Utilities 2023-12-18: UNCHANGED at AVERAGE strength rating (5th strongest of 9 levels), previous move was UP
Utilities as active as one would imagine. Not very. Some movers = 3 months GNE +95%, 4 weeks CEPU/NEP/RGCO +27%/26%/26%, 1 week NOVA +23%.
Full details at downloadable file linked below.
What are you seeing here and why do you care? Partial listing:
🔹 An objective measurement of industry strengthening and weakening so you can objectively compare strength and weakness across/within industries and sub-industries.
🔹 A listing of stocks rated Strongest and Weakest (highest/lowest strength of 9 levels) by sub-industry, saving you significant time finding stocks that may be prone to making bigger moves faster. Stronger stocks have less overhead resistance, Weaker stocks are prone to “pops” from bargain hunting and short-covering yet due to preceding weakness are also prone to falling far and fast.
Background
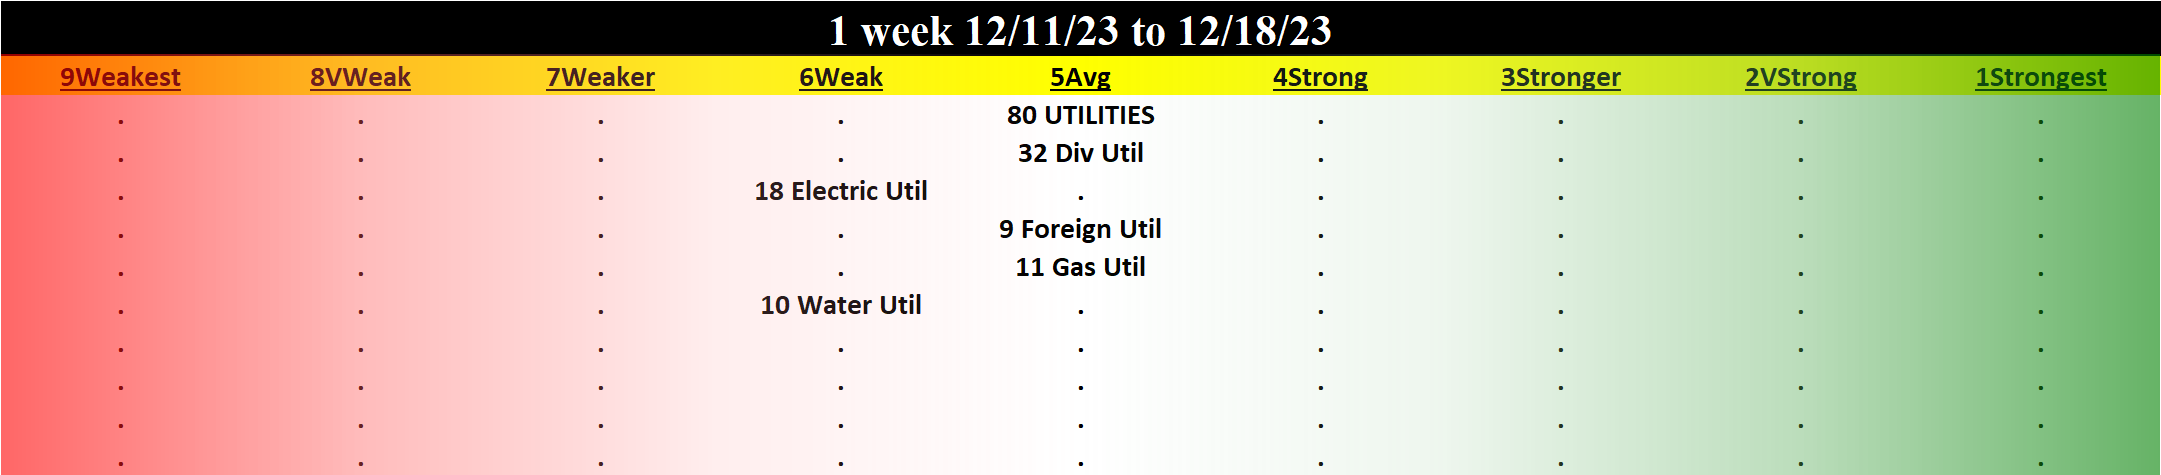
Largest of 5 sub-industries (80 stocks, average 16):
- Diversified Utilities (32 stocks)
- Electric Utilities (18 stocks)
- Gas Utilities (11 stocks)
Top market cap stocks: NEE/NextEra Energy, SO/Southern Company The, DUK/Duke Energy Corp, SRE/Sempra Energy, EXC/Exelon Corporation, AEP/American Electric Power, D/Dominion Energy Inc, PCG/Pacific Gas & Electric Co, XEL/Xcel Energy Inc, ED/Consolidated Edison Inc.
Details
🔹 8% Strongest Stocks, 4% Weakest Stocks.
🔹 Mixed/WEAKENING 1 Week vs. Mid- and Longer-Term // 1 week positive/negative stocks ratio is LOWER than 4 weeks but HIGHER than 3 Months (64%/83%/48% positive)
🔹 Sub-industry Overview:
STRONGEST at Average rating/5th strongest of 9 levels:
- Diversified Utilities (32 stocks)
- Foreign Utilities (9 stocks)
- Gas Utilities (11 stocks)
WEAKEST at Weak rating/6th strongest of 9 levels:
- Electric Utilities (18 stocks)
- Water Utilities (10 stocks)
🔹 Lookback Periods Comparison:
3 Months: 4% stocks >+20% and 1% stocks <-20%.
___UP most:
GNE +95% (Div Util)
CEPU +44% (Foreign Util)
NRG +24% (Div Util)
RGCO +17% (Gas Util)
CWCO +14% (Foreign Util)
___DOWN most:
NEP -41% (Electric Util)
EXC -17% (Div Util)
OGS -16% (Gas Util)
TAC -15% (Electric Util)
CDZI -12% (Water Util)
4 weeks: 16% stocks >+10% and 1% stocks <-10%.
___UP most:
CEPU +27% (Foreign Util)
NEP +26% (Electric Util)
RGCO +26% (Gas Util)
NOVA +20% (Electric Util)
GNE +16% (Div Util)
___DOWN most:
EXC -12% (Div Util)
AEE -7% (Div Util)
TAC -5% (Electric Util)
MNTK -4% (Div Util)
PEG -4% (Div Util)
1 Week: 3% stocks >+10% and 1% stocks <-10%.
___UP most:
NOVA +23% (Electric Util)
NEP +11% (Electric Util)
CEPU +8% (Foreign Util)
ORA +6% (Electric Util)
AY +6% (Foreign Util)
___DOWN most:
EXC -13% (Div Util)
AEE -9% (Div Util)
SGU -6% (Gas Util)
PNW -4% (Electric Util)
NWE -2% (Div Util)