Utilities 2023-10-02: DOWN -1 to VERY WEAK strength rating (8th strongest of 9 levels), previous move was also DOWN
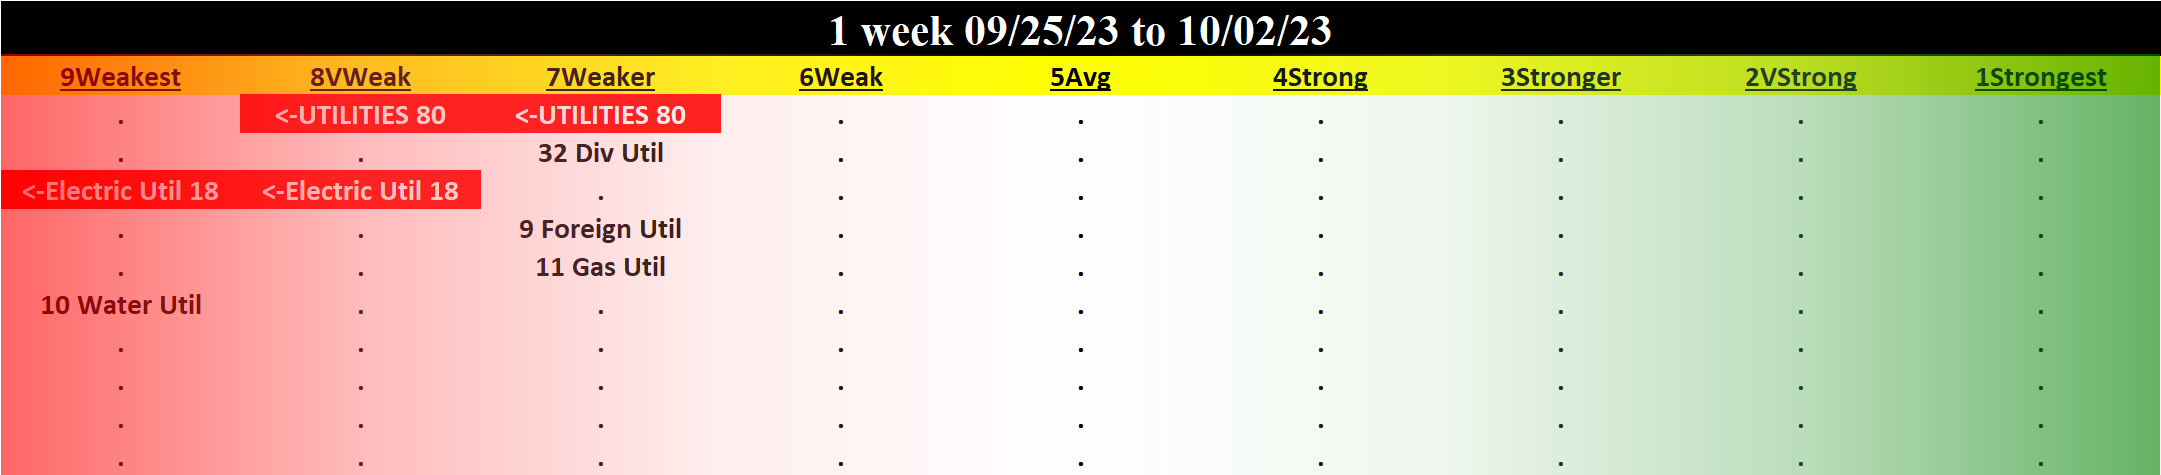
TABLE OF CONTENTS
- INDUSTRY OVERVIEW
1A. Performance
1B. Background - SUB-INDUSTRIES AND STOCKS DETAIL
2A. Sub-Industries Overview
2B. Sub-Industries 10-Week Strengthening Analysis
2C. Stocks 1 Week Strongest and Weakest - STRENGTH BY LOOKBACK PERIOD (with Best/Worst stocks)
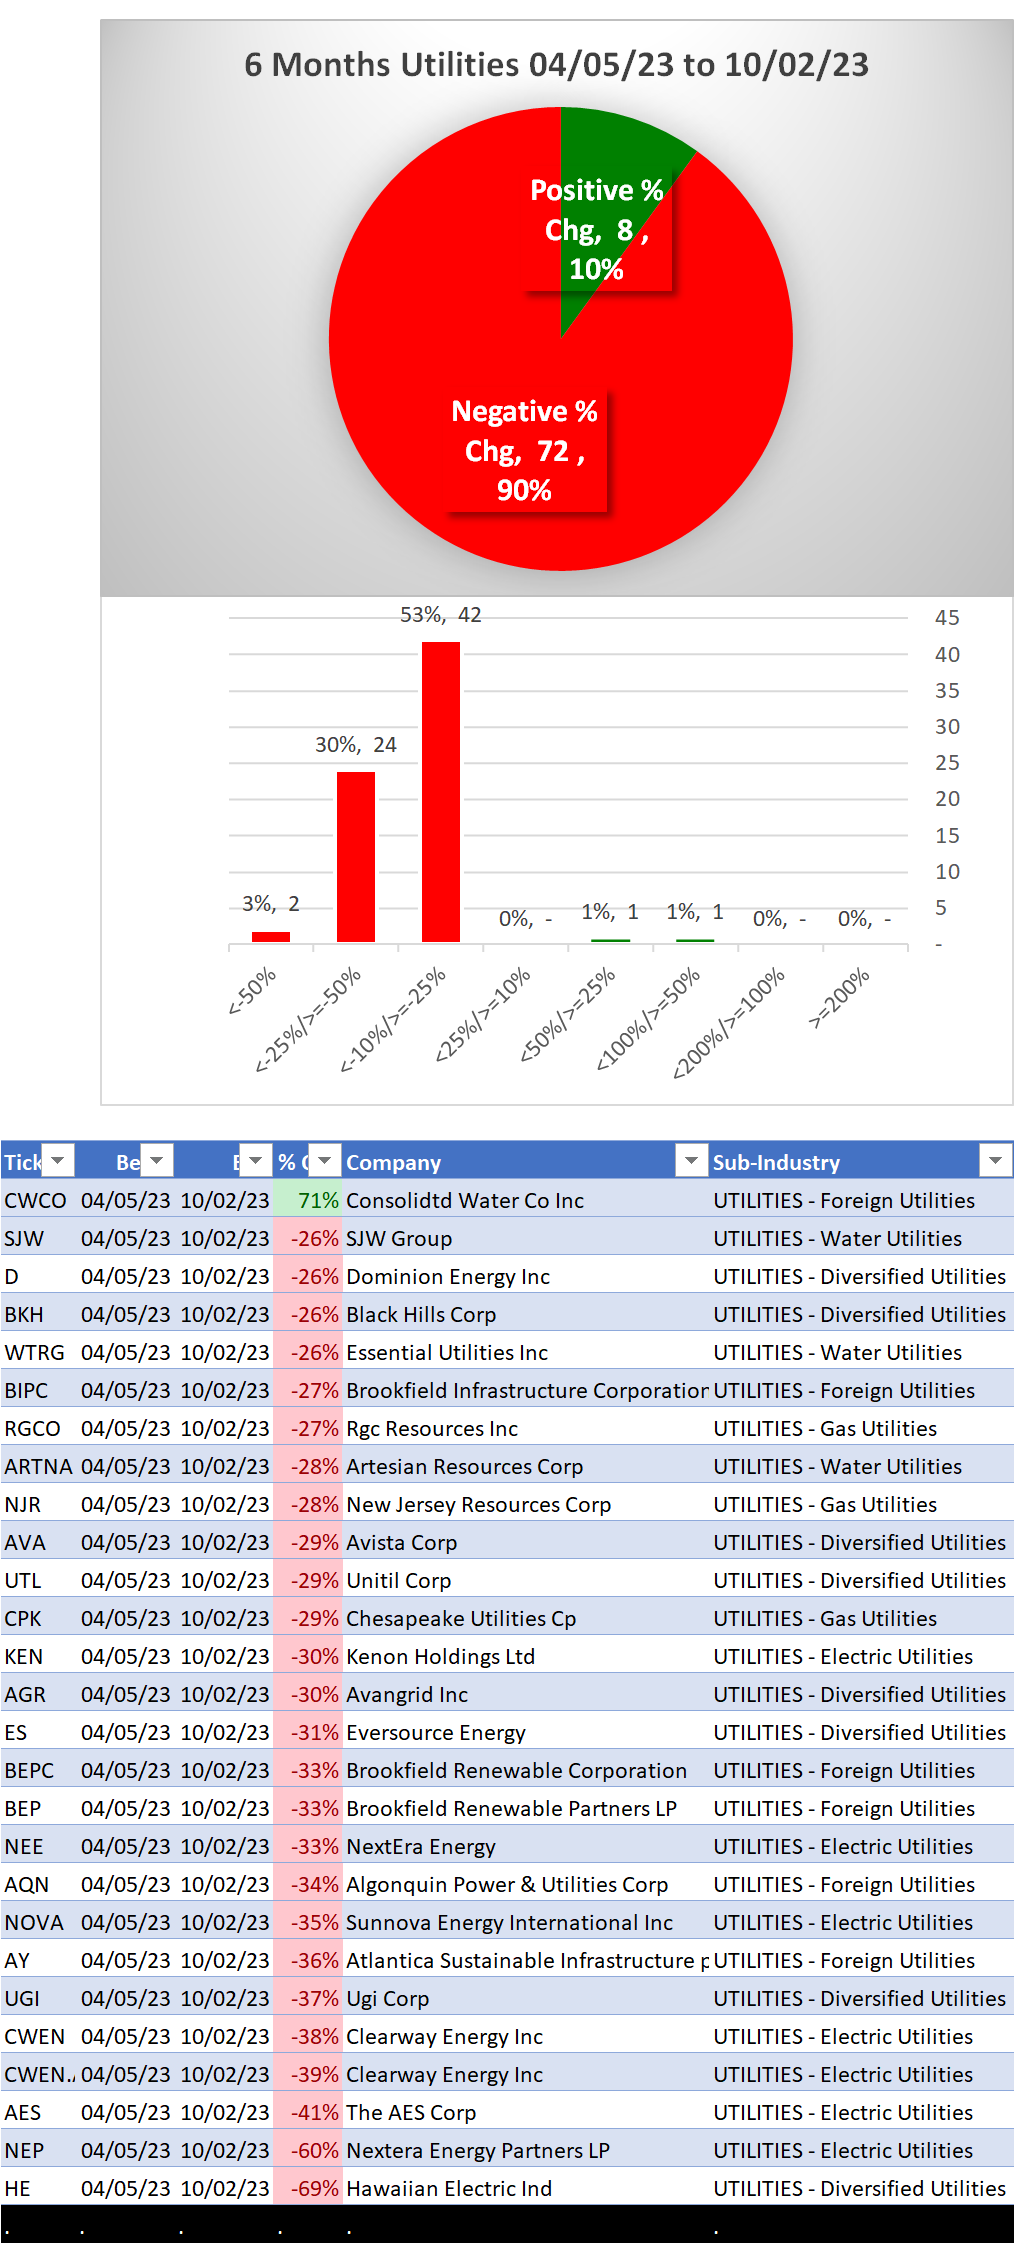
3A. Lookback 6 Months
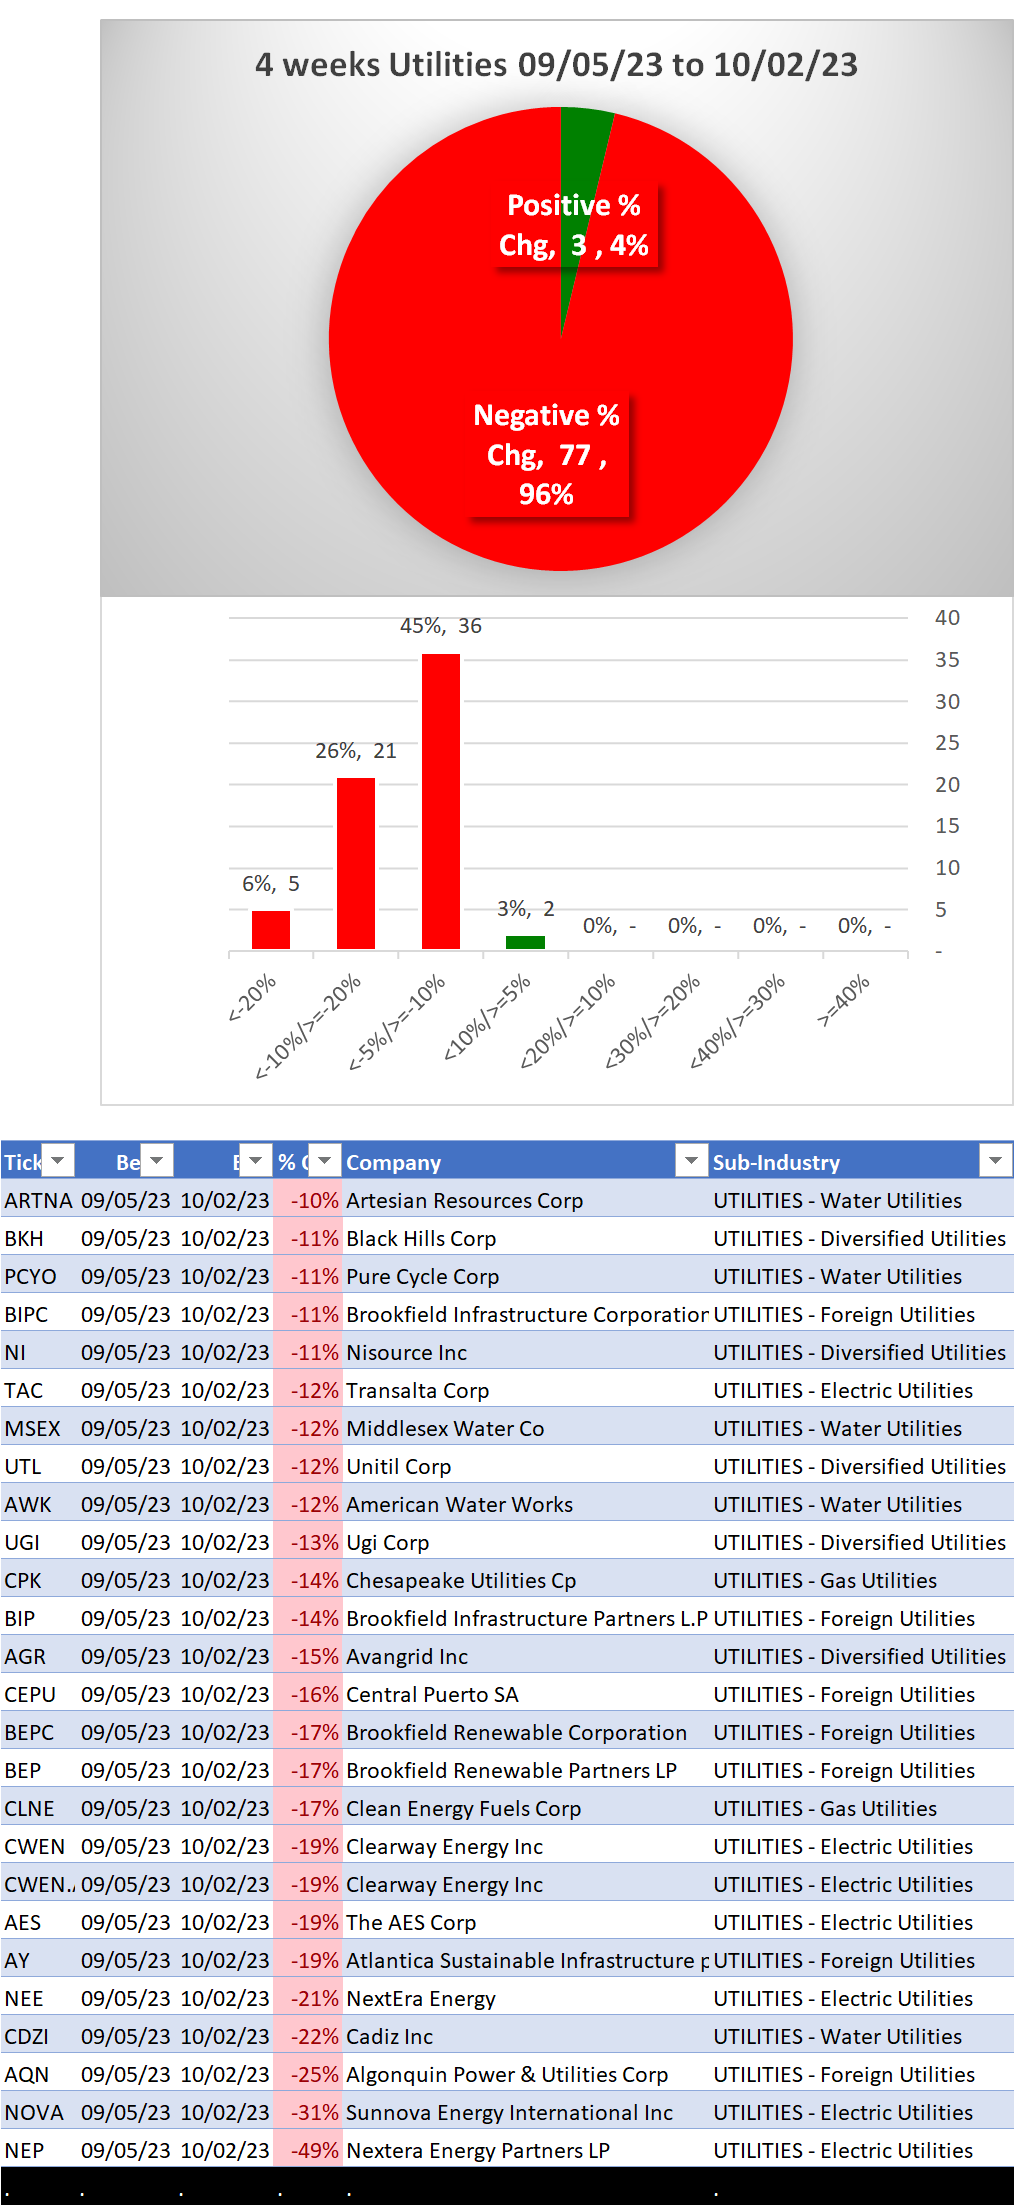
3B. Lookback 4 weeks
3C. Lookback 1 Week
1. INDUSTRY OVERVIEW
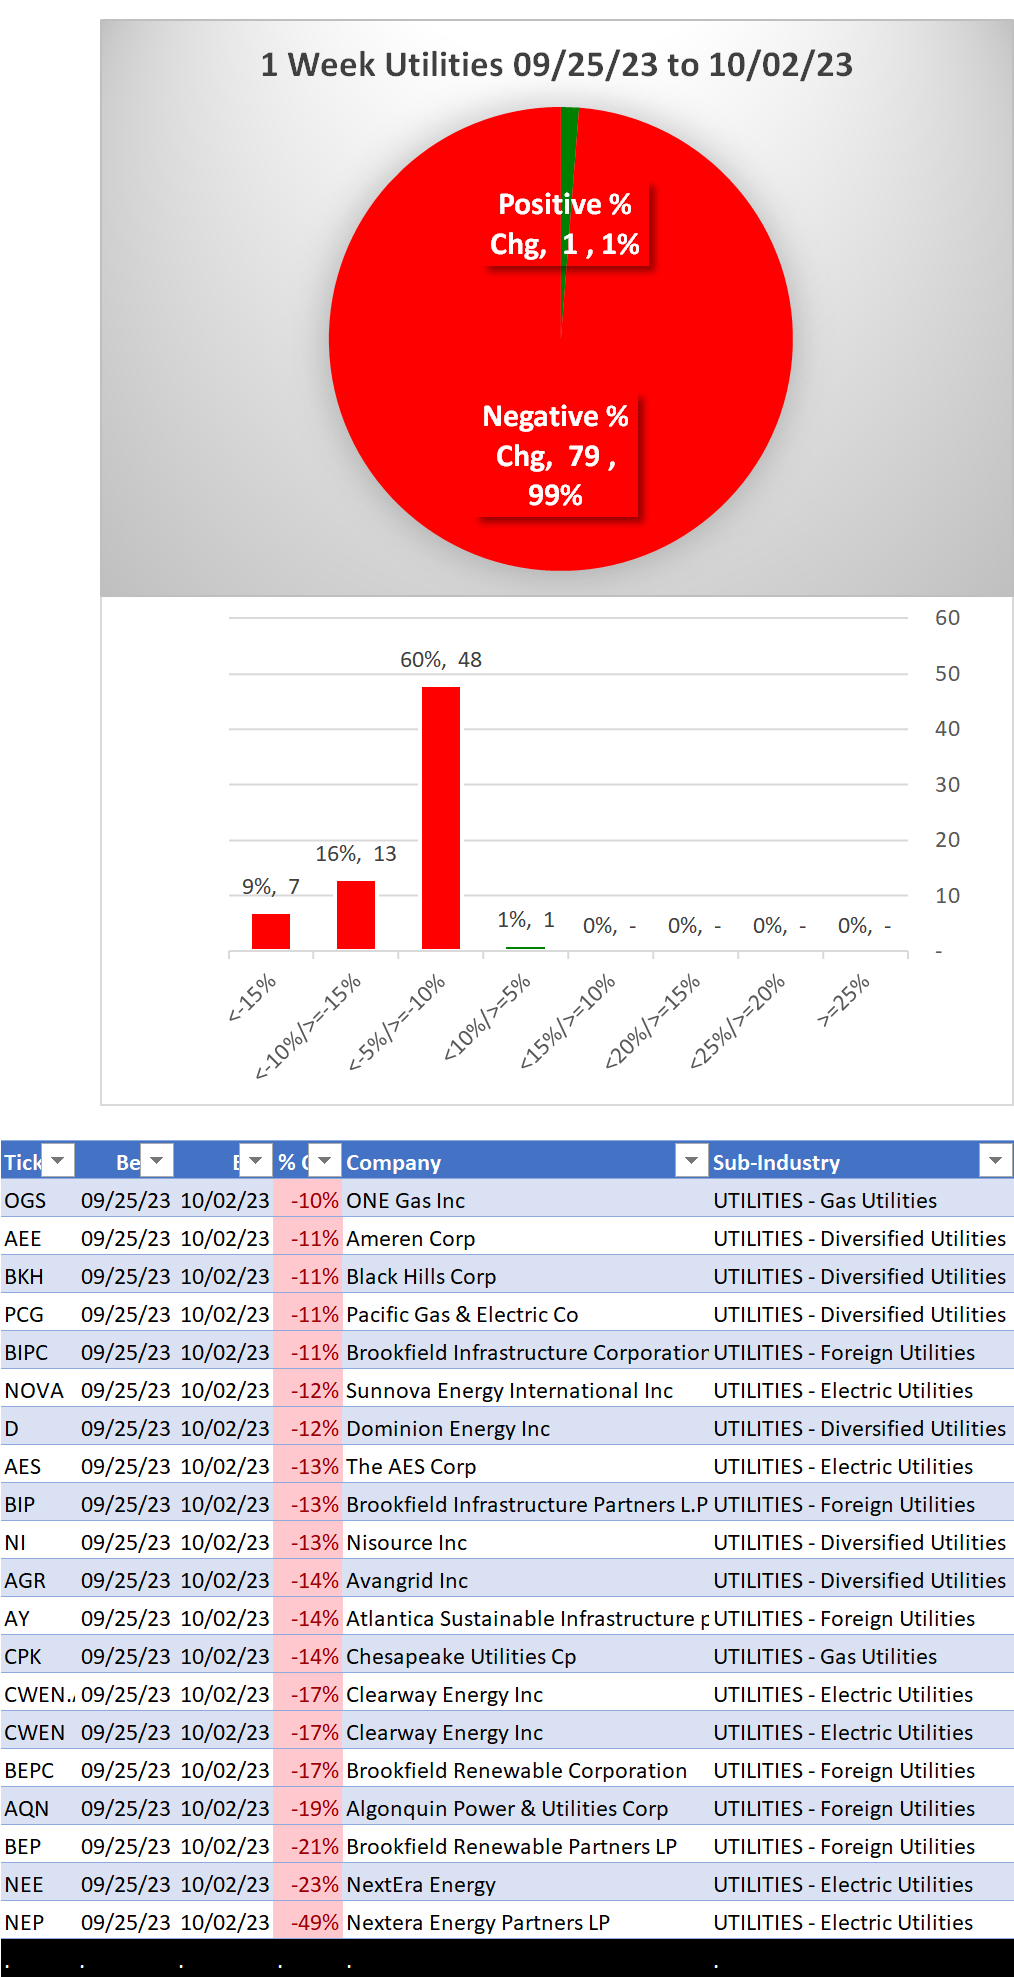
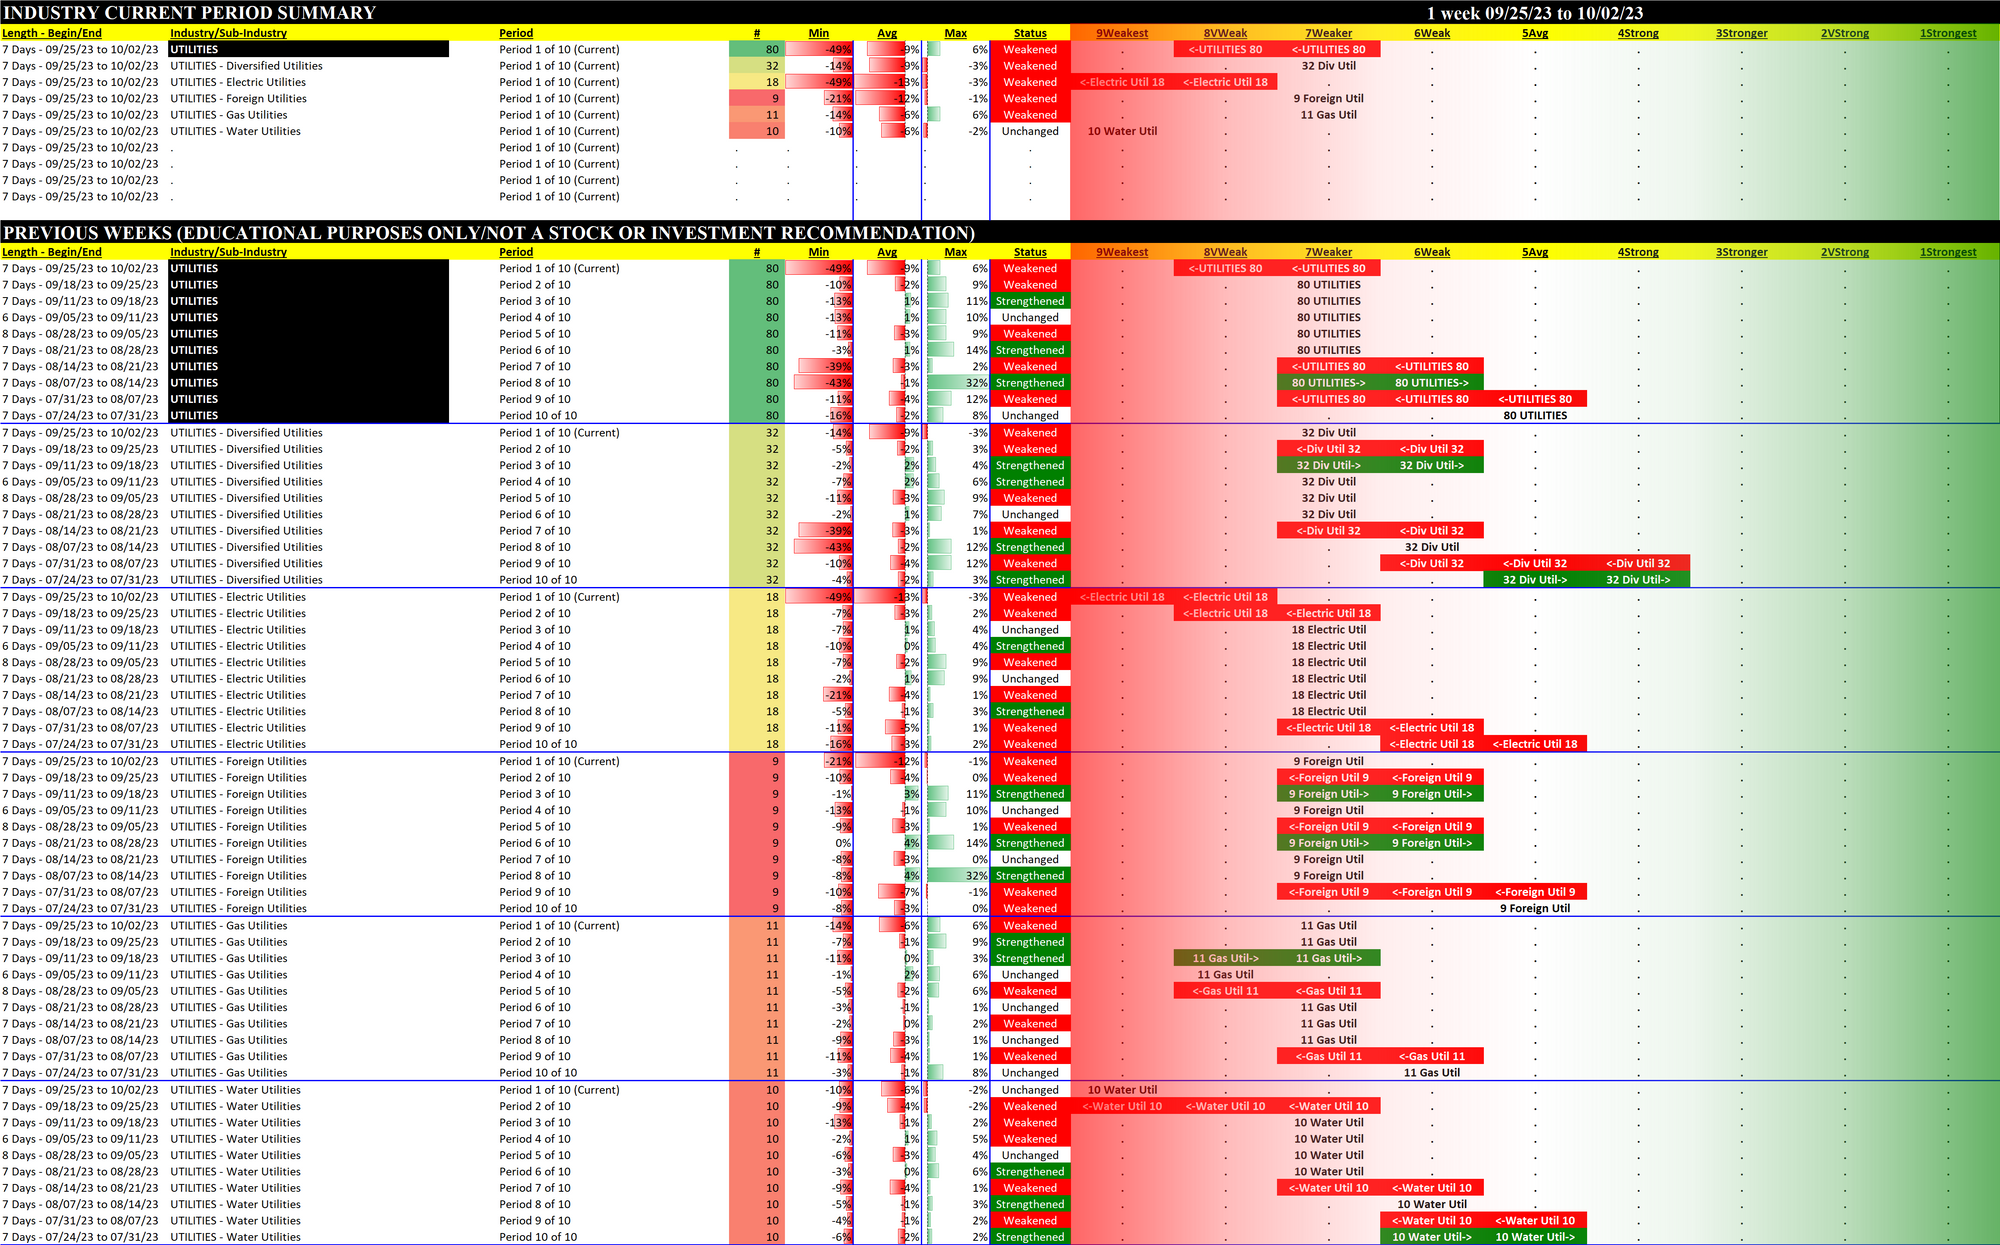
1A. Performance
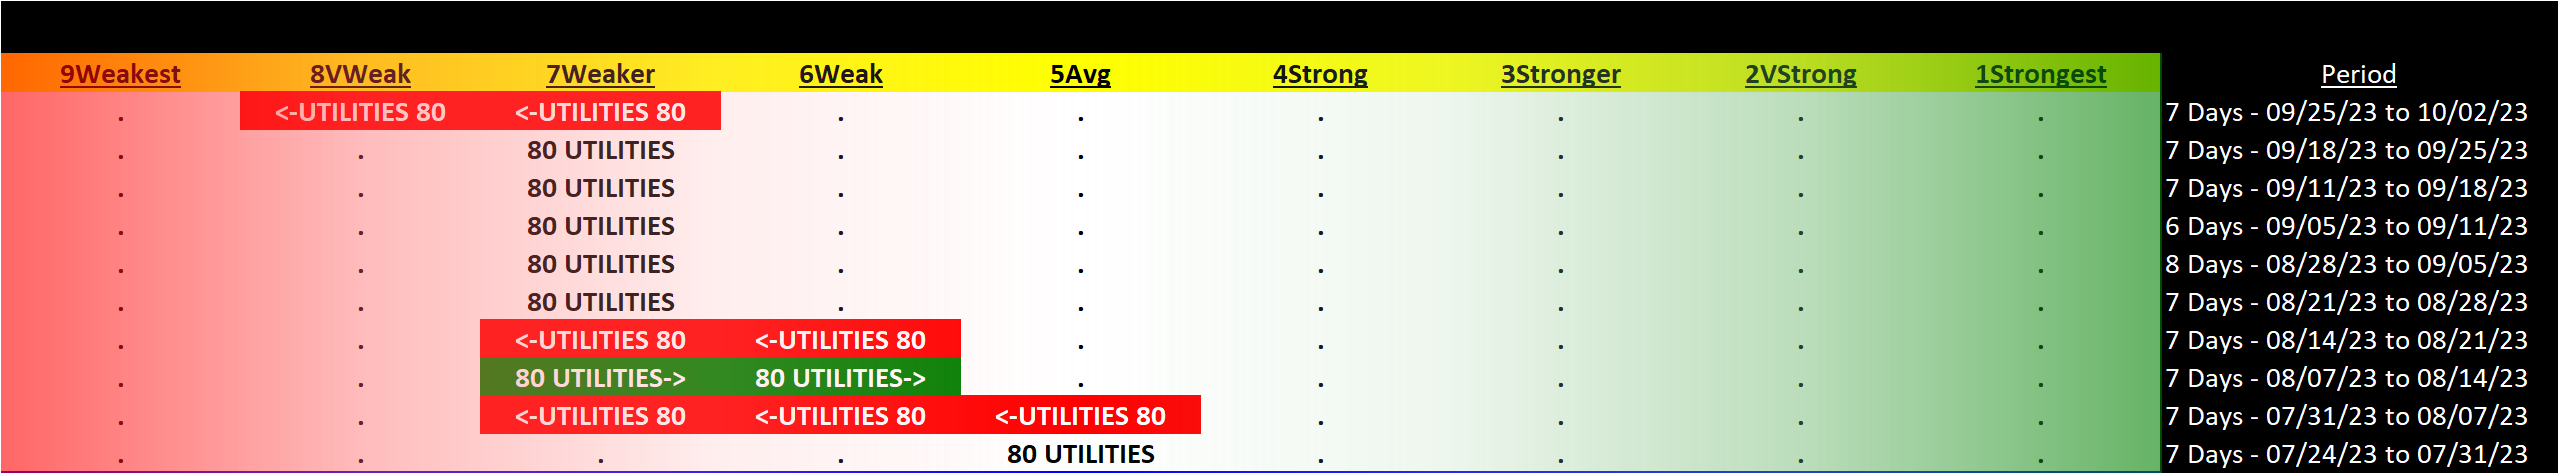
Past 10 Weeks Strengthening/Weakening week-by-week, per the following chart:
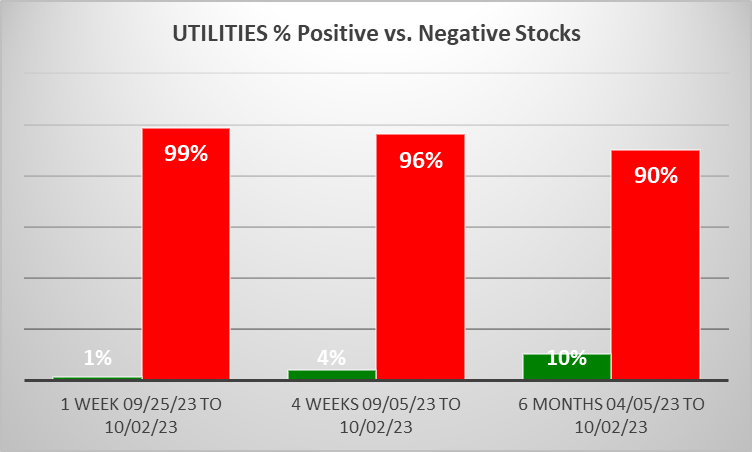
WEAKENING 1 Week vs. Mid- and Longer-Term // 1 week positive/negative stocks ratio is LOWER than both 4 weeks and 6 Months, per the following chart:
Comment:
- Only 10% of stocks are positive over past 6 months - and this is 10x the past week's positive stocks ratio.
- 79% of stocks are rated Weakest. Only 1% rated Strongest.
- 1 in 3 stocks down more than -25% 6 months, same ratio down more than 10% 4 weeks, and 1 in 4 down more than 10% in 1 week.
1B. Background
Largest of 5 sub-industries (80 stocks, average 16):
- Diversified Utilities (32 stocks)
- Electric Utilities (18 stocks)
- Gas Utilities (11 stocks)
Top 10 by Market Capitalization:
NEE/NextEra Energy, SO/Southern Company The, DUK/Duke Energy Corp, SRE/Sempra Energy, AEP/American Electric Power, EXC/Exelon Corporation, DLR/Digital Realty Trust Inc, XEL/Xcel Energy Inc, PCG/Pacific Gas & Electric Co, WEC/WEC Energy Group Inc
2. SUB-INDUSTRIES AND STOCKS DETAIL
2A. Sub-Industries Overview
Strengthened: 0/5 sub-industries
Weakened: 1/5 sub-industries
STRONGEST at Weaker rating/7th strongest of 9 levels:
- Diversified Utilities (32 stocks)
- Foreign Utilities (9 stocks)
- Gas Utilities (11 stocks)
WEAKEST at Weakest rating/9th strongest of 9 levels:
- Electric Utilities (18 stocks)
- Water Utilities (10 stocks)
2B. Sub-Industries 10-Week Strengthening Analysis
What: recent week-by-week strength changes for the industry and each underlying sub-industry
Why: objective measurement of strengthening and weakening enabling comparison within and across industries and sub-industries
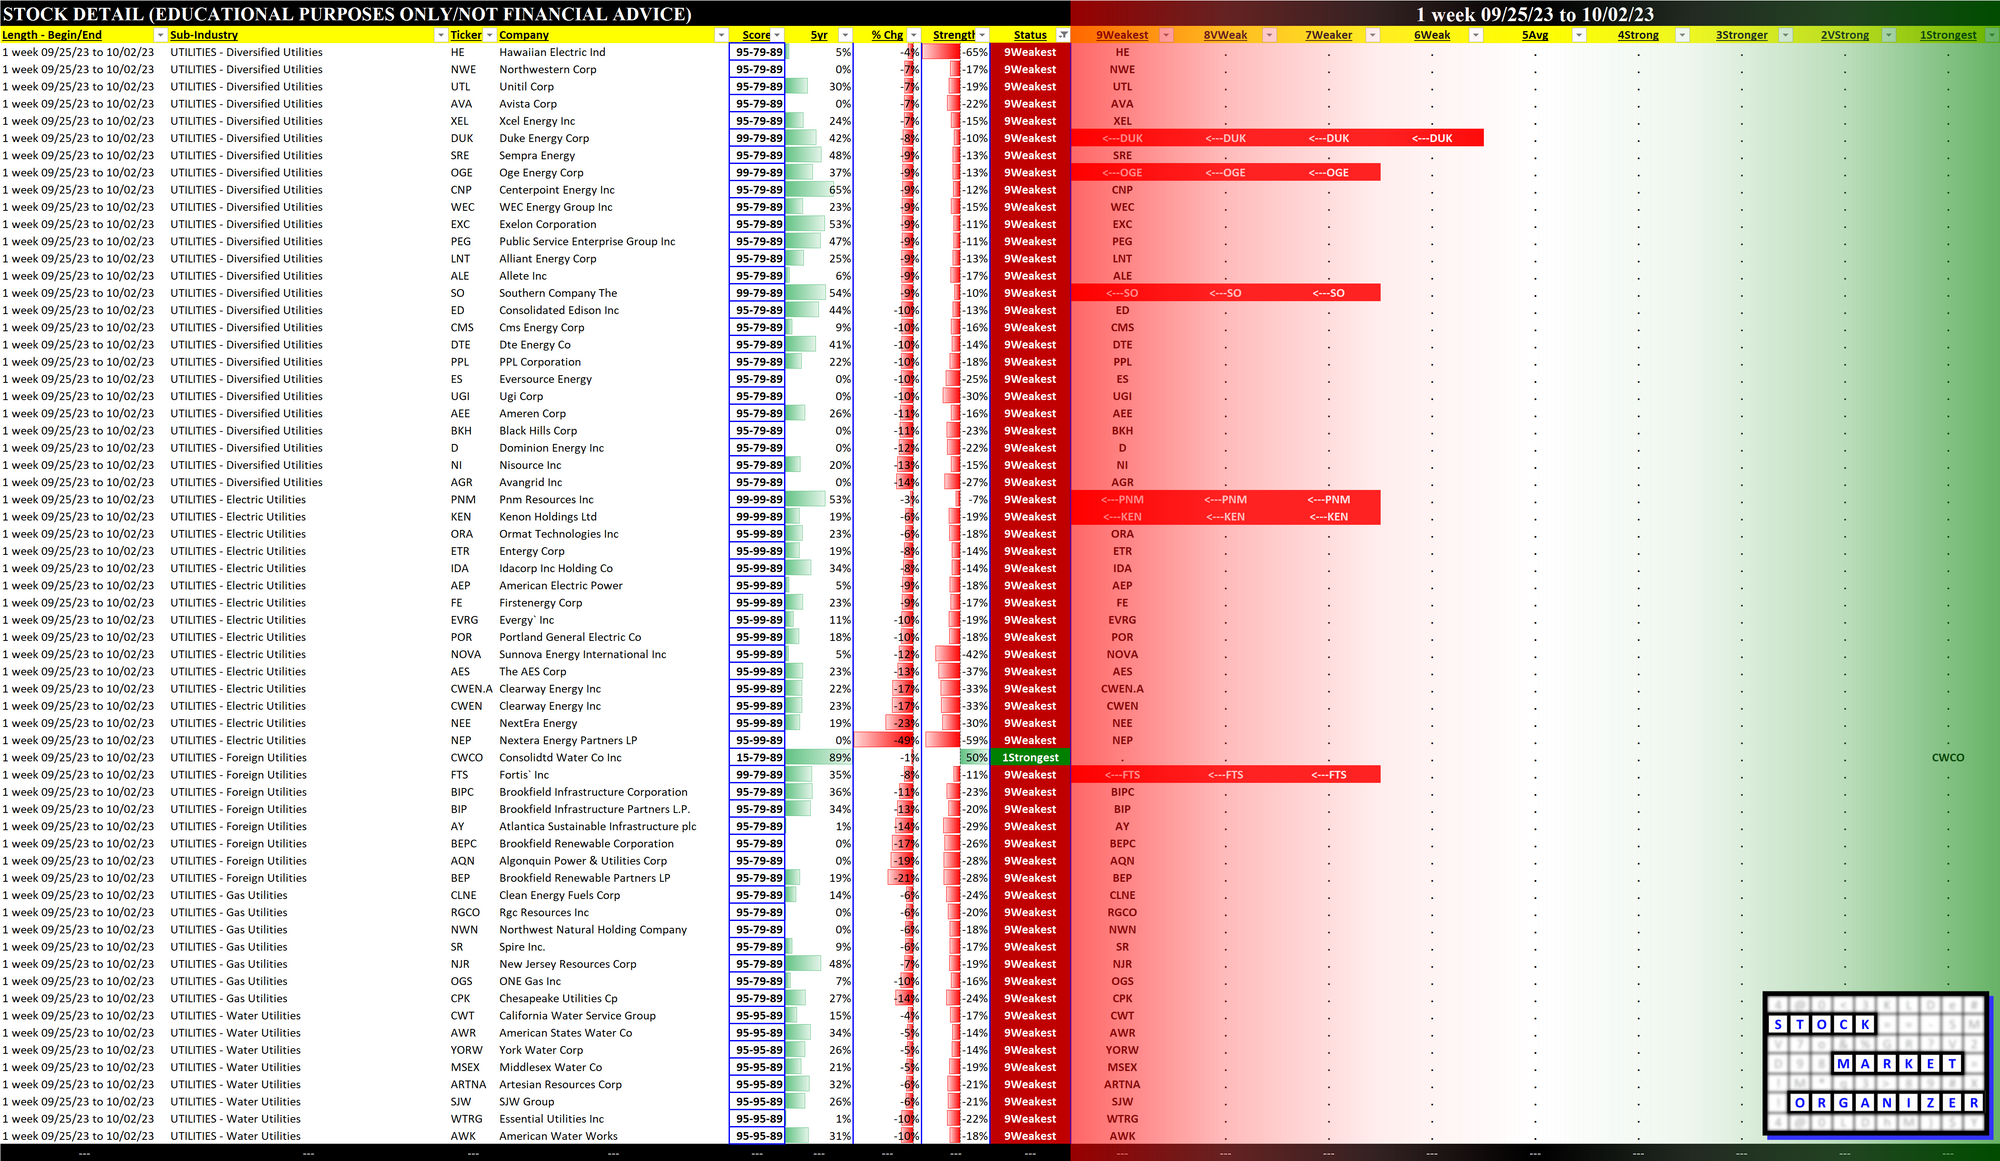
2C. Stocks 1 Week Strongest and Weakest
What: stocks currently rated Strongest/Weakest (highest/lowest of 9 strength ratings)
Why: most interesting stocks for available capital because
- the Strongest have the least amount of overhead supply to dampen breakouts while
- the Weakest may be prone to volatility, subject to big pops from bottom-fishing and short-covering BUT ALSO to bigger and faster falls.
(Not guaranteed and not a recommendation - weak stocks in weakening sub-industries may be better shorts than high-flyers.)
3. STRENGTH BY LOOKBACK PERIOD (with Best/Worst stocks)
3A. Lookback 6 Months
3B. Lookback 4 weeks
3C. Lookback 1 Week