Utilities Weaker 2023-03-21 with pandemic era 4- and 8-week context
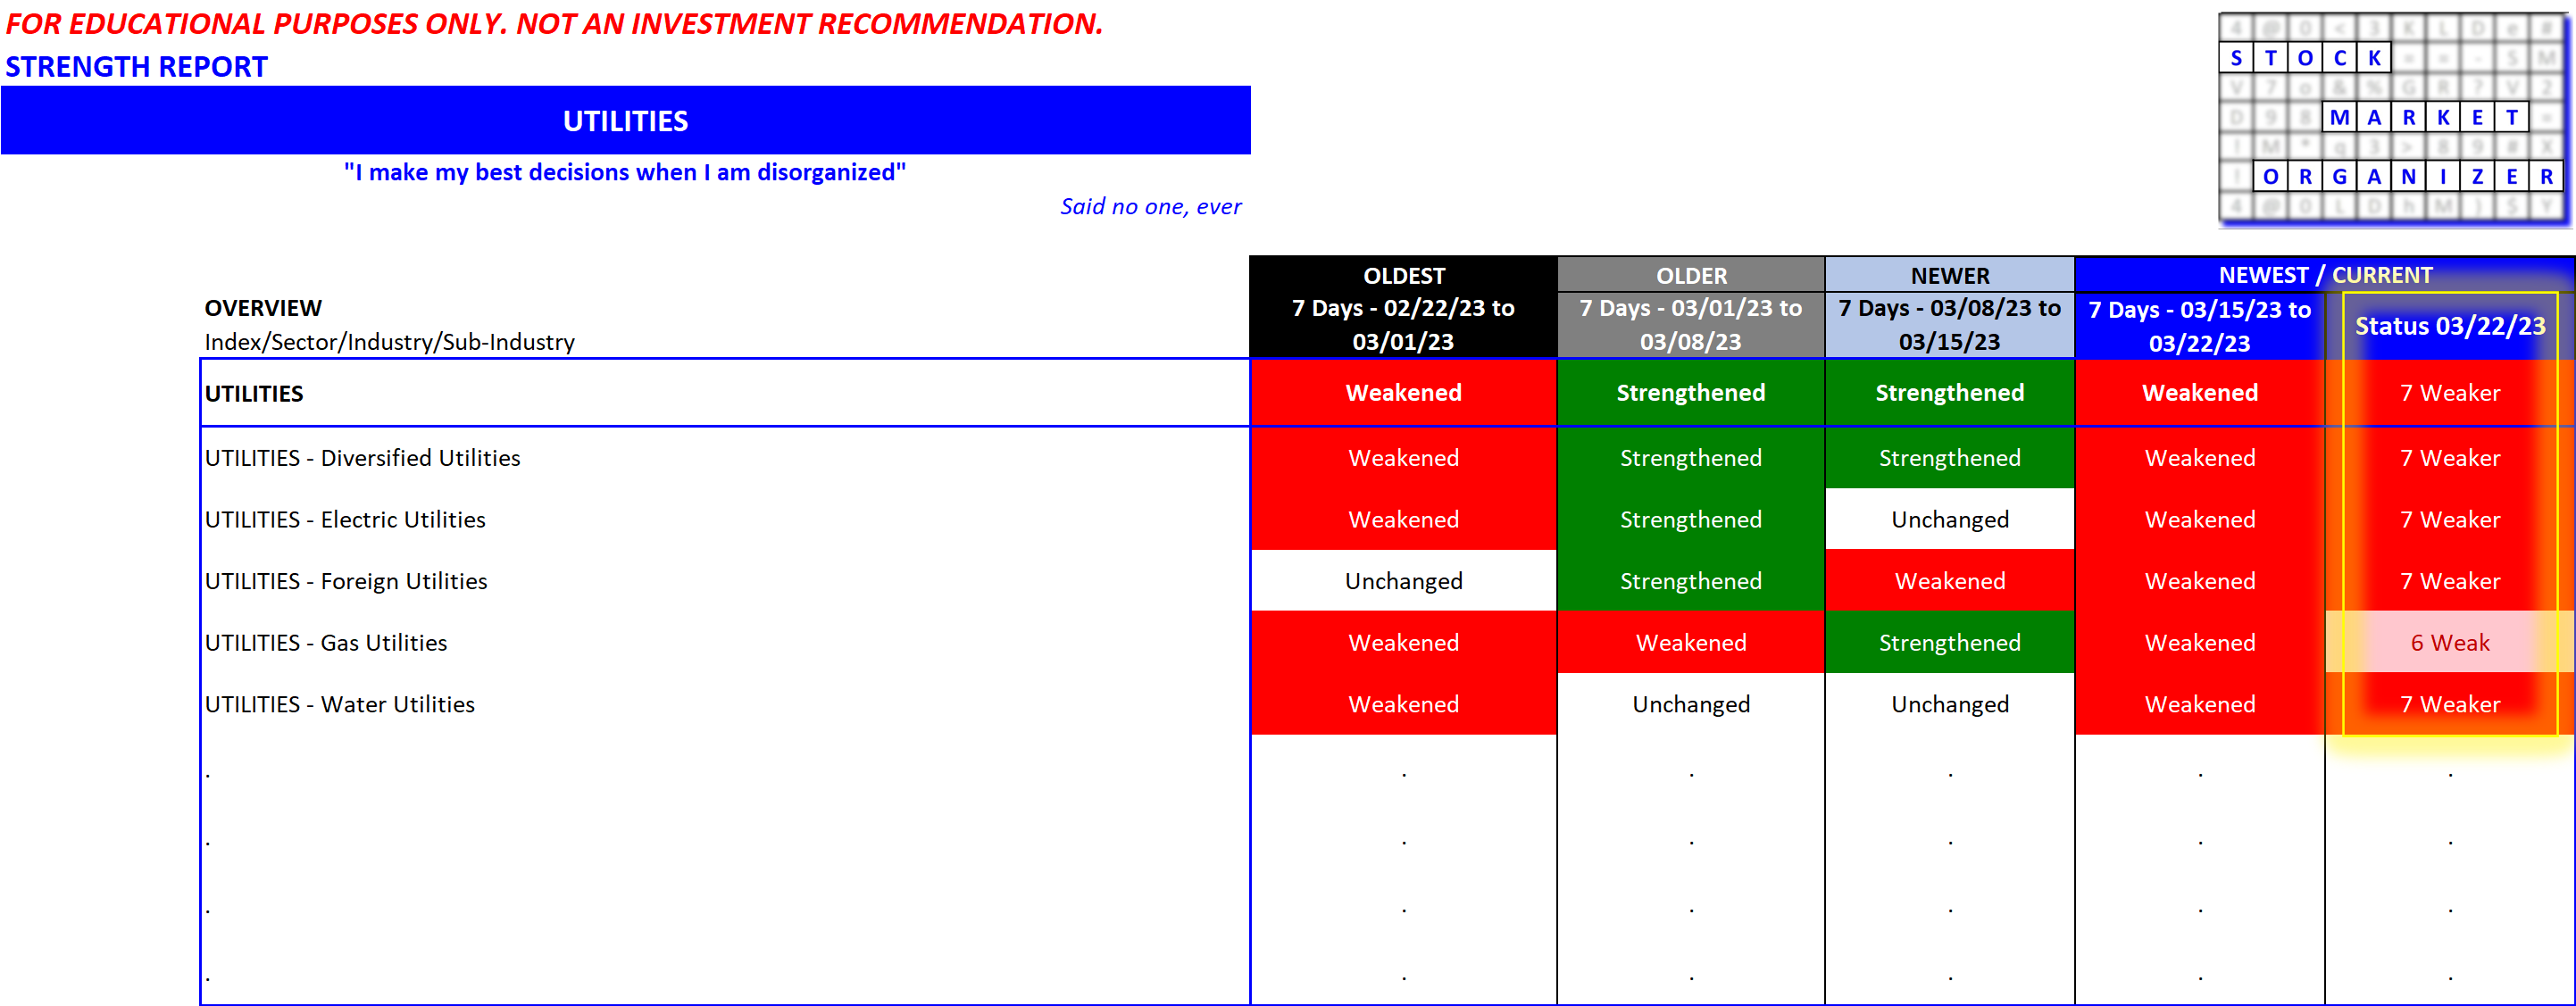
Utilities stocks aren't exciting and they are worse when they aren't going up. As shown in the following graphic, they have been weak over the past four weeks and are not well at the moment. Gas Utilities is slightly less weak than the other sub-industries but this is immaterial.
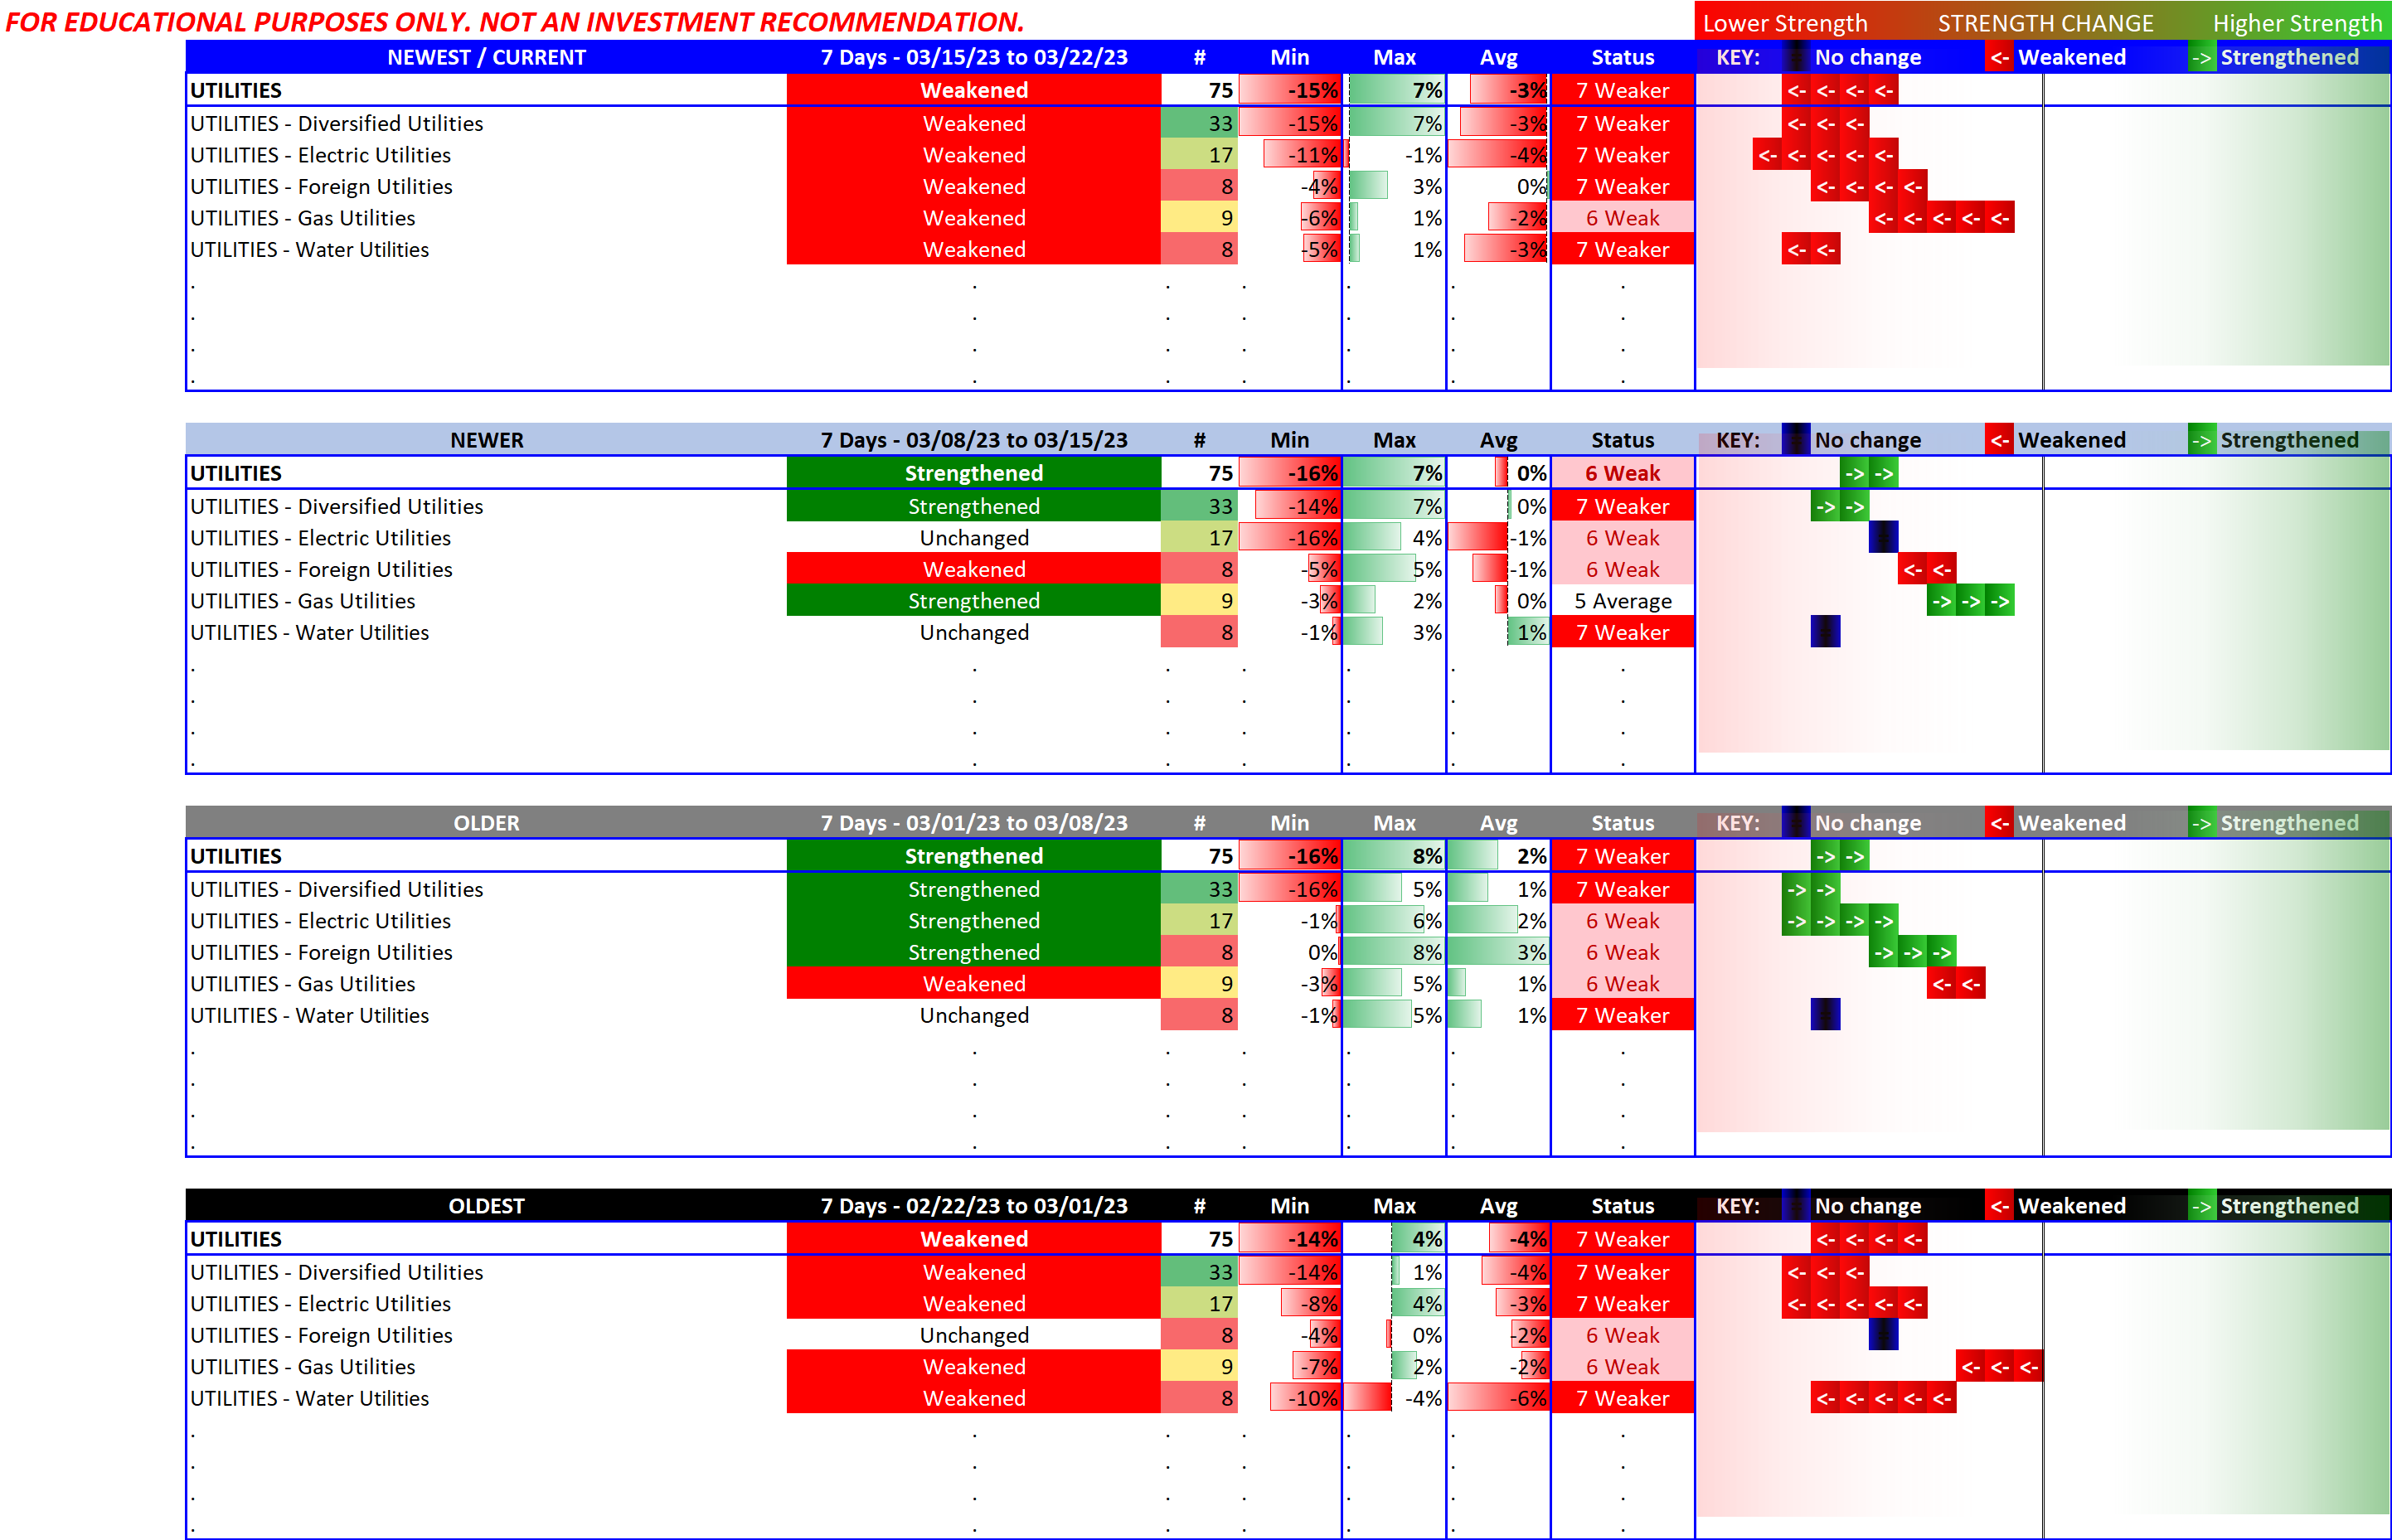
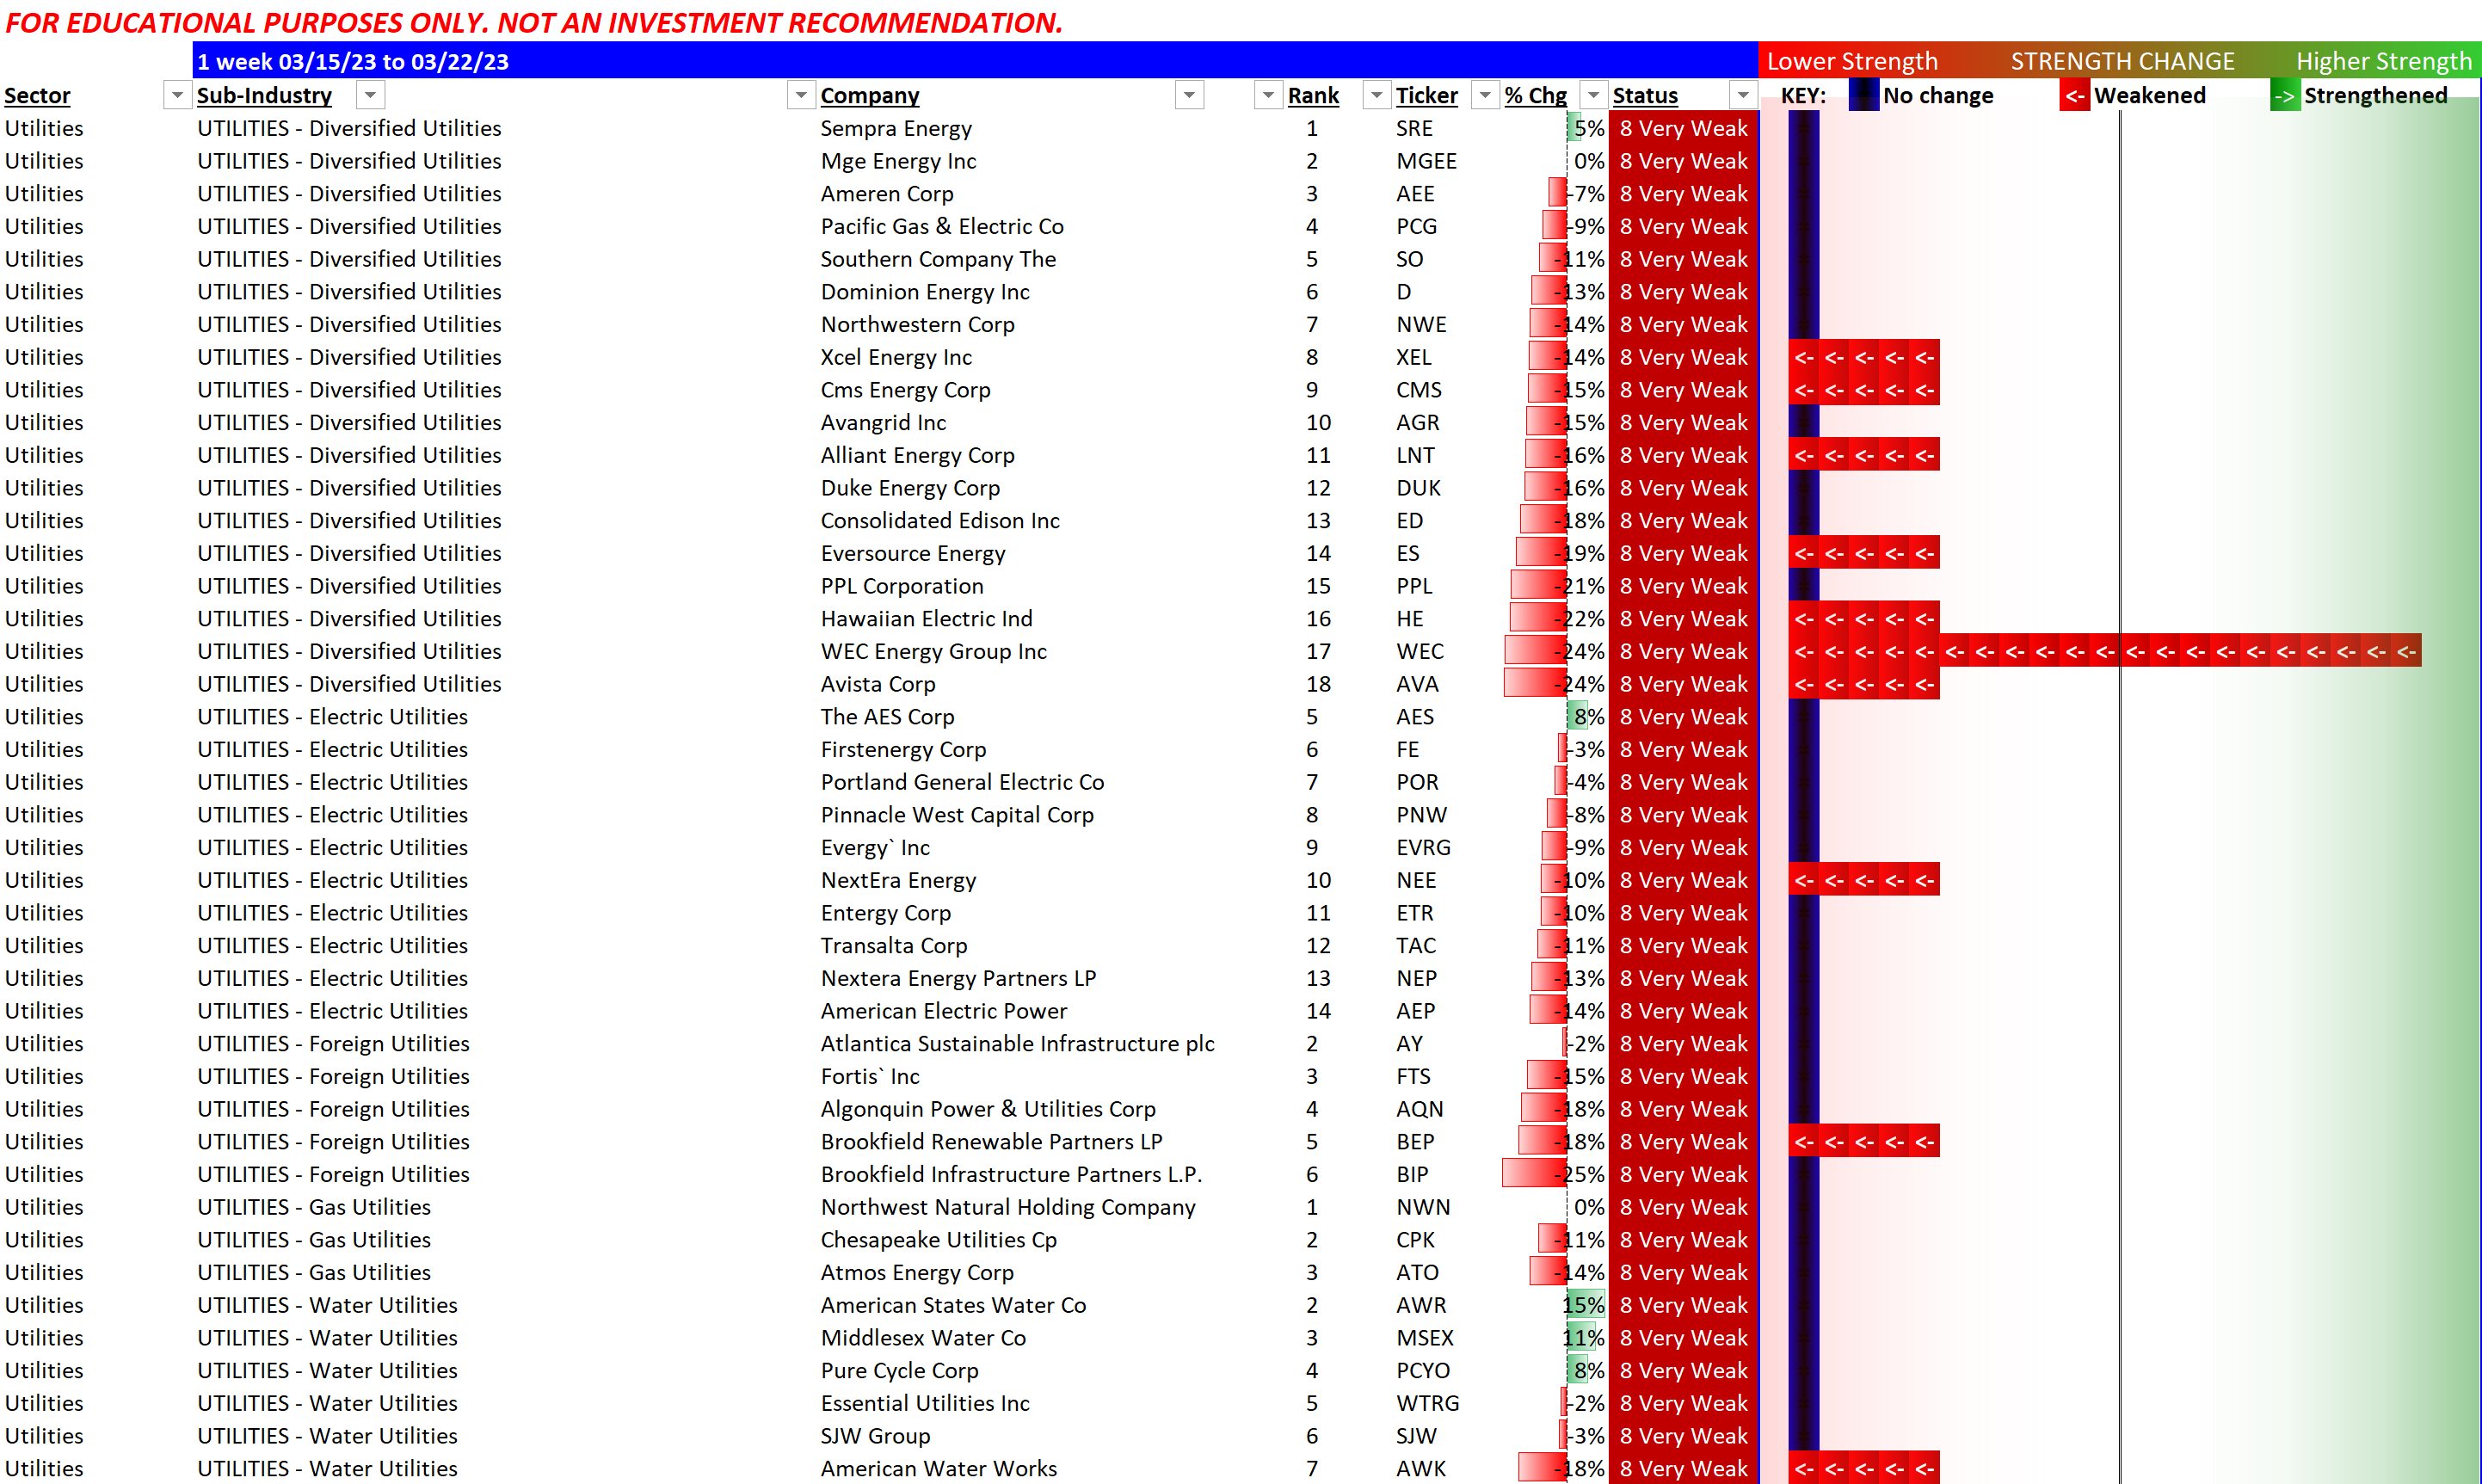
Current view 4-week look back
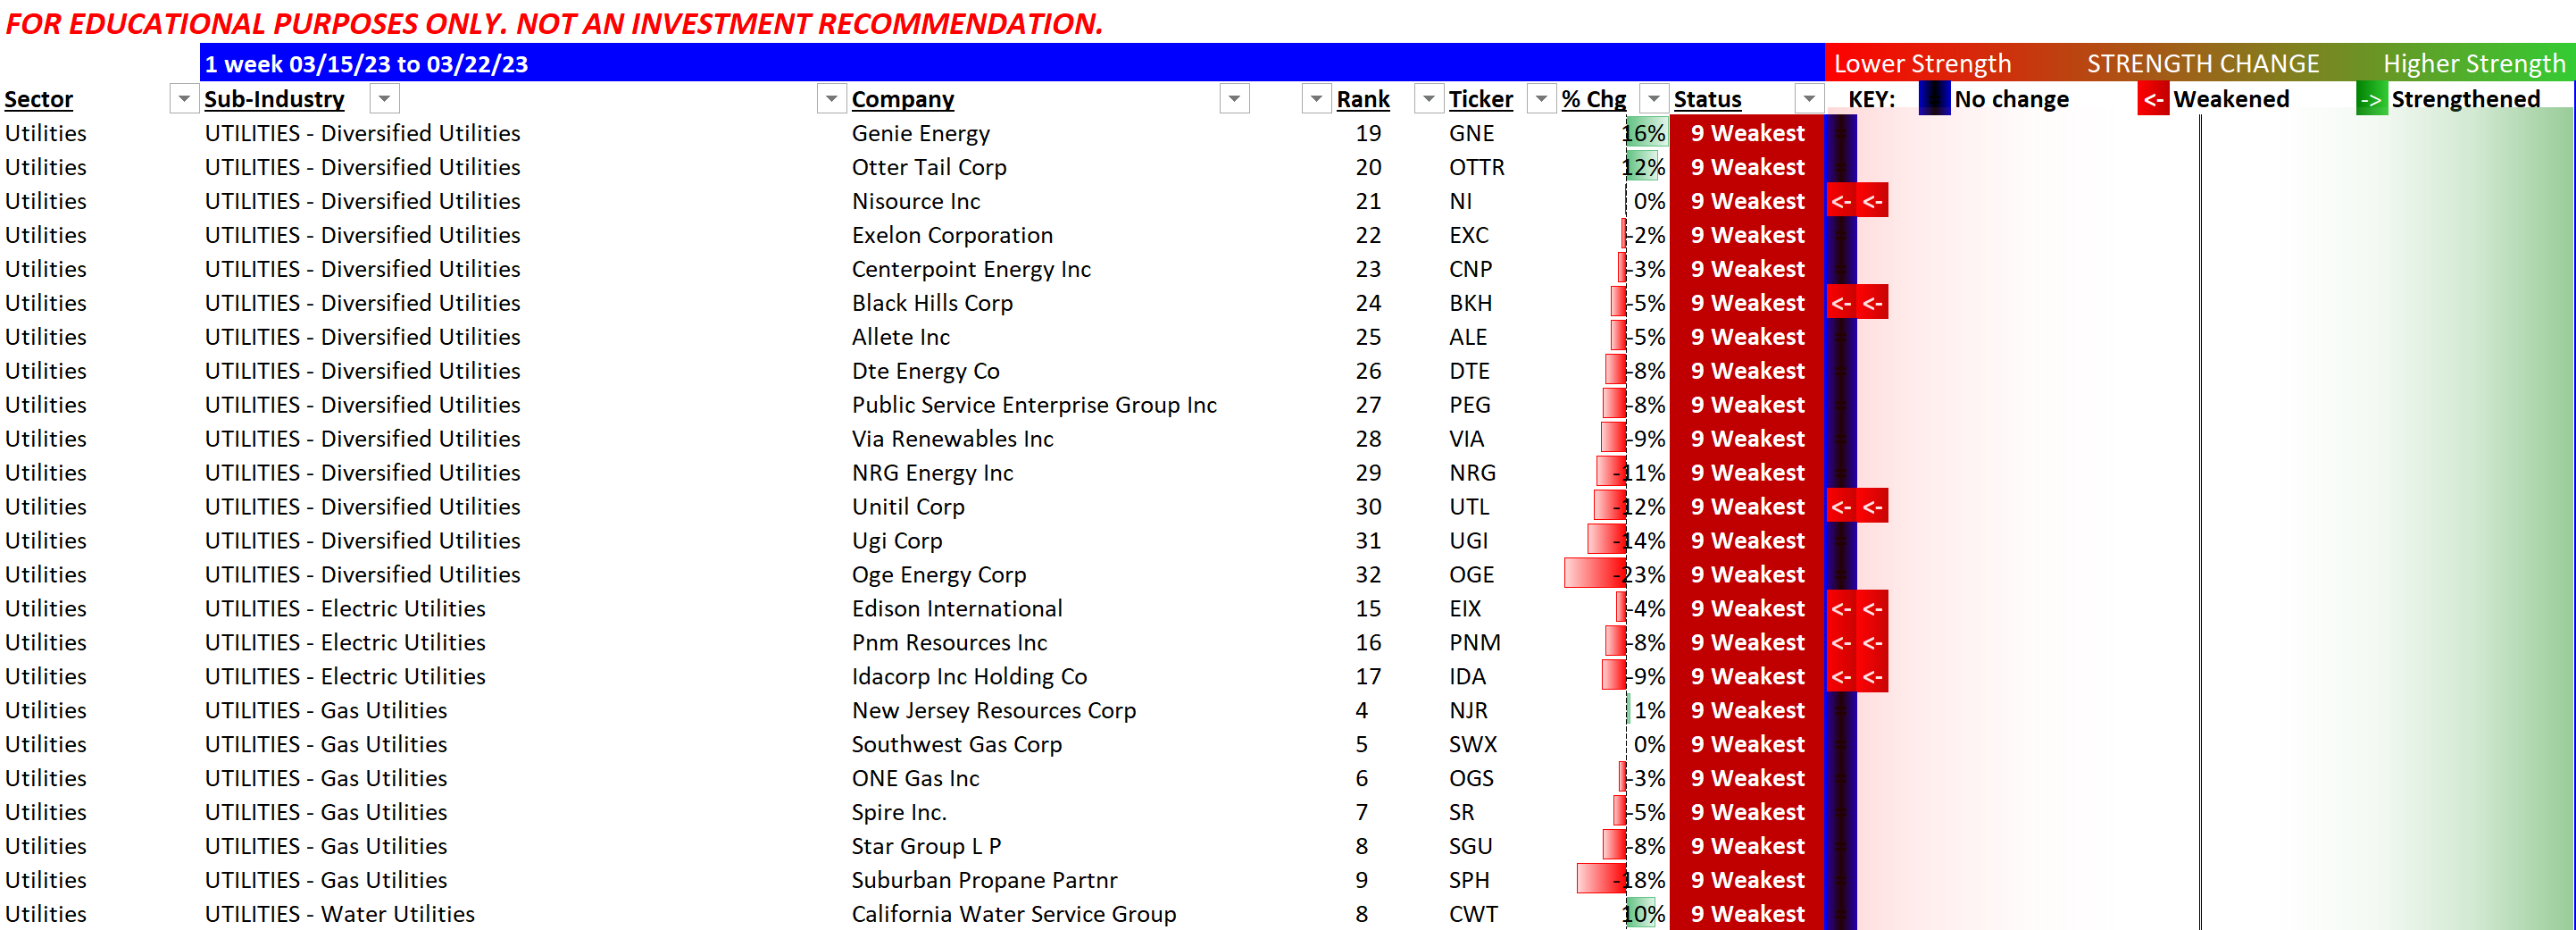
Below is a summary of the currently strongest and weakest in Utilities. Otter Tail Corp./OTTR is the only Utility stock with the Strongest rating. Conversely, there are 43 Utilities stocks with the weakest rating.
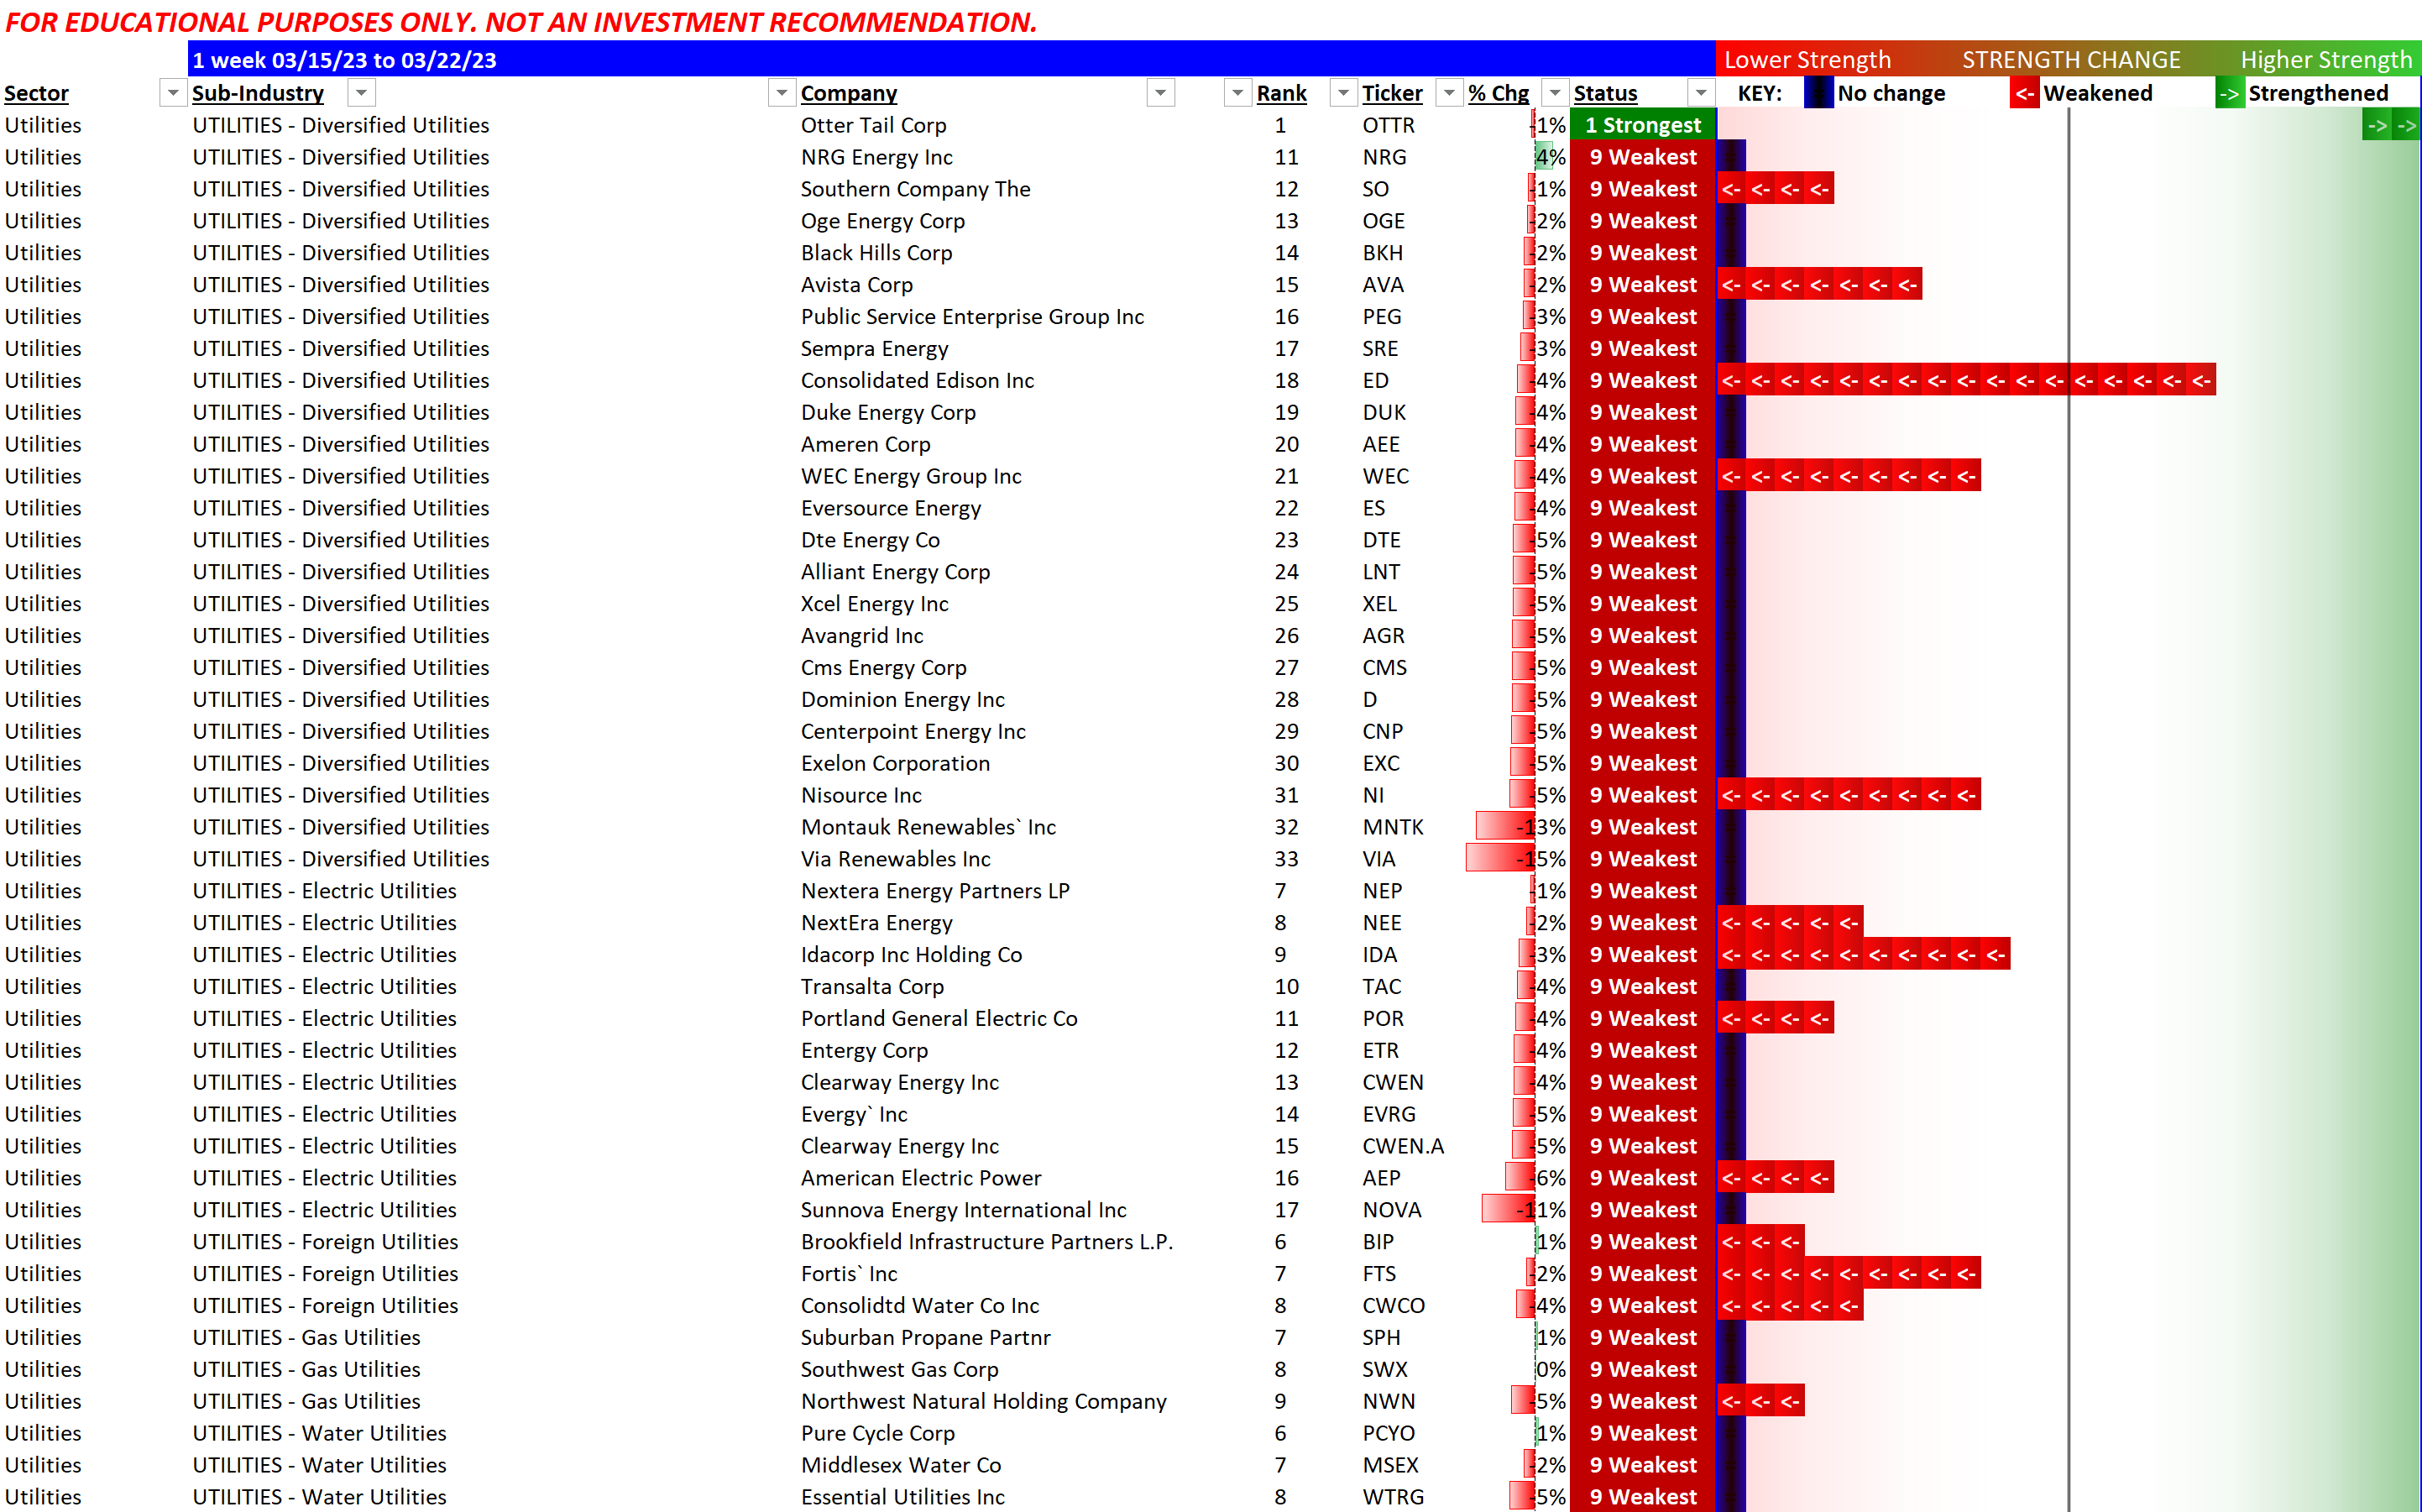
Downloadable report with stock-by-stock detail is available here:
Context - March 23, 2020 4-week look back (pandemic decline)
Below is a summary of the strongest and weakest Utilities stocks during the week ending March 23, 2020. Spoiler alert: there were no Utilities stocks with the strongest rating. Below are 24 stocks which had the Weakest rating.
Additionally, there were 42 stocks that had the second weakest rating, shown below.
66 of 72 (92%) Utilities stocks had the Weakest or Very Weak ratings as of March 23, 2020. Per the previous graphic, none had the Strongest rating.
Downloadable report with stock-by-stock detail is available here:
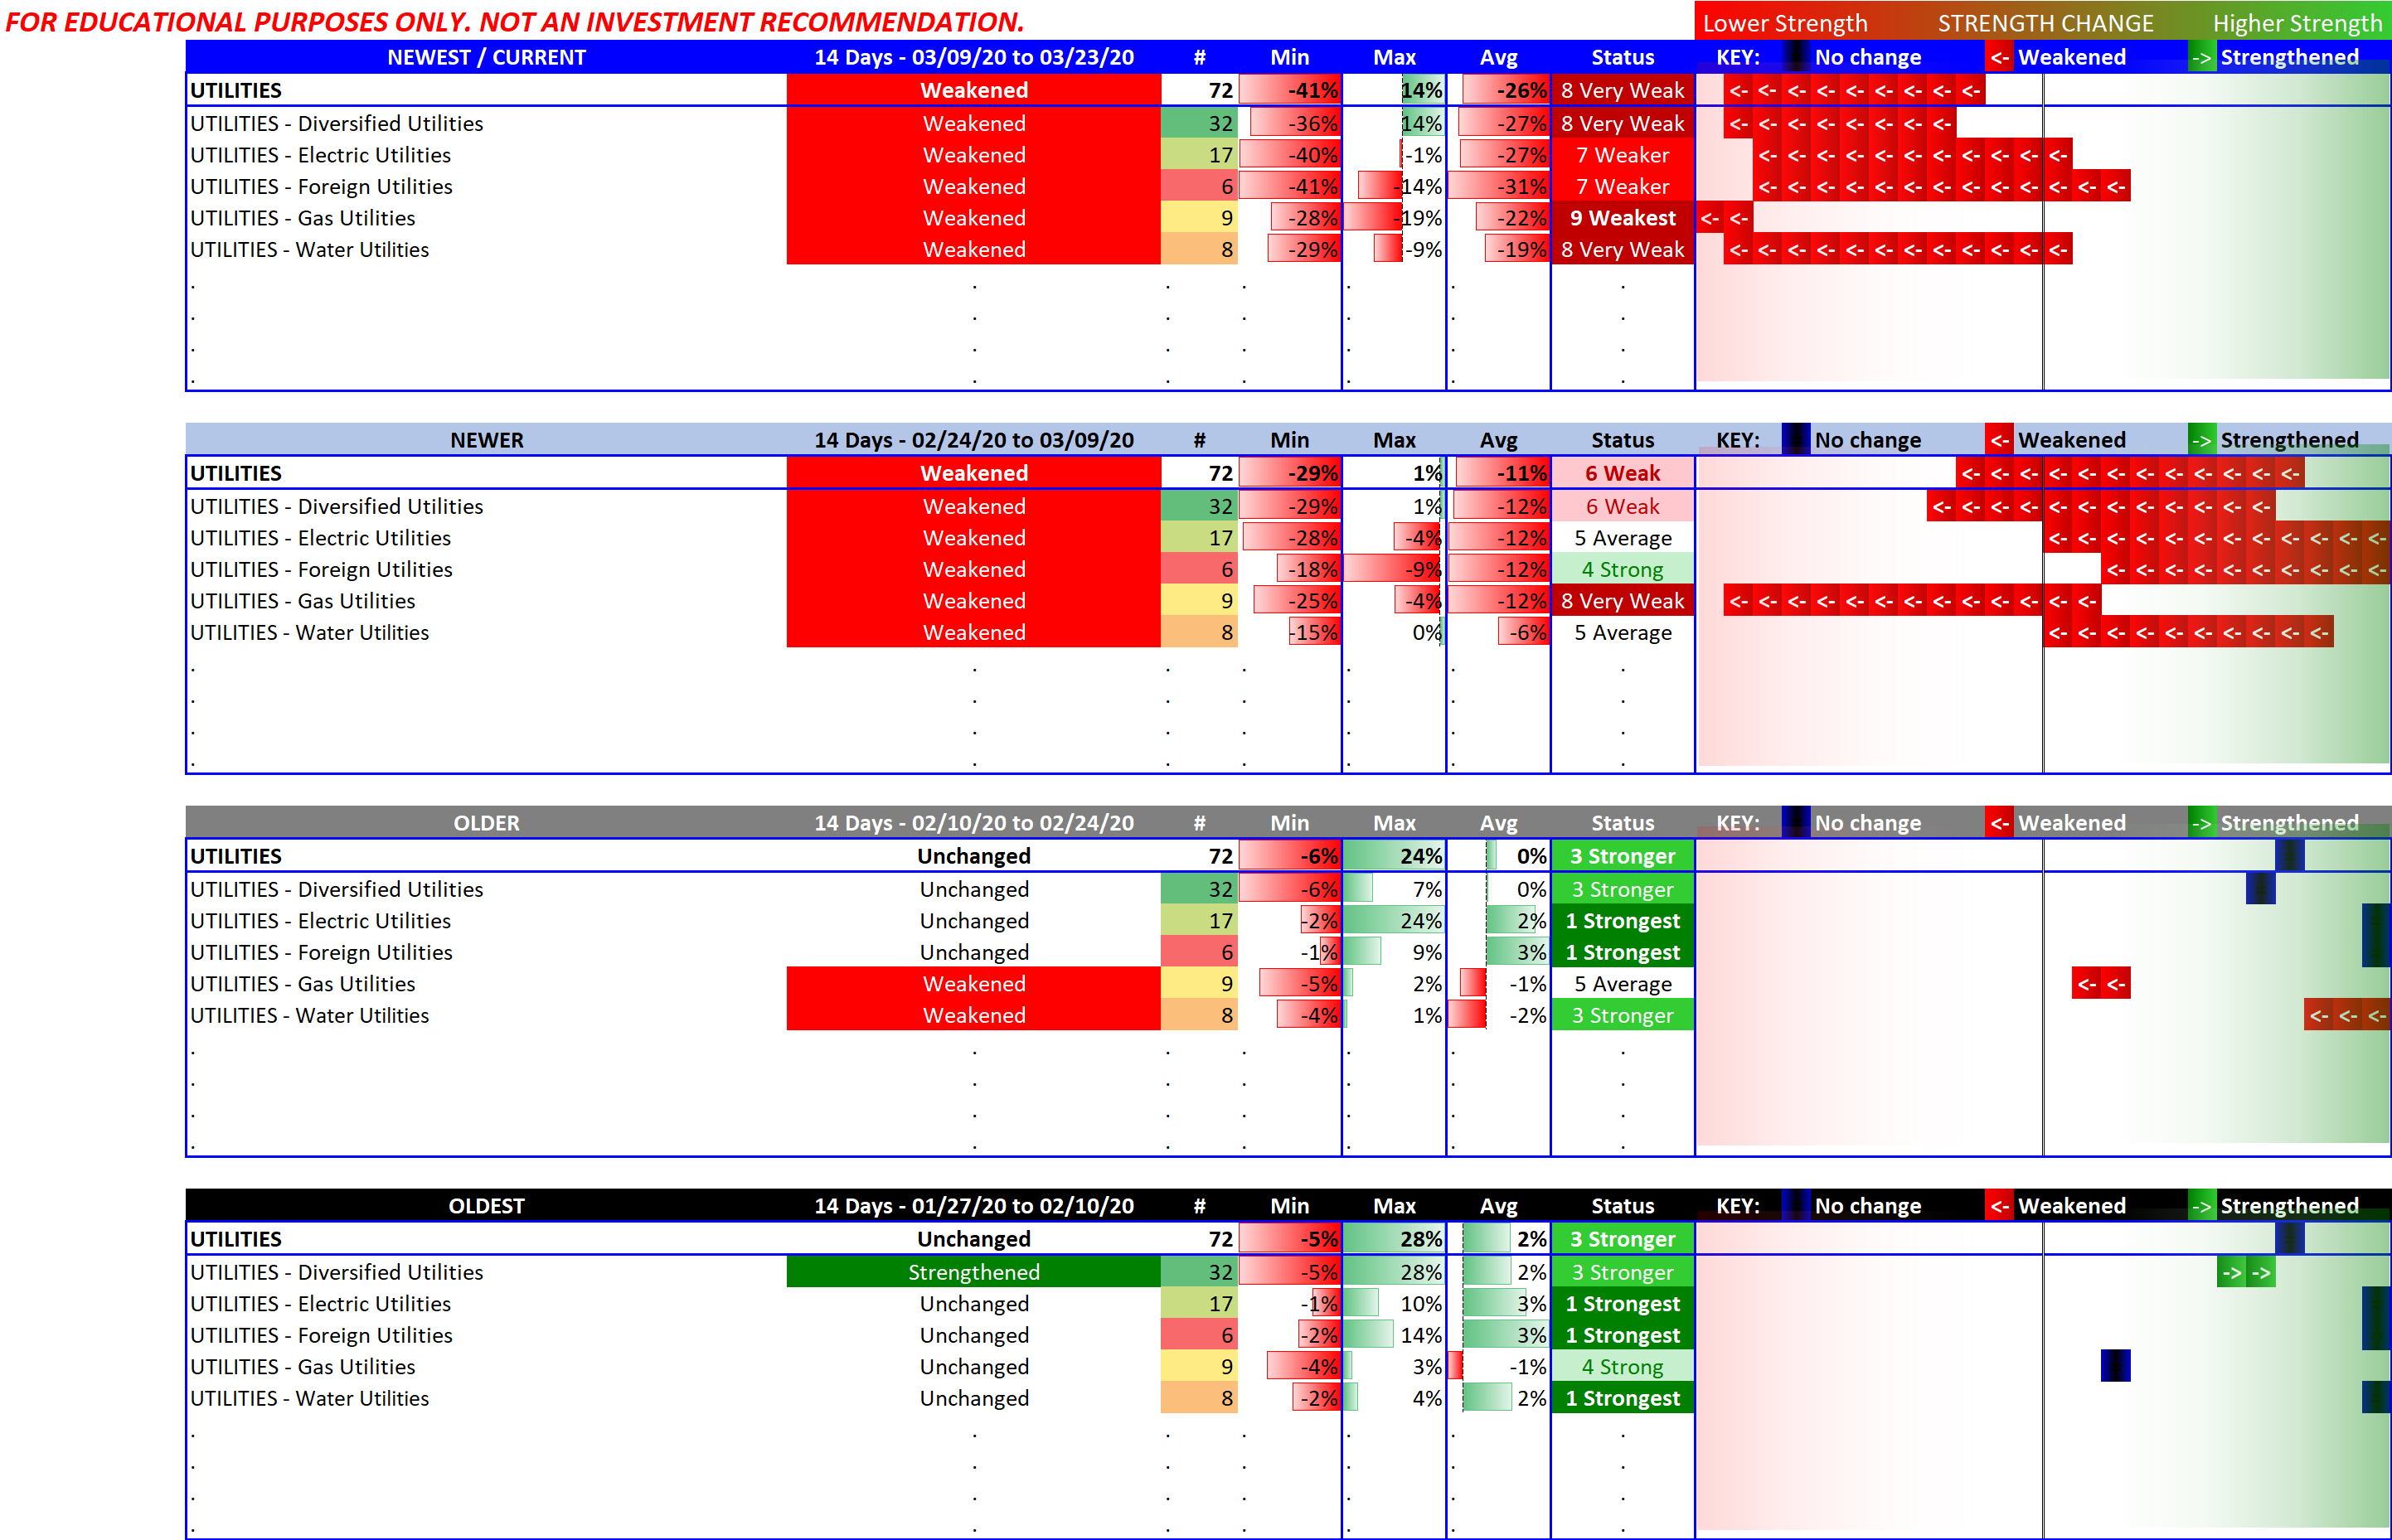
Context - March 23, 2020 8-week look back (pandemic decline)
The full pandemic decline is shown in this 8-week look back. Since this is shown on a spectrum of possibilities from strongest to weakest, the degeneration is clear in a different manner than what a price chart would show. A price chart would not objectively tell you the answer to the question "how low is low?" This perspective does.
Downloadable report with stock-by-stock detail is available here: