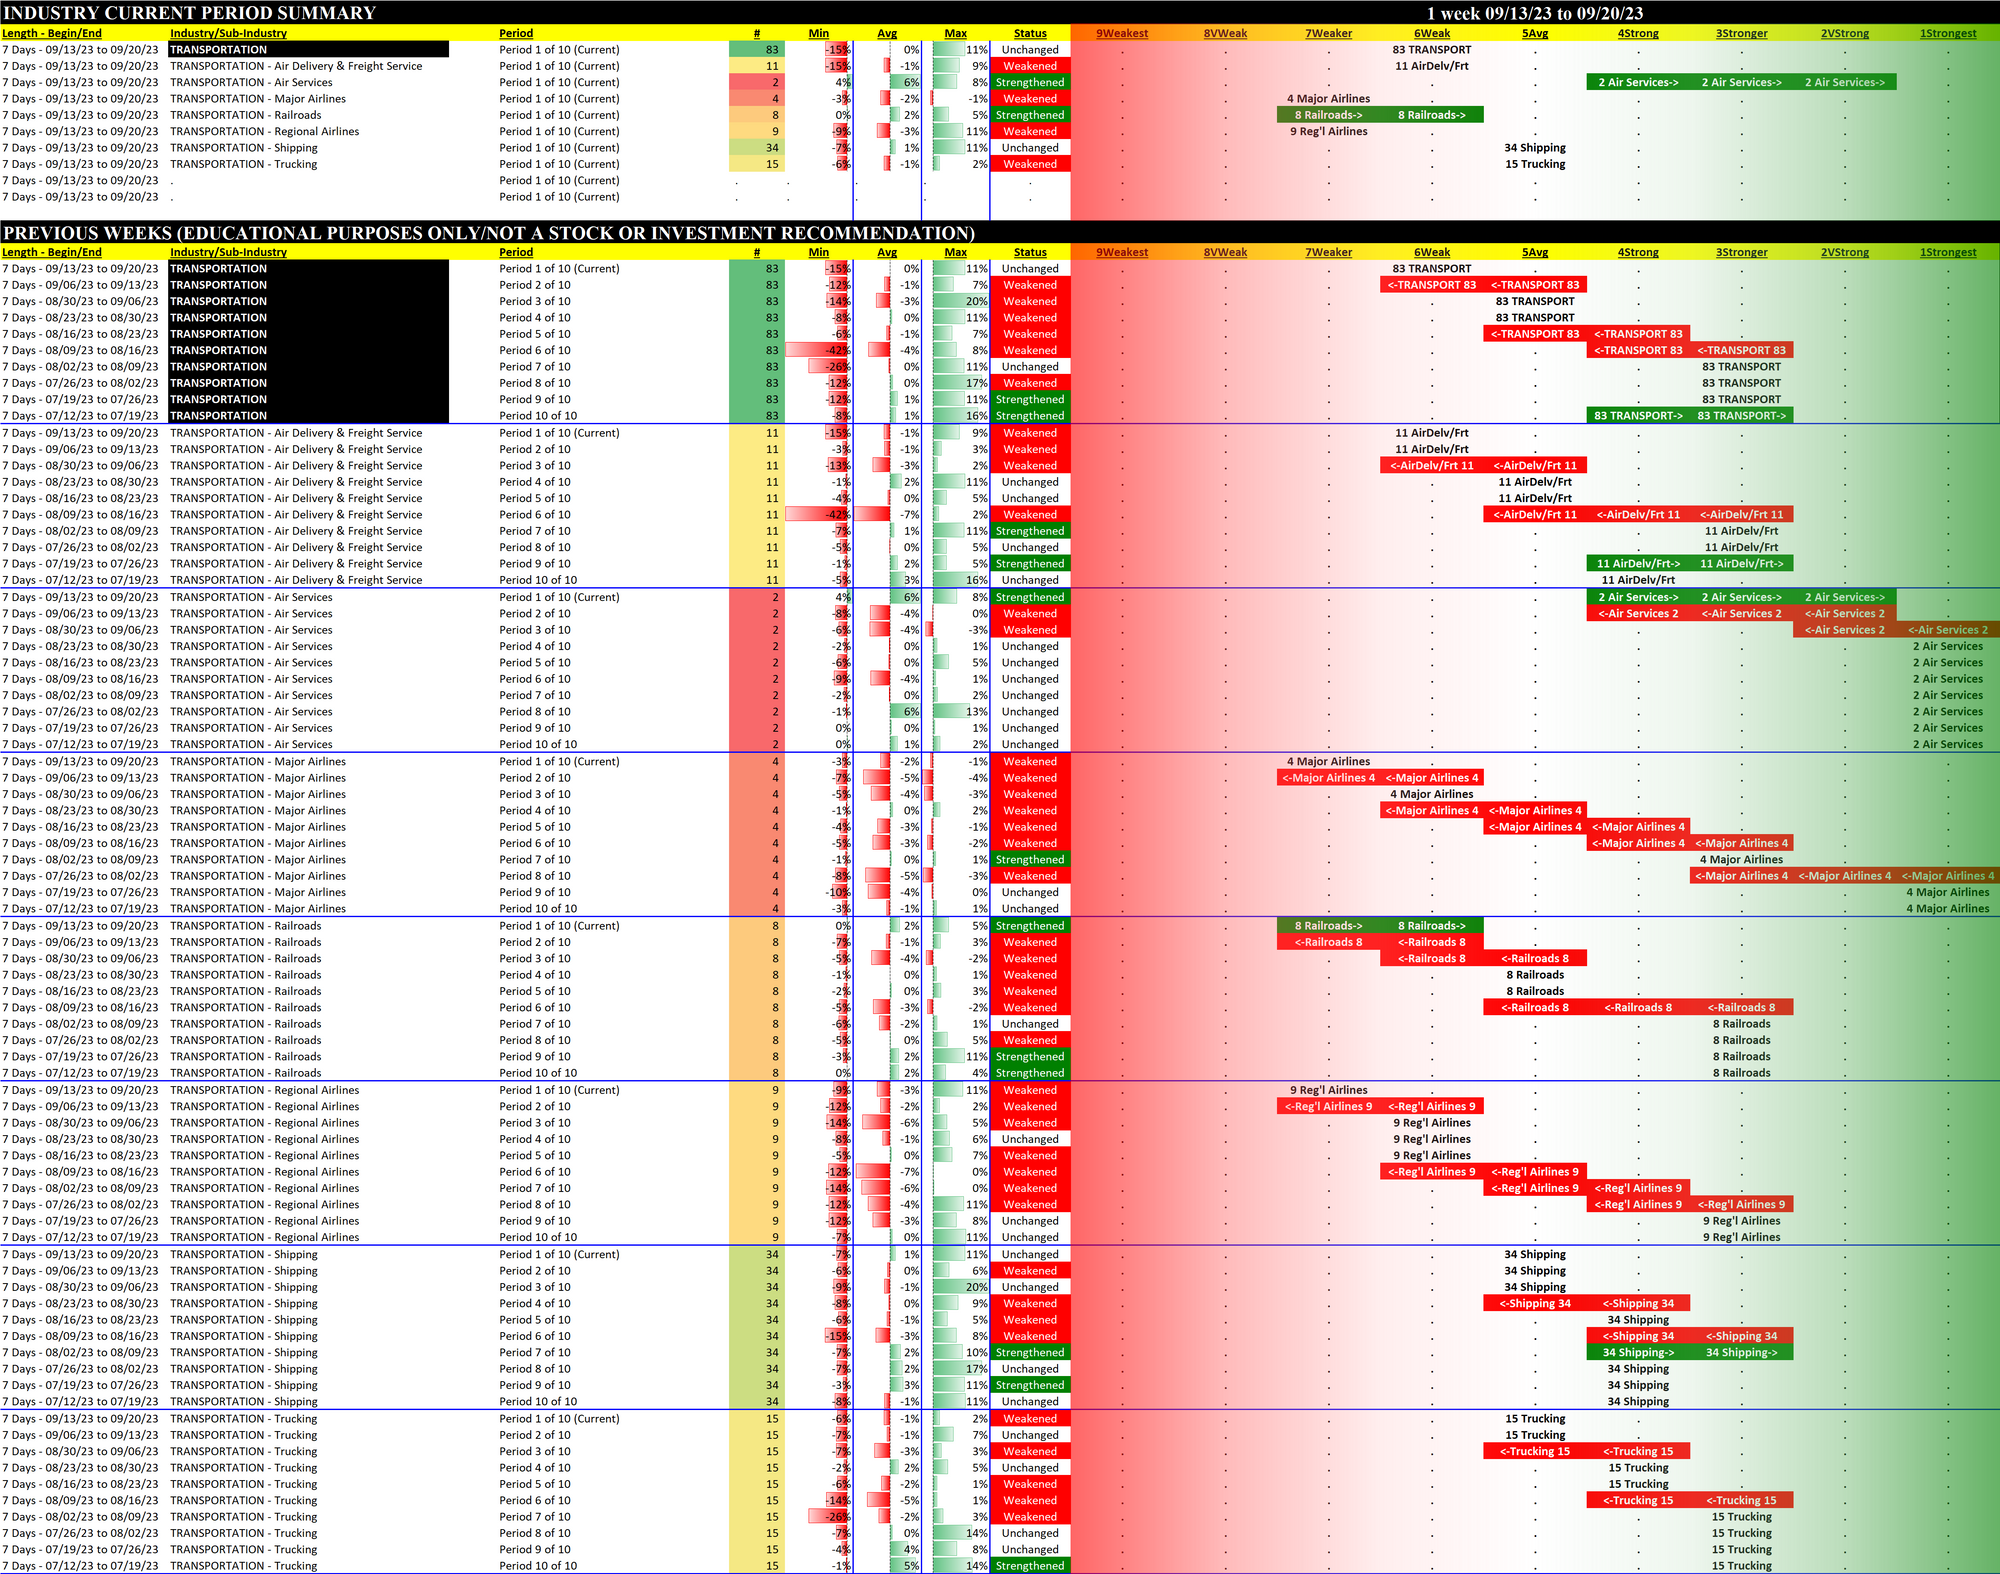
Transportation 2023-09-20: Unchanged at WEAK strength rating (6th strongest of 9 levels), previous move was DOWN
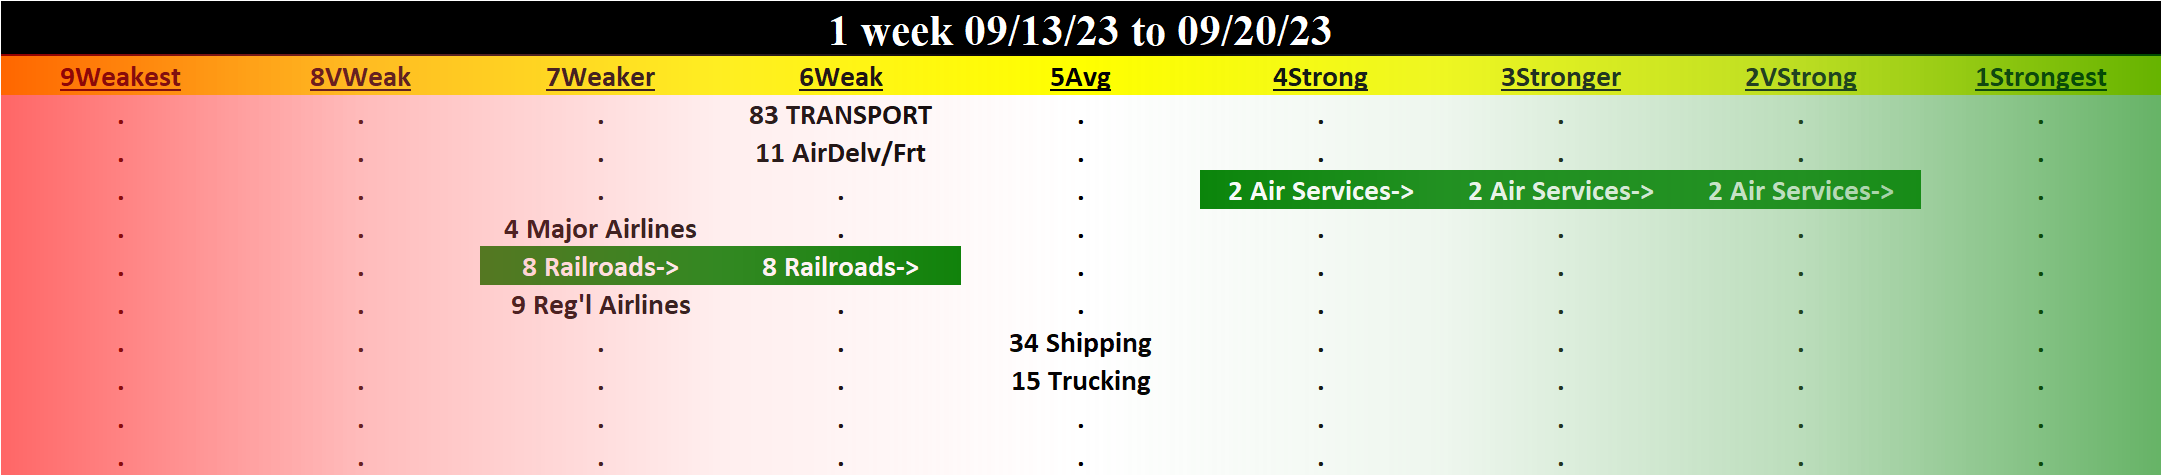
TABLE OF CONTENTS
- INDUSTRY OVERVIEW
1A. Performance
1B. Background - SUB-INDUSTRIES AND STOCKS DETAIL
2A. Sub-Industries Overview
2B. Sub-Industries 10-Week Strengthening Analysis
2C. Stocks 1 Week Strongest and Weakest - STRENGTH BY LOOKBACK PERIOD (with Best/Worst stocks)
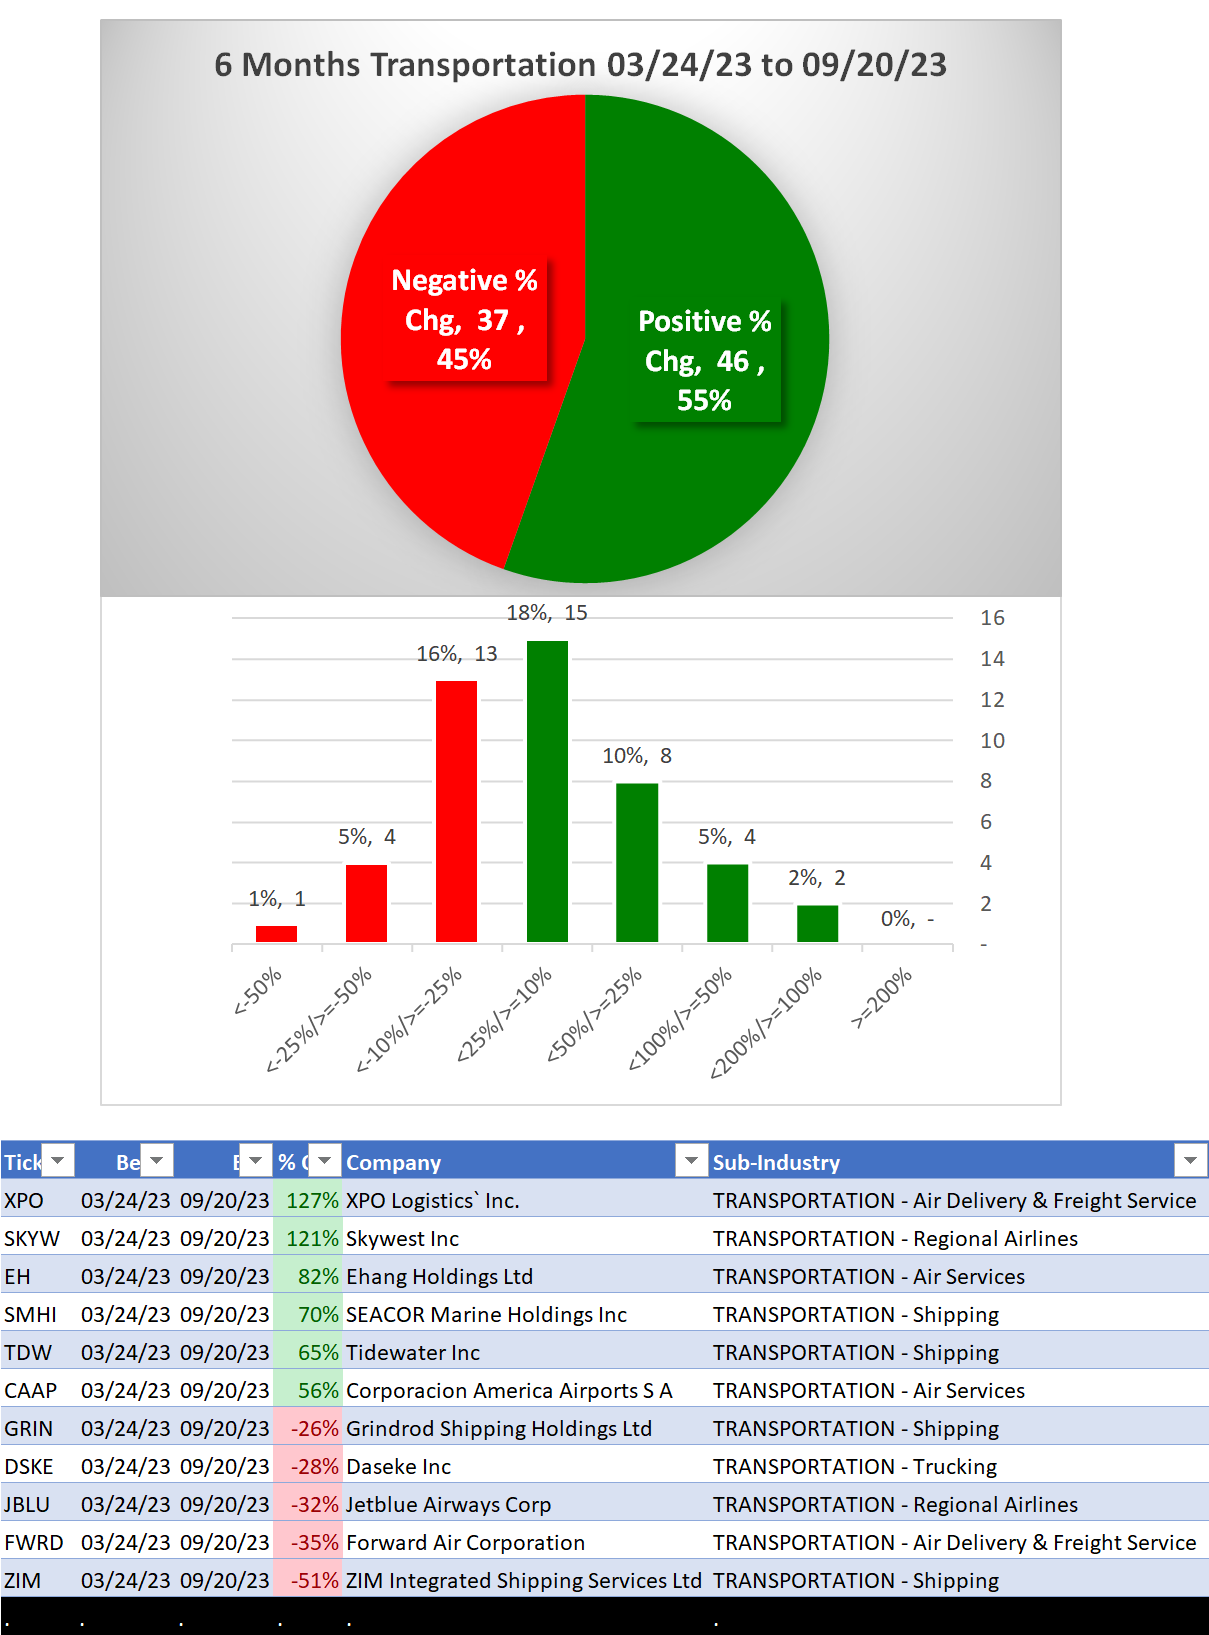
3A. Lookback 6 Months
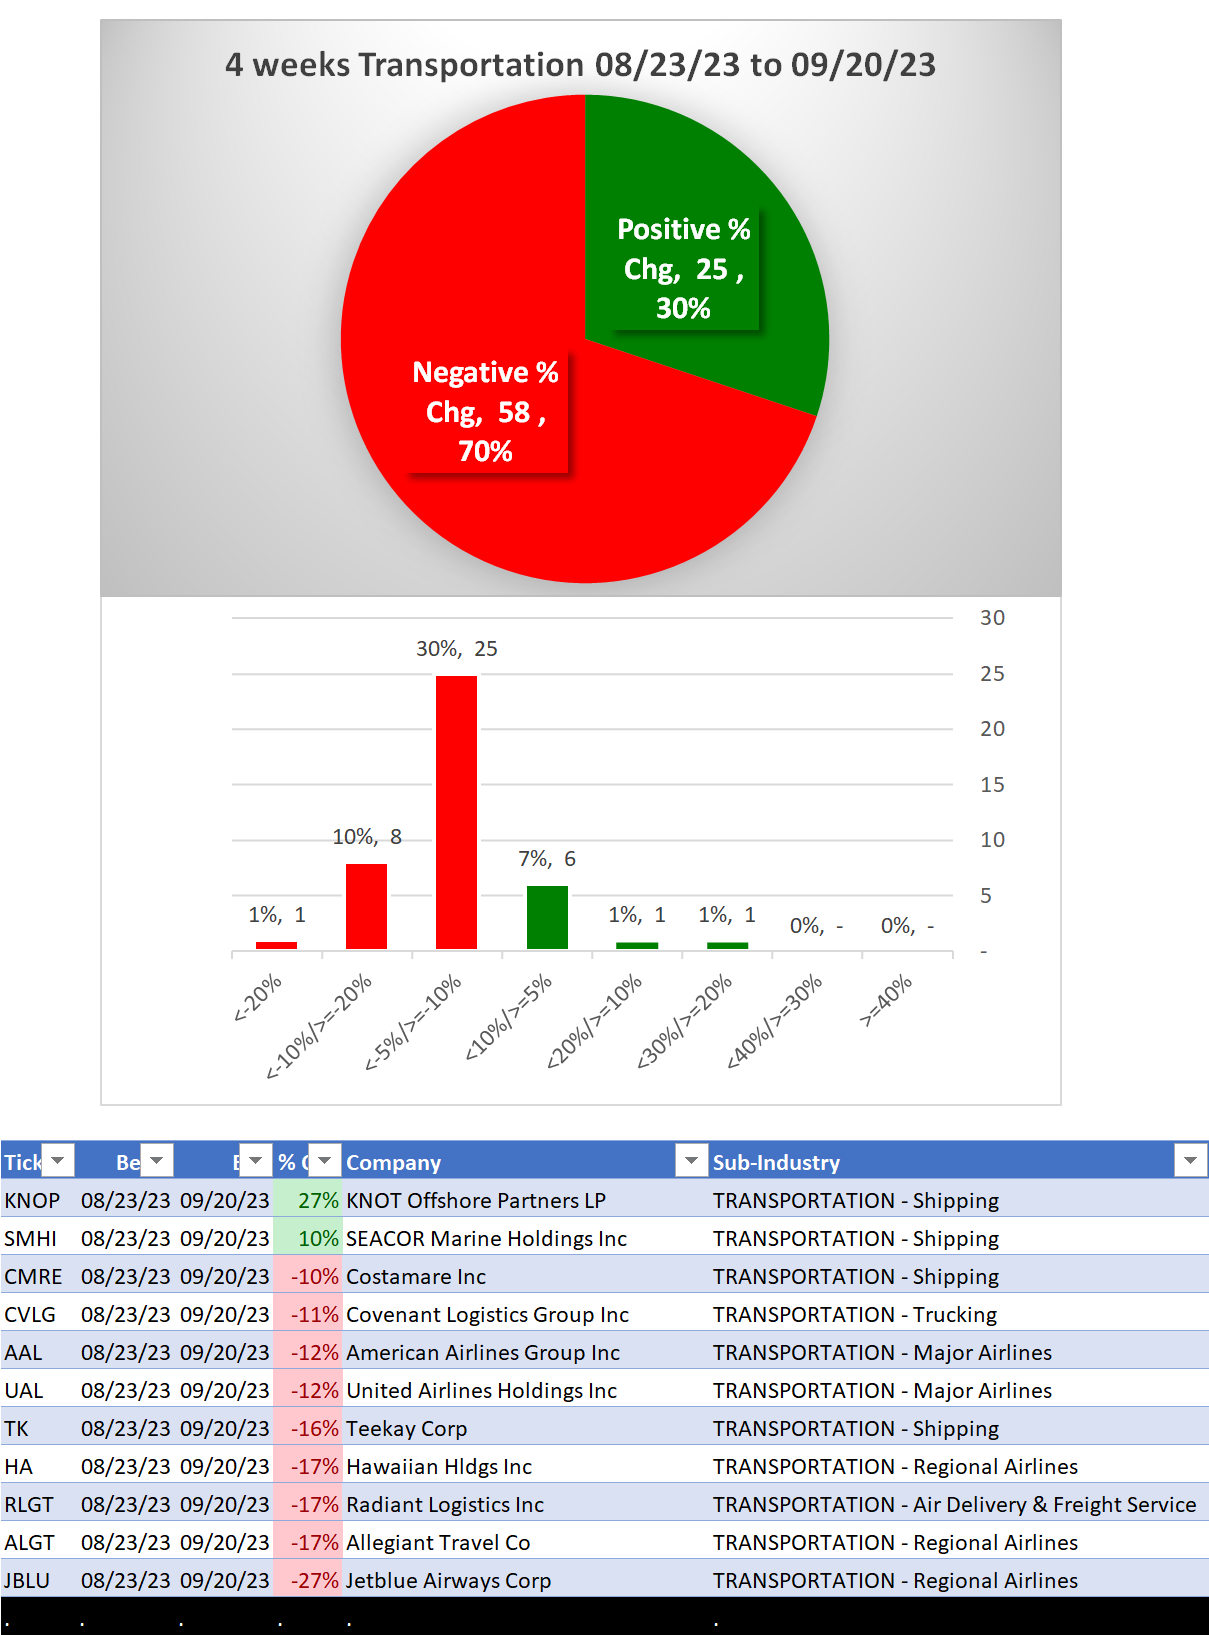
3B. Lookback 4 weeks
3C. Lookback 1 Week
1. INDUSTRY OVERVIEW
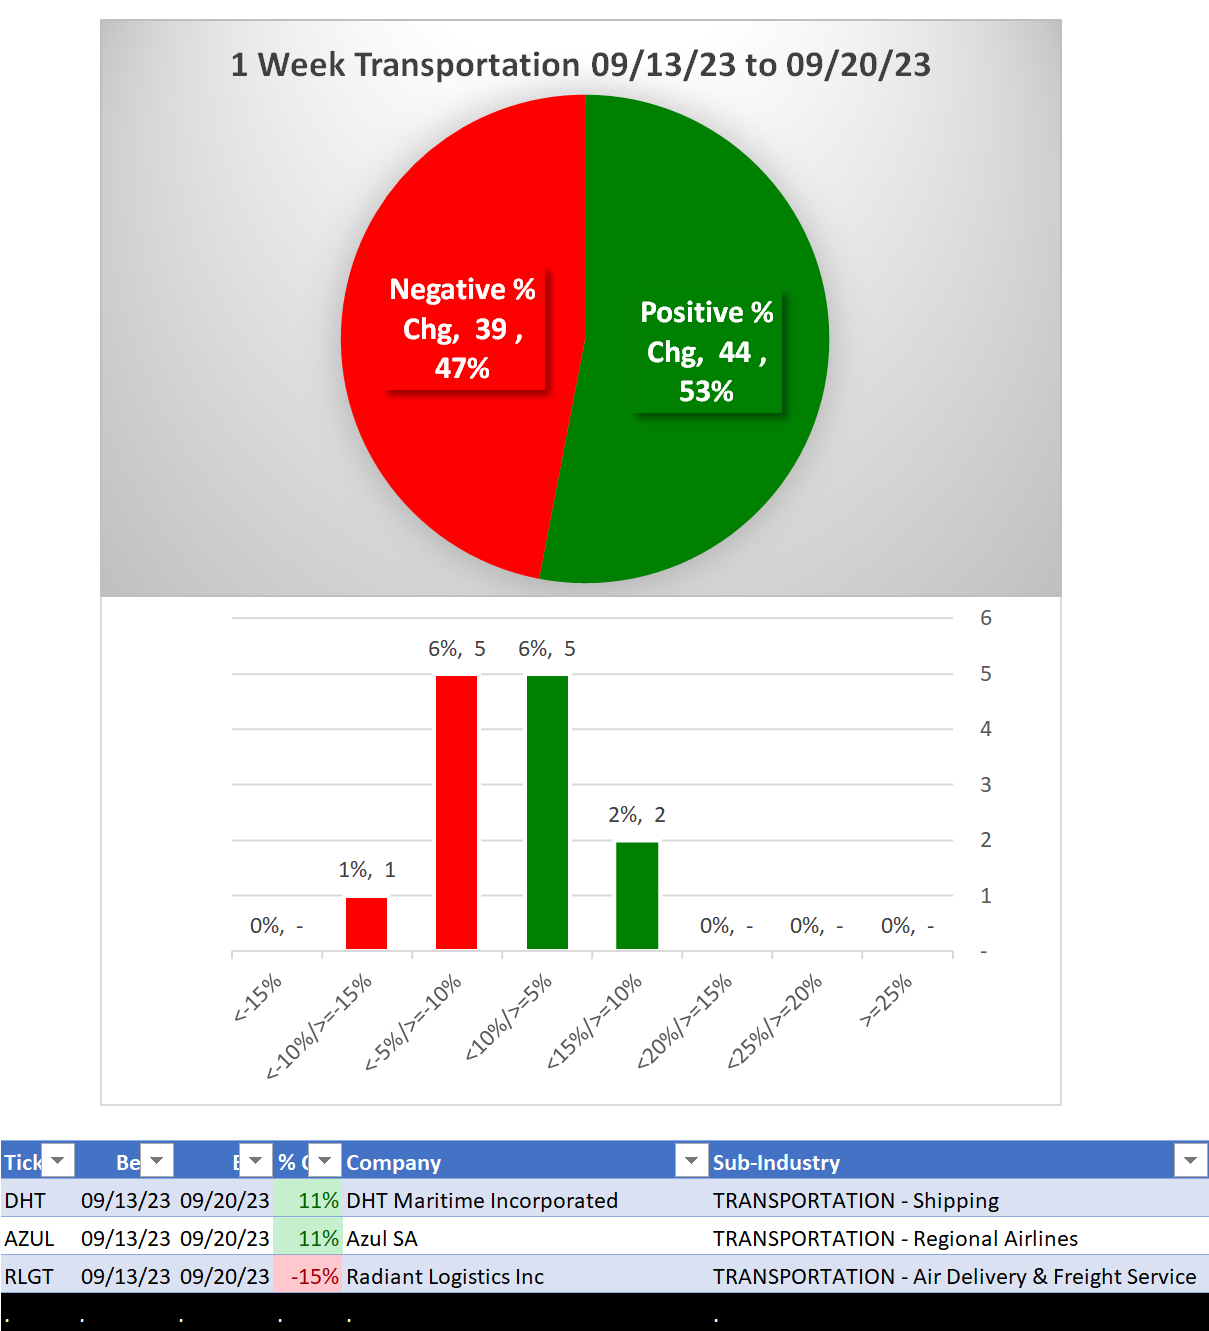
1A. Performance
Past 10 Weeks Strengthening/Weakening week-by-week, per the following chart:
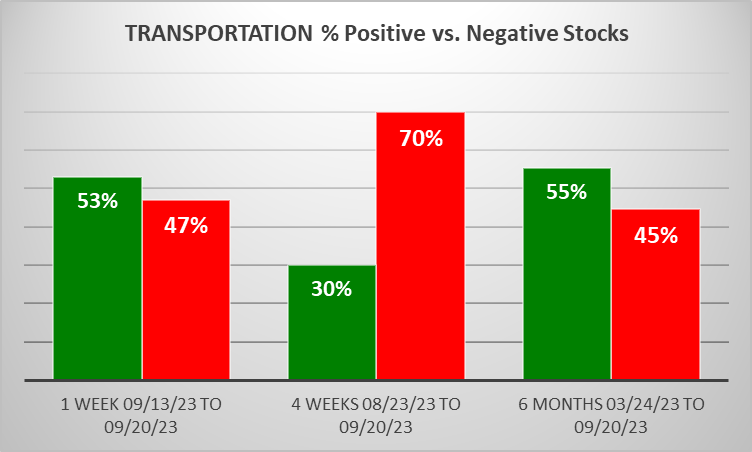
Mixed/STRENGTHENING 1 Week vs. Mid- and Longer-Term // 1 week positive/negative stocks ratio is HIGHER than 4 weeks but LOWER than 6 Months, per the following chart:
Comments:
Stocks rated Weakest are currently 28% of total stocks.
1B. Background
Largest of 7 sub-industries (83 stocks, average 12):
- Shipping (34 stocks)
- Trucking (15 stocks)
- Air Delivery & Freight Service (11 stocks)
- Regional Airlines (9 stocks)
Top 10 by Market Capitalization:
UPS/United Parcel Service Inc, UNP/Union Pacific Corp, CNI/Canadian Natl Railway, CP/Canadian Pacific Railway Ltd, FDX/Fedex Corp, CSX/Csx Corp, ODFL/Old Dominion Freight Lines Inc, NSC/Norfolk Southern Corp, DAL/Delta Air Lines Inc, WAB/Wabtec Corporation
2. SUB-INDUSTRIES AND STOCKS DETAIL
2A. Sub-Industries Overview
Strengthened: 2/7 sub-industries
Weakened: 0/7 sub-industries
STRONGEST at Very Strong rating/2nd strongest of 9 levels:
- Air Services (2 stocks)
WEAKEST at Weaker rating/7th strongest of 9 levels:
- Major Airlines (4 stocks)
- Regional Airlines (9 stocks)
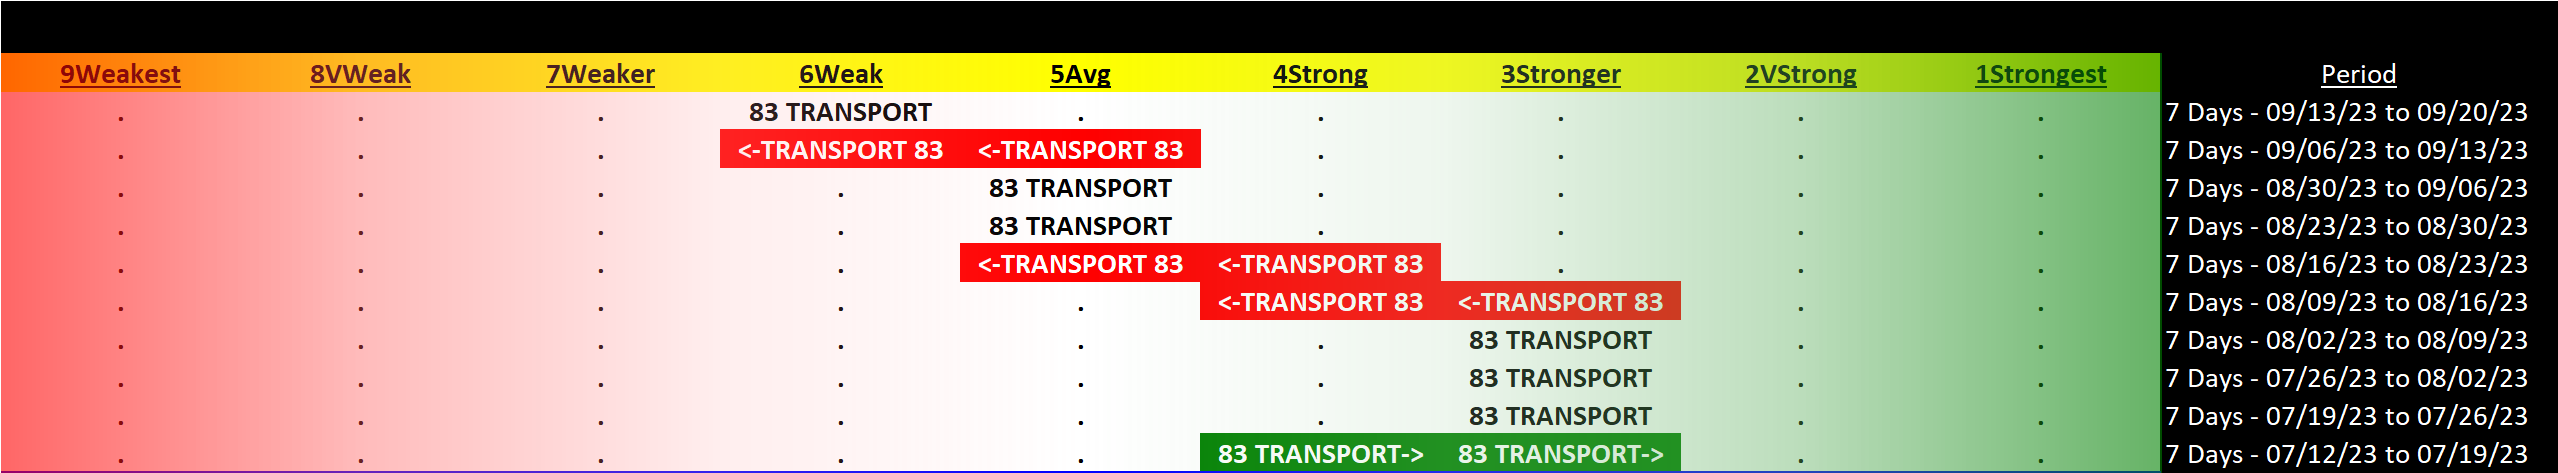
2B. Sub-Industries 10-Week Strengthening Analysis
What: recent week-by-week strength changes for the industry and each underlying sub-industry
Why: objective measurement of strengthening and weakening enabling comparison within and across industries and sub-industries
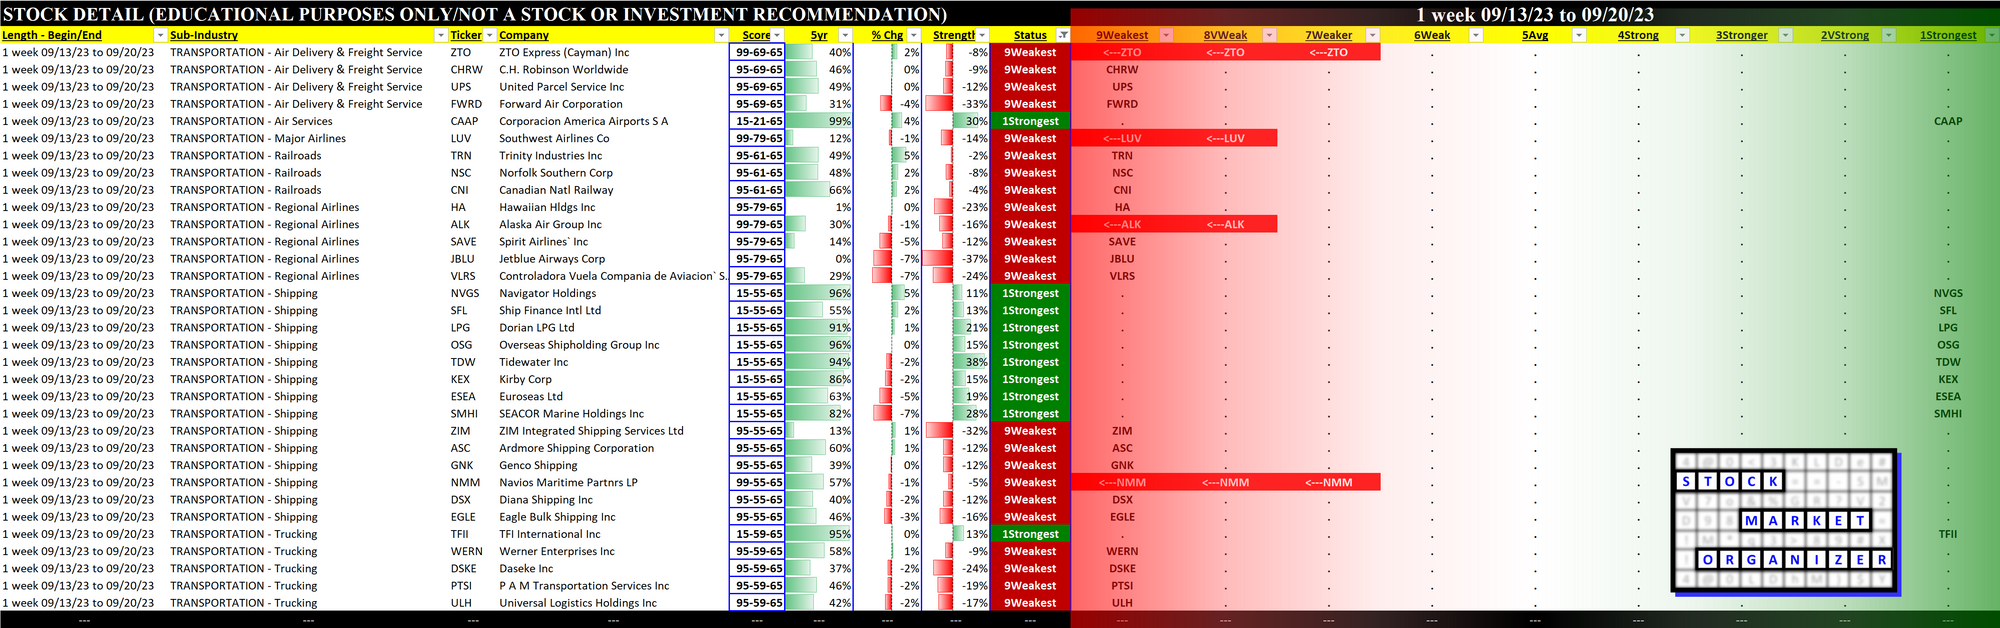
2C. Stocks 1 Week Strongest and Weakest
What: stocks currently rated Strongest/Weakest (highest/lowest of 9 strength ratings)
Why: most interesting stocks for available capital because
- the Strongest have the least amount of overhead supply to dampen breakouts while
- the Weakest may be prone to volatility, subject to big pops from bottom-fishing and short-covering BUT ALSO to bigger and faster falls.
(Not guaranteed and not a recommendation - weak stocks in weakening sub-industries may be better shorts than high-flyers.)
3. STRENGTH BY LOOKBACK PERIOD (with Best/Worst stocks)
3A. Lookback 6 Months
3B. Lookback 4 weeks
3C. Lookback 1 Week