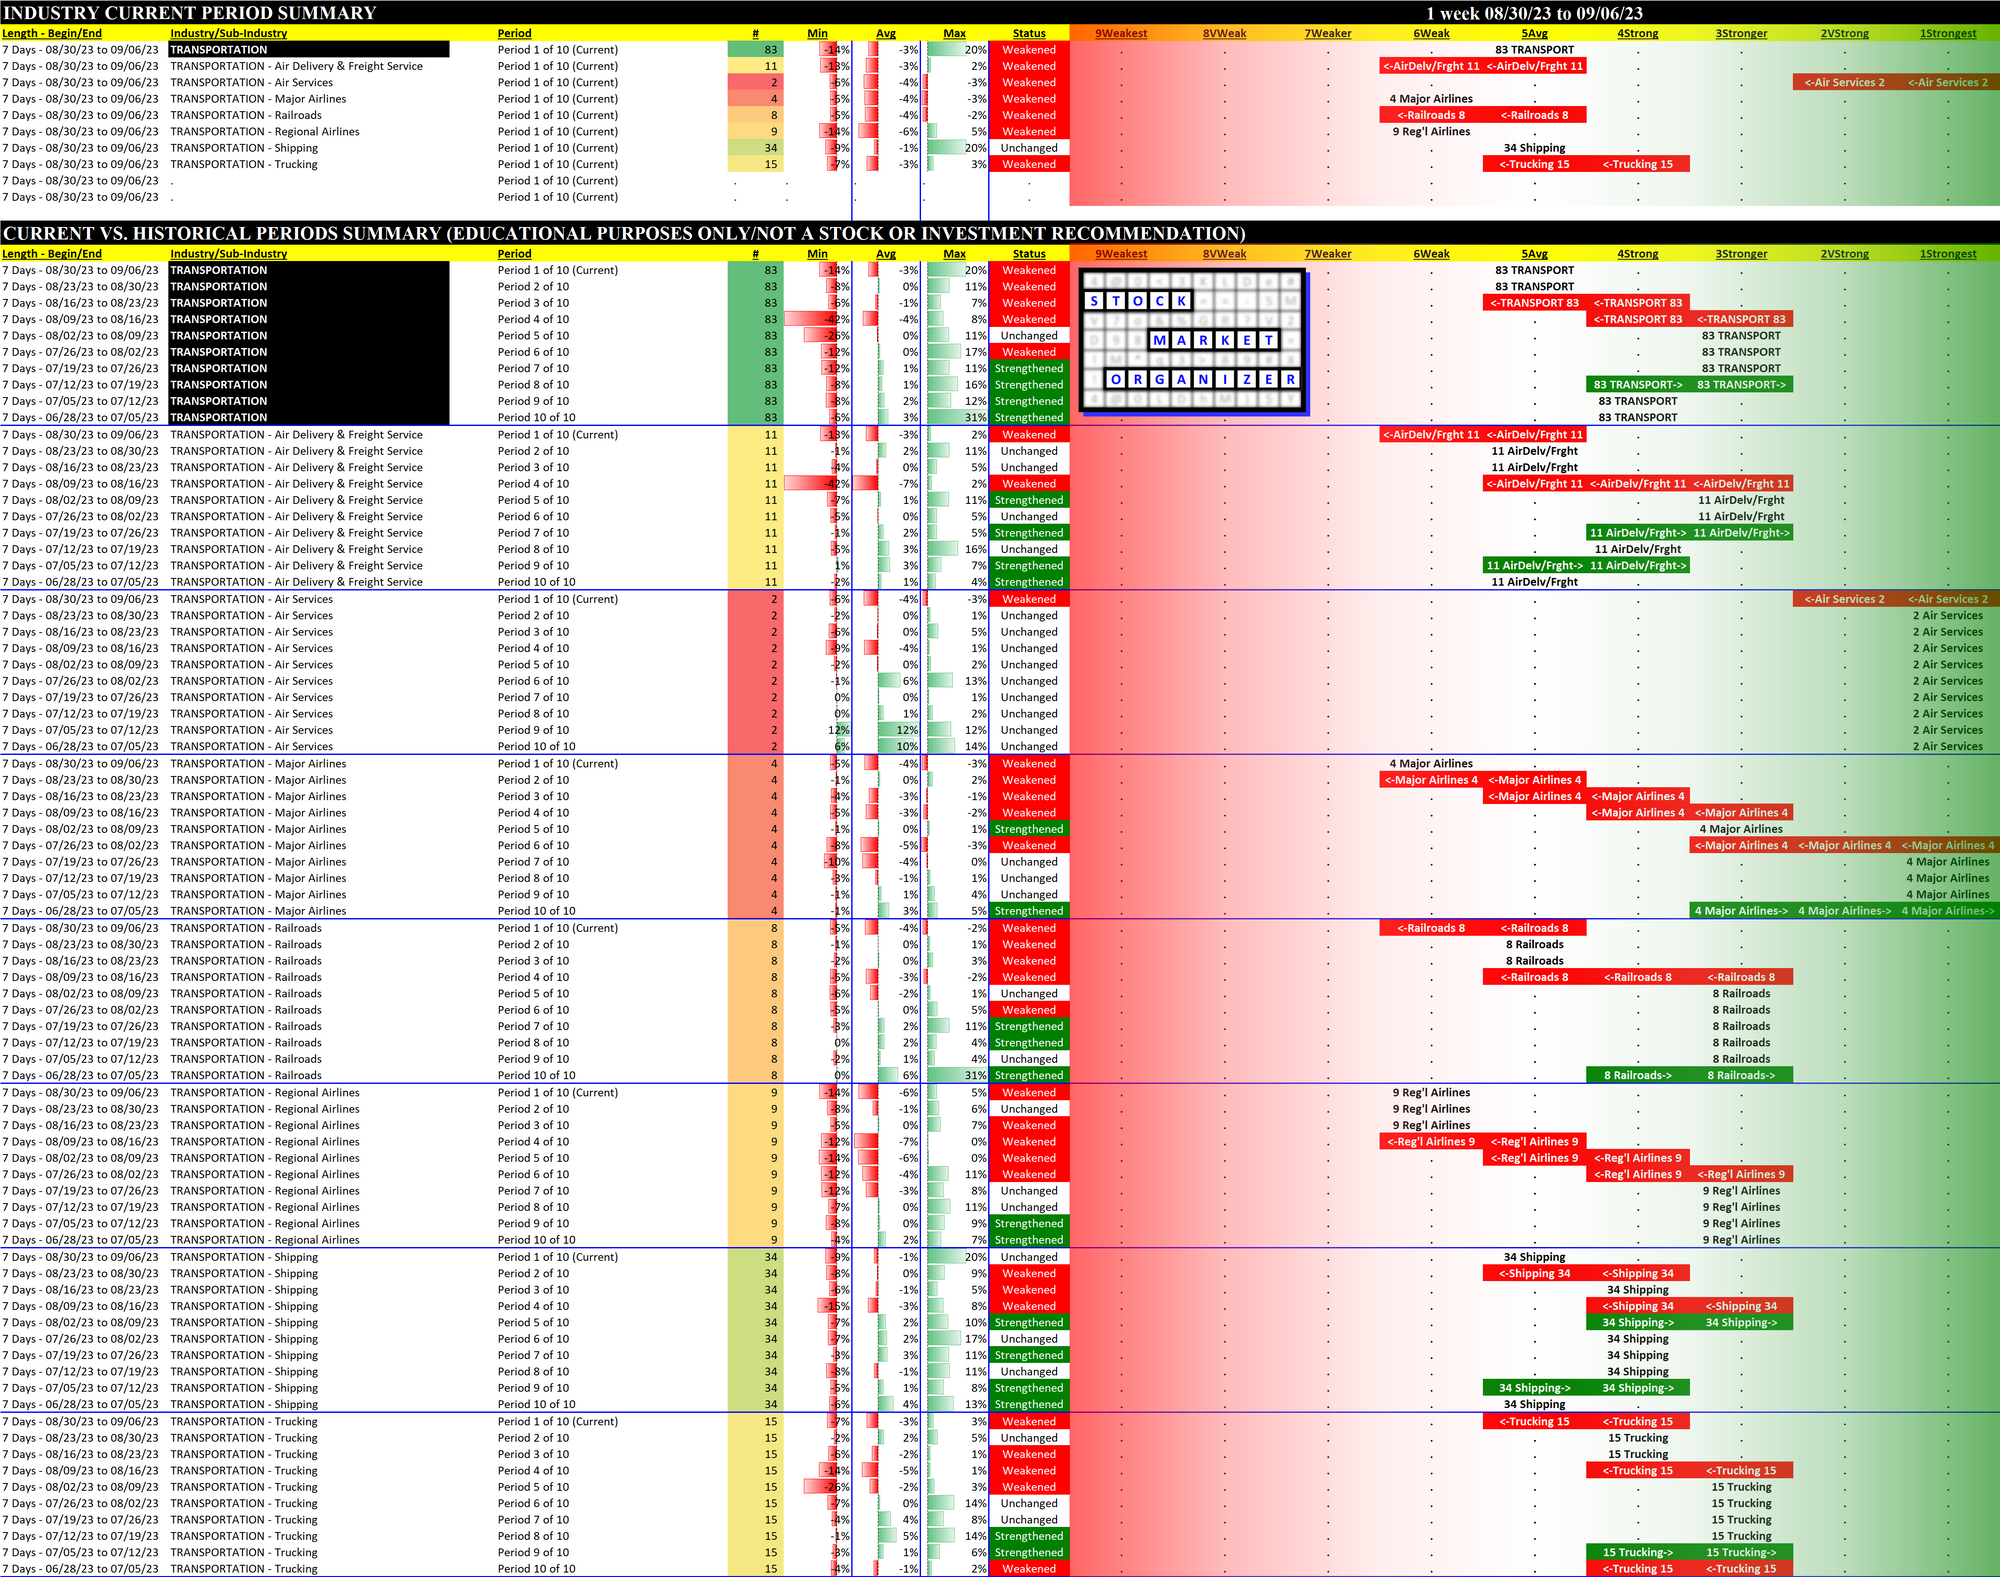
Transportation 2023-09-06: Unchanged at "AVERAGE" strength rating (5th strongest of 9 levels), previous move was DOWN
My most recent review of Transportation was July 12, 2023.
Like Automotive, it was also rated Stronger (3rd strongest of 9 levels). Today, it is 2 strength levels lower at Average.
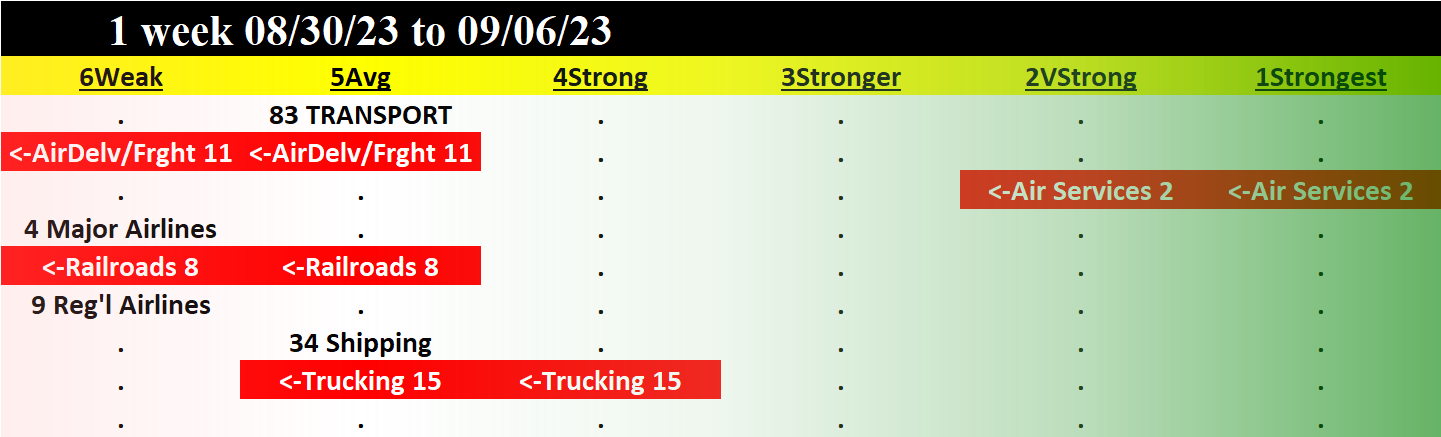
There are 7 Transportation sub-industries with 83 stocks. The largest sub-industry is Shipping with 34 stocks. This industry also includes the 4 Major Airlines stocks and 9 Regional Airlines stocks.
For some longer term perspective, here are some YTD 2023 stats:
1. 4 stocks >100% return (SKYW/Skywest +163%, XPO/XPO Inc. +118%, SAIA/Saia Inc. +108%, and EH/Ehang Holdings +105%).
2. 20 stocks (about 1 in 4) have returned between 25% and 100%.
3. 33 stocks (about 40%) are negative this year.
4. The biggest loser by far at -59% is GRIN/Grindrod Shipping Holdings. There are 3 stocks that lost about 1/3 their value.
5. 3 of the 4 major airlines stocks have double digit YTD returns - UAL/United Airlines +28%, DAL/Delta Air Lines 27%, and AAL/American Airlines Group +13%. LUV/Southwest Airlines is -11%.
Since the beginning of August, the industry has had its troubles. 5 of 6 stocks are negative since then. Perhaps shockingly, 10 Transportation stocks have declined by at least 20% during this period, with another 26 down double digits.
Among the biggest losers since the beginning of August is JBLU/JetBlue Airways Corp. -28%. Also down big: ALK/Alaska Air Group -17% and American Airlines -14%. Within the Regional Airlines sub-industry, other than Skywest with a basically-flat -1% performance the remaining 8 regional airlines were -14% to -35% during this period. These airlines struggles are reflected in the graph below.
Leaders and Laggards
Current strongest and weakest stocks are shown below. These are of most interest as the downtrodden are prone to large (if perhaps temporary) pops while the strongest have been leading the charge for their sub-industries.