SPDR Sector ETFs Tue 2025-04-15: 6.1 Strength Score (Strengthened +0.7)
This post objectively summarizing current market conditions consists of the following five sections:
I. Introduction
II. Weekly Returns
III. Spectrum Graph Analysis
IV. Today's Market Context
V. Detailed Sector ETF Analysis
Previous four reports:
- Friday 4/11/25, 6.3 Strength Score, Strengthened +0.1 from 4/04/25
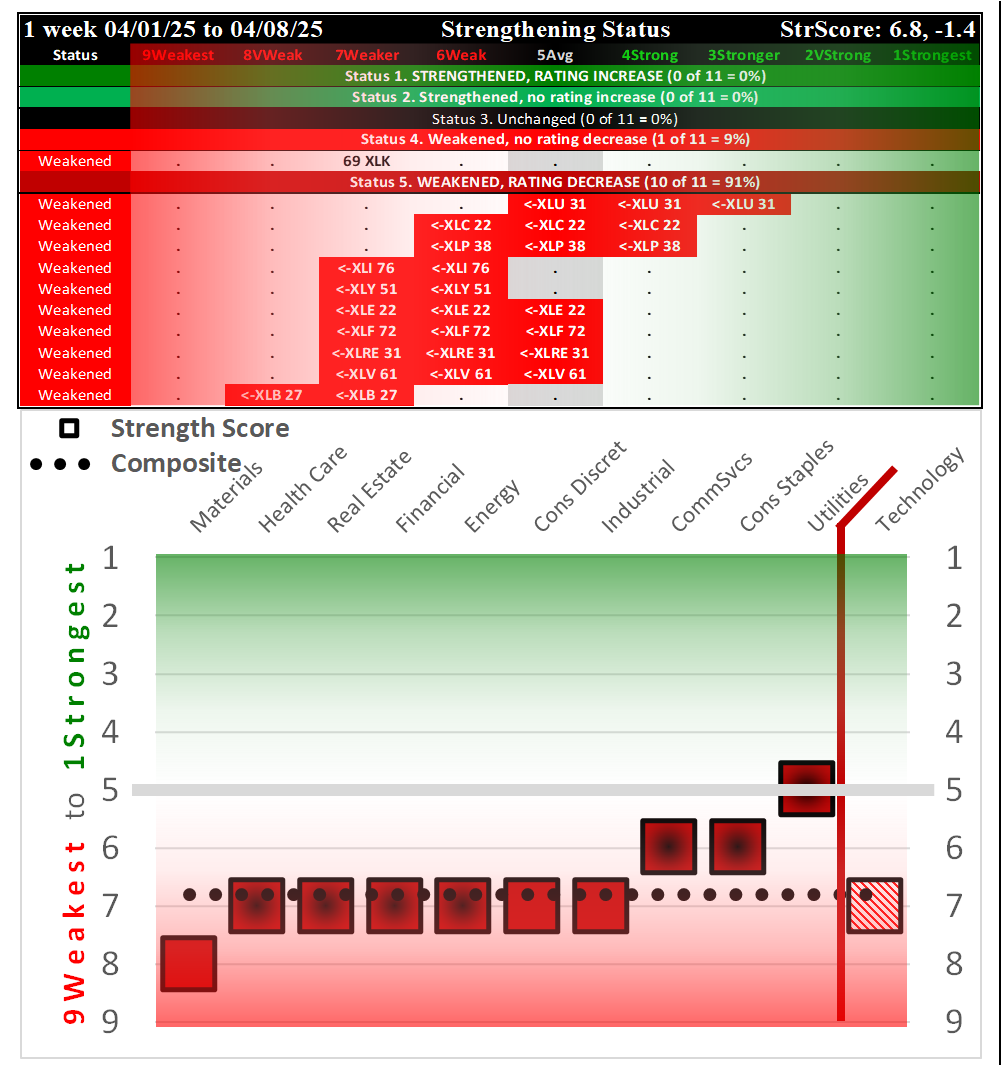
- Tuesday 4/08/25, 6.8 Strength Score, Weakened -1.4 from 4/01/25
- Friday 4/04/25, 6.4 Strength Score, Weakened -0.7 from 3/28/25
- Tuesday 4/01/25, 5.4 Strength Score, Weakened -0.3 from 3/25/25
I. Introduction
Background
This analysis consists of the Stock Market Organizer stock-by-stock strength analysis applied to the 500 stocks that comprise the 11 SPDR Select ETFs.
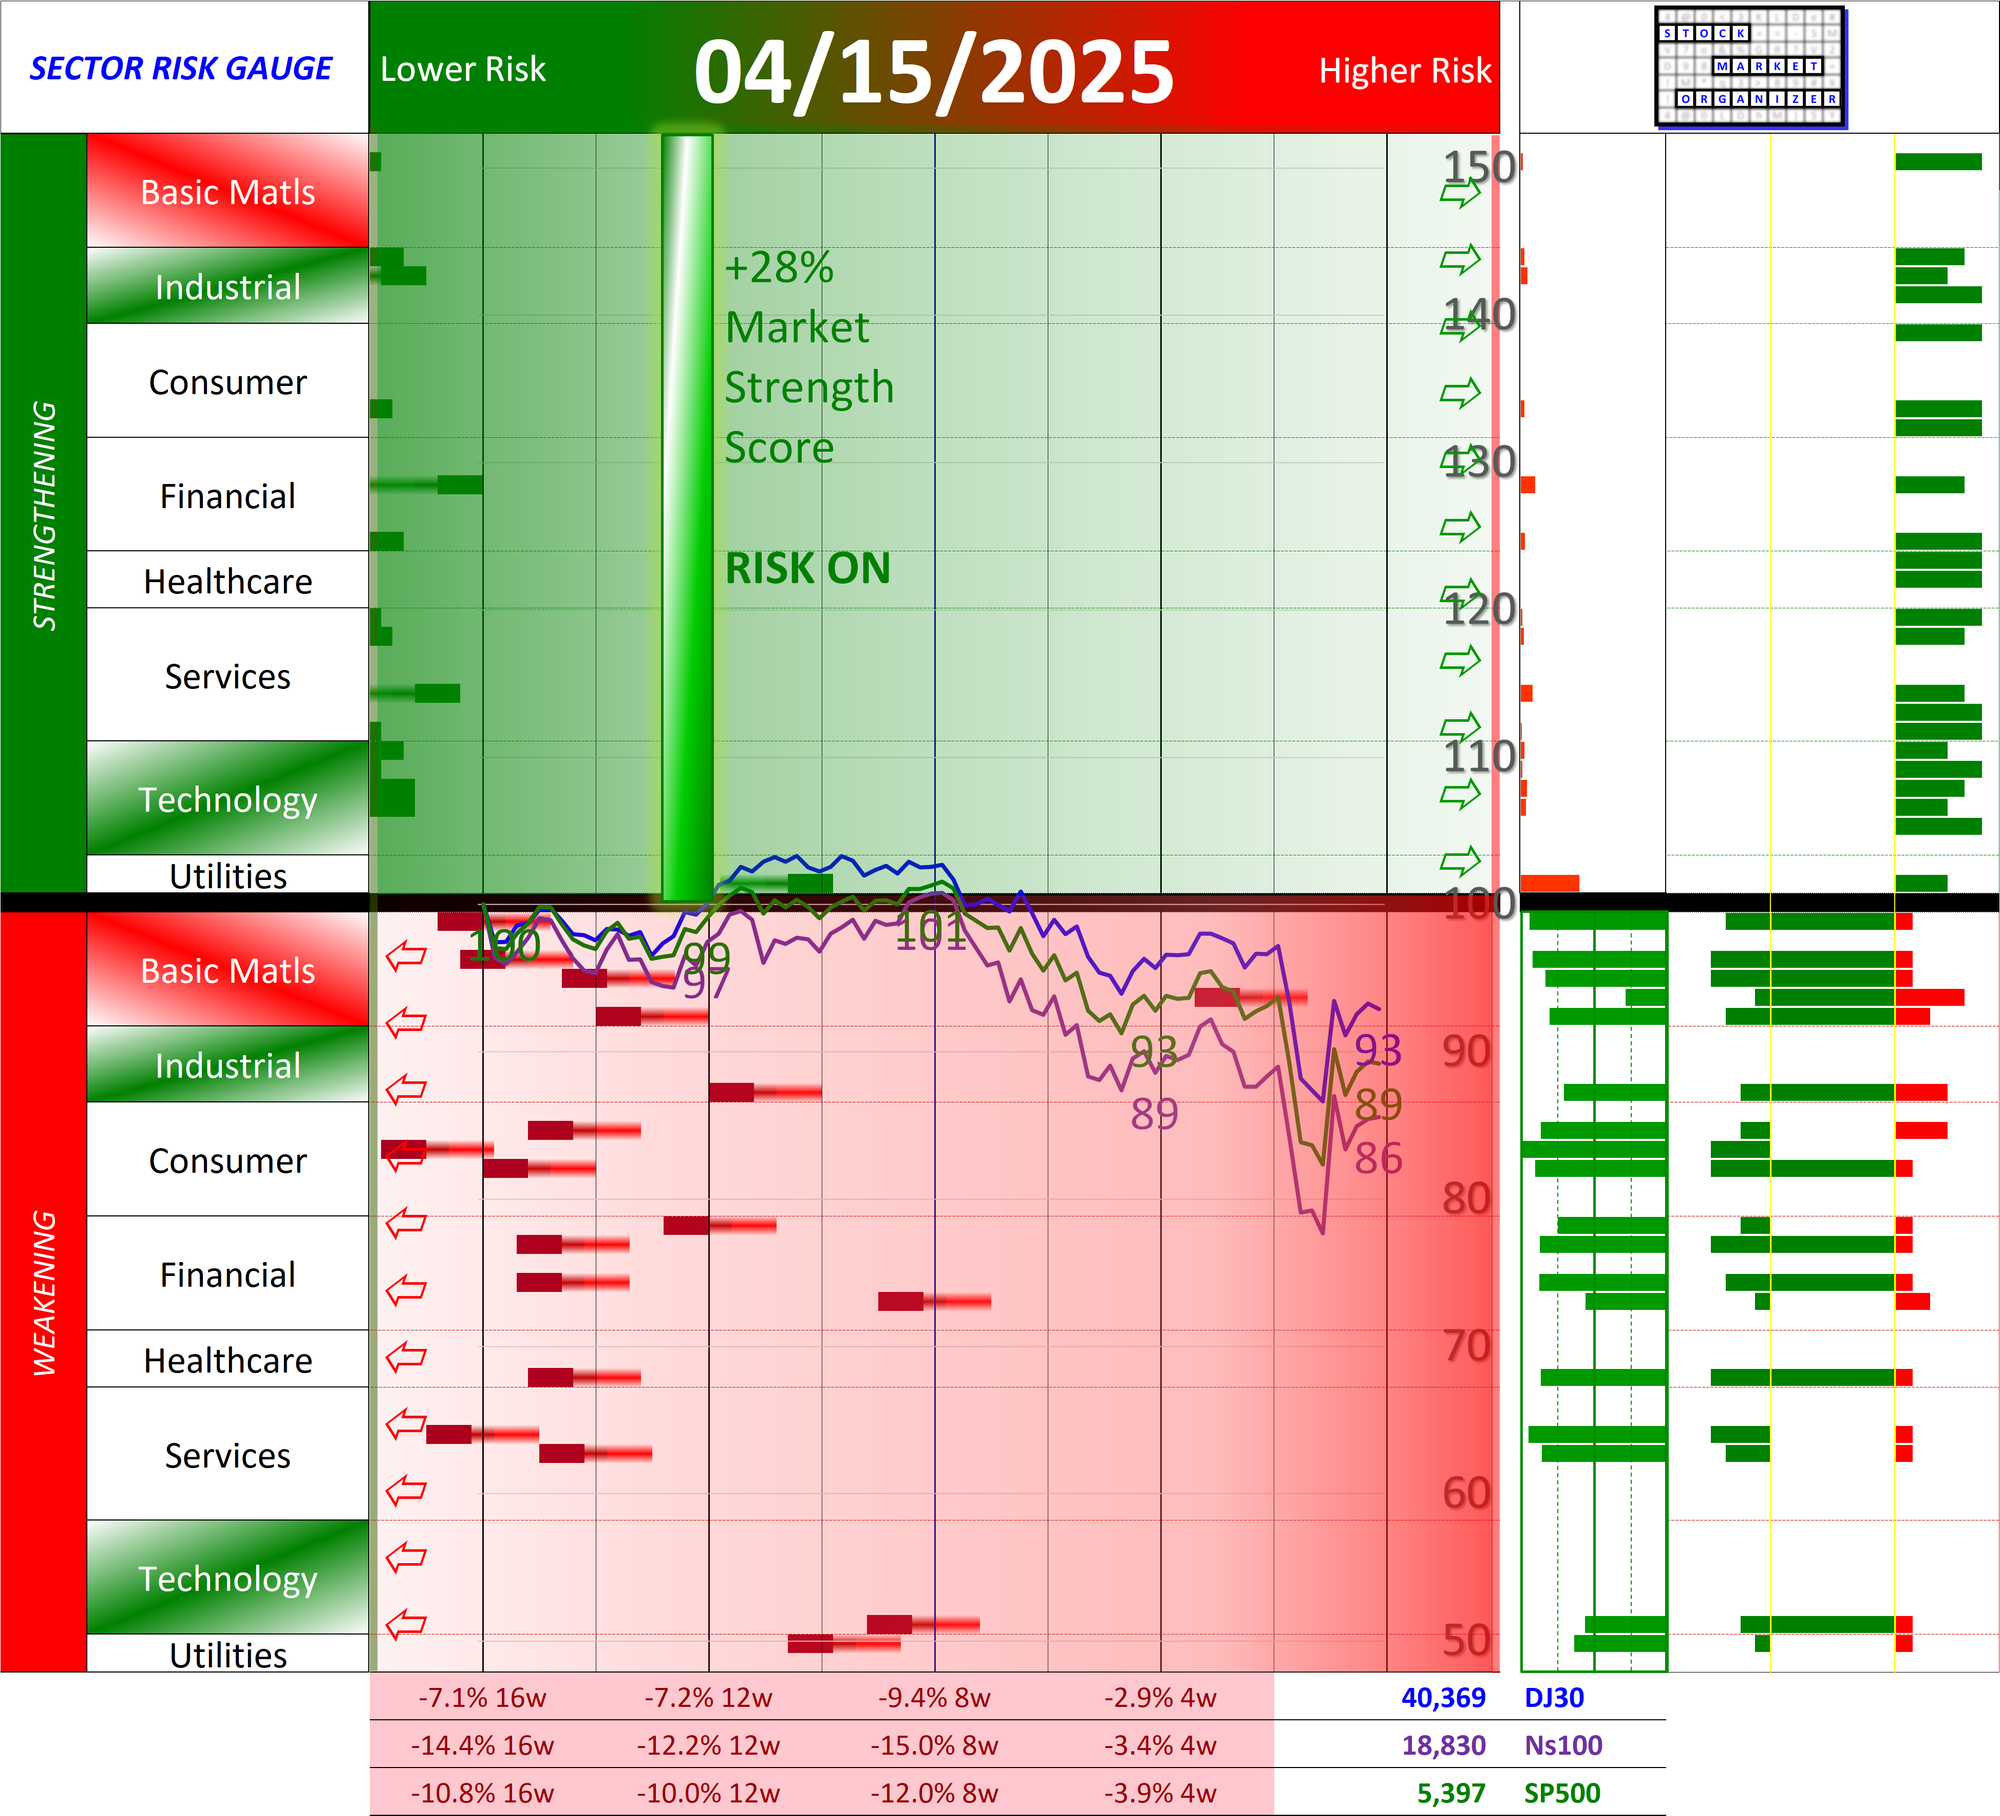
These results are combined with overall market environment readings - the Market Strength Score and the Sector Risk Gauge, which reflect "Risk ON" as of Thursday, April 10, 2025 - to discern appropriate portfolio exposure and risk/position management given prevailing market and sector conditions.
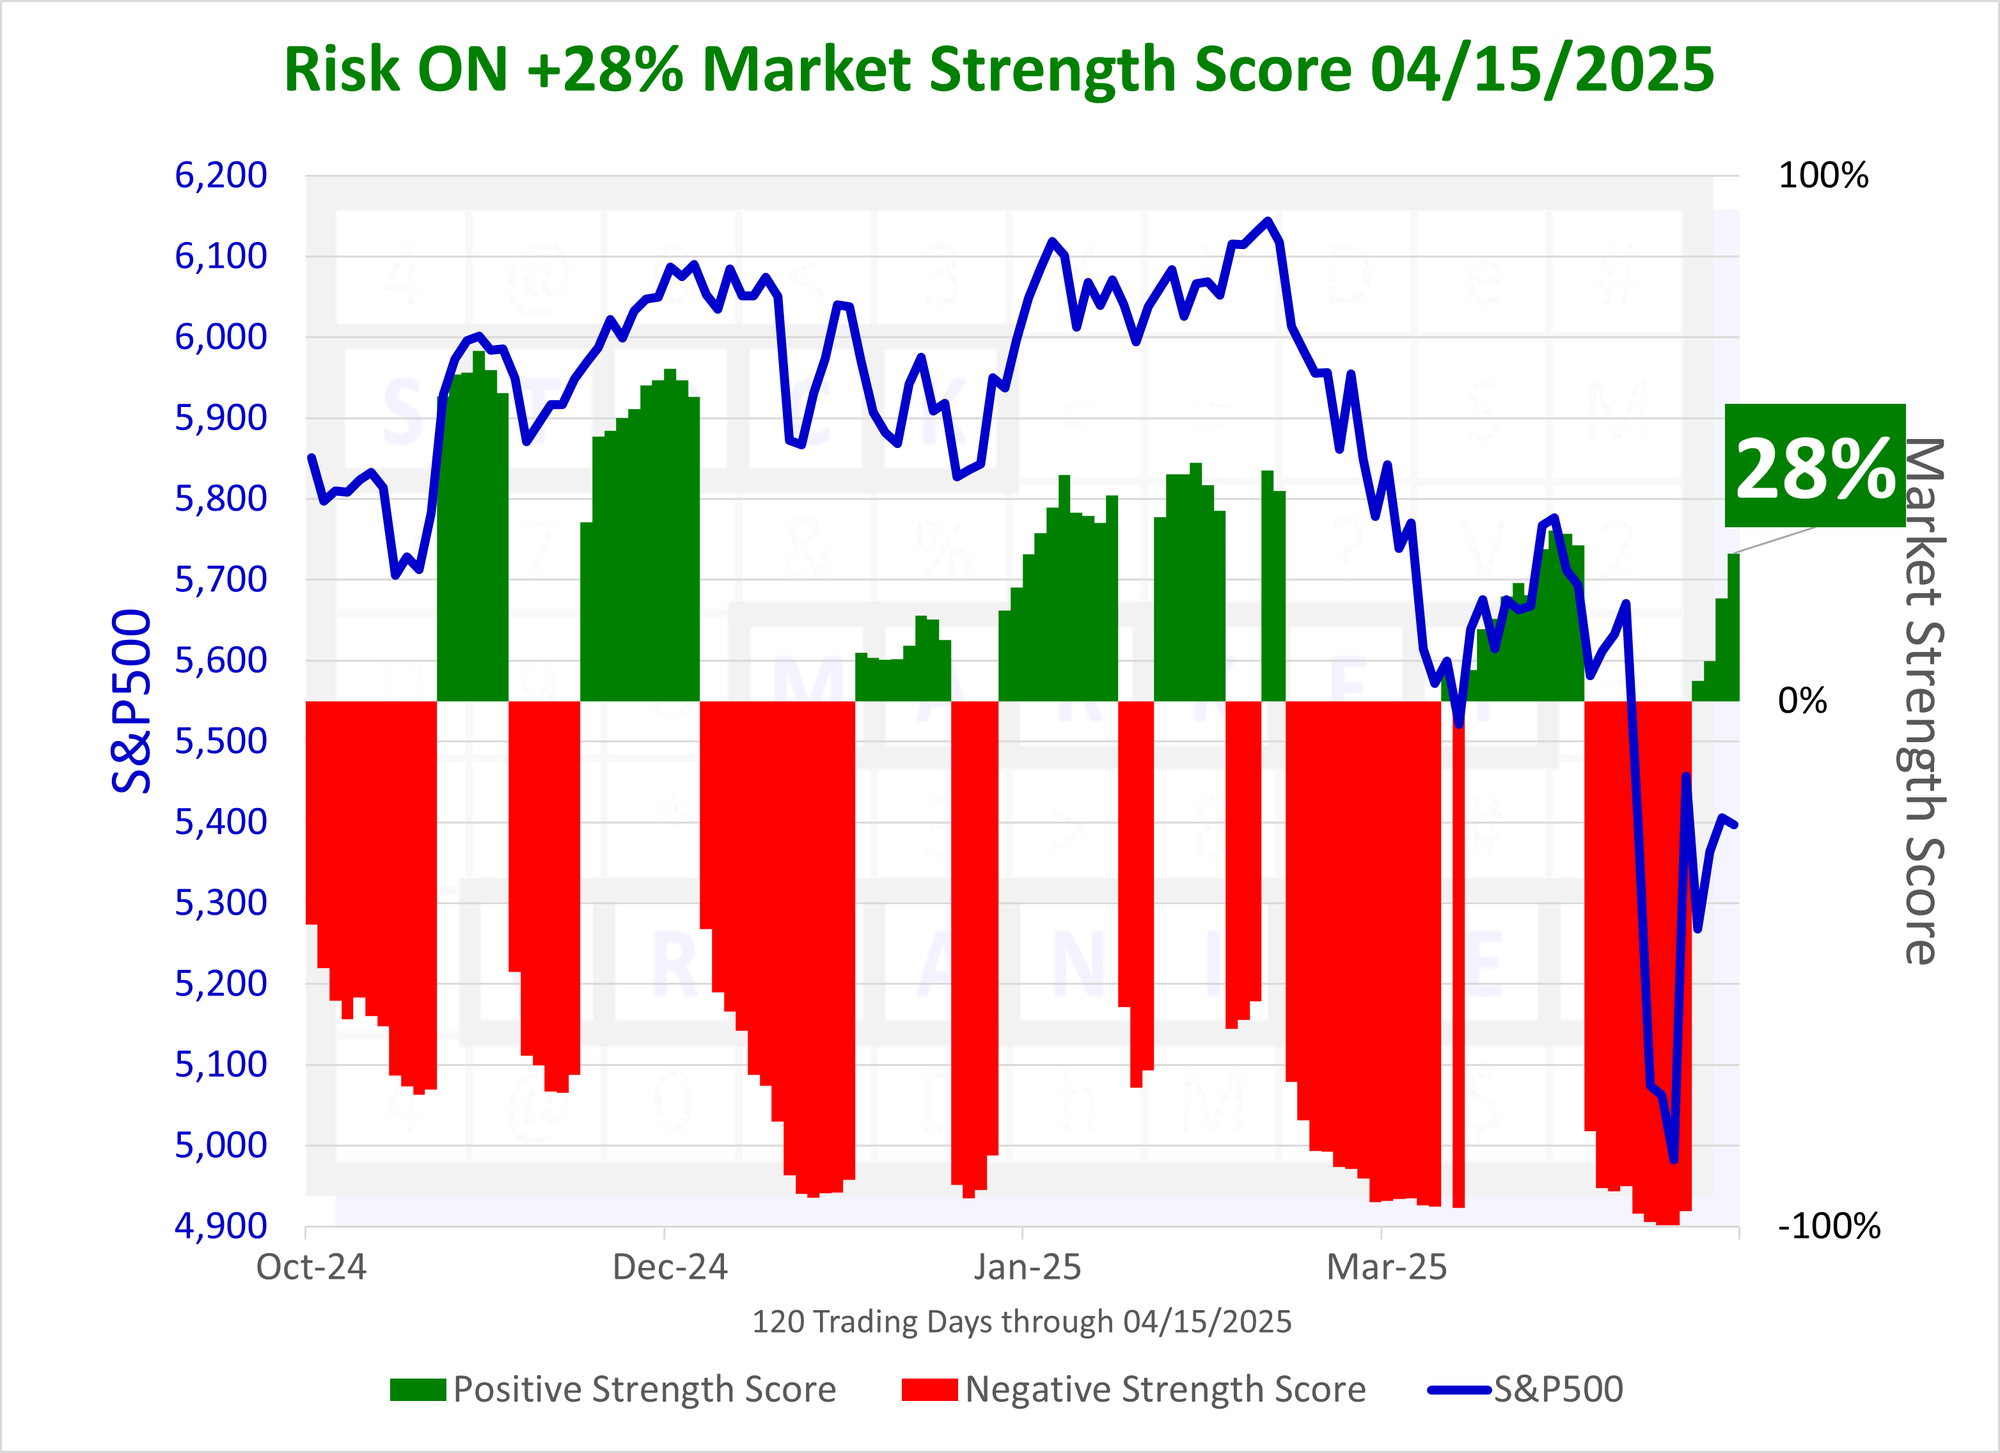
Here is the corresponding Market Strength Score:
Why do you care?
This dynamic market analysis provides a continuously updated, apples-to-apples comparison of the strengthening and weakening trends in the US market. By tracking the 500 large-cap stocks across 11 key sectors (via SPDR ETFs), this analysis offers valuable insights for investors seeking to harness momentum in their portfolios.
Each week, the analysis clearly identifies which sectors and stocks have gained, remained flat, or lost ground. With this data, investors can objectively assess sector and stock strength, refining their timing and positioning for new investments. Ultimately, this approach aims to enhance long-term portfolio performance by leveraging momentum – a proven market factor – to inform data-driven investment decisions.
Most Important Ranking: Strengthening Status
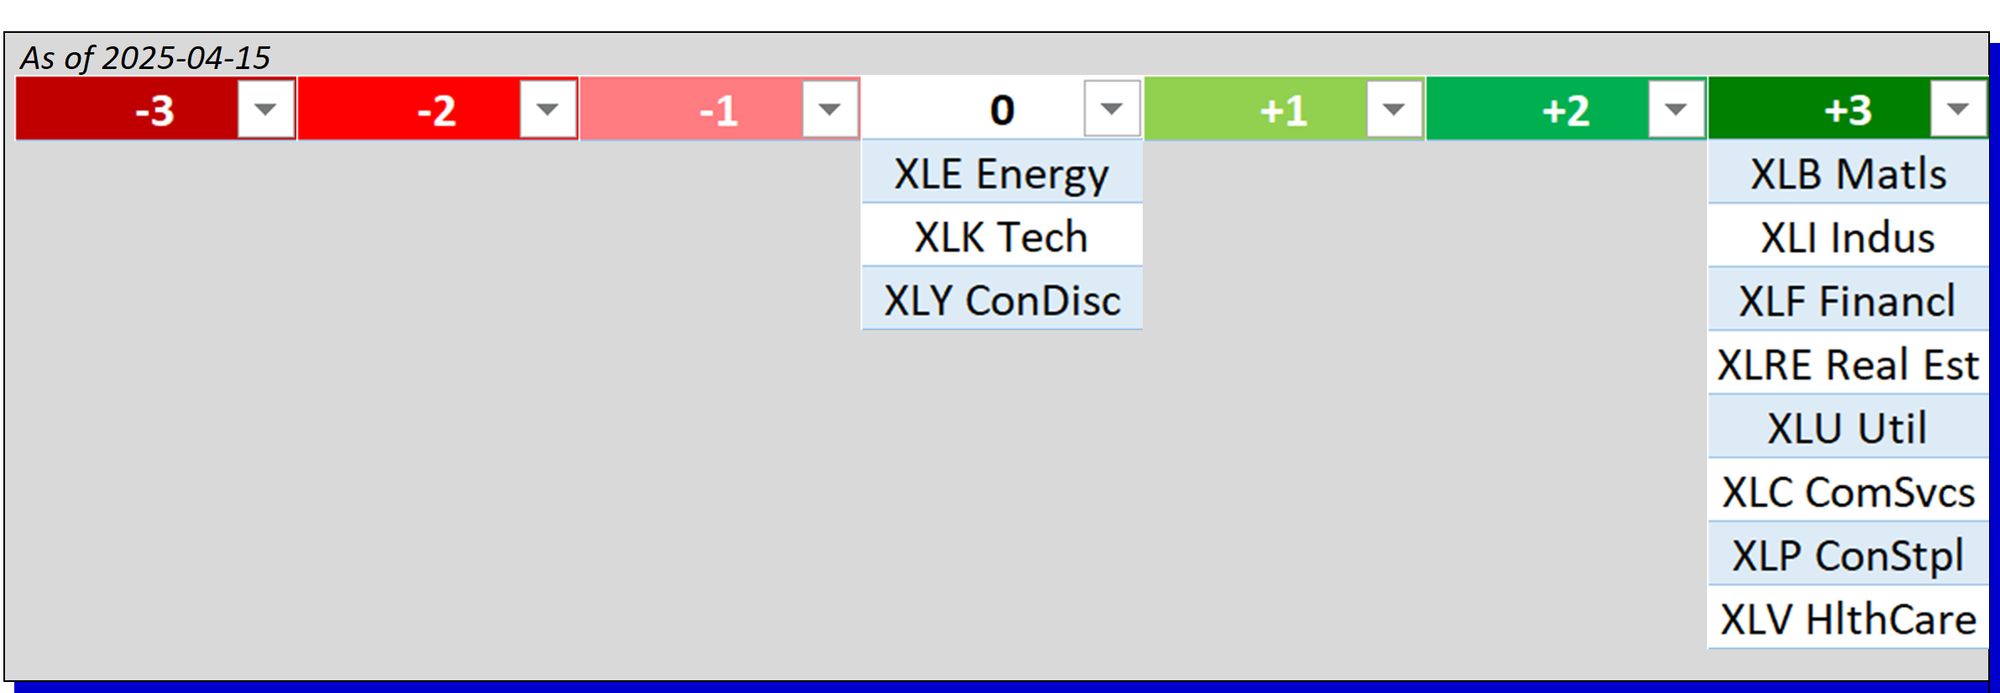
The following Strengthening Status spectrum graph shows the ETFs based on their current strengthening status, as compared to last week.
These are ordered based on important distinctions - did an ETF strengthen or weaken, enough (or not) to change rating, and where in the ratings scale (aka the spectrum of possibilities) does the ETF currently lie?
This graphic clearly provides this key information at a glance.


Comparison of this week vs. the past two weeks. The upper portions show strengthening from the top row down, while the lower portions show strengthening from right to left. These graphics are set up to clearly convey which ETFs/sectors strengthened or weakened, and from/to where this happened. Though it is impossible to determine how long these signals will last (what will be), the critical point is that these are the objective strength levels of these ETFs right now (what is).
Bottom Line Translation
Each ETF/Sector is given a Bottom Line rating below on a scale of -3 (Worst) to +3 (Best) based on A) the ending strength rating of each ETF and B) the strengthening/weakening action of the ETFs during the week, with the five possibilities being 1) strengthened enough to increase rating, 2) strengthened but not enough to increase rating, 3) unchanged, 4) weakened but not enough to decrease rating, and 5) weakened enough to decrease rating.
II. Weekly Returns
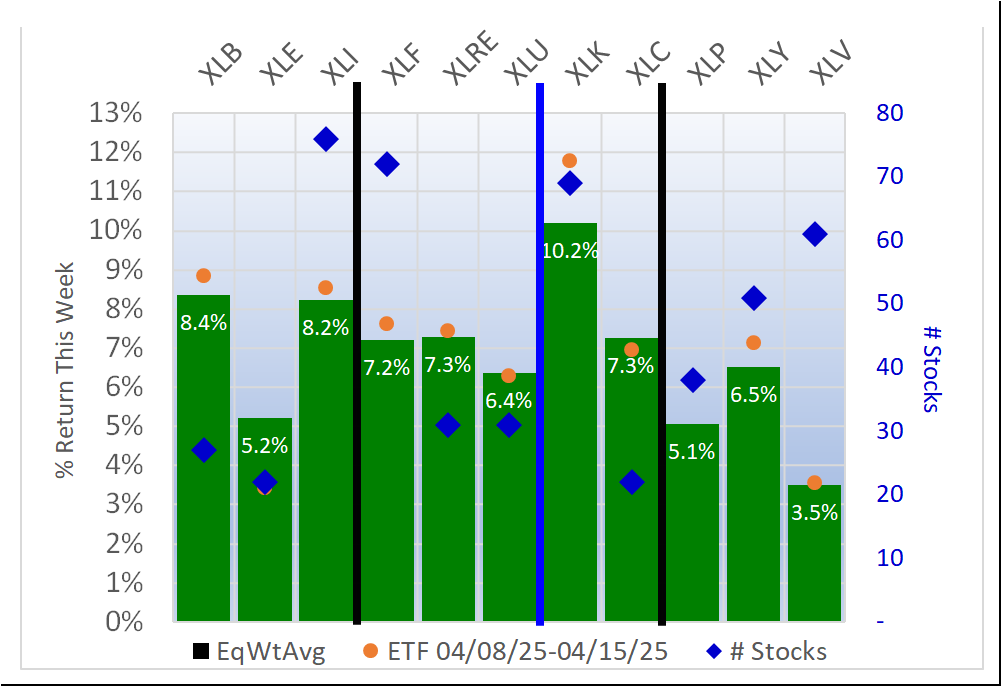
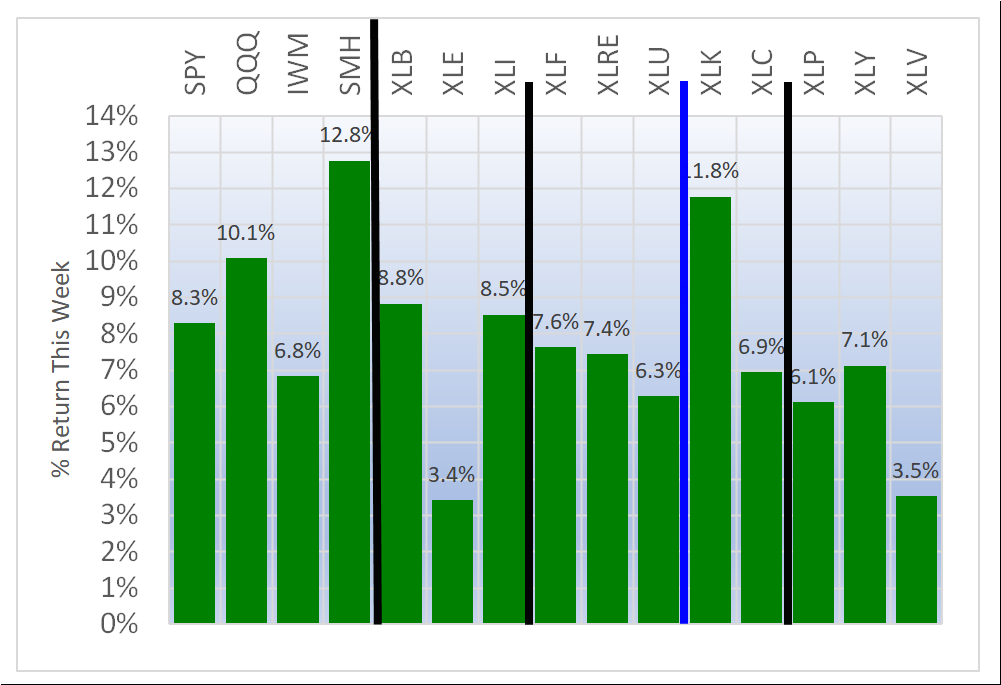
Average Returns
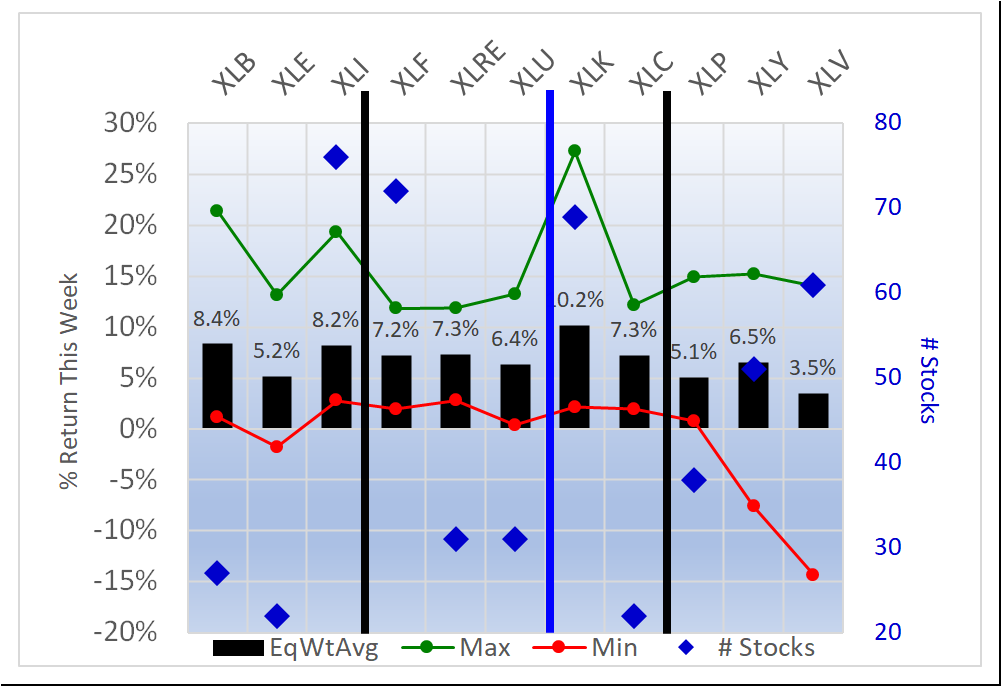
The average returns for the underlying stocks in each ETF are shown below - note this is NOT the return for the ETF for this week, which is shown below in Section IV. Today's Market Context.
The best and worst are highlighted below:
Best:
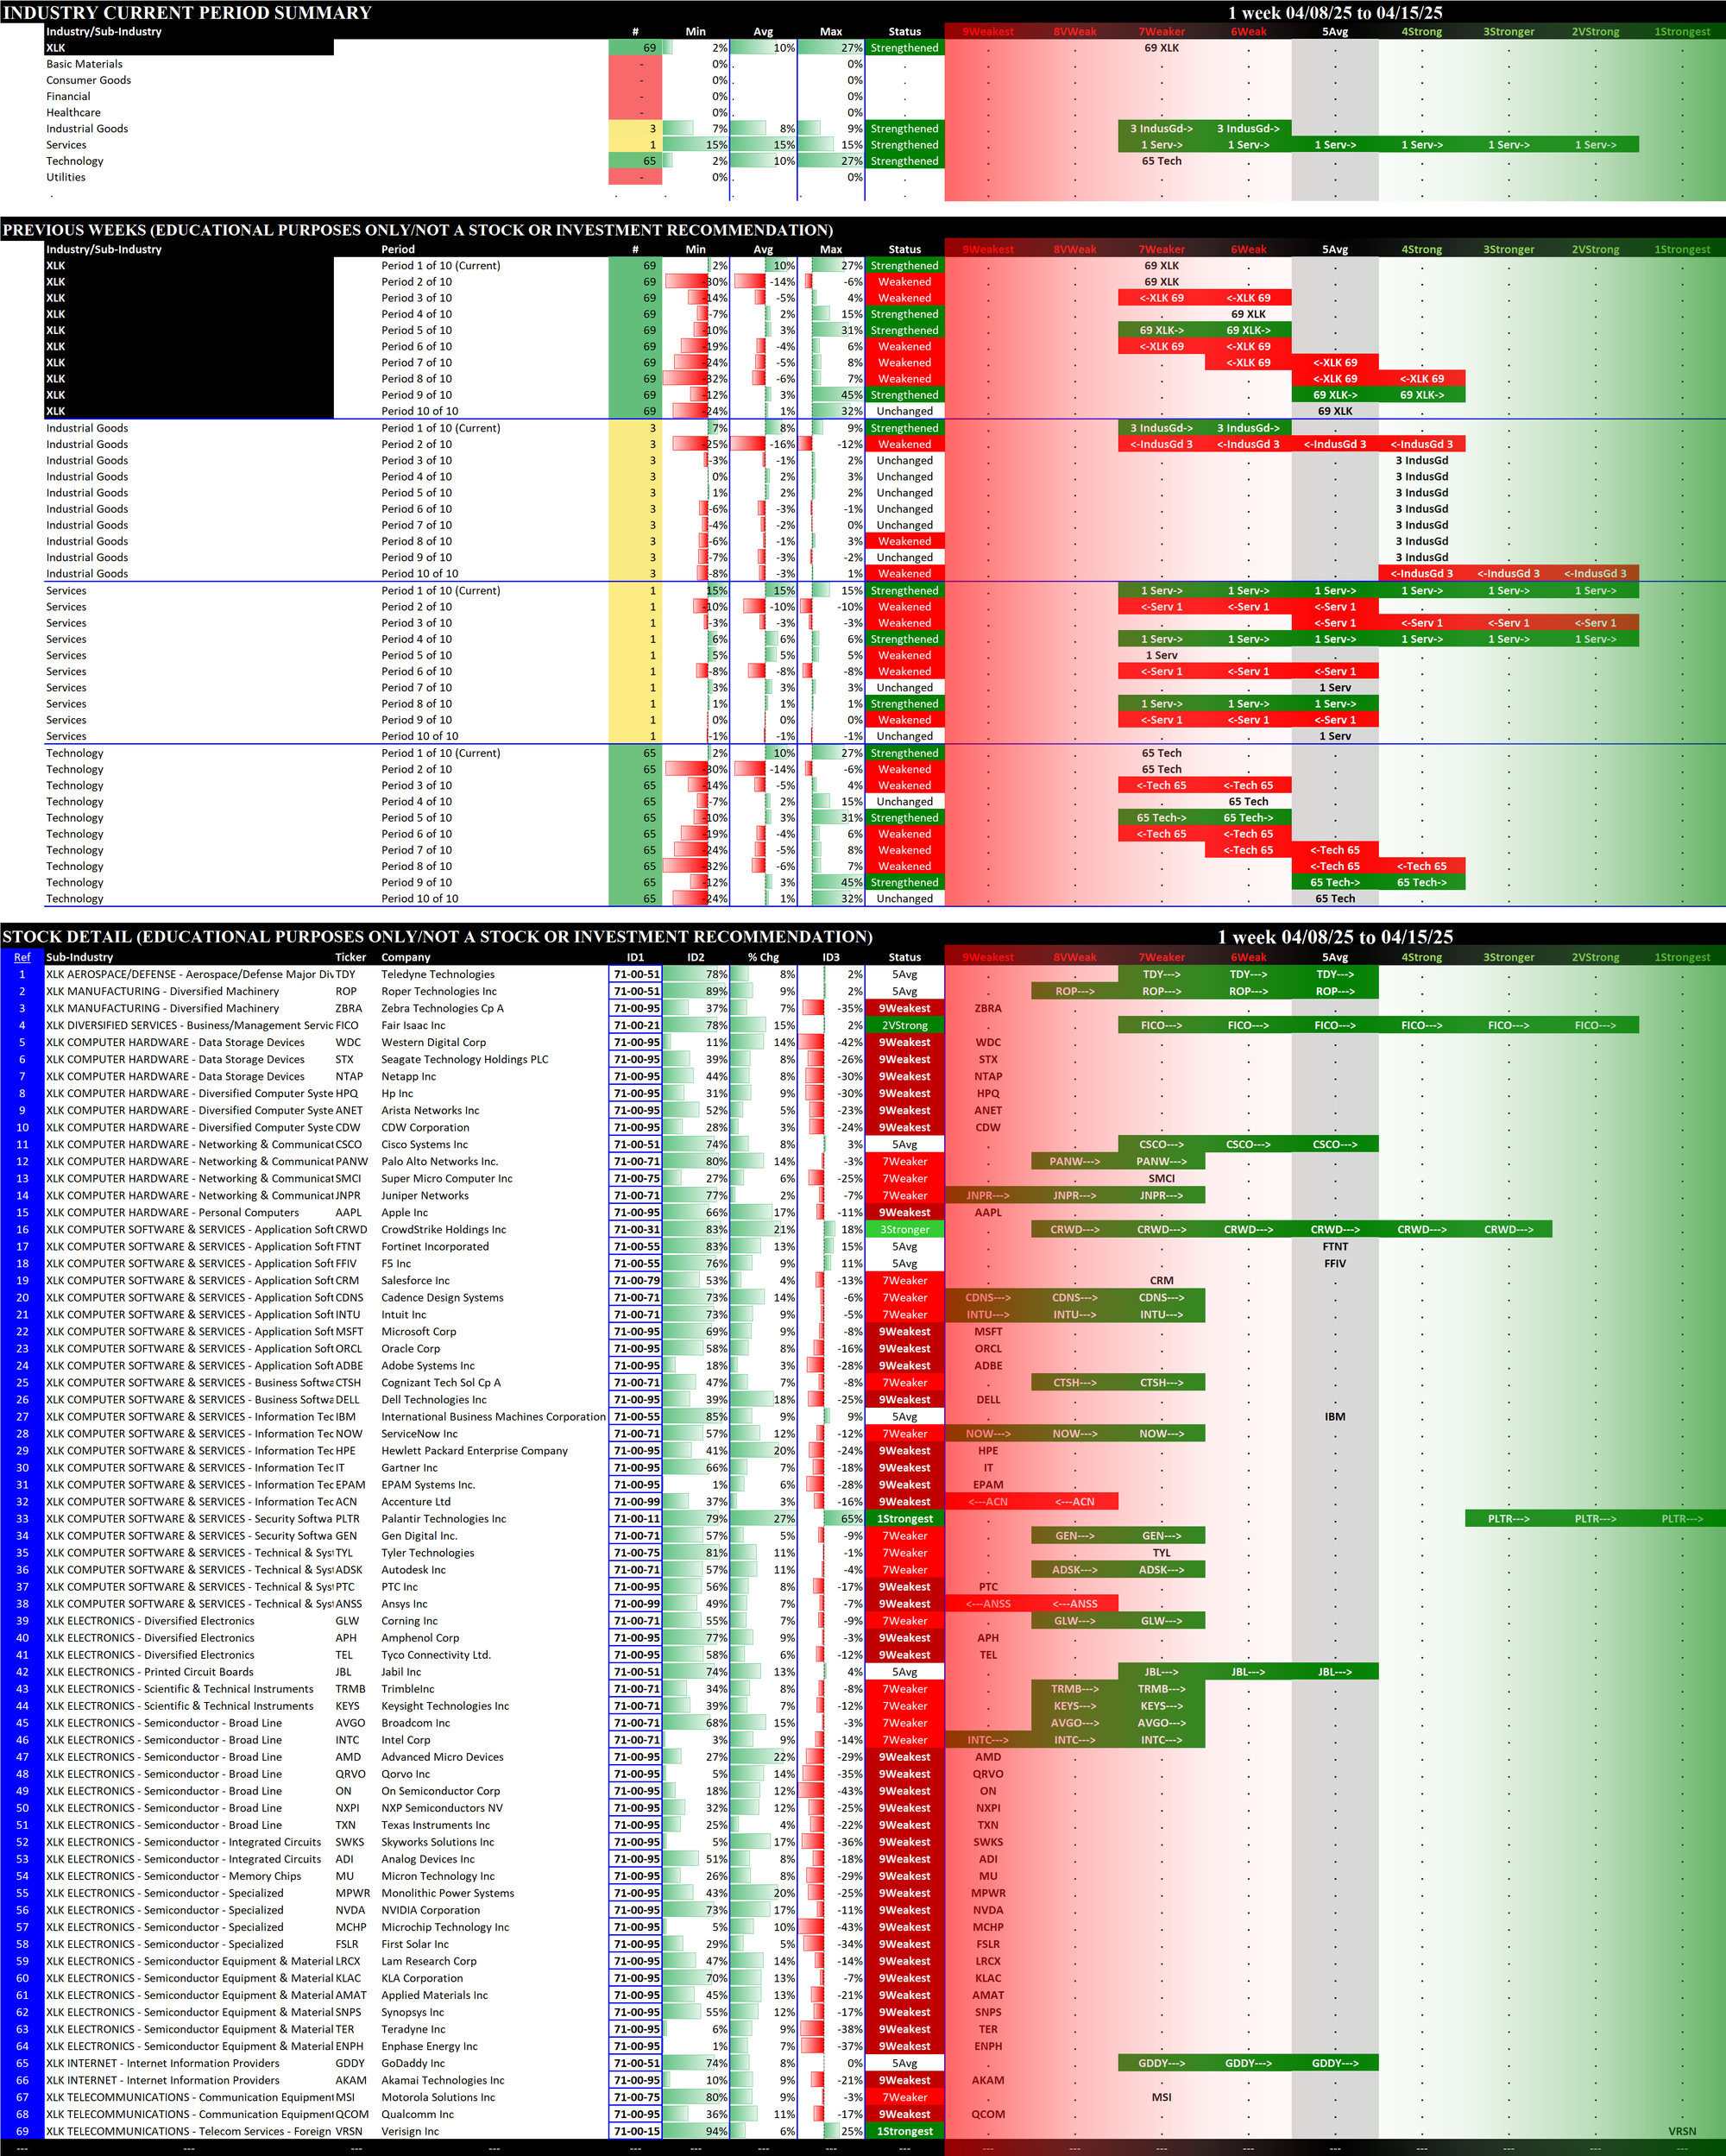
- XLK/Technology, 10.2% average for 69 stocks
- XLB/Materials, 8.4% average for 27 stocks
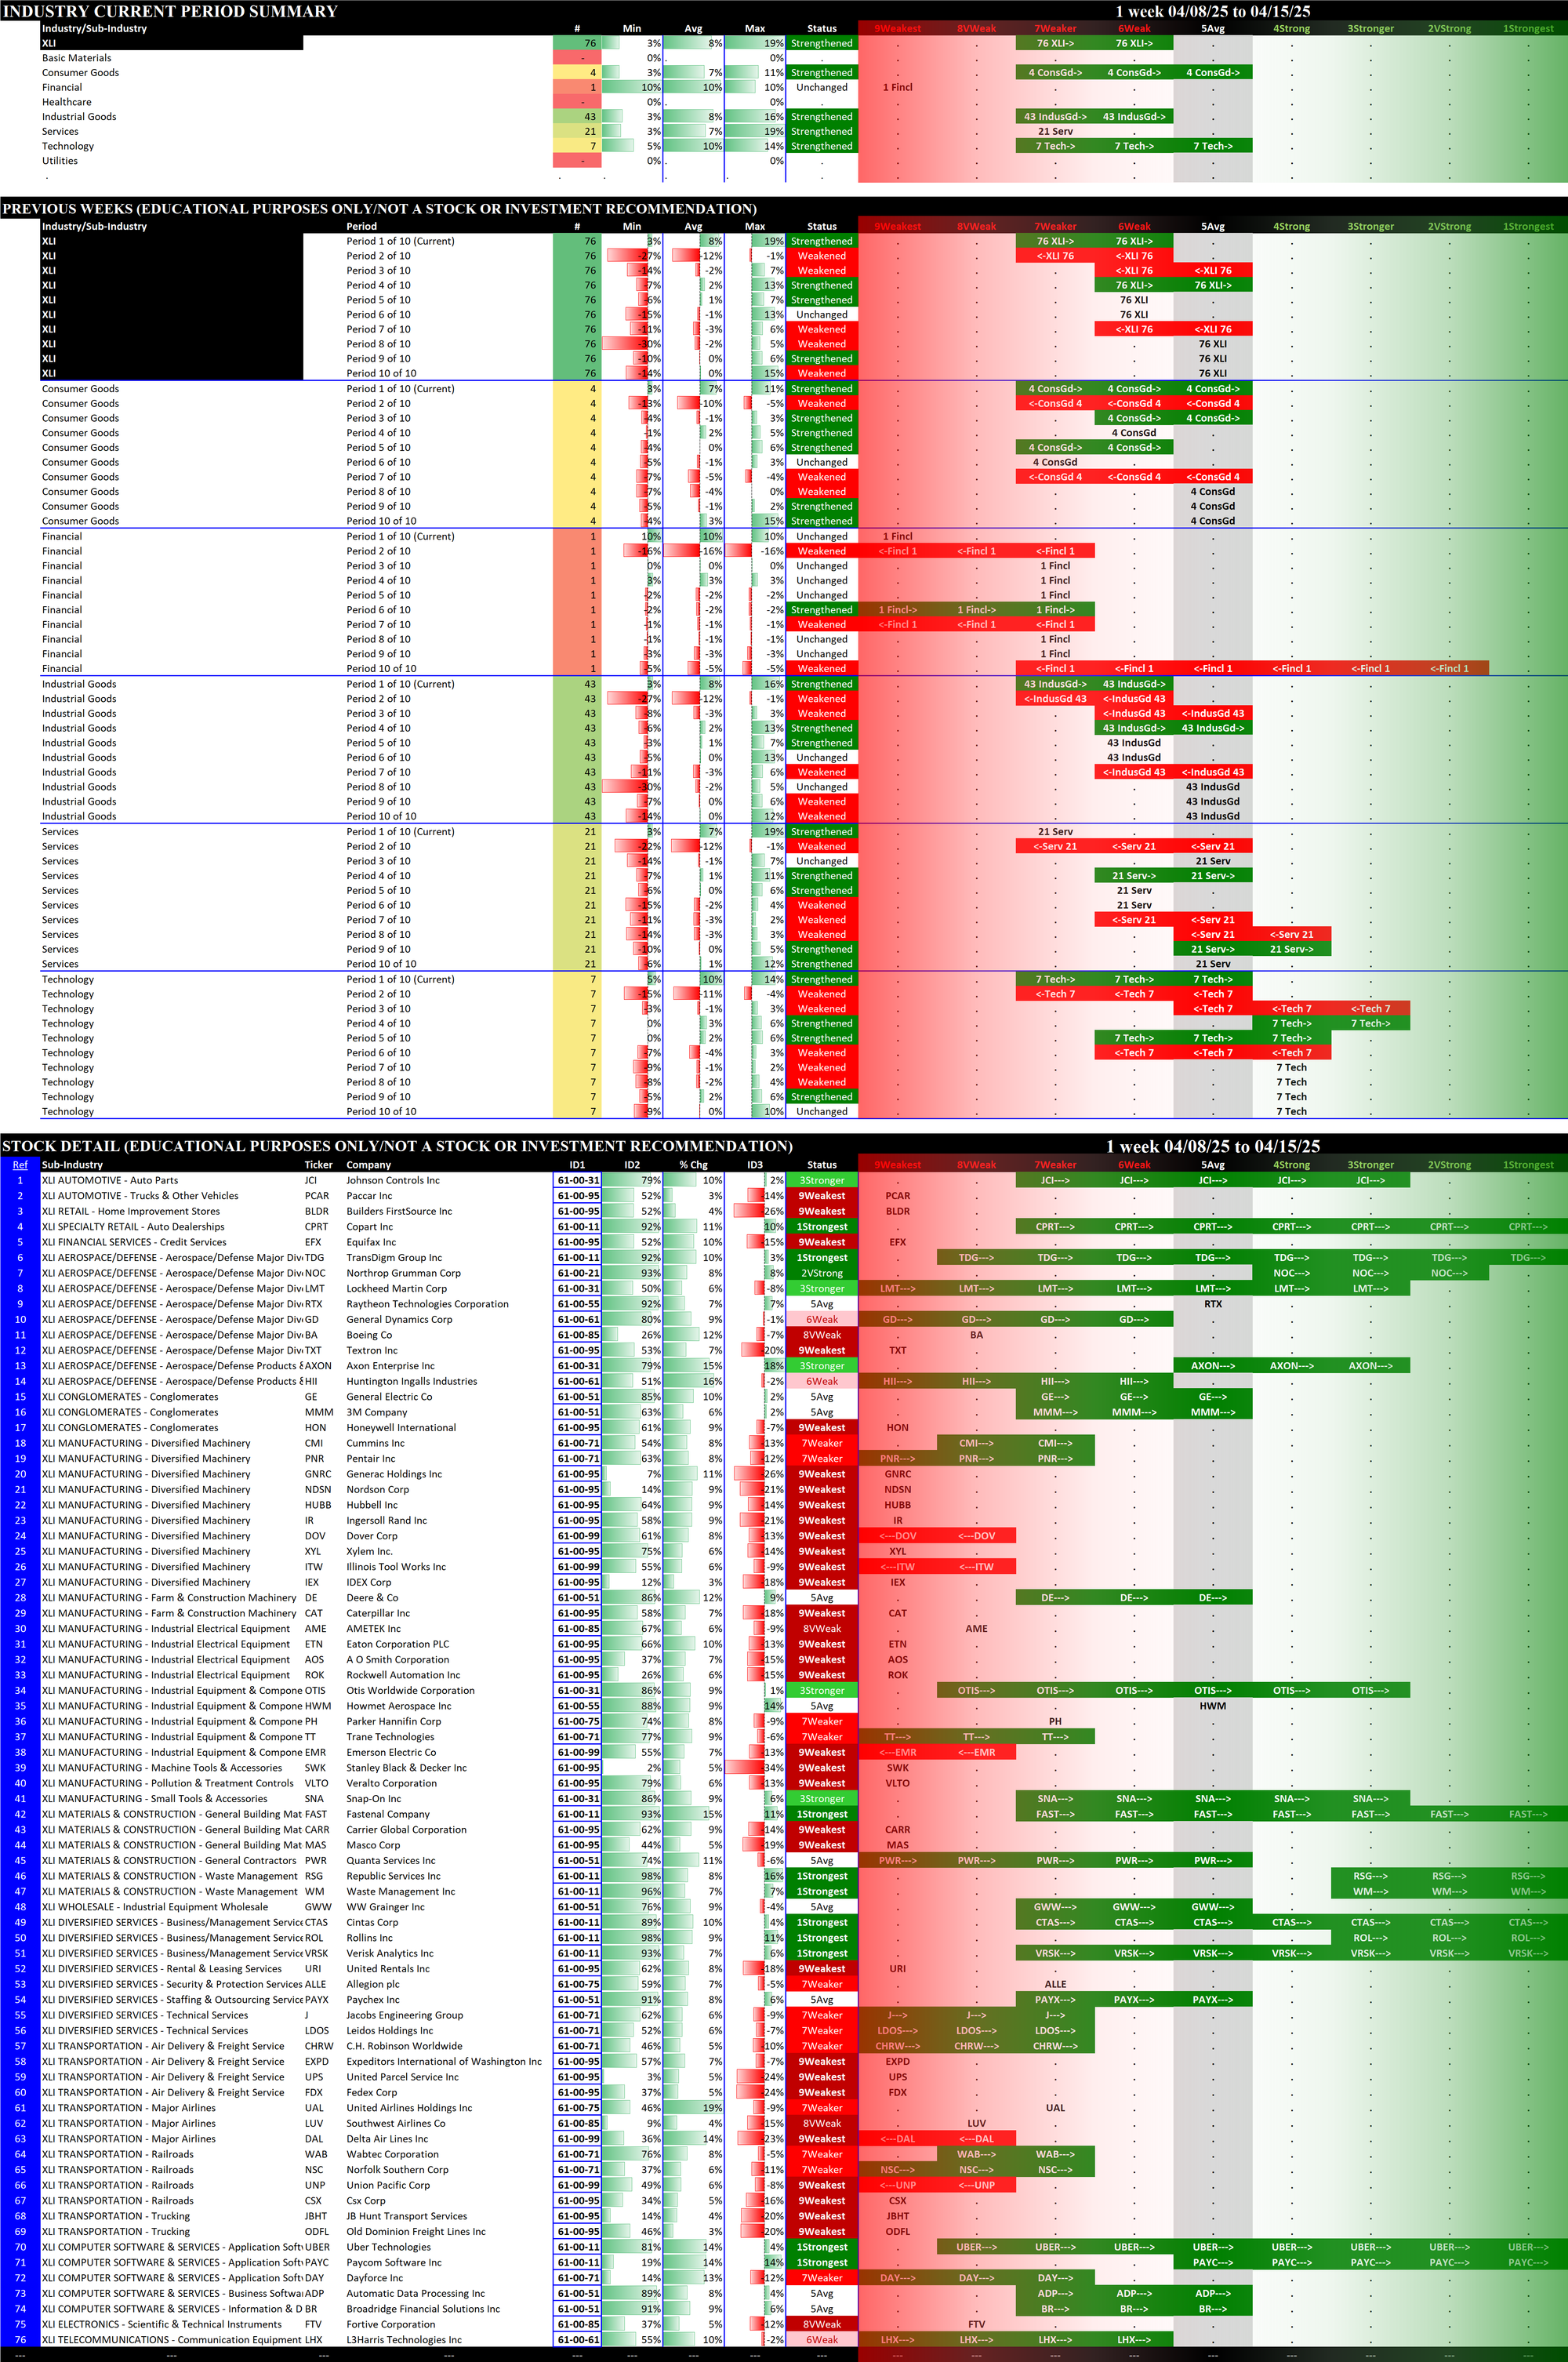
- XLI/Industrial, 8.2% average for 76 stocks
Worst:
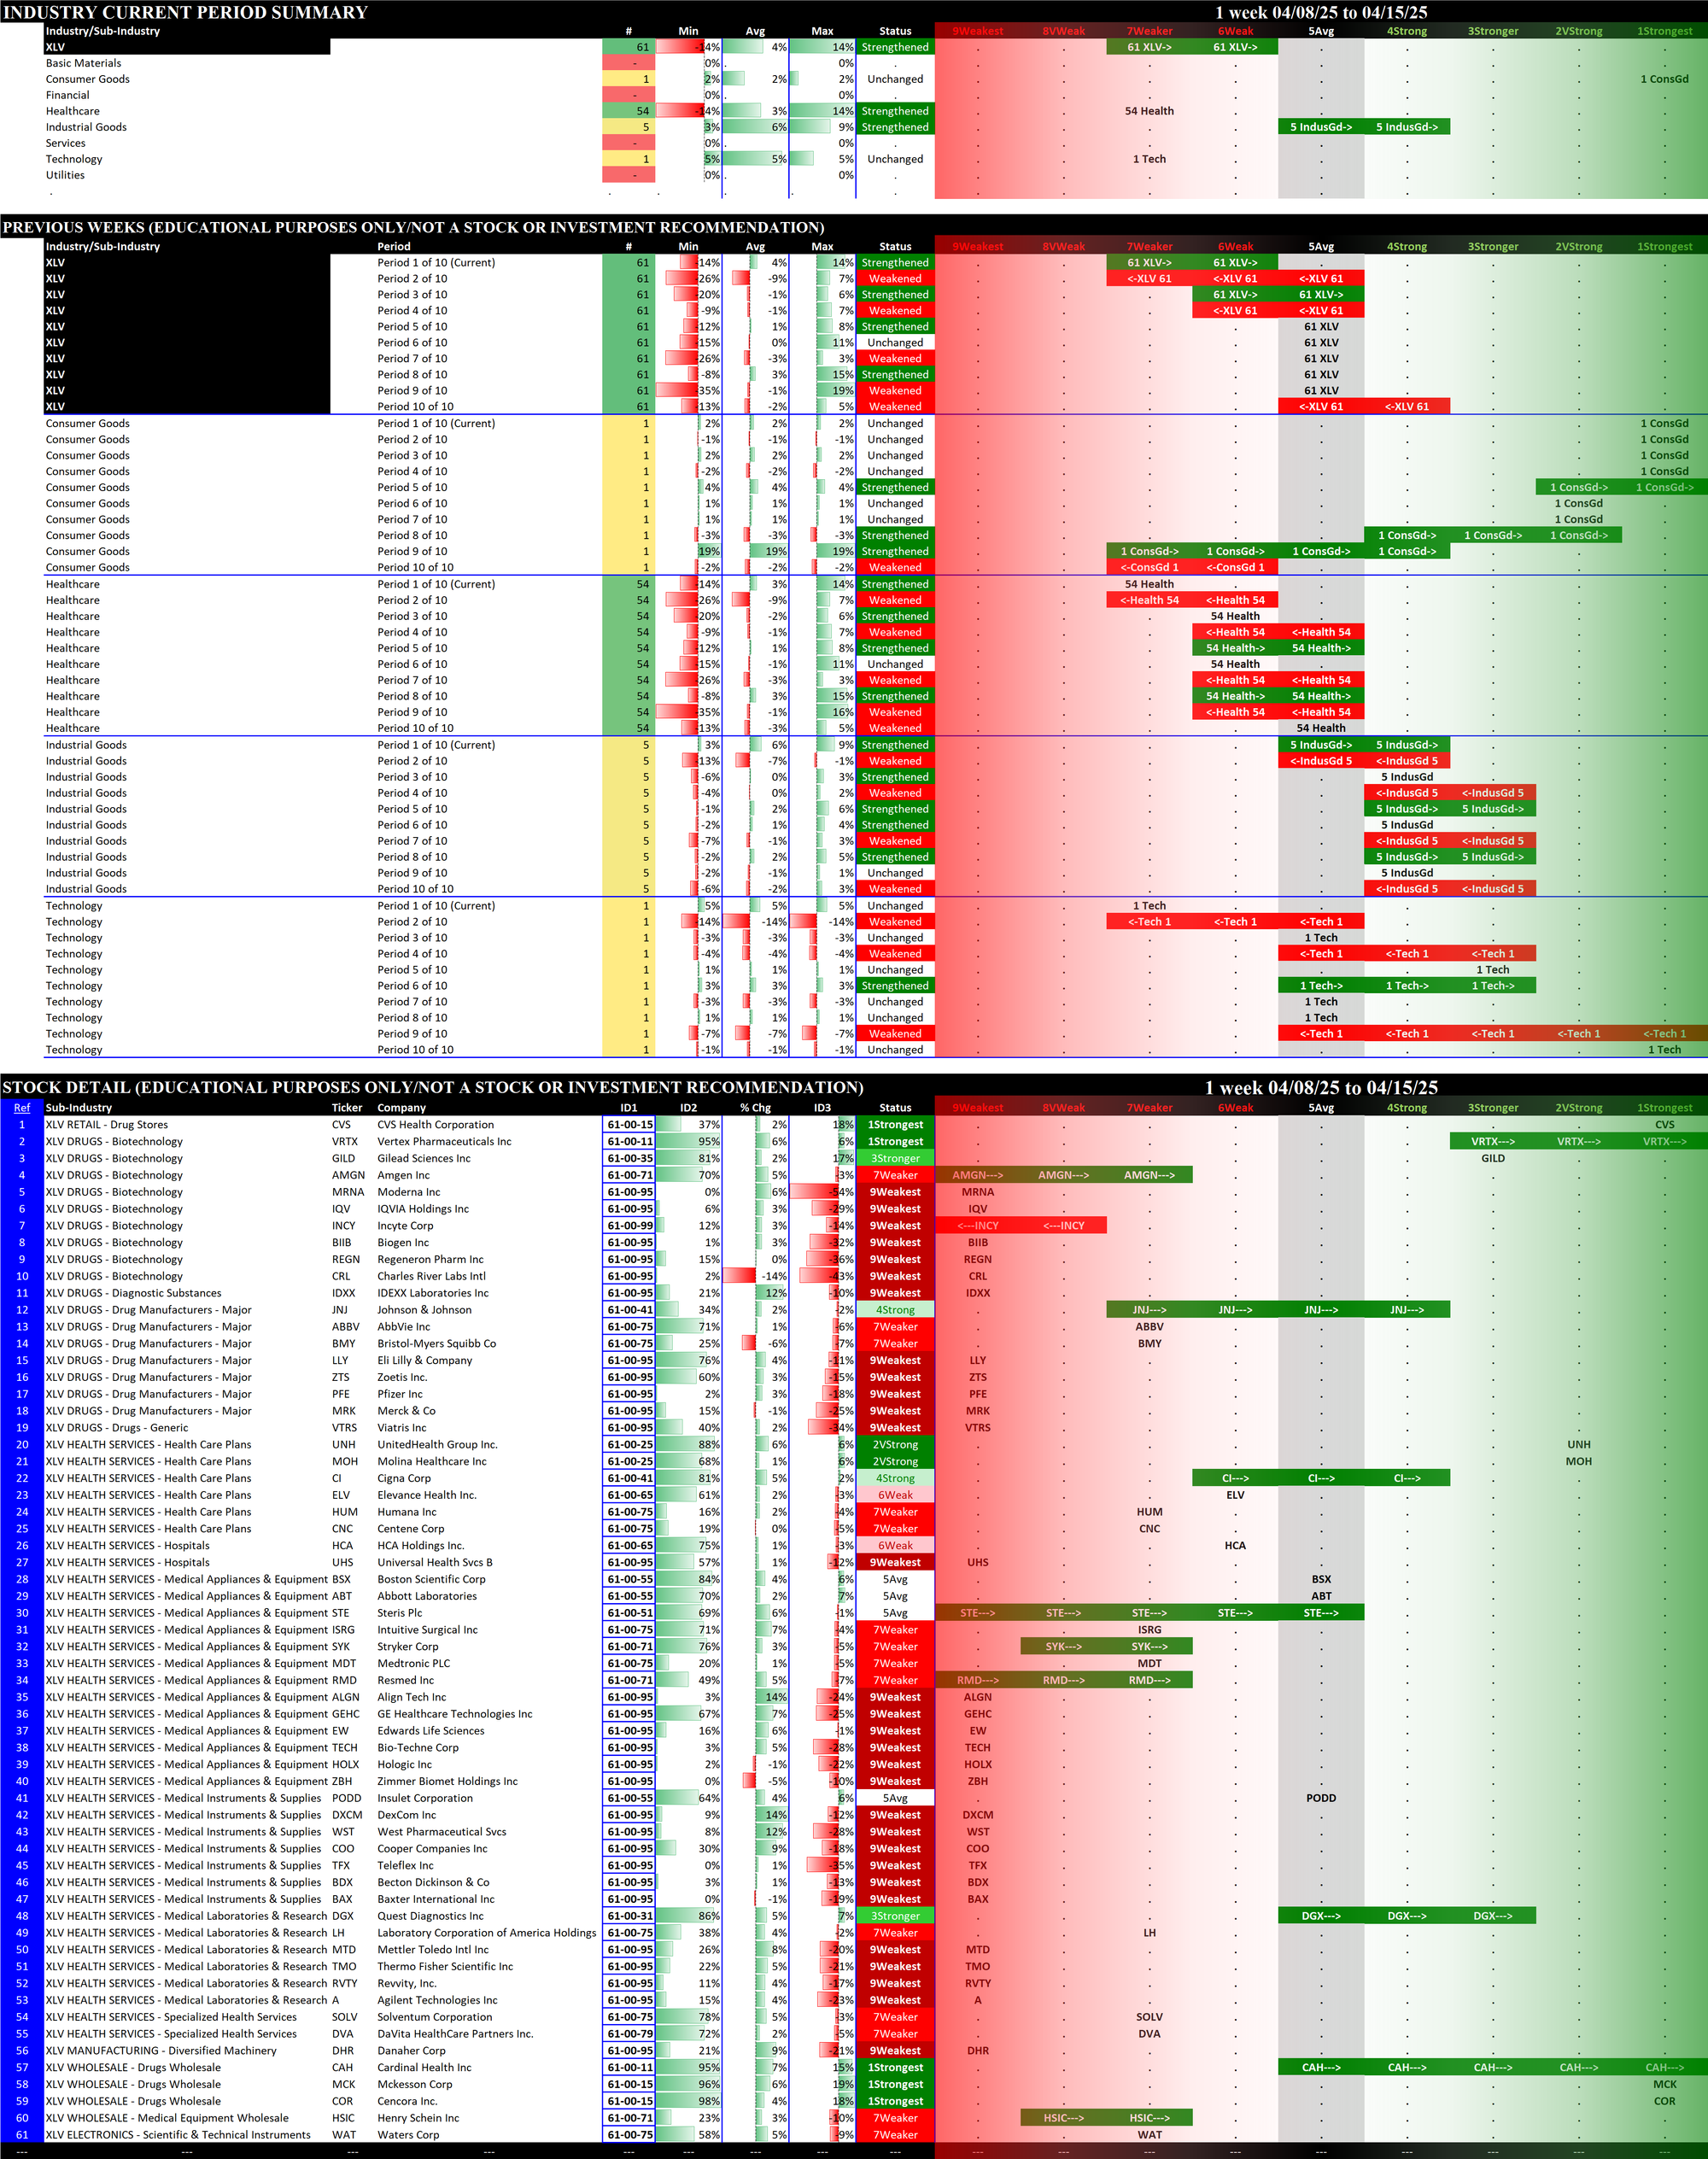
- XLV/Health Care, 3.5% average for 61 stocks
- XLP/Consumer Staples, 5.1% average for 38 stocks
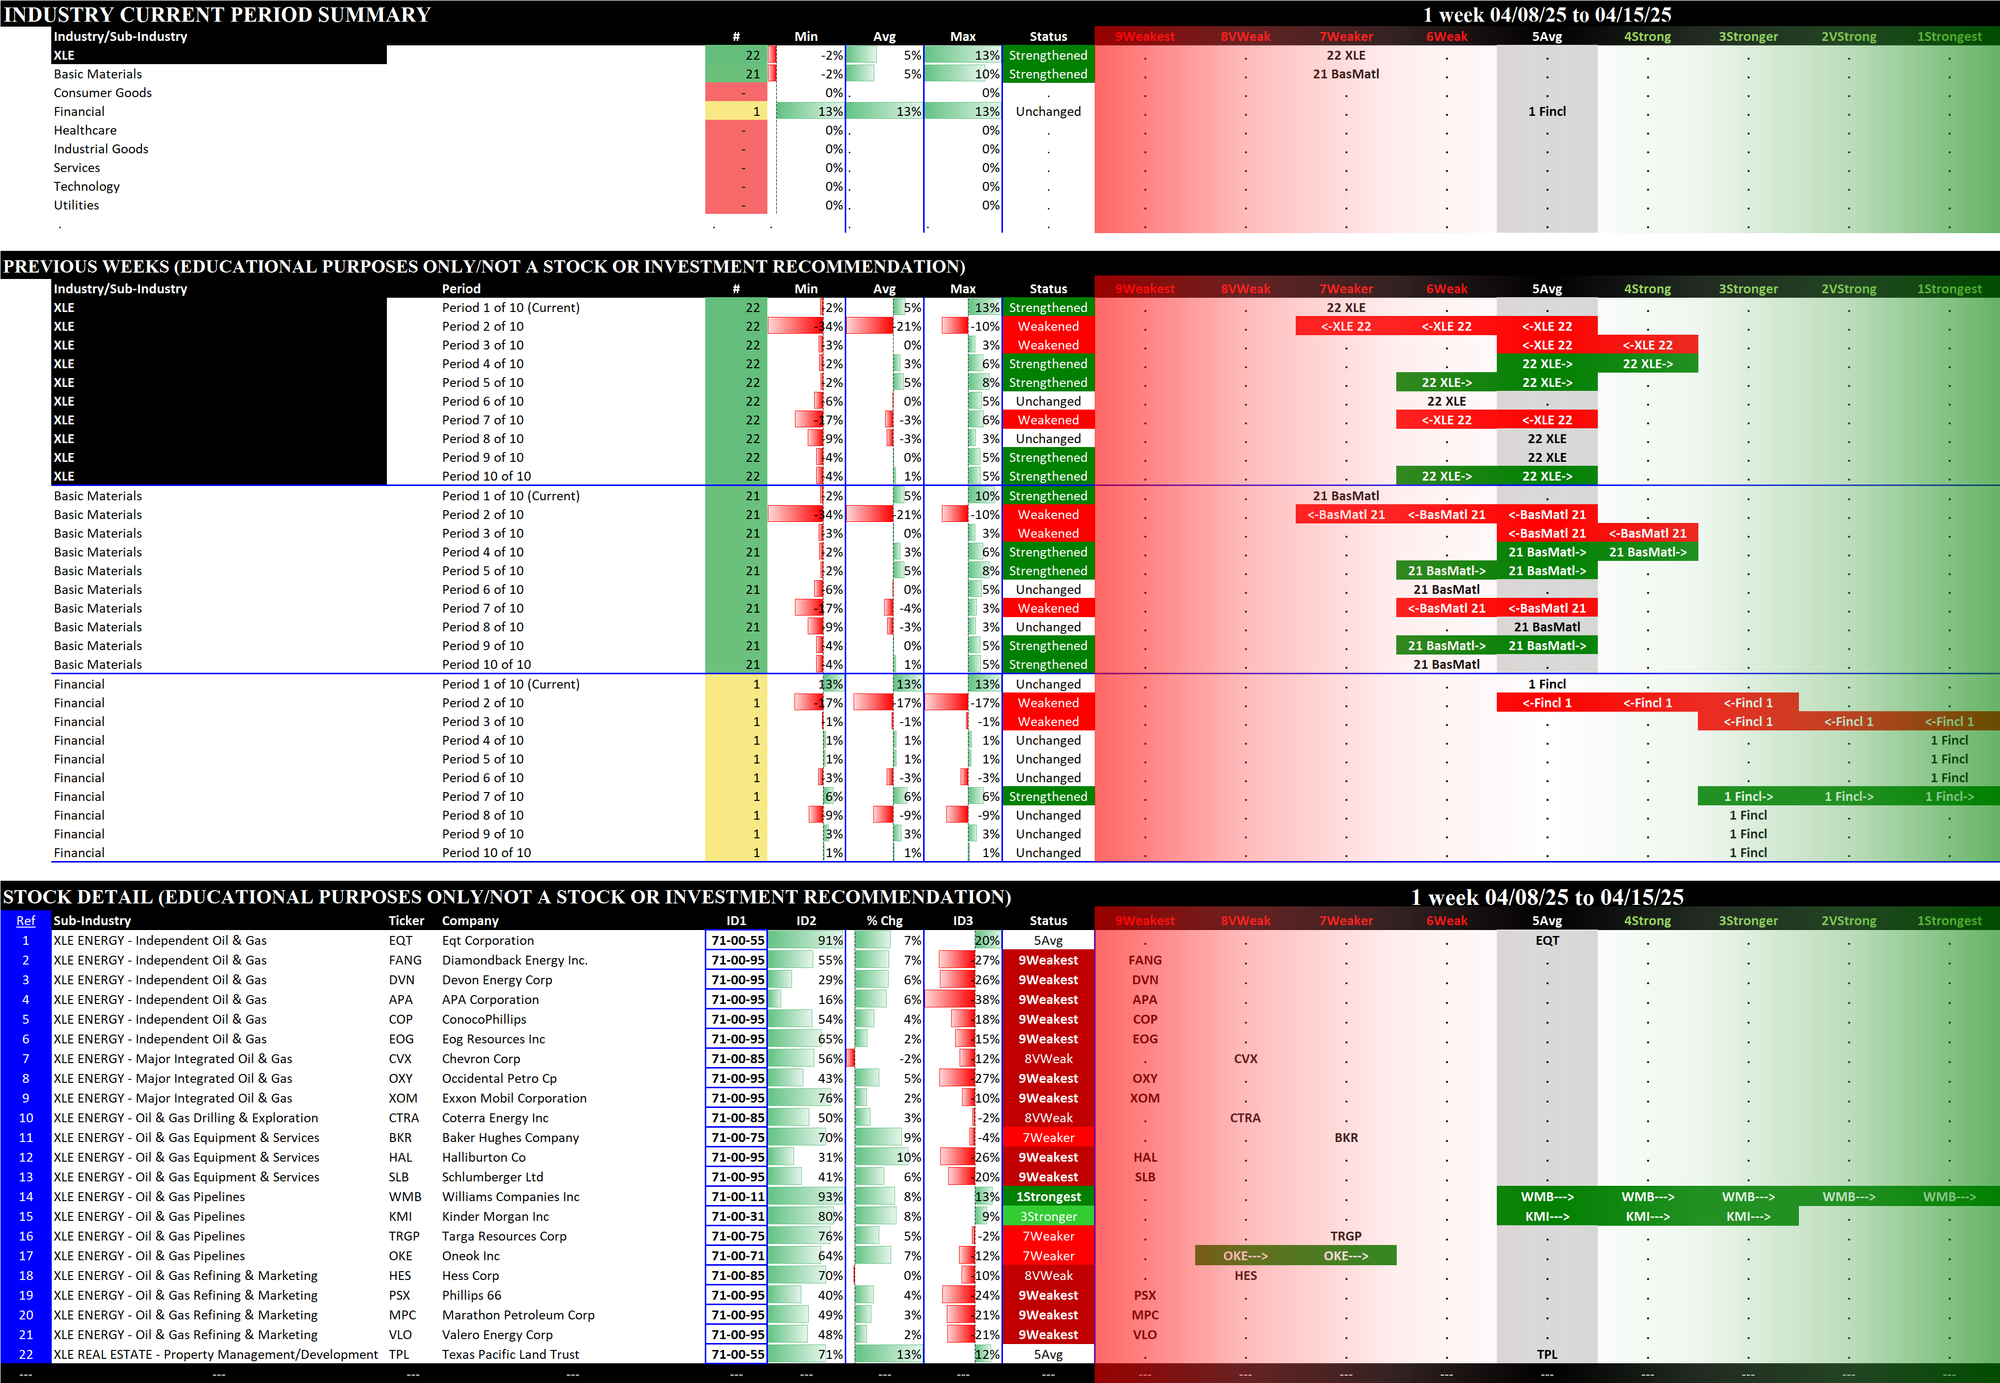
- XLE/Energy, 5.2% average for 22 stocks
High and Low Returns
The following graphic overlays the lowest and highest returns in each sector.
III. Spectrum Graph Analysis
This methodology uses spectrum graphs to obtain key insights unavailable elsewhere.
There are currently four types of spectrum graphs in this ETF analysis:
- By Strengthening - this is the most important graph, and it clearly shows in order the ETFs/sectors based on their strengthening/weakening performance during the week:
- Strengthened rating (rating change is most important signal)
- Strengthened but not enough to change rating
- Unchanged
- Weakened but not enough to change rating, and
- Weakened rating (rating change is most important signal). - By Type - logically groups the ETFs (for example, interest rate-sensitive, technology-related, consumer-related) for direct comparison with similar ETFs.
- By Strongest to Weakest
- Alphabetically
The remainder of this section uses types 2, 3, and 4 above to show current performance.
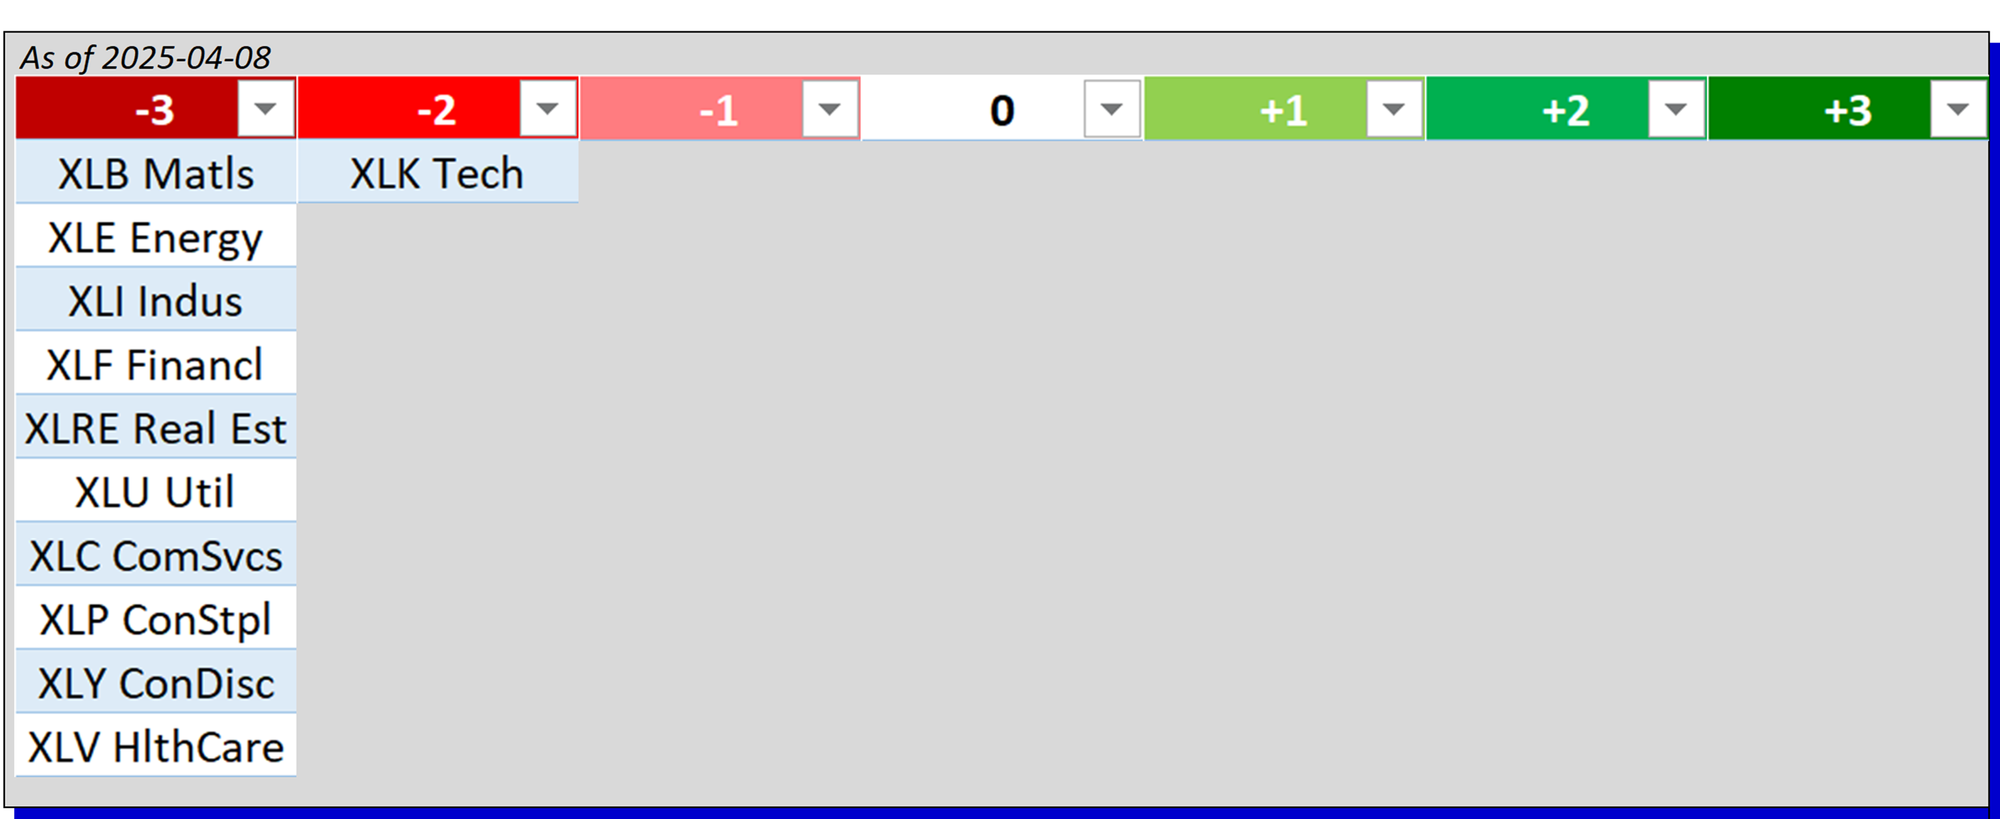
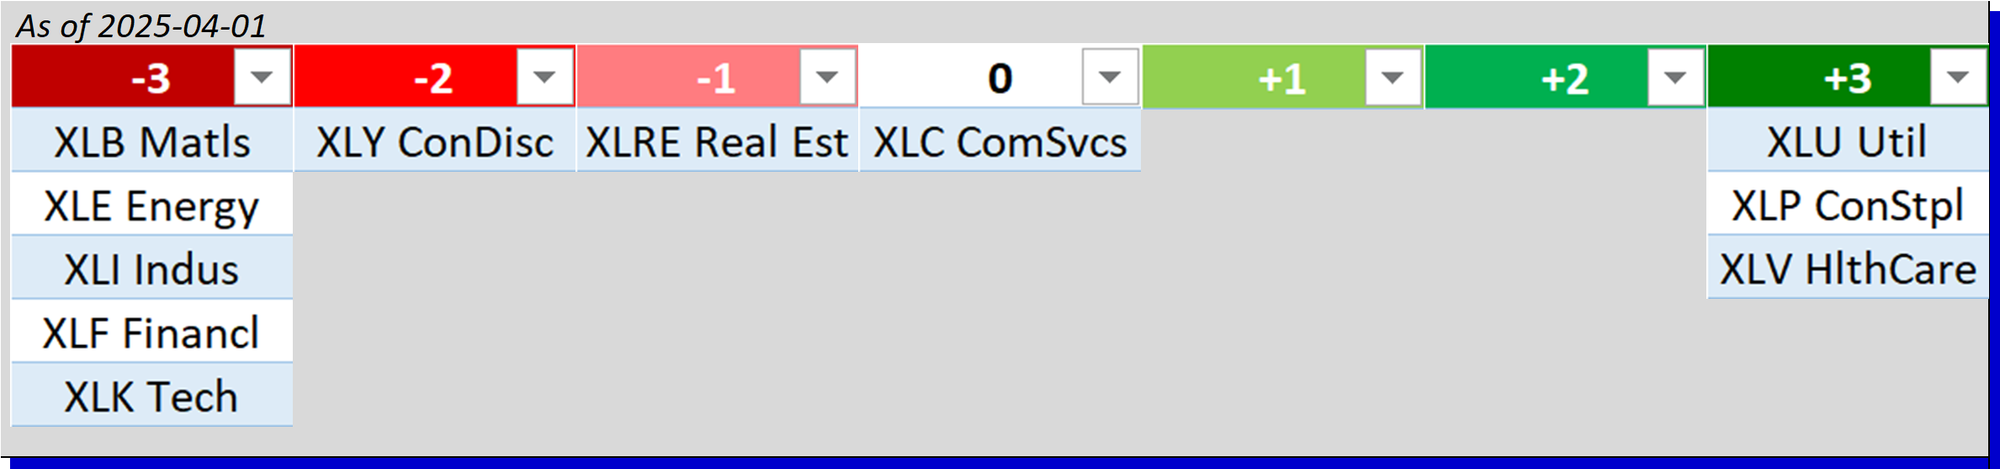
Context: Comparison to Recent Weeks
The following spectrum graphs by ETF Type show recent Tuesday week-to-week changes compared to the current week.
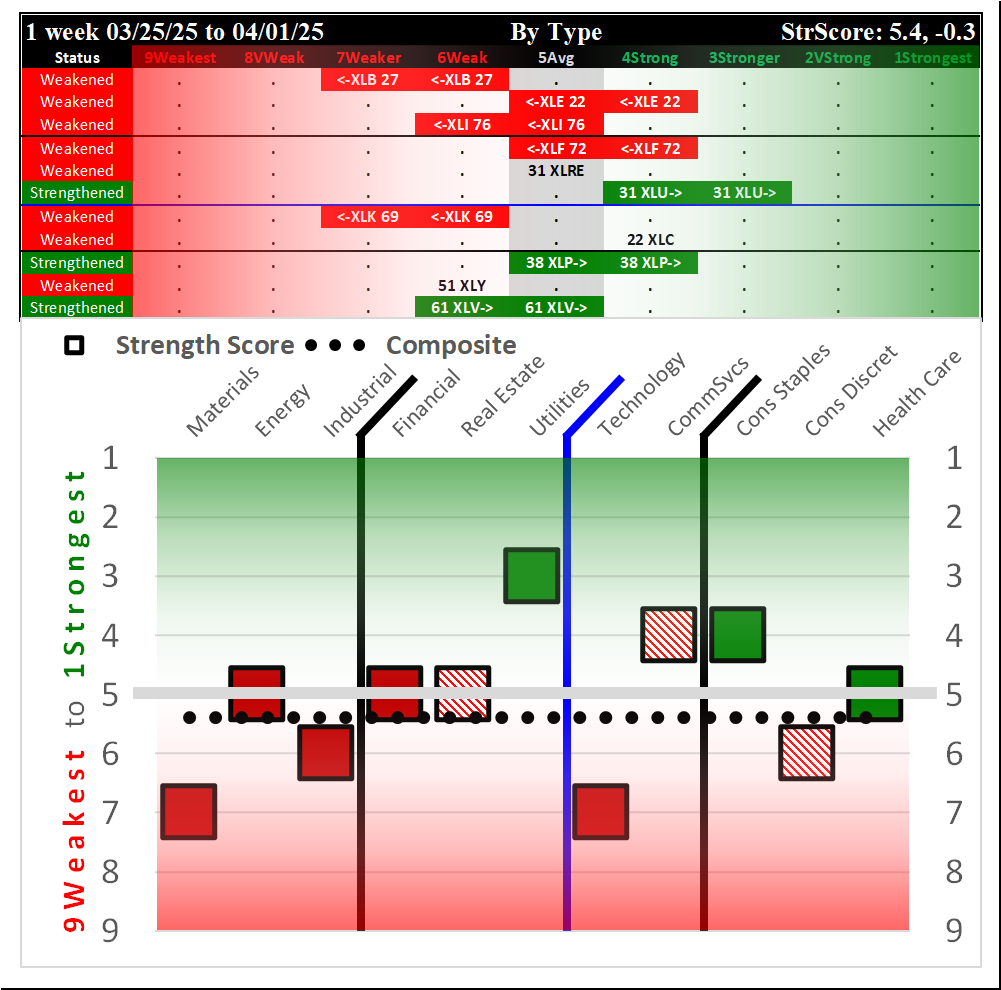
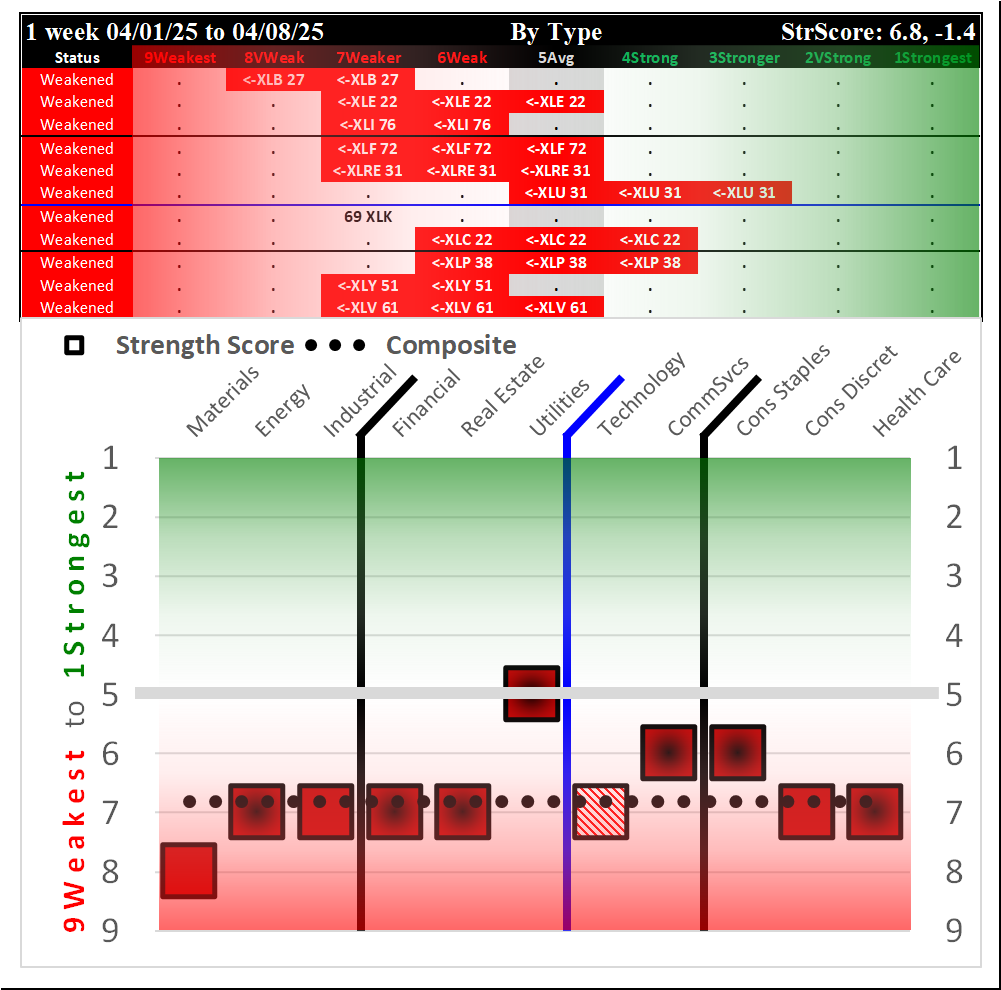
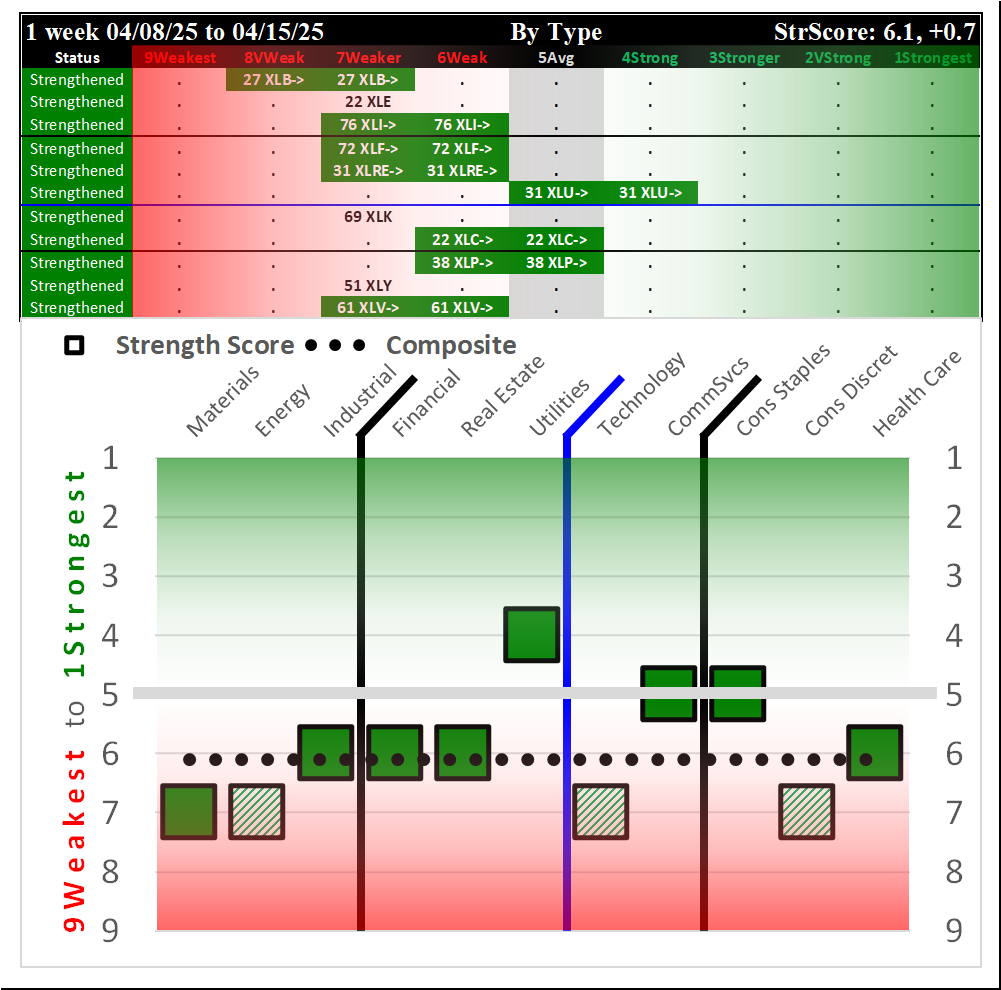
04/01/2025 = Weakened, 04/08/2025 = Weakened, 04/15/2025 = Strengthened.
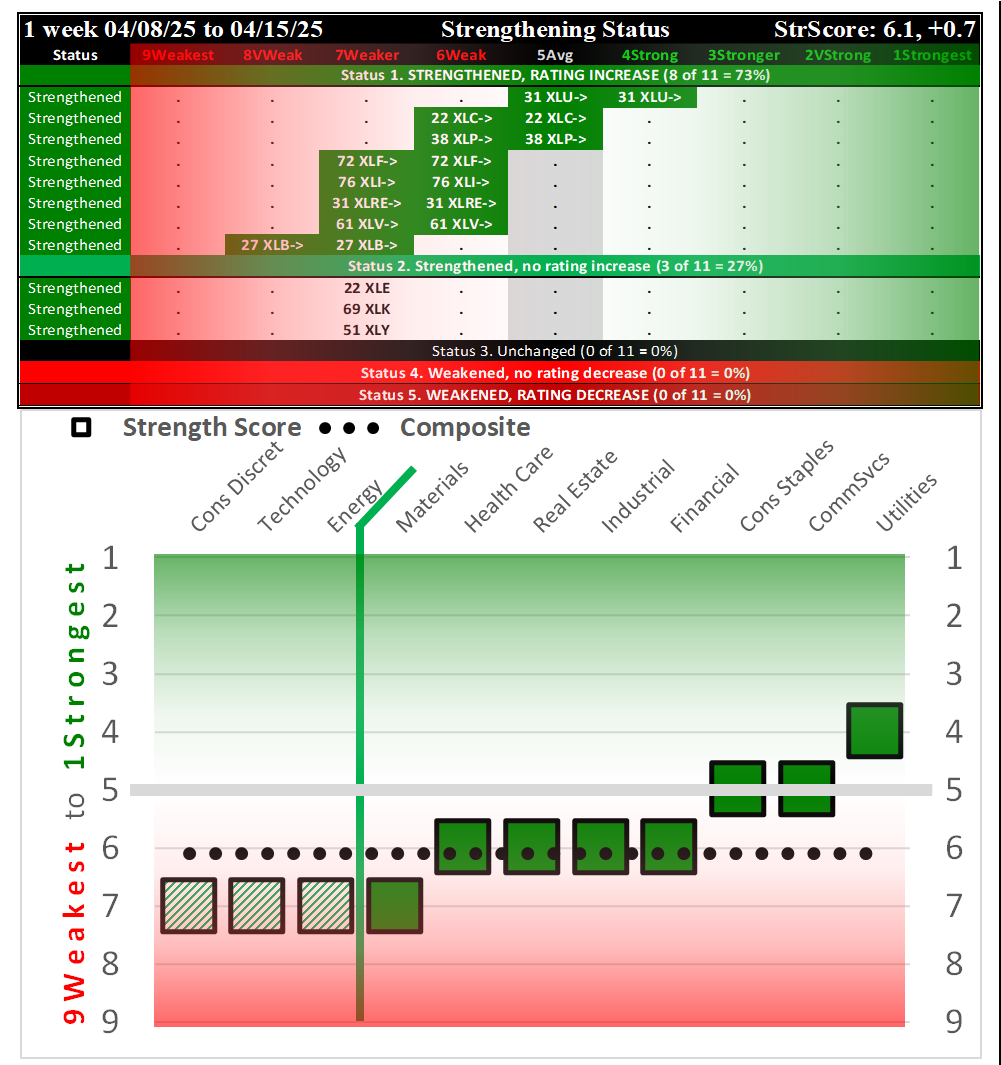
Current Status: 6.1 Composite Score, Strengthened +0.7 this week
The following spectrum graph "Strongest to Weakest" shows the composition of the ETF ratings that comprise the current composite score, in order of Strength Rating. Below that is a "play" chart (somewhat like a football play diagram) which groups the sectors on a graphic for easy review of what sectors are at what strength ratings and what was their path to arriving at these ratings. This is followed by an Alphabetical spectrum graph.
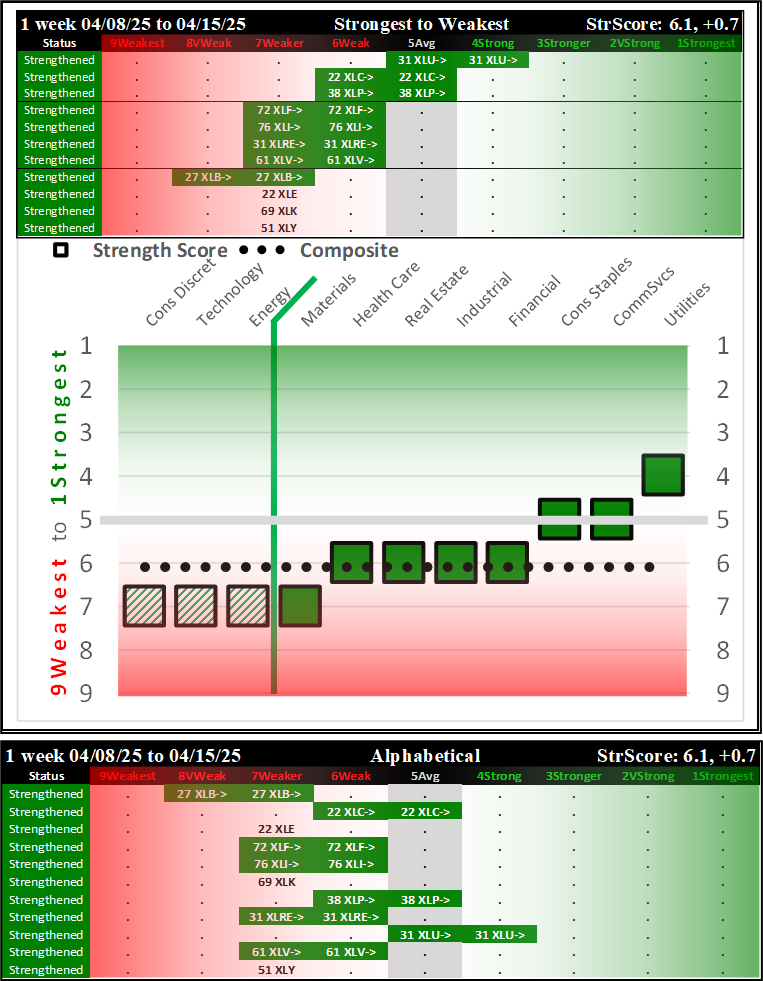
The ETFs are listed below based on their strength rating.
1Strongest
None
2VeryStrong
None
3Stronger
None
4Strong
- XLU/Utilities (STRENGTHENED RATING)
5Average
- XLC/Communication (STRENGTHENED RATING)
- XLP/Consumer Staples (STRENGTHENED RATING)
6Weak
- XLF/Financial (STRENGTHENED RATING)
- XLI/Industrial (STRENGTHENED RATING)
- XLRE/Real Estate (STRENGTHENED RATING)
- XLV/Health Care (STRENGTHENED RATING)
6.1 - Composite Score
7Weaker
- XLB/Materials (STRENGTHENED RATING)
- XLE/Energy (Strengthened)
- XLK/Technology (Strengthened)
- XLY/Consumer Discretionary (Strengthened)
8VeryWeak
None
9Weakest
None
IV. Today's Market Context
Indexes and ETFs Weekly Performance
Key Headlines
Marketwatch:
- United Airlines is sure it can thrive in ‘uncertain’ economy. Then why did it offer two outlooks?
- What the recent rise in ‘real’ Treasury bond yields signals amid tariff worries
- Albertsons warns of competition from larger retailers but downplays tariff impact
- Trump Seeks Ideas to Reduce Prescription Drug Costs
- Wall Street predicts a 10% stock rebound by the end of 2025. Why investors shouldn’t buy the hype just yet.
CNBC:
- Nvidia says it will record $5.5 billion charge tied to H20 processors exported to China
- Apple airlifted iPhones worth a record $2 billion from India in March as Trump tariffs loomed
- OpenAI considering its own social network to compete with Elon Musk’s X
- AOC fundraising soars as the New York rep and Bernie Sanders barnstorm U.S. against Trump
- How investors are positioning ahead of a big March retail sales report
Yahoo!:
- Exclusive: Bessent says 'we have a big toolkit' to handle bond volatility
- US tariffs may cost chip equipment makers more than $1 billion
- Goldman, Wells Fargo lead $17 billion bank borrowing spree
- Stock market today: Dow, S&P 500, Nasdaq drift lower as tariff chaos pauses for a day
- Choppy markets show investors gulping down developments on tariffs and the sluggish U.S. dollar
Key Current Readings
(Current - previous week - 2 weeks ago)
SP500: 5,396.63 - 4,982.77 - 5,633.07
Nasdaq: 16,823.17 - 15,267.91 - 17,449.89
Nasdaq 100: 18,830.23 - 17,090.4 - 19,436.42
Russell 2000: 1,882.92 - 1,760.71 - 2,012.24
10Y Treasury: 4.333% - 4.297% - 4.174%
2YT: 3.826% - 3.732% - 3.883%
Oil (WTI Crude): $61.36 - $58.12 - $70.94
Bitcoin: $83,697 - $77,102 - $84,436
Dollar Index: 100.05 - 103 - 104.27
Gold: $3,262.3 - $2,996.7 - $3,148.1
VIX: 30.12 - 52.33 - 22.29
(CNBC)
V. Detailed Sector ETF Analysis
The following Stock Market Organizer strengthening/weakening analysis looks at the 11 SPDR ETFs and their underlying component stocks for the week just ended, as follows:
- ETFs Summaries
1.1 Current: Component Stocks Strength Ratings (1Strongest vs. 9Weakest vs. Ignore Status)
1.2 Current: Component Stocks Positive vs. Negative Weekly Returns
1.3 Historical: 10 Week Ratings by ETF
1.4 Historical: 10 Week Ratings by Week - ETFs Detail
2.1 XLB Materials
2.2 XLC Communications
2.3 XLE Energy
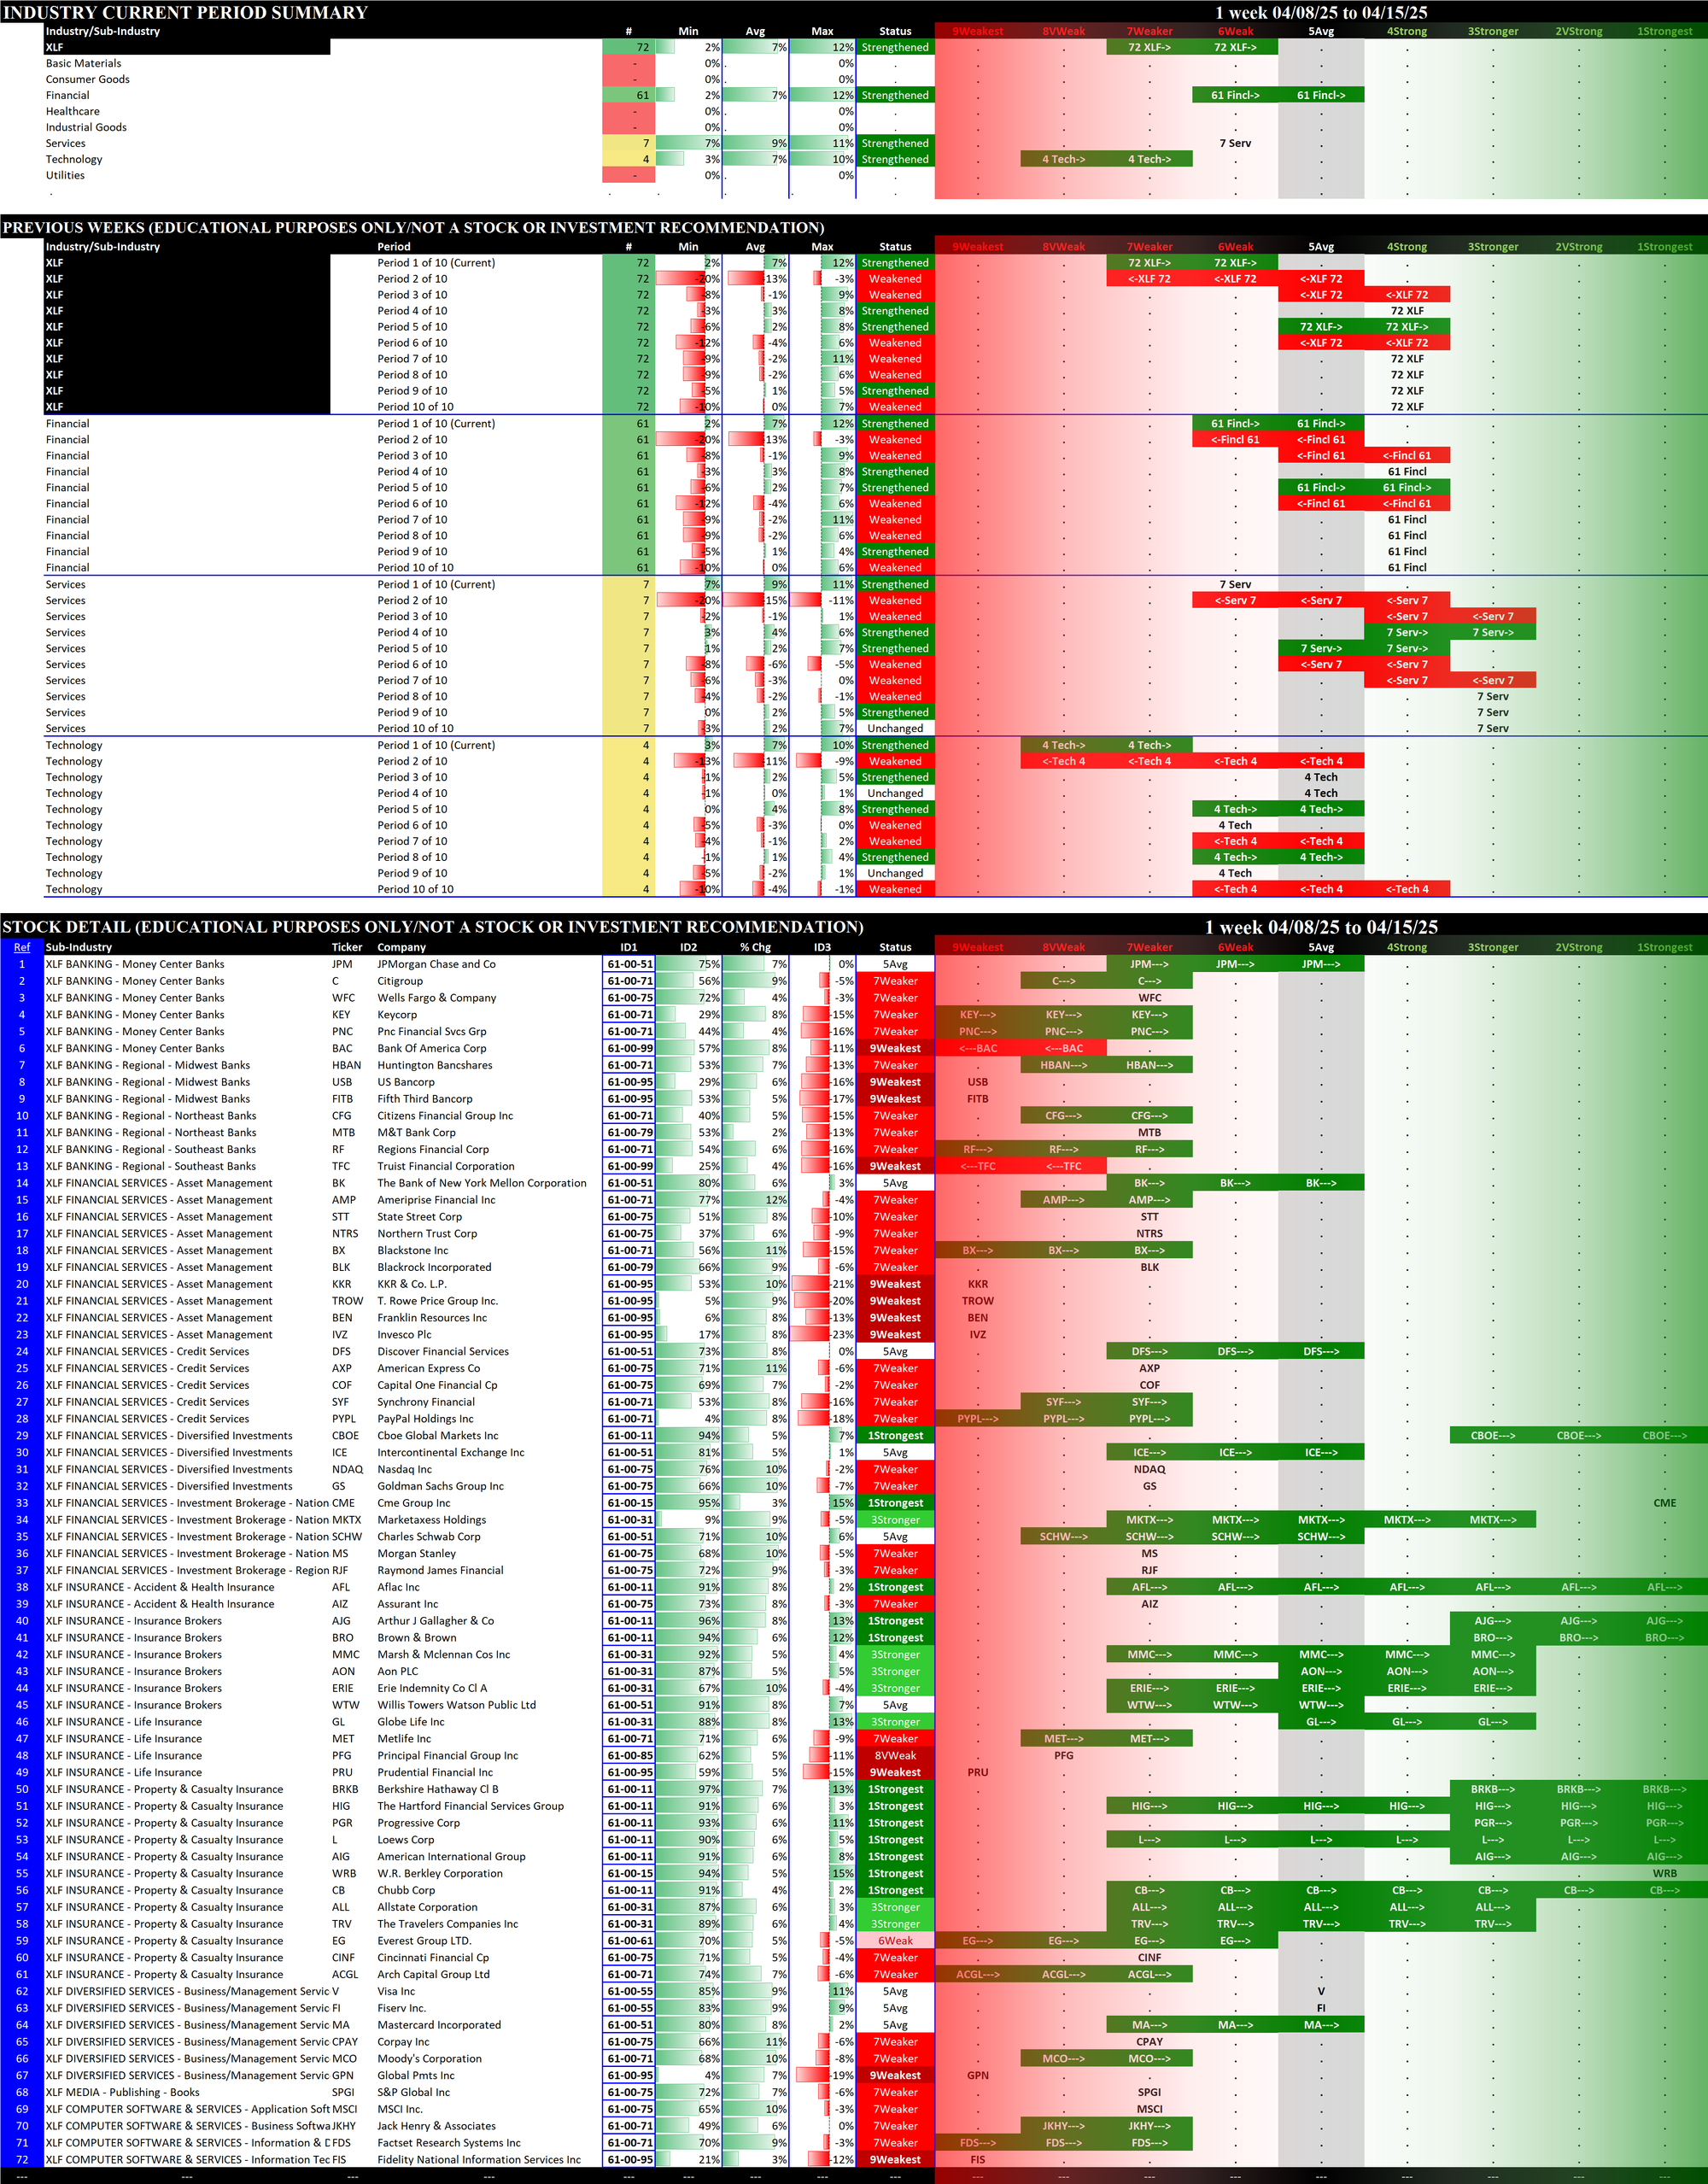
2.4 XLF Financial
2.5 XLI Industrial
2.6 XLK Technology
2.7 XLP Consumer Staples
2.8 XLRE Real Estate
2.9 XLU Utilities
2.10 XLV Health Care
2.11 XLY Consumer Discretionary - Stock Detail (downloads)
1. ETFs Summaries
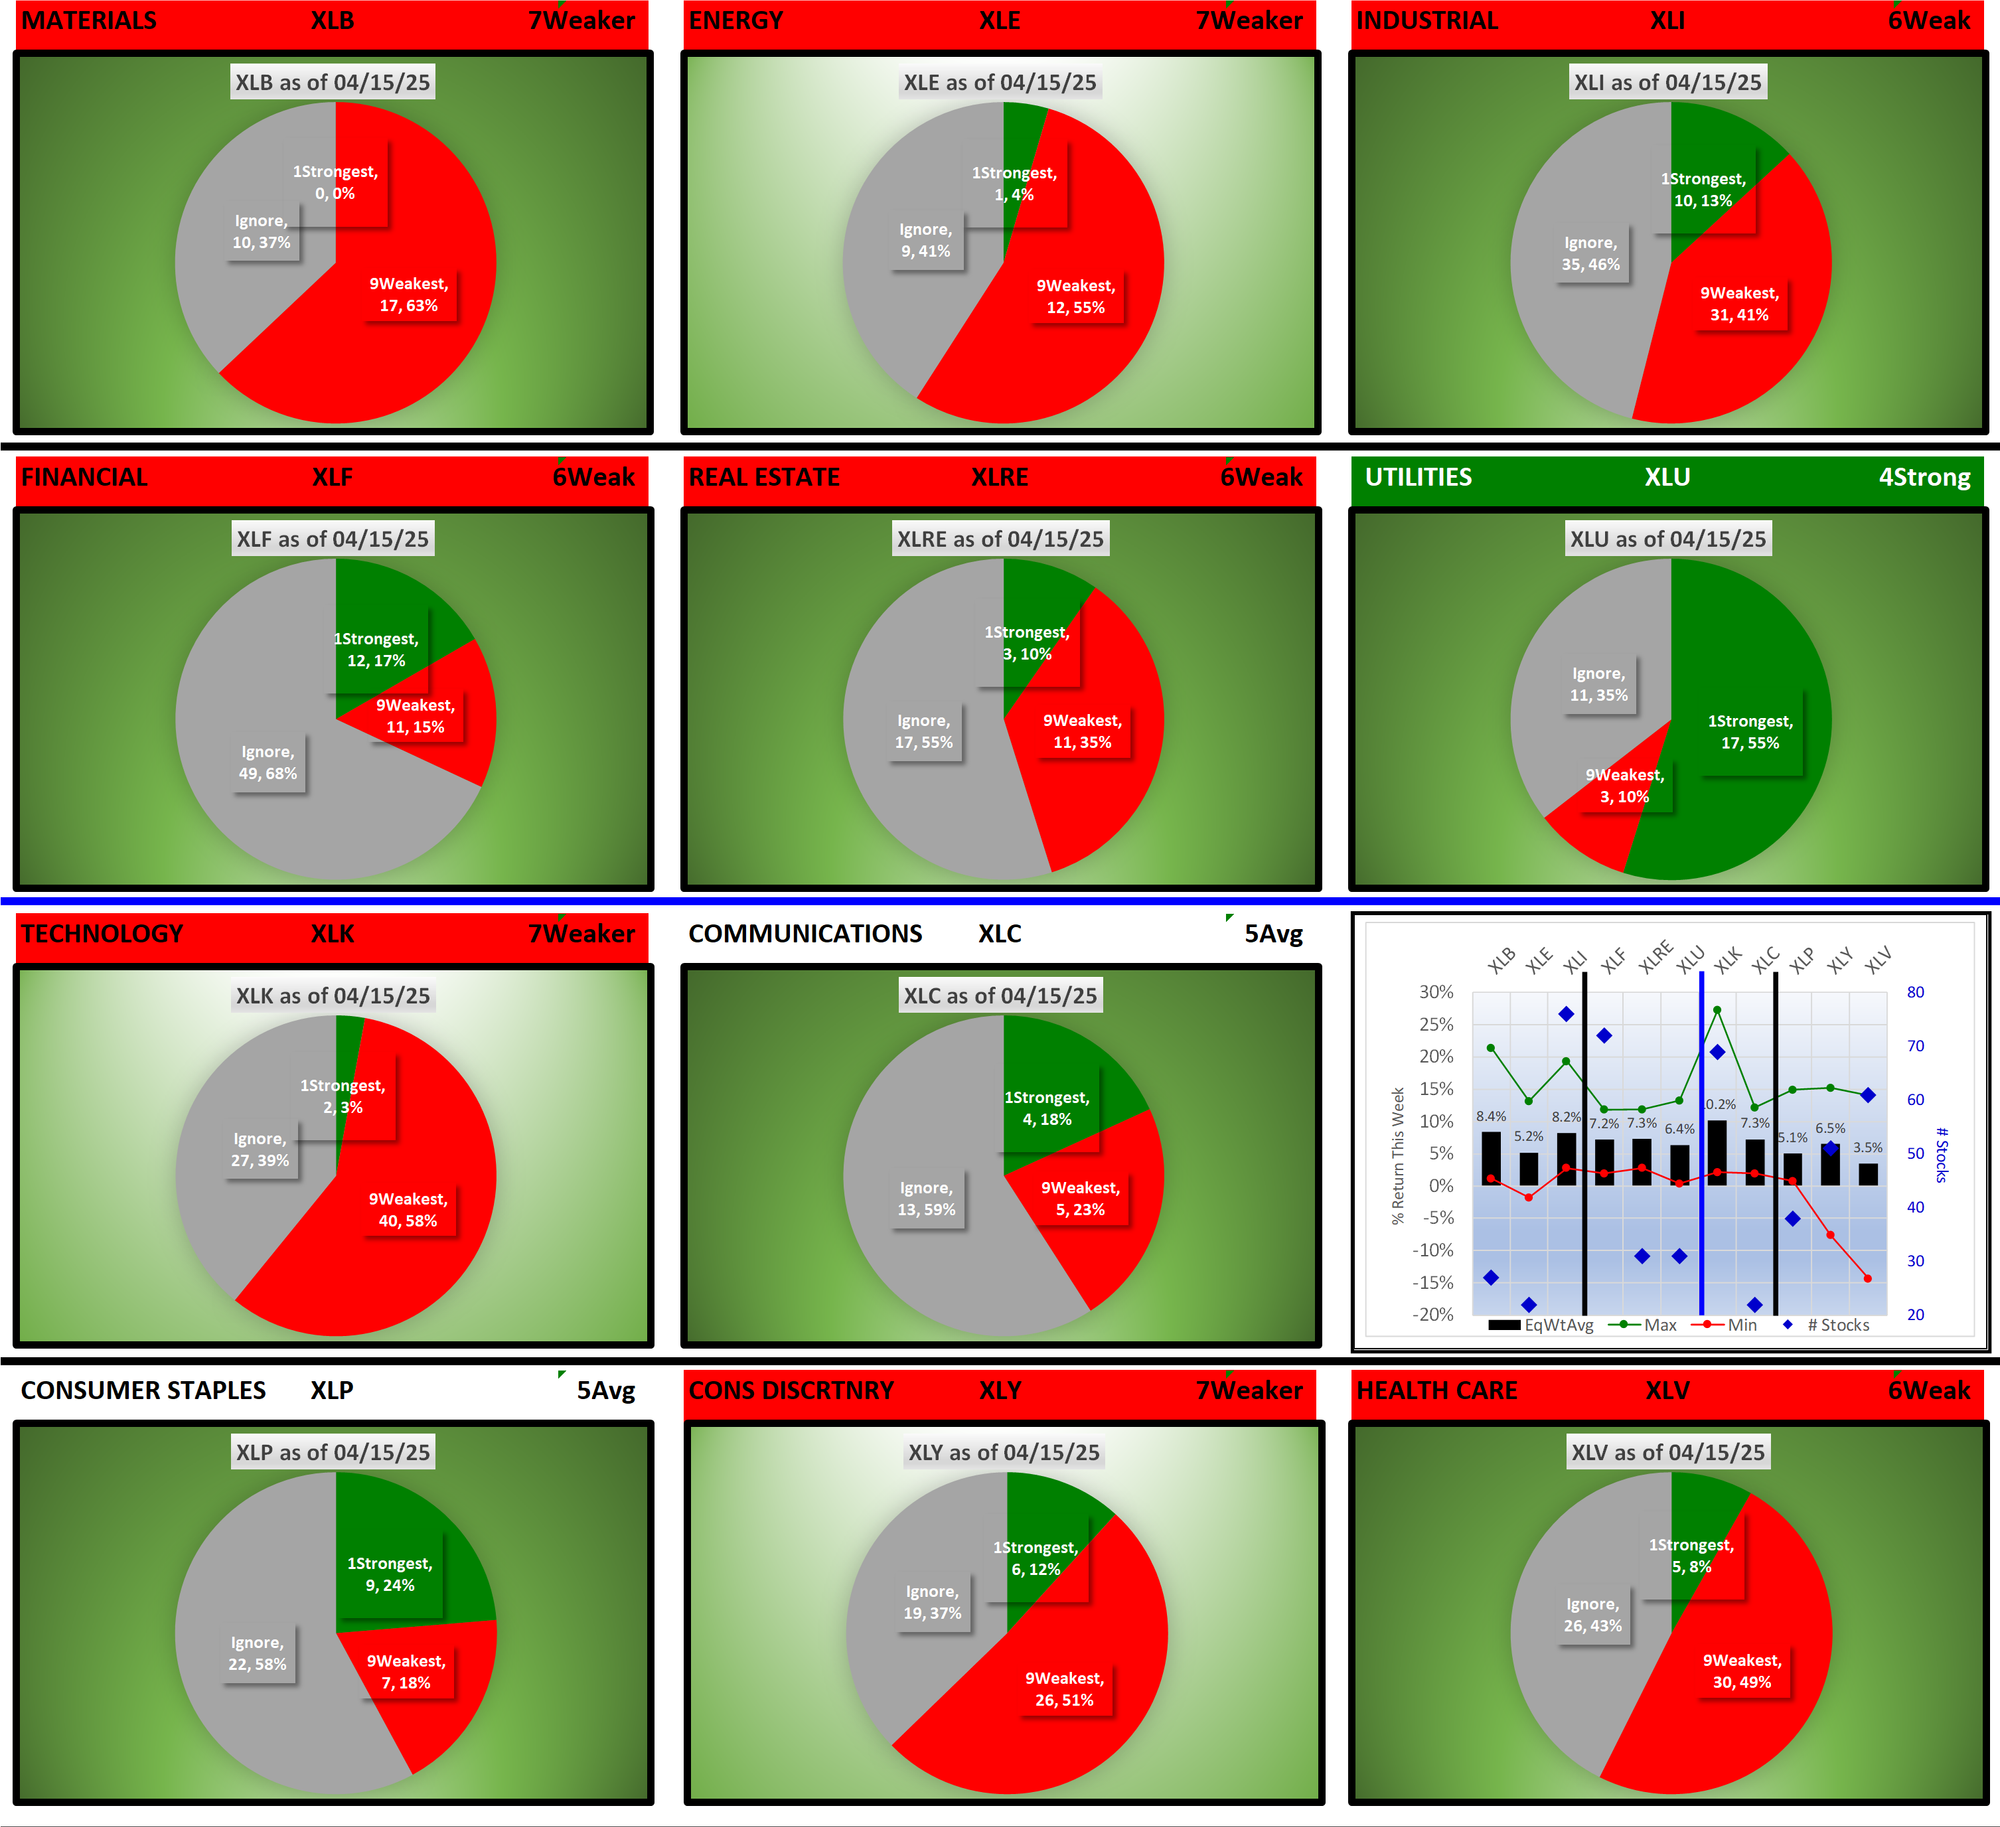
1.1 Current: Component Stocks Strength Ratings (1Strongest vs. 9Weakest vs. Ignore Status)
The following graphs reflect the composition of each of the ETFs based on their underlying component stock strength ratings which range from 1Strongest to 9Weakest. I only care about the strongest and weakest in each sector and thus categorize as "Ignore" stocks rated from 2VeryStrong through 8VeryWeak.
- Top row: XLB/Basic Materials, XLE/Energy, and XLI/Industrial
- Second row: interest rate-sensitive ETFs XLF/Financial, XLRE/Real Estate, and XLU/Utilities
- Third row: XLK/Technology and XLC/Communications
- Bottom row: XLP/Consumer Staples, XLY/Consumer Discretionary, and XLV/Health Care
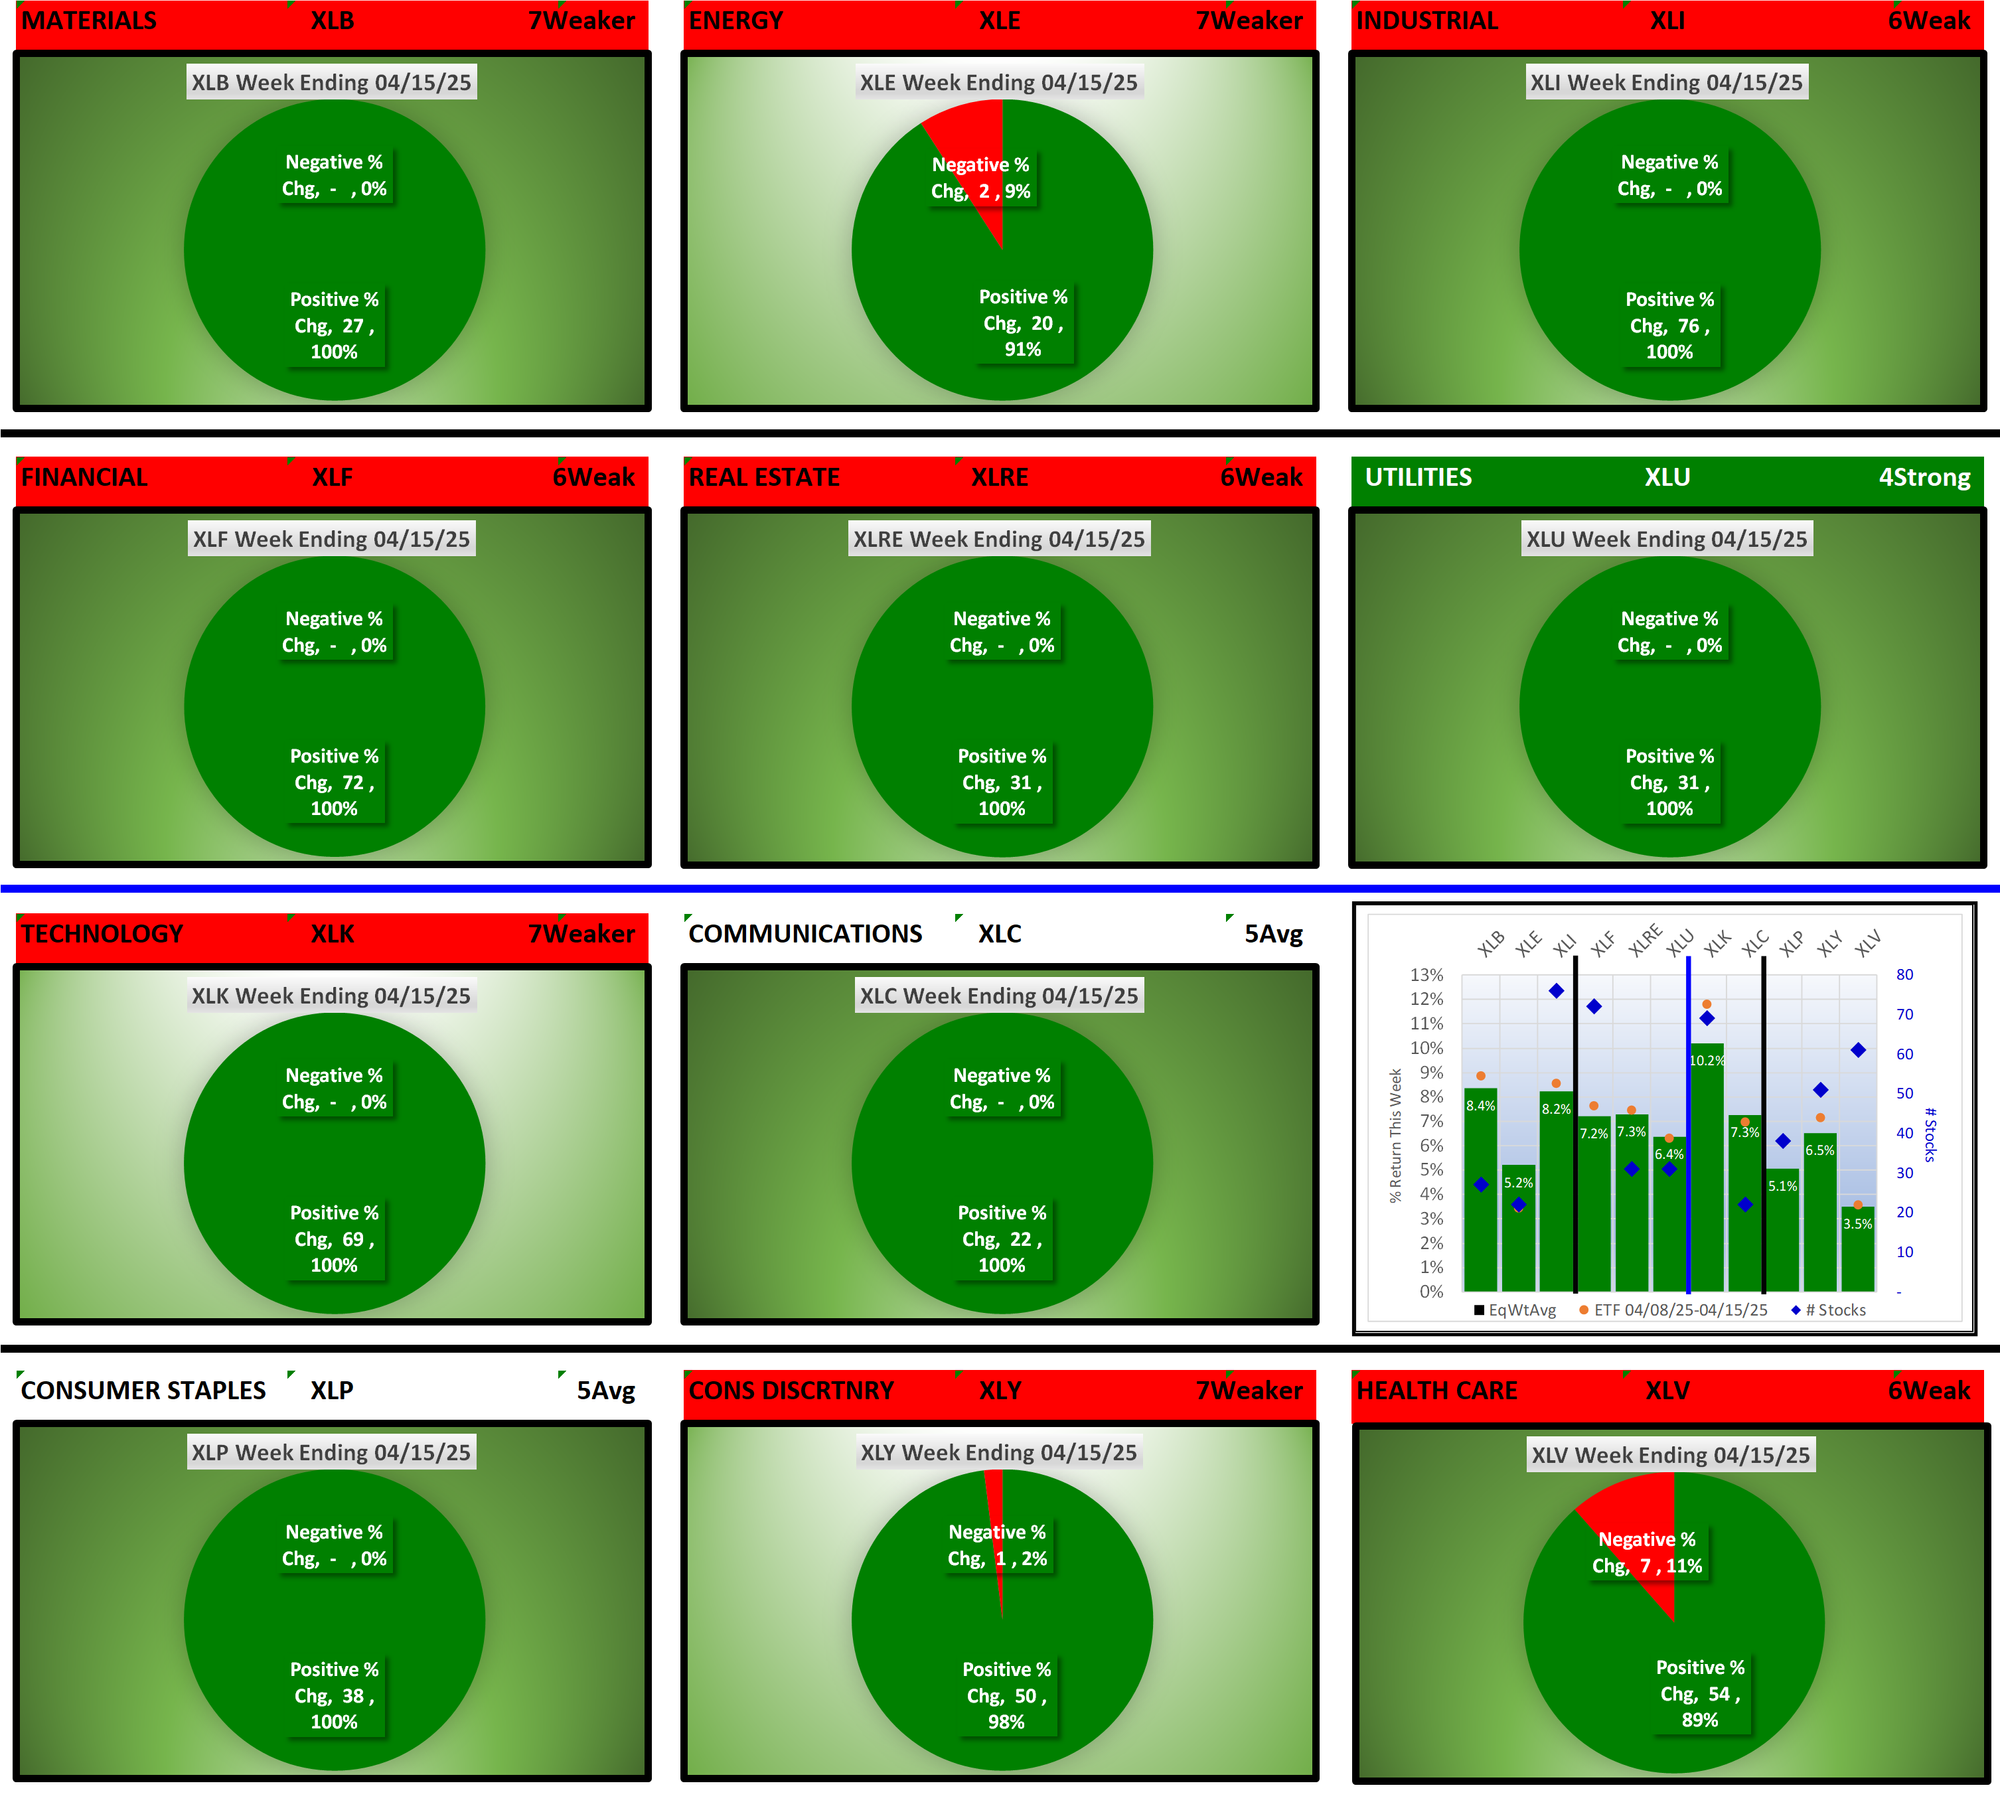
1.2 Current: Component Stocks Positive vs. Negative Weekly Returns
The following pie charts show the breadth of positive and negative returns for the week for the component stocks of each ETF.
1.3 Historical: 10 Week Ratings by ETF
Below are 10-week historical strength rating summaries of the ETFs, sorted by ETF - each grouping shows the 10-week ratings change for individual ETFs. This shows the path each ETF has taken over the past 10 weeks to arrive at the current strength rating.
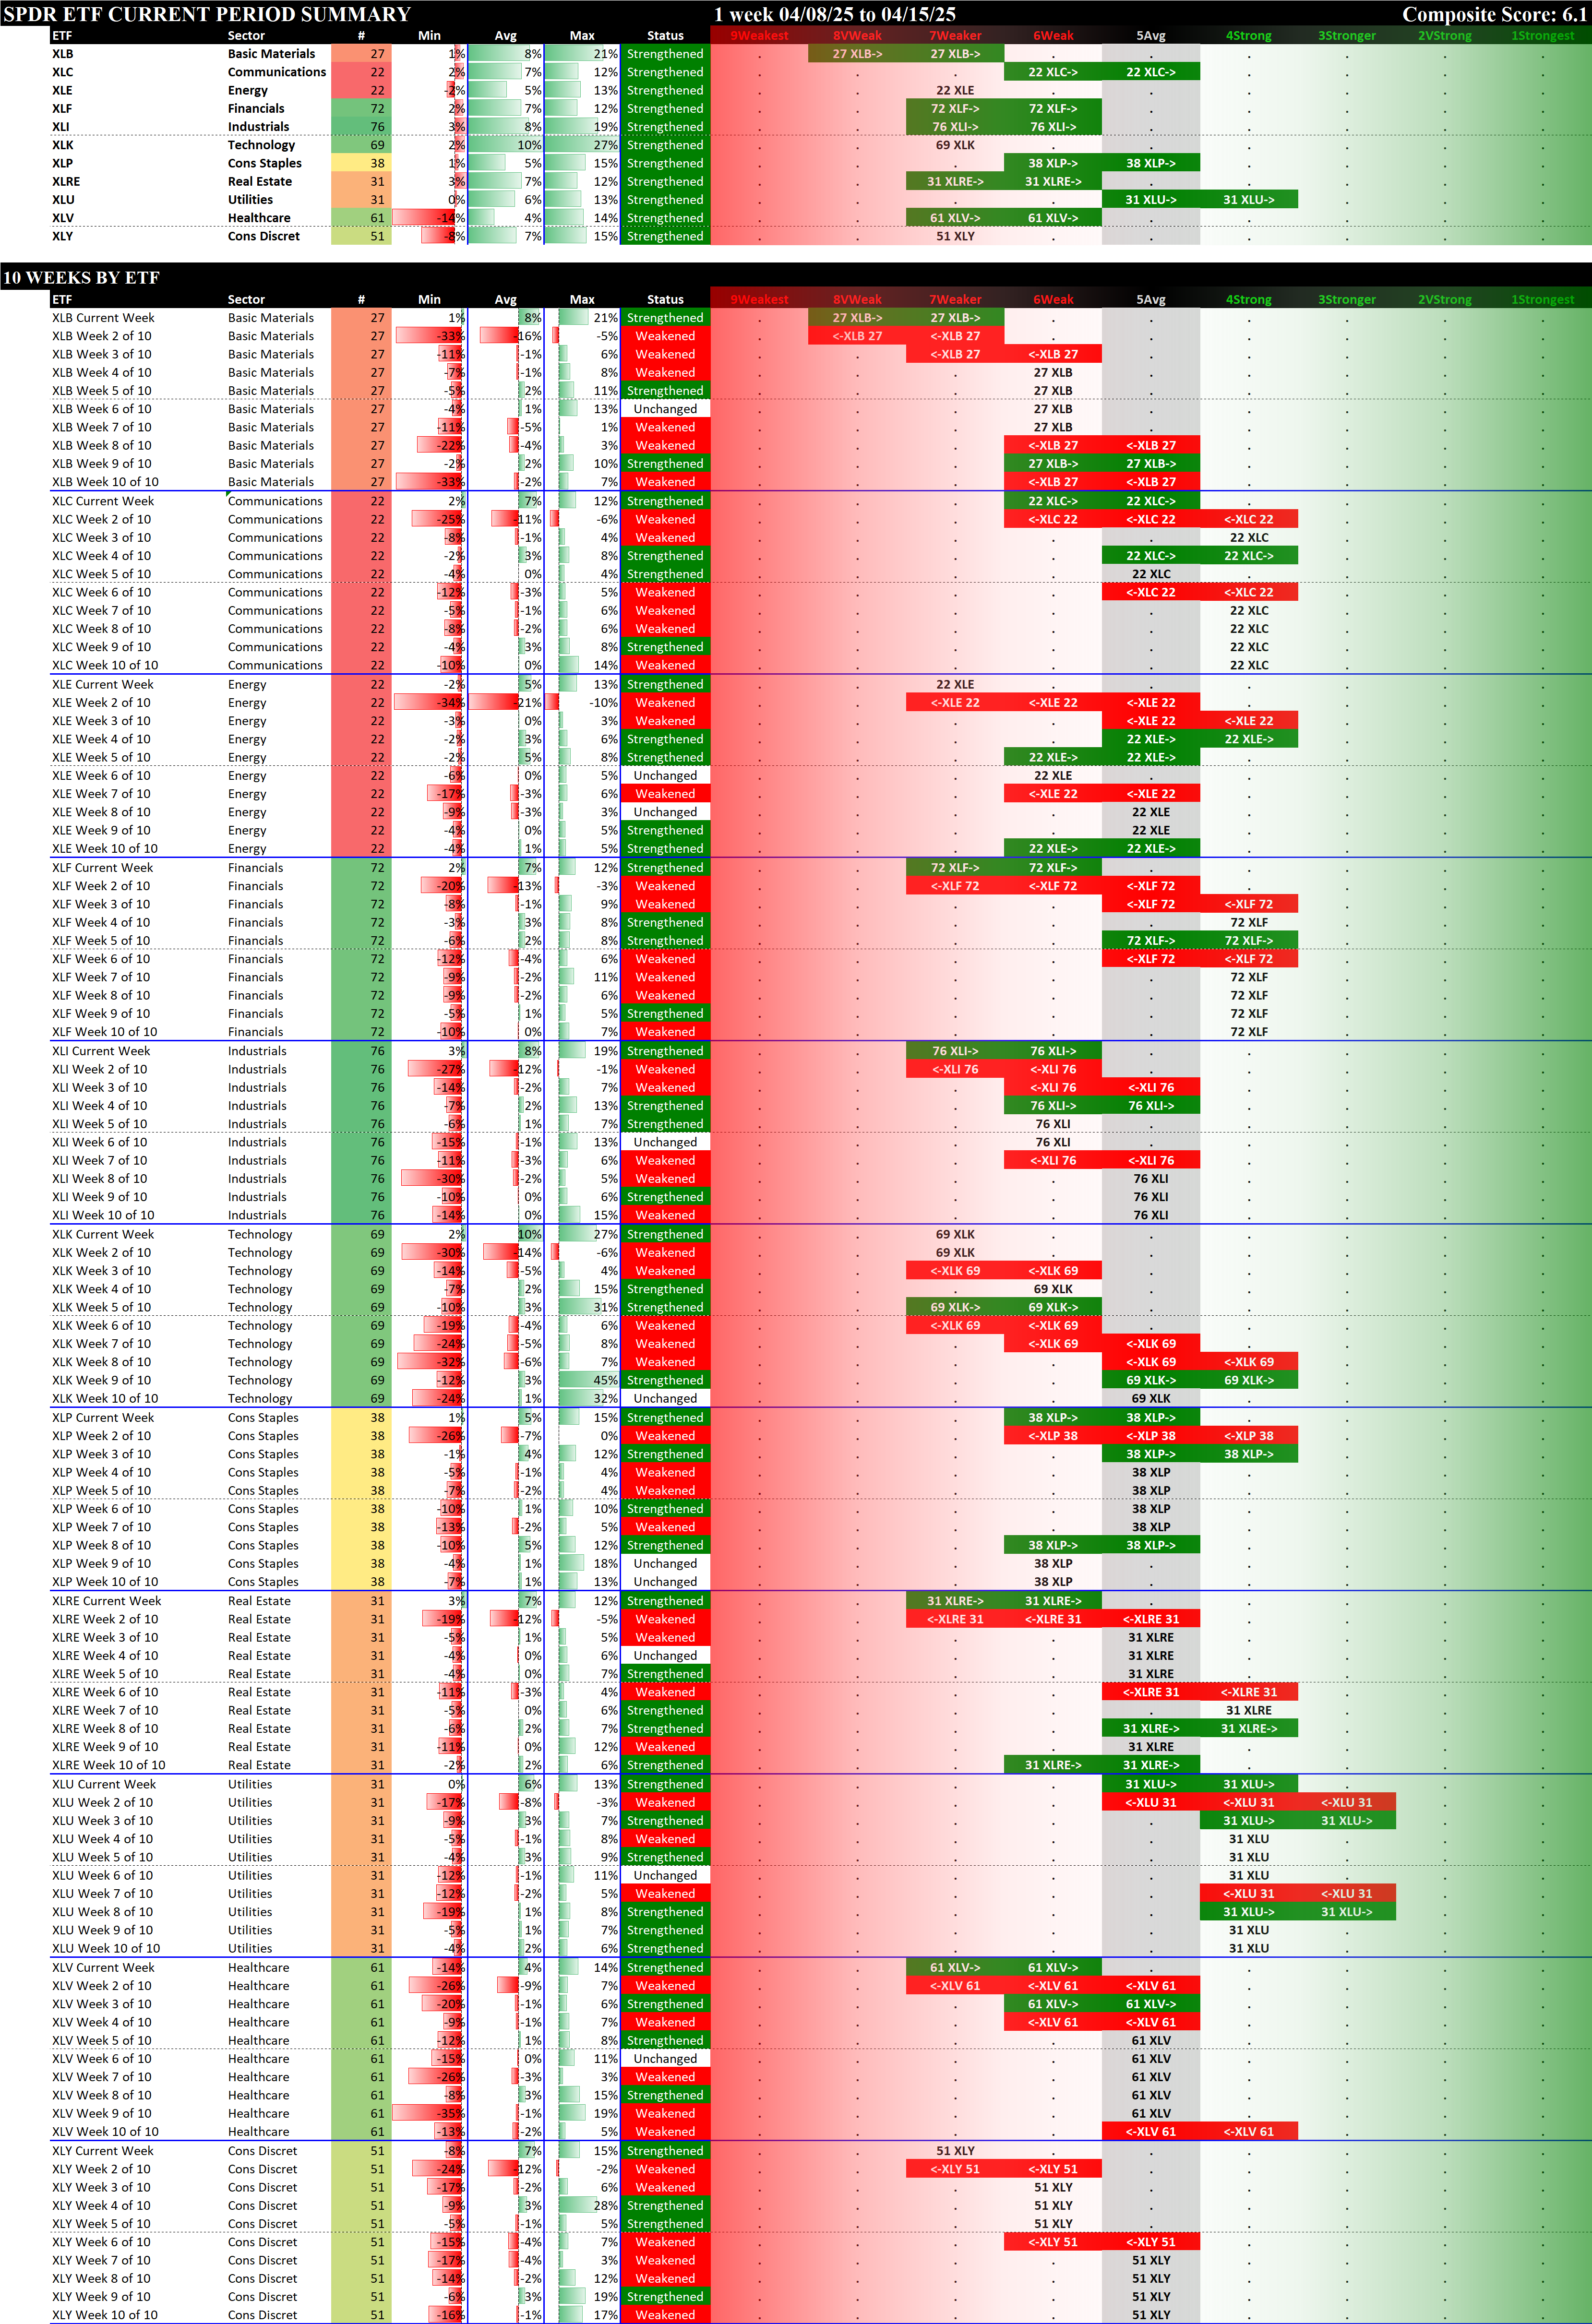
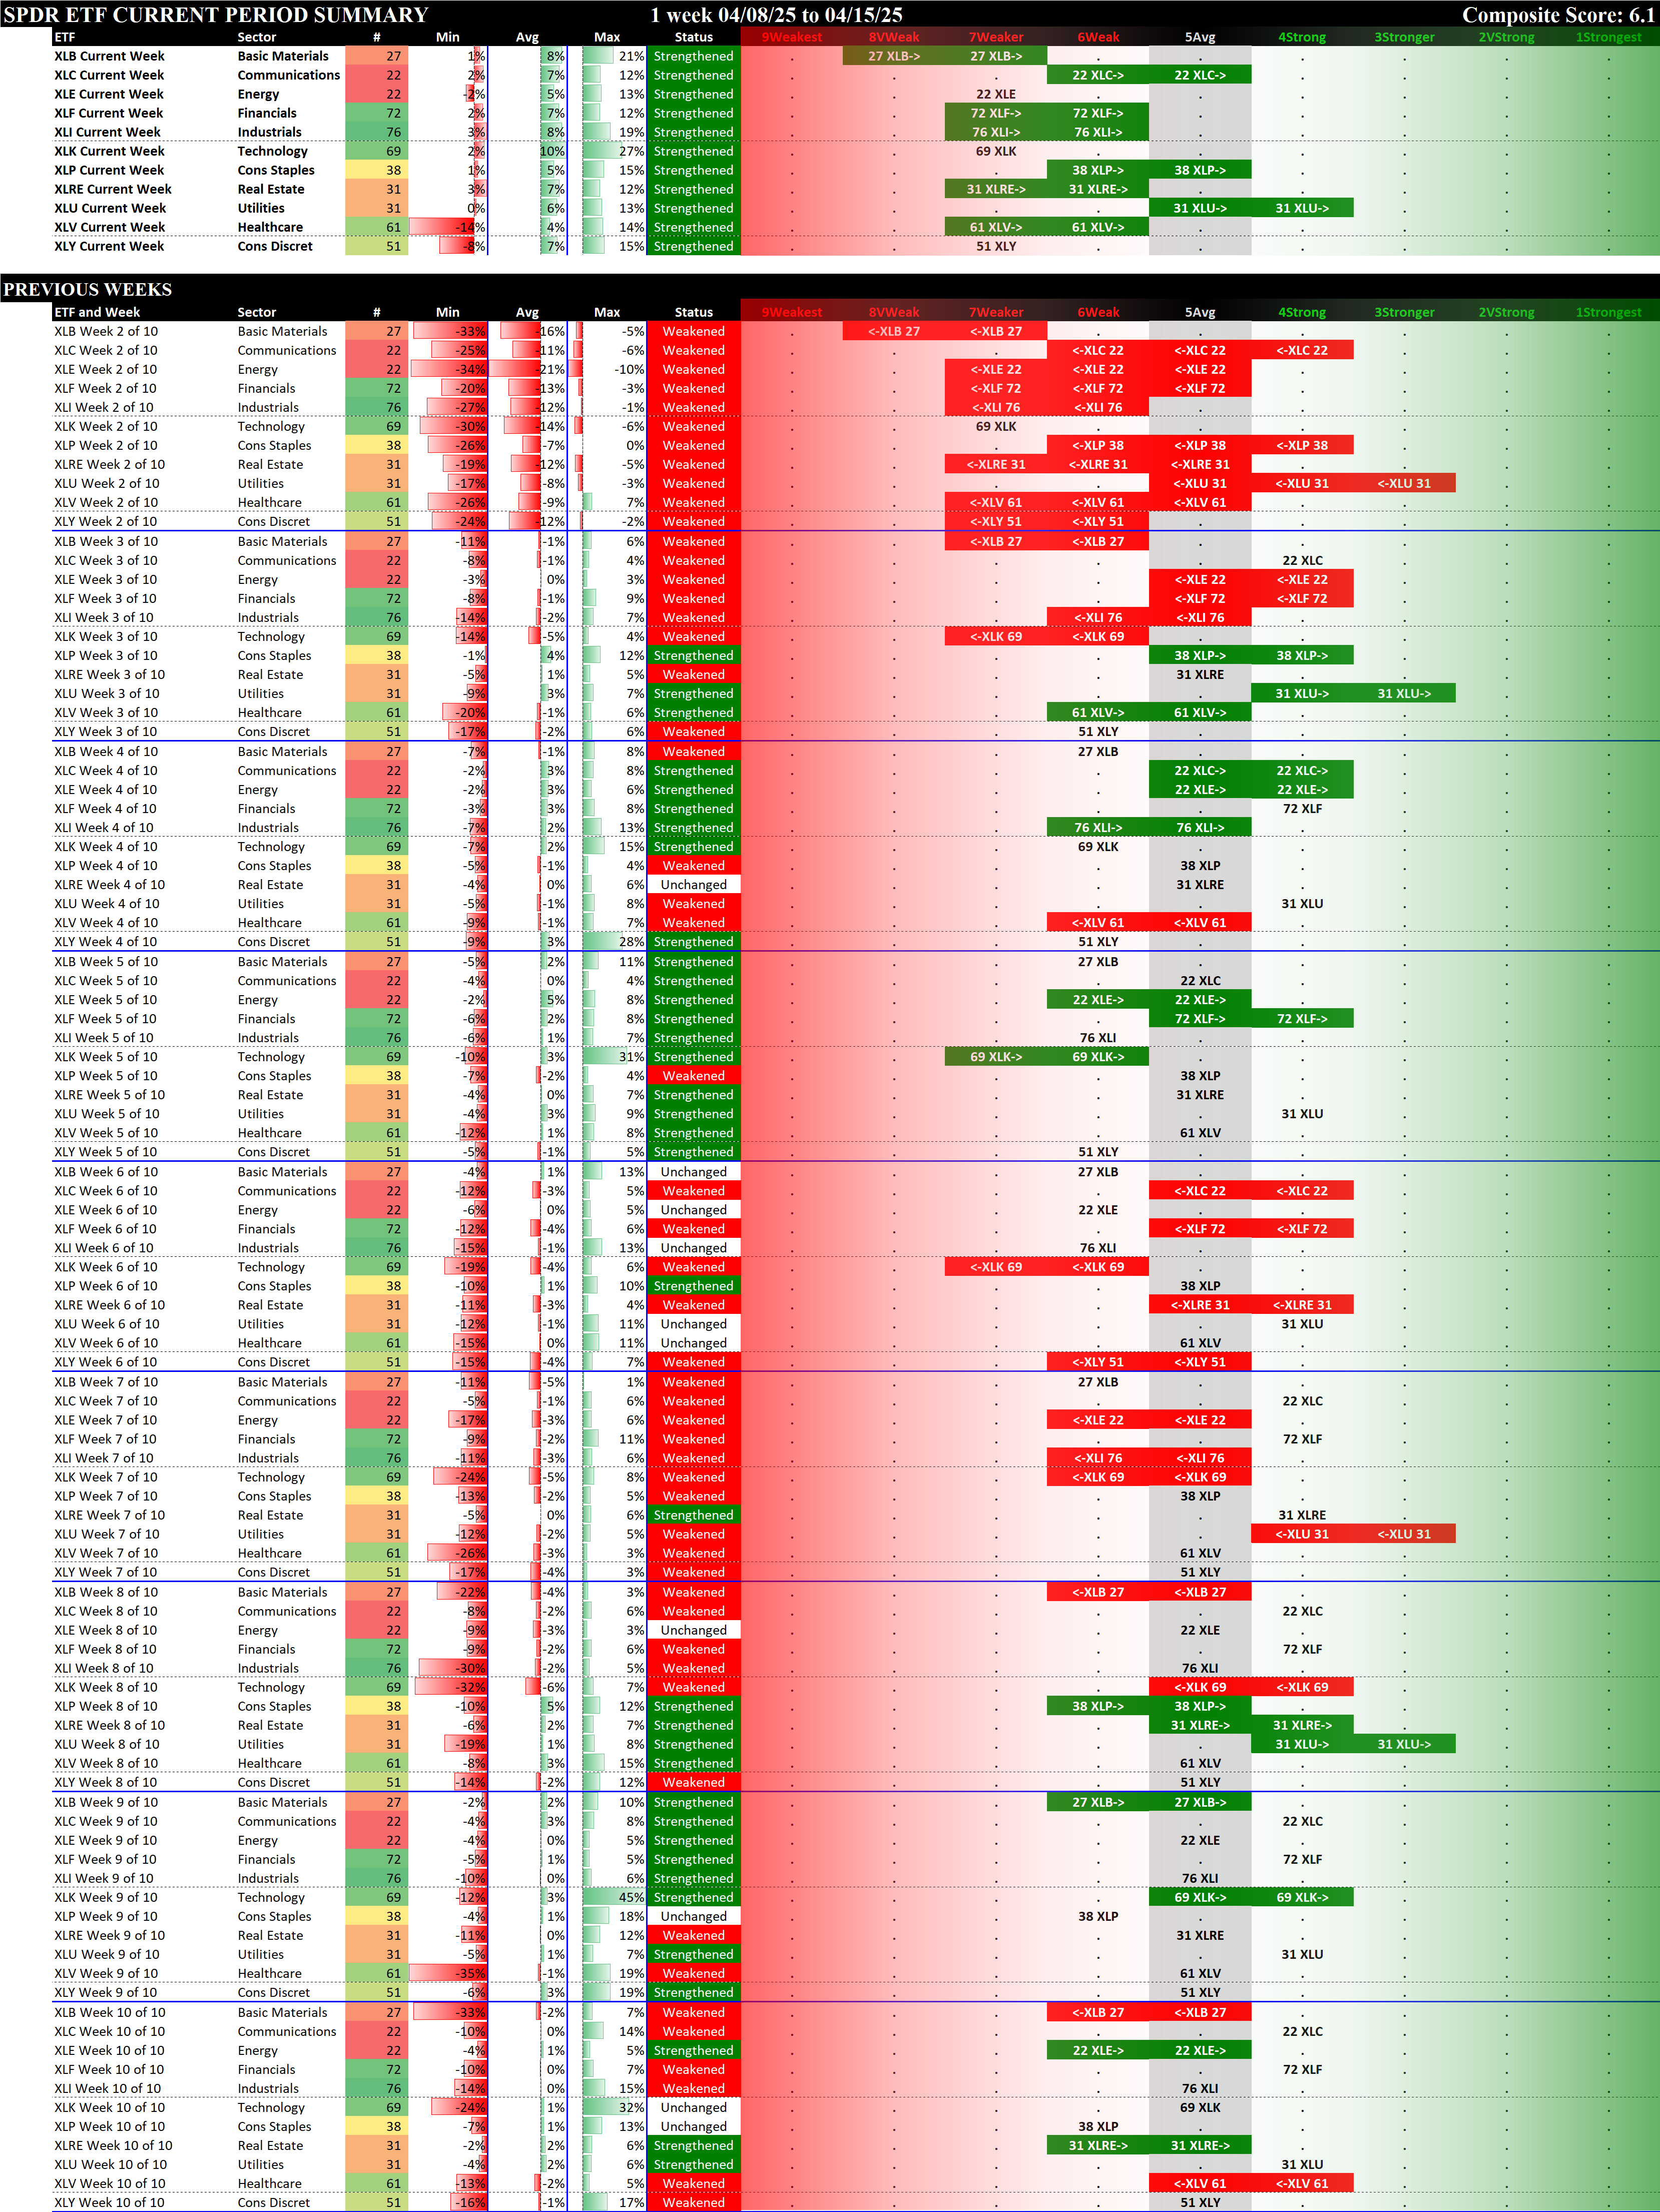
1.4 Historical: 10-Week Ratings by Week
Below are 10-week historical strength rating summaries of the ETFs, sorted by week - each grouping shows one week for all 11 ETFs in newest-to-oldest format. This reveals the weekly strengthening/weakening path of all the ETFs.
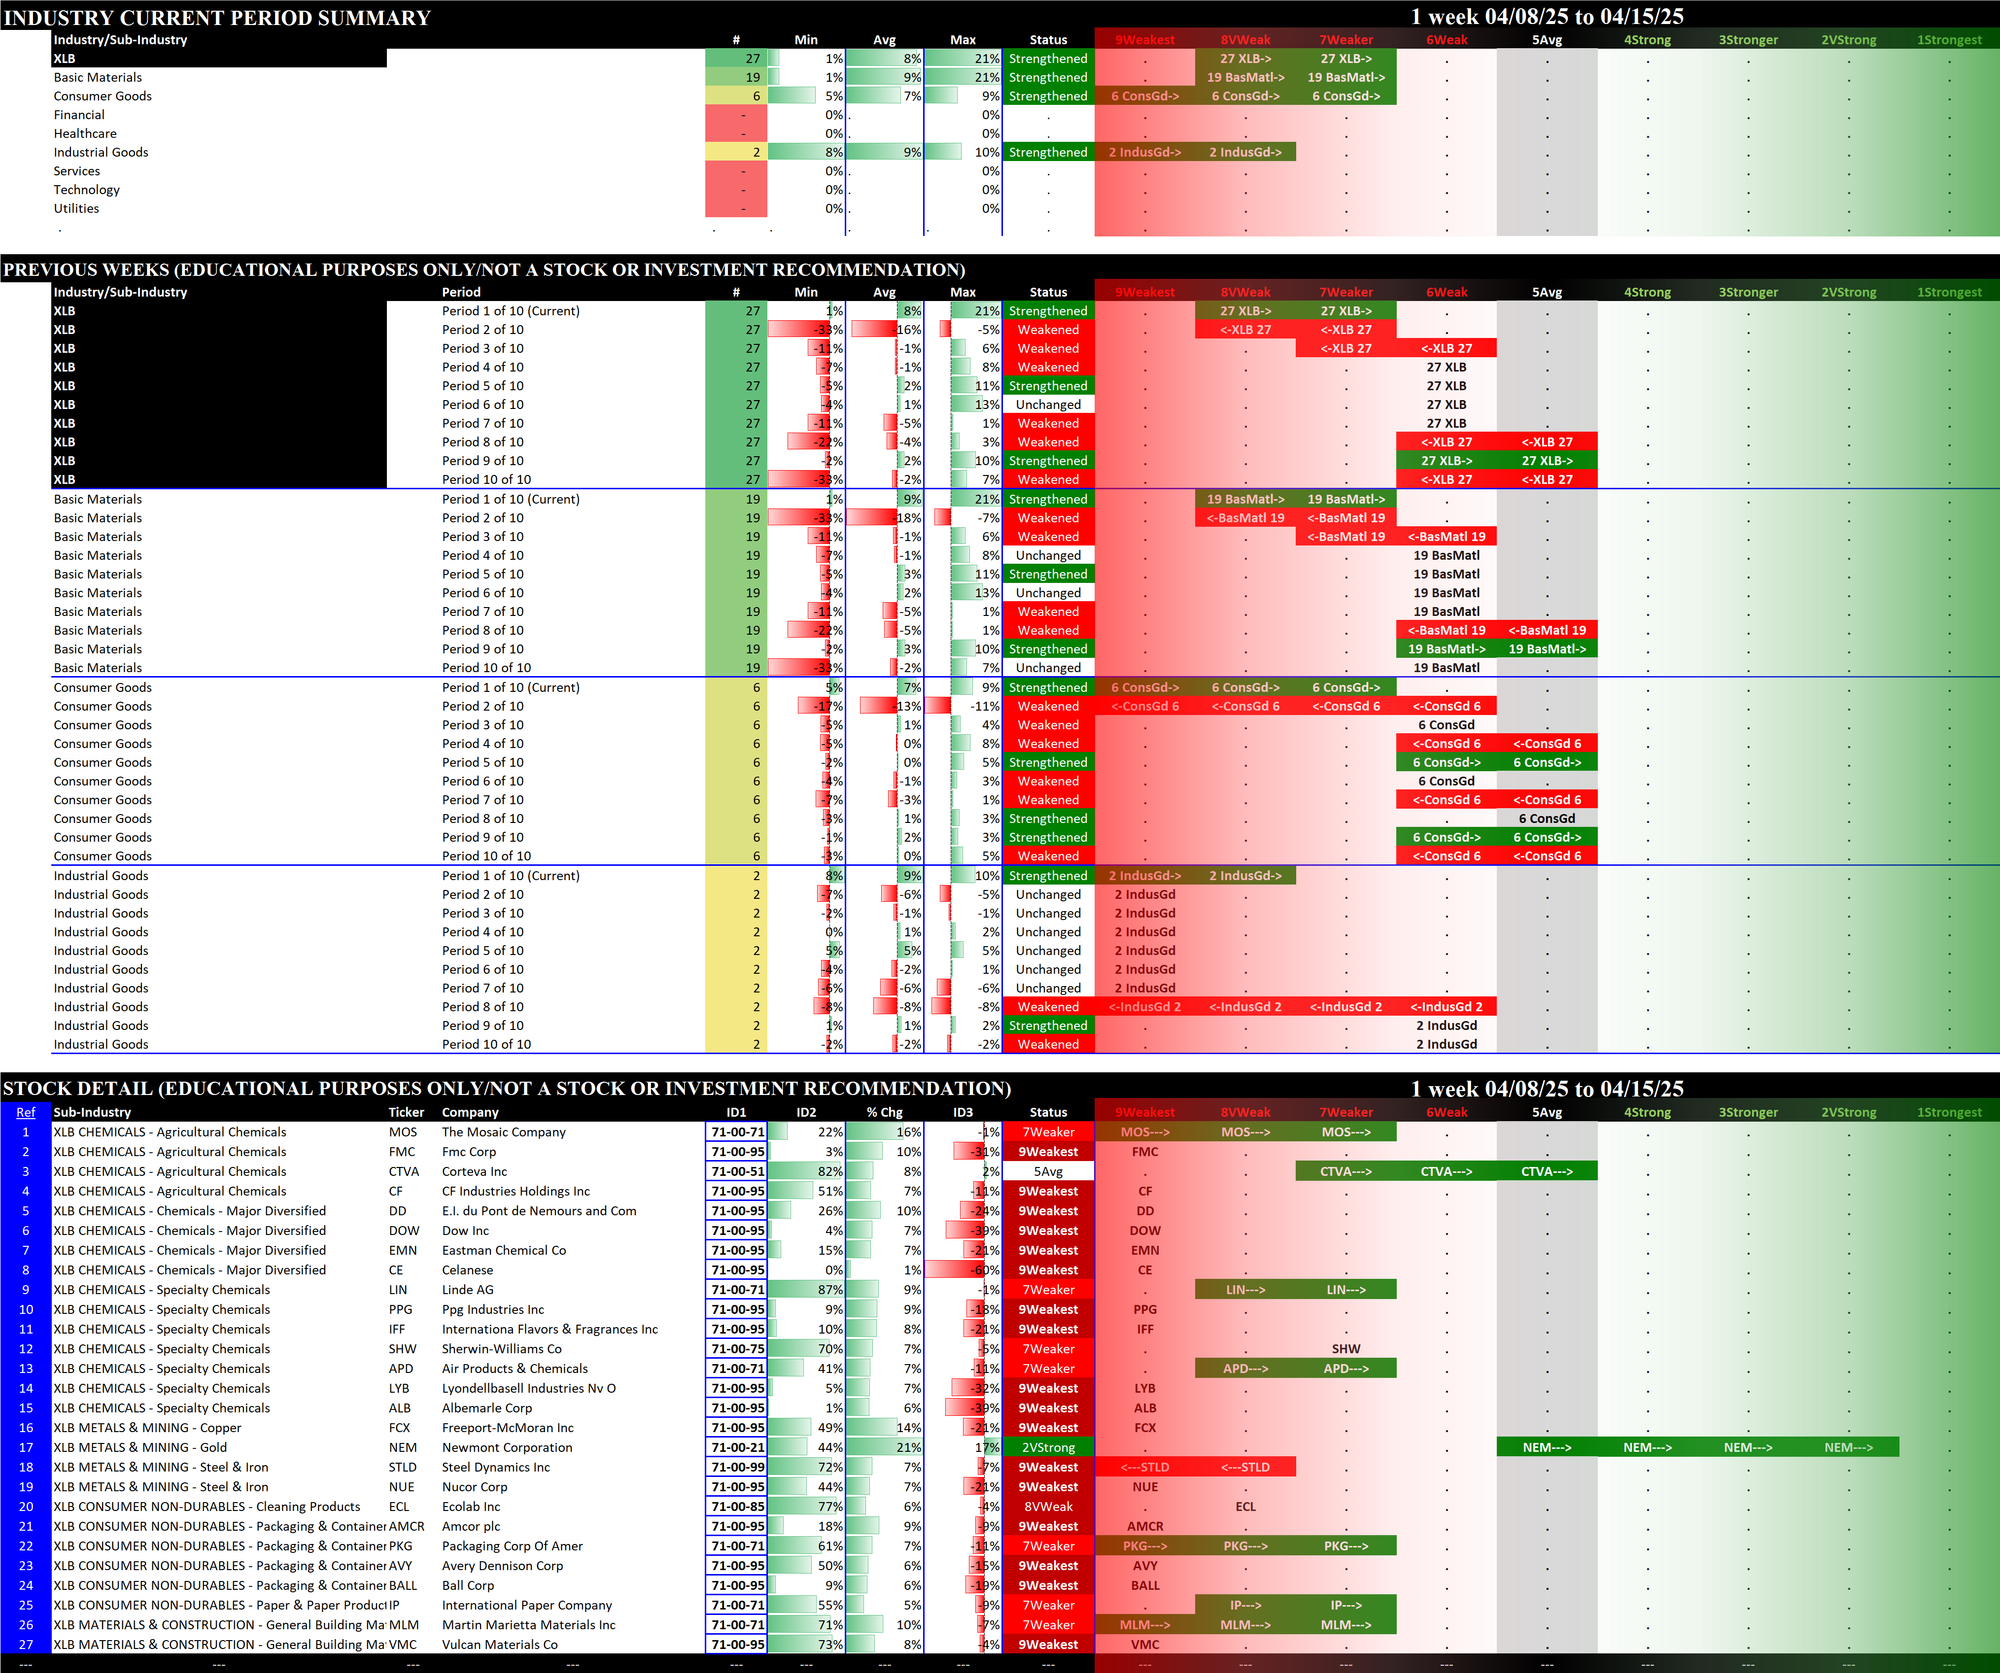
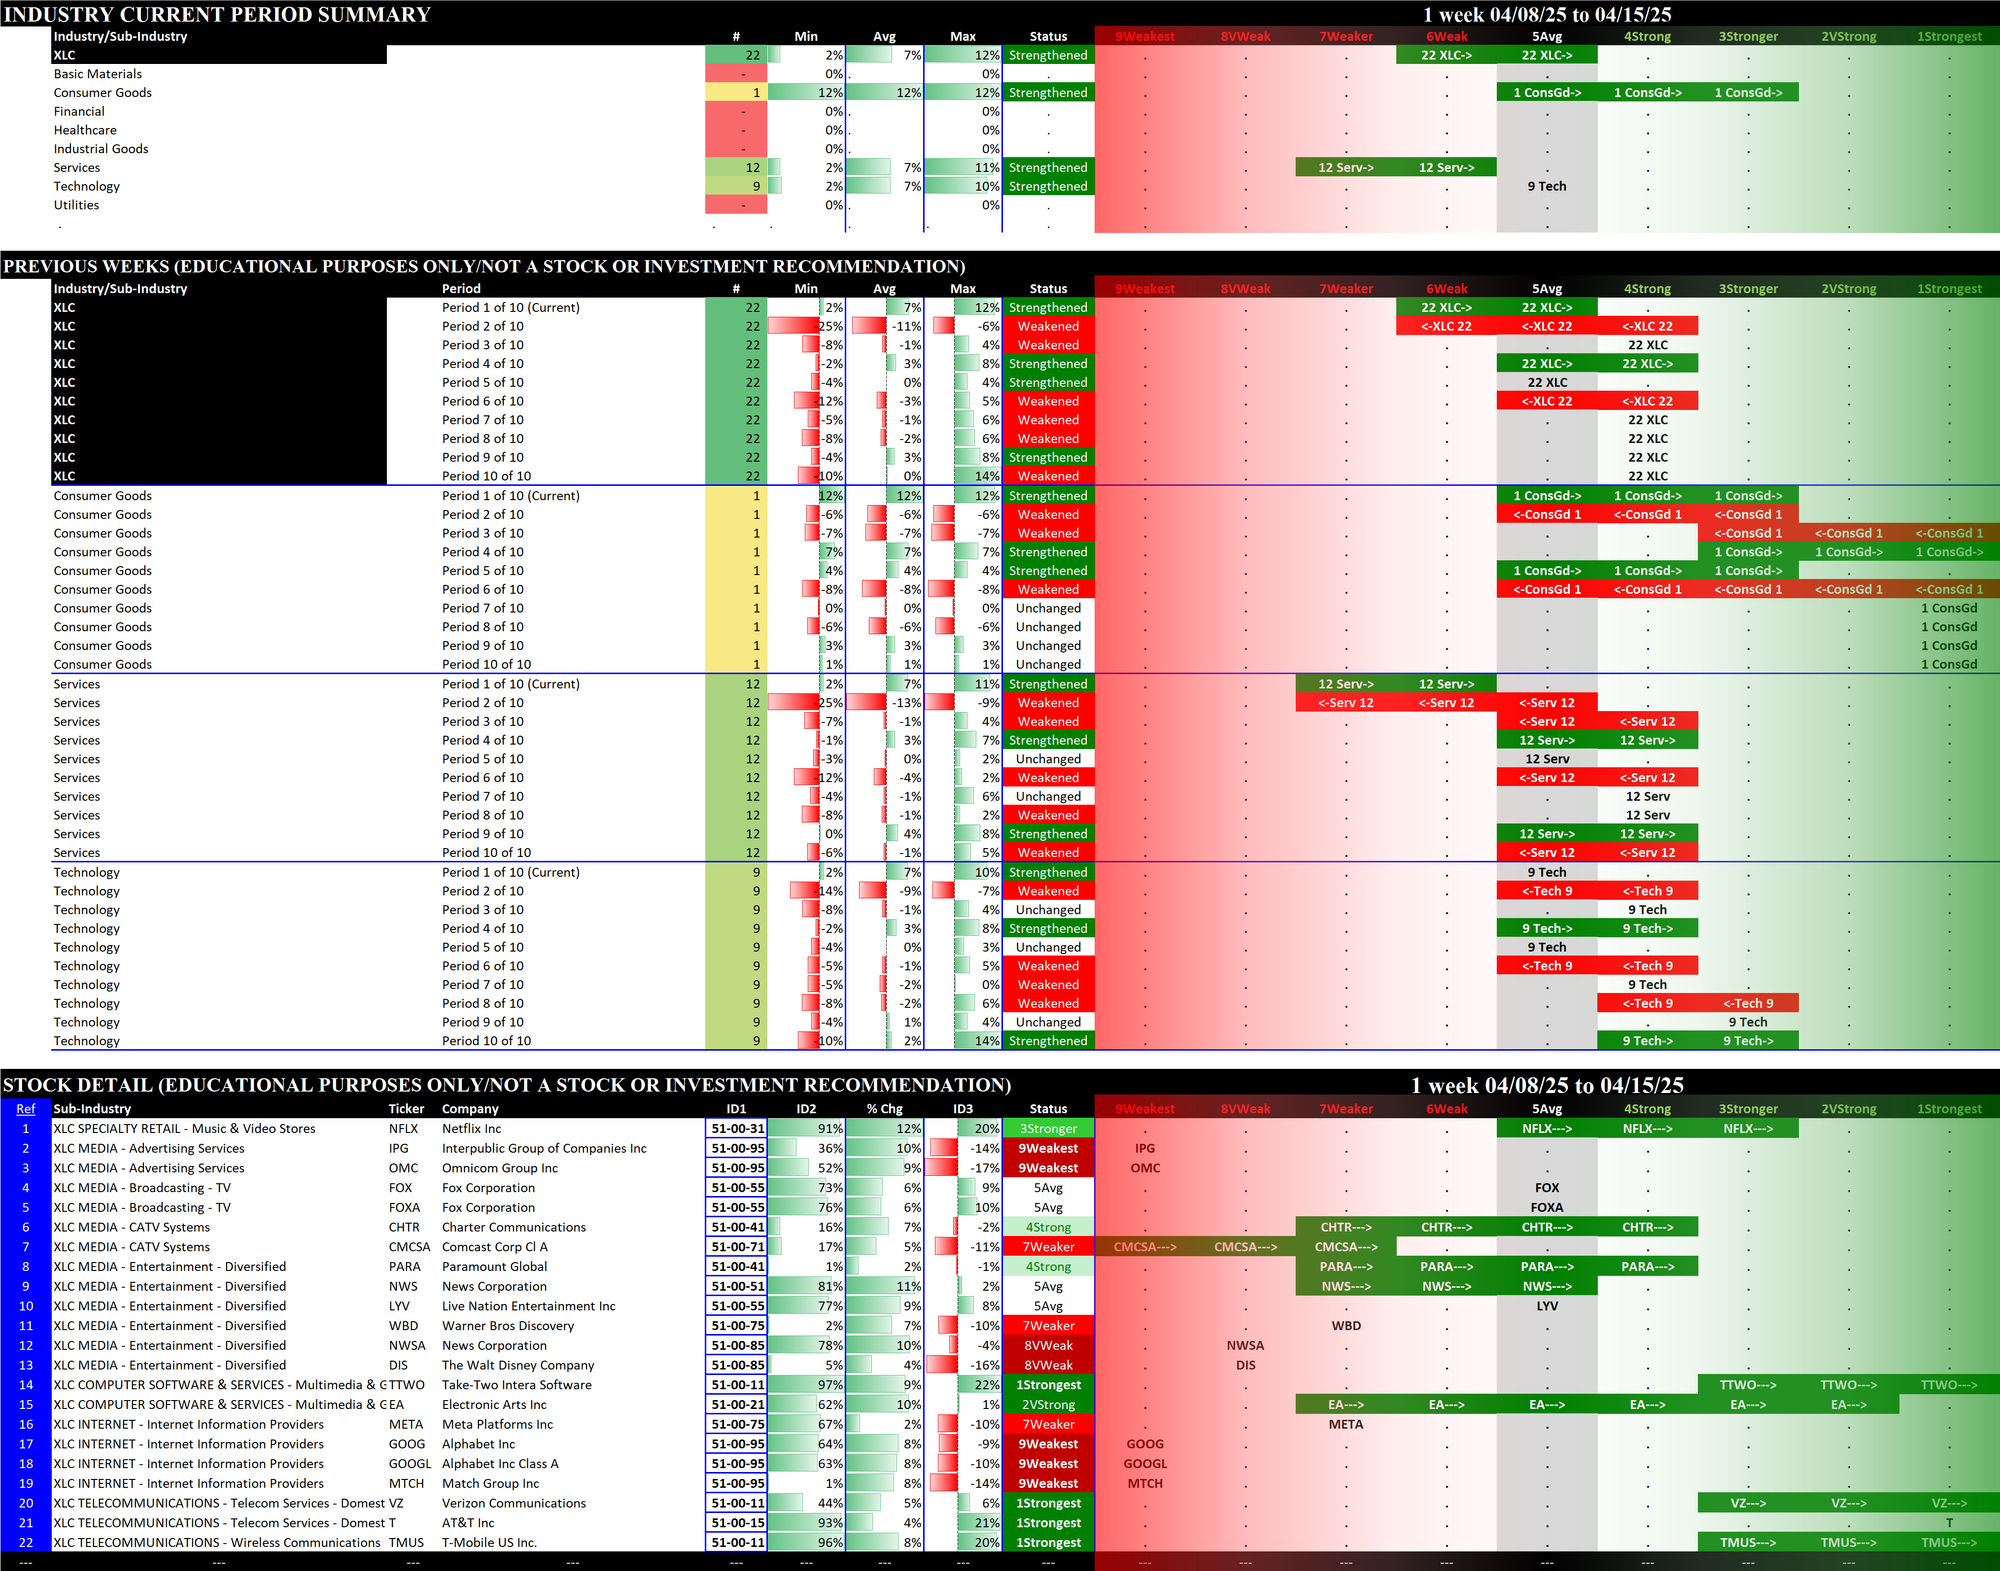
2. ETFs Detail
Details for each of the 11 ETFs are provided below. Comments:
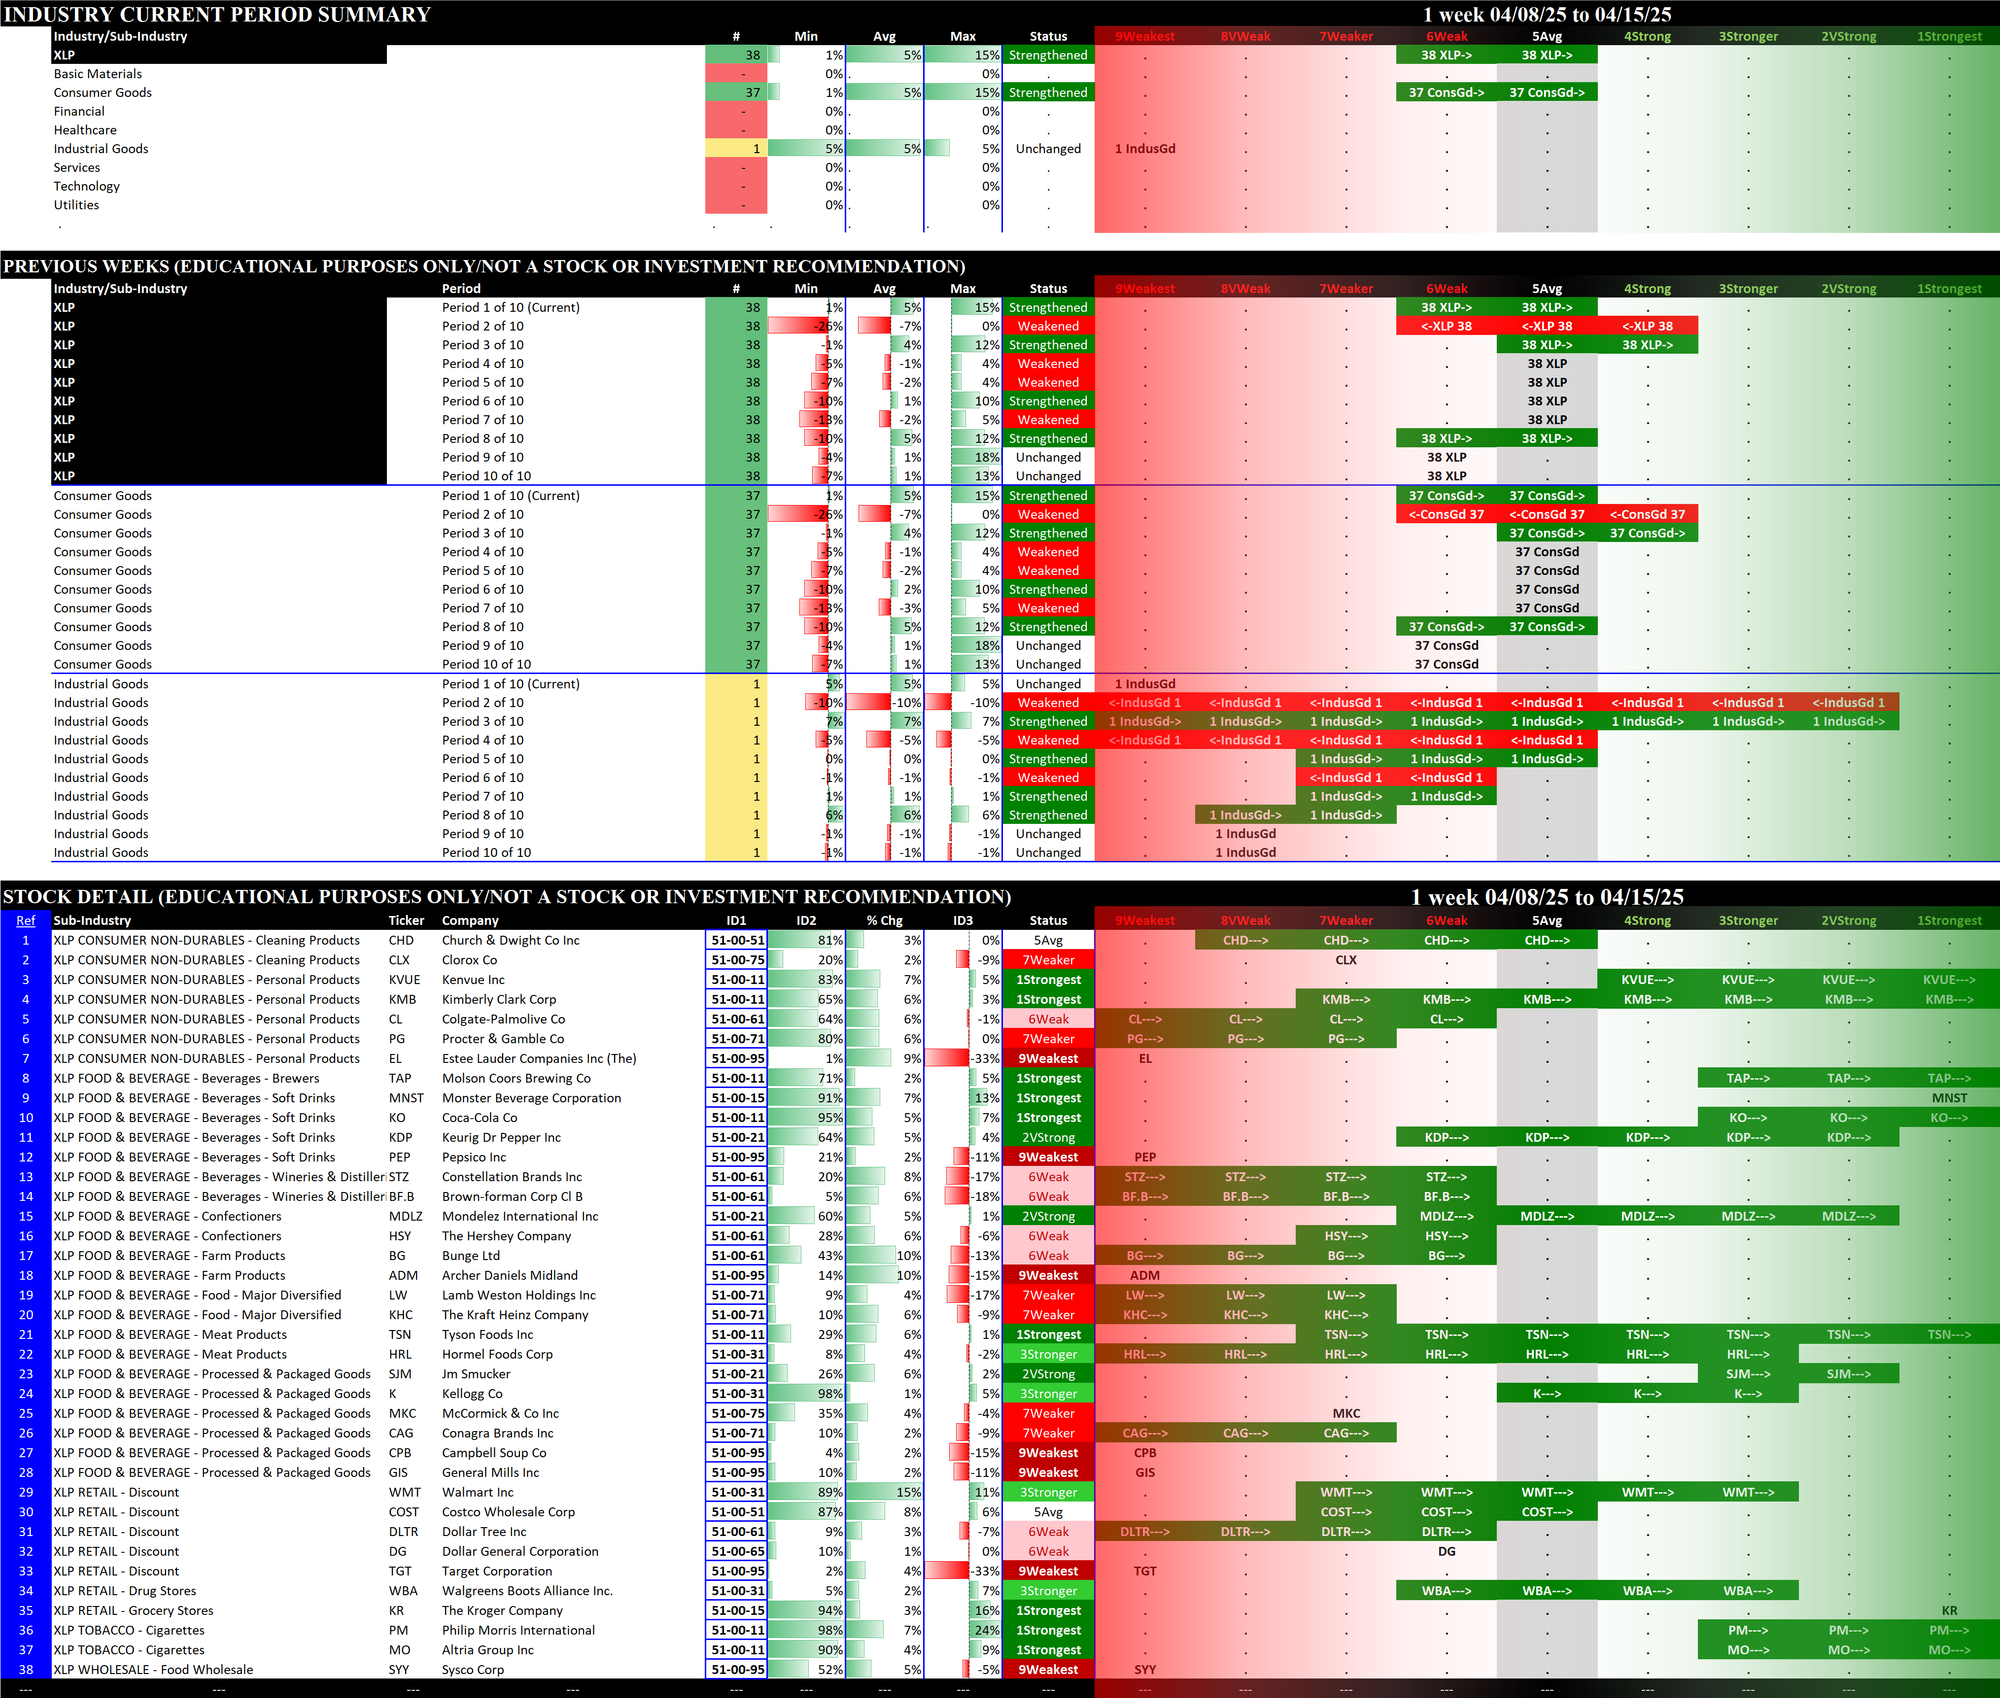
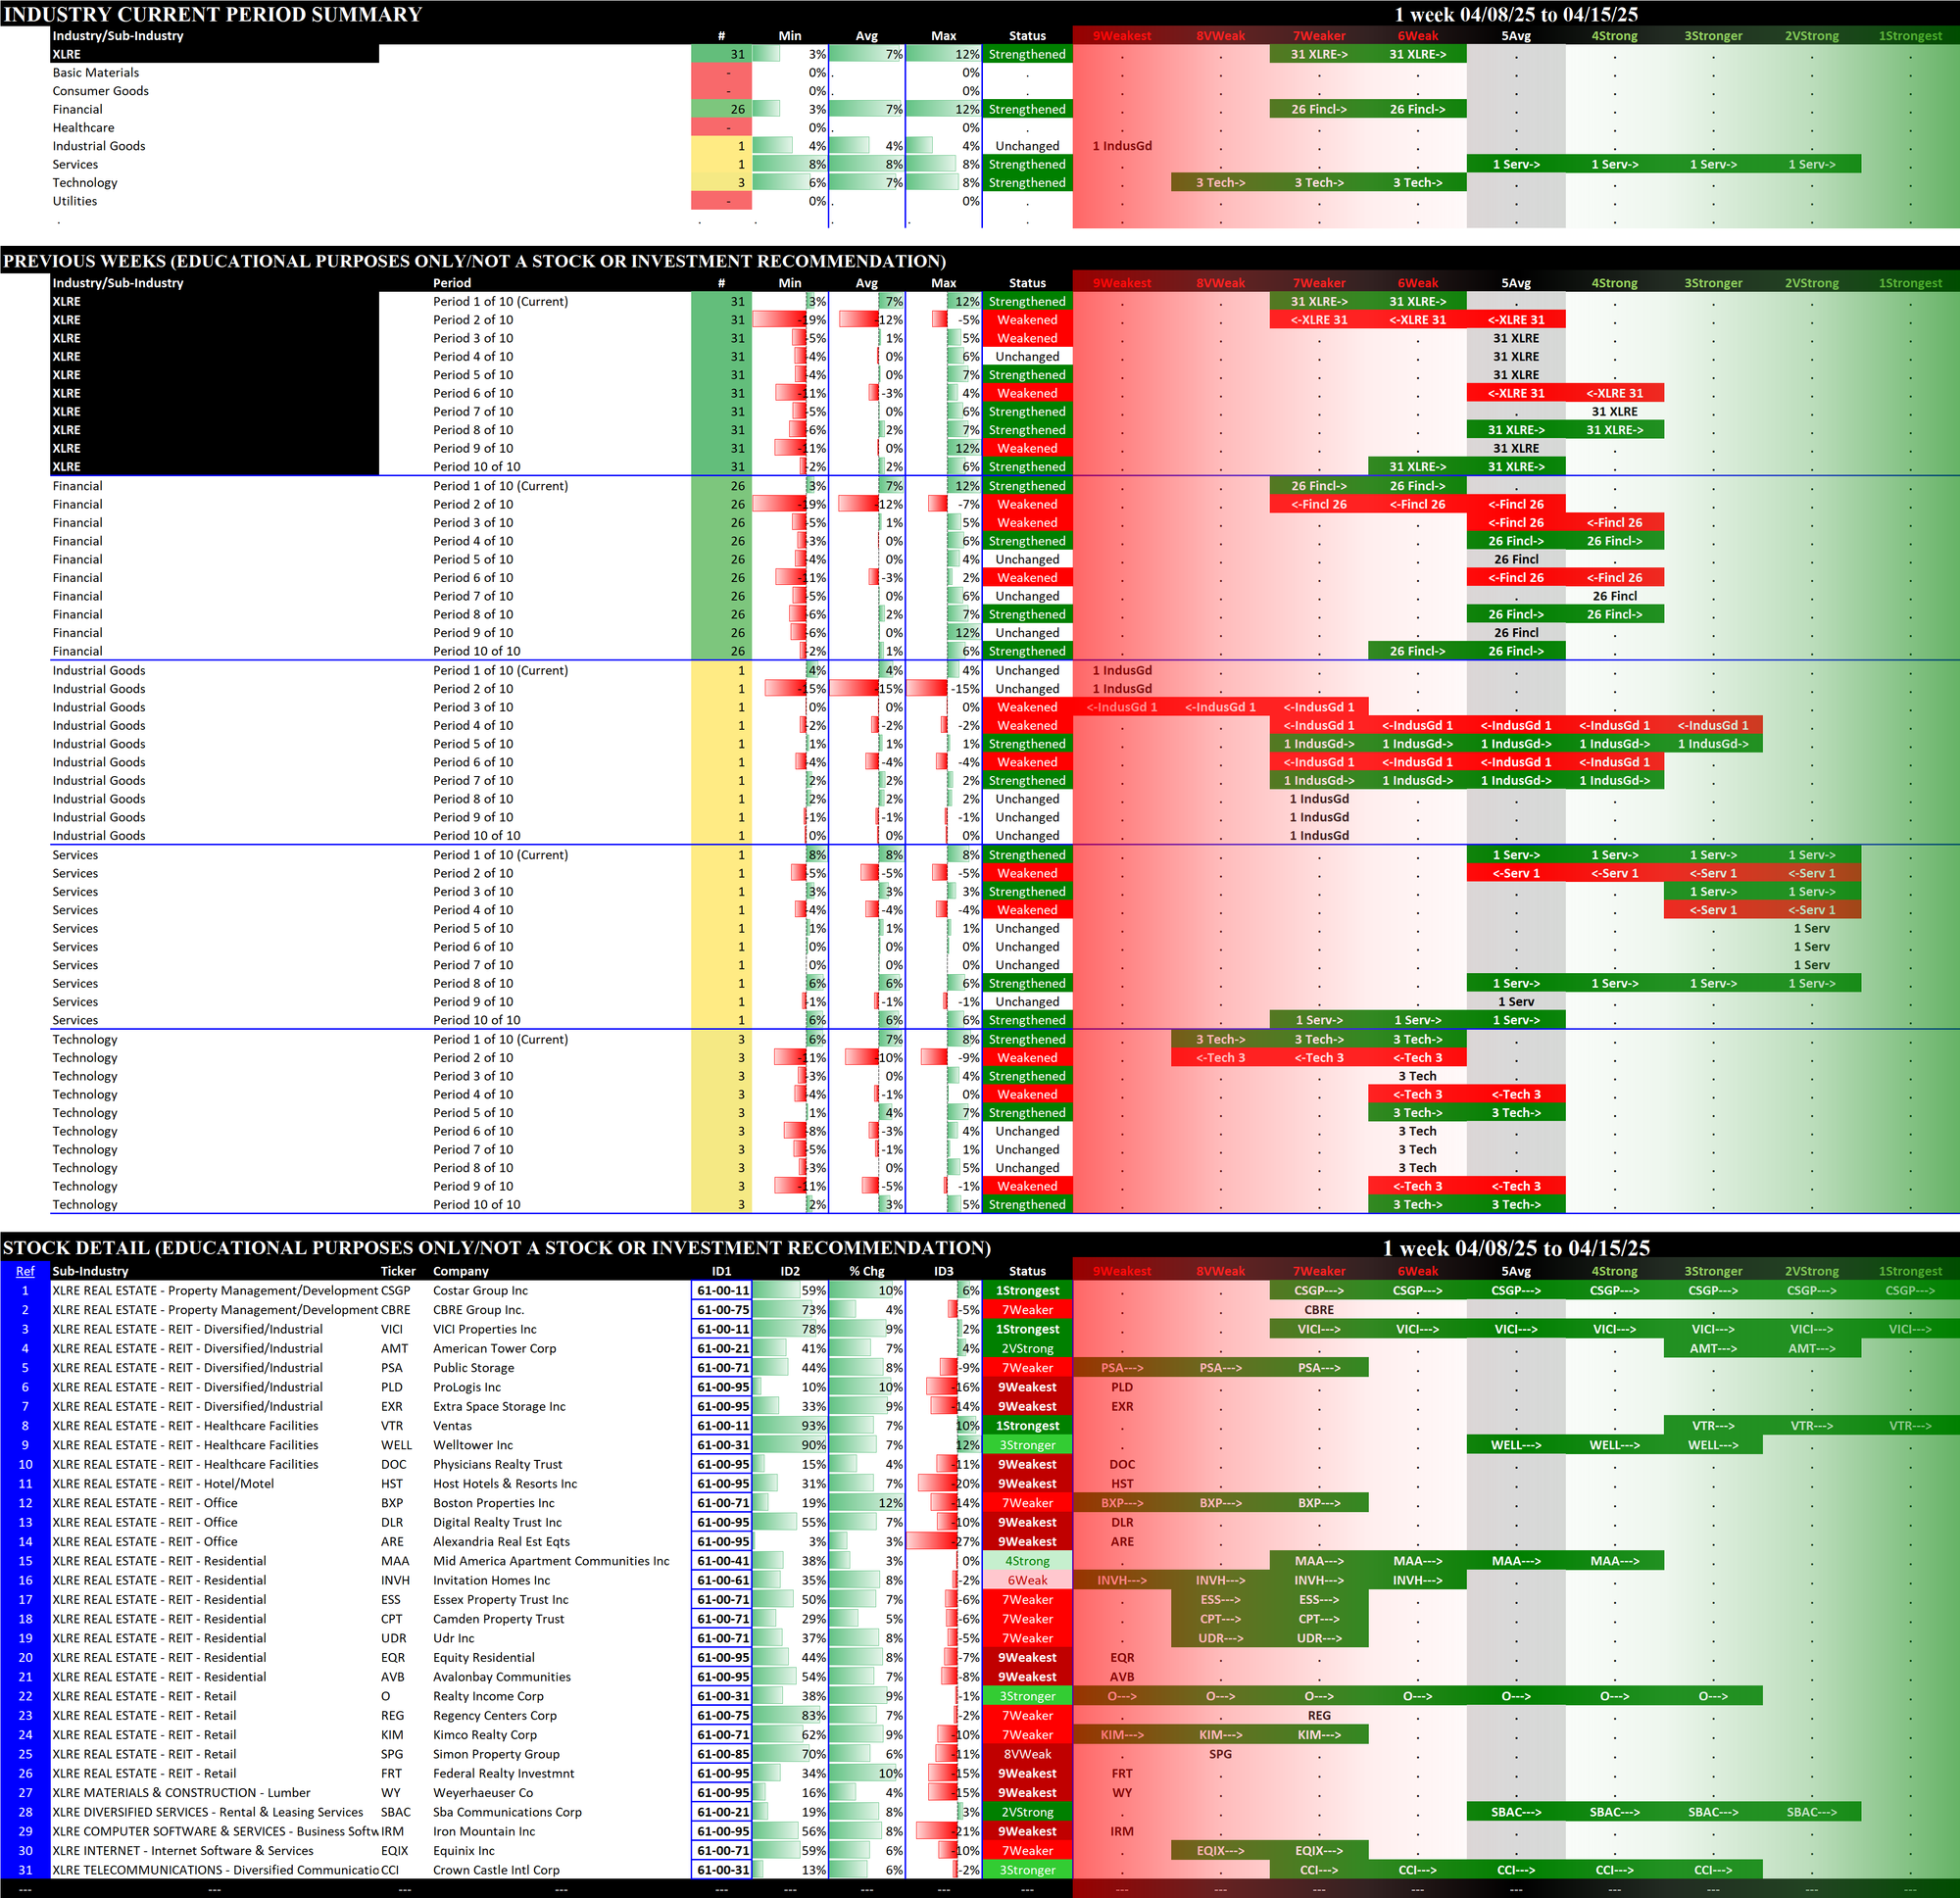
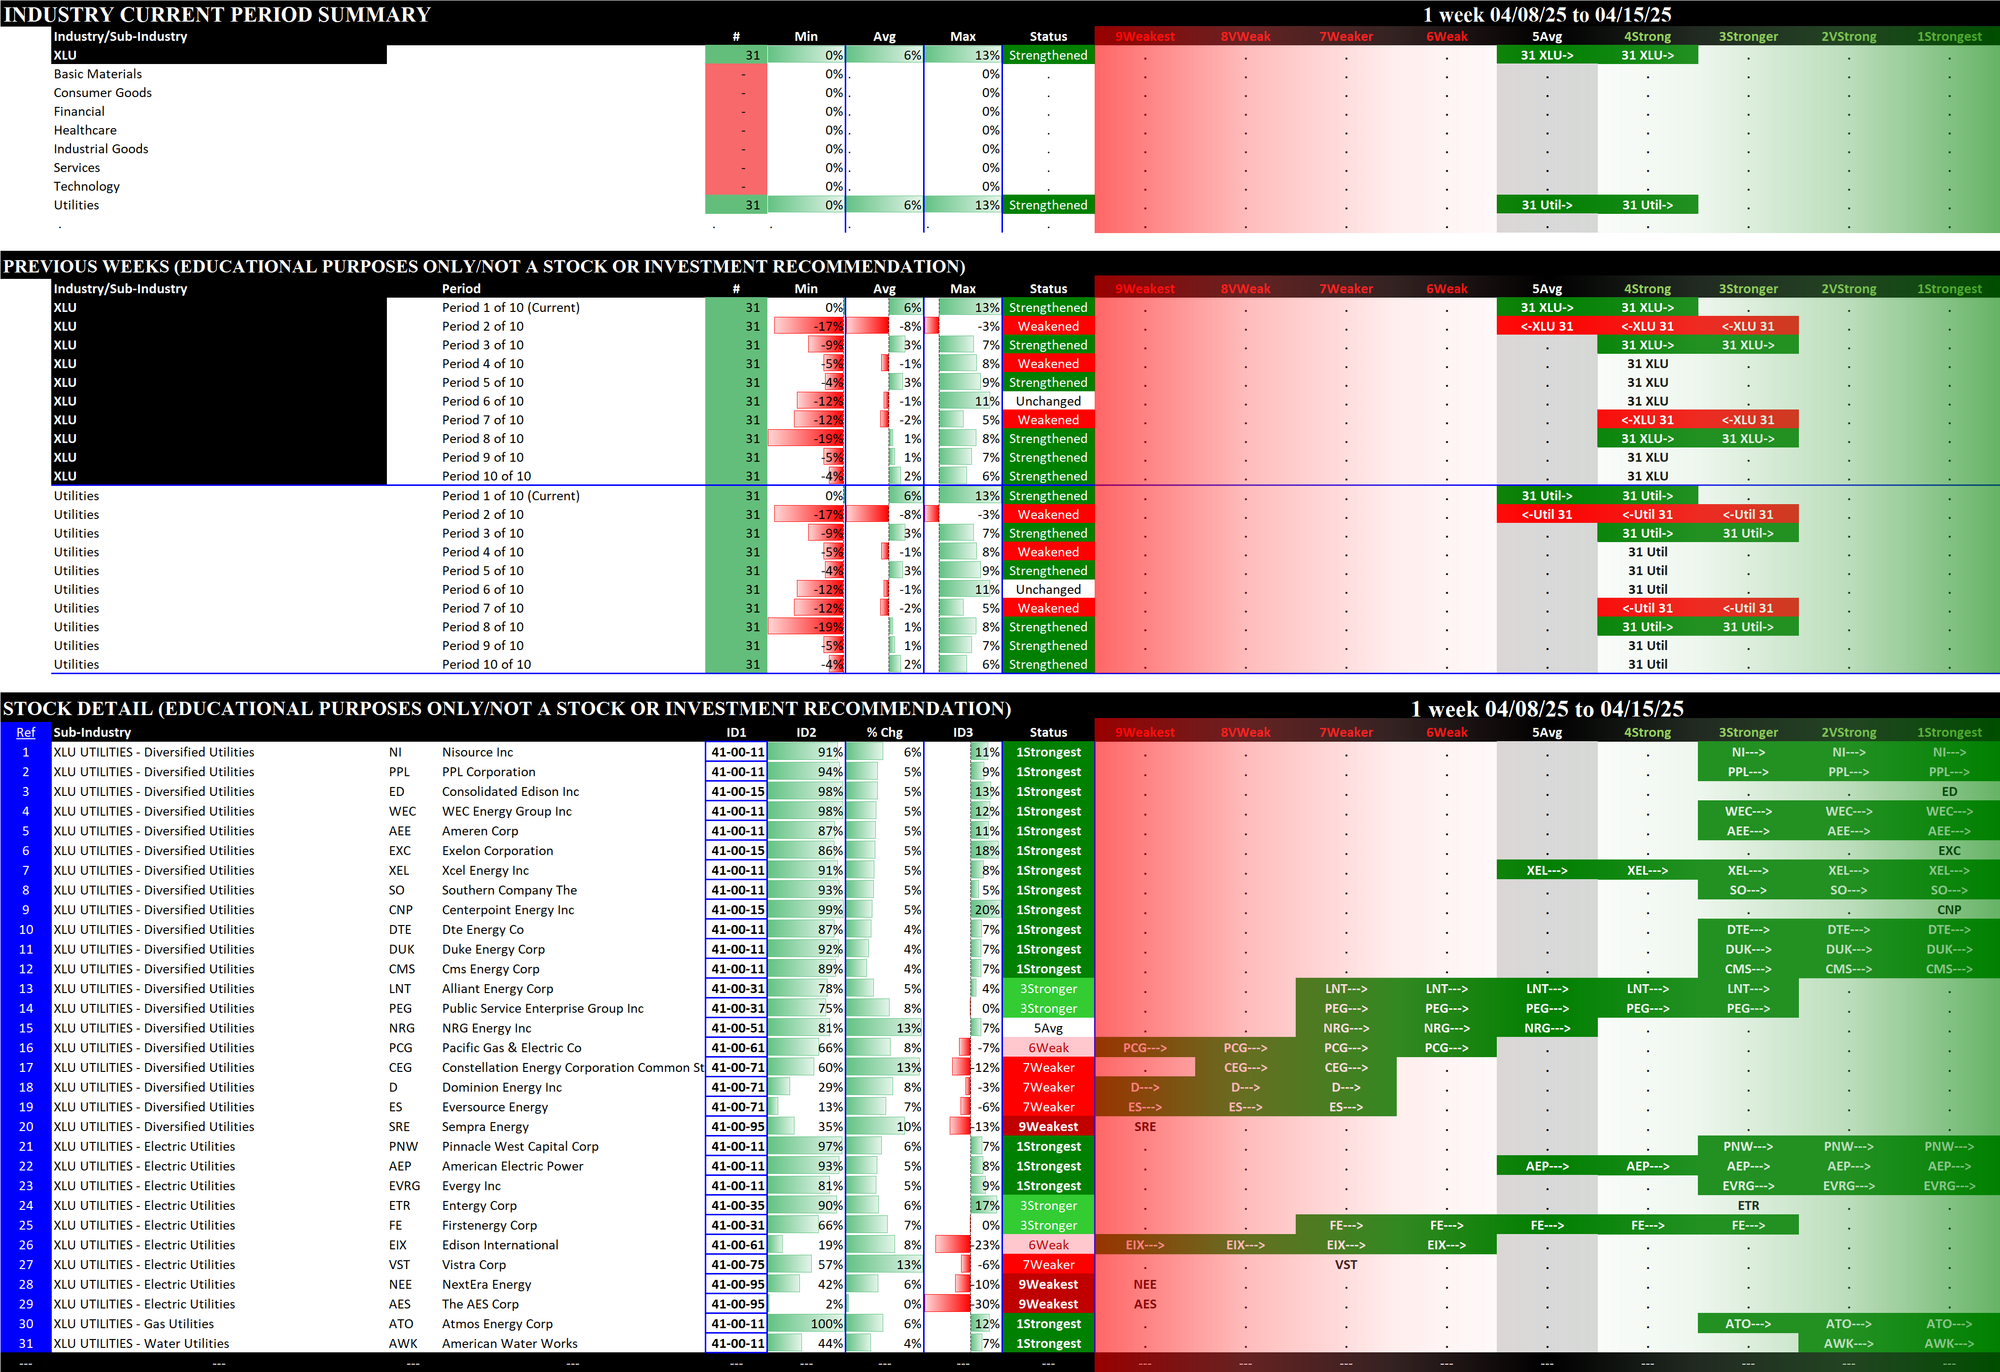
- The top section shows the strength rating of the sectors comprising each ETF, based on the eight original Stock Market Organizer classifications and NOT the 11 ETF classifications. For example, the XLB Basic Materials ETF consists of 19 Basic Materials stocks, 6 Consumer Goods stocks, and 2 Industrial Goods stocks.
- The middle section shows the previous 10 weeks' strengthening and weakening of the relevant sectors. For example, since the XLB has Basic Materials, Consumer Goods, and Industrial Goods stocks, these three sectors are shown in the middle section of the XLB detail. The XLF (Financial) has Financial, Services, and Tech stocks.
- The bottom section shows strengthening/weakening for the underlying ETF component stocks, and includes the listing of their Stock Market Organizer industries and sub-industries. These stocks are listed in order based on Sub-industry then strongest to weakest comparative stock strength rating. The Basic Materials XLB ETF includes both Newmont Corporation/NEM in the Gold sub-industry within the Metals & Mining industry and Dow Inc./DOW in the Specialty Chemicals sub-industry within the Chemicals industry.
In these bottom sections, one can visually see the strength/strengthening and weakness/weakening of the component stocks in each ETF.
2.1 XLB Materials (27 stocks, small), STRENGTHENED RATING TO 7Weaker = tied for WORST
2.2 XLC Communication Services (22 stocks, small), STRENGTHENED RATING TO 5Avg
2.3 XLE Energy (22 stocks, small), Strengthened at 7Weaker = tied for WORST
2.4 XLF Financial (72 stocks, large), STRENGTHENED RATING TO 6Weak
2.5 XLI Industrial (76 stocks, large), STRENGTHENED RATING TO 6Weak
2.6 XLK Technology (69 stocks, large), Strengthened at 7Weaker = tied for WORST
2.7 XLP Consumer Staples (38 stocks, mid-sized), STRENGTHENED RATING TO 5Avg
2.8 XLRE Real Estate (31 stocks, small/mid-sized), STRENGTHENED RATING TO 6Weak
2.9 XLU Utilities (31 stocks, small/mid-sized), STRENGTHENED RATING TO 4Strong = BEST
2.10 XLV Health Care (61 stocks, large), STRENGTHENED RATING TO 6Weak
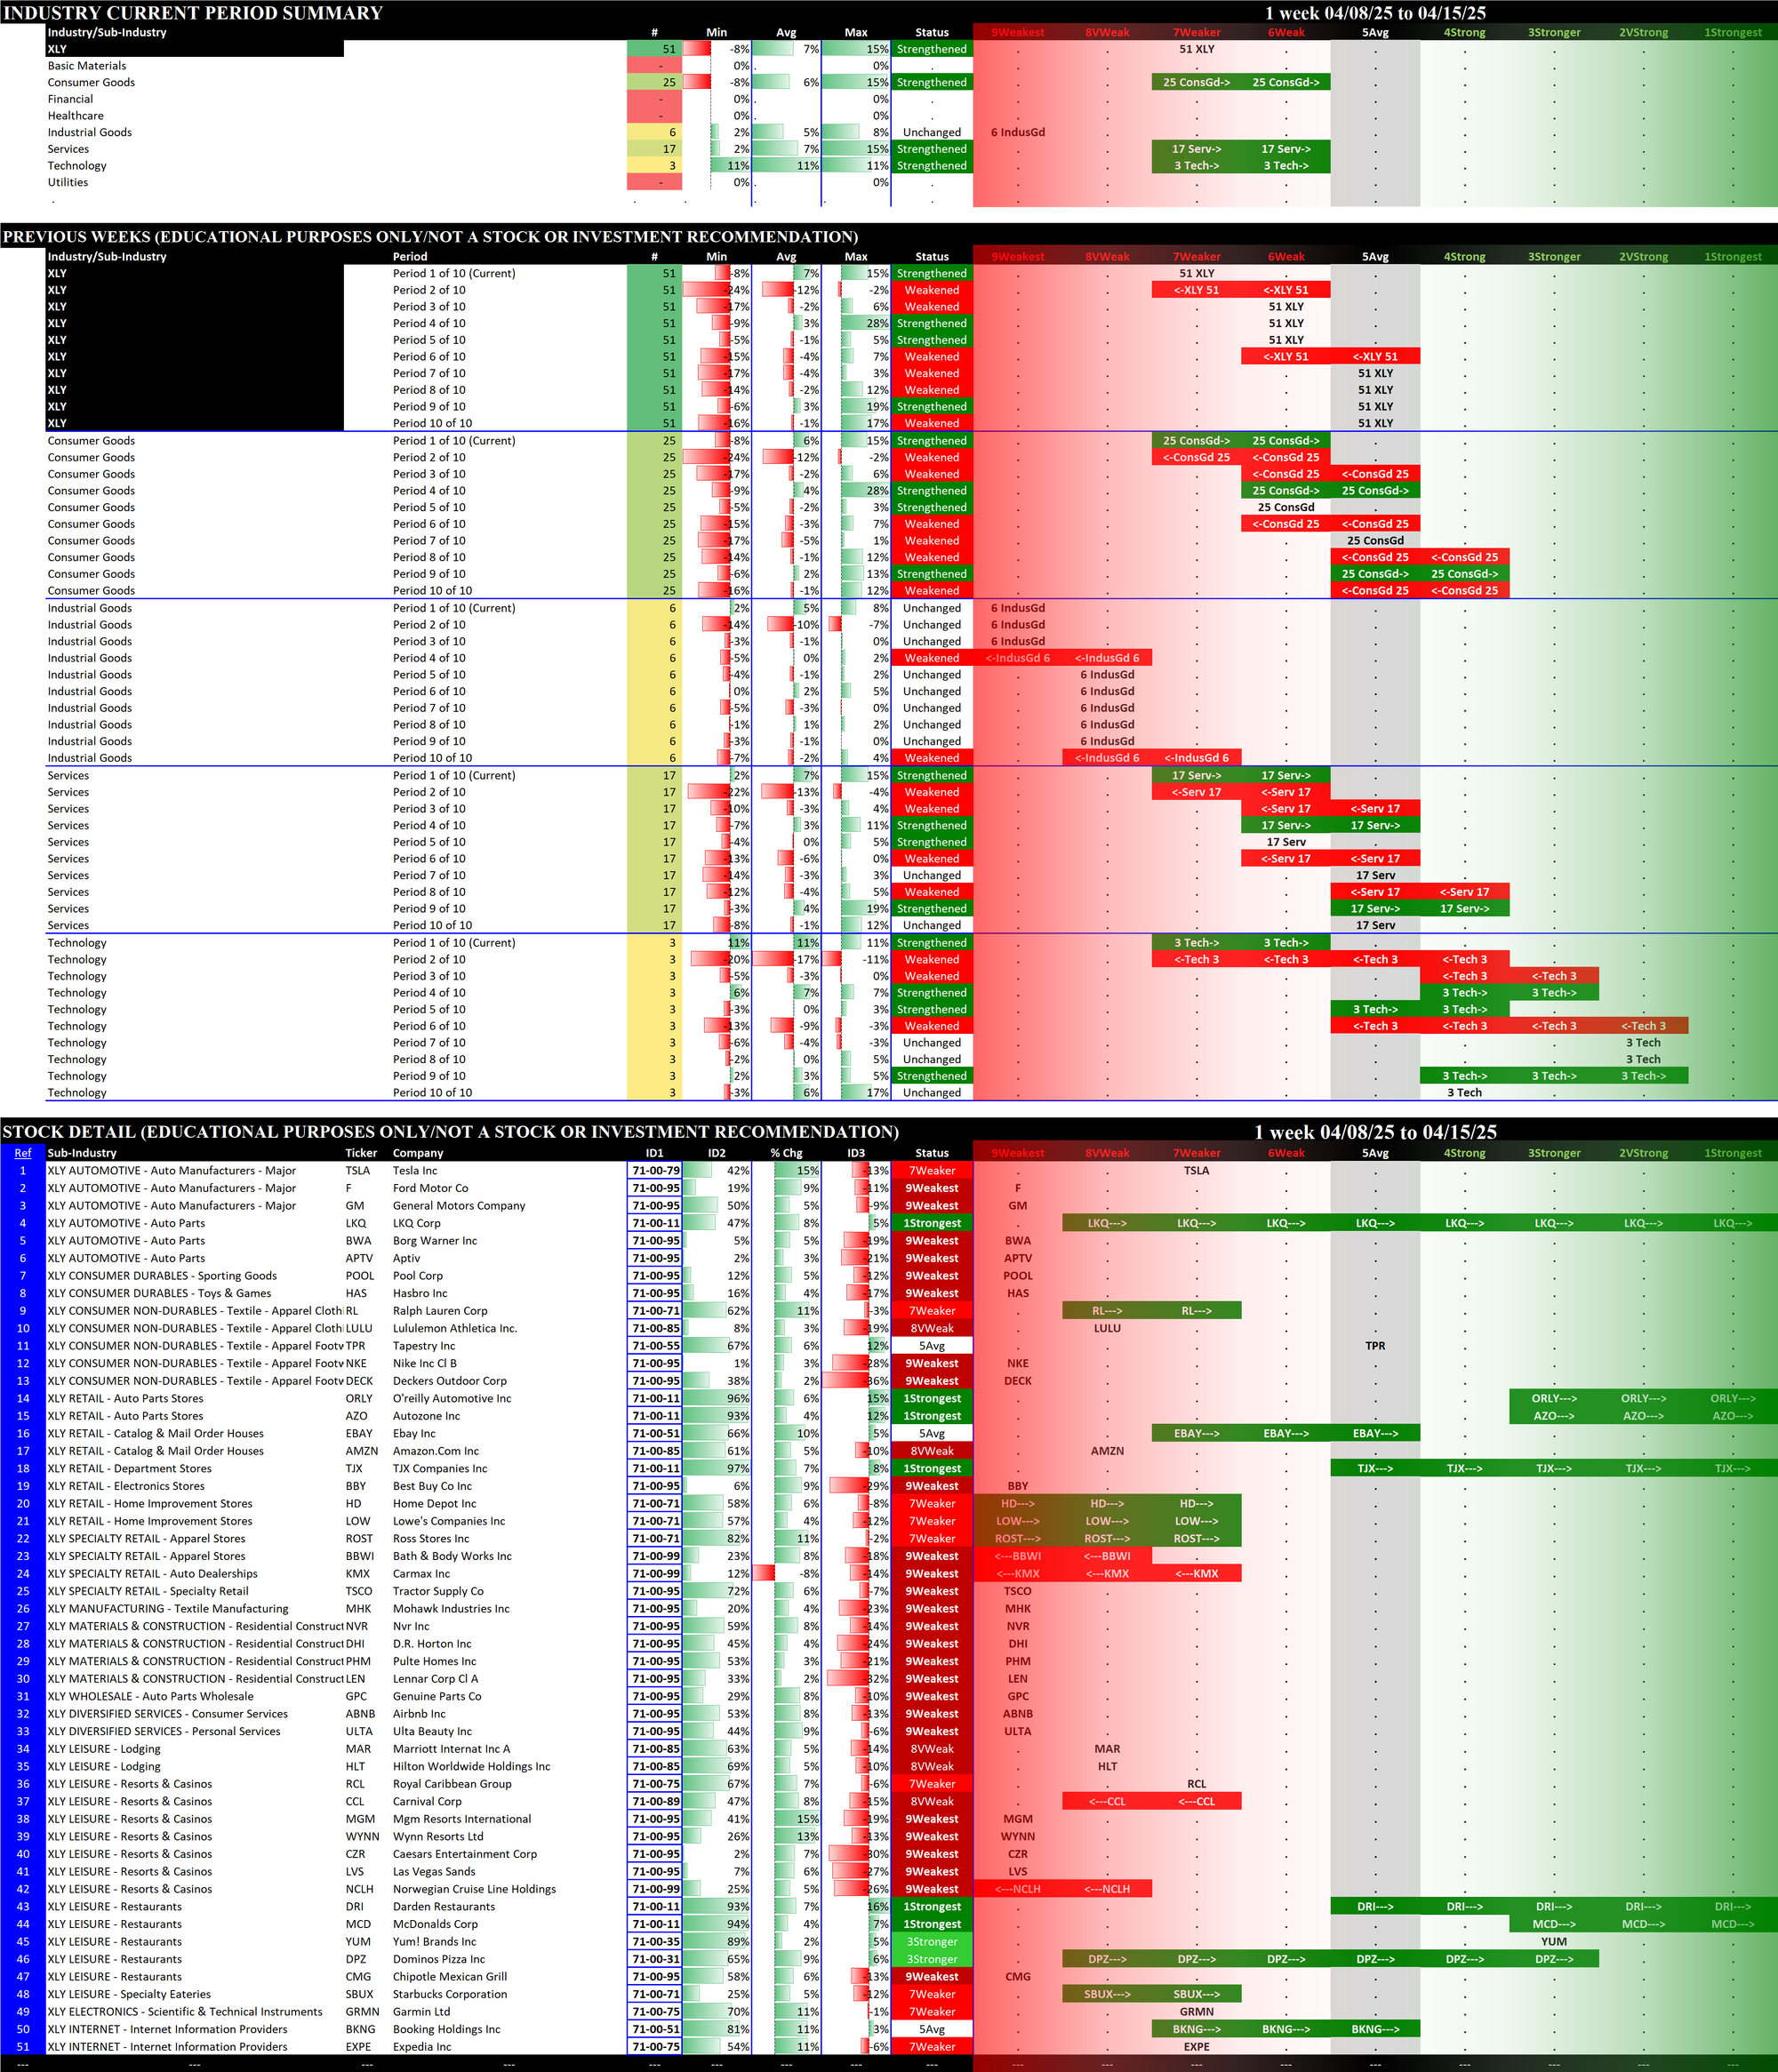
2.11 XLY Consumer Discretionary (51 stocks, mid-sized/large), Strengthened at 7Weaker = tied for WORST
3. Stock Detail
The downloadable PDF below lists all component stocks in order of first Strongest to Weakest ETF and second Strongest to Weakest Stock. The difference between this report and the 11 ETF stock listings above is this report consolidates all component stocks whereas the above listings are segregated by ETF.
Download the following Excel file if you are interested in sorting results yourself.