Software 2023-09-14: -1 to "AVERAGE" strength rating (5th strongest of 9 levels), previous move was UP
SUMMARY
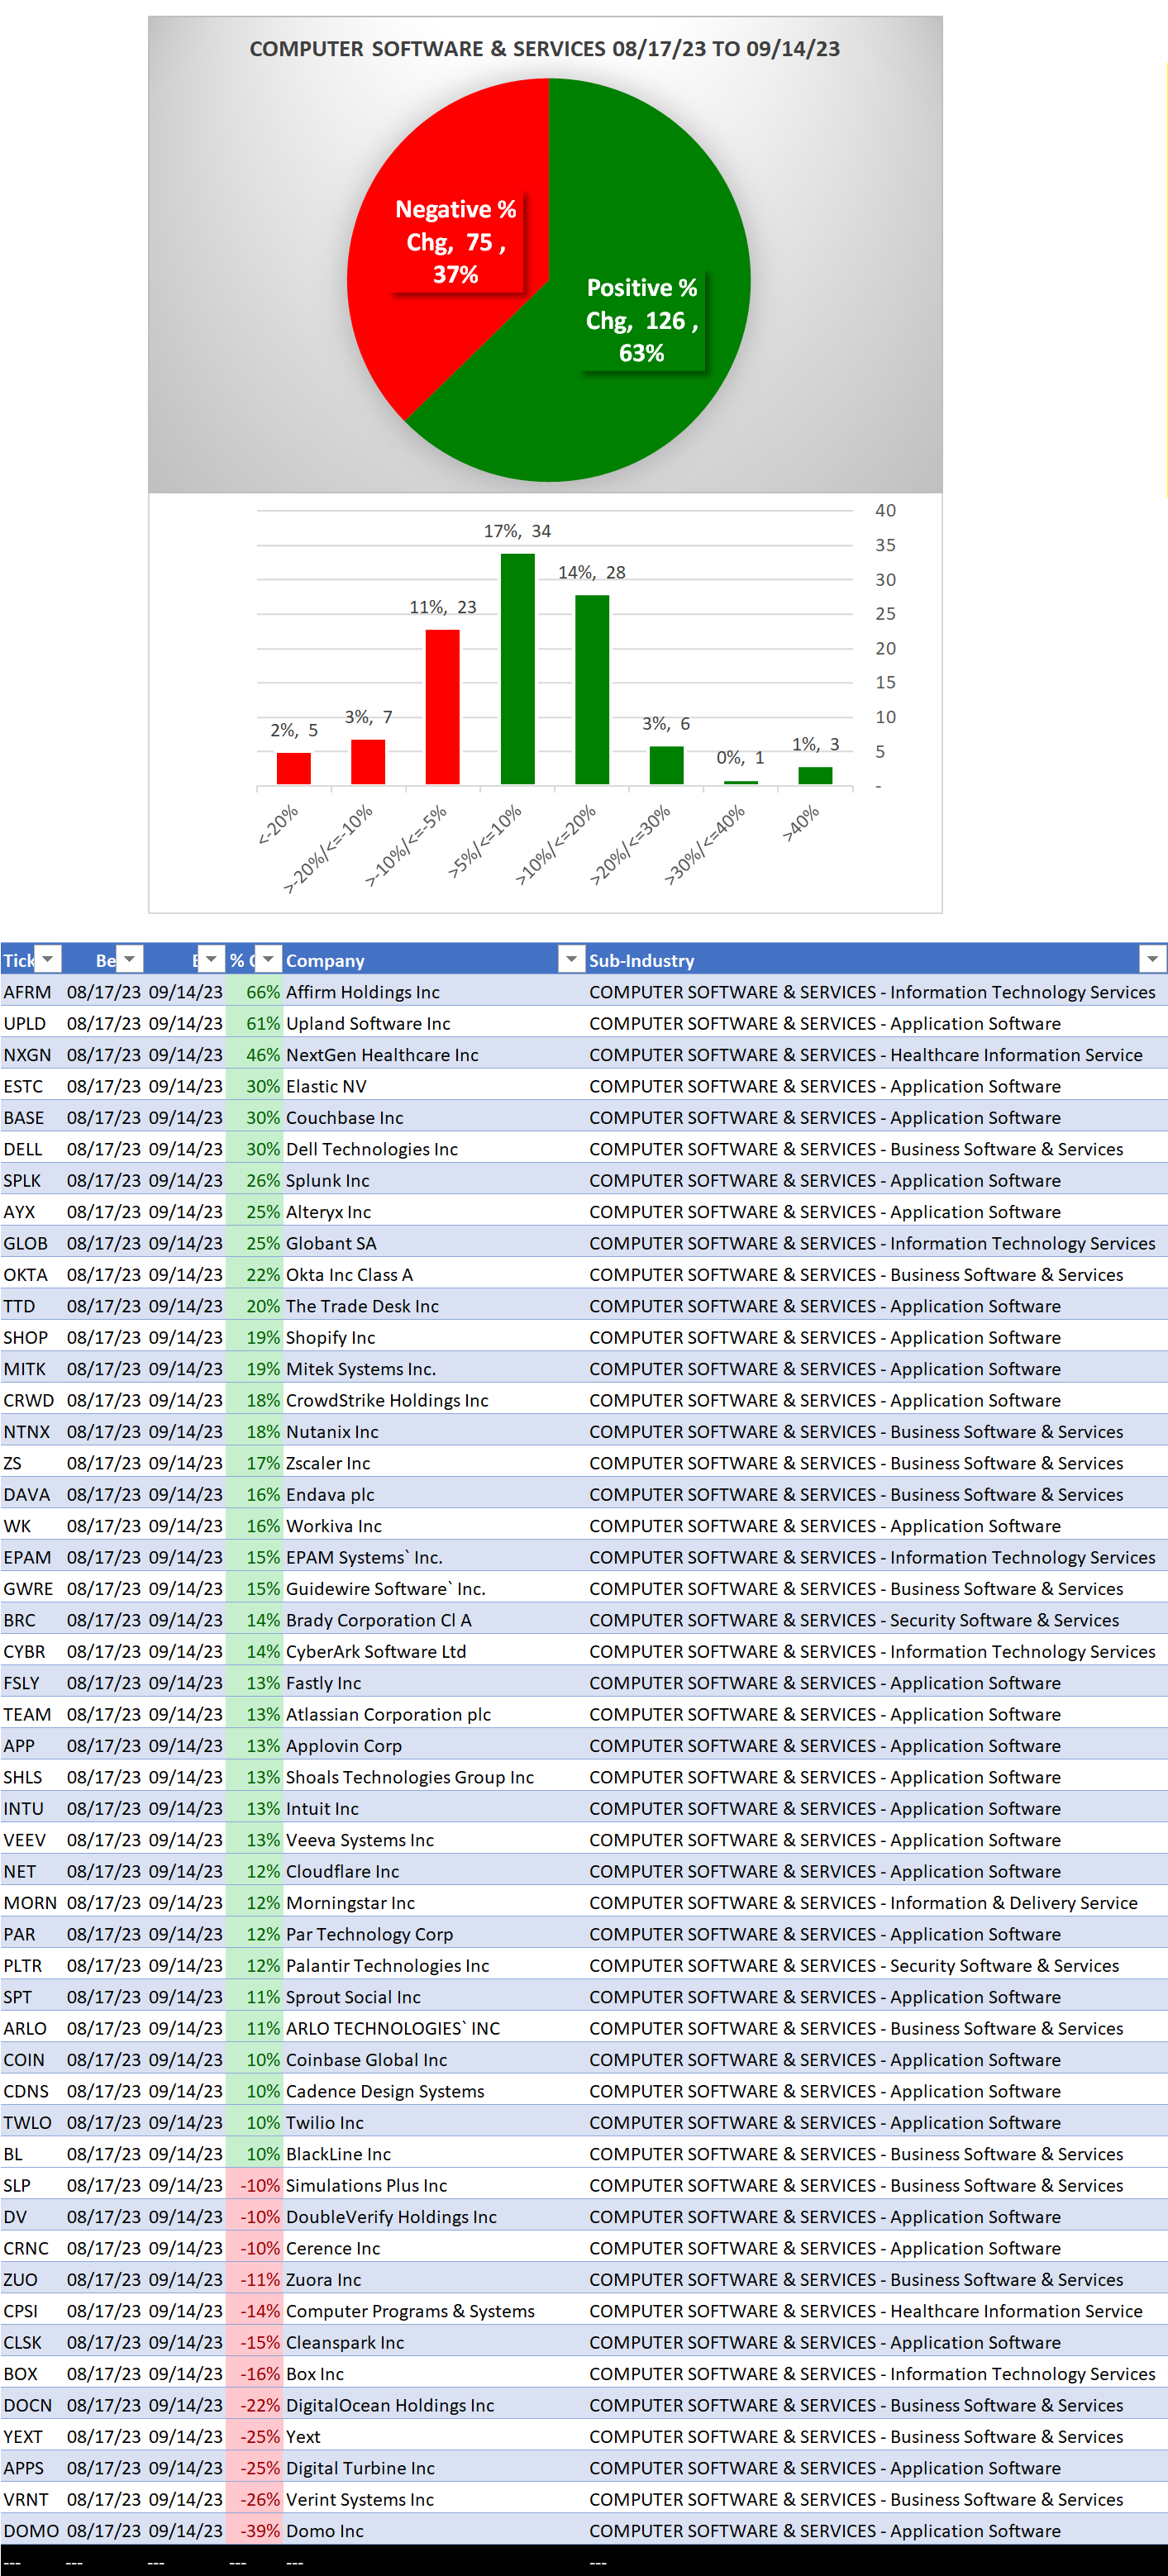
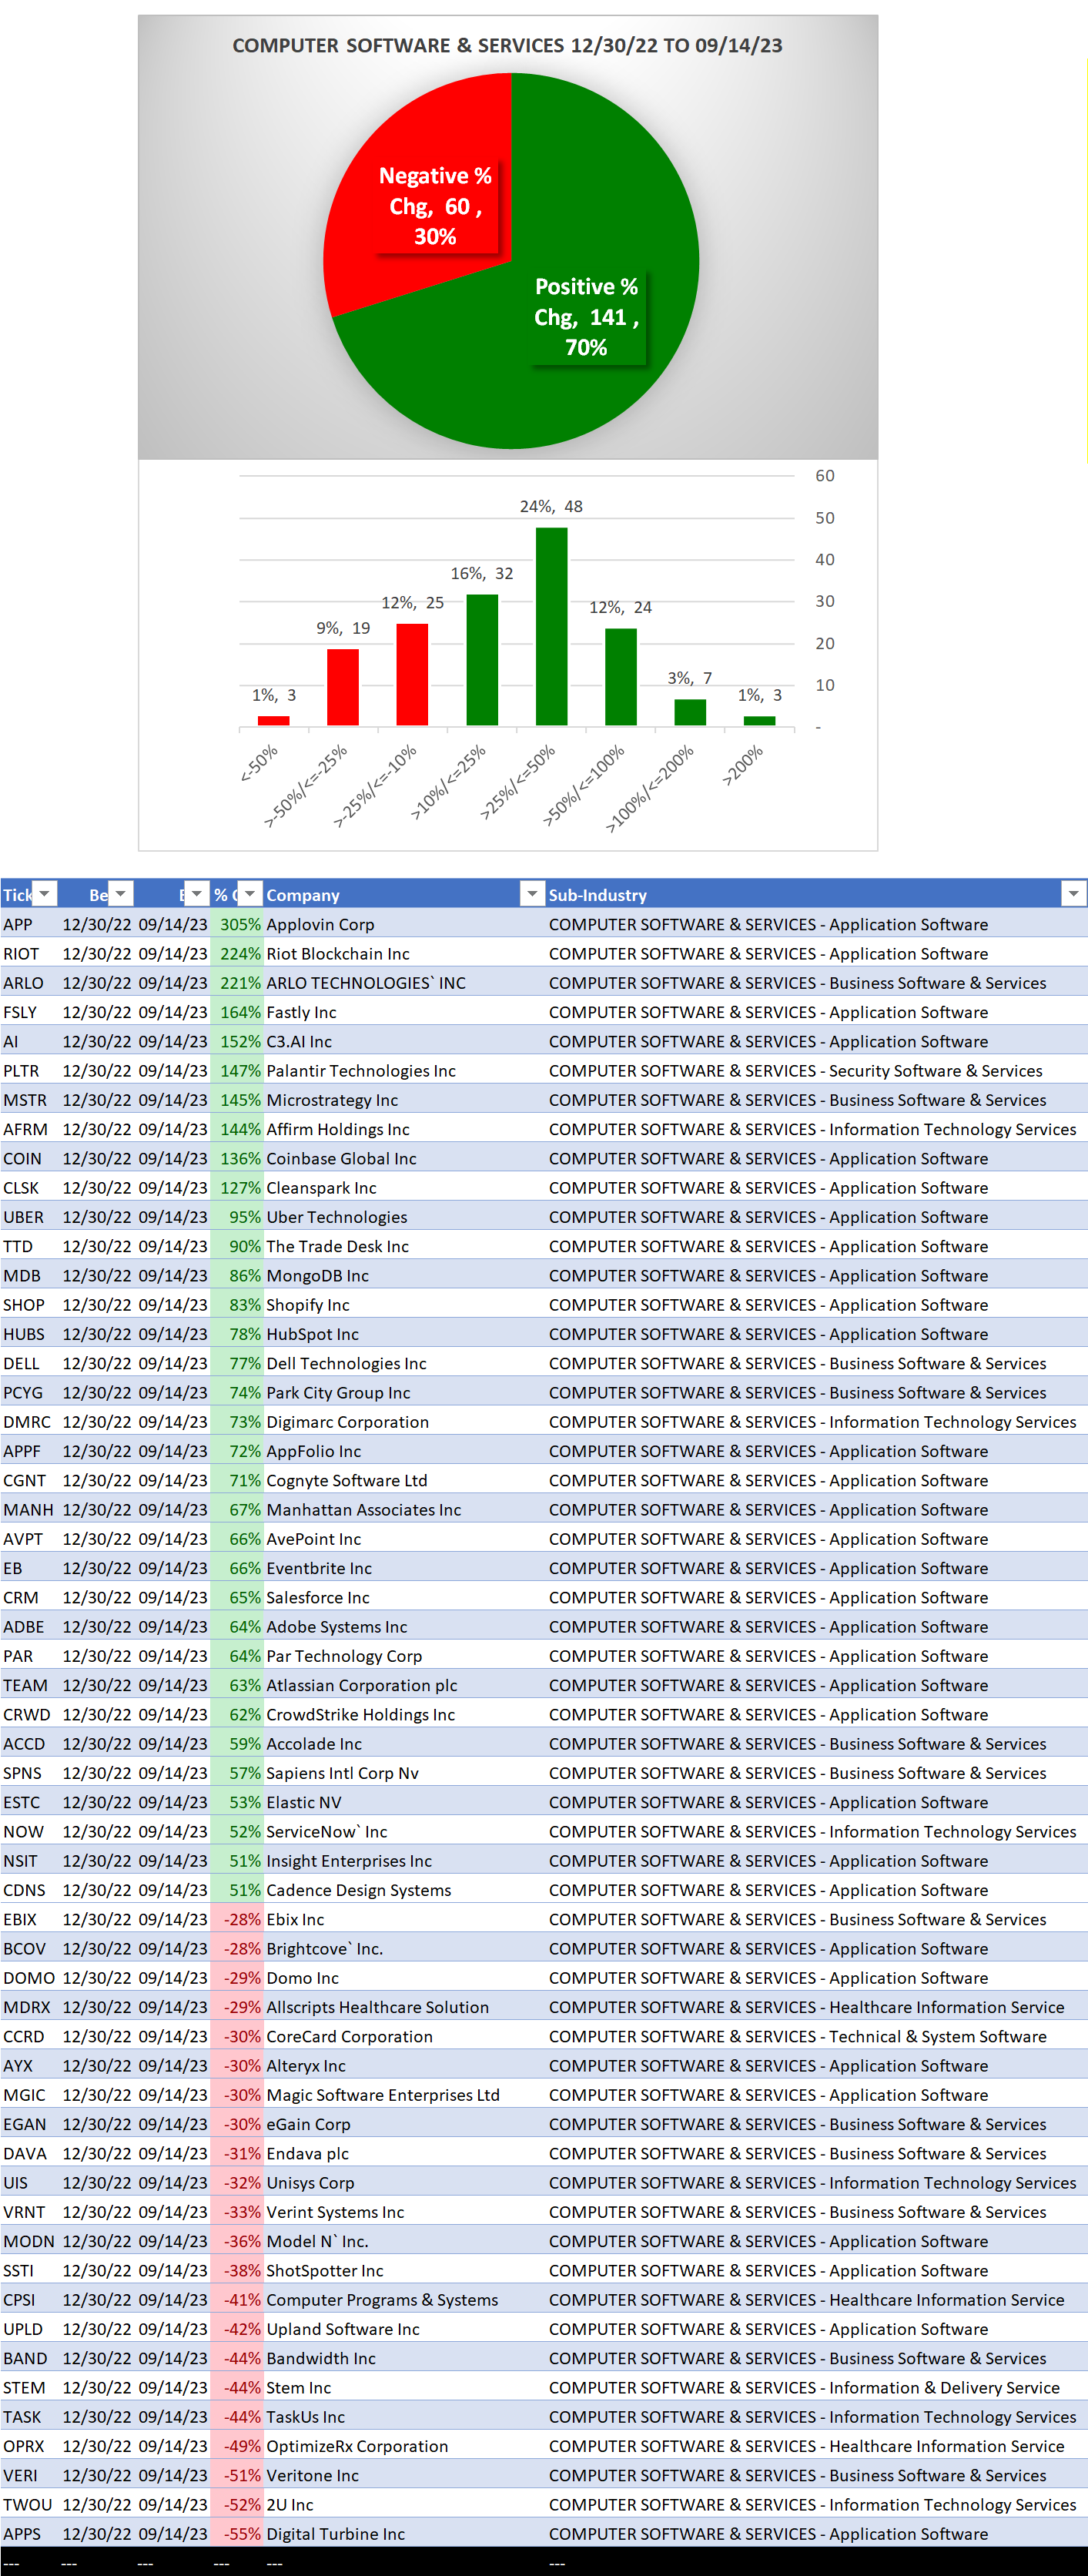
Performance
Bottom line: 7 weeks alternating between 5th/Average and 4th/Strong levels
Context: slightly weaker recently vs. YTD
- 70% positive stocks YTD
- 63% positive stocks past 4 weeks
Background
Largest of 8 Sub-industries (201 stocks total):
- 94 stocks Application Software
- 48 stocks Business Software & Services
- 25 stocks Information Technology & Services
10 Biggest Market Cap stocks: MSFT, ORCL, ADBE, CRM, ACN, INTU, IBM, NOW, ADP, UBER
DETAIL: 1 week review, YTD/4 weeks lookbacks
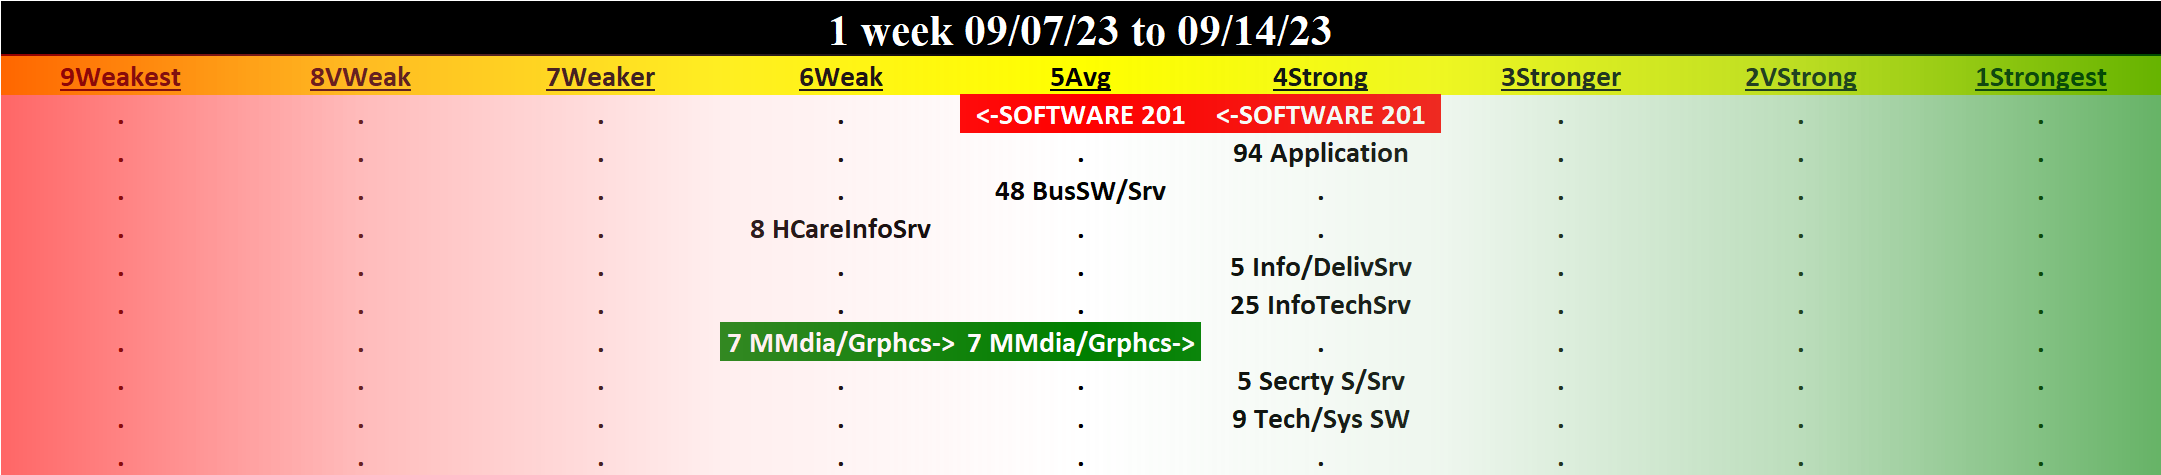
1 Week Review
Strengthened: 1/8 sub-industries
Weakened: 0/8 sub-industries
Strongest at Strong/4th strongest (of 9 levels) rating: tie
- Application Software
- Information & Delivery Service
- Information Technology Services
- Security Software & Services
- Technical & System Software
Weakest at Weak/6th strongest rating: Healthcare Information Service
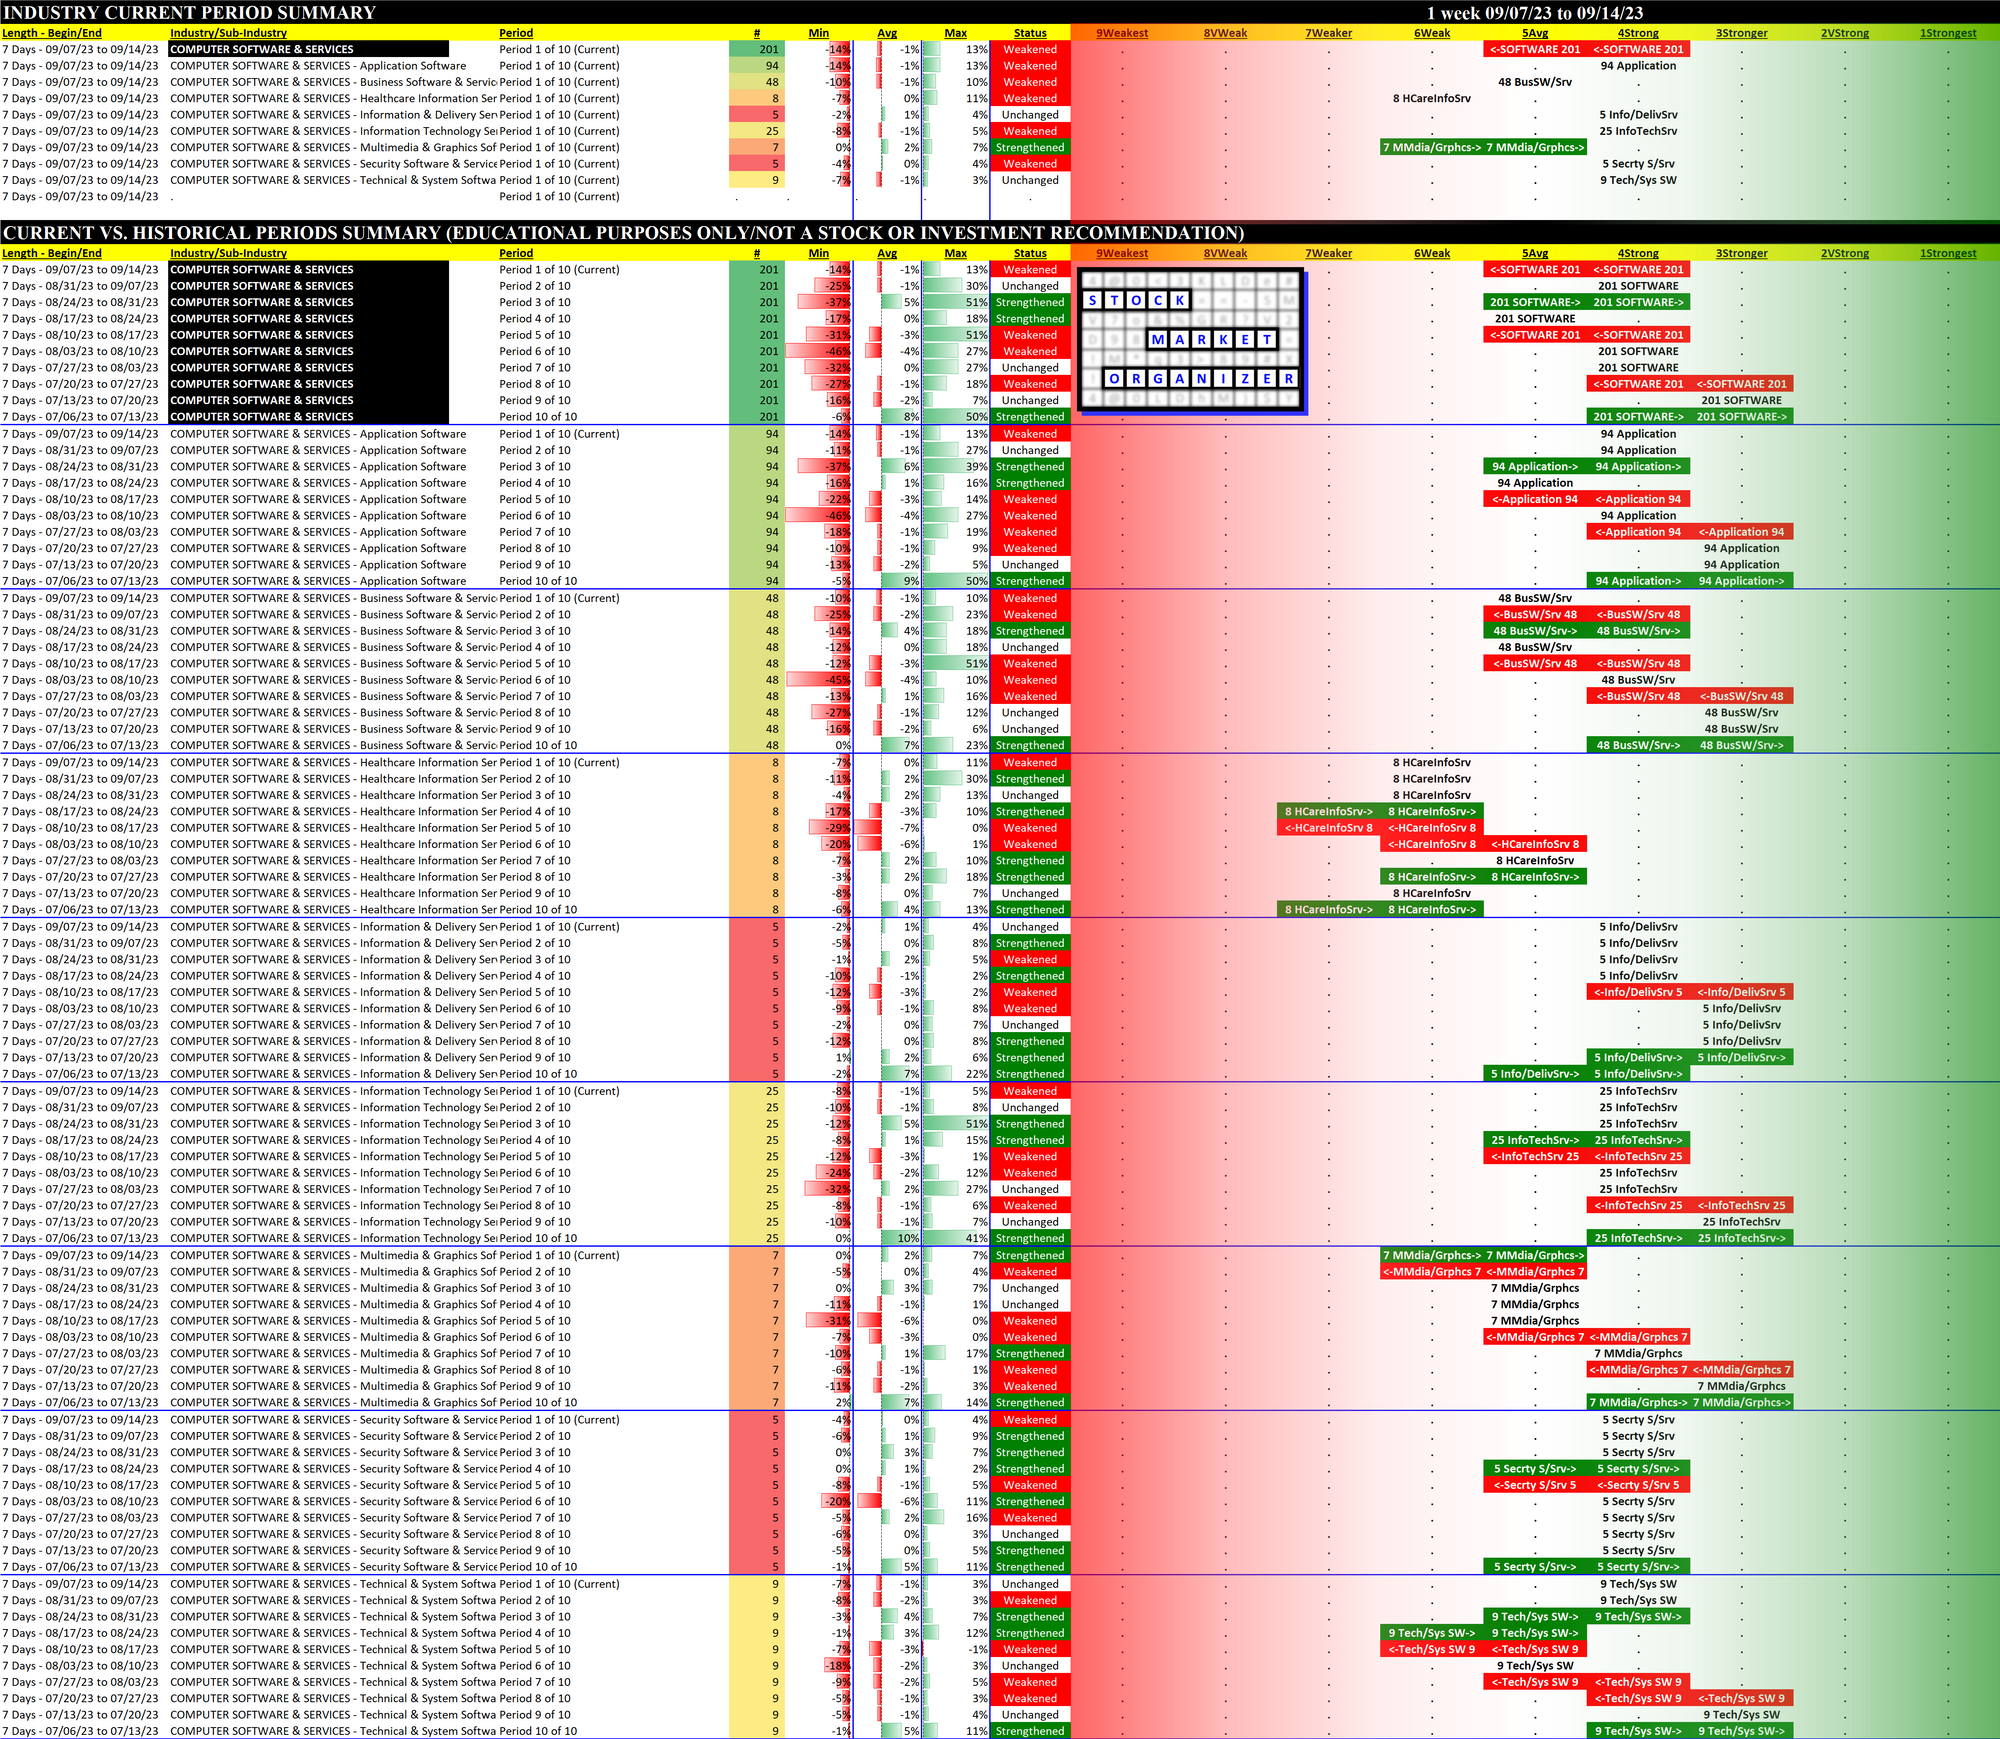
10-Week Week-by-Week Industry/Sub-industry Strength Comparison
What: recent week-by-week strength changes for the industry and each underlying sub-industry
Why: objective measurement of strengthening and weakening enabling comparison within and across industries and sub-industries
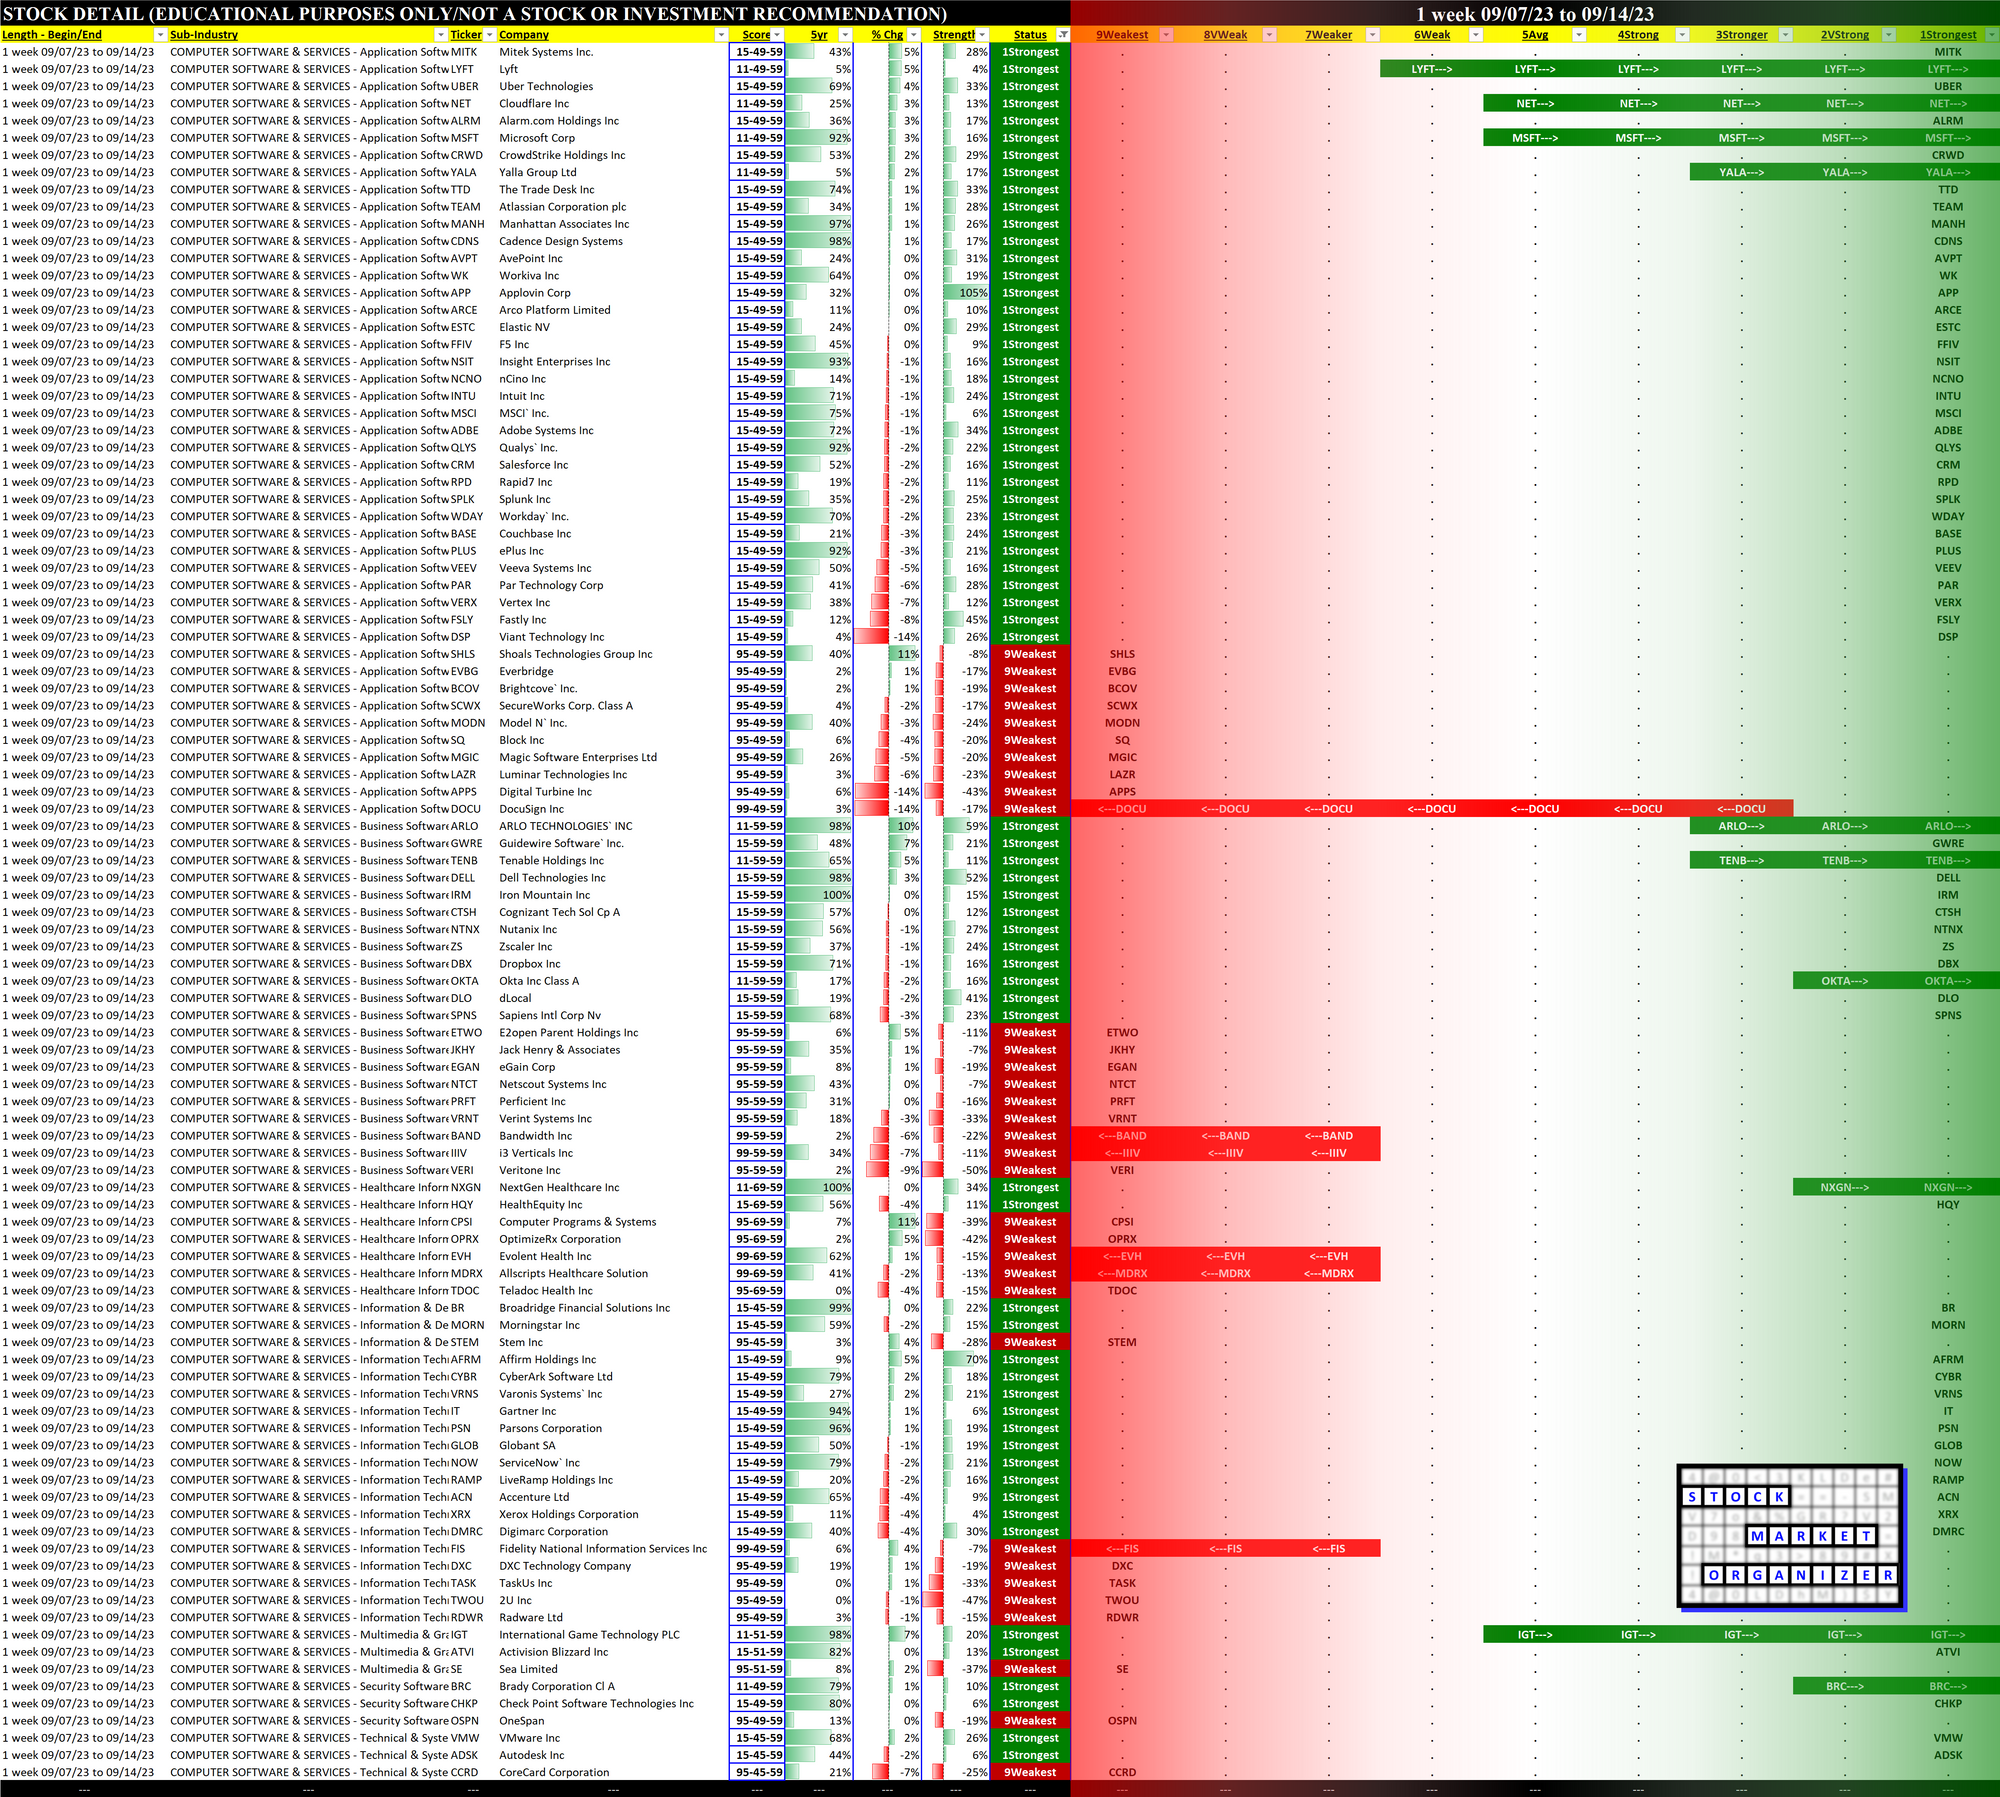
Strongest and Weakest Stocks
What: stocks currently rated Strongest/Weakest (highest/lowest of 9 strength ratings)
Why: most interesting stocks for available capital because
- the Strongest may be meme-stock mania candidates prone to breakouts, and
- the Weakest may be prone to large bottom-fishing/short-covering-driven pops... and may also be primed for bigger and faster falls. (Not guaranteed and not a recommendation - weak stocks in weakening sub-industries may be better shorts than high-flyers.)
YTD Lookback
4 Weeks Lookback