SMO Exclusive: U.S. Stock Market Strength Report 2024-07-19 (no new Shorts)

Here’s your unique, strength-focused U.S. stock market overview as of/for the week ending 7/19/24. Do you want to know if current sub-industry, industry, sector, and market tides are currently helping or hindering your stocks of interest? Answers attached.
Why read this report from a nobody outsider vs. those from big-name institutional managers and experts? Because
🔹 It is 100% original with 0% bias, 0% emotions, 0% feelings, 0% judgments, 0% opinions, and 0% predictions.
- You cannot find this analysis anywhere else and my personal thoughts play no role in the output.
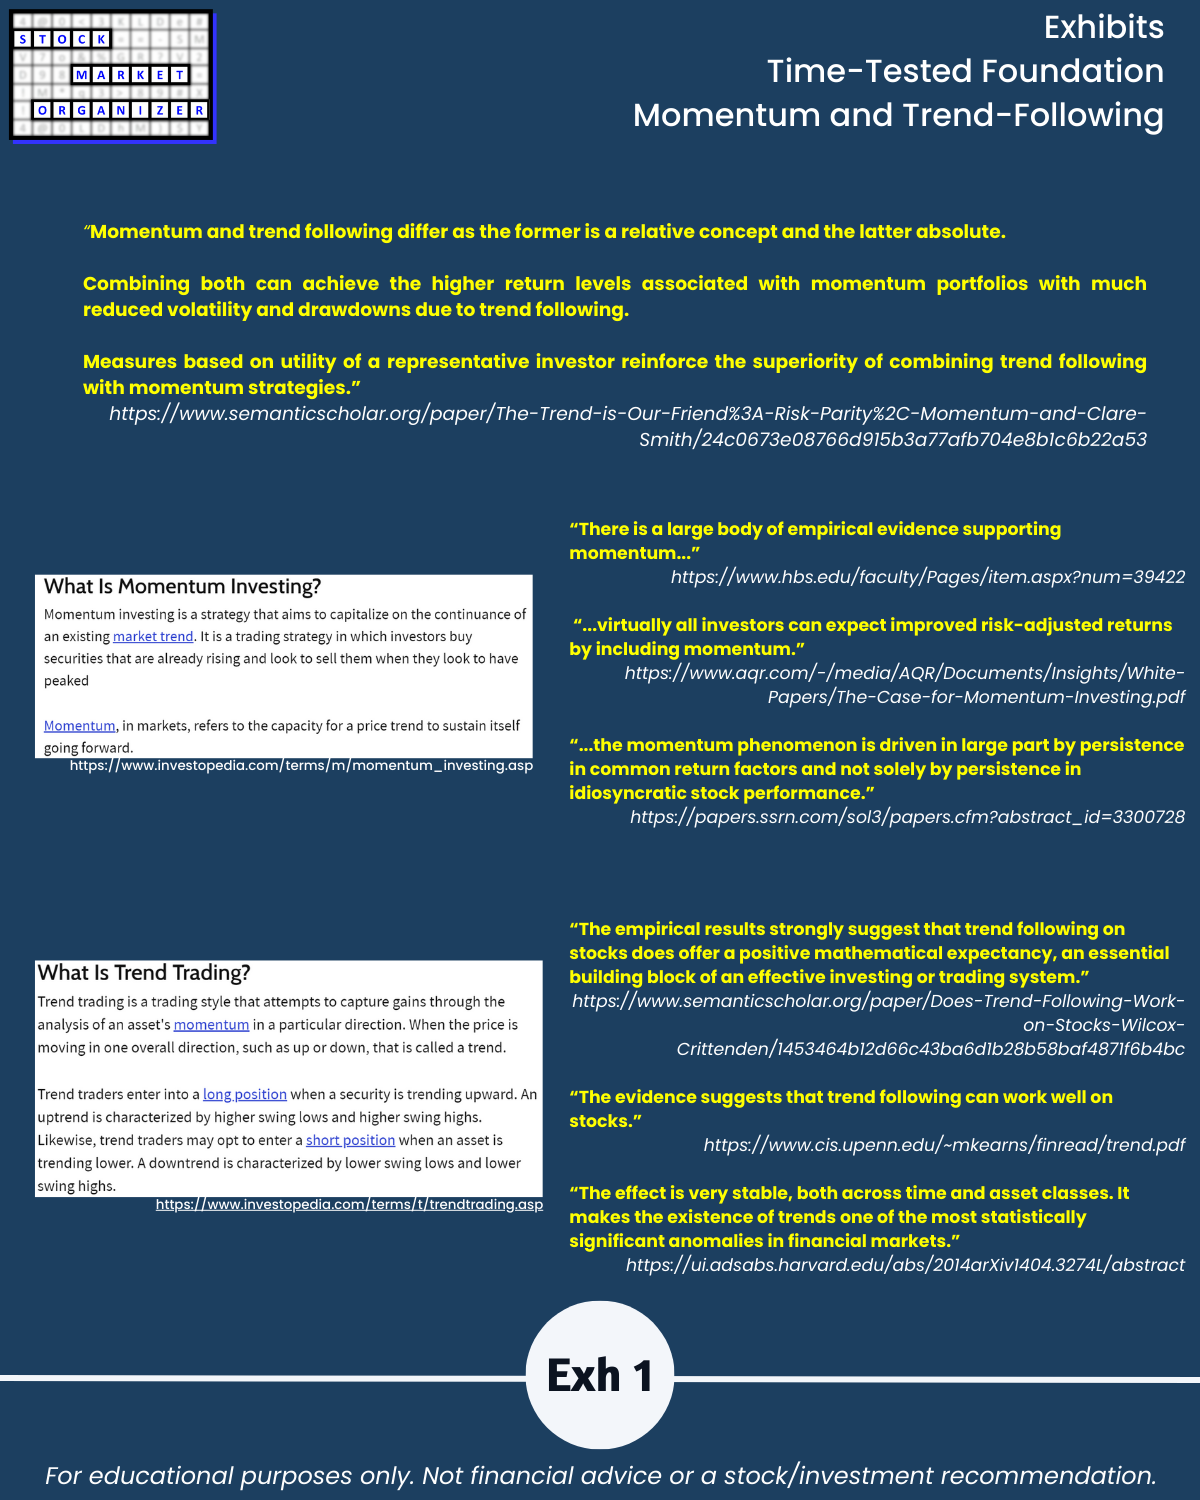
🔹 It systematically and objectively translates daily action into unique strength-focused and actionable insights for anyone interested in the U.S. stock market, founded upon the time-tested concepts of momentum and trend-following.
- The underlying analysis was created to provide meaningful answers to the questions “what is happening in the market now and what do I do about it?”
🔹 It leverages multiple indisputable truths based on the concept that the market does not have to be so complicated:
- The stronger your stocks, the greener your portfolio.
- Market conditions matter – most stocks rise and fall with the market.
- The multi-month rally begins with one up week.
- The journey to 100%+ returns begins with 10% returns.
Too simplistic? Some will think that. My reply remains… the market does not have to be so complicated.
DID YOU KNOW?
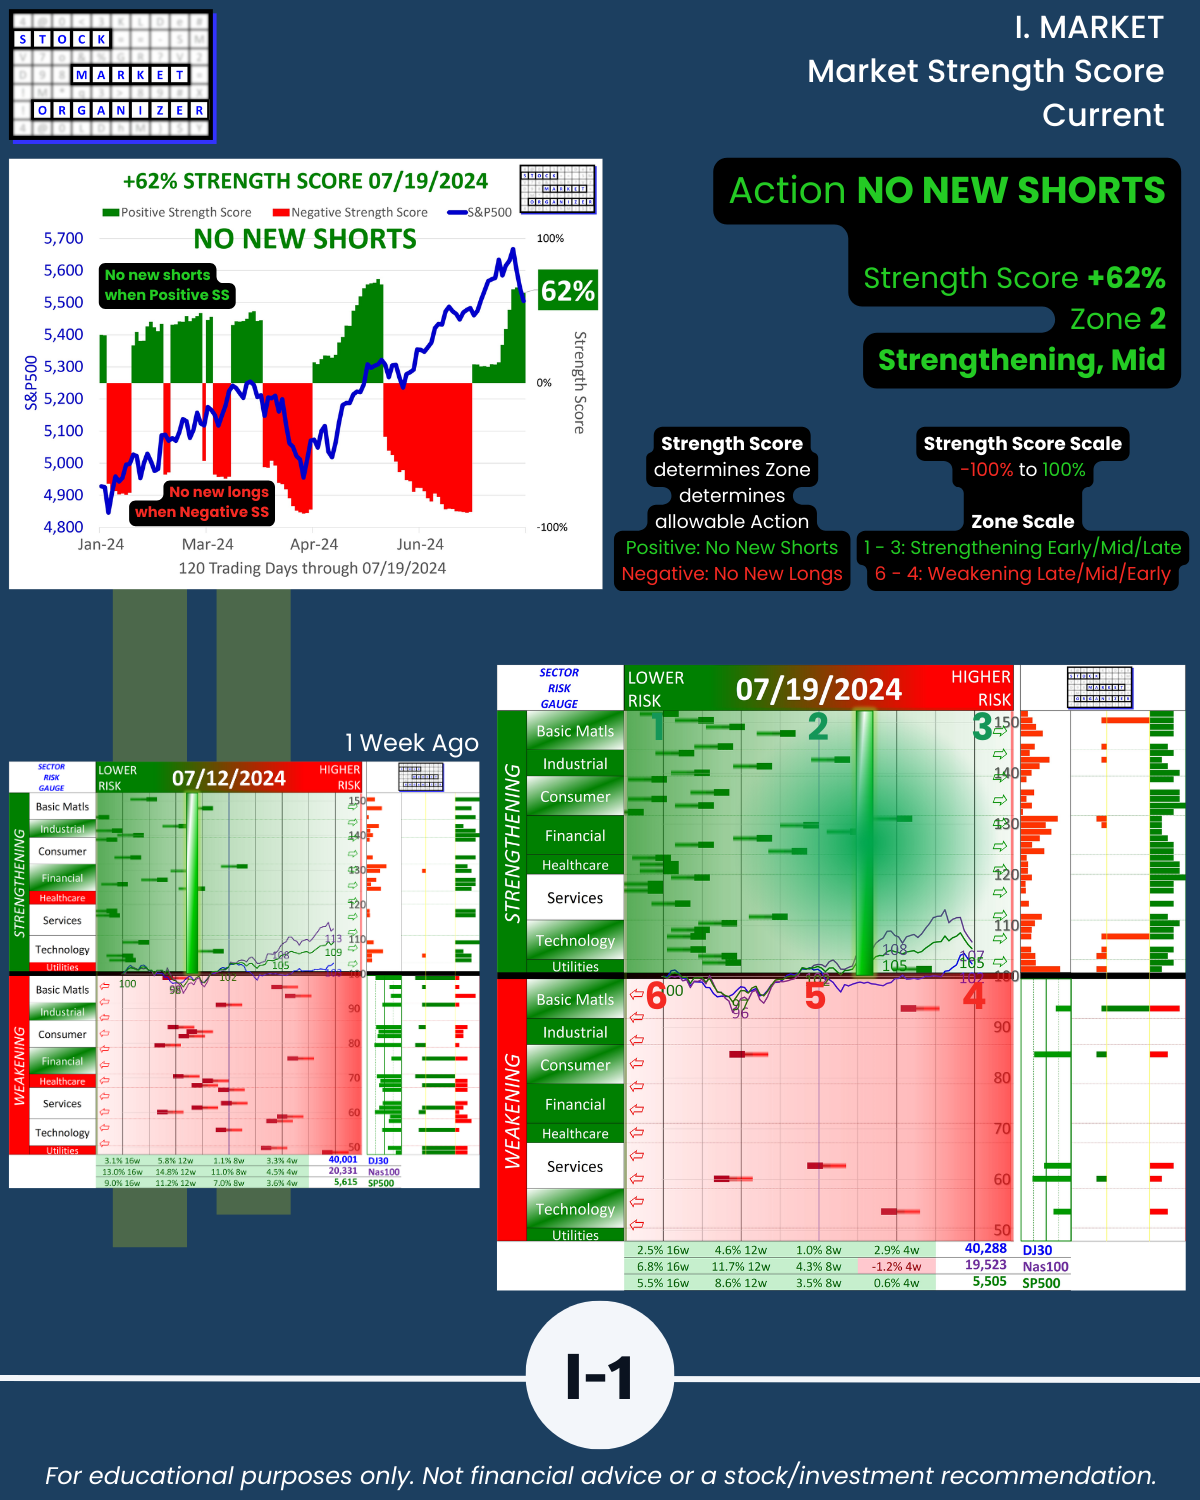
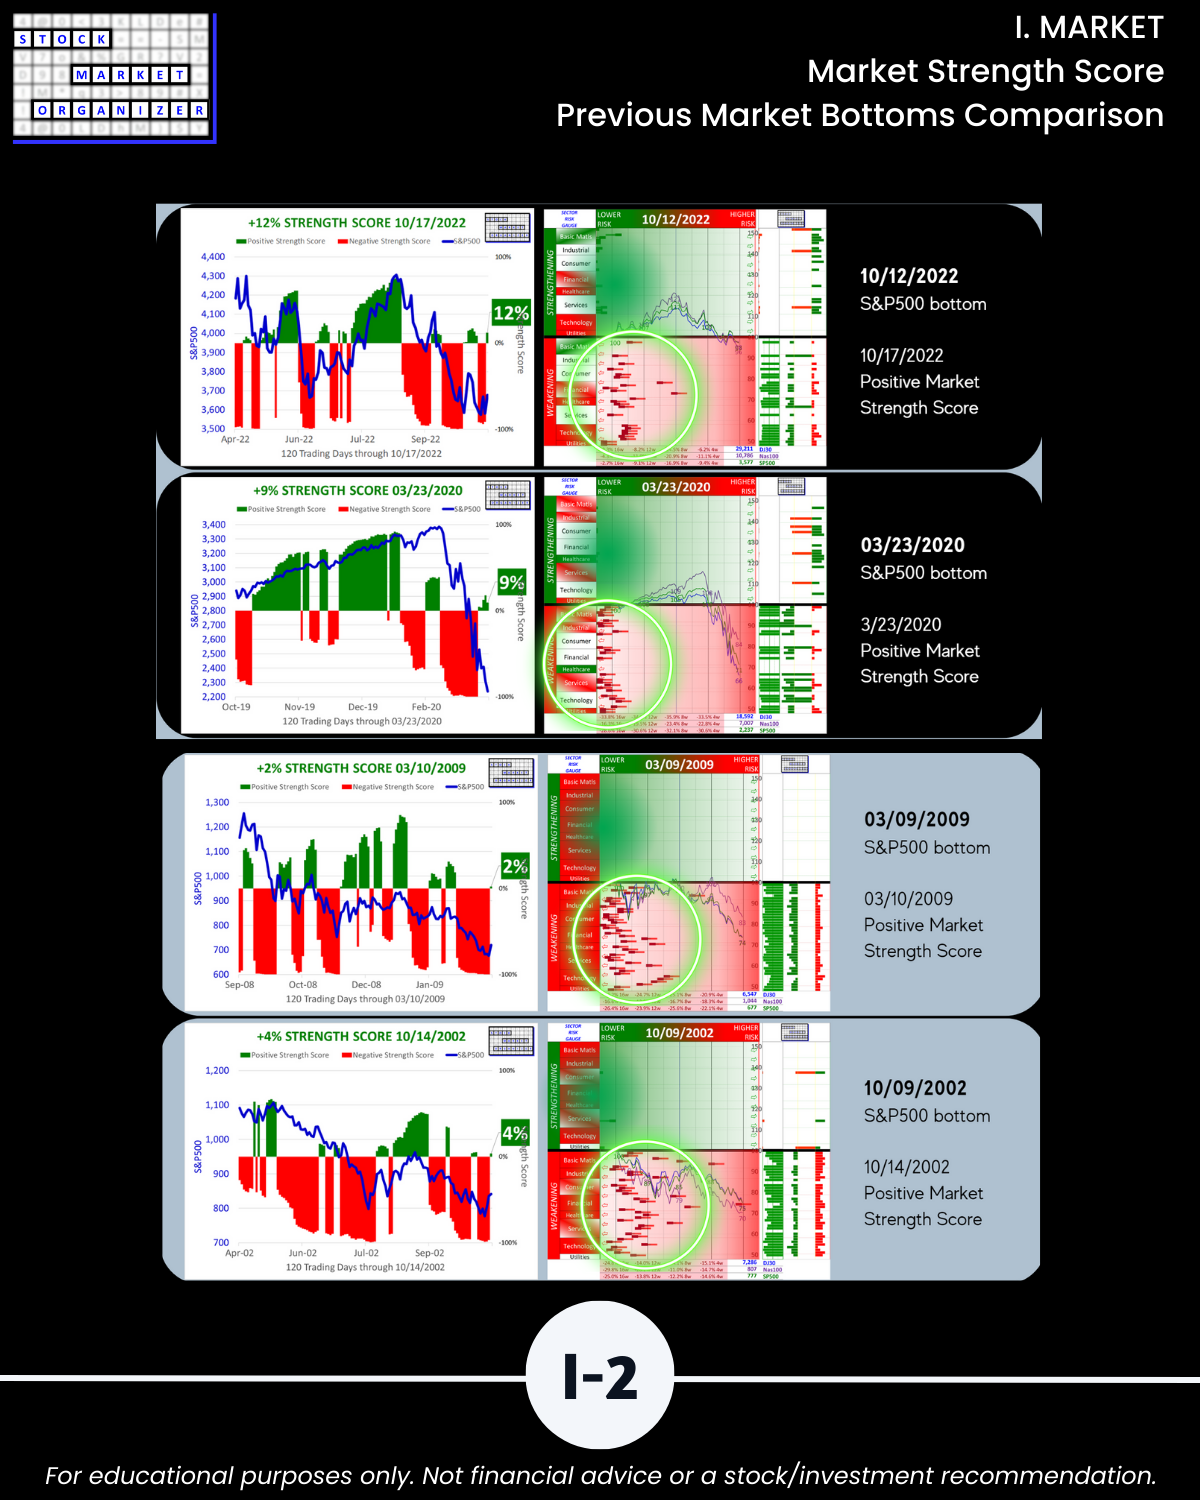
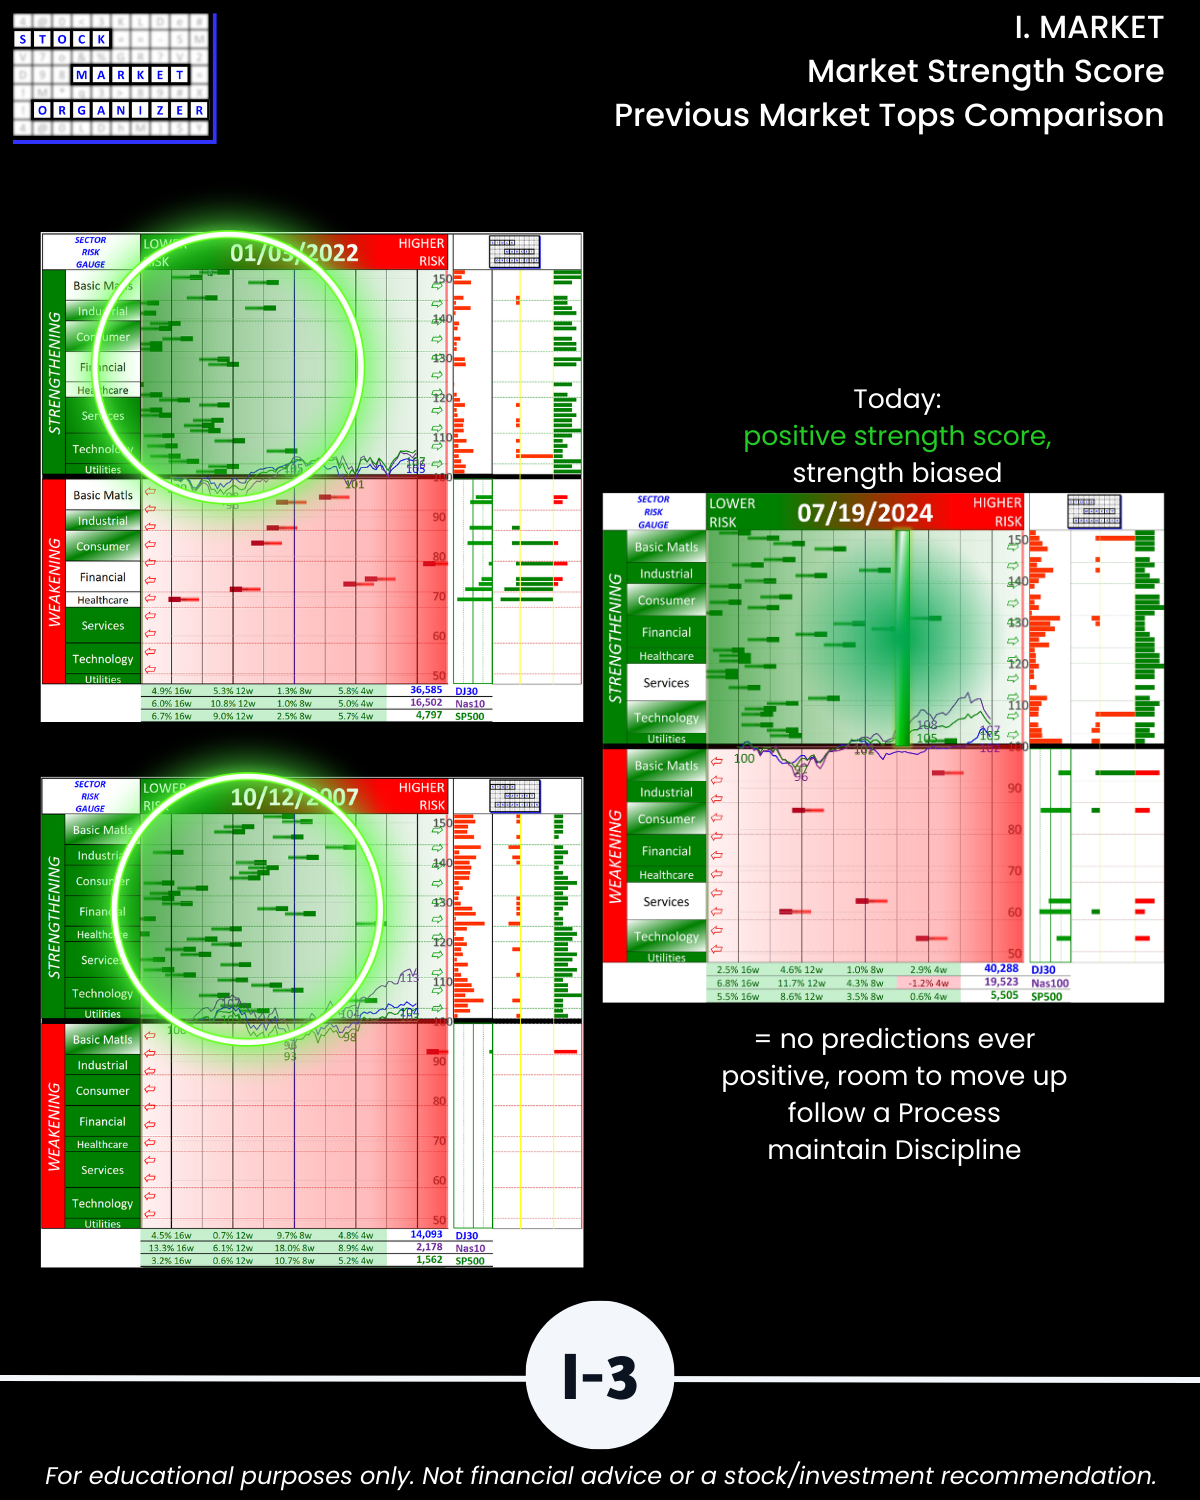
🔹 The Market Strength Score has been positive = No New Shorts since changing from -89% 6/27/24 to +13% after the 6/28/24 trading day.
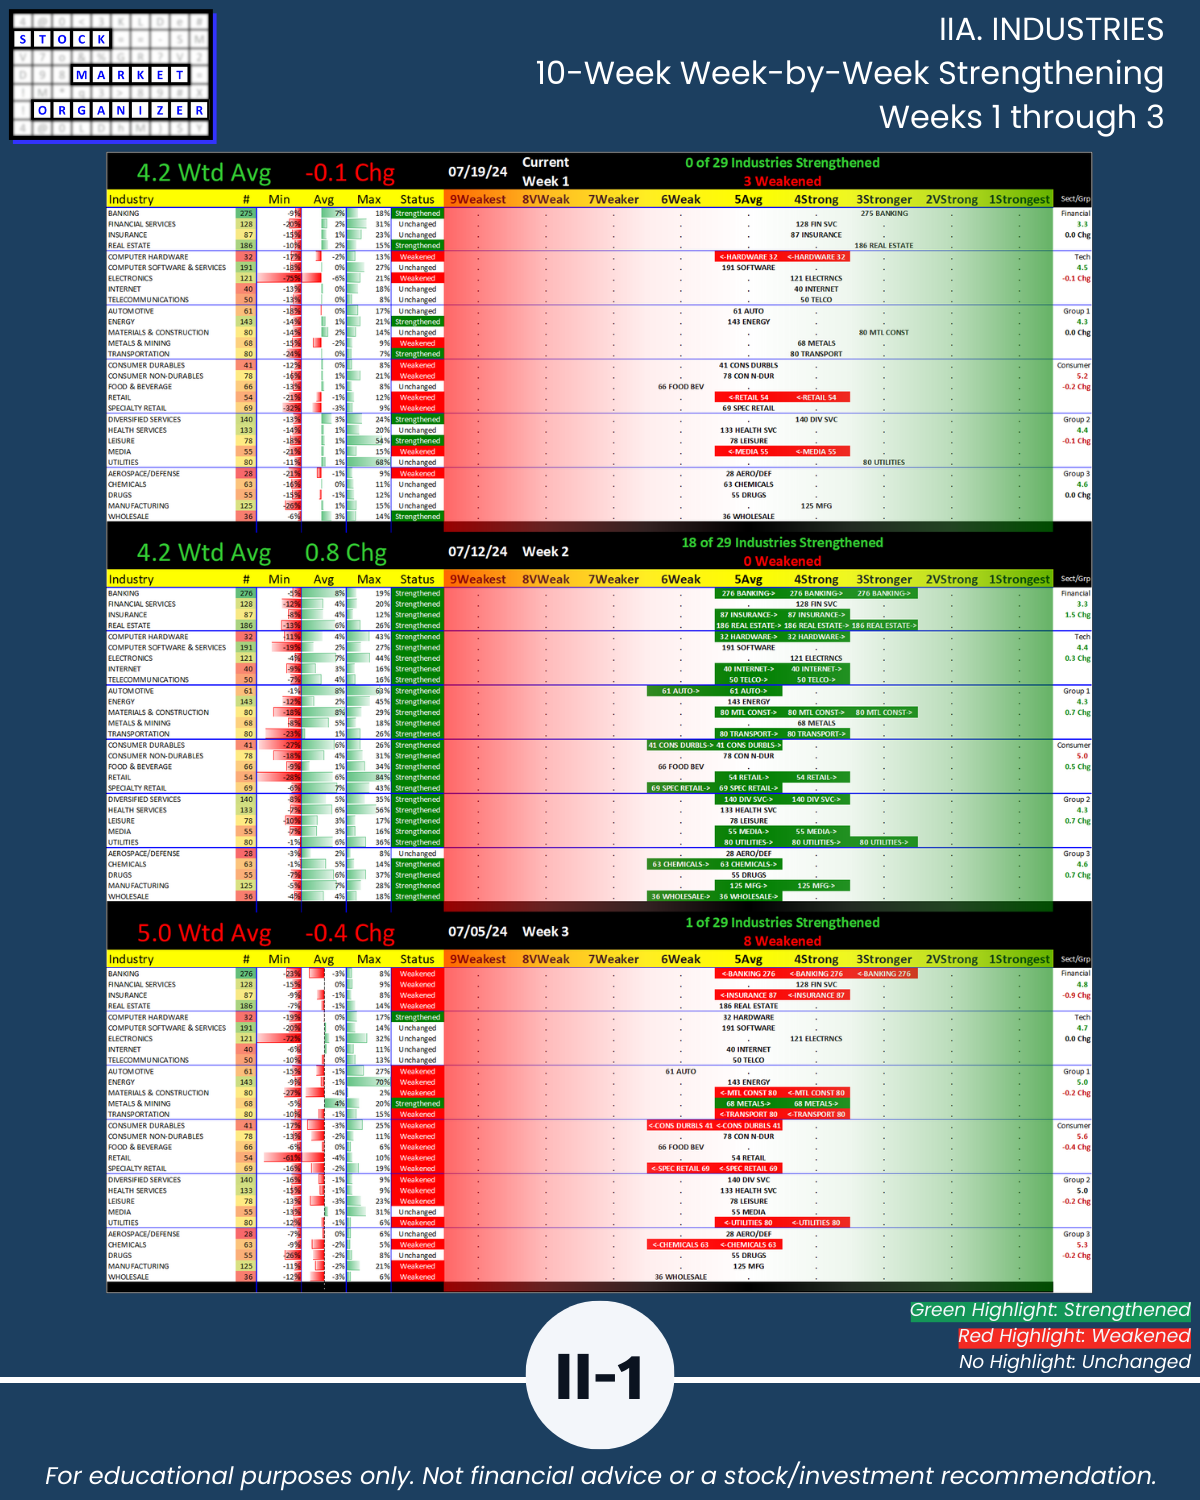
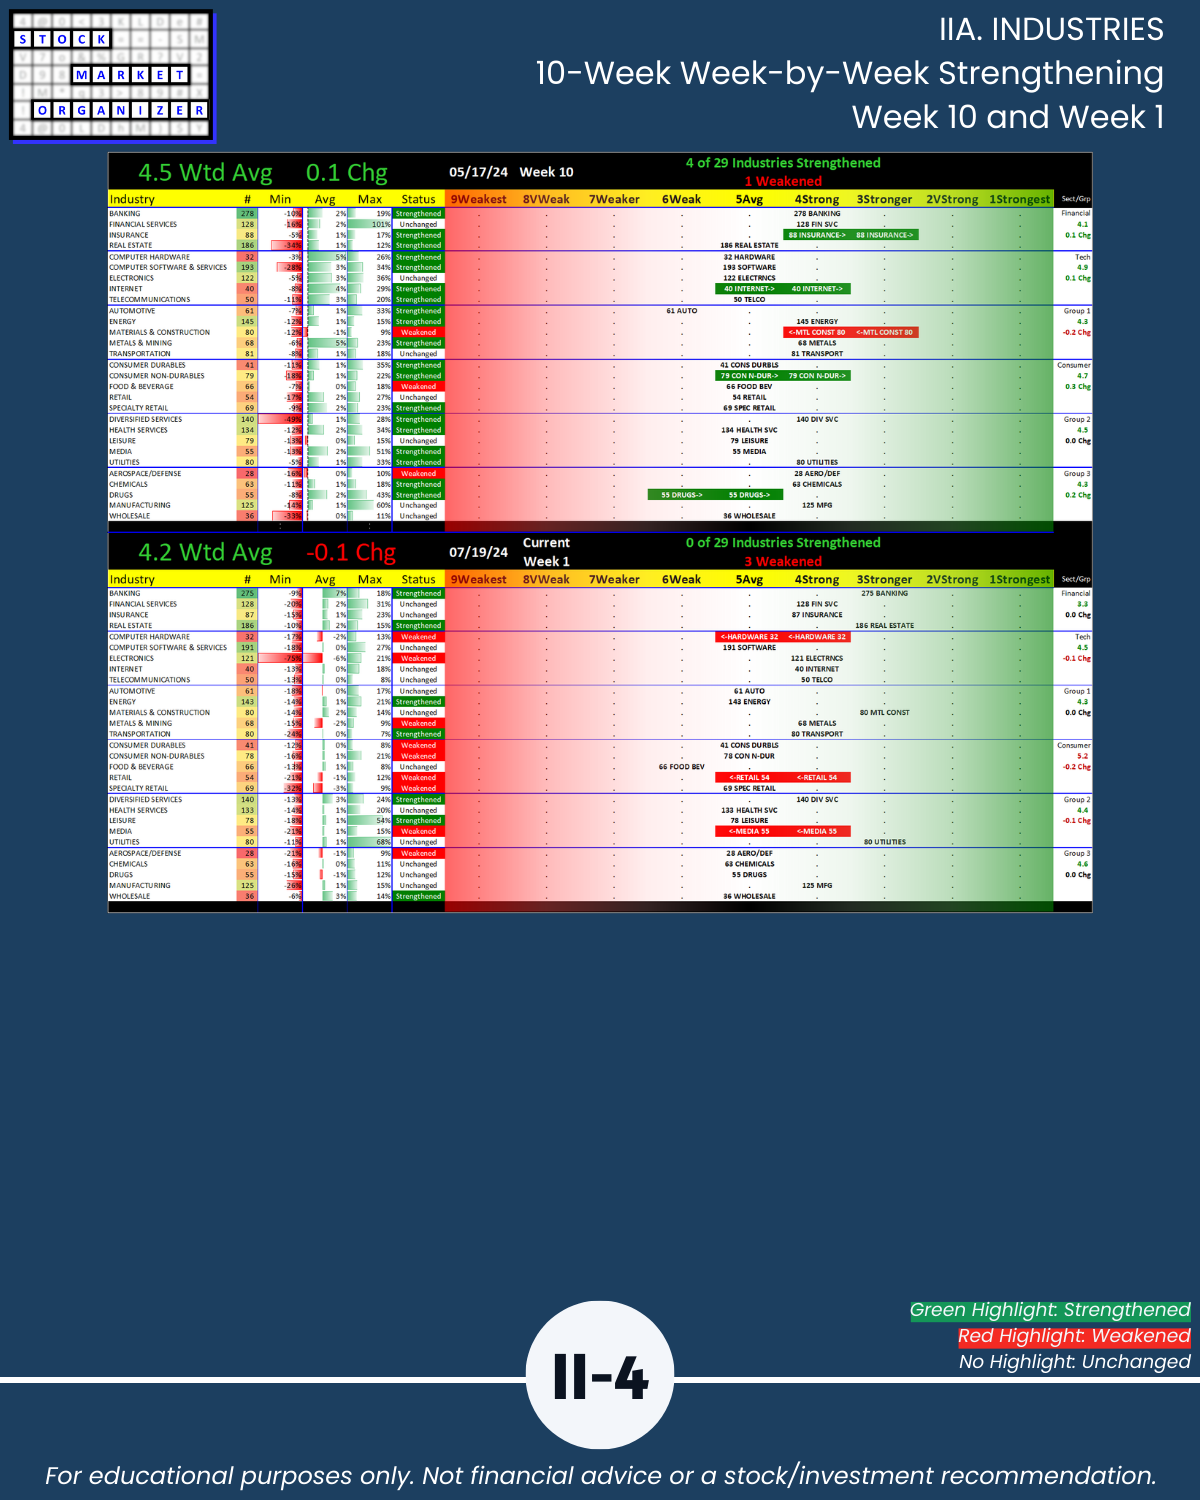
🔹 The Market Composite Strength Rating is 4.2 (range 1=Strongest to 9=Weakest), between 4Strong and 5Average.
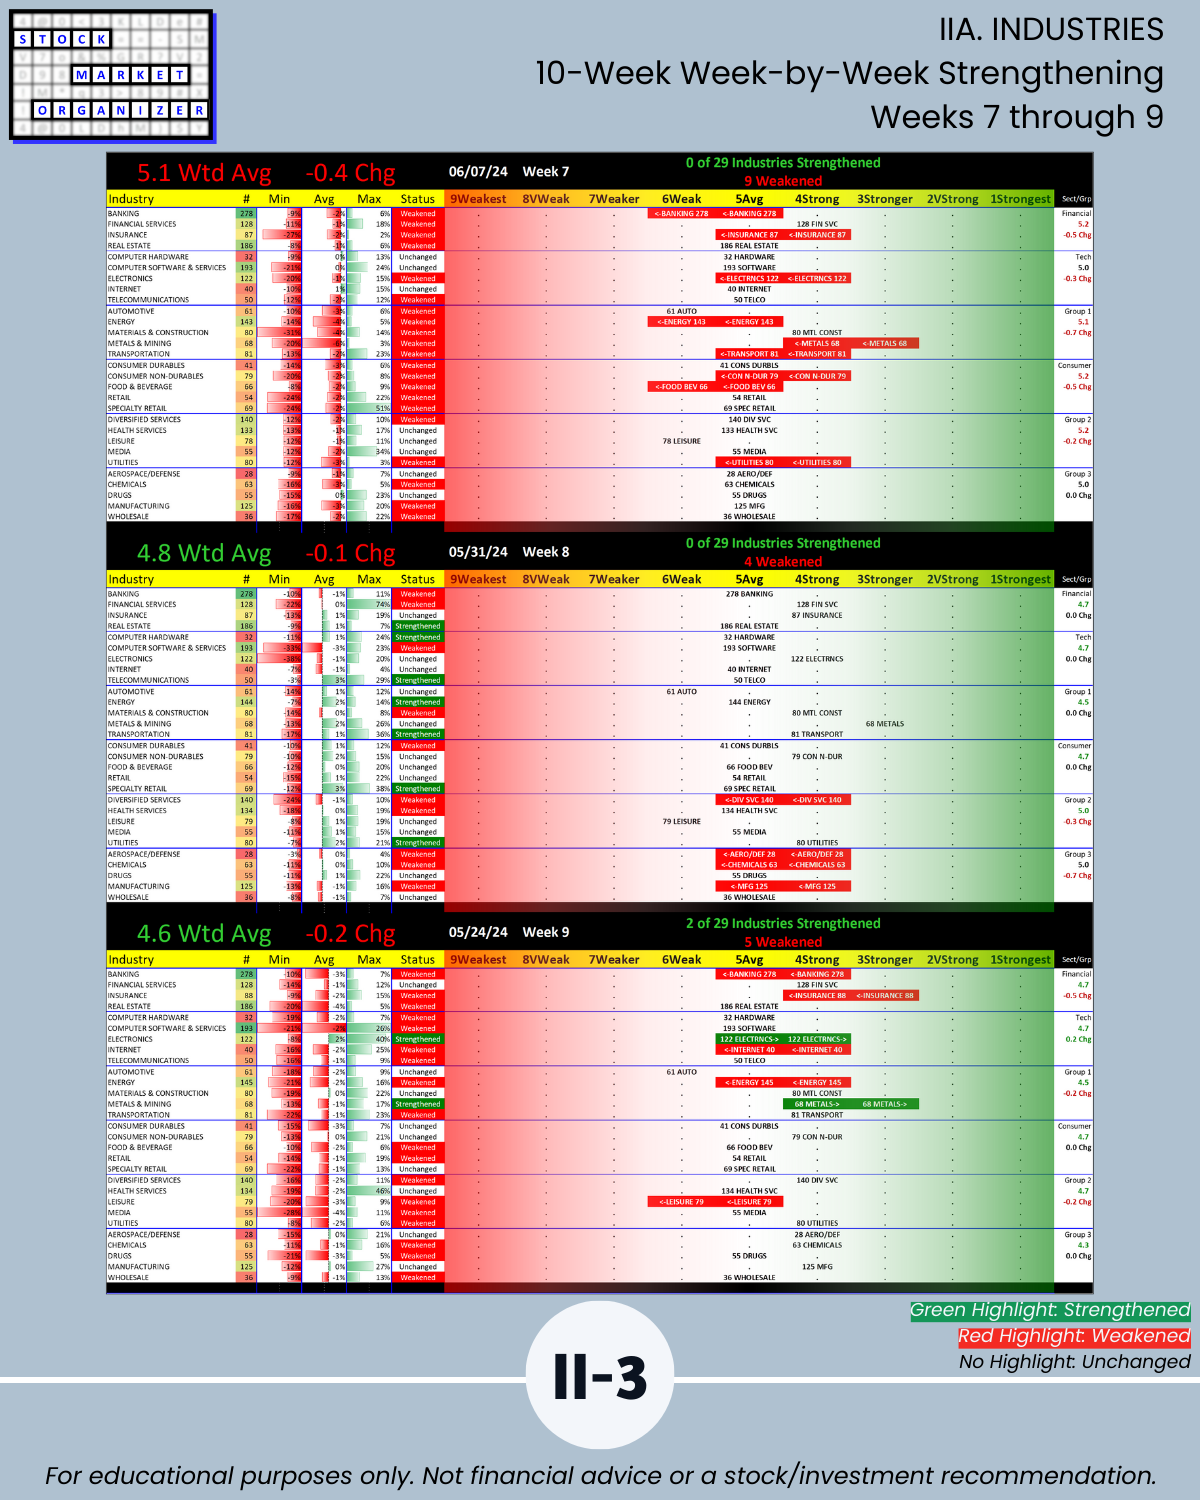
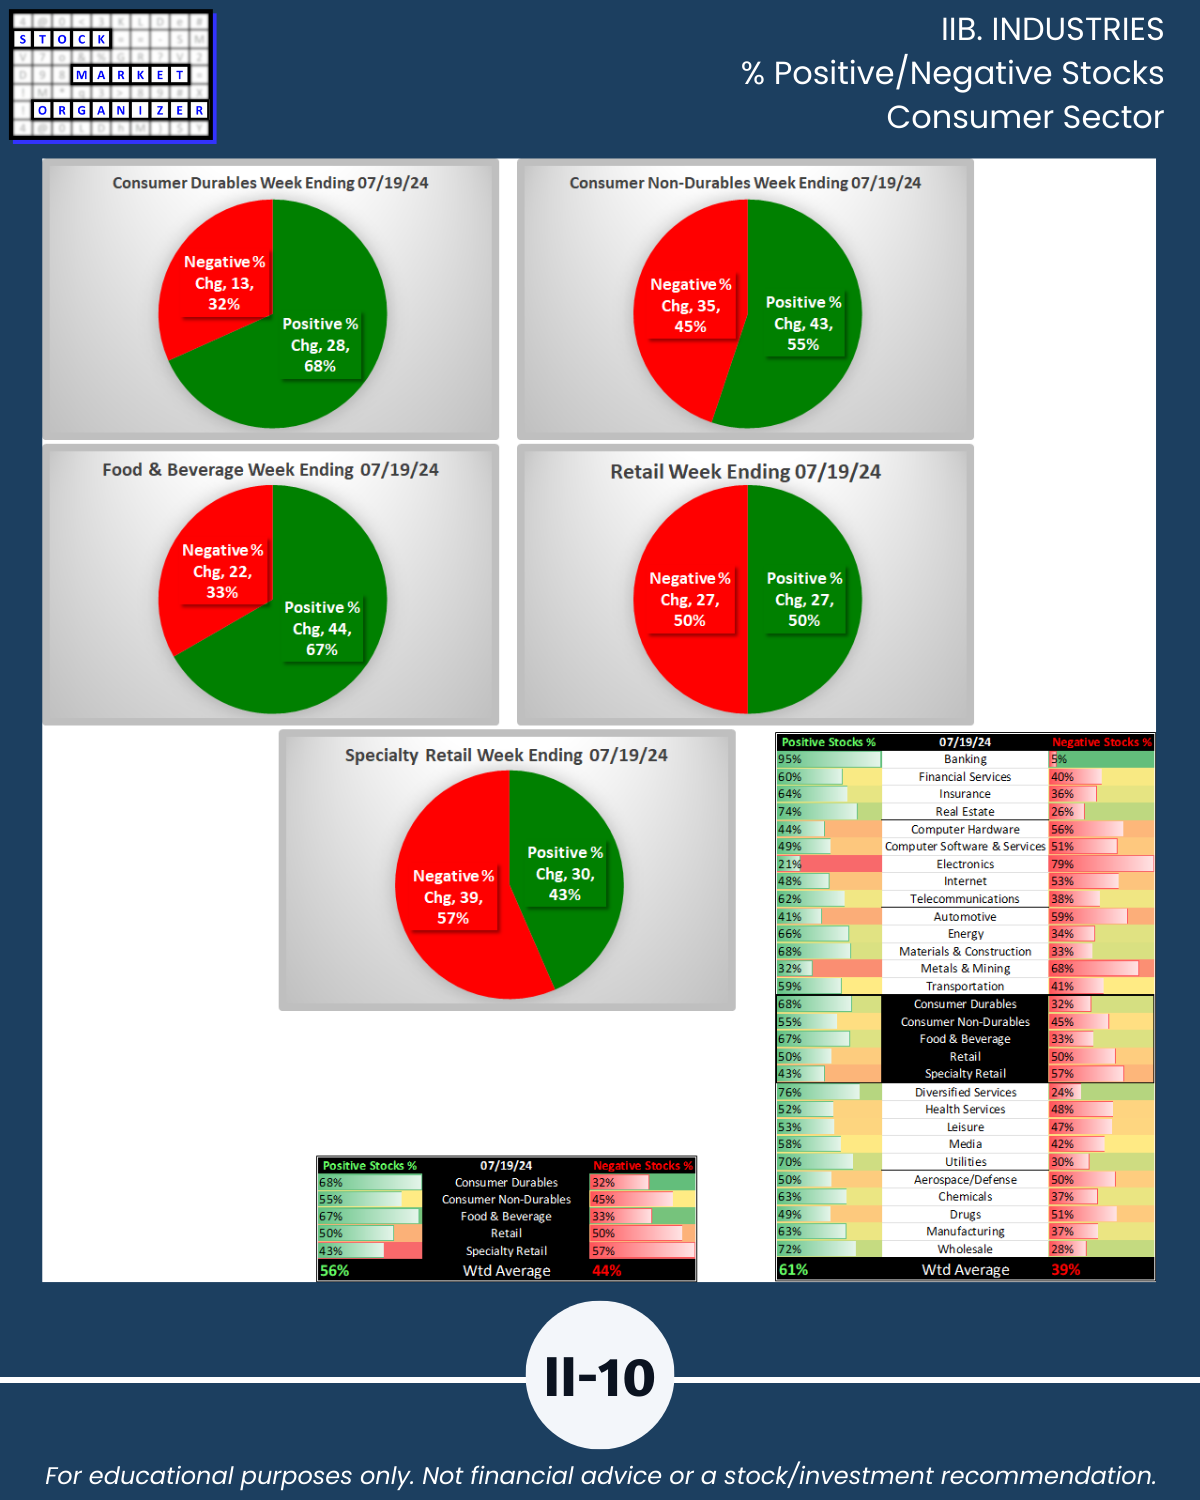
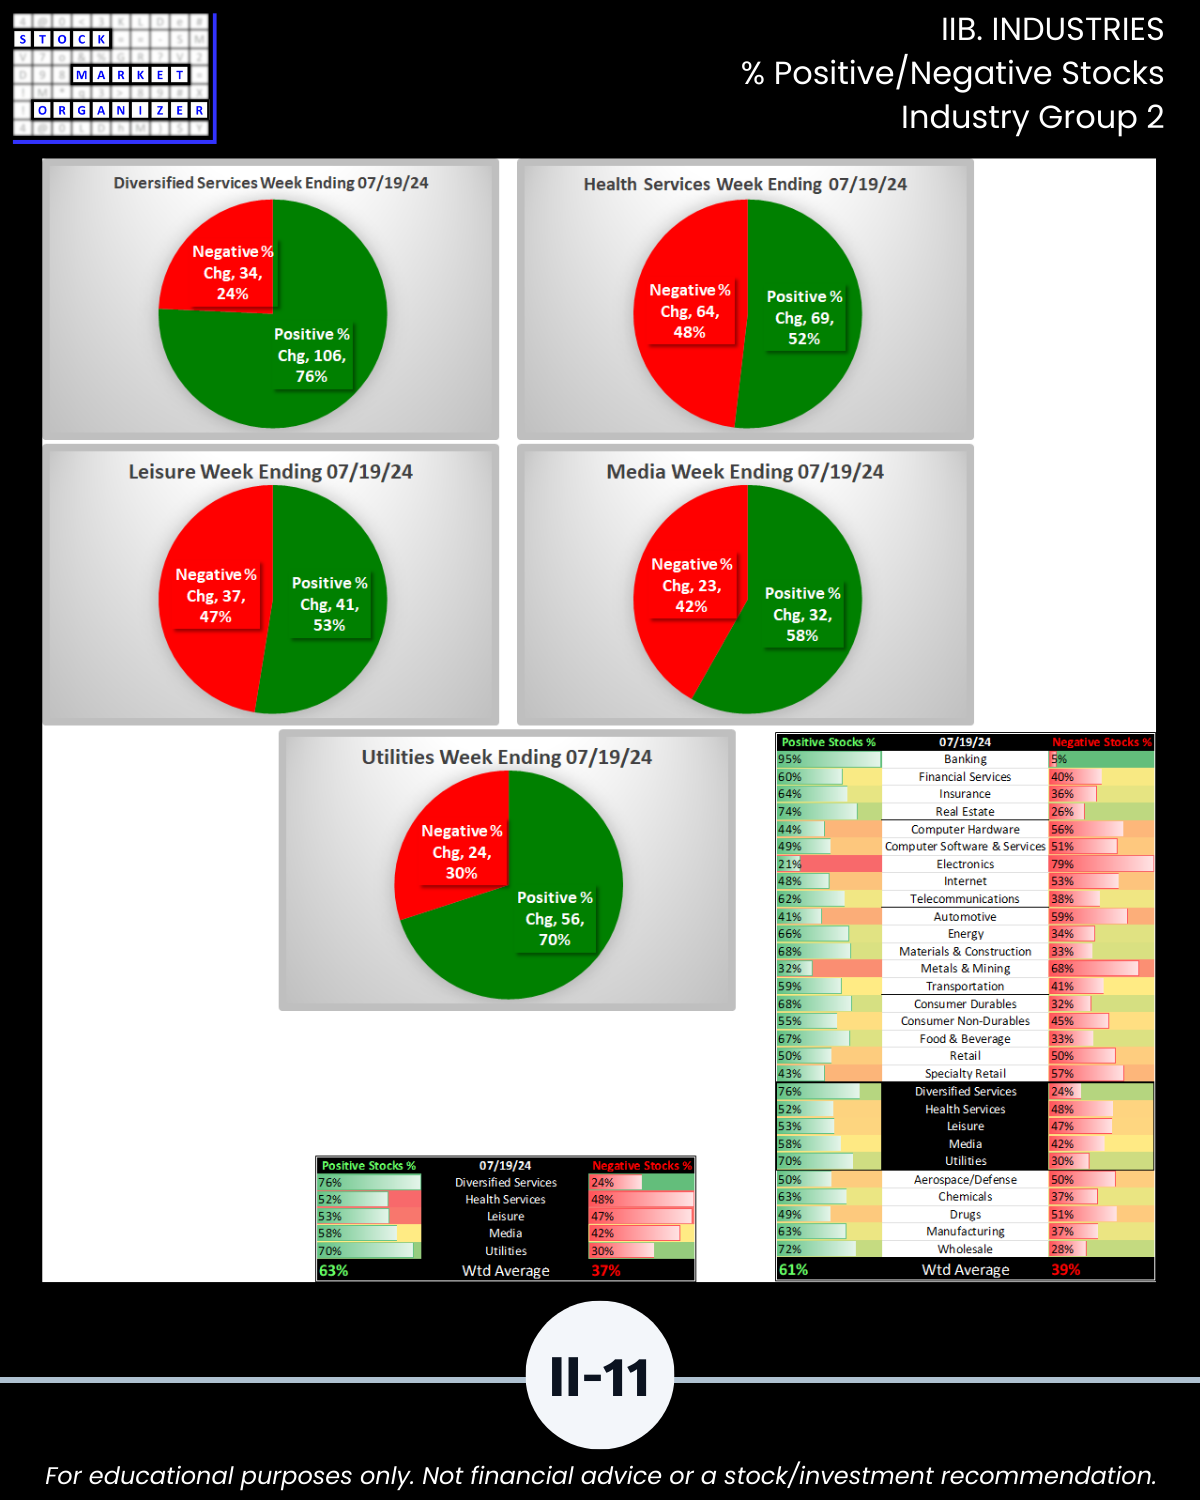
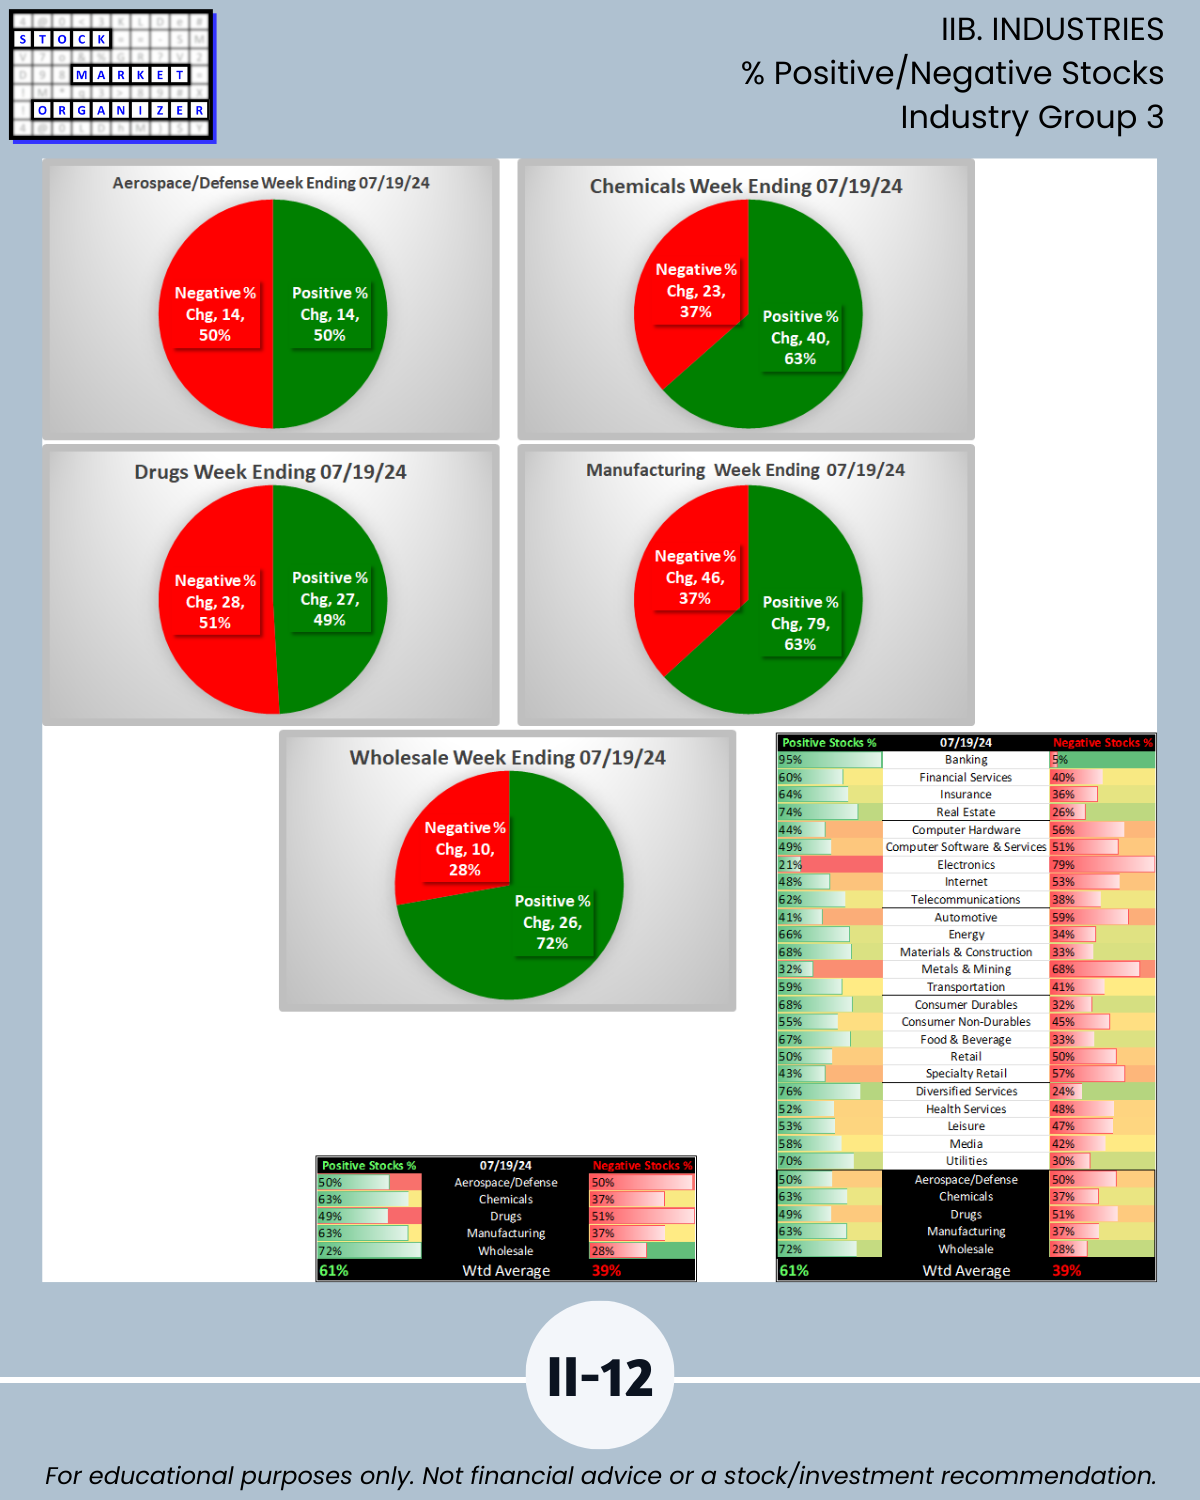
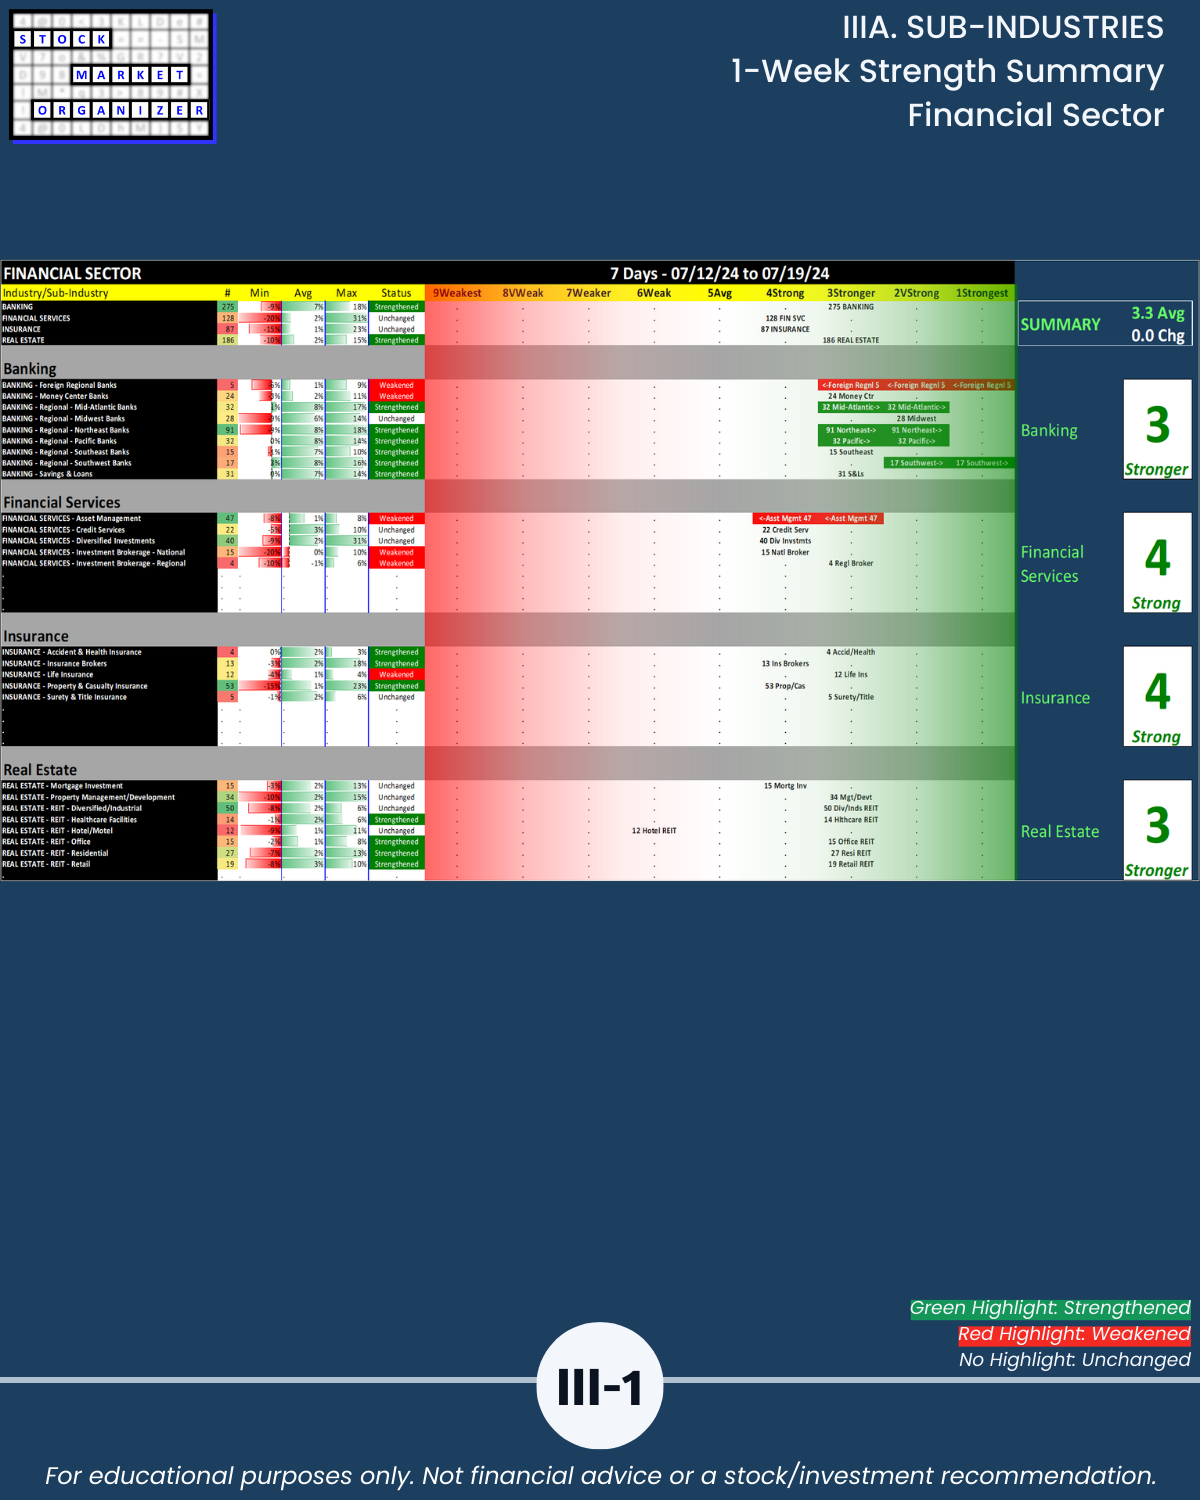
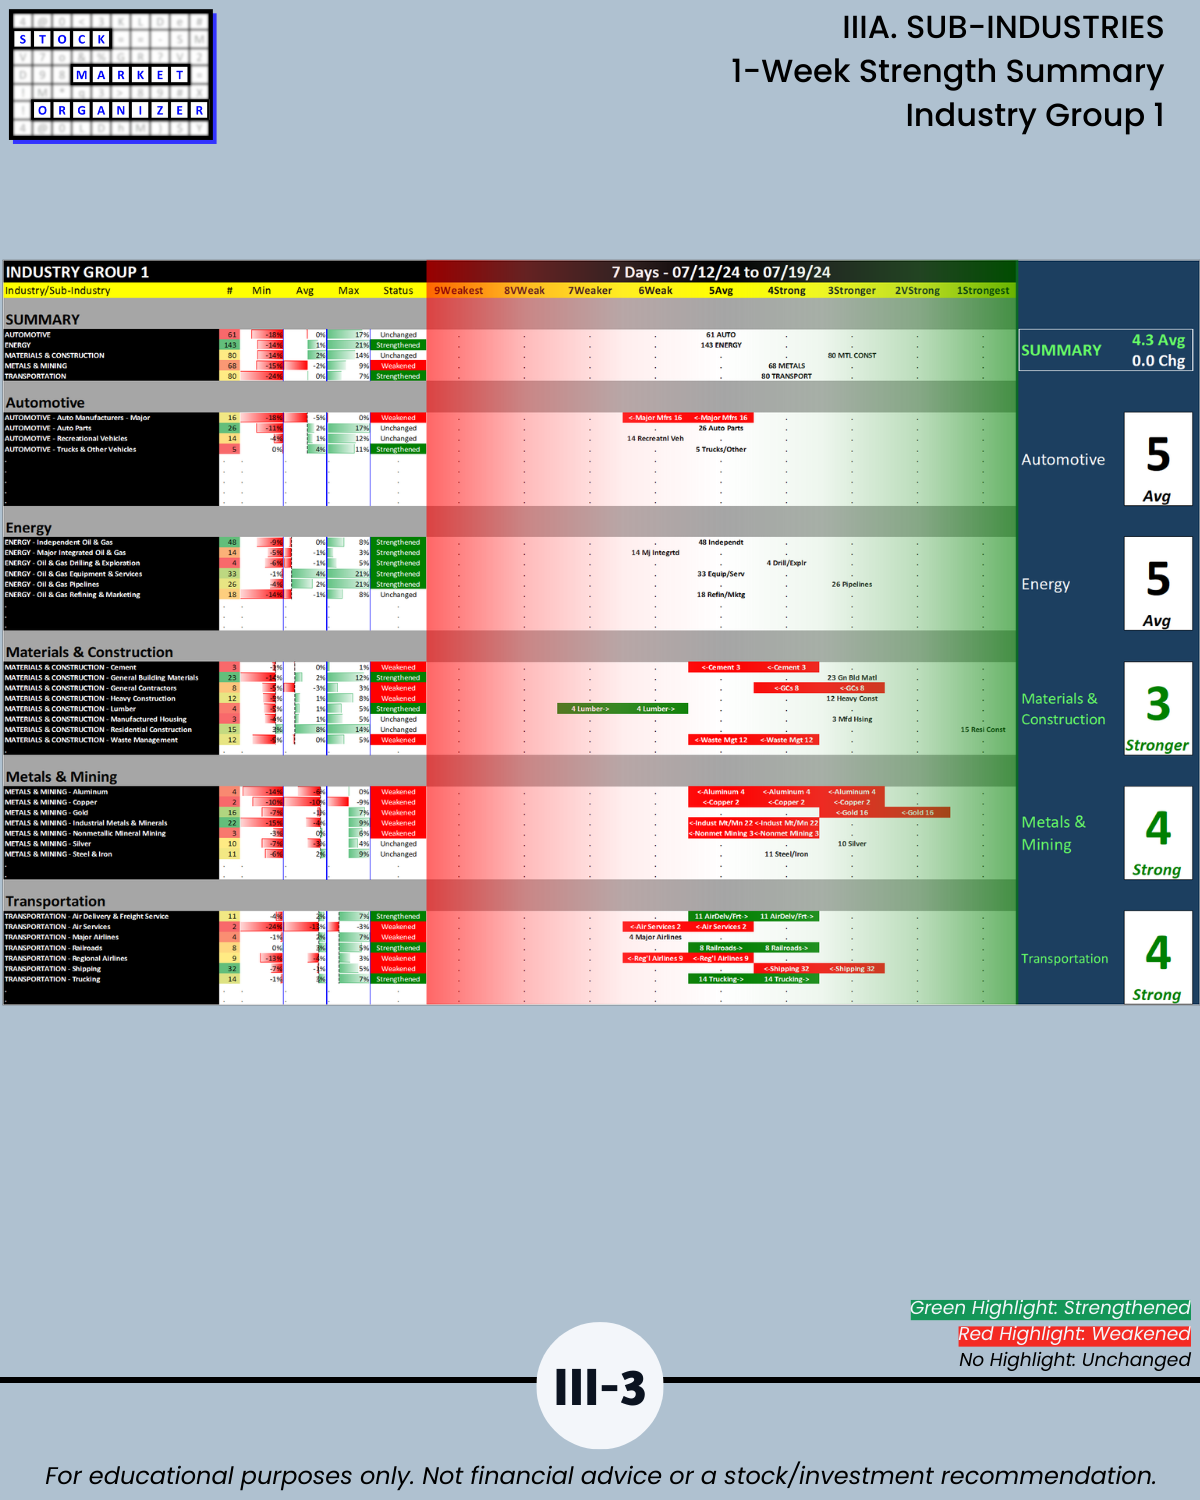
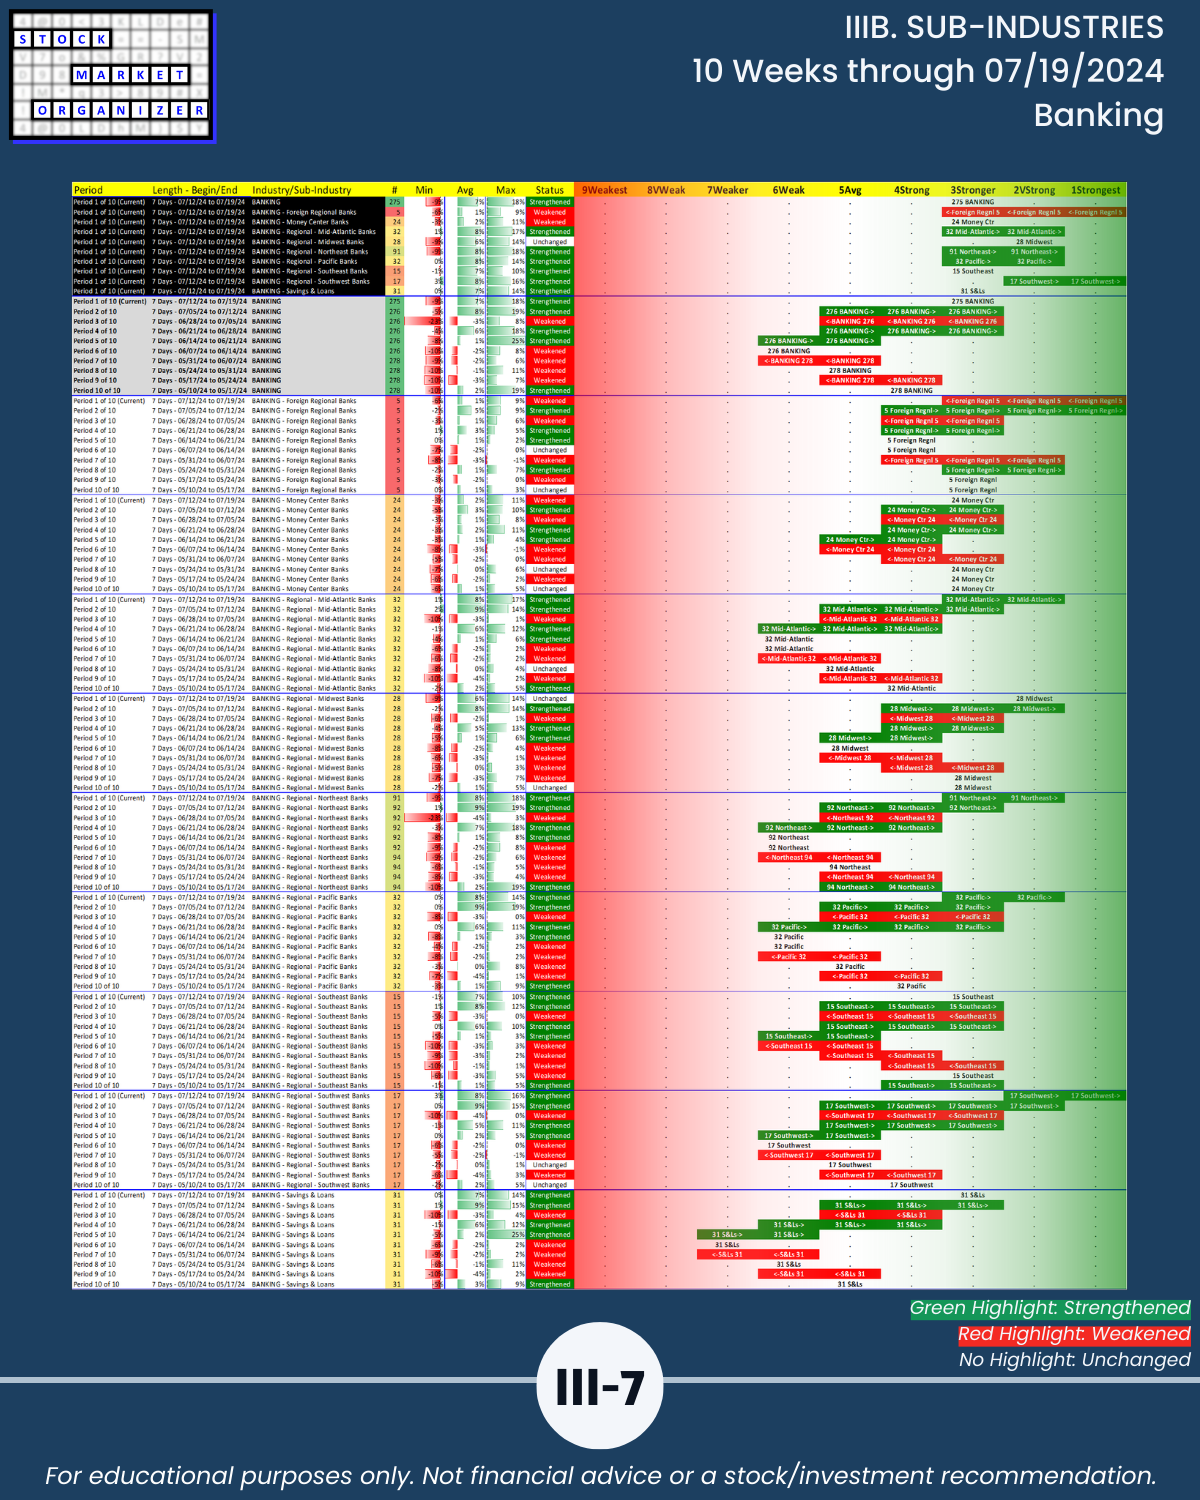
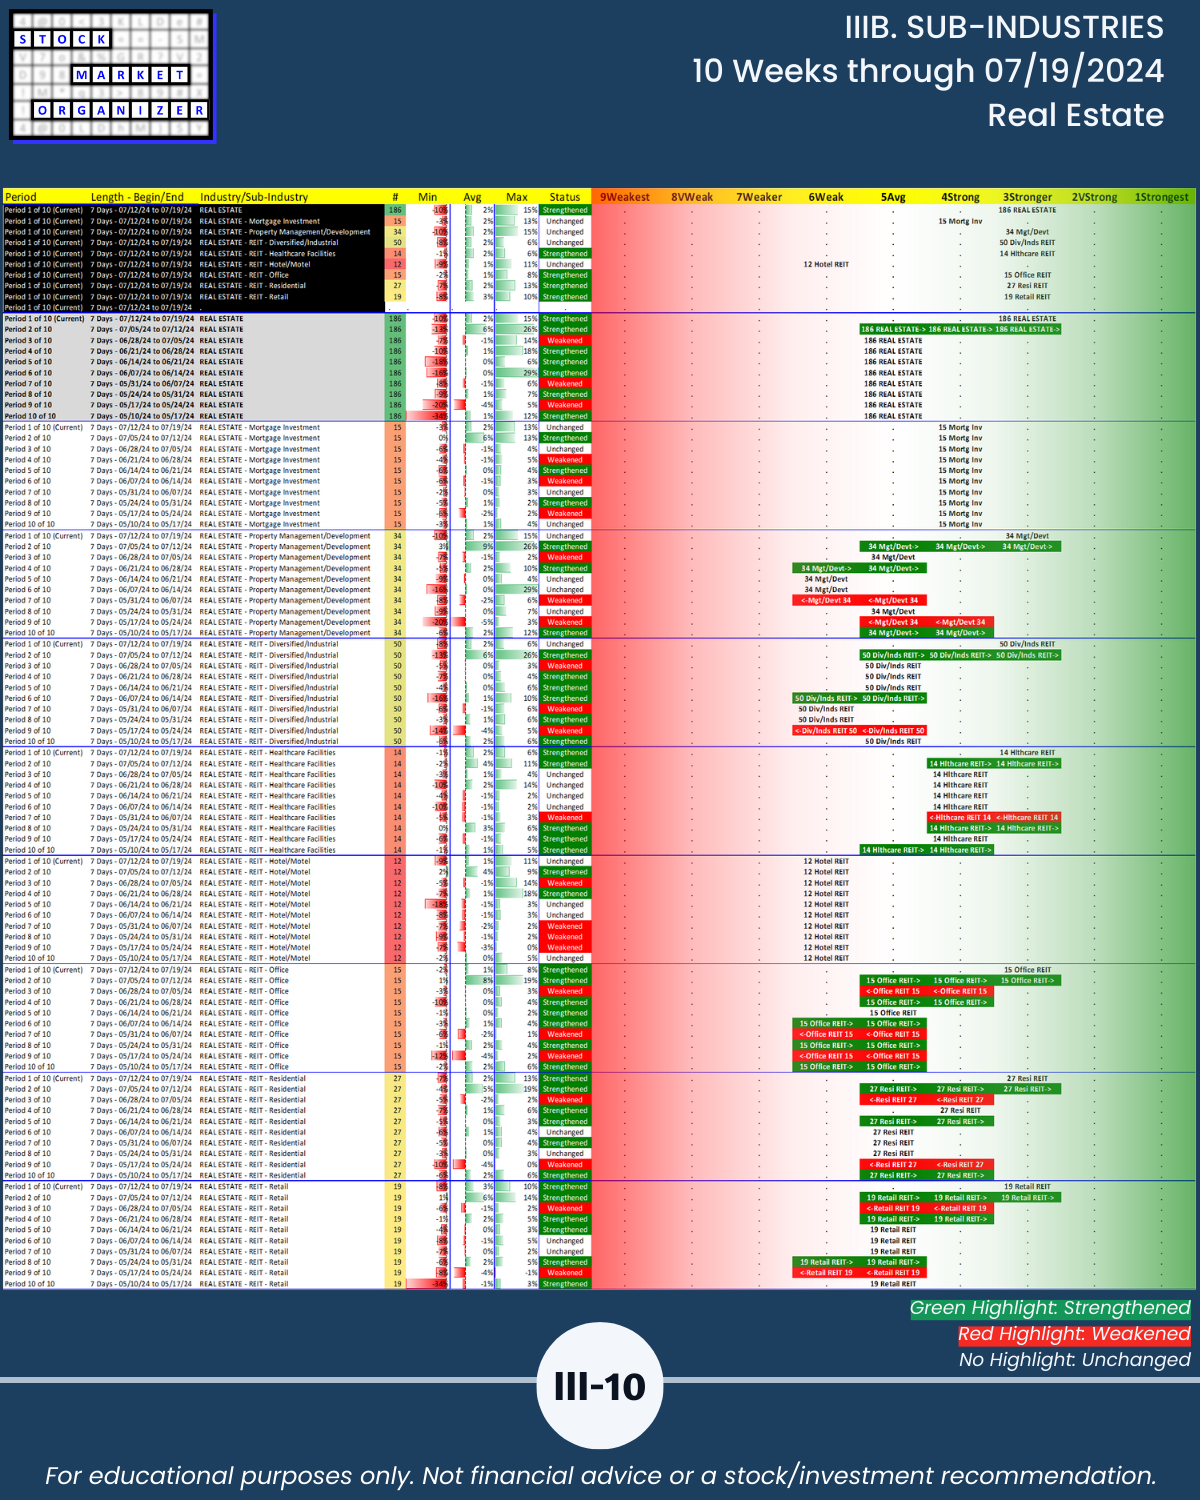
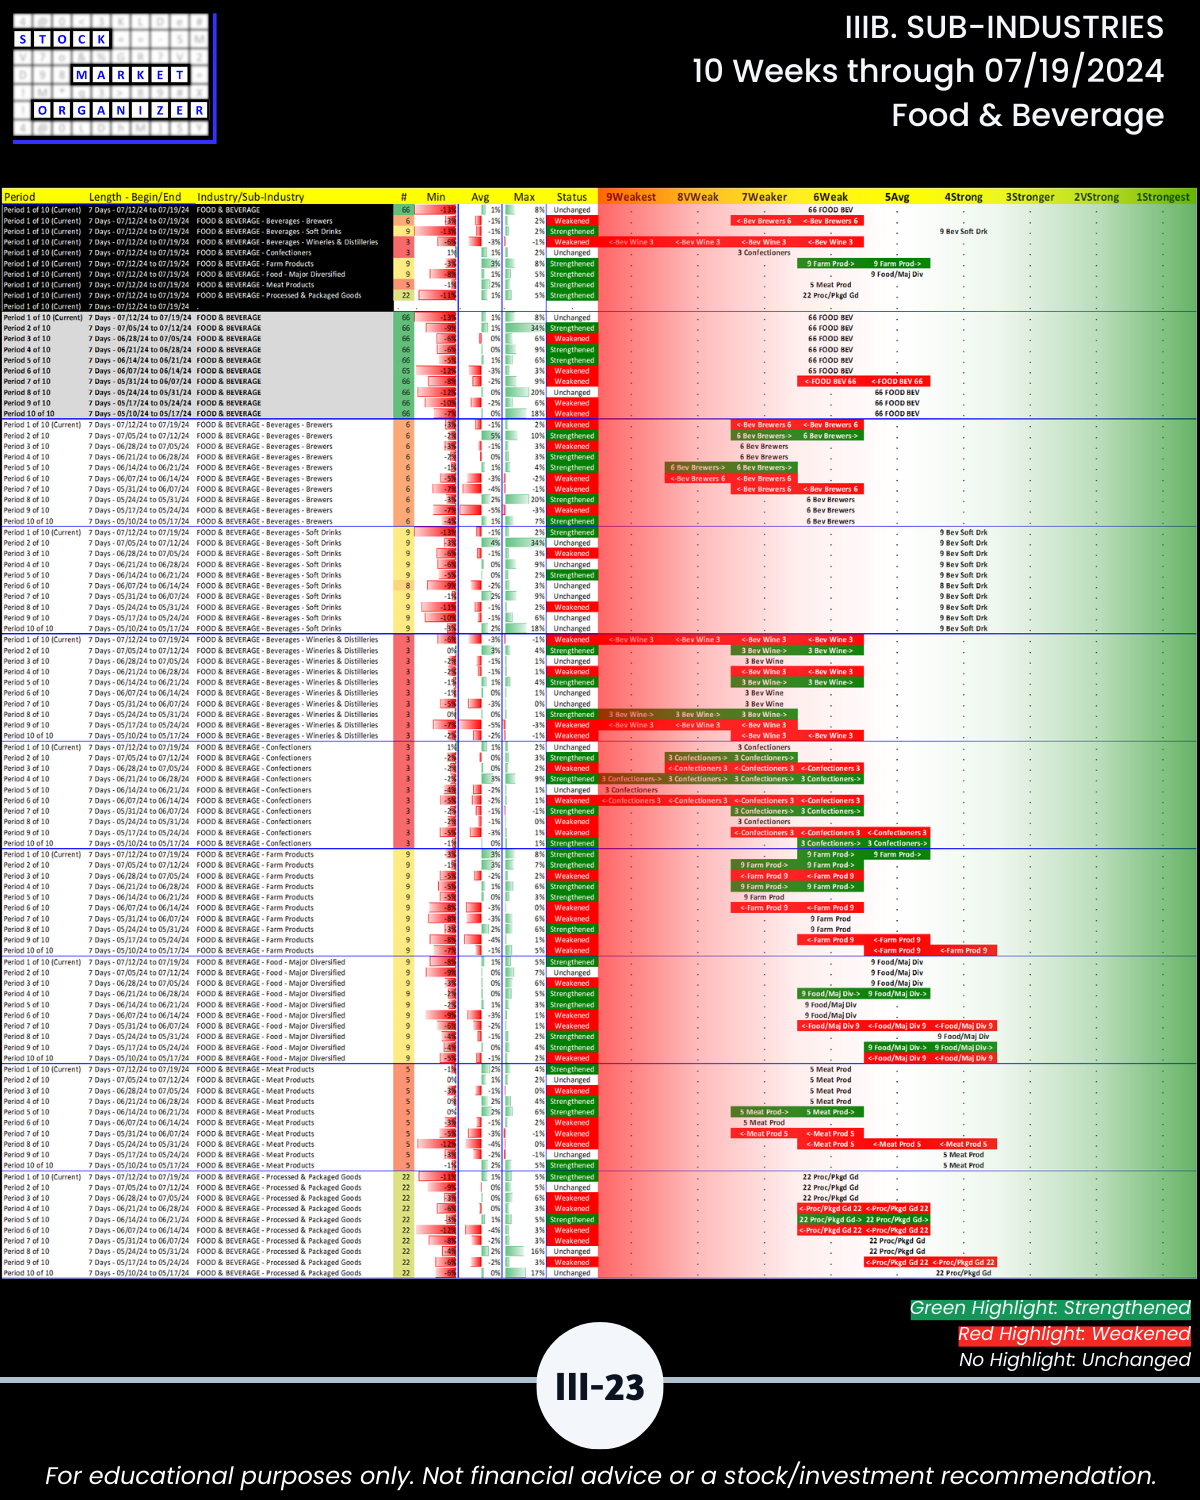
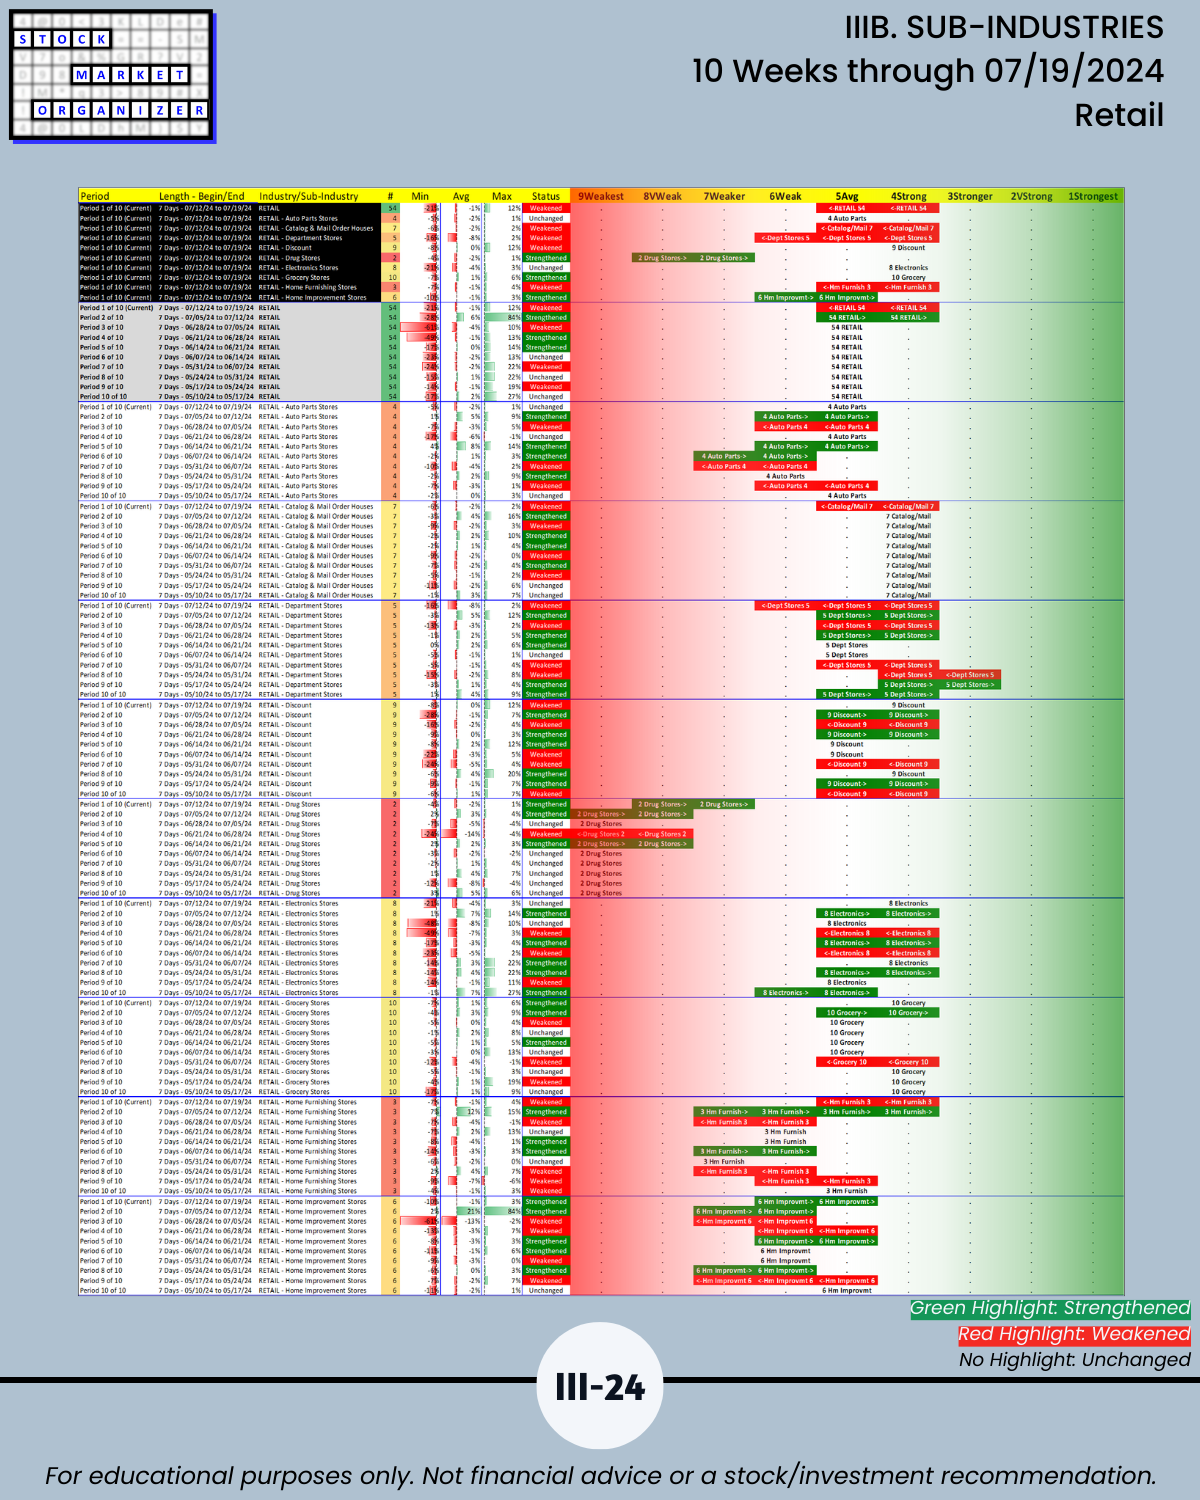
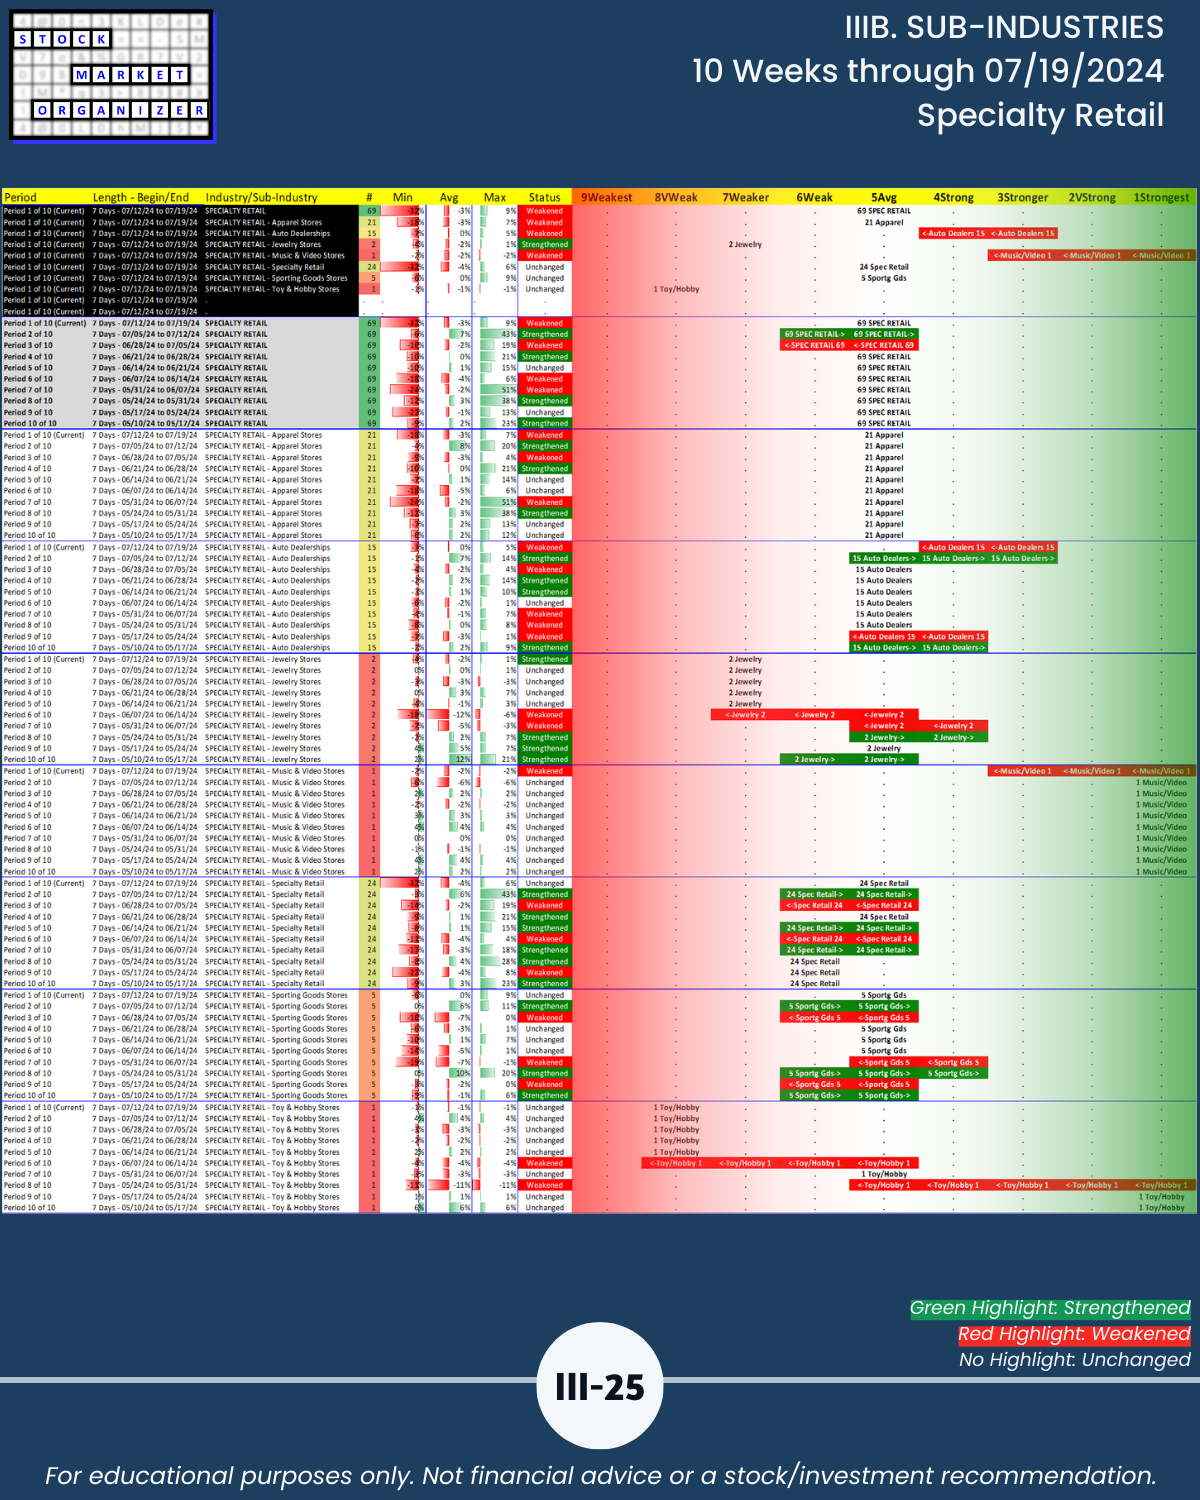
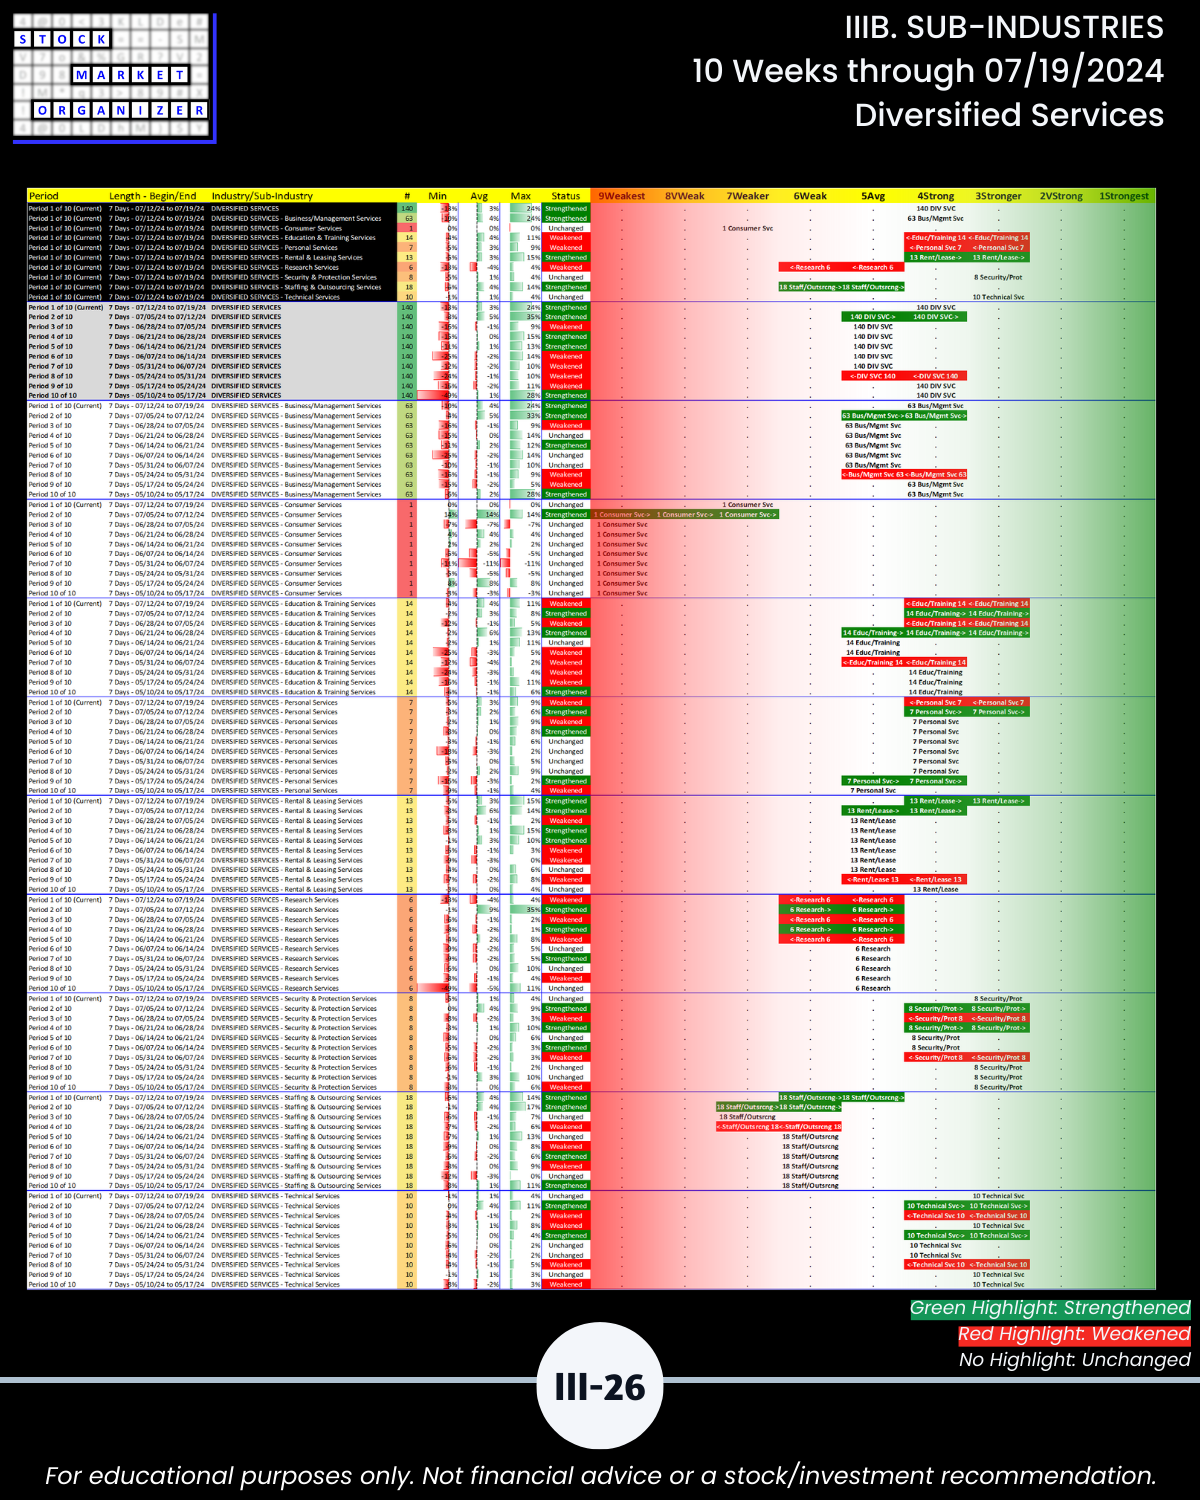
🔹 Banking, Real Estate, Materials & Construction, and Utilities are the strongest of 29 industries, rated 3Stronger. Food & Beverage is weakest at 6Weak. All others are clumped at 5Average or 4Strong.
WHY DO YOU CARE?
See Section IV – stocks detail - for the answers.
Trend-followers and mean reverters alike will find useful information, though not stock recommendations.
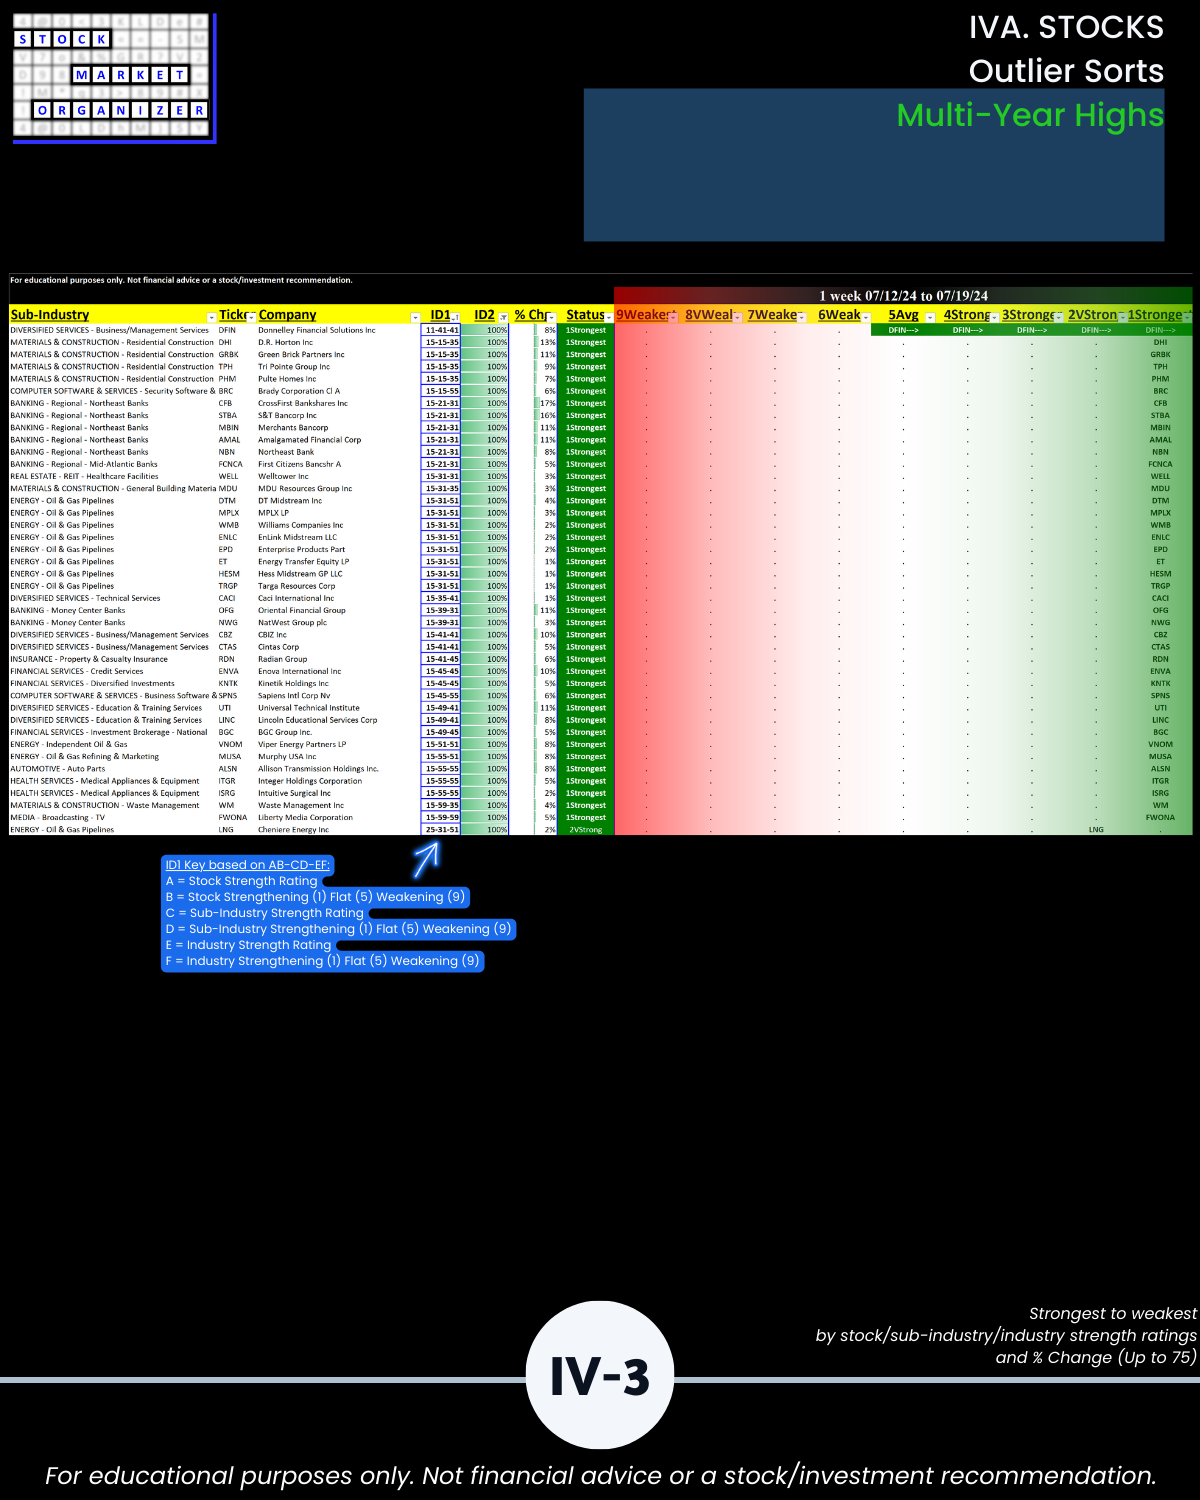
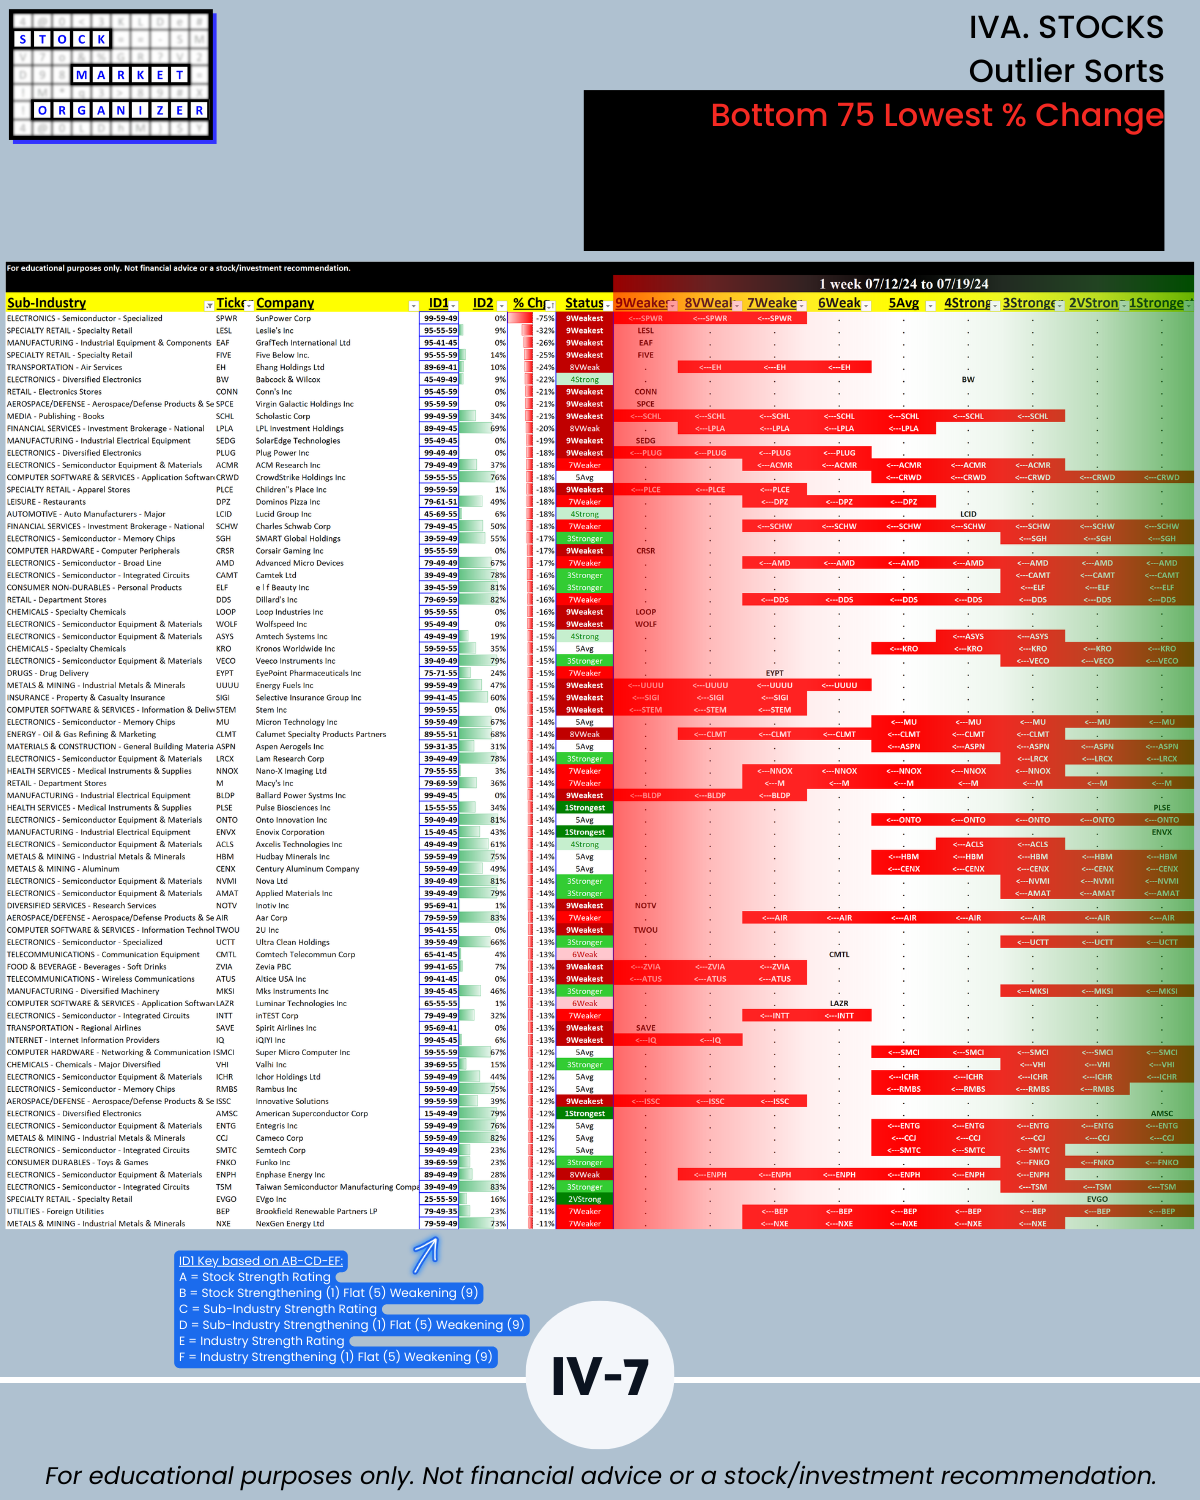
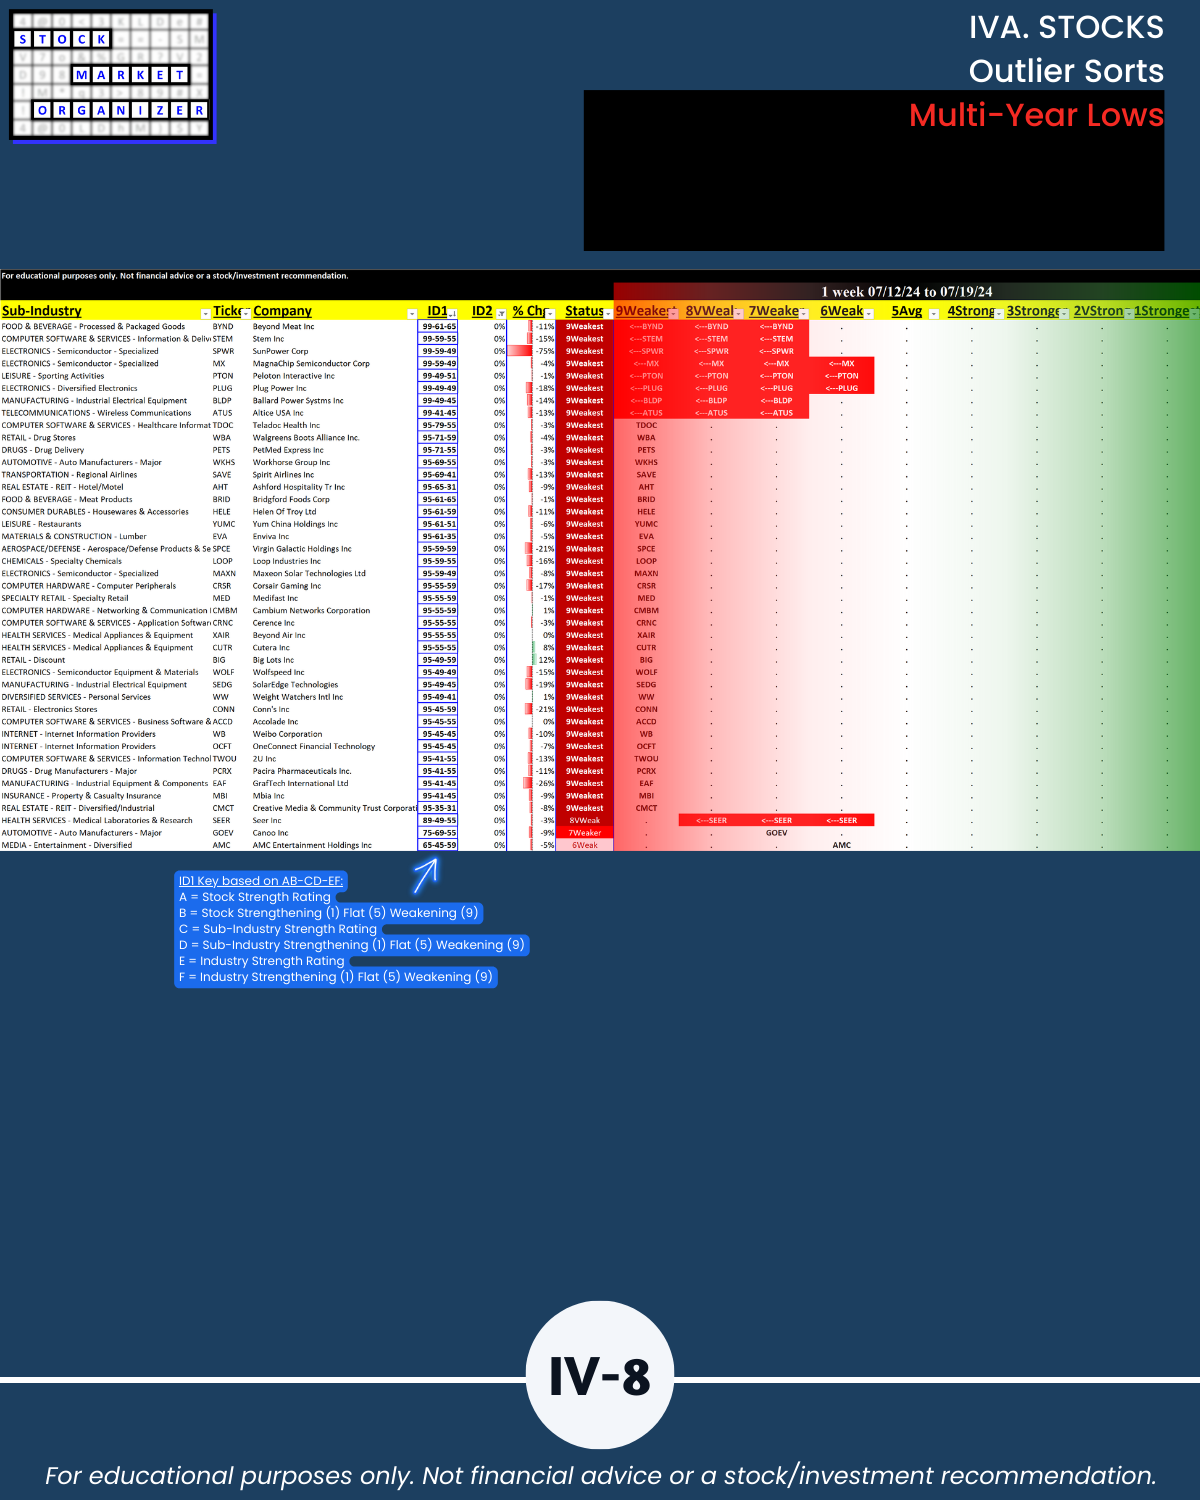
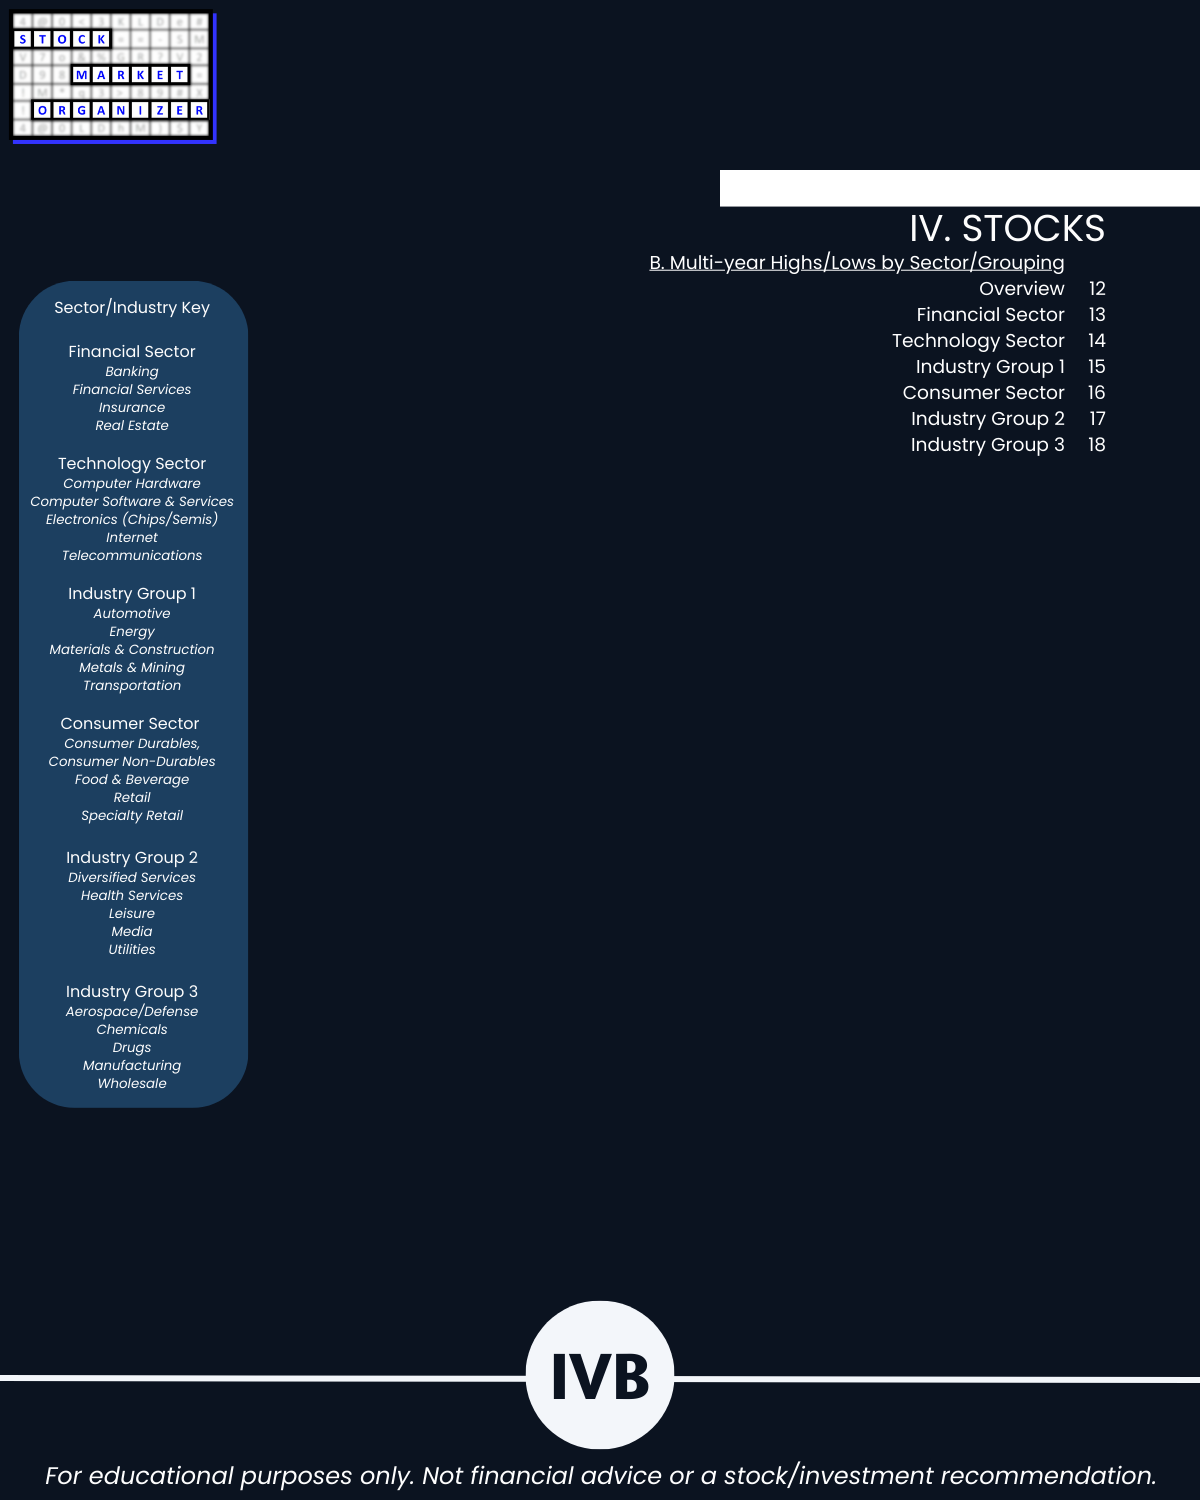
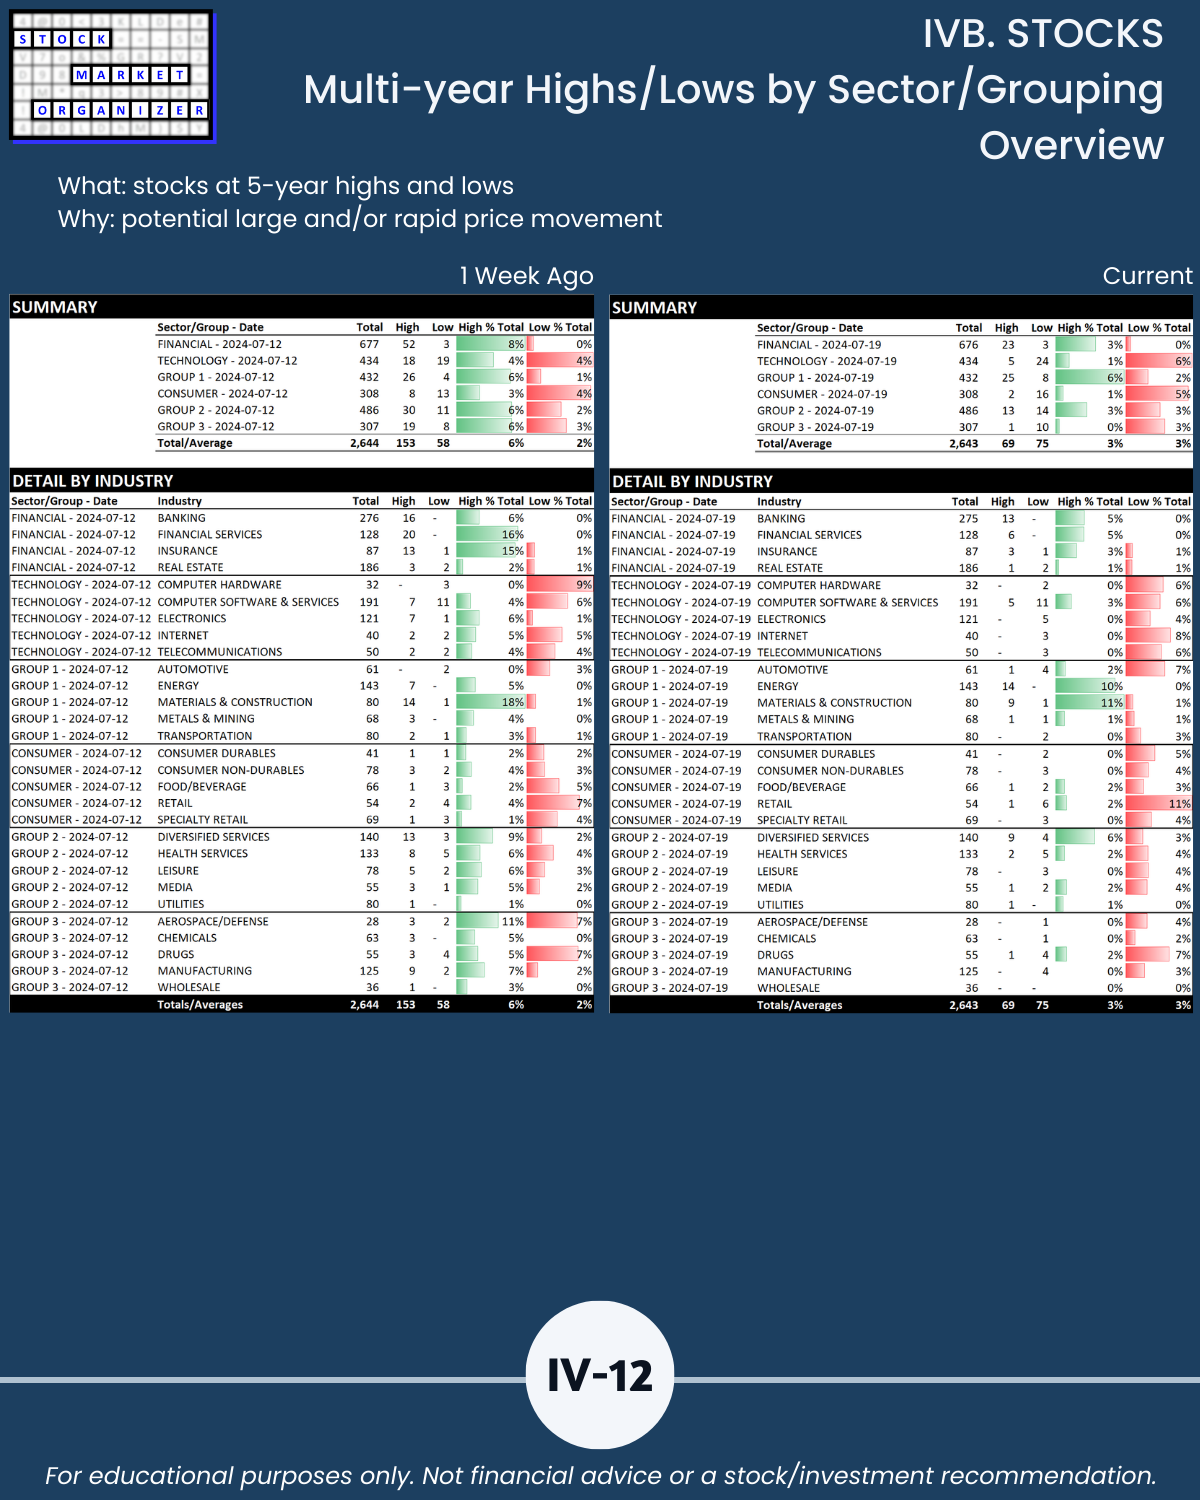
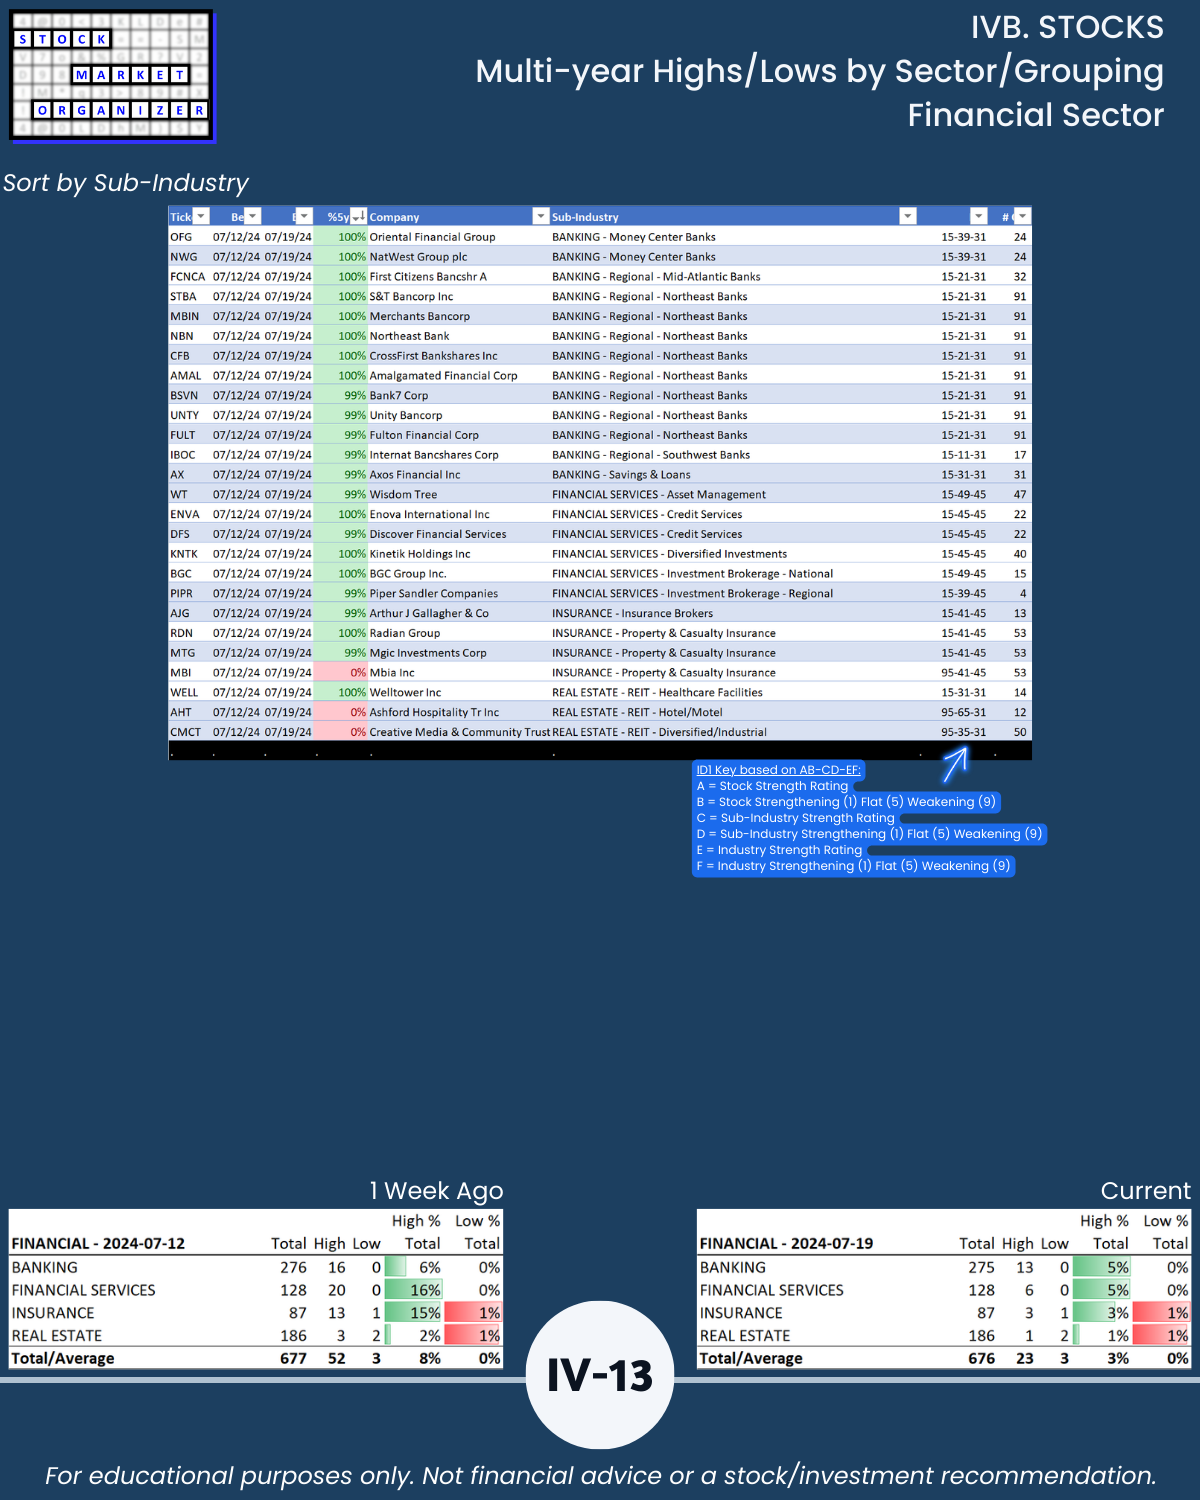
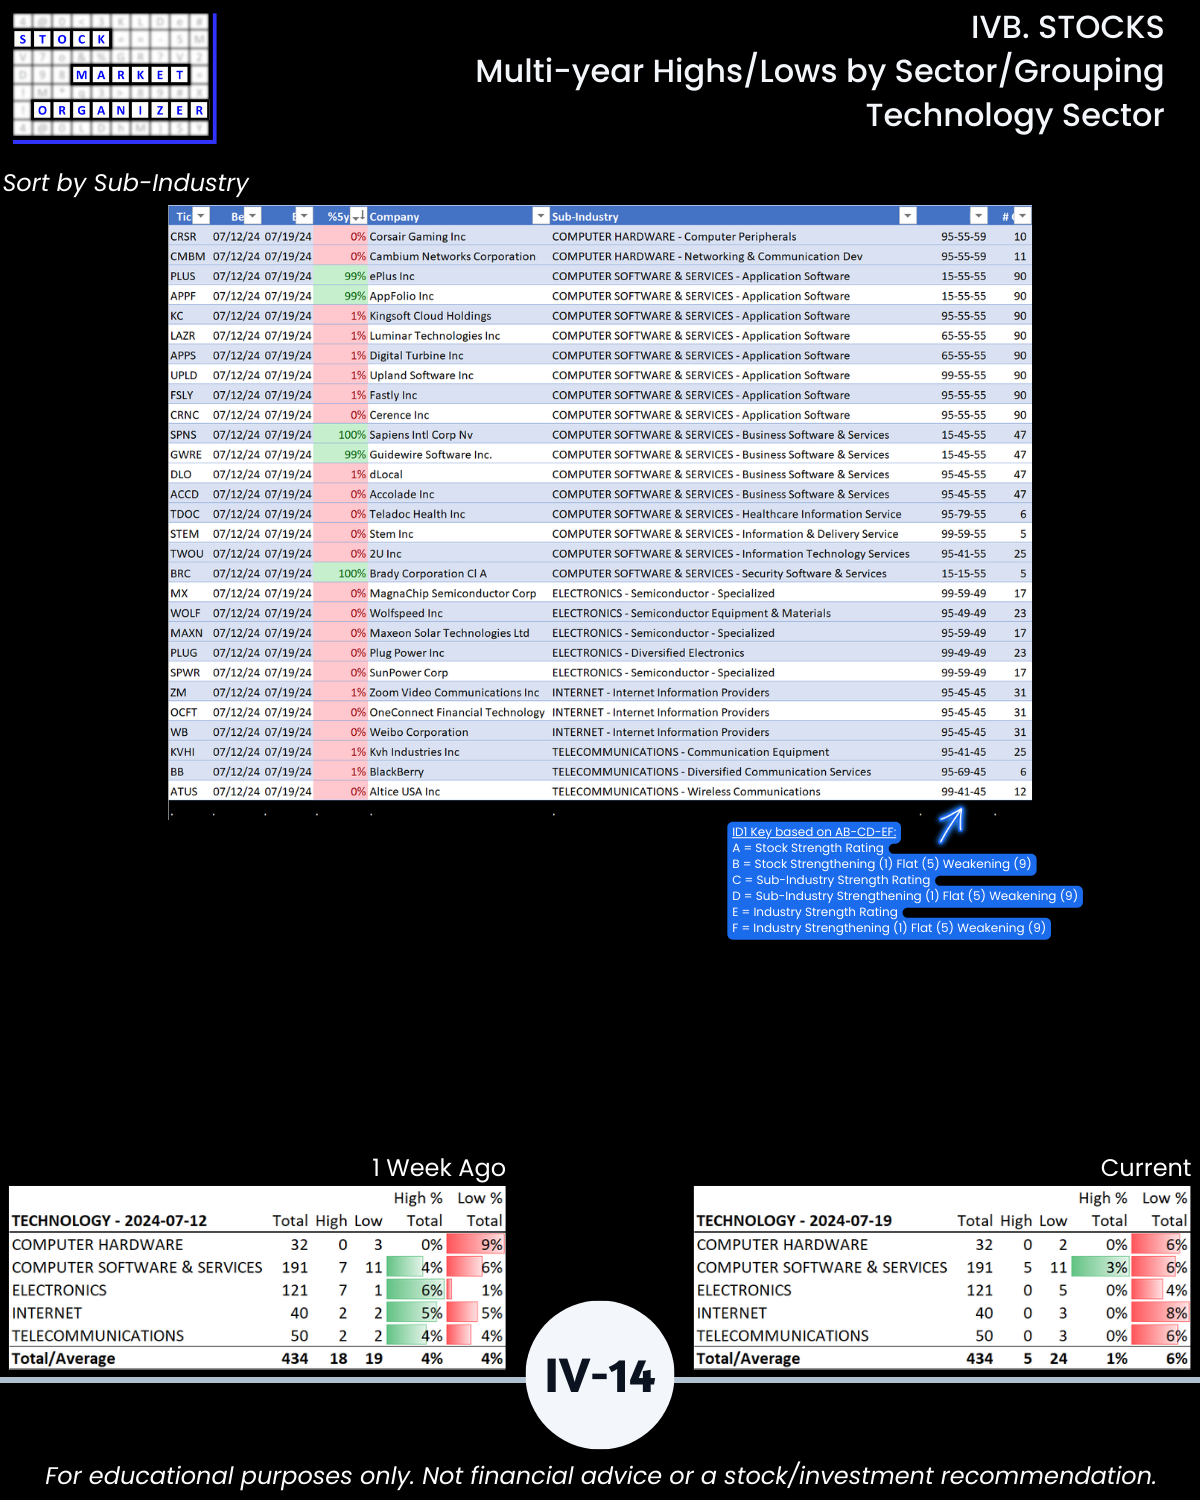
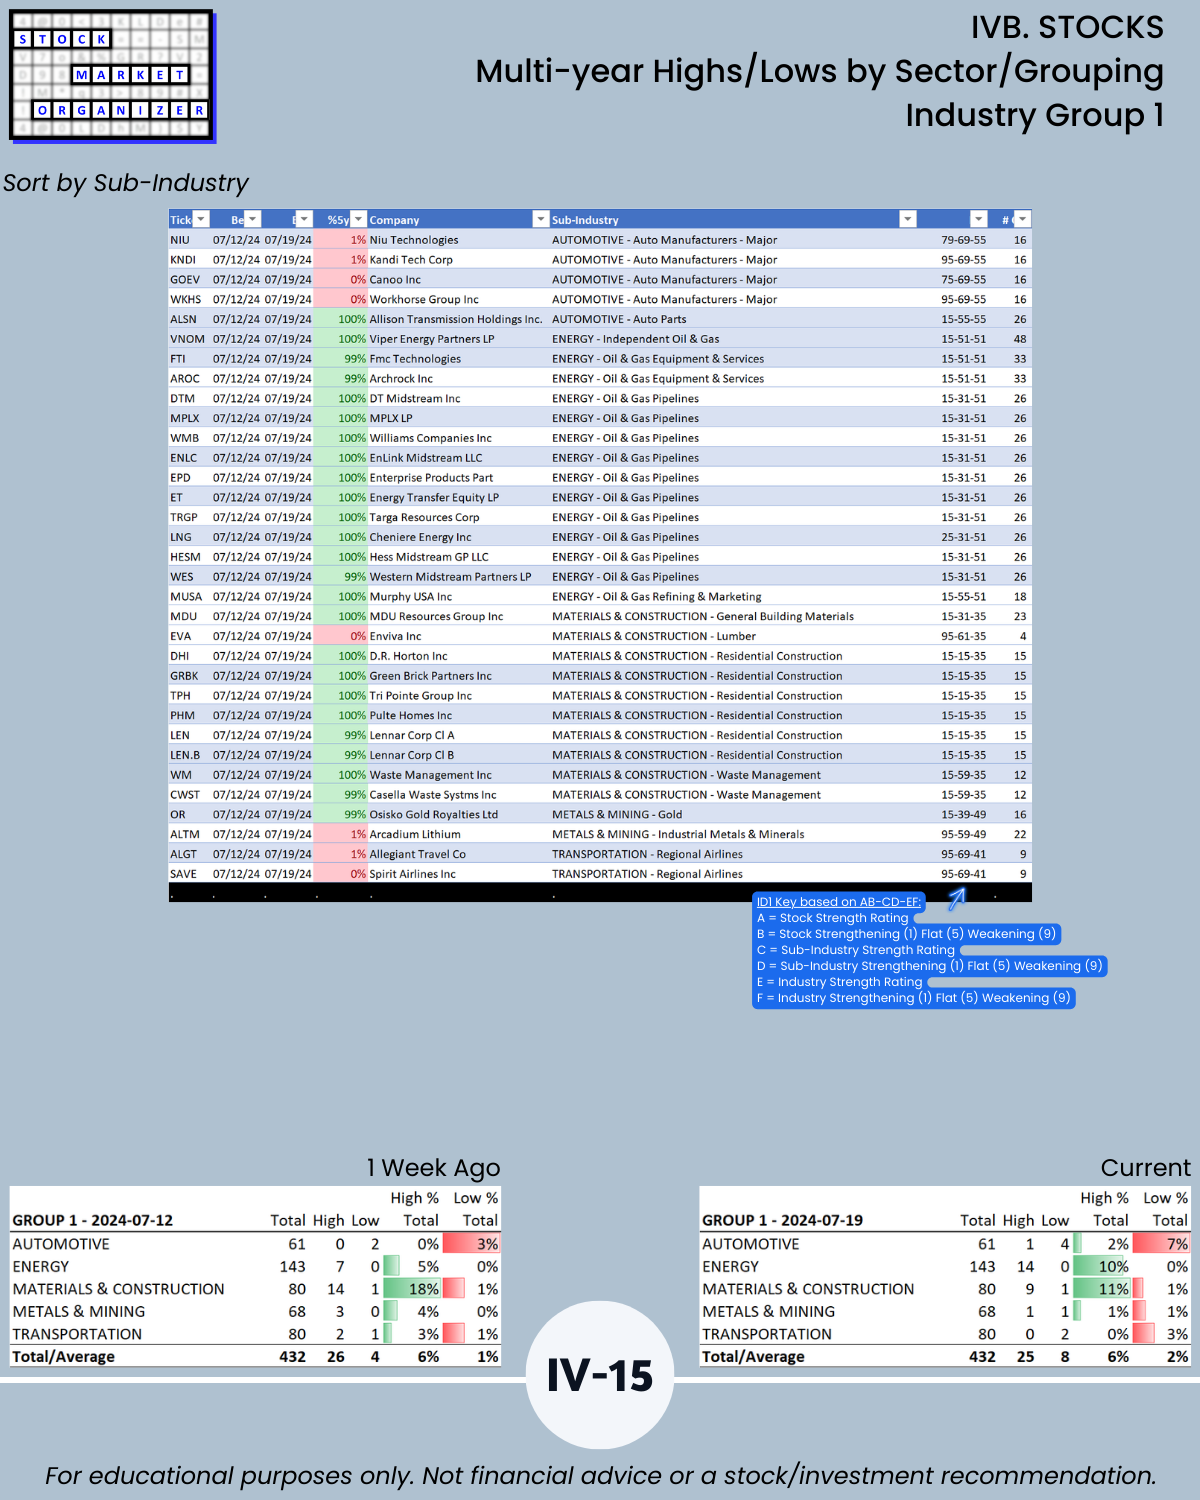
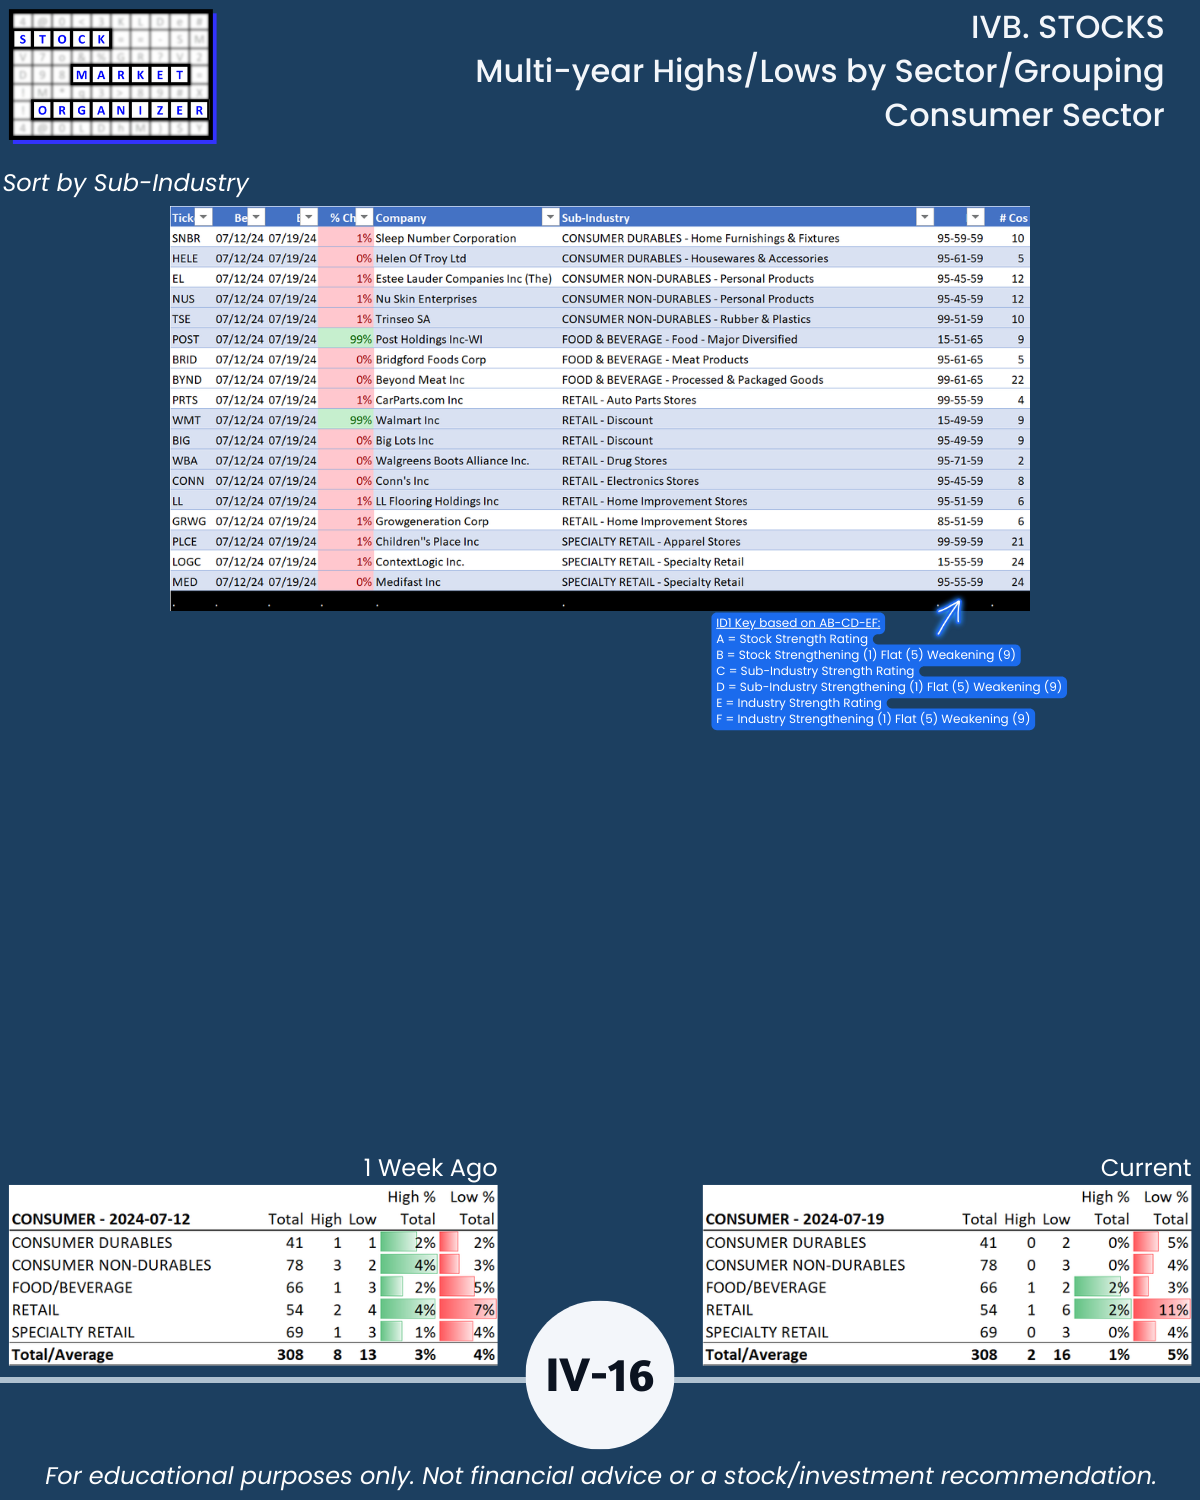
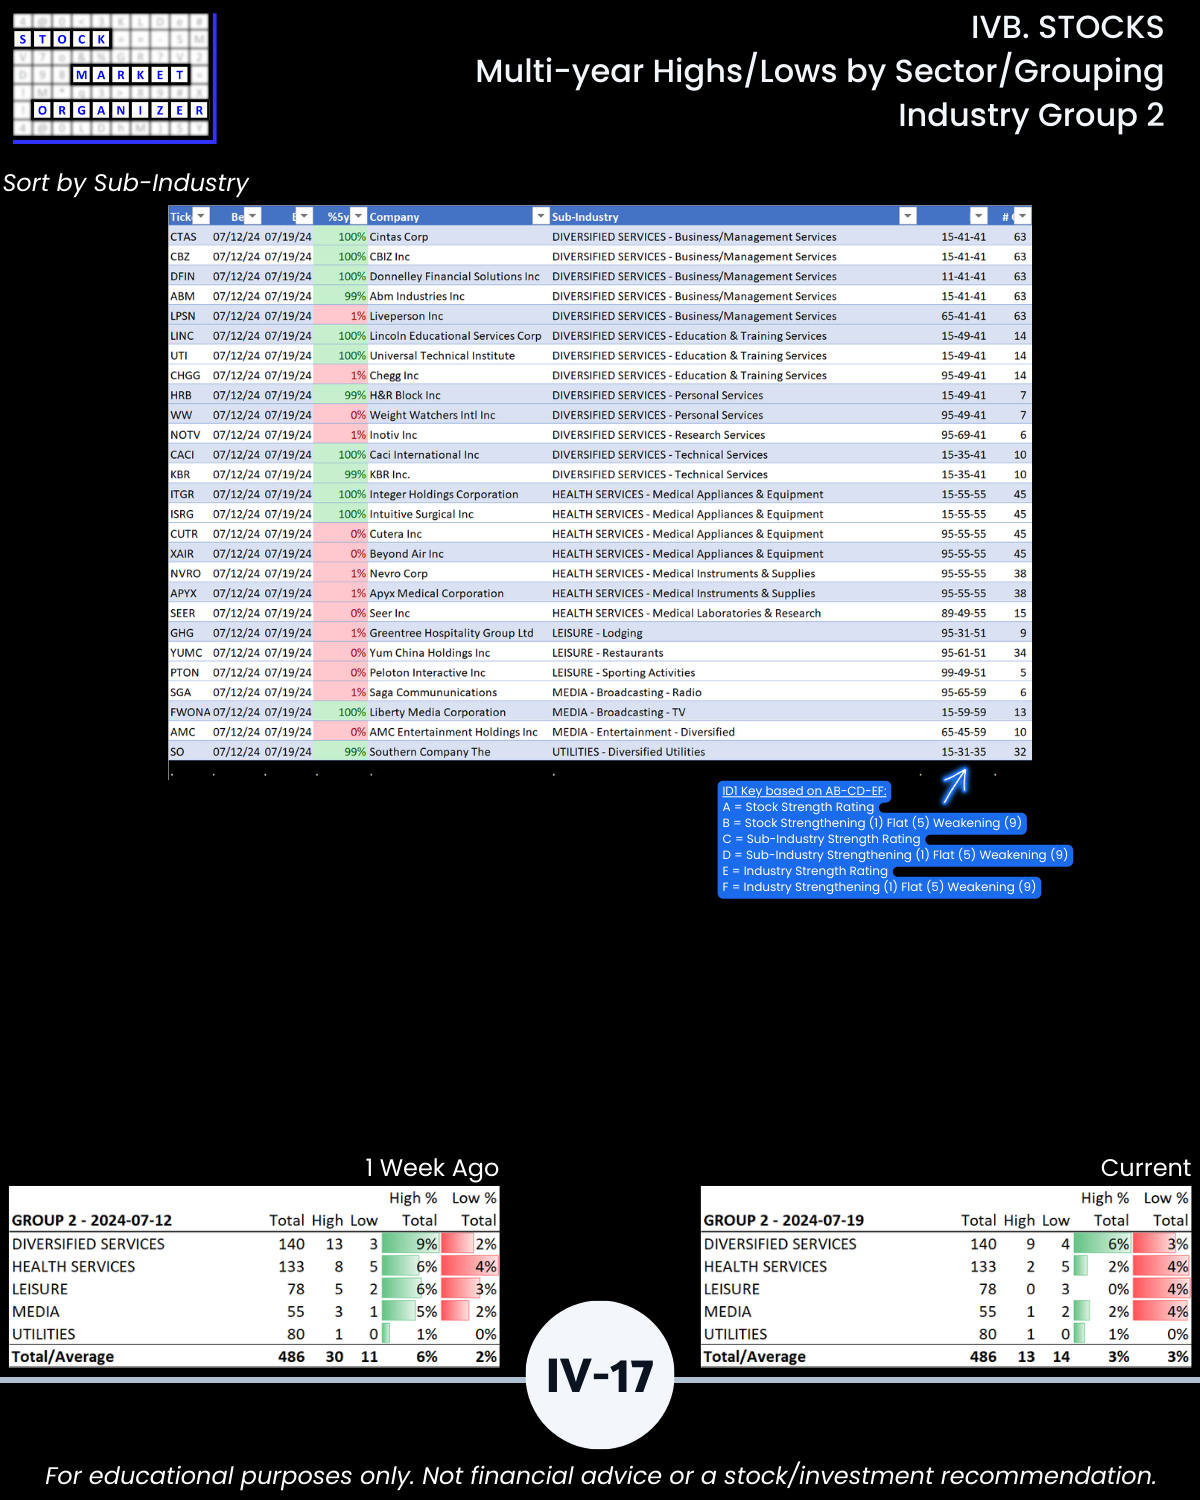
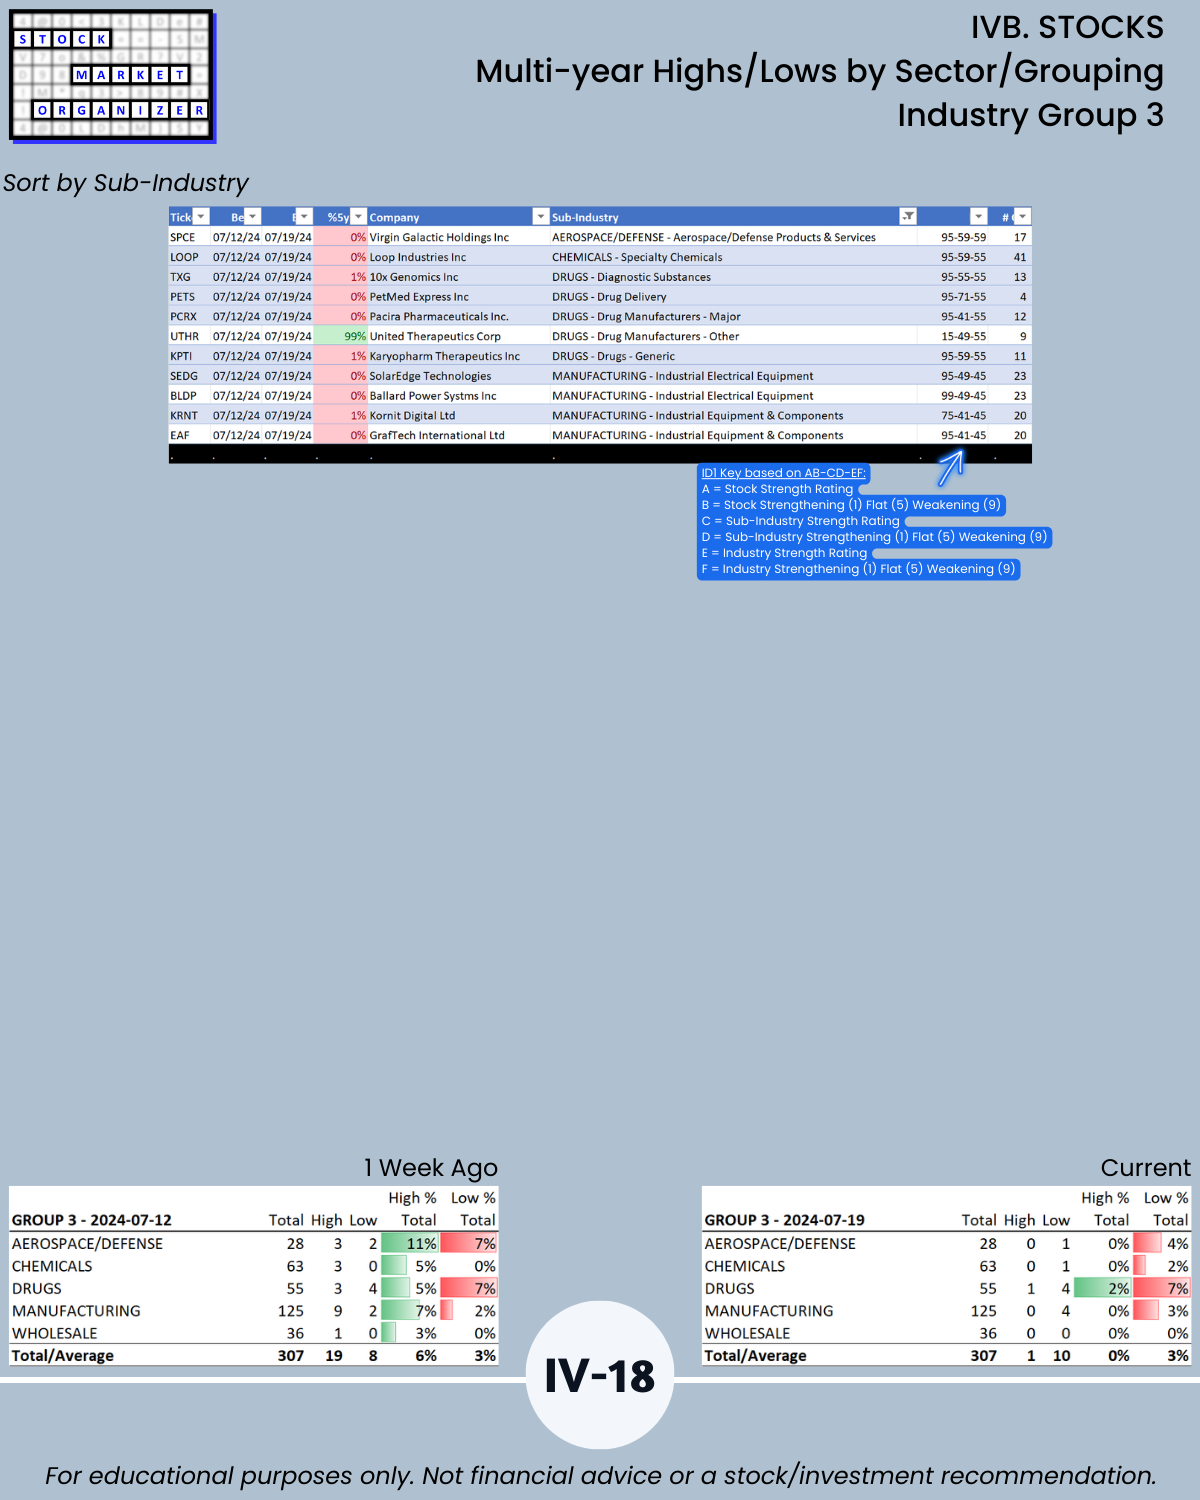
You’ve seen 52-week highs and lows… this section reveals by sub-industry and industry the stocks at or near 5+ year highs and lows (pages IV-13 to IV-18). Should you buy the former and sell the latter? Or vice versa?
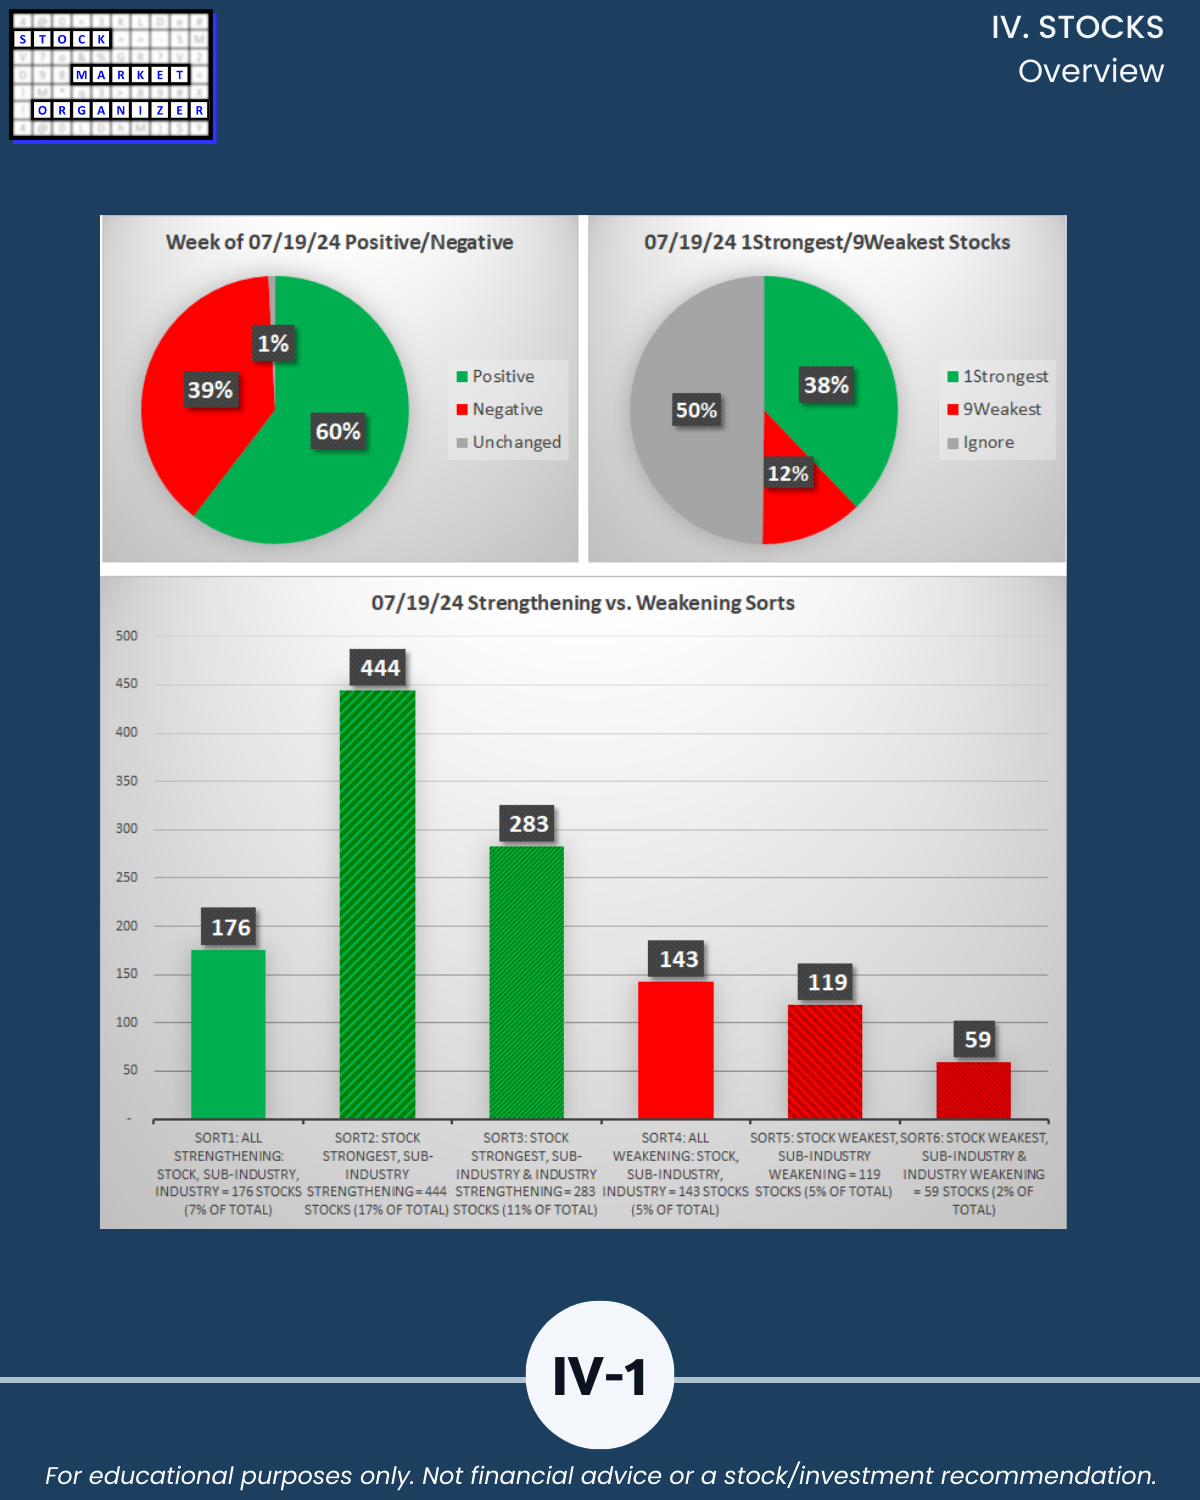
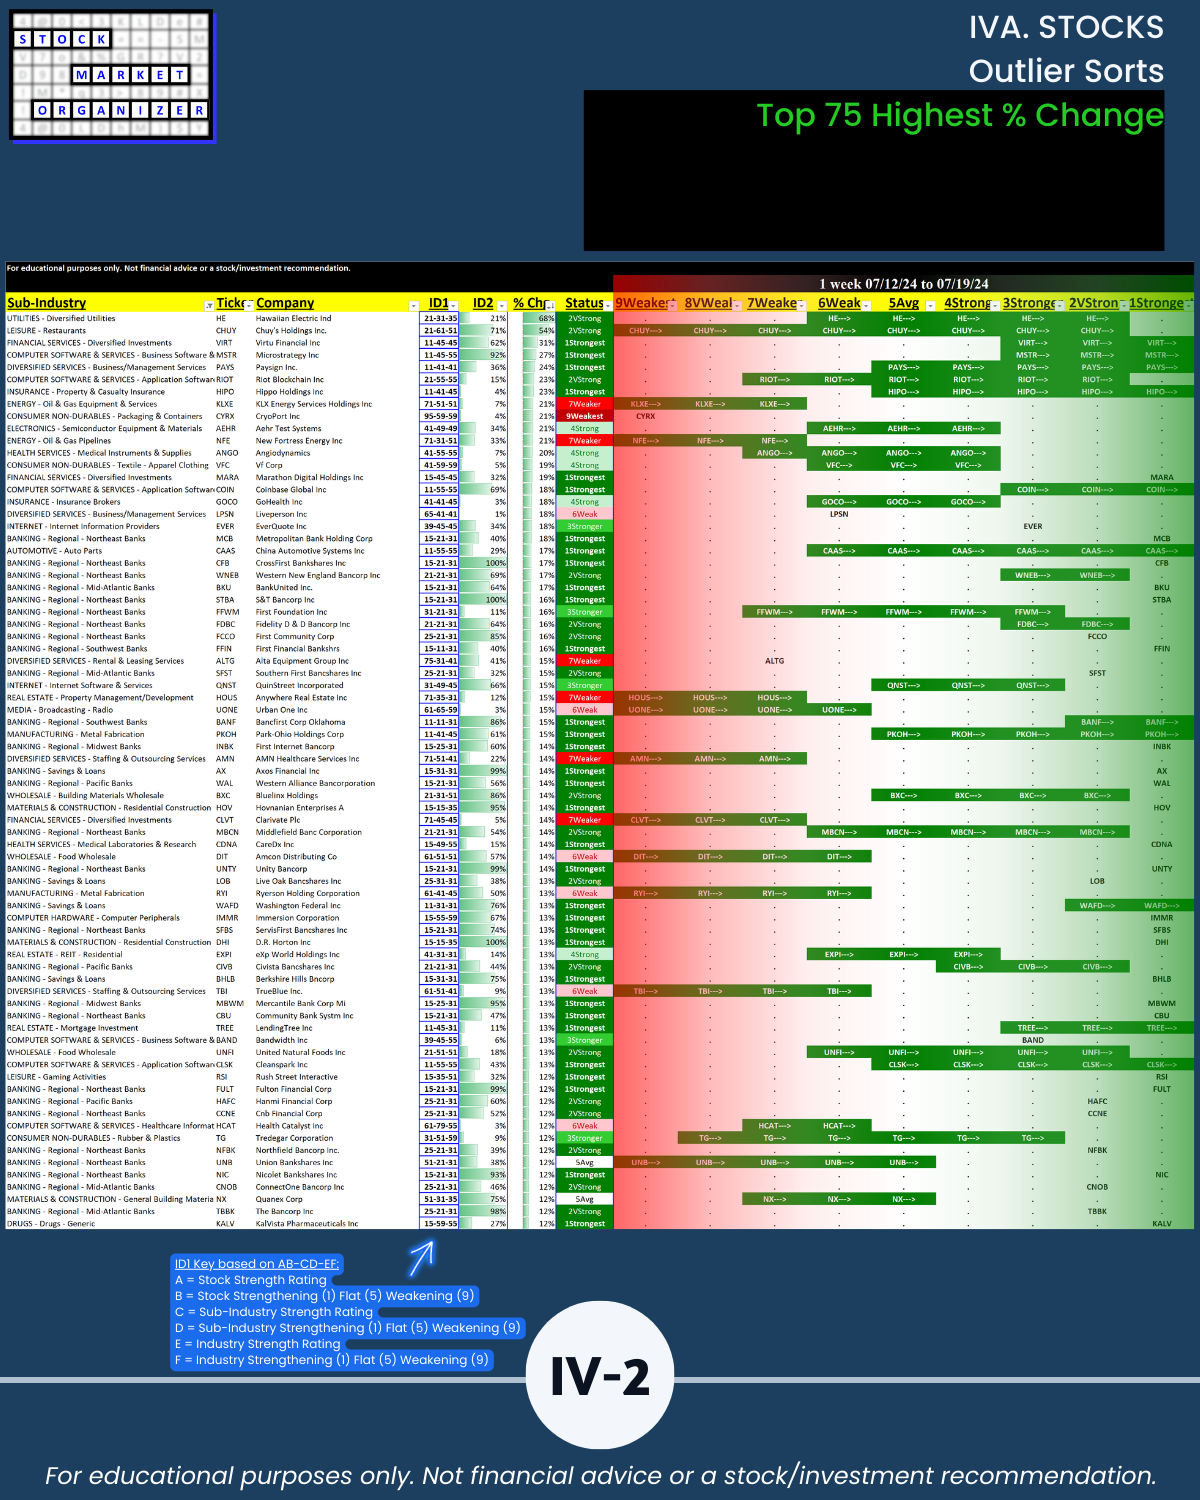
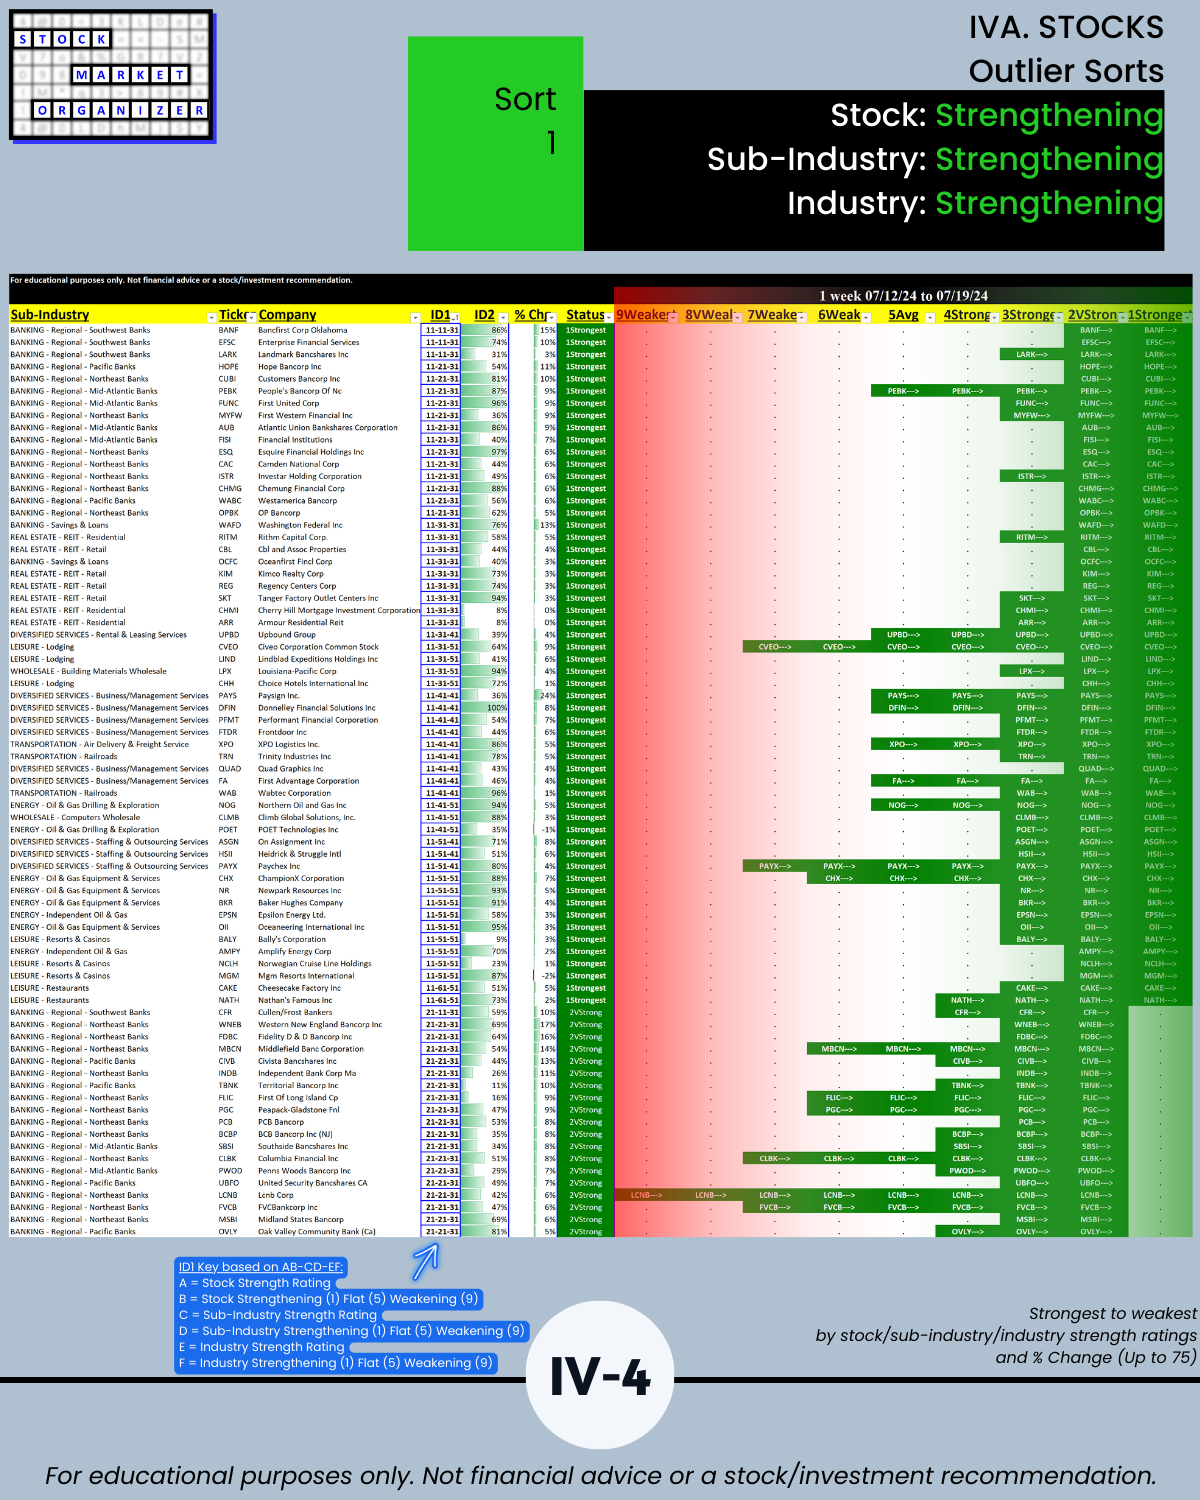
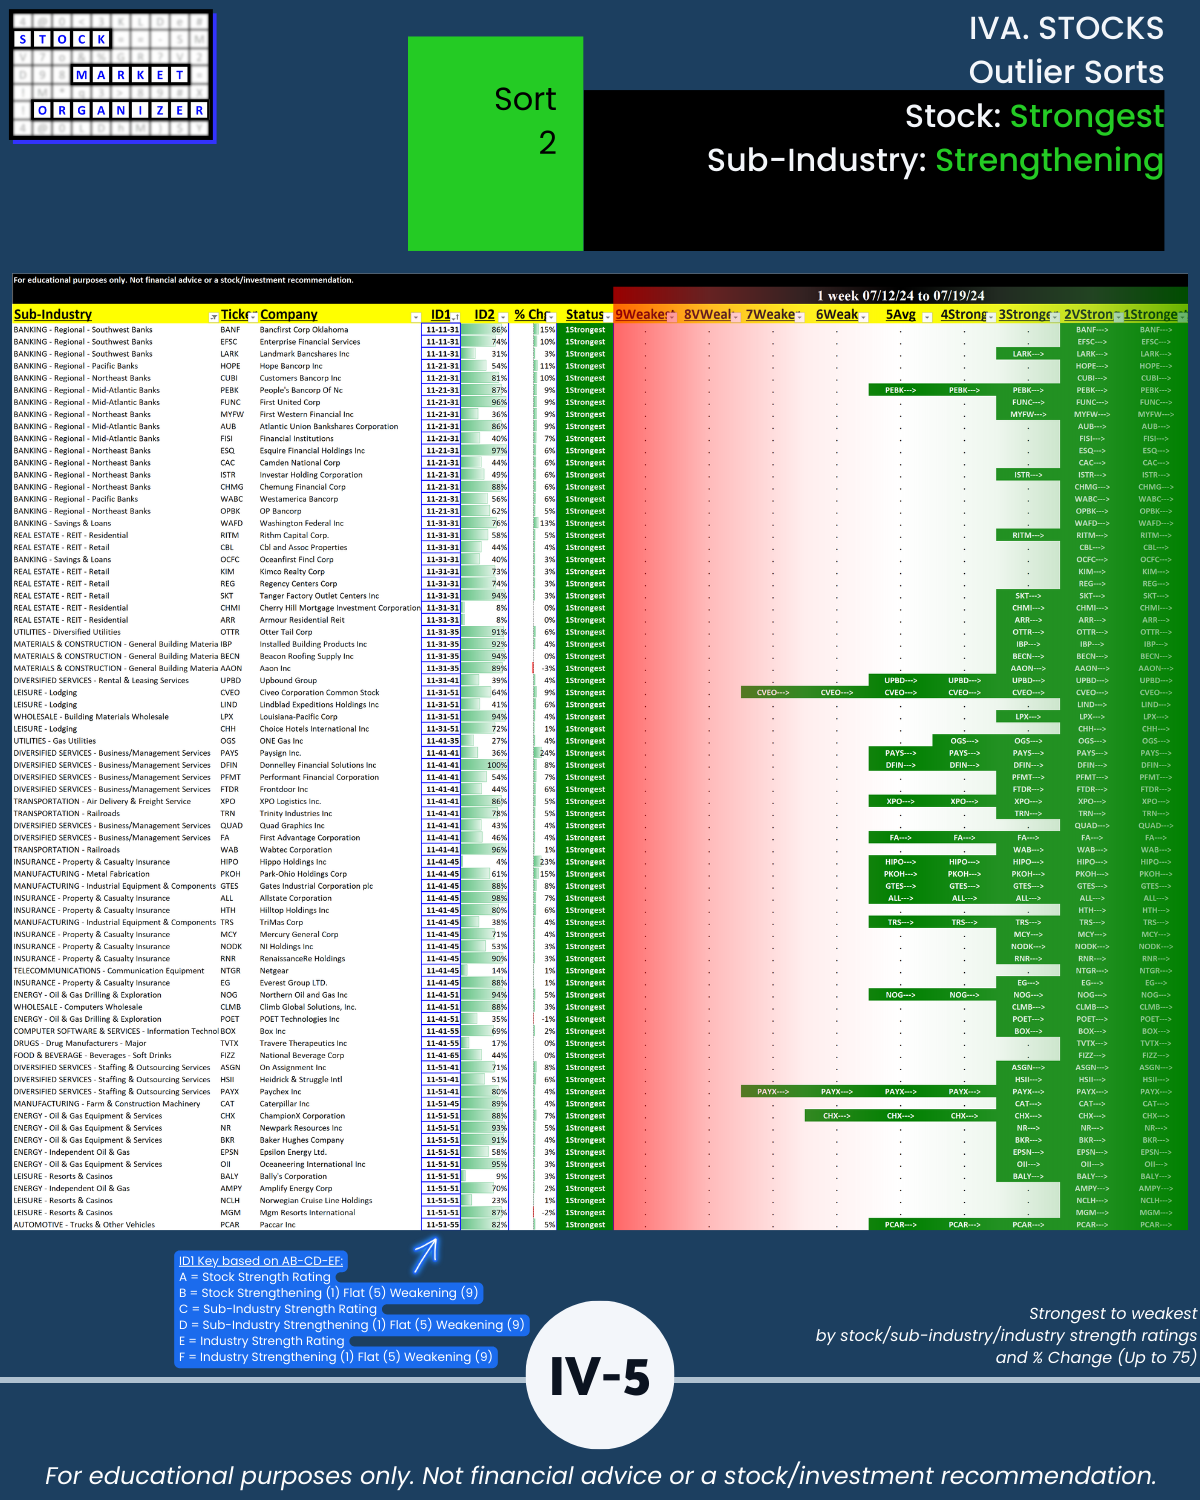
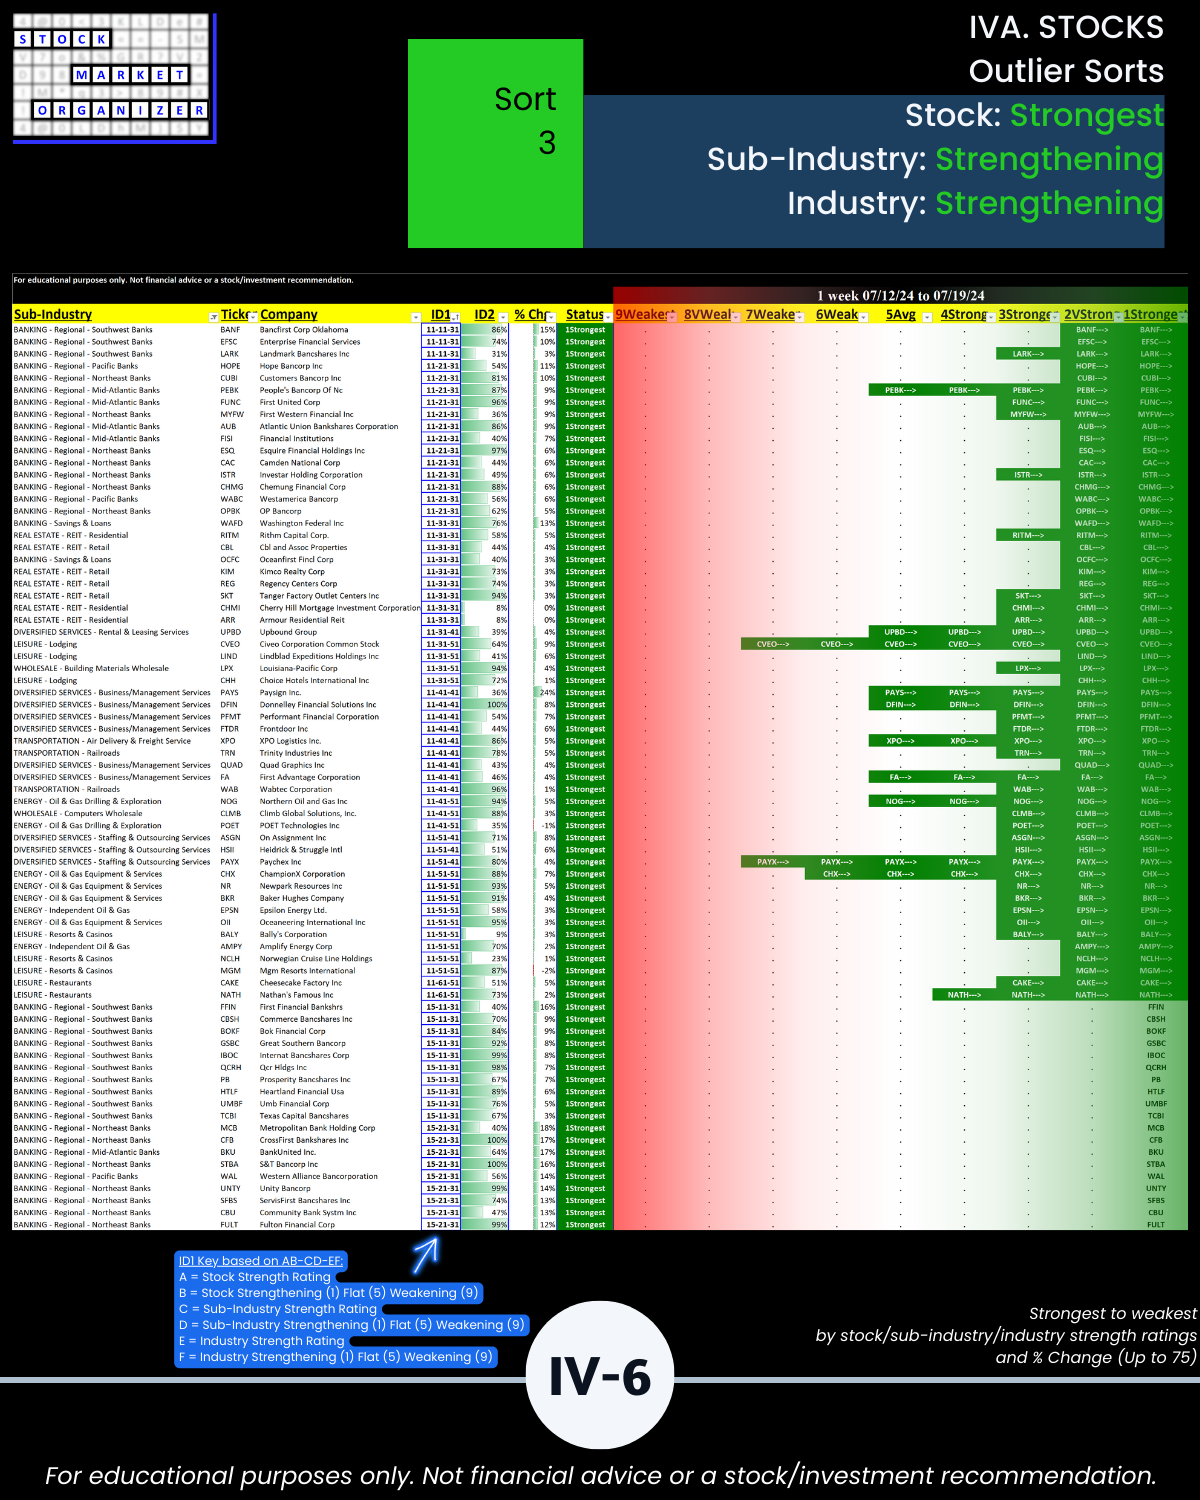
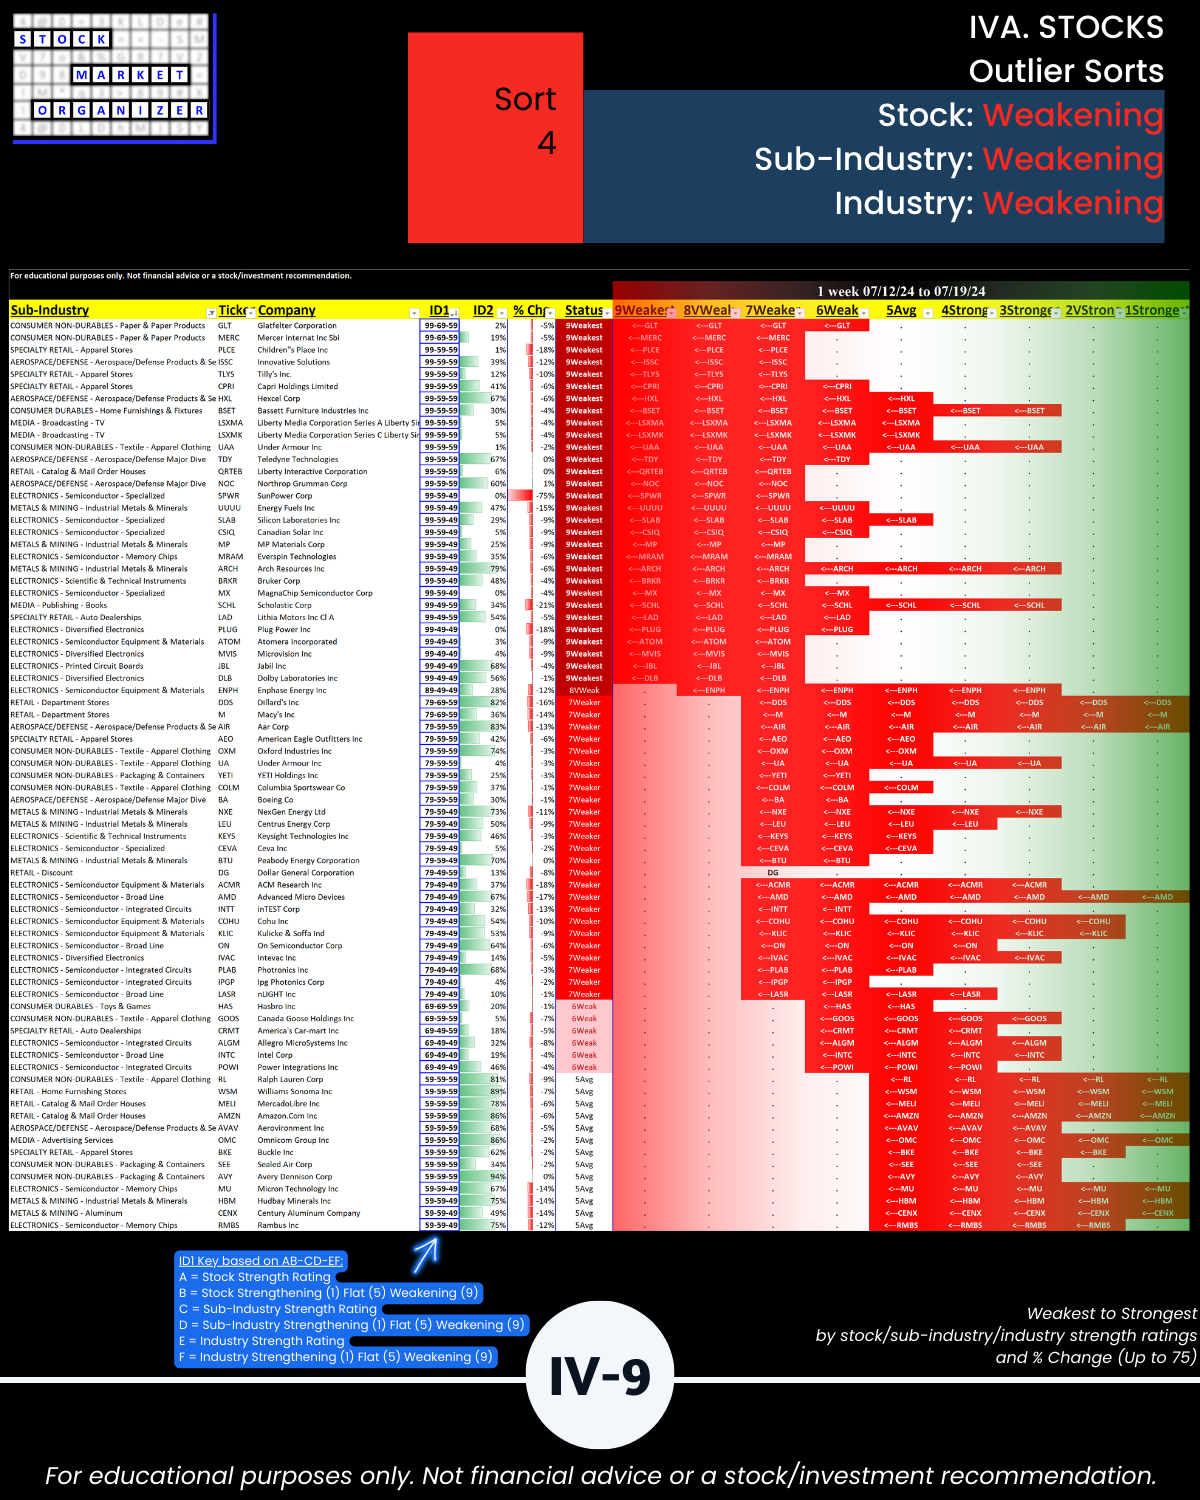
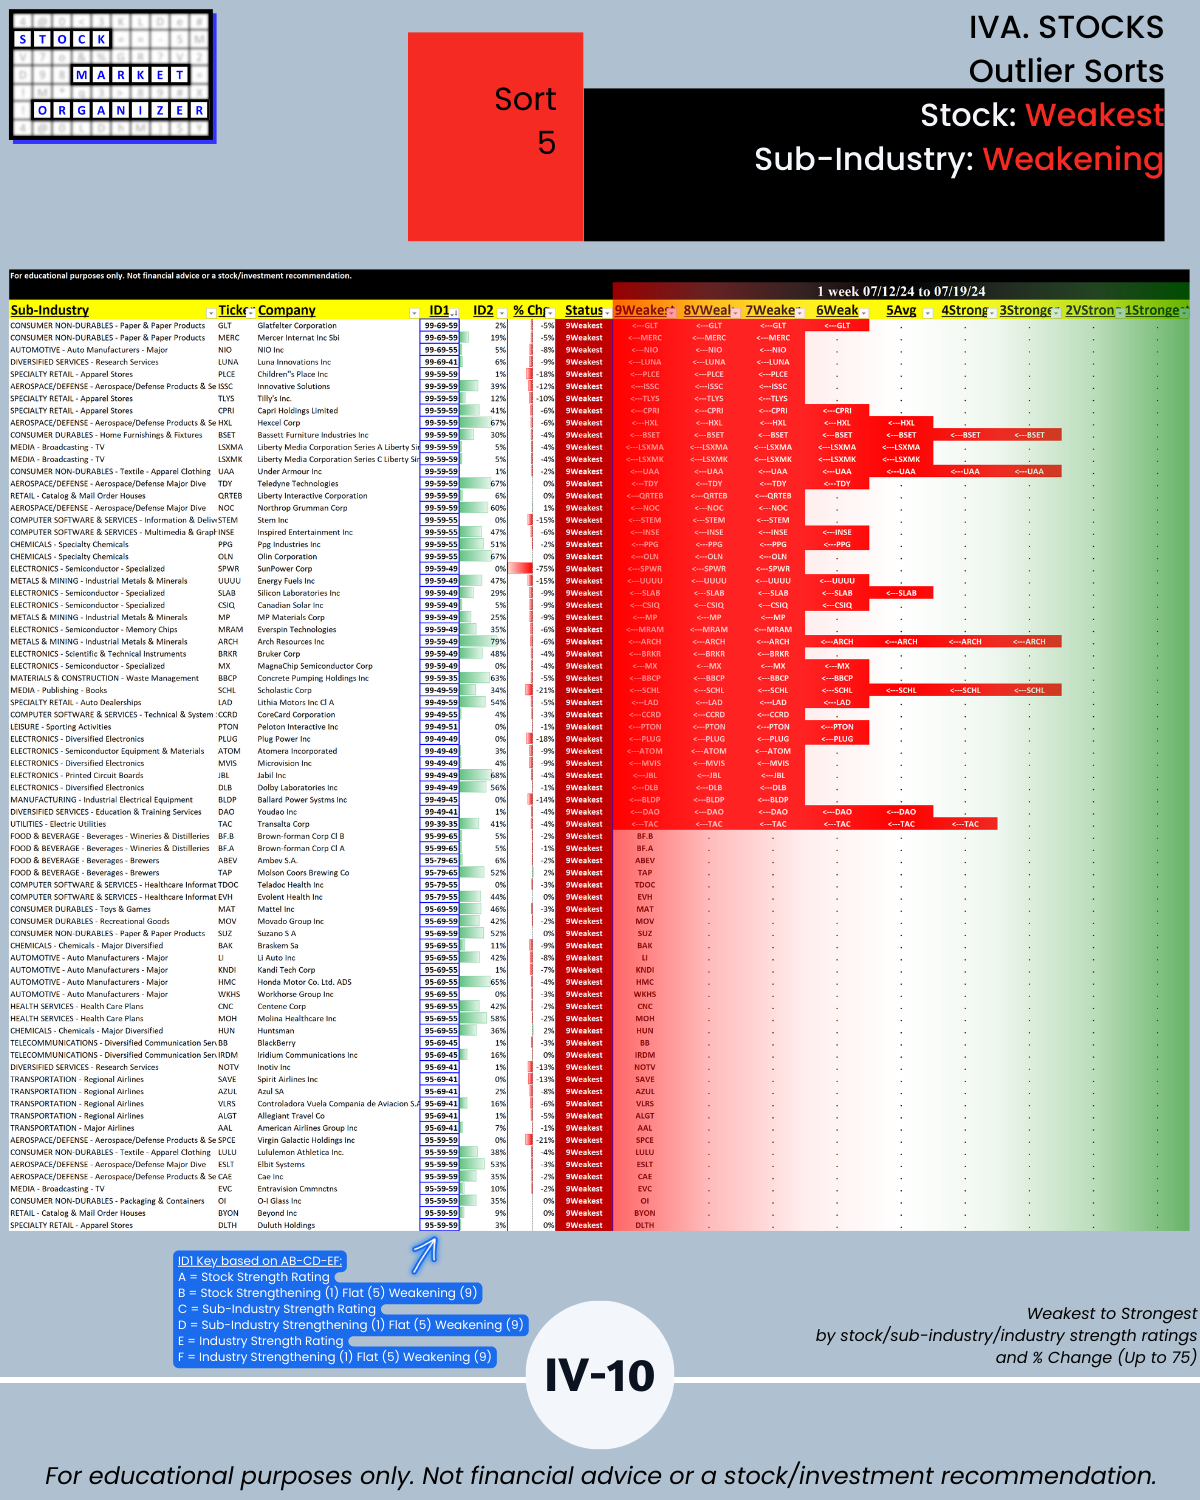
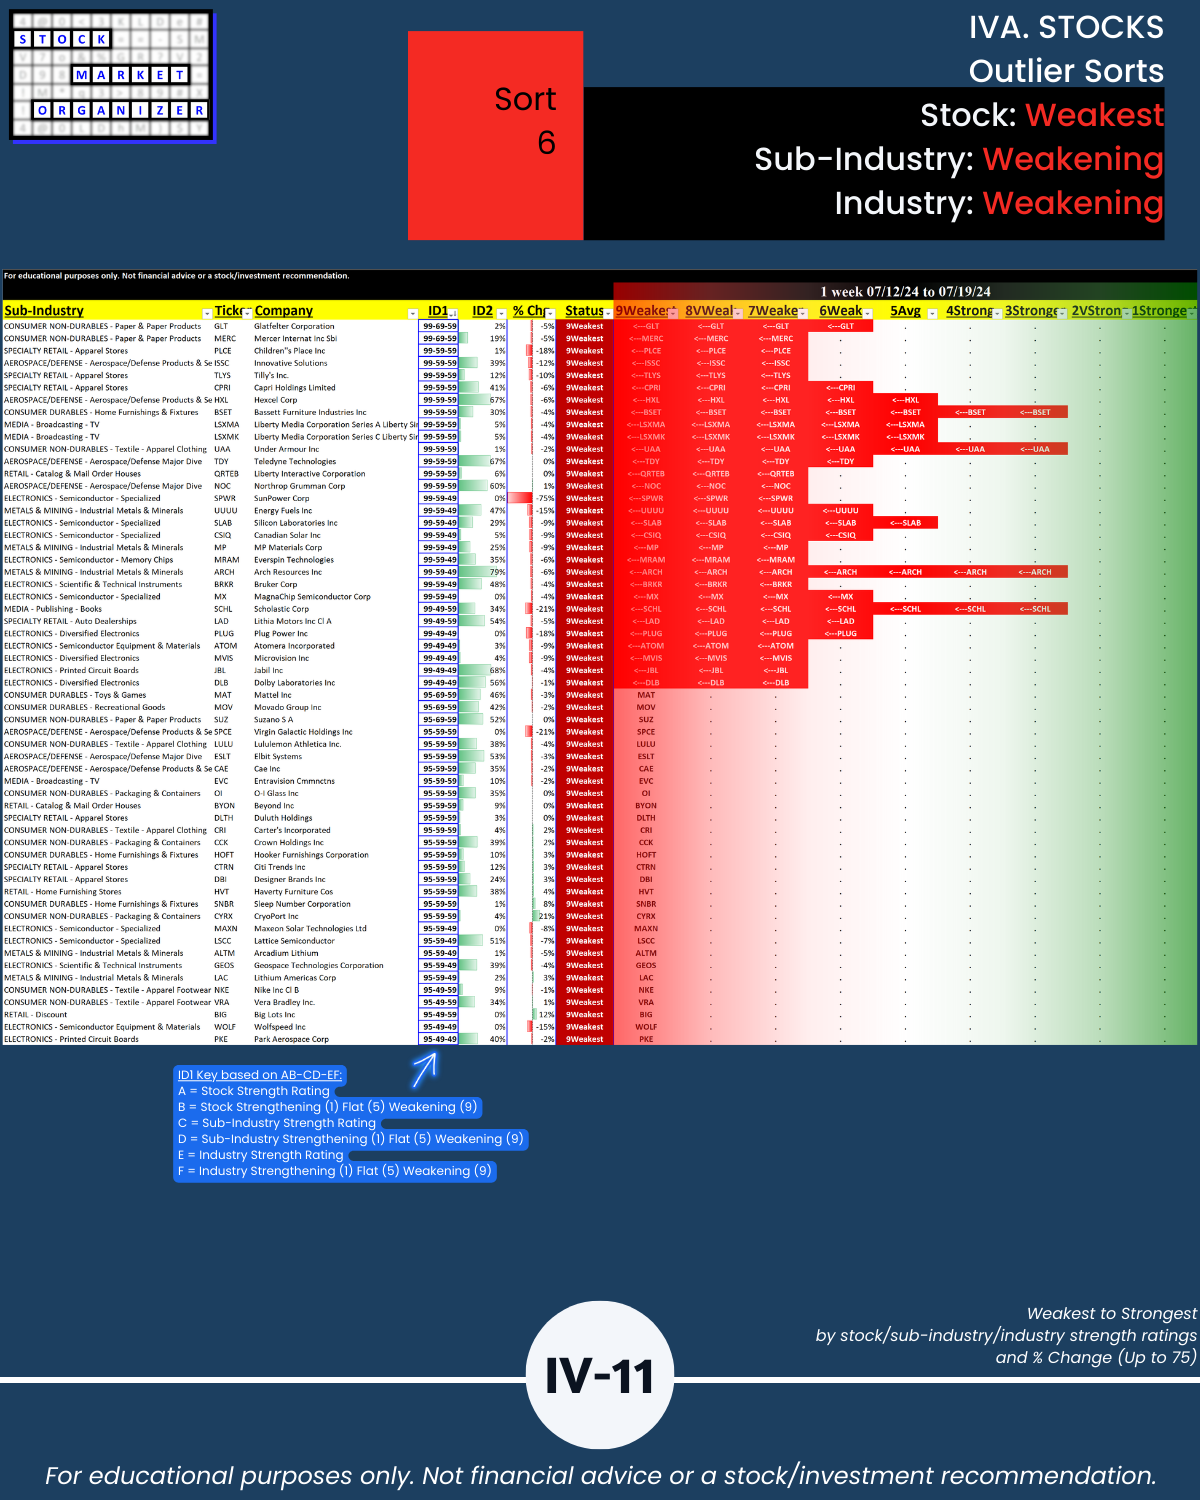
This section also provides Outlier Sorts which reveal practical strengthening and weakening information.
Knowing which stocks to ignore can be helpful. As is objectively knowing which strengthening stocks are also supported by strengthening sub-industries and strengthening industries (Sort1, page IV-4).
Others may be interested in stocks rated 9Weakest in weakening sub-industries and weakening industries (Sort6, page IV-11).
FINAL NOTE
These are sample sorts. With the underlying information, I can generate for you other enlightening perspectives unavailable elsewhere. If you are interested in finding out more, please contact me.
Why do you care? (Part 2)
This report may resonate with you if you subscribe to the following:
- The stock market does not have to be so complicated.
- “What” matters, not “why.”
- Market conditions matter.
- The 100%+ rally begins with a 10% rally.
- The multi-month rally begins with one up week. (Also applies to declines.)
- The stronger your stocks, the greener your P&L.
See report below for more detail.
I. MARKET Prologue Critical Concepts/Market Strength Score


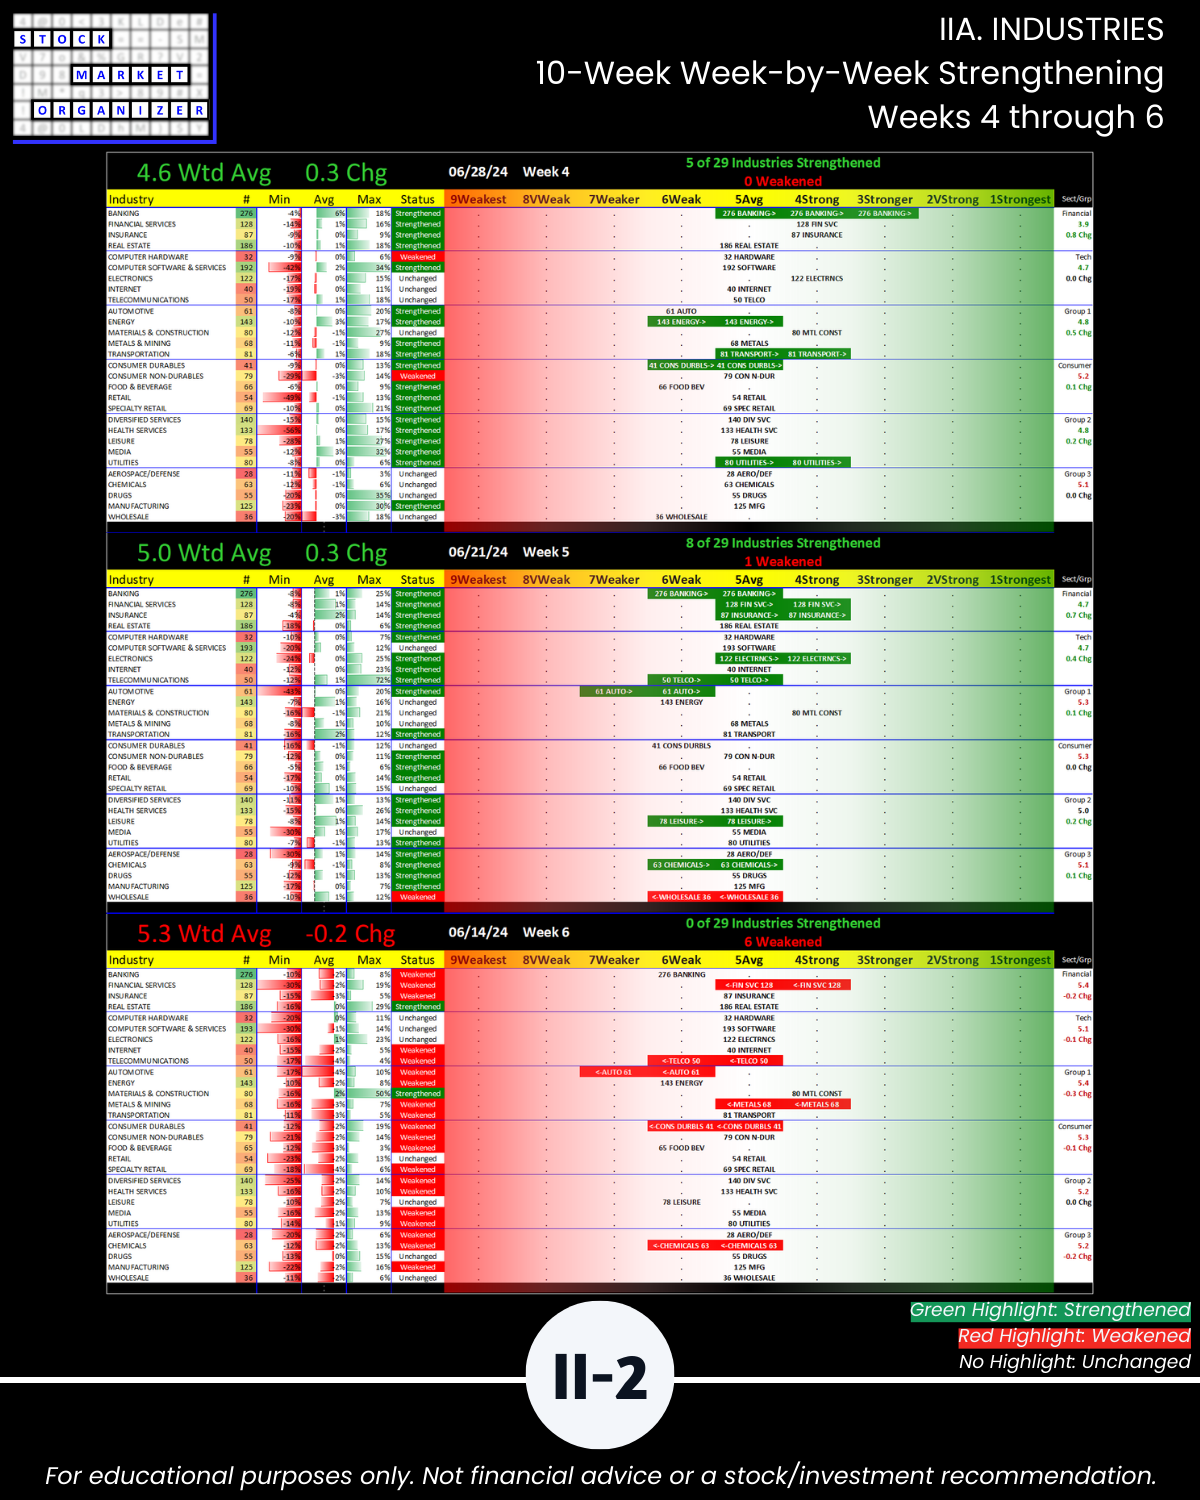
IIA. INDUSTRIES 10-Week Week-by-Week Strengthening
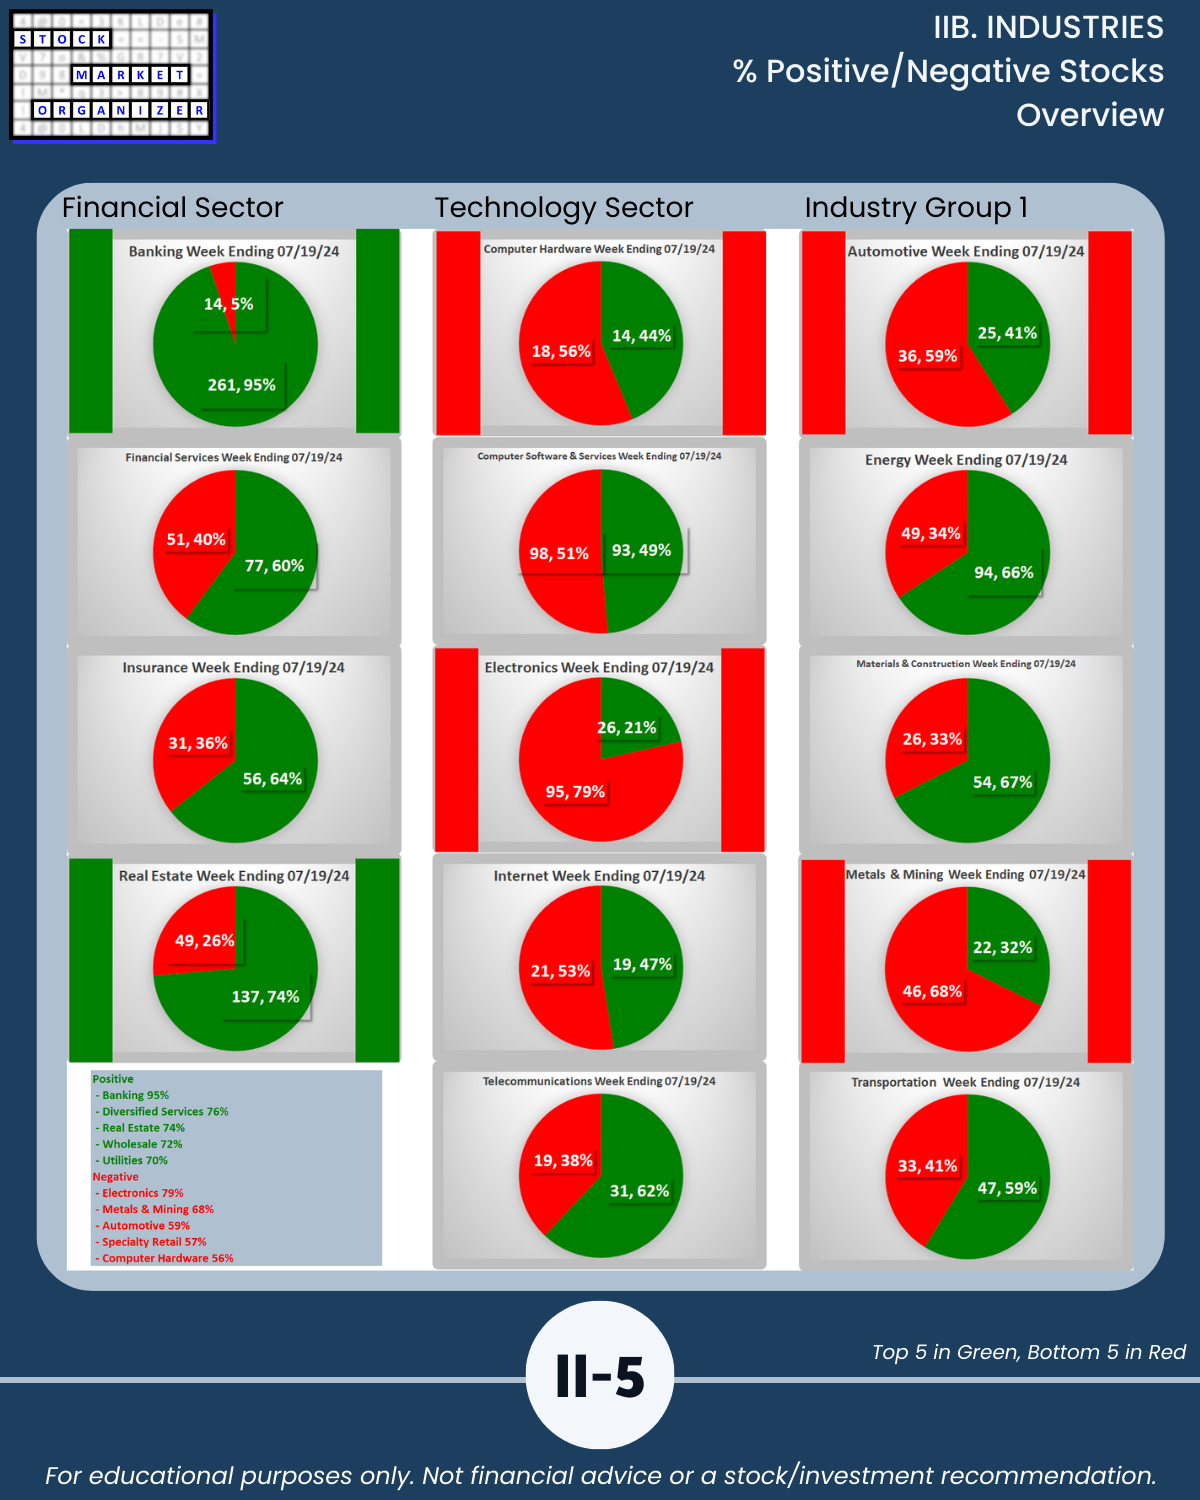
IIB. INDUSTRIES % Positive/Negative Stocks
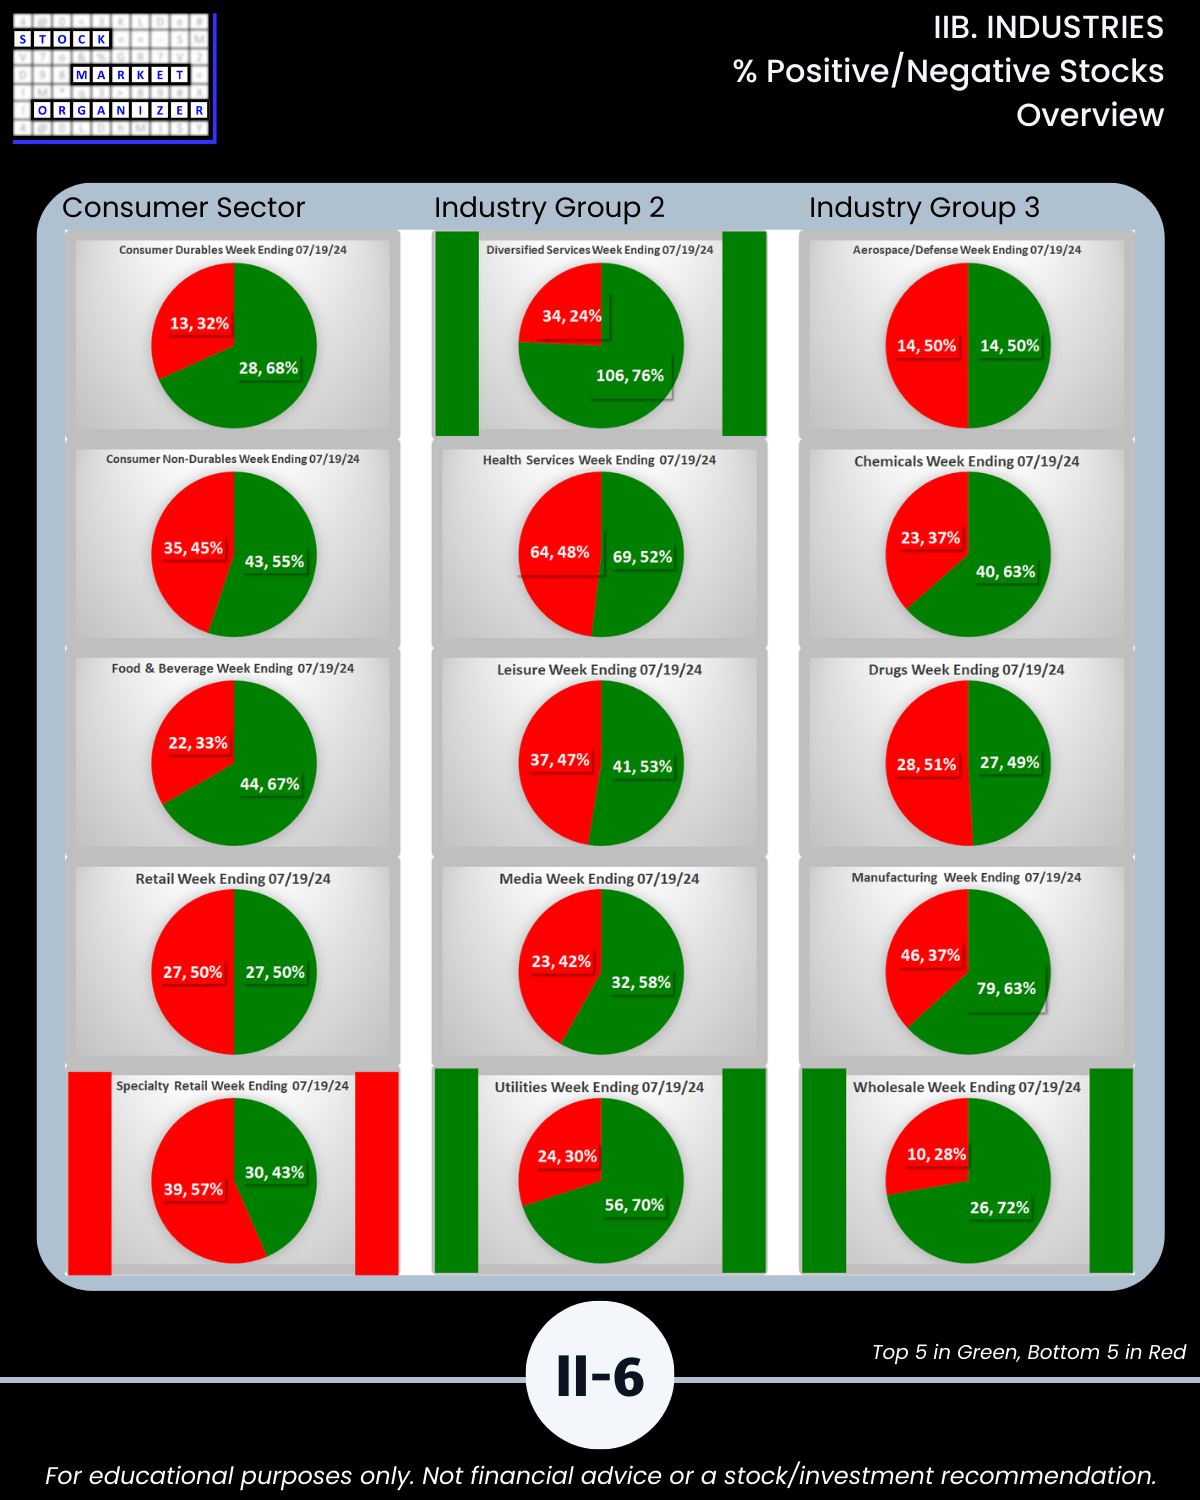
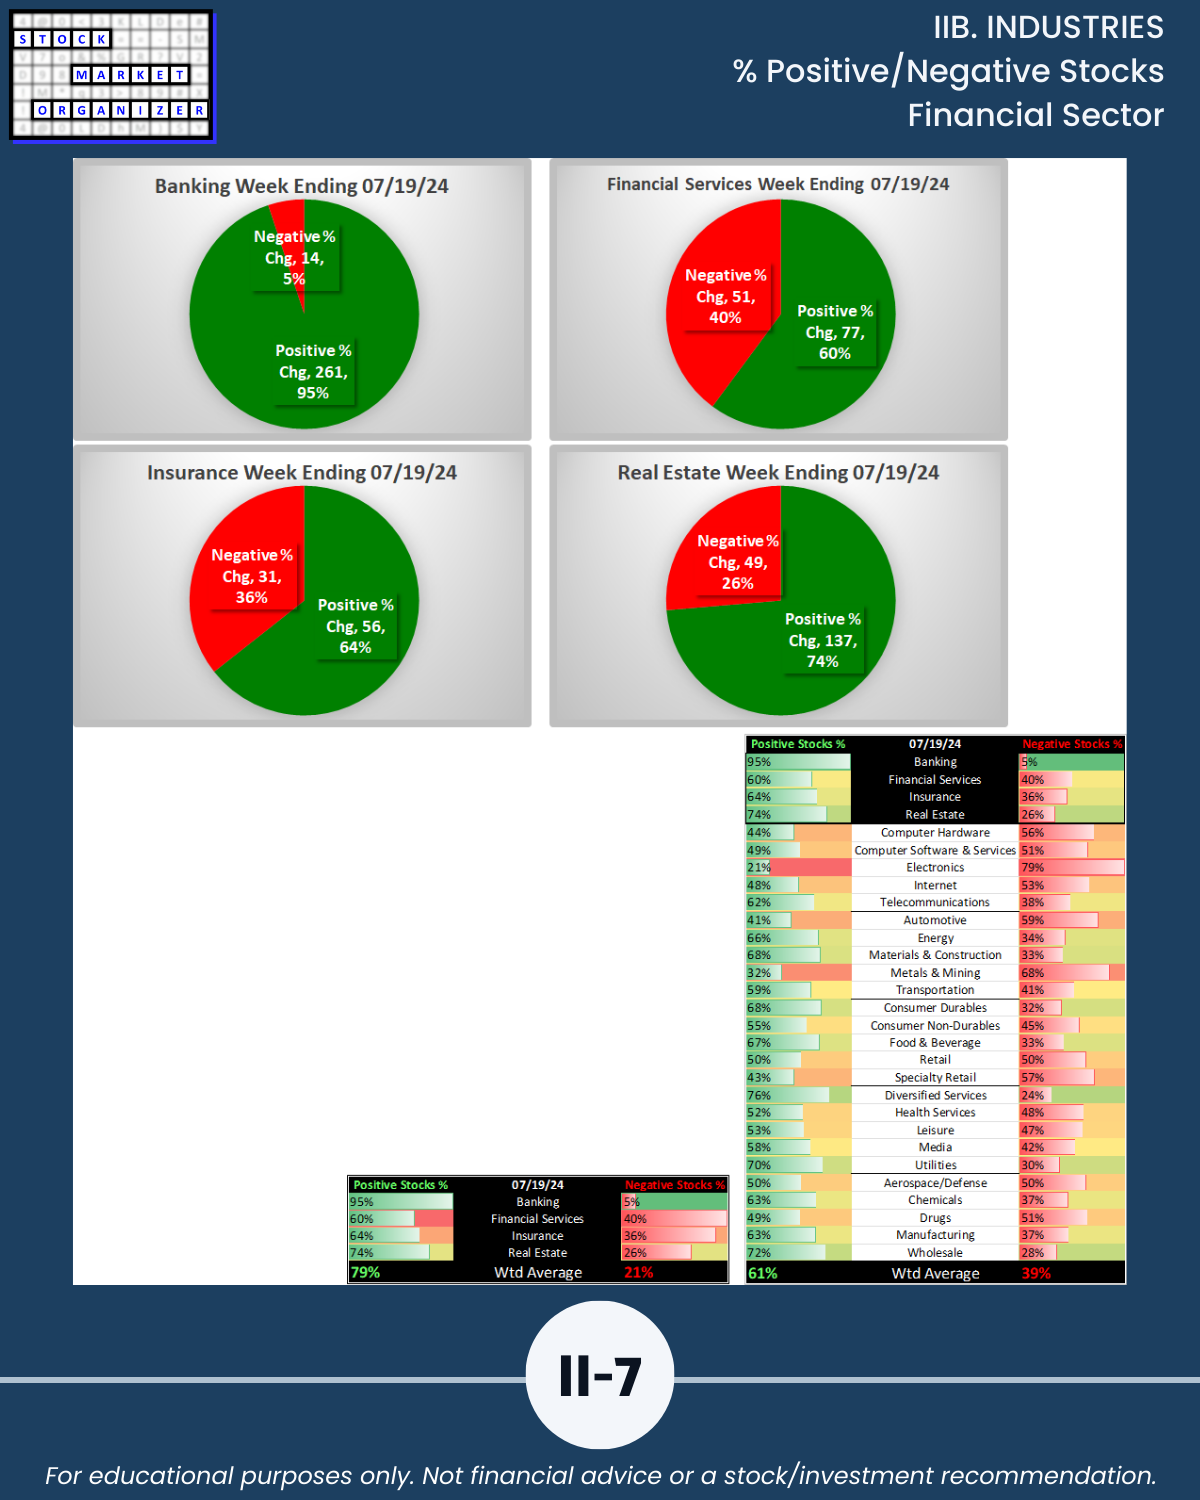
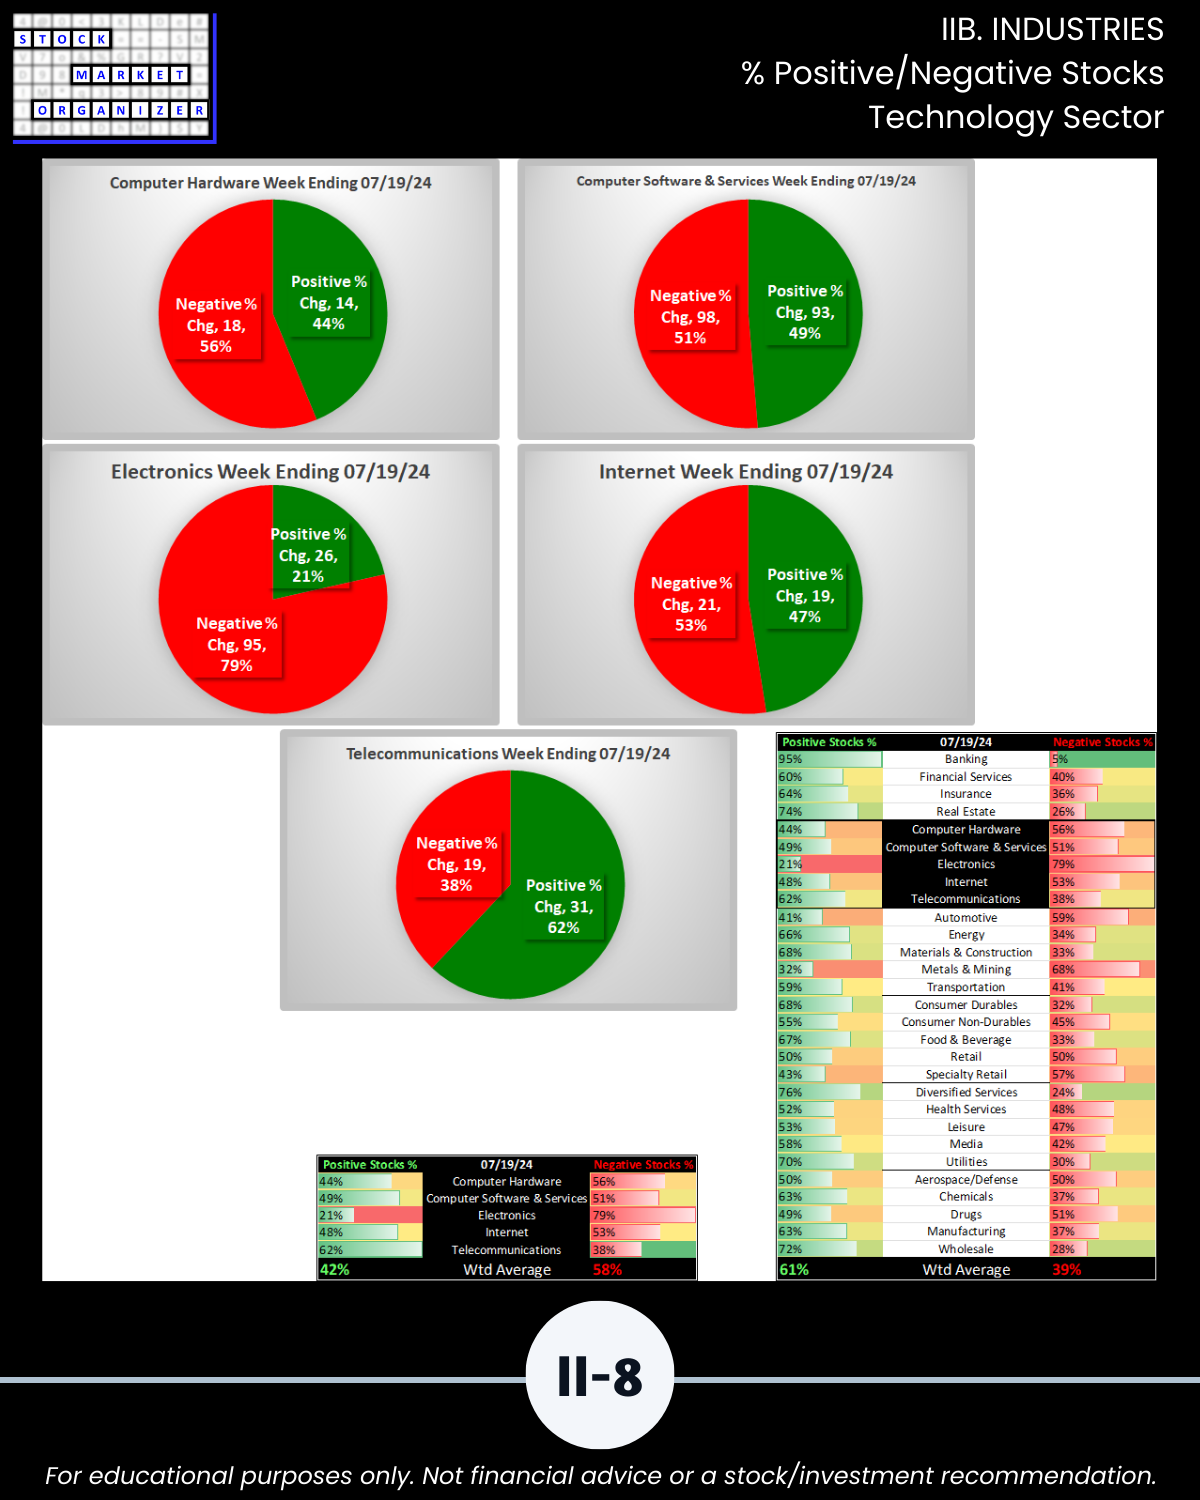
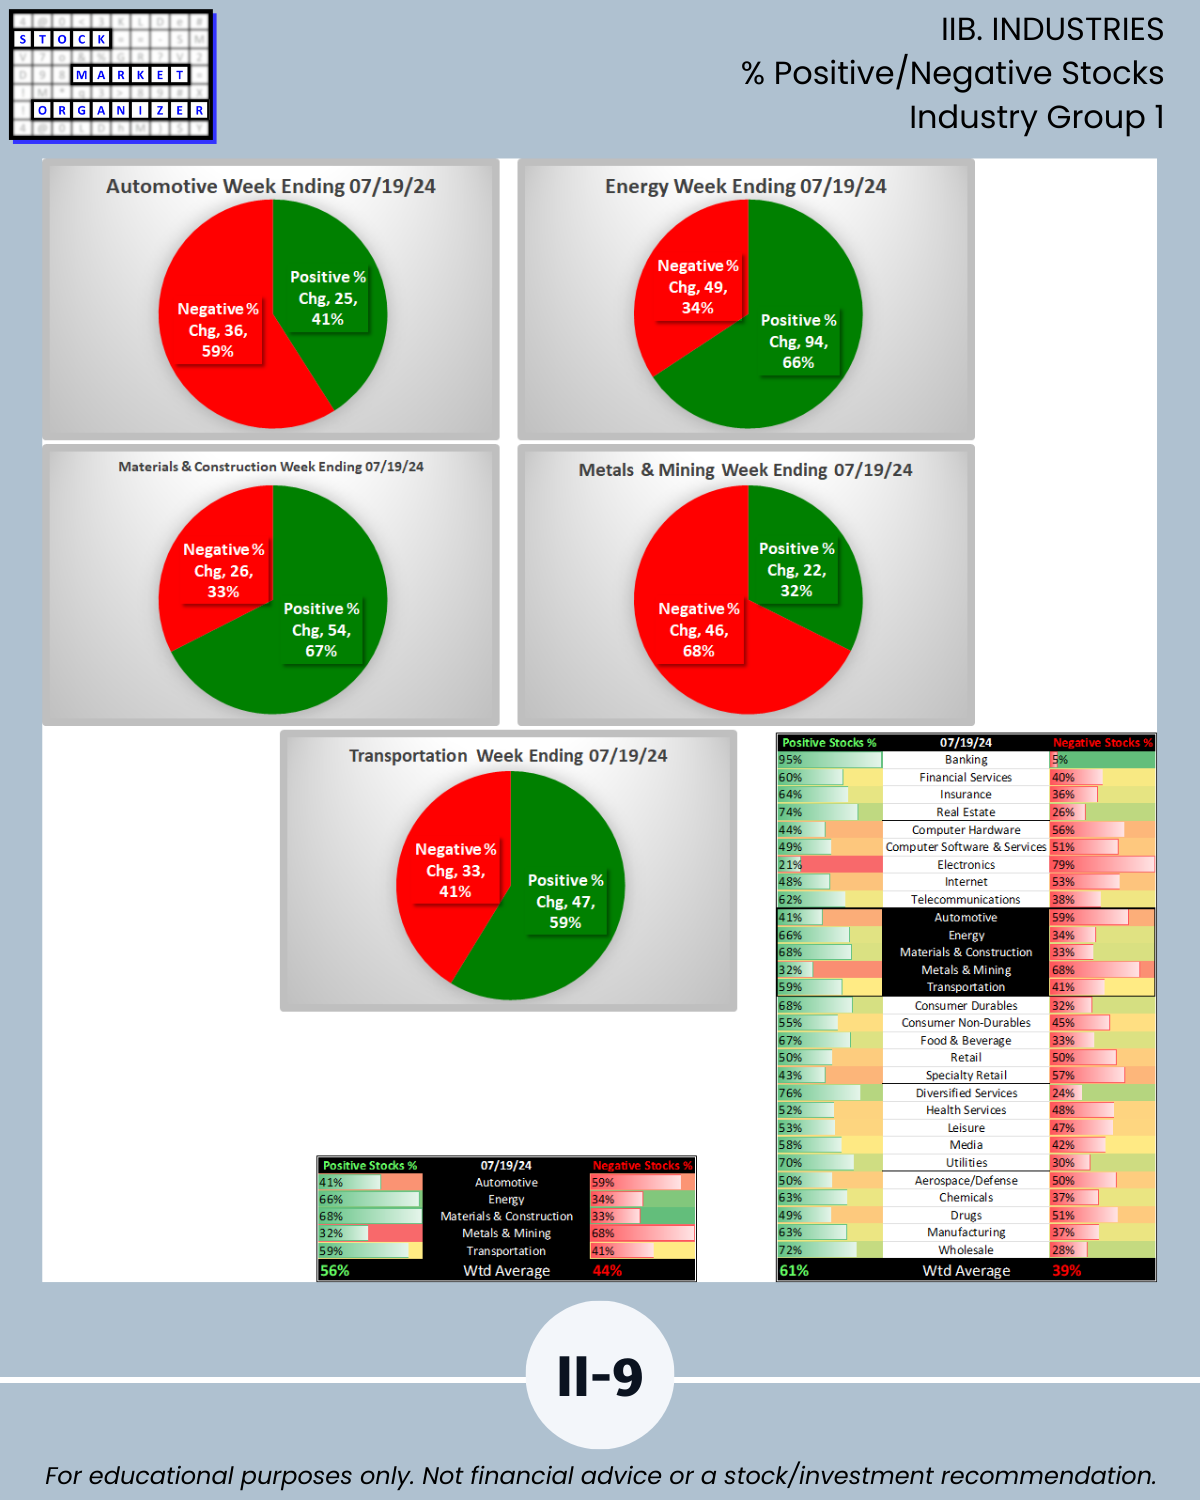
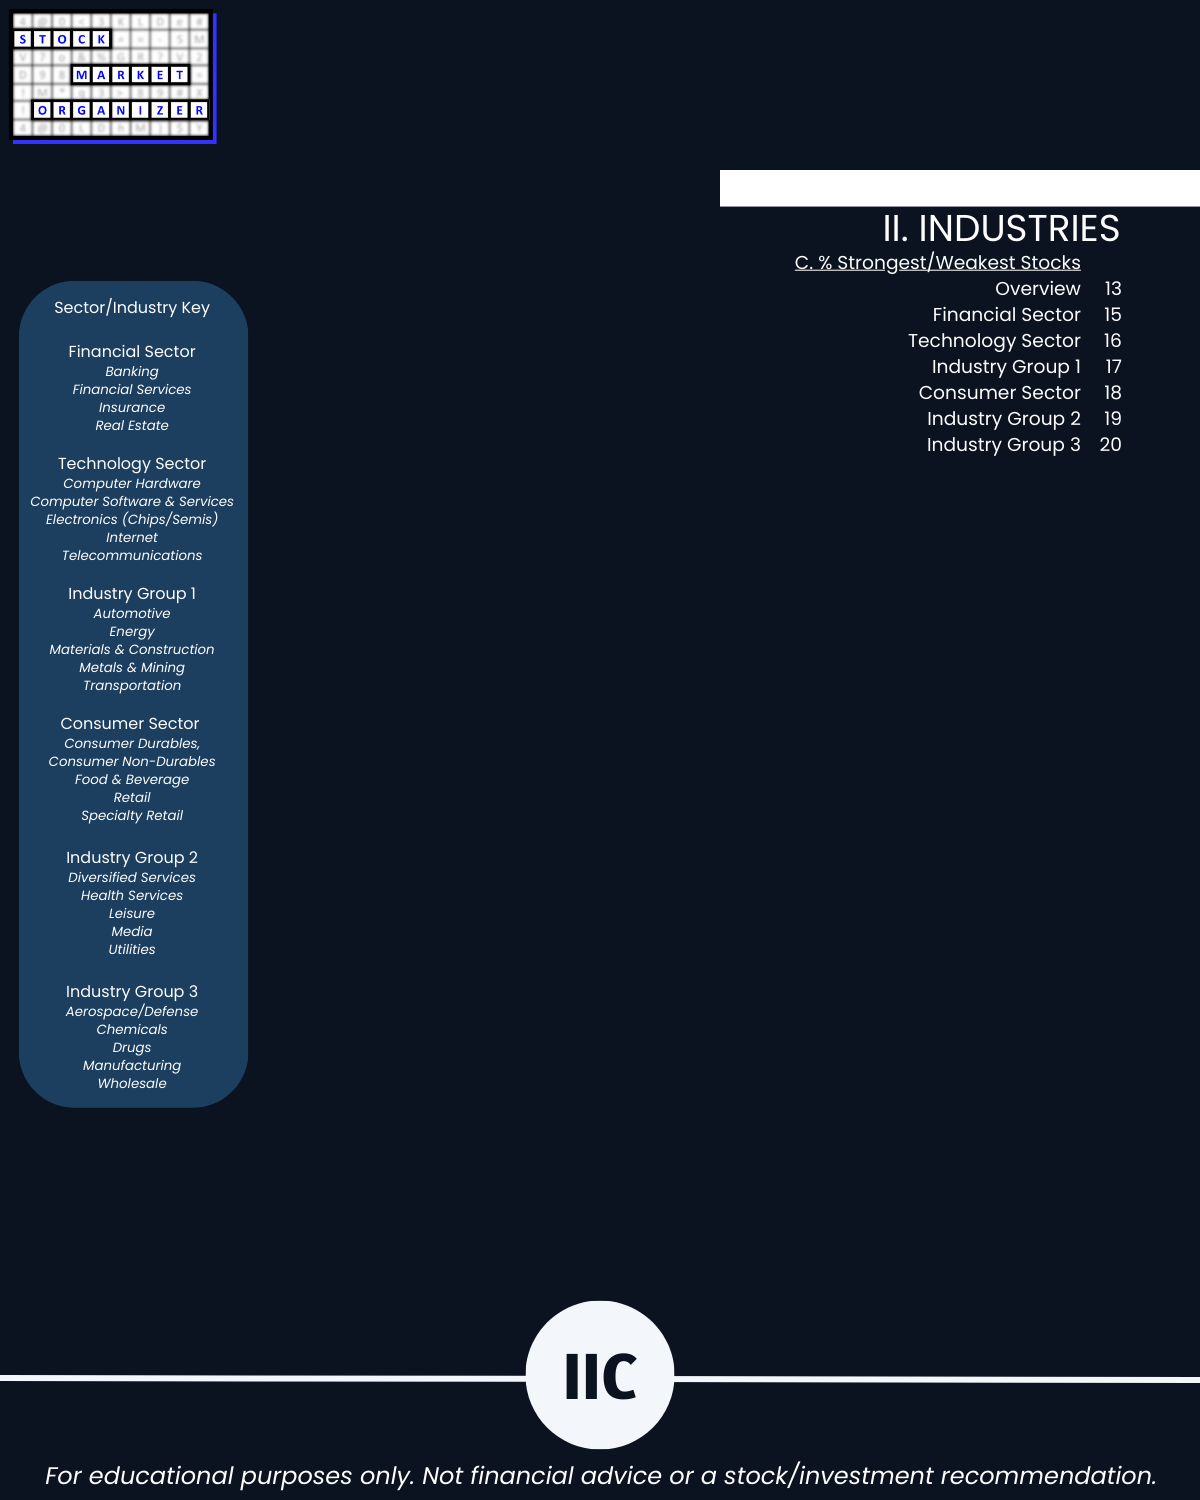
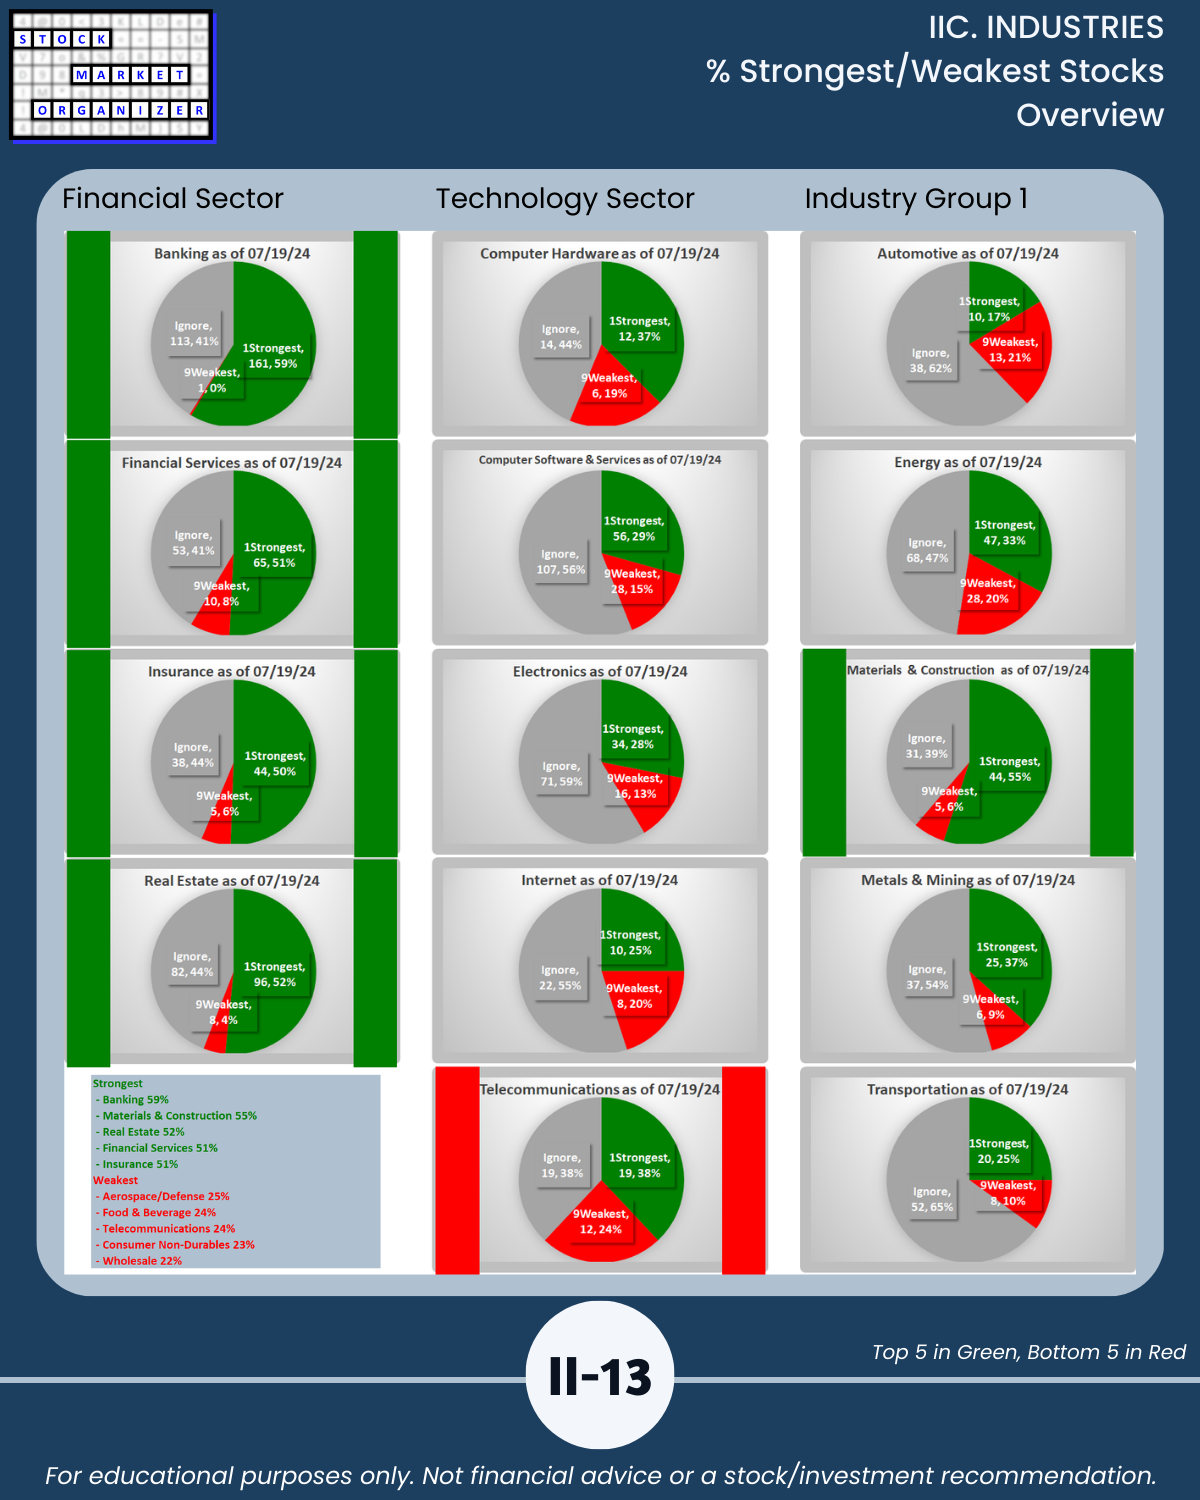
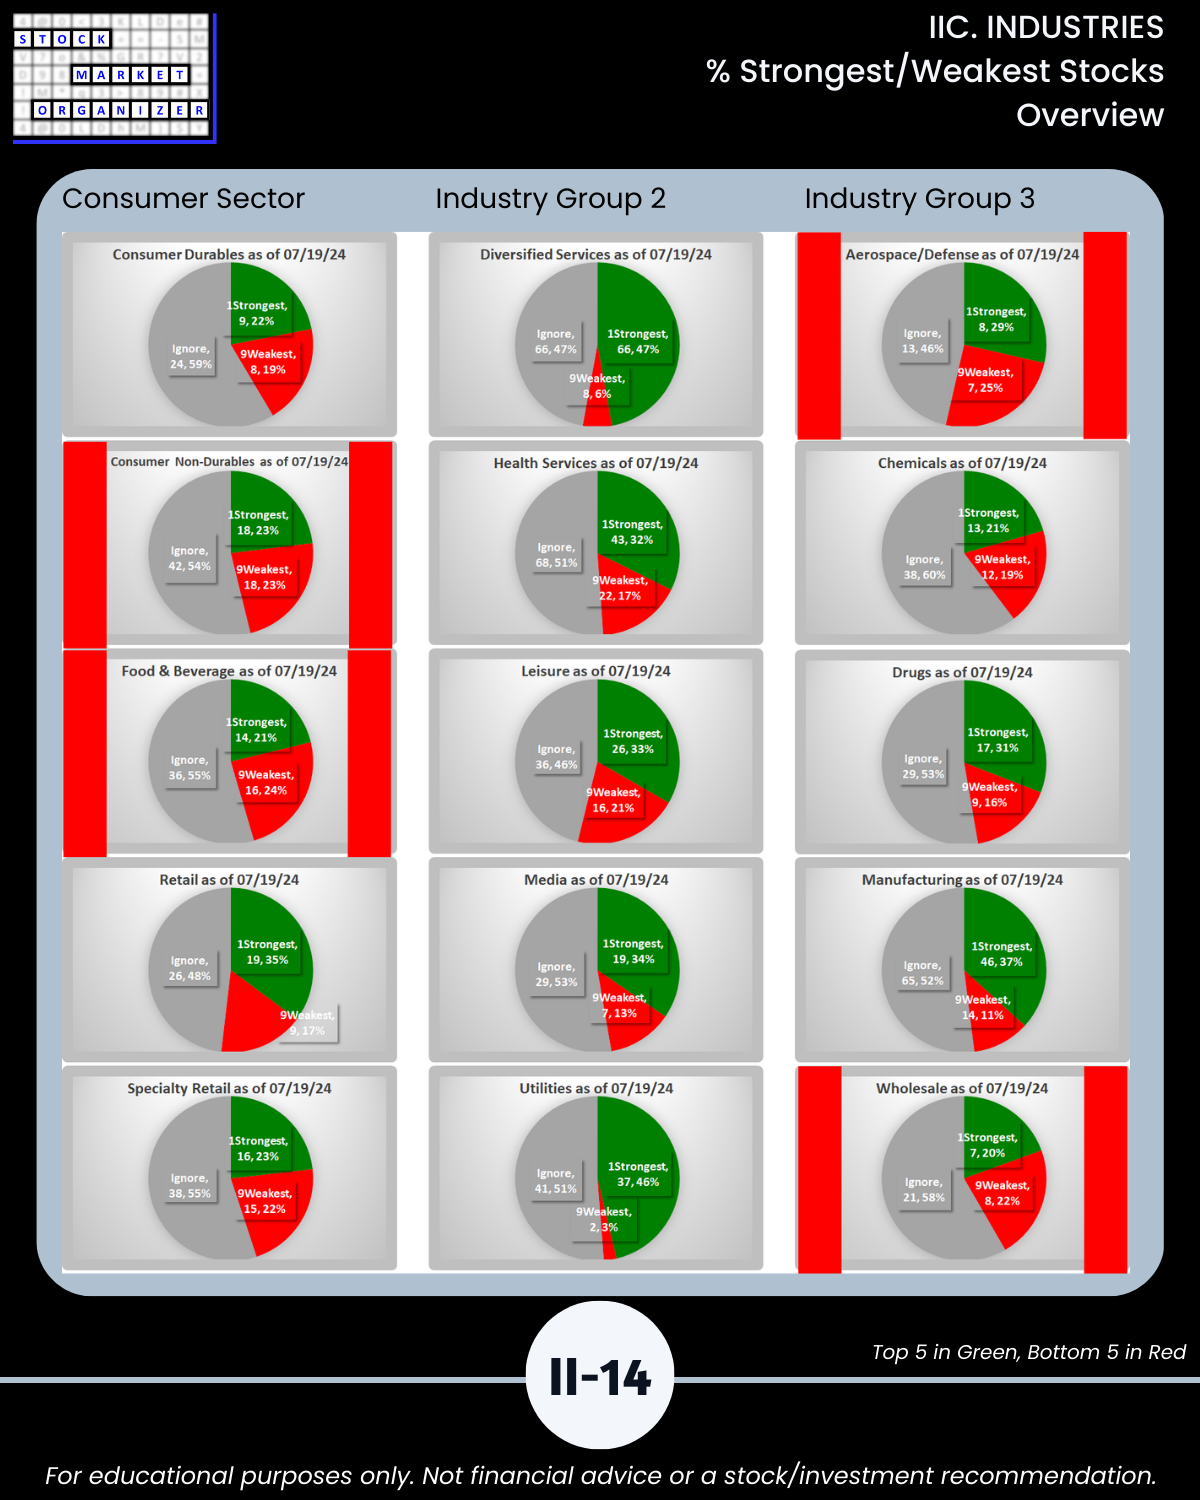
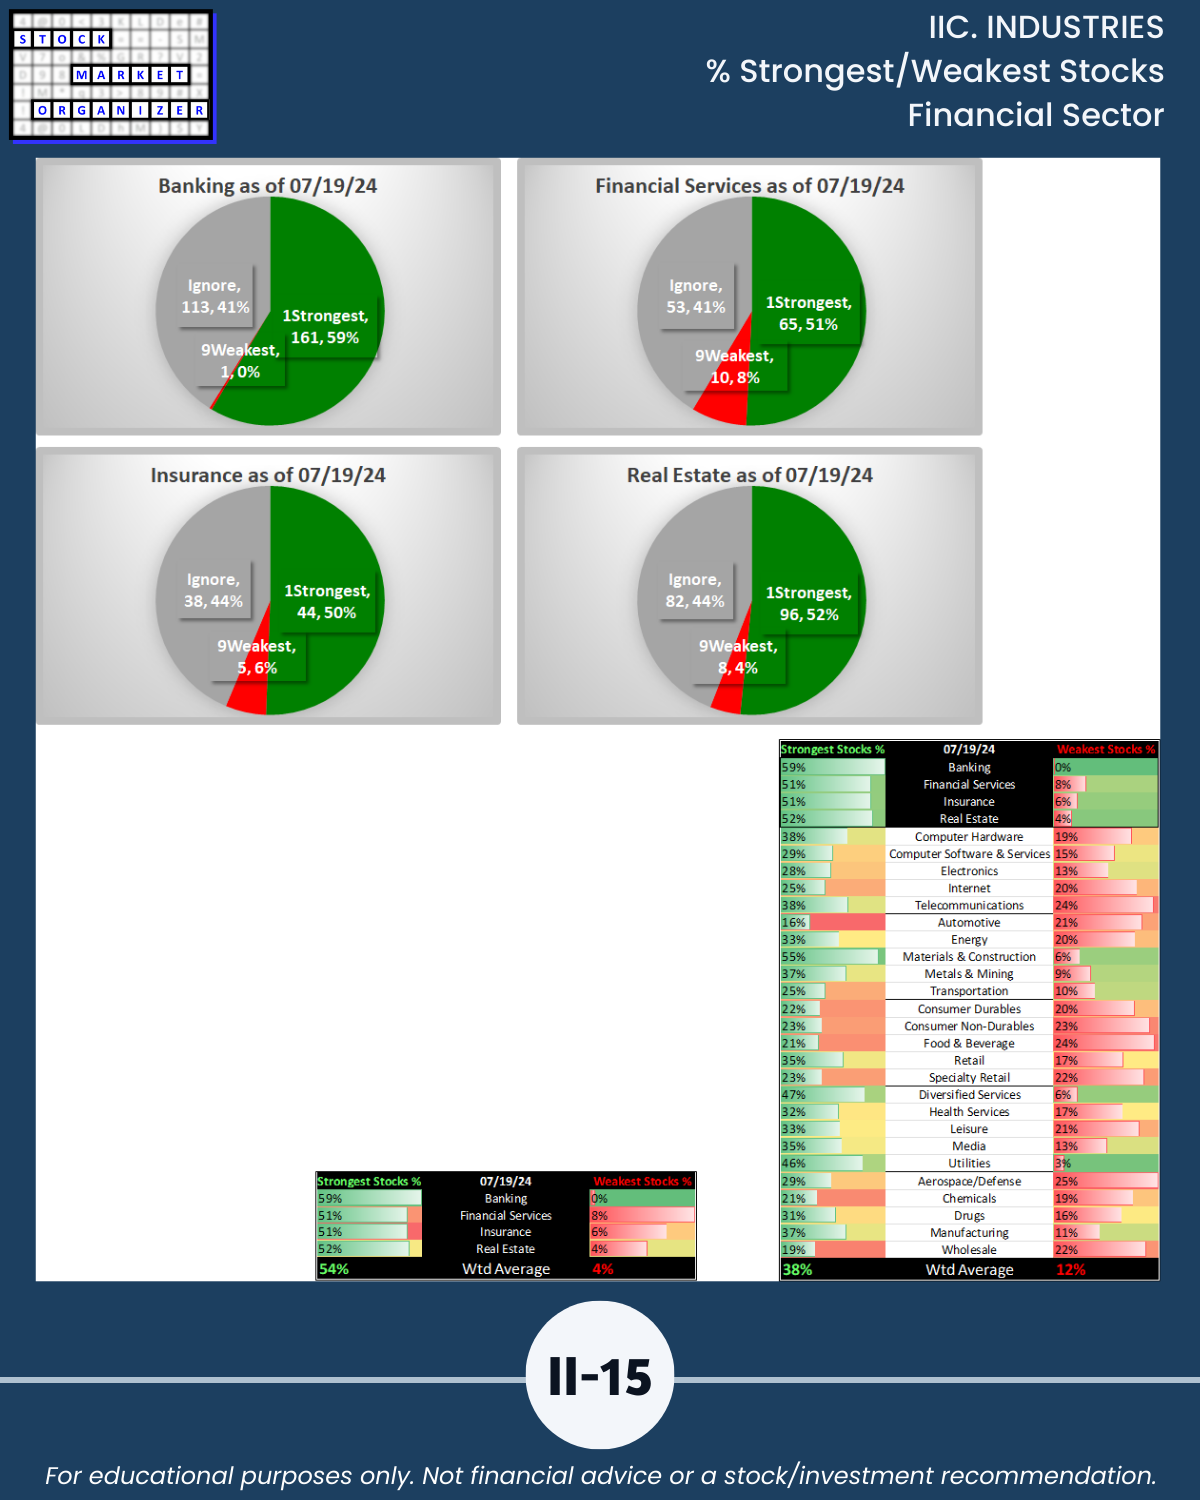
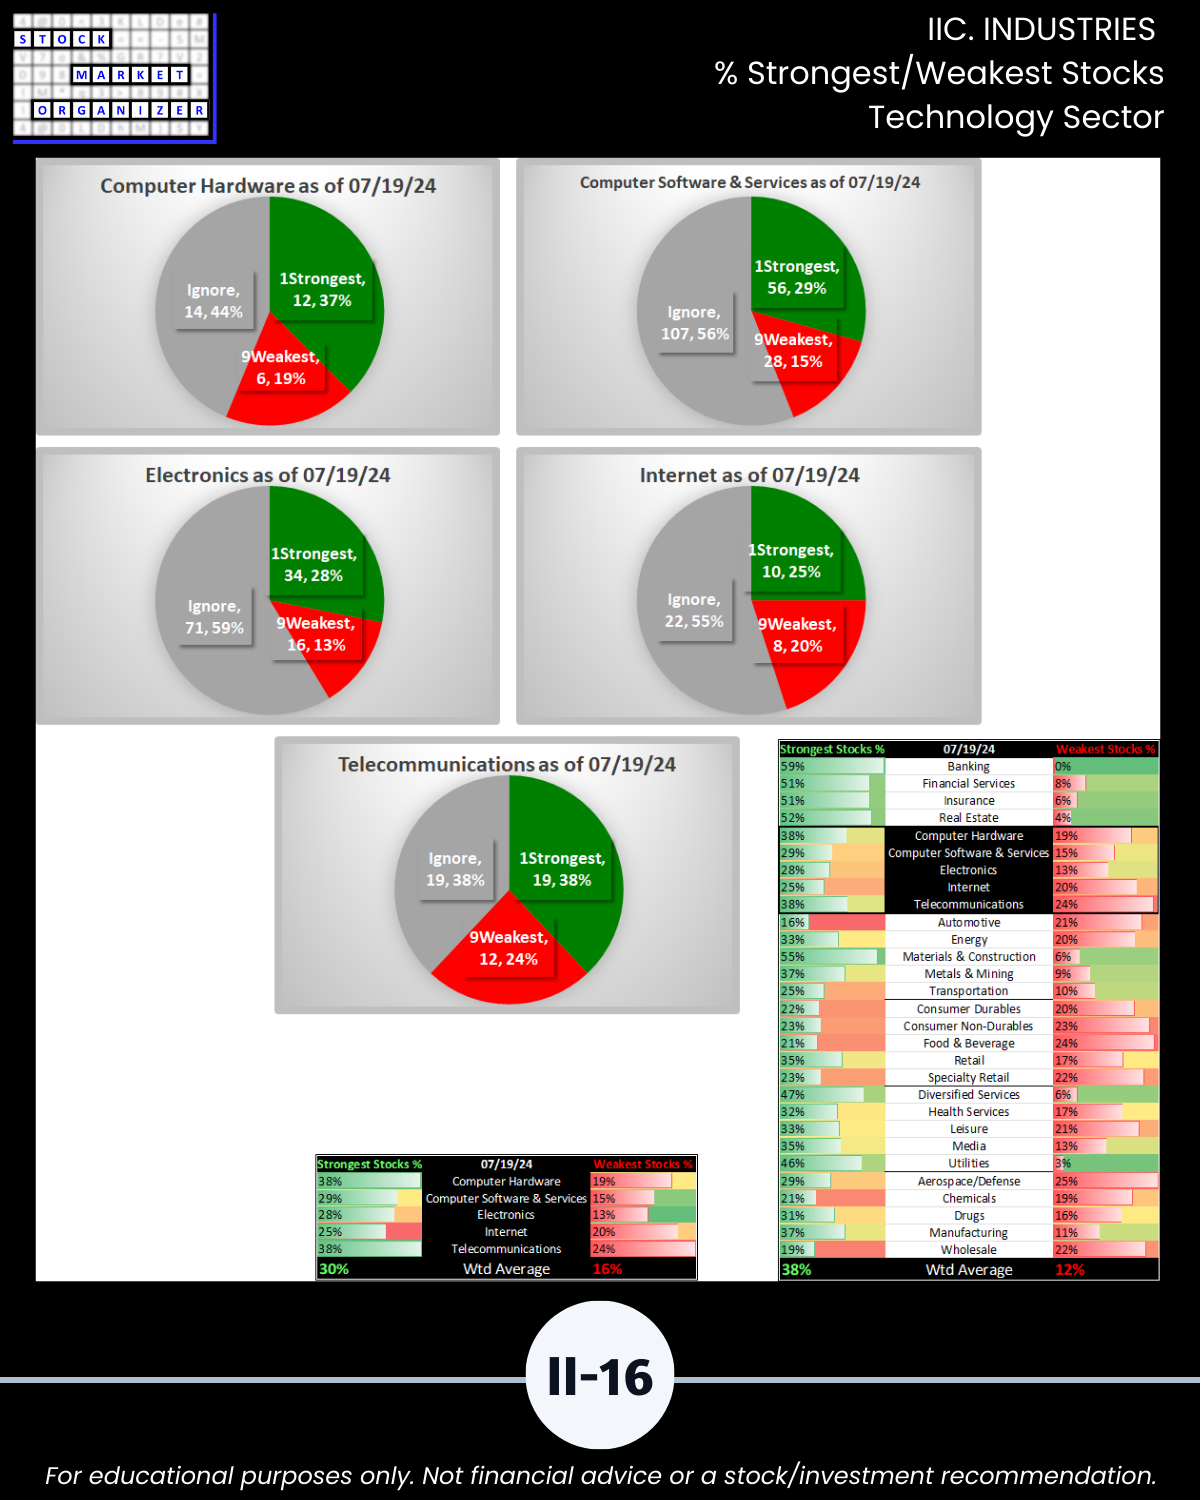
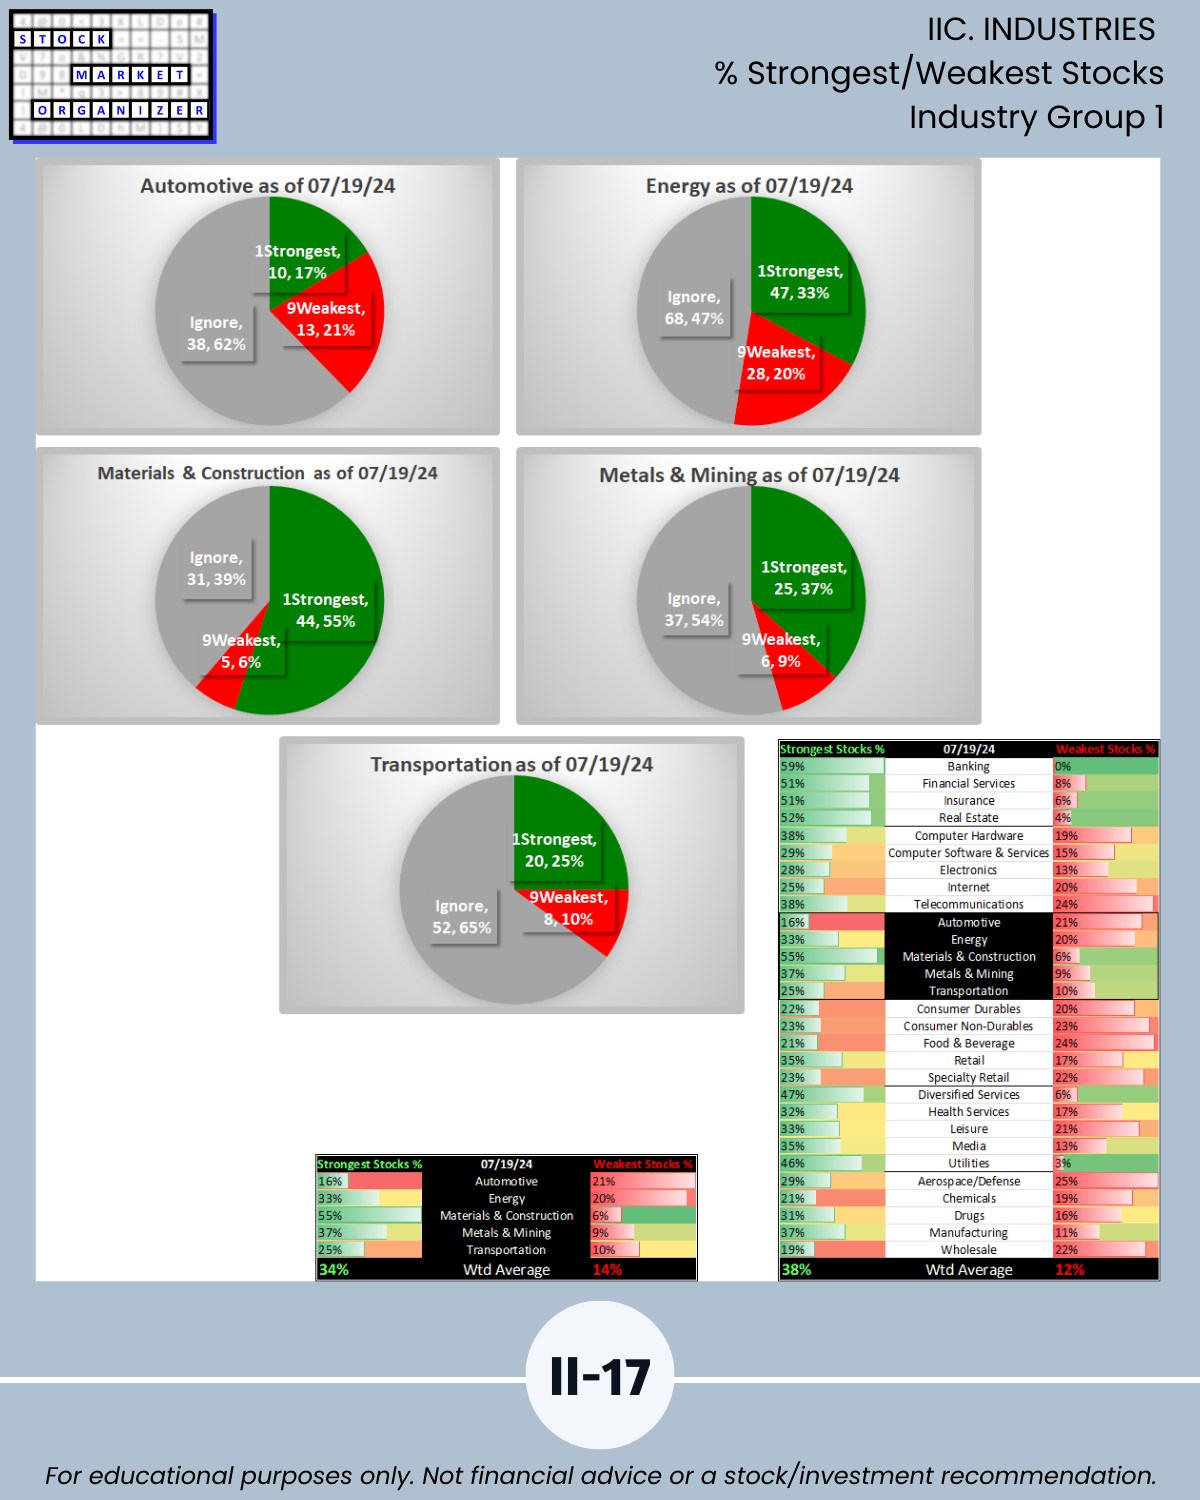
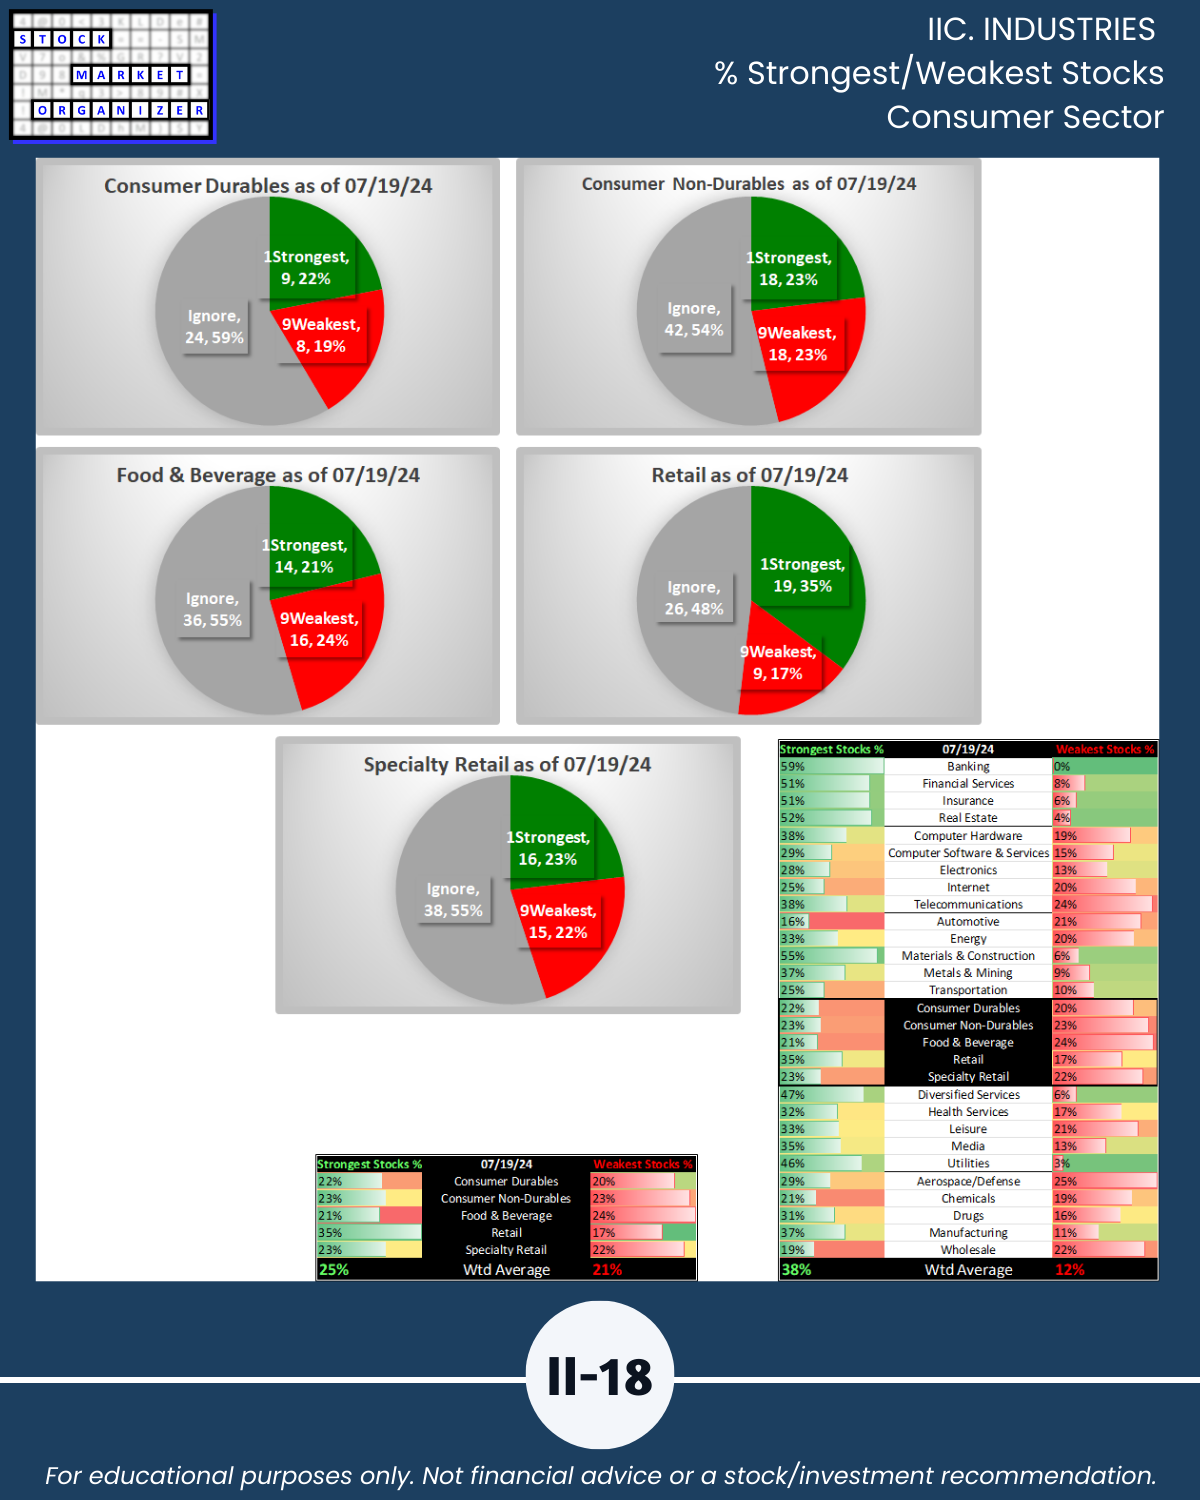
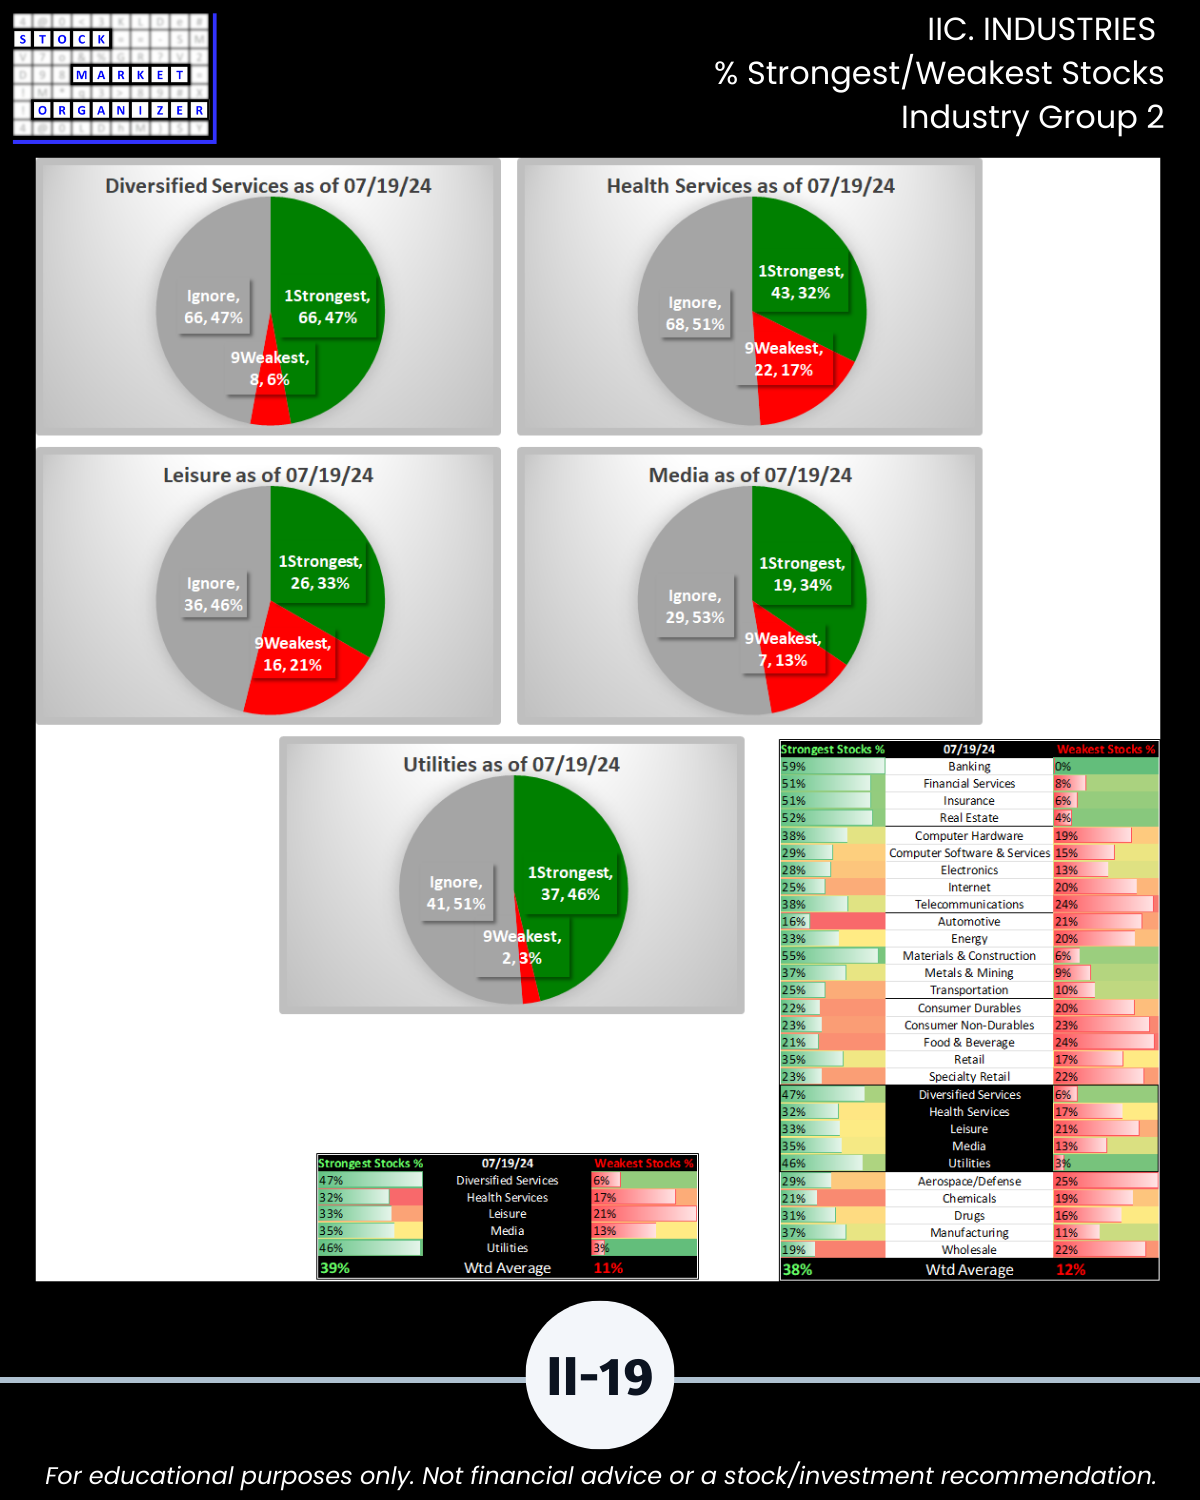
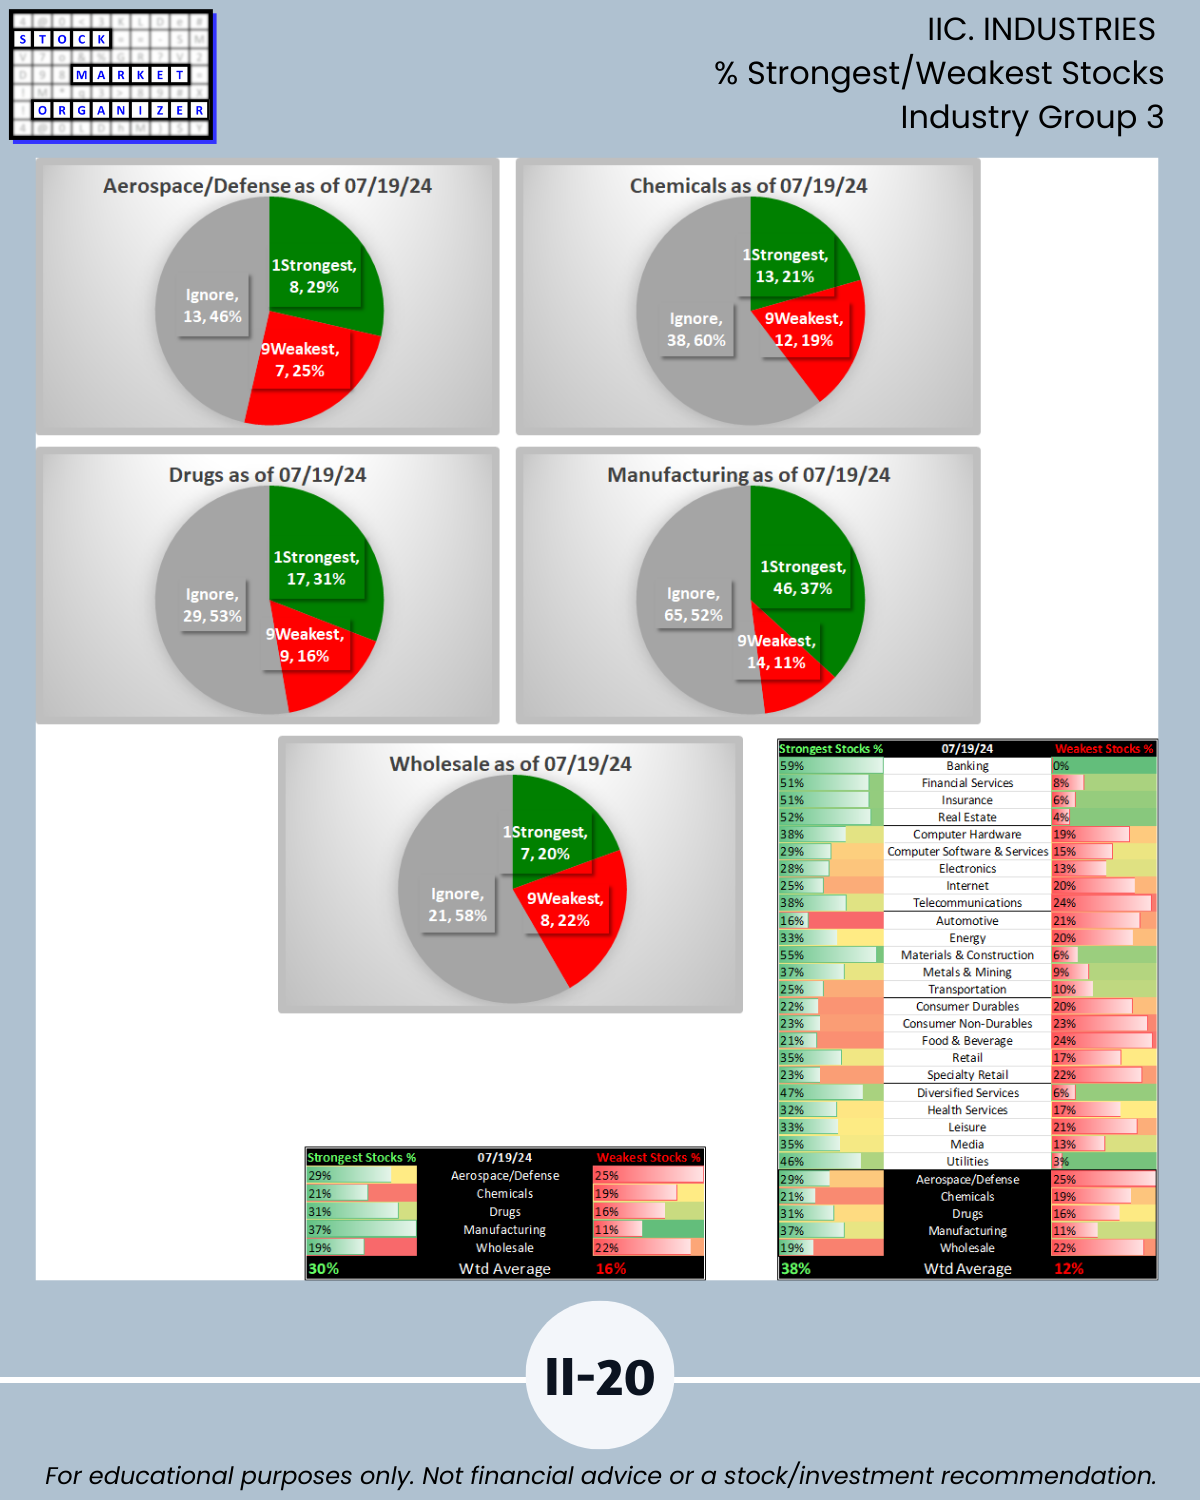
IIC. INDUSTRIES % Strongest/Weakest Stocks
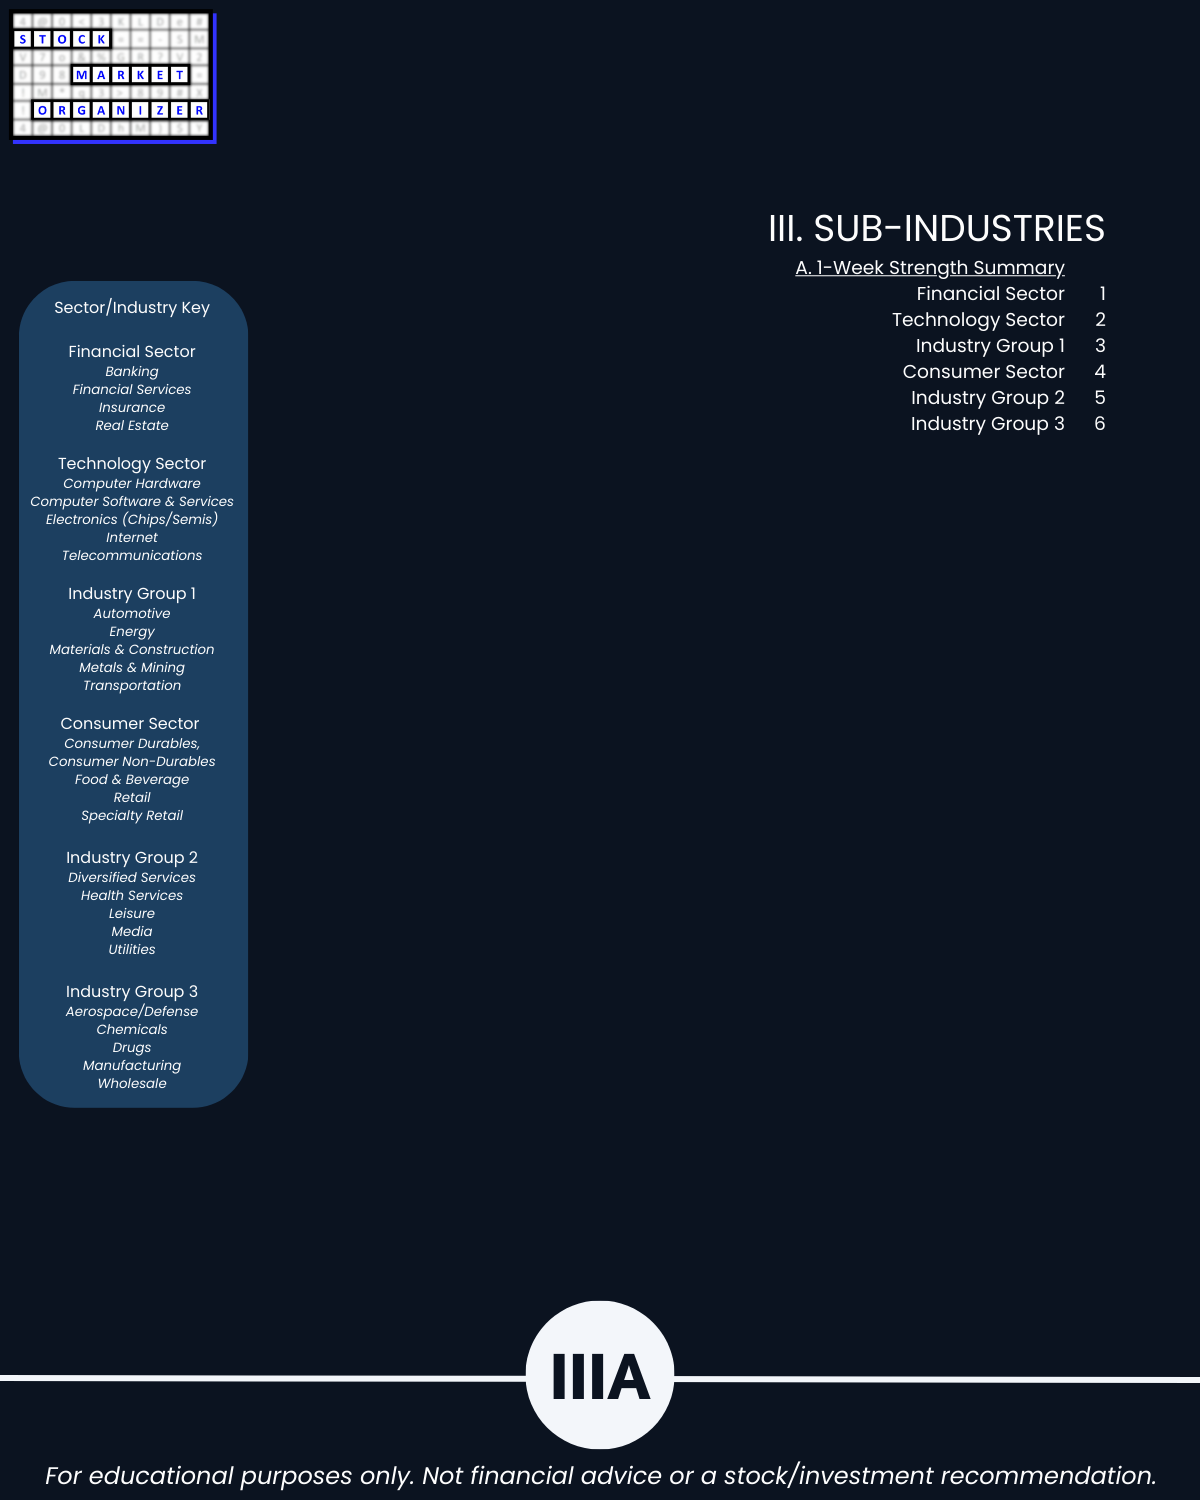
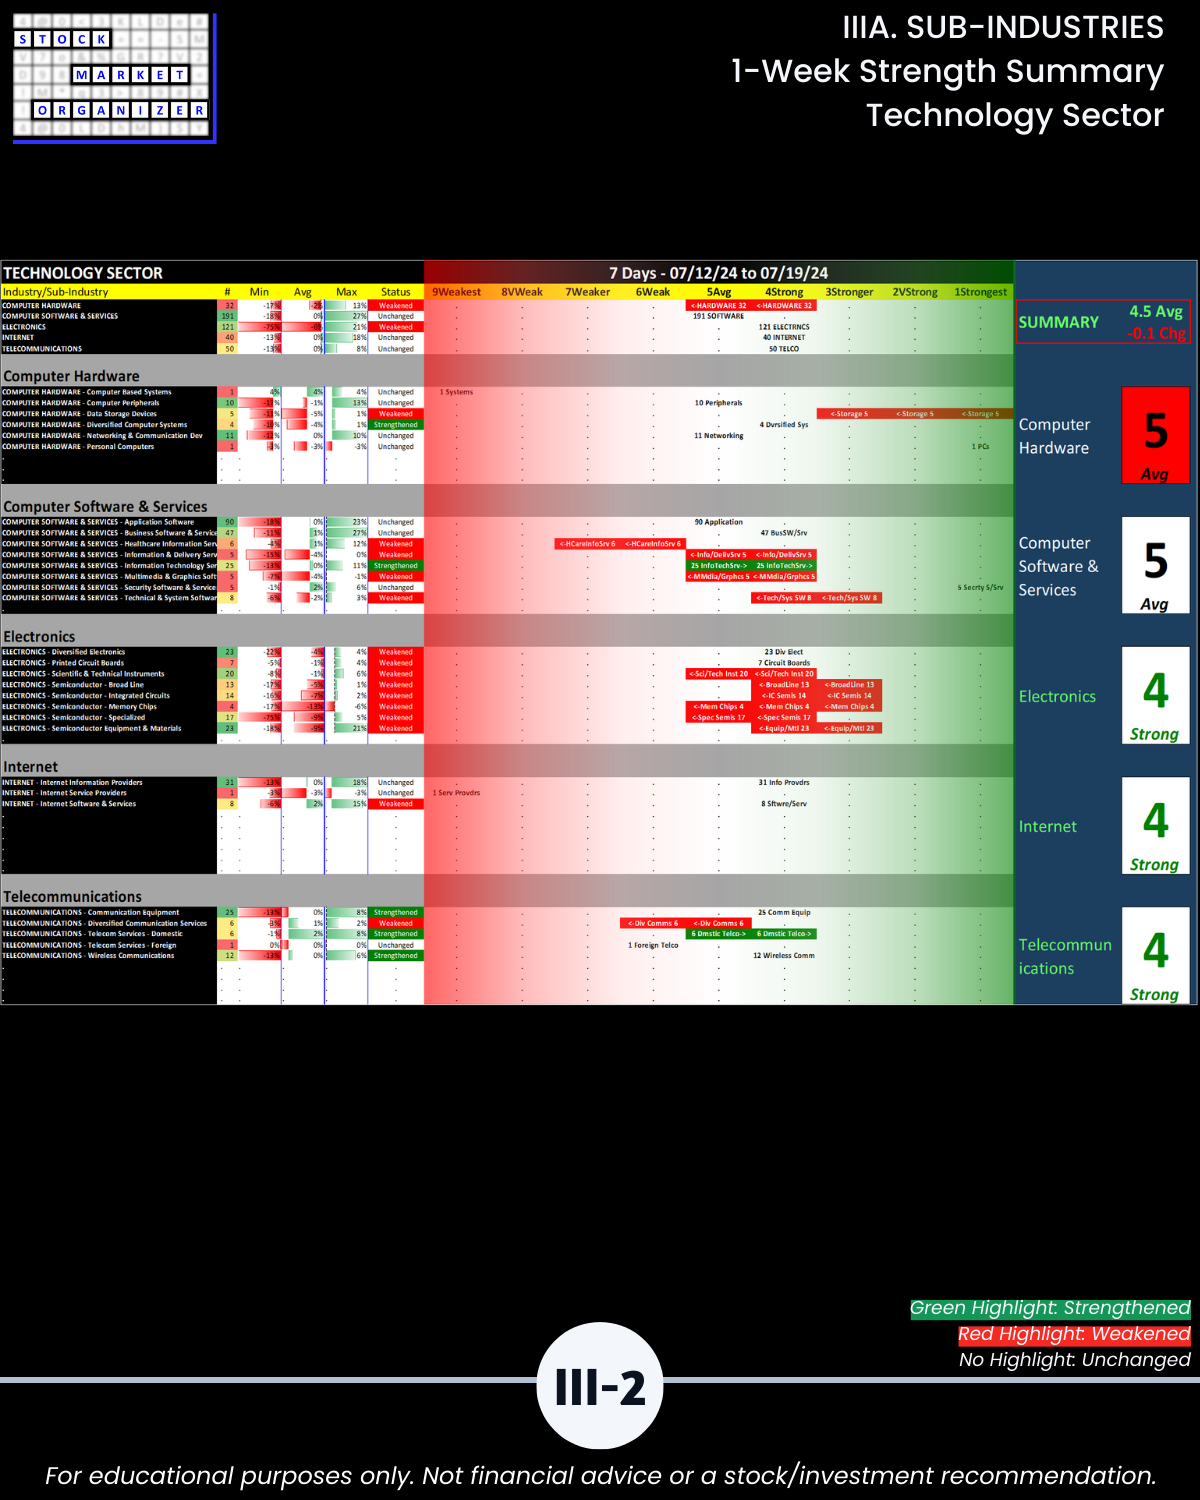
IIIA. SUB-INDUSTRIES 1-Week Strength Summary
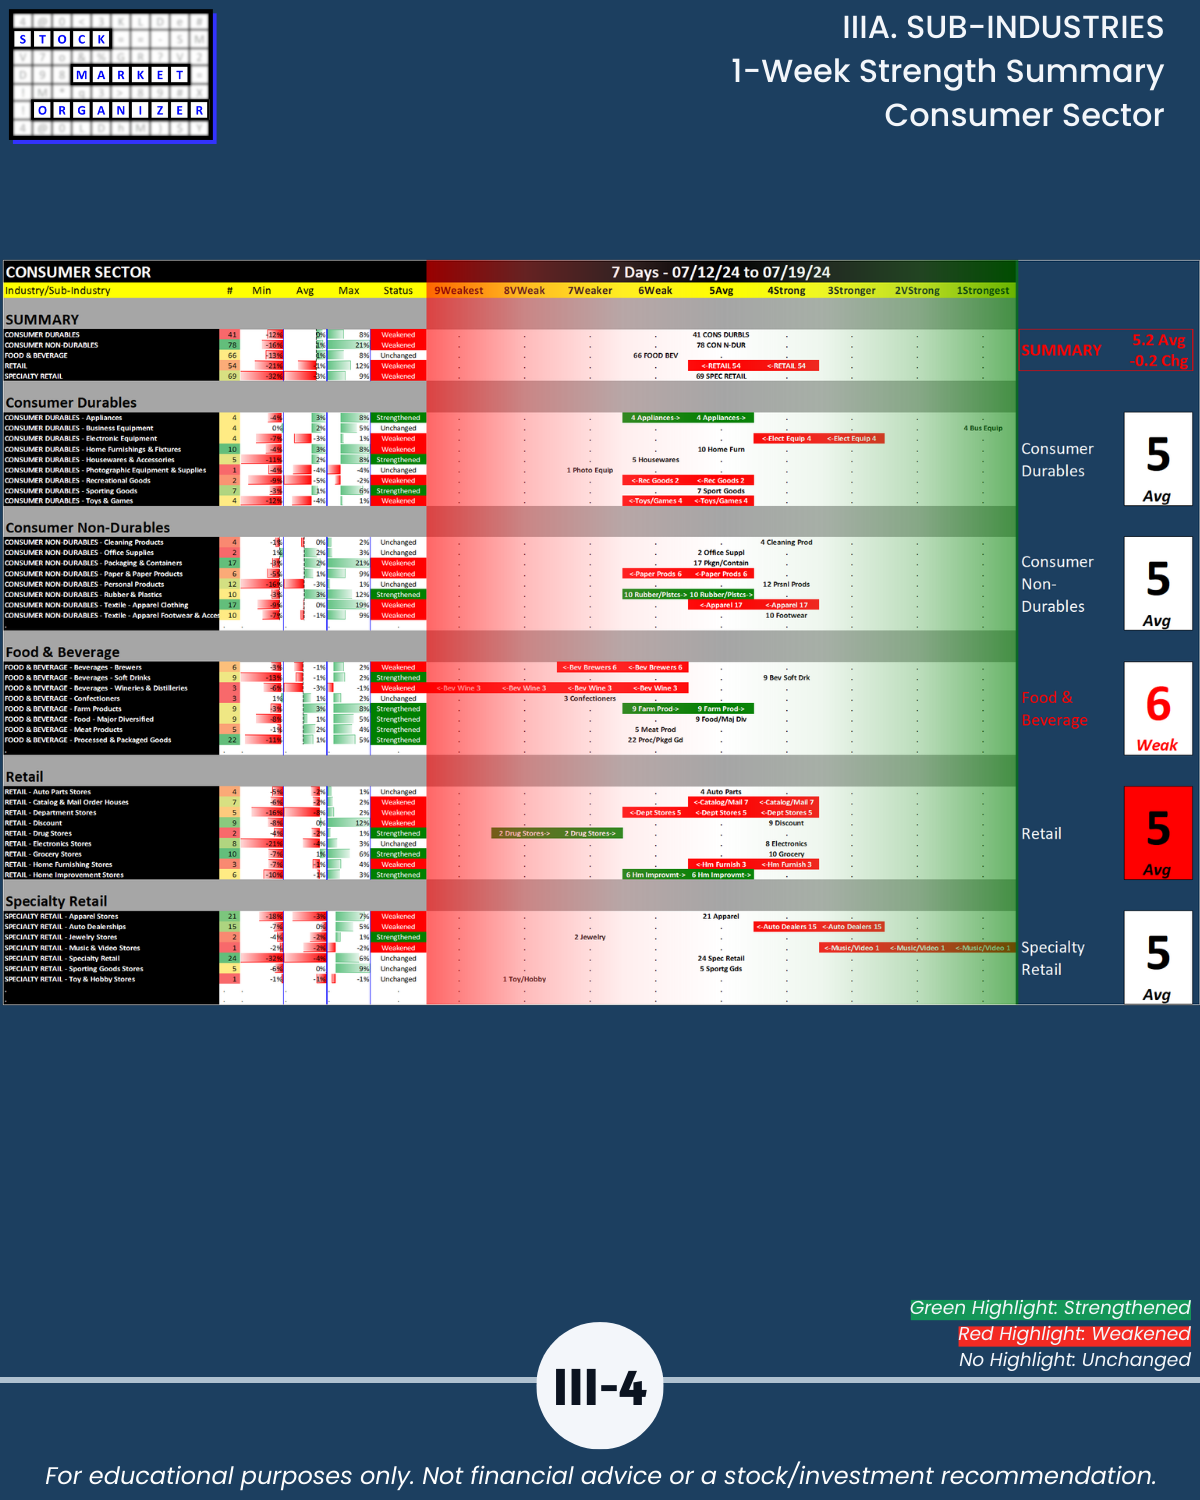
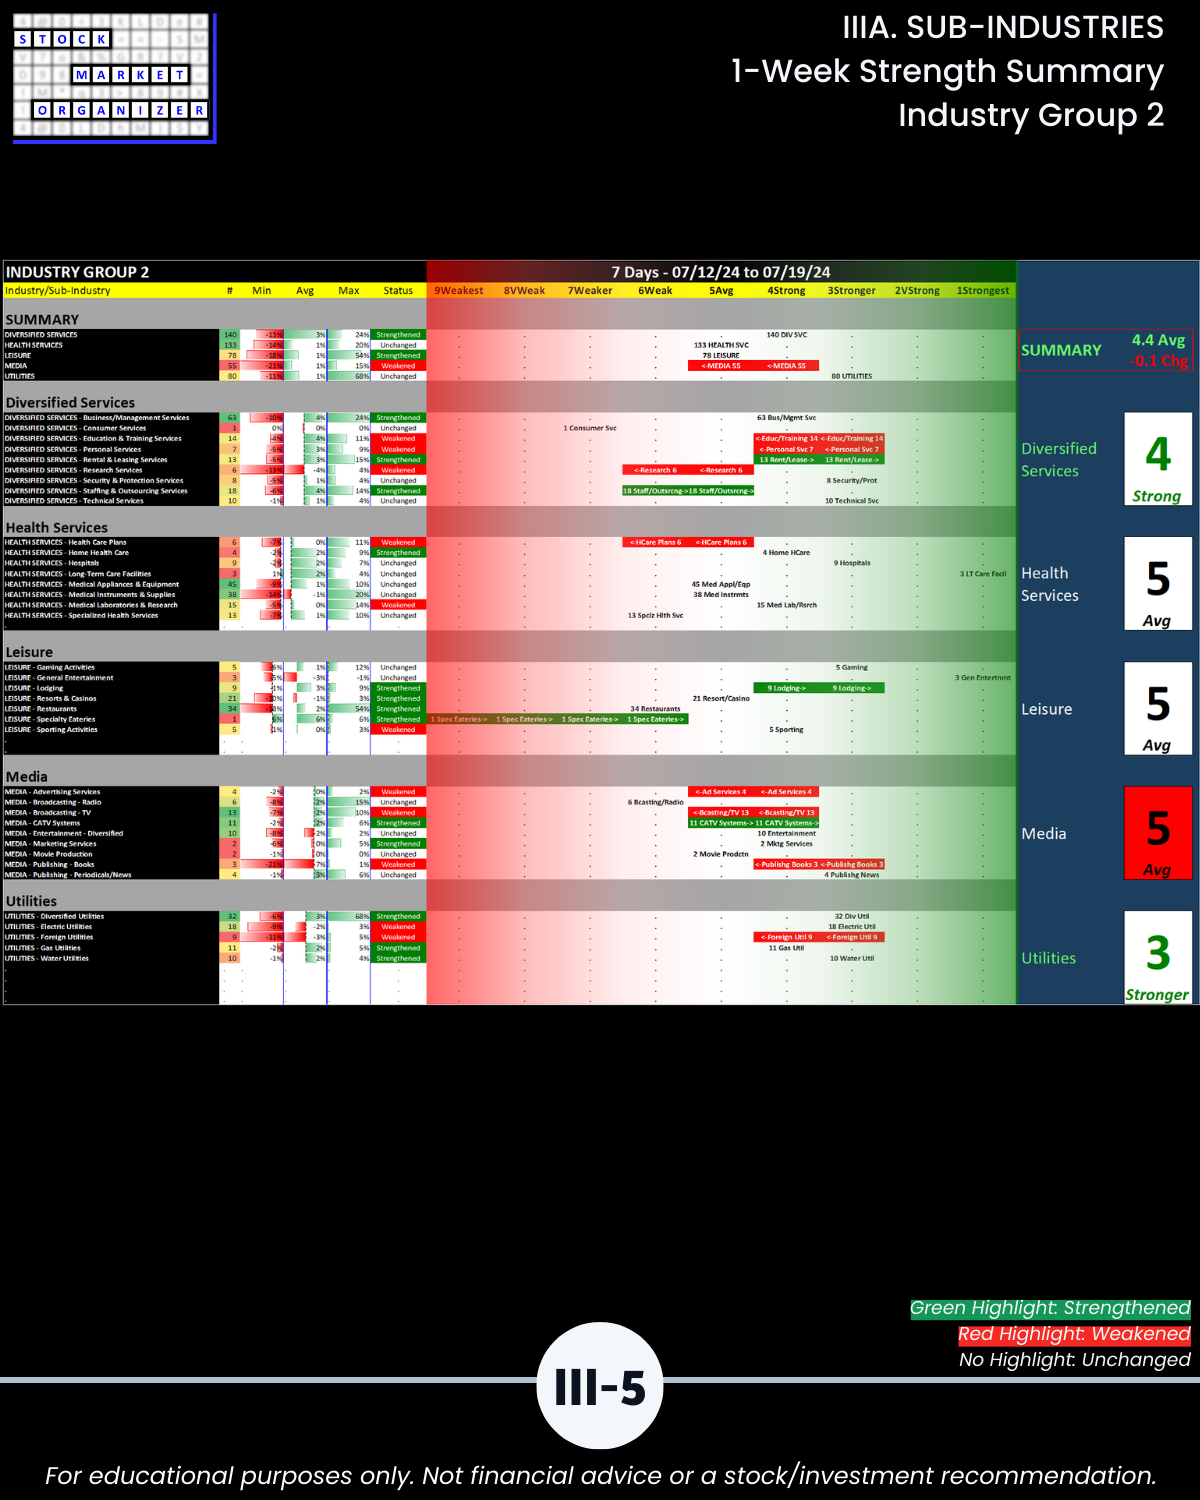
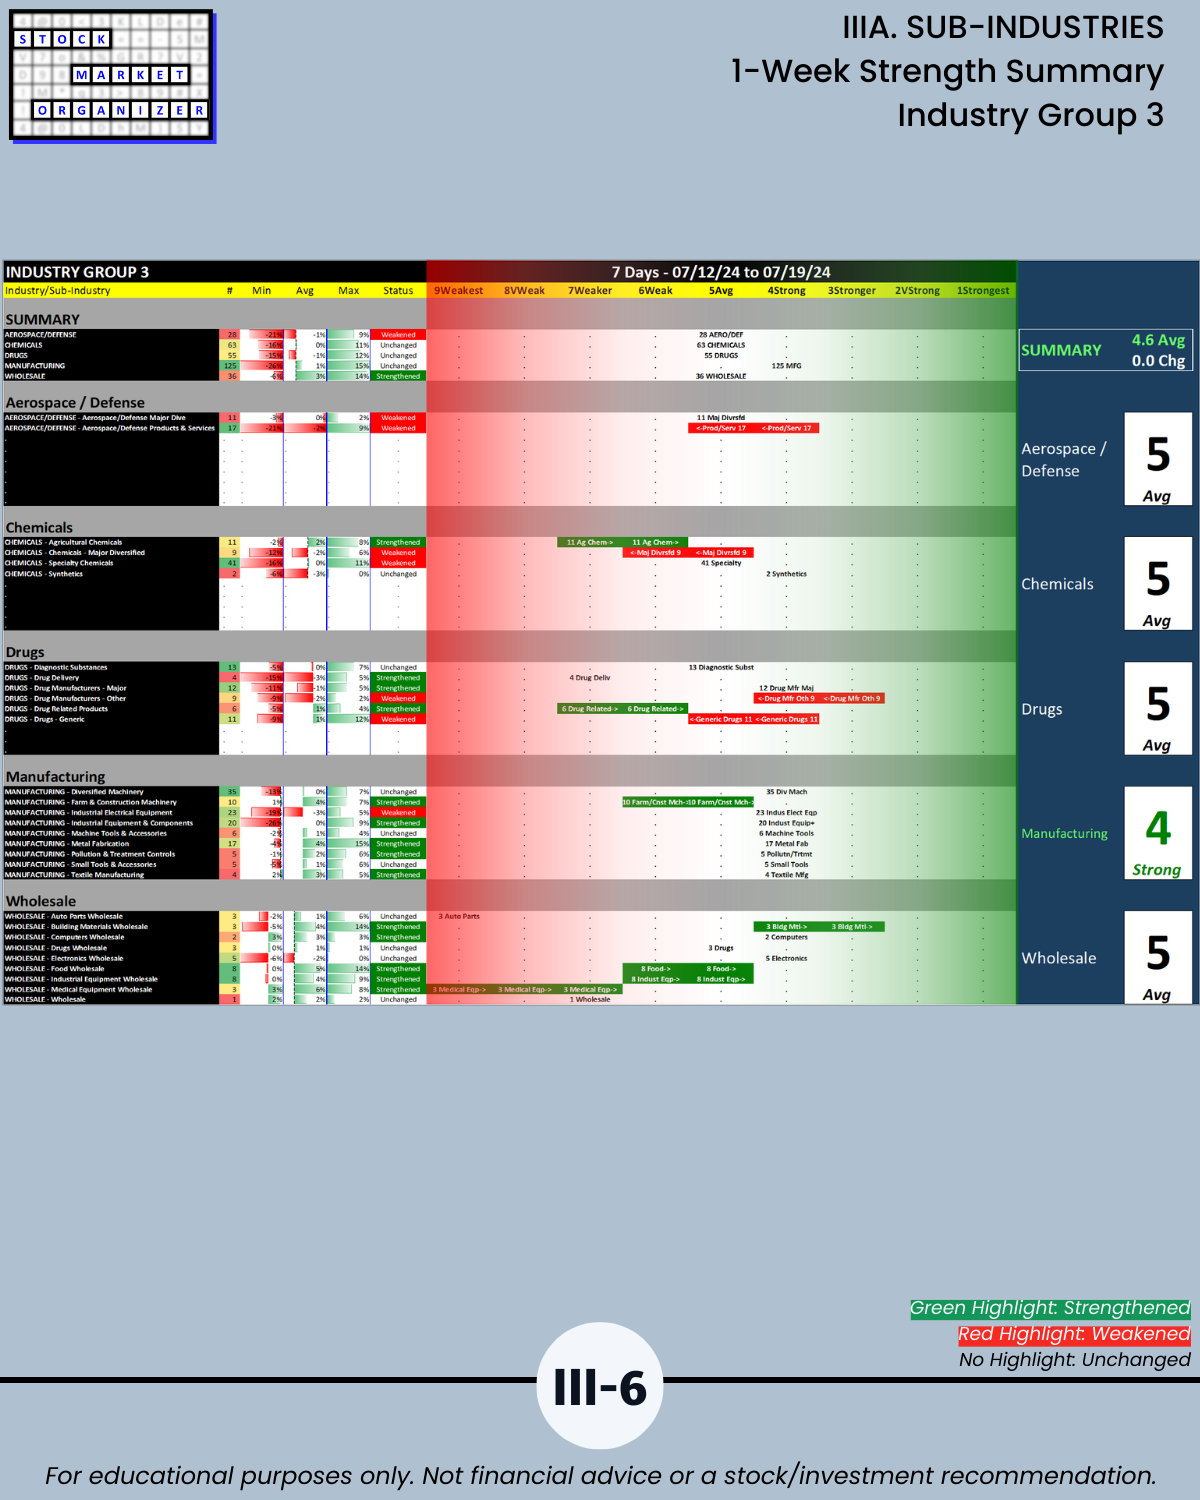
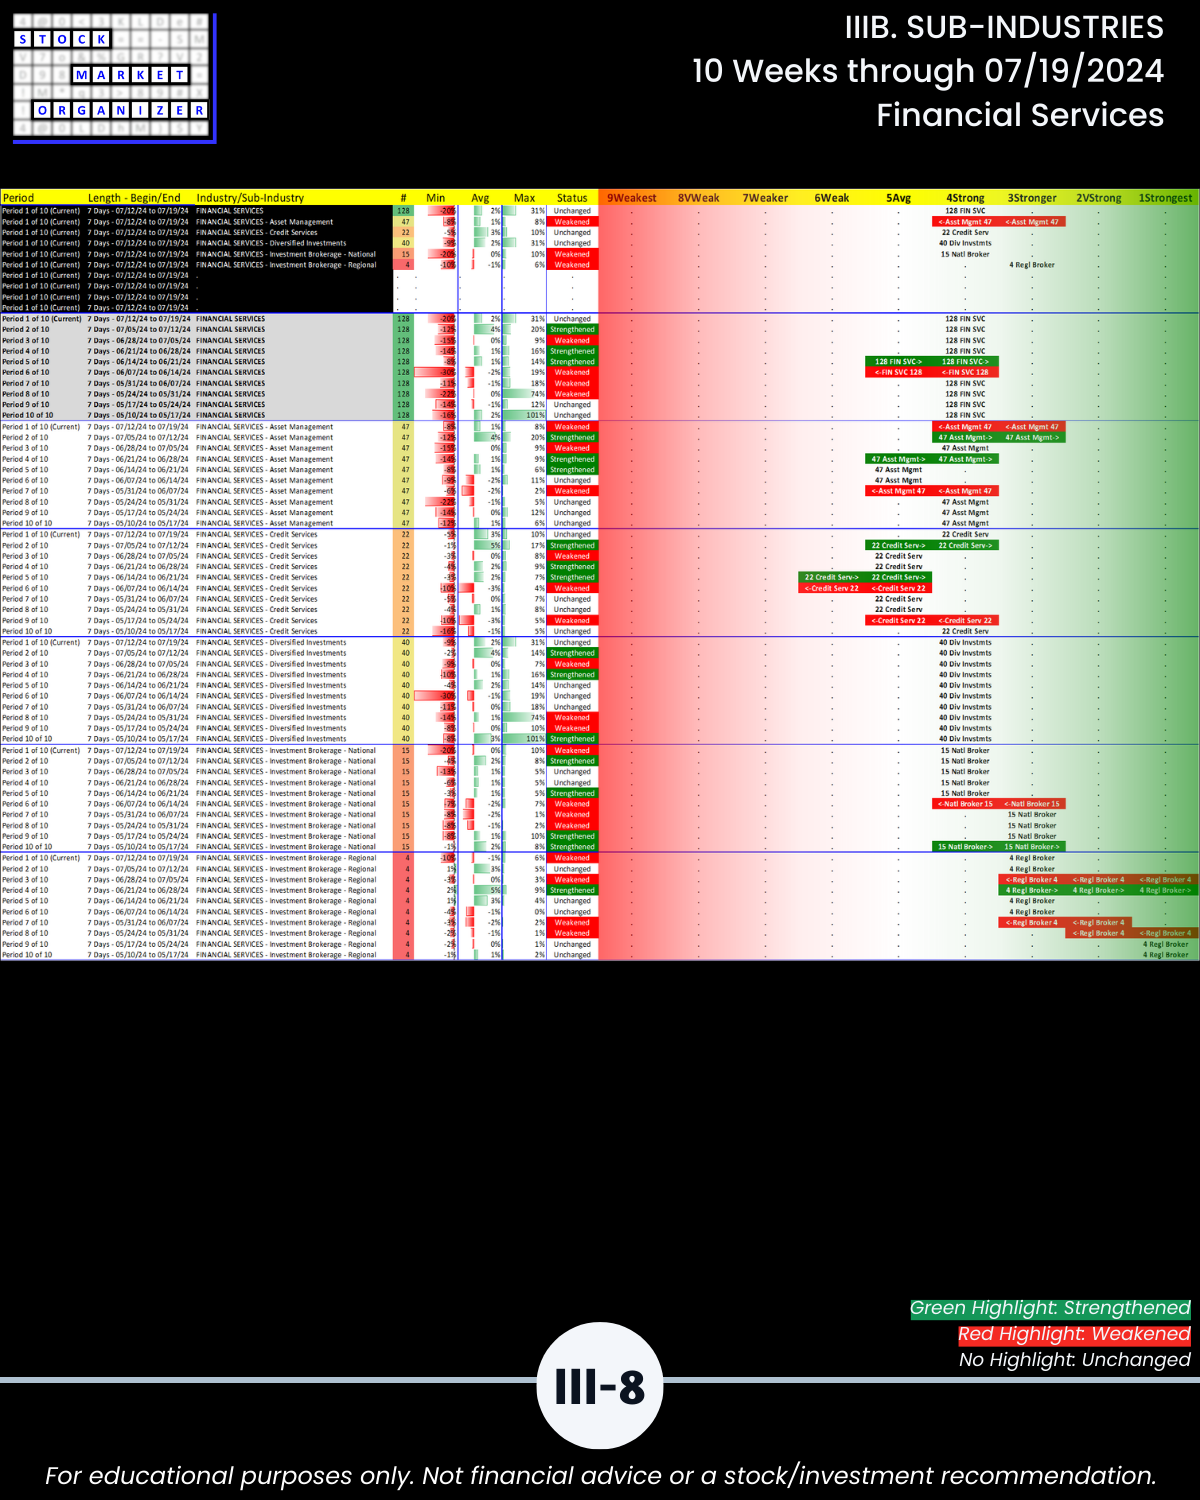
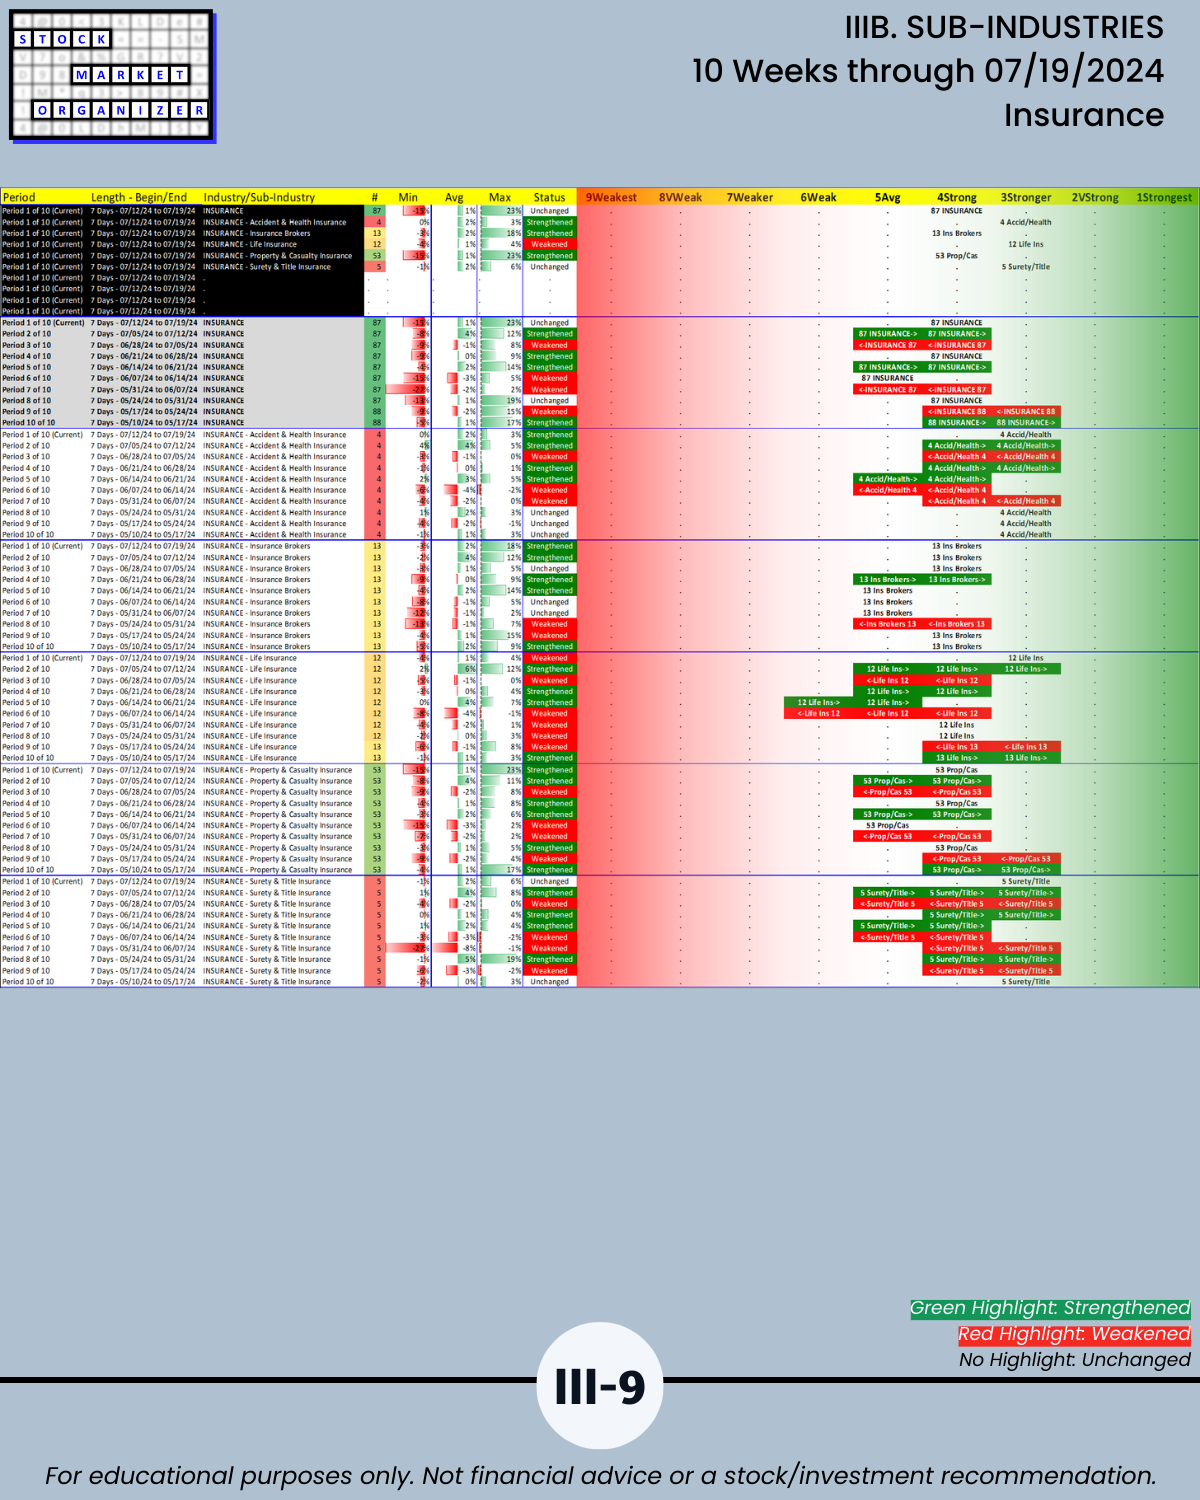
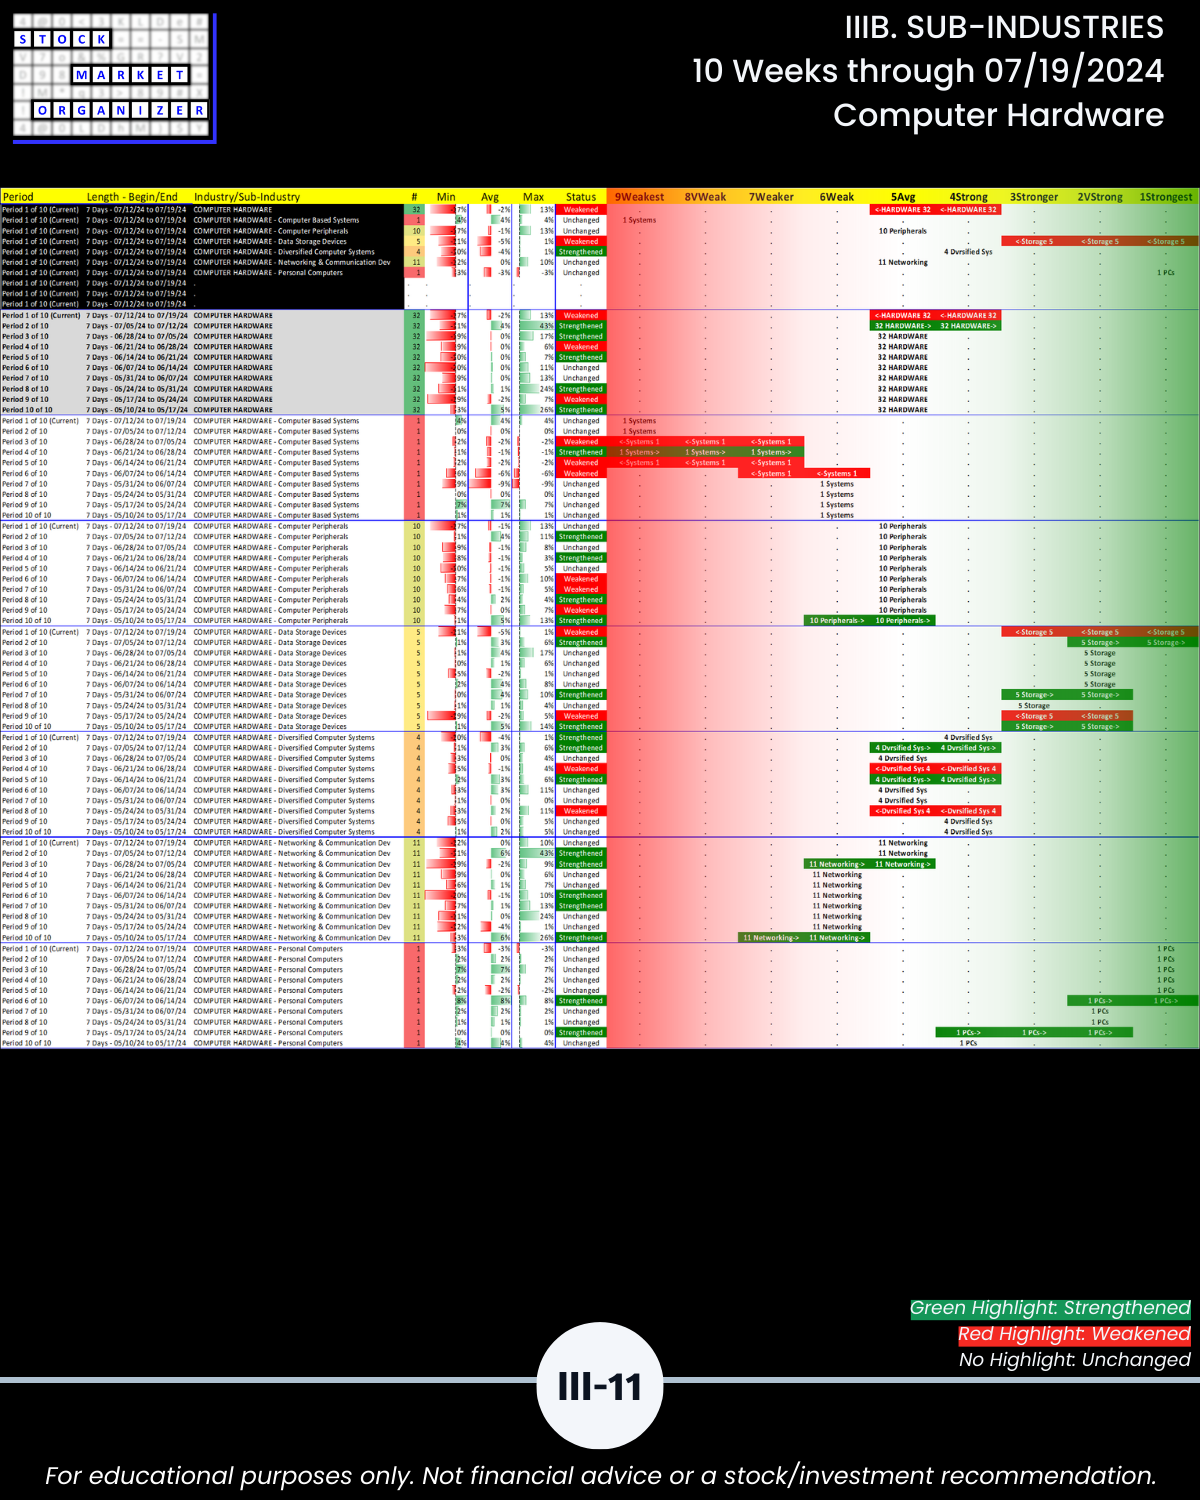
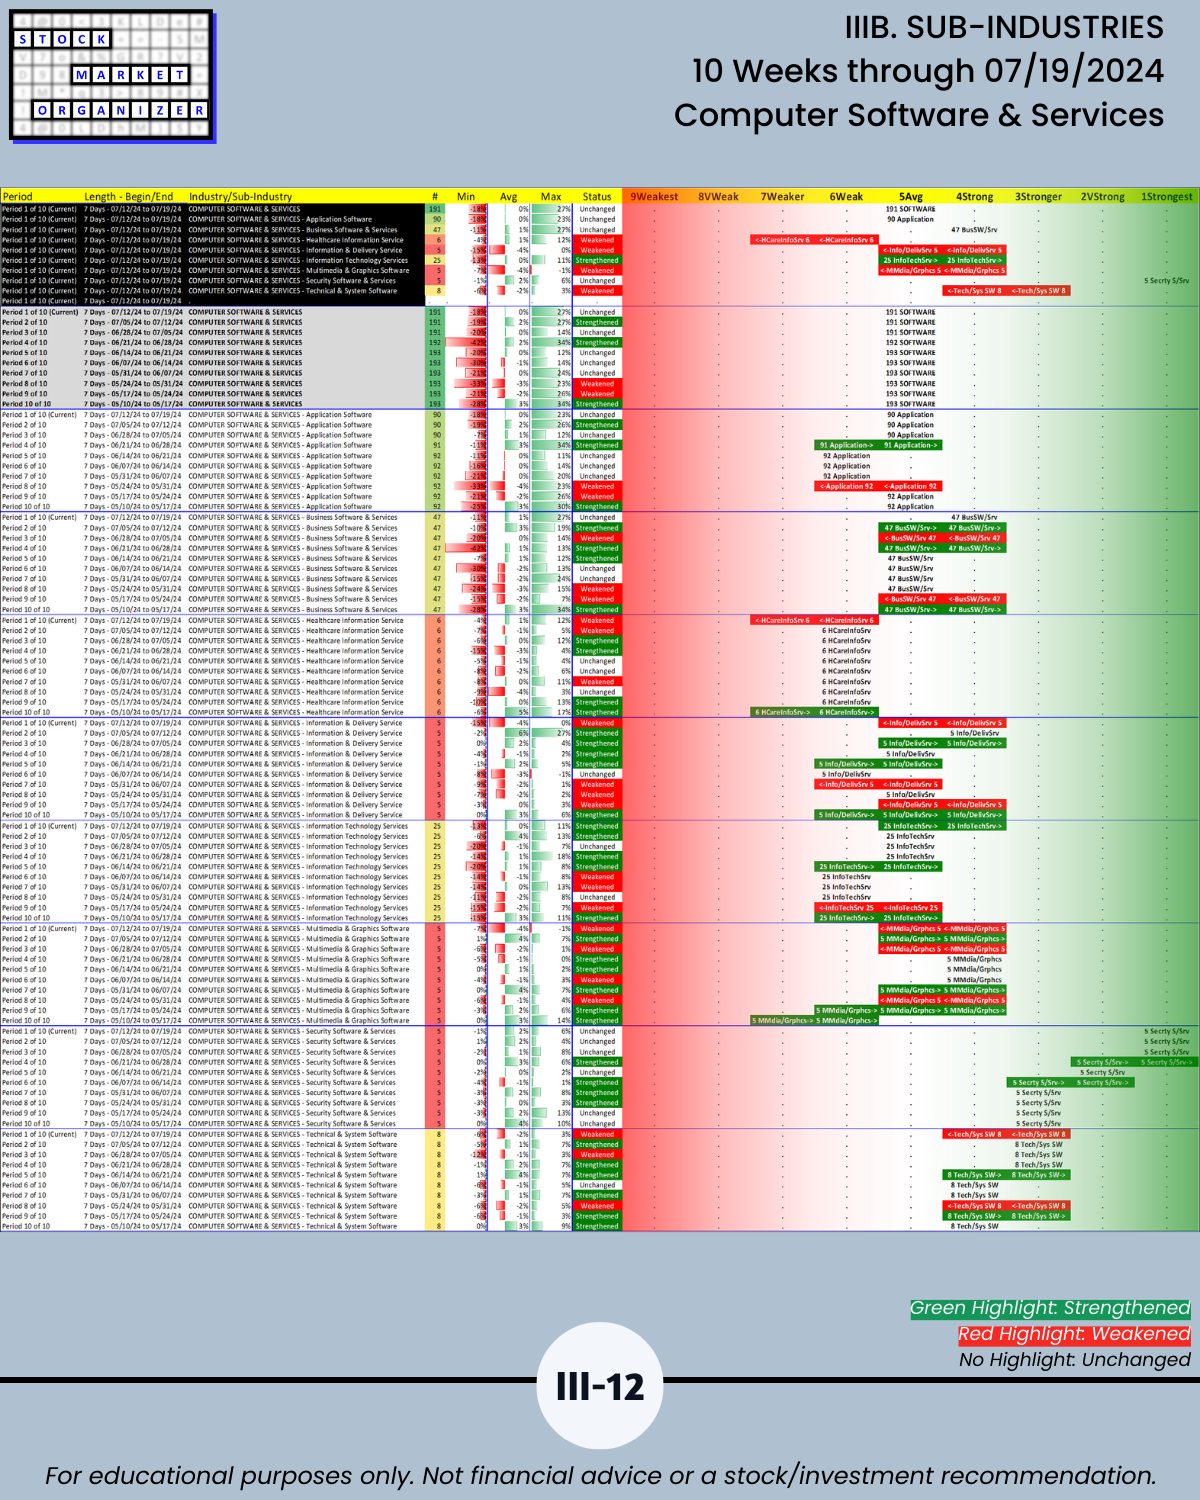
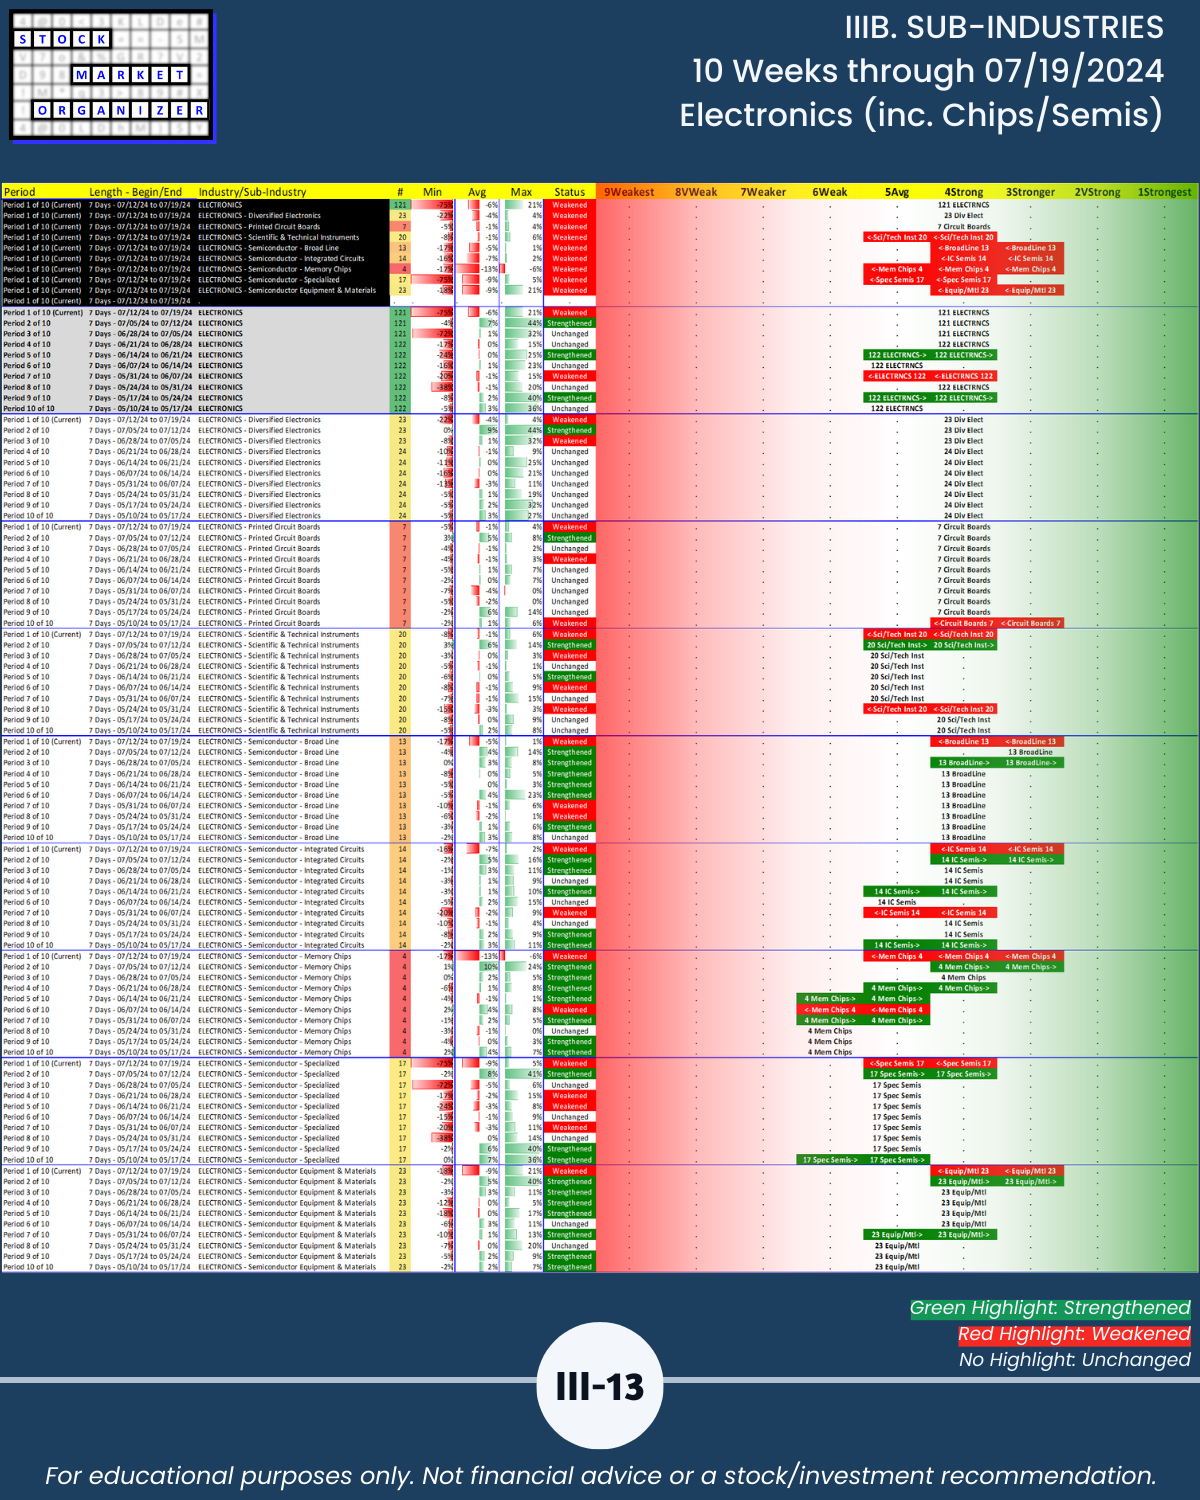
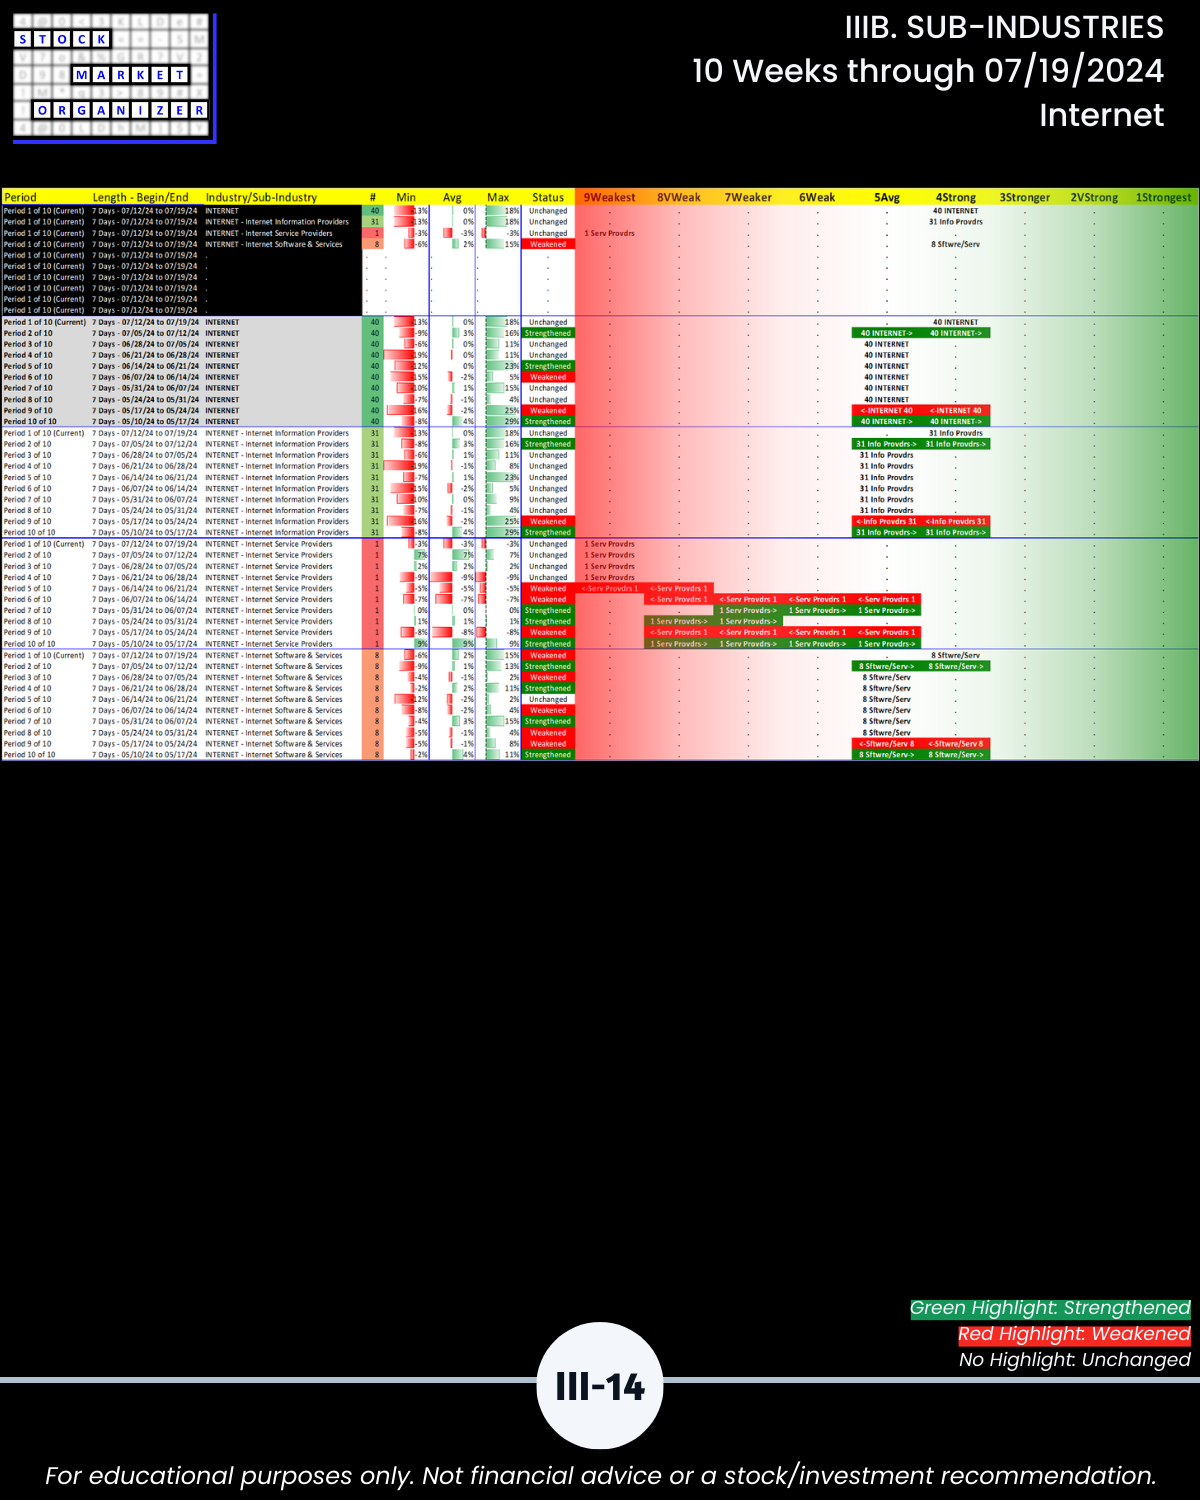
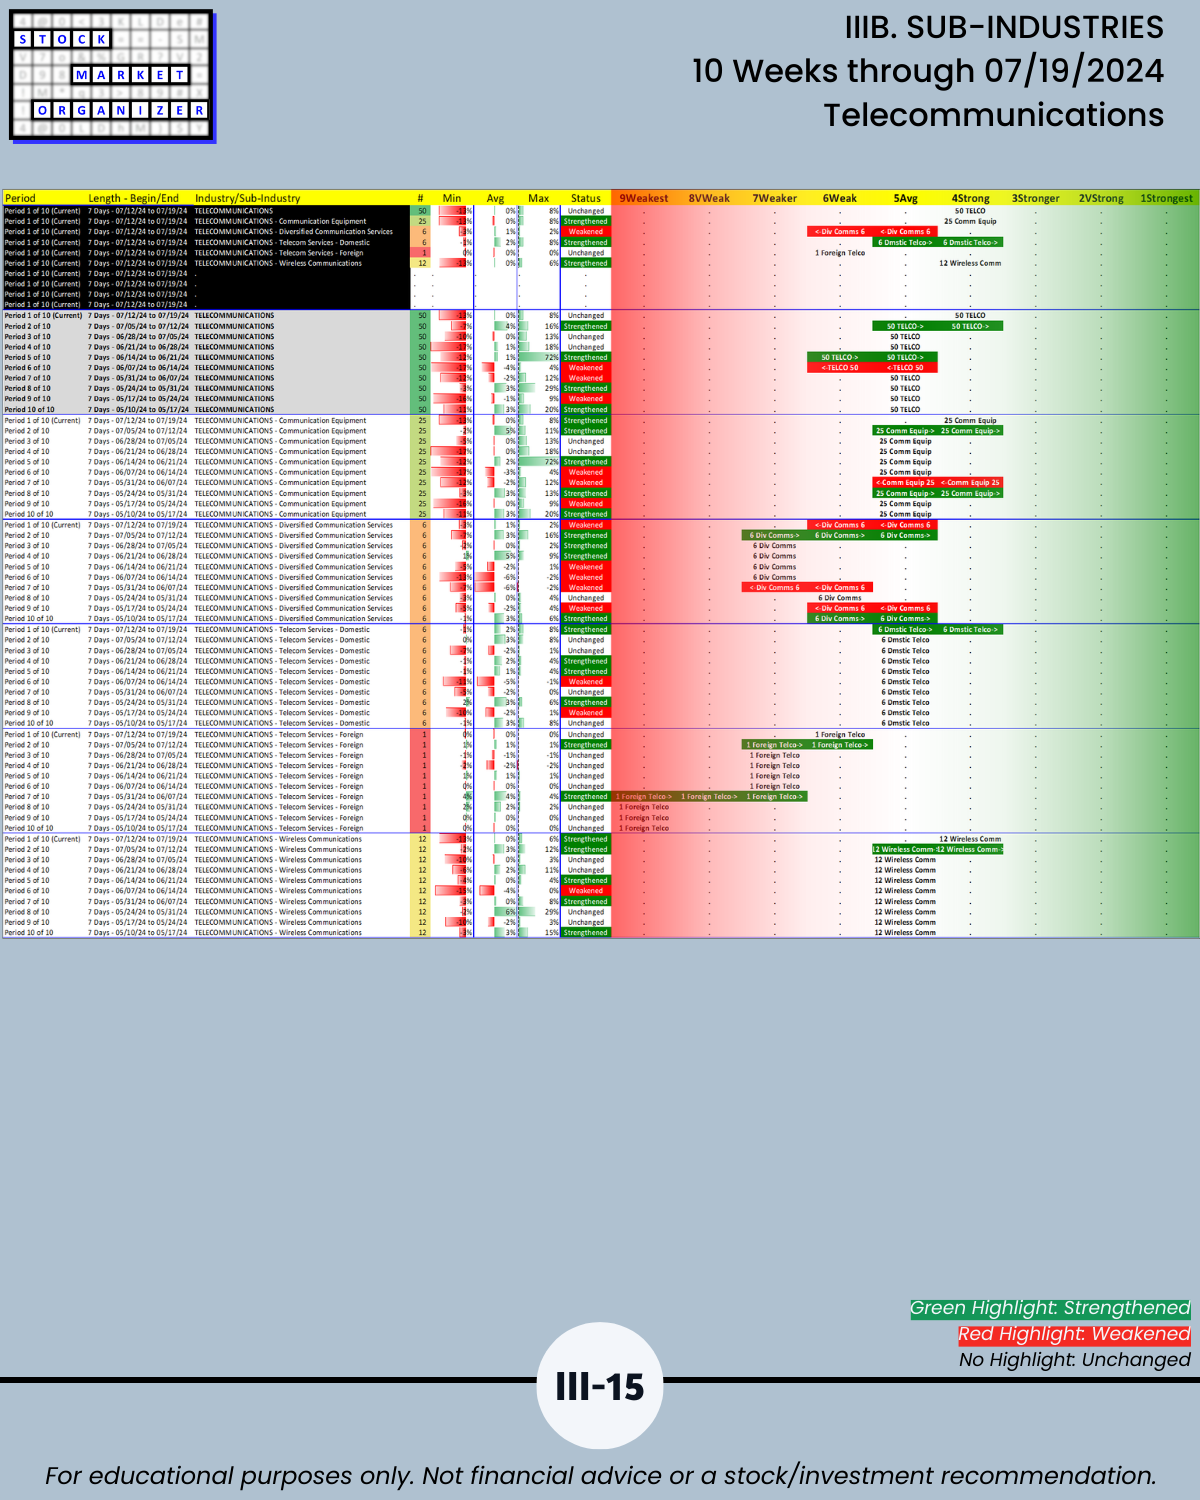
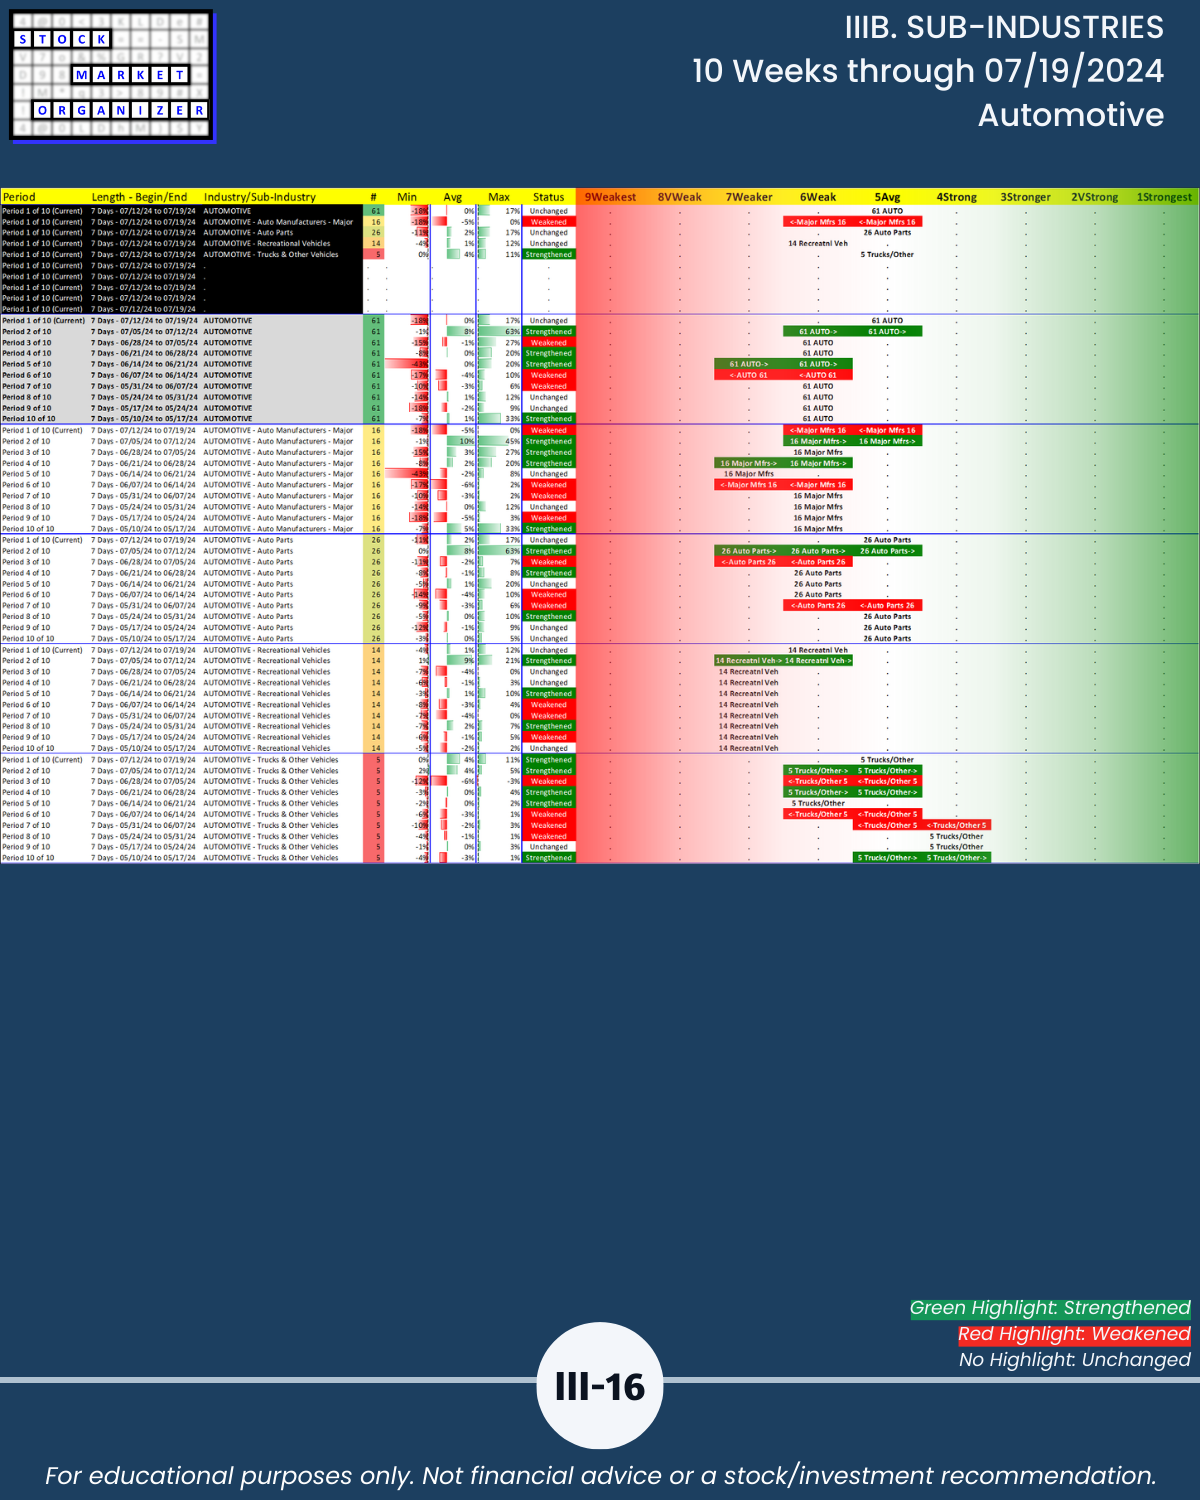
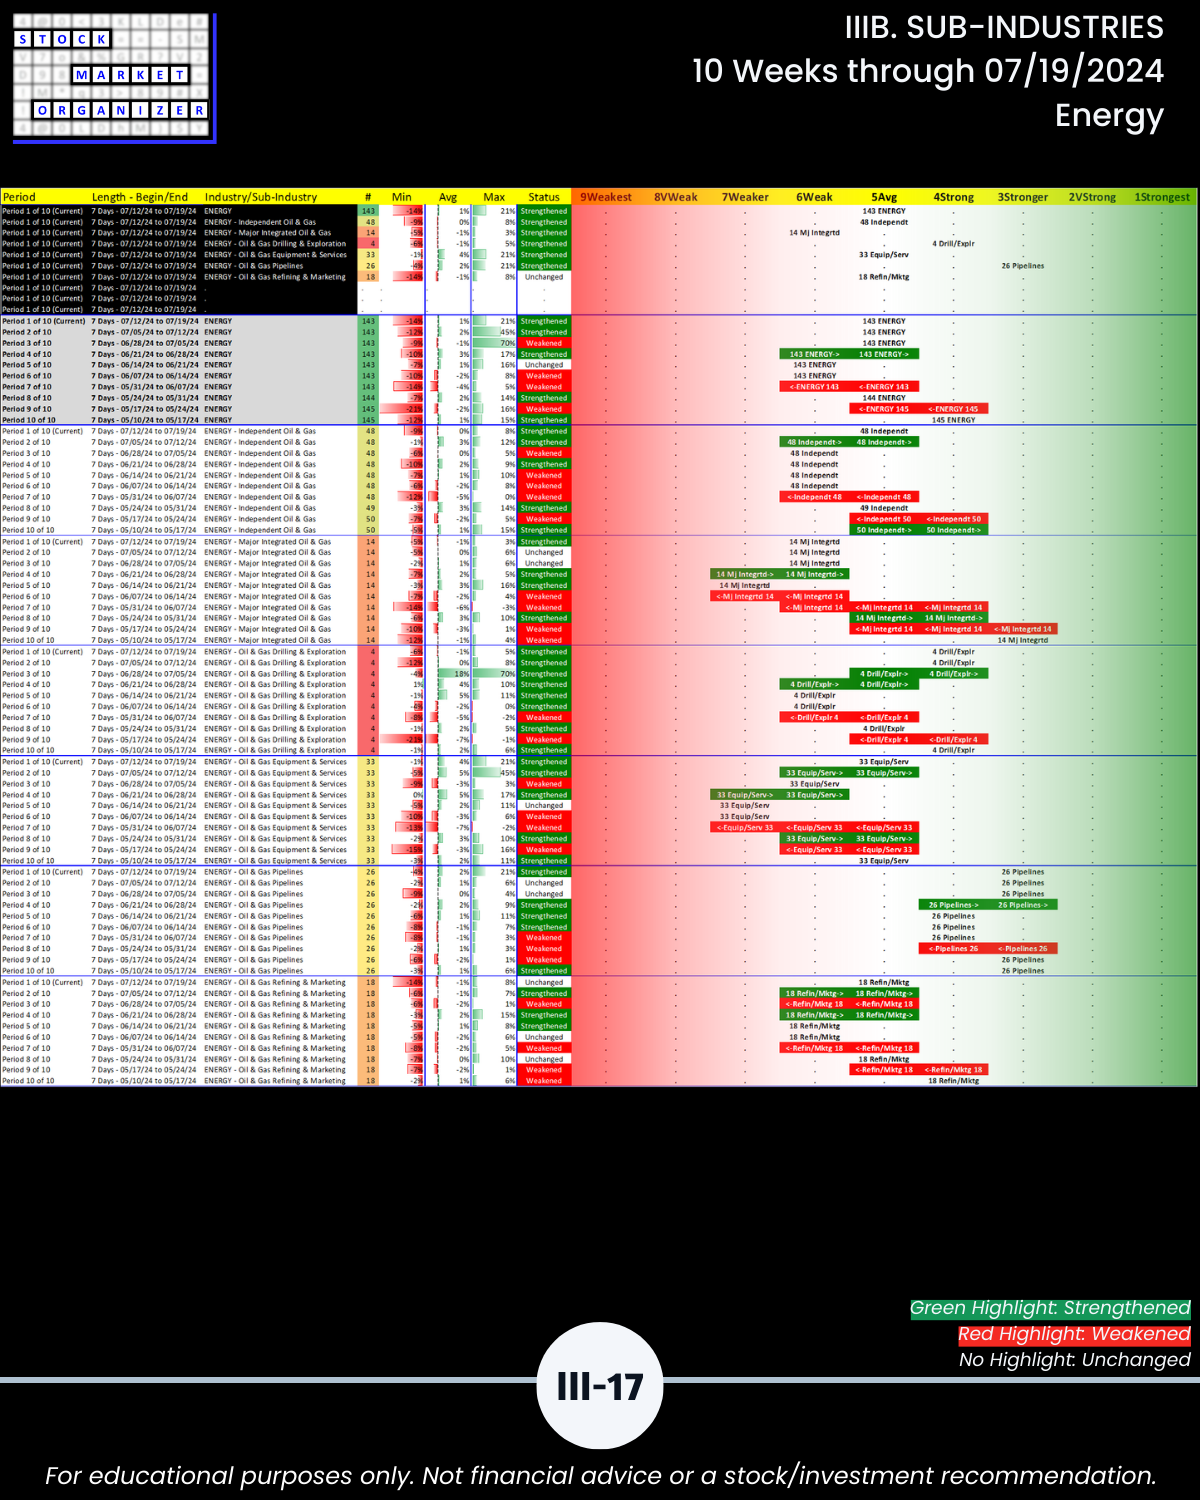
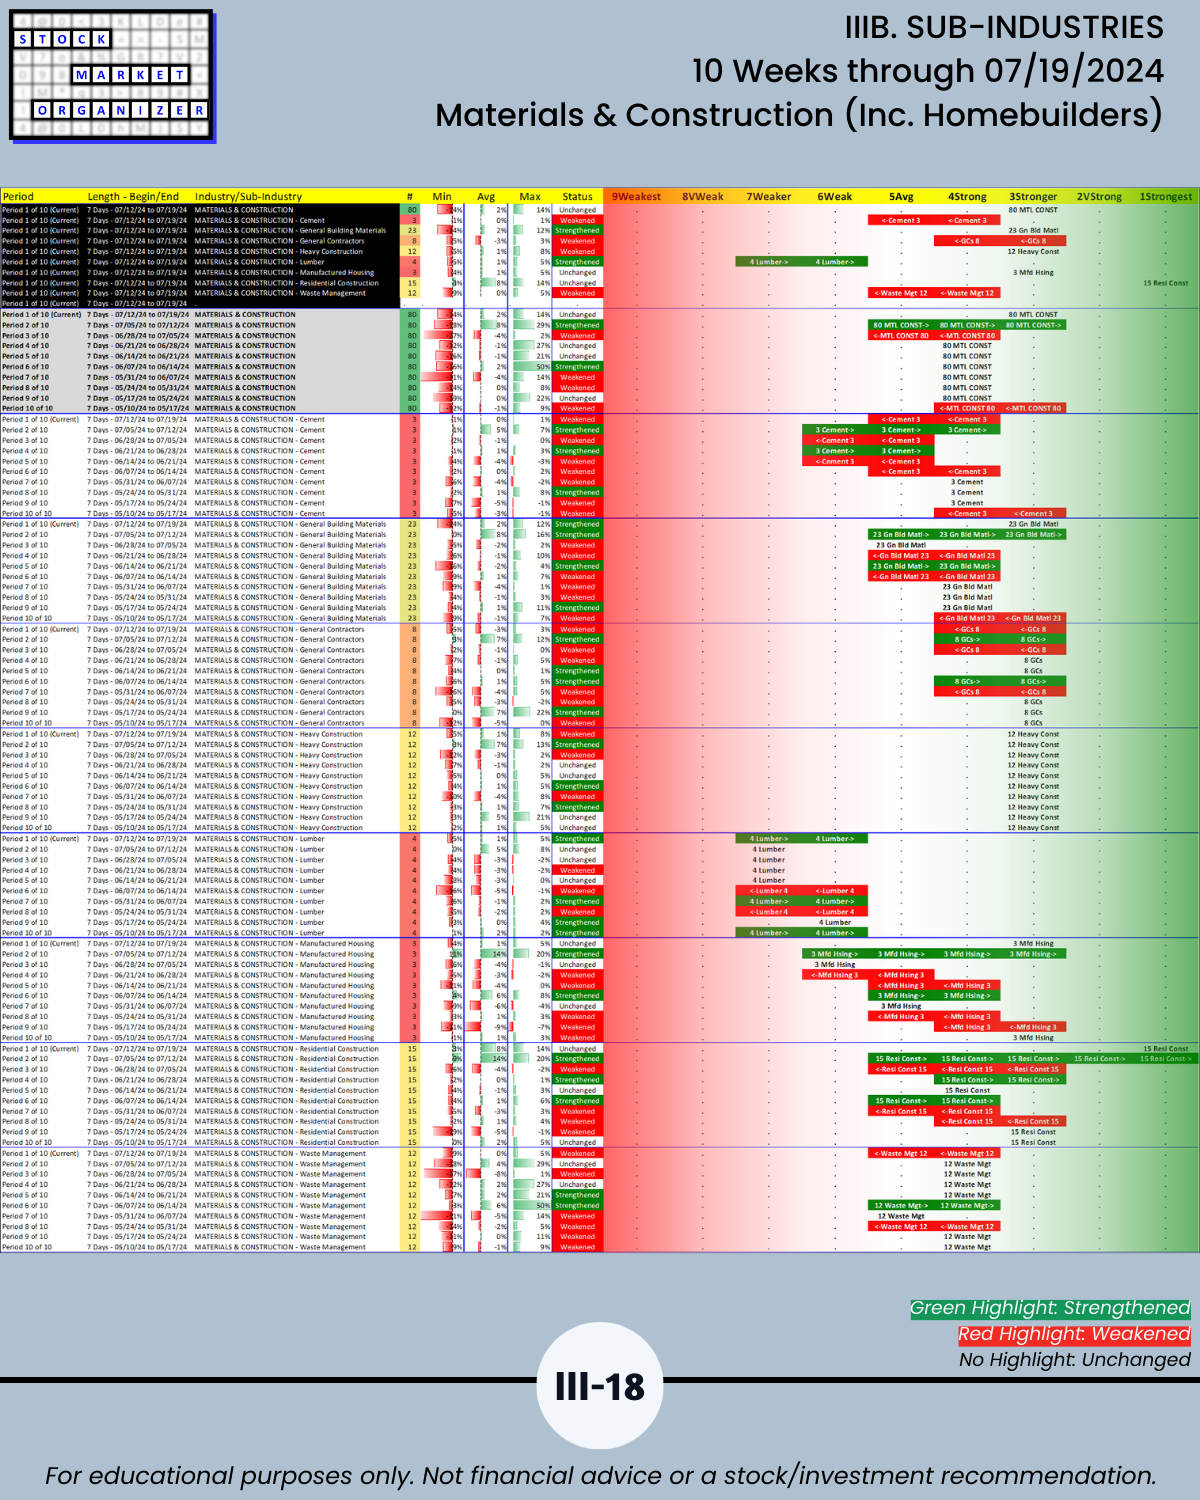
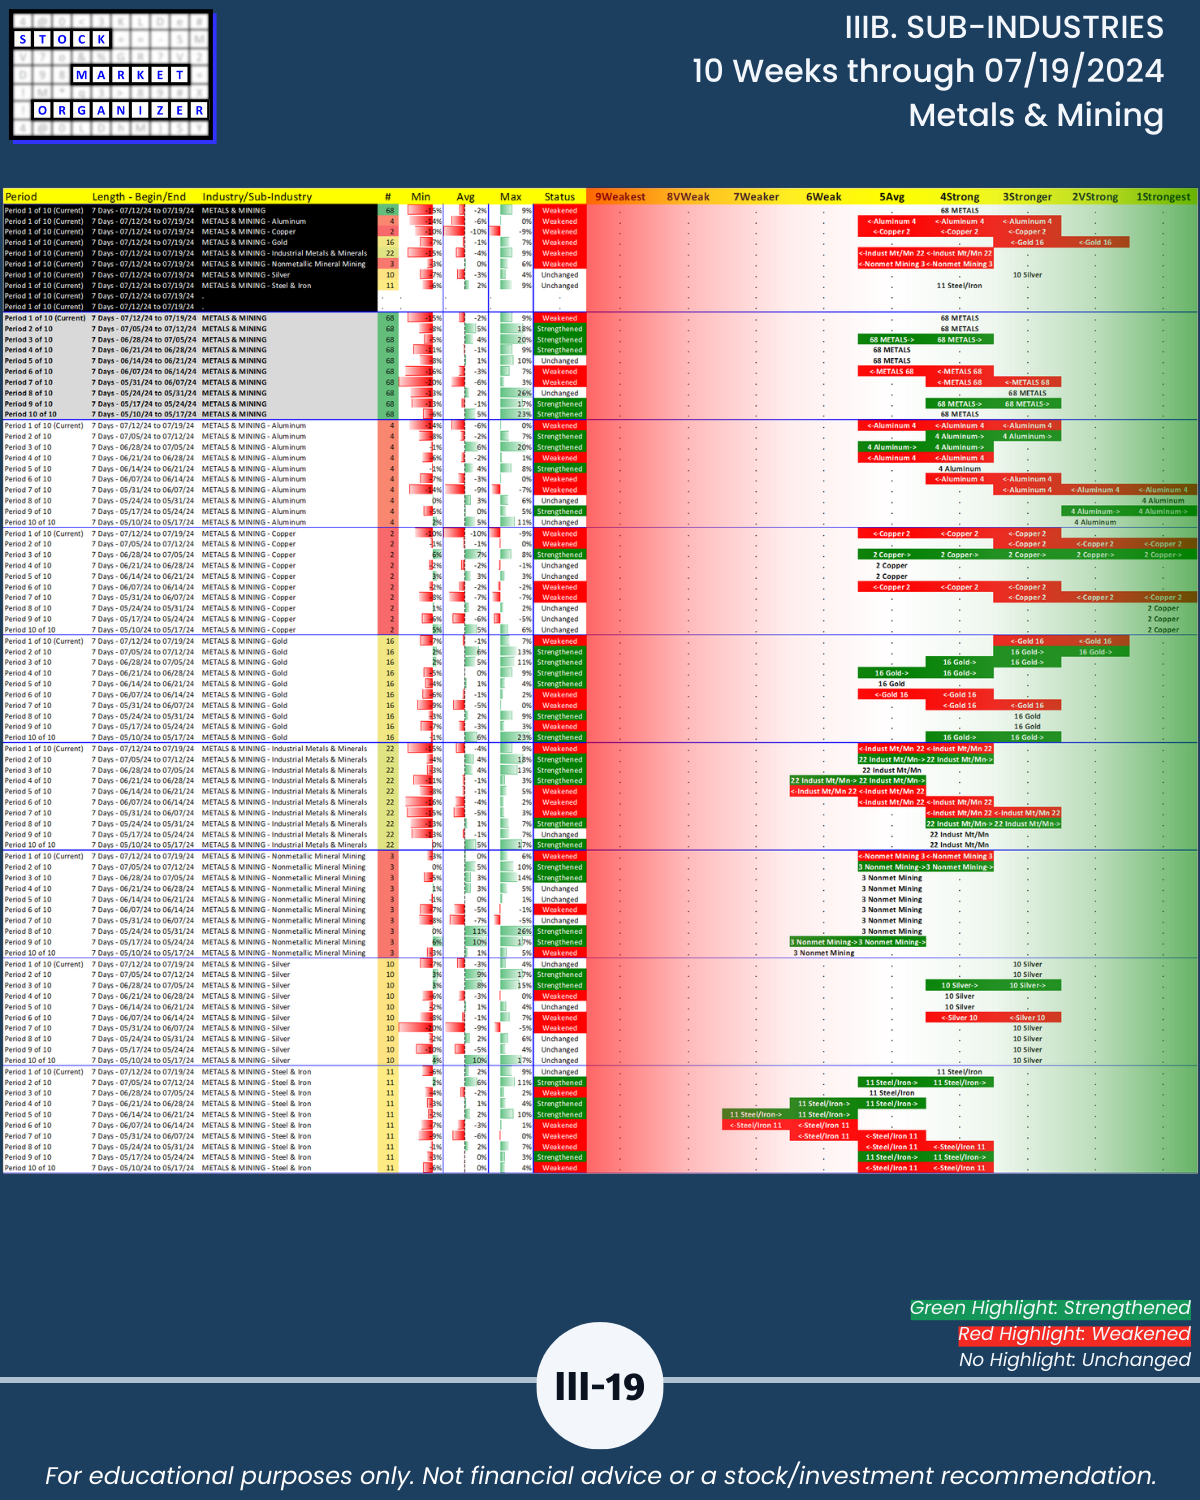
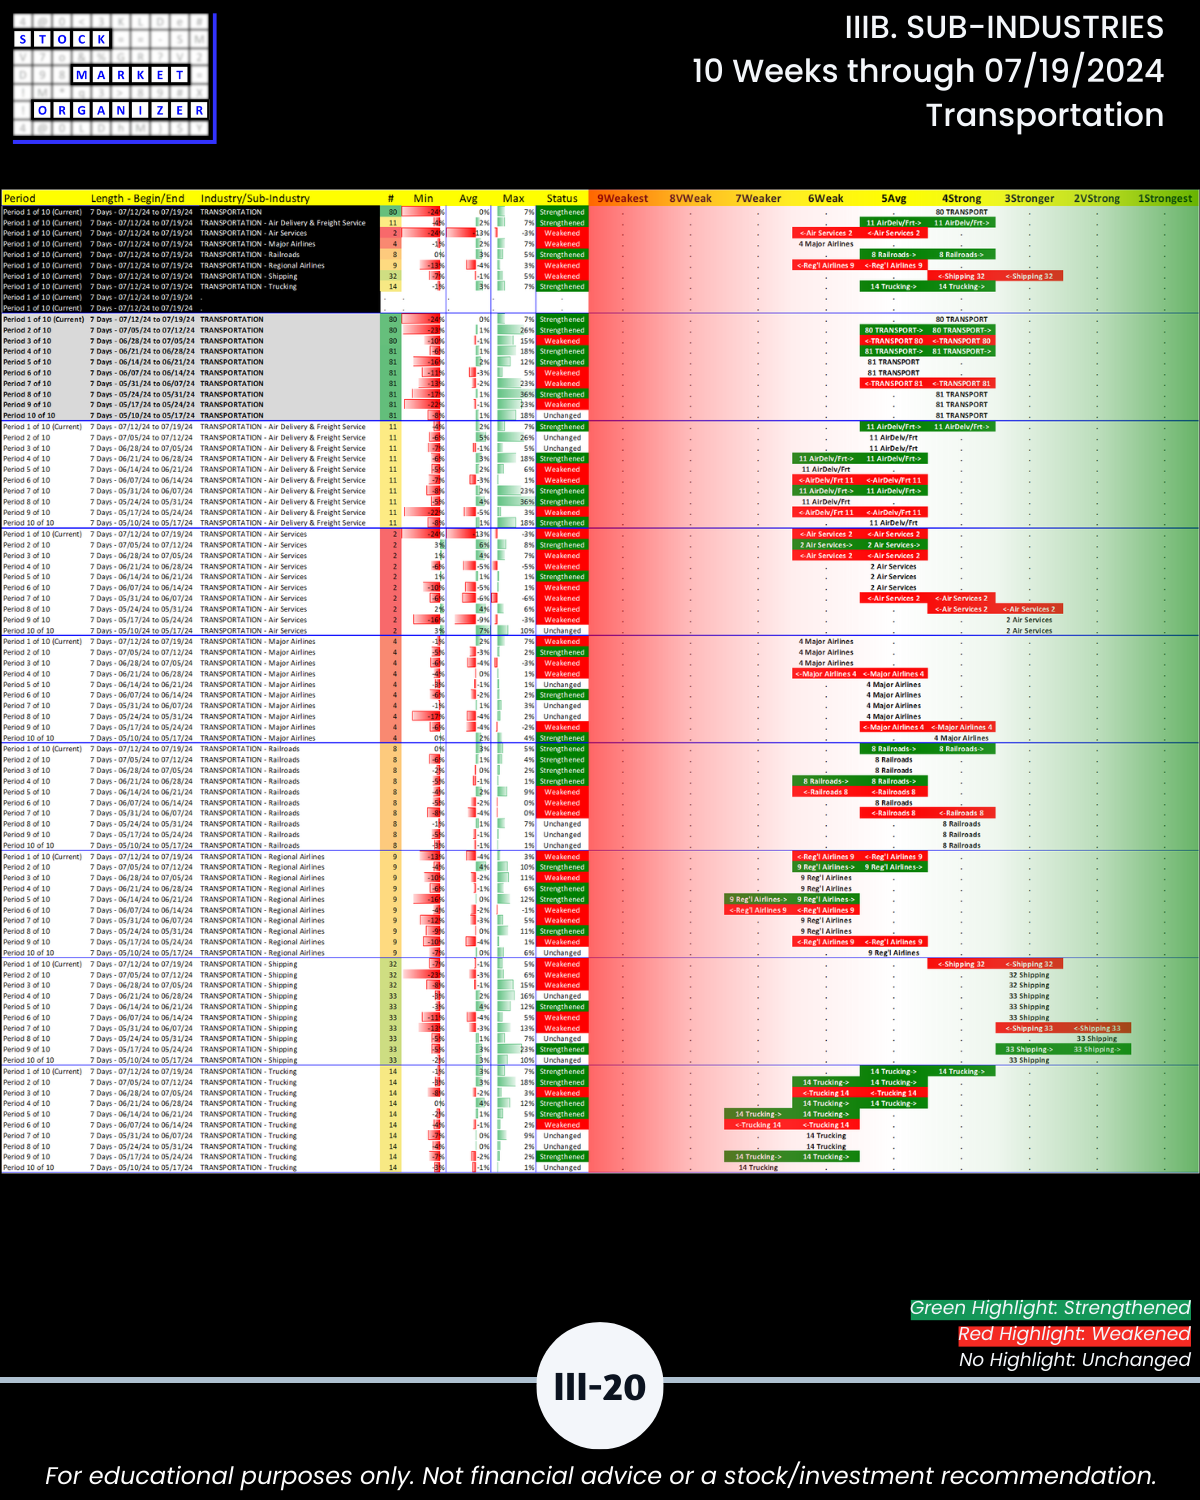
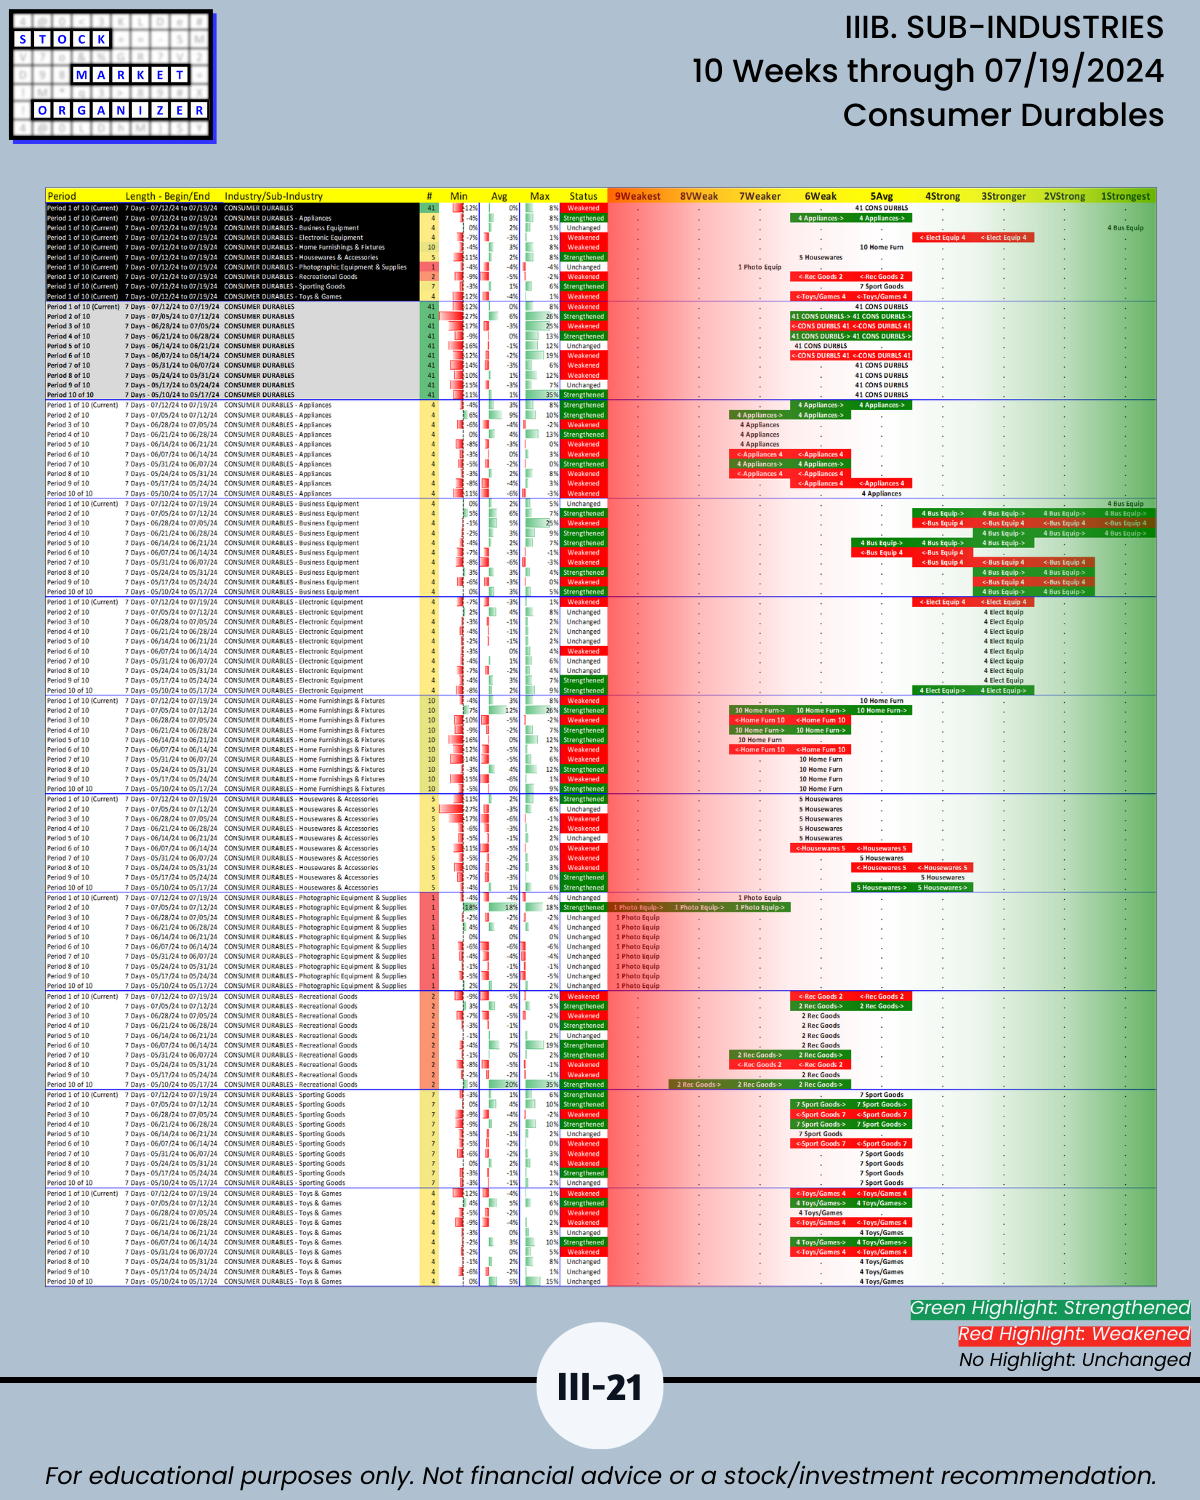
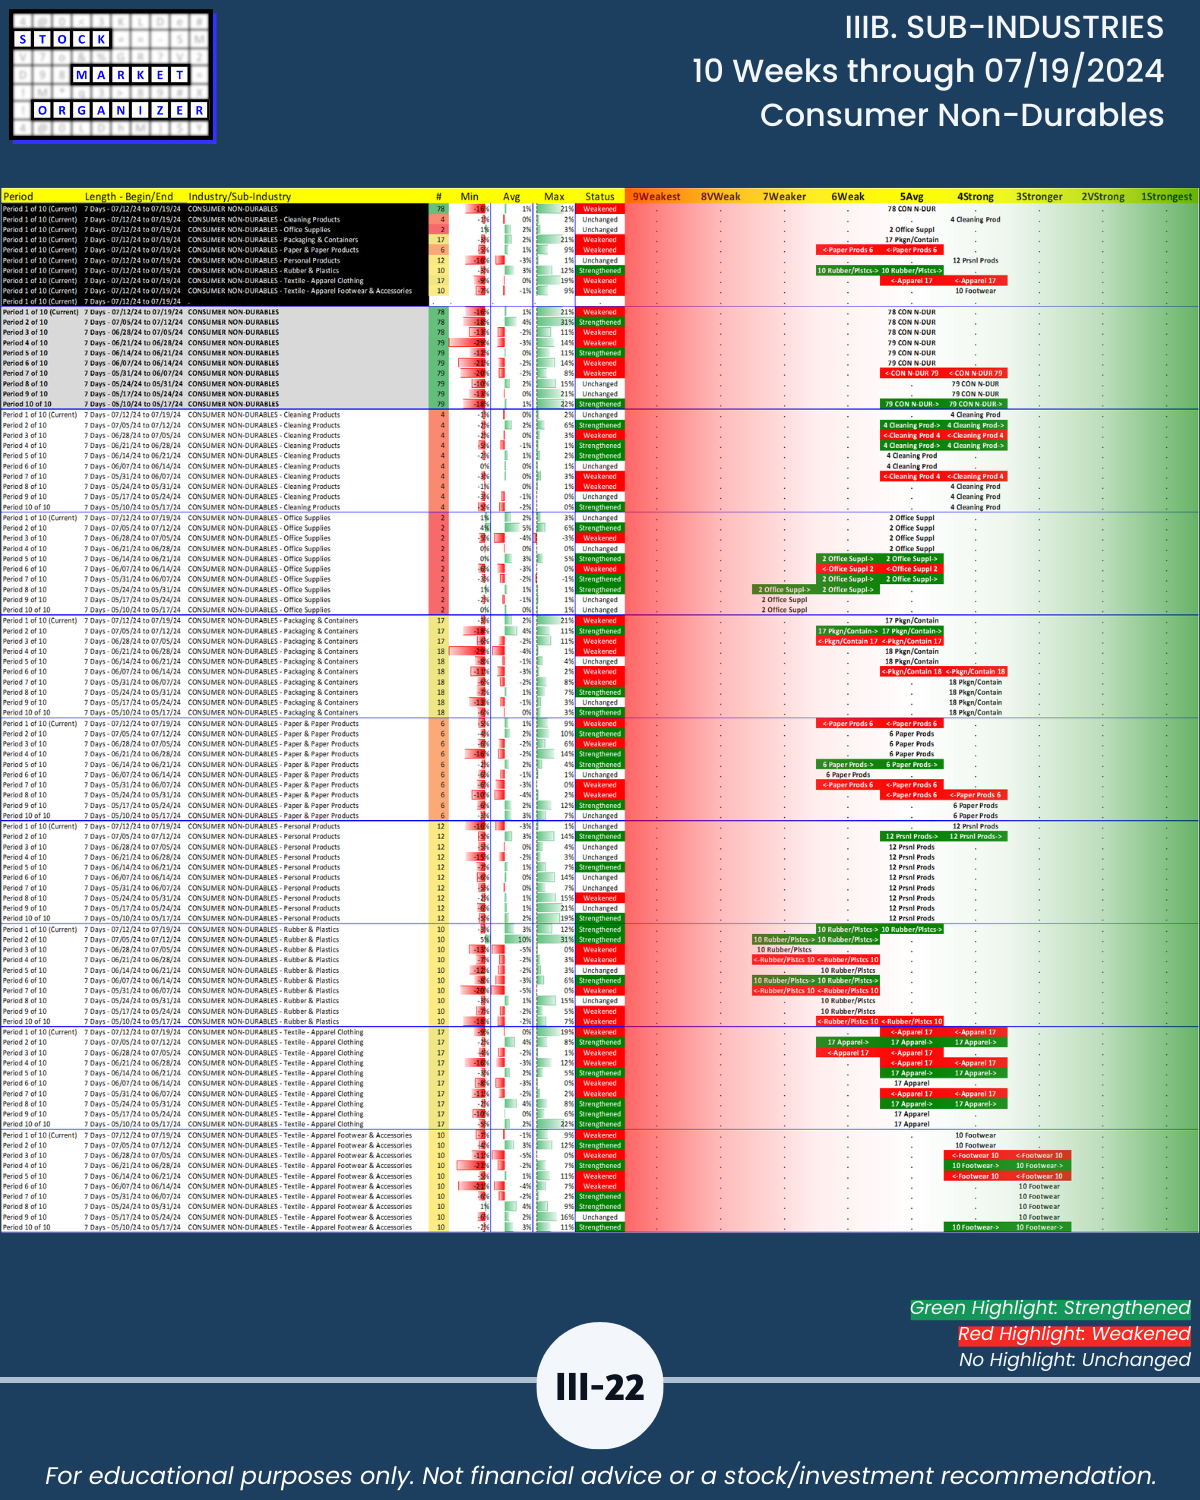
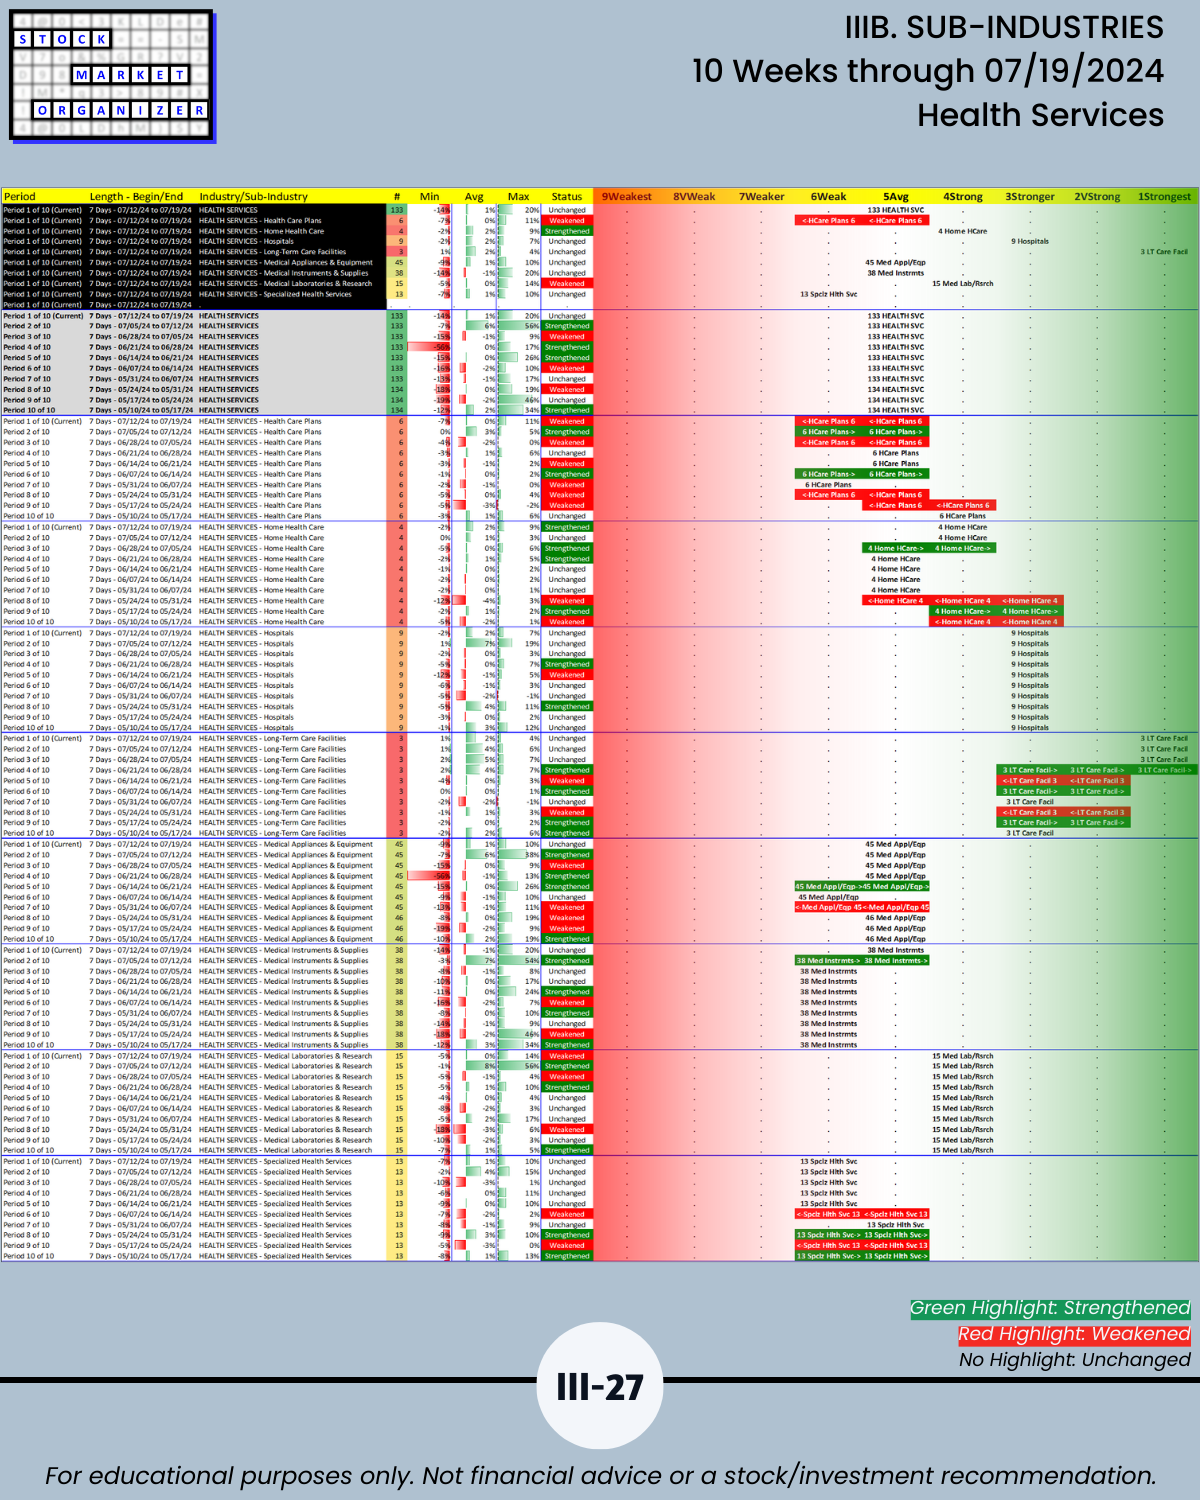
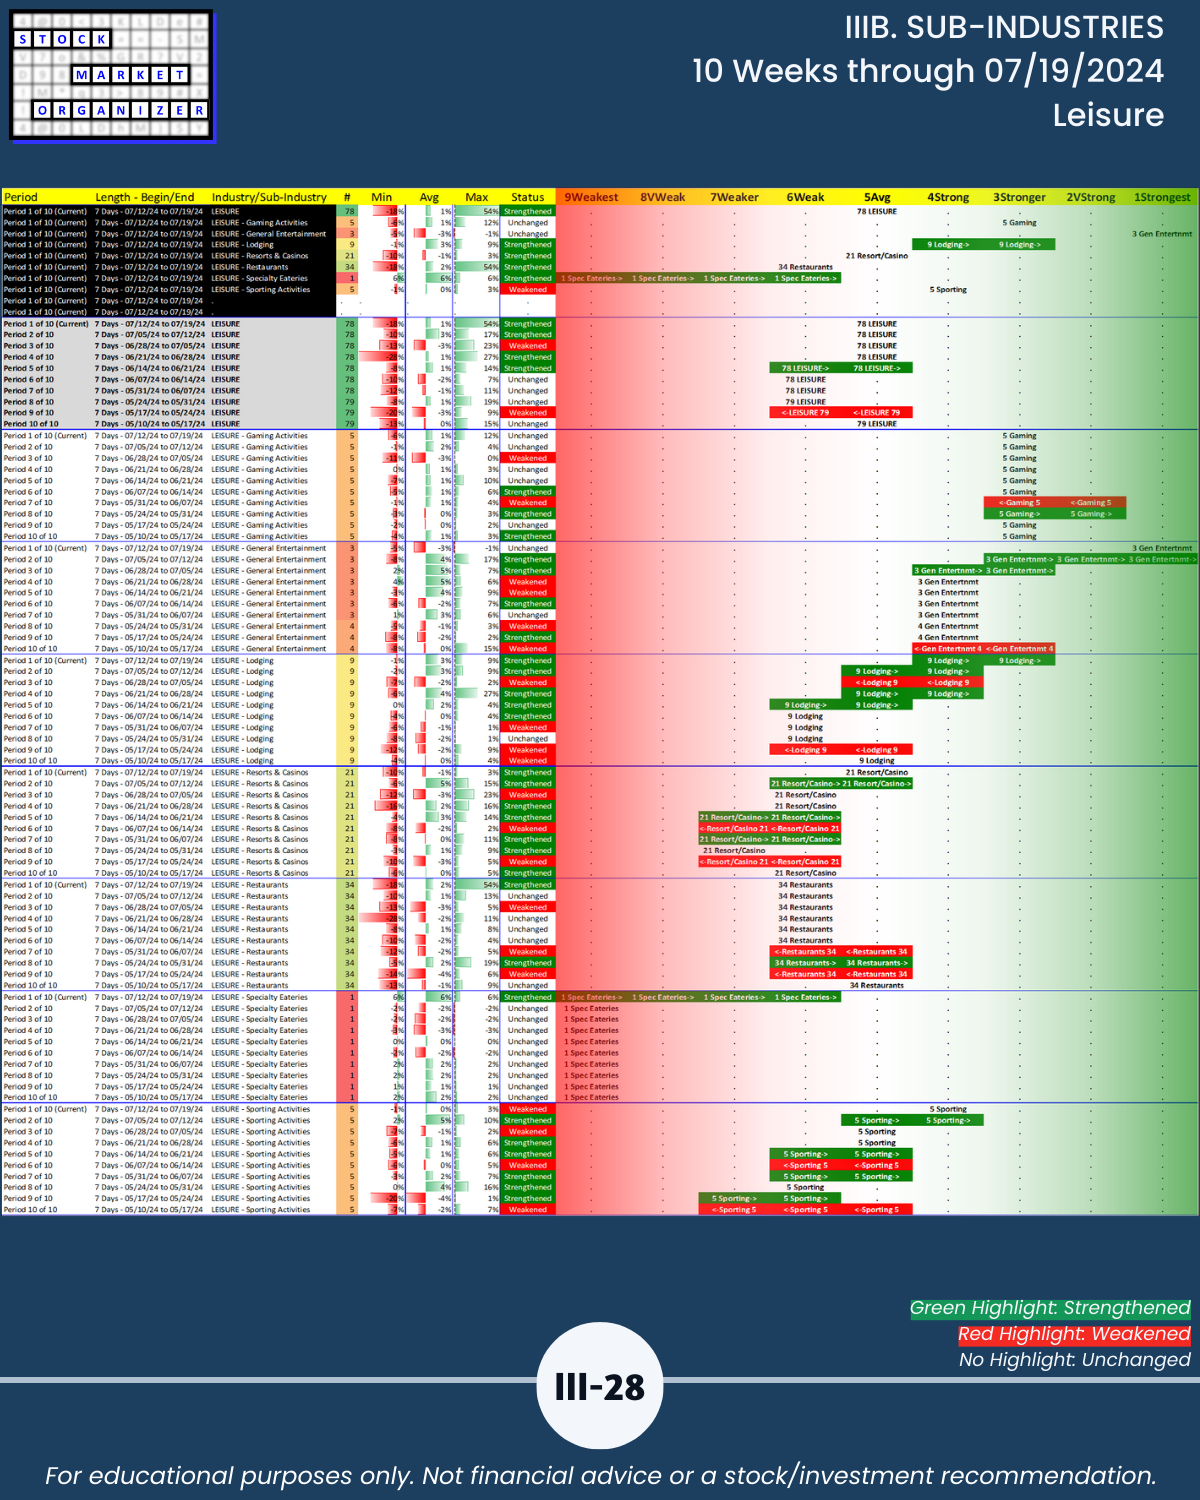
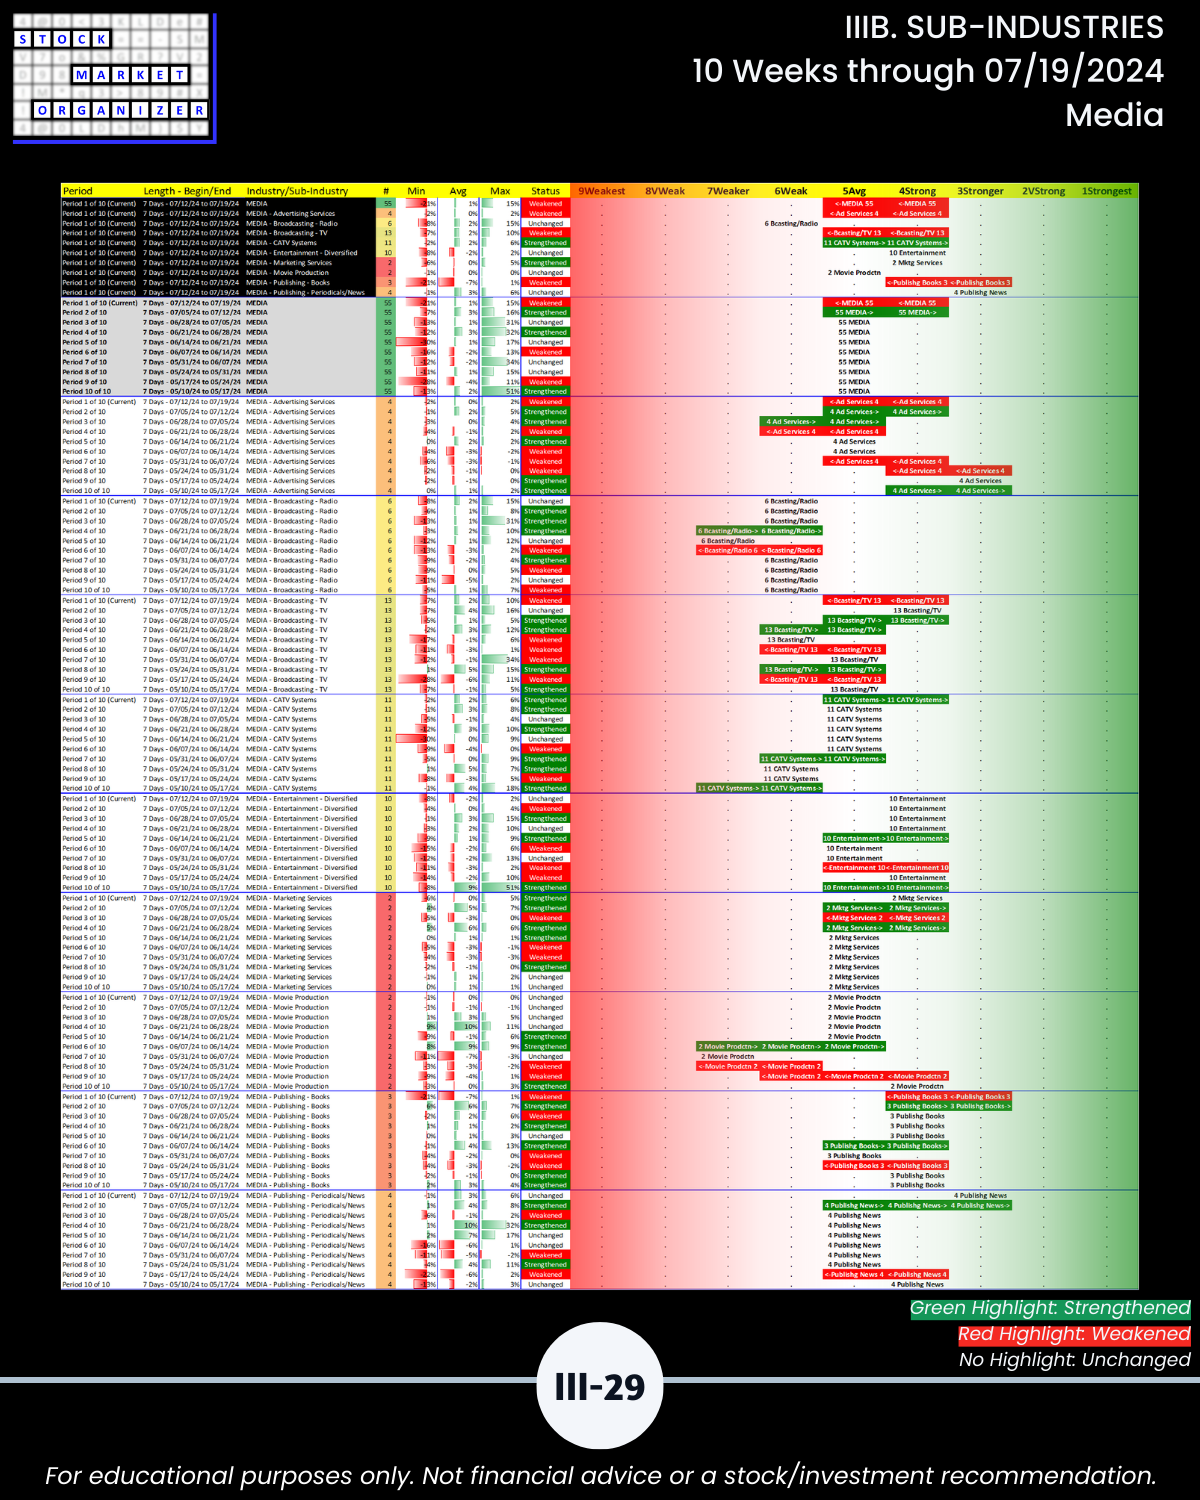
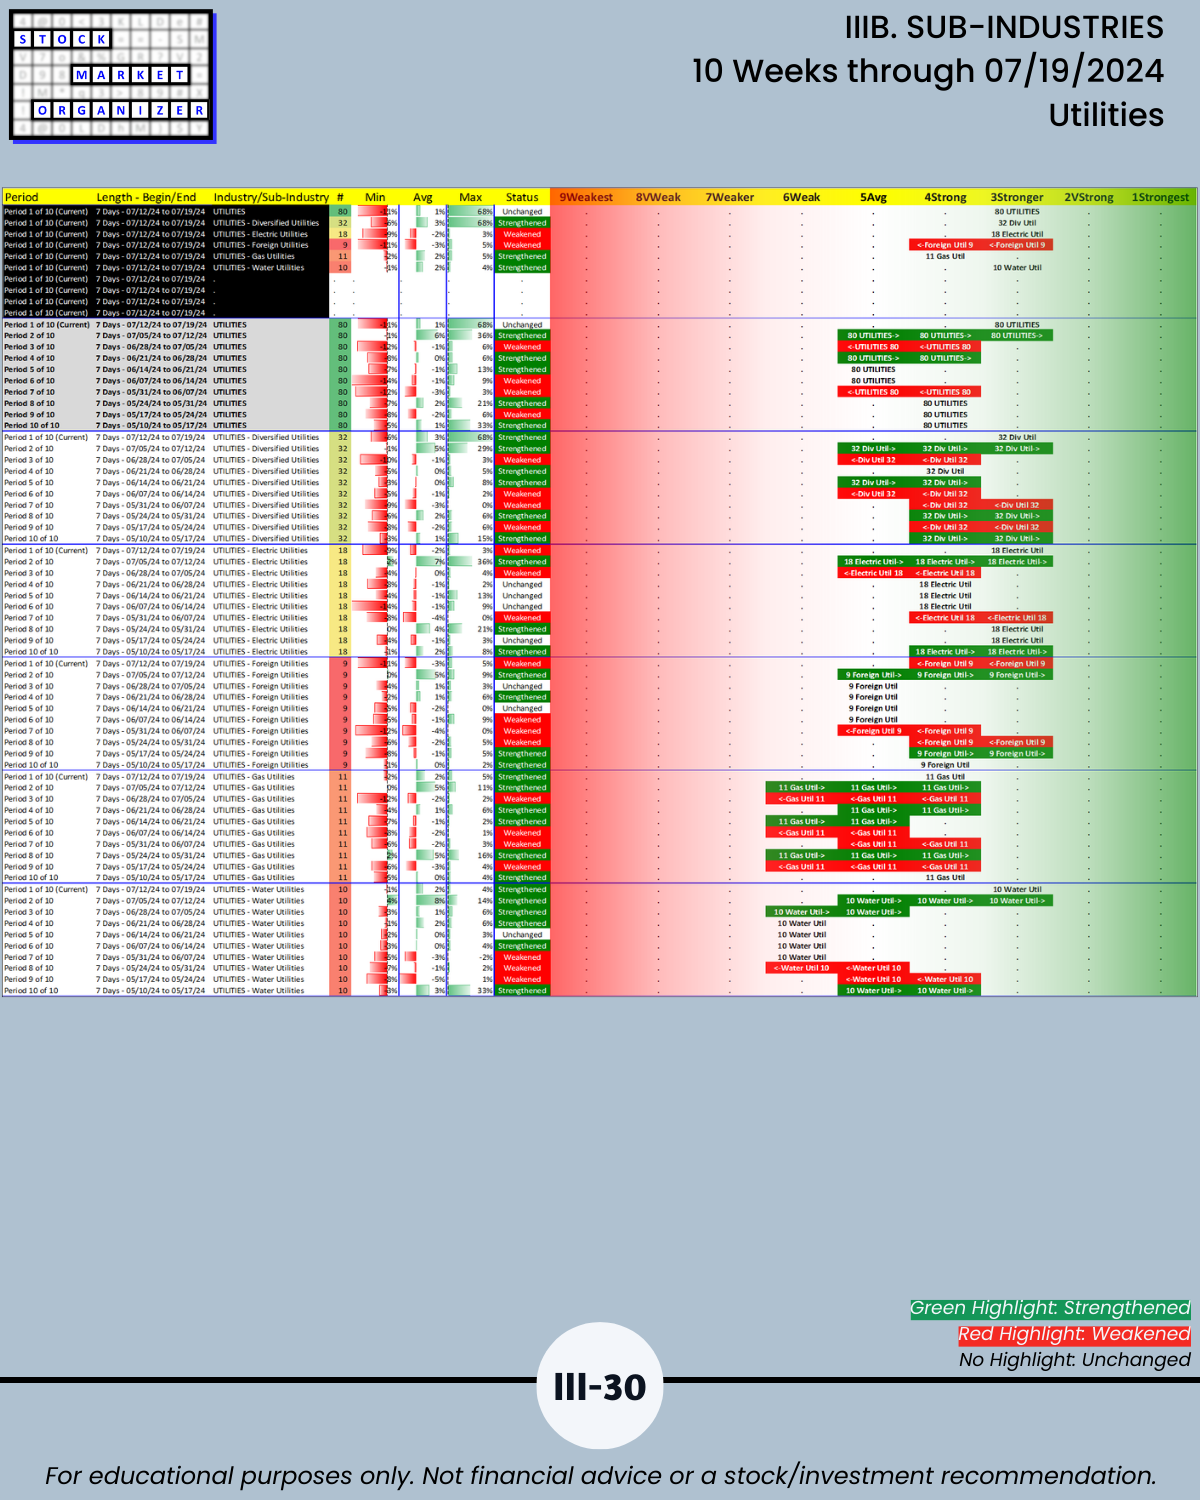
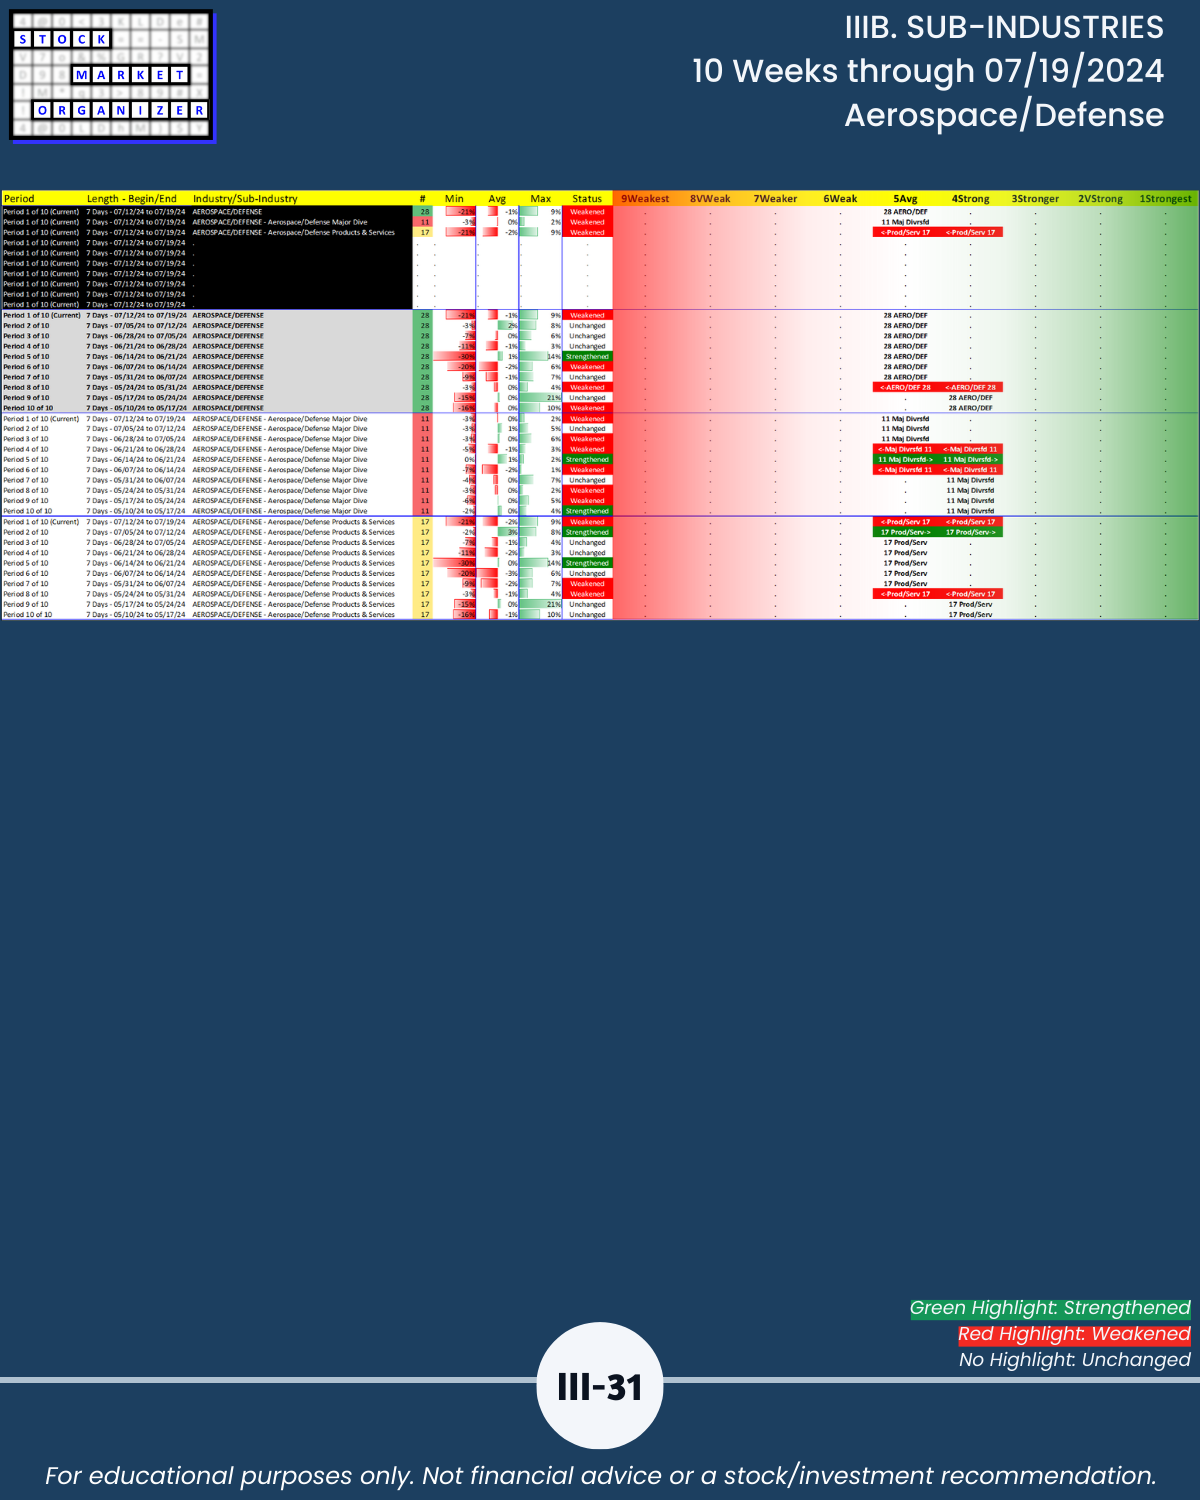
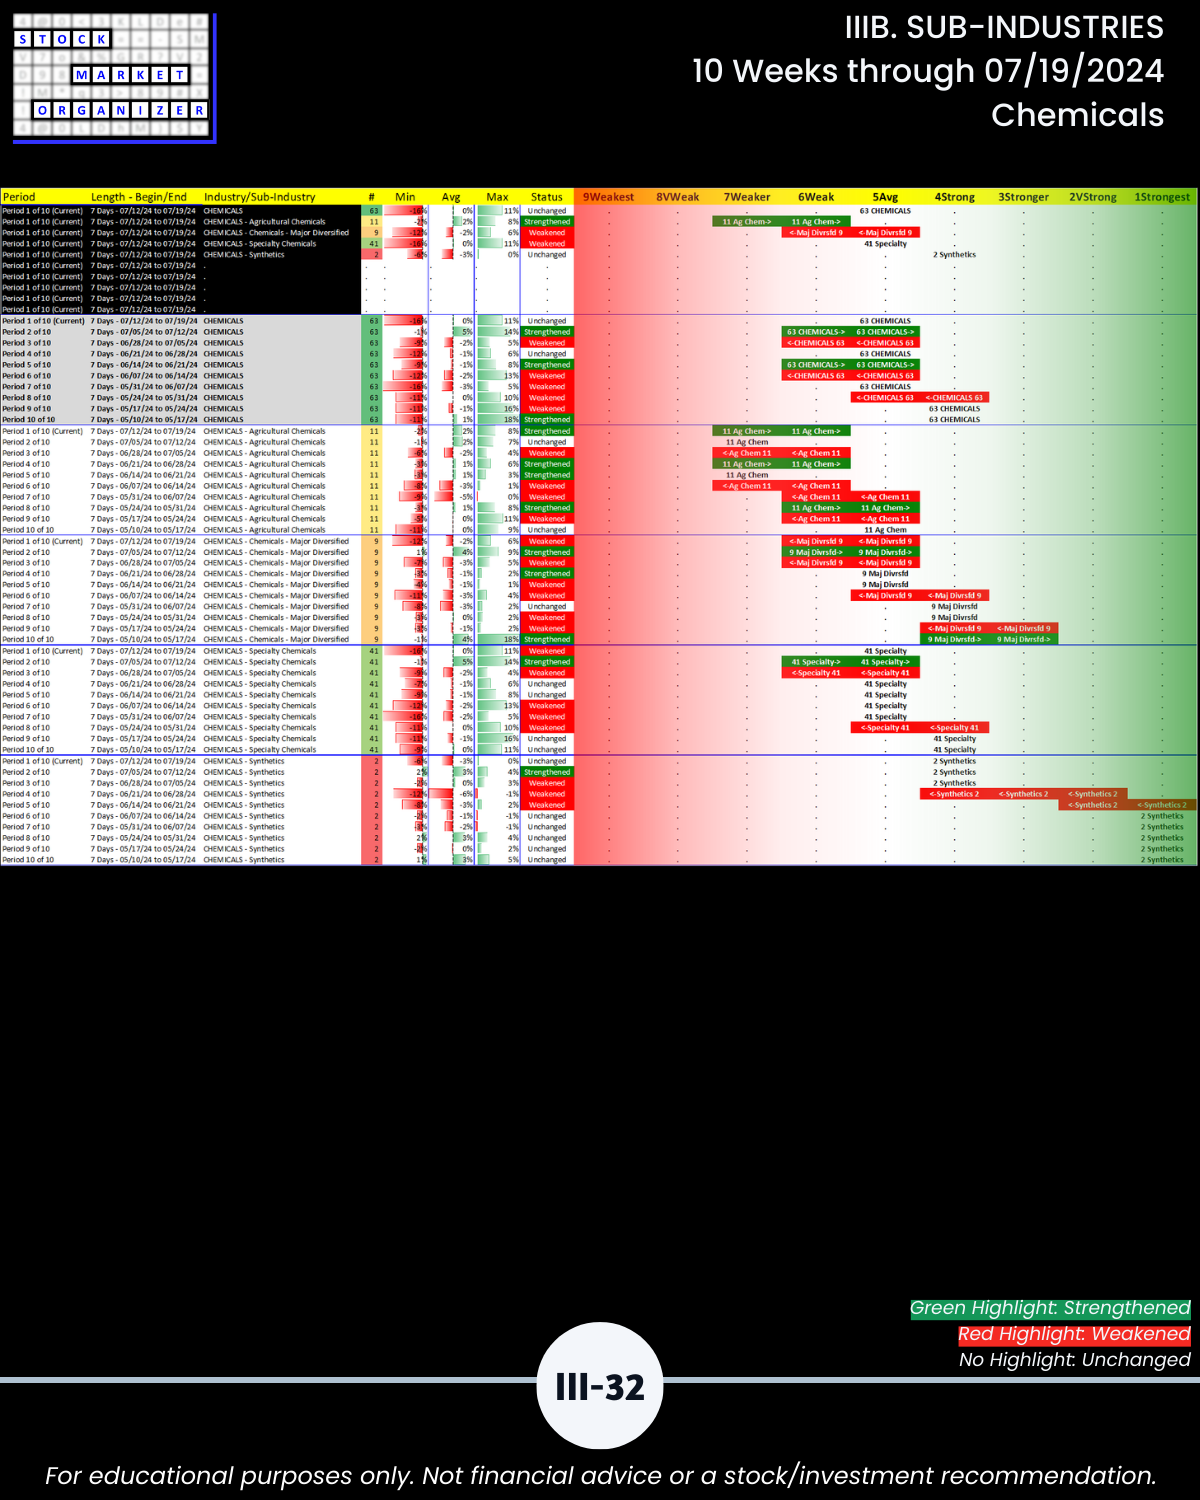
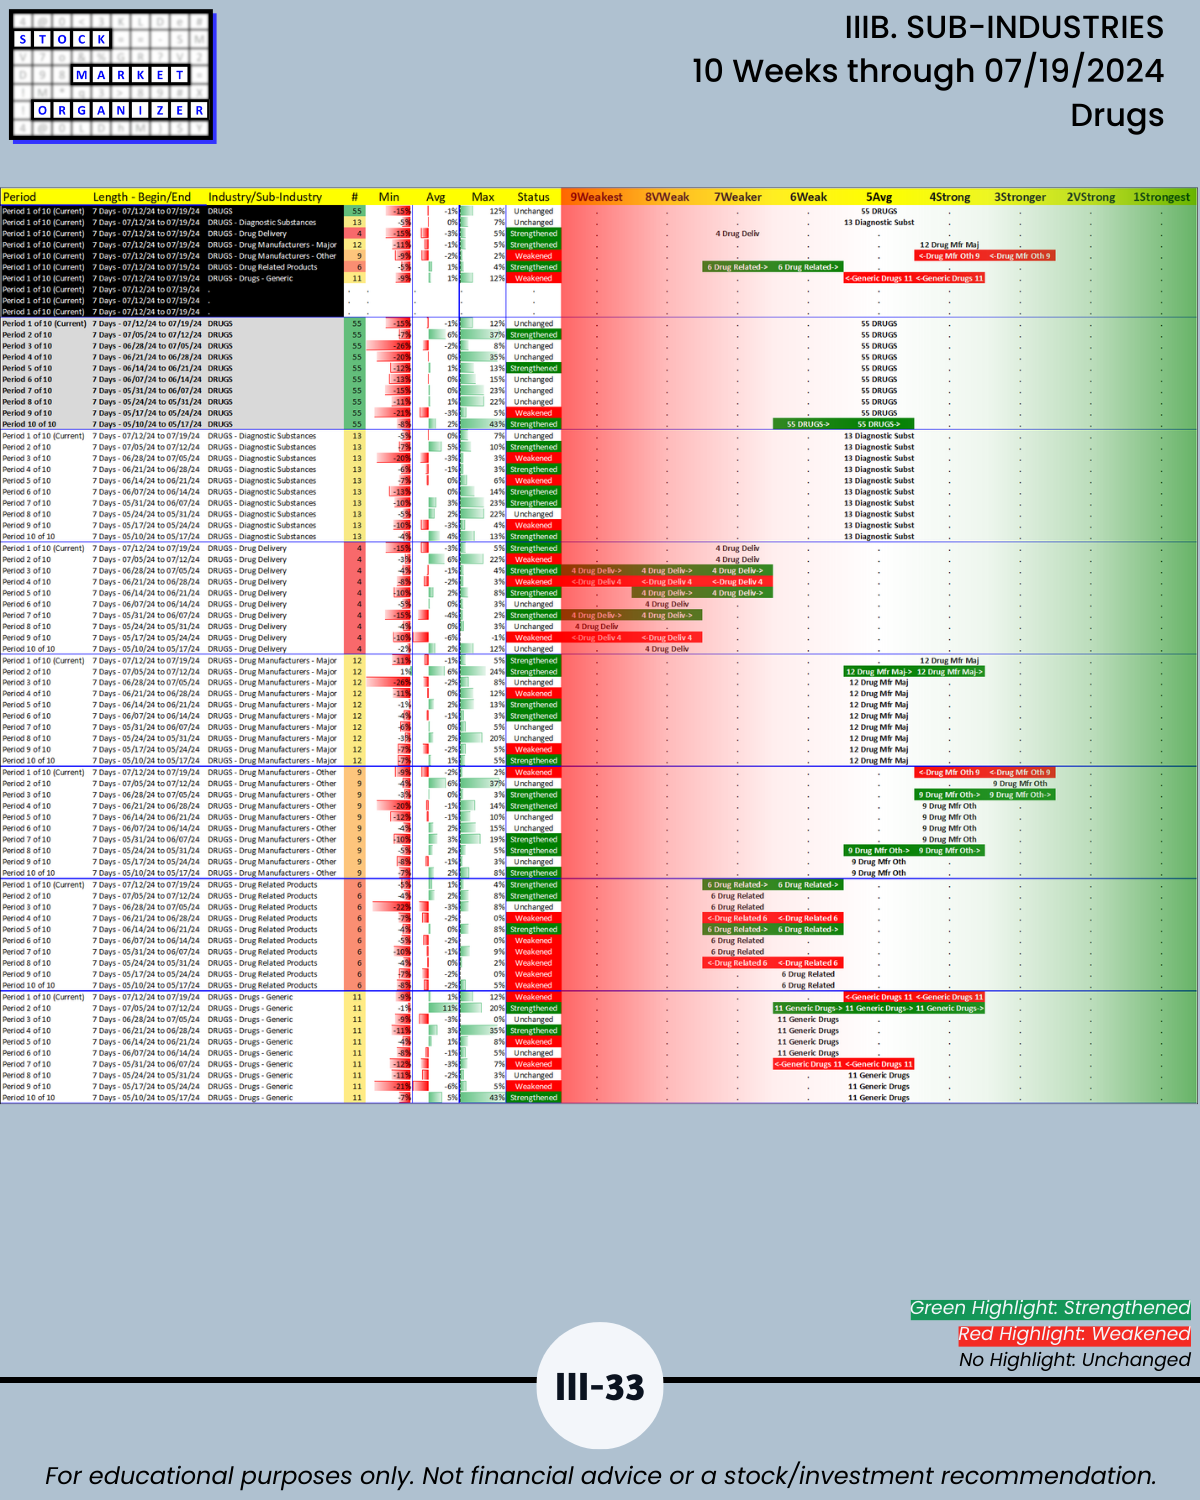
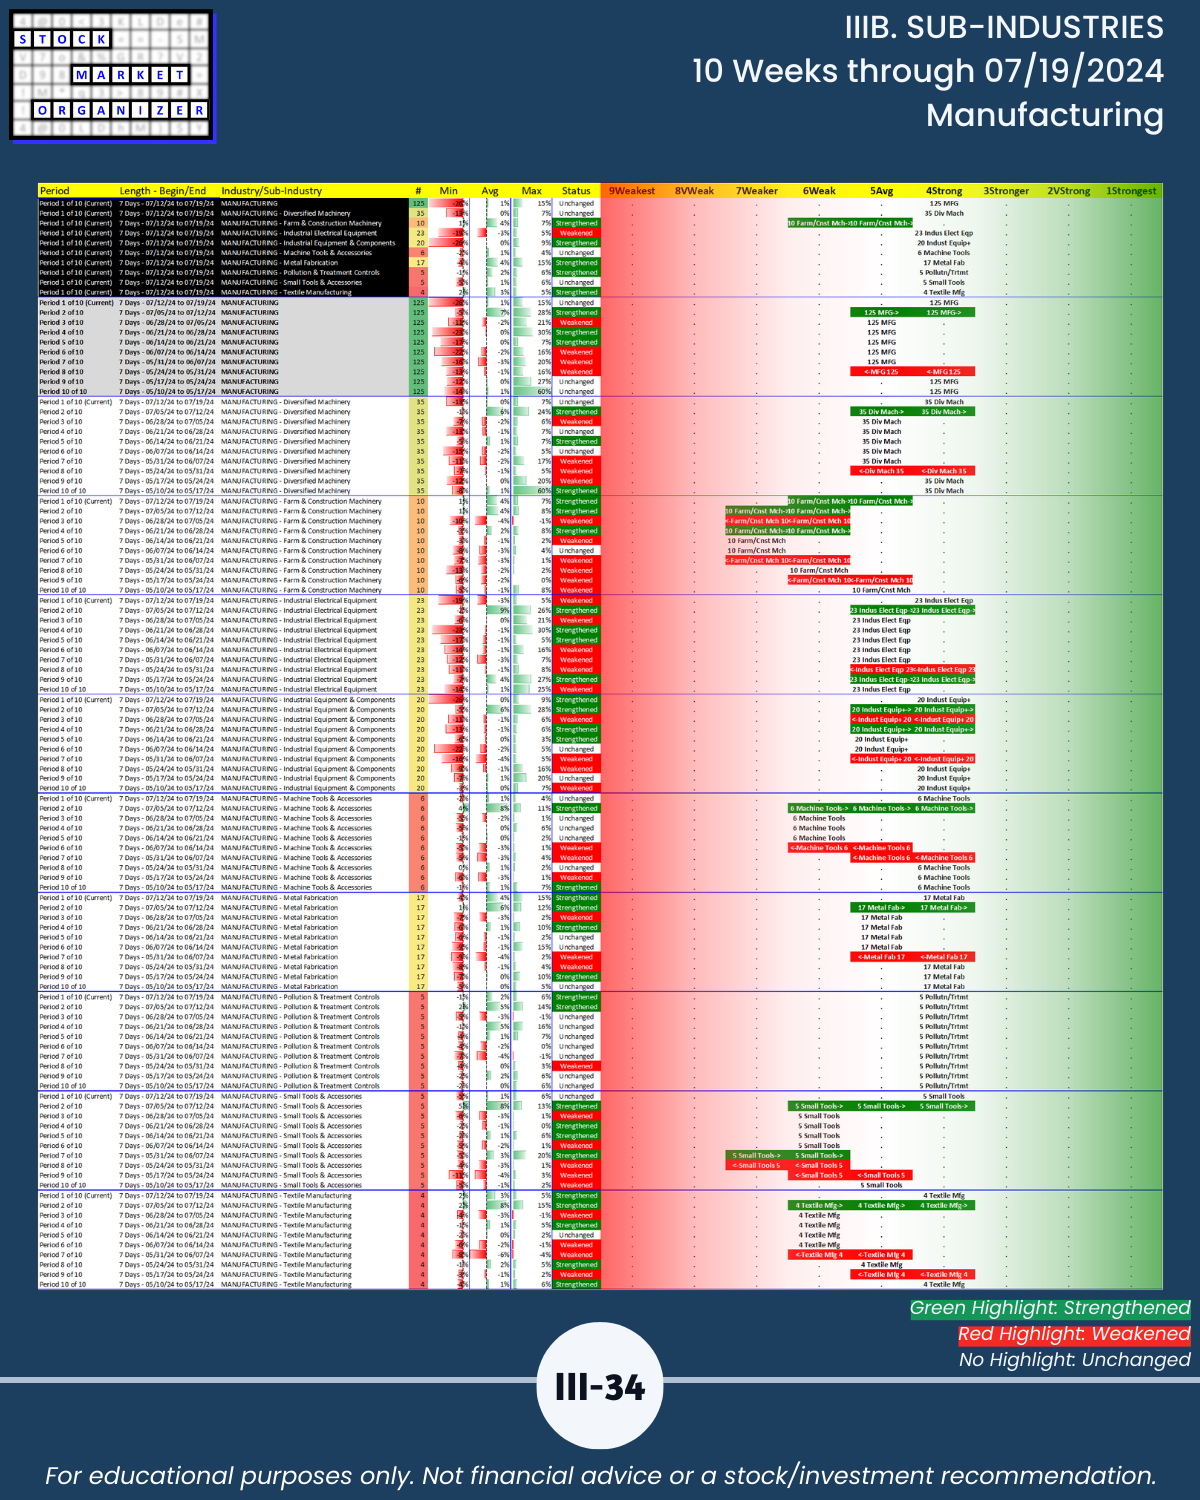
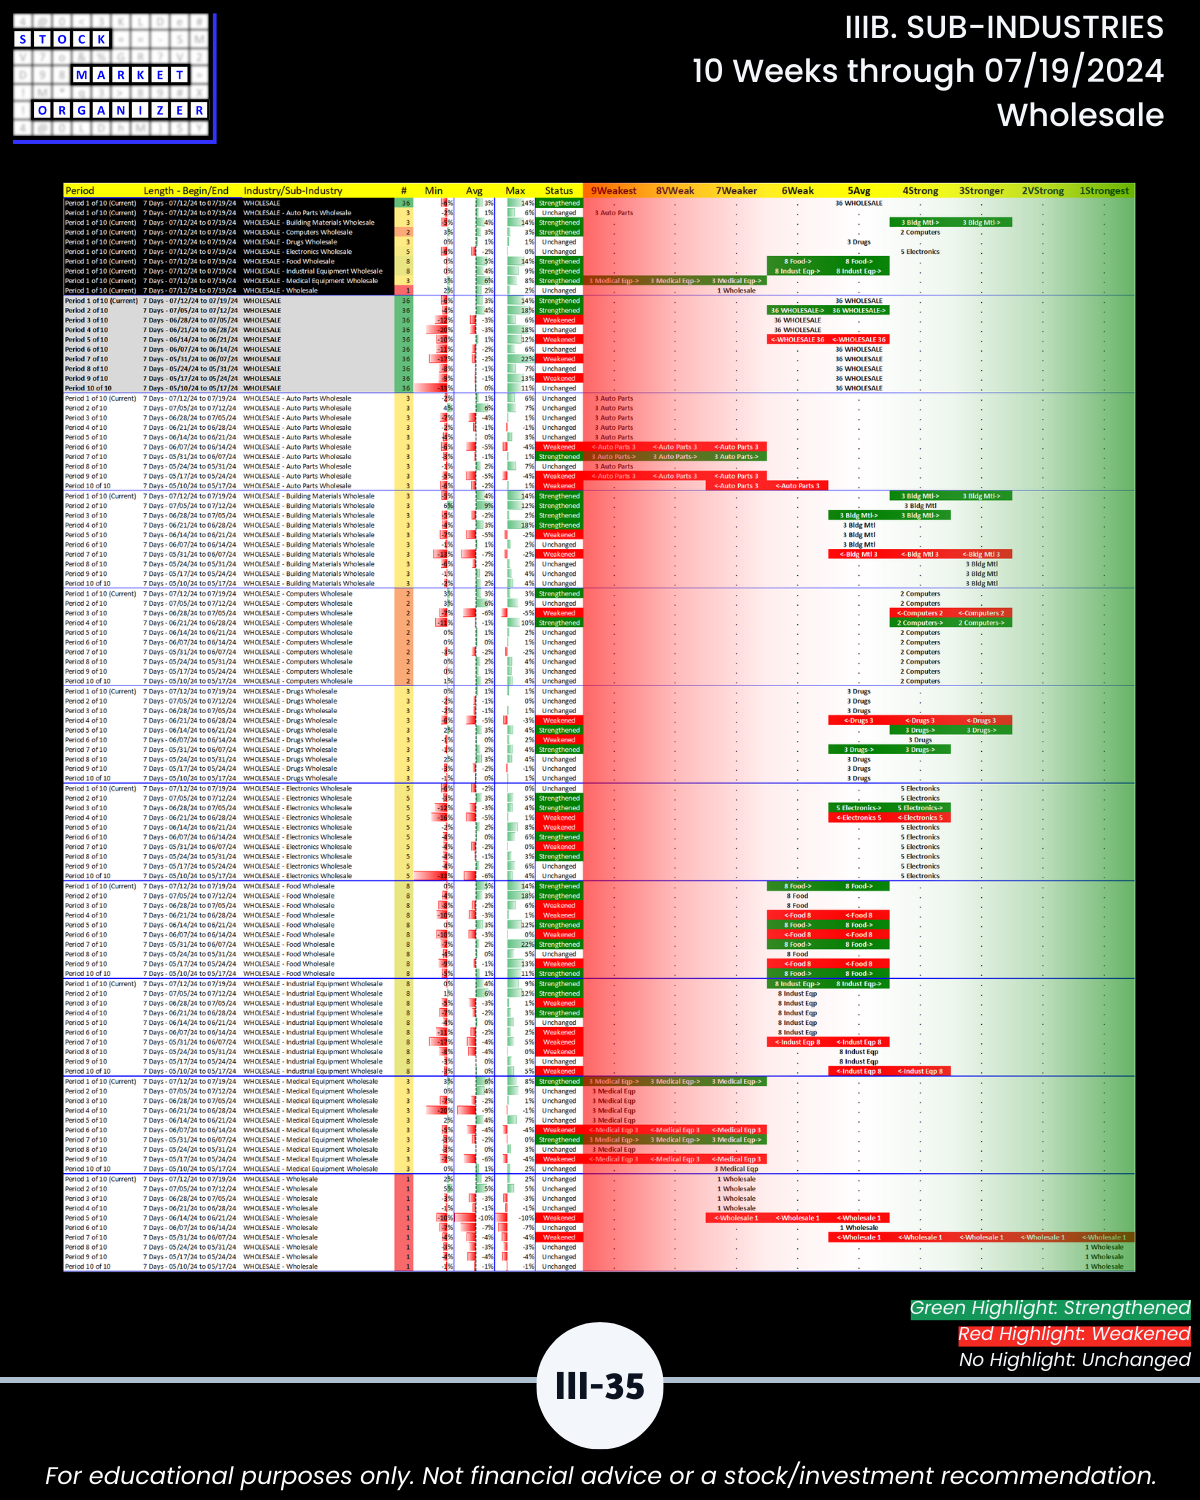
IIIB. SUB-INDUSTRIES 10-Week Strengthening/Weakening
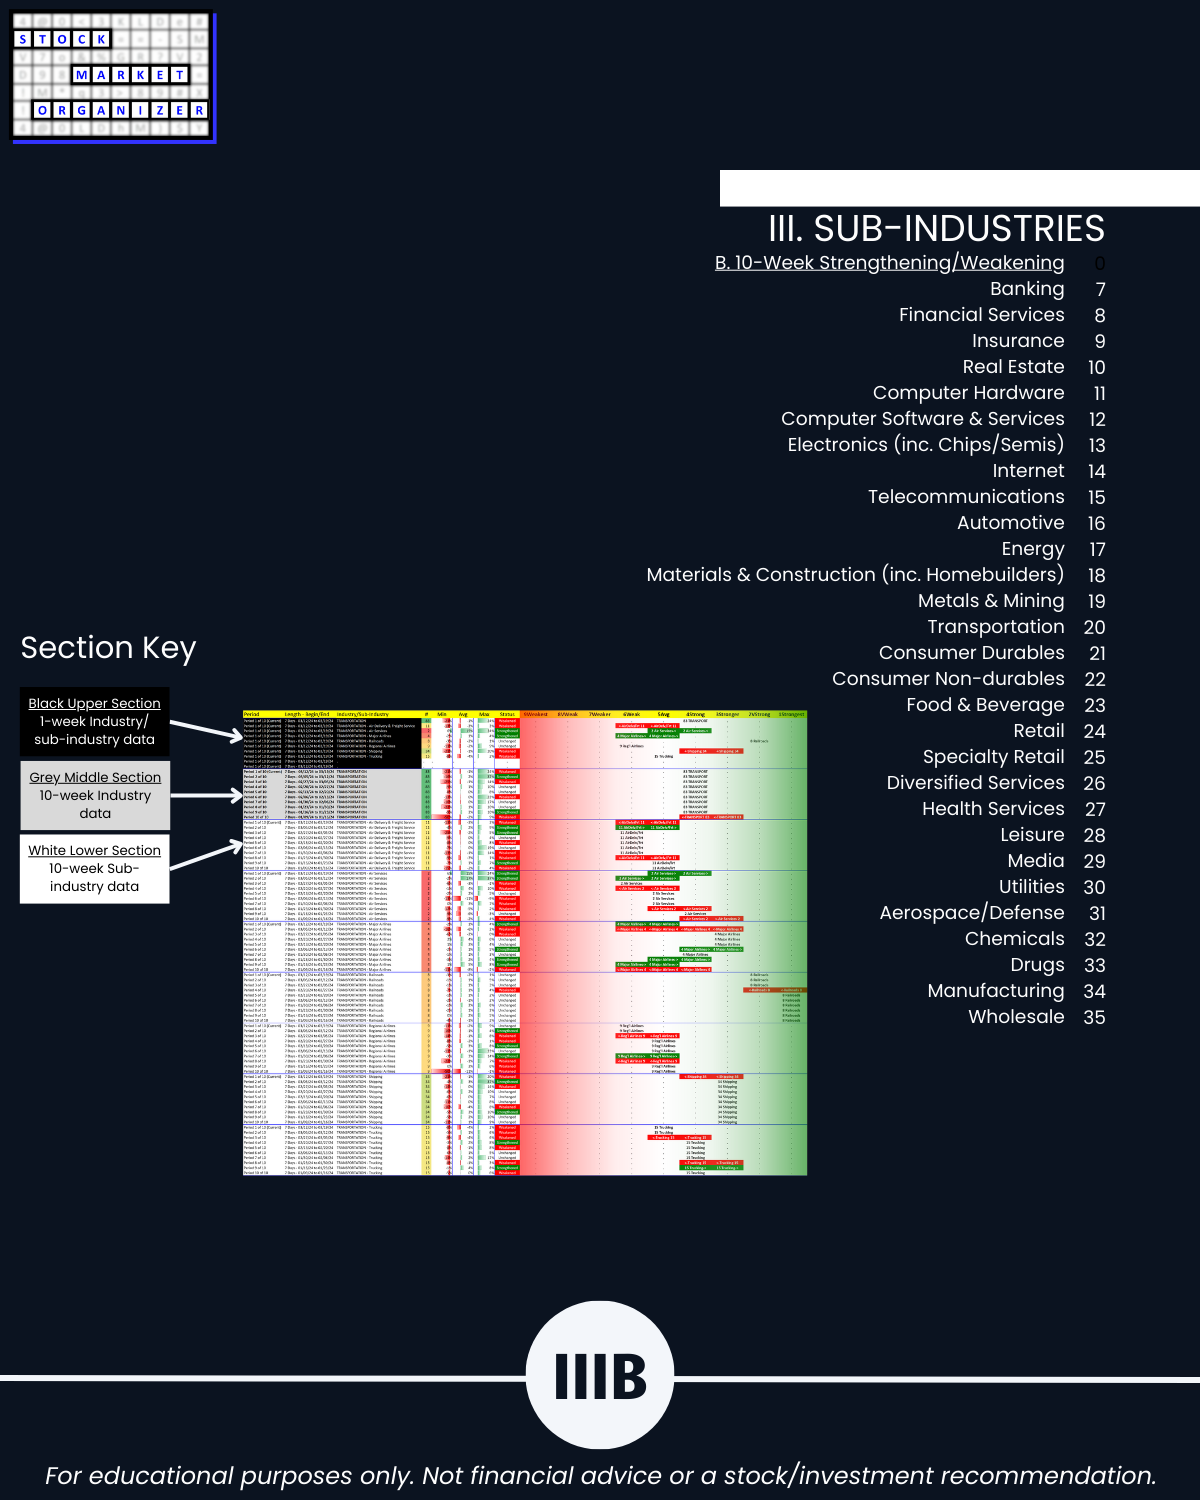
IVA. STOCKS Outlier Sorts
IVB. STOCKS Multi-Year Highs/Lows by Sector/Grouping
IV. EXHIBITS System Foundations

