SMO Exclusive: U.S. Stock Market Strength Report 2024-06-21 (no new Longs)

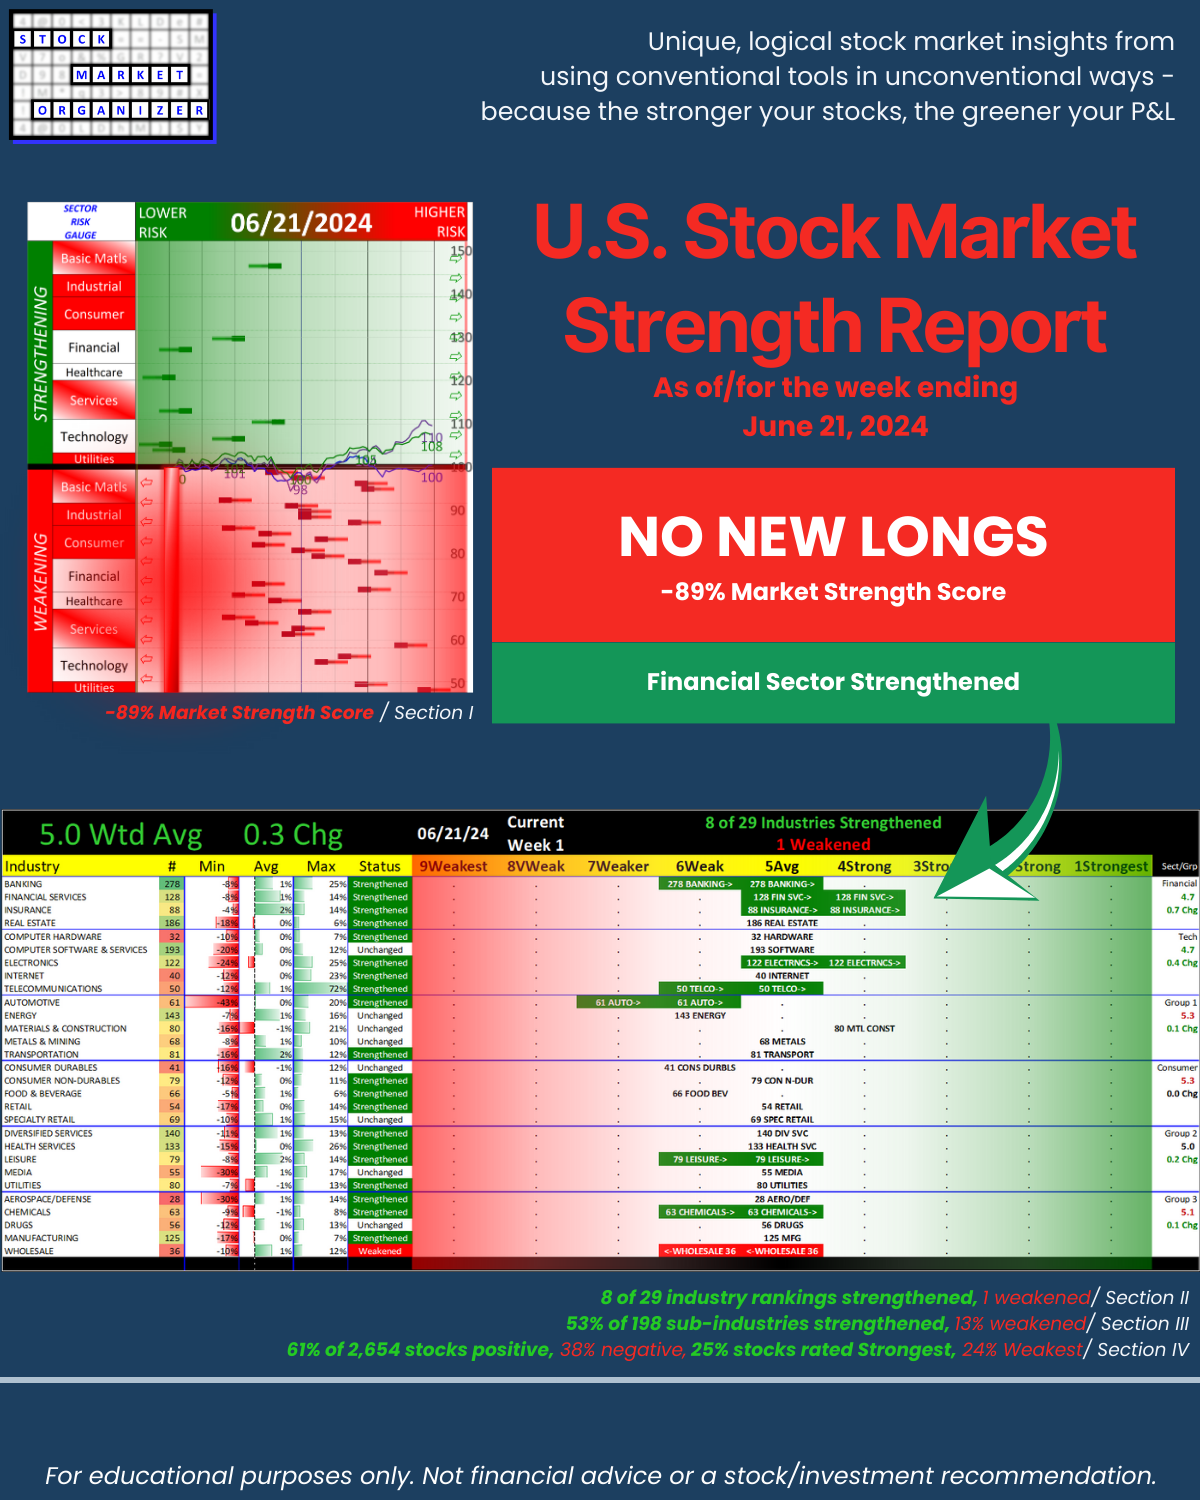
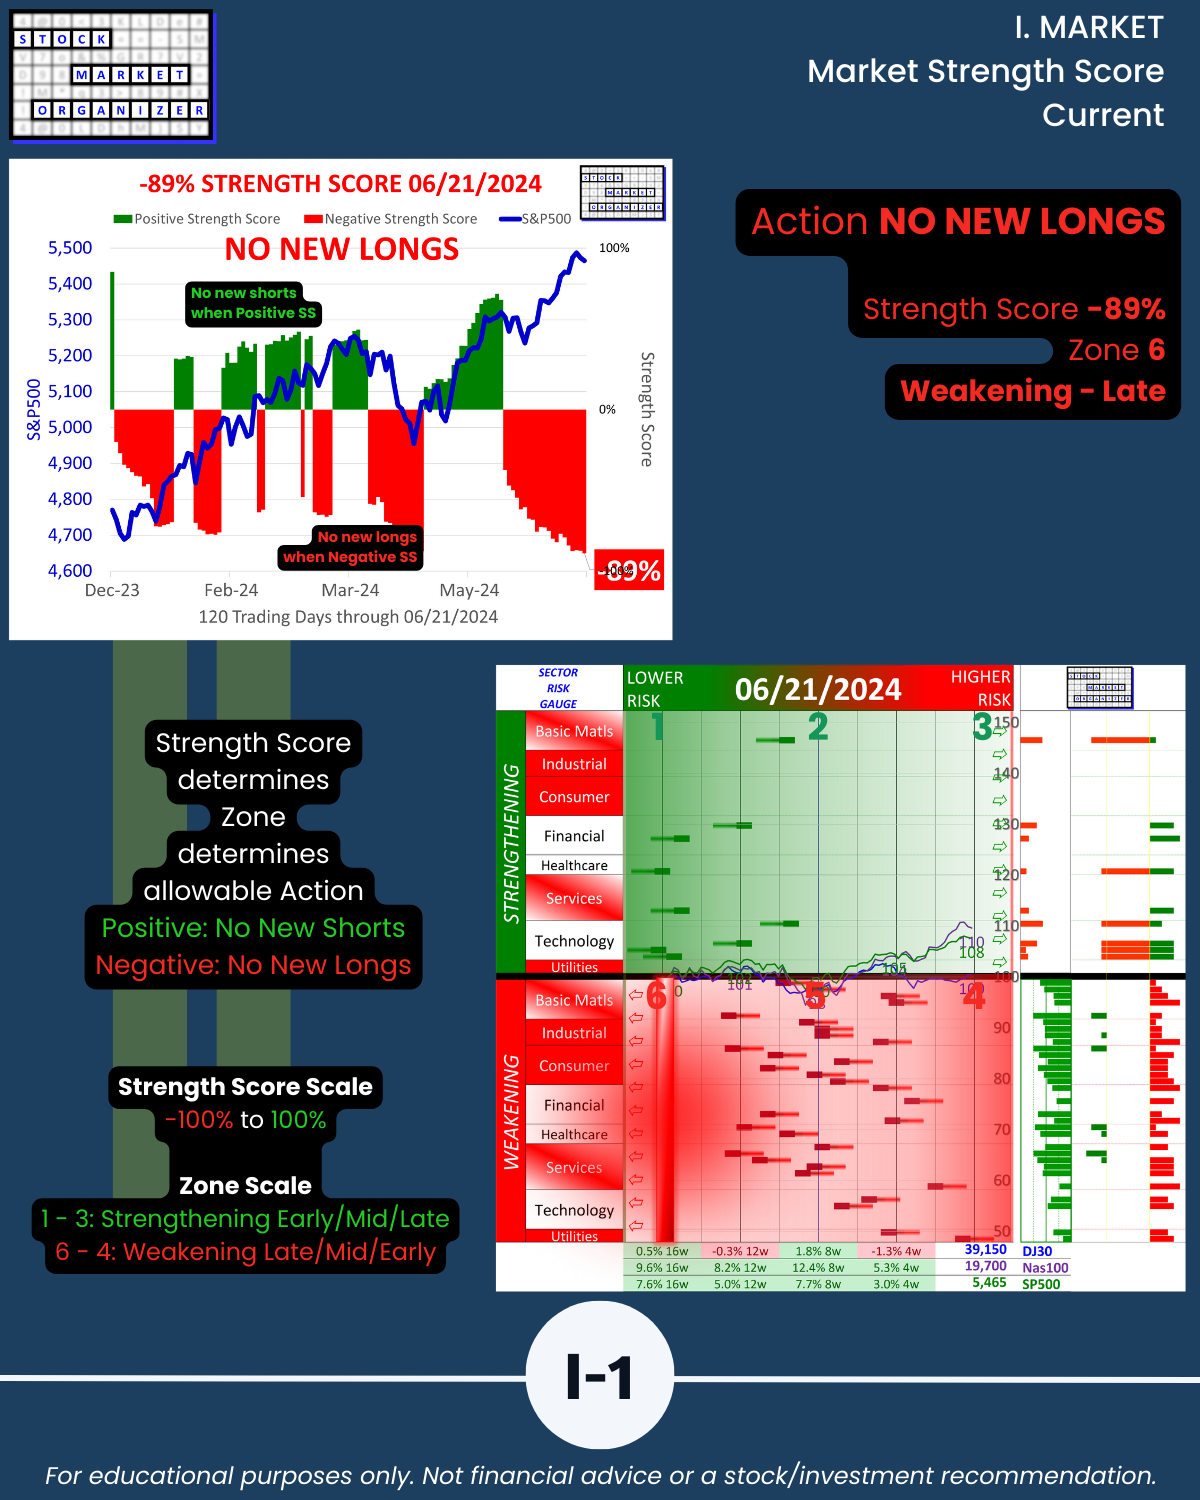
Attached, comprehensive U.S. stock market strength report as of/for the week ending 6/21/24 - negative strength score so no new longs but note Financial sector strength. My analysis mirrors what is being broadly reported. Weak underlying breadth remains the story. The top 7 stocks have about $15 trillion in market cap and they are driving the index levels. Hence a -89% strength score (this is low, the scale is -100% to +100%) while the “market” is at/near all-time highs.
What are you looking at here?
(Those focused on fundamentals will likely ignore. Anyone else open to a different perspective may have interest.) A top-down, inside-out (sector, industry, sub-industry), and bottom-up revealing of strength/strengthening and weakness/weakening throughout the stock market.
It offers unique, logical, and actionable insights from using conventional tools in unconventional ways.
Why do you care?
This report may resonate with you if you subscribe to the following:
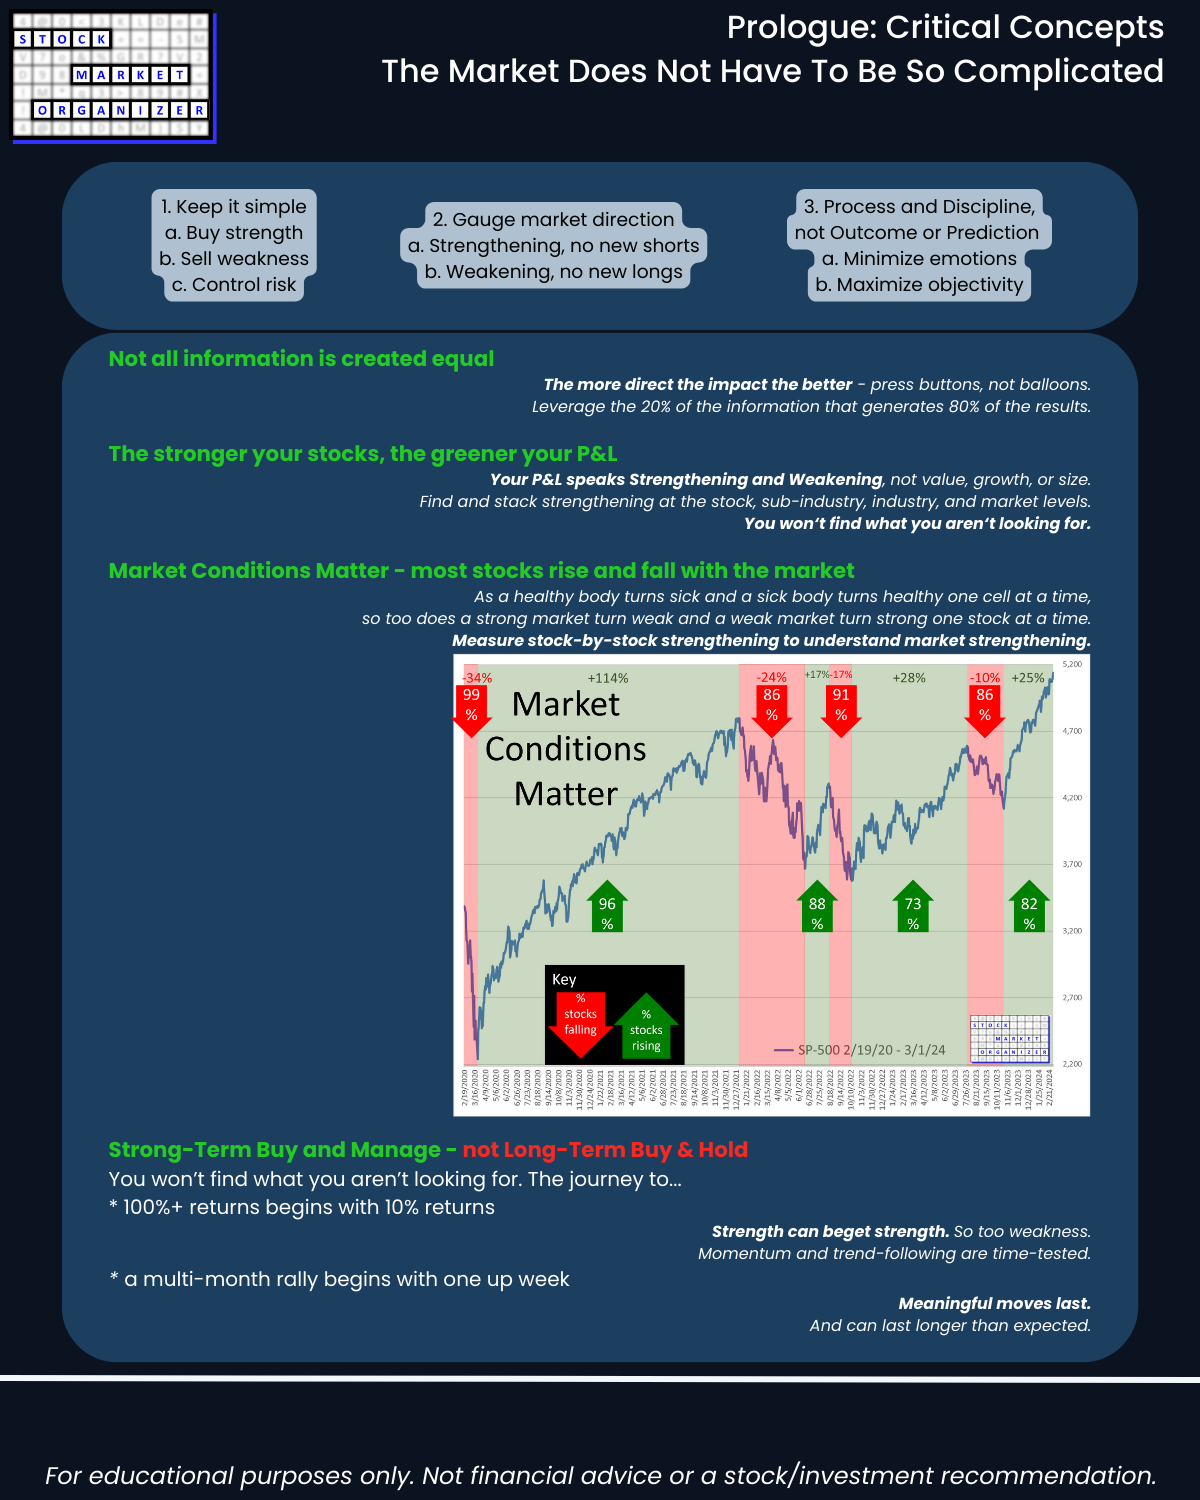
- The stock market does not have to be so complicated.
- “What” matters, not “why.”
- Market conditions matter.
- The 100%+ rally begins with a 10% rally.
- The multi-month rally begins with one up week. (Also applies to declines.)
- The stronger your stocks, the greener your P&L.
Current stats
- Market Strength Score: -89%, no new Longs
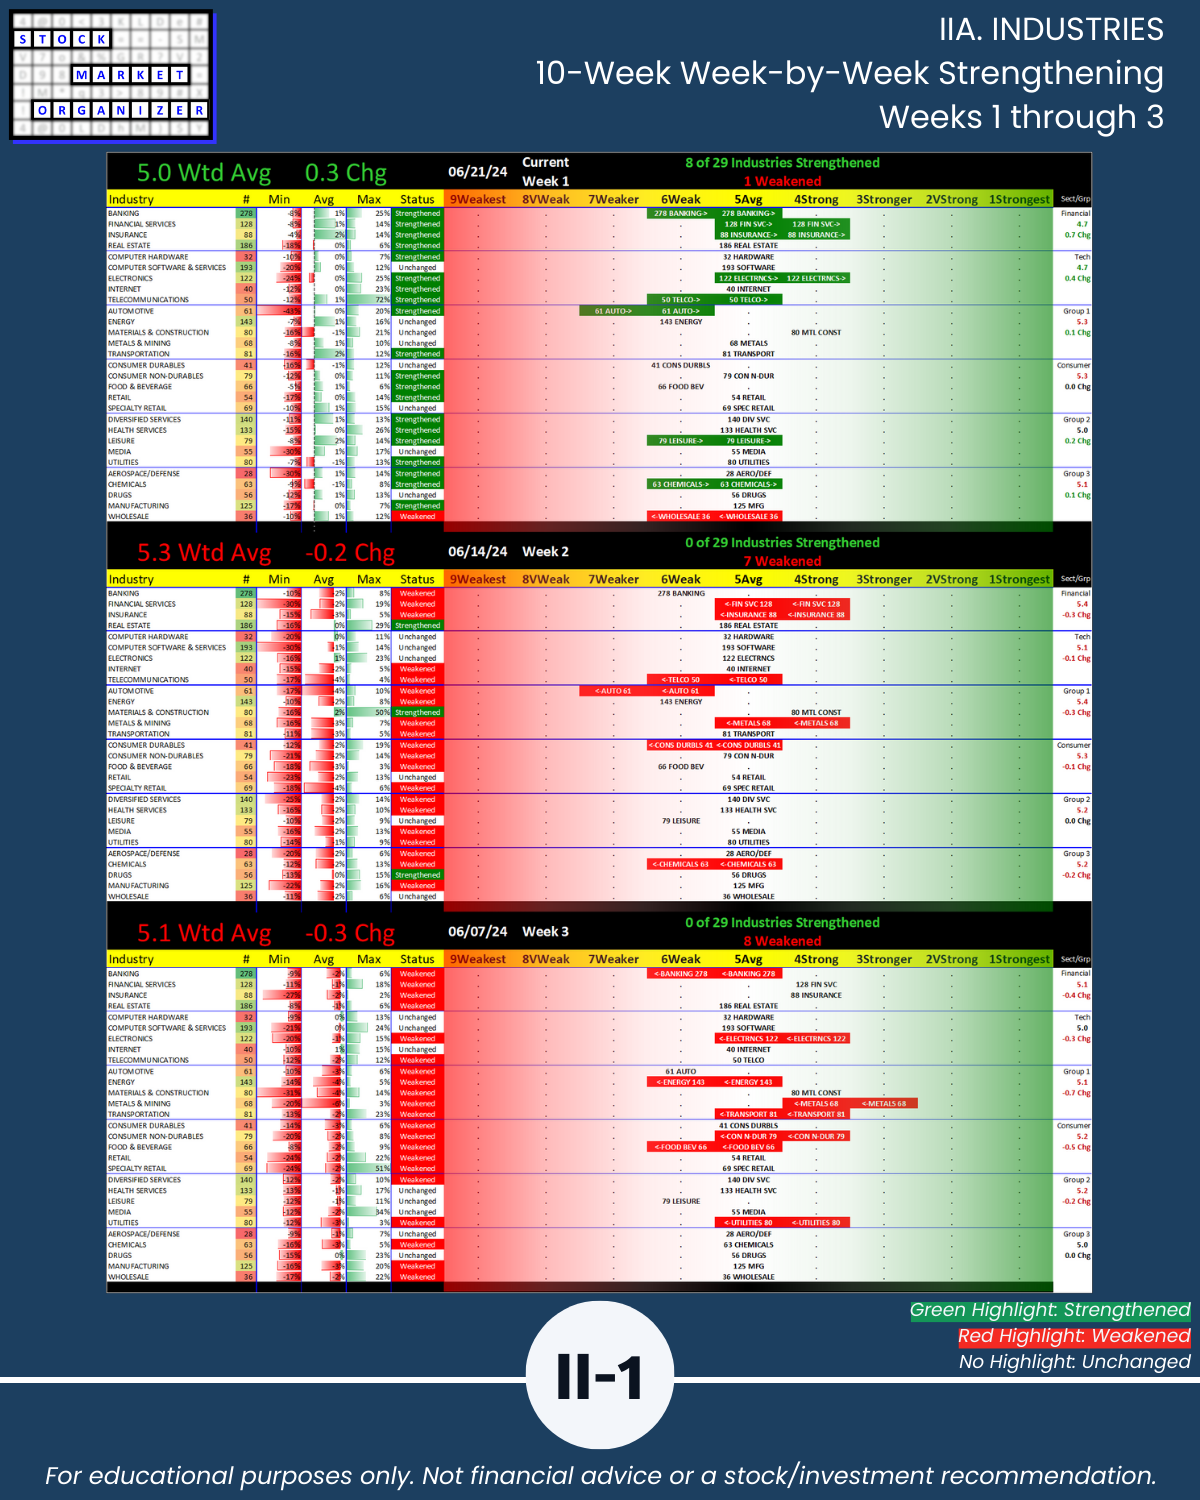
- 8 of 29 industry rankings strengthened, 1 weakened/Section II
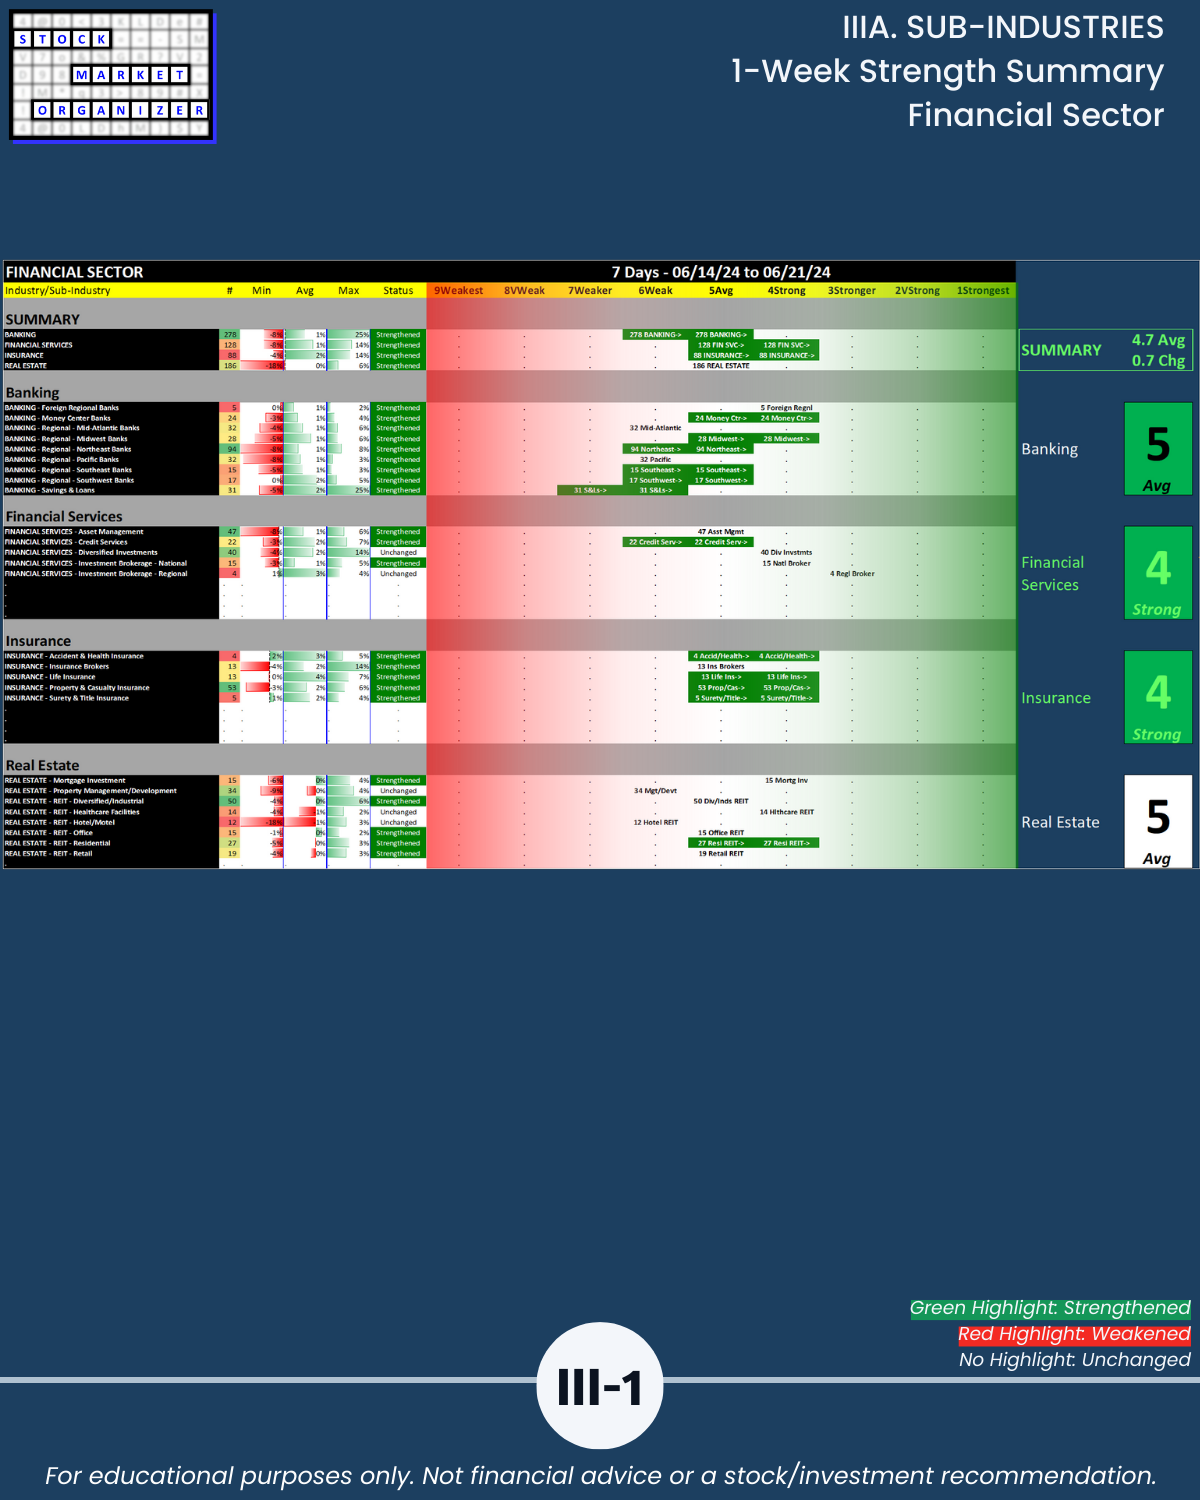
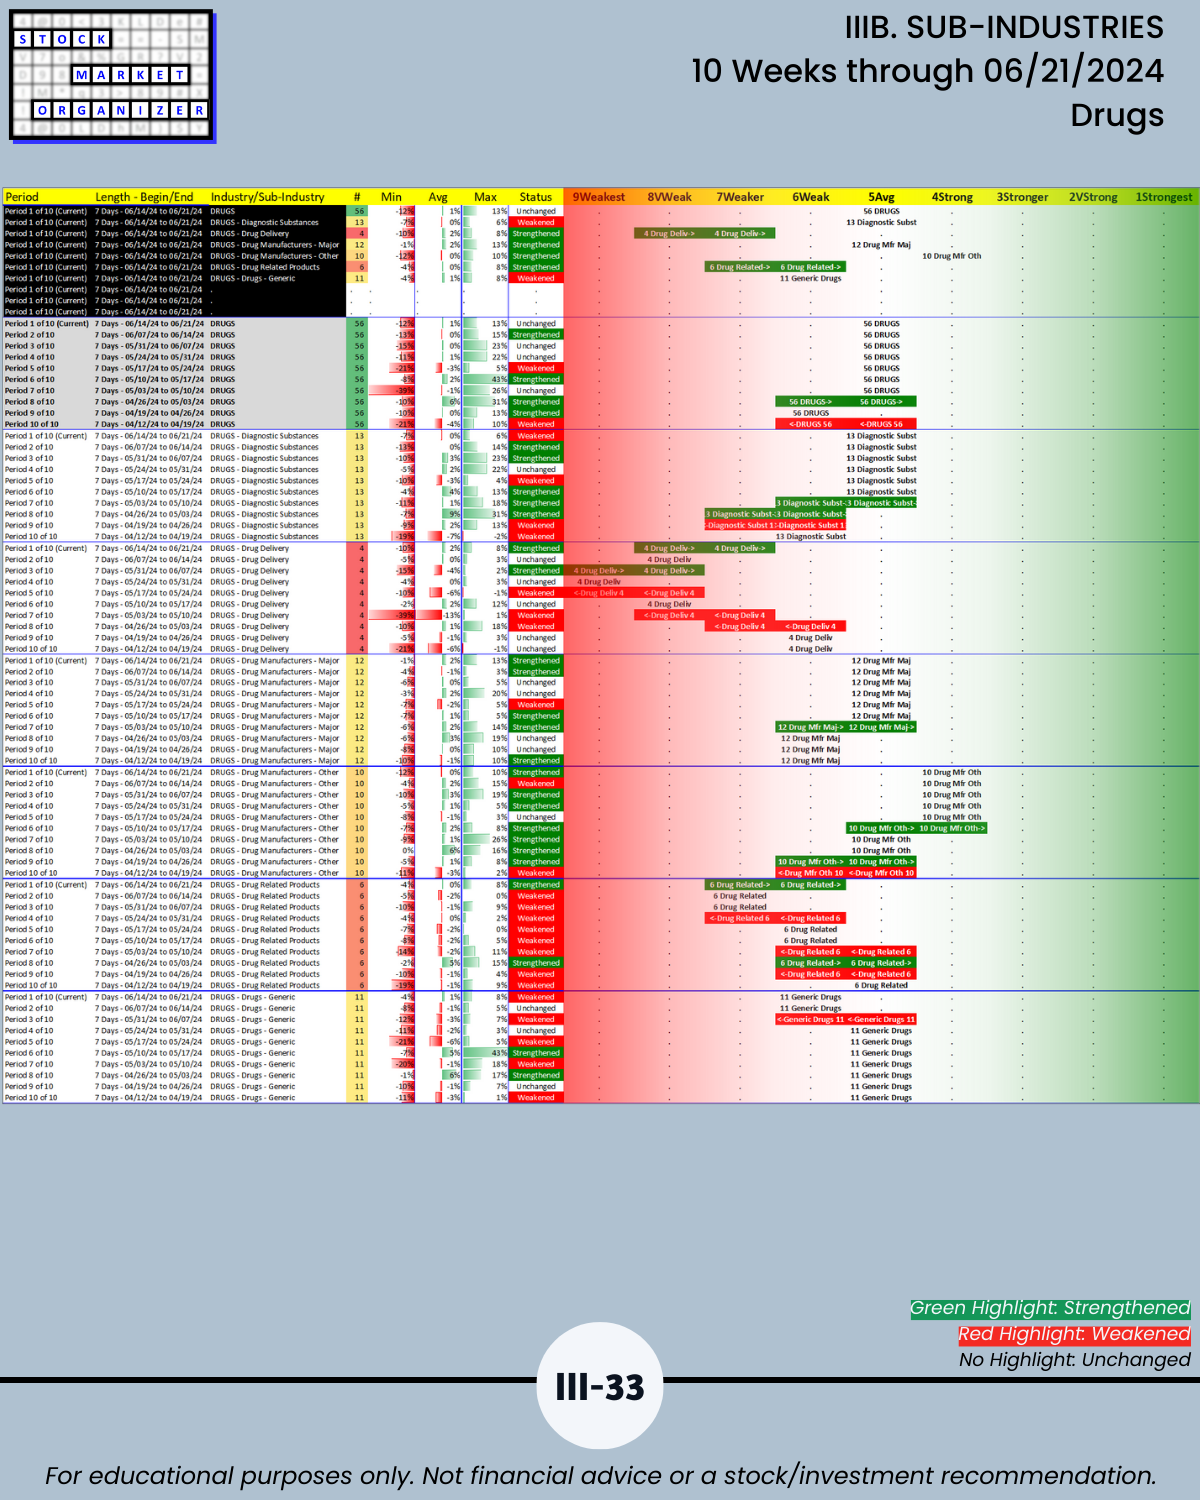
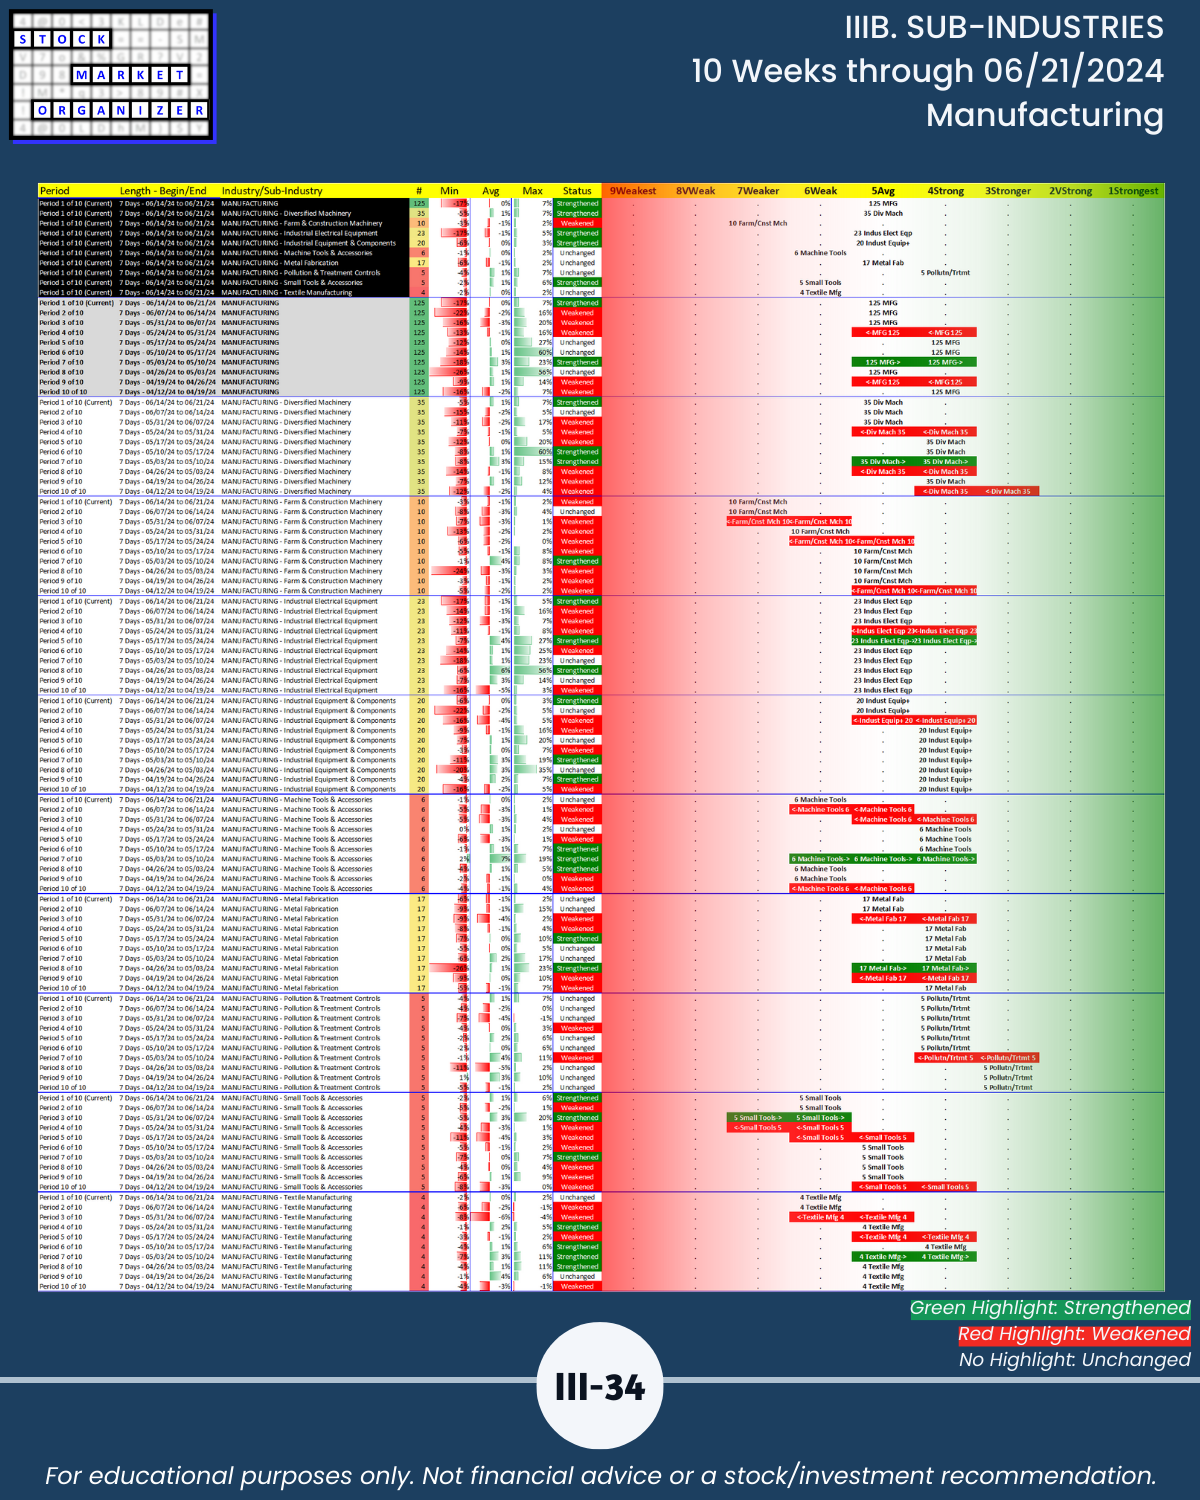
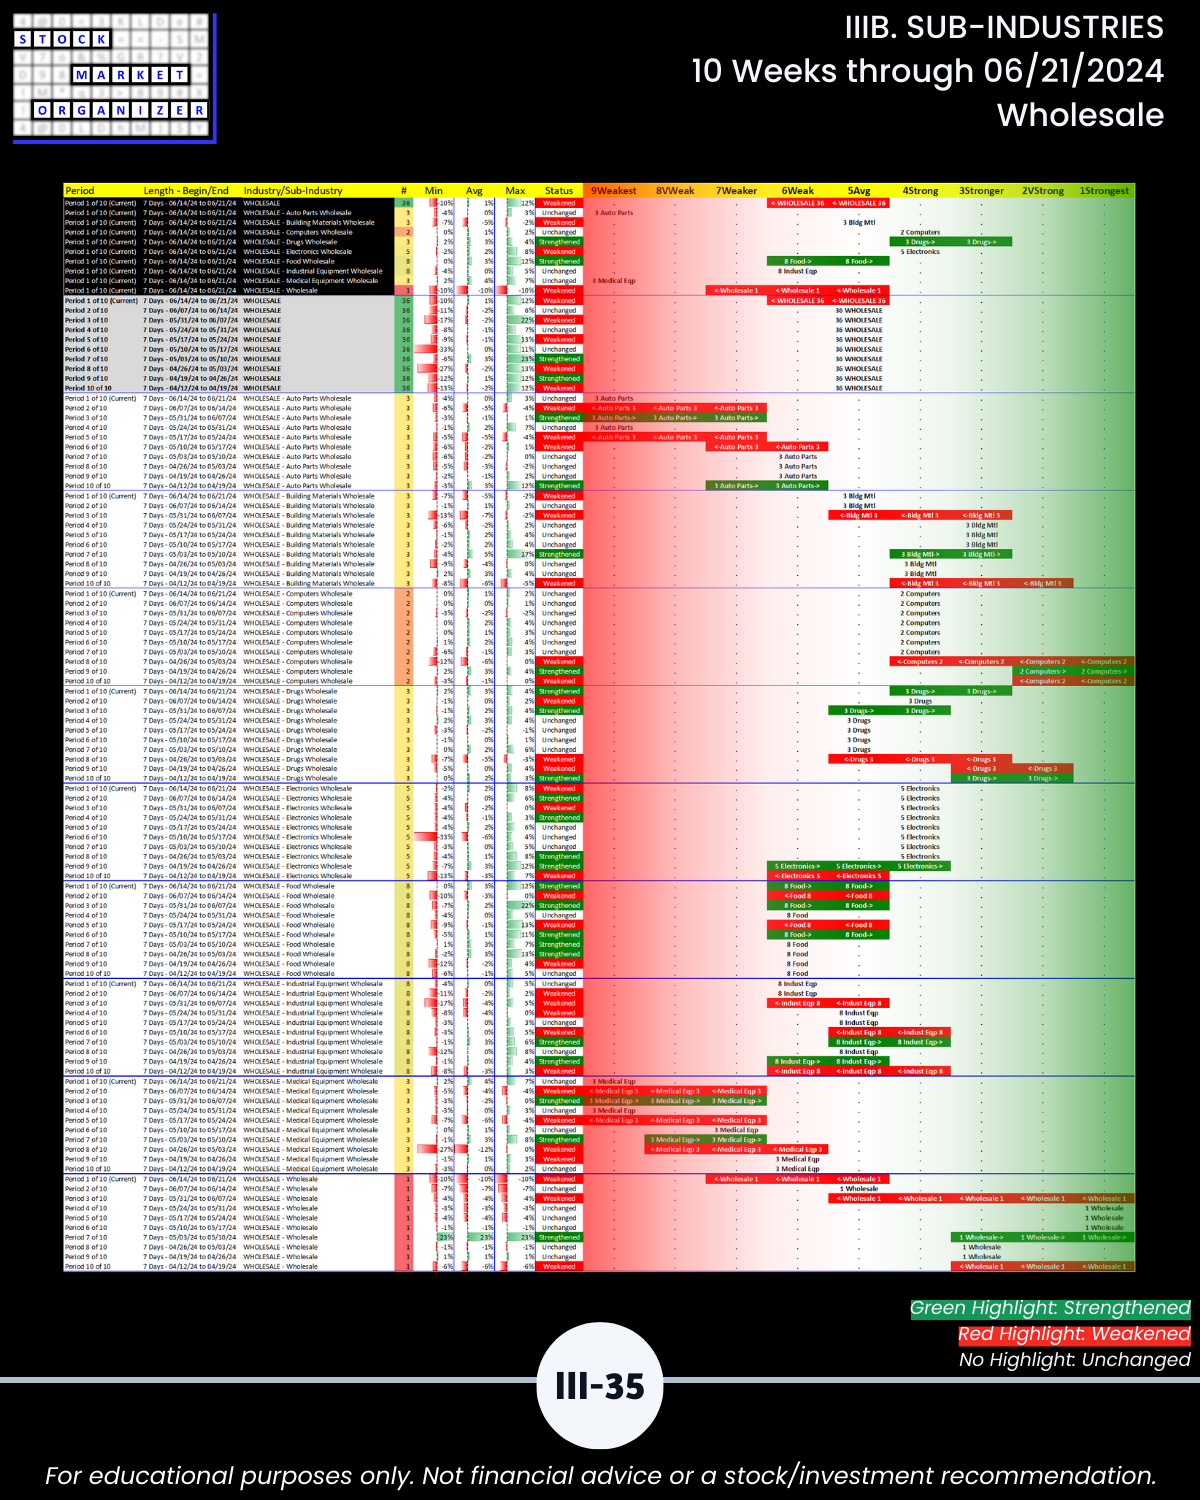
- 53% of 198 sub-industries strengthened, 13% weakened/Section III
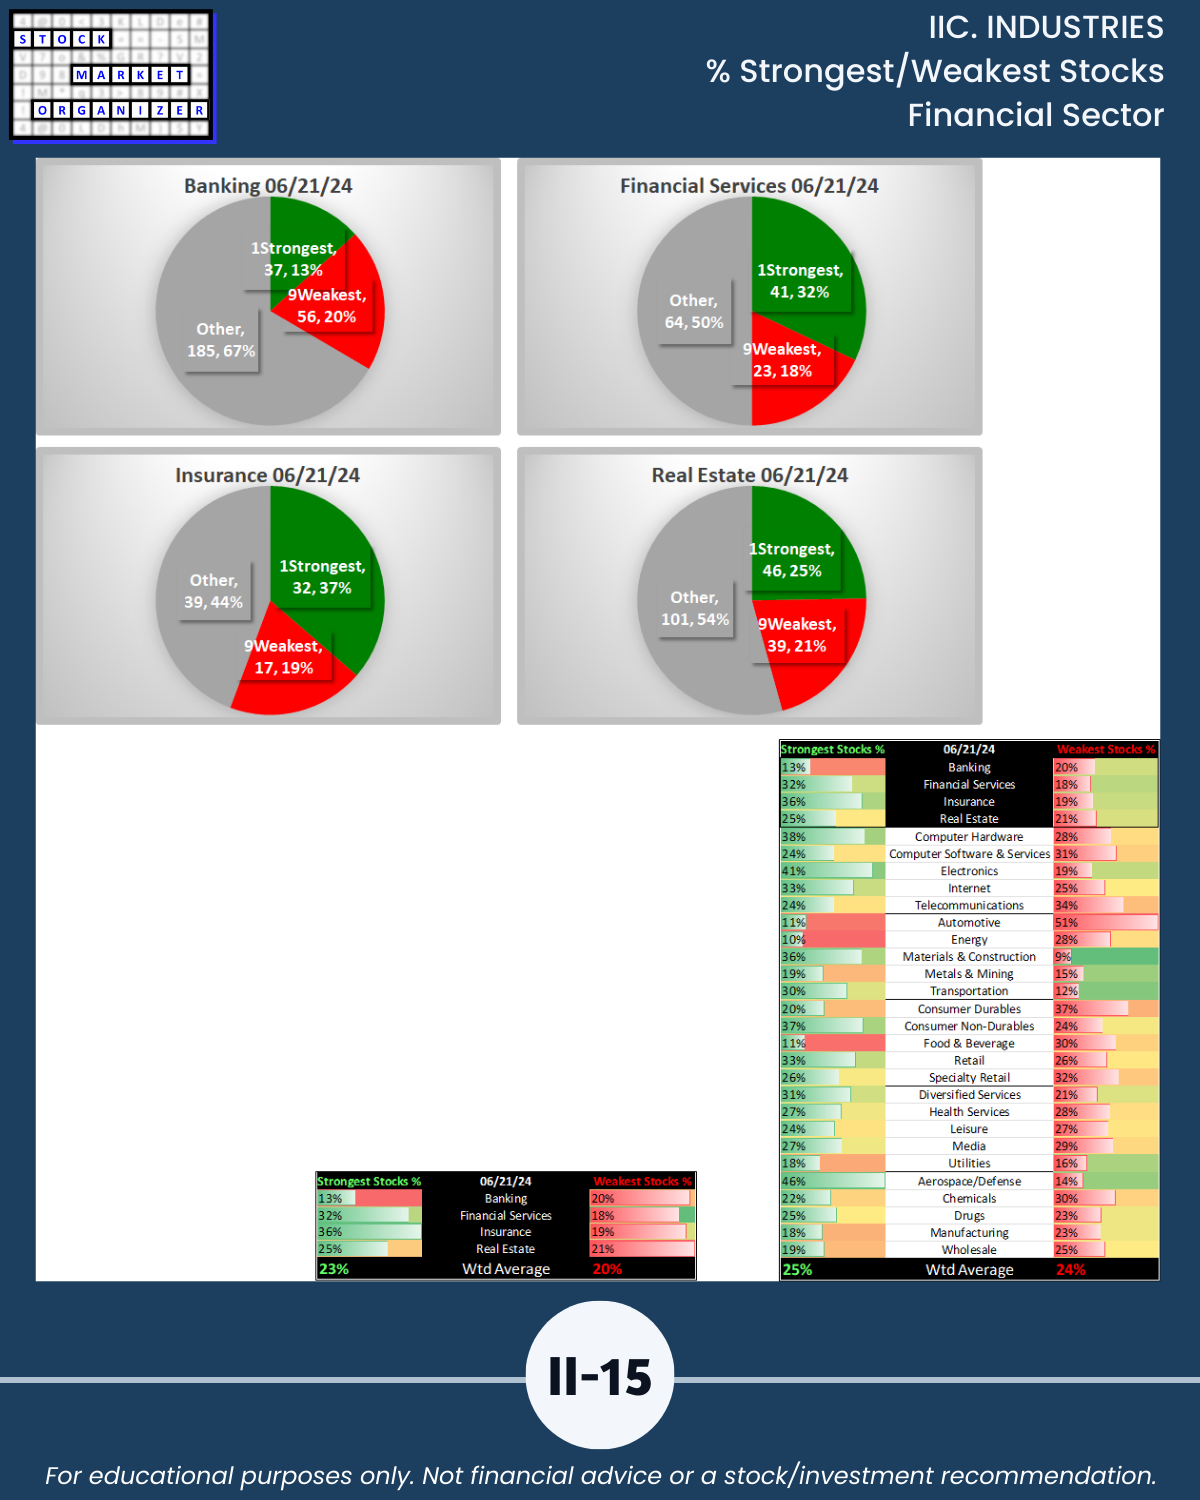
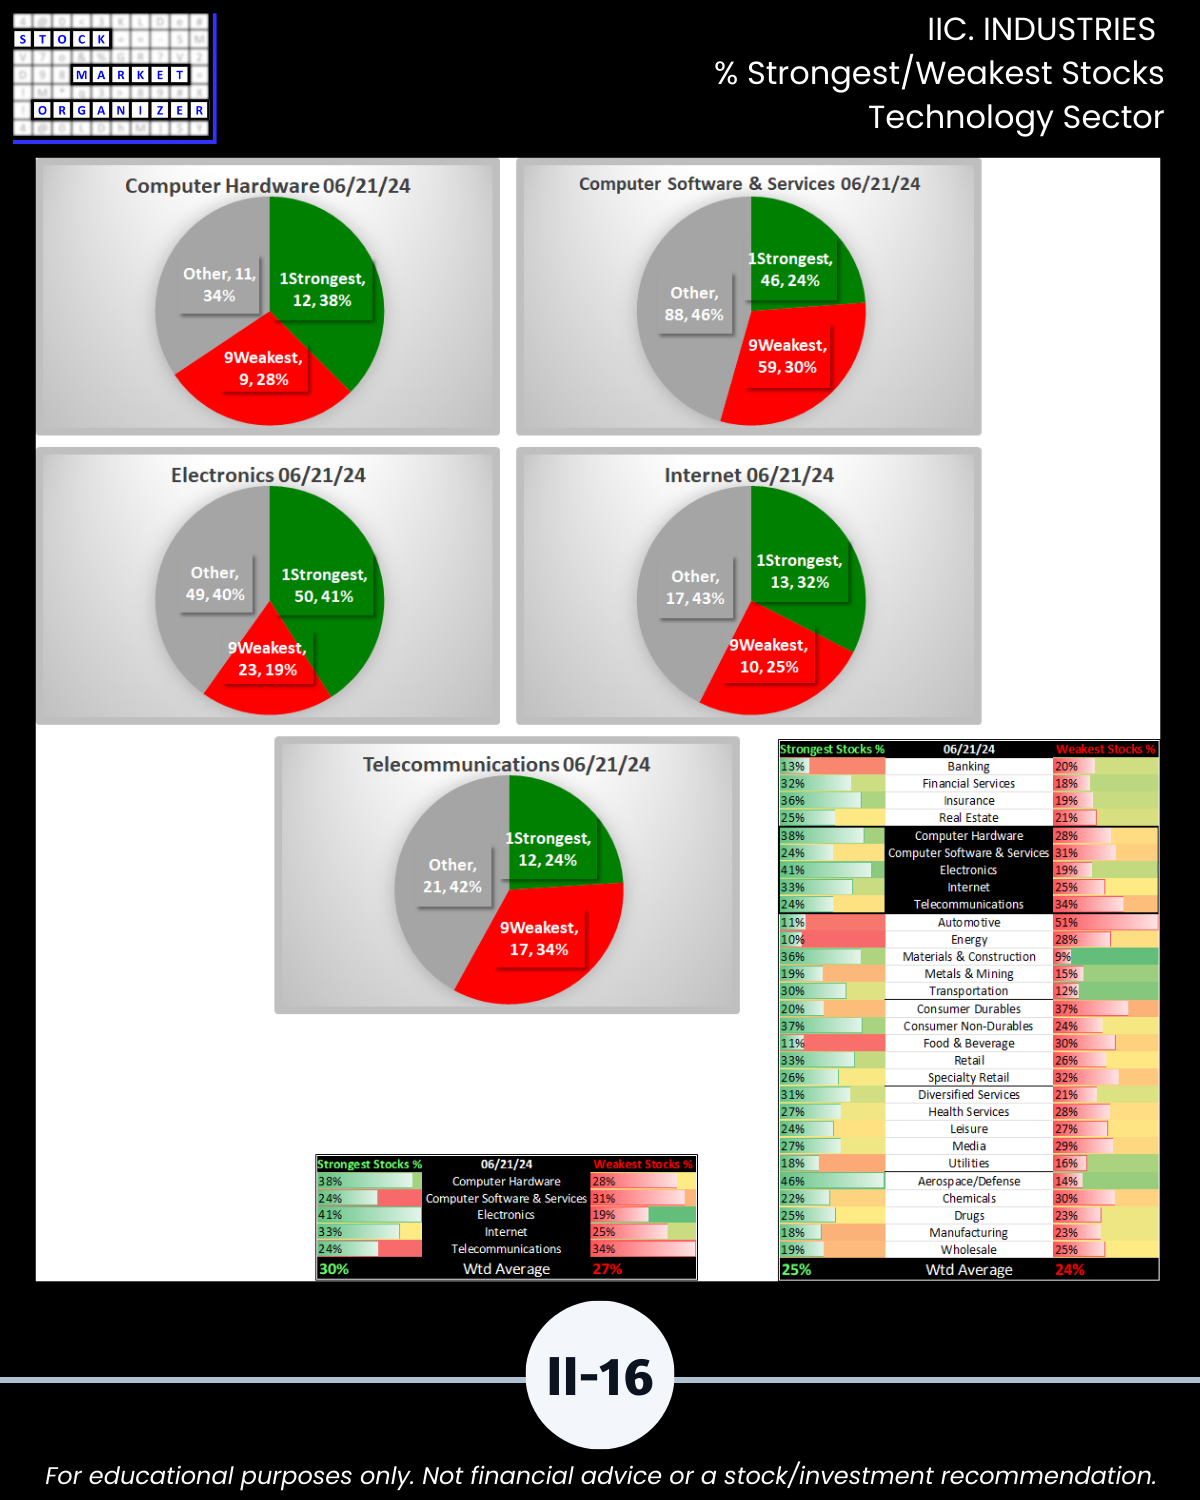
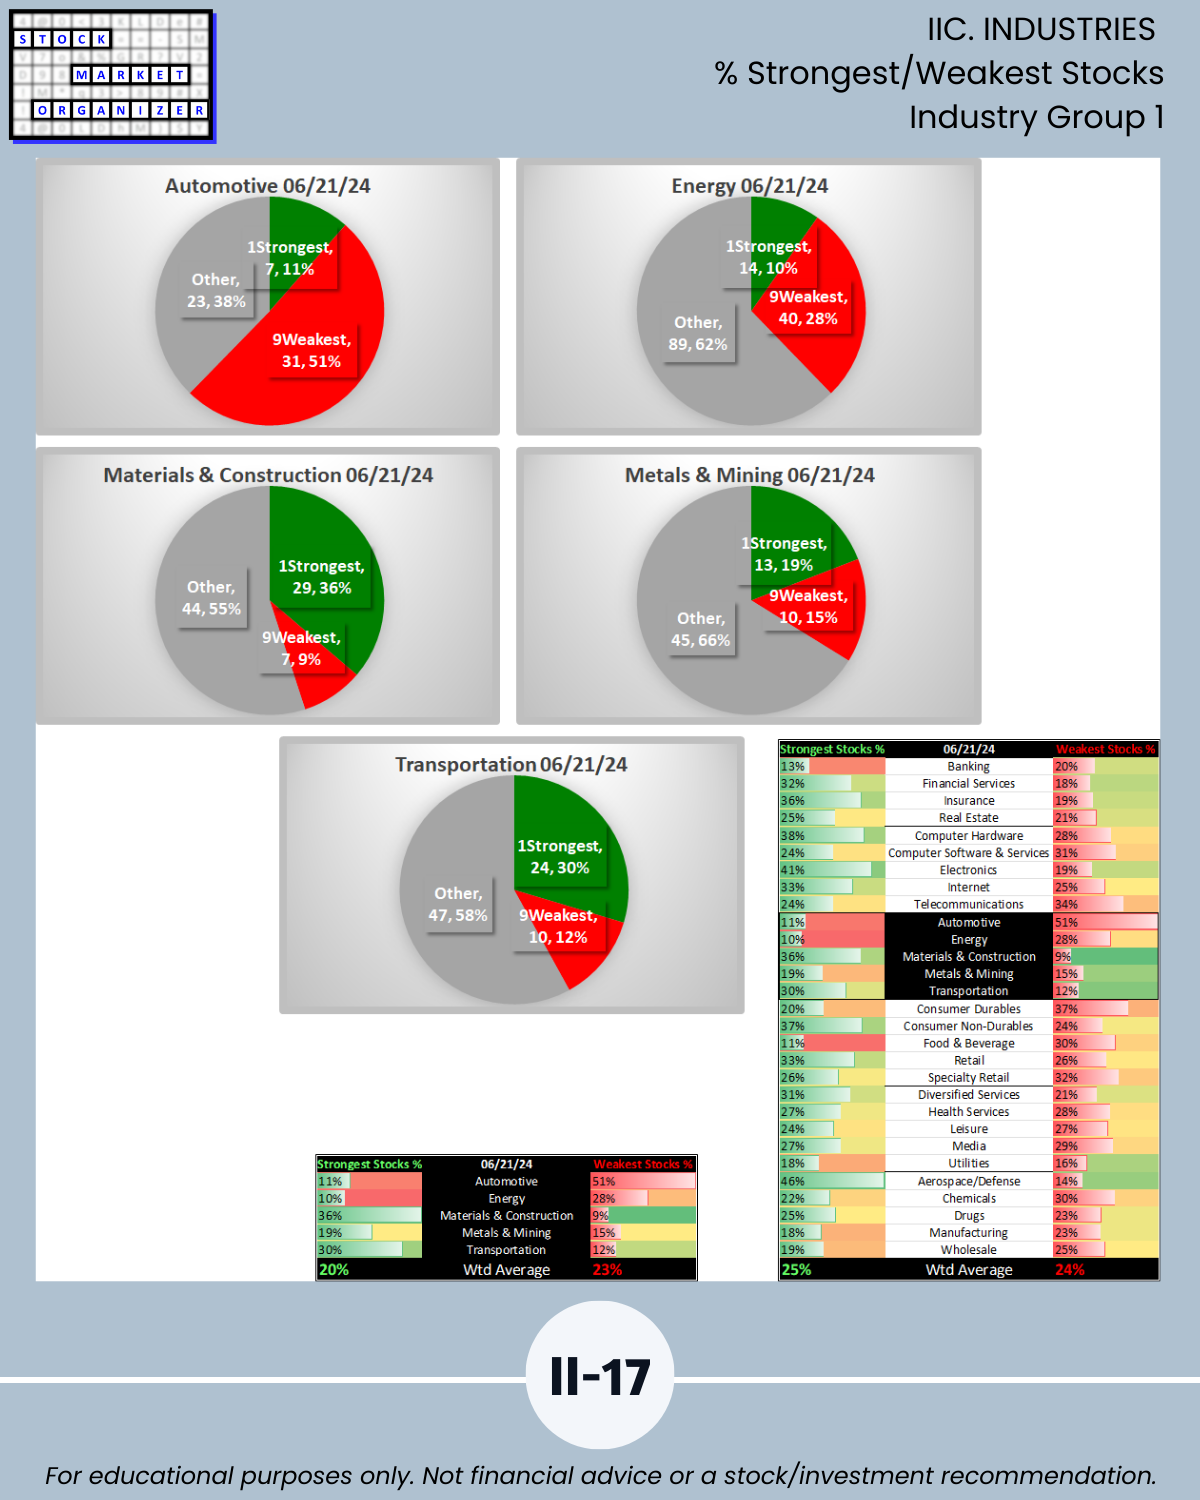
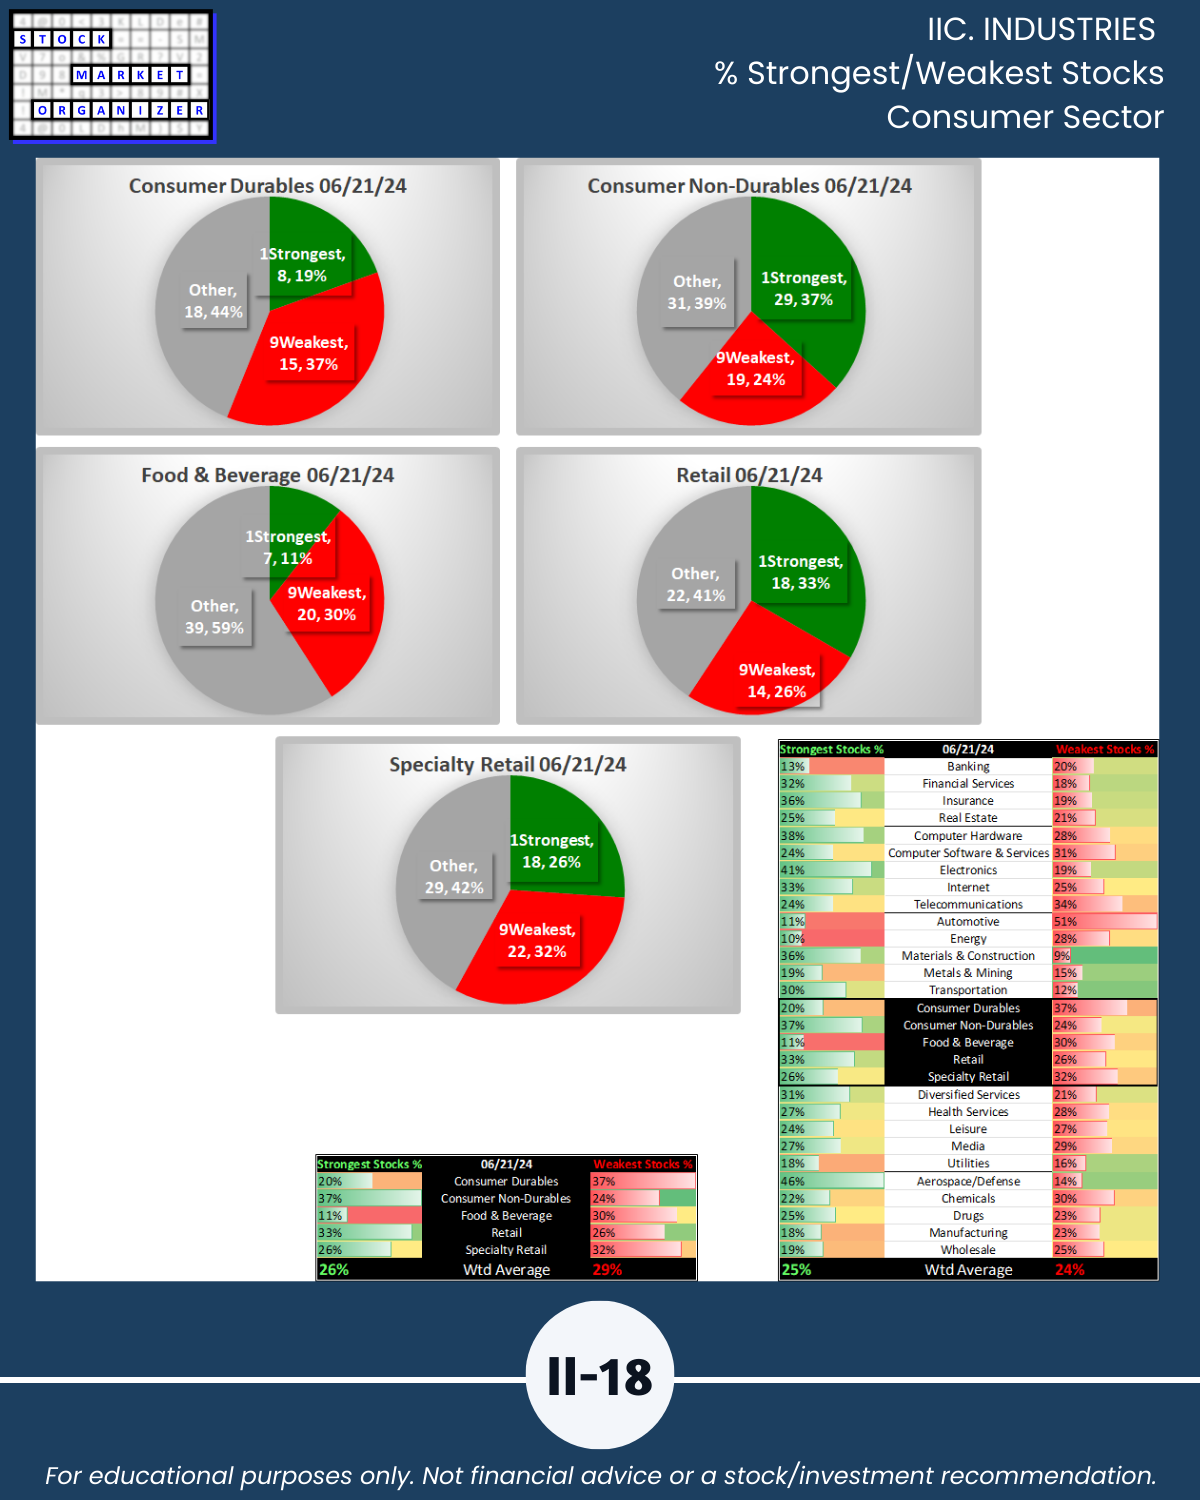
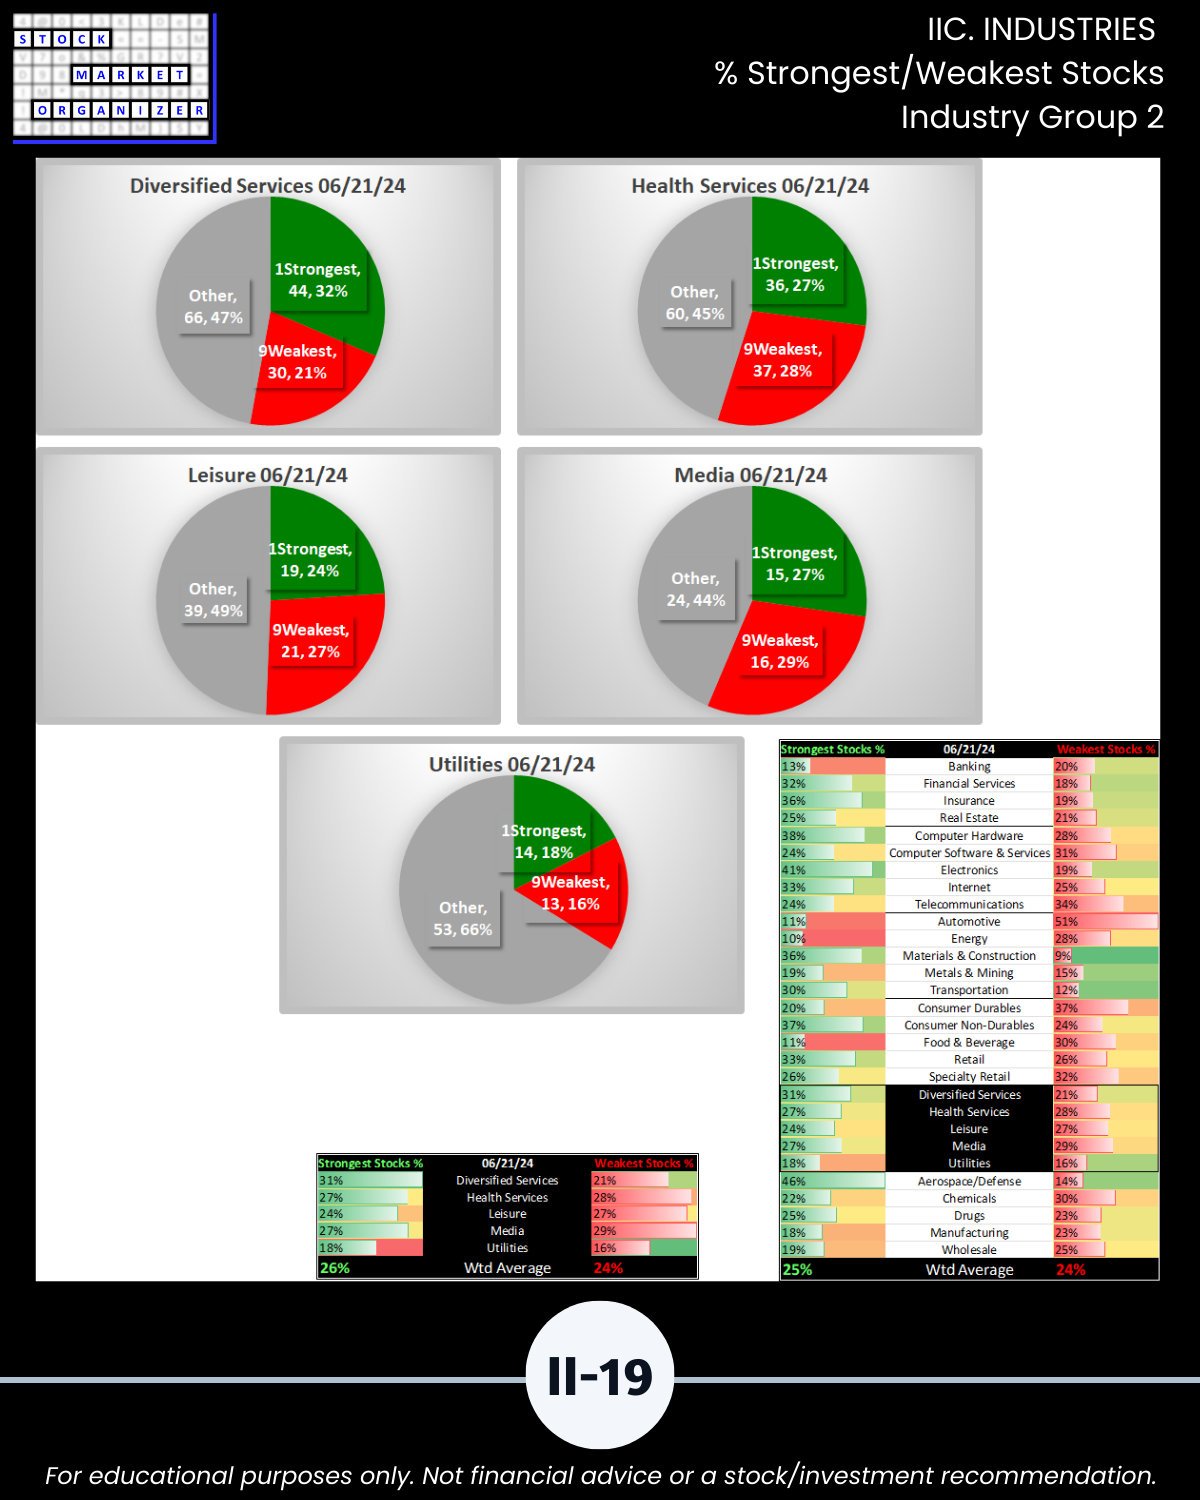
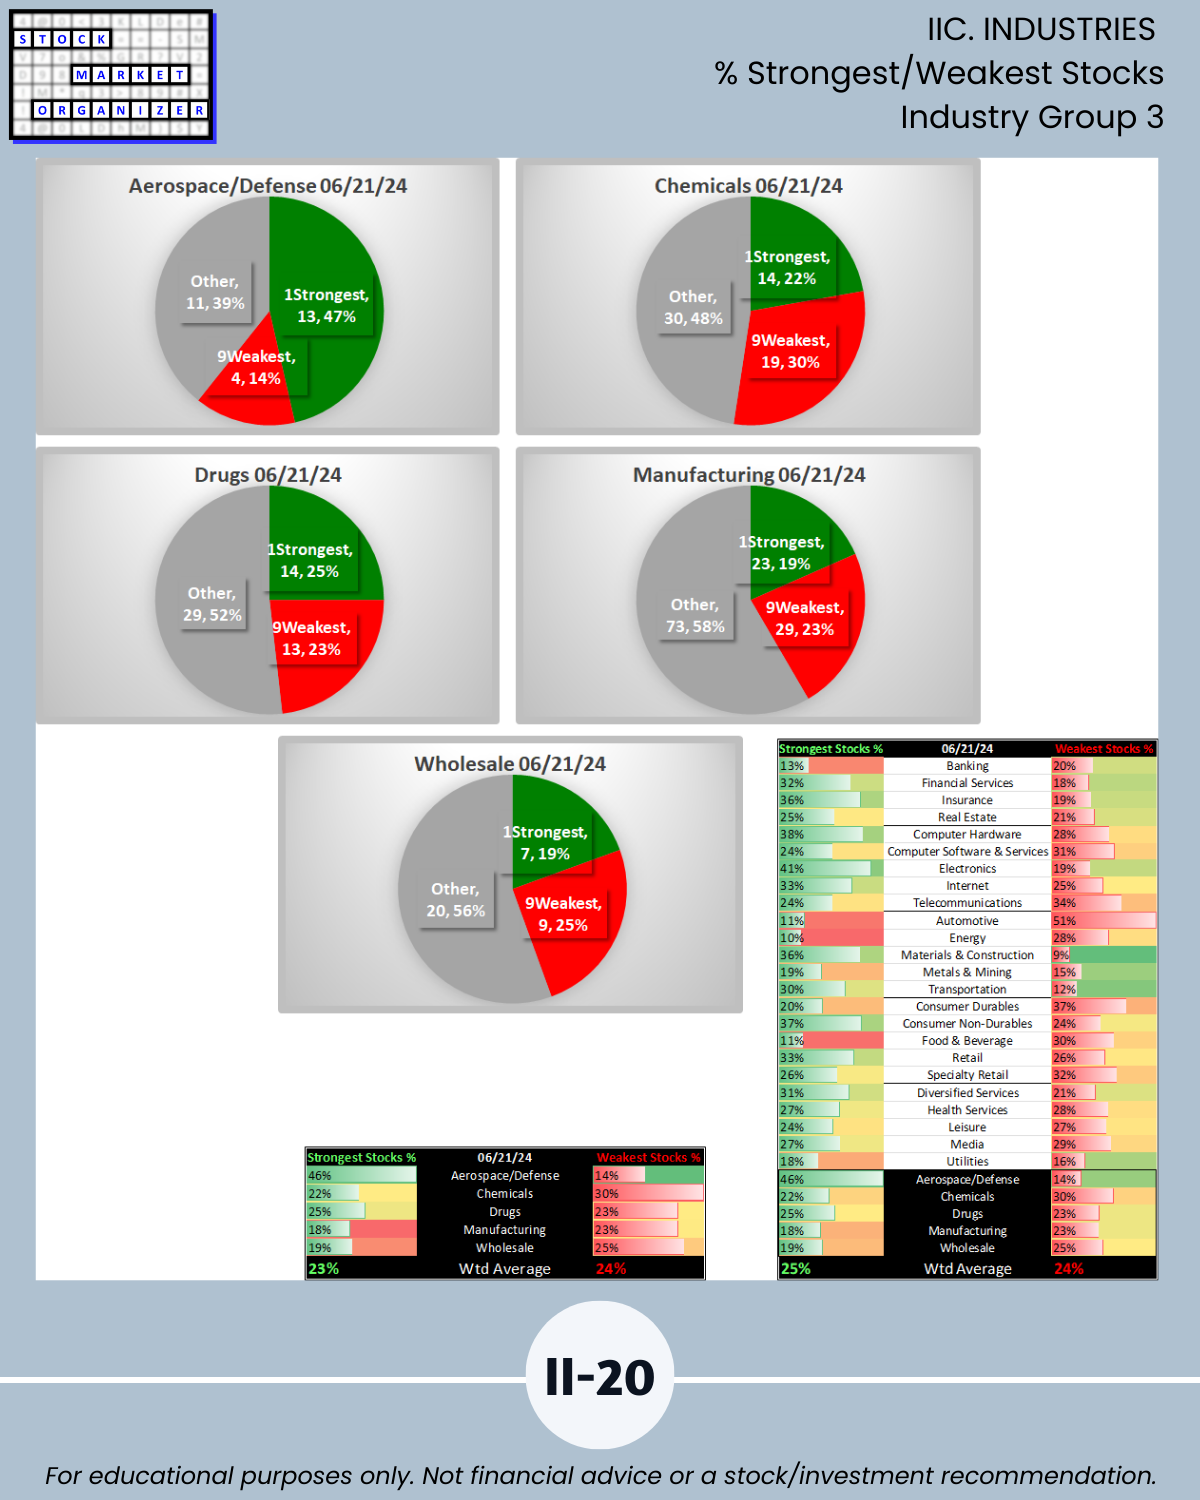
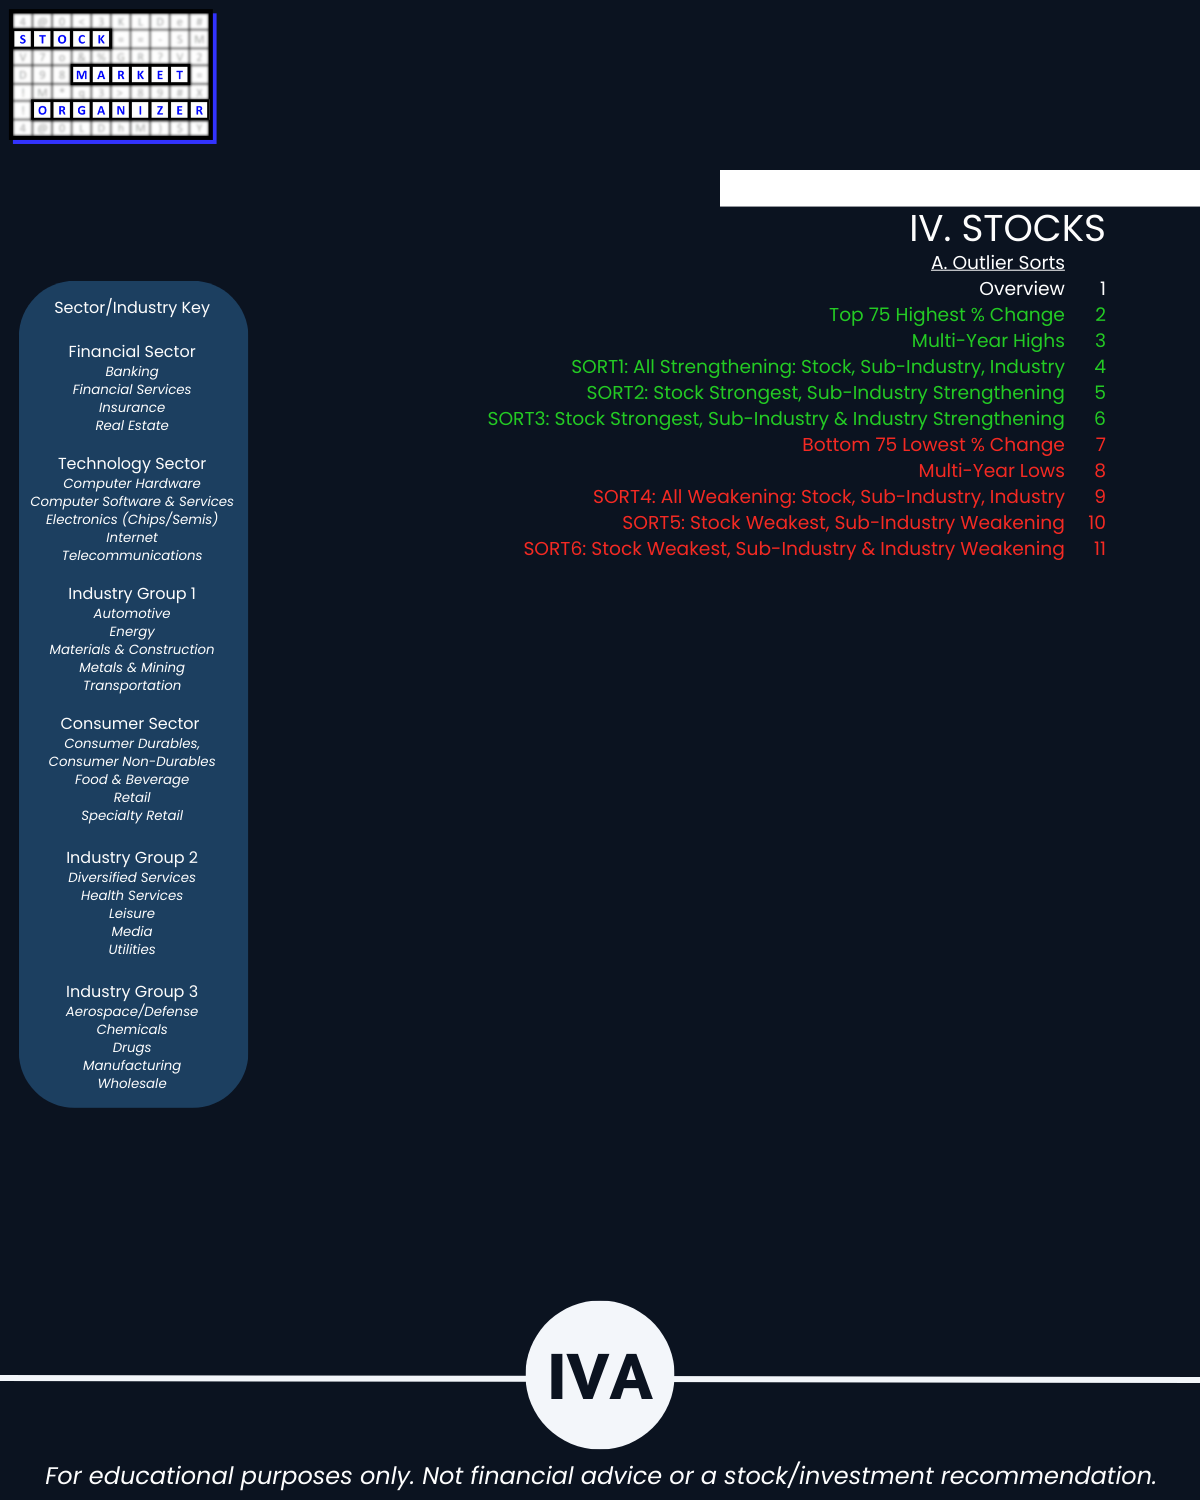
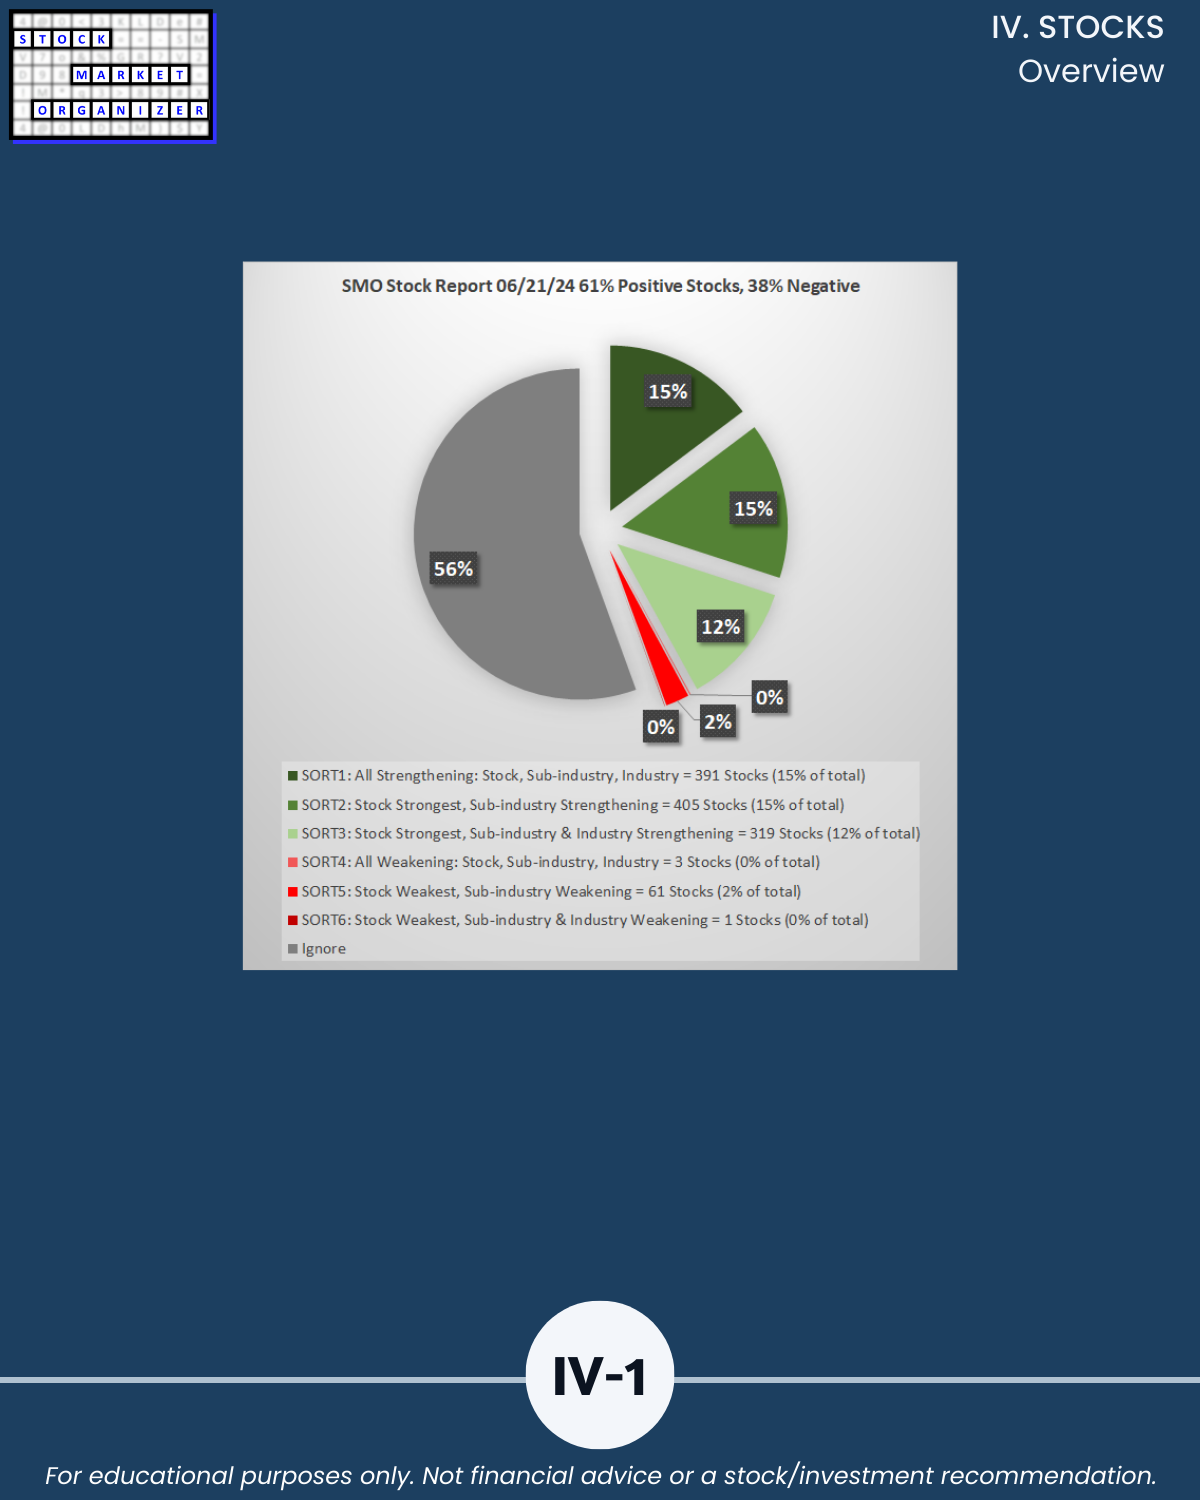
- 61% of 2,654 stocks positive, 38% negative, 25% stocks rated Strongest, 24% Weakest/Section IV
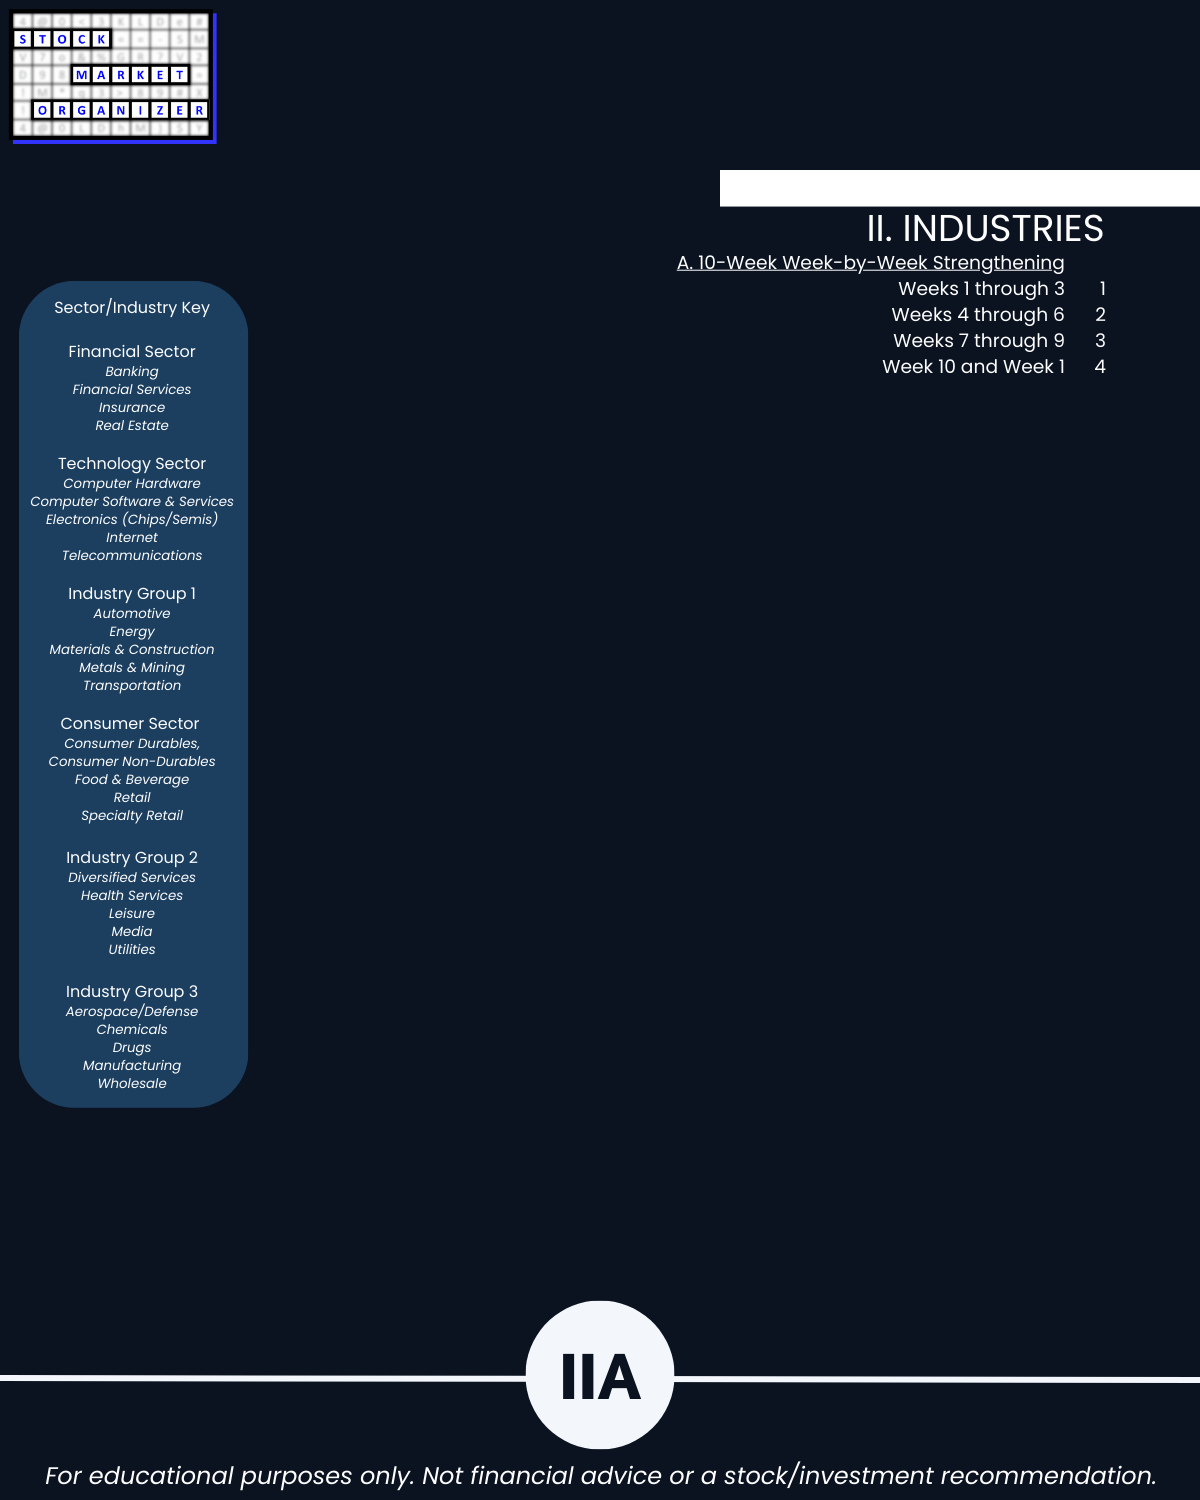
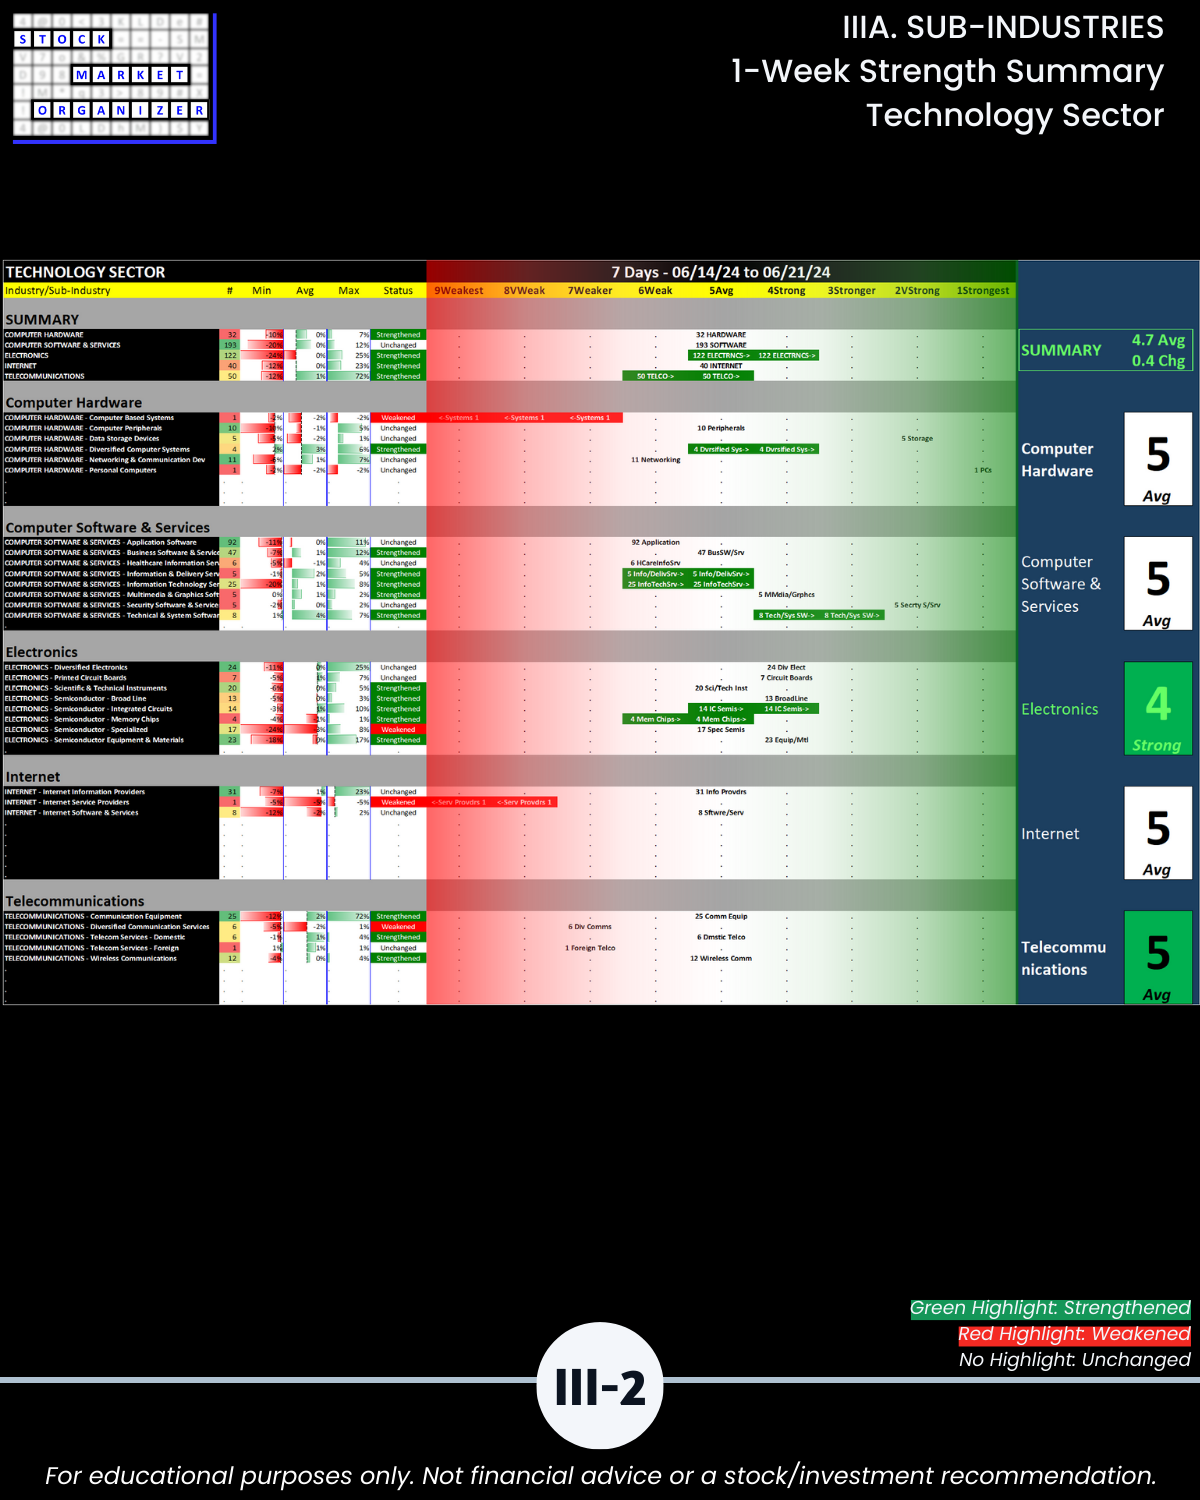
Leading Sectors/industry groupings with a 4.7 weighted average ranking:
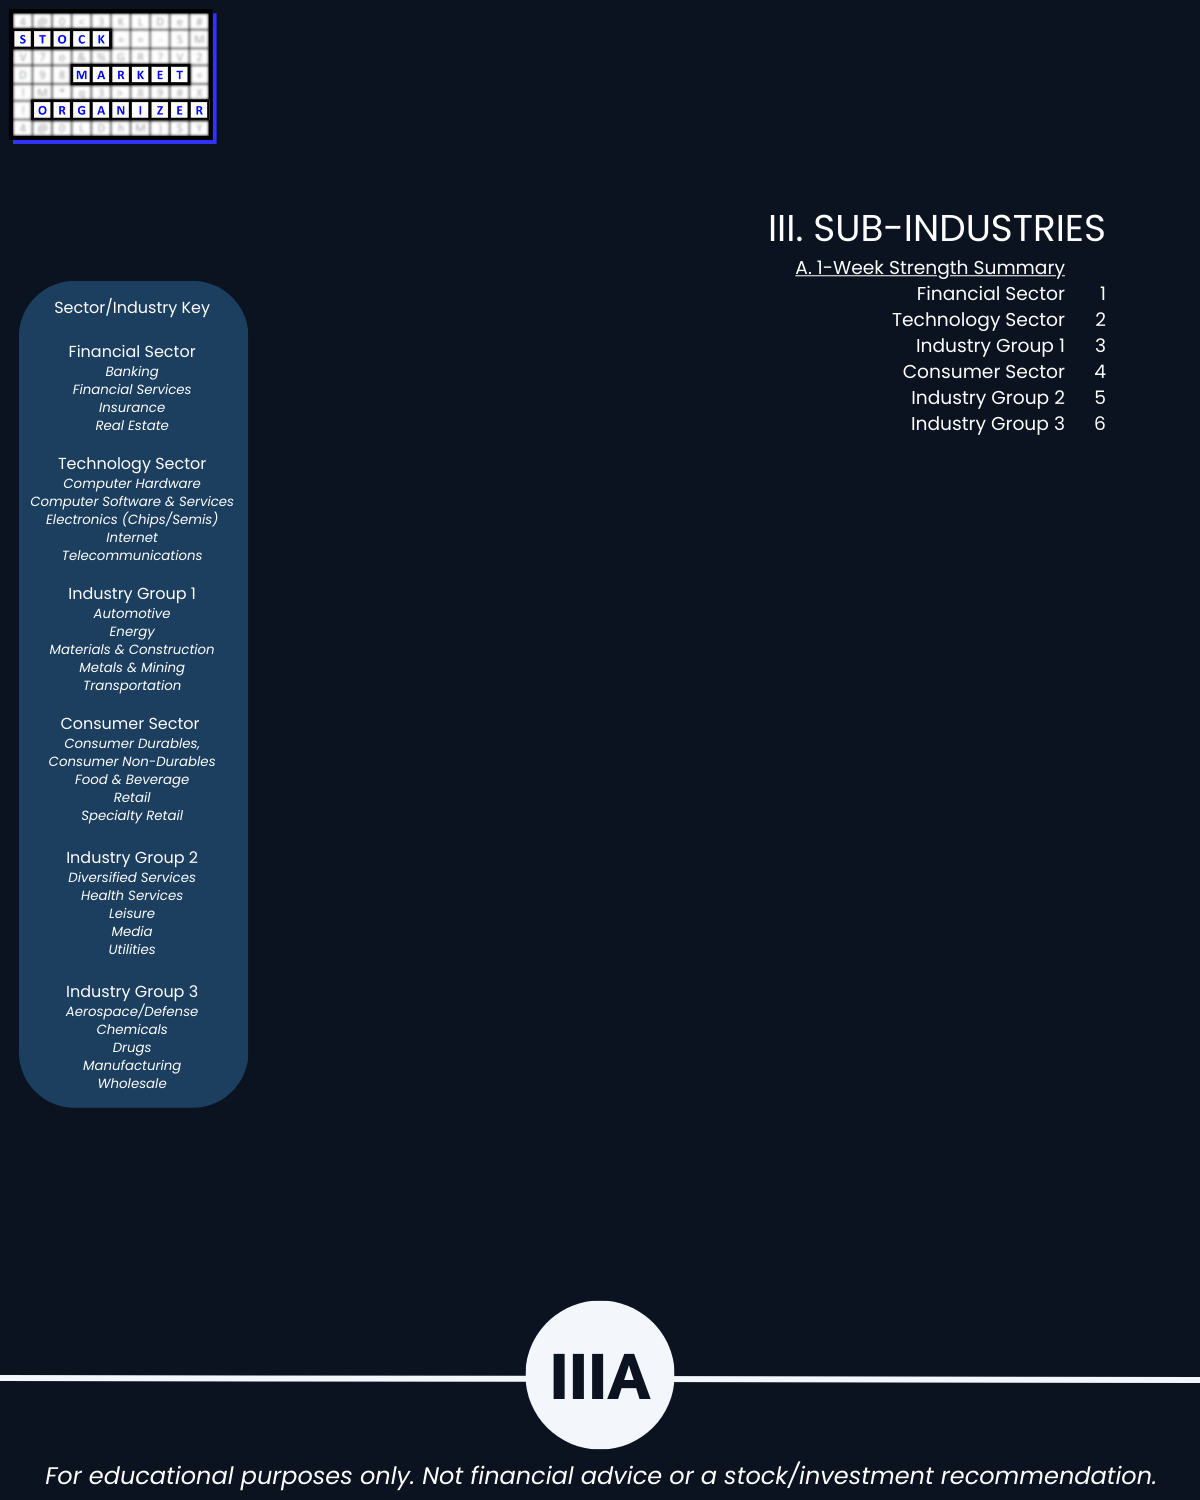
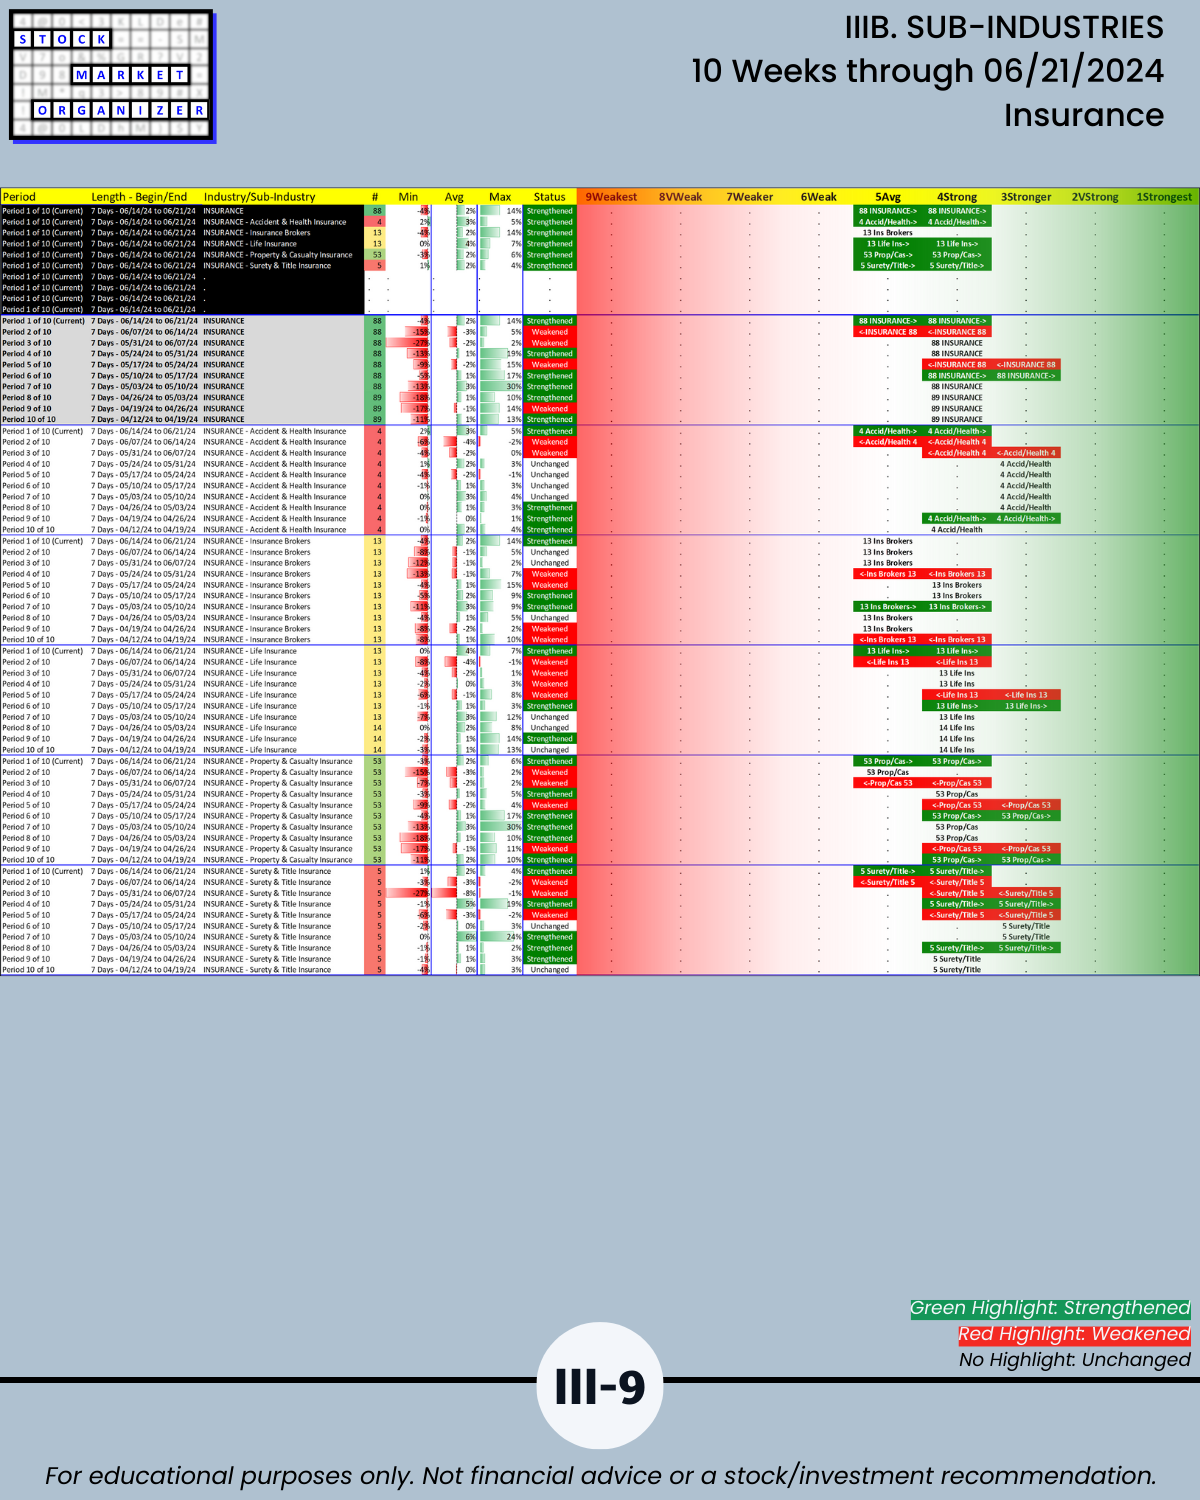
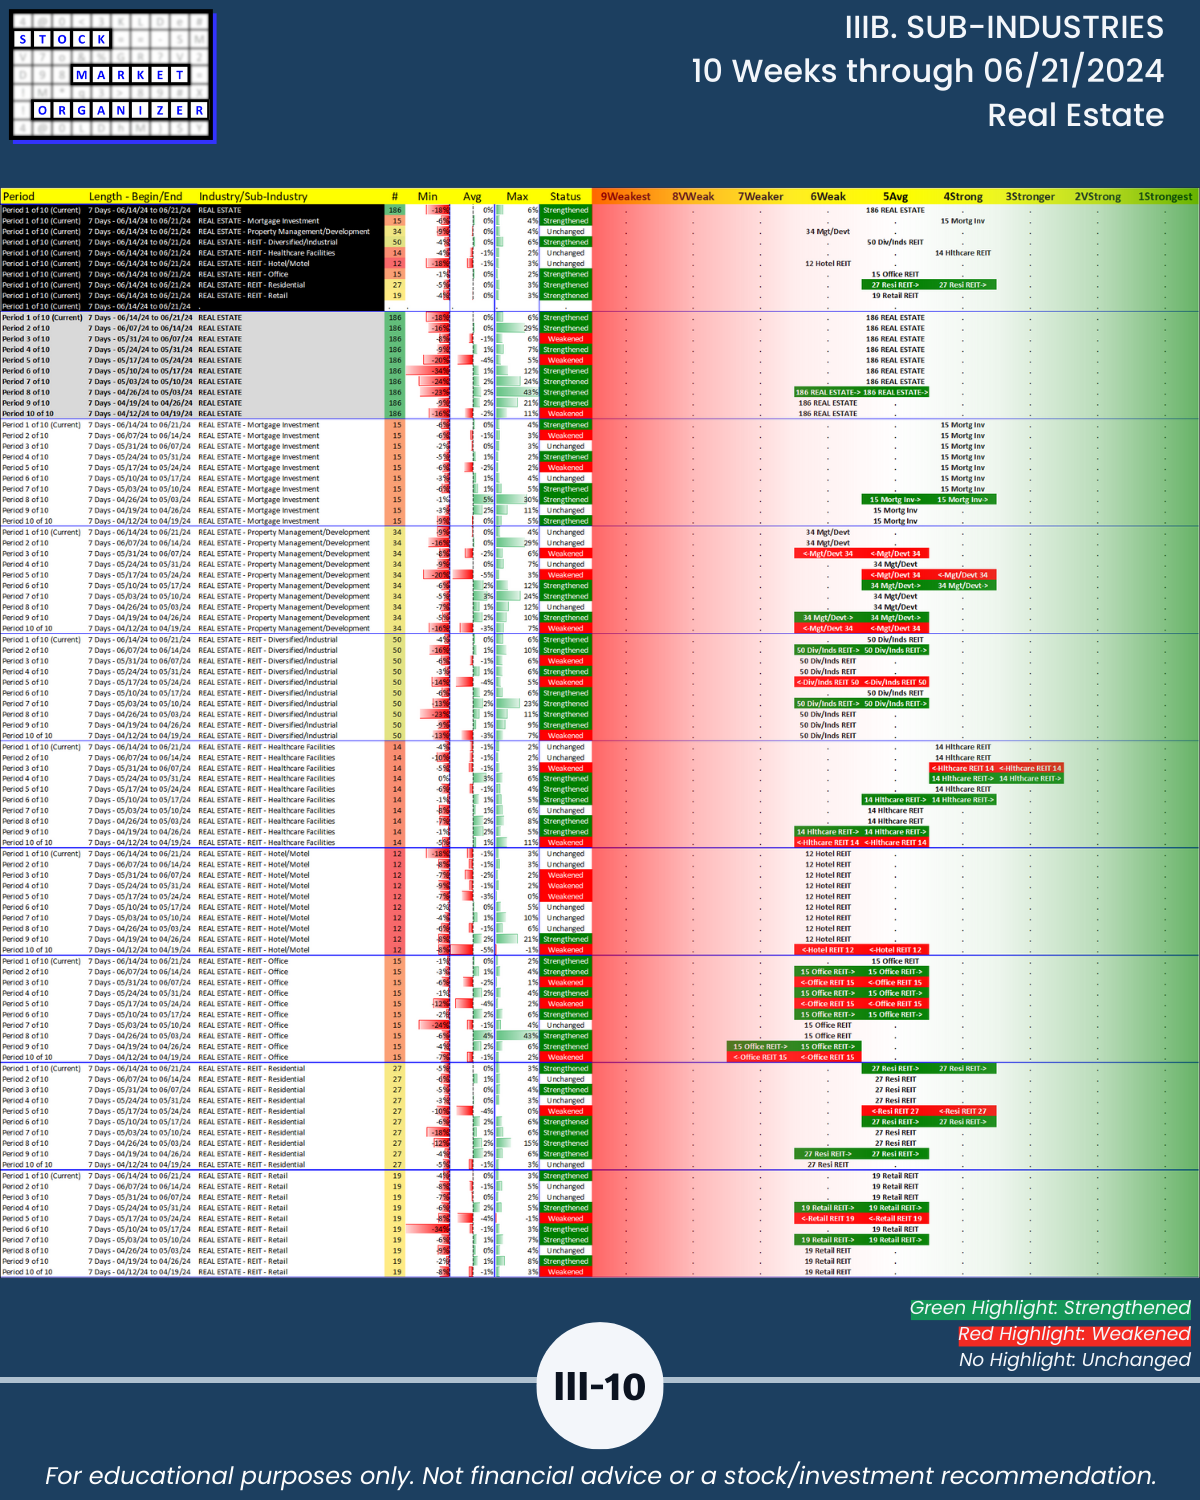
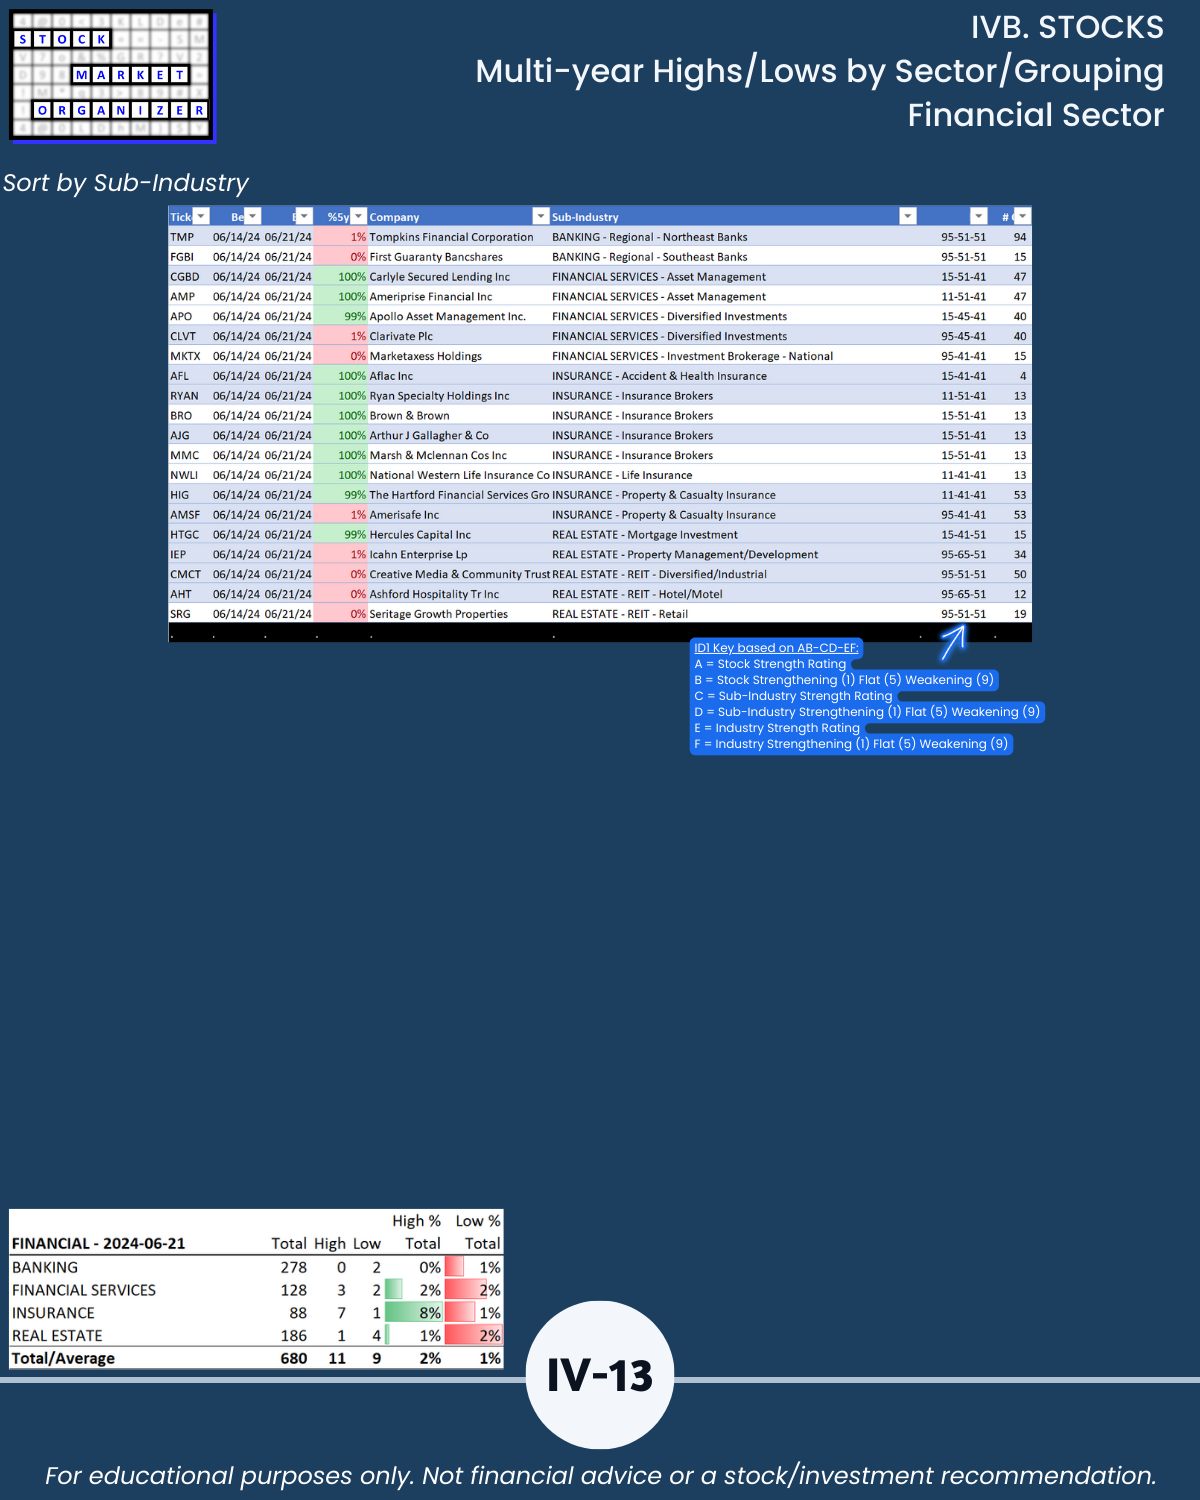
- Financial Sector (Banking, Financial Services, Insurance, Real Estate)
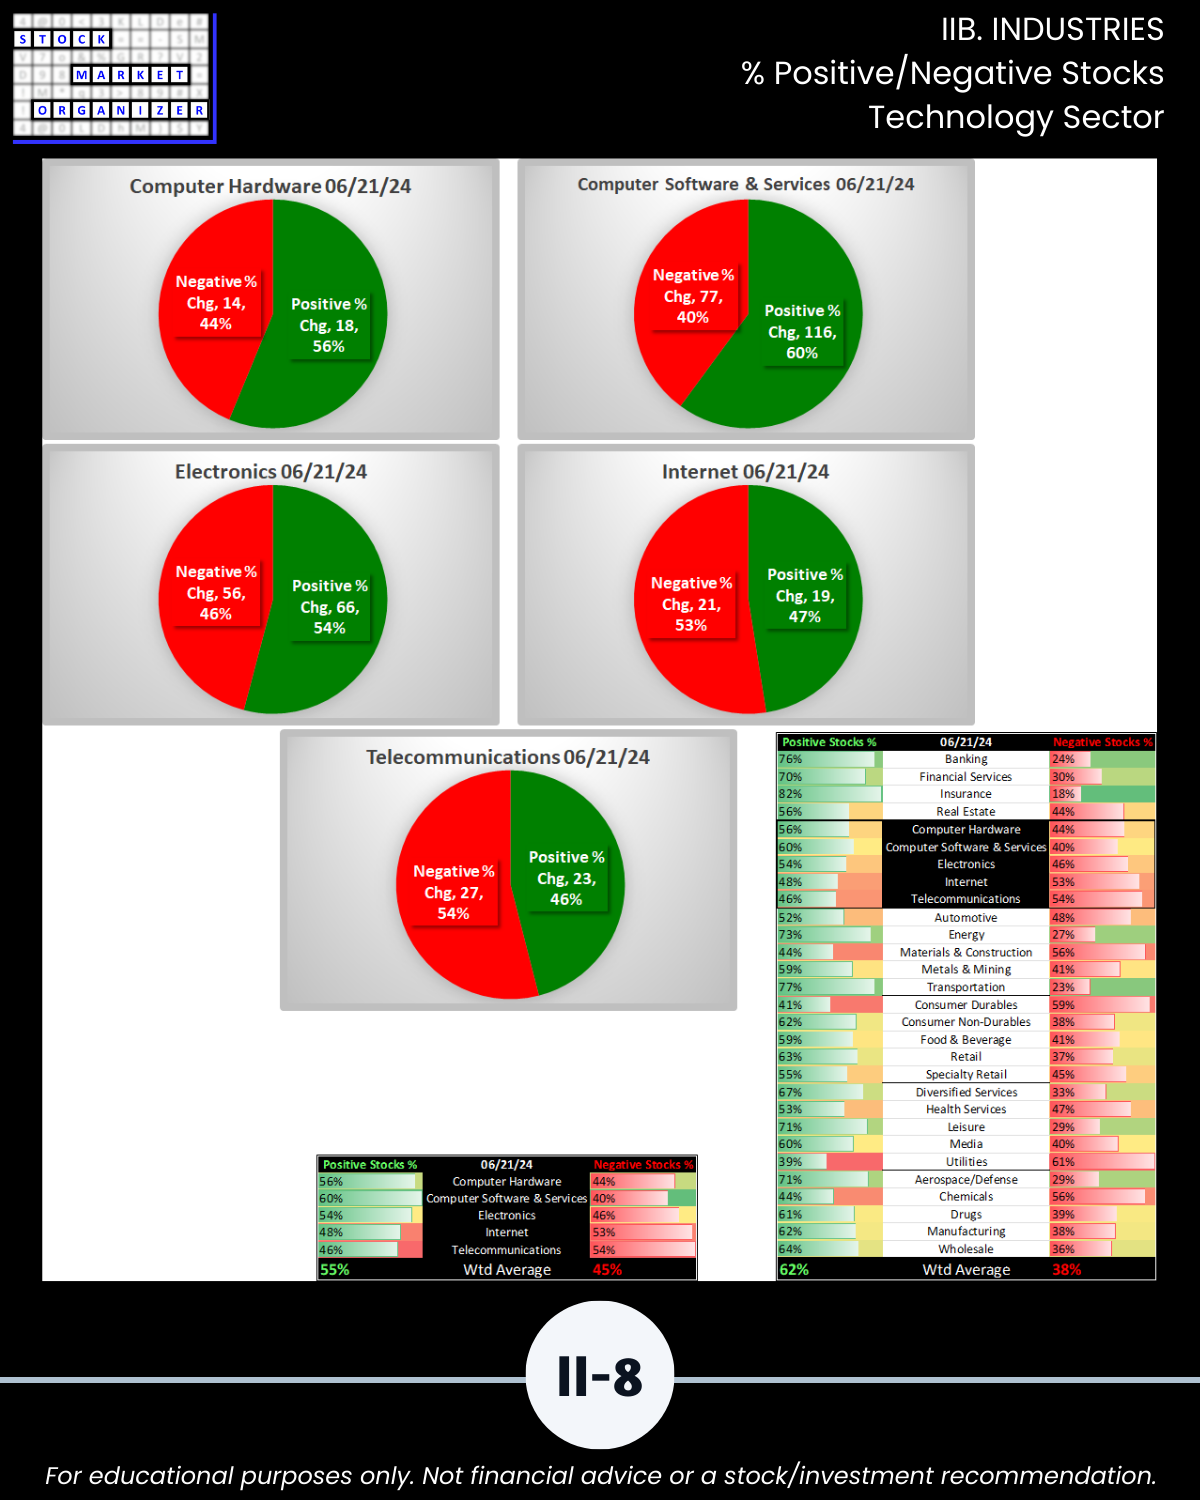
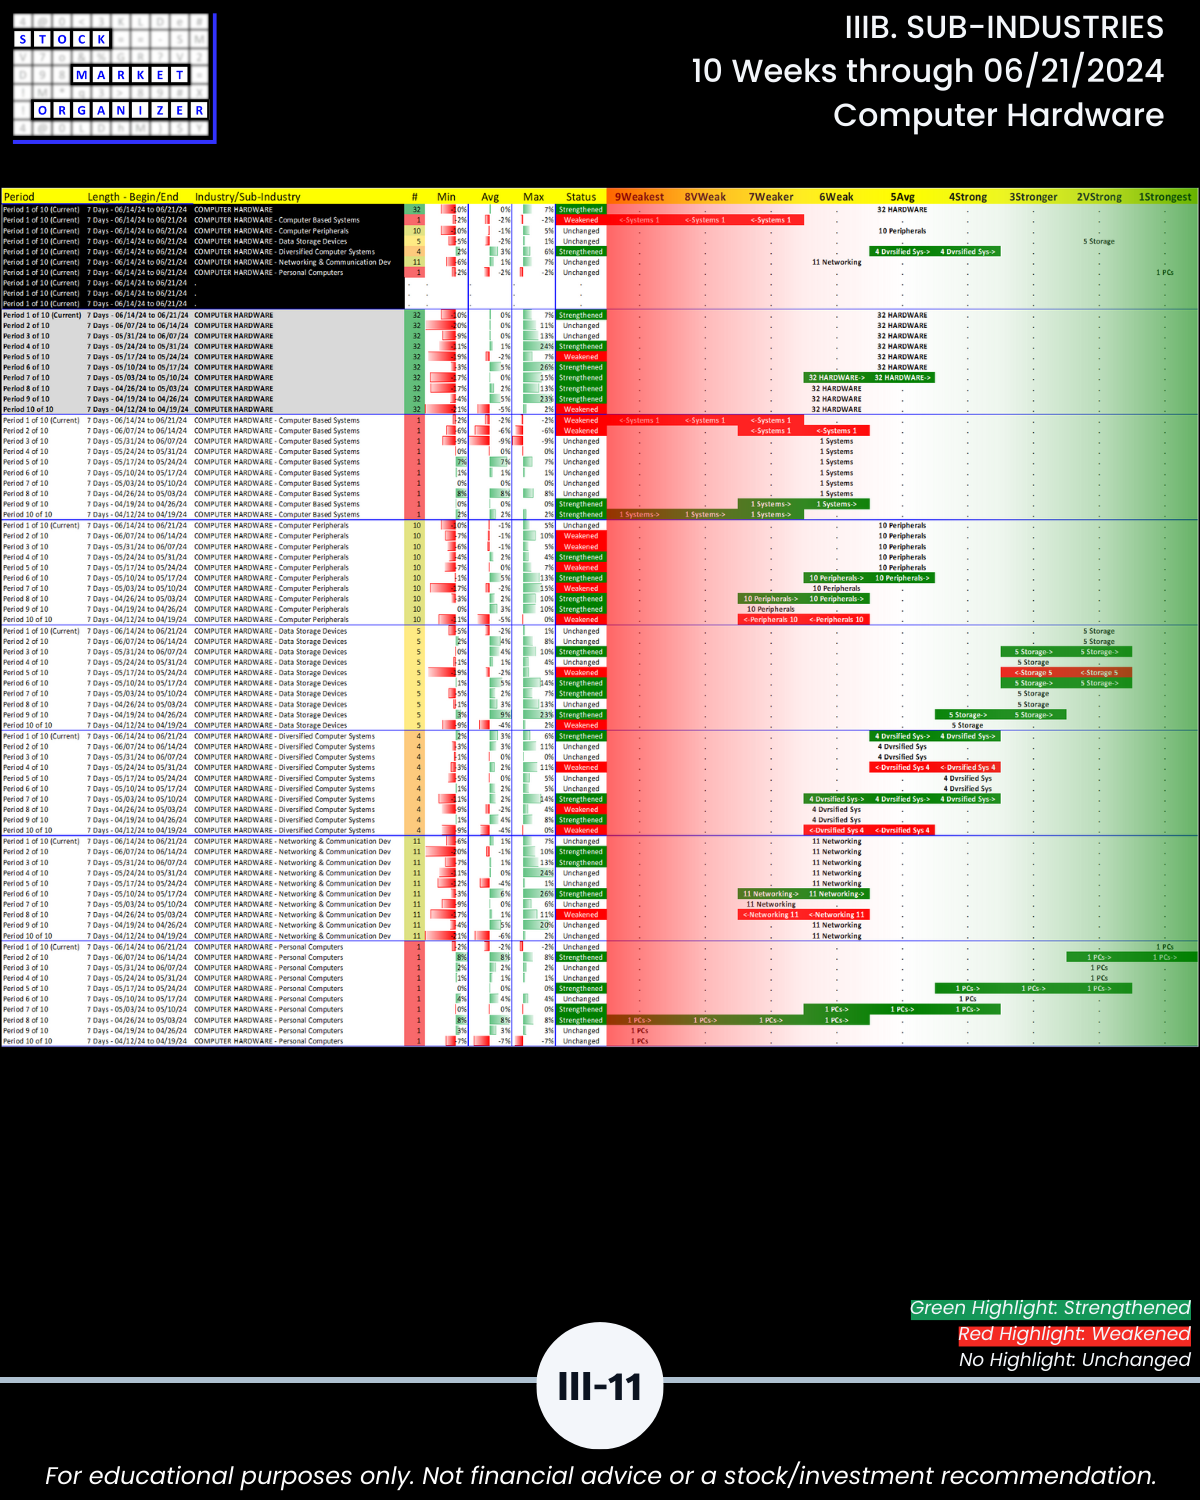
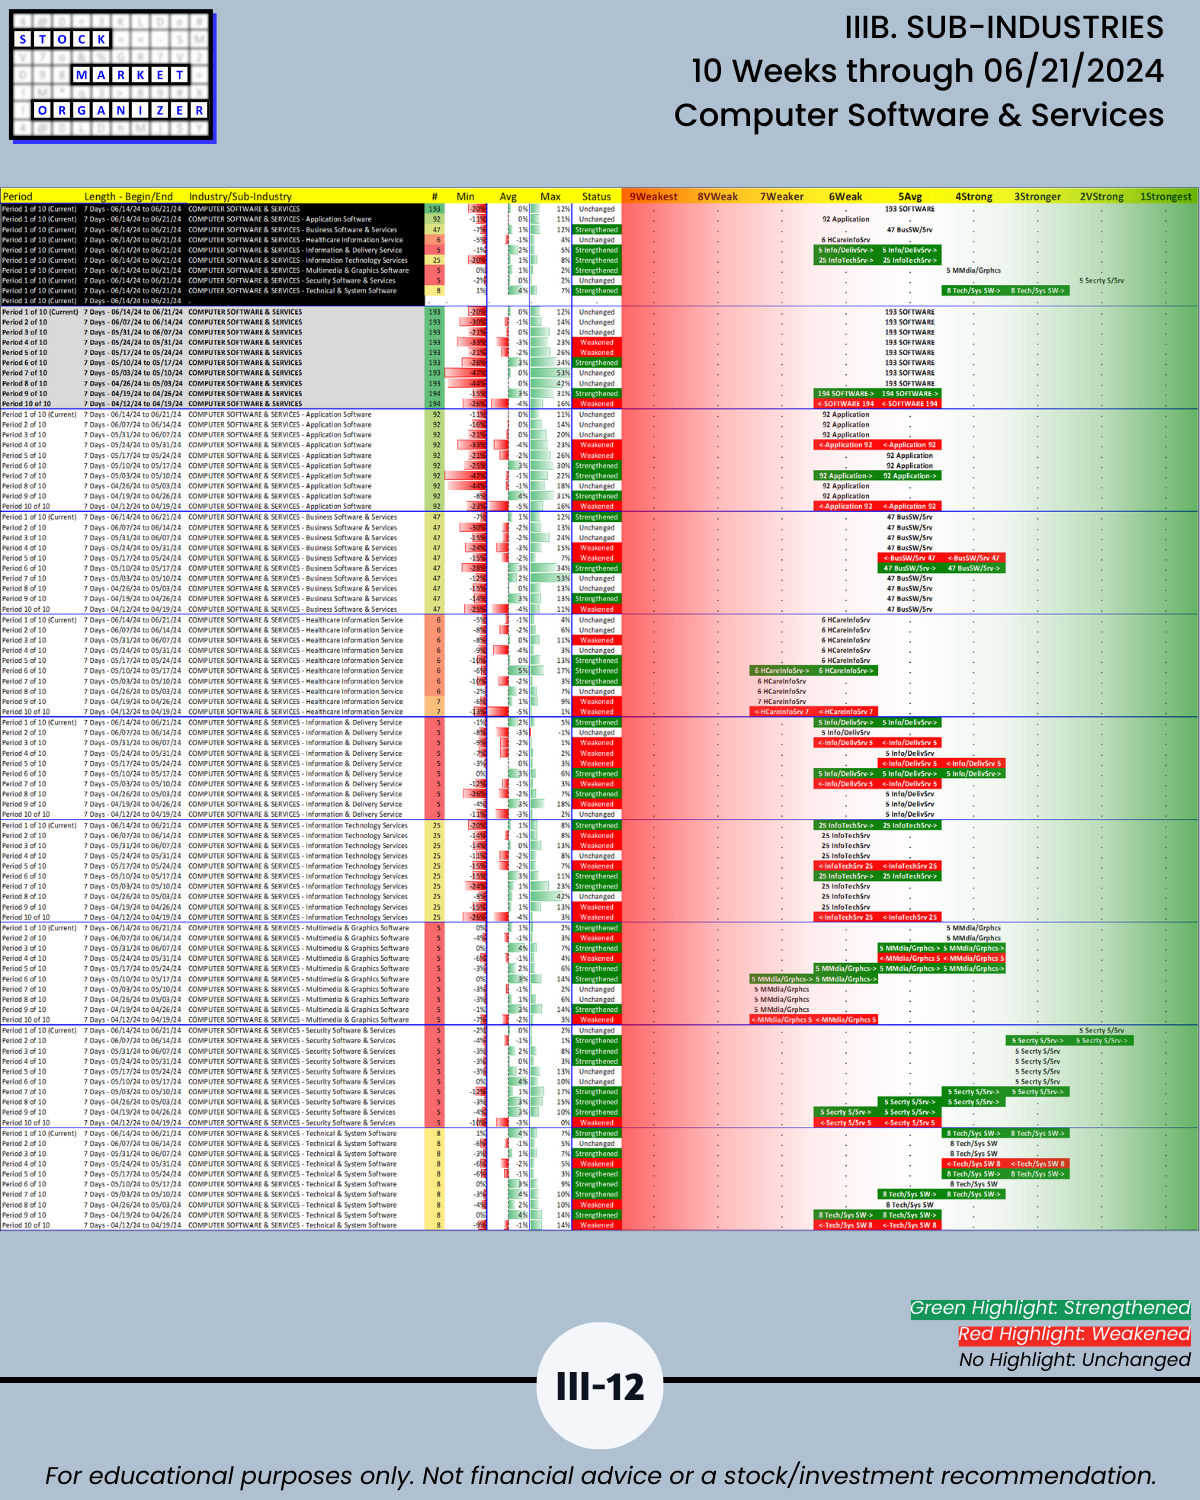
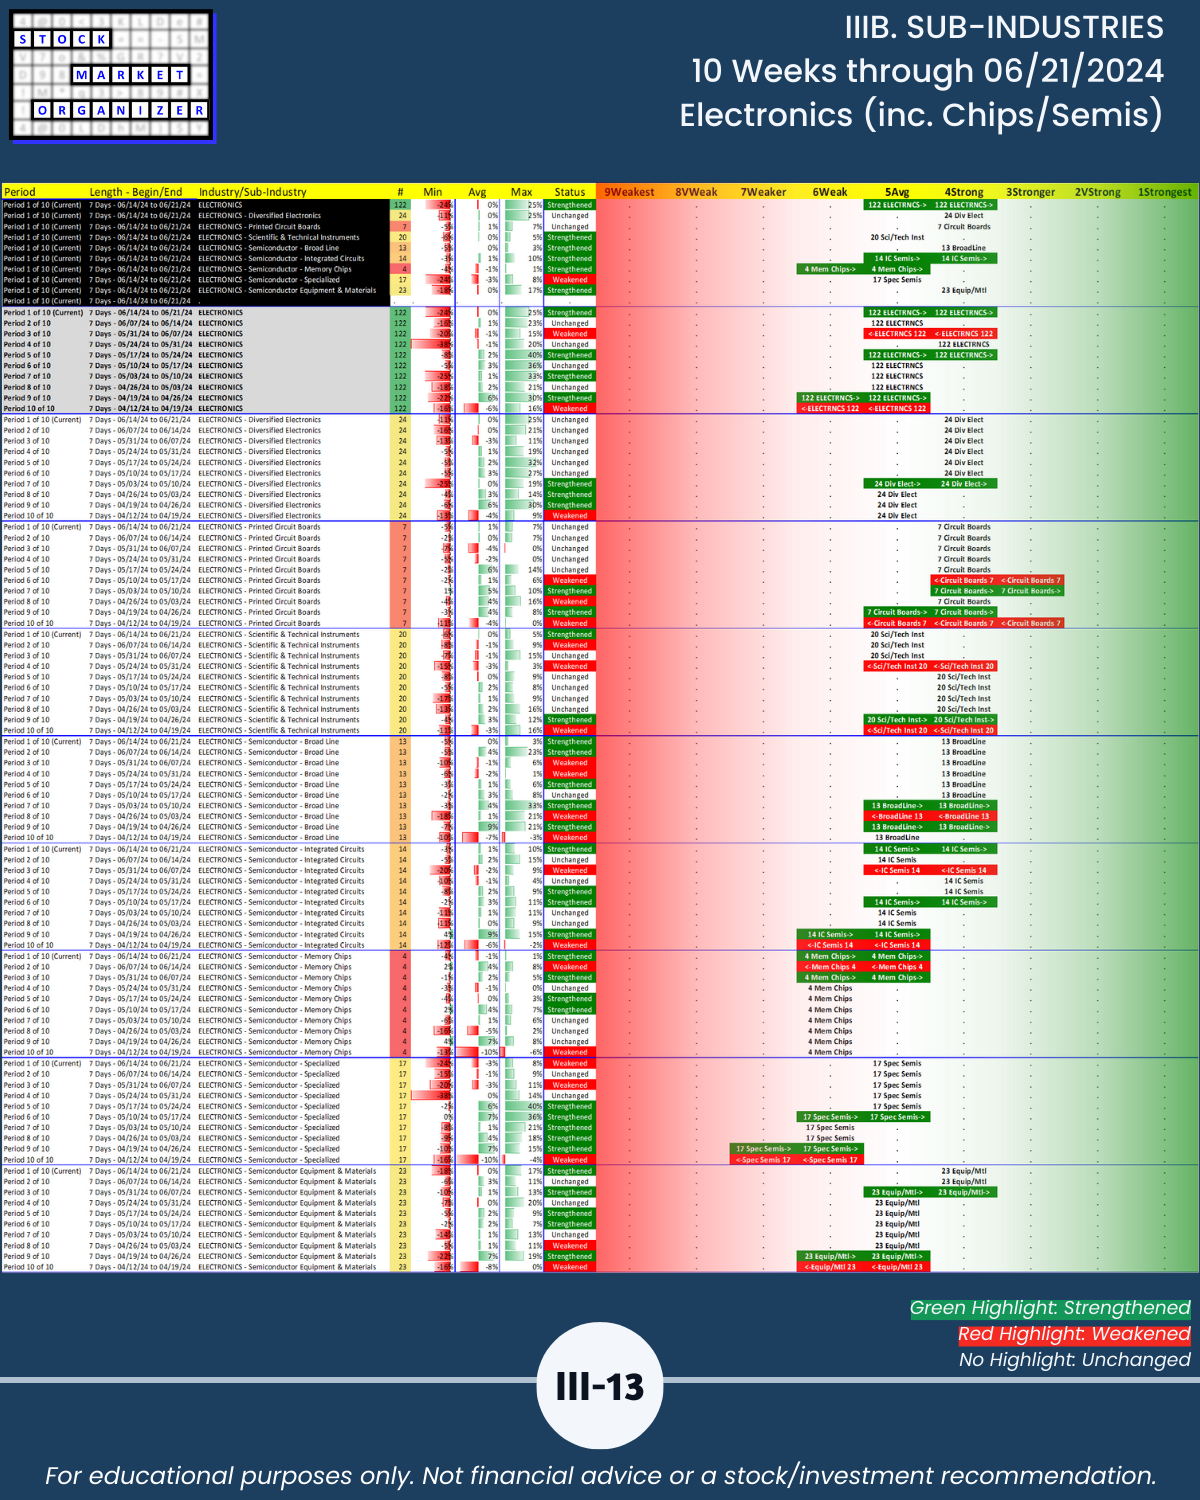
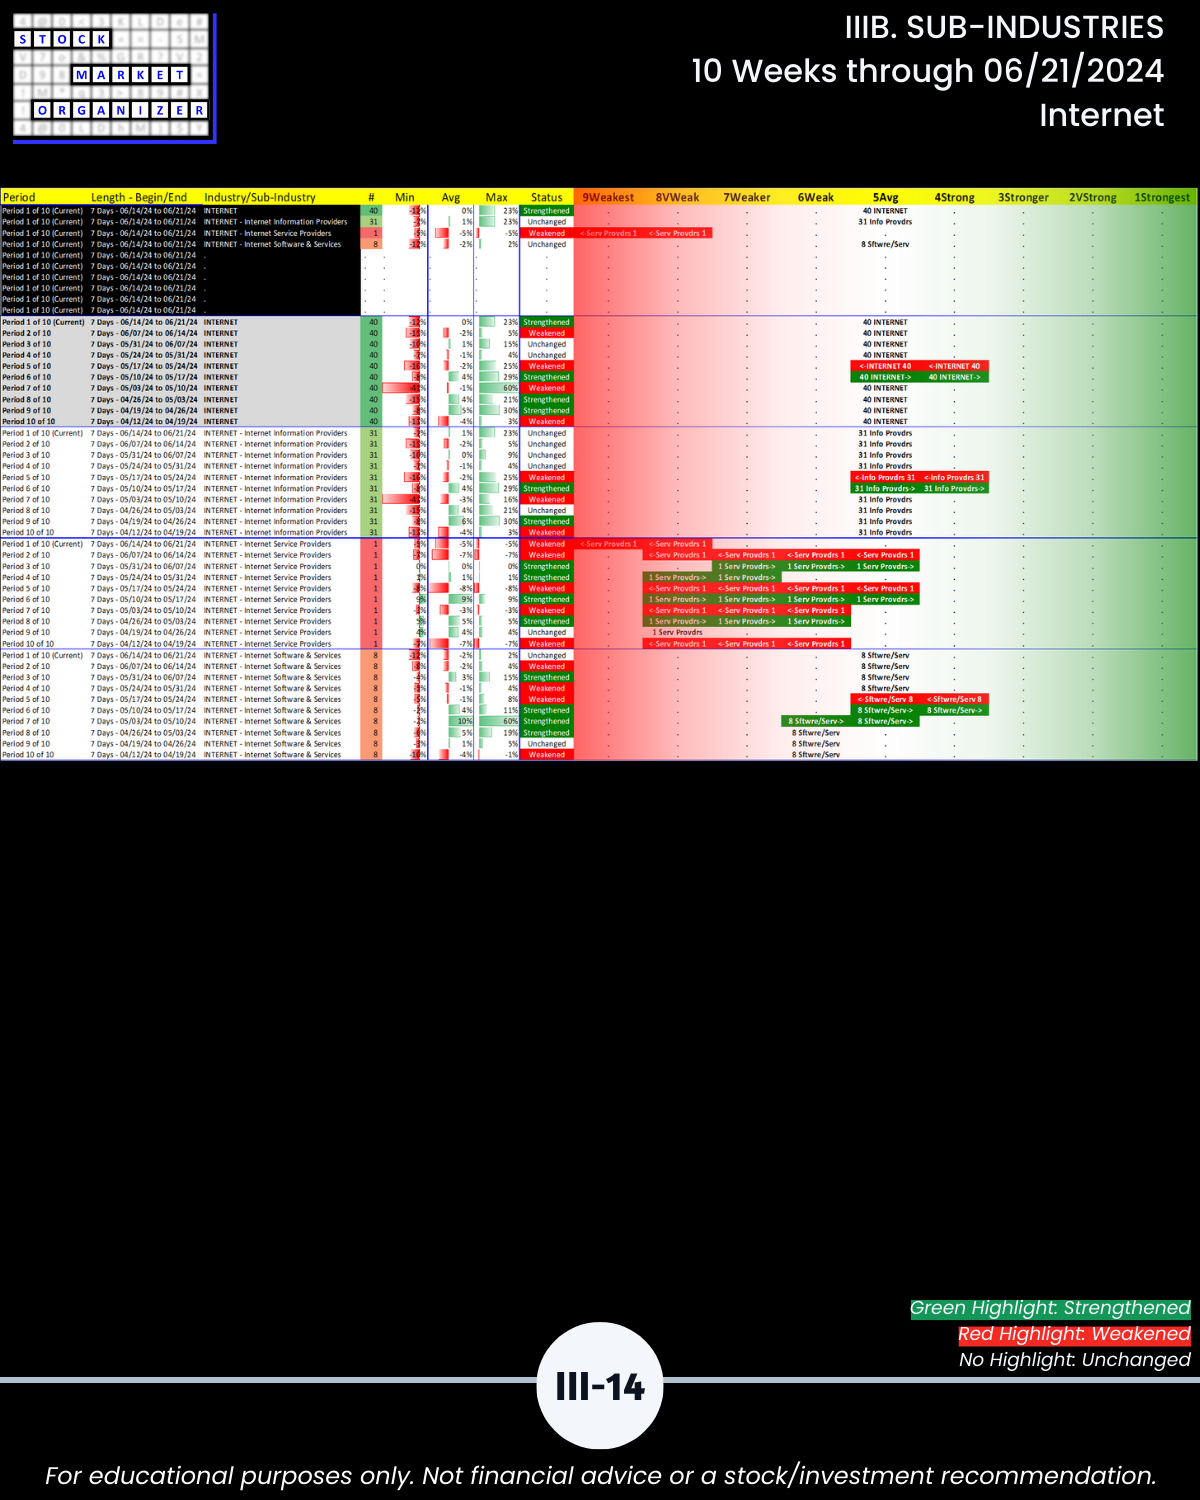
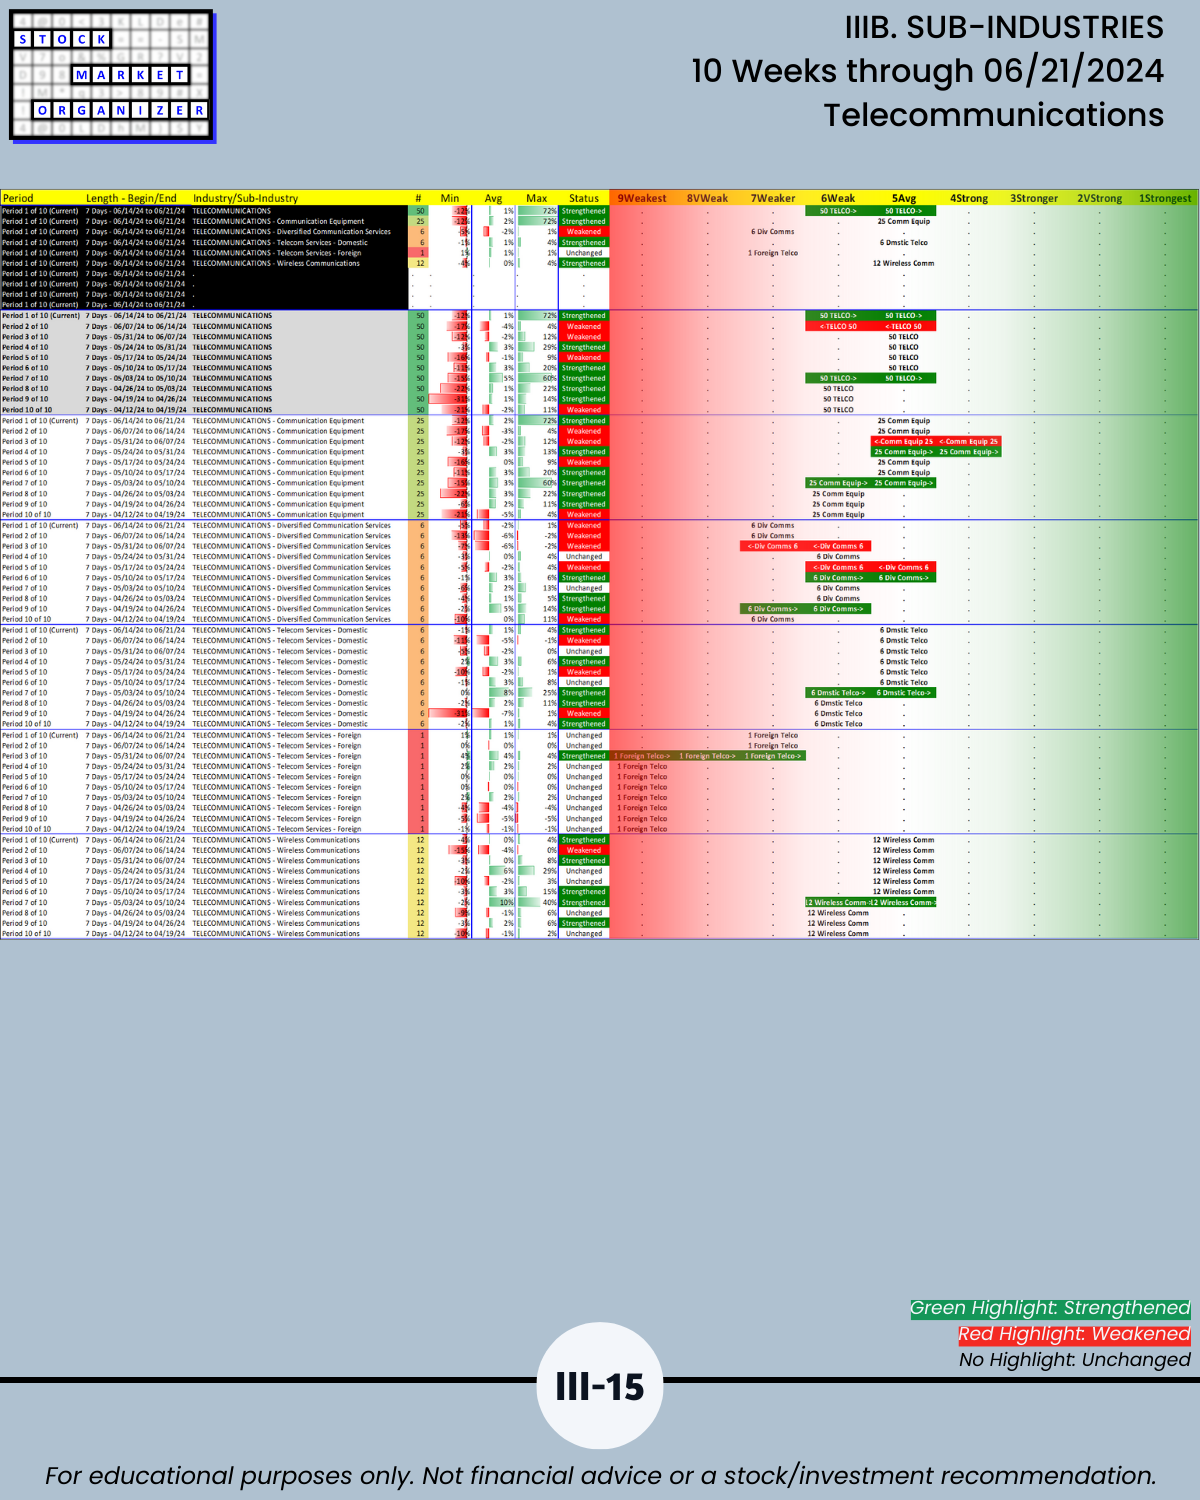
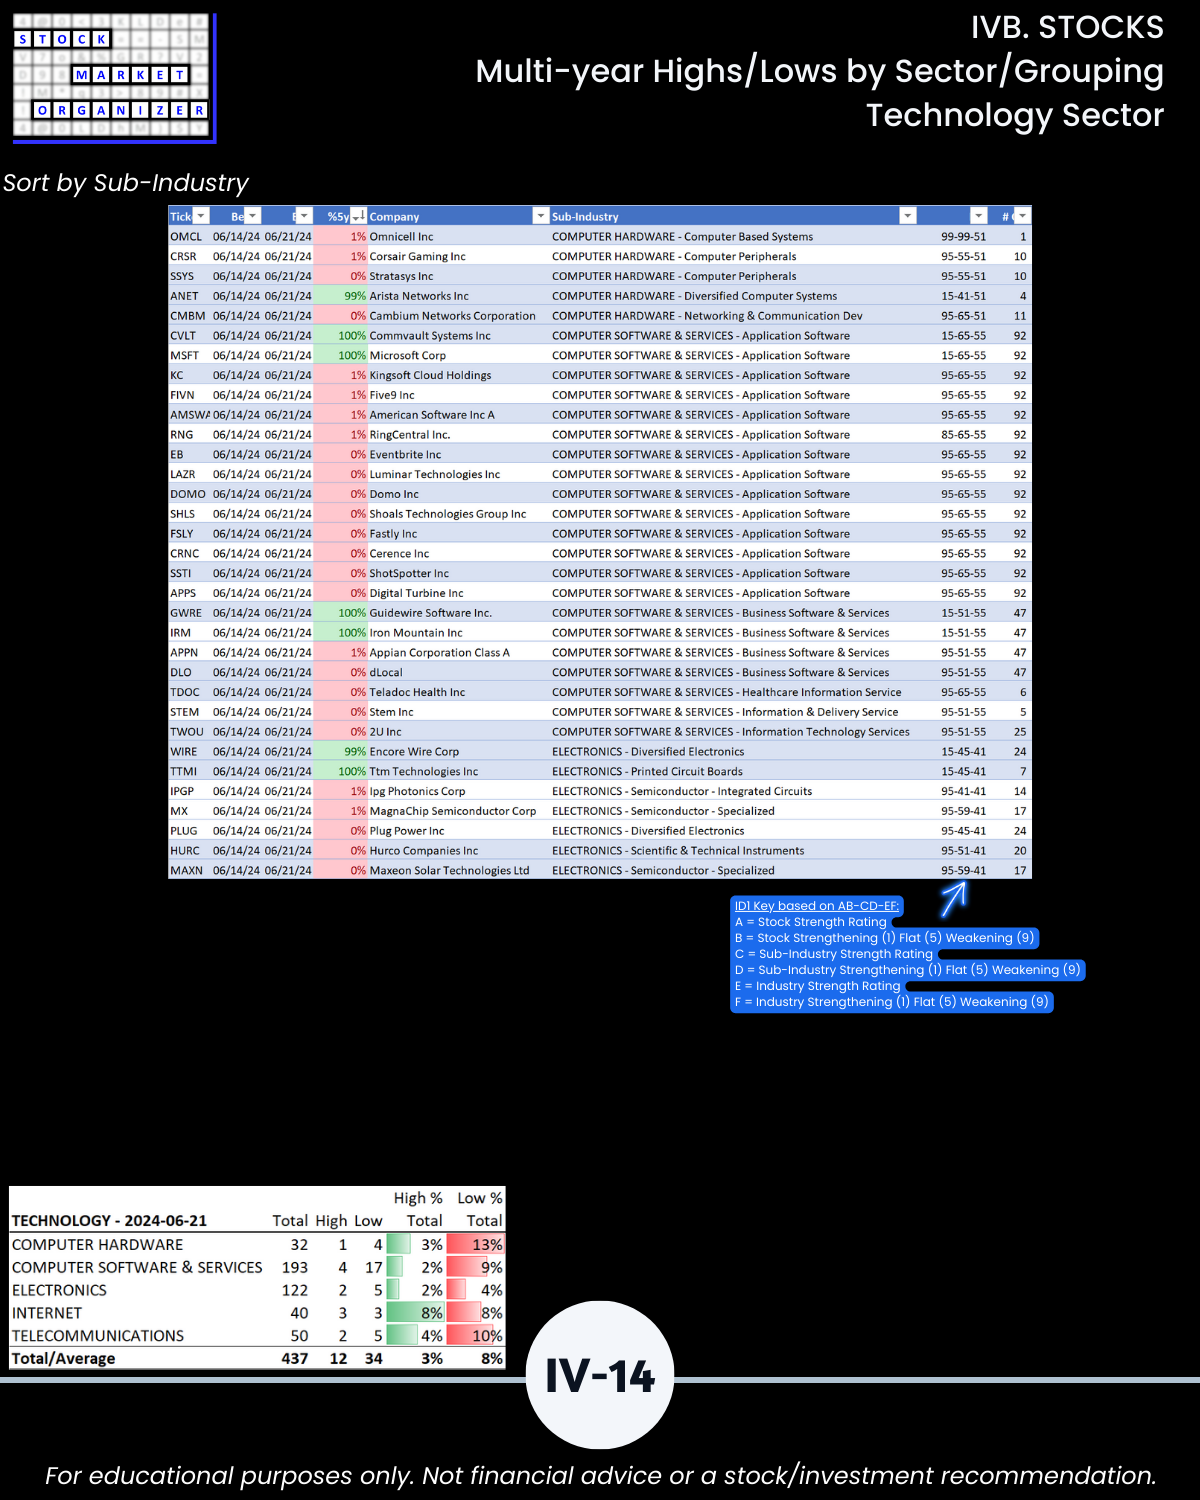
- Technology Sector (Computer Hardware, Computer Software & Services, Electronics, Internet, Telecommunications)
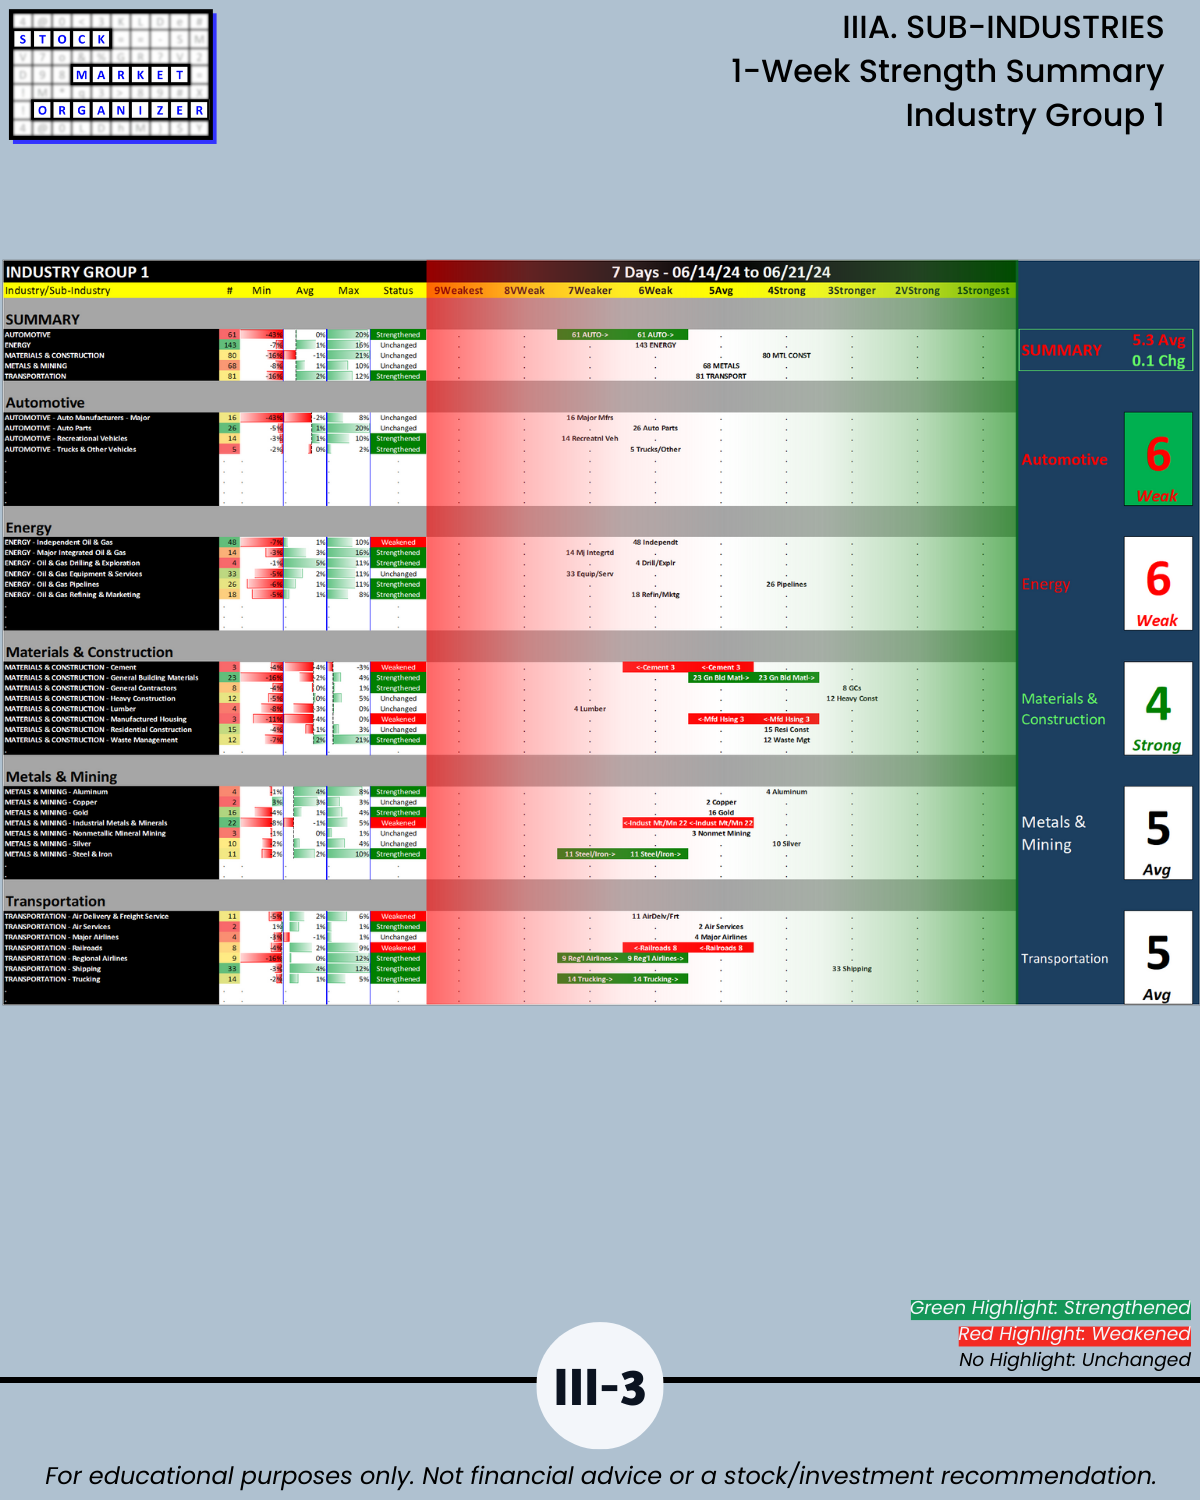
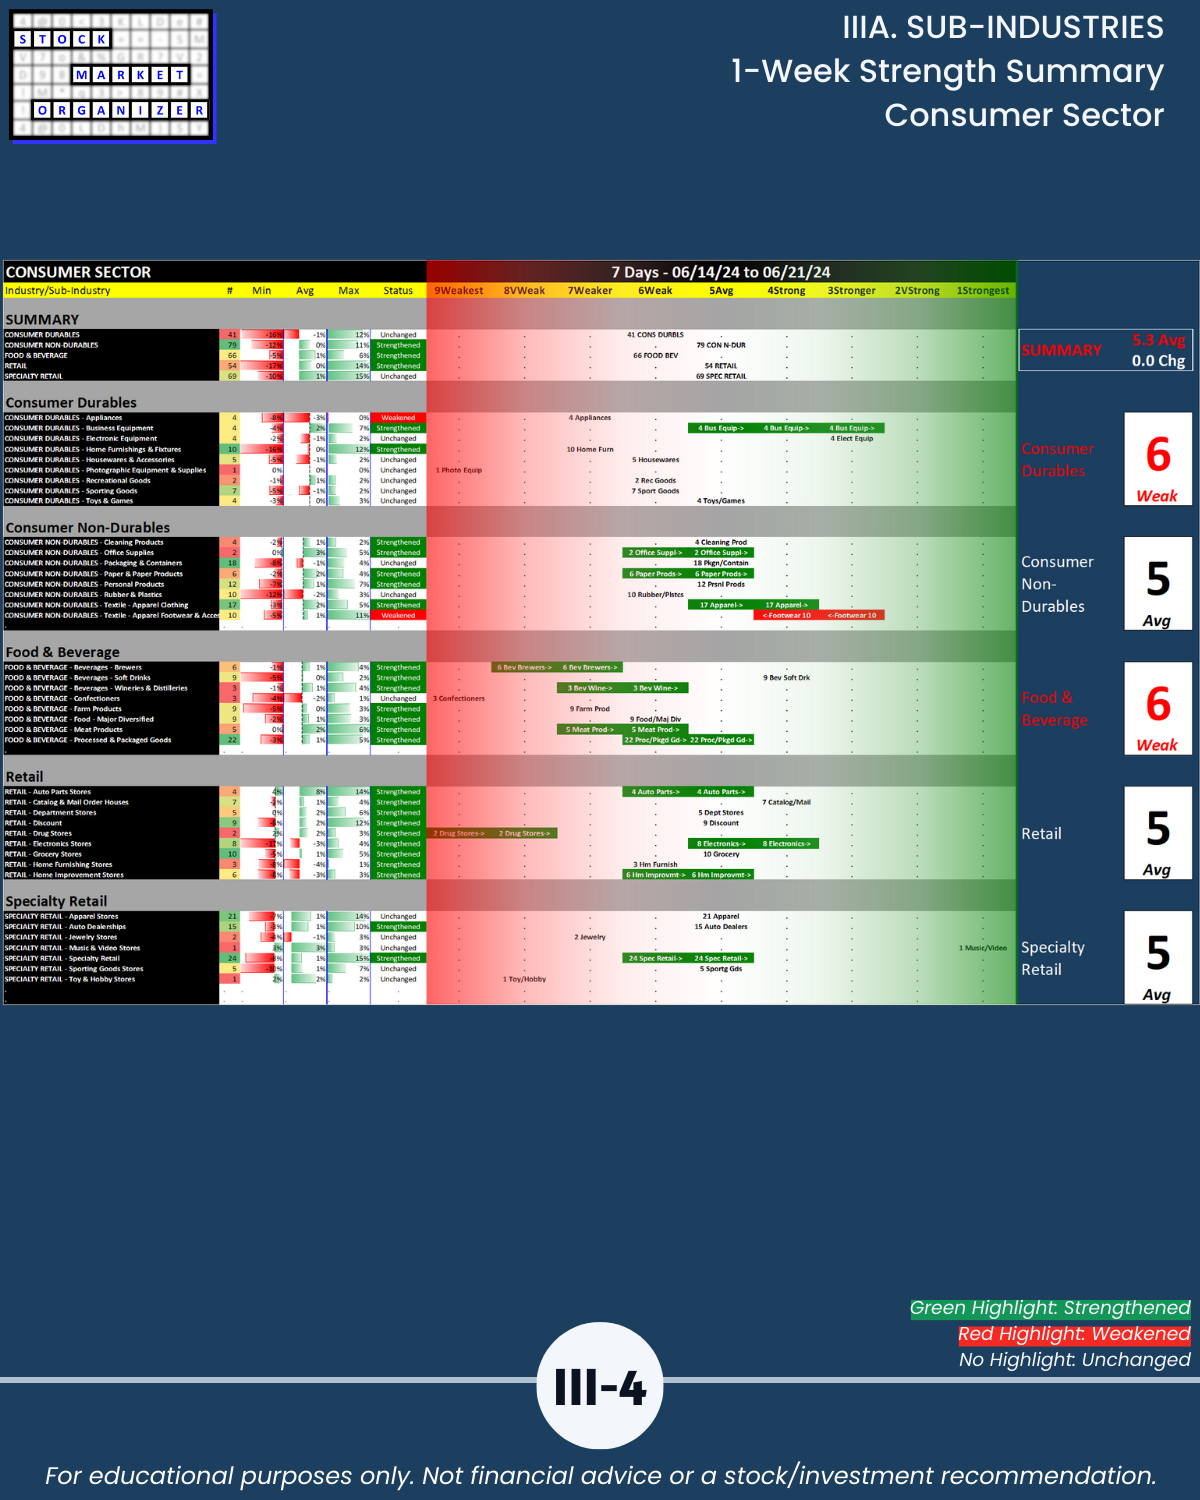
Lagging Sectors/industry groupings with a 5.3 weighted average ranking:
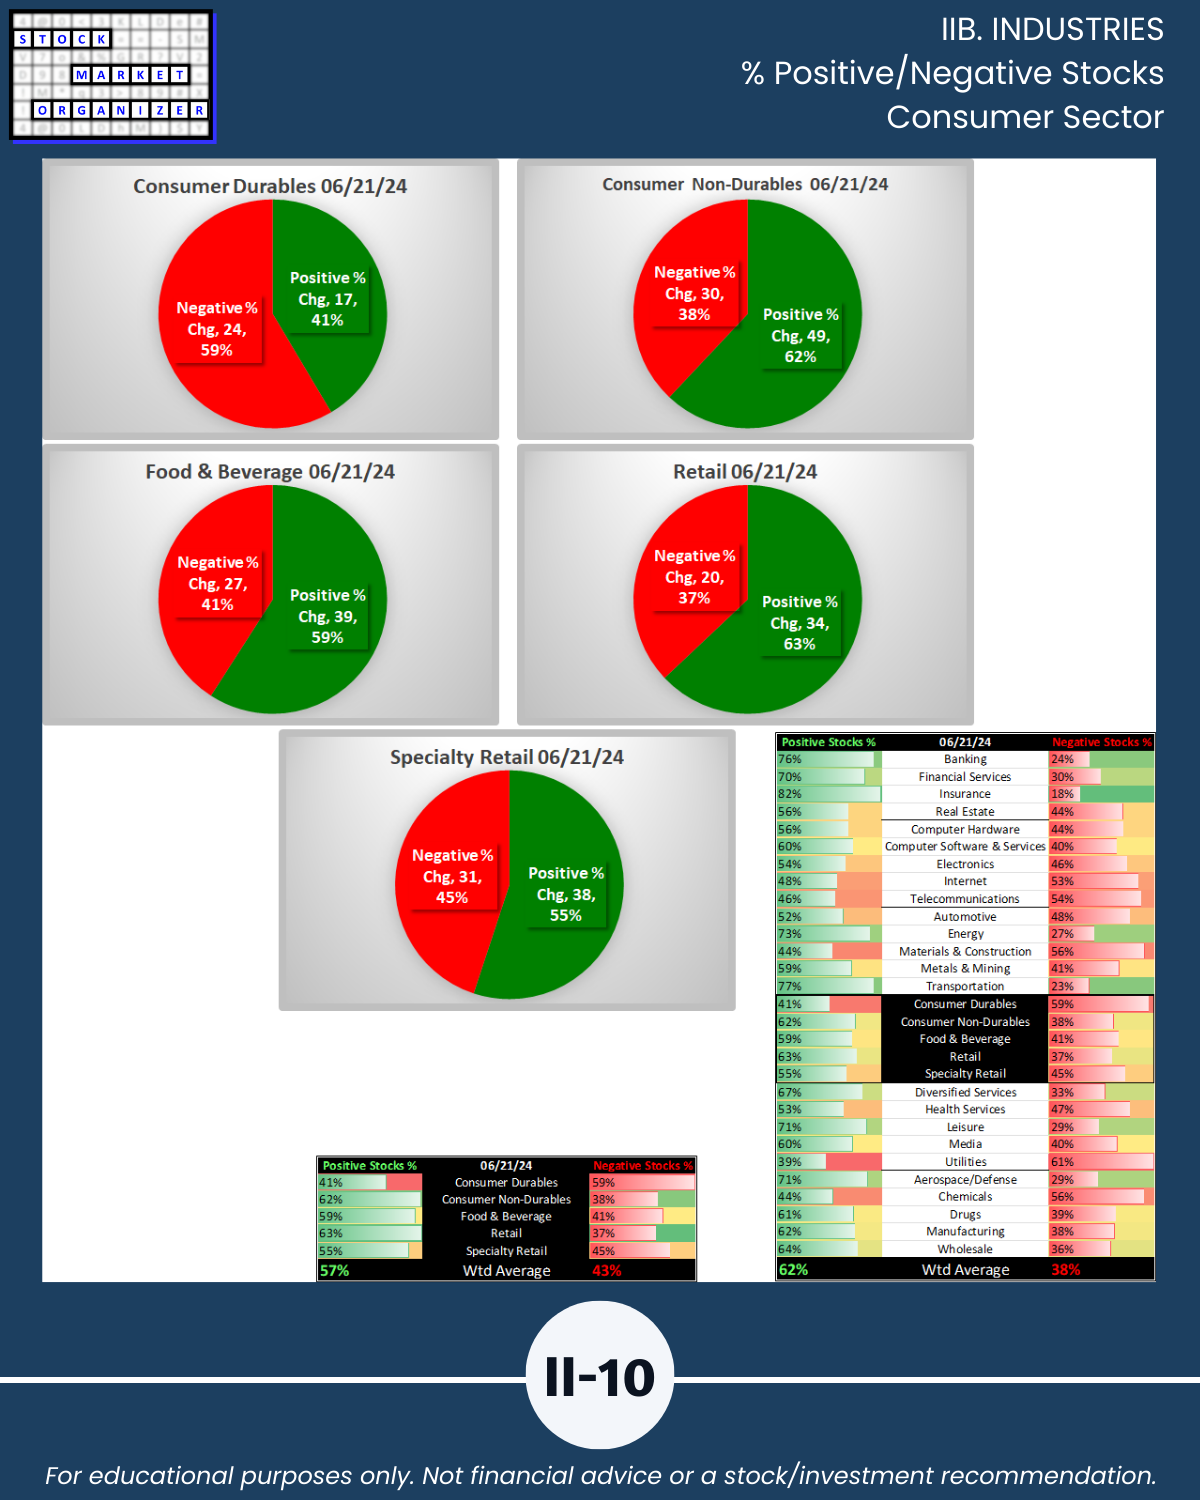
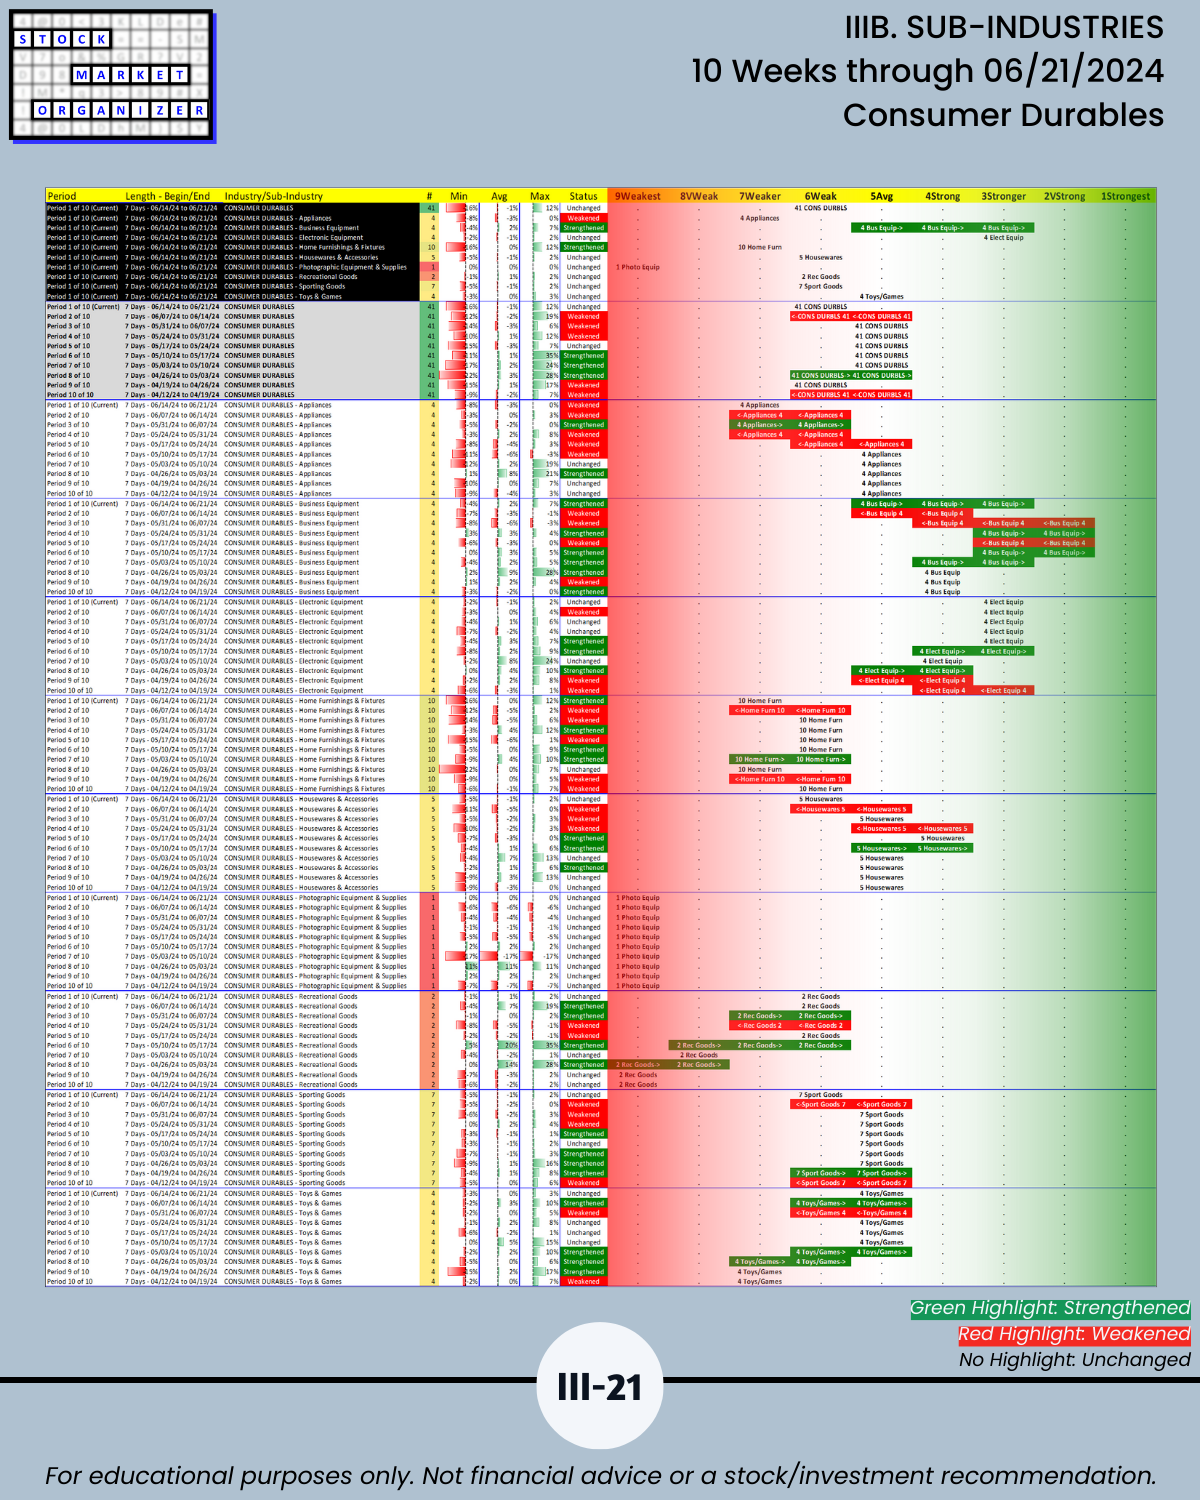
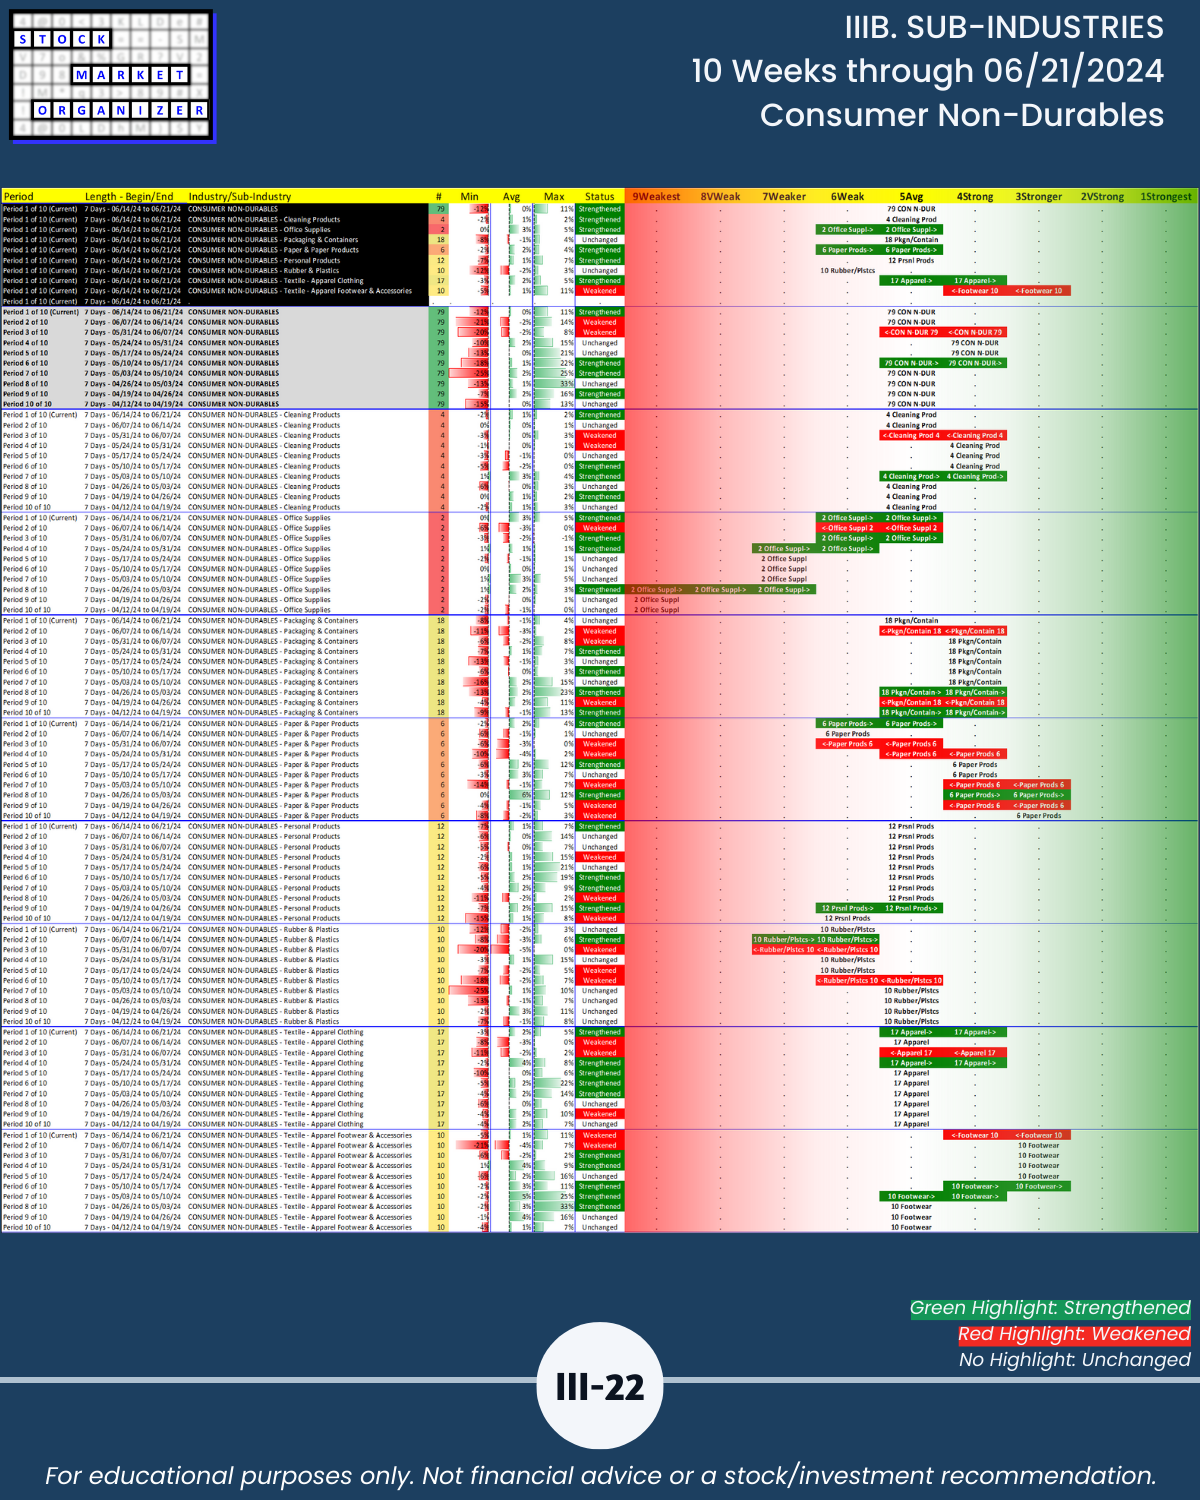
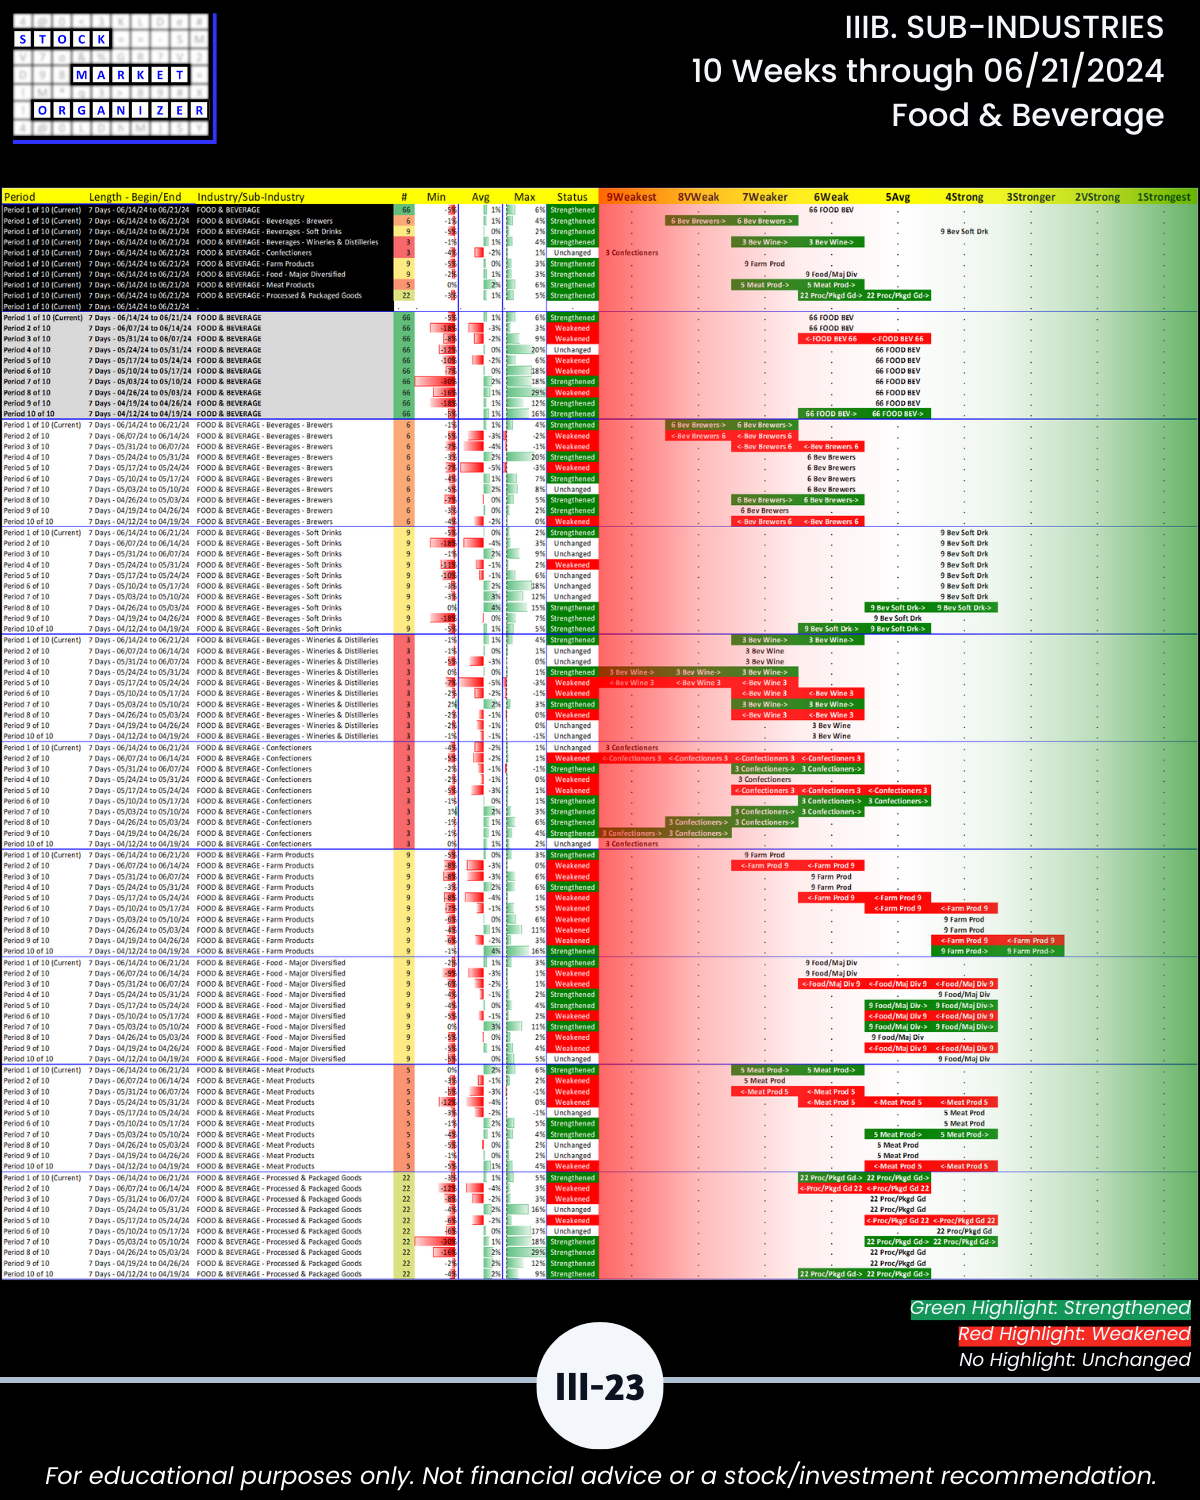
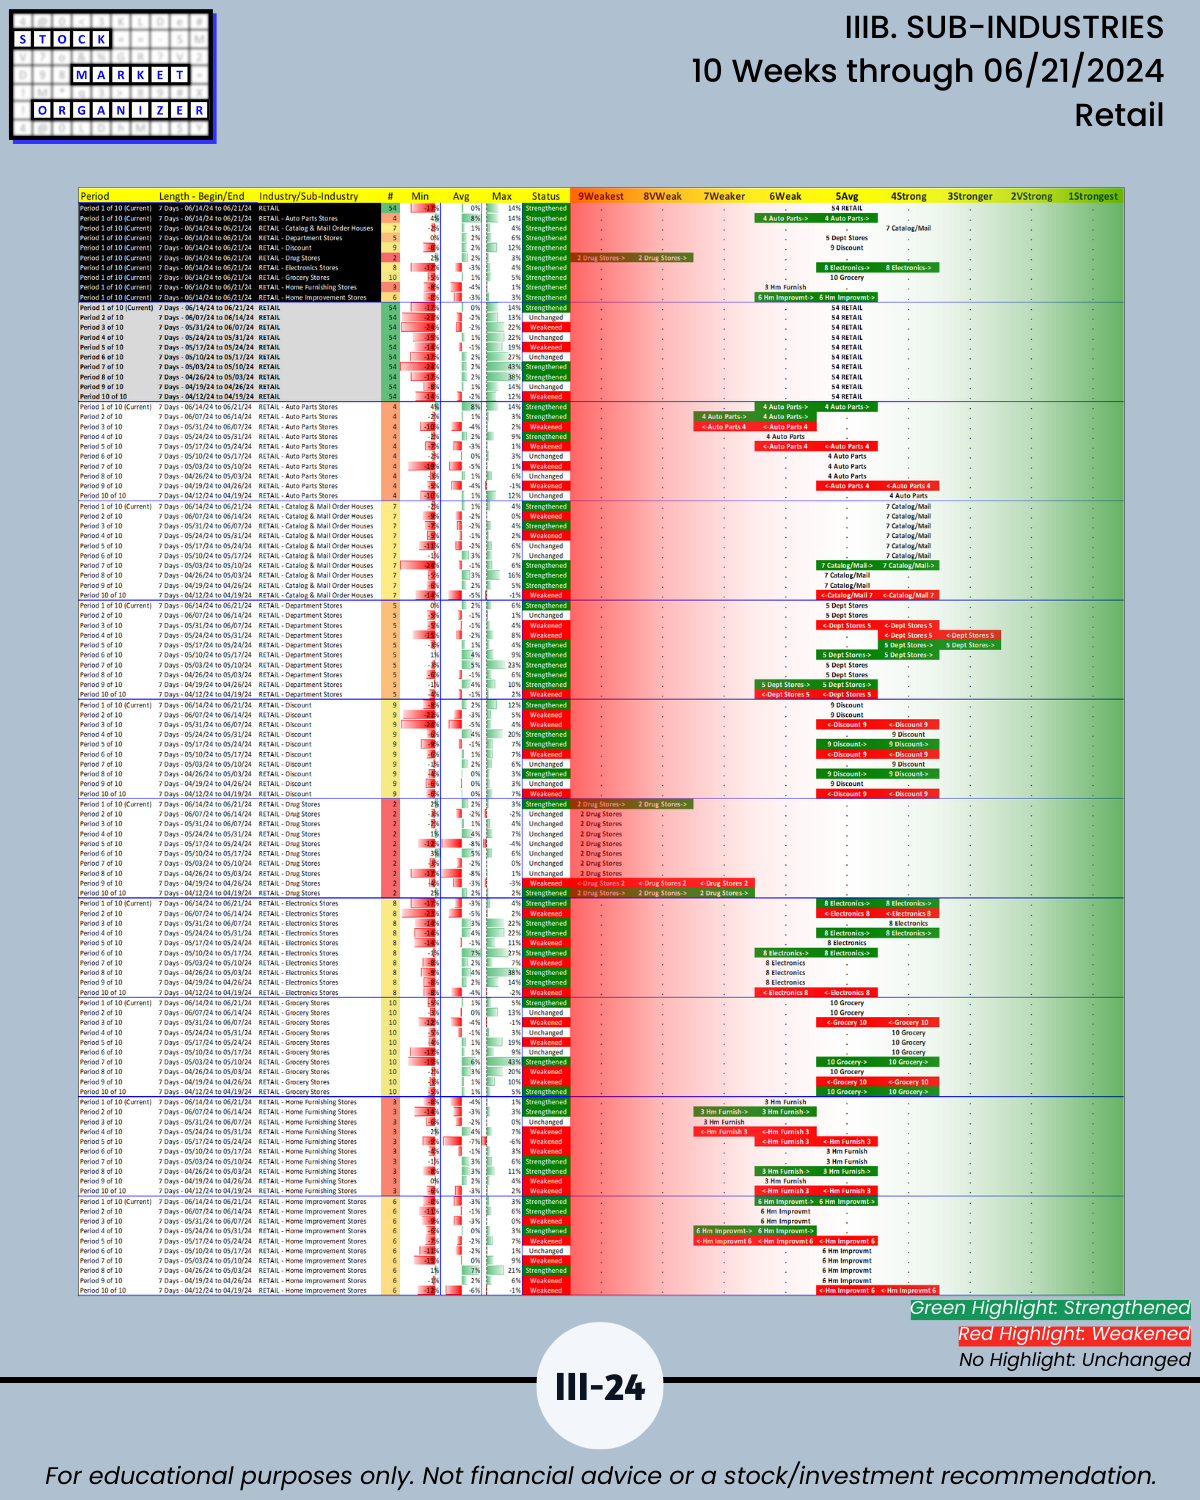
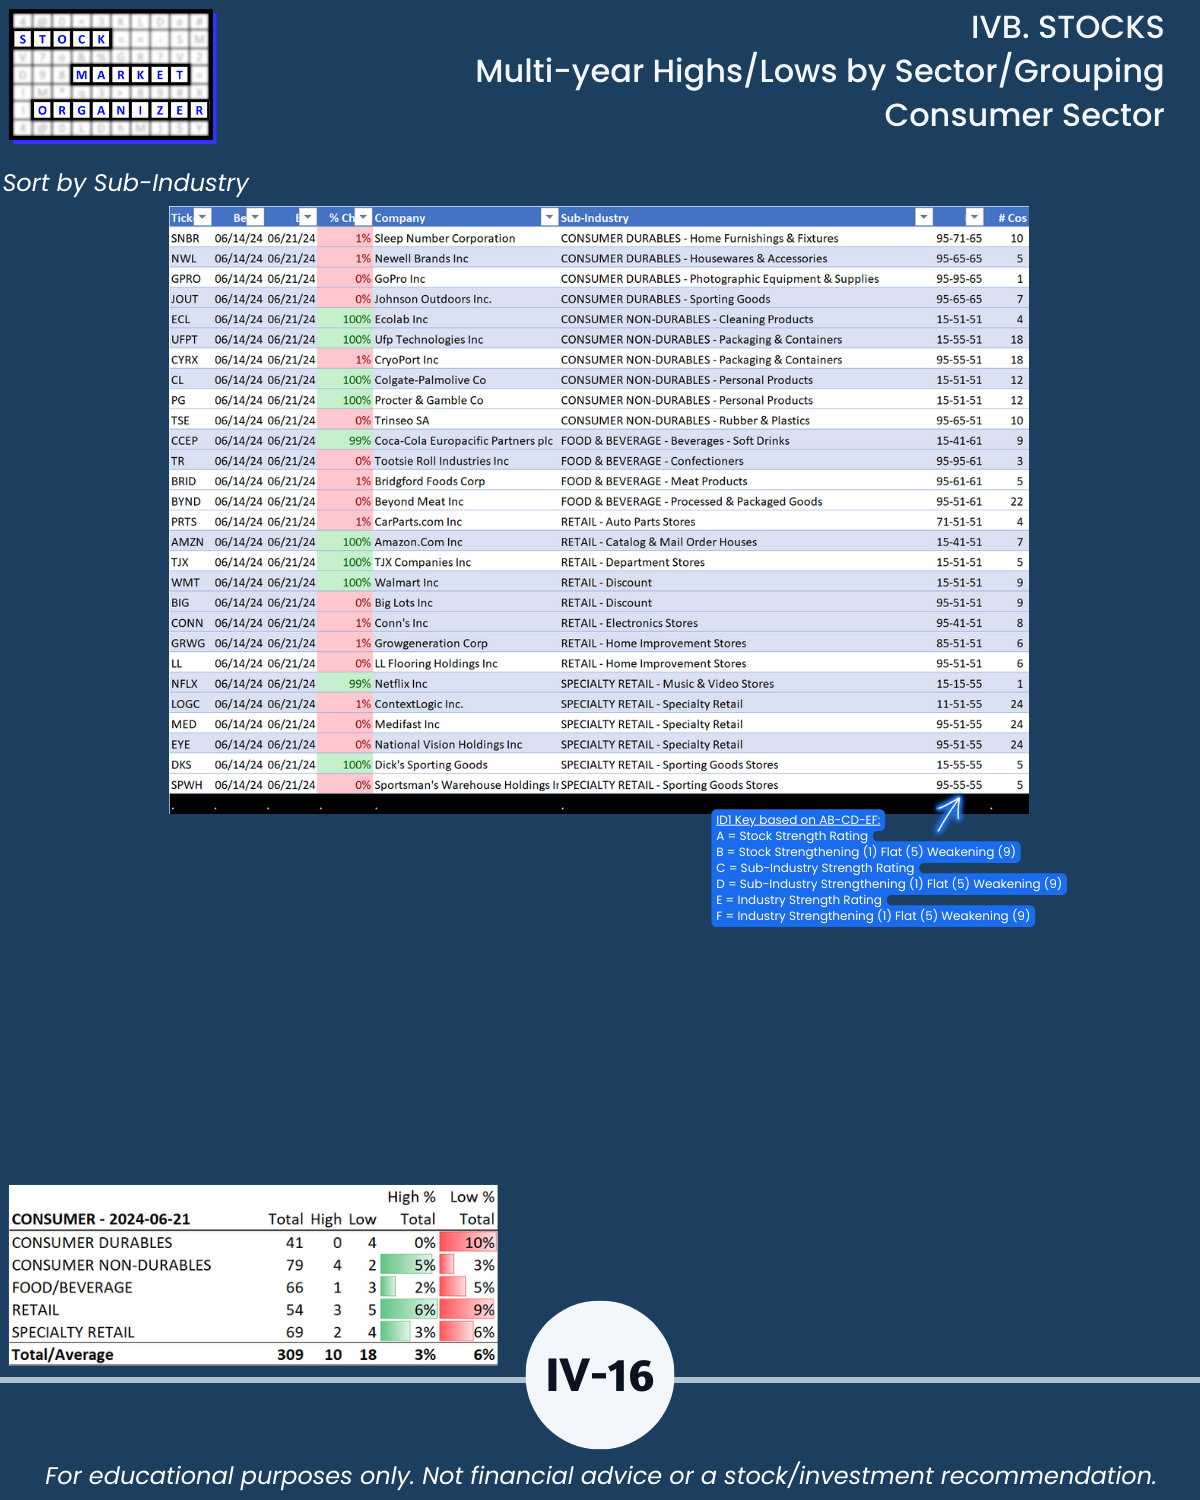
- Consumer Sector (Consumer Durables, Consumer Non-Durables, Food & Beverage, Retail, Specialty Retail)
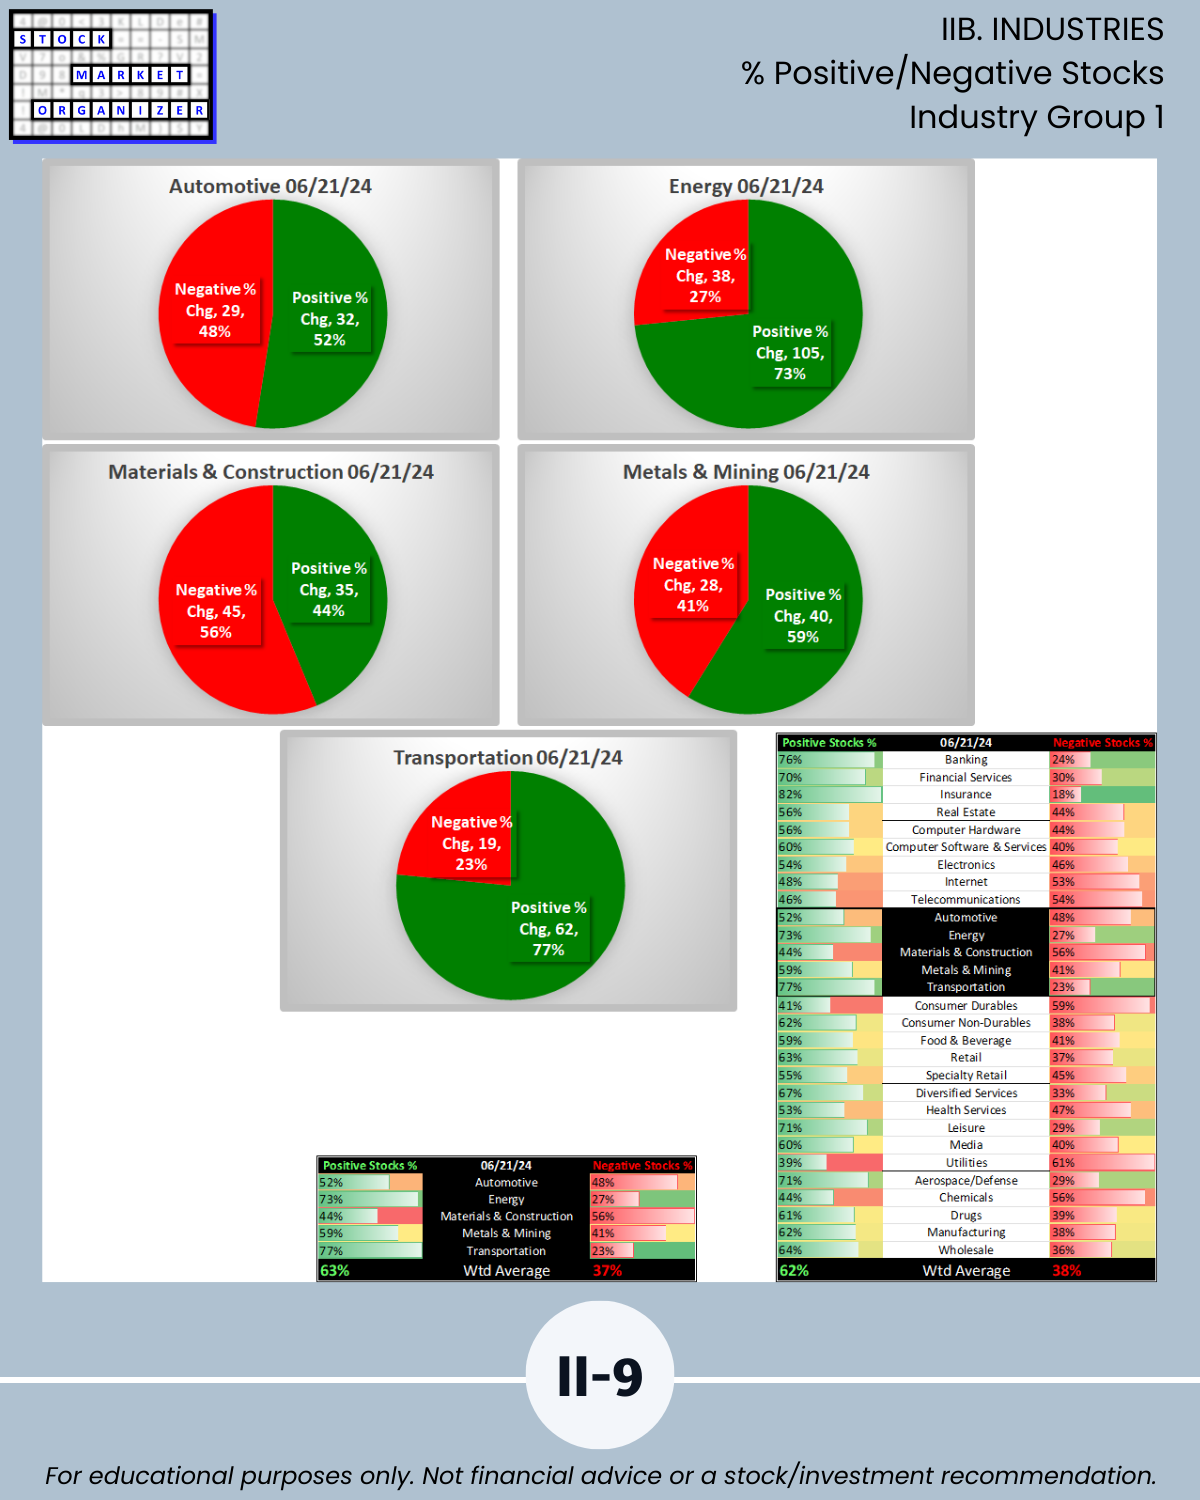
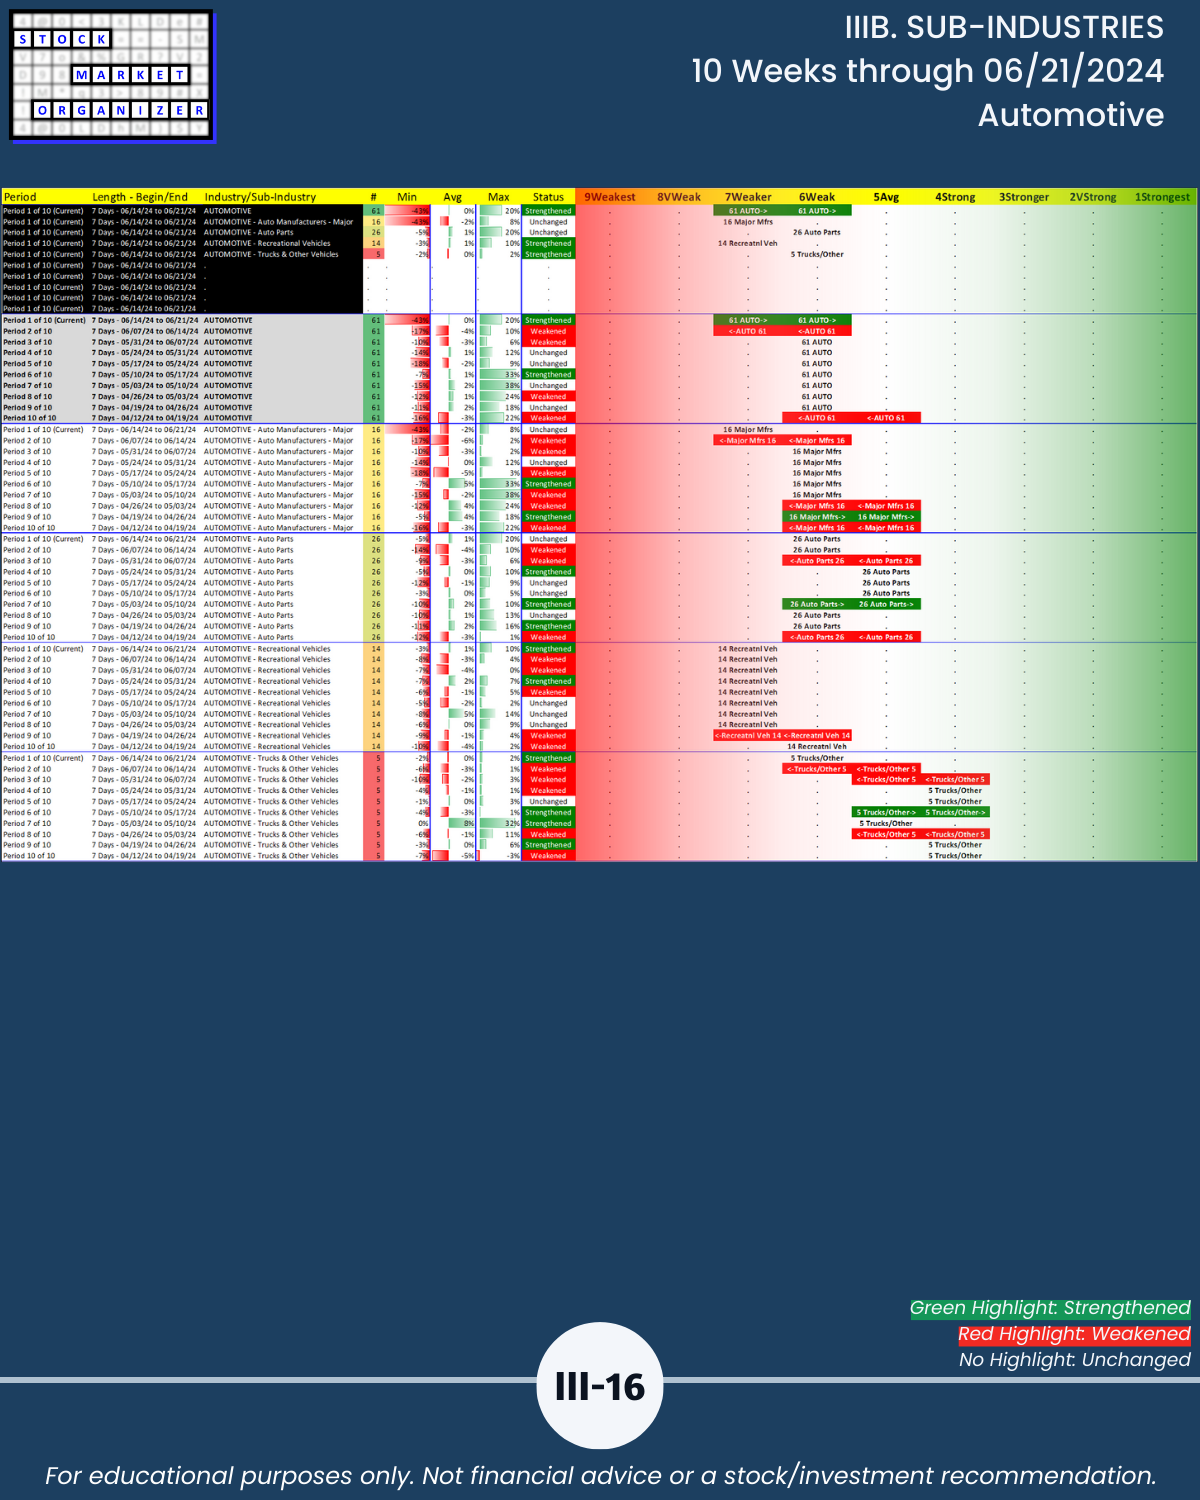
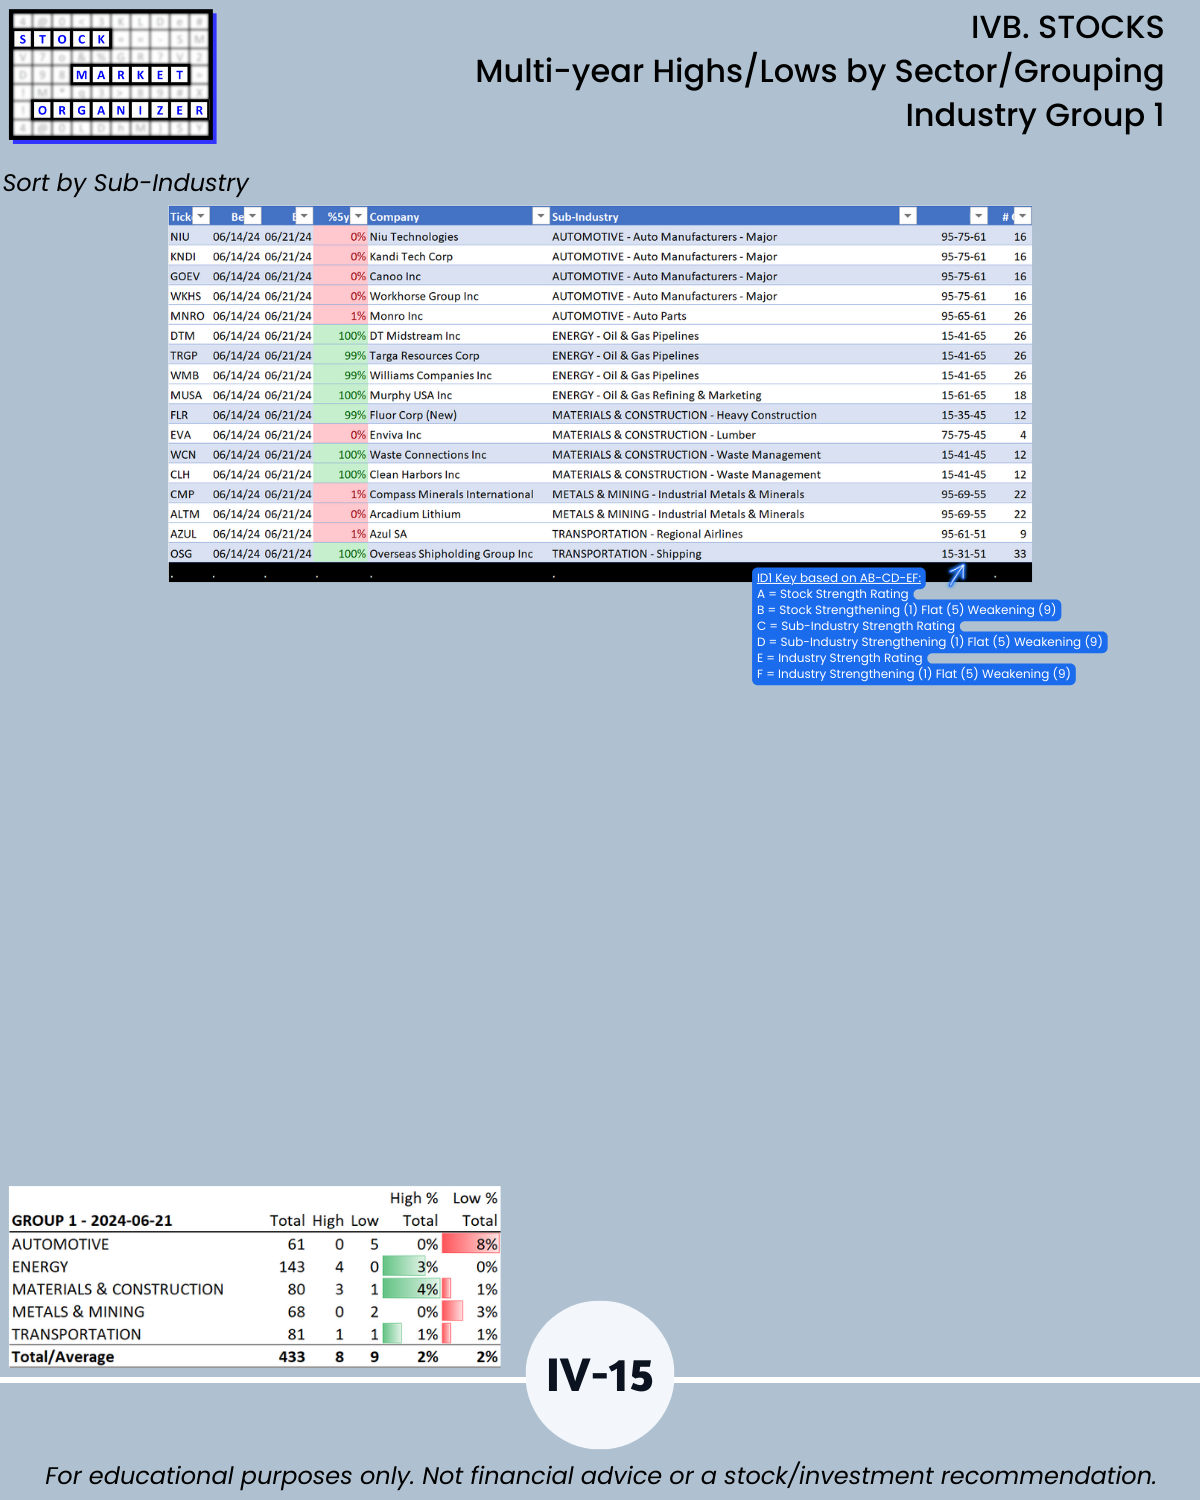
- Industry Group 1 (Automotive, Energy, Materials & Construction, Metals & Mining, Transportation)
Leading Sub-industries (minimum 3 stocks) with a 2Very Strong ranking:
- Computer Hardware - Data Storage Devices
- Computer Software & Services - Security Software & Services
Lagging Sub-industries (minimum 3 stocks) with a 9Weakest ranking:
- Food & Beverage - Confectioners
- Wholesale - Auto Parts
- Wholesale - Medical Equipment
More in the market, sector, industry, sub-industry, and stock analysis below.
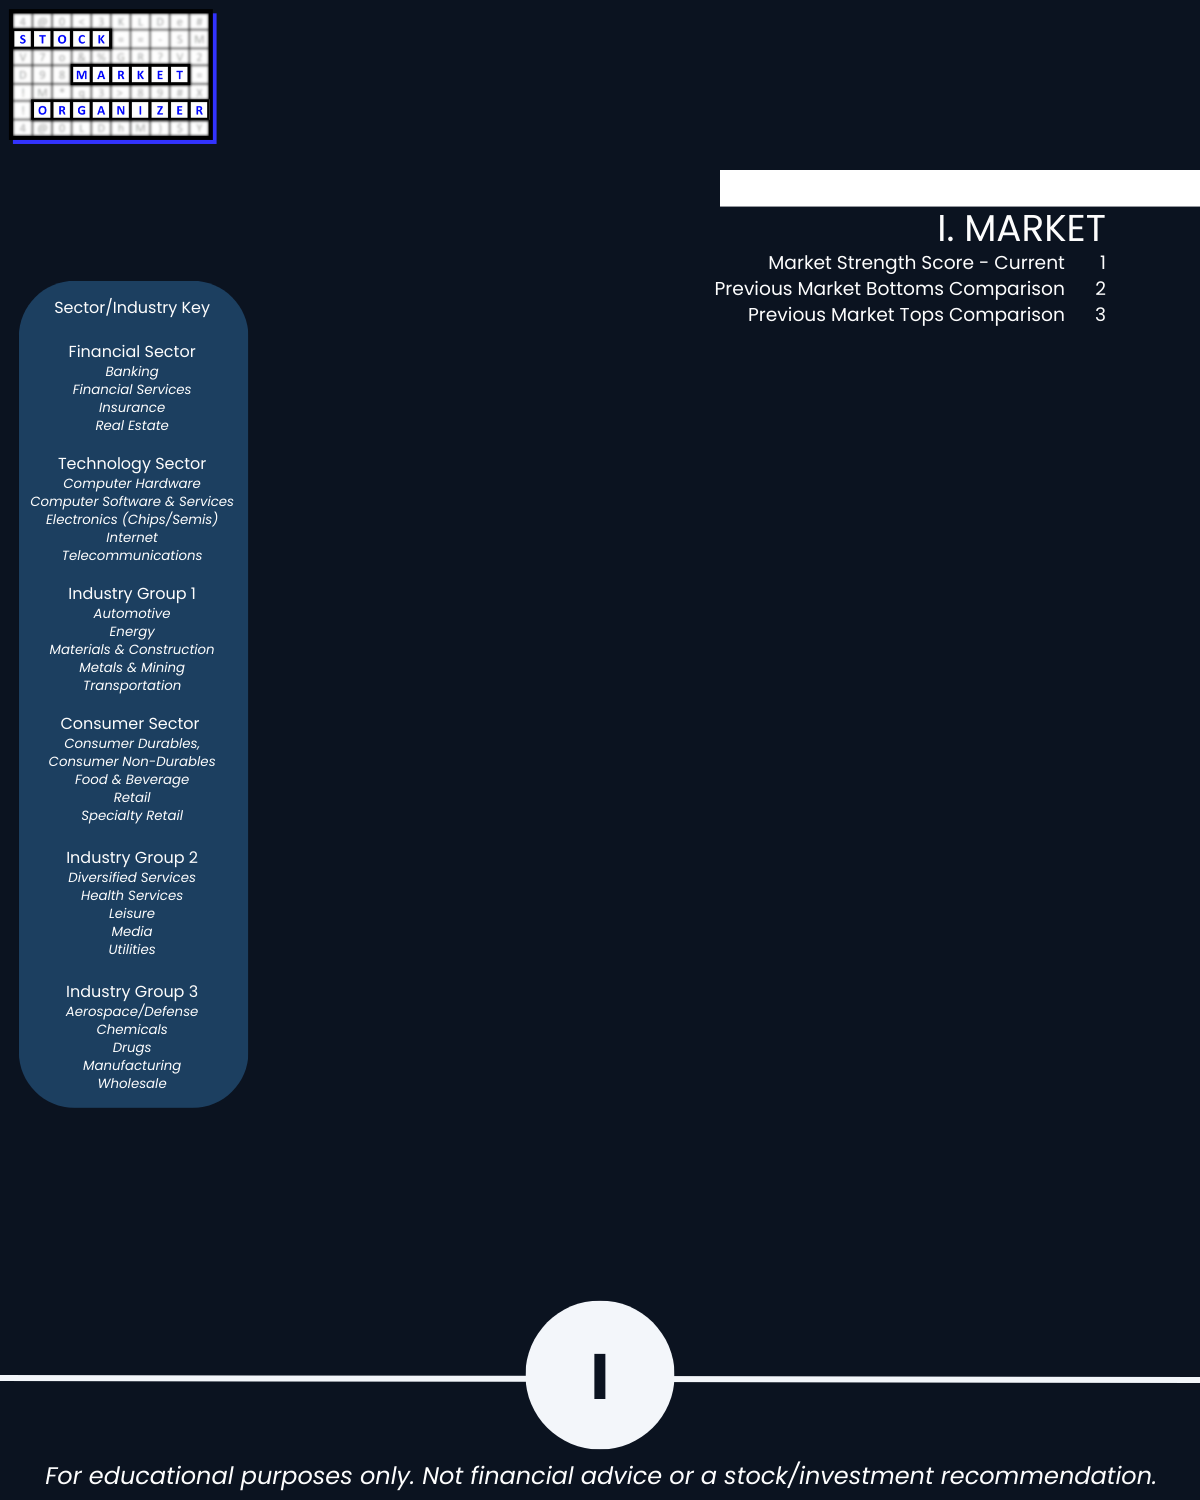
I. MARKET Prologue Critical Concepts/Market Strength Score
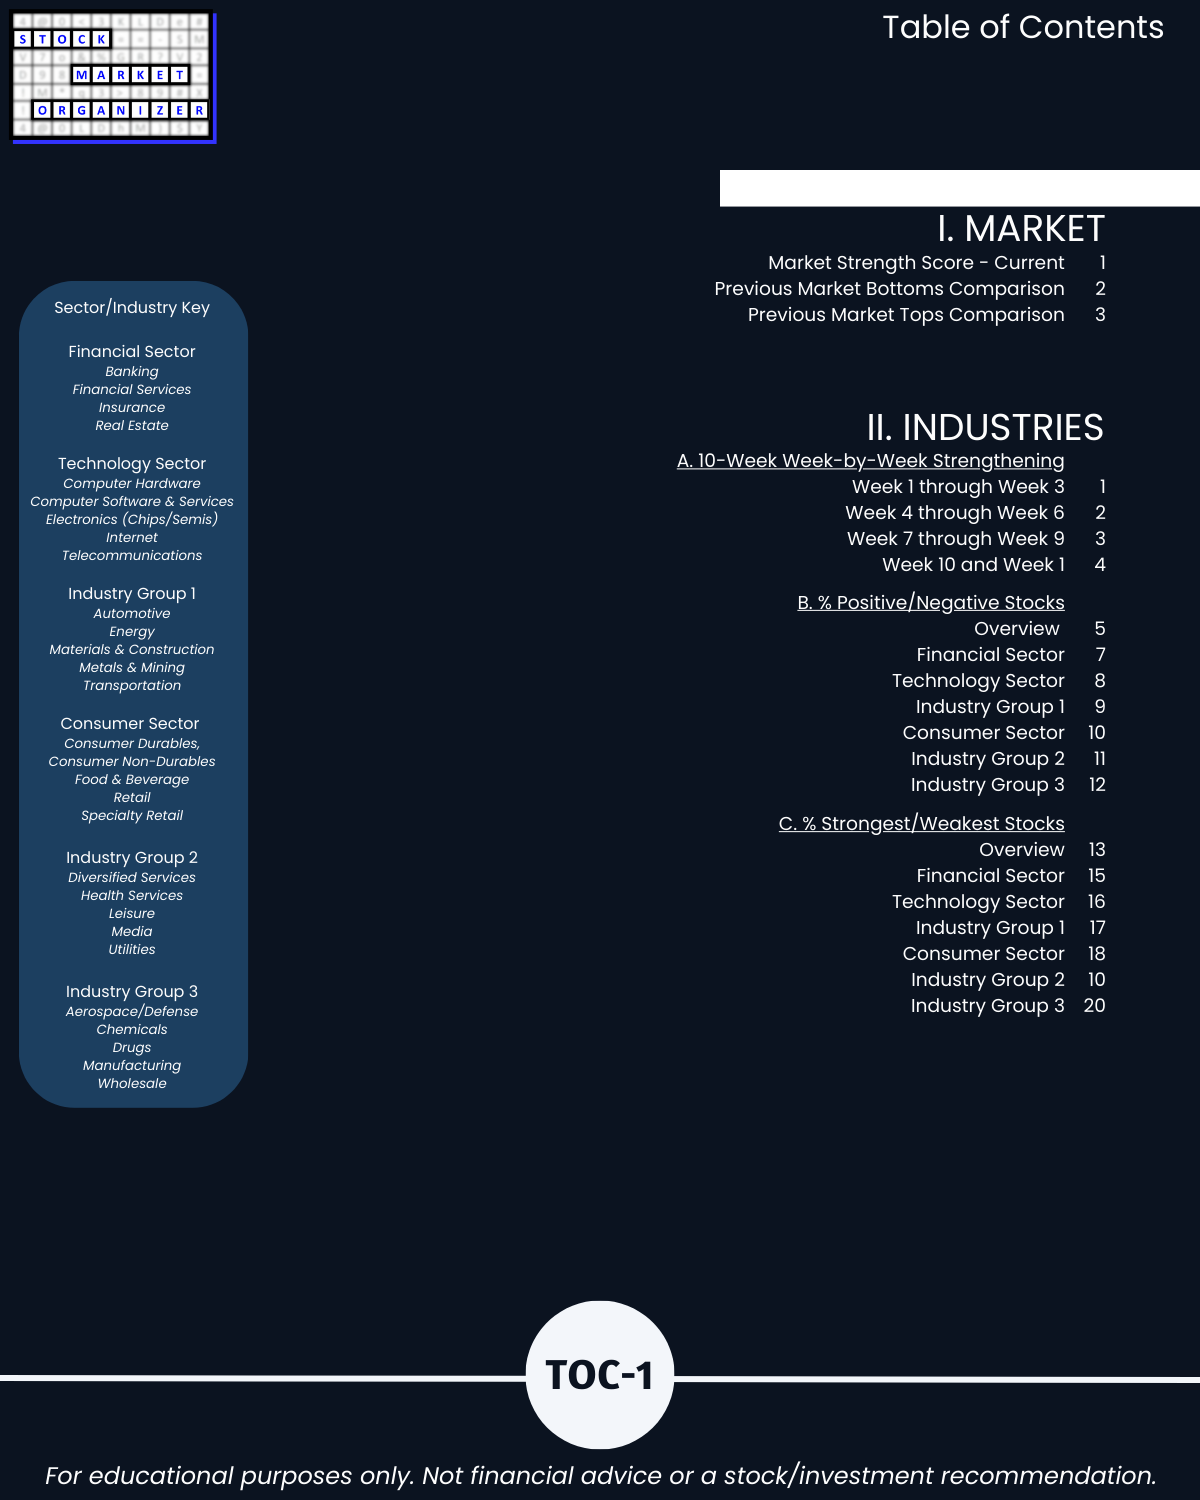
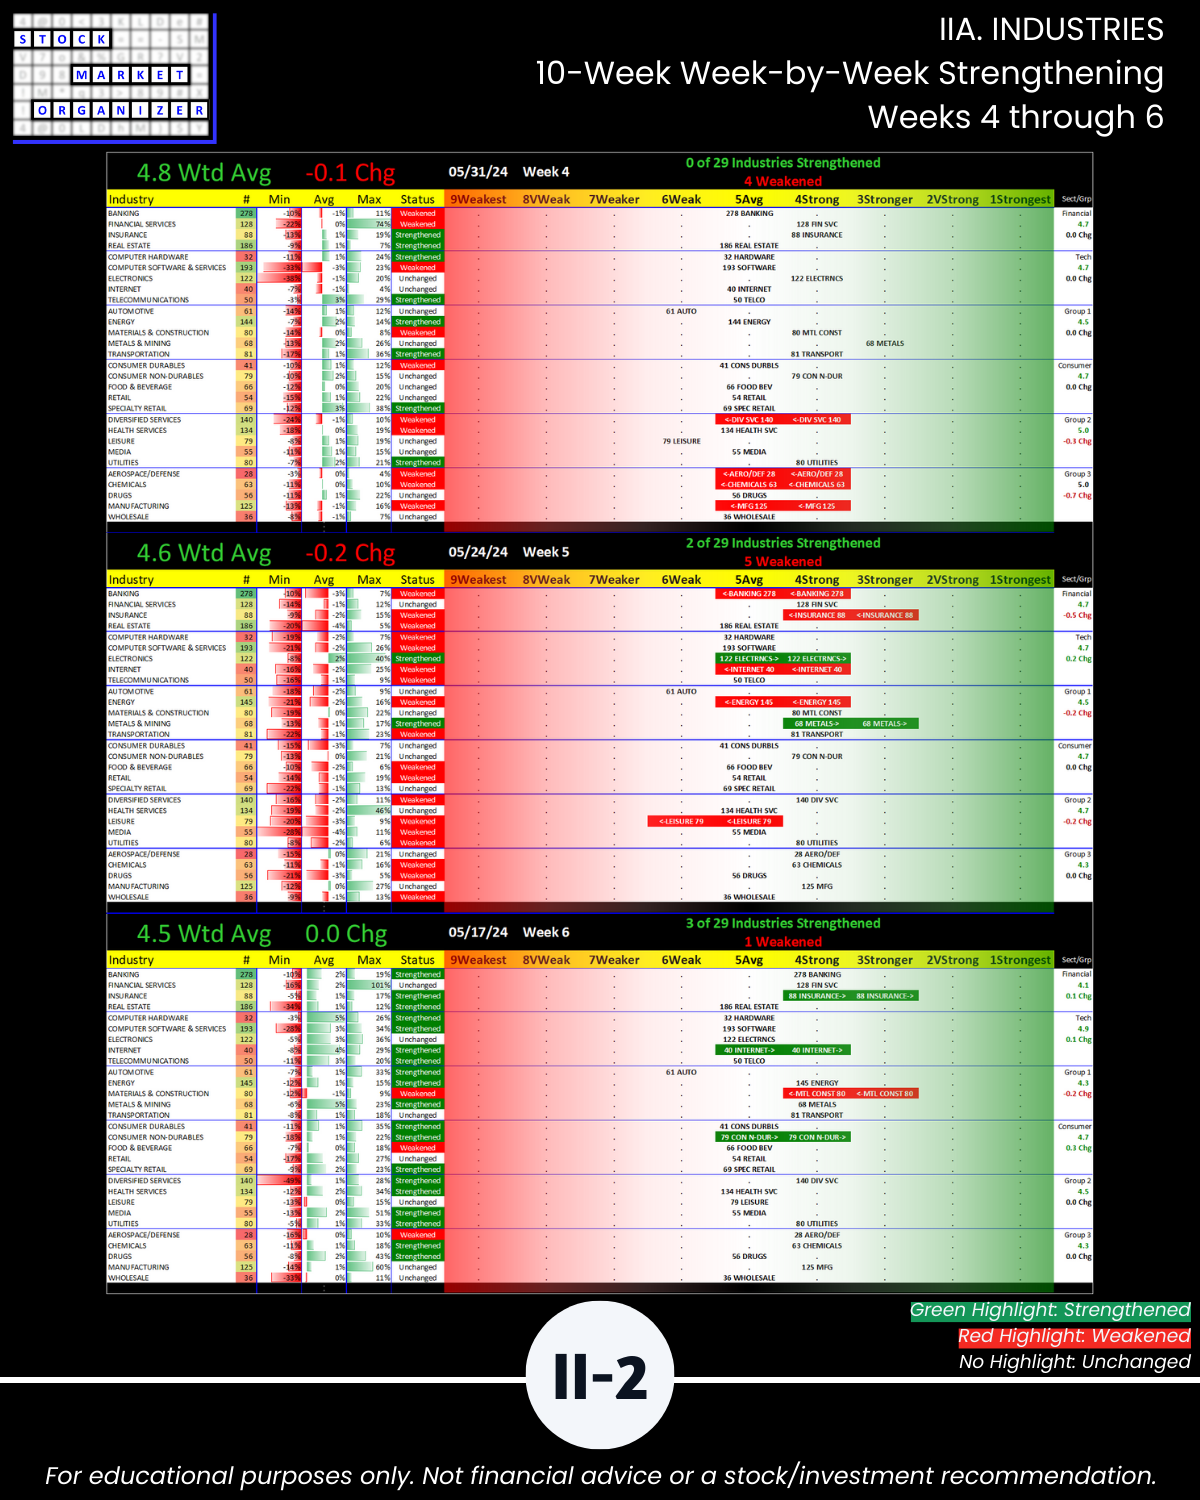
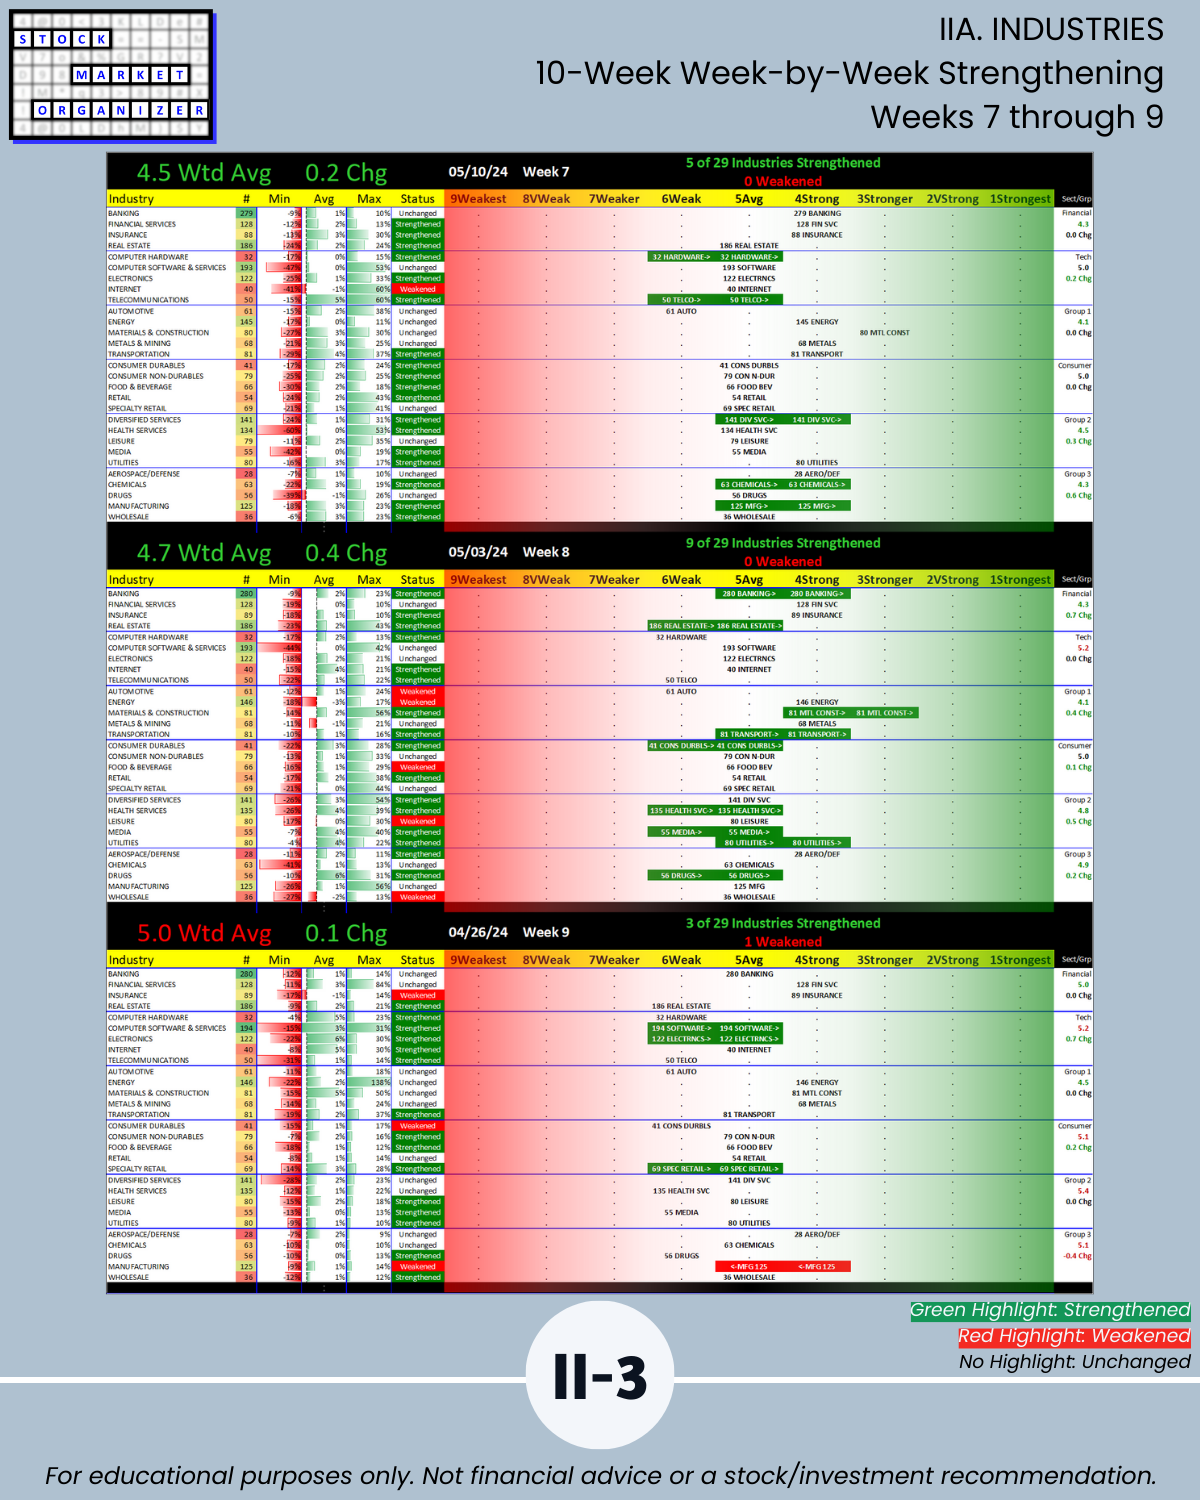
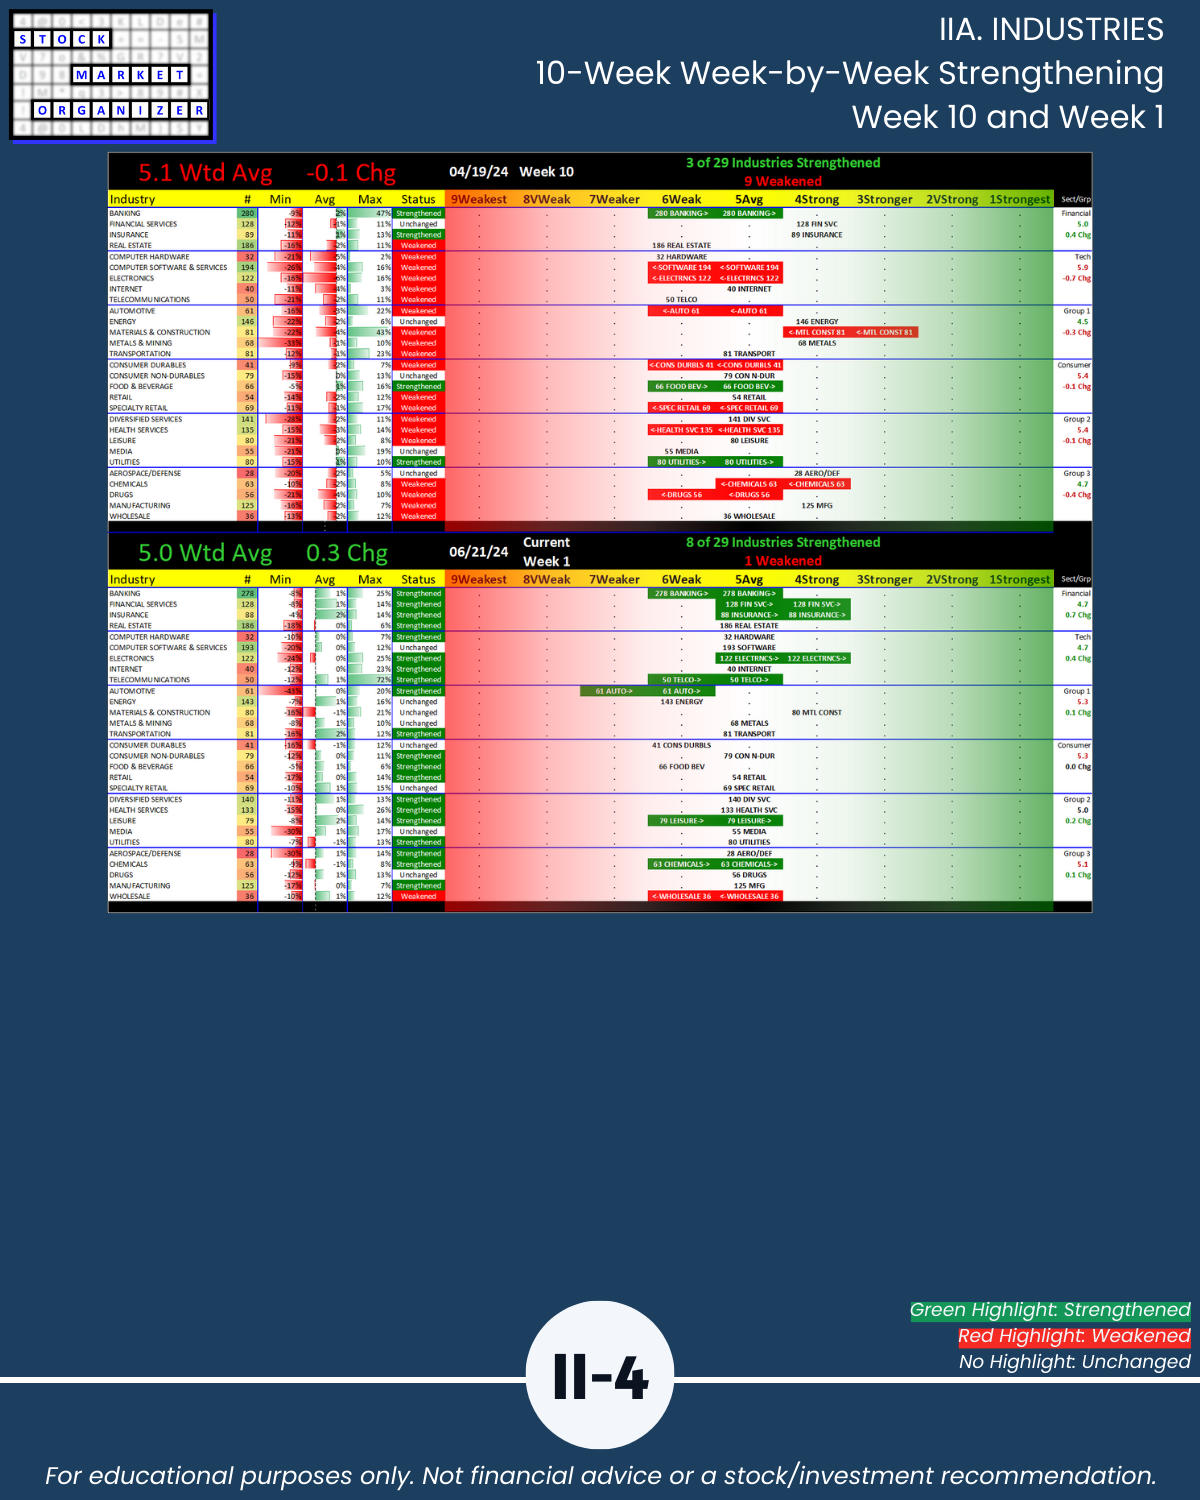
IIA. INDUSTRIES 10-Week Week-by-Week Strengthening
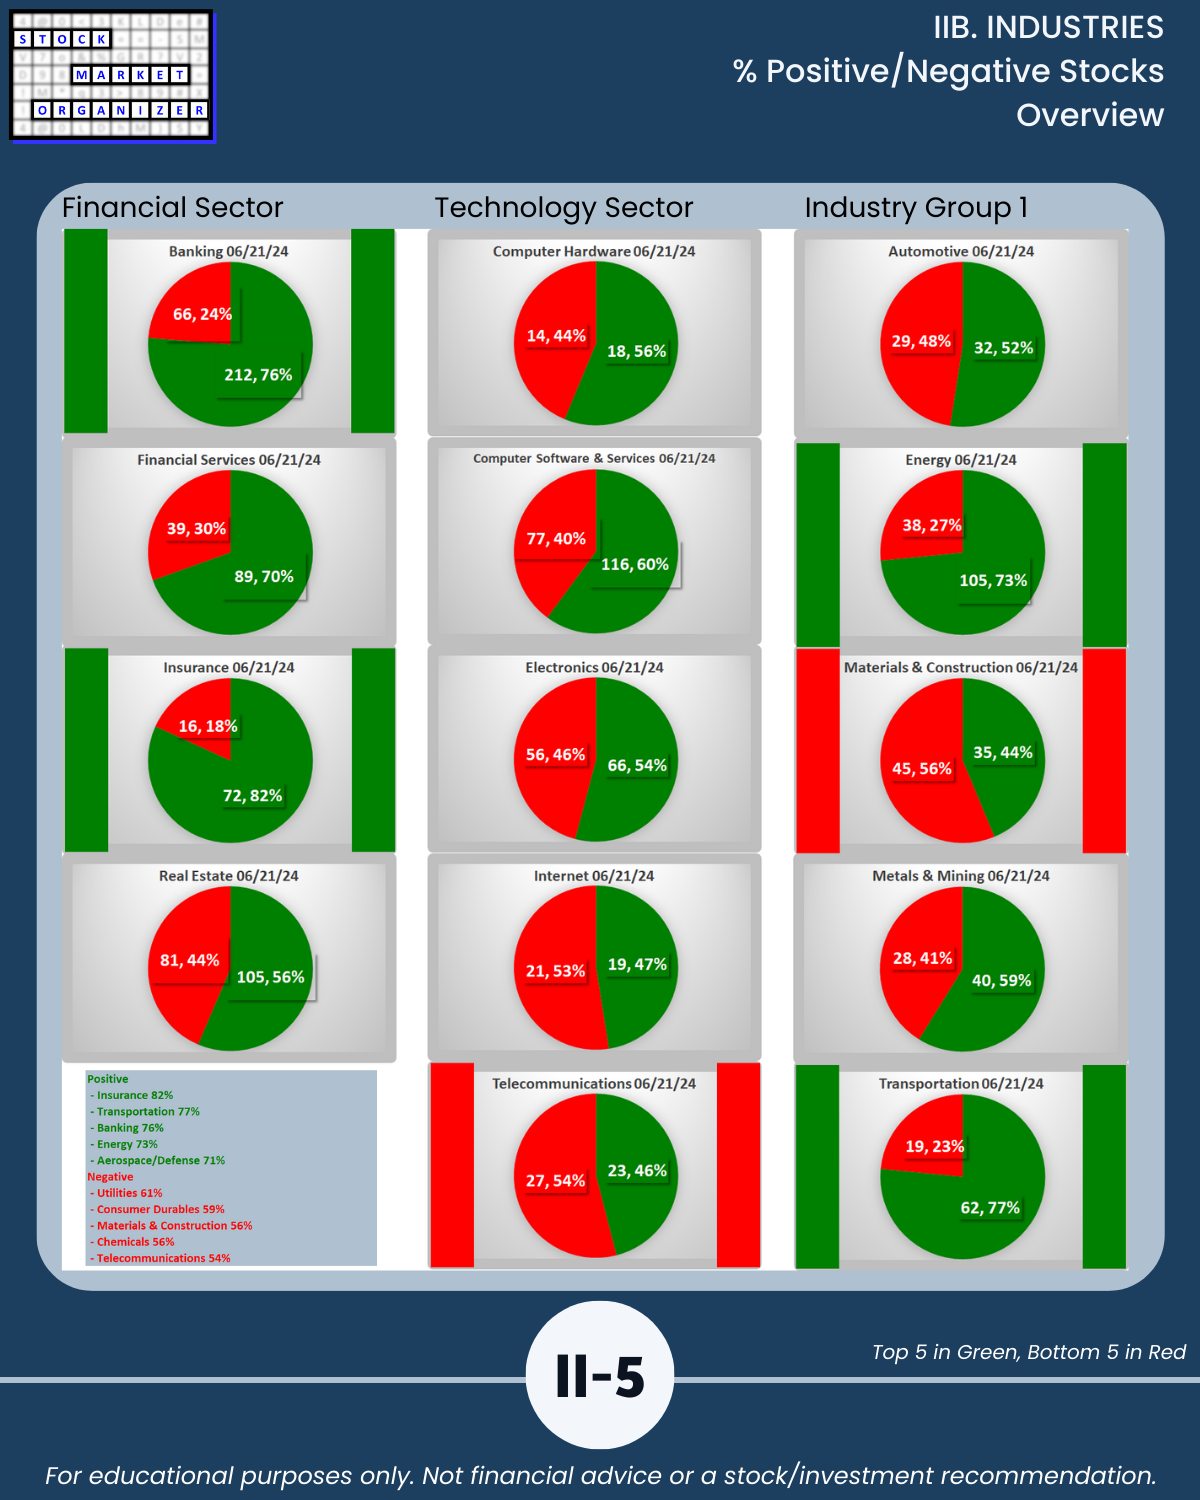
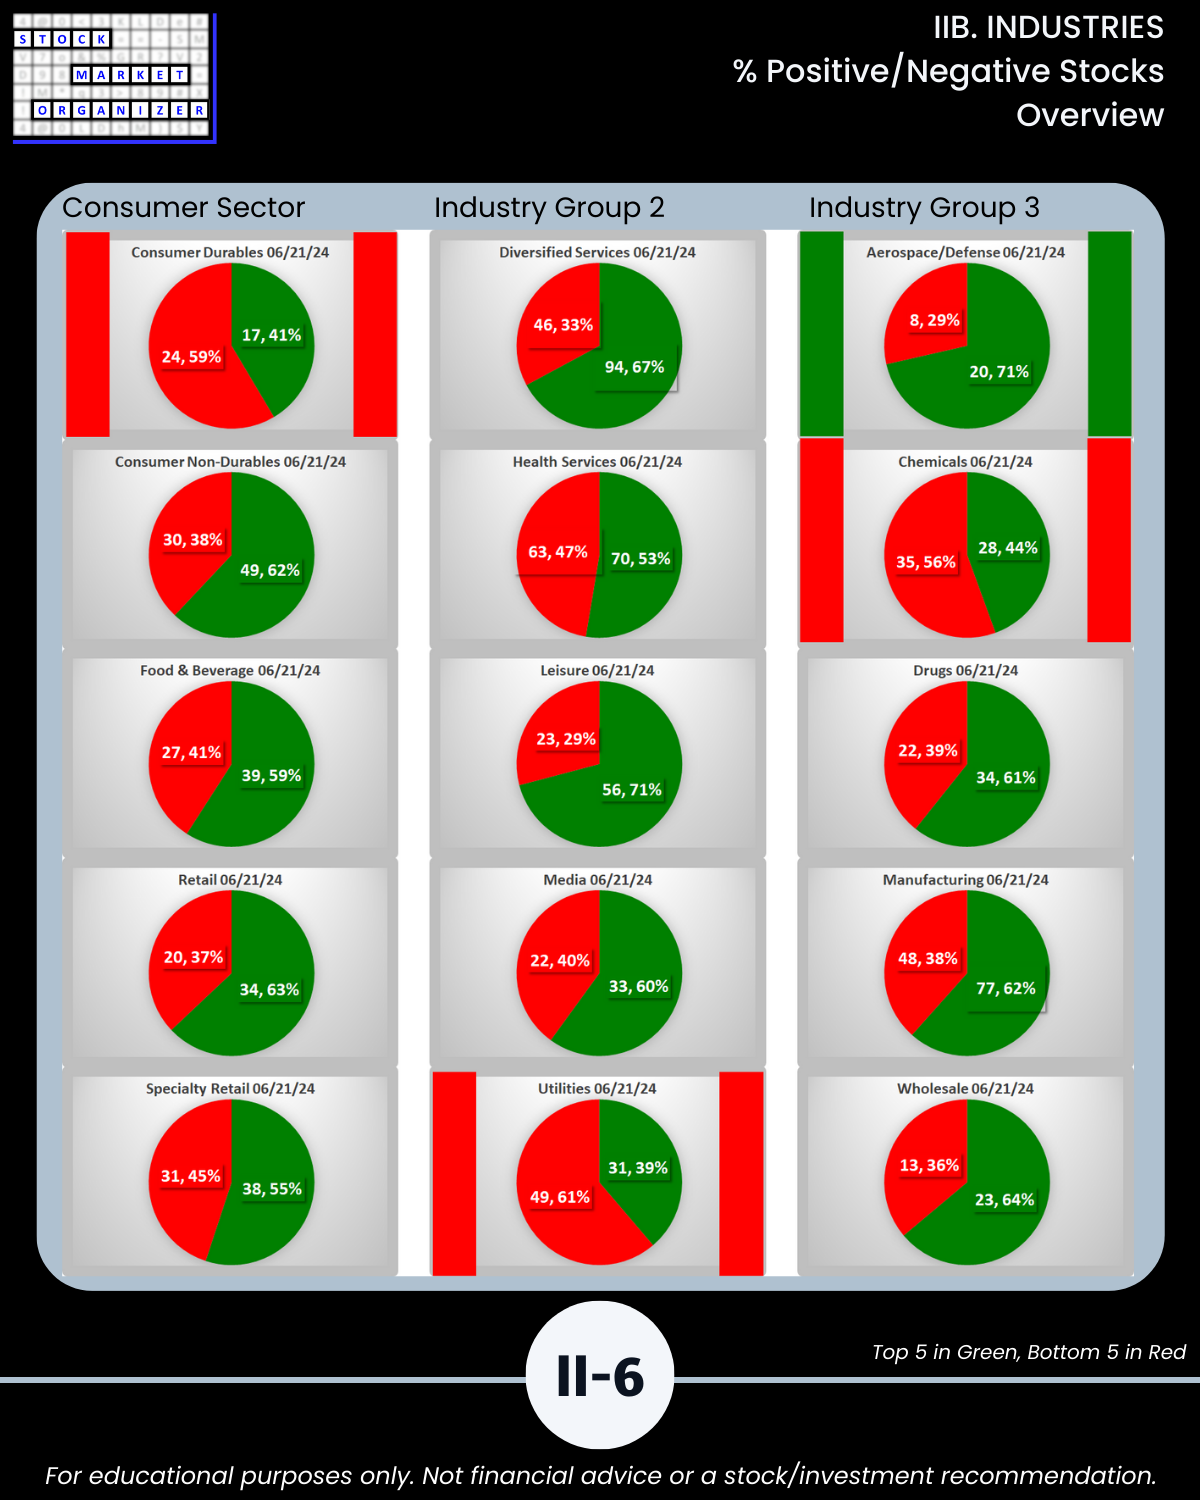
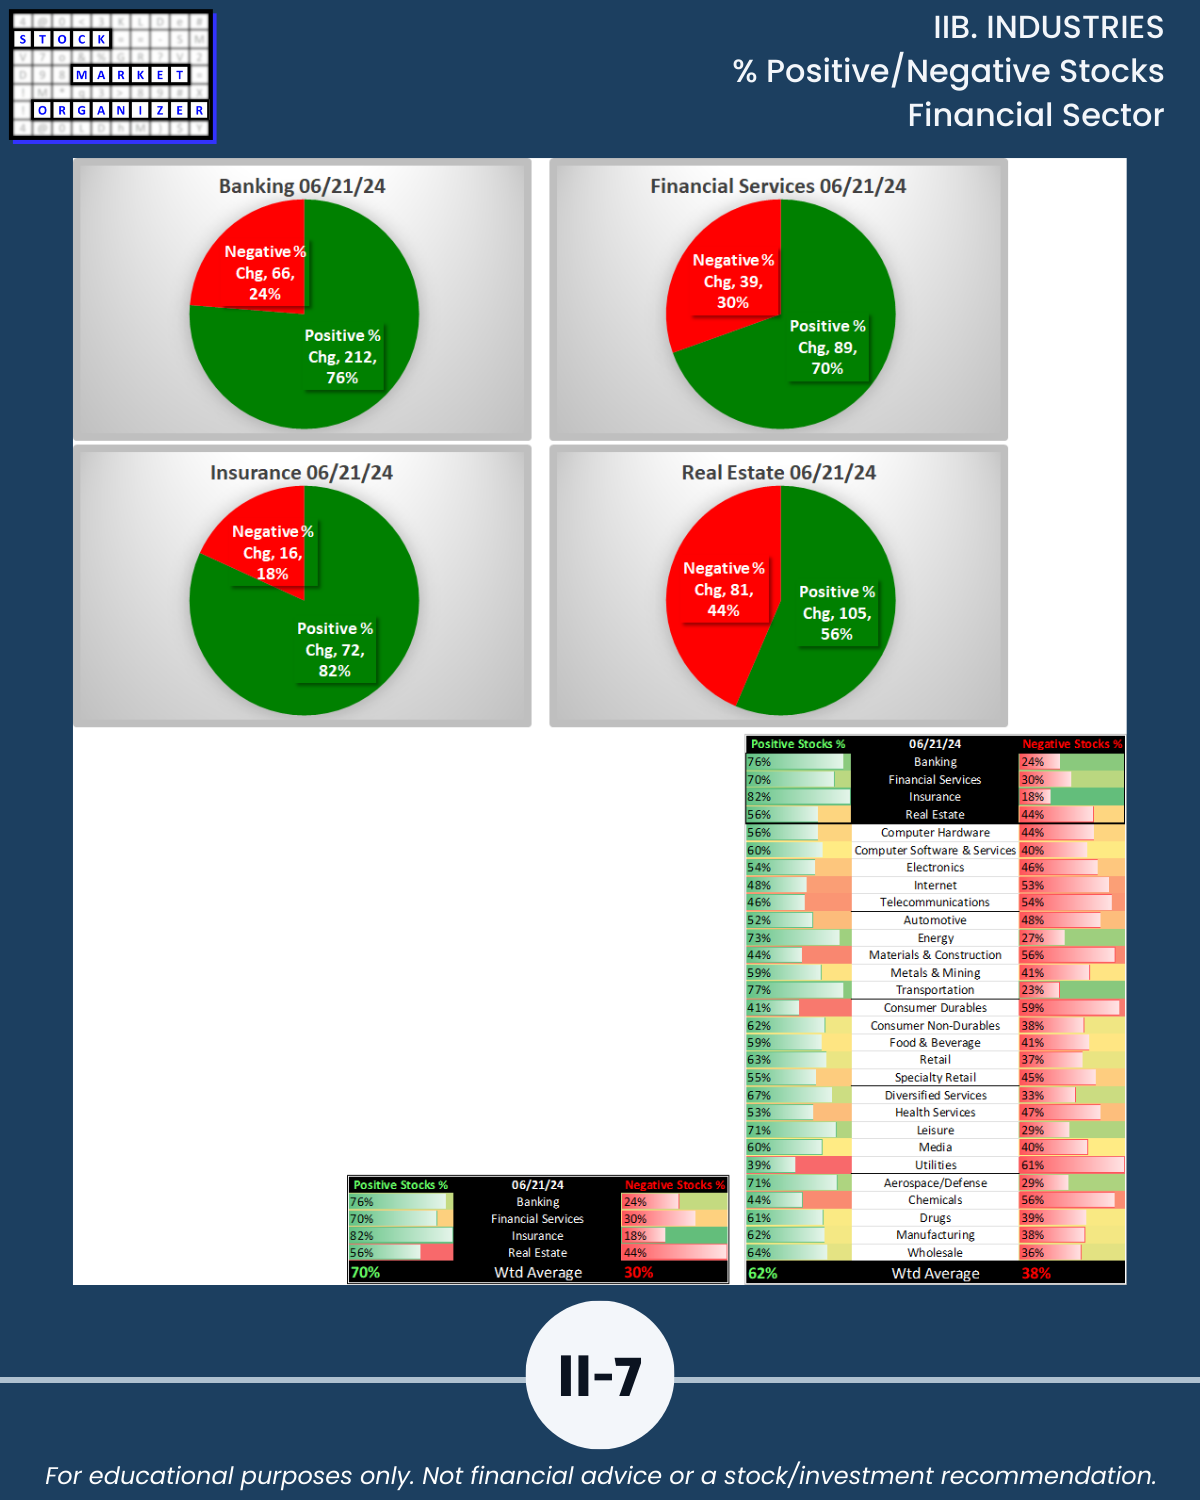
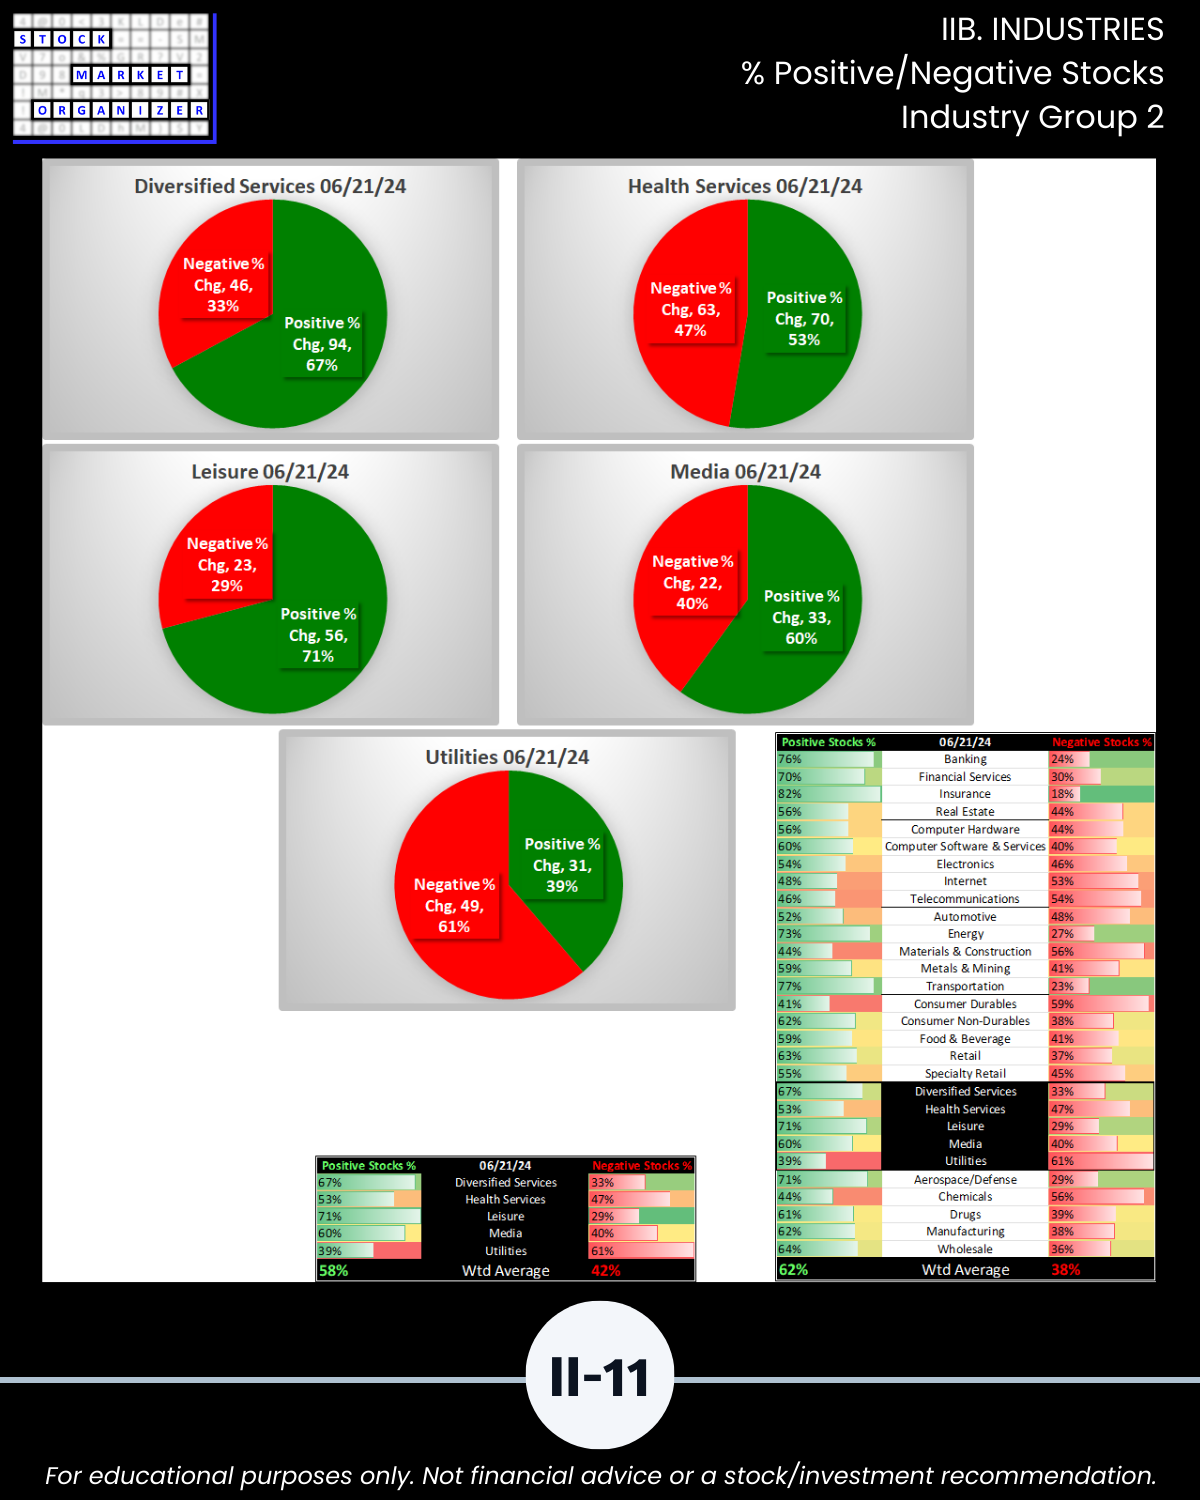
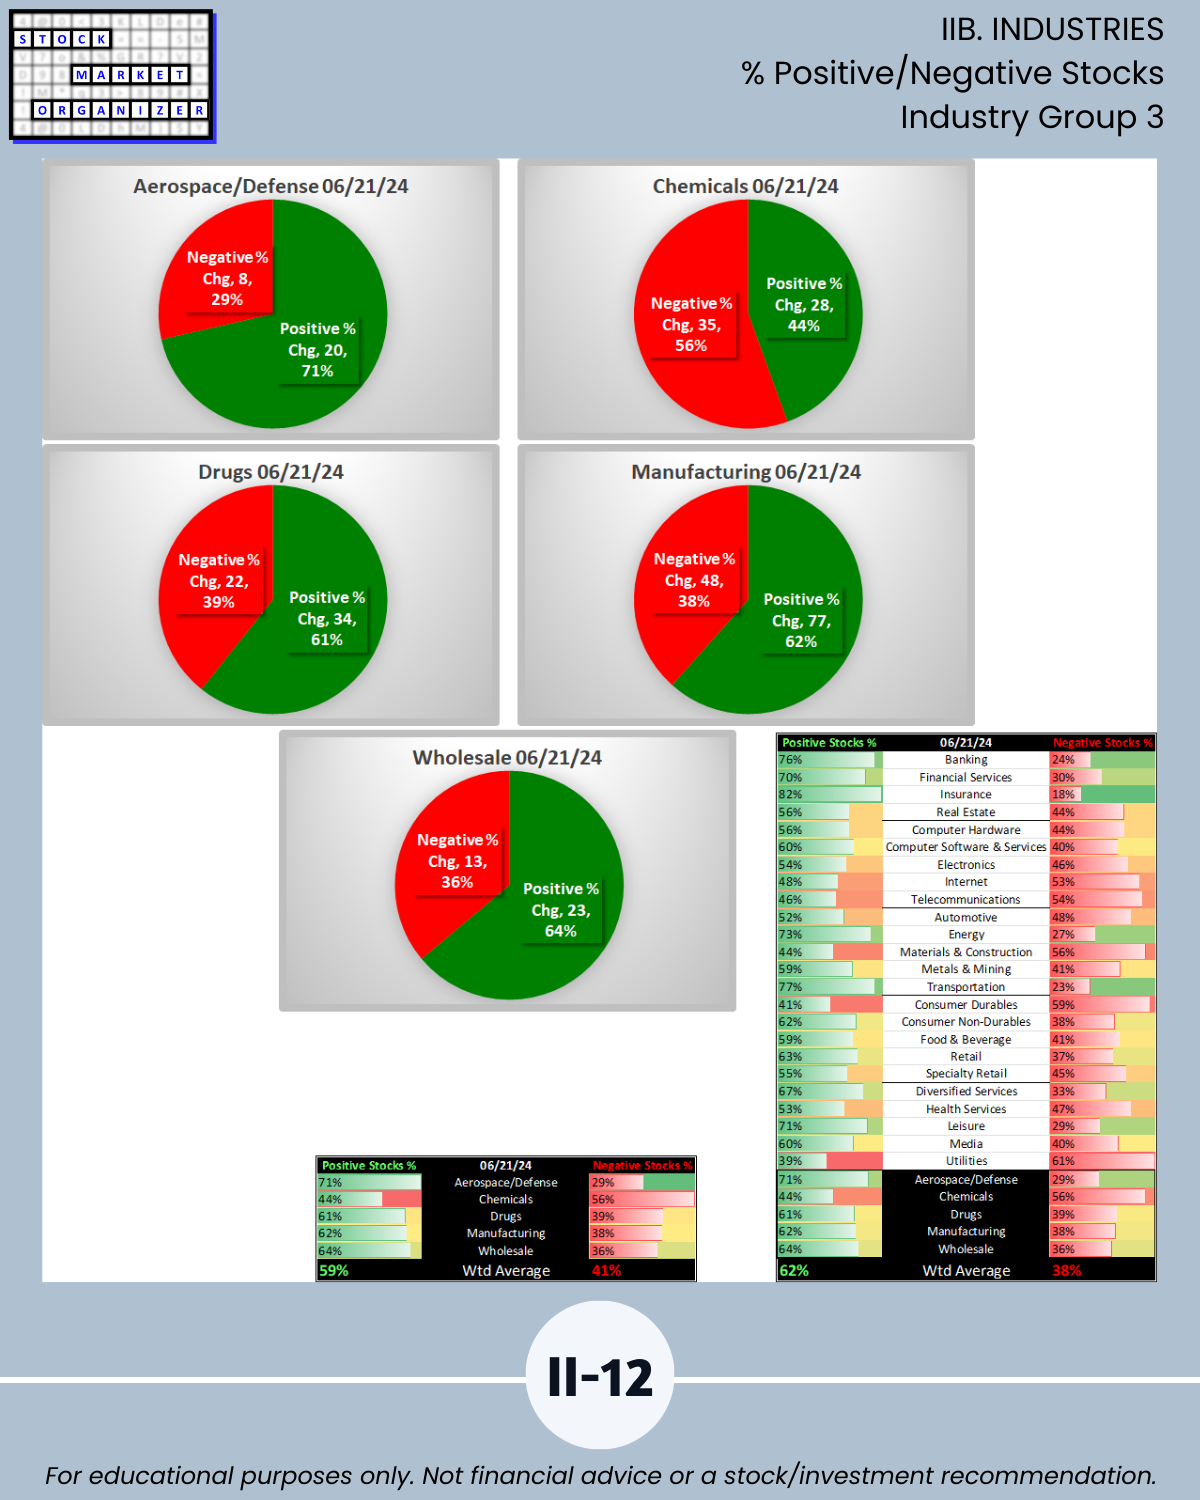
IIB. INDUSTRIES % Positive/Negative Stocks
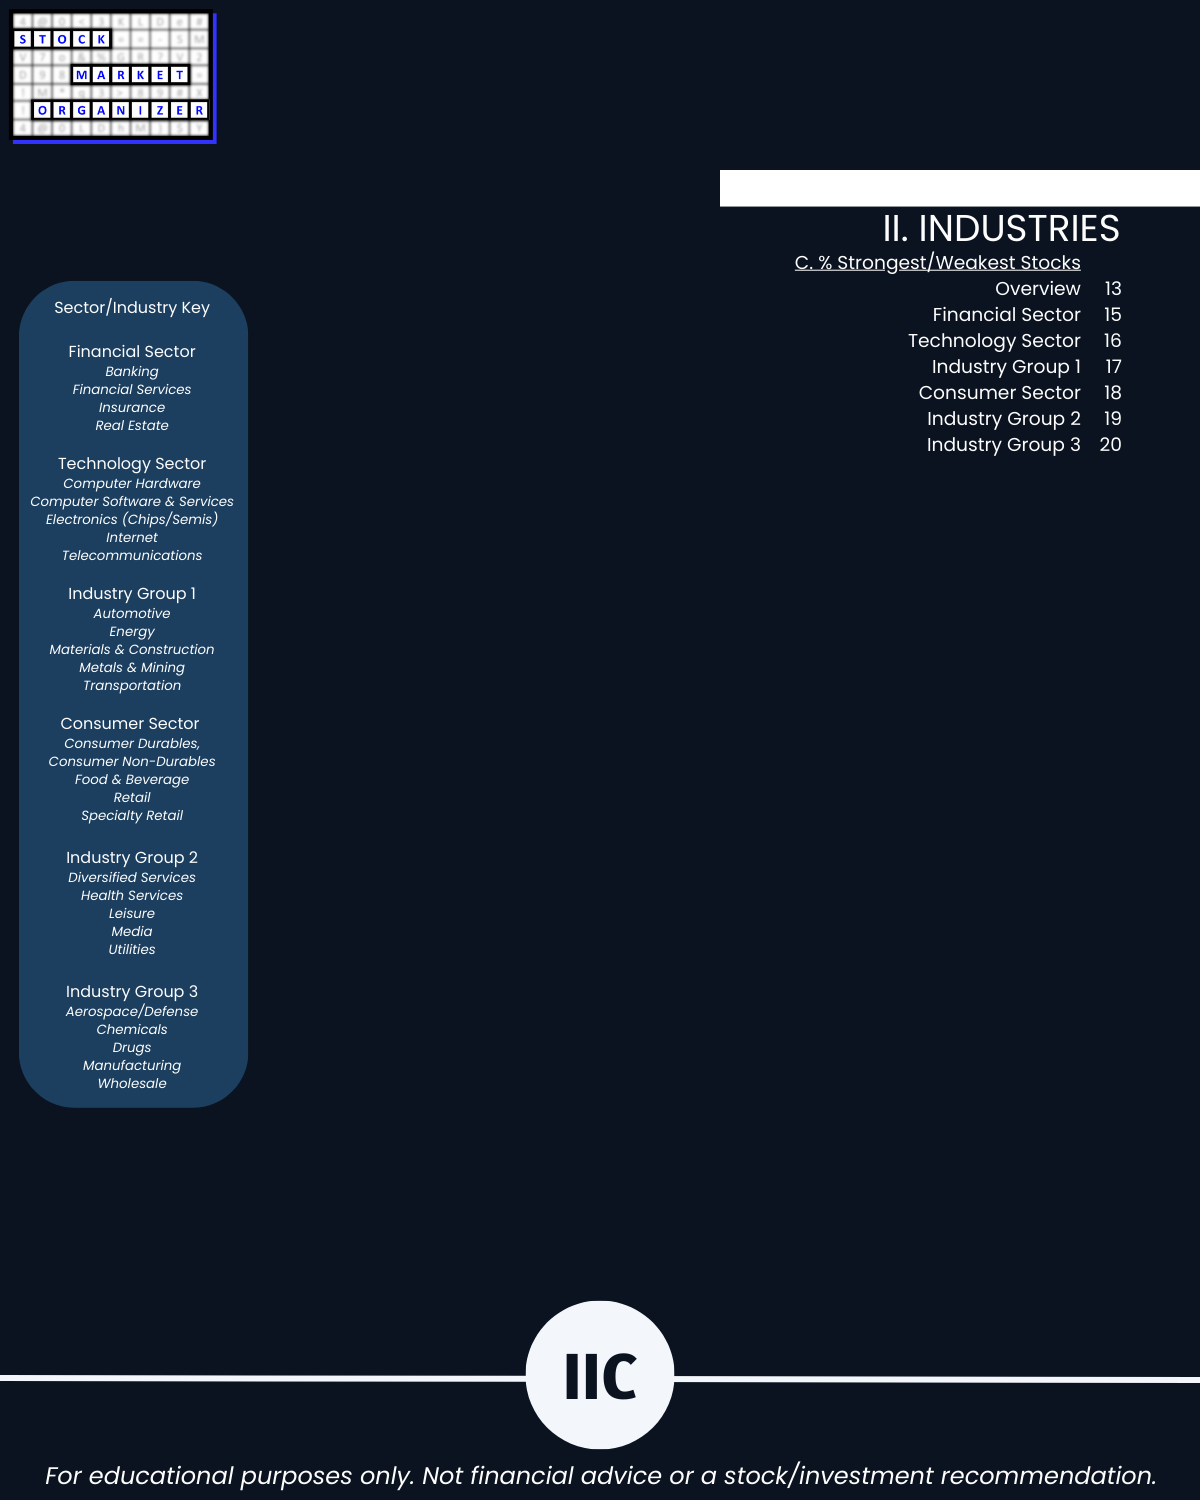
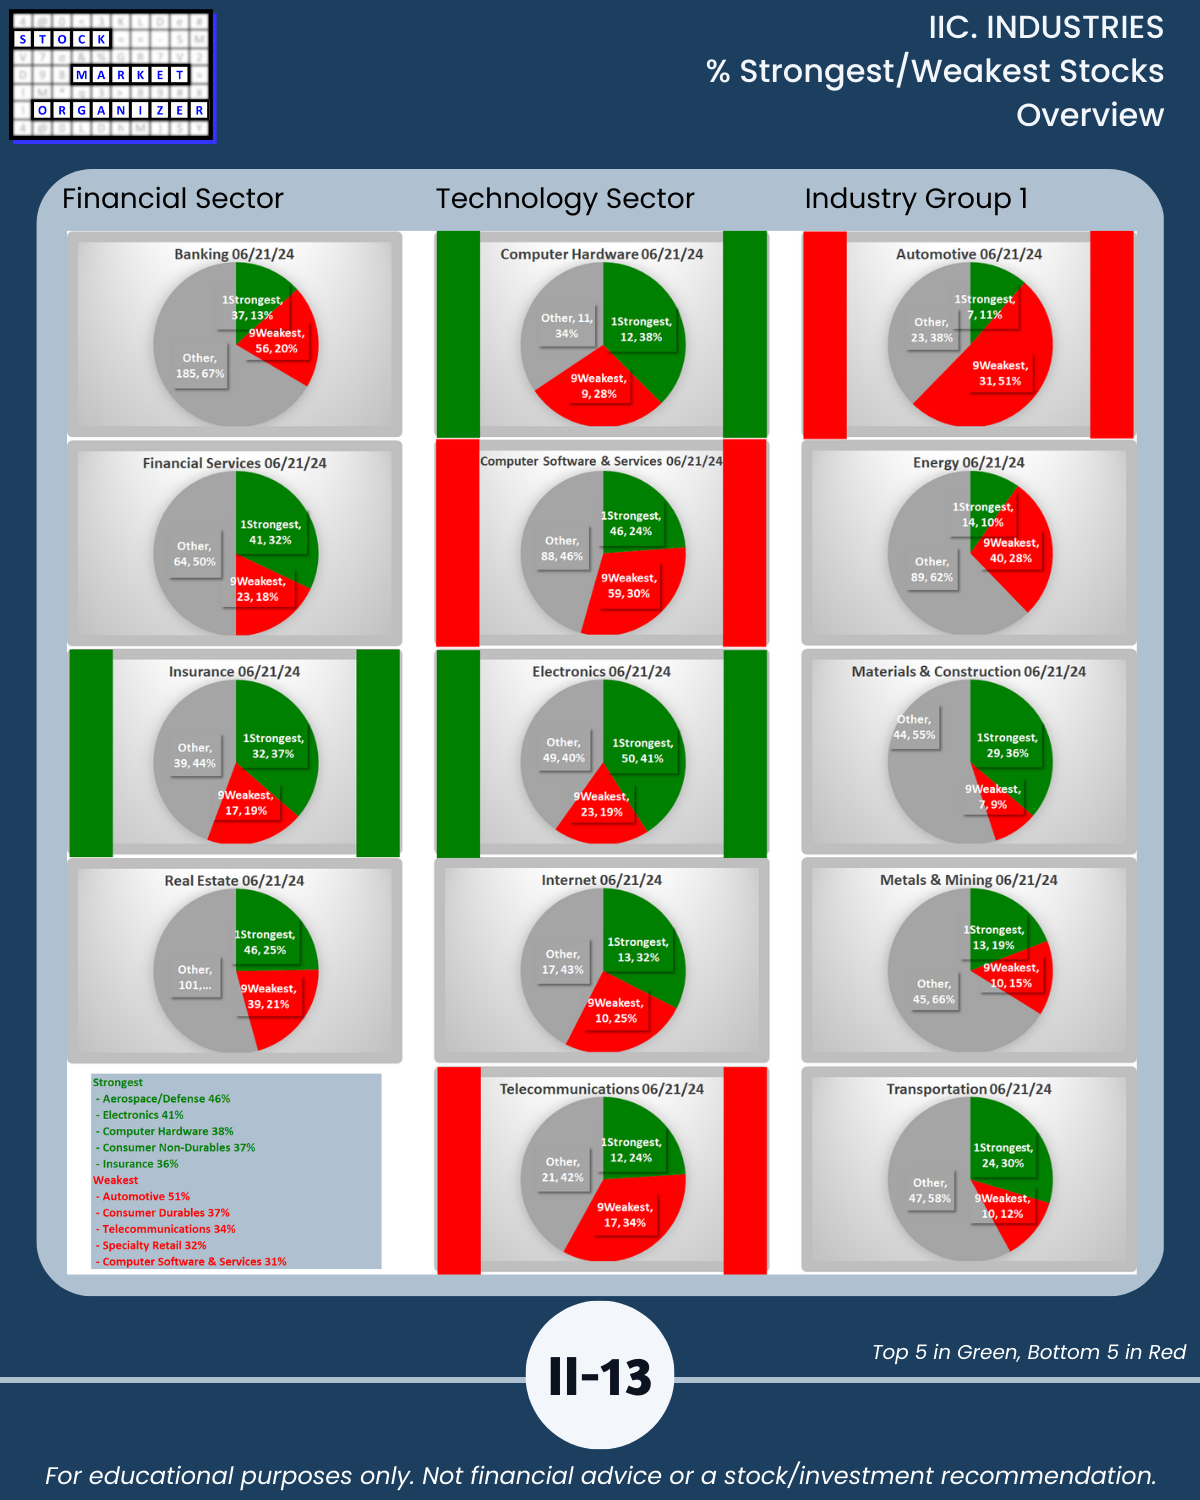
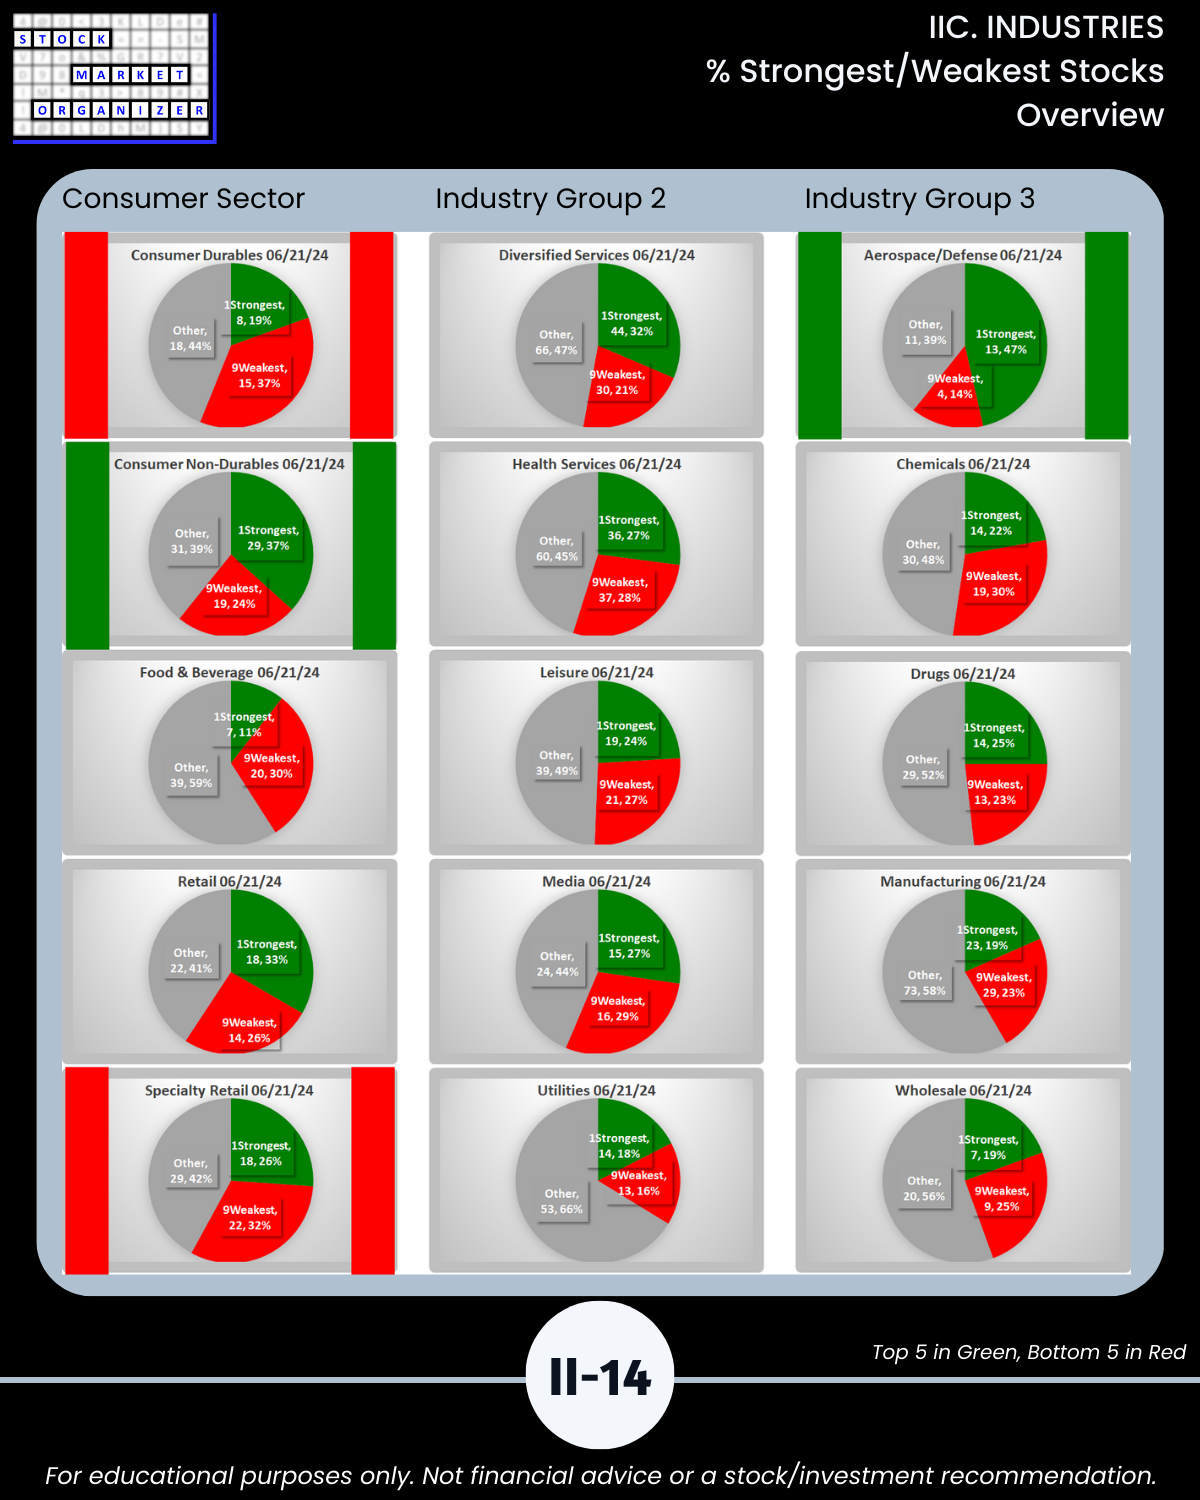
IIC. INDUSTRIES % Strongest/Weakest Stocks
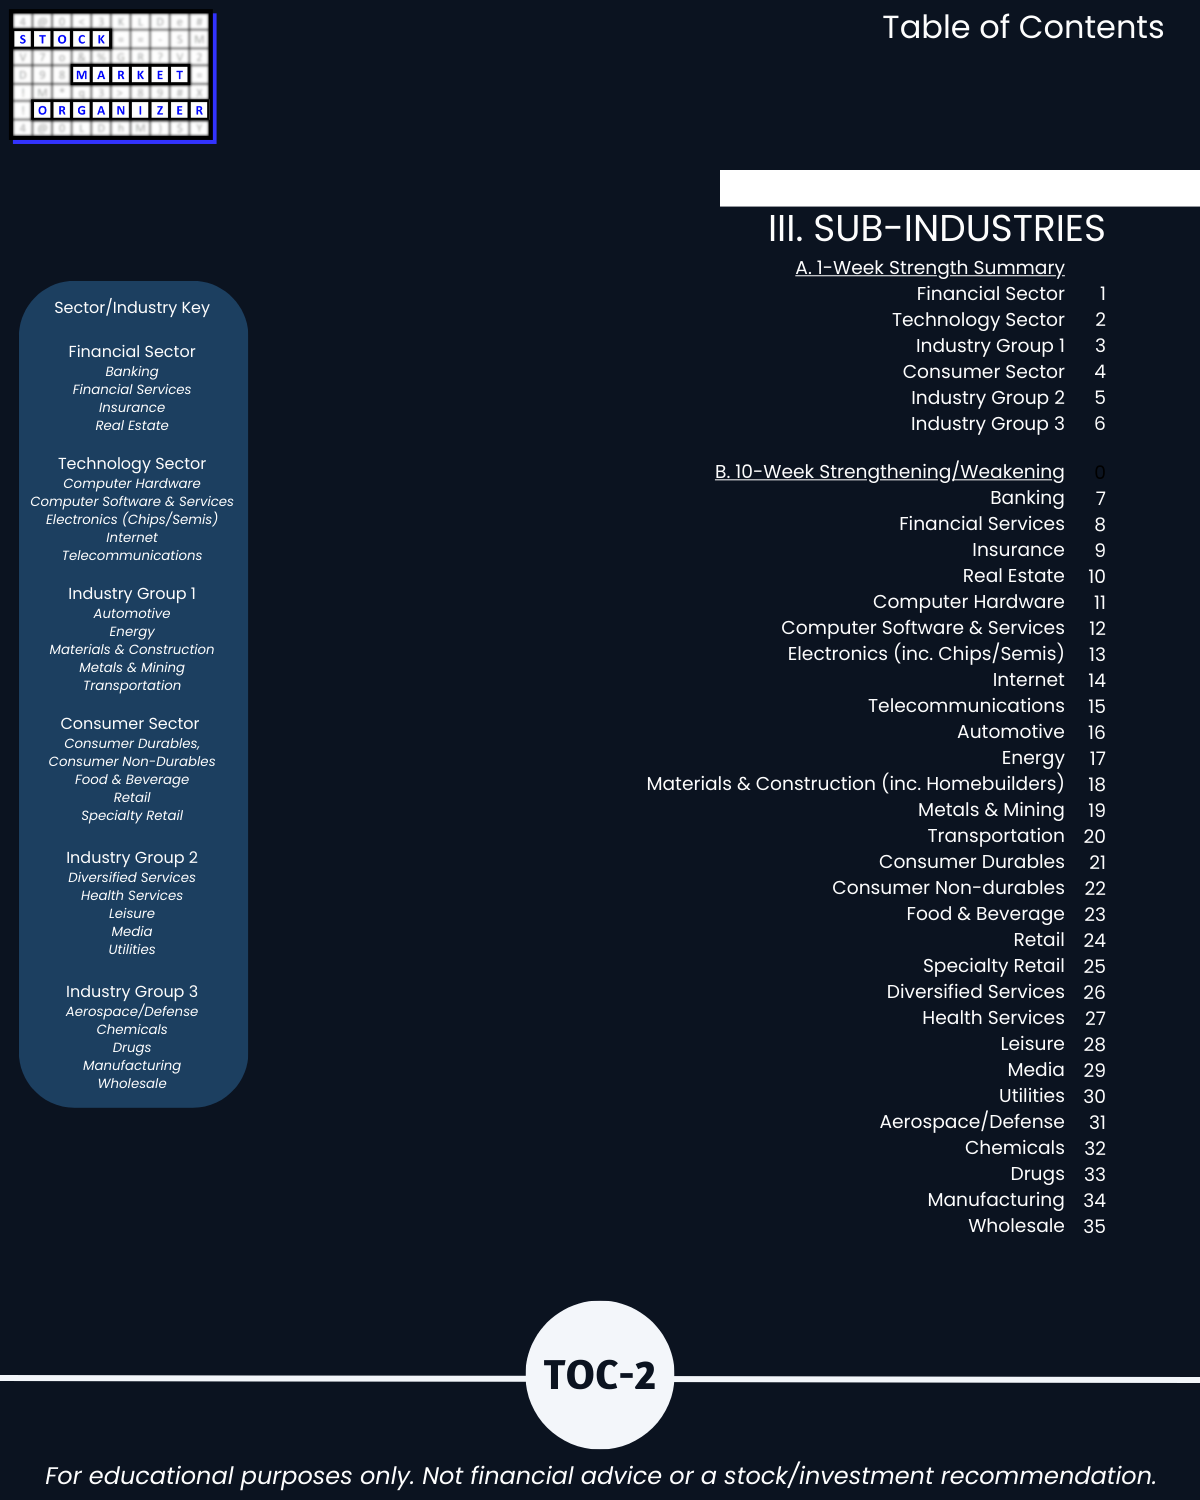
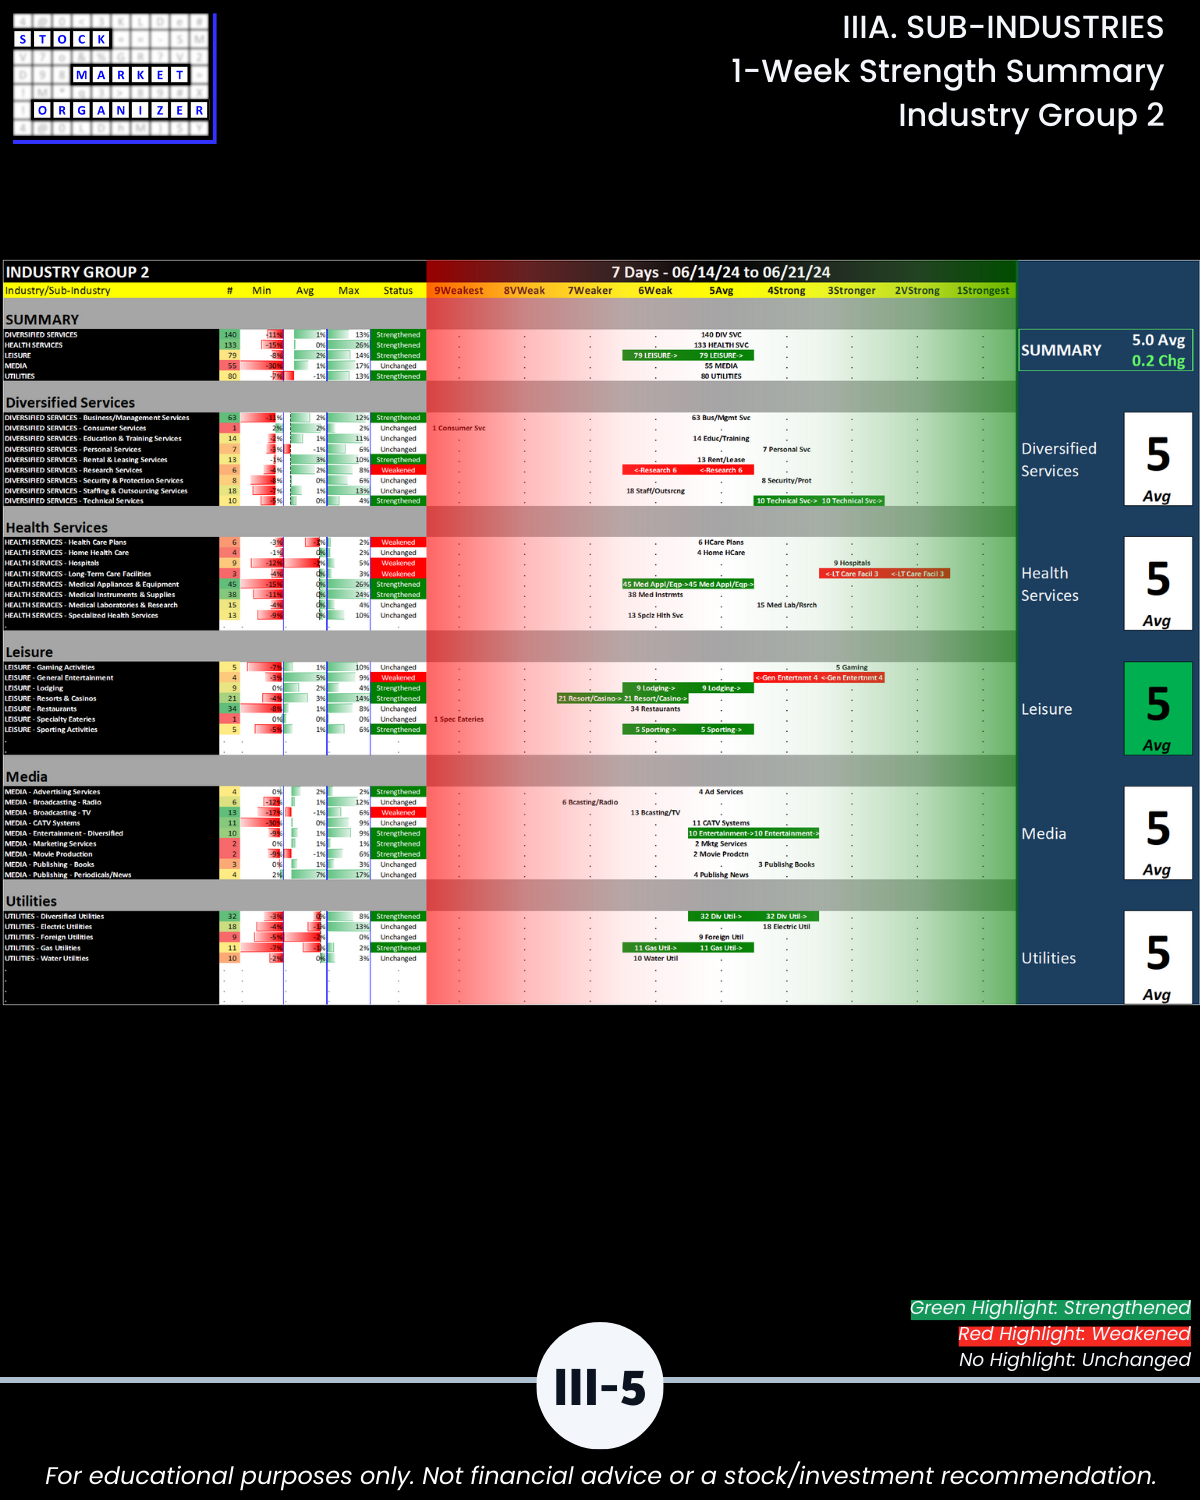
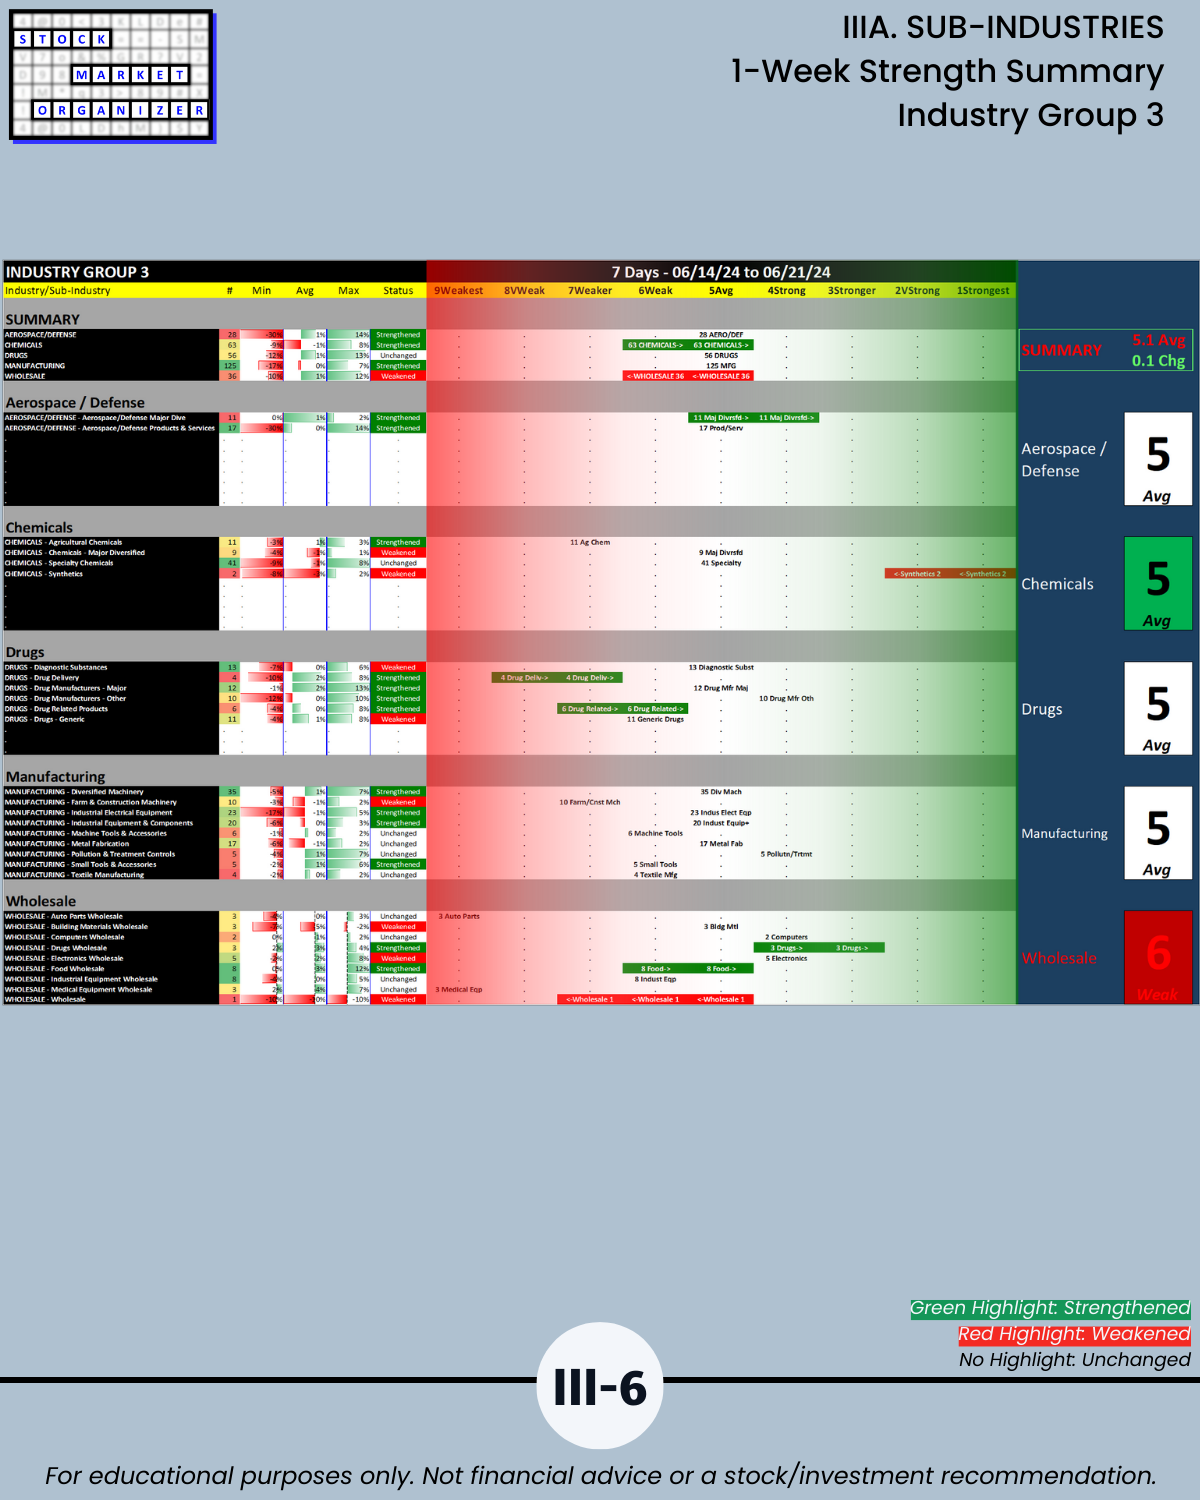
IIIA. SUB-INDUSTRIES 1-Week Strength Summary
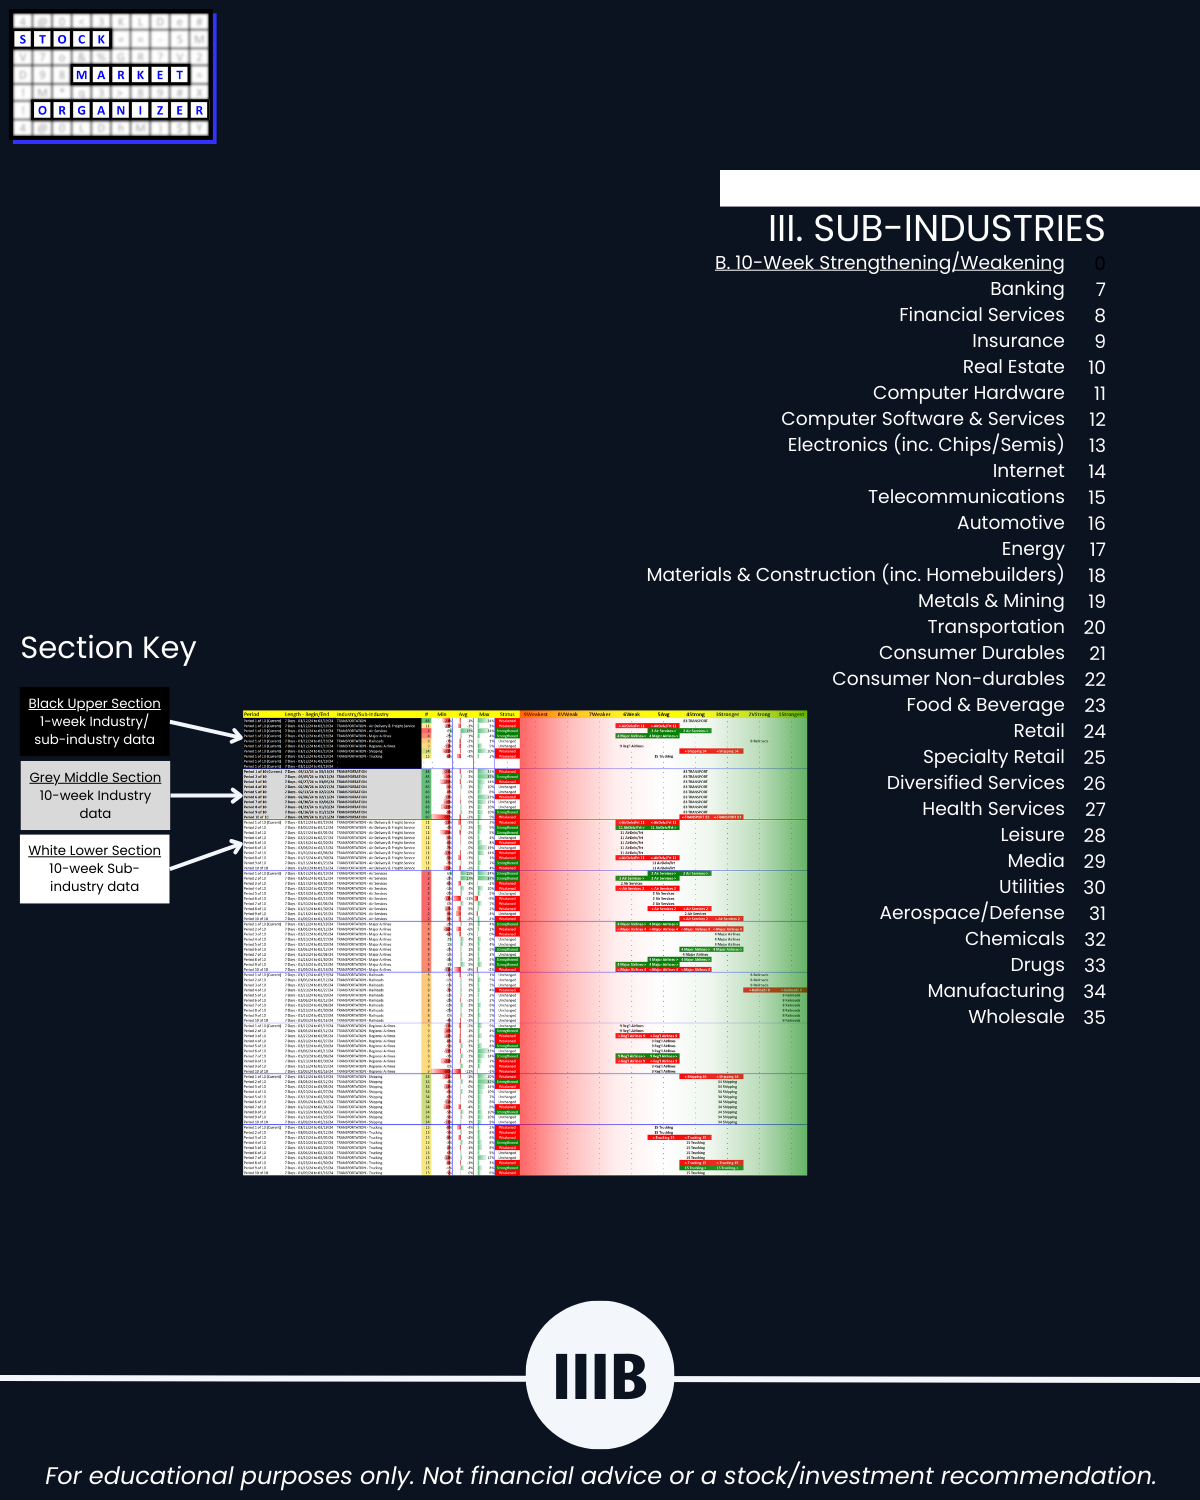
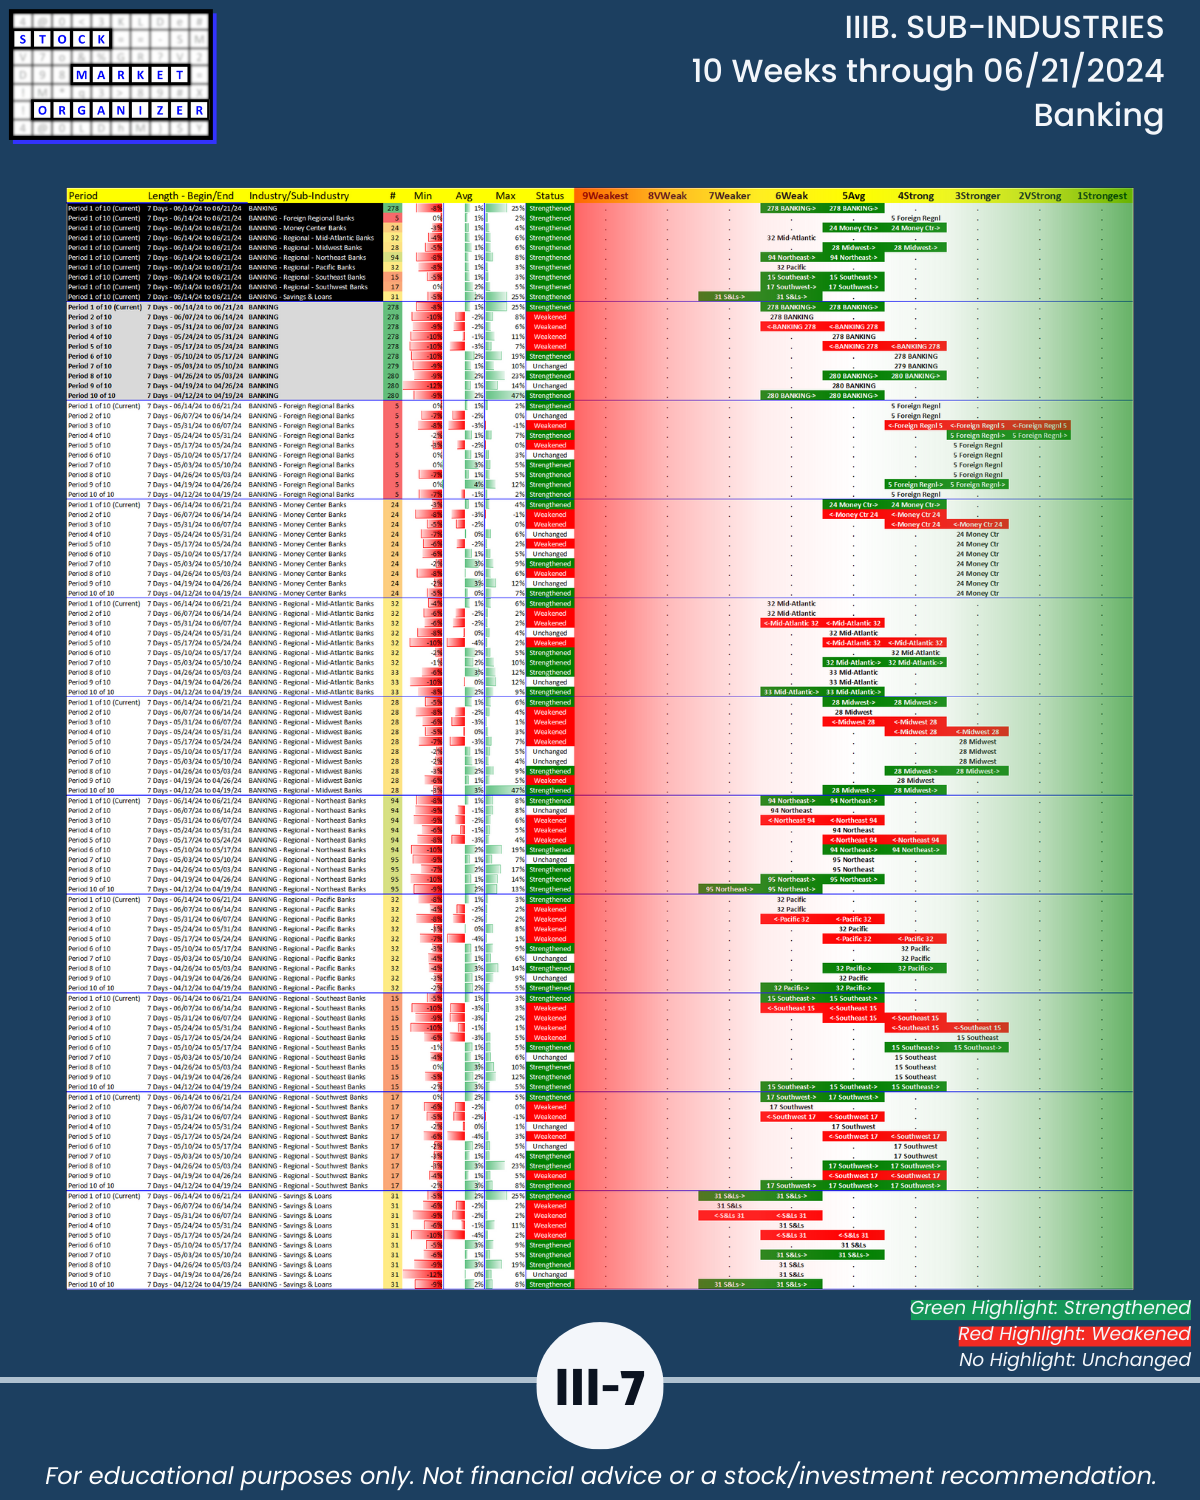
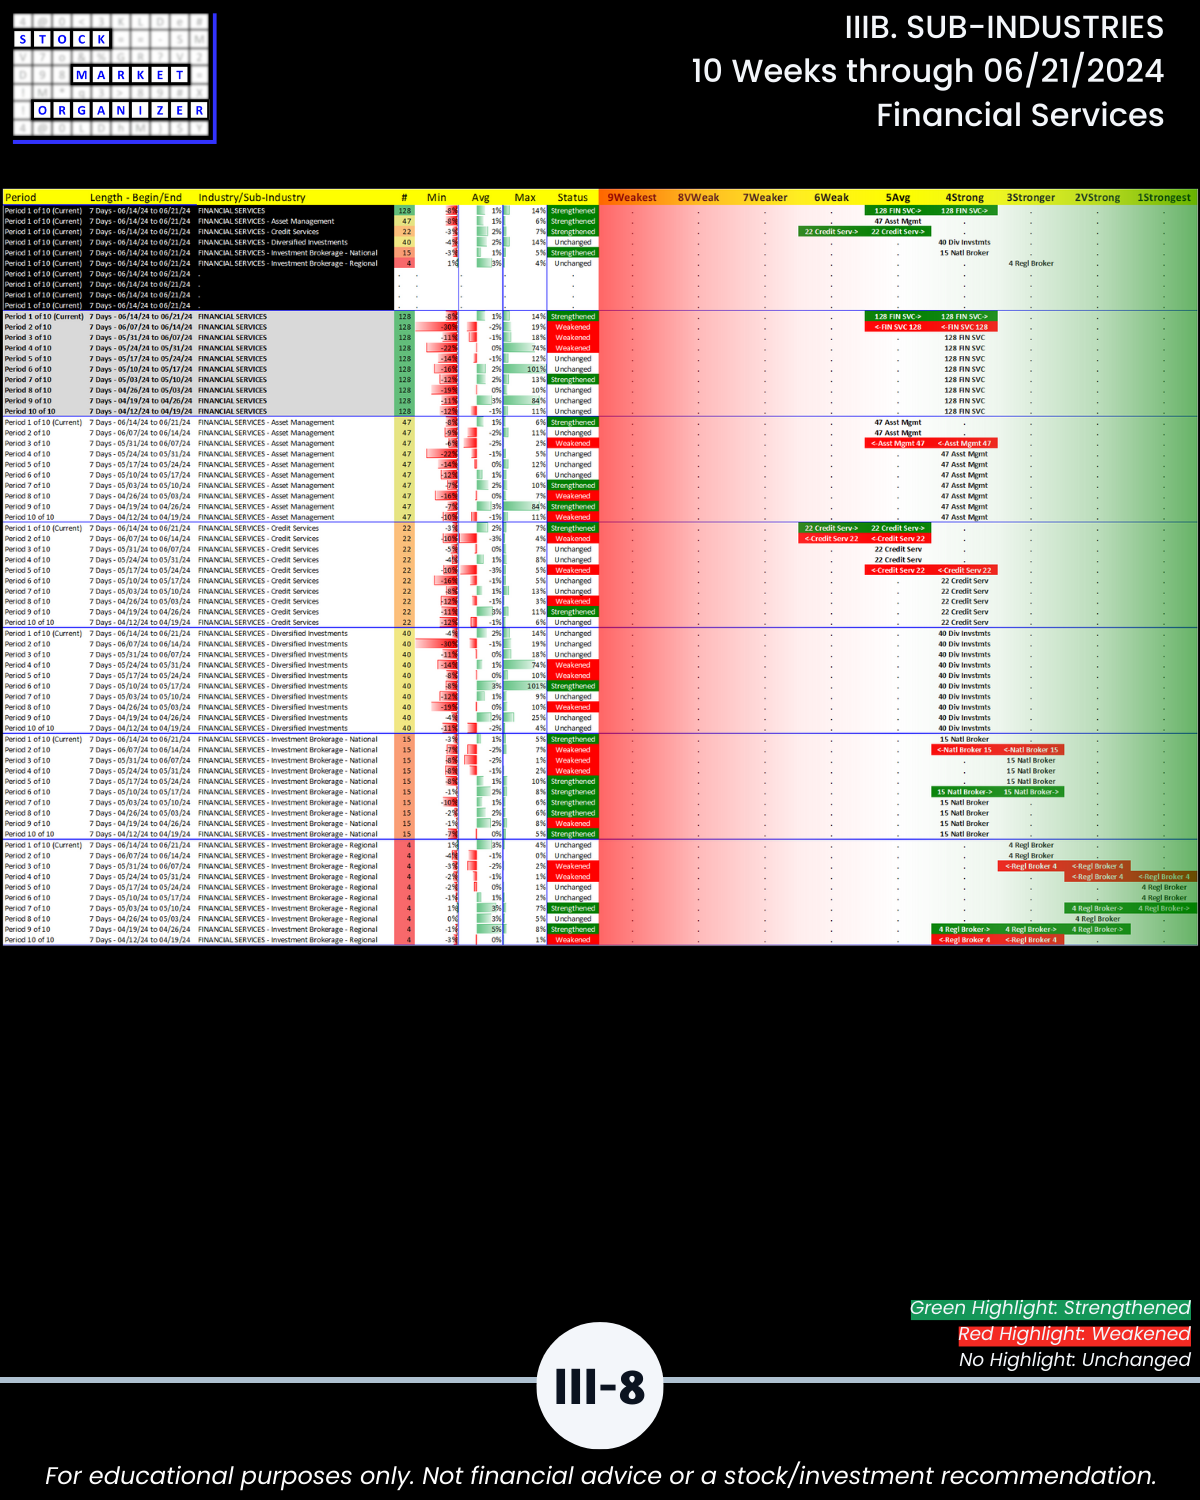
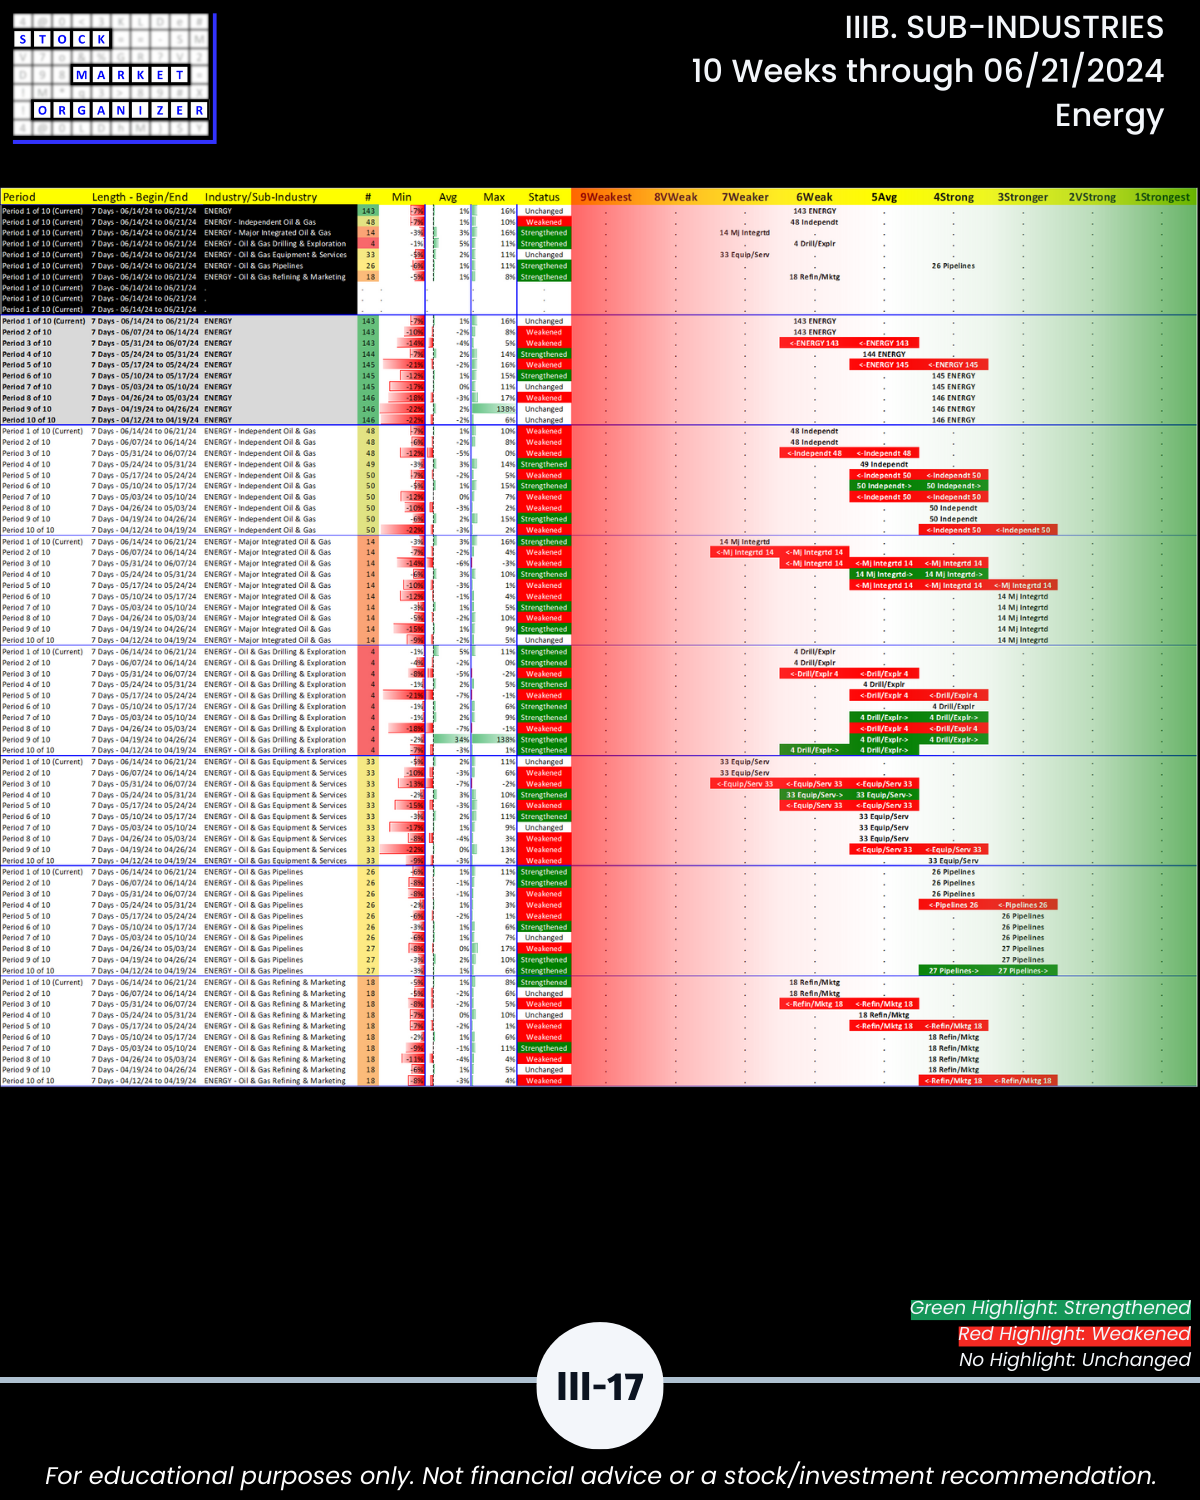
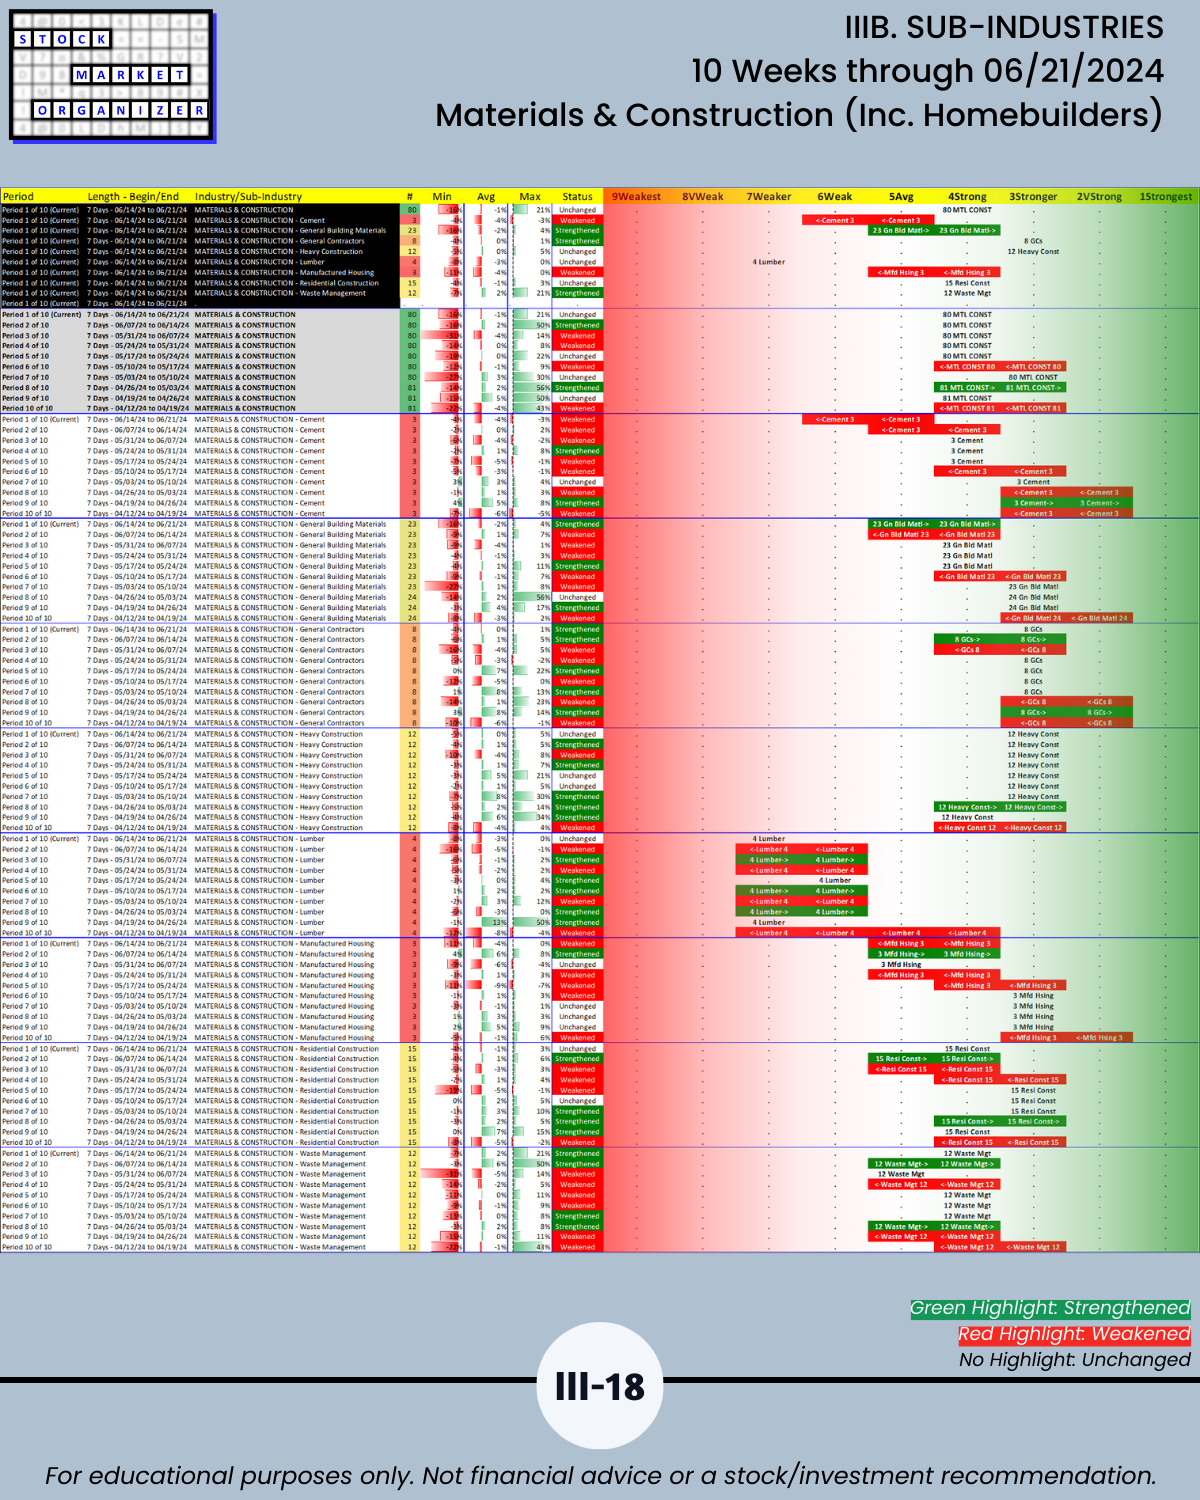
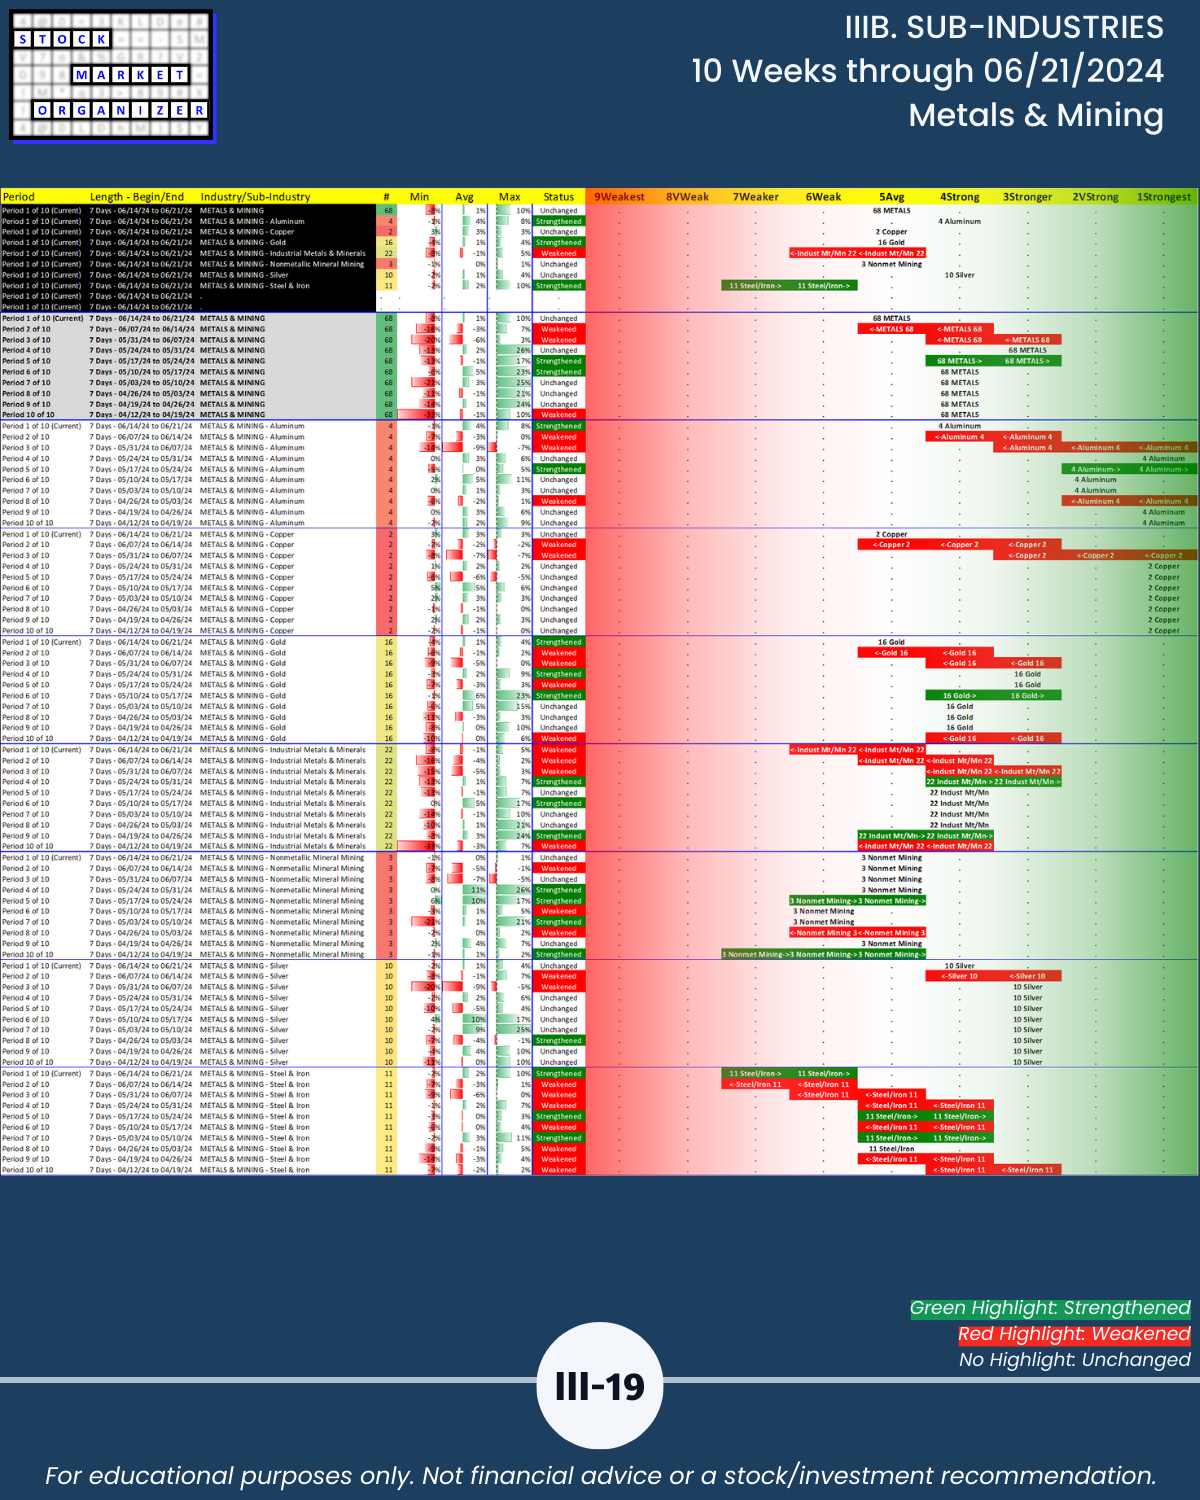
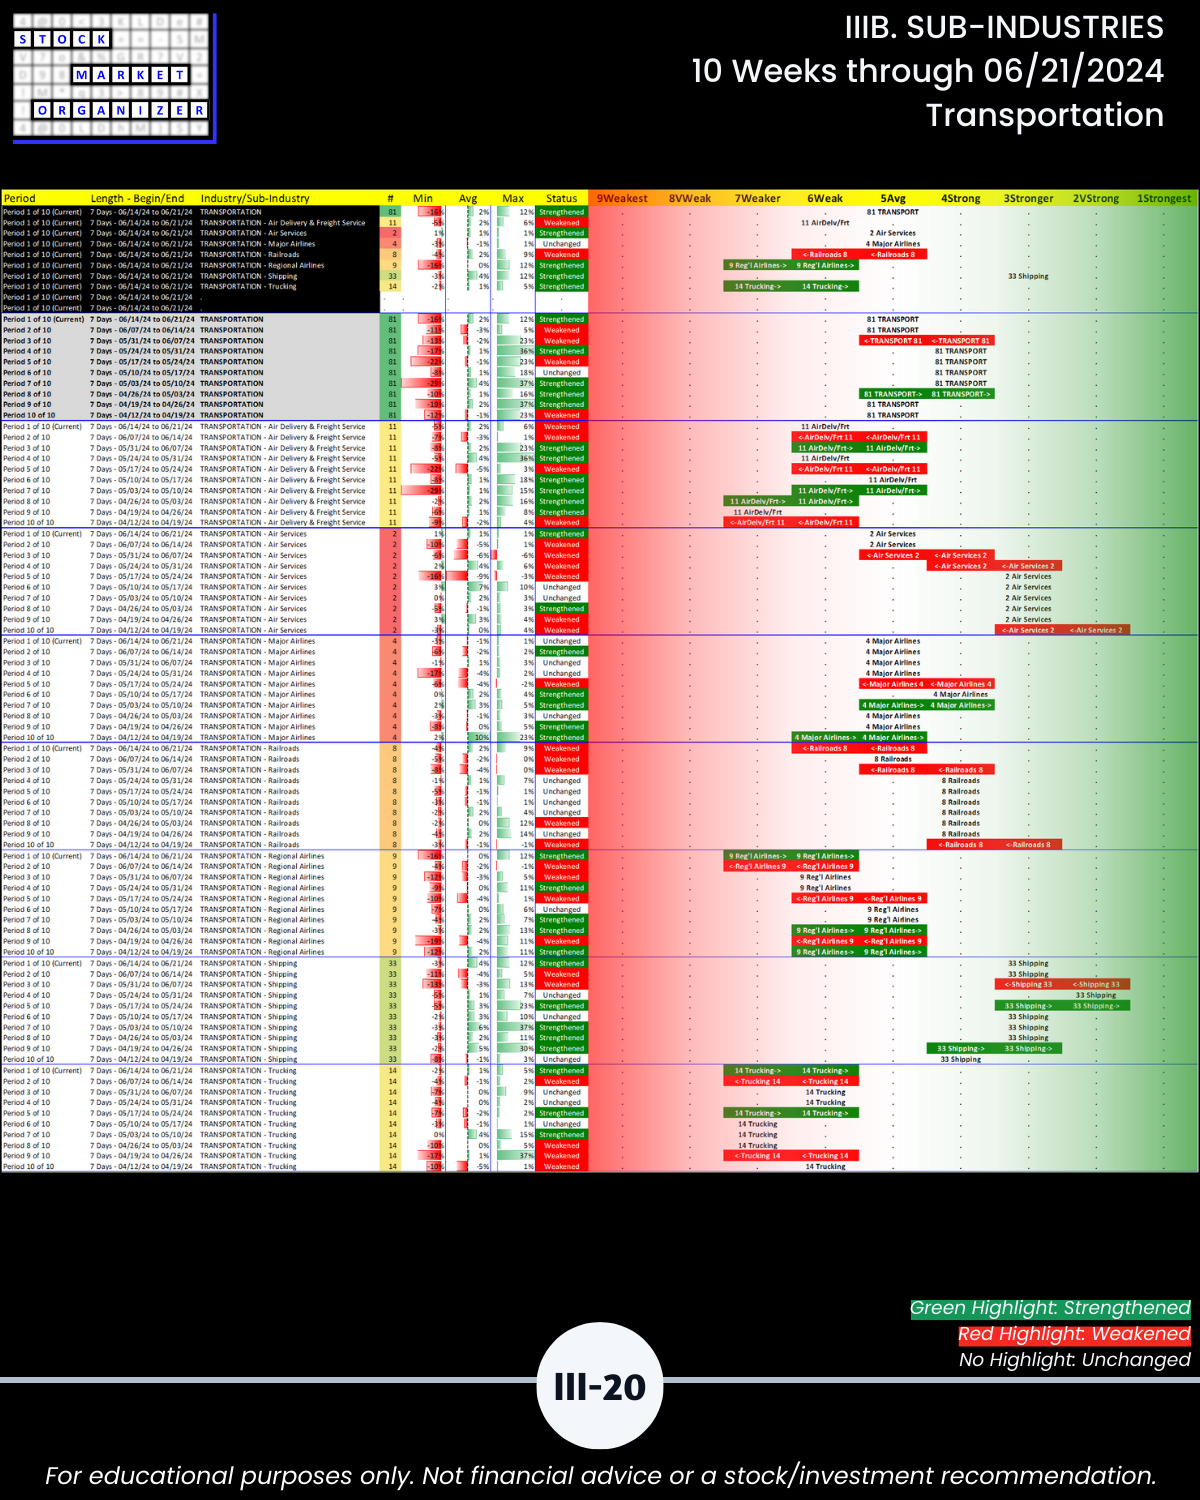
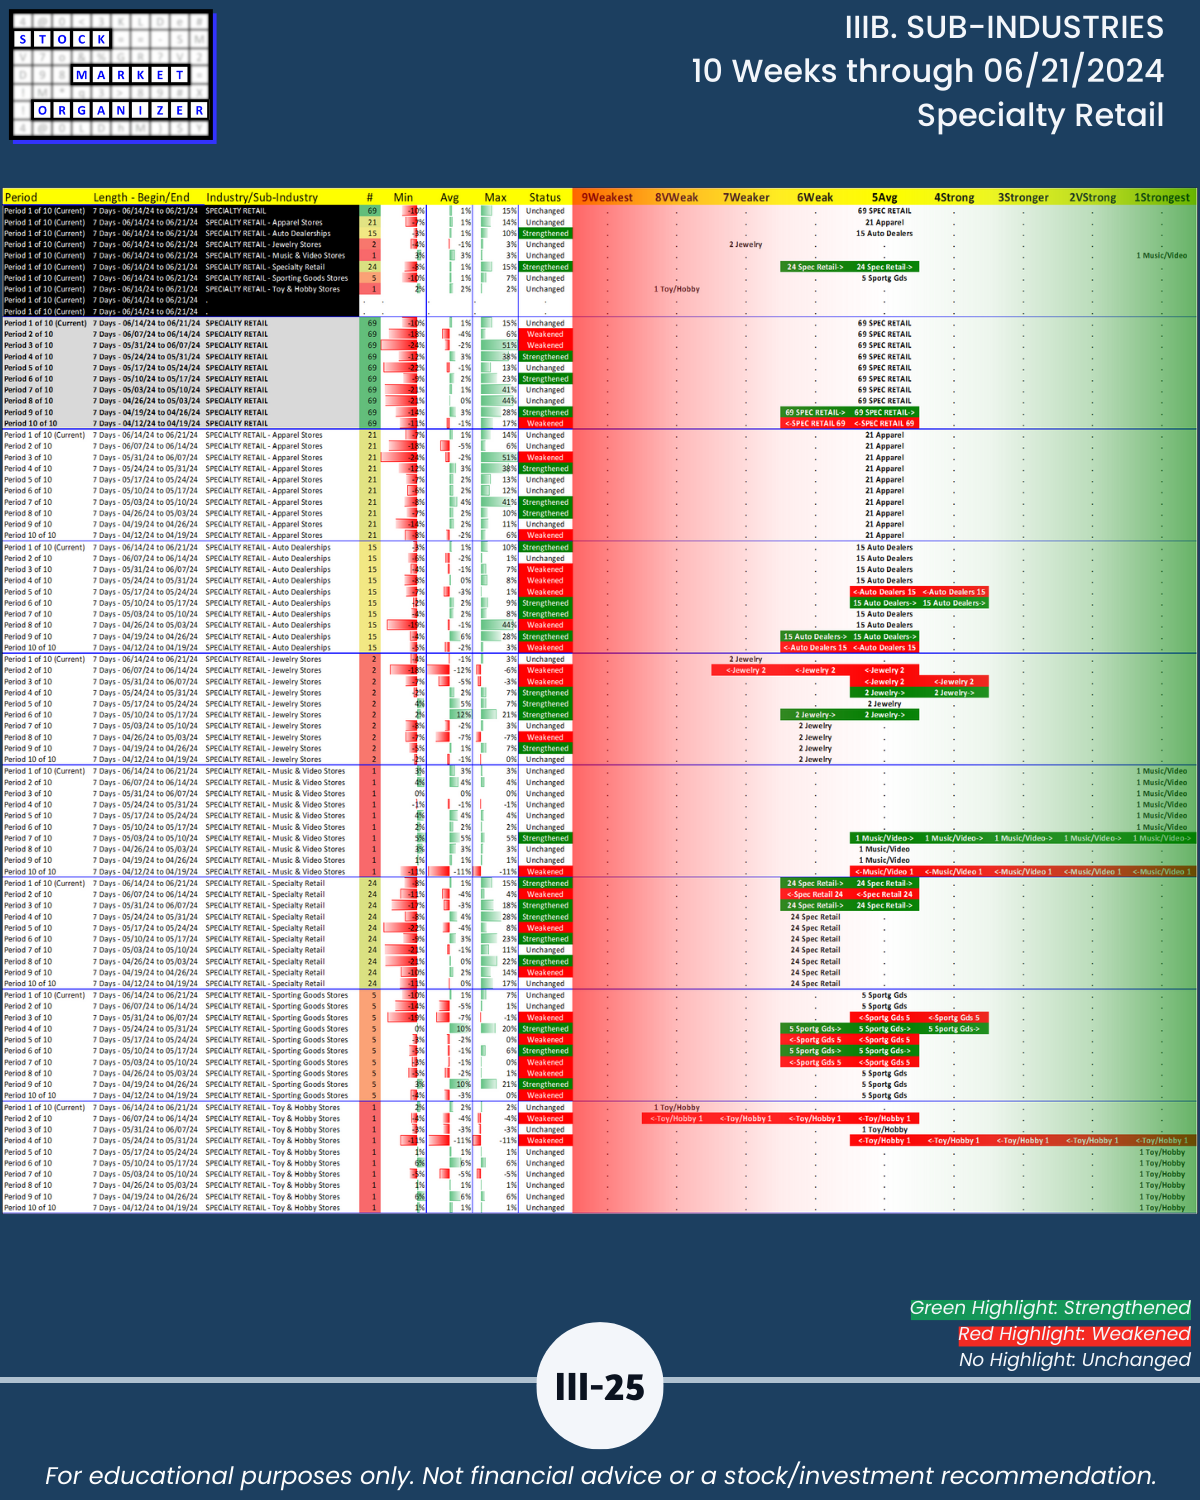
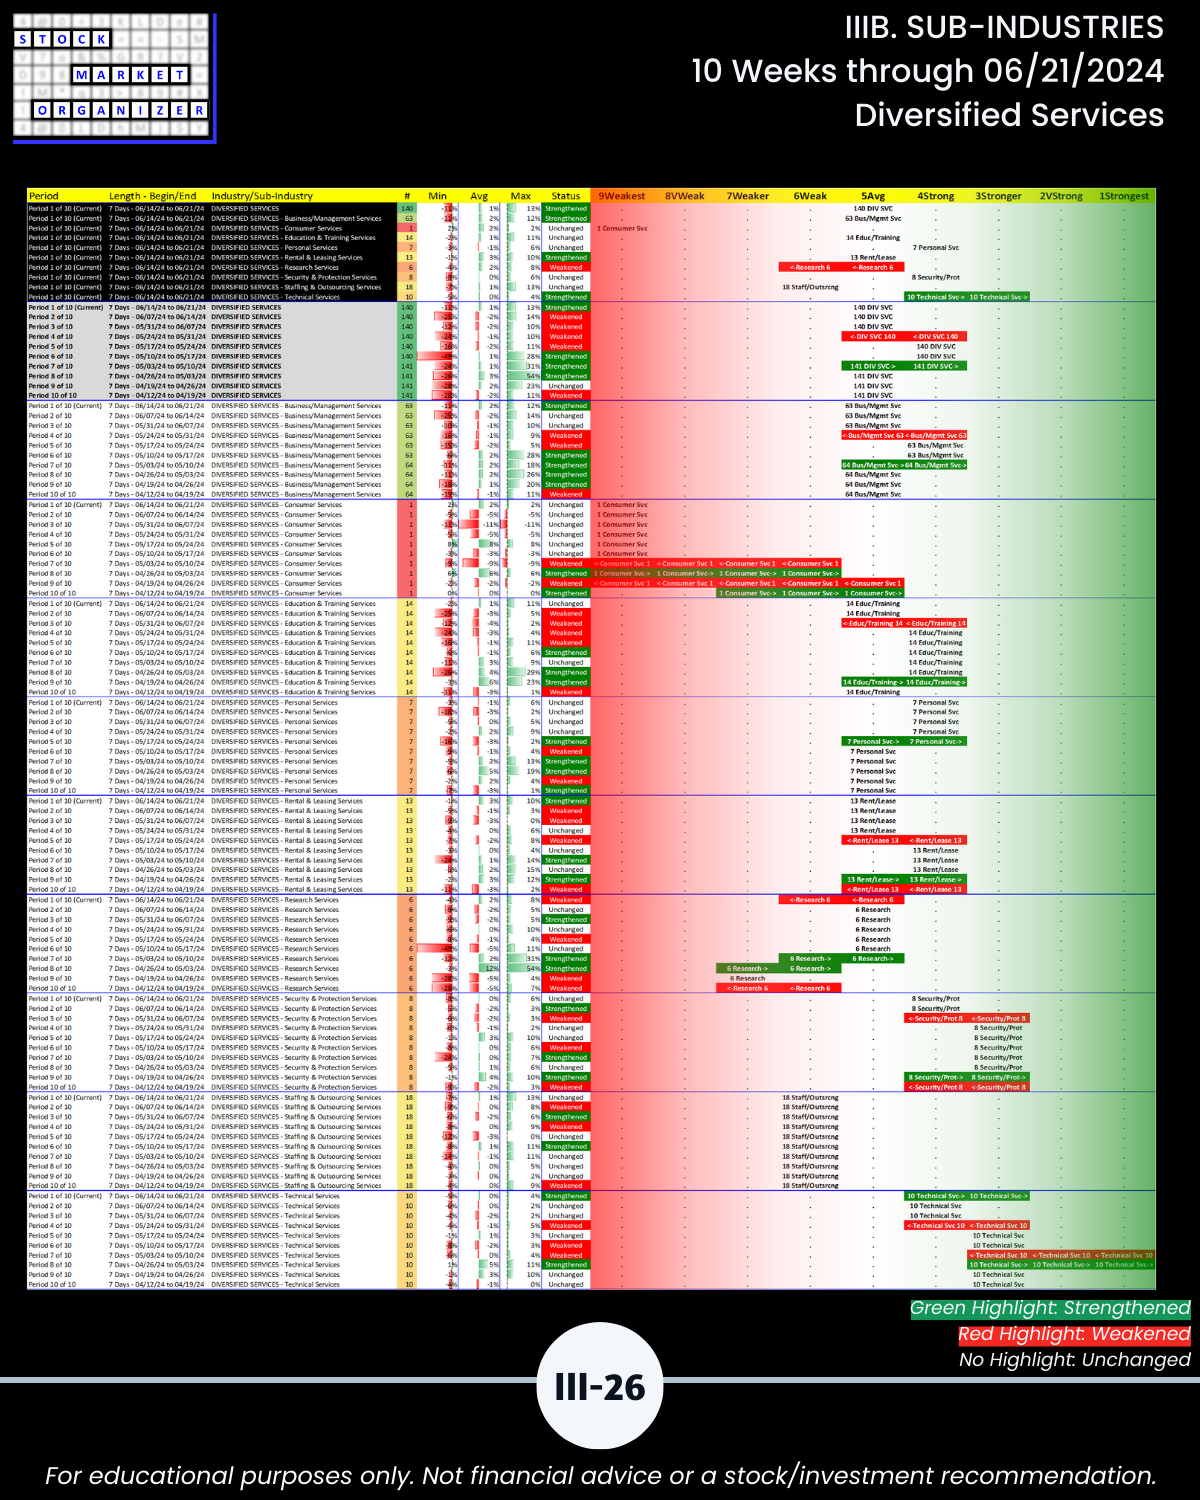
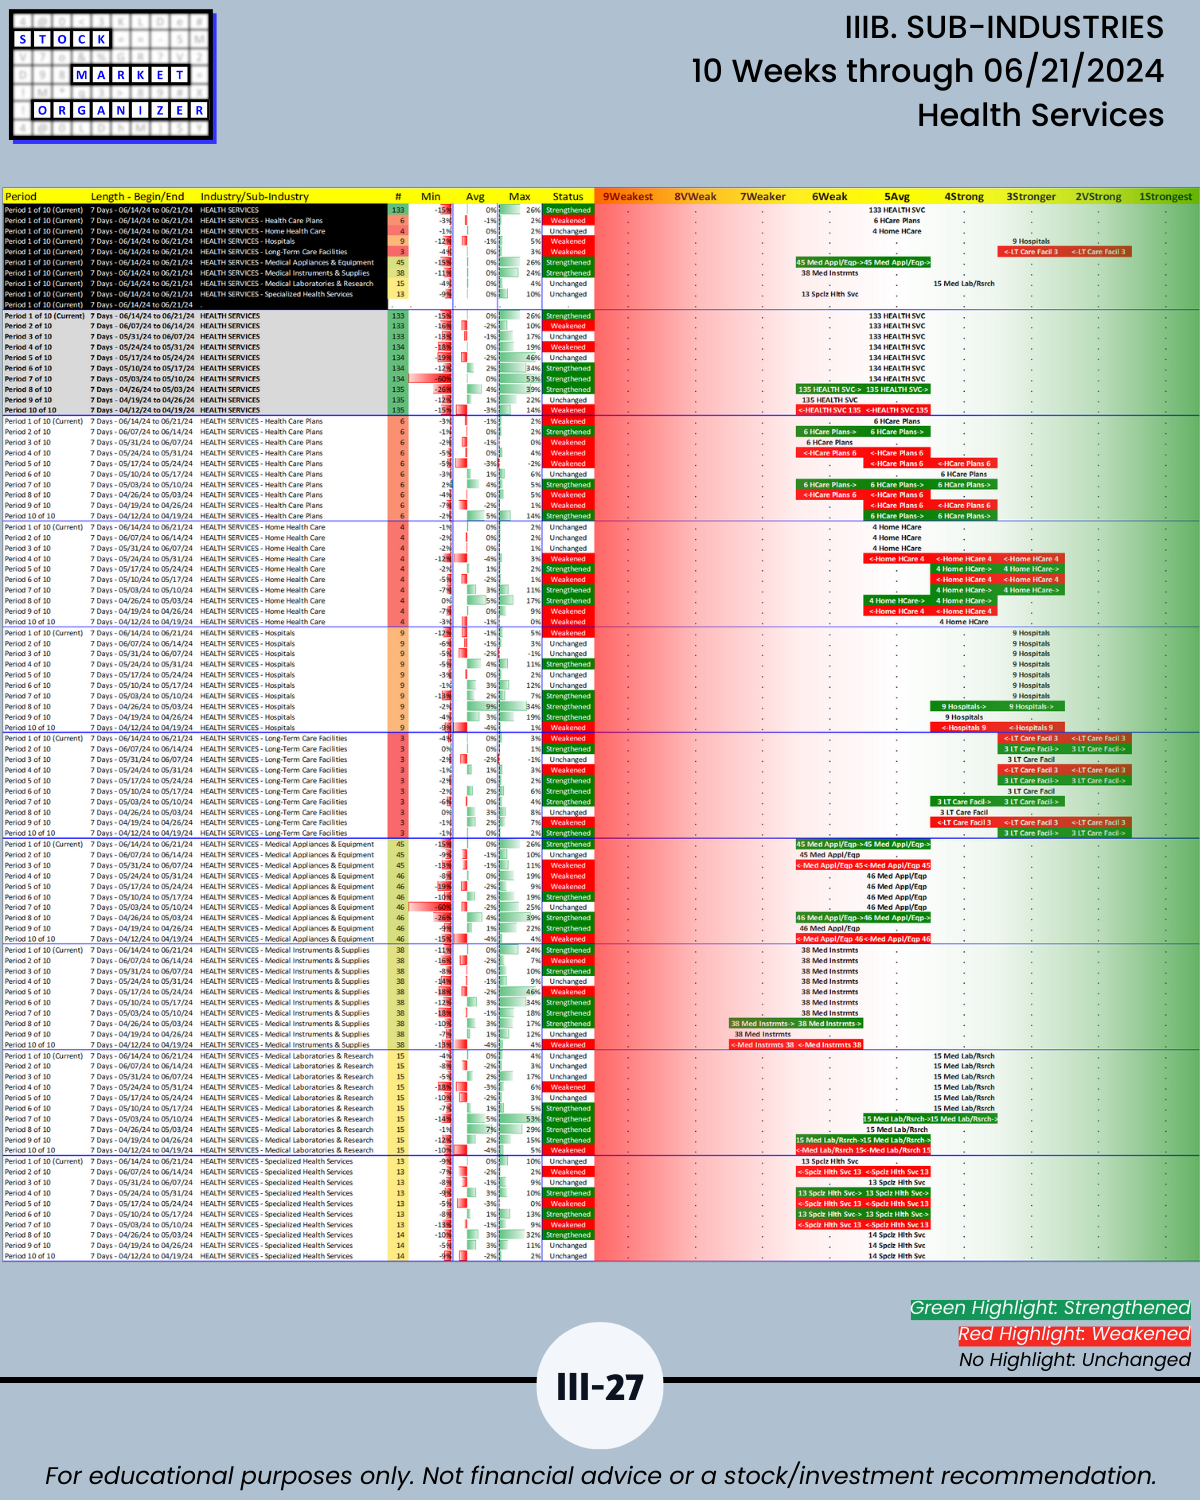
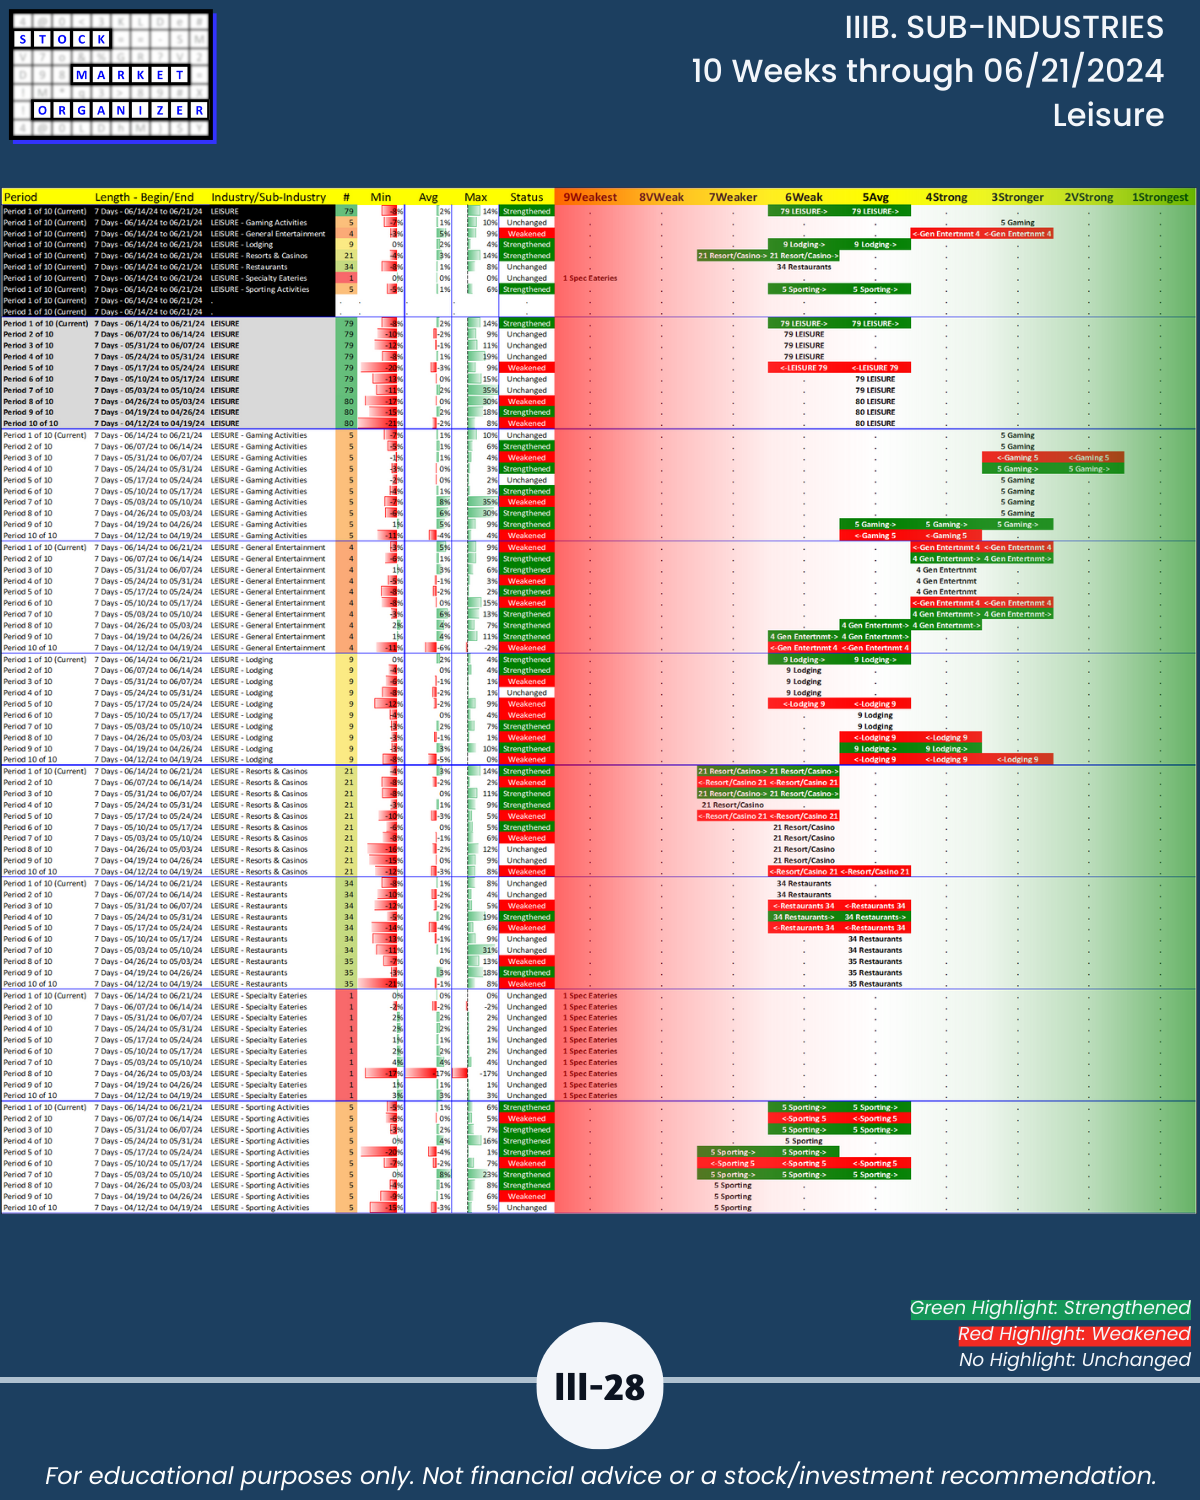
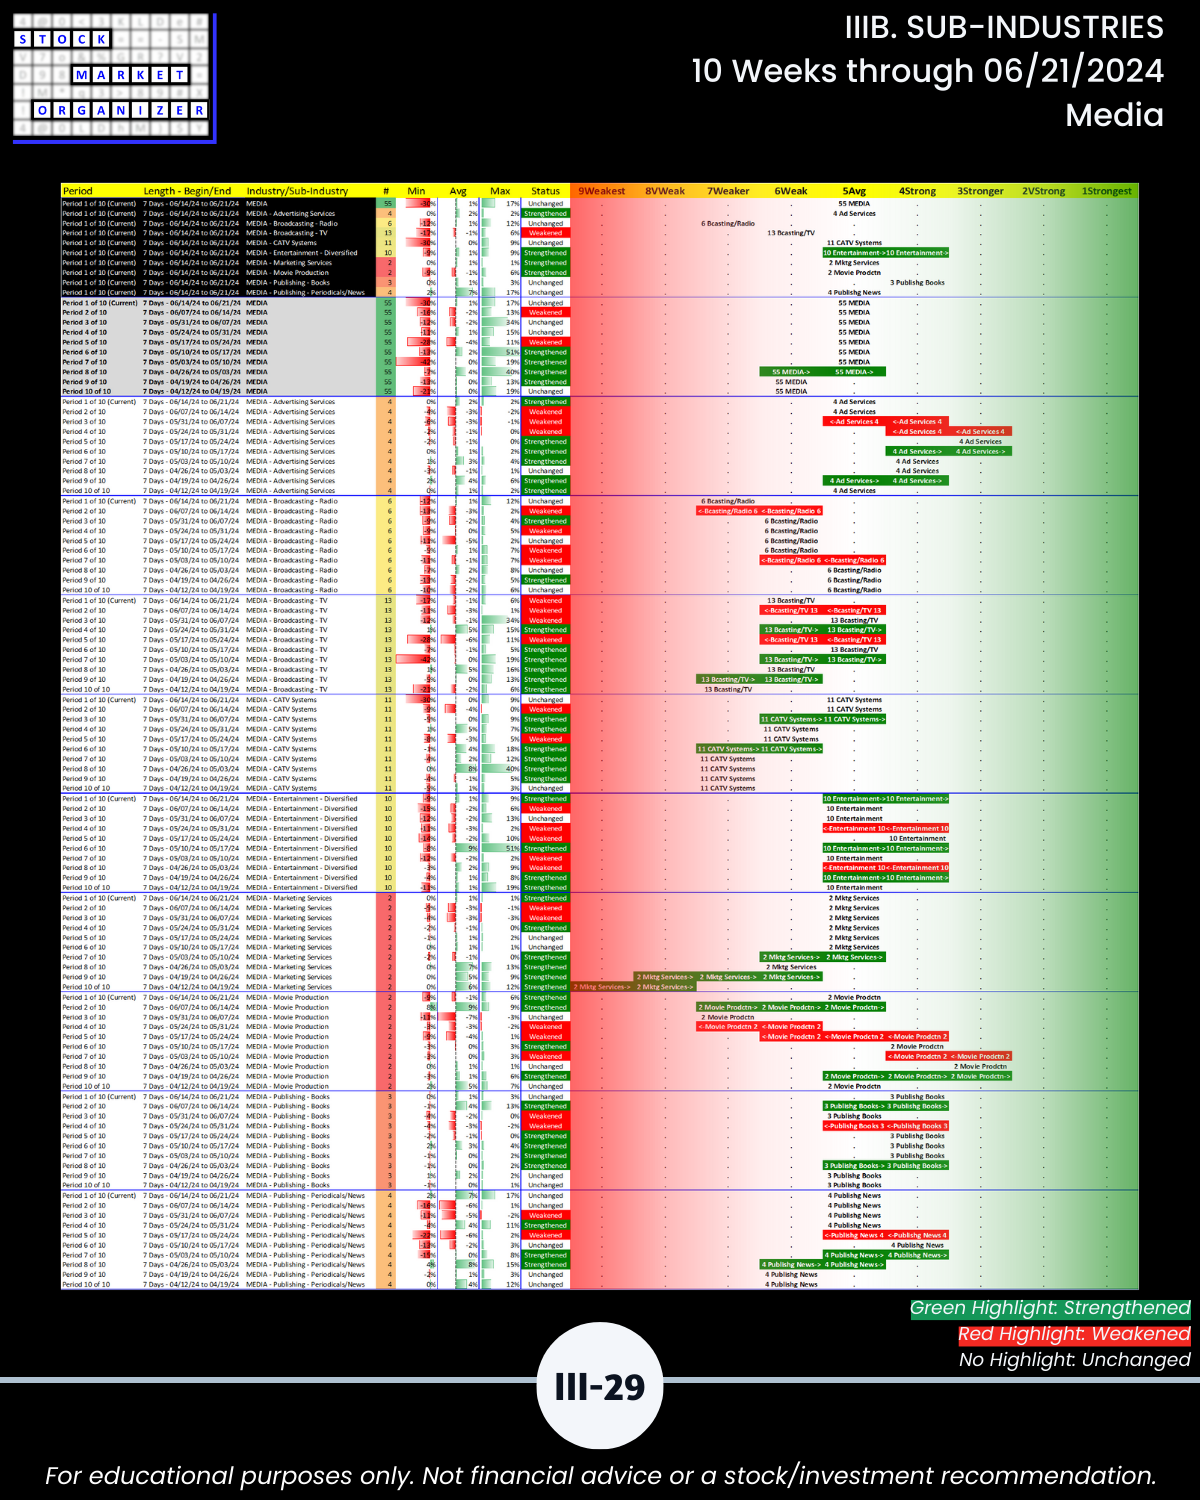
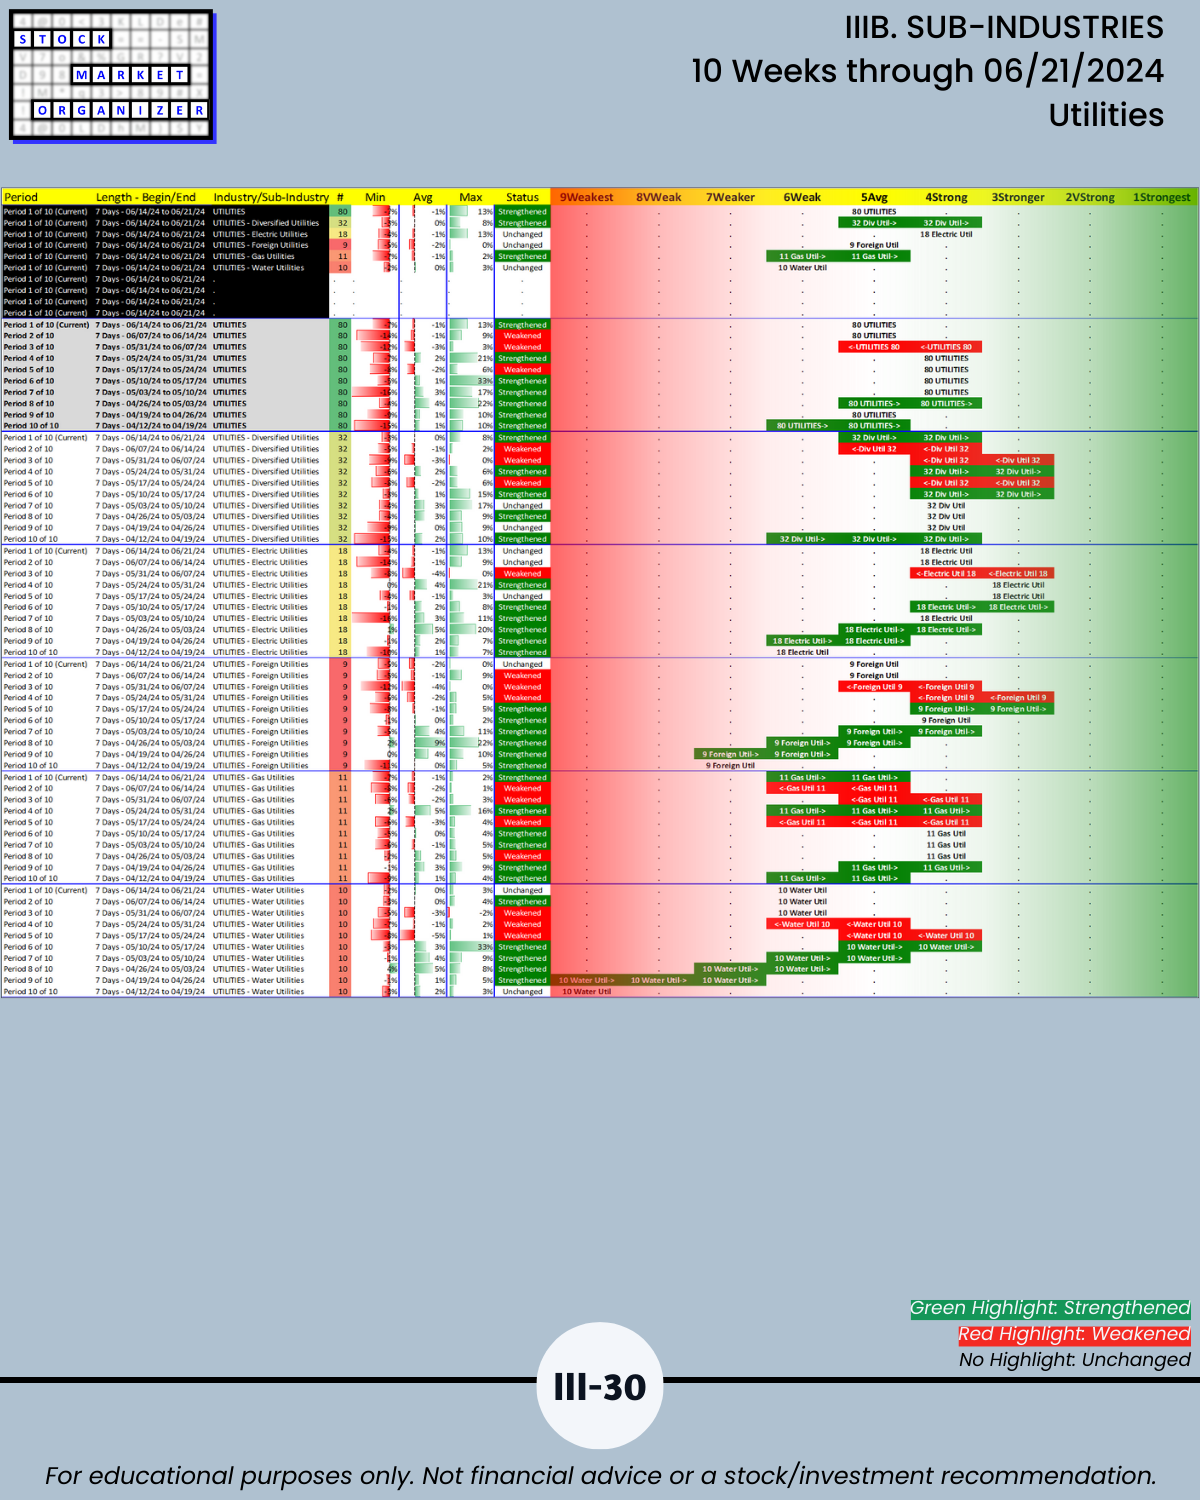
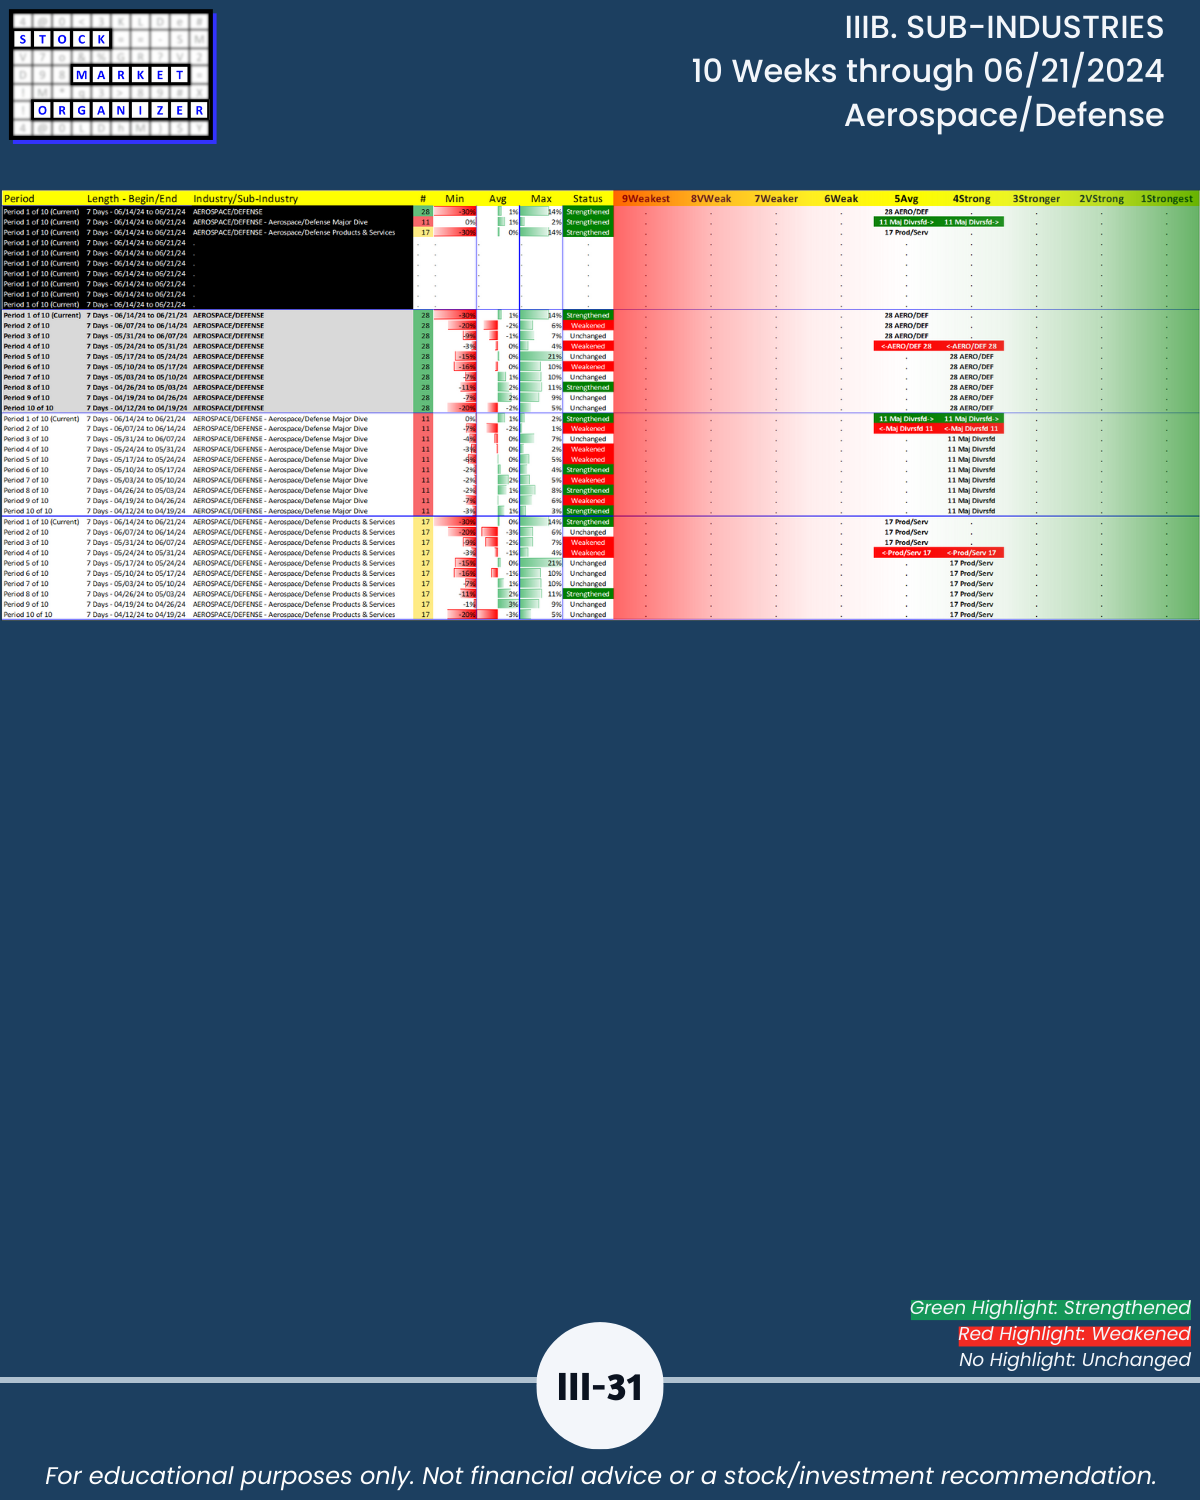
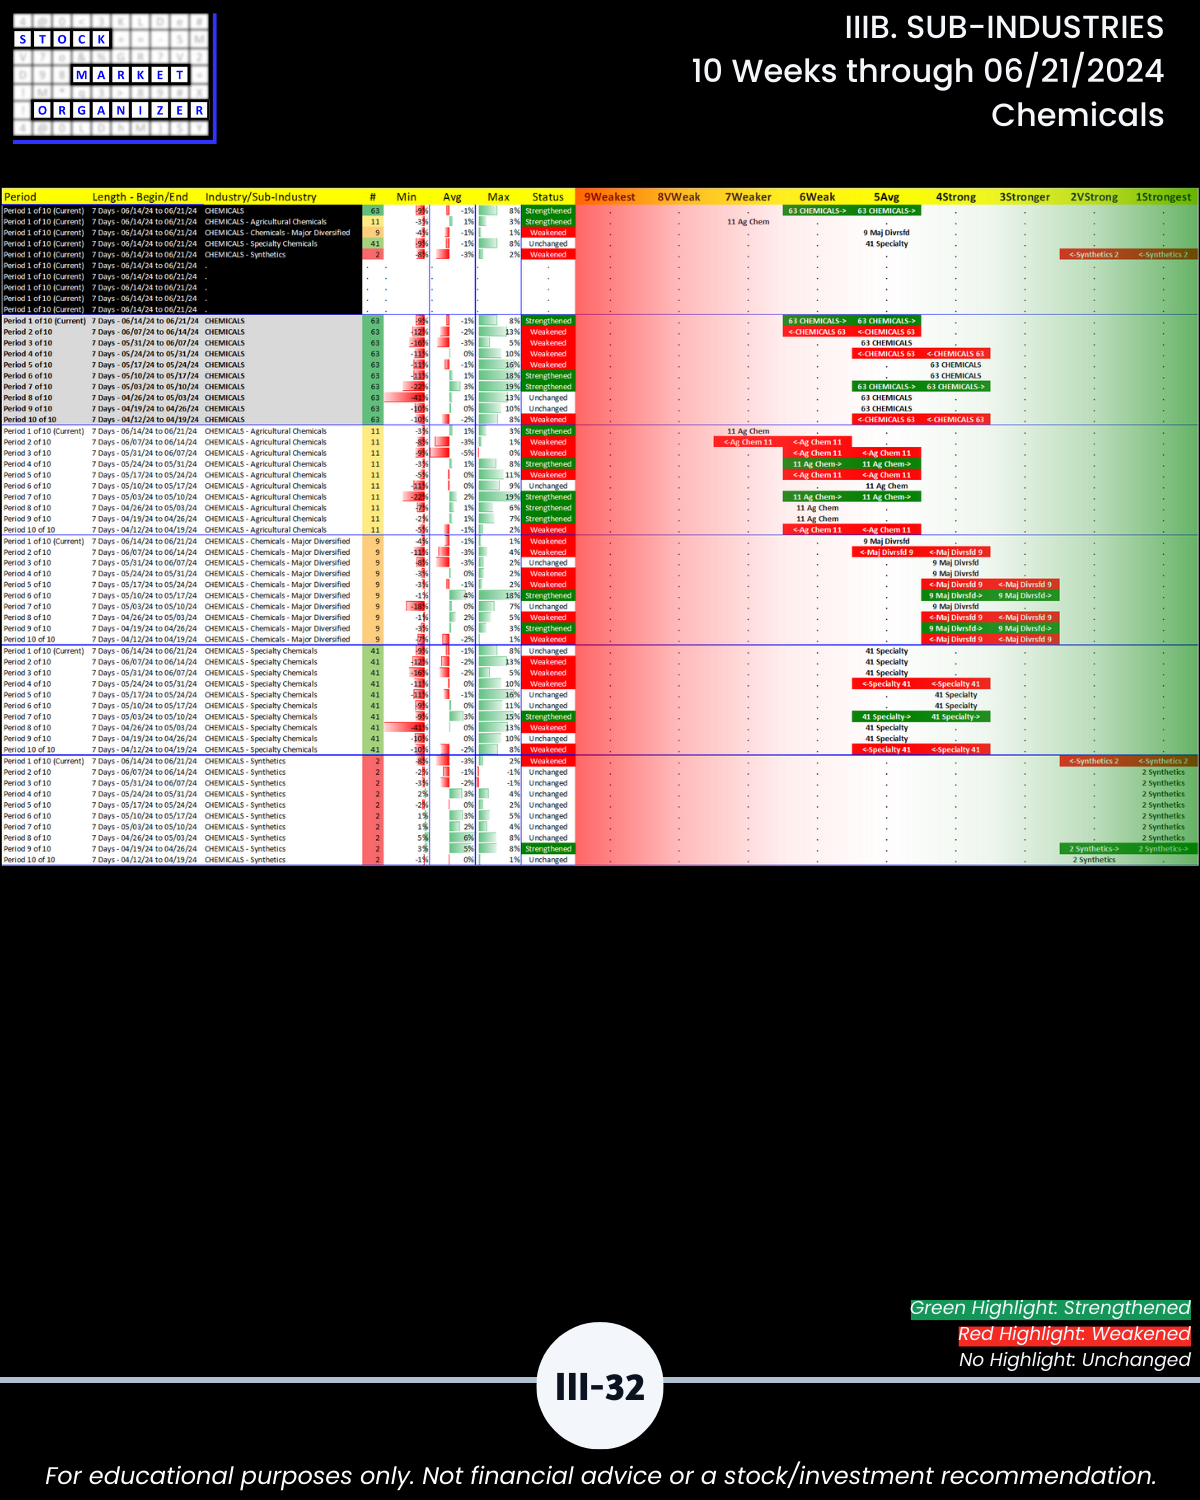
IIIB. SUB-INDUSTRIES 10-Week Strengthening/Weakening
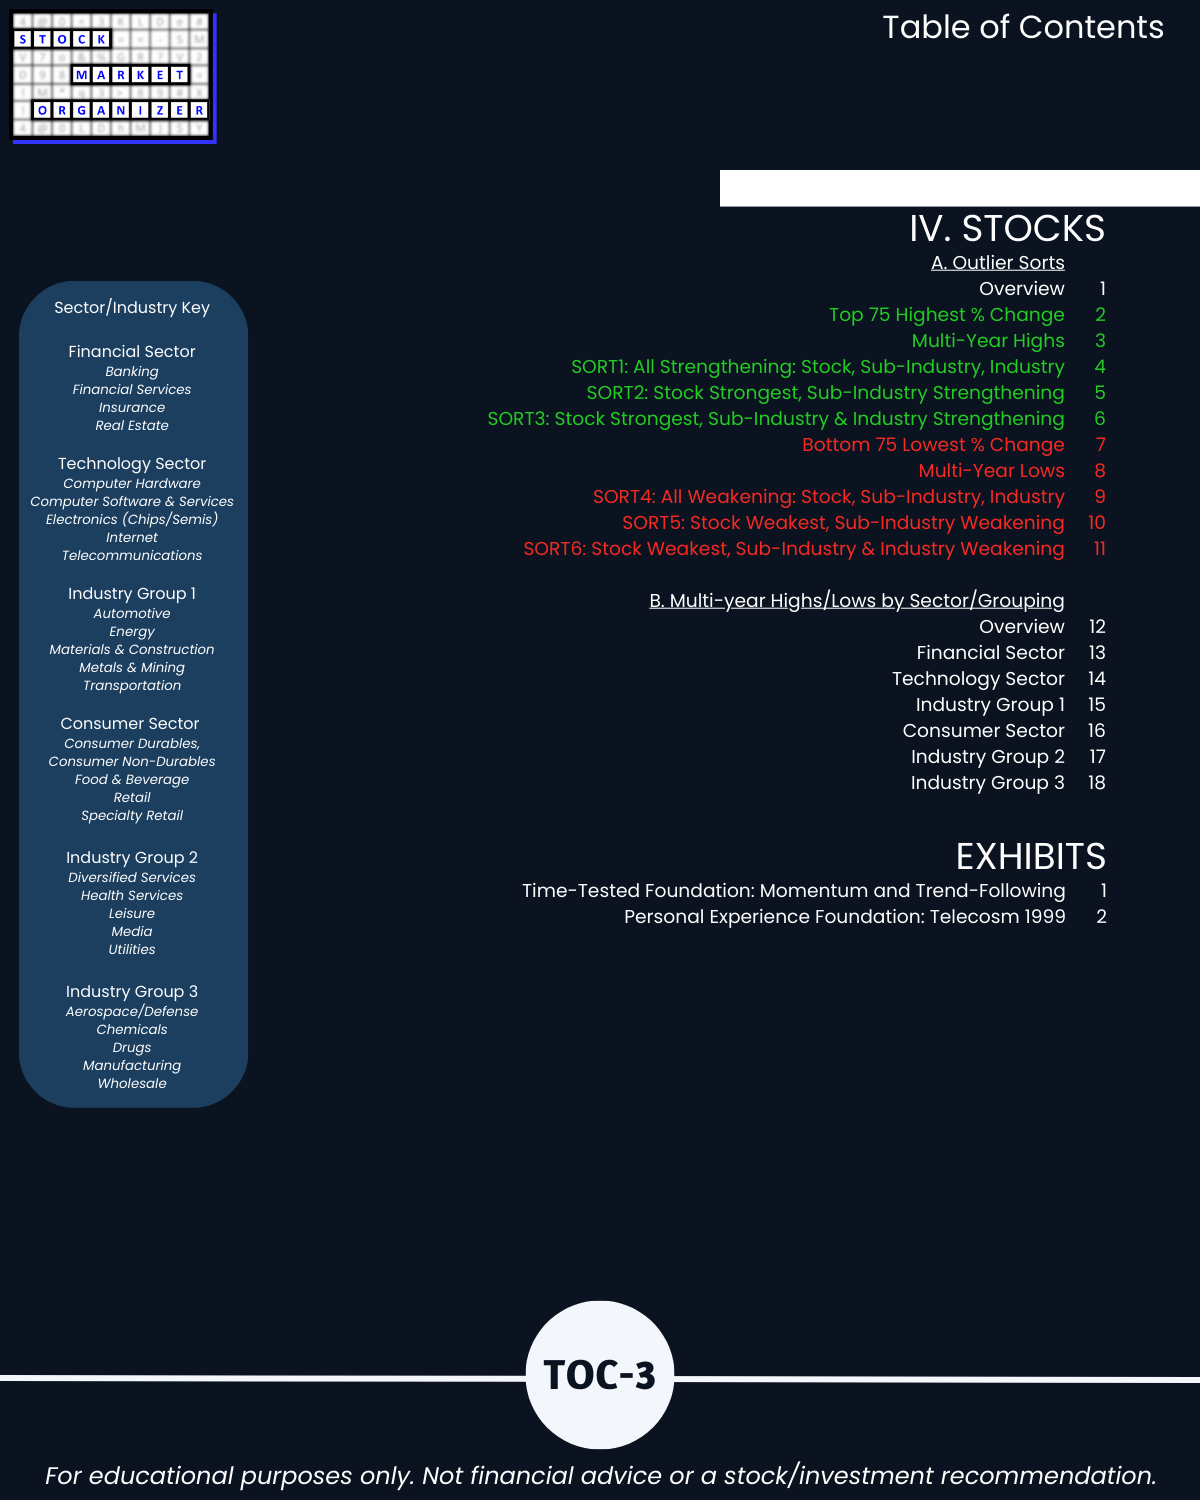
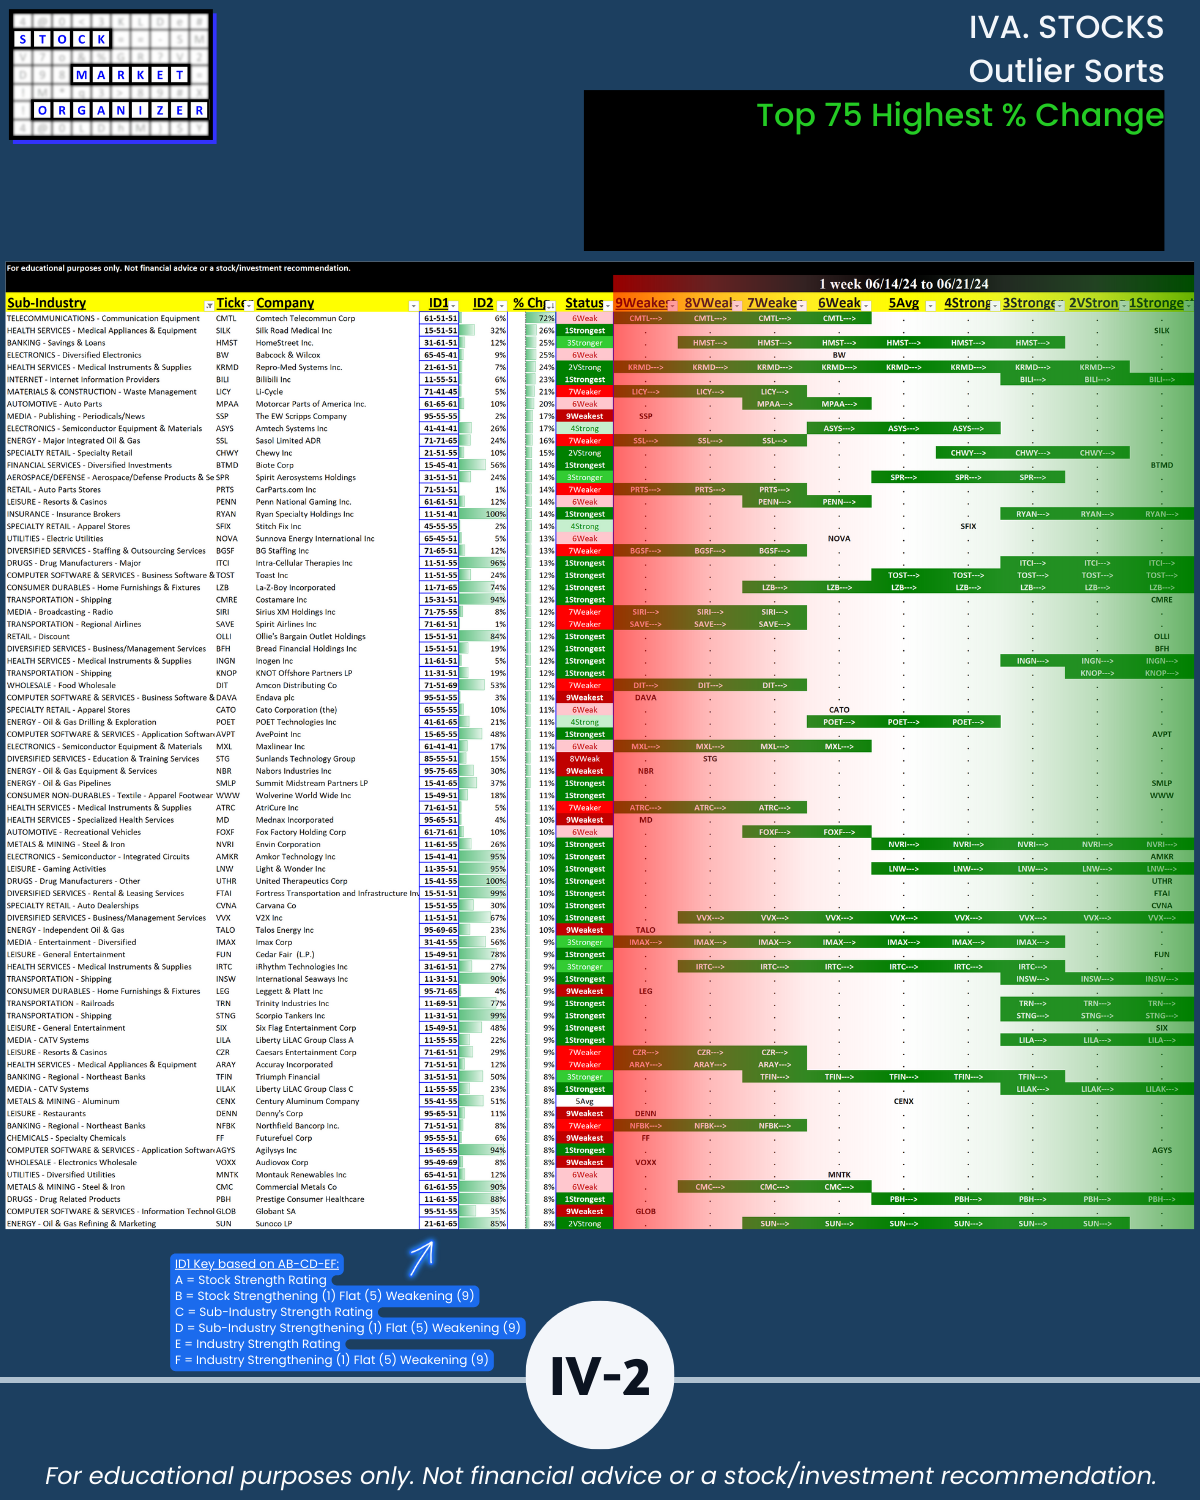
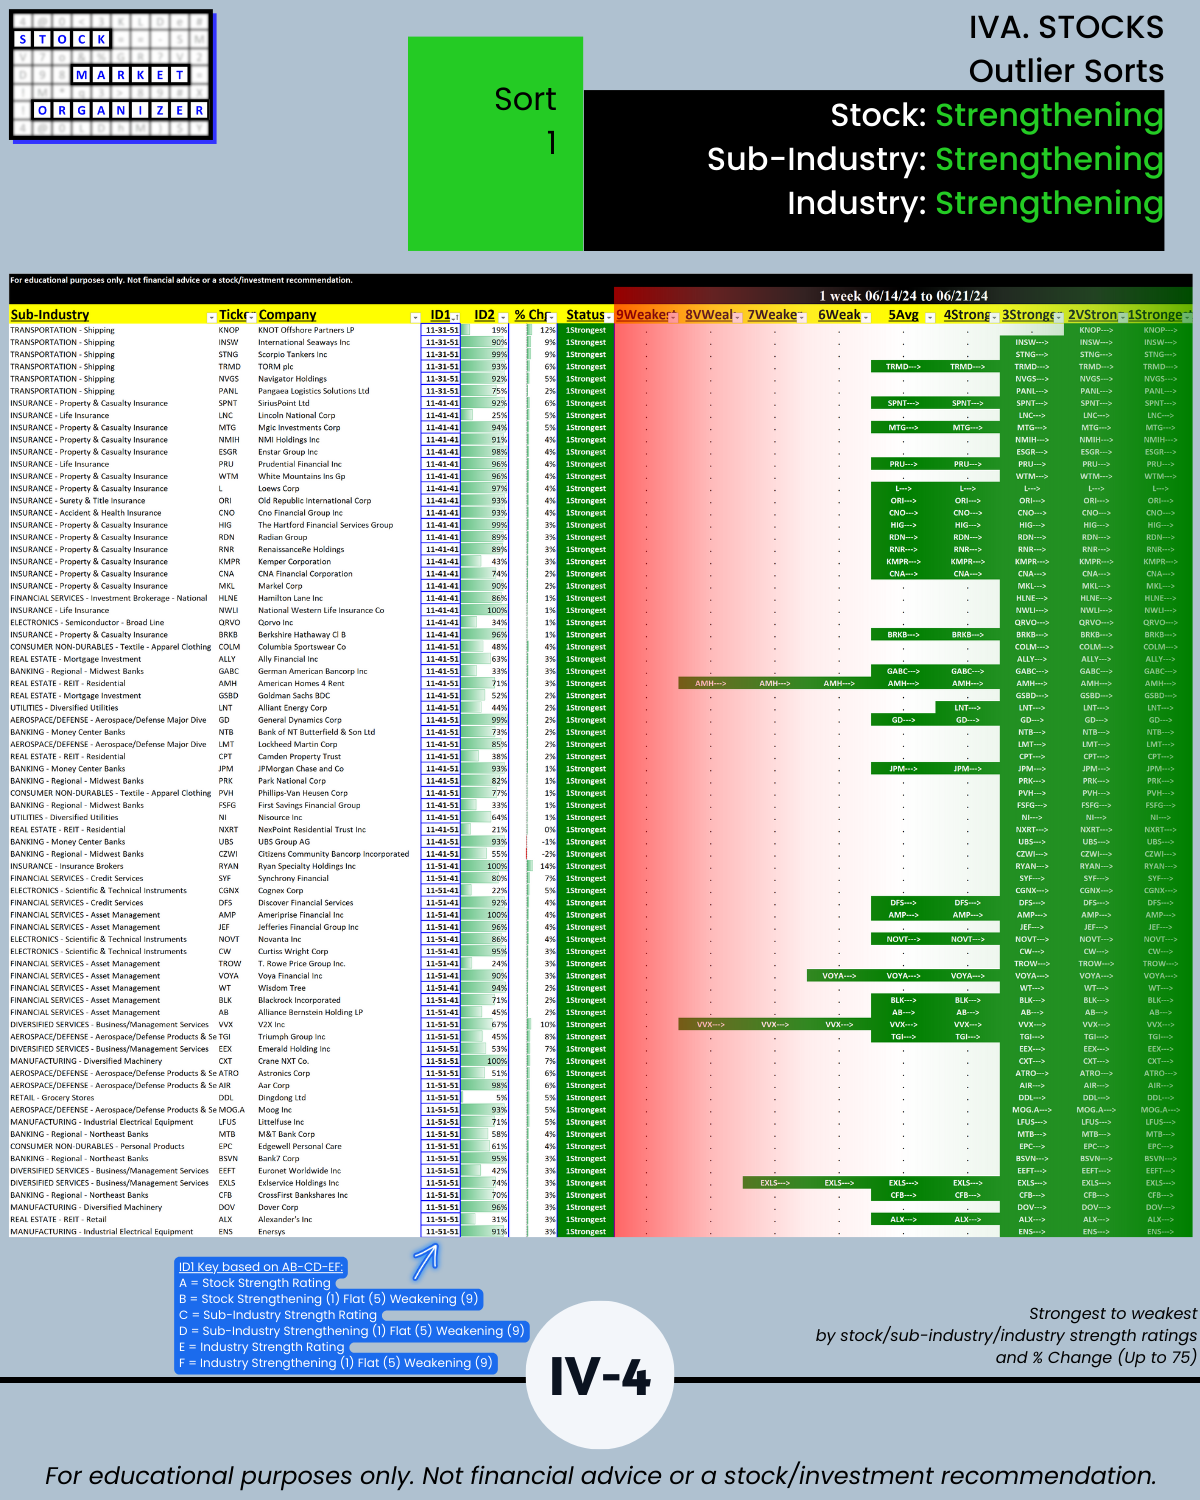
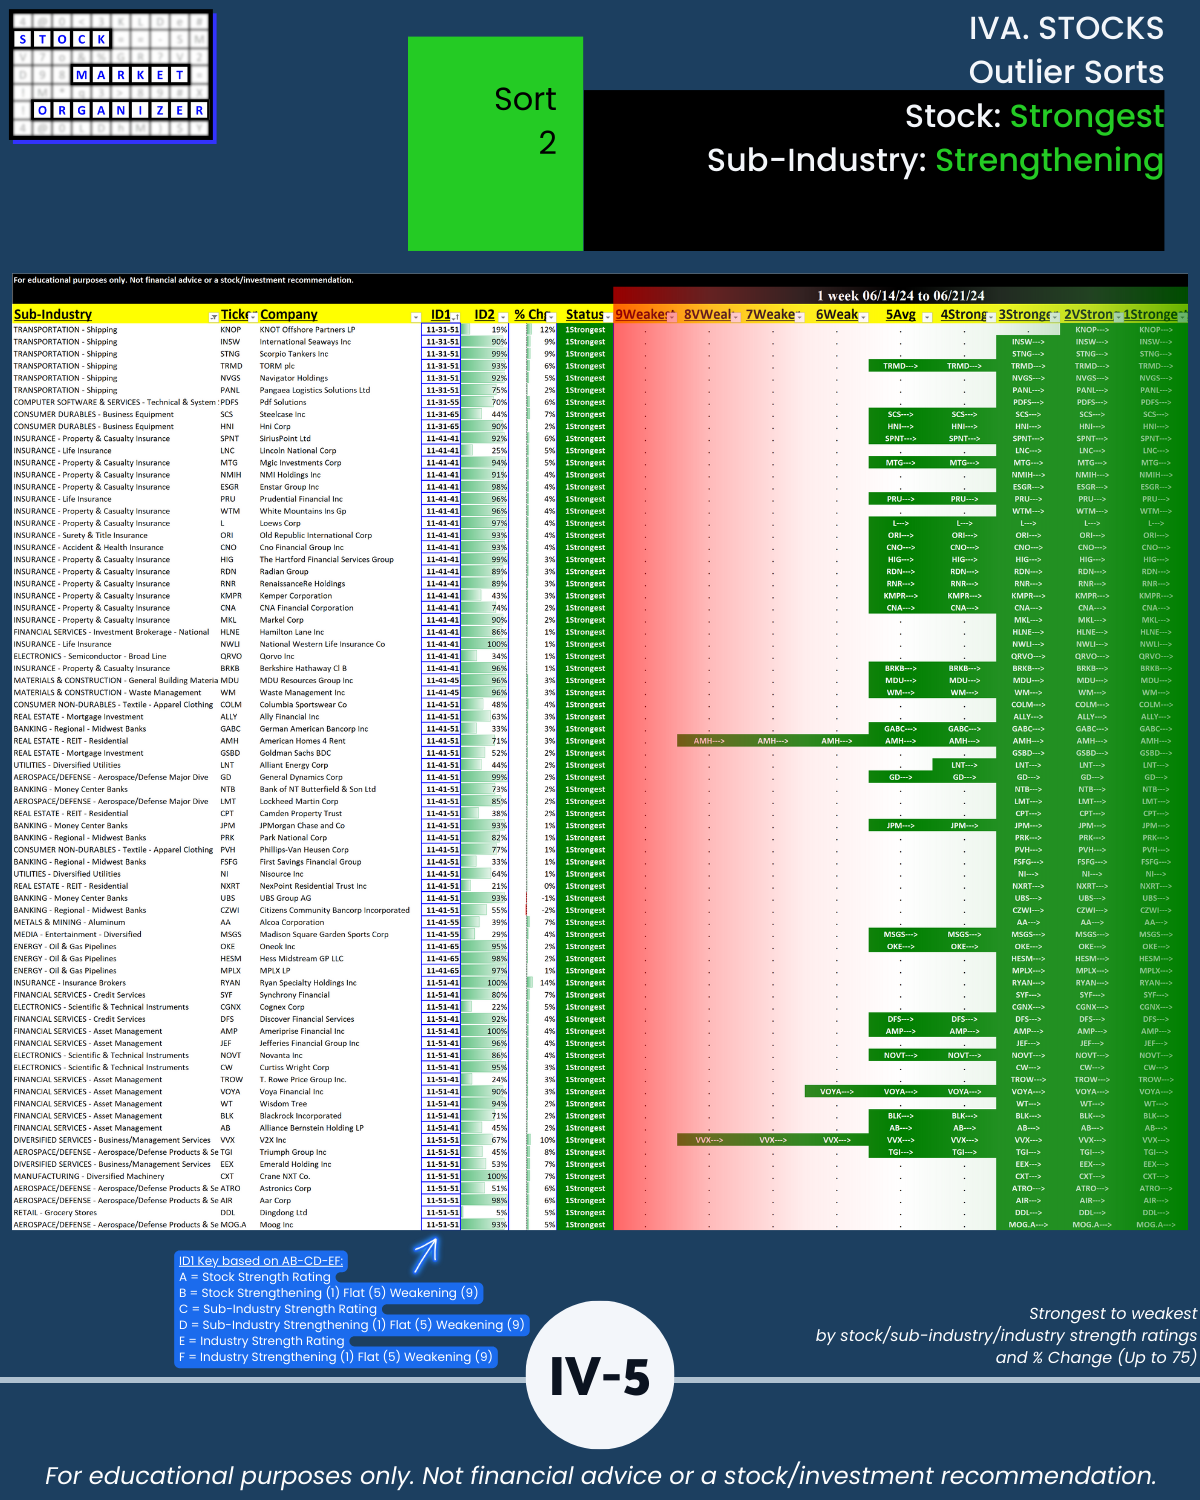
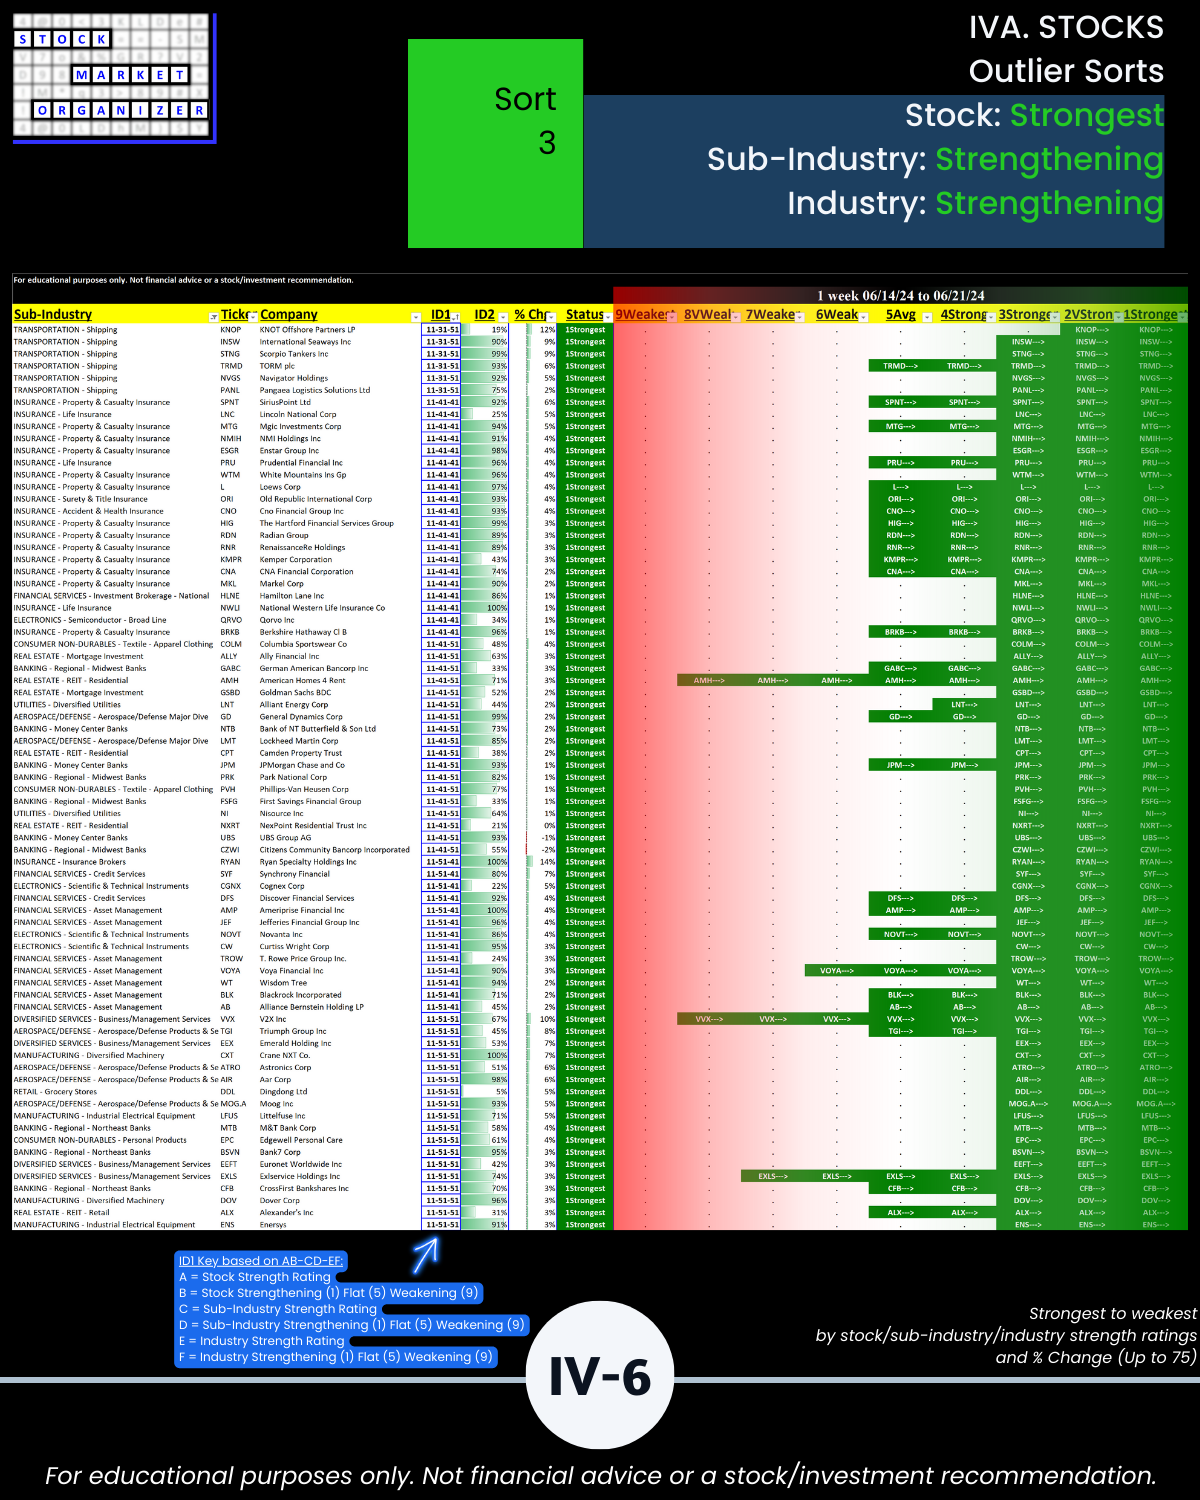
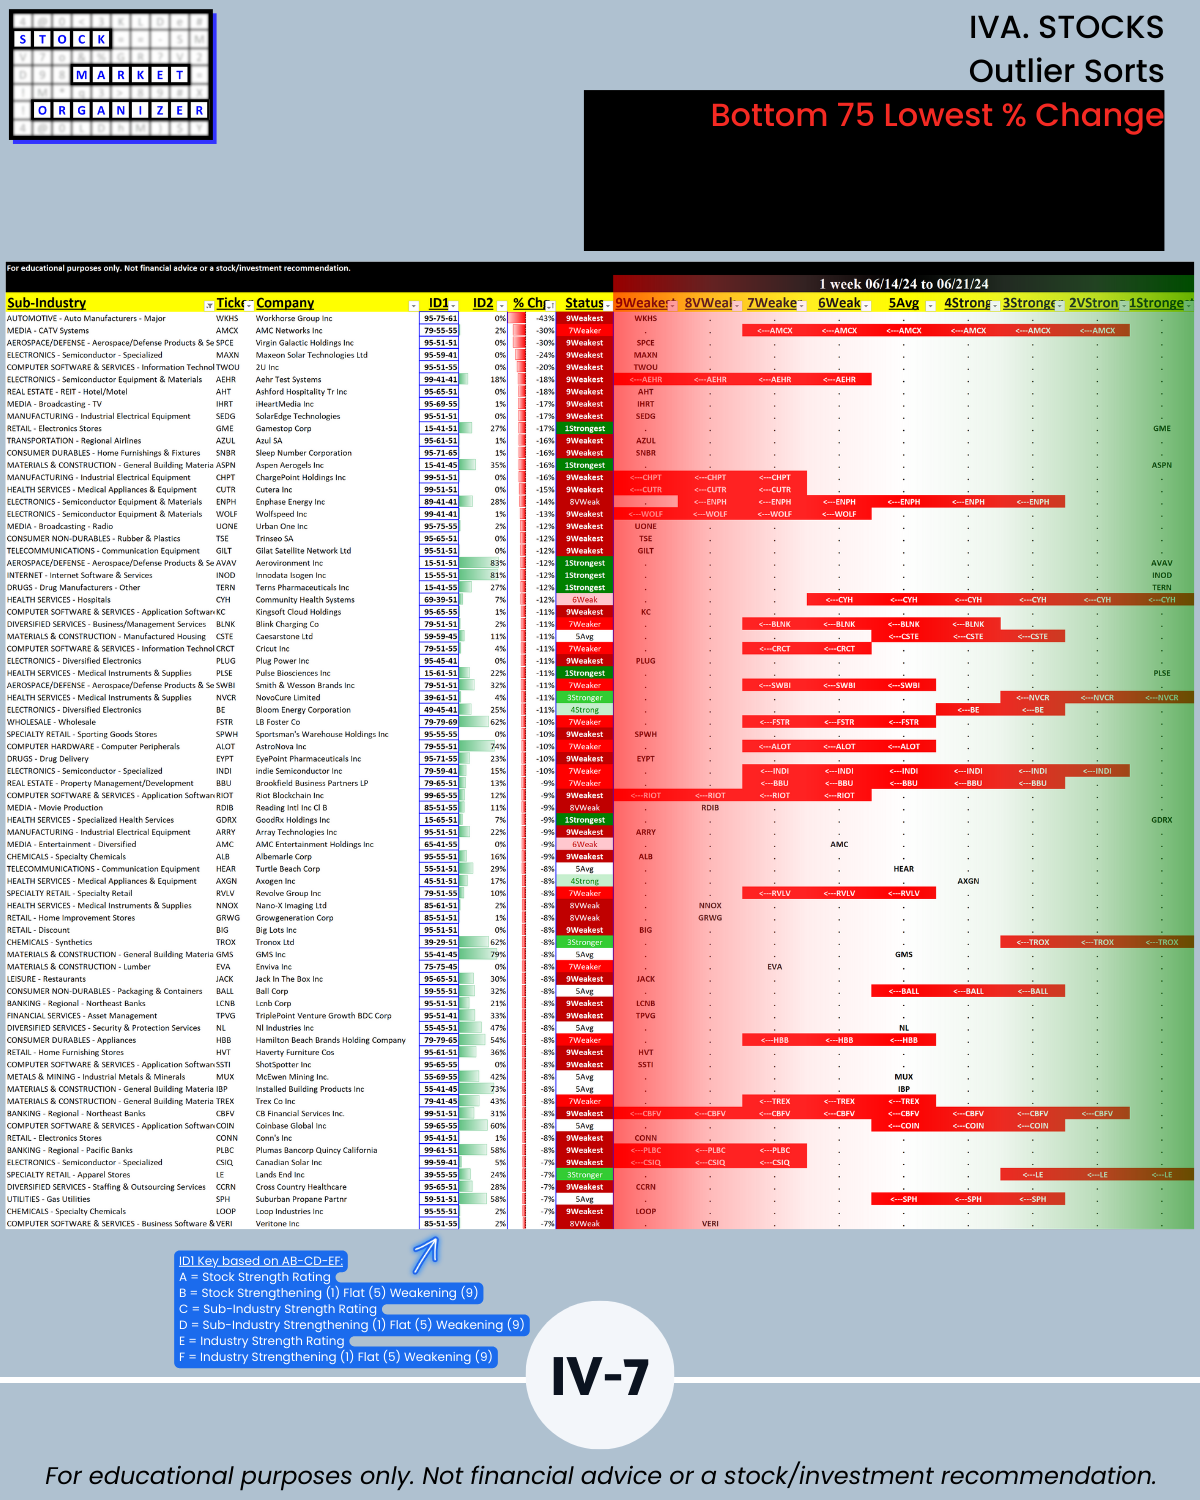
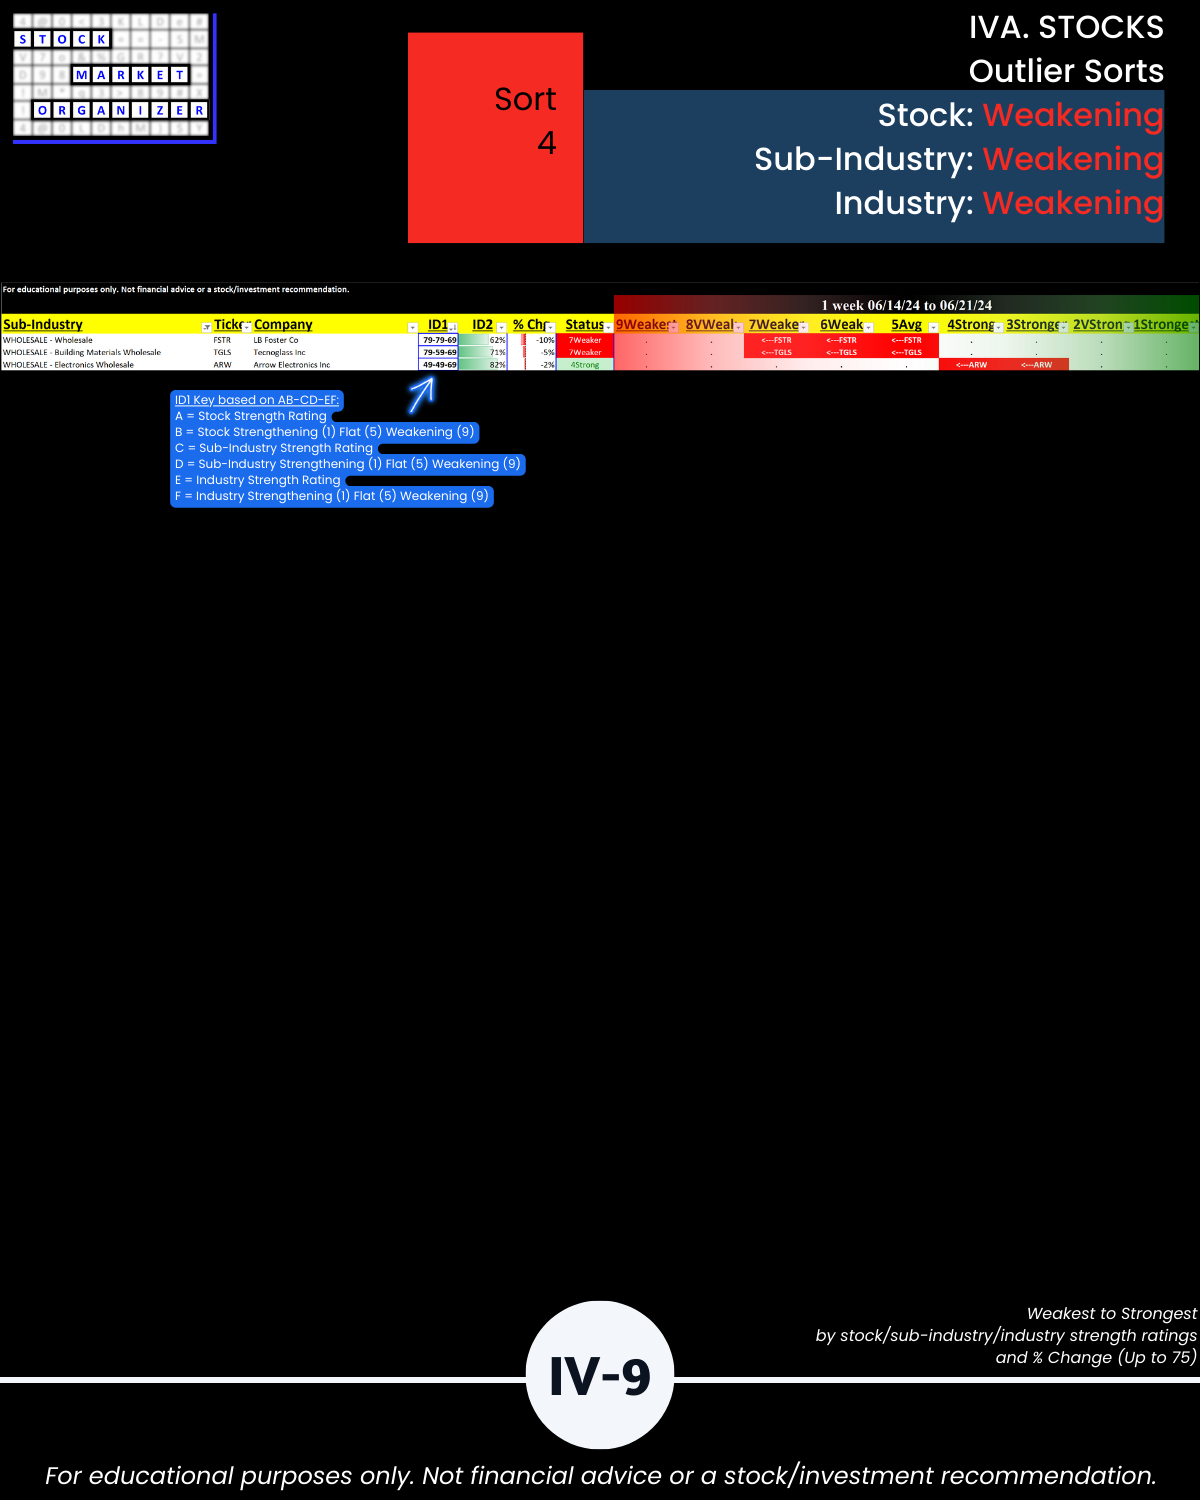
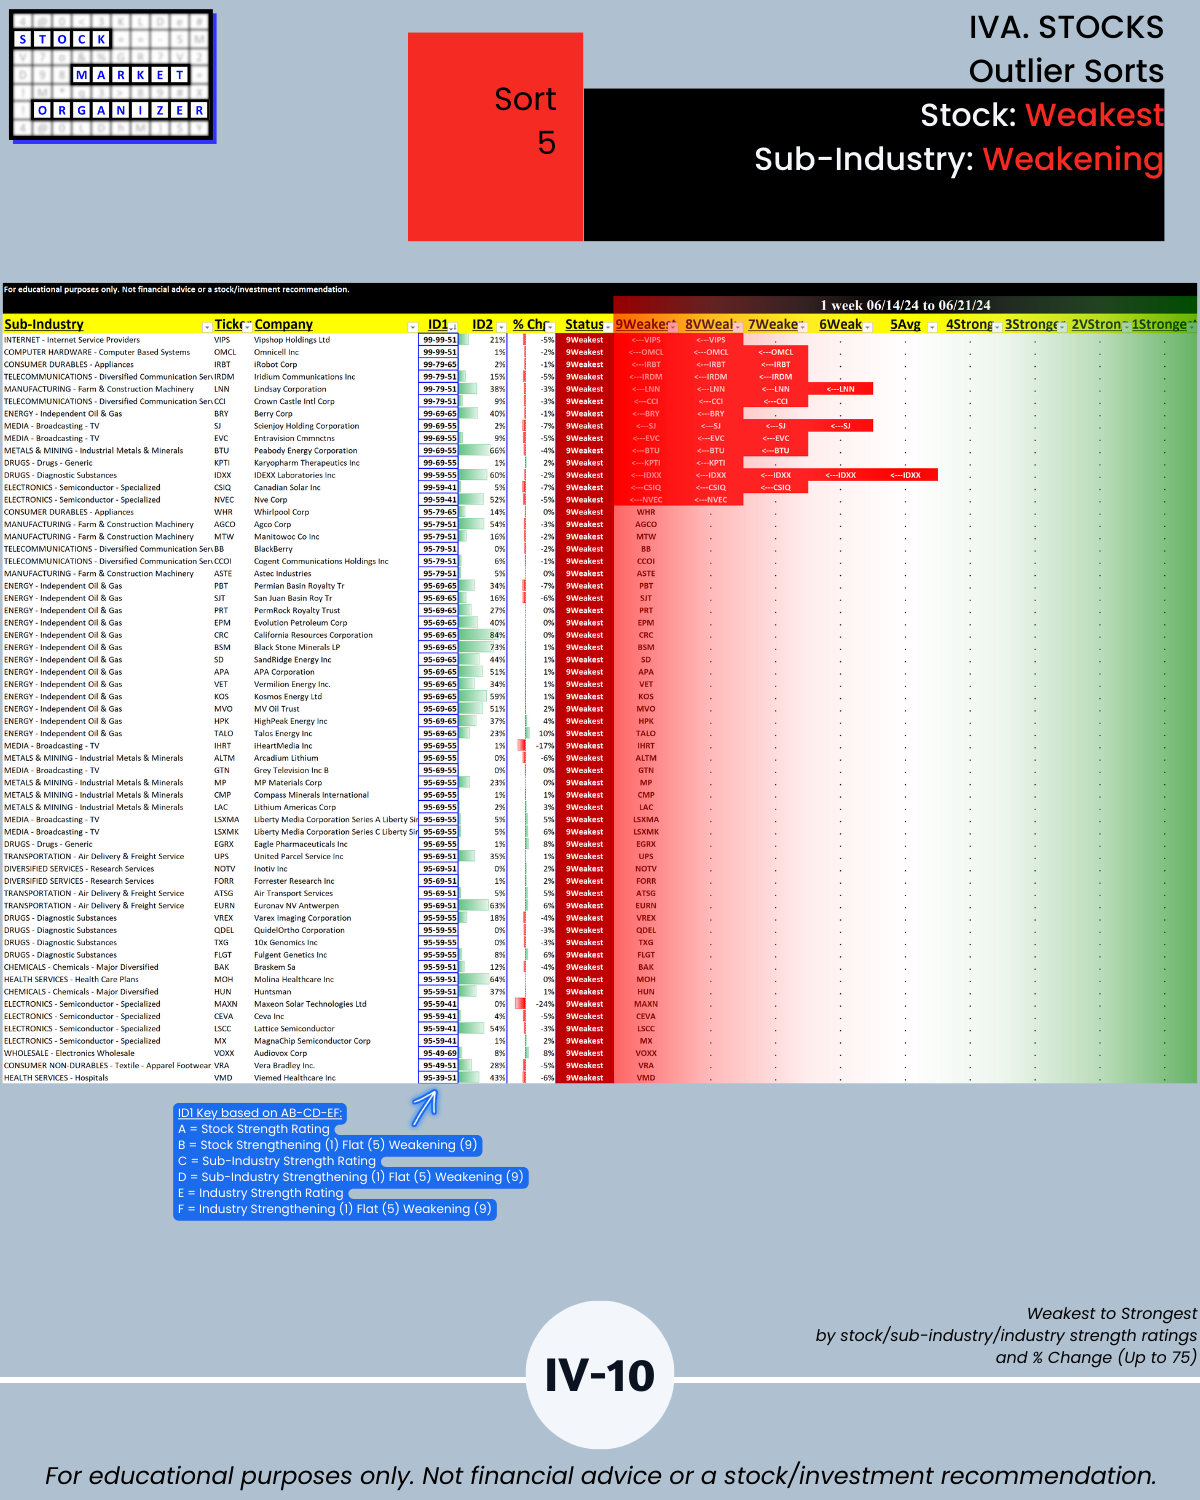
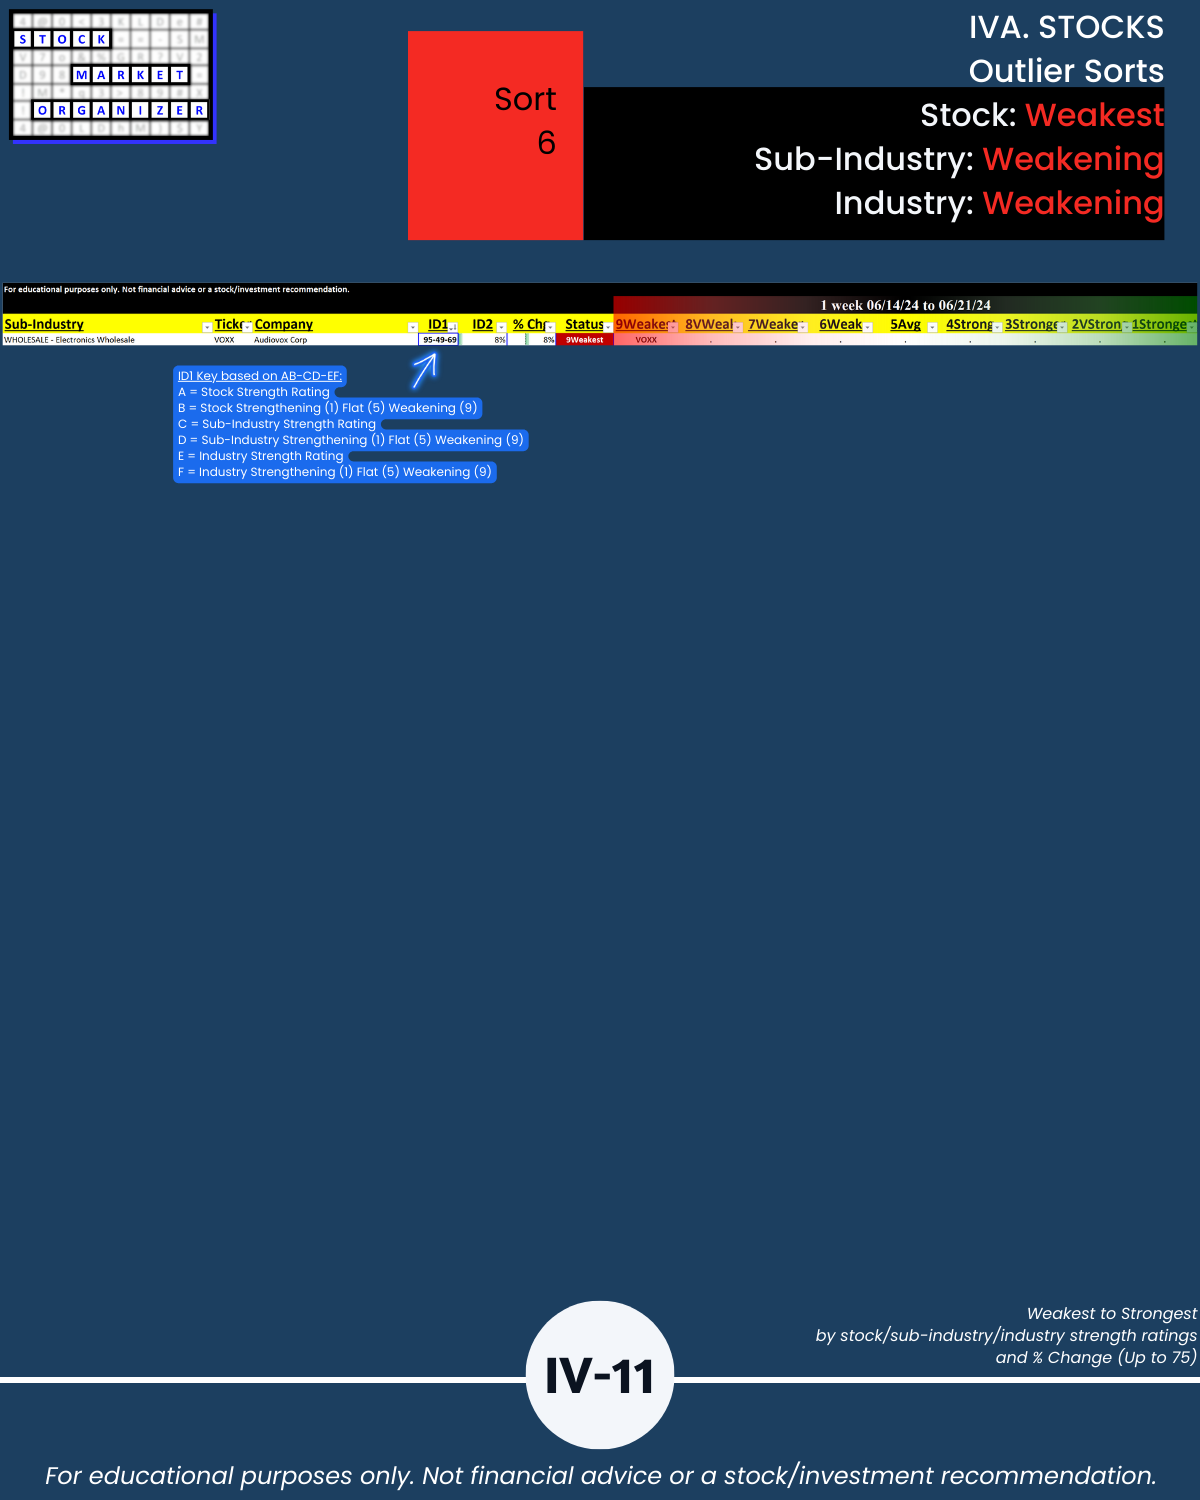
IVA. STOCKS Outlier Sorts
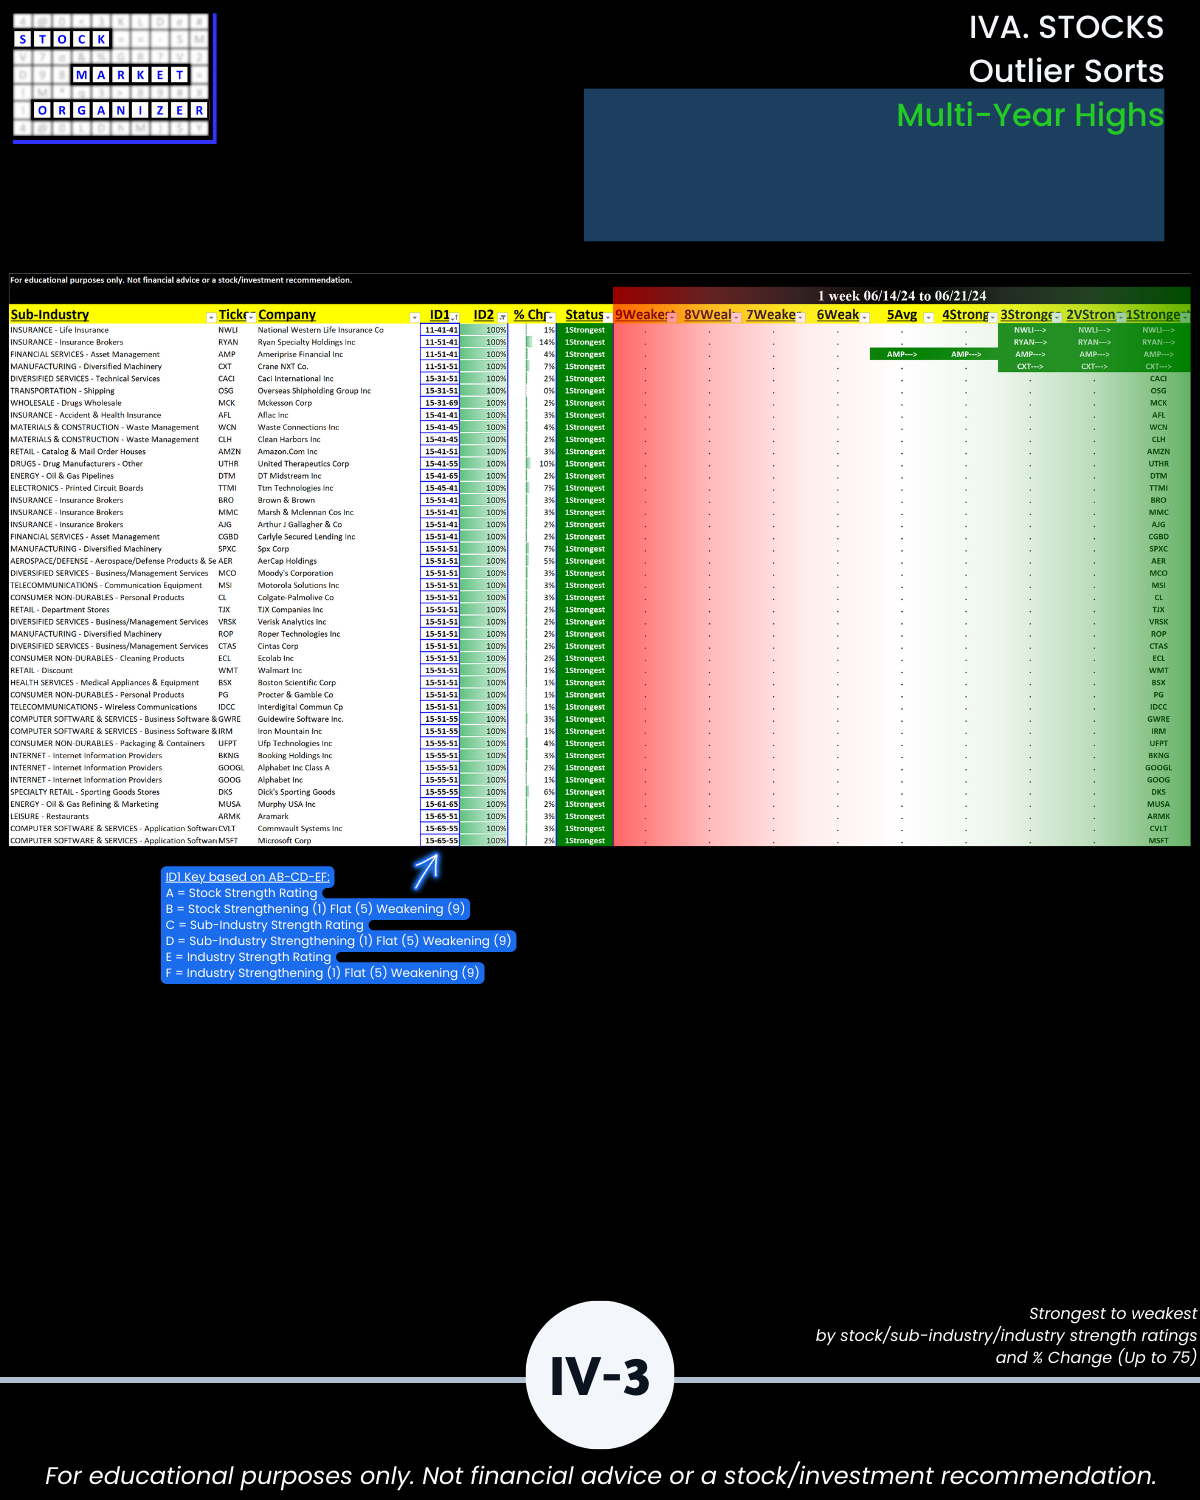
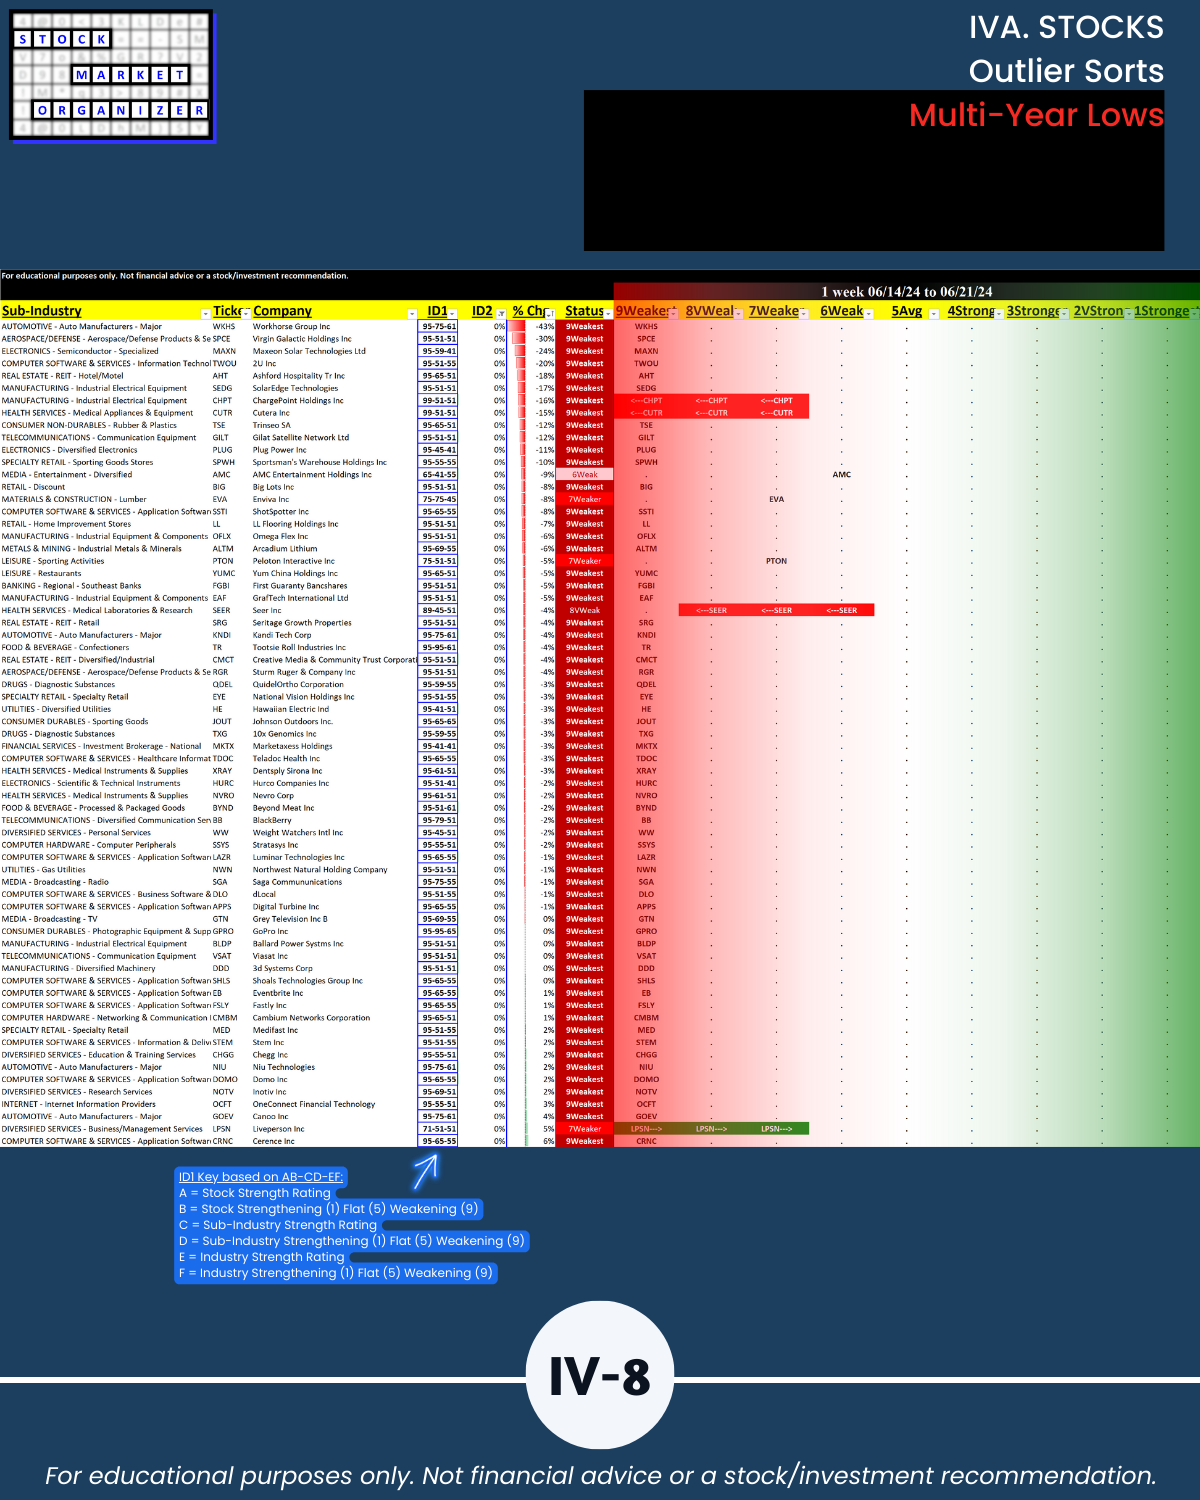
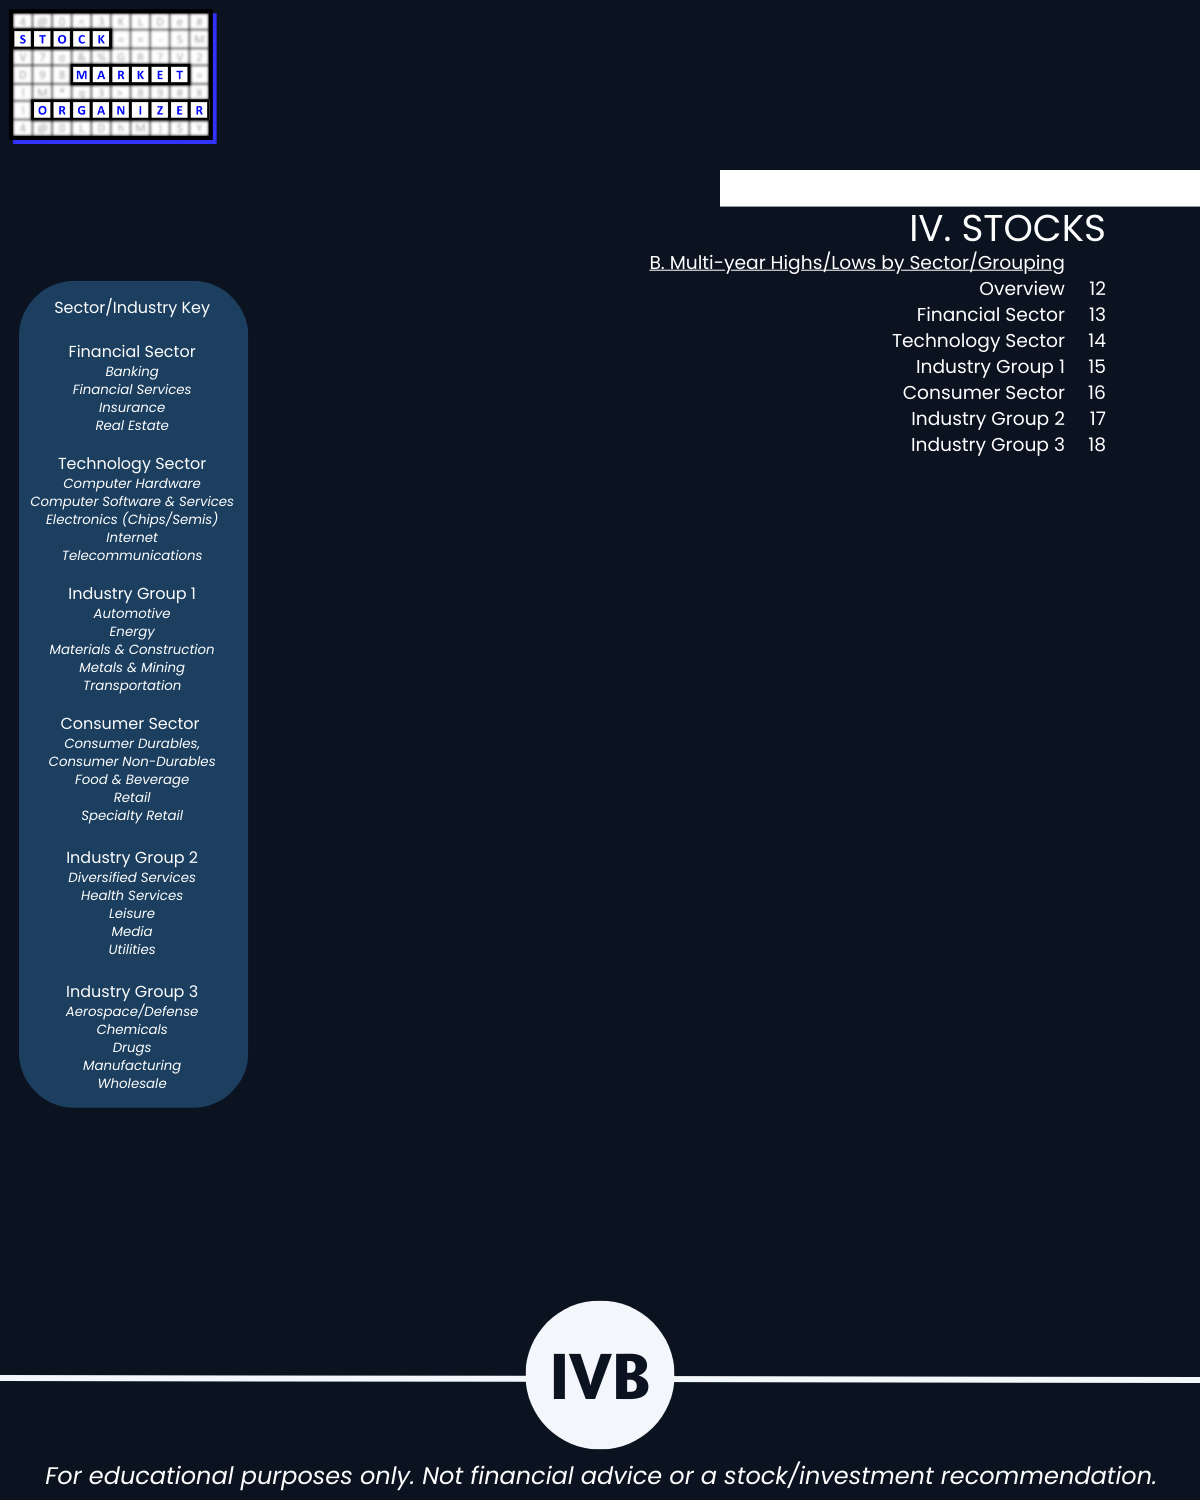
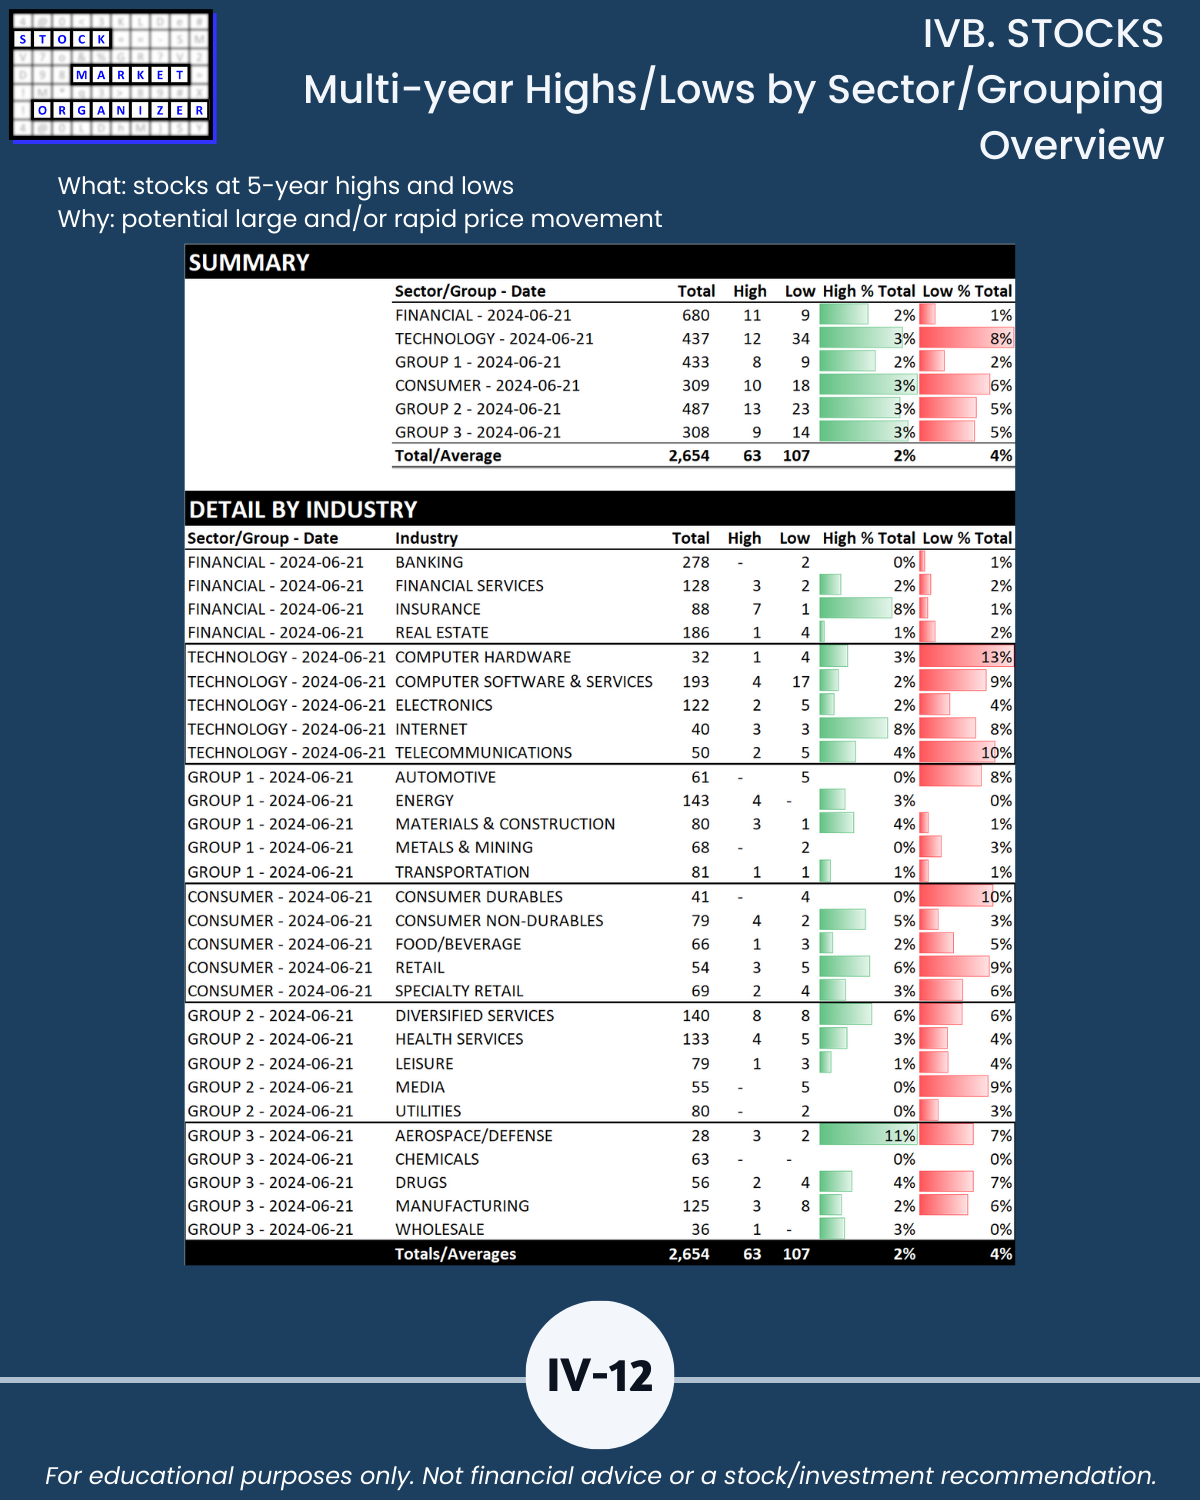
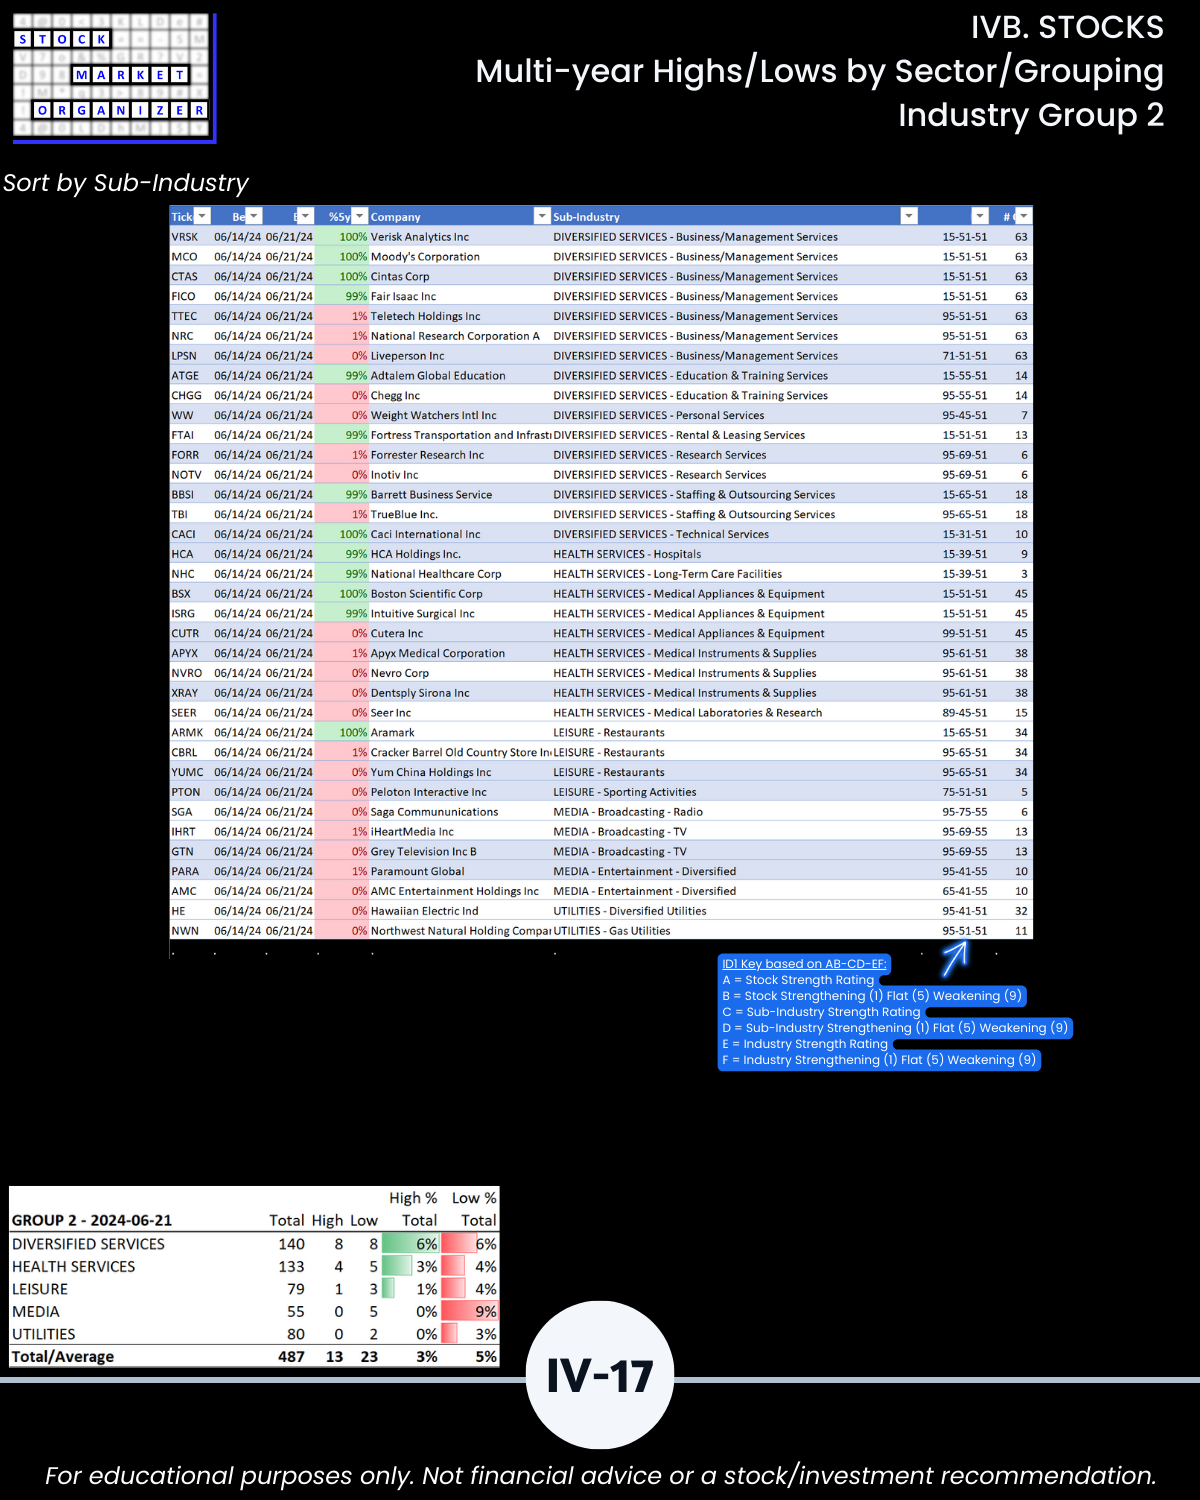
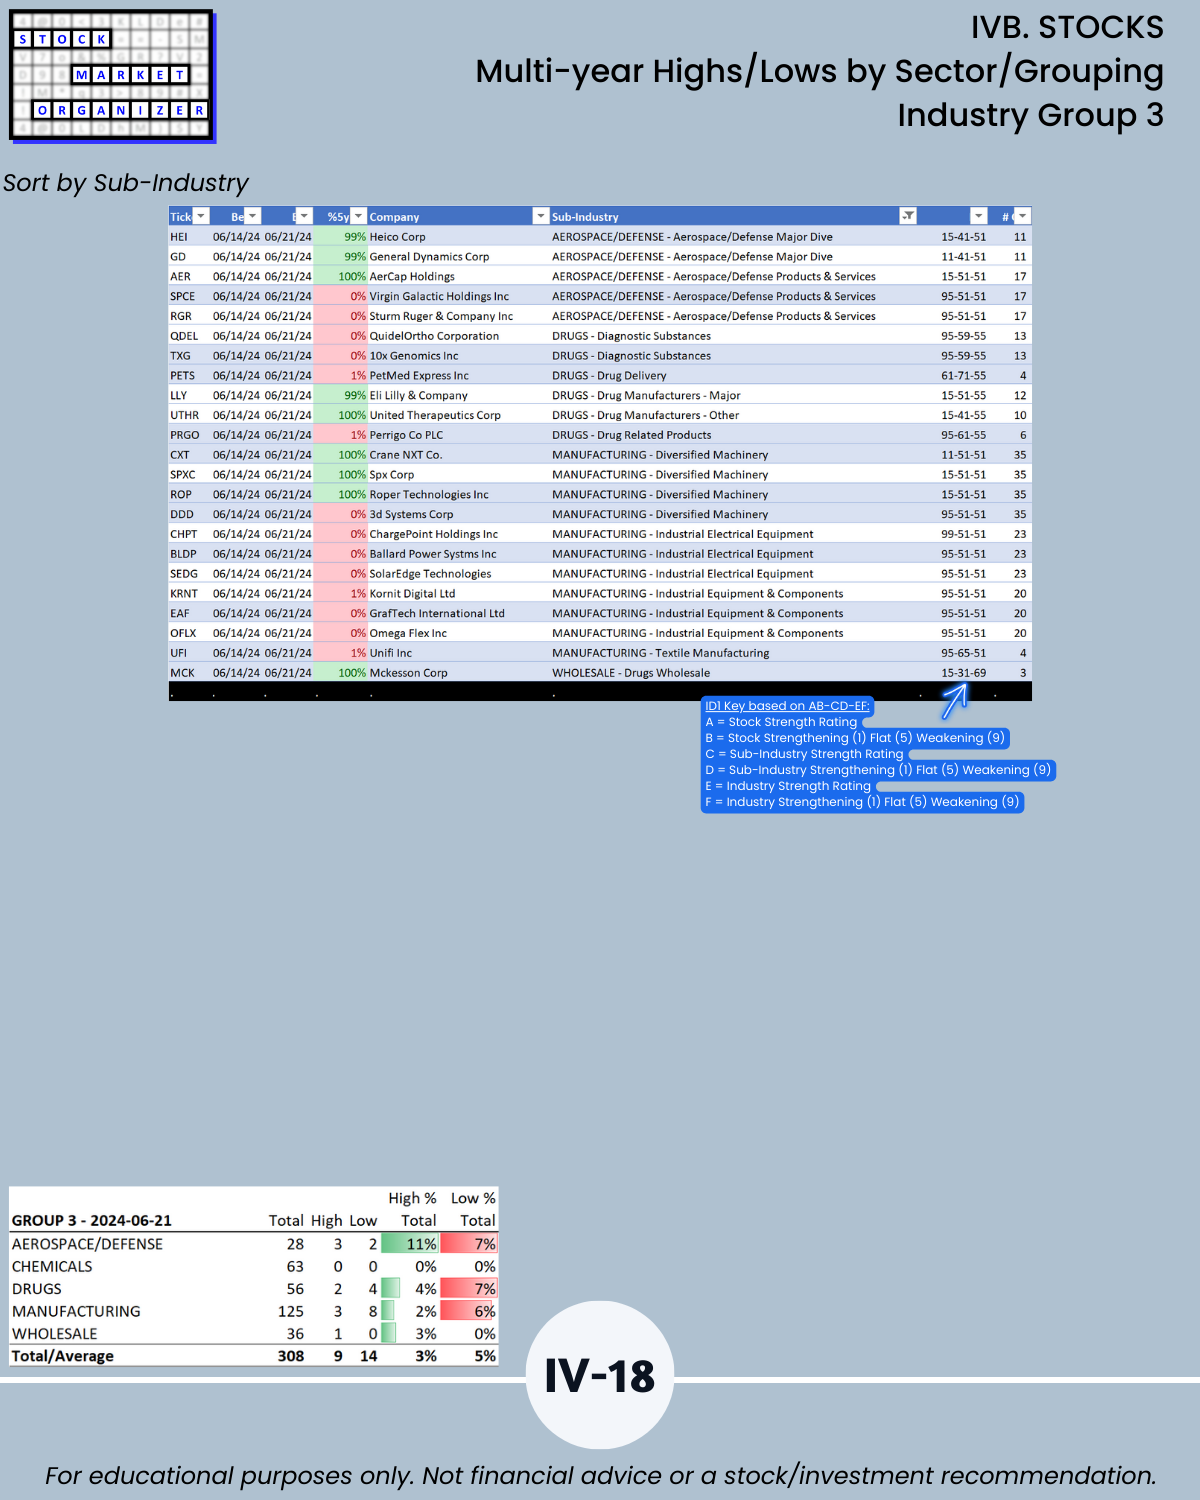
IVB. STOCKS Multi-Year Highs/Lows by Sector/Grouping
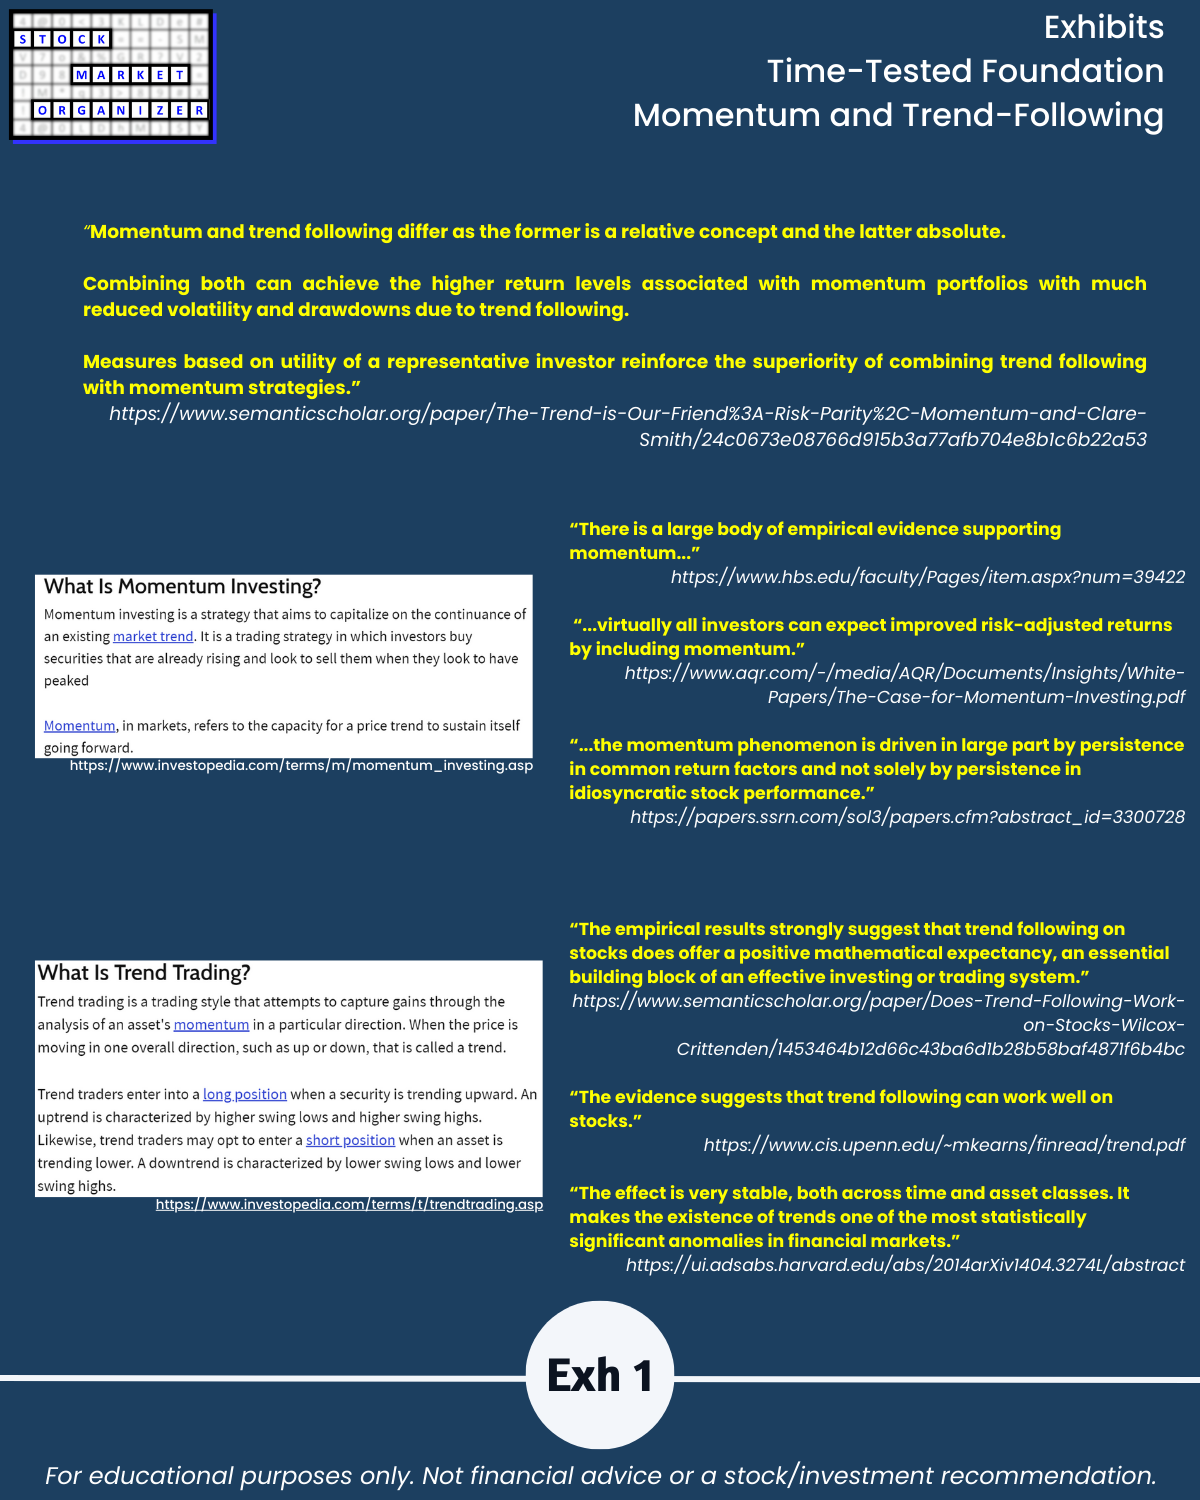
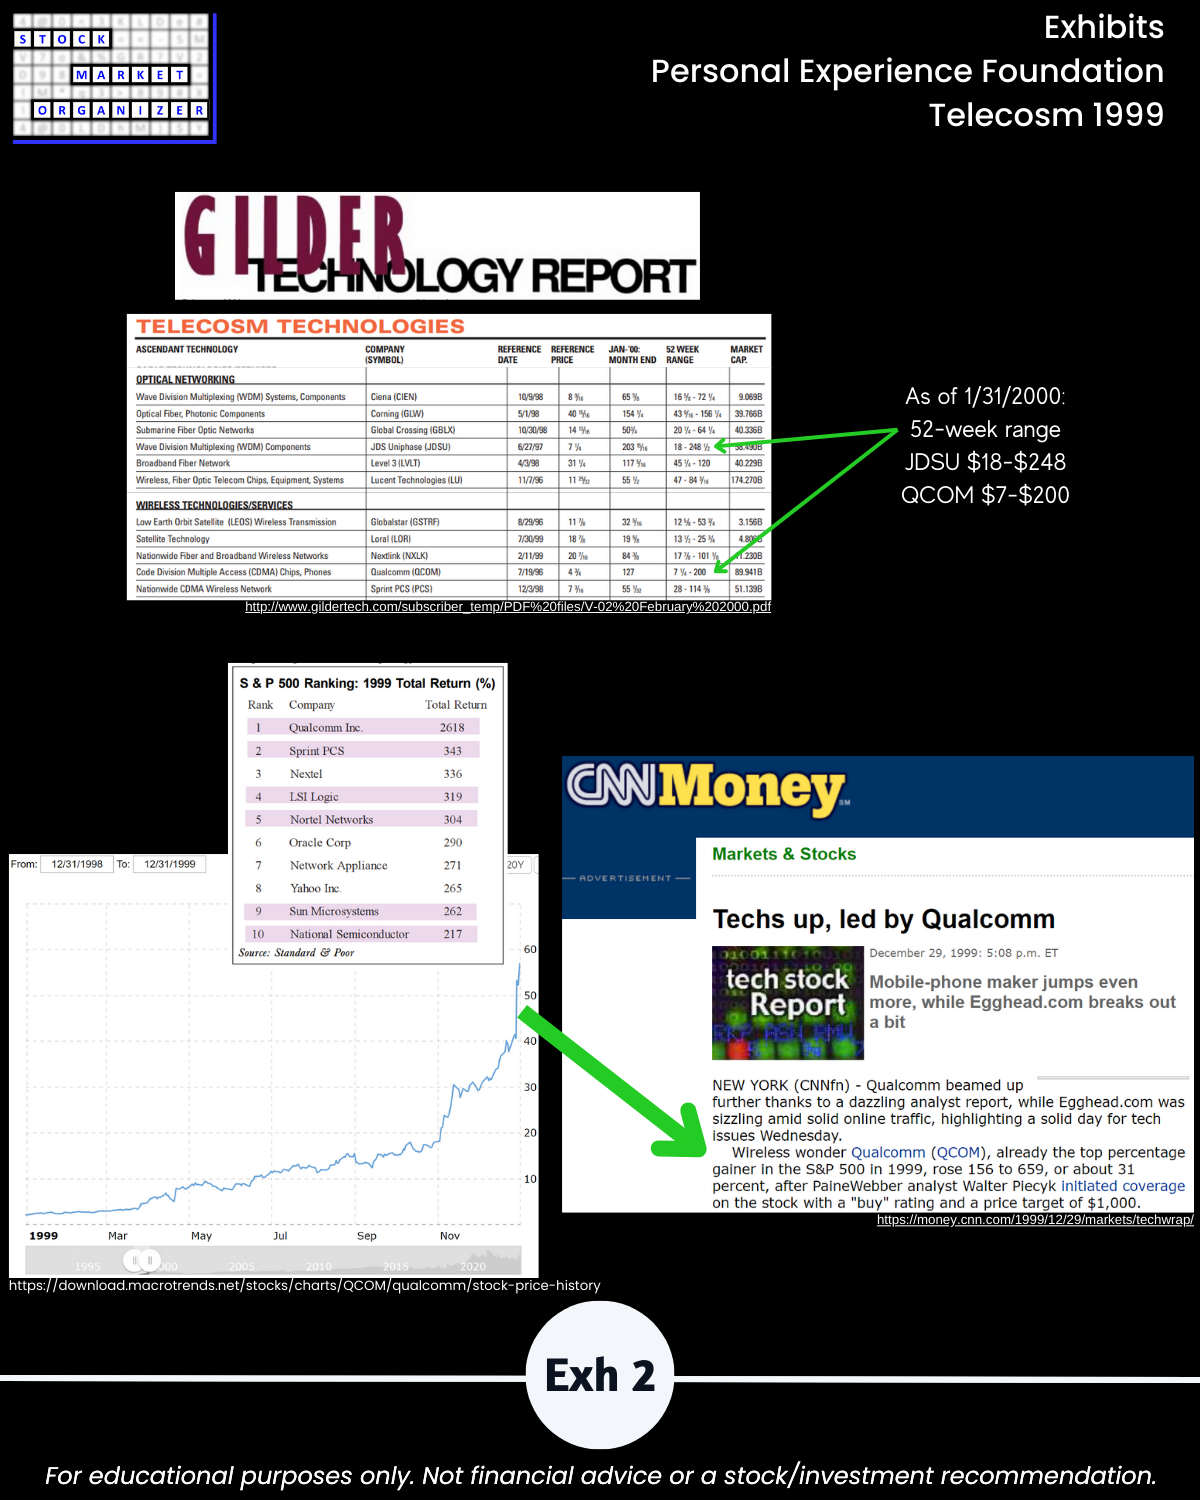
IV. EXHIBITS System Foundations