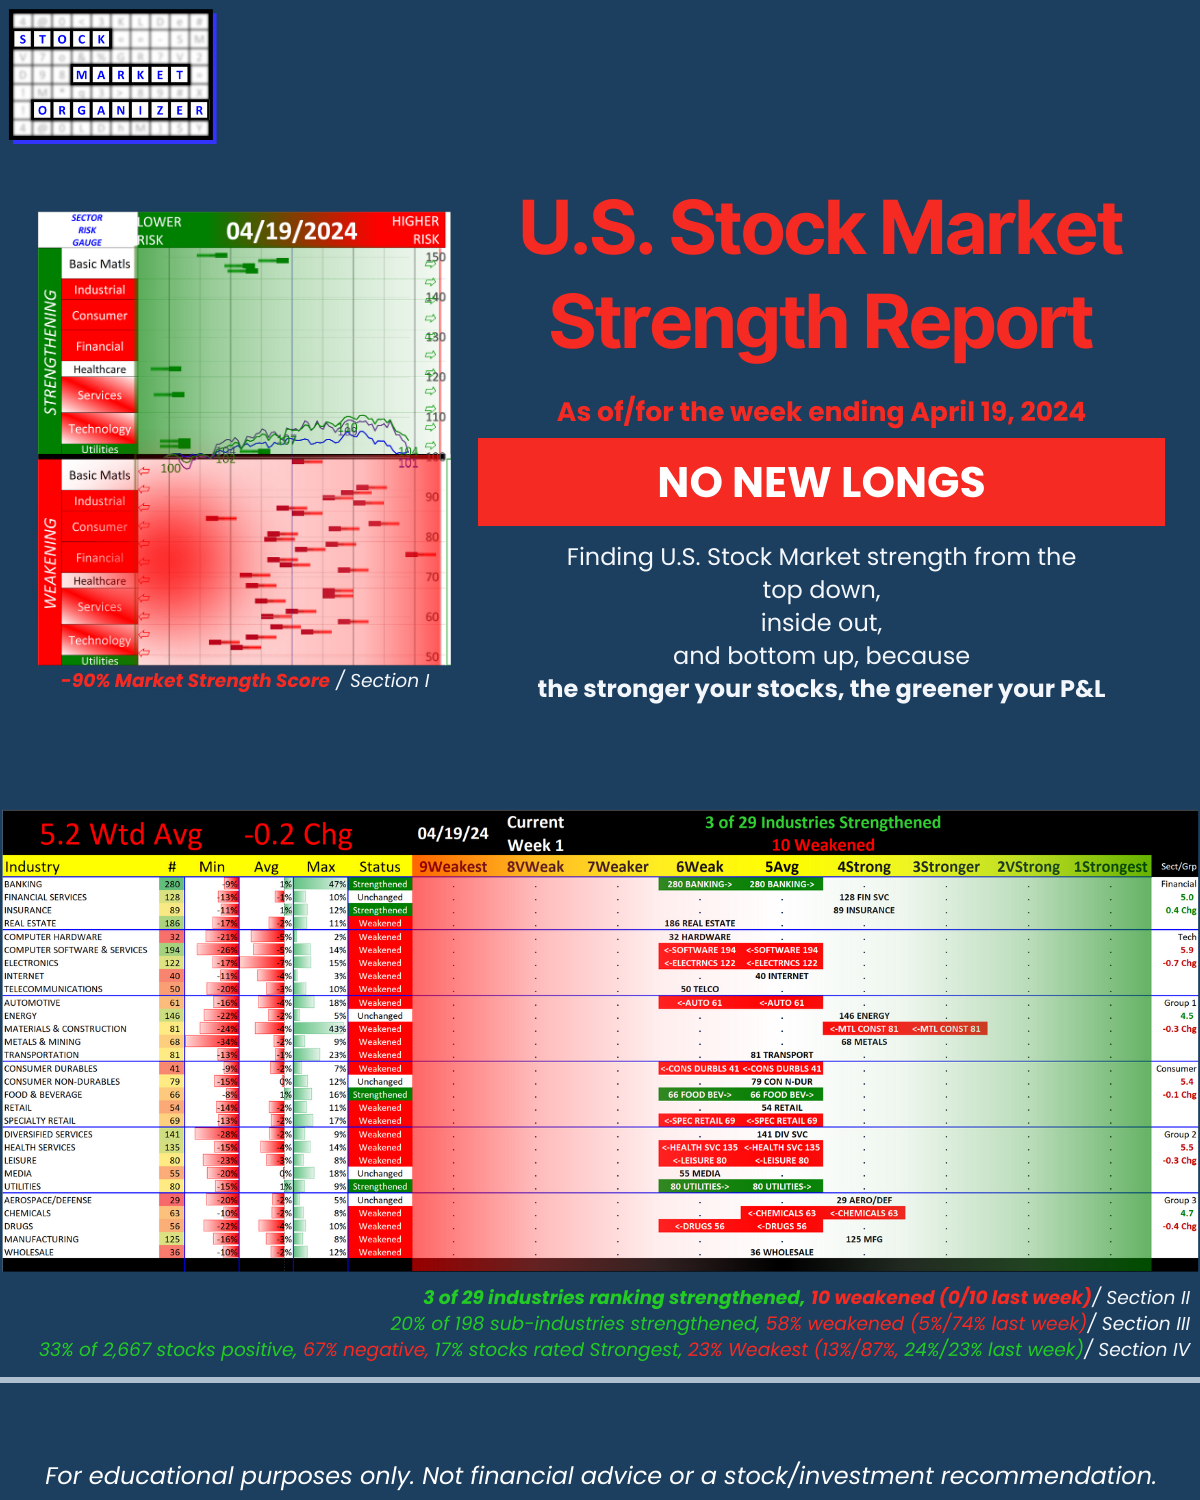
SMO Exclusive: U.S. Stock Market Strength Report 2024-04-19 (no new Longs)

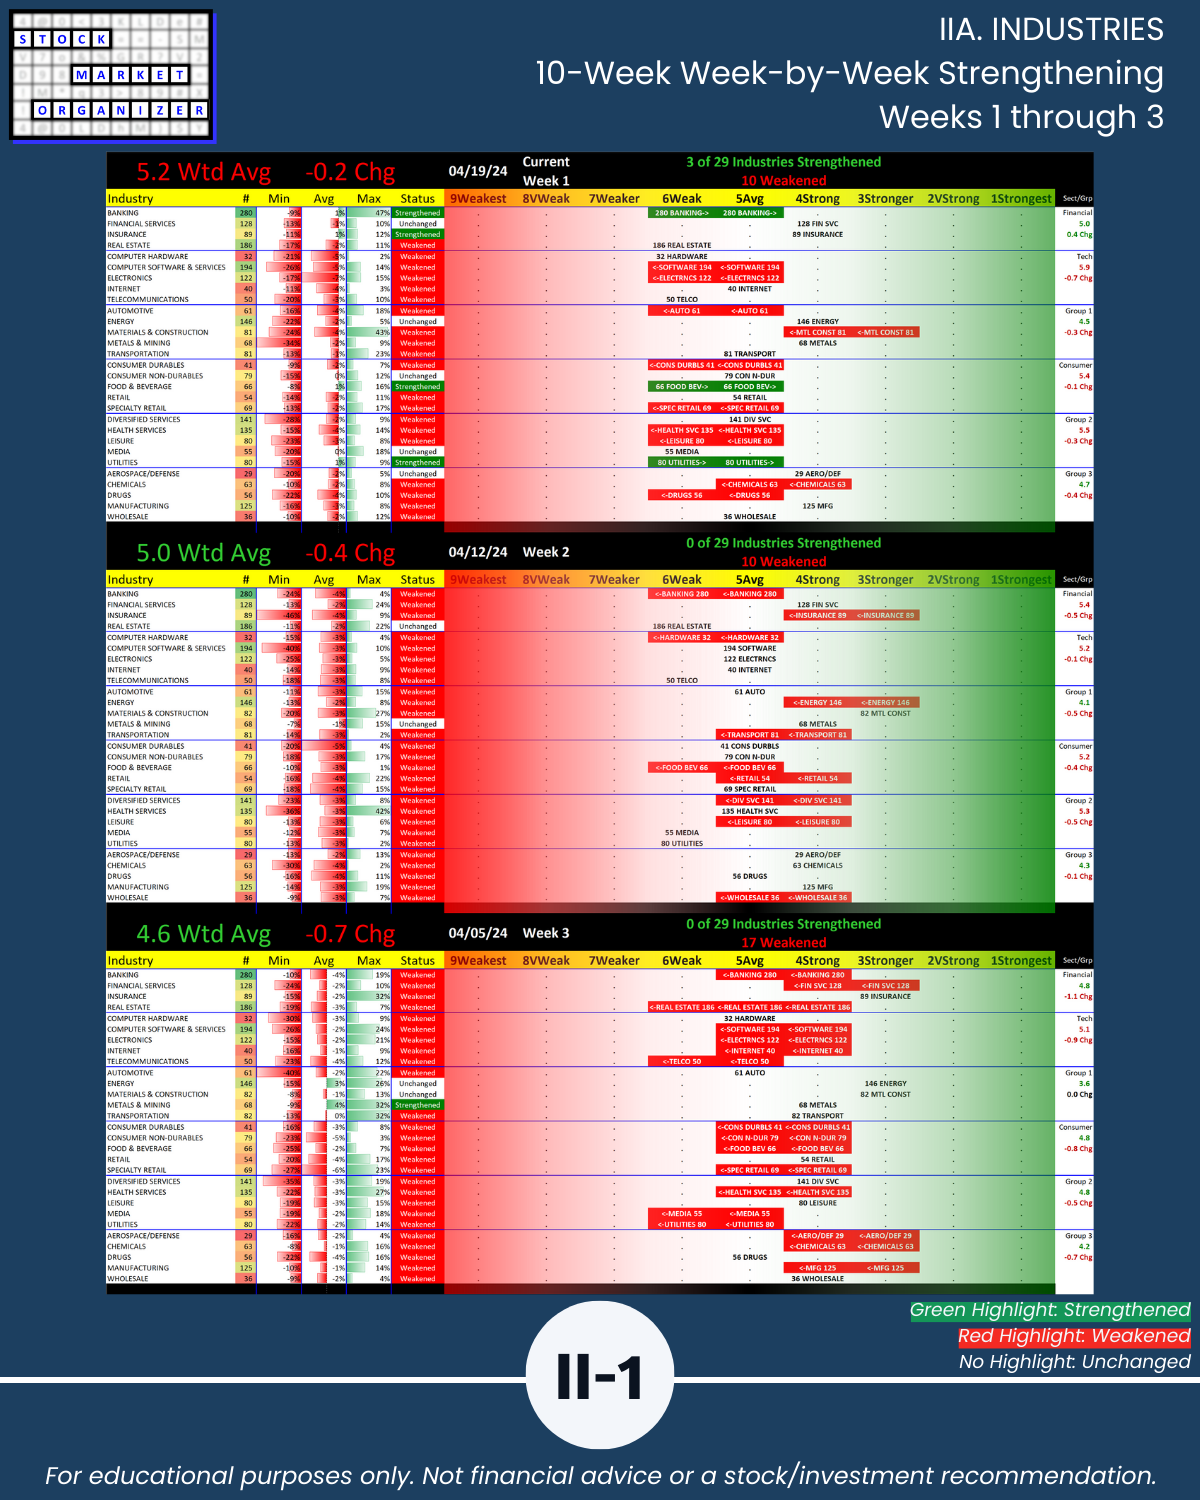
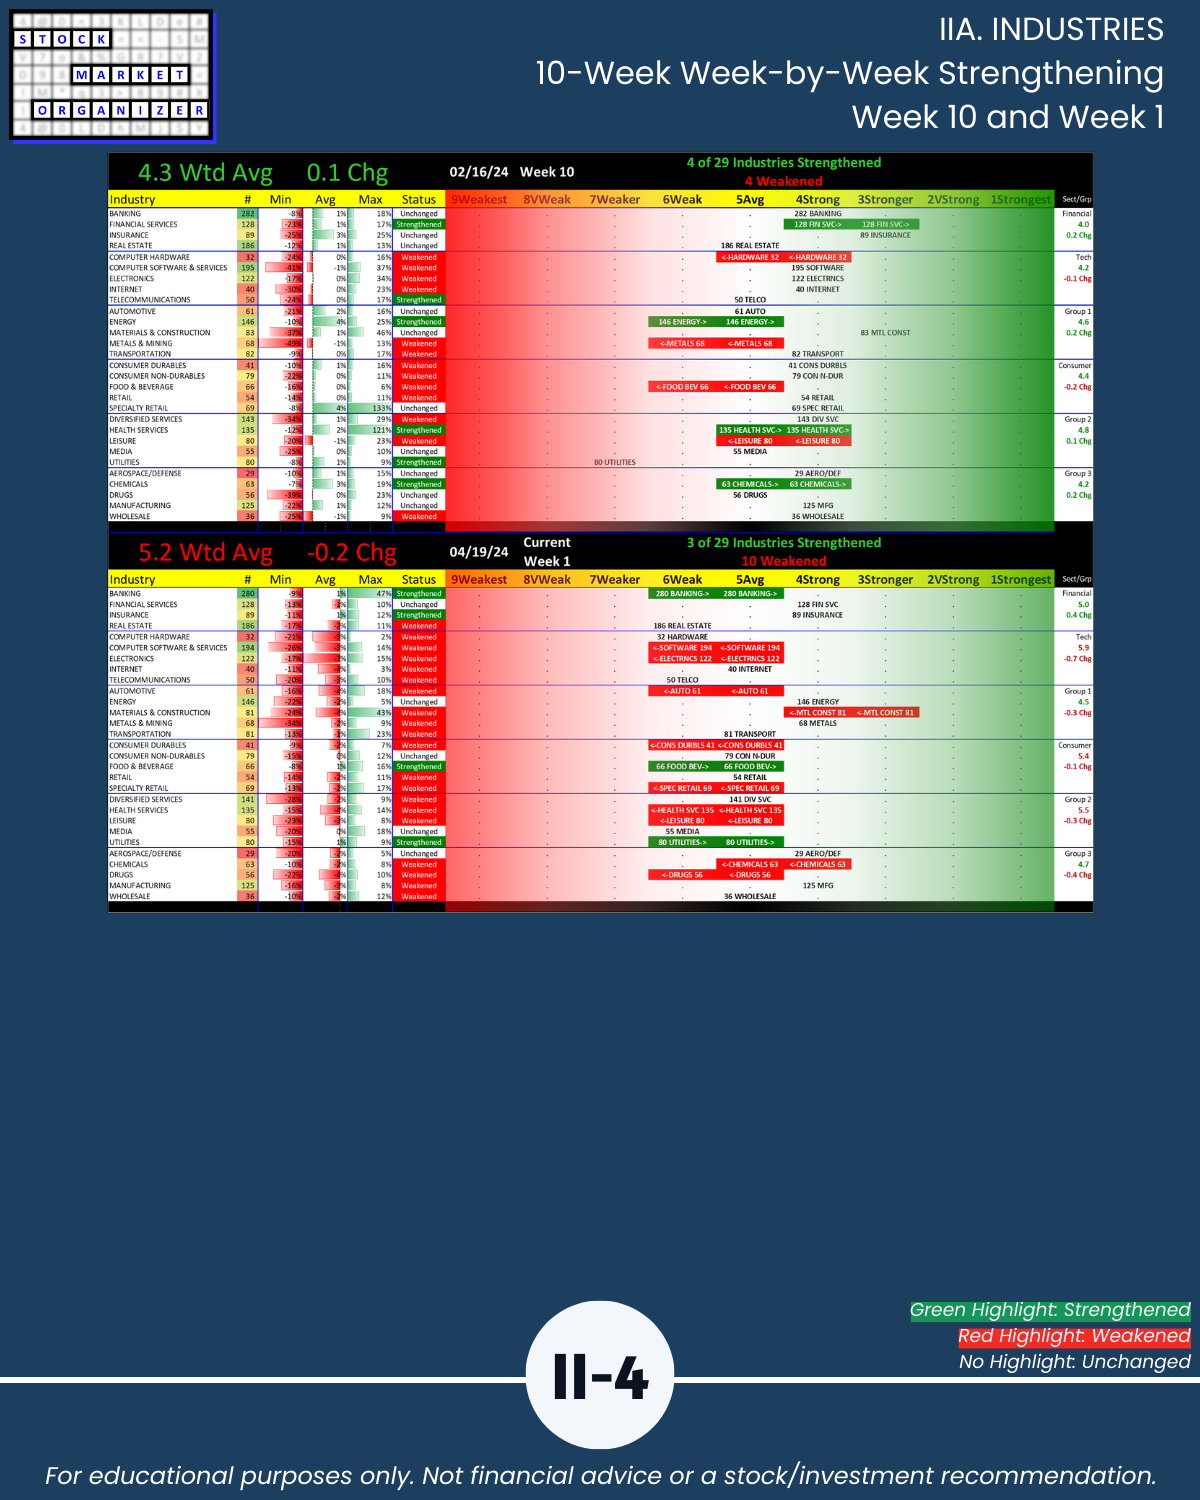
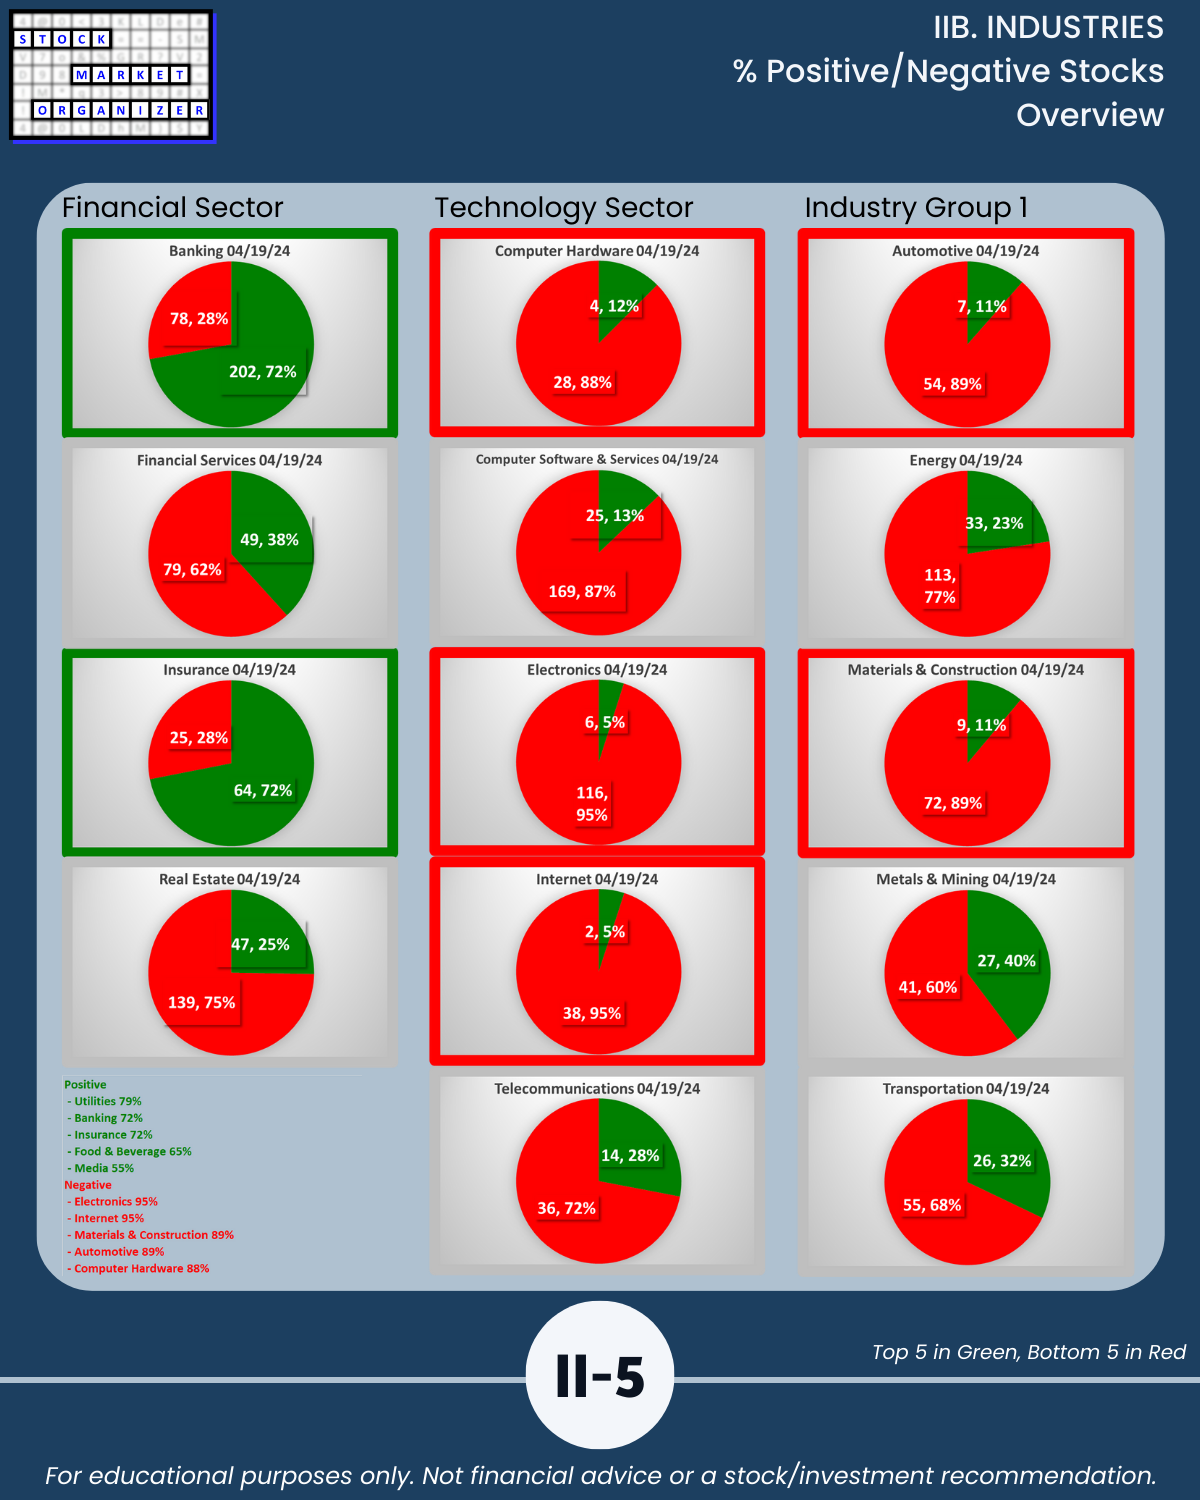
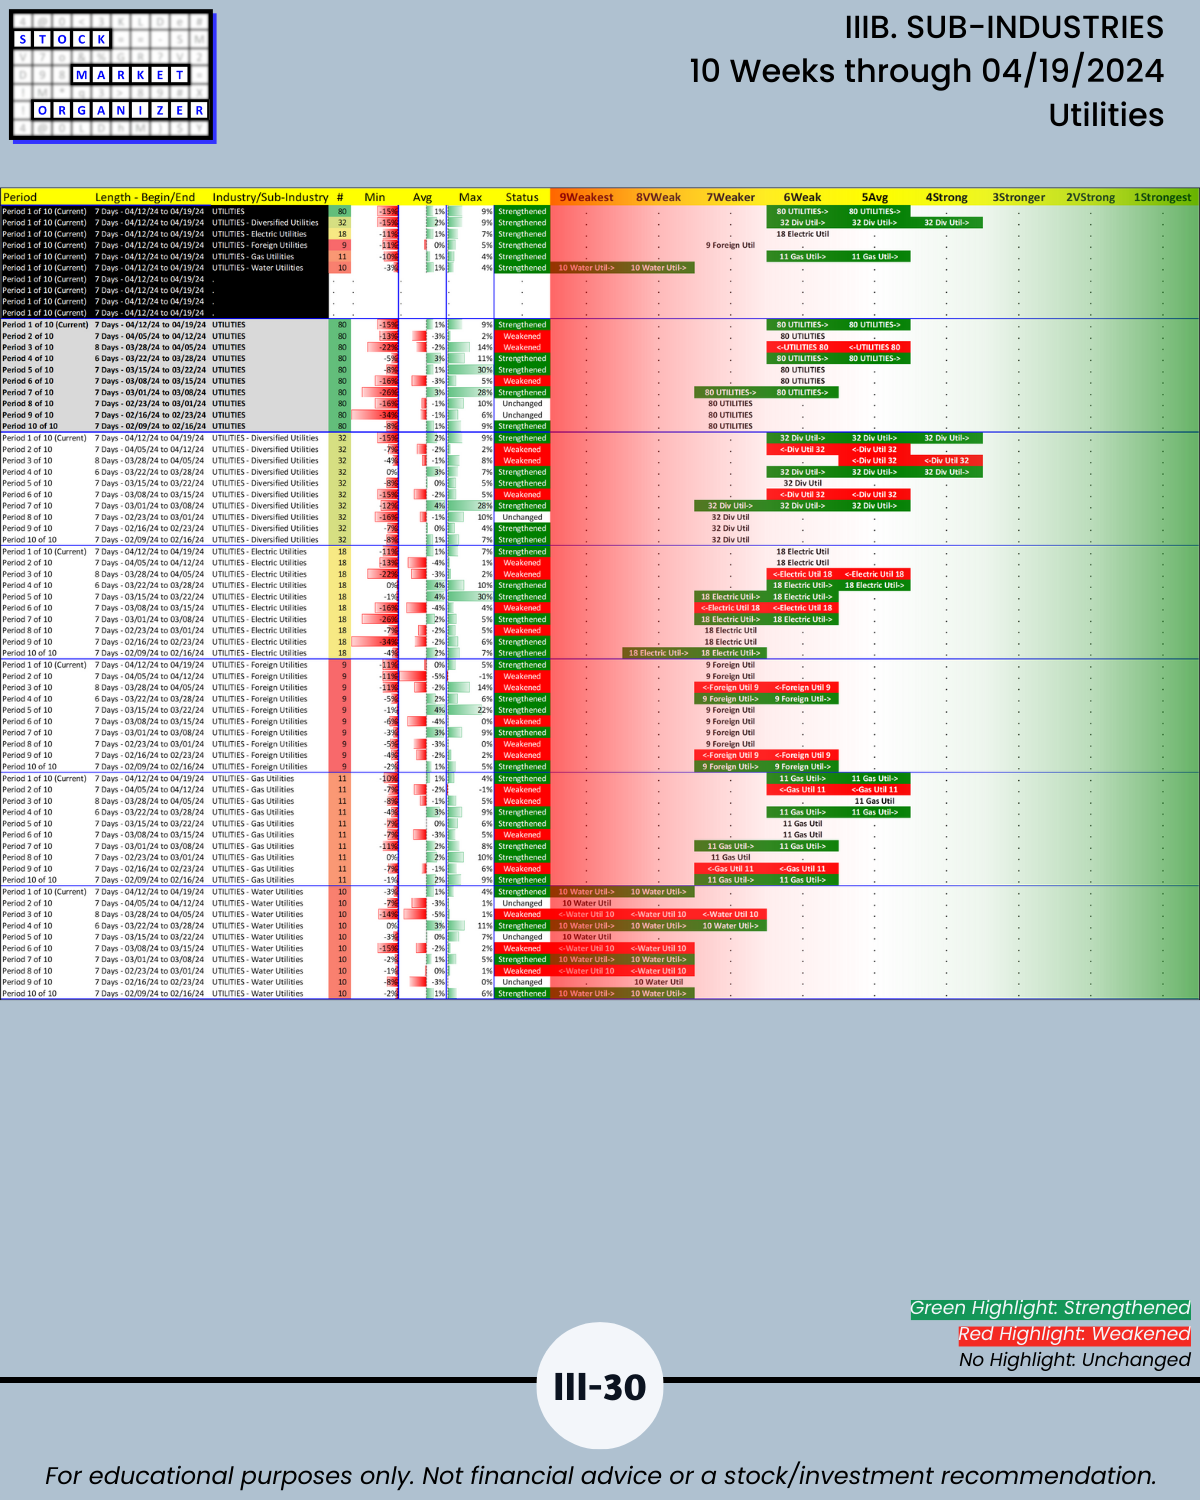
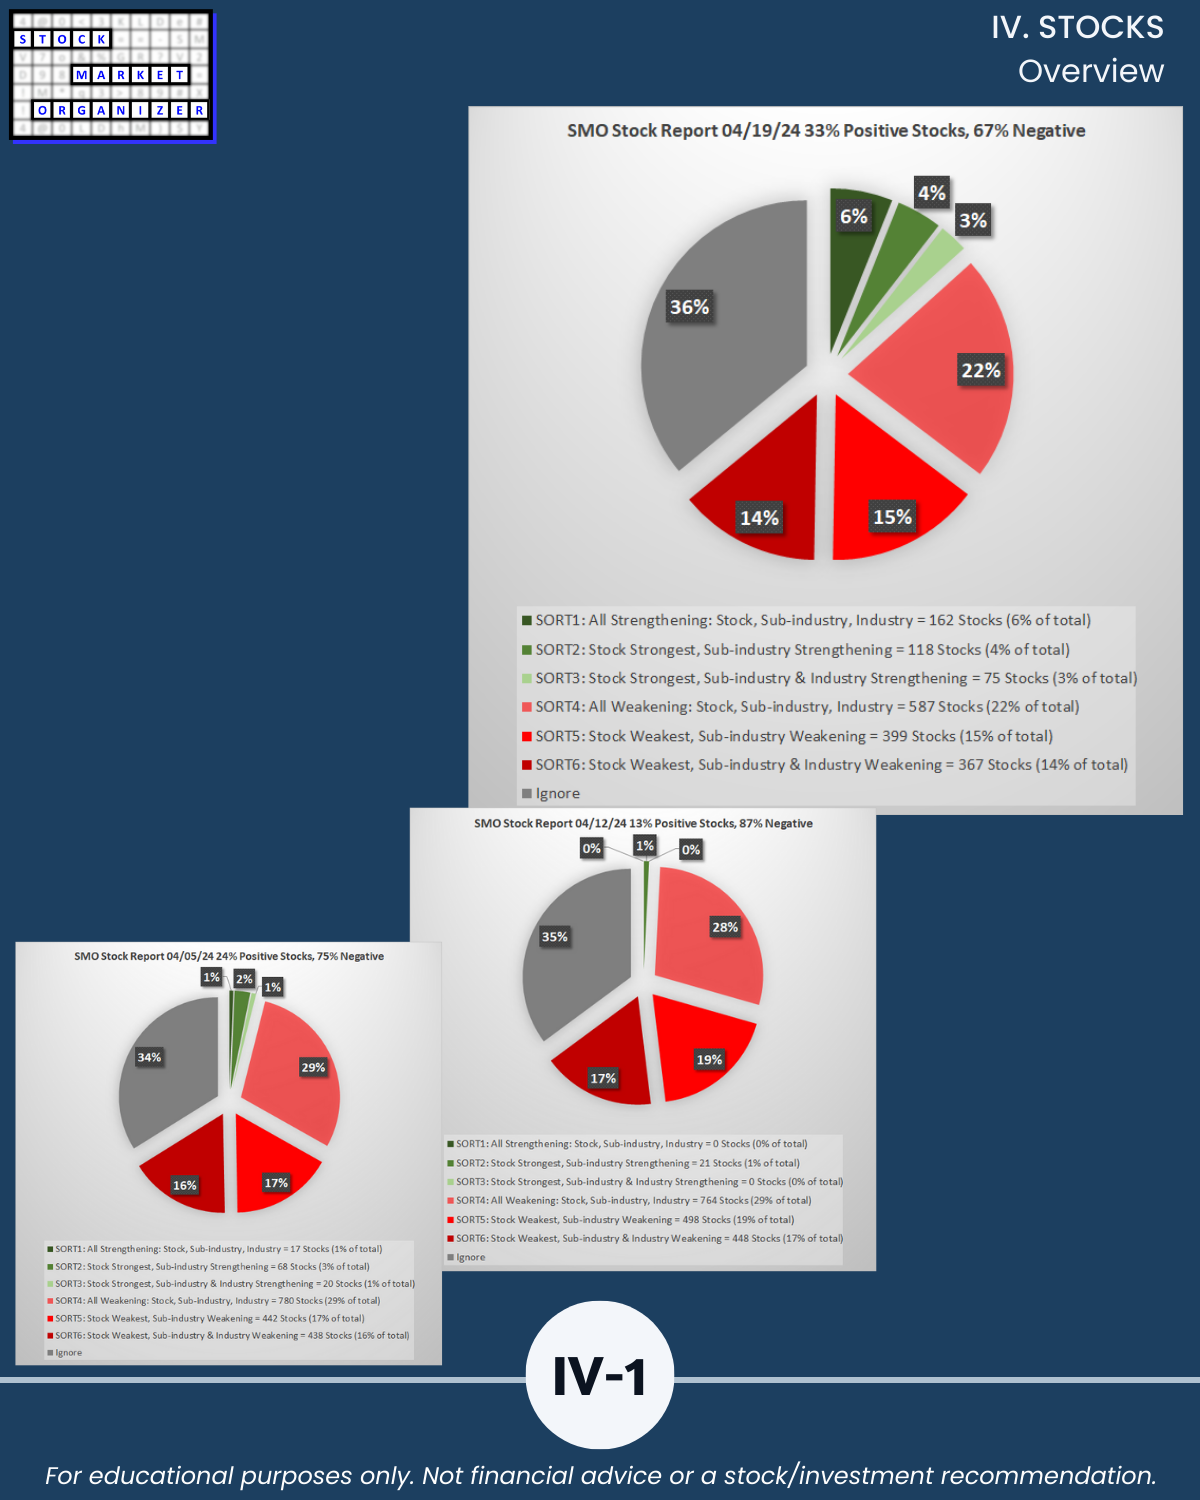
U.S. stock market 4/19/24 - to convert confusing chaos into crystal clear, calming context, see the attached unique strength-focused review. It looks at the market from the top-down, inside-out, and bottom up. It is original with insights unavailable elsewhere that will complement all other market views. Including yours. BOTTOM LINE – LESS WEAKENING STILL MEANS WEAKENING. (Especially if you own NVDA and/or SMCI.) By the numbers: 🔹 29 industries: 3 strengthened rankings (Banking, Food & Beverage, and Utilities) as 10 weakened (vs. 0/10 last week), 🔹 198 sub-industries: 20% strengthened and 58% weakened (vs. 5%/74% last week), 🔹 2,667 stocks: 67% negative (vs. 87% last week).
For more in the attached:
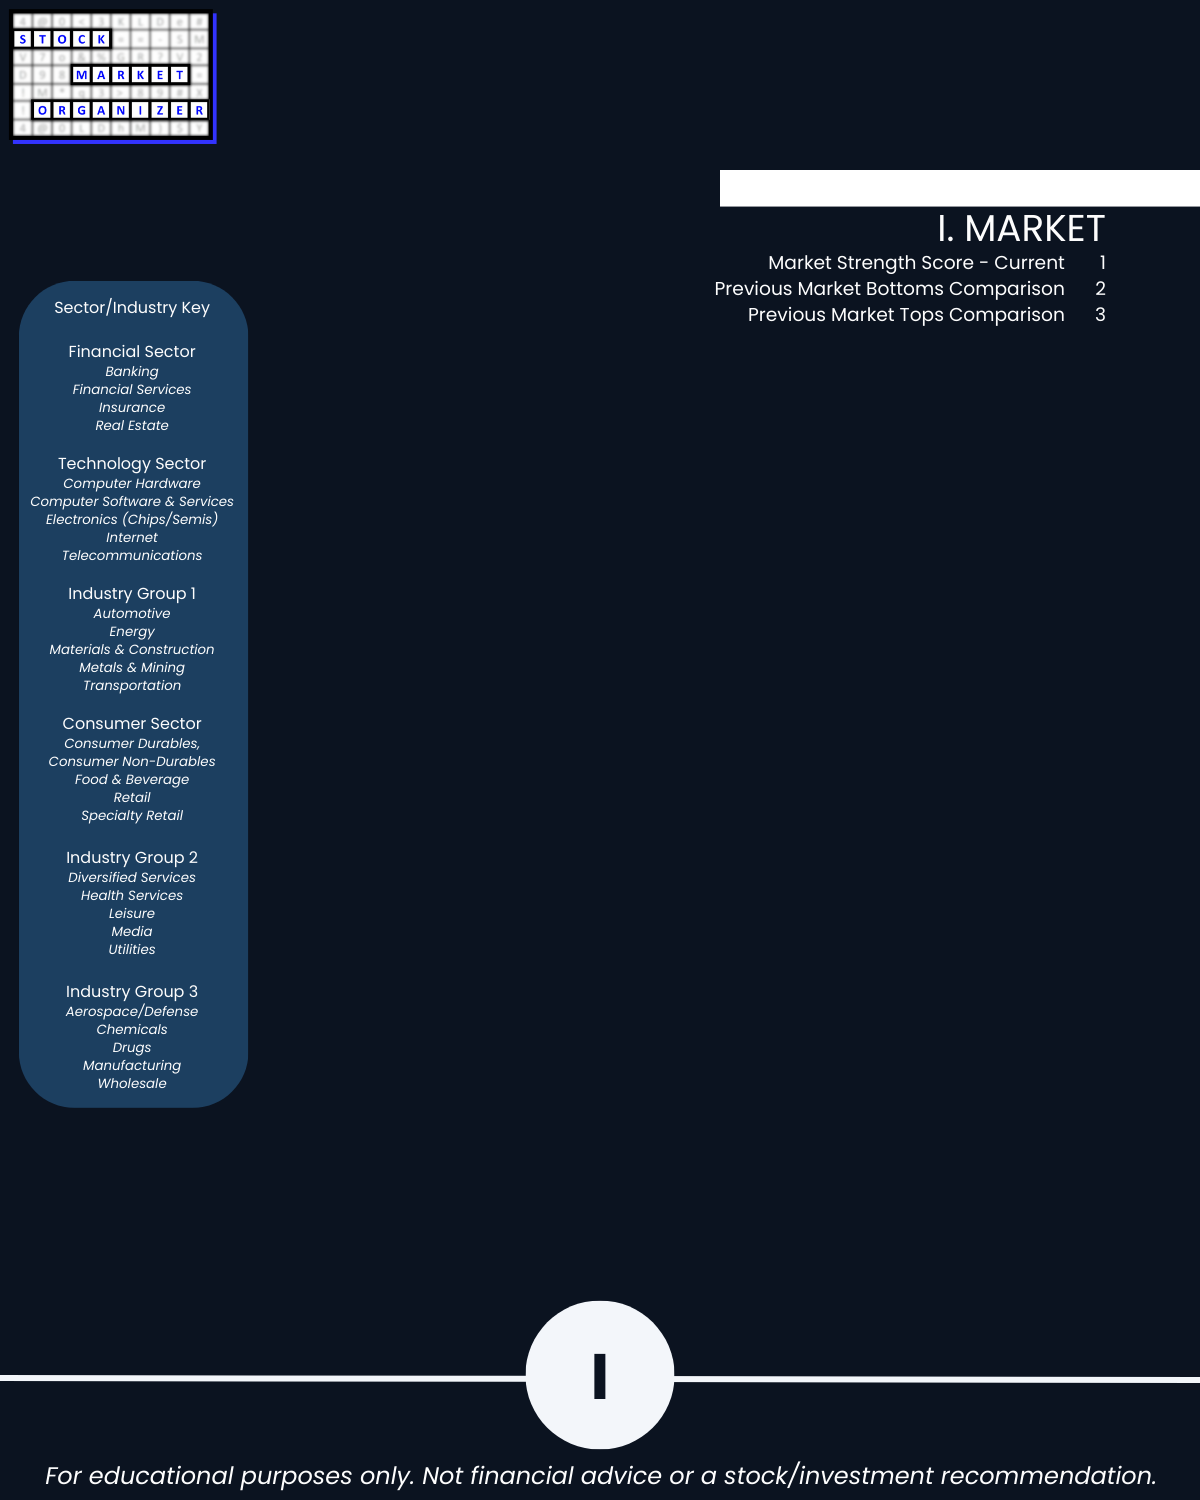
Market: Section I
Industries: Section II
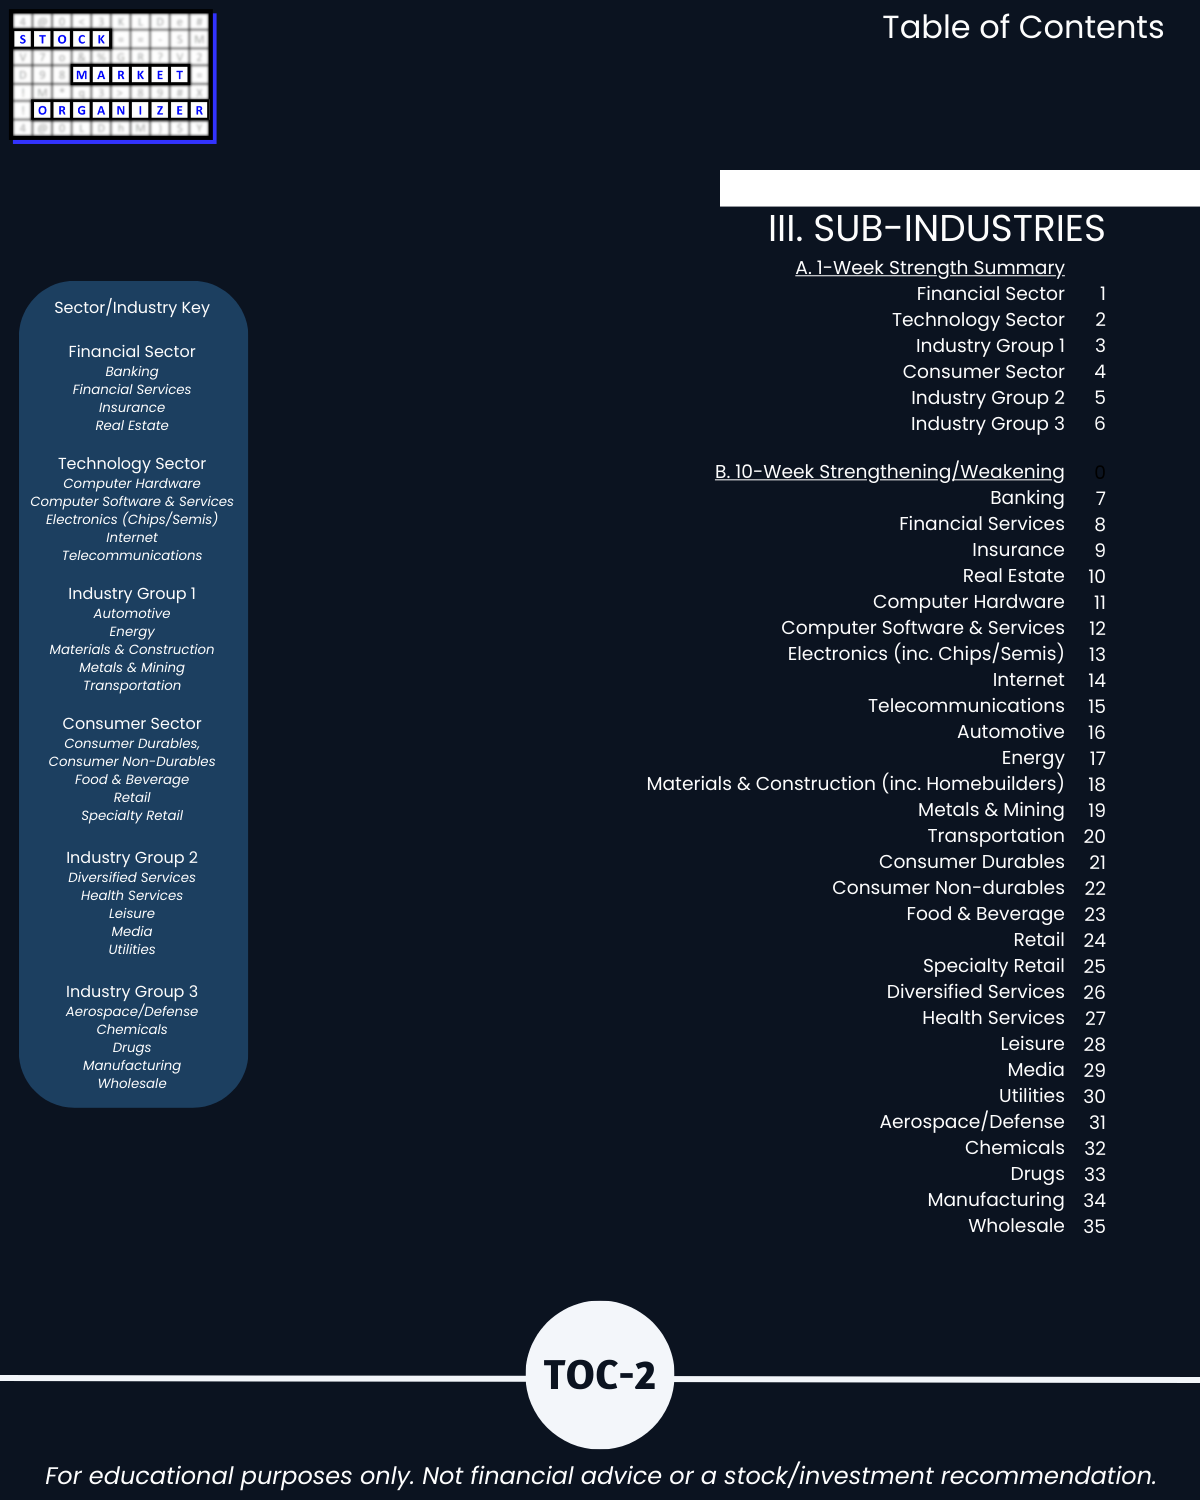
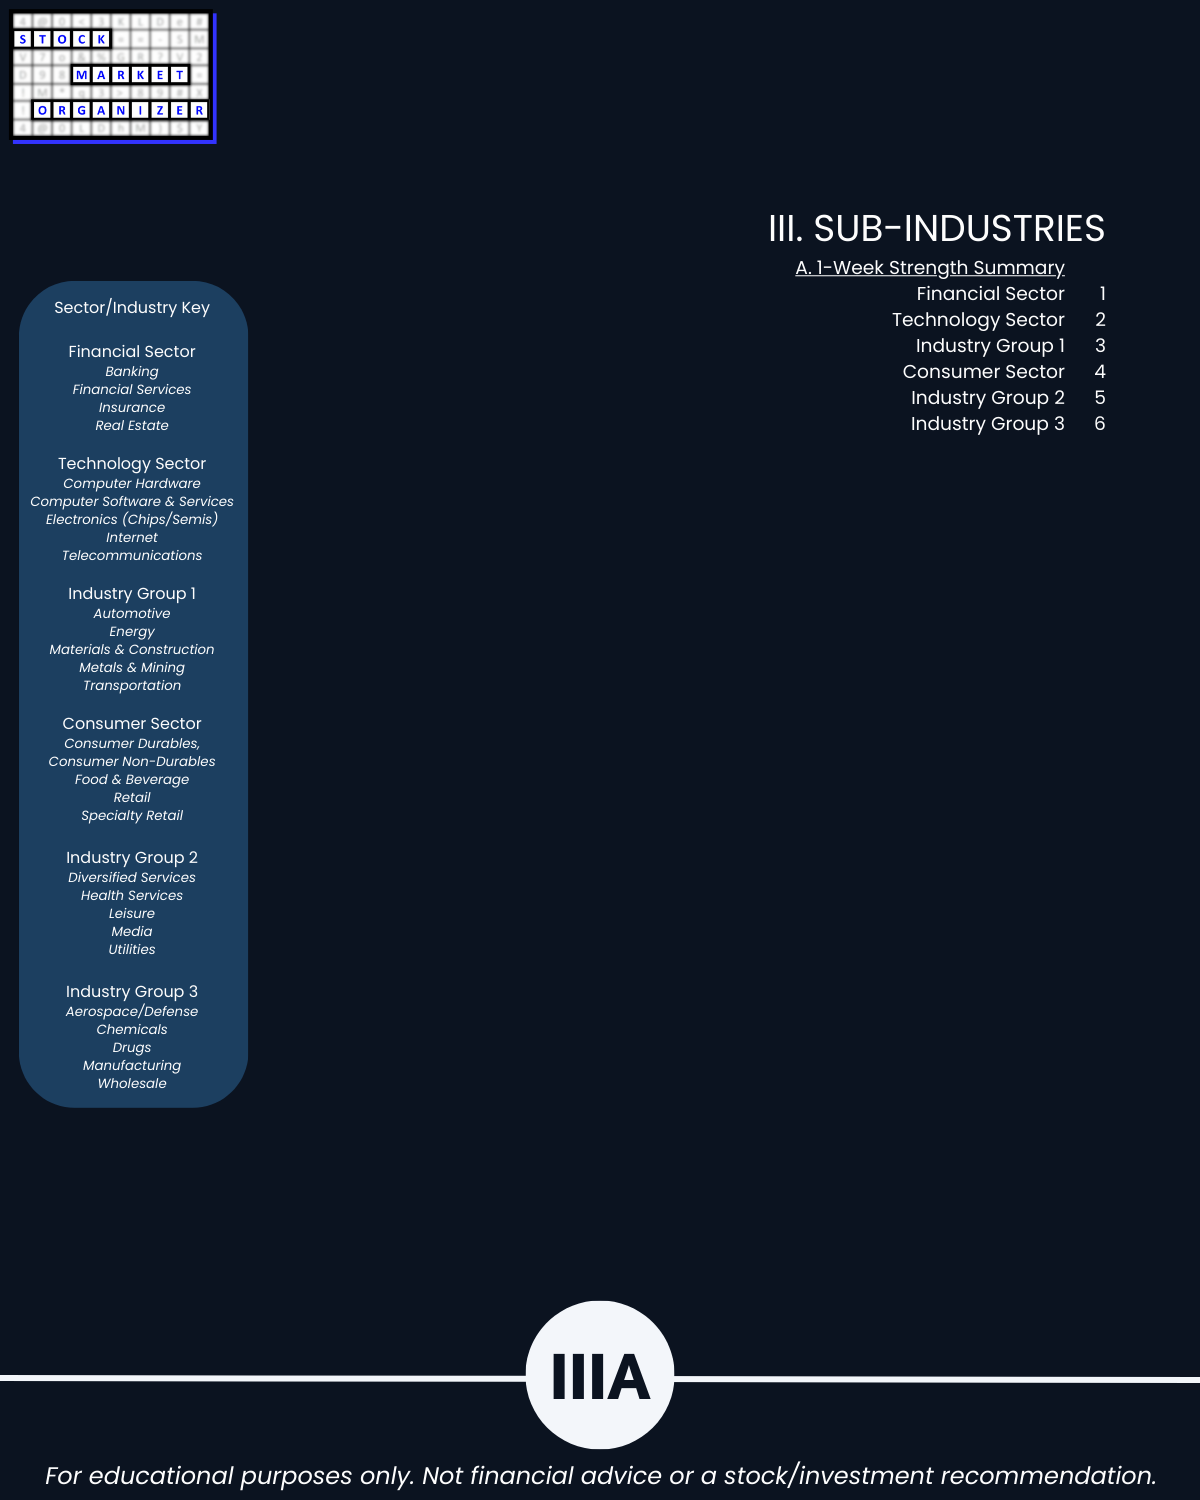
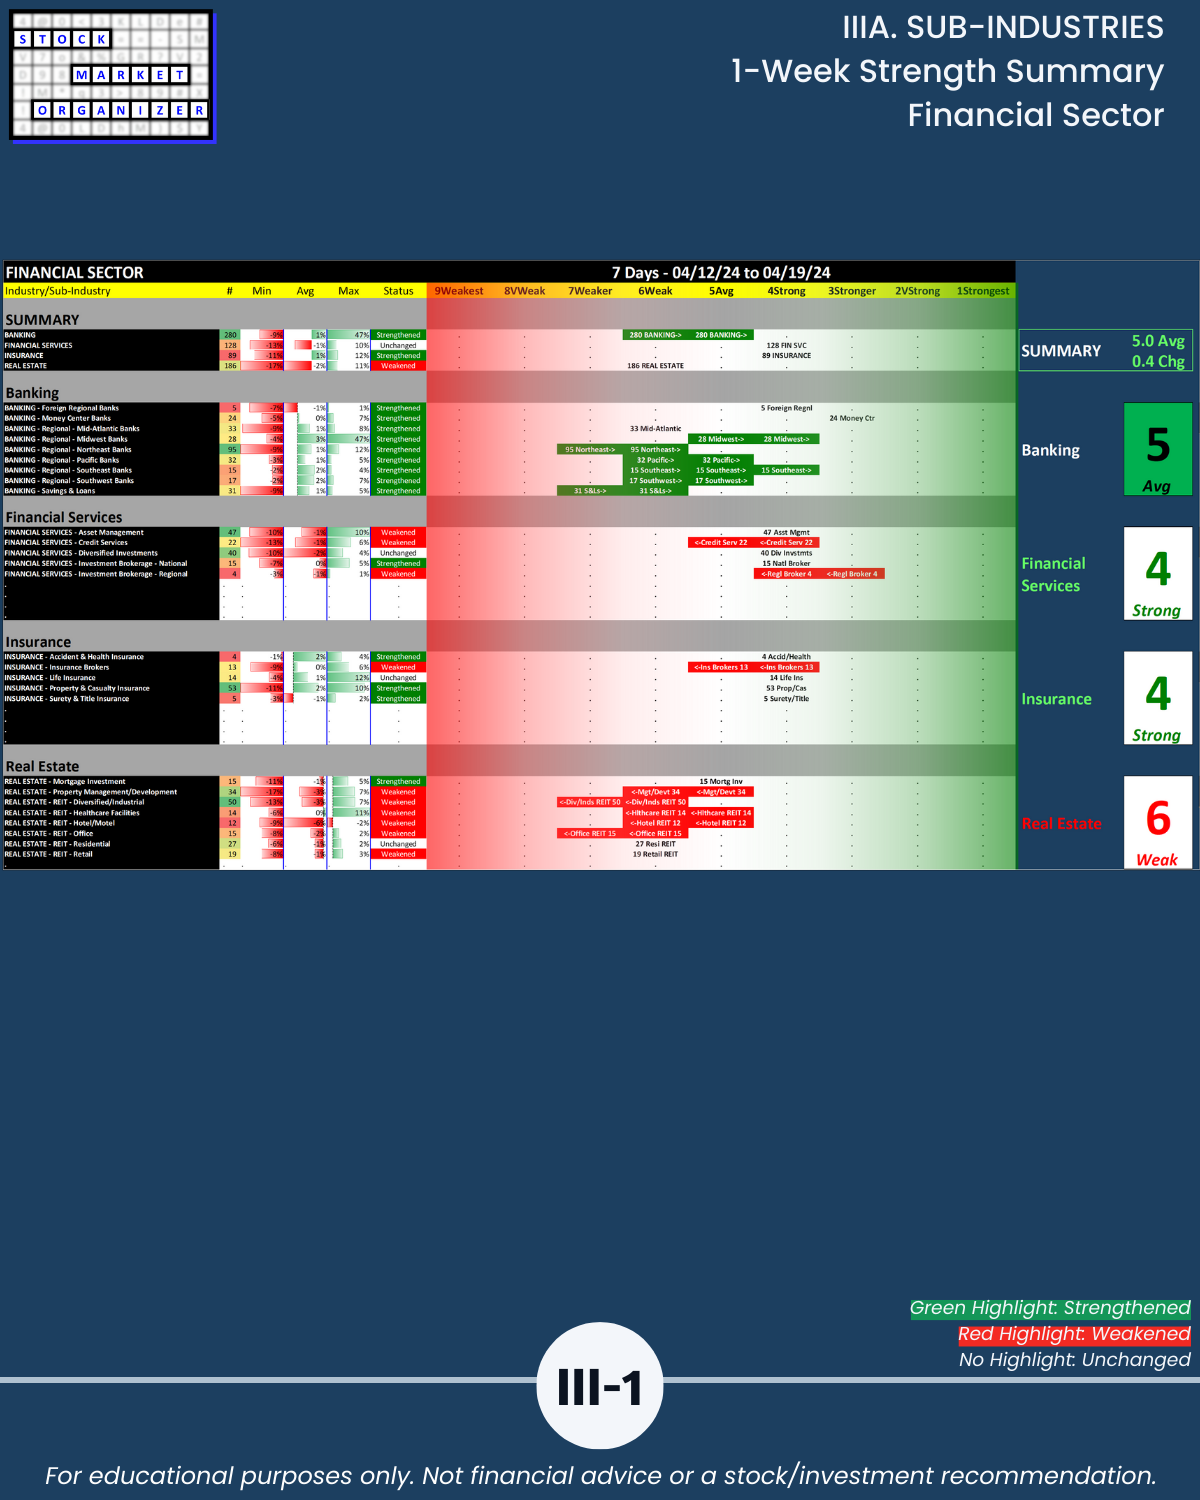
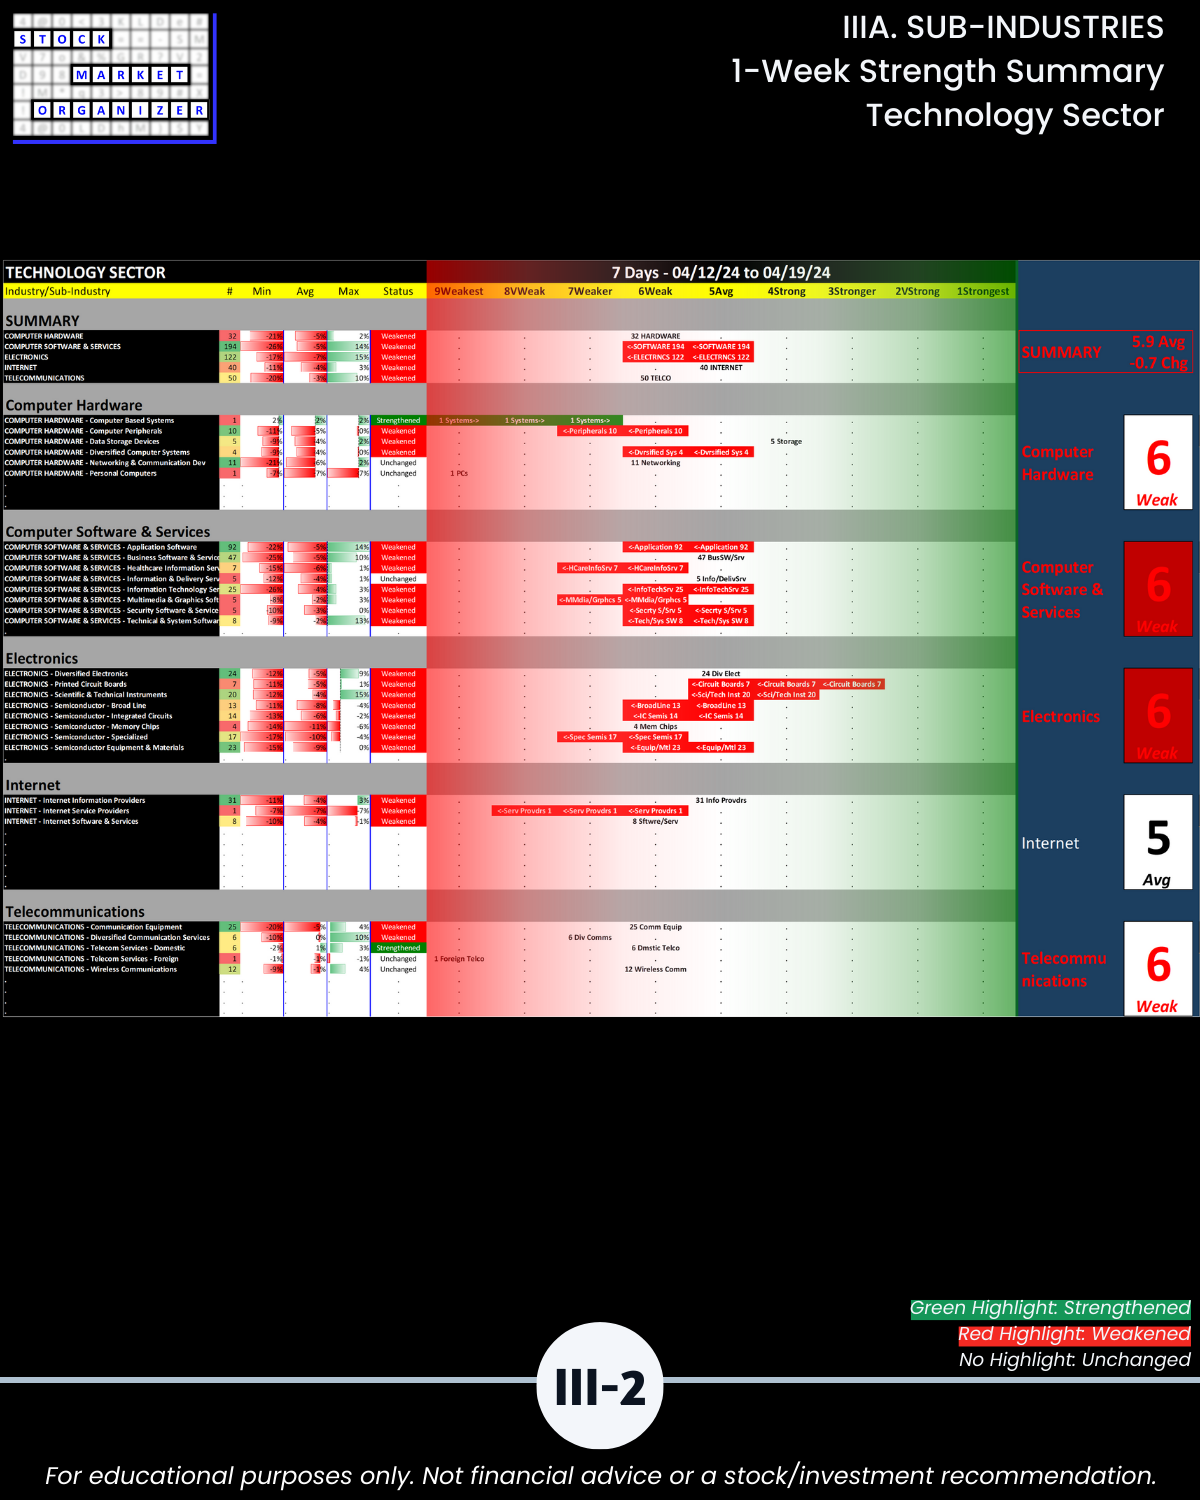
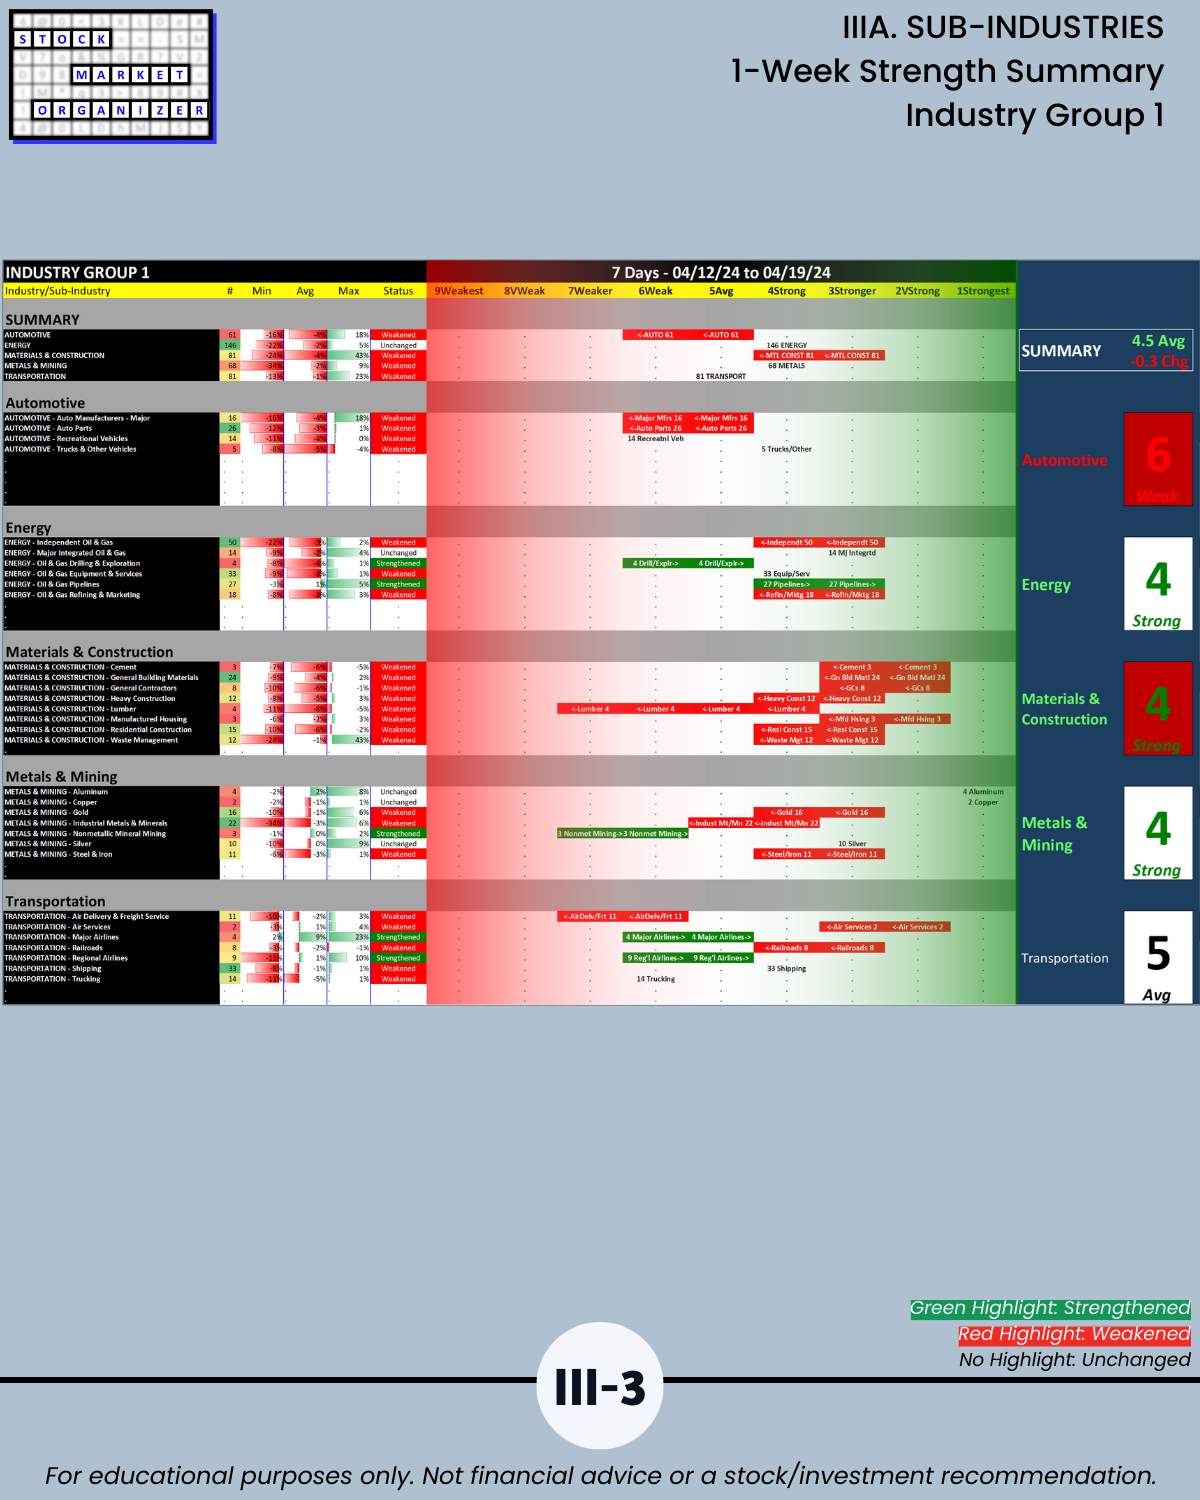
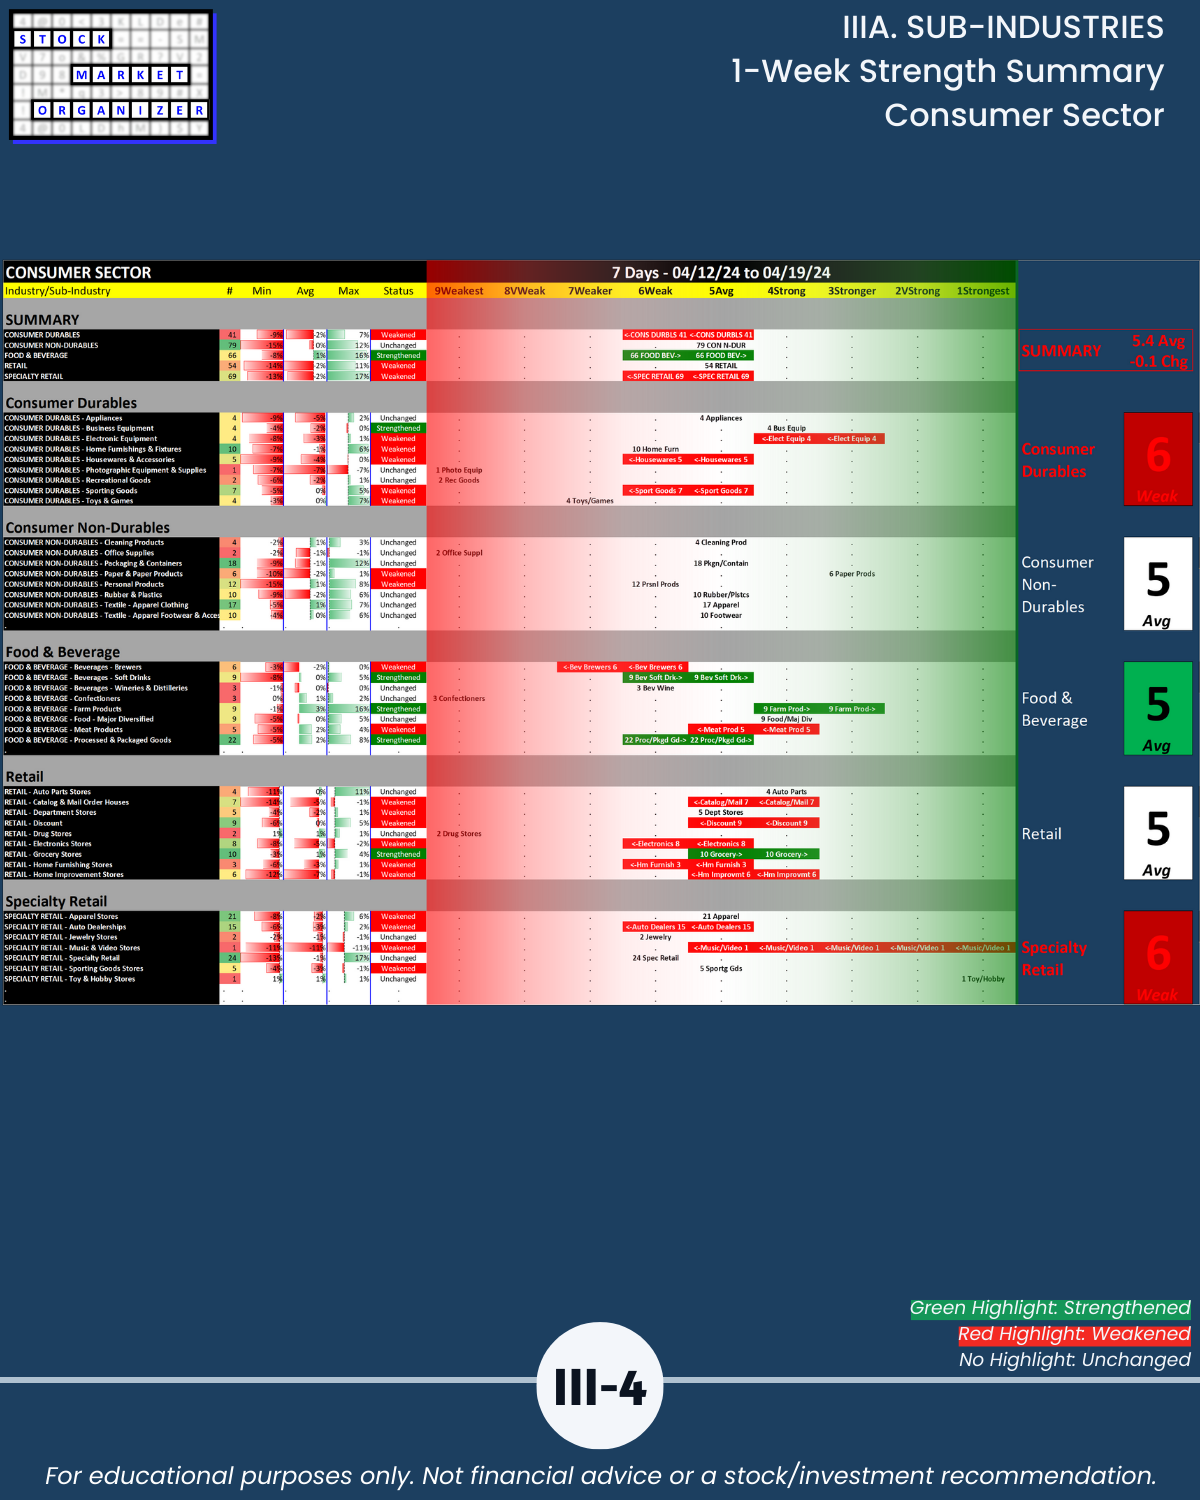
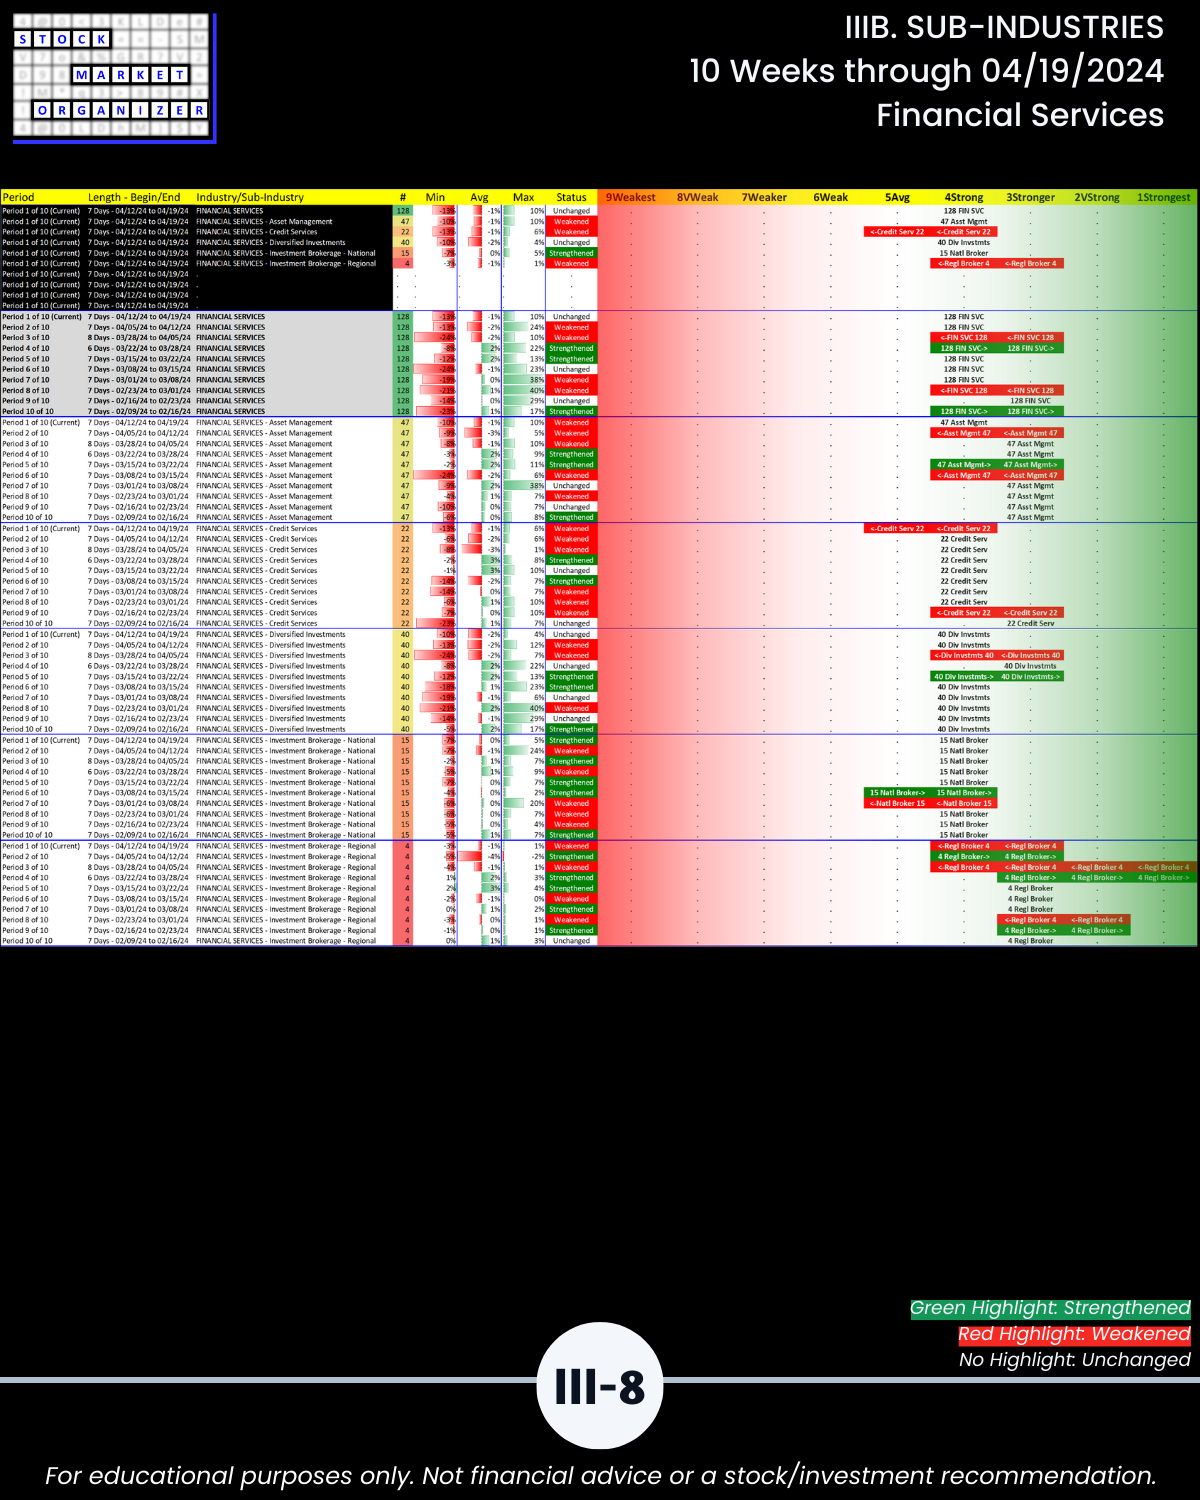
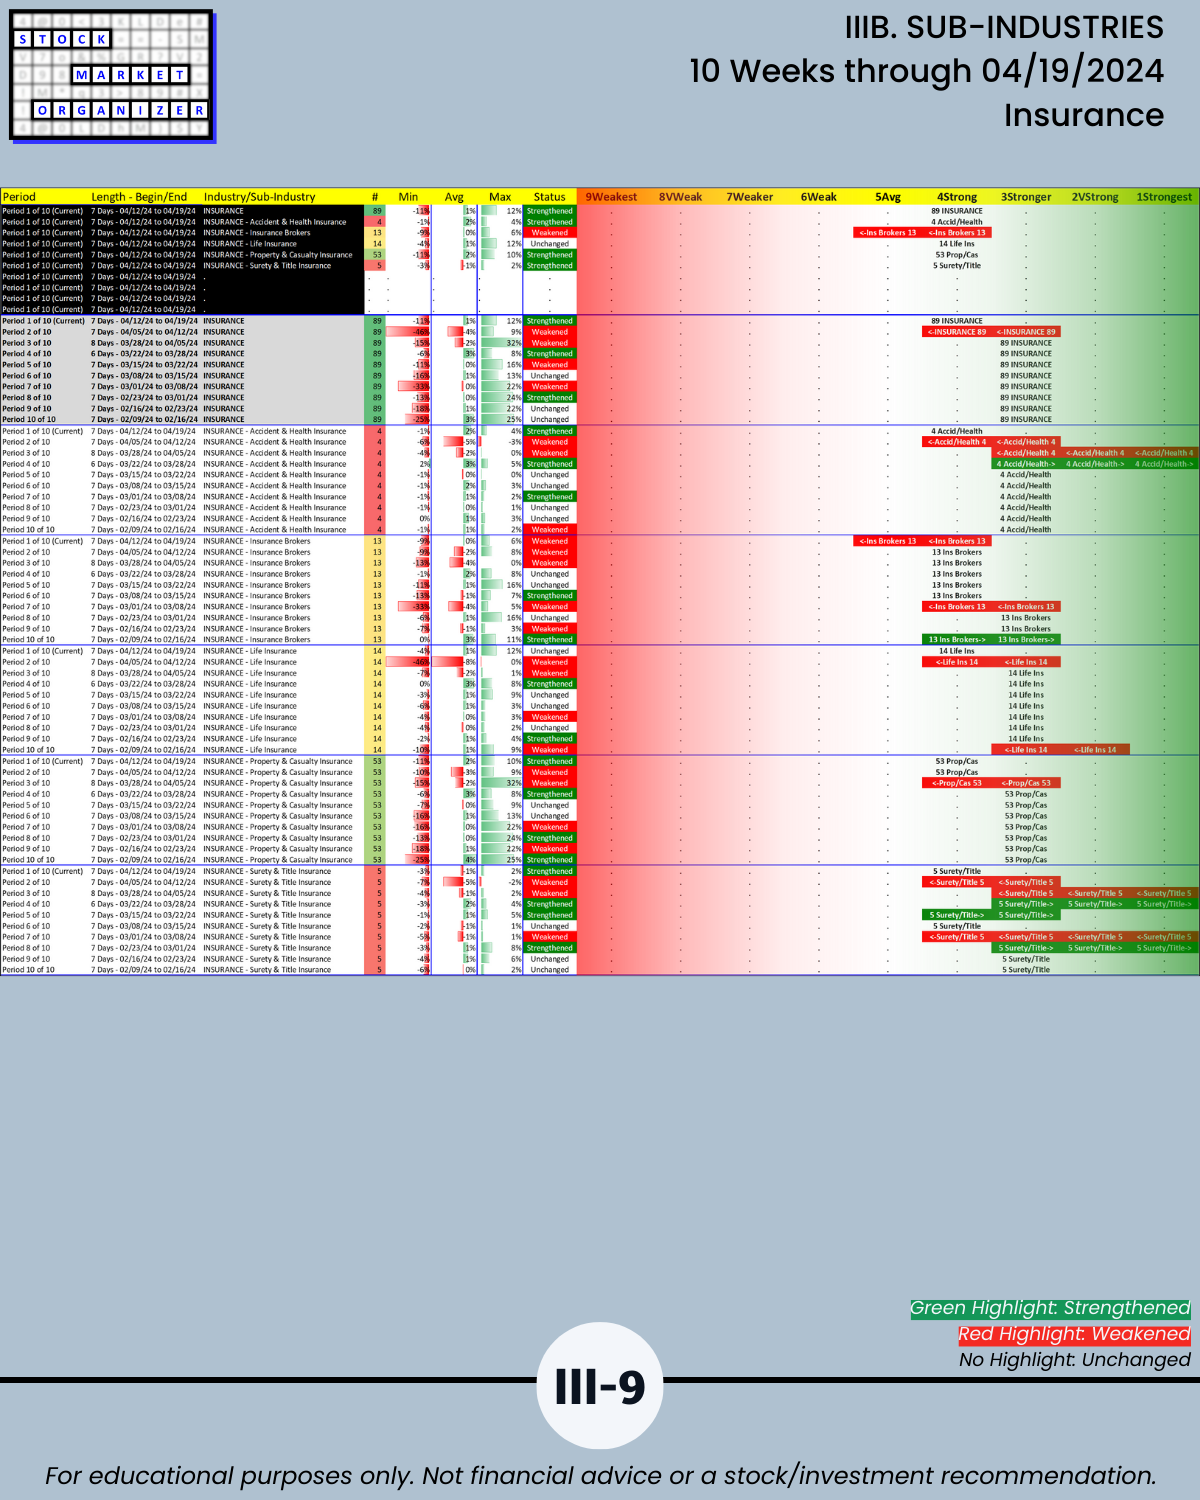
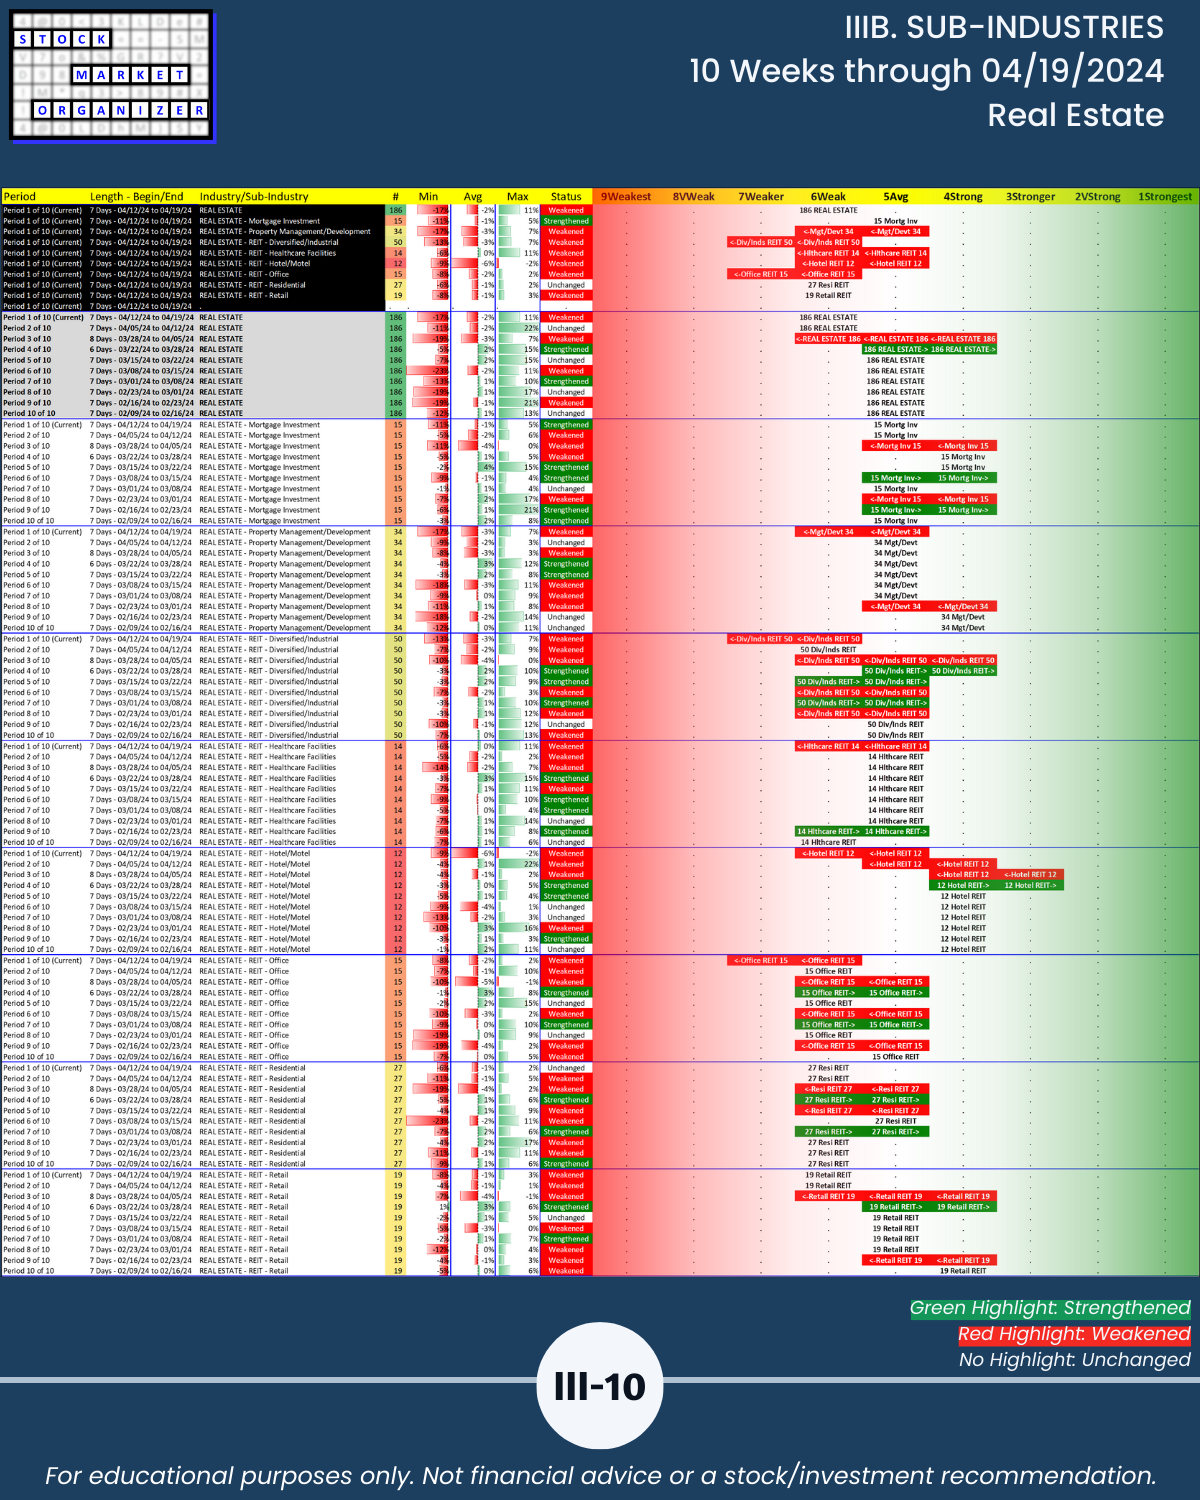
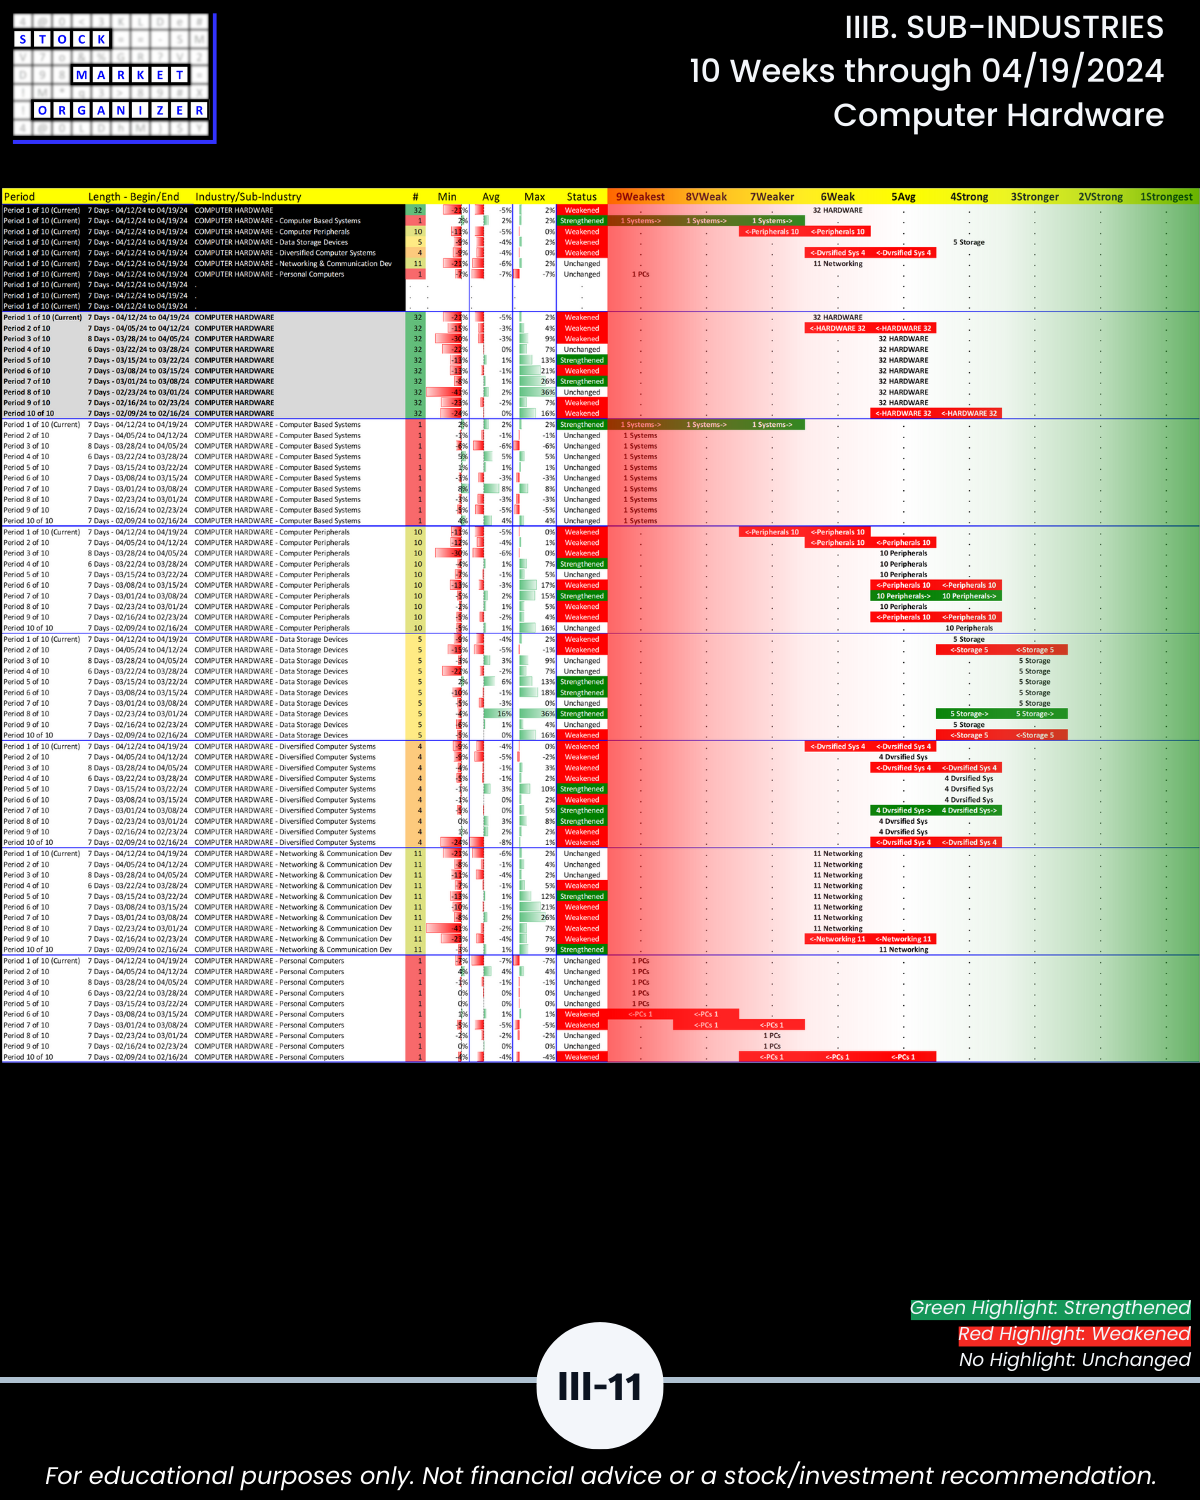
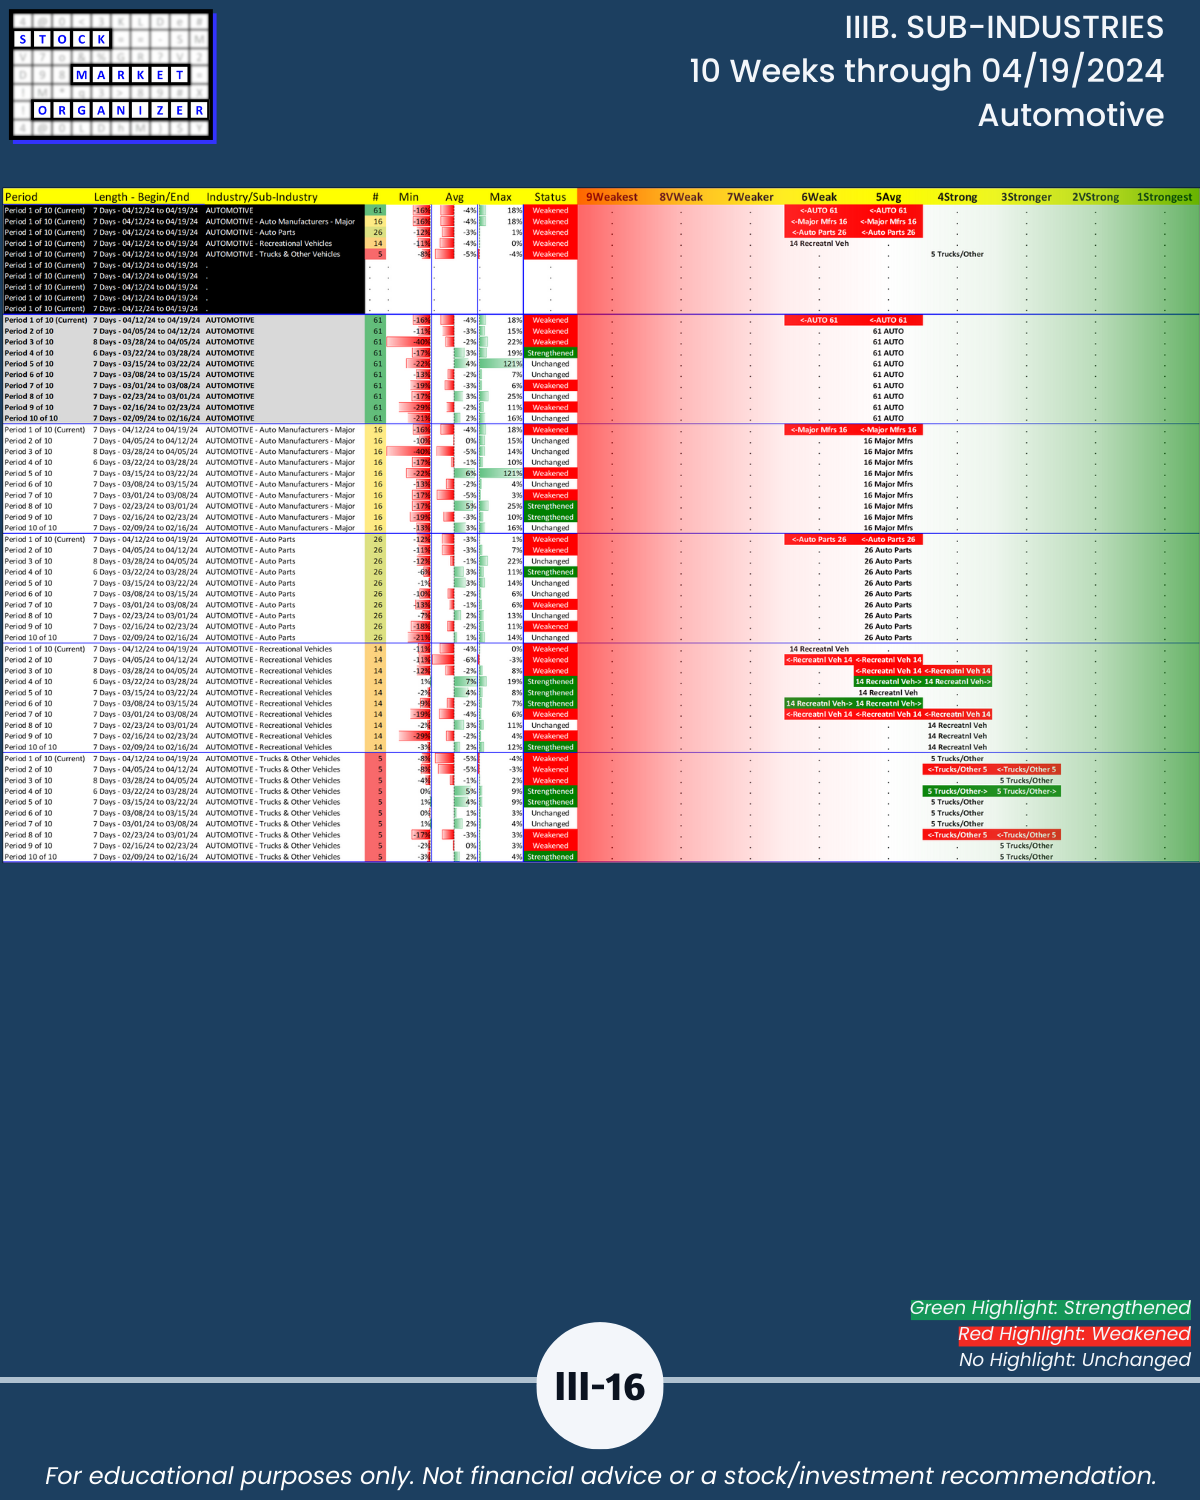
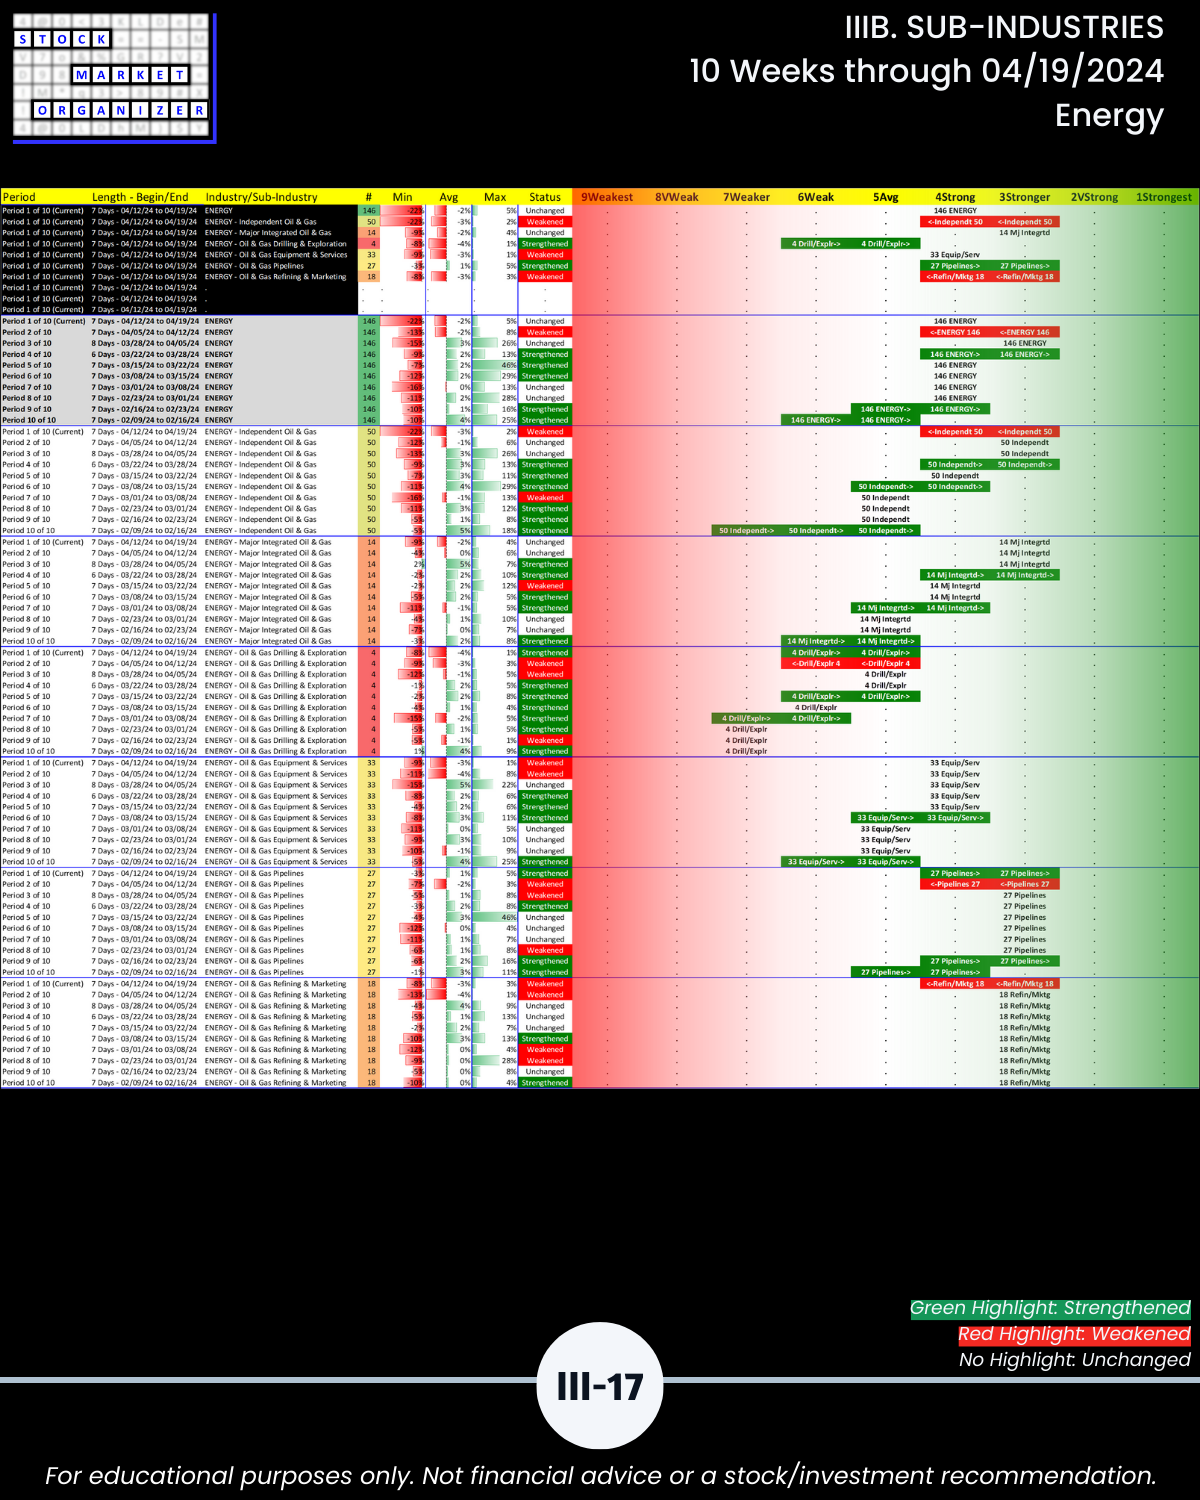
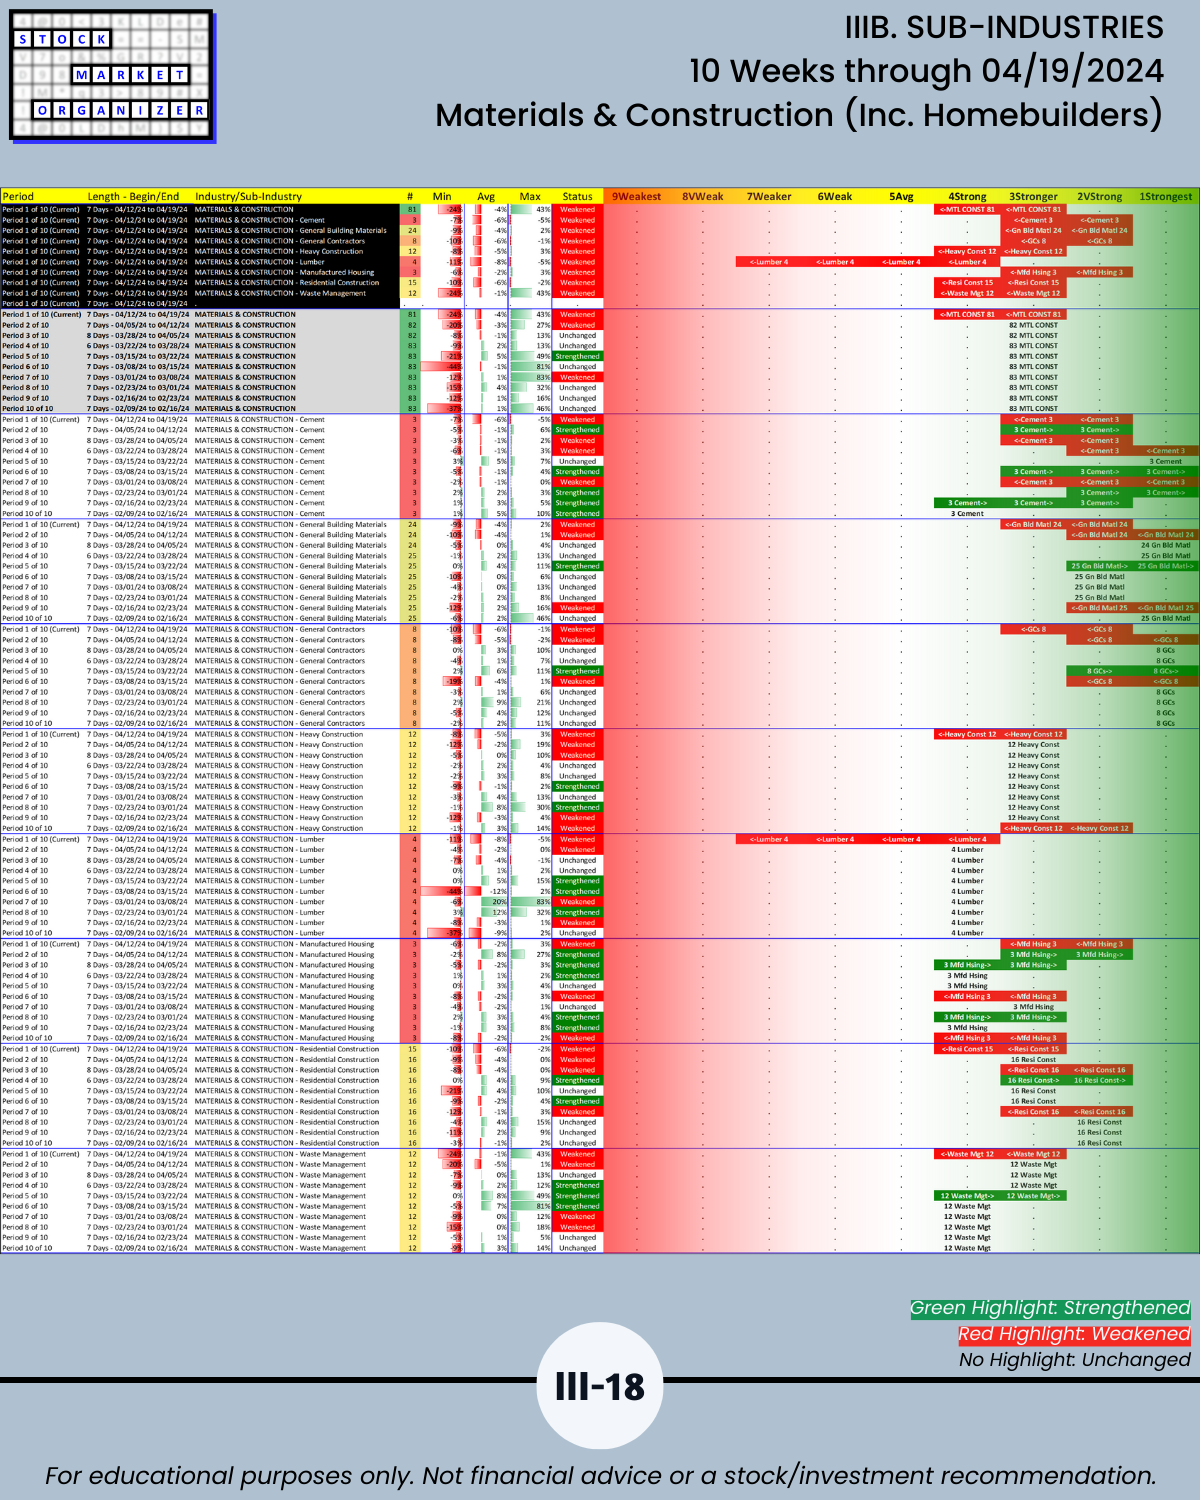
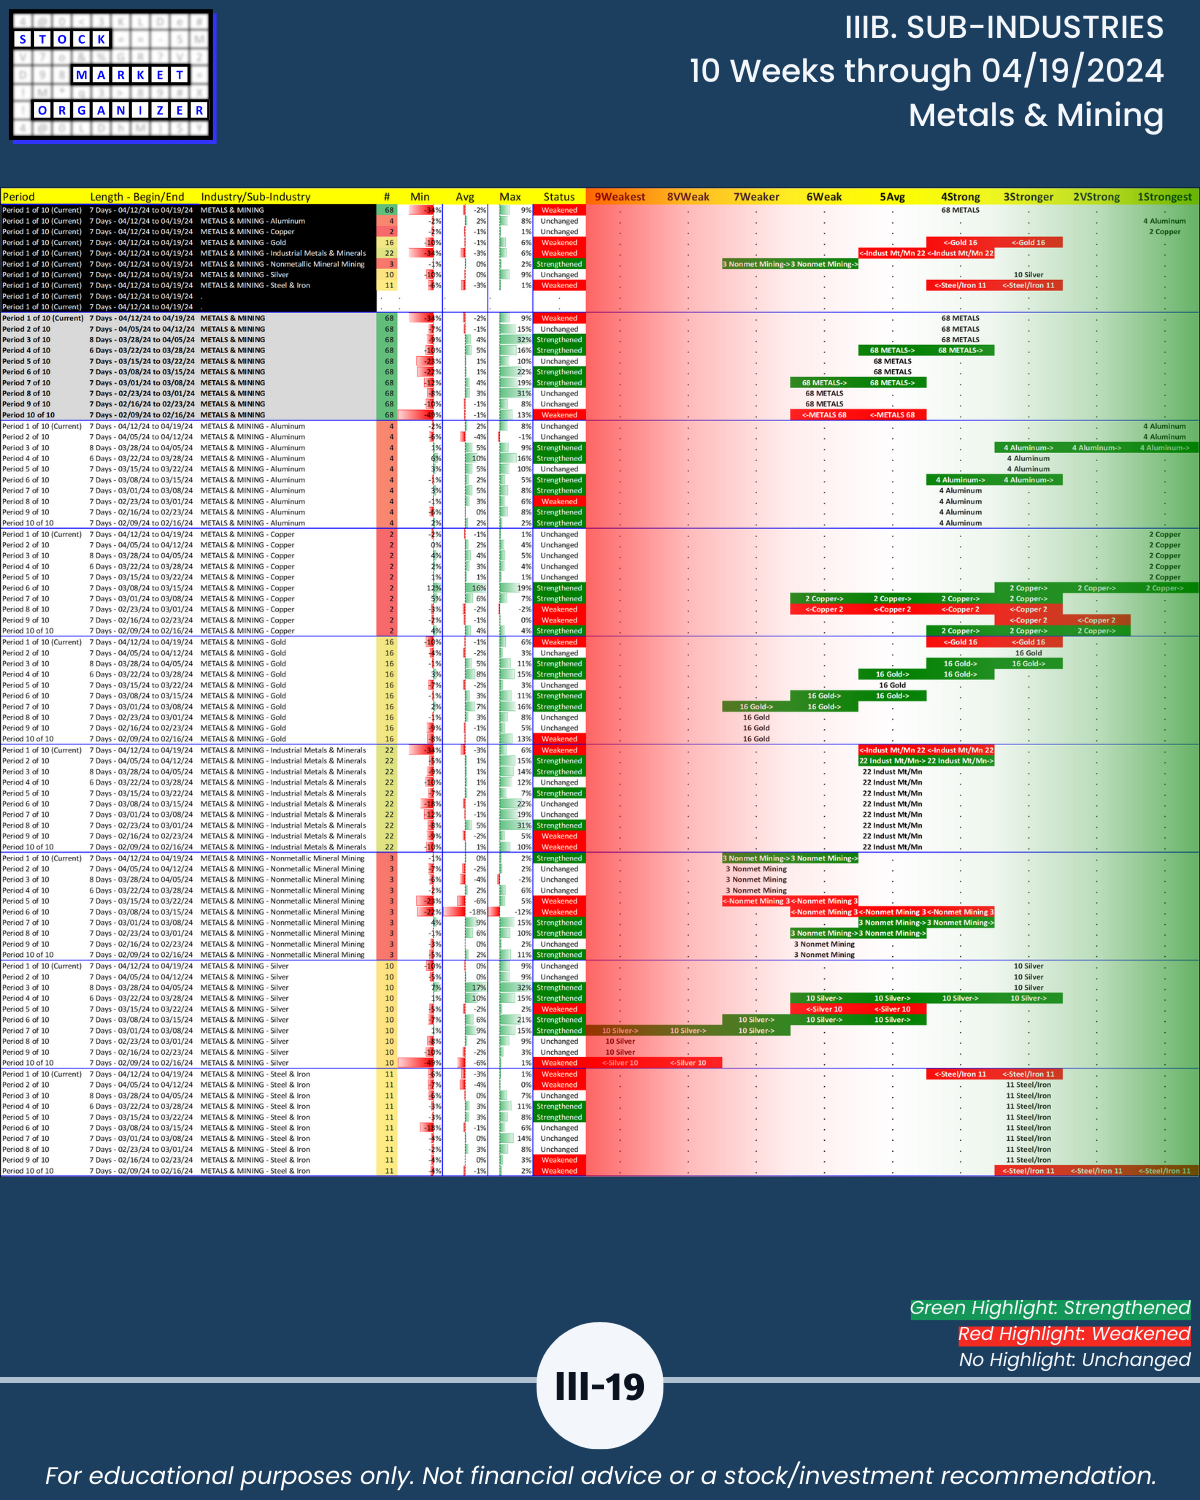
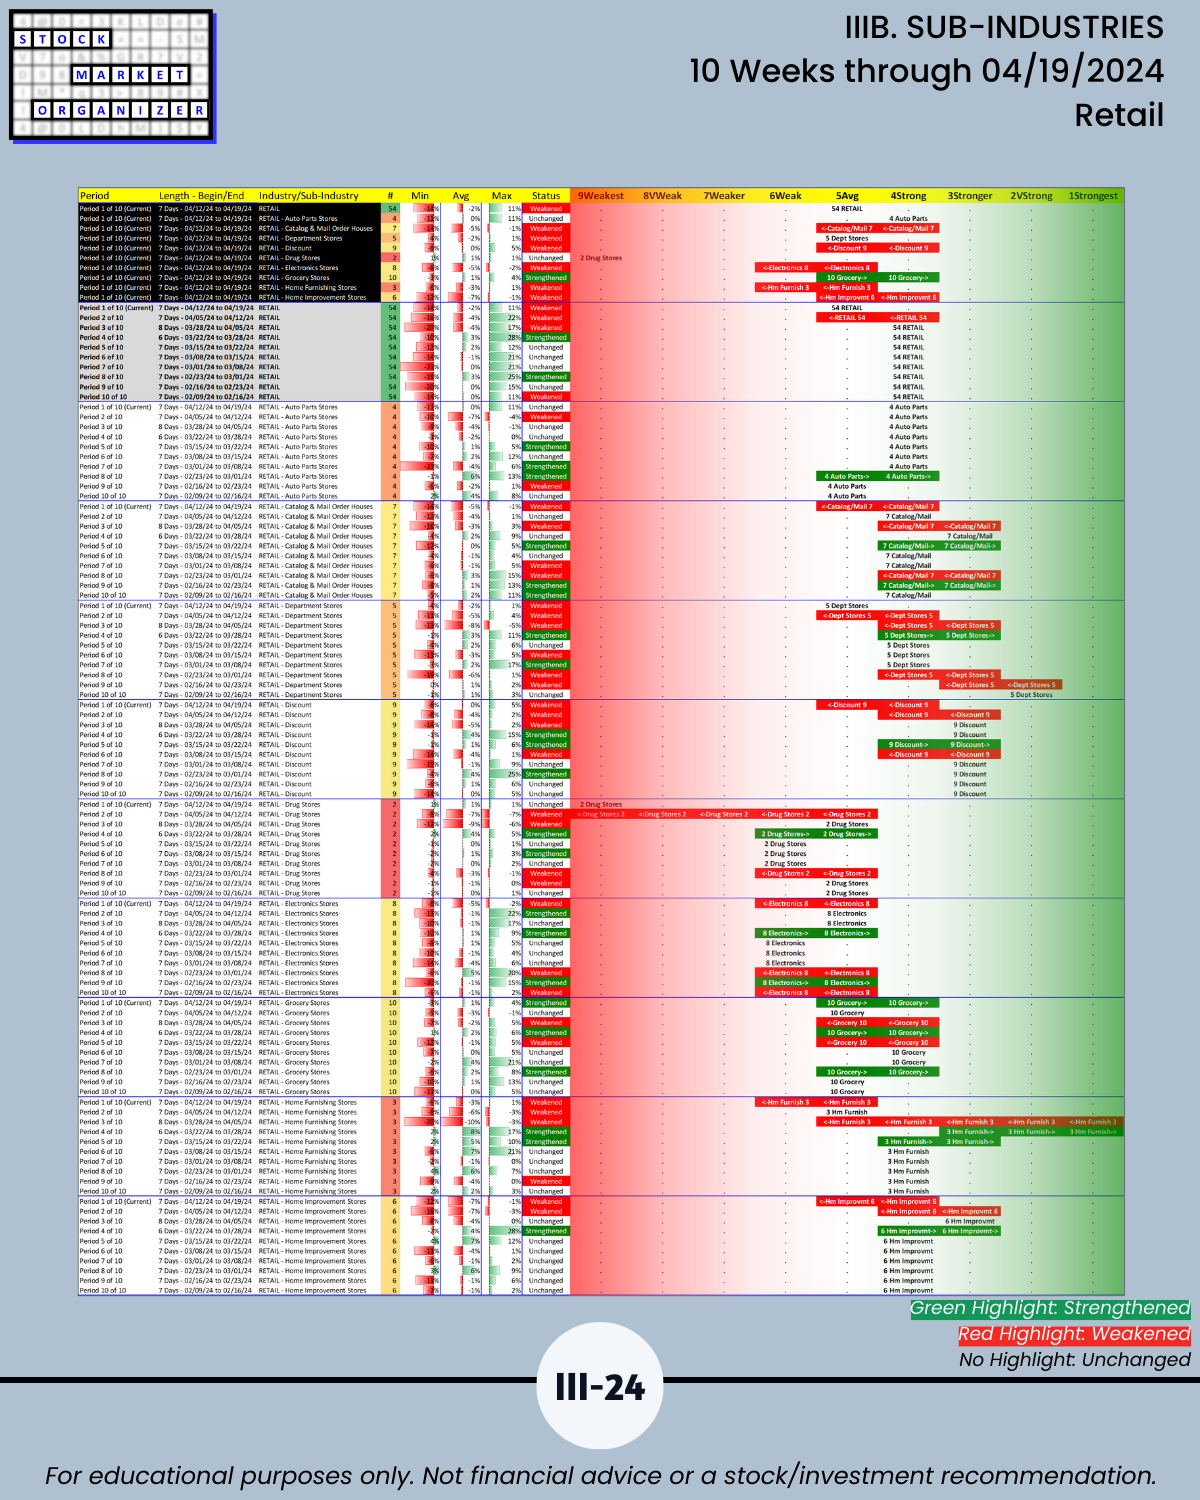
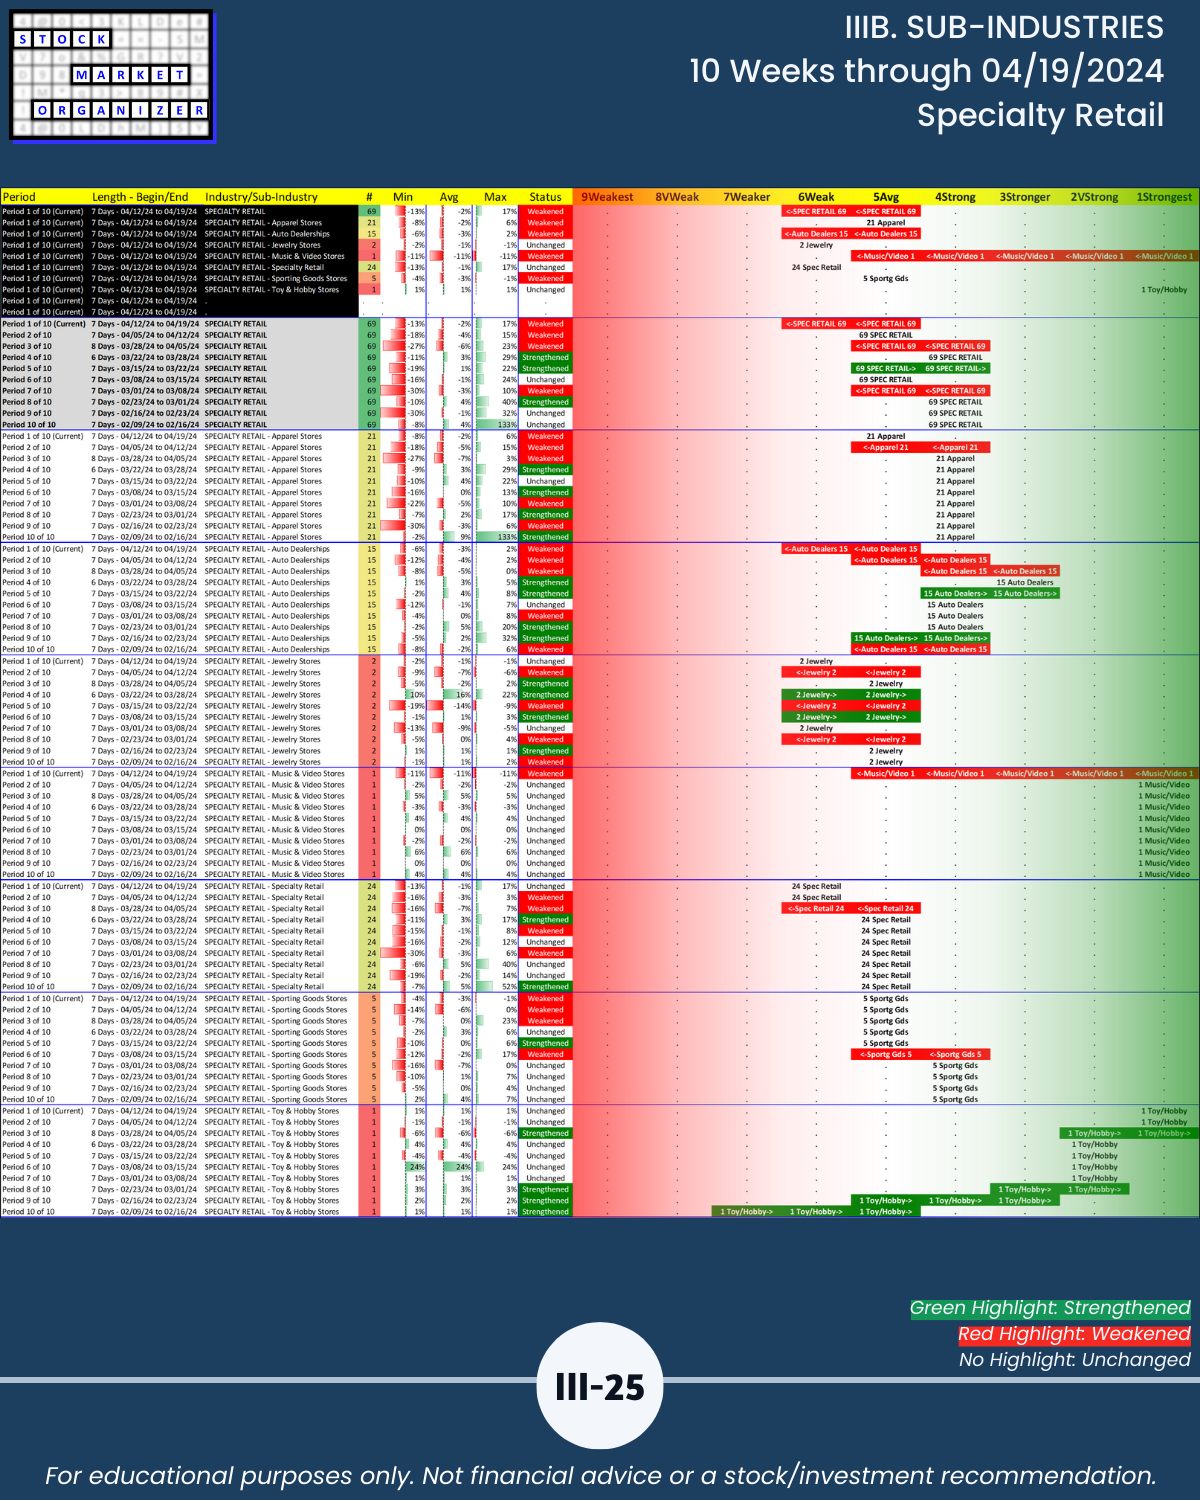
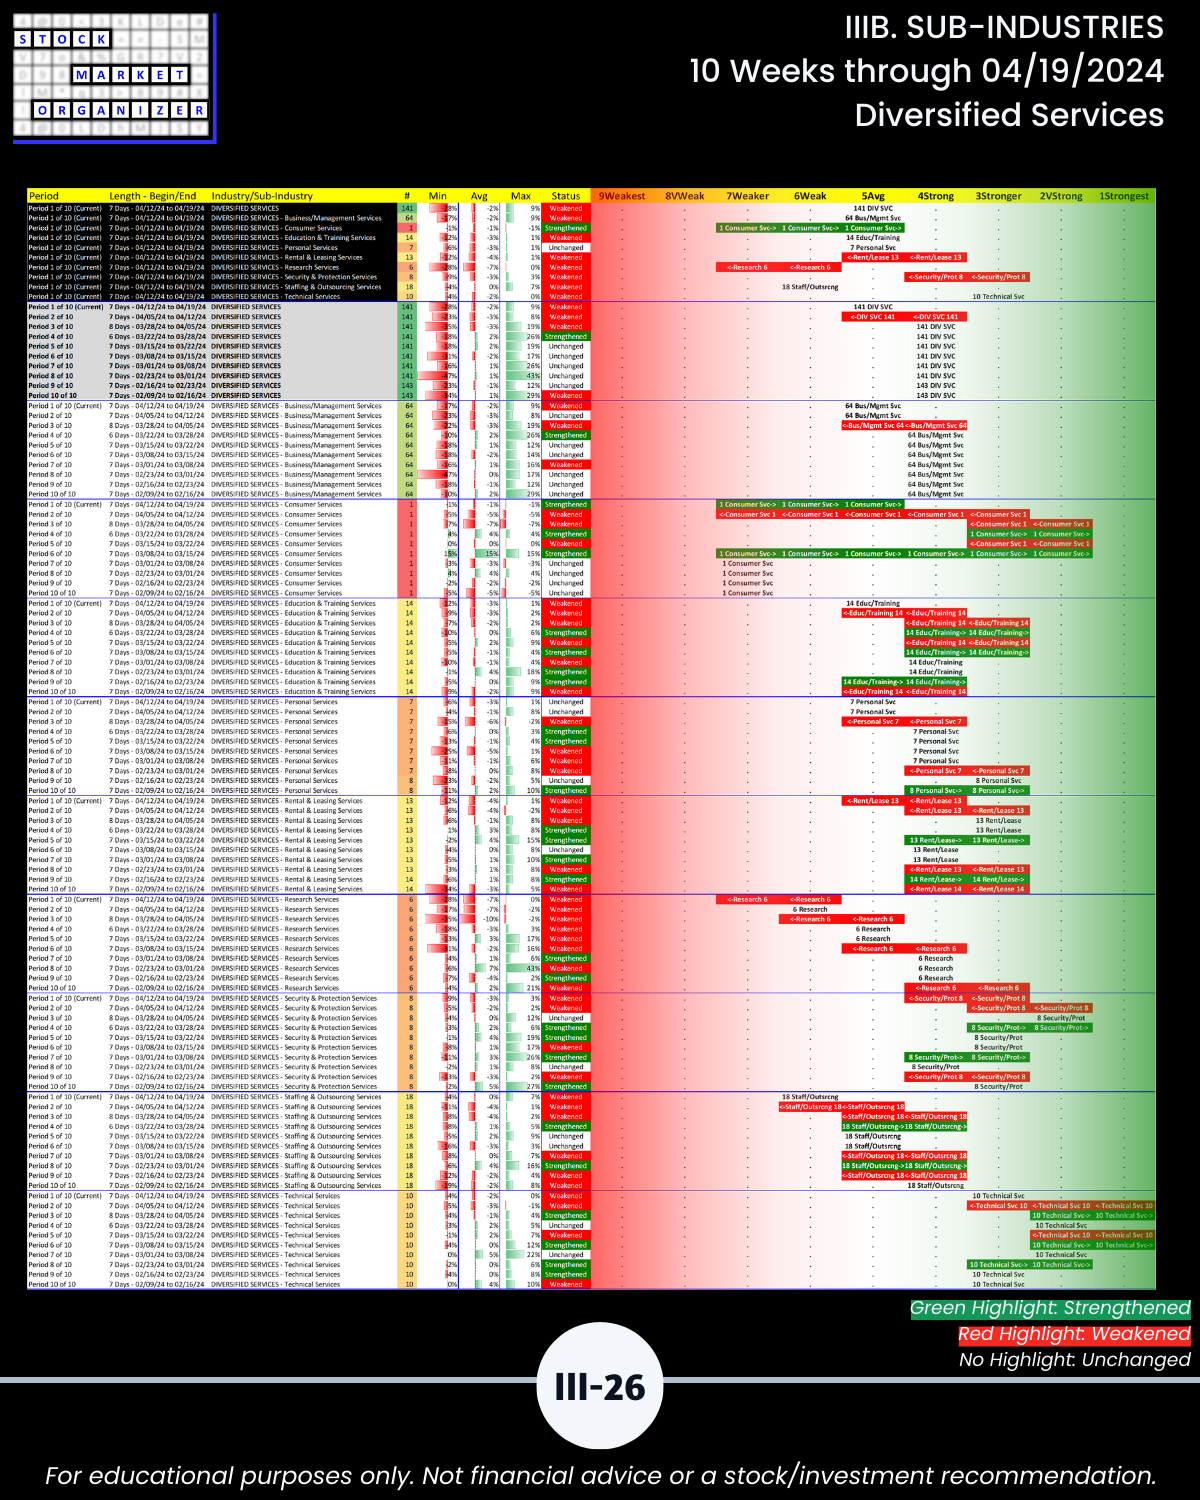
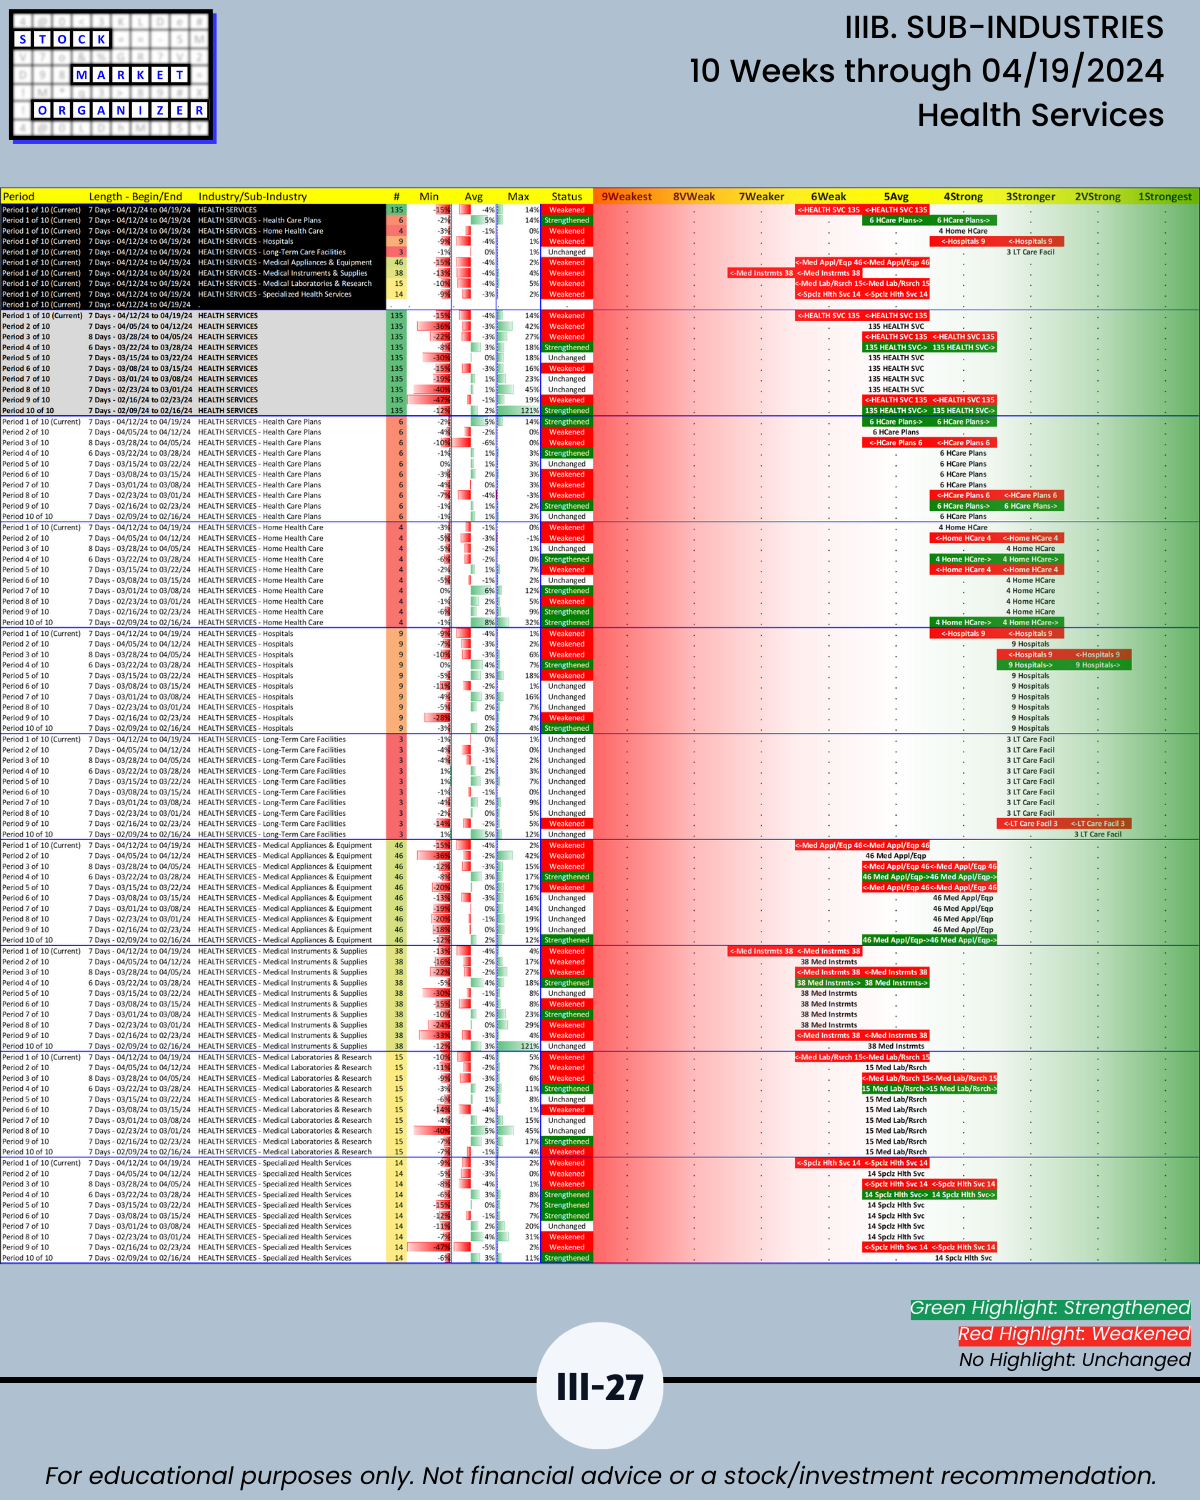
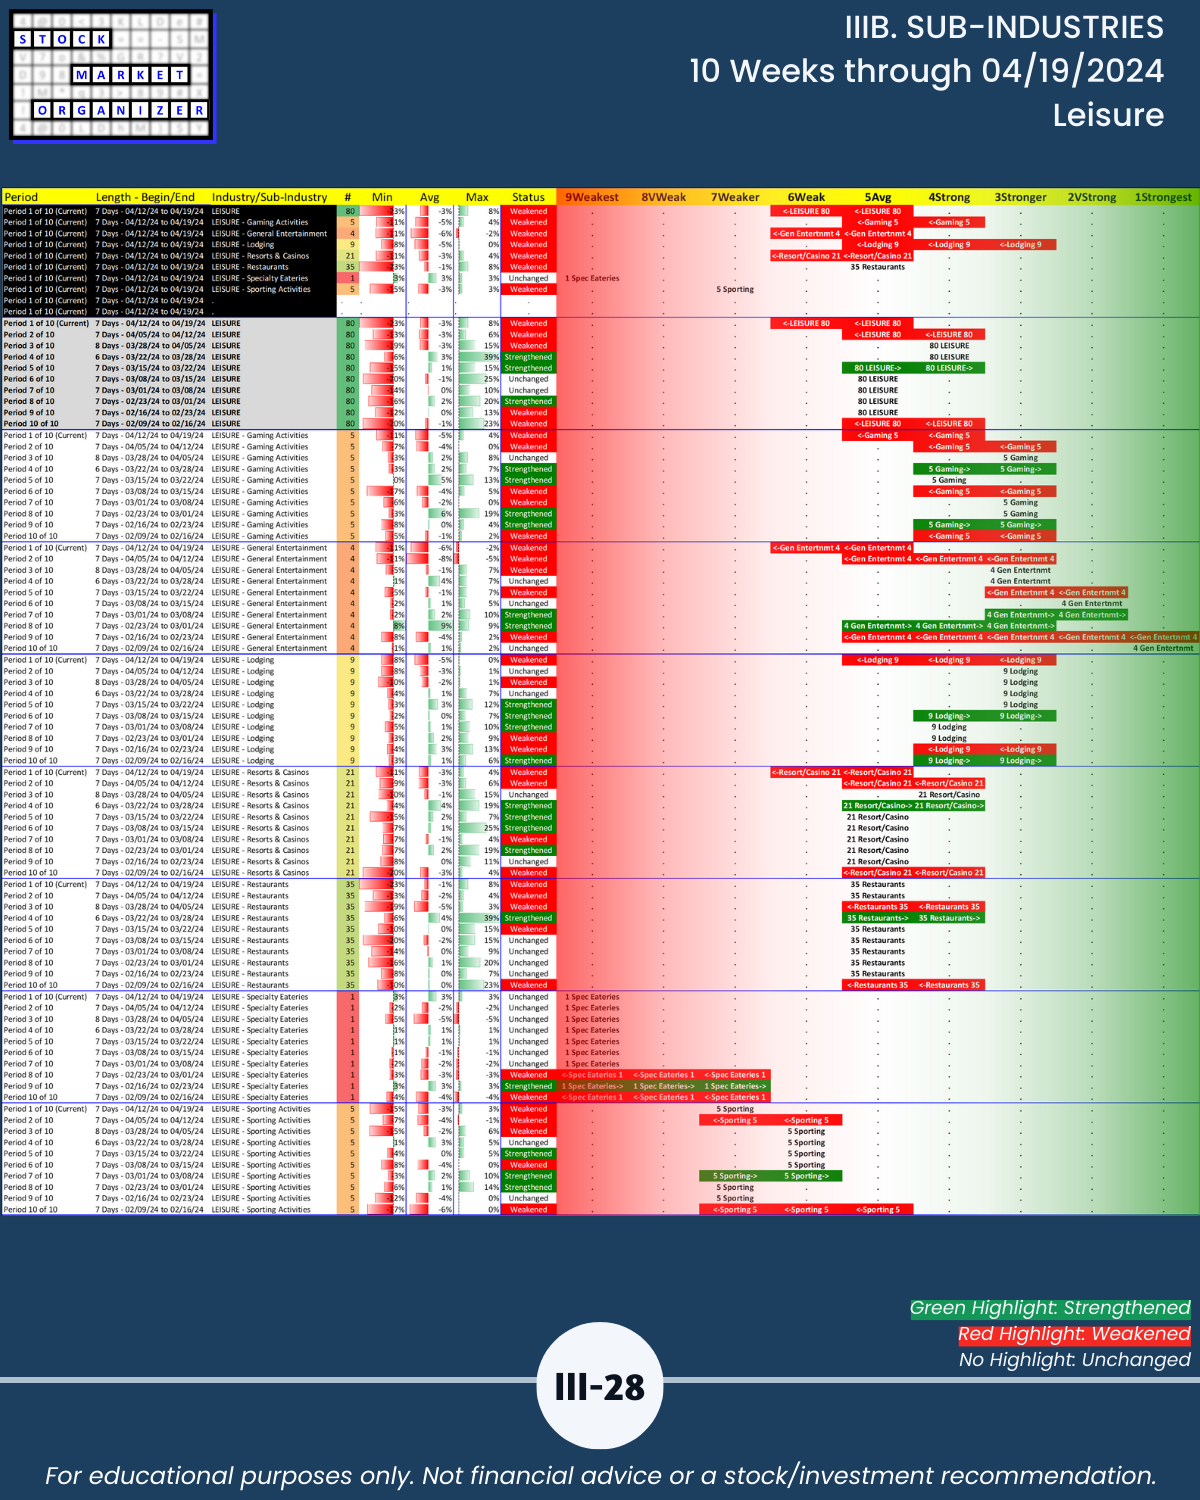
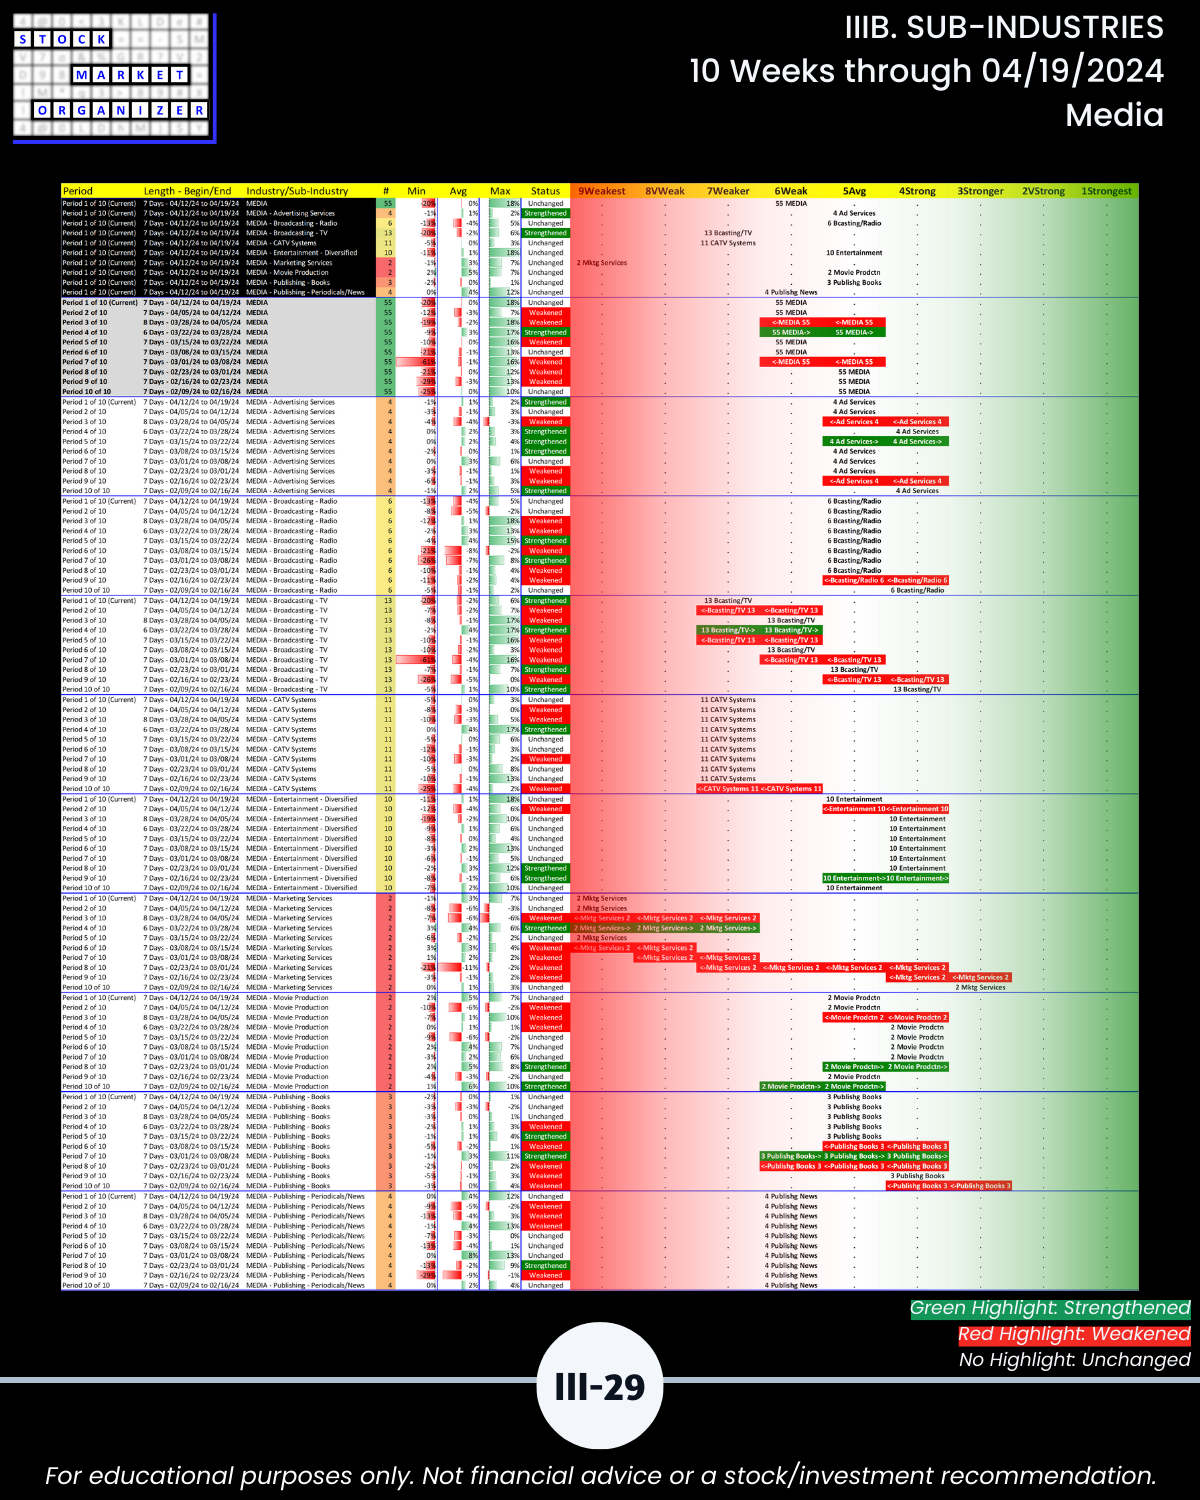
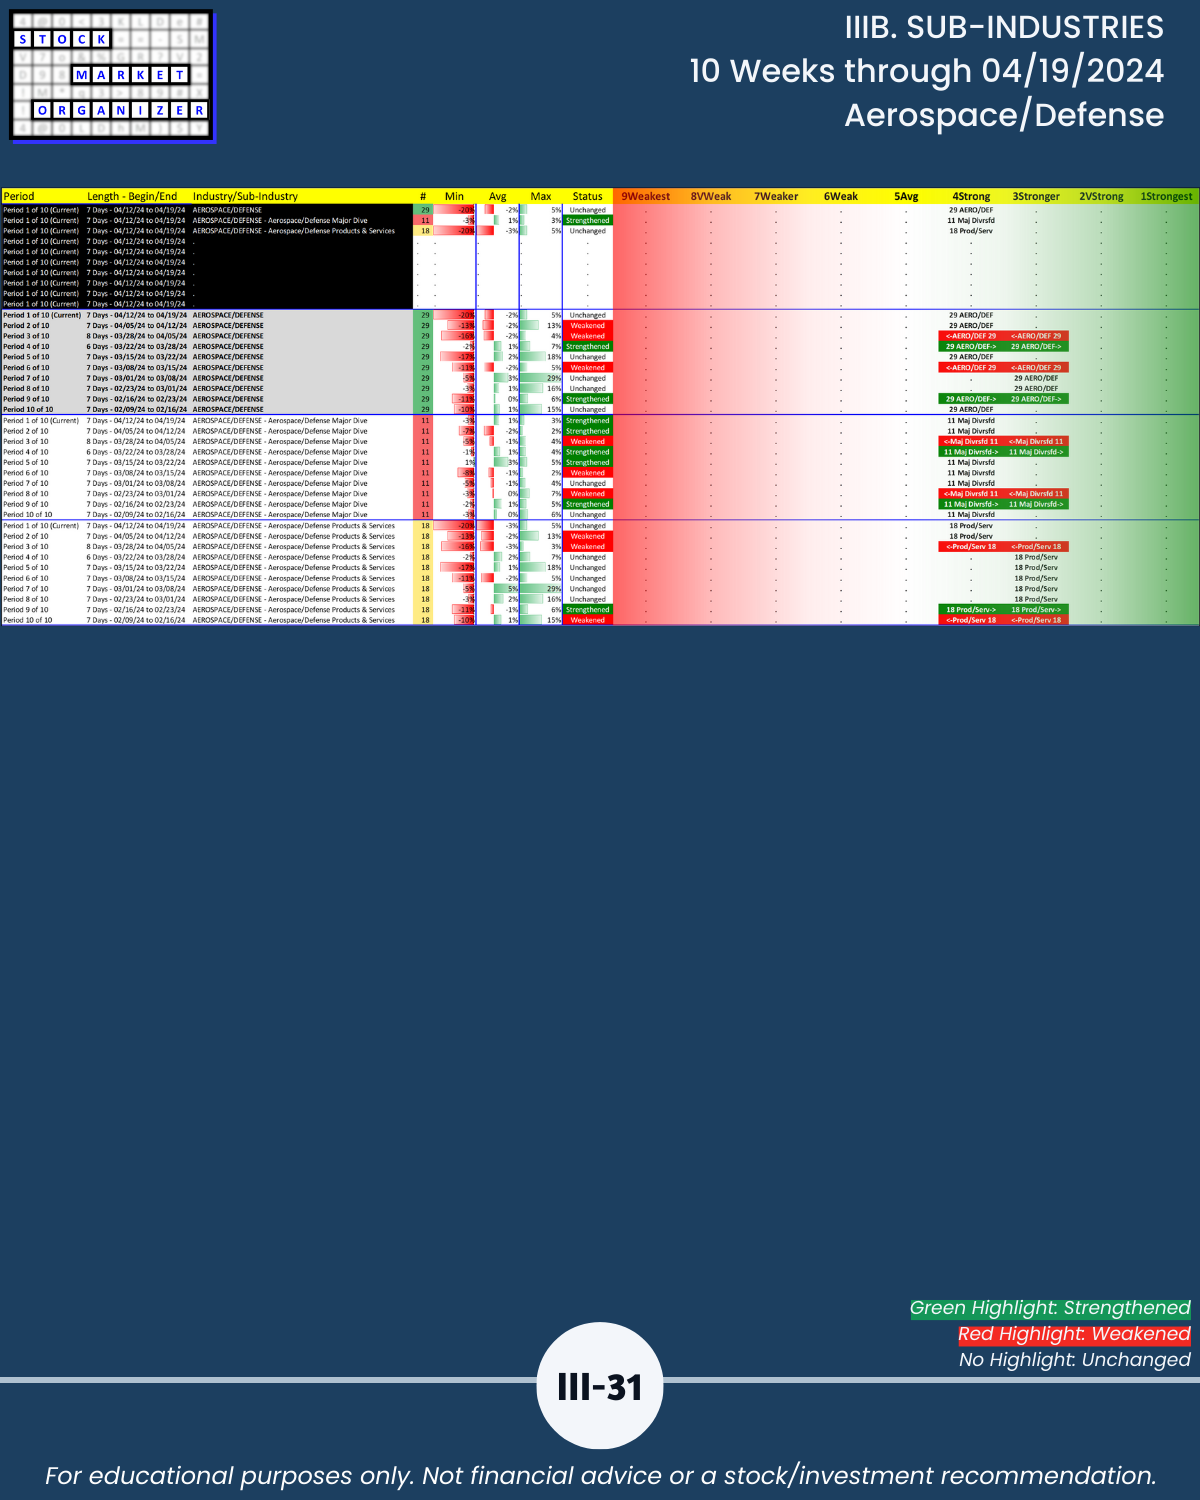
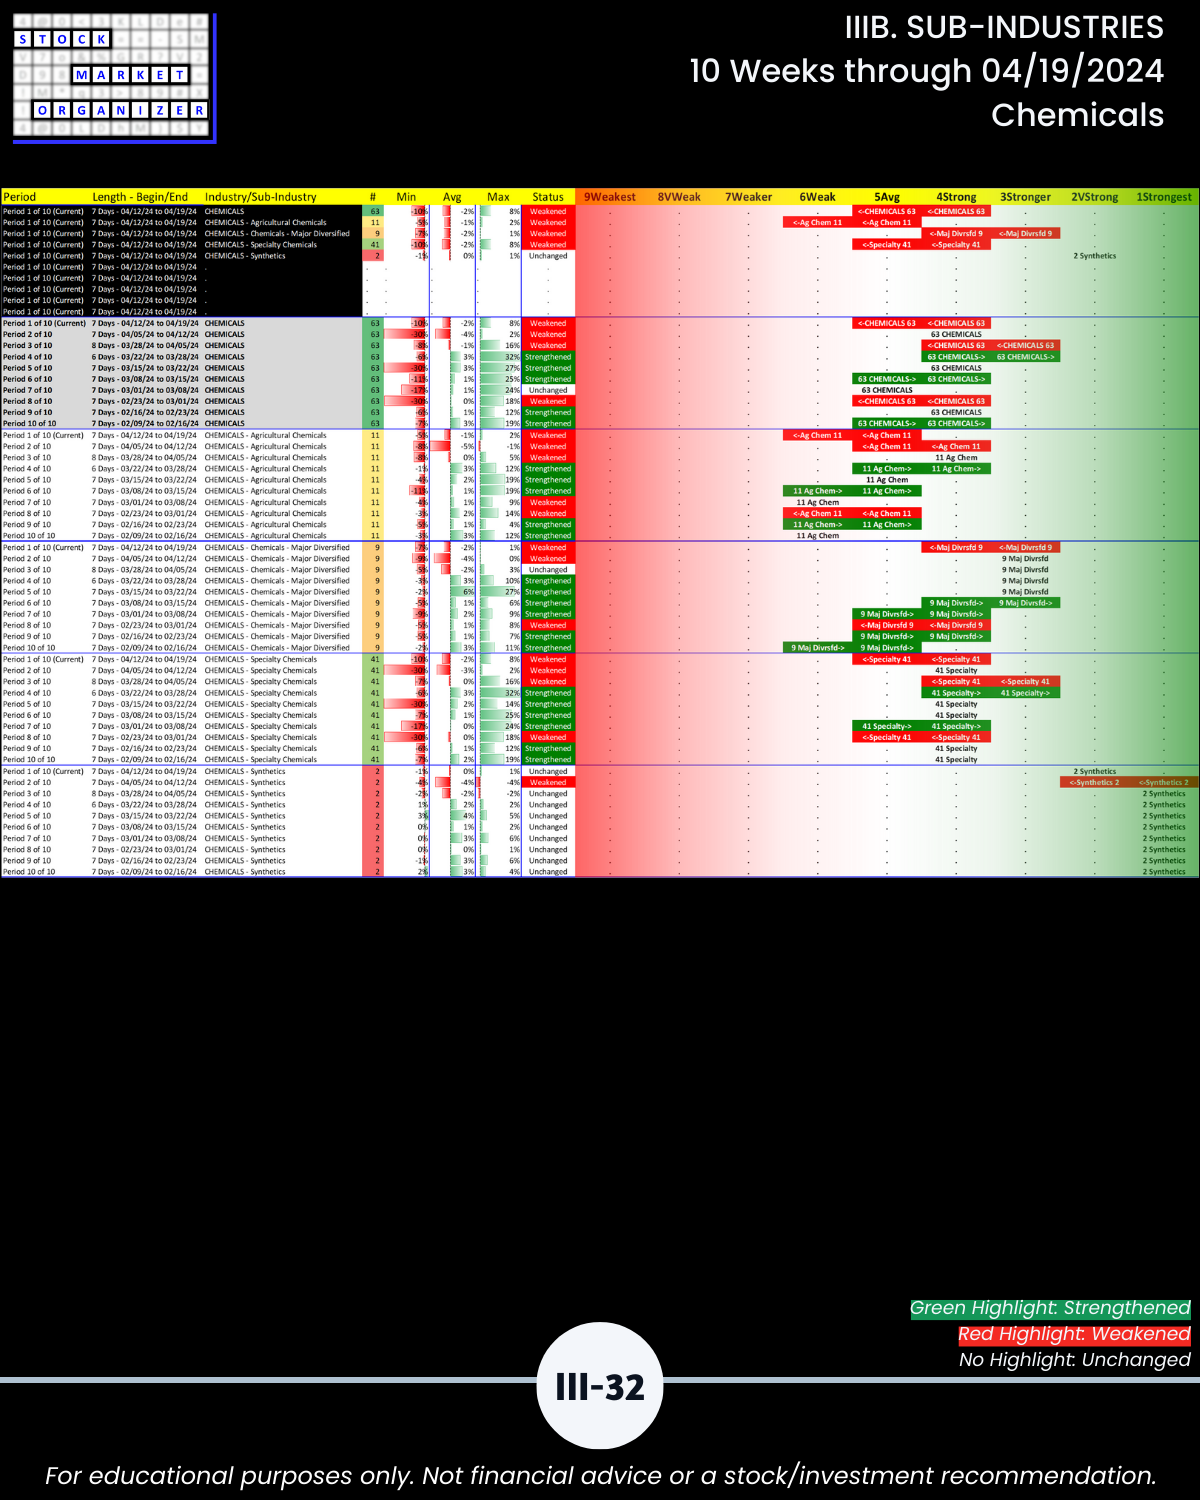
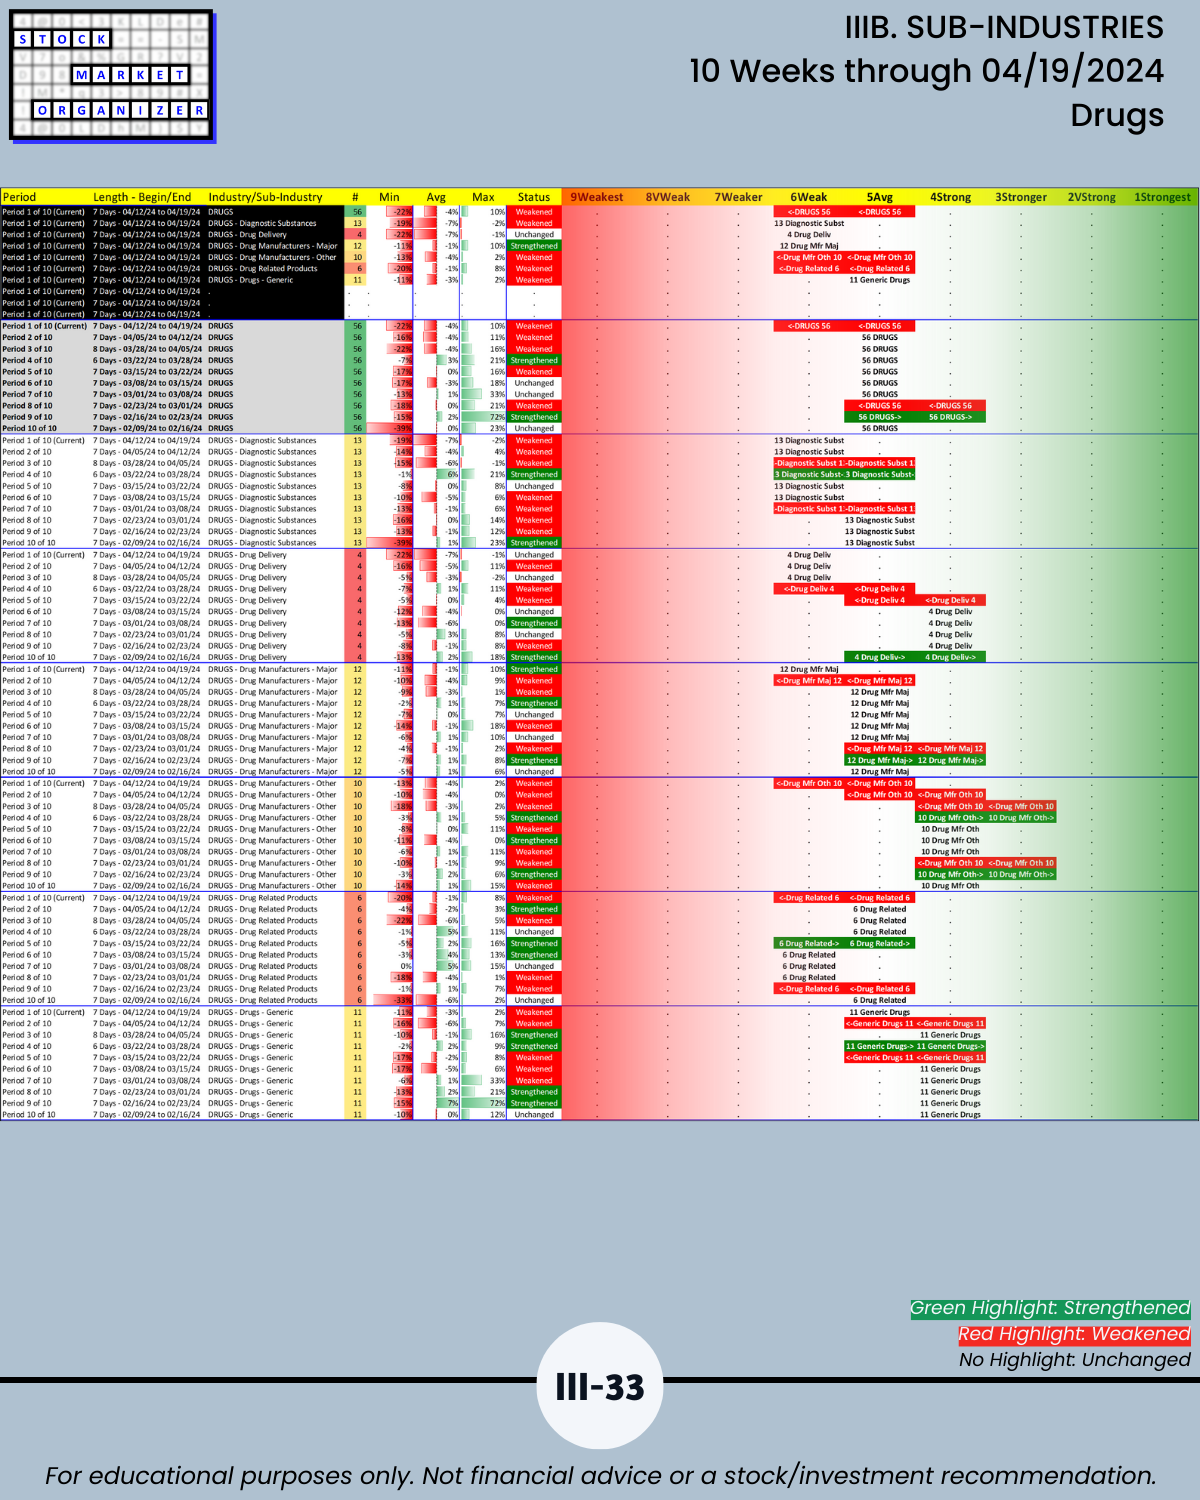
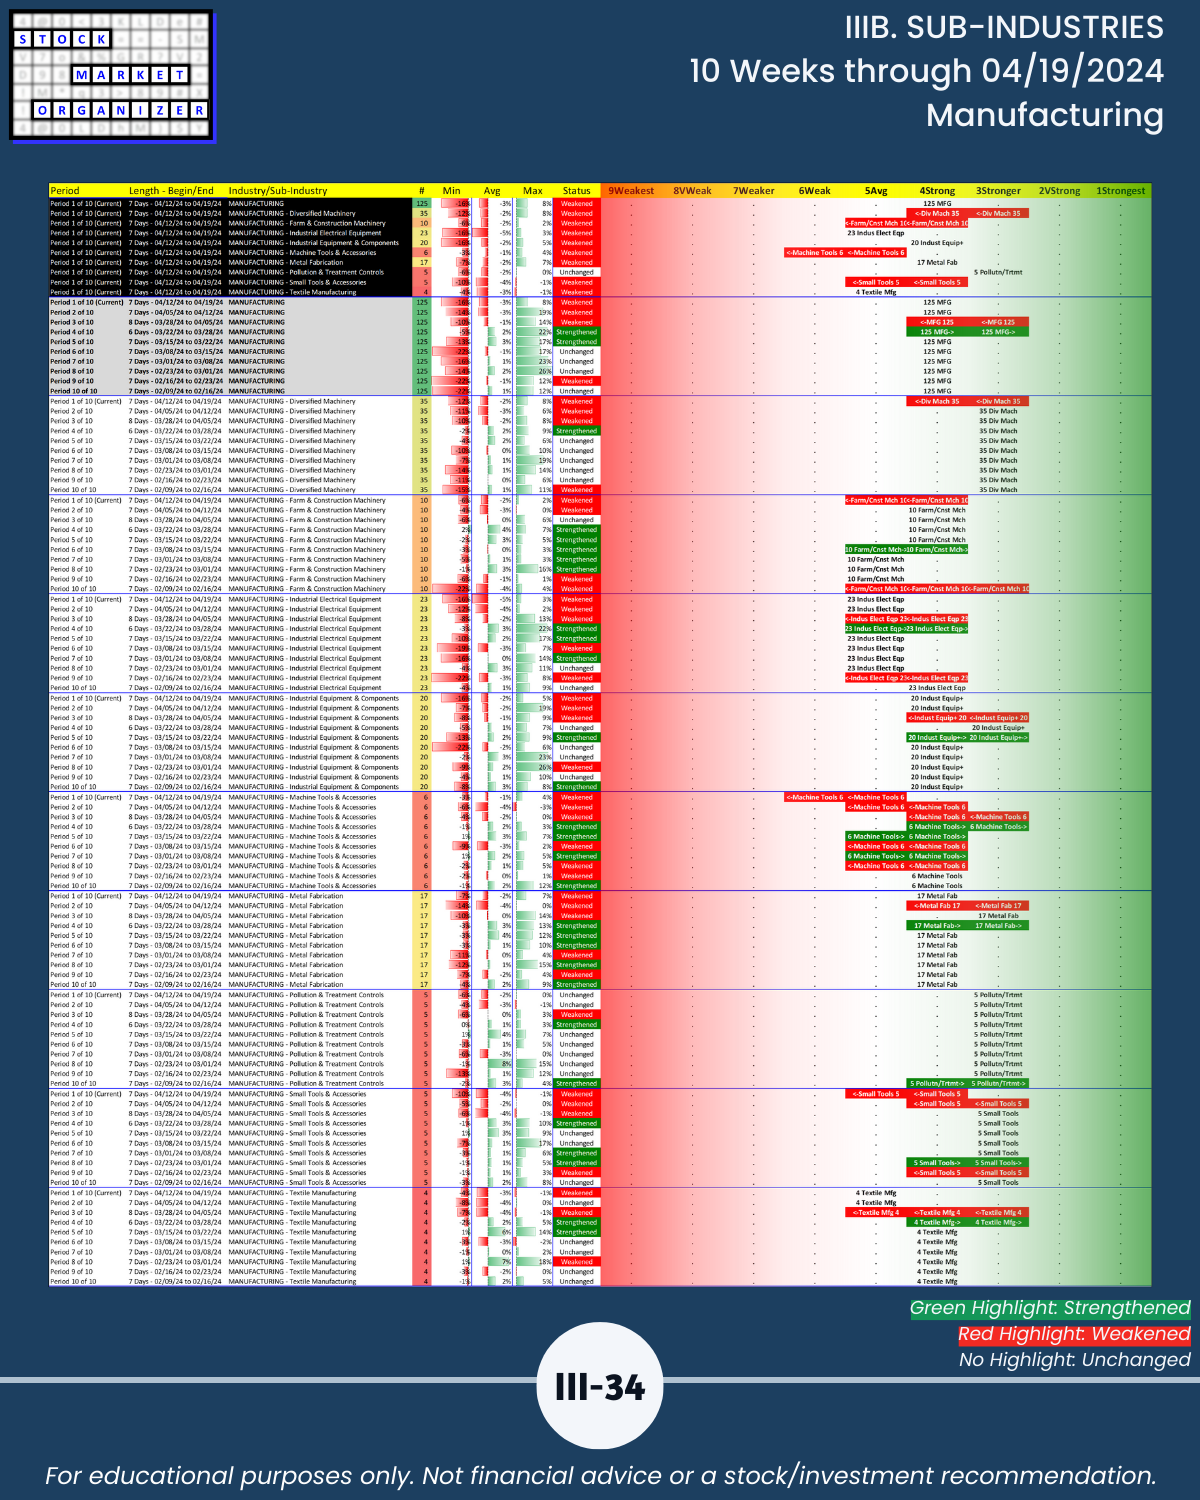
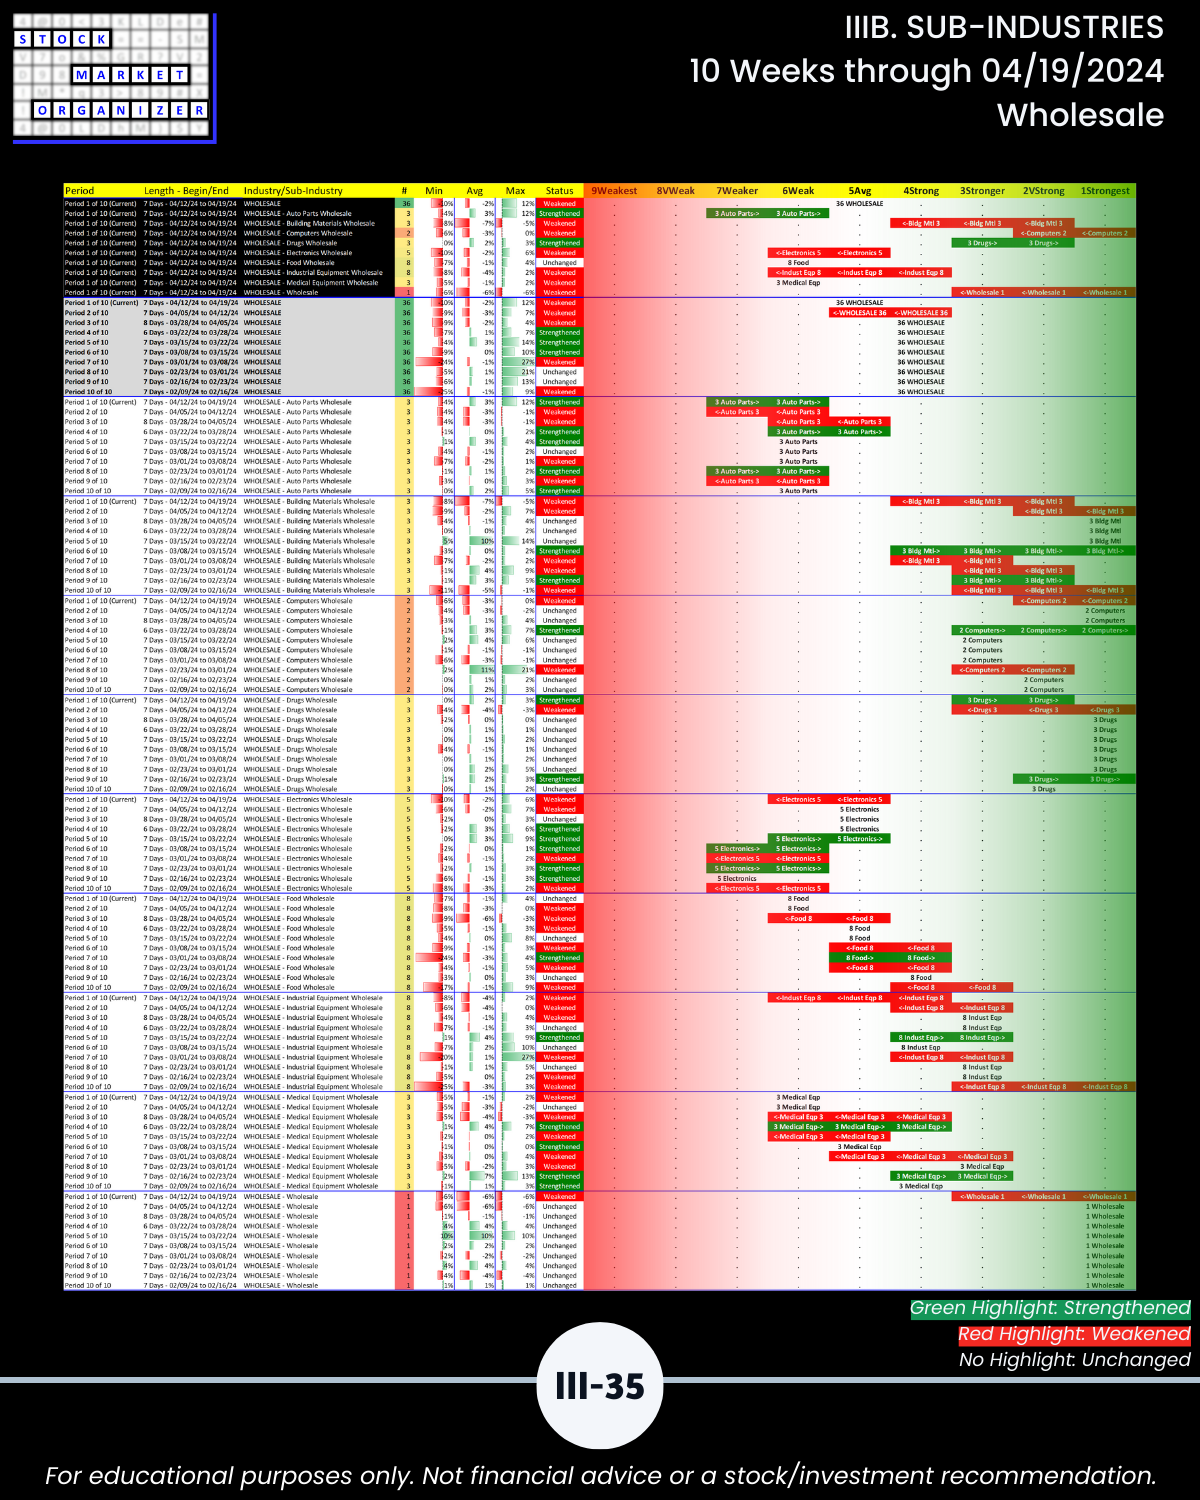
Sub-industries: Section III
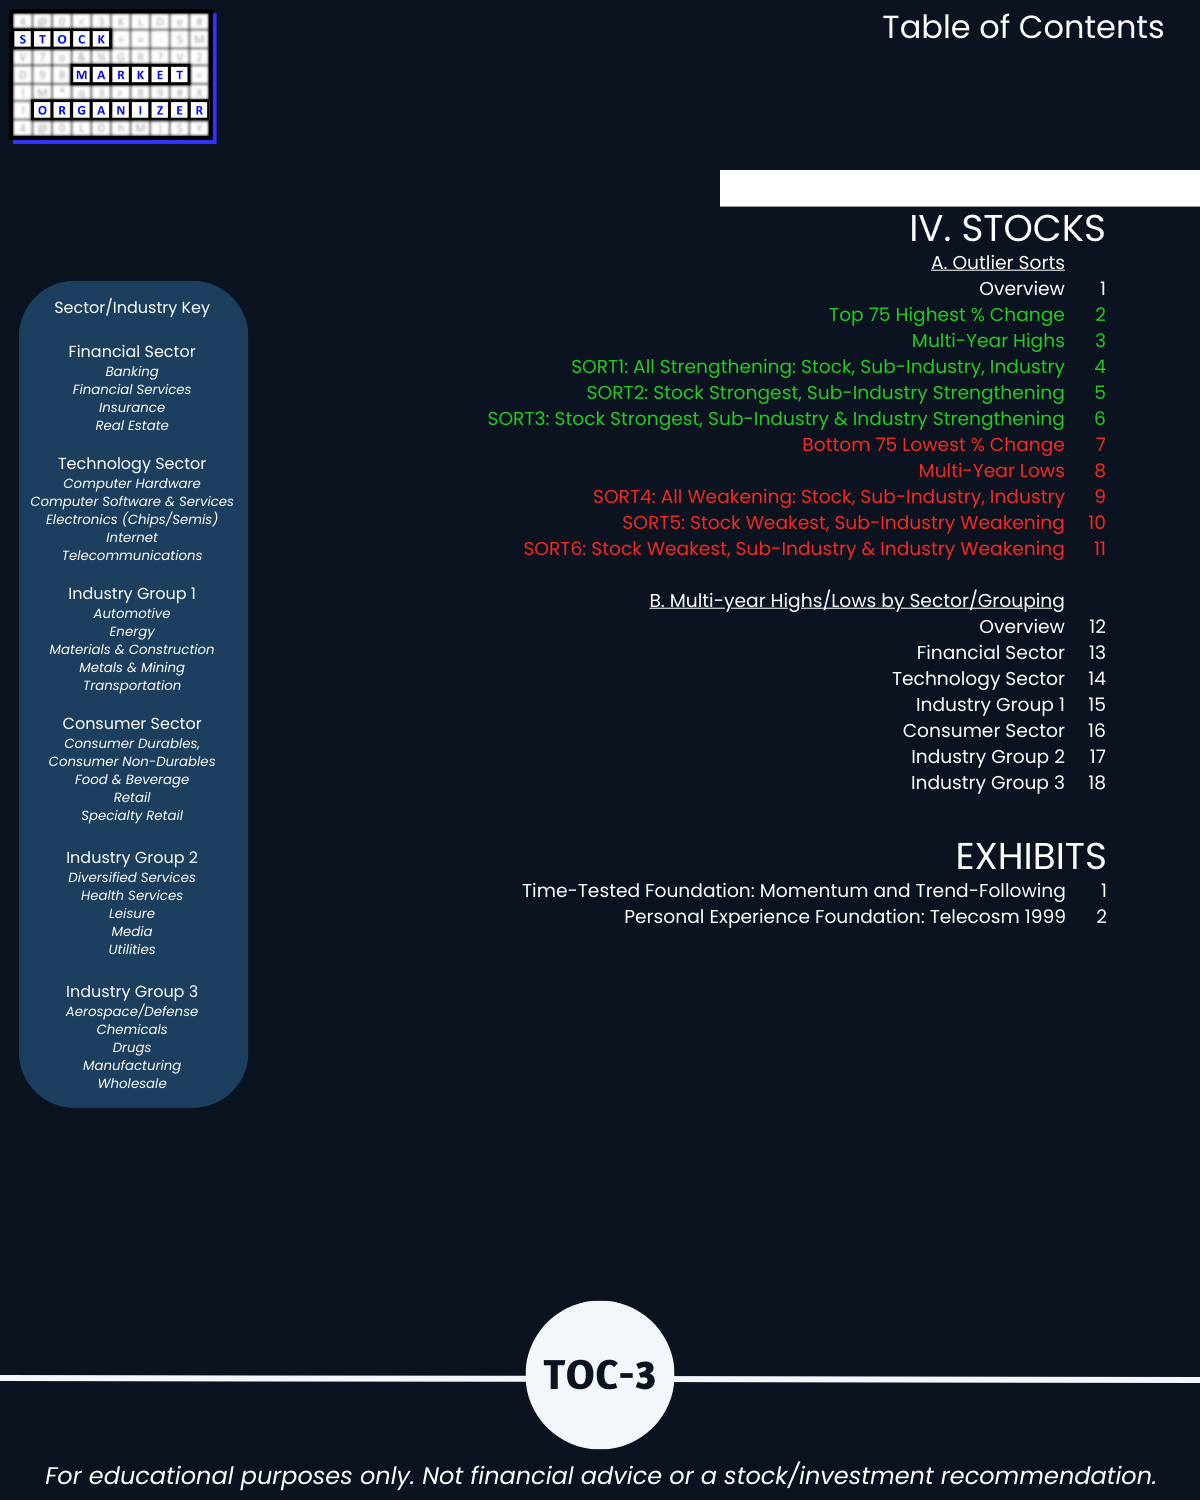
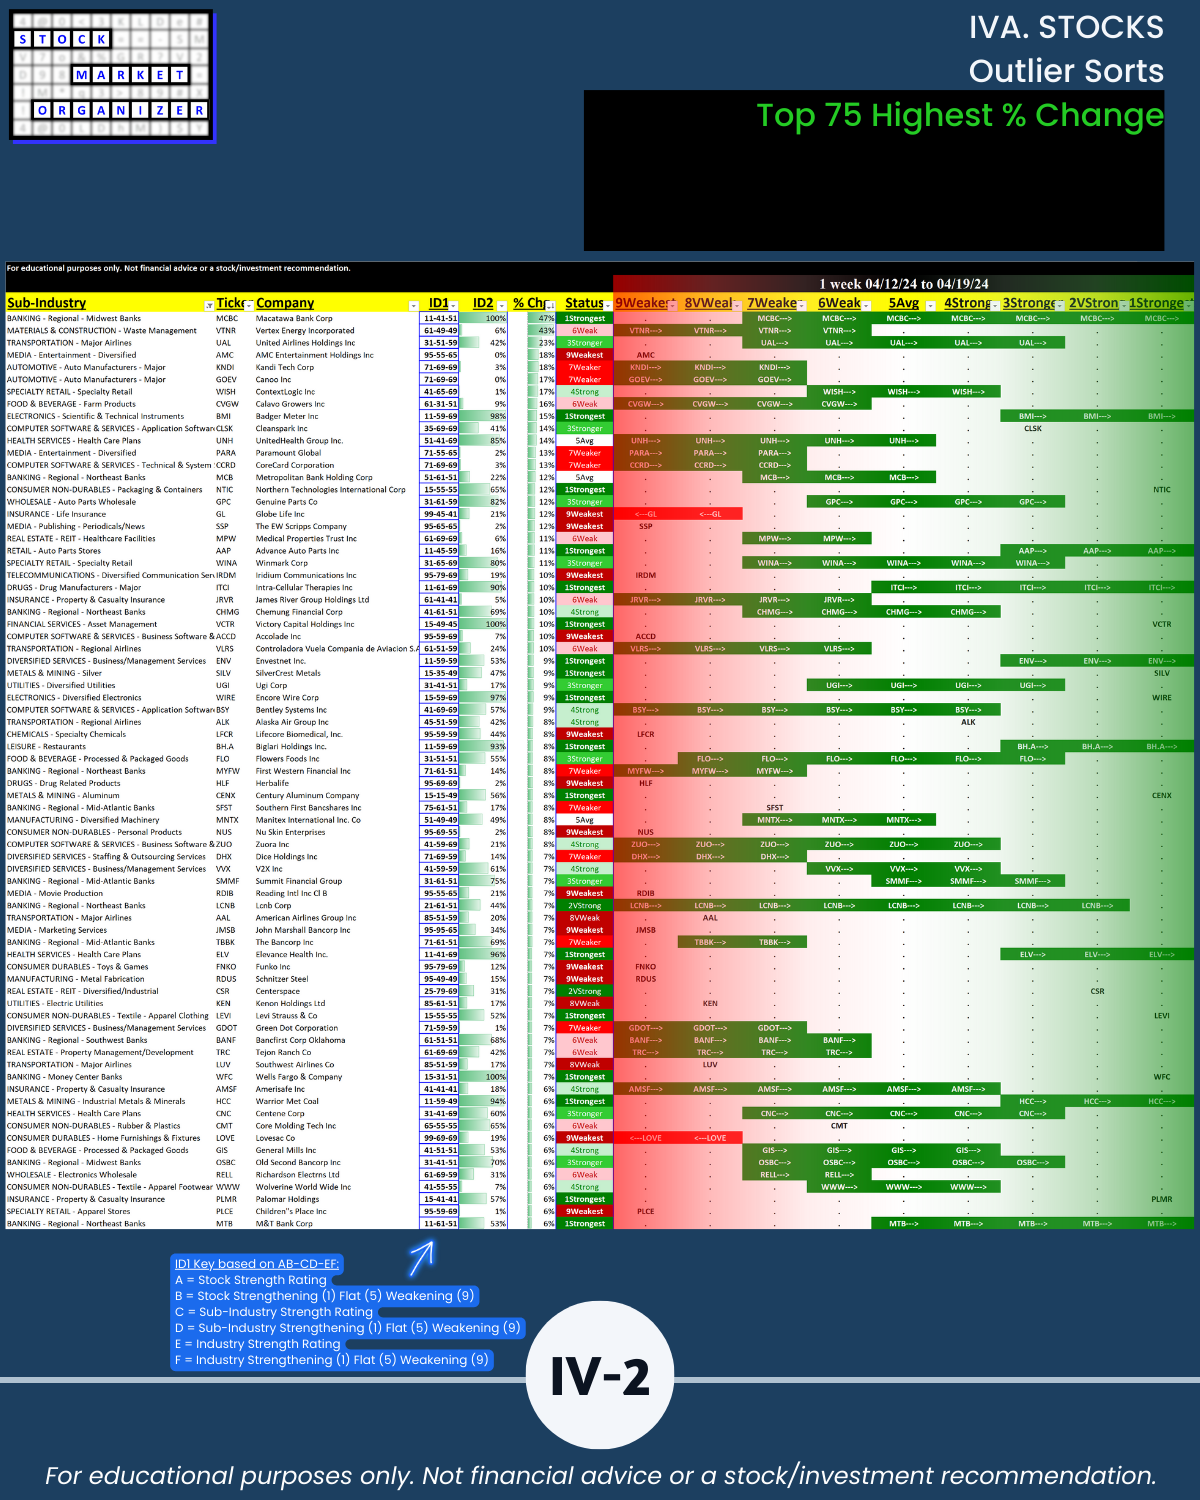
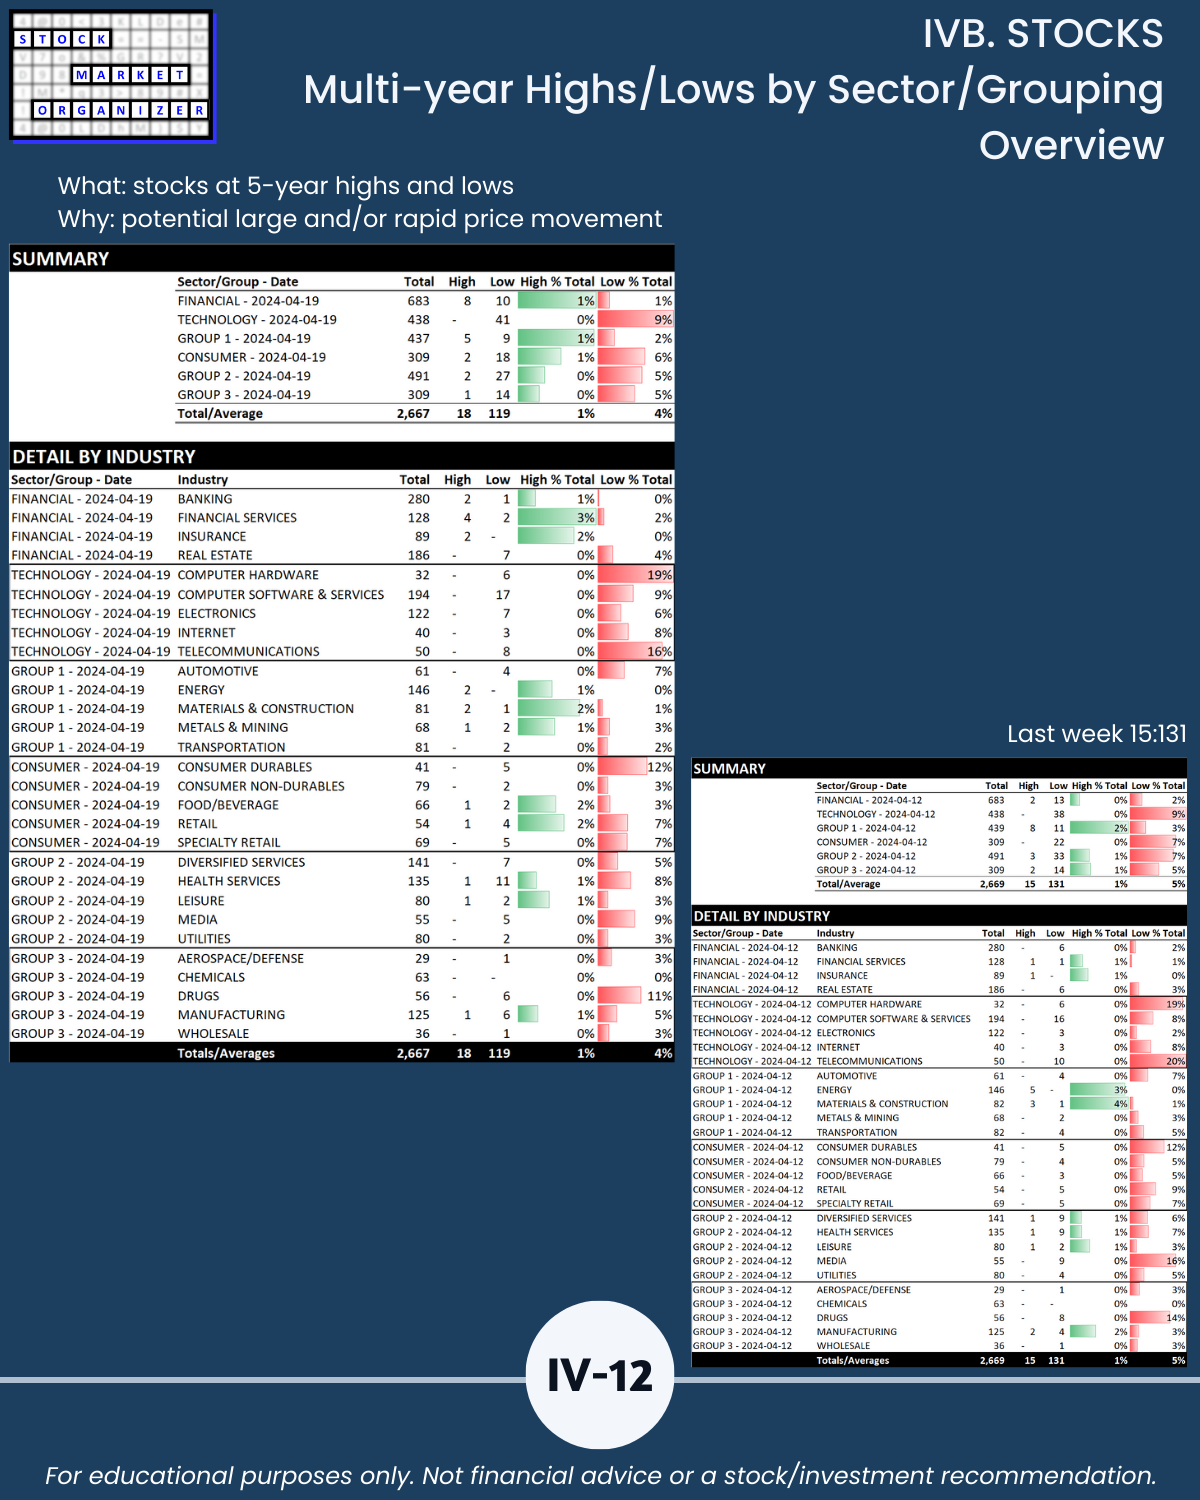
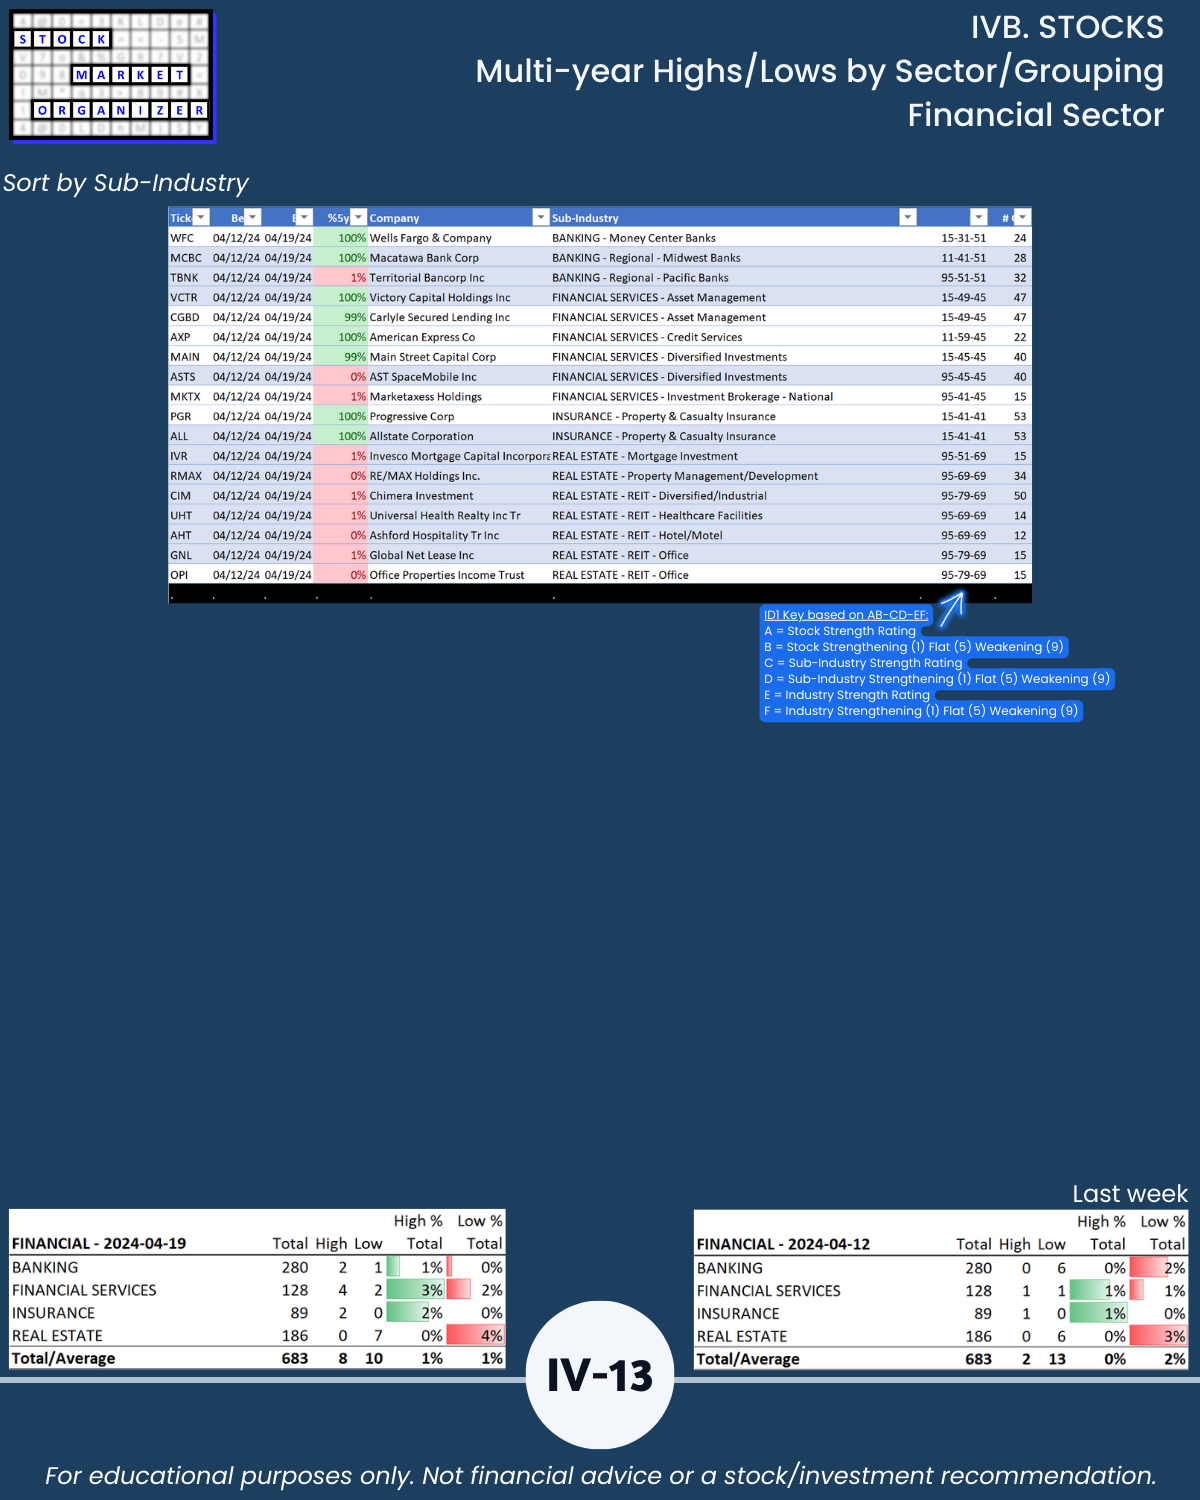
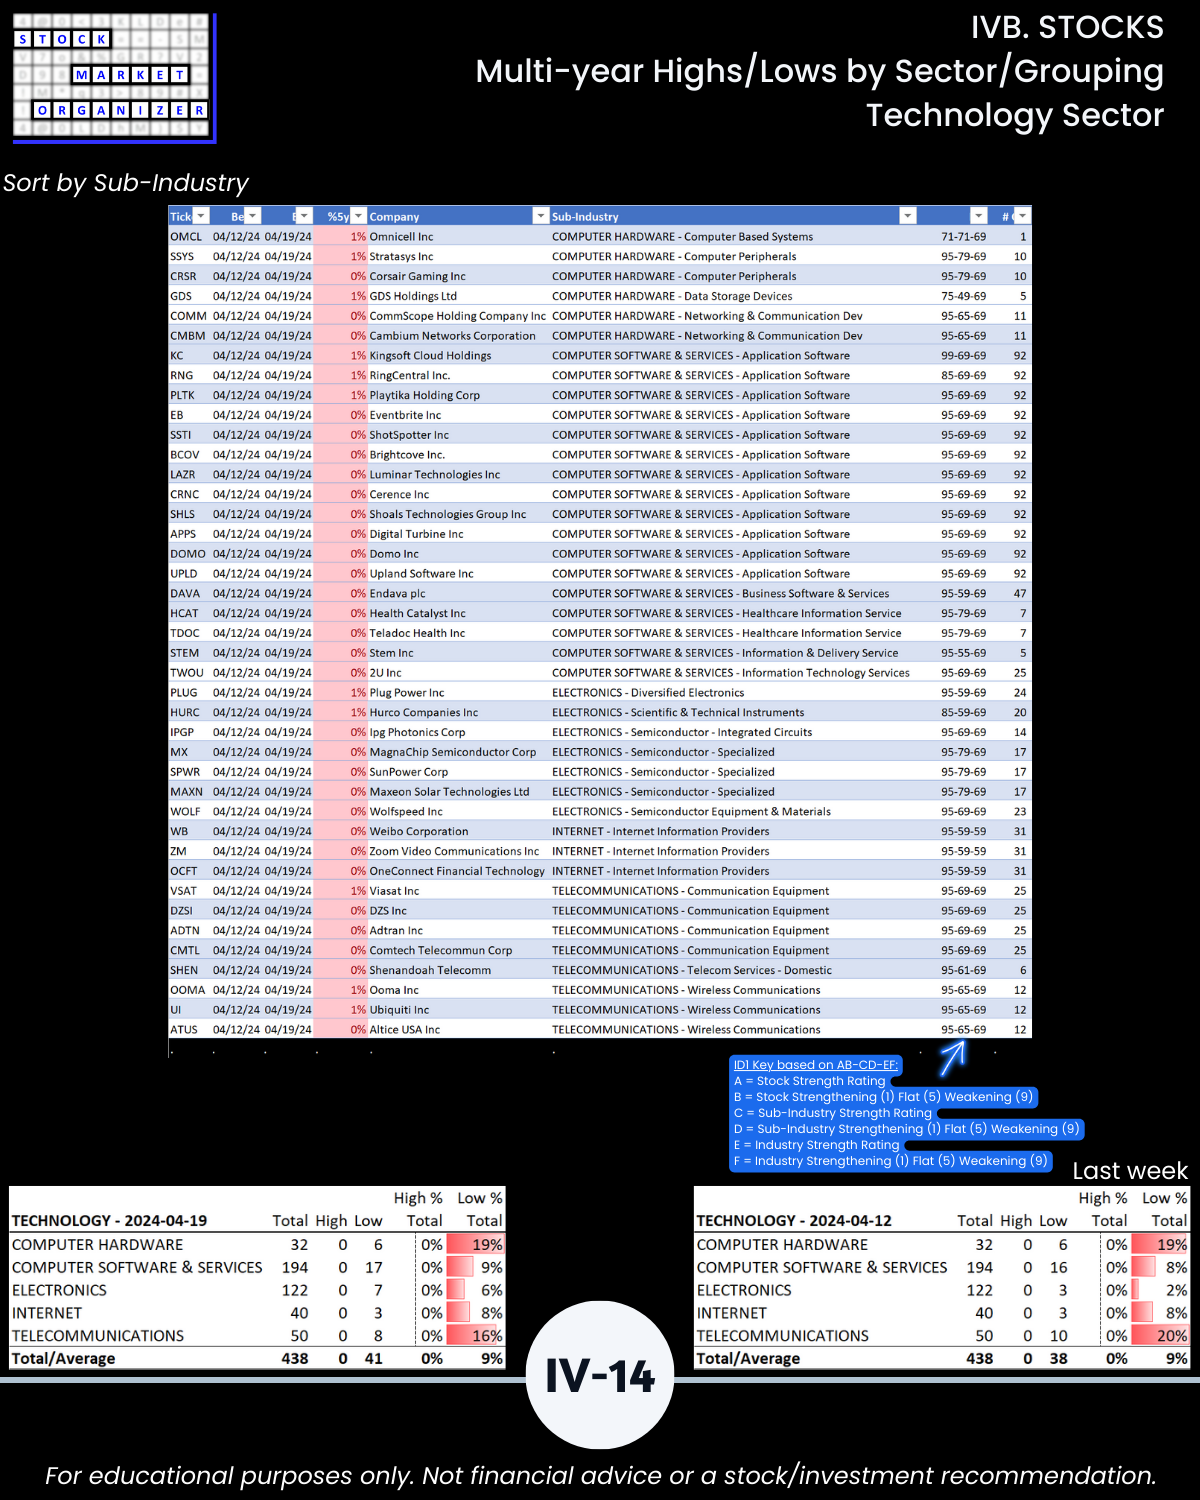
Stocks: Section IV
Retail participants – hoping you have plans to address this market. It’s dicey out there without a guide.
Advisors – hoping you can use a competitive edge that comes from offering your clients unique, concise market insights that reveal your comprehensive grasp on current conditions.
MORE TOP-DOWN, INSIDE-OUT, AND BOTTOM-UP DETAIL
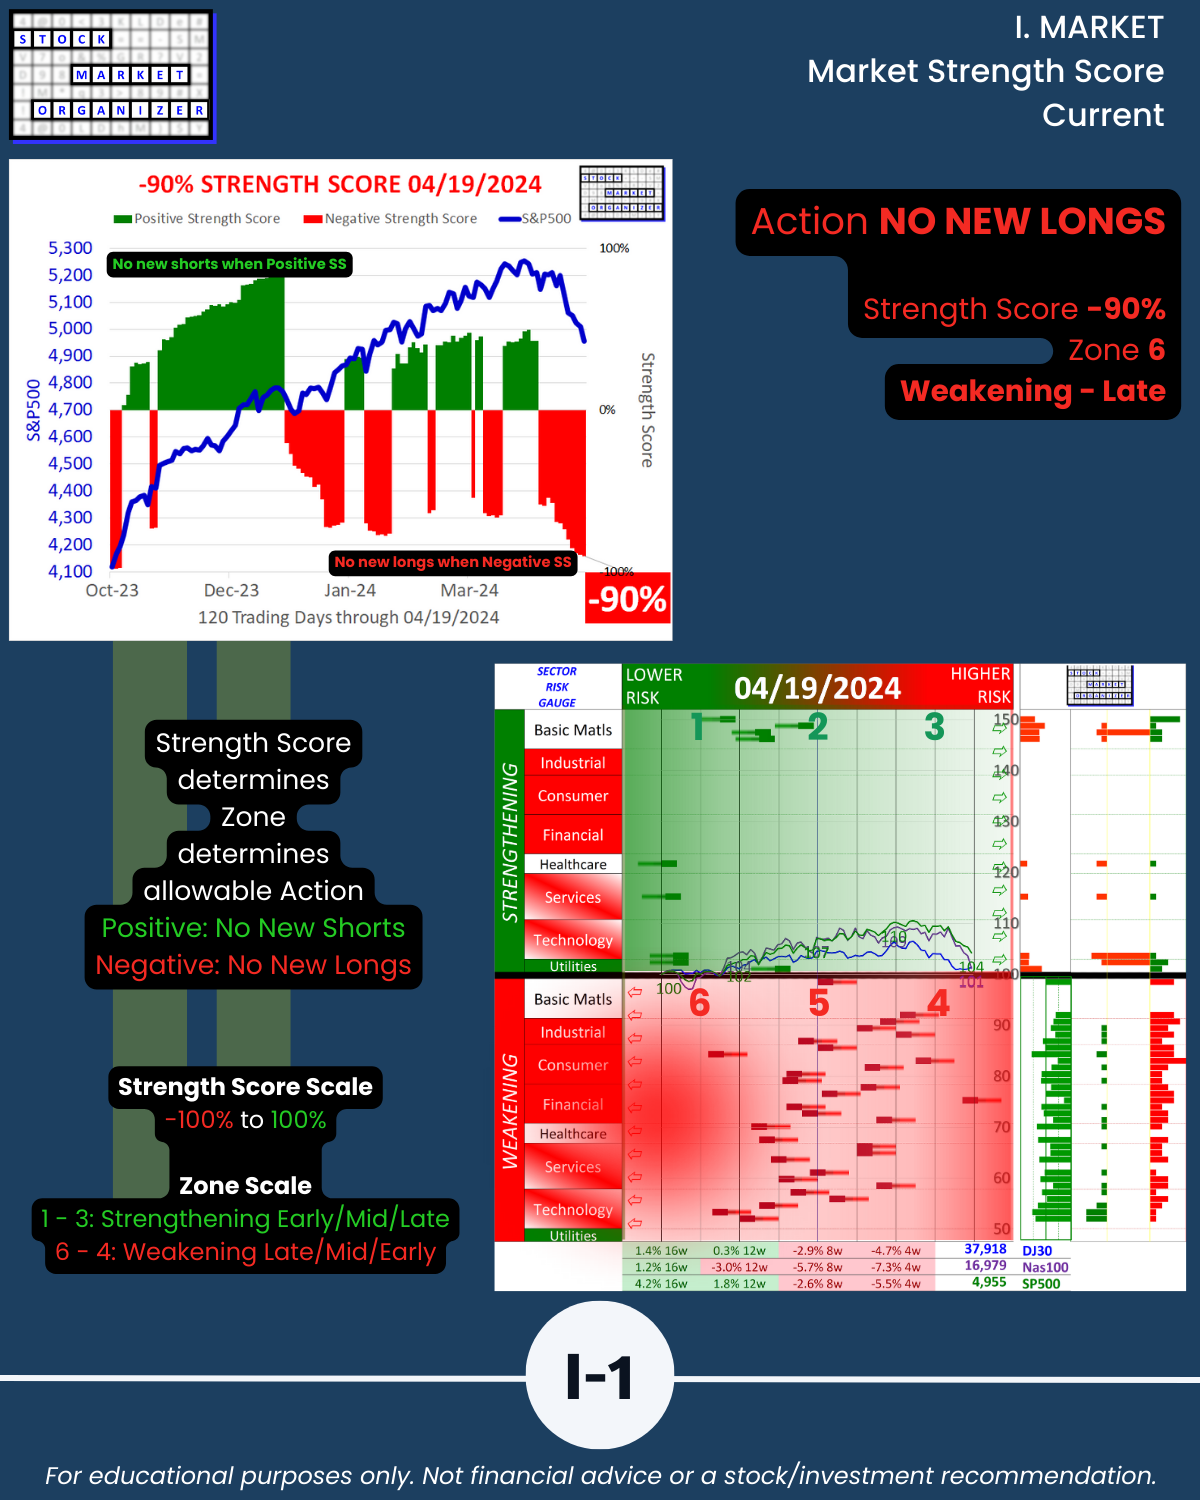
MARKET
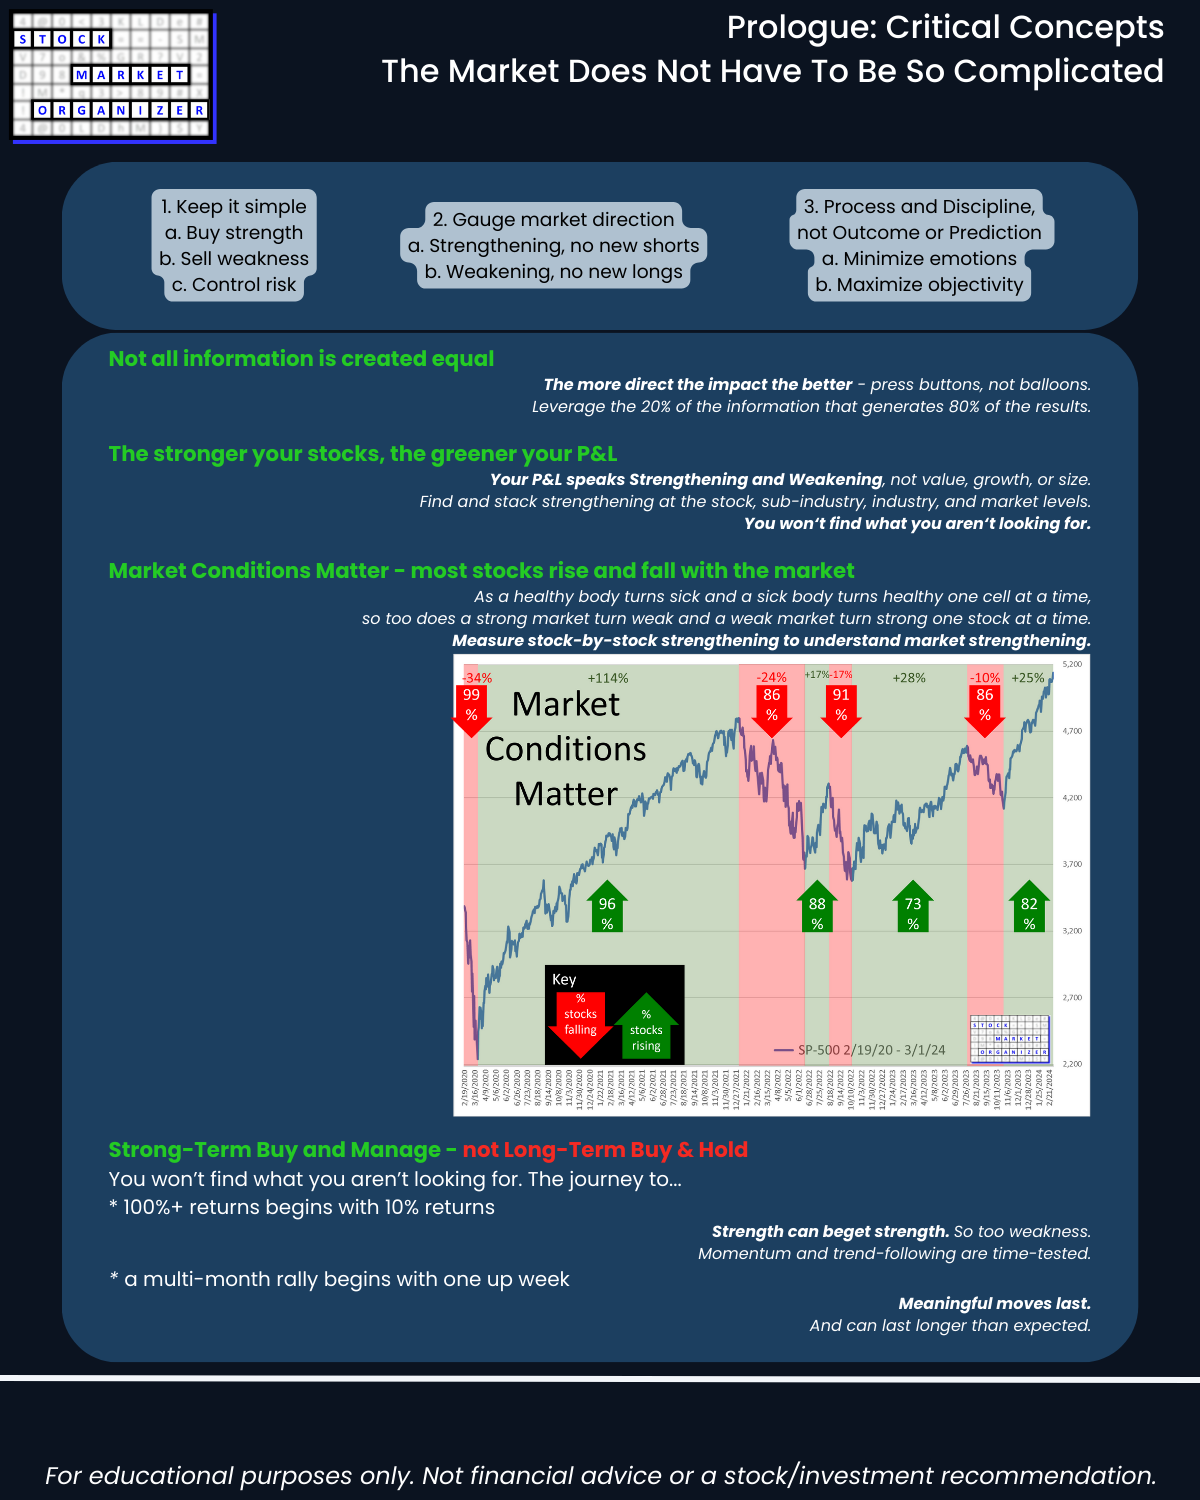
🔹 Has a negative Market Strength Score so NO NEW LONGS
SECTORS/INDUSTRY GROUPINGS (6)
🔹 Overall weighted average strength ranking is 5.2, -0.2 this week
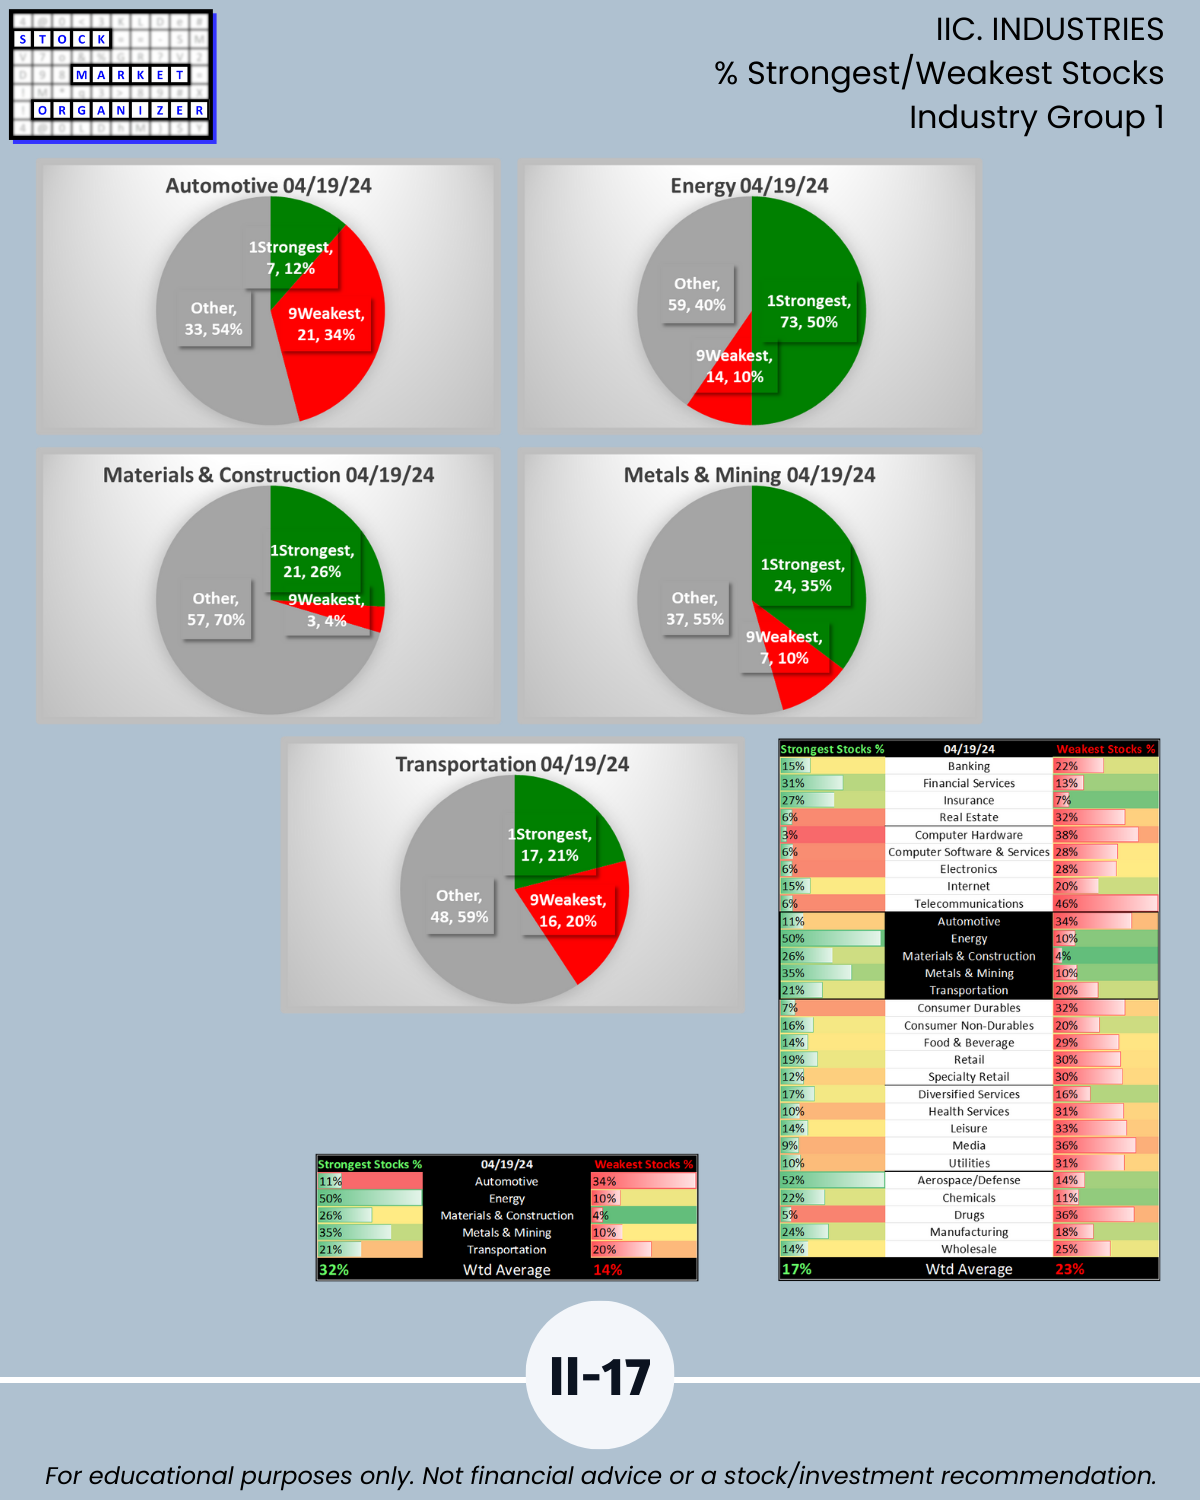
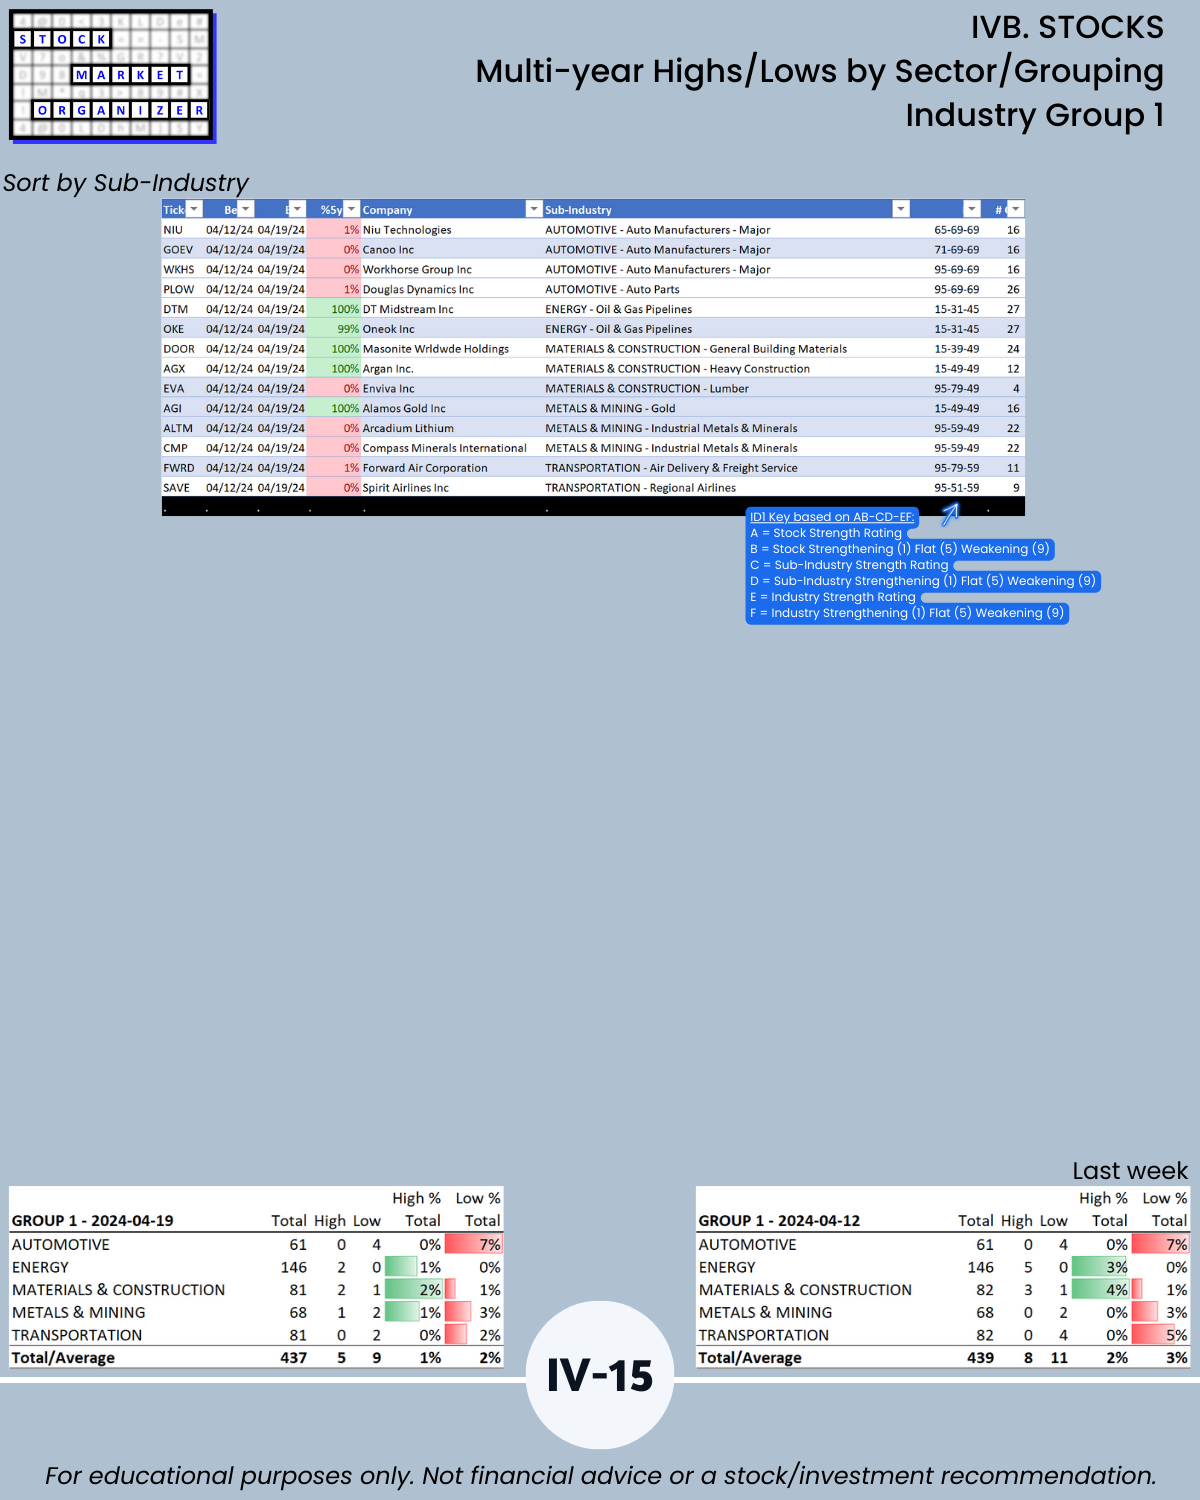
🔹 Best: Industry Group 1, 4.5 = -0.3 this week (Automotive, Energy, Materials/Construction, Metals/Mining, Transportation)
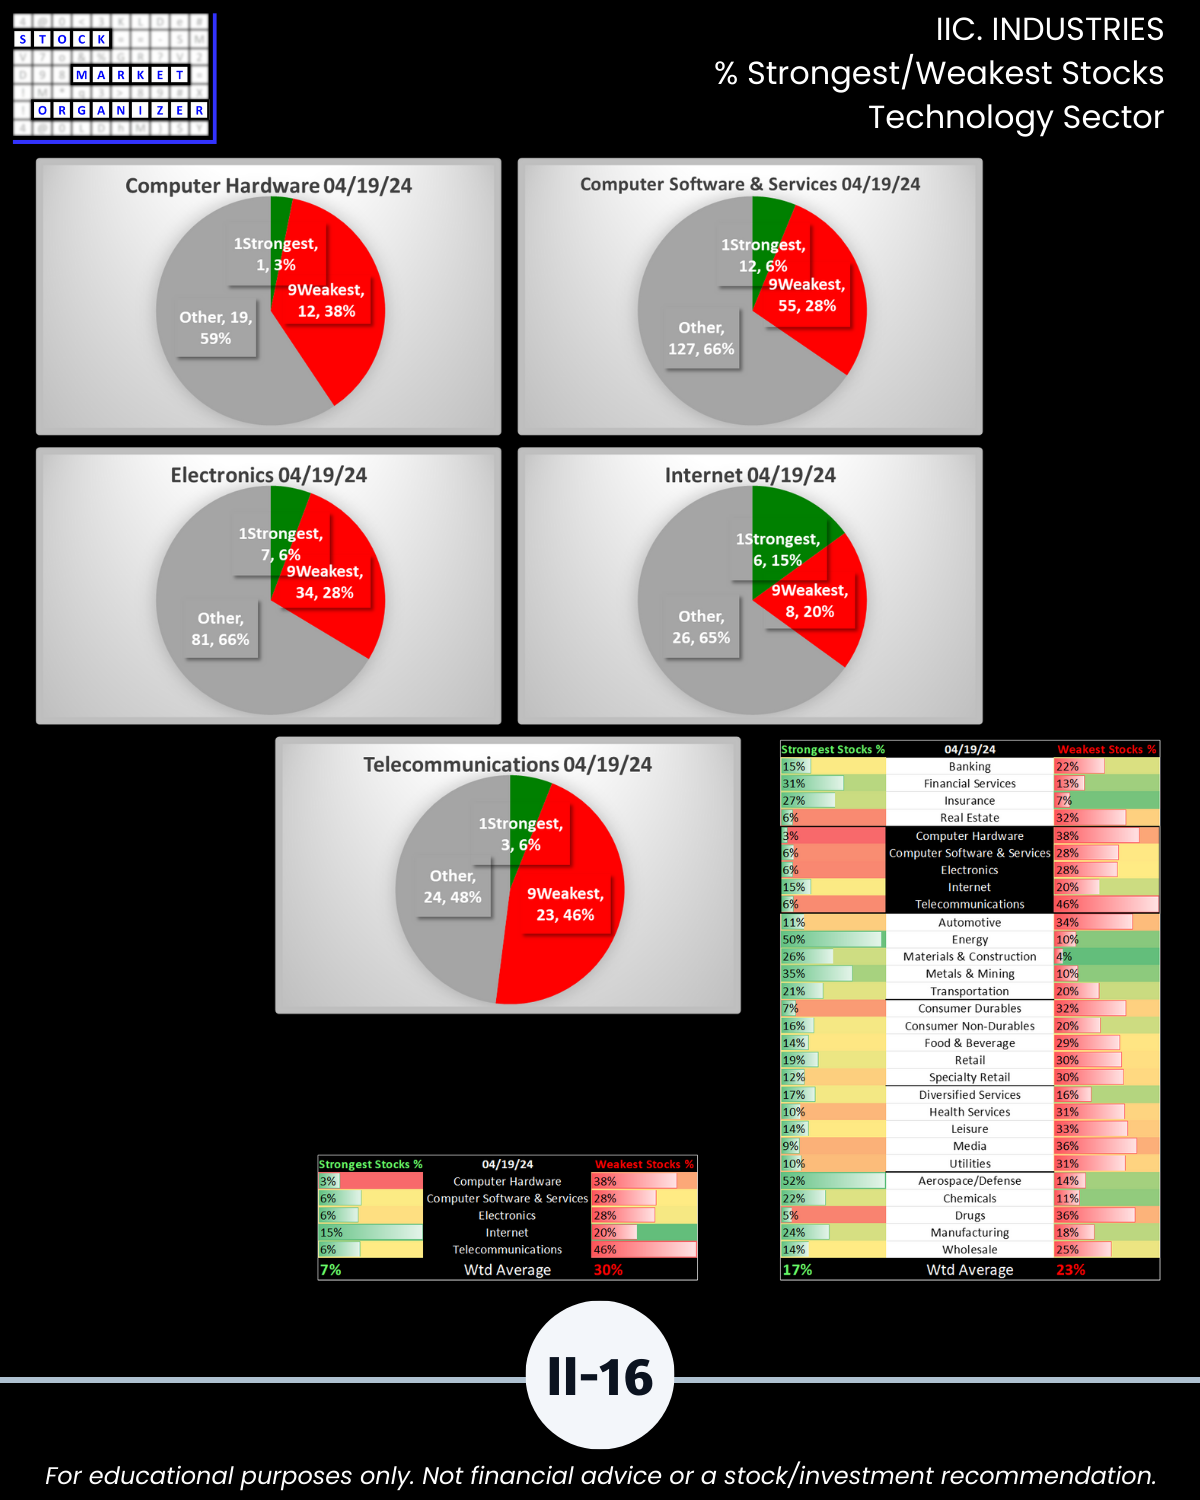
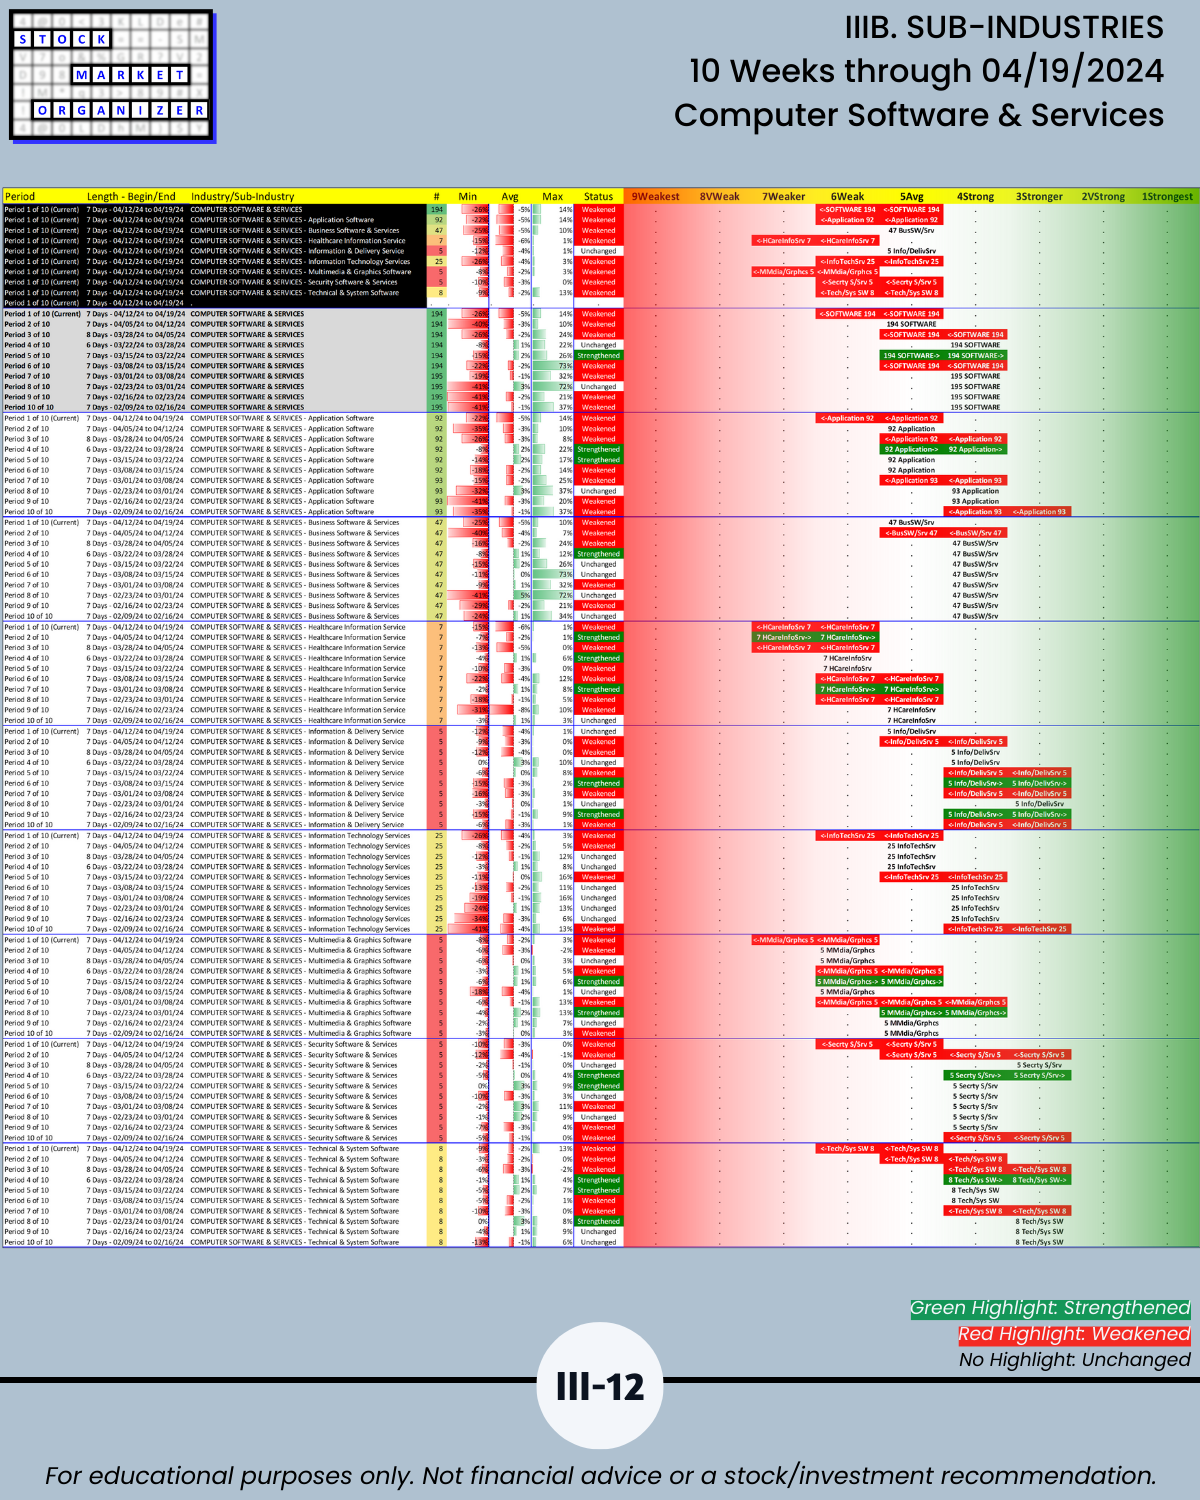
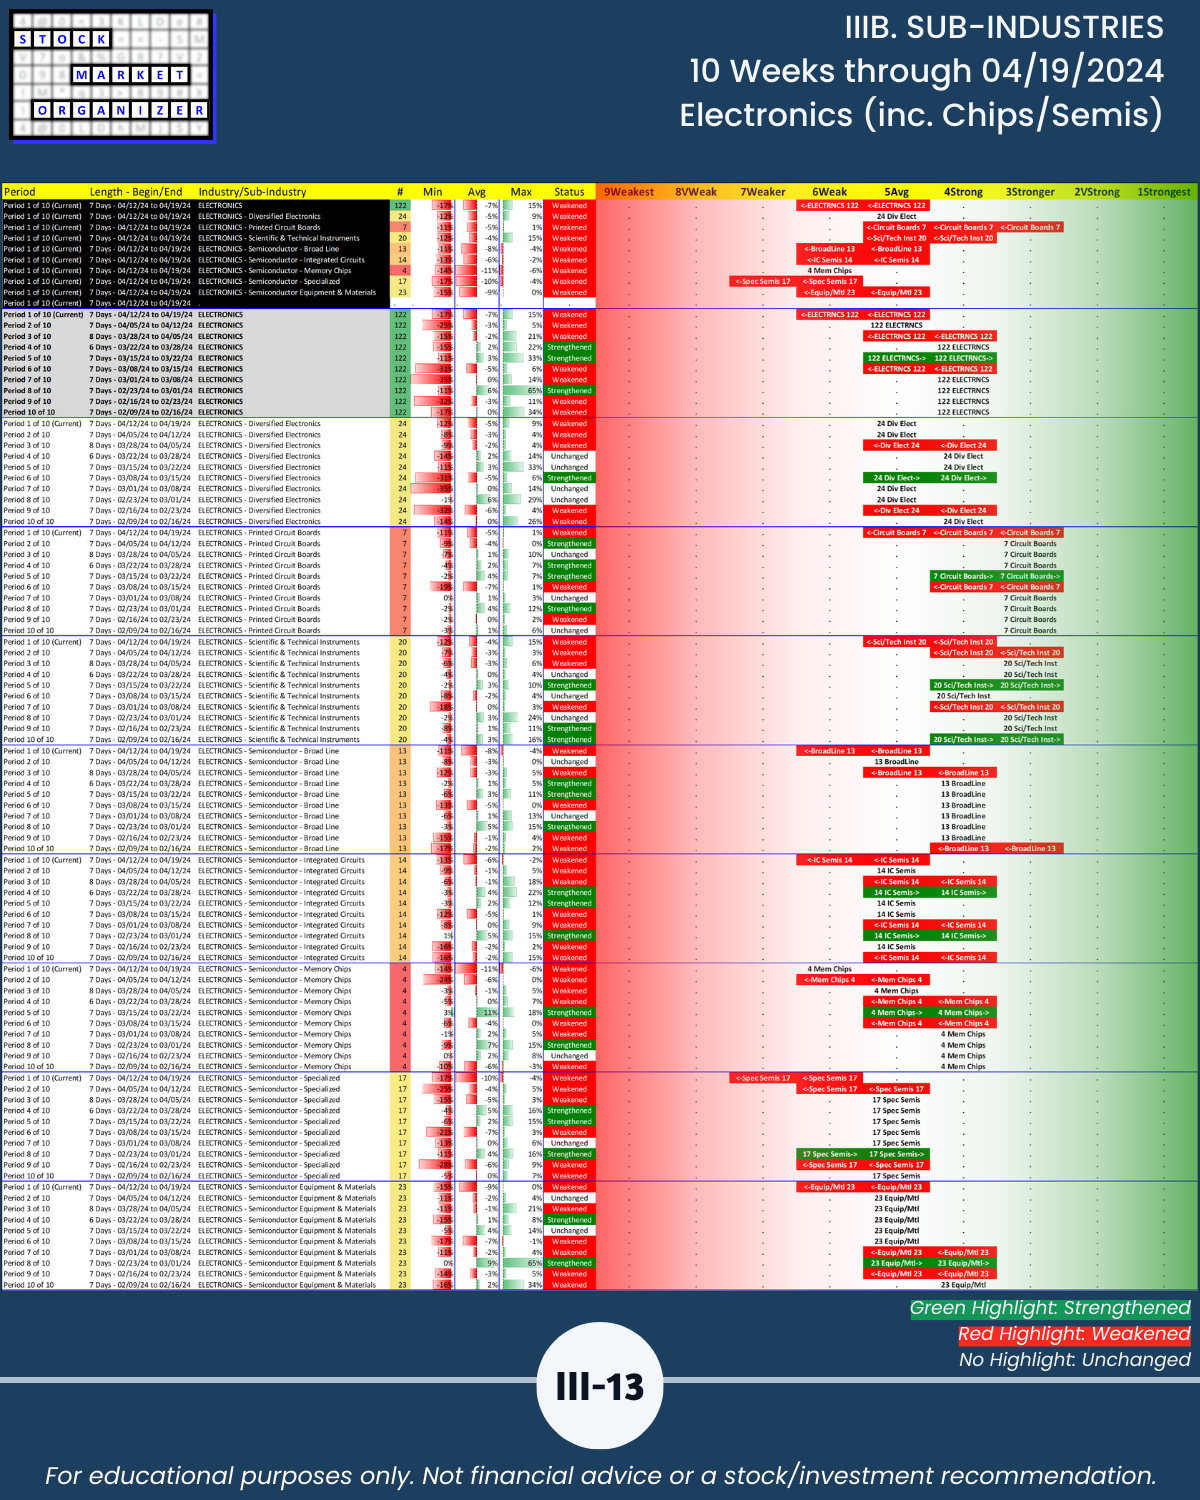
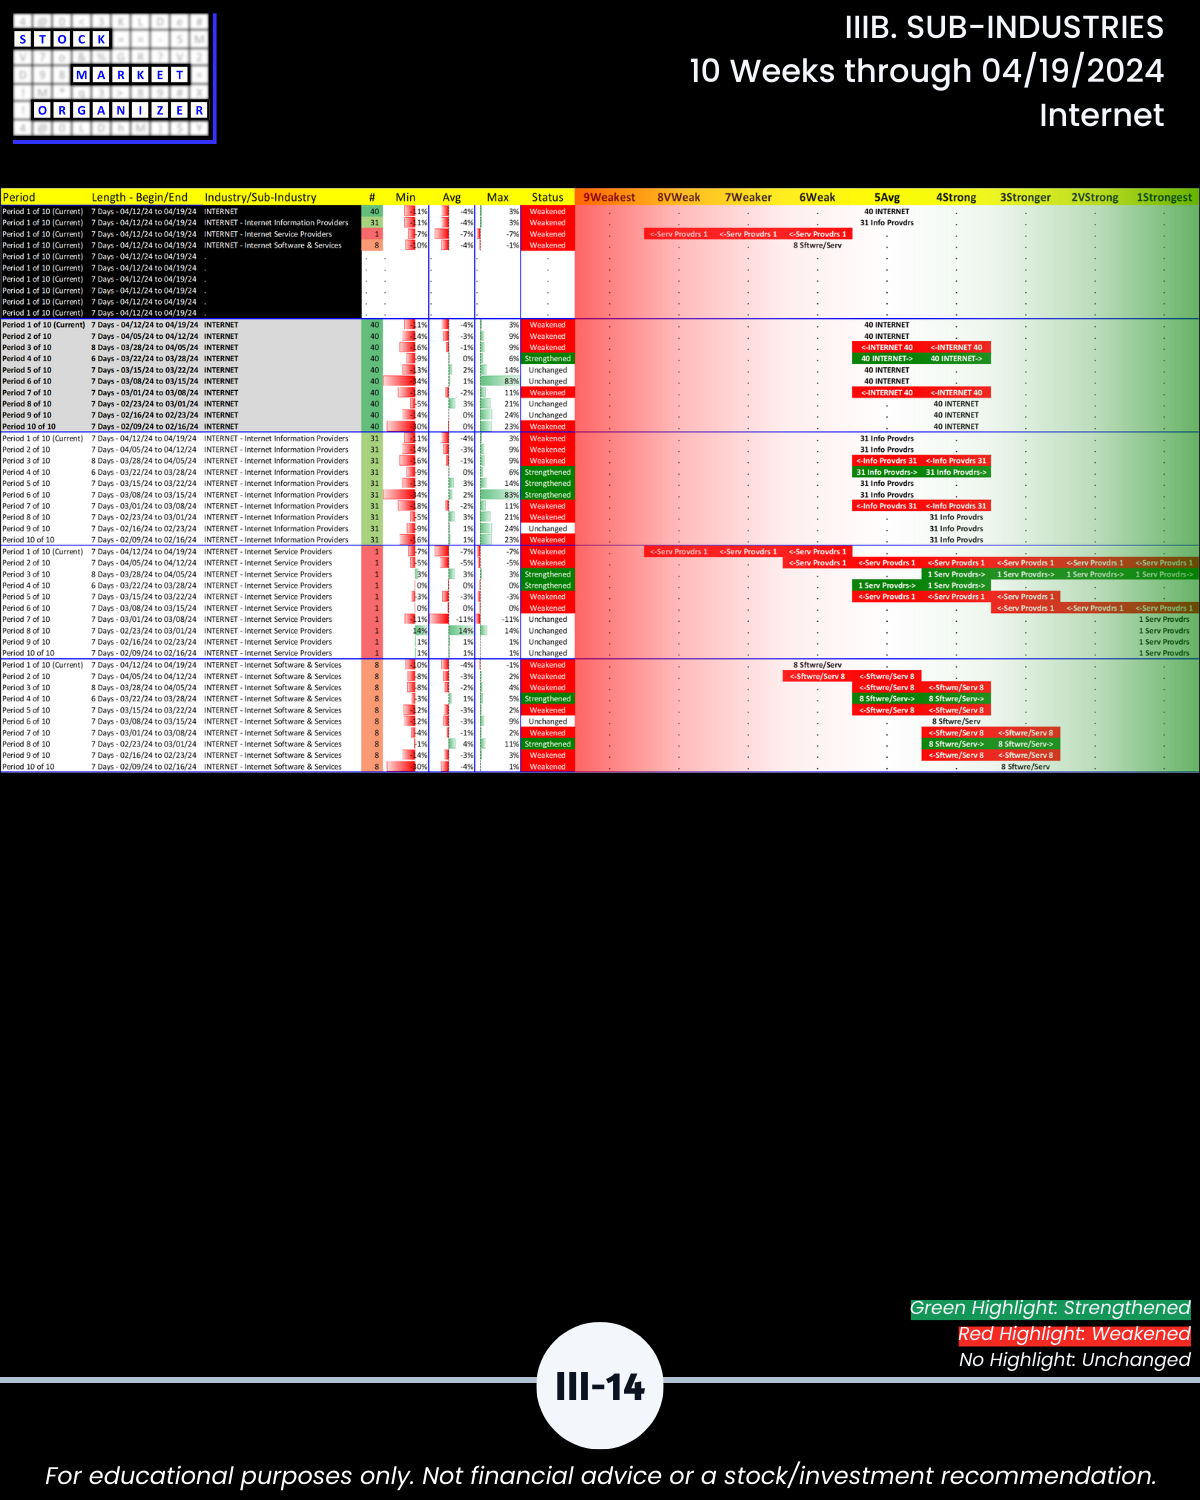
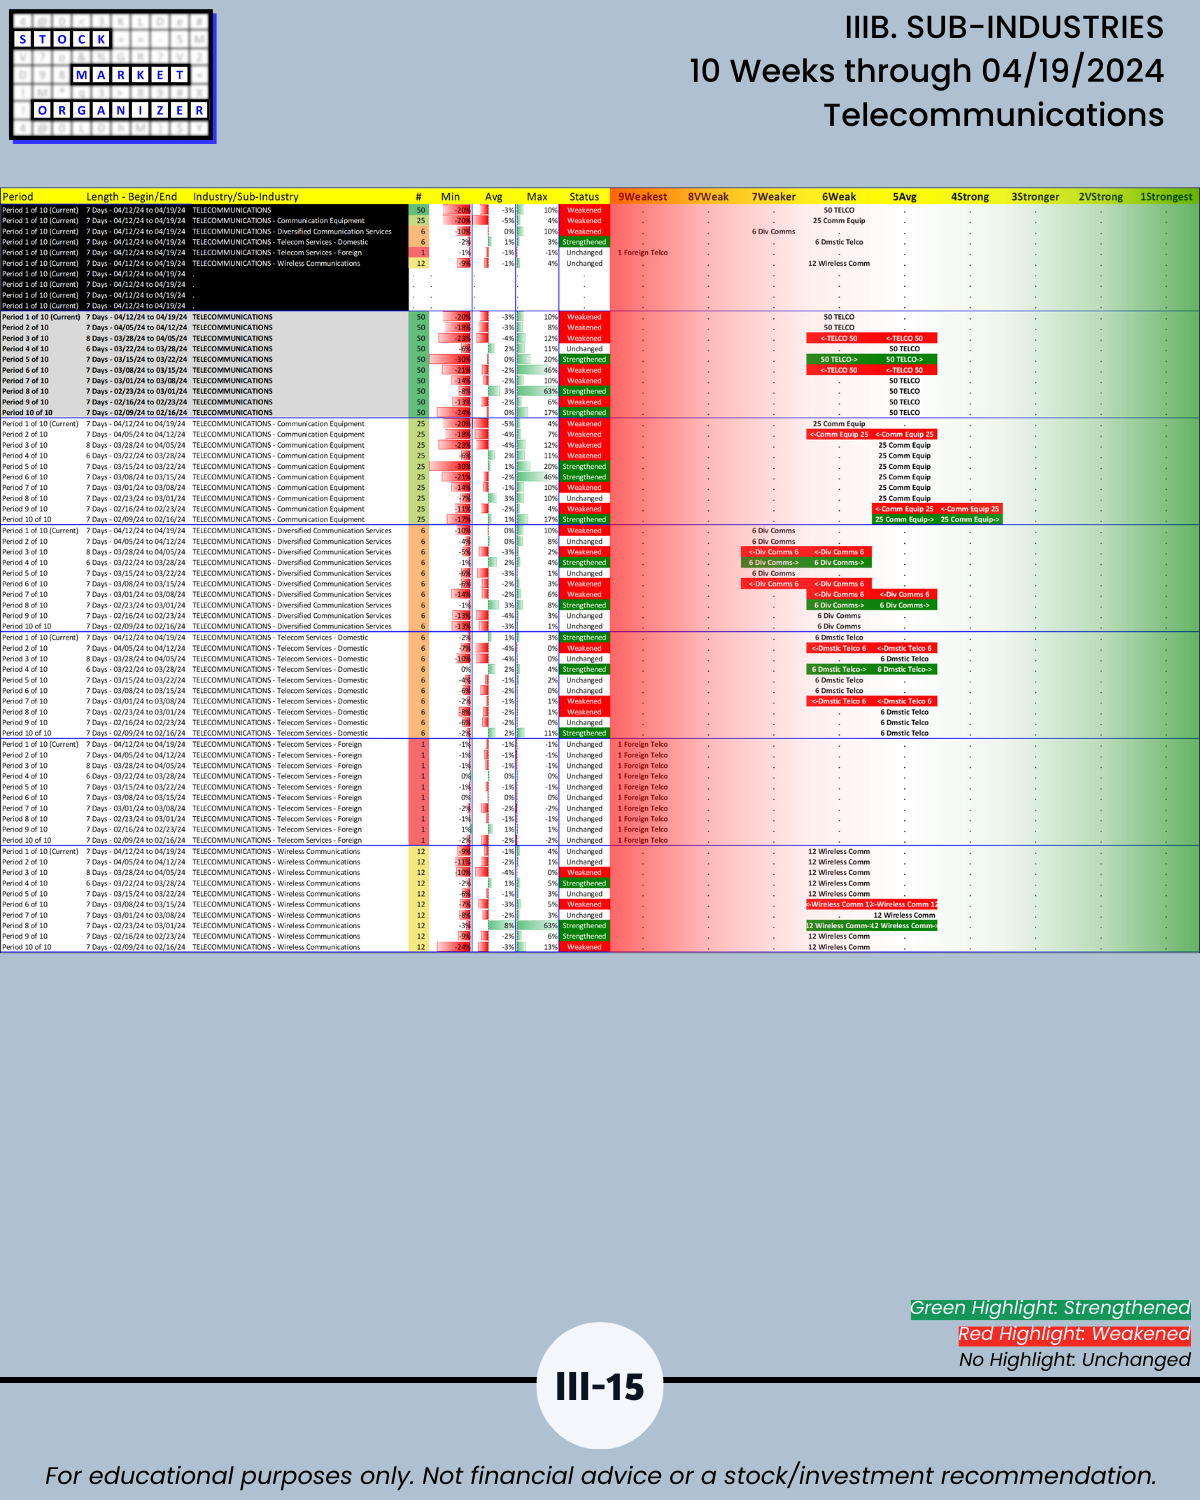
🔹 Worst: Tech Sector, 5.9 = -0.7 this week (Computer Hardware, Computer Software & Services, Electronics, Internet, and Telecommunications)
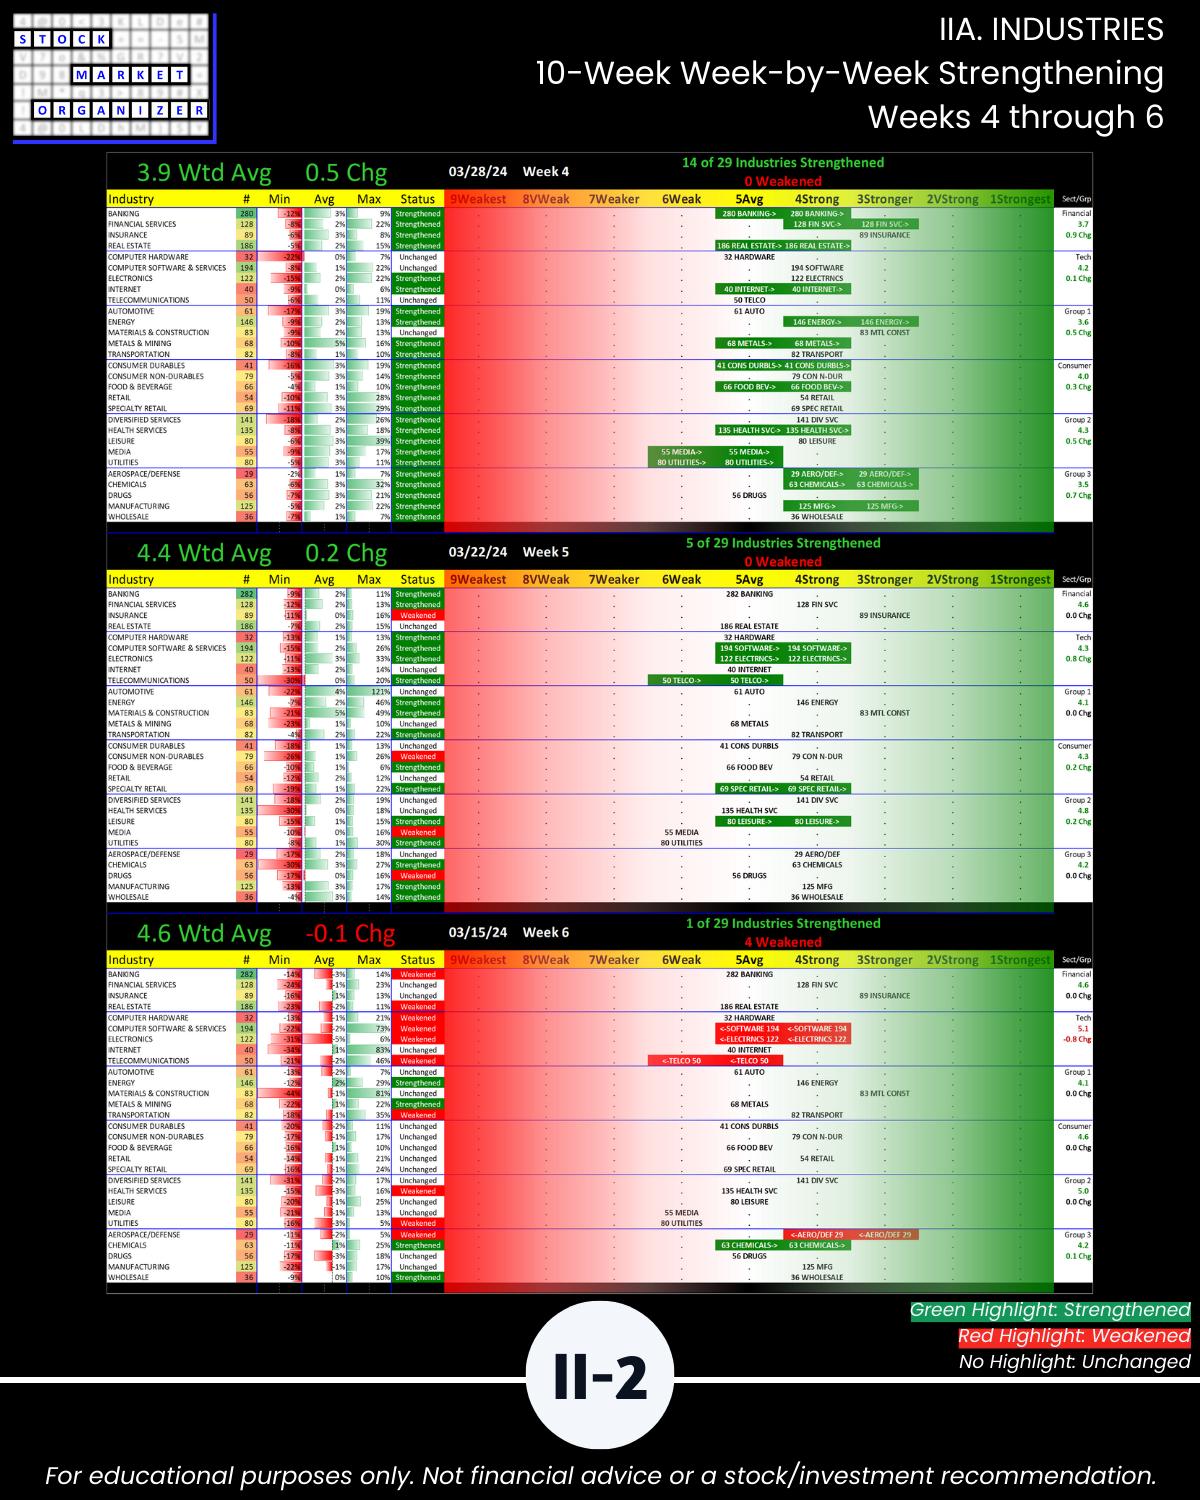
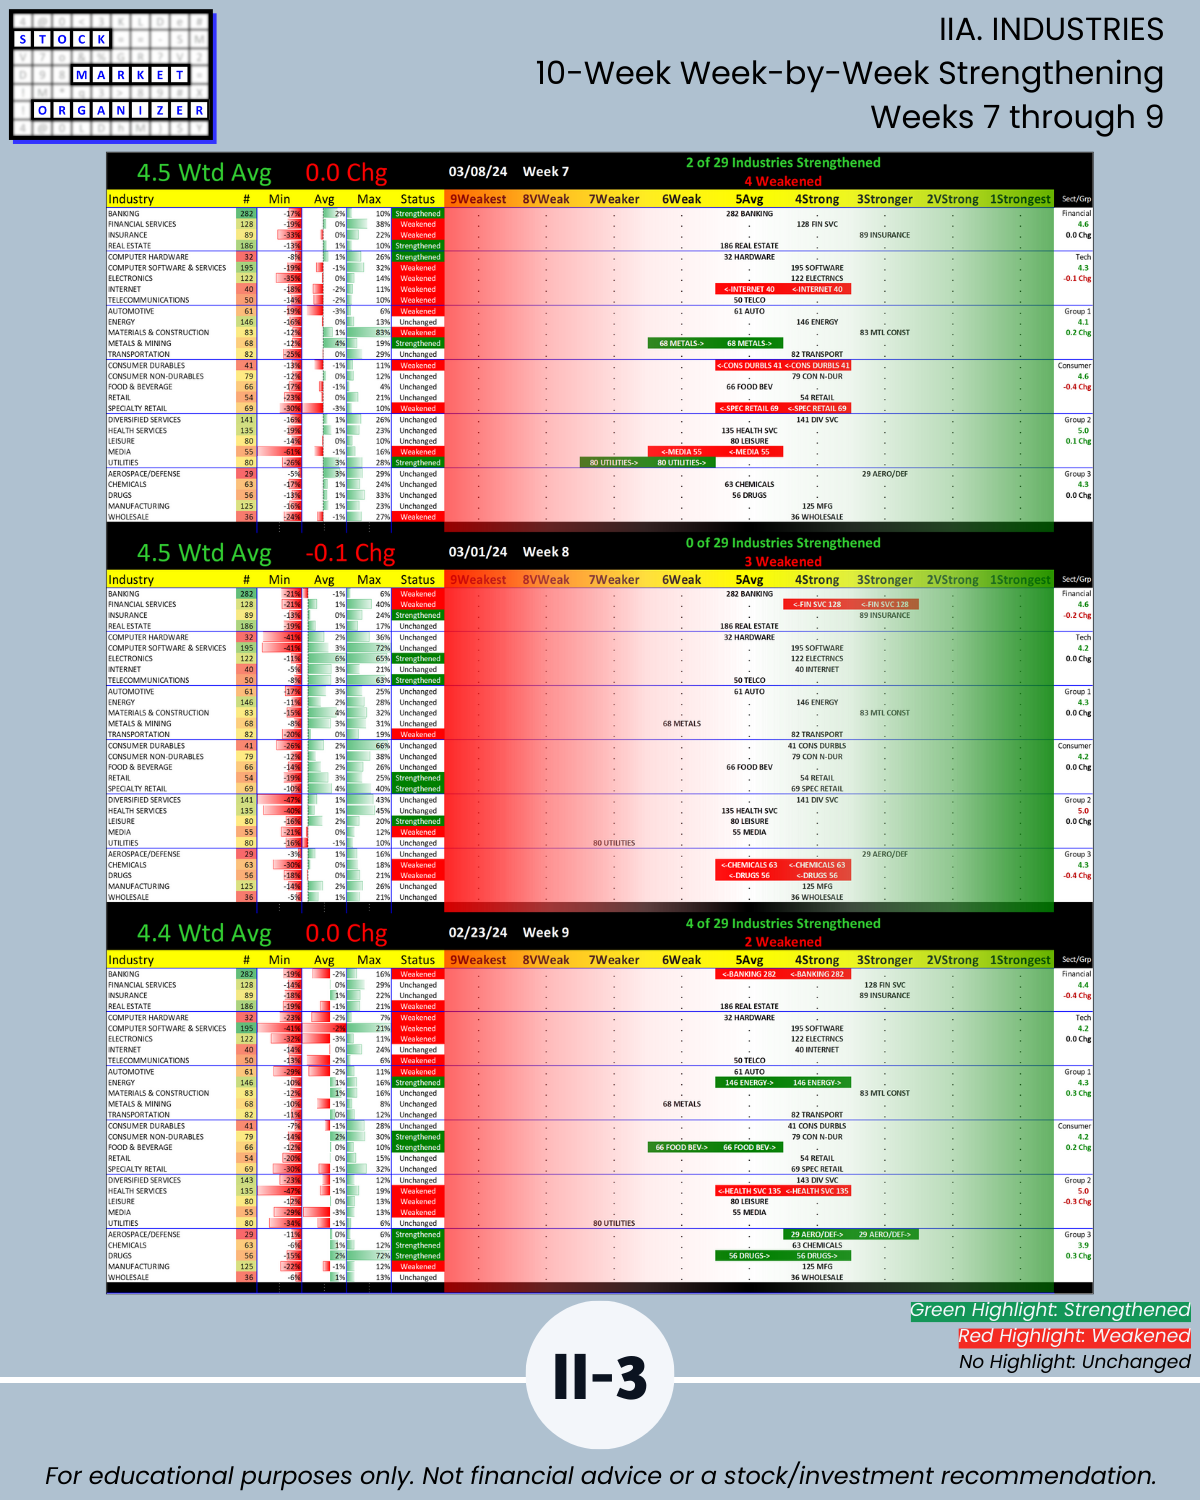
INDUSTRIES
🔹 Strongest: 7-way tie at 4Strong
- Financial Services
- Insurance
- Energy
- Materials & Construction
- Metals & Mining
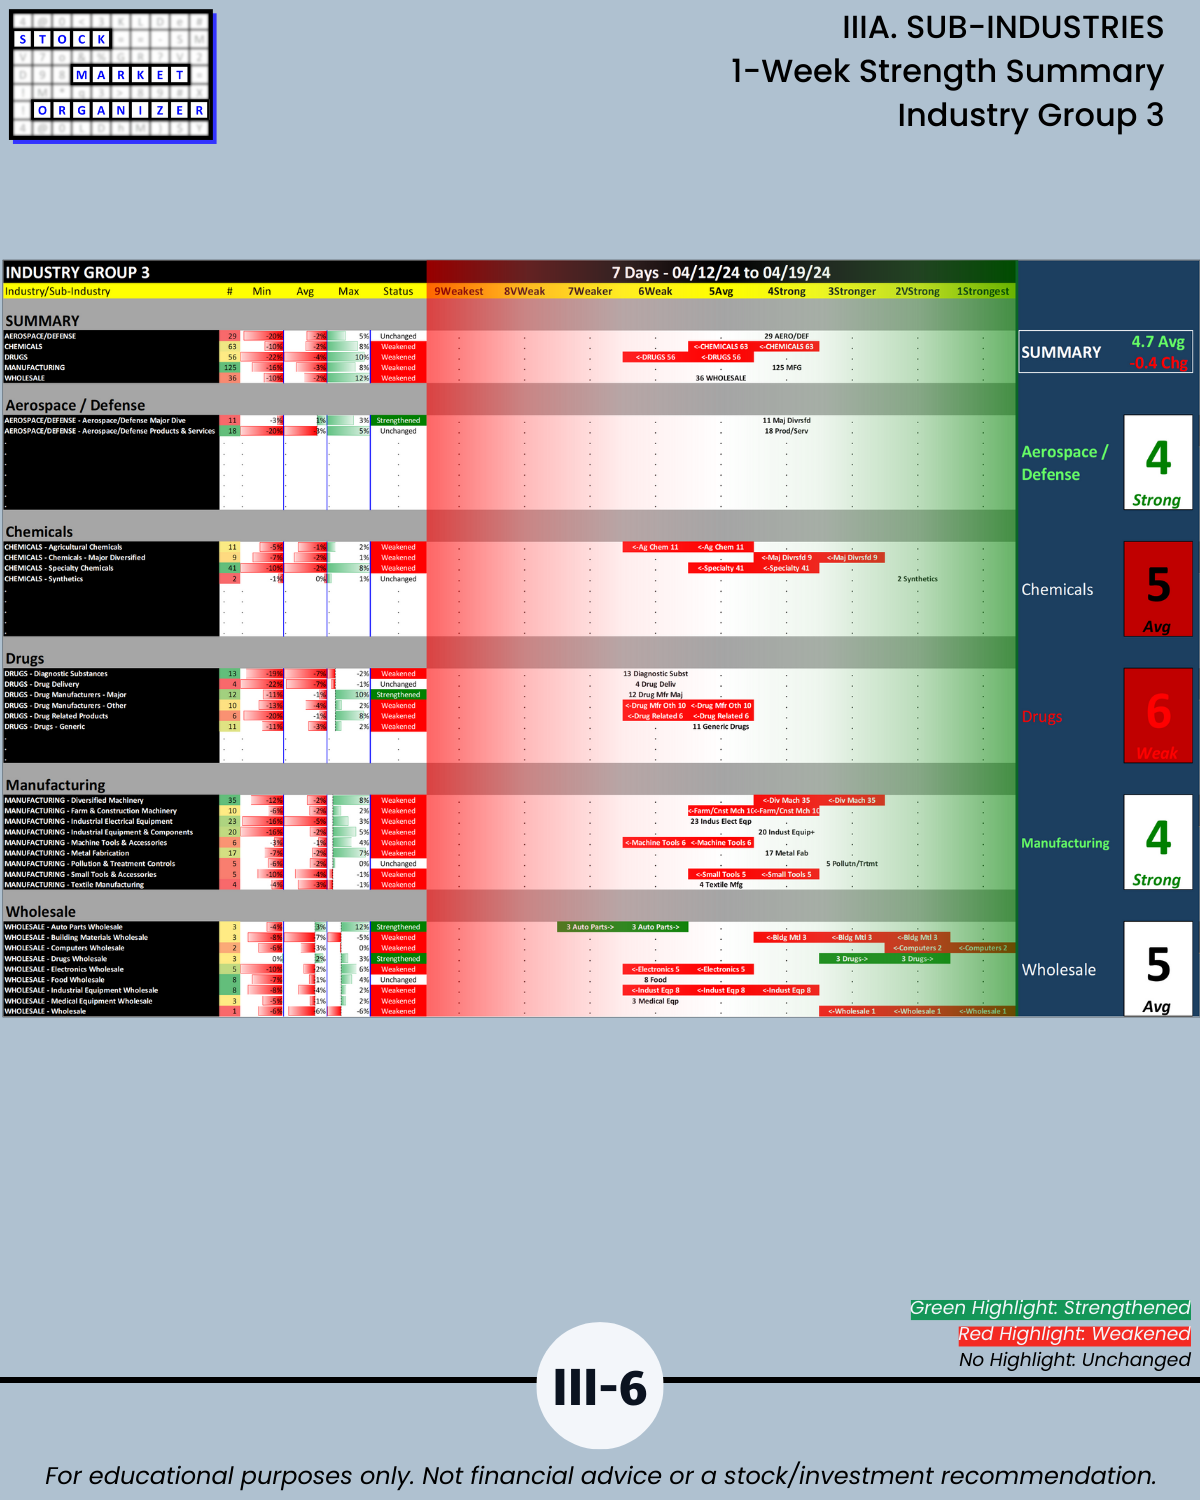
- Aerospace/Defense
- Manufacturing
🔹 Weakest: 12-way tie at 6Weak:
- Real Estate
- Computer Hardware
- Computer Software/Services
- Electronics
- Telco
- Automotive
- Consumer Durables
- Specialty Retail
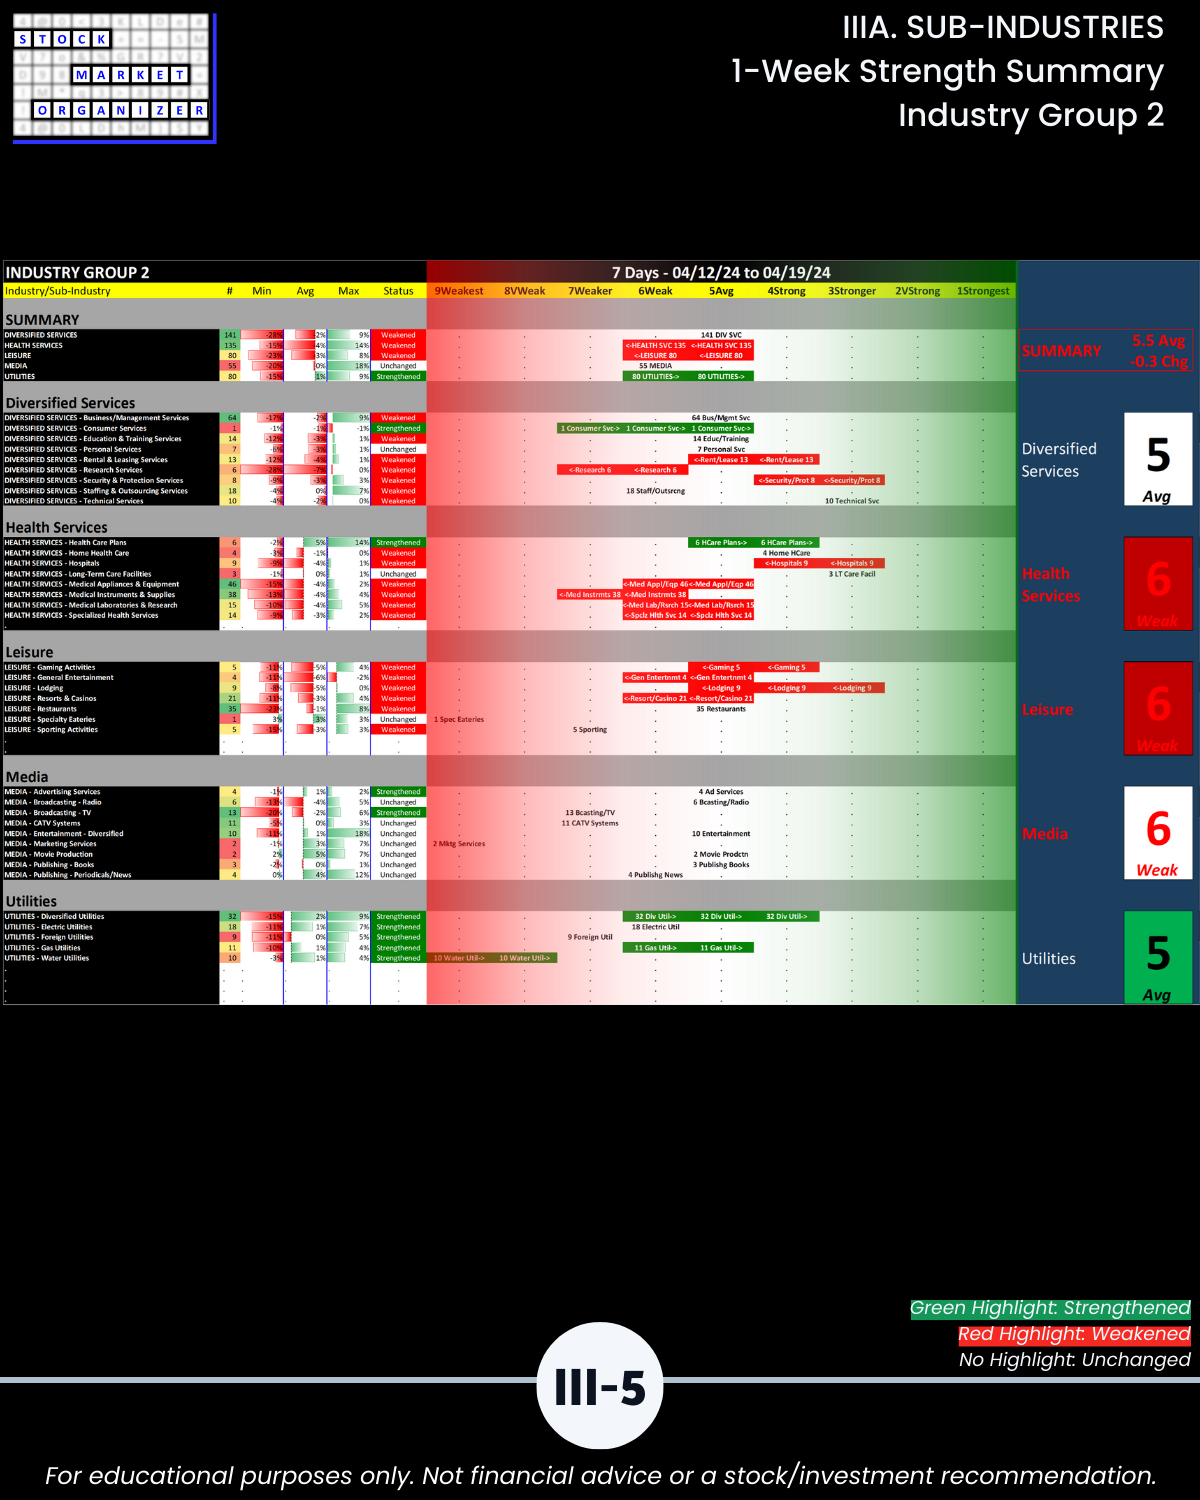
- Health Services
- Leisure
- Media
- Drugs
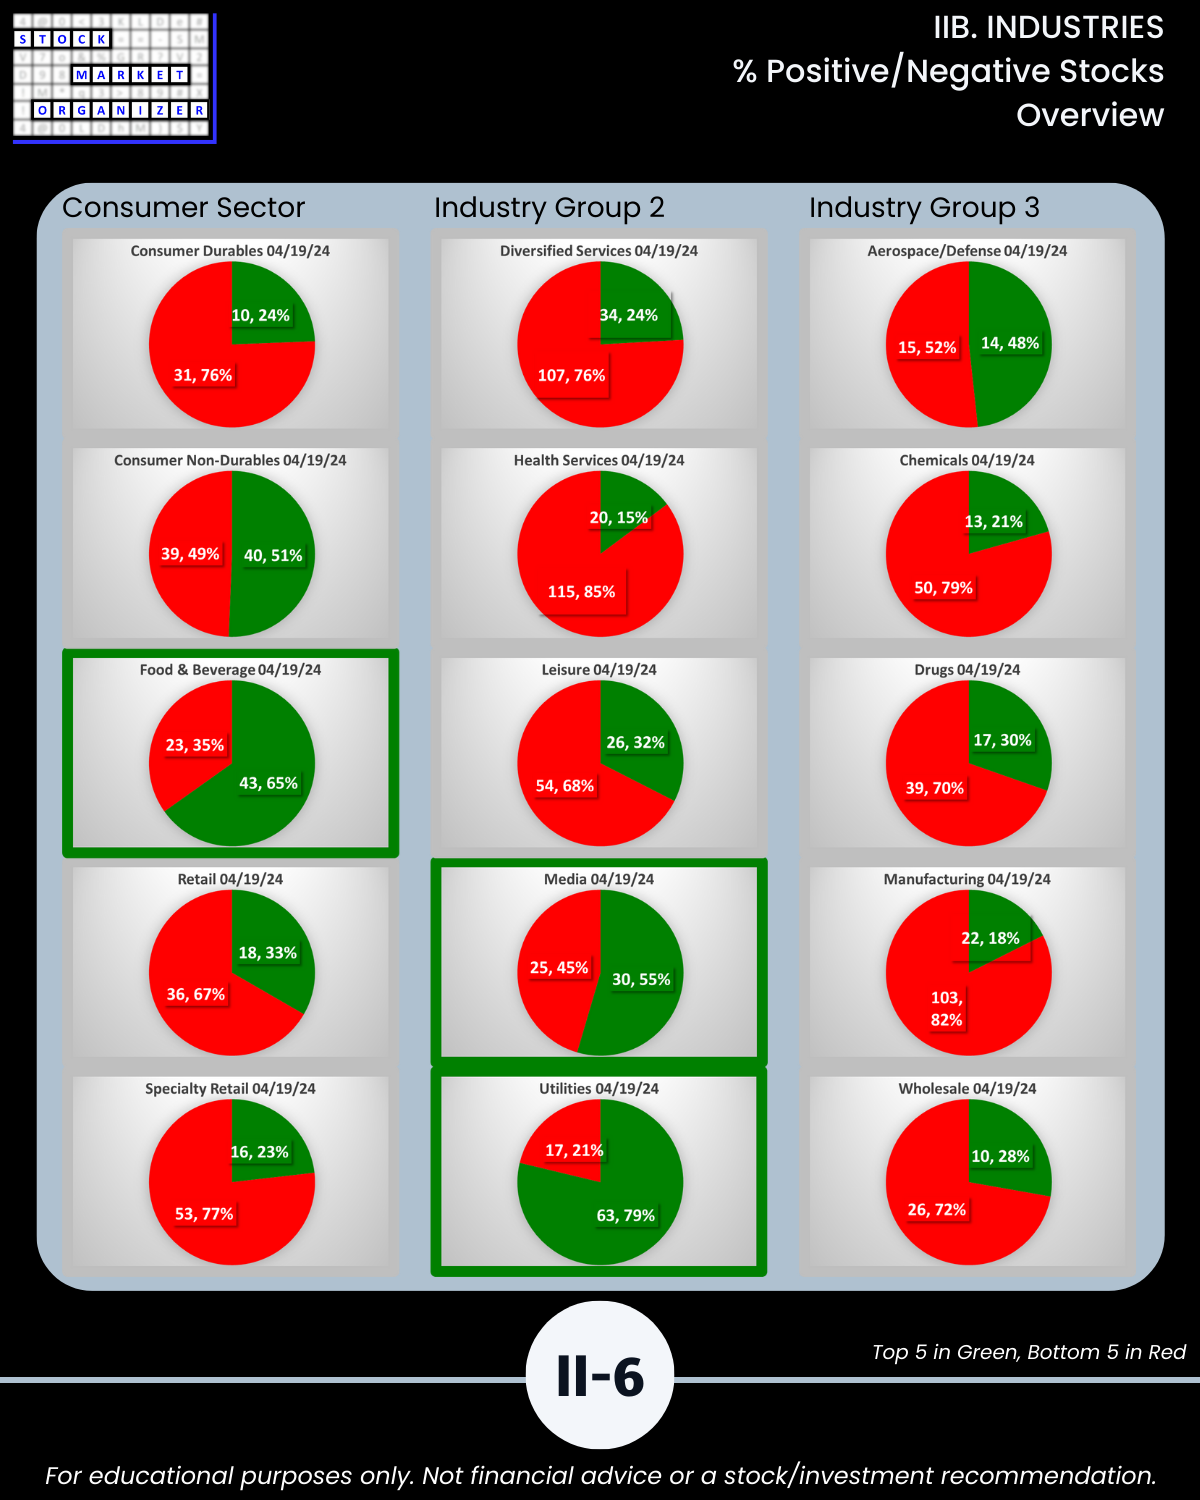
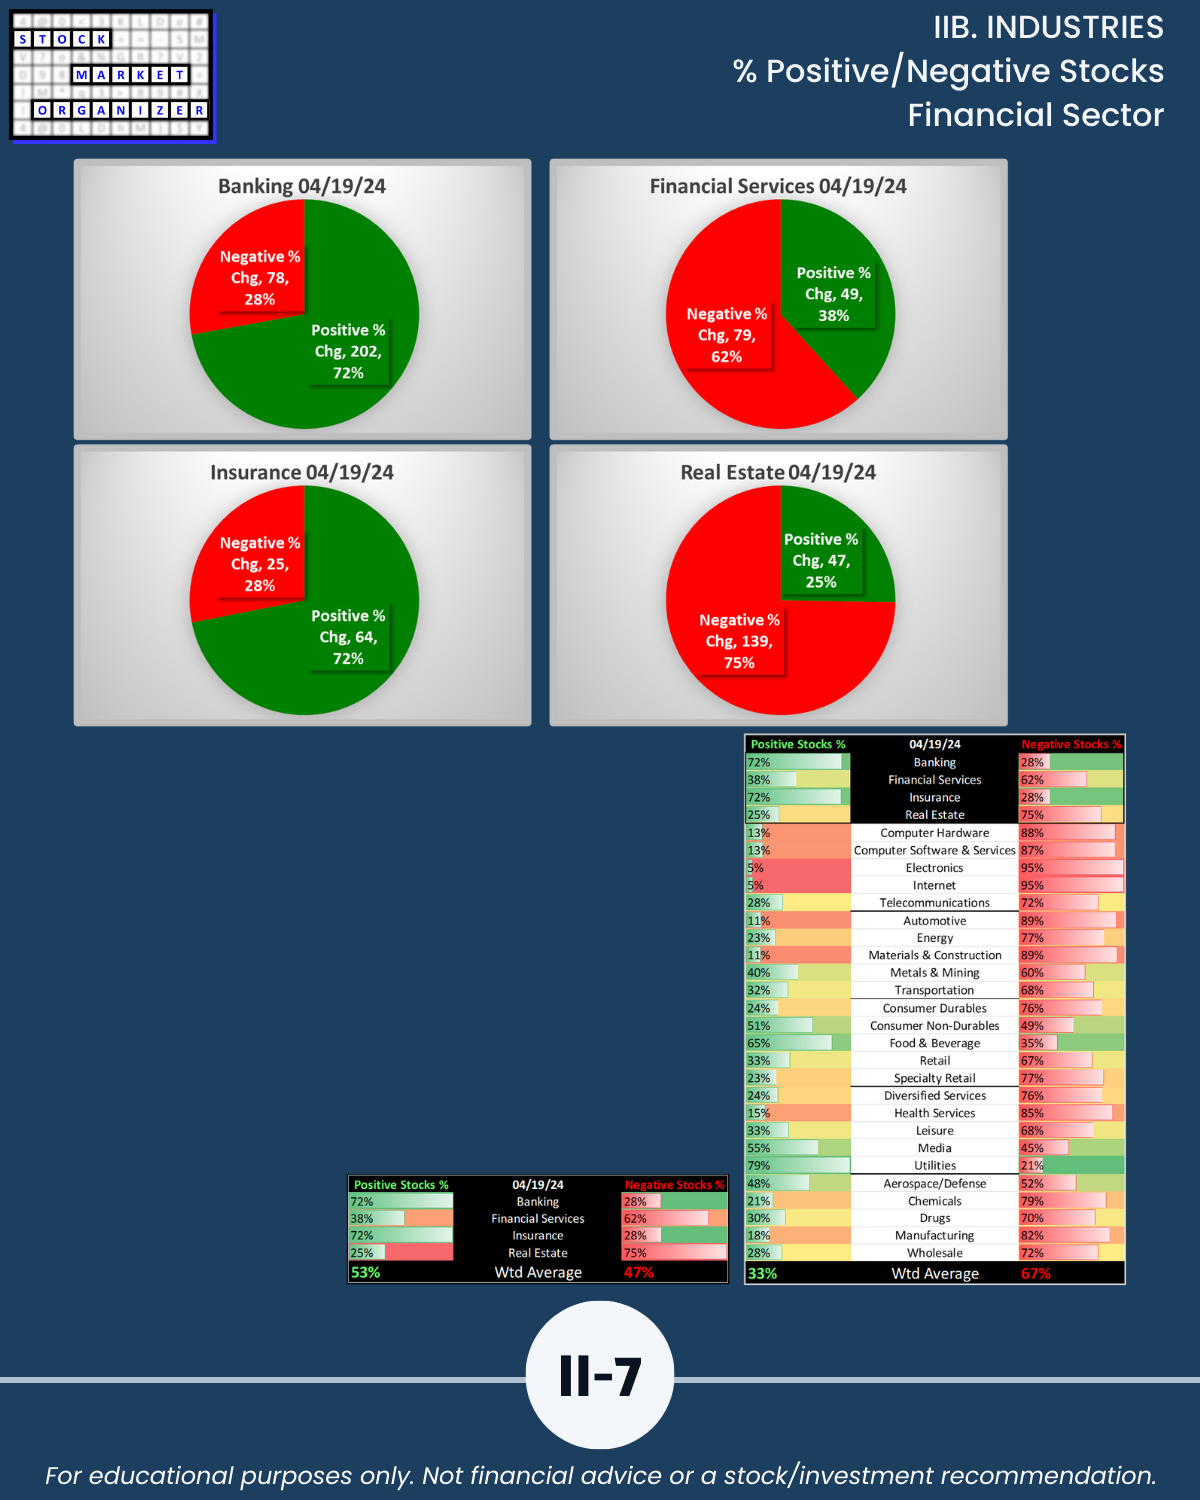
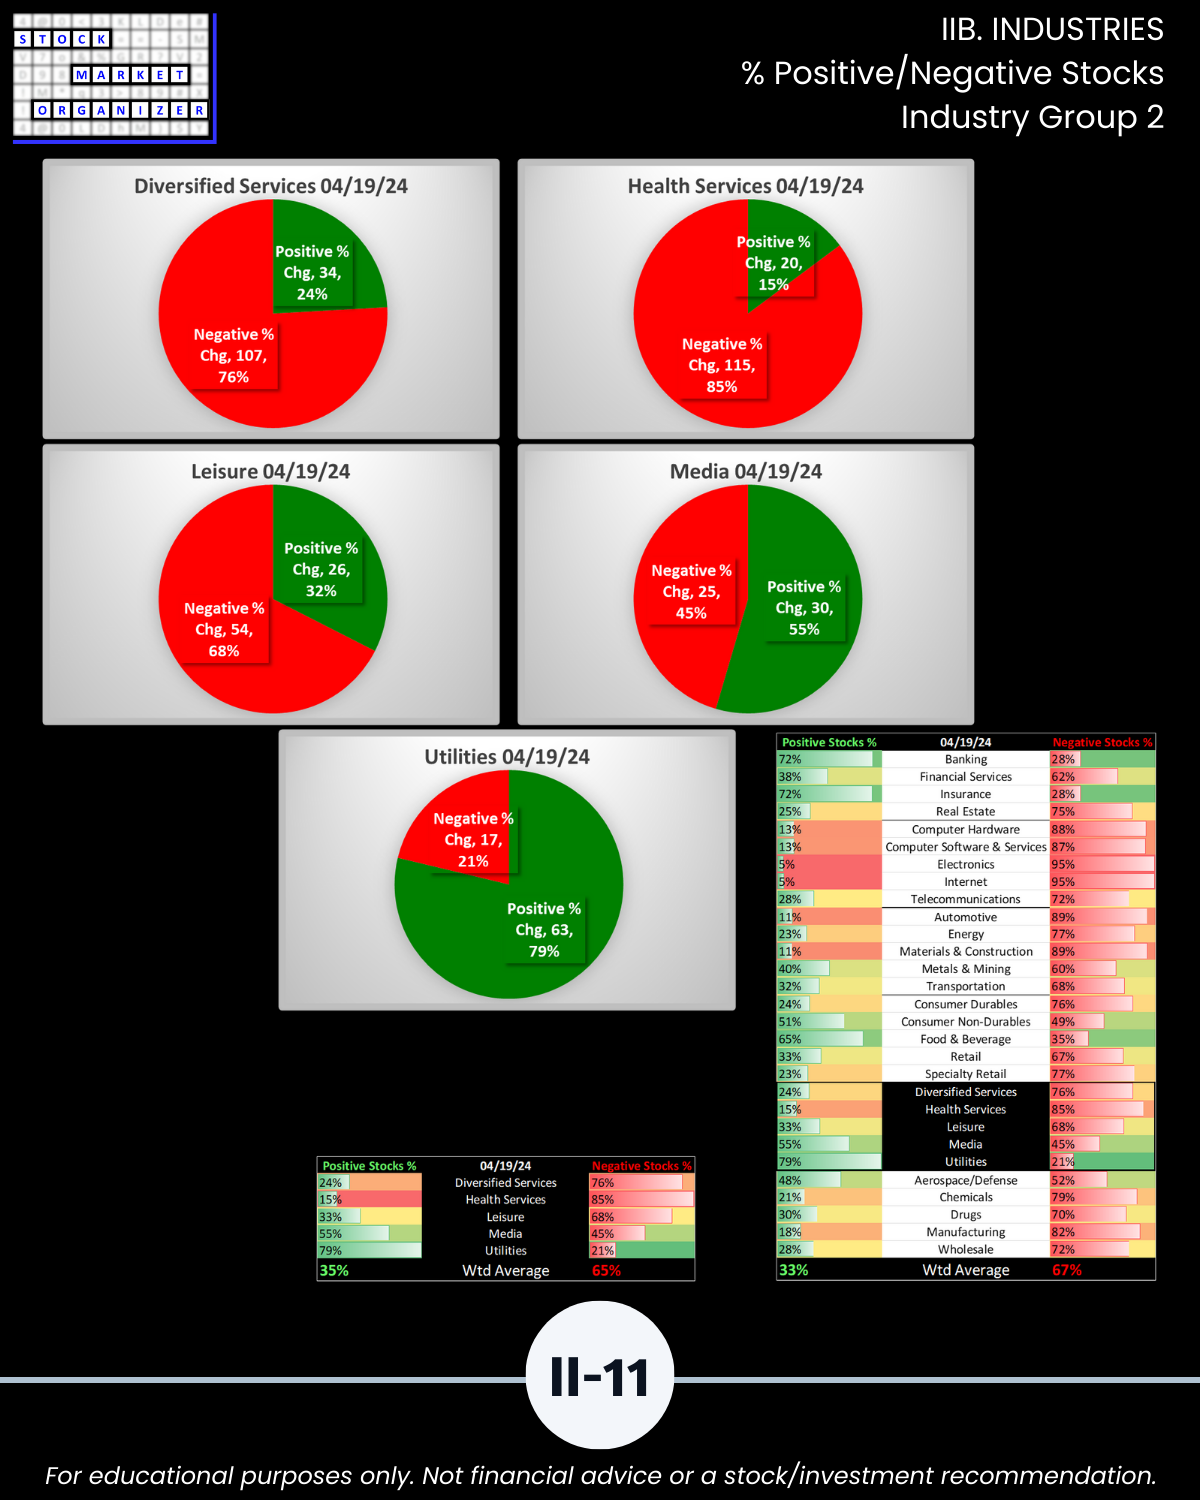
🔹 Highest Positive Stocks 55% to 79% (ABOVE last week 22% to 35%)
- Utilities 79%
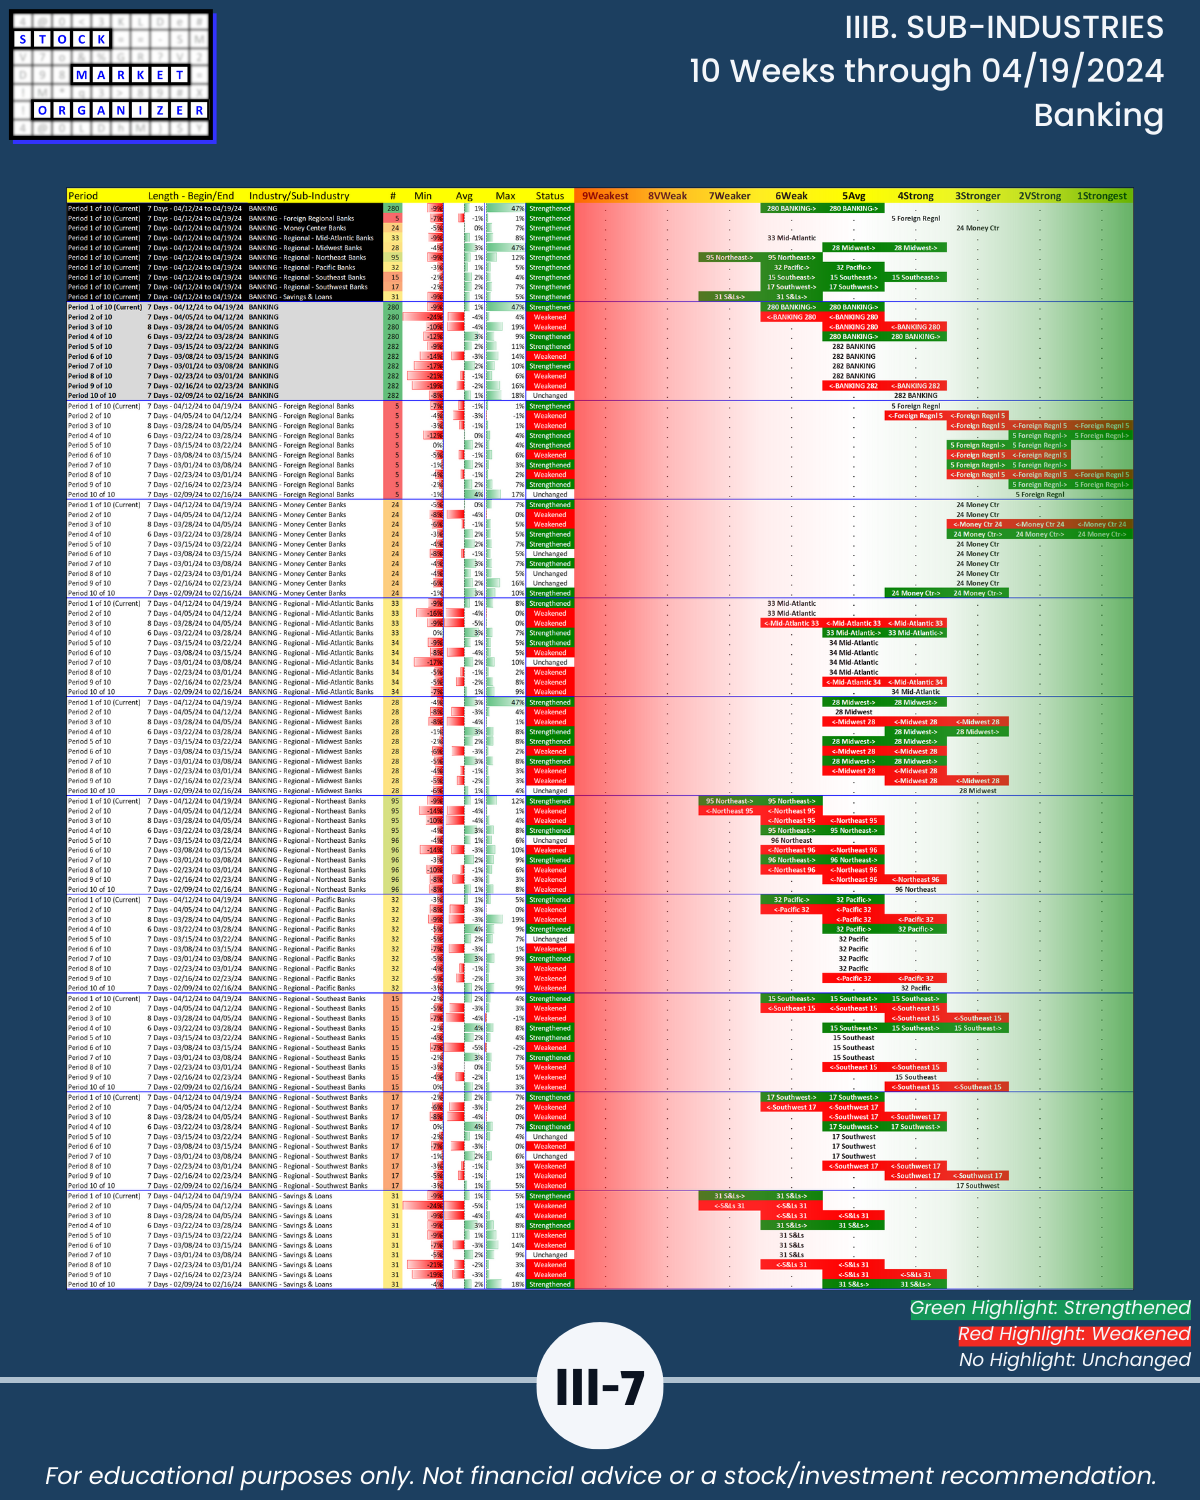
- Banking 72%
- Insurance 72%
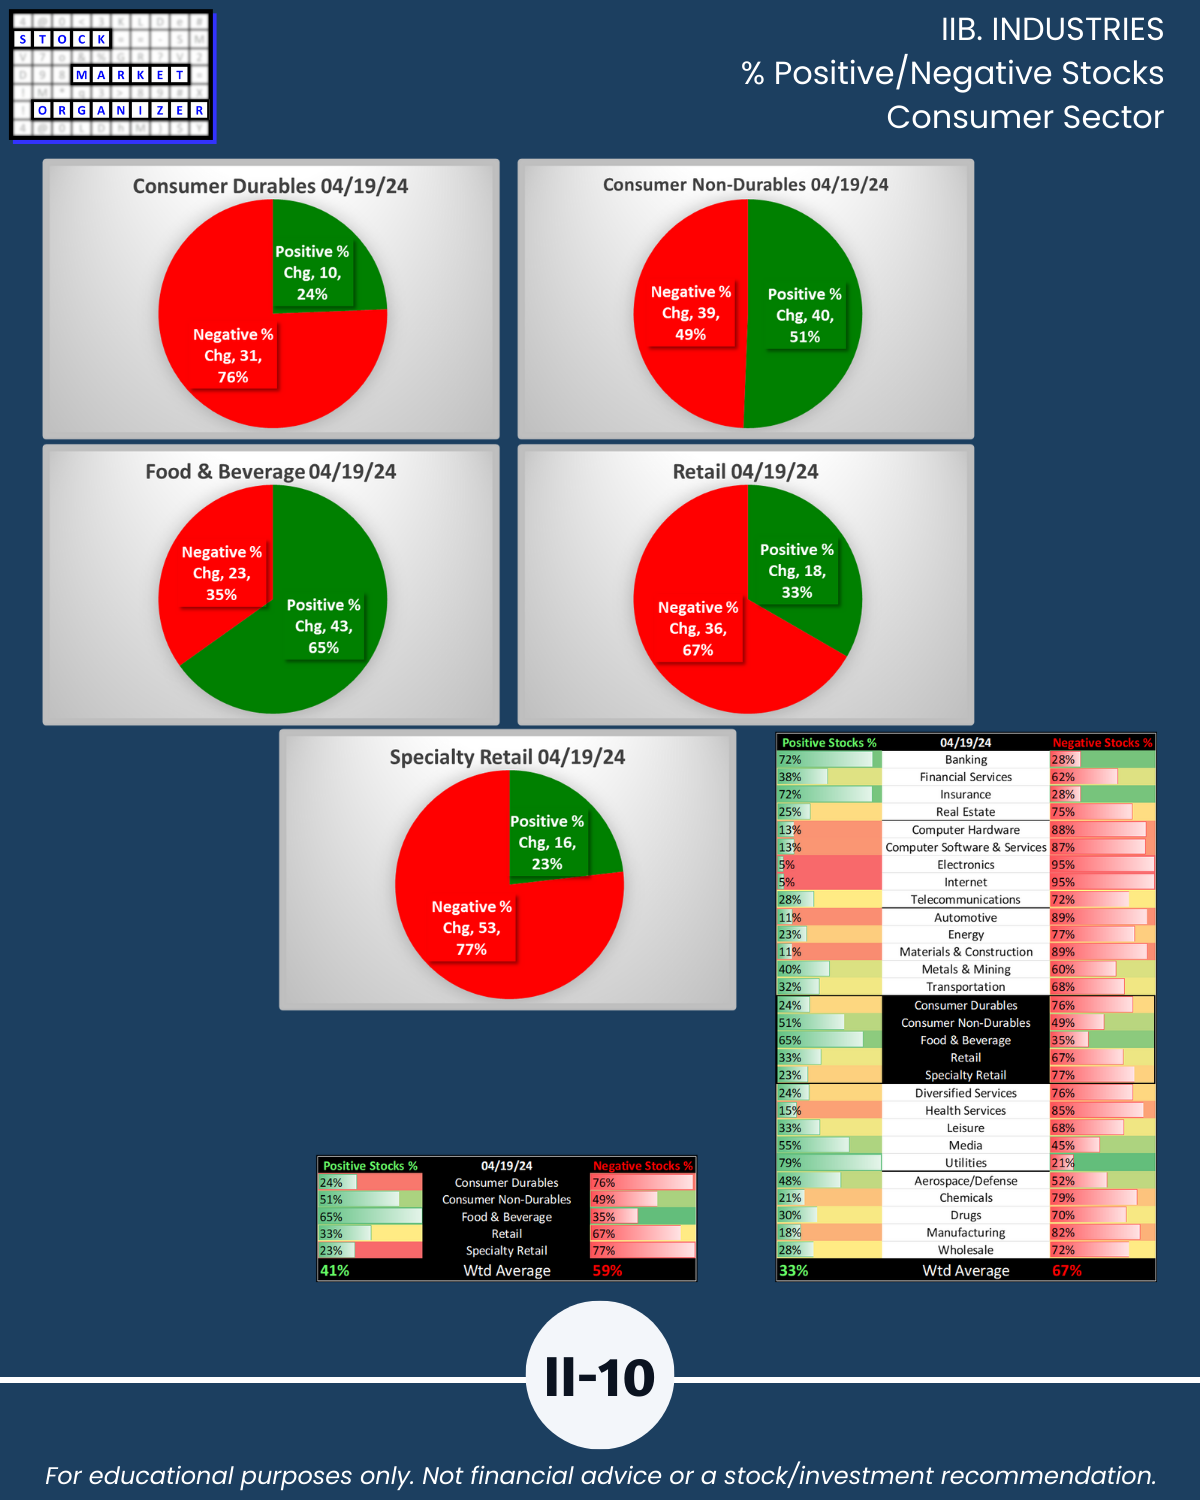
- Food & Beverage 65%
- Media 55%
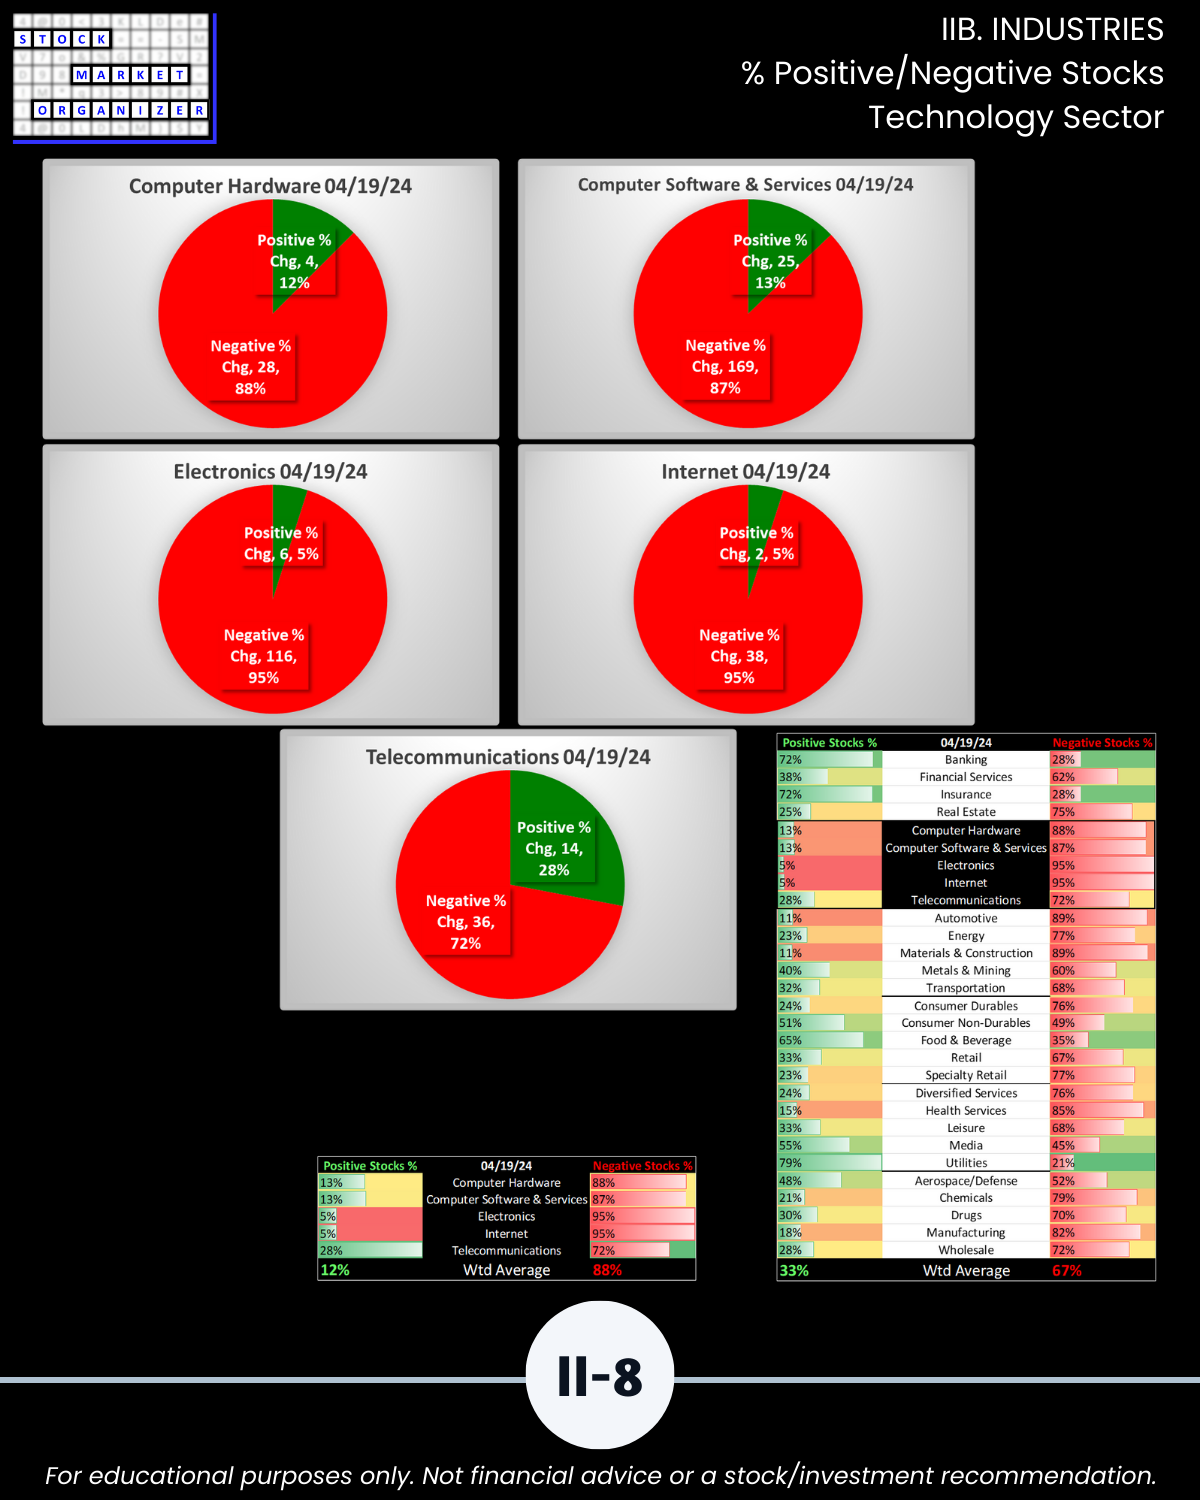
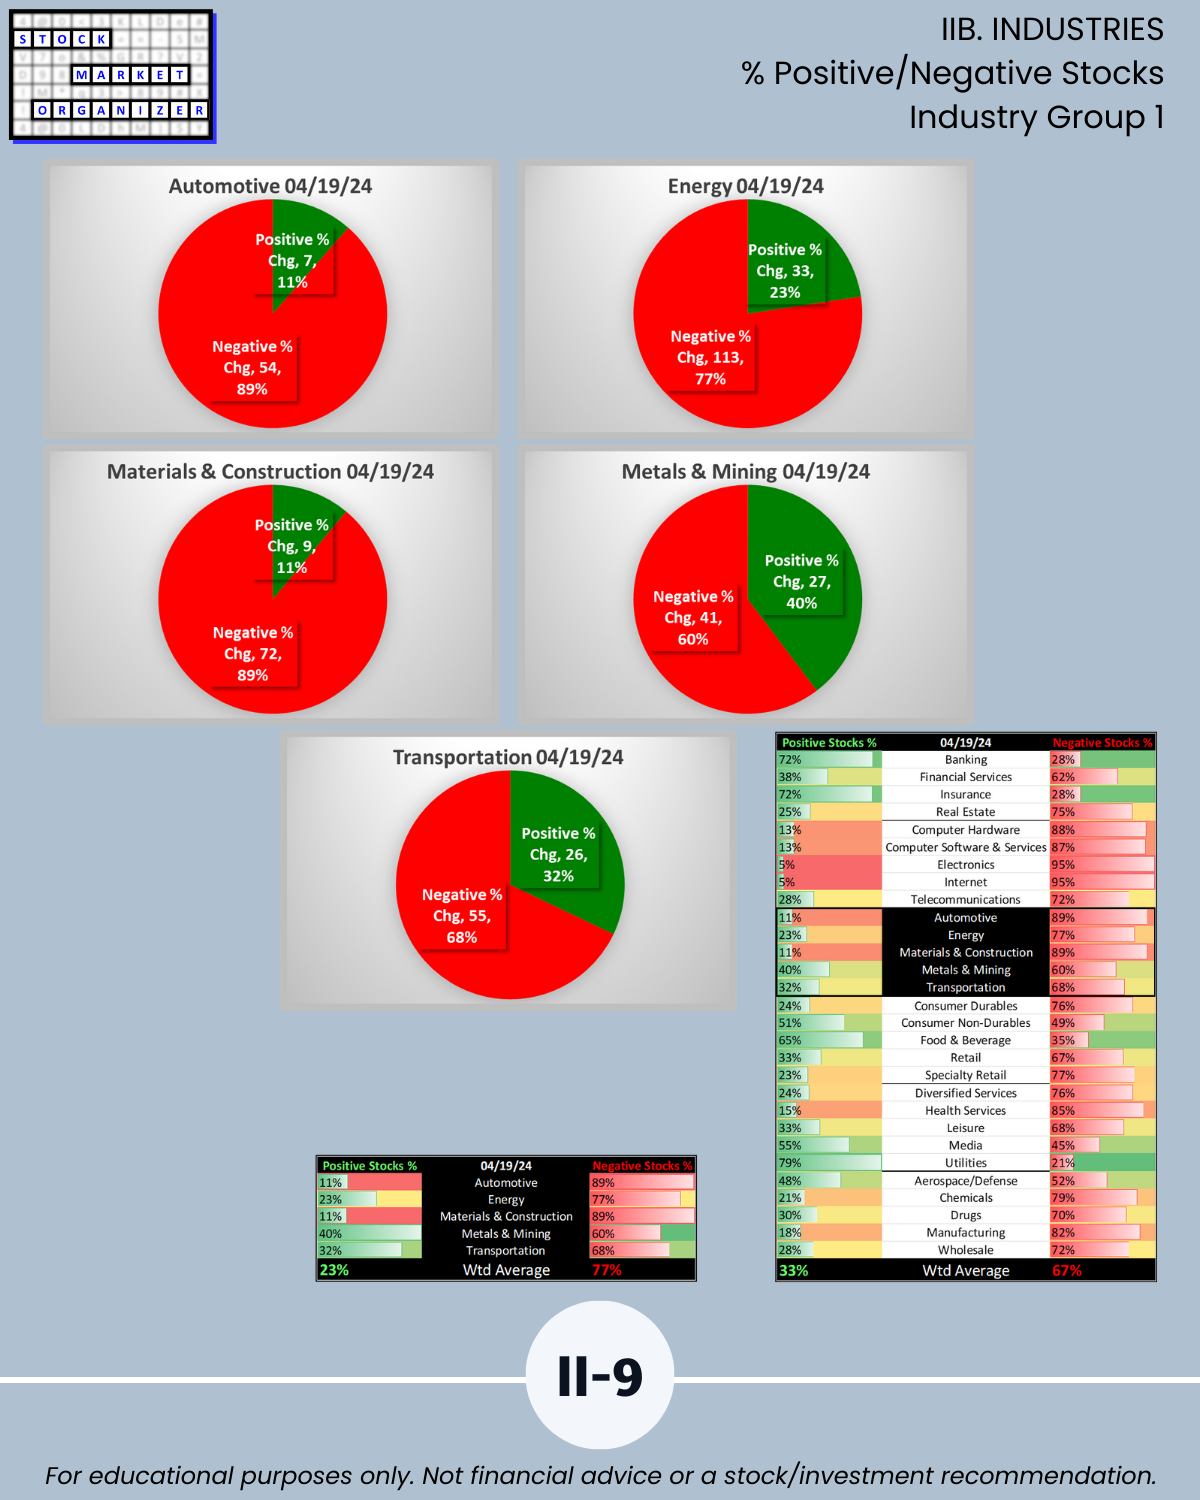
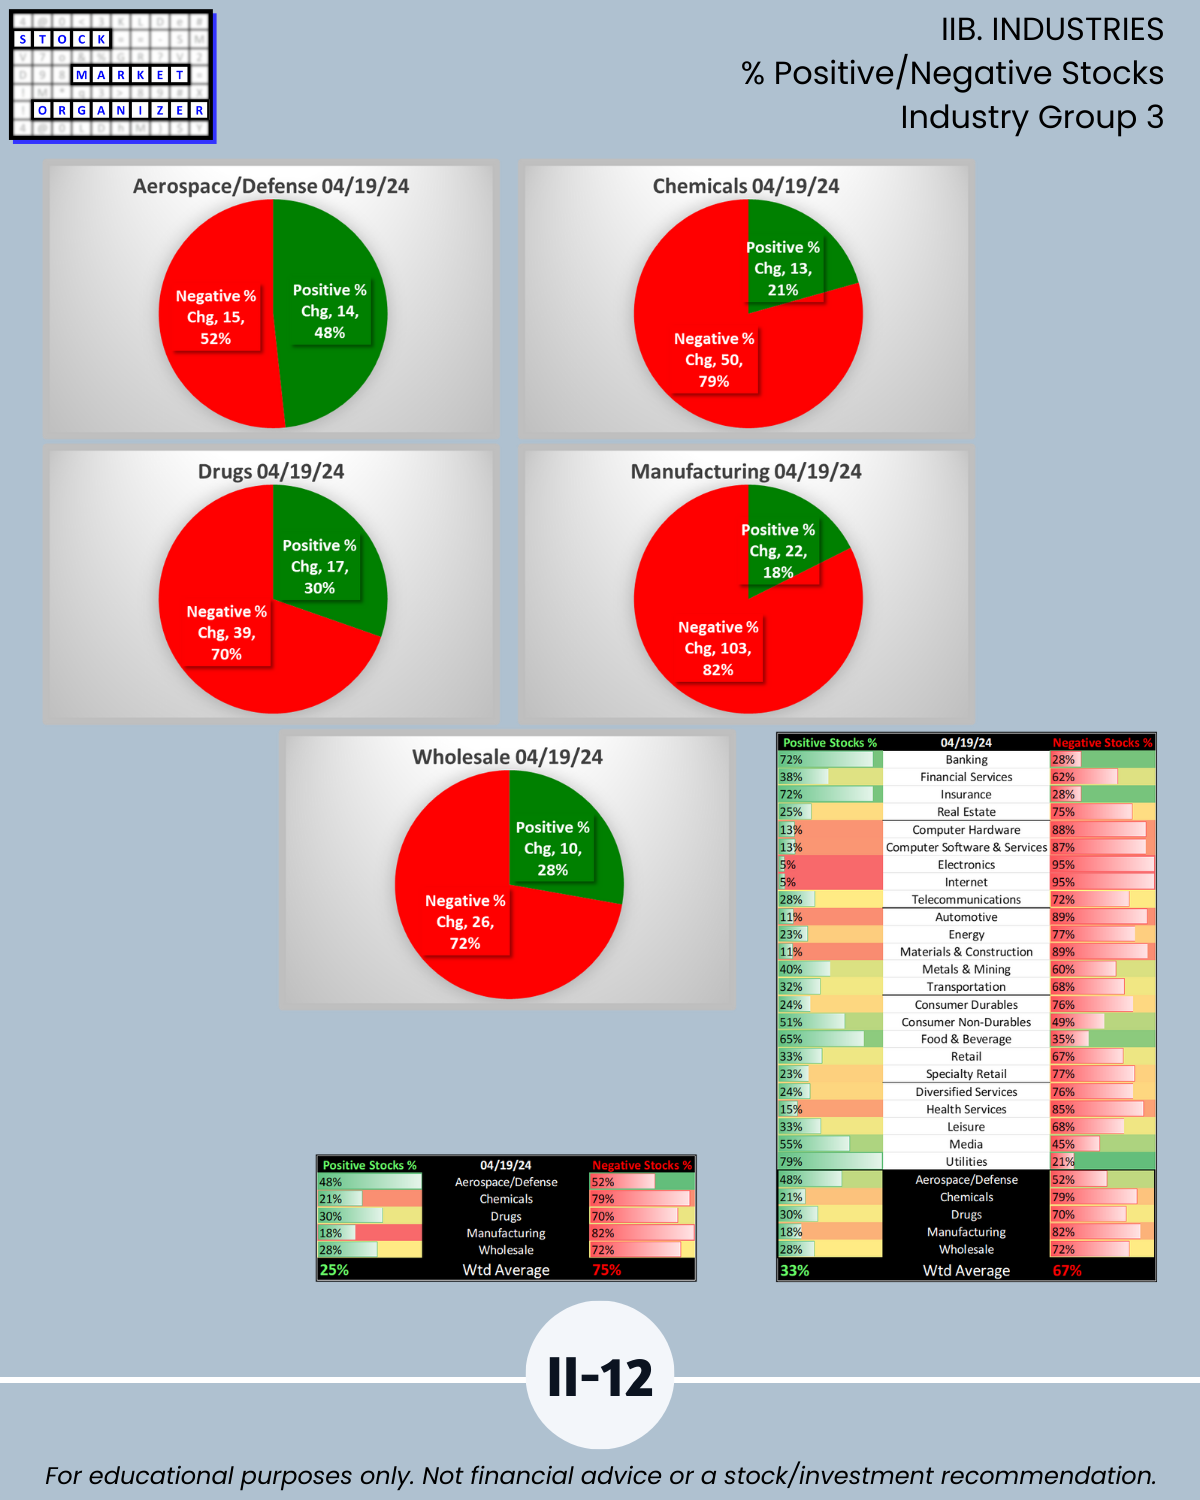
🔹 Highest Negative Stocks 88% to 95% (BELOW last week 94% to 96%)
- Electronics 95%
- Internet 95%
- Materials & Construction 89%
- Automotive 89%
- Computer Hardware 88%
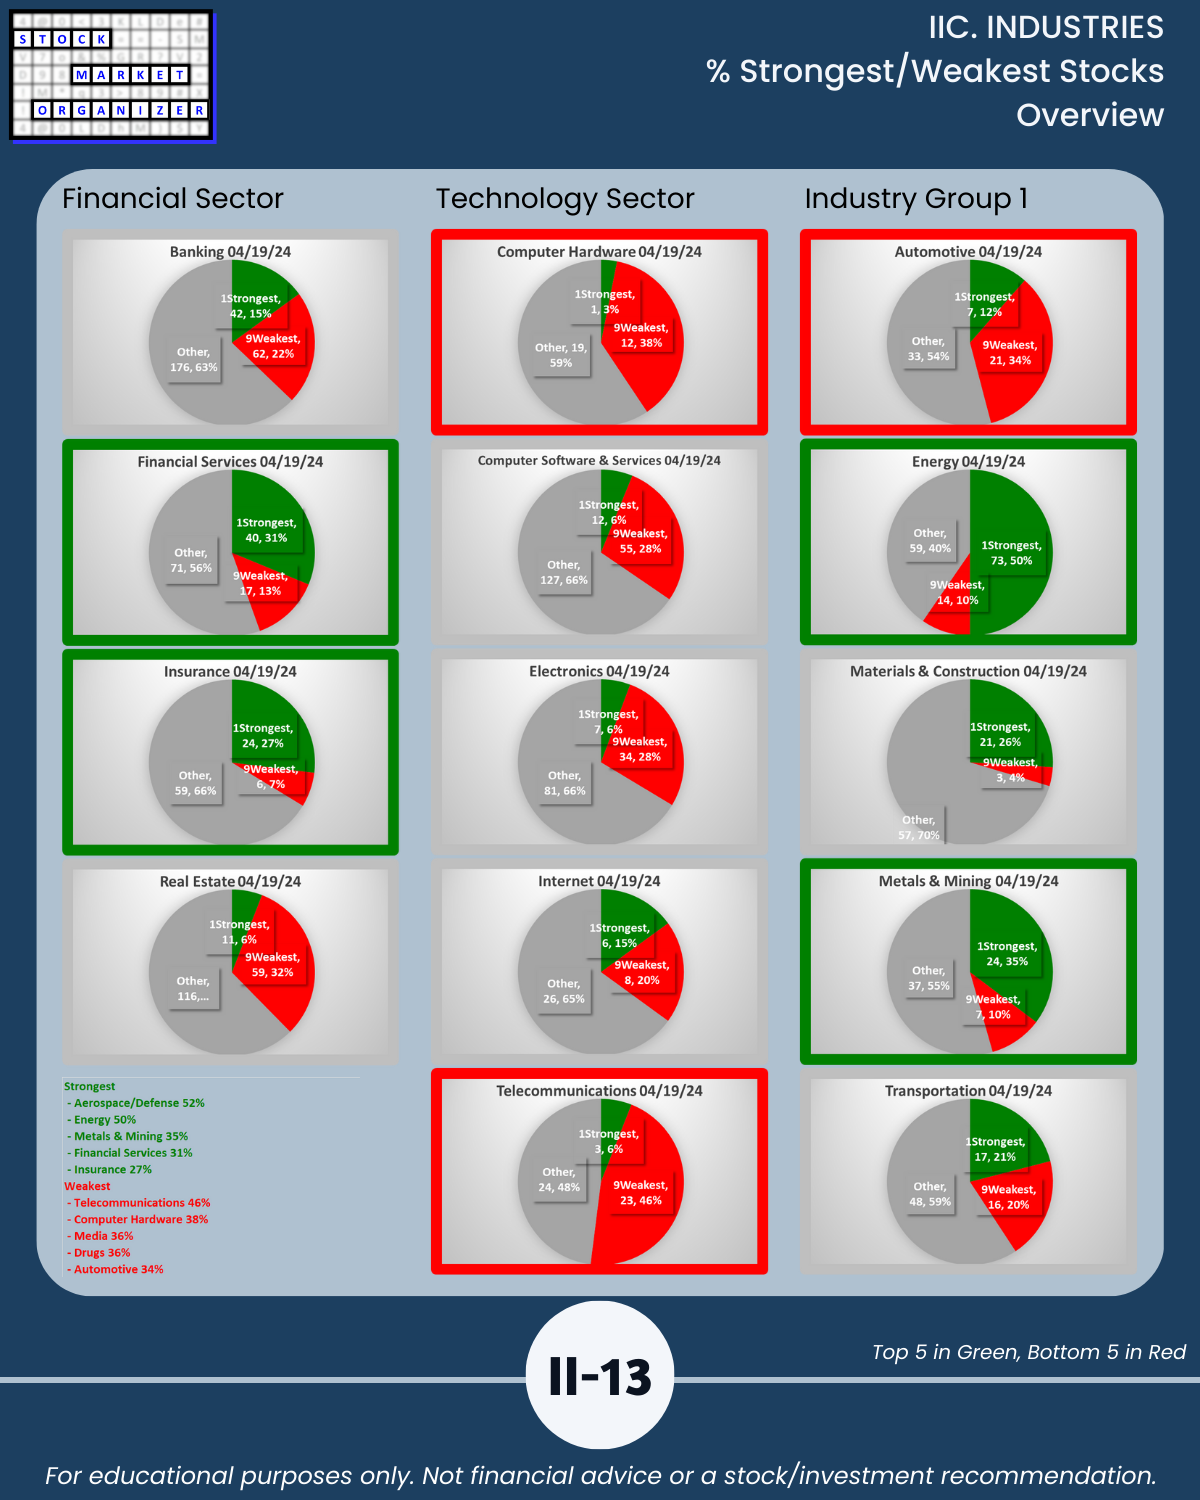
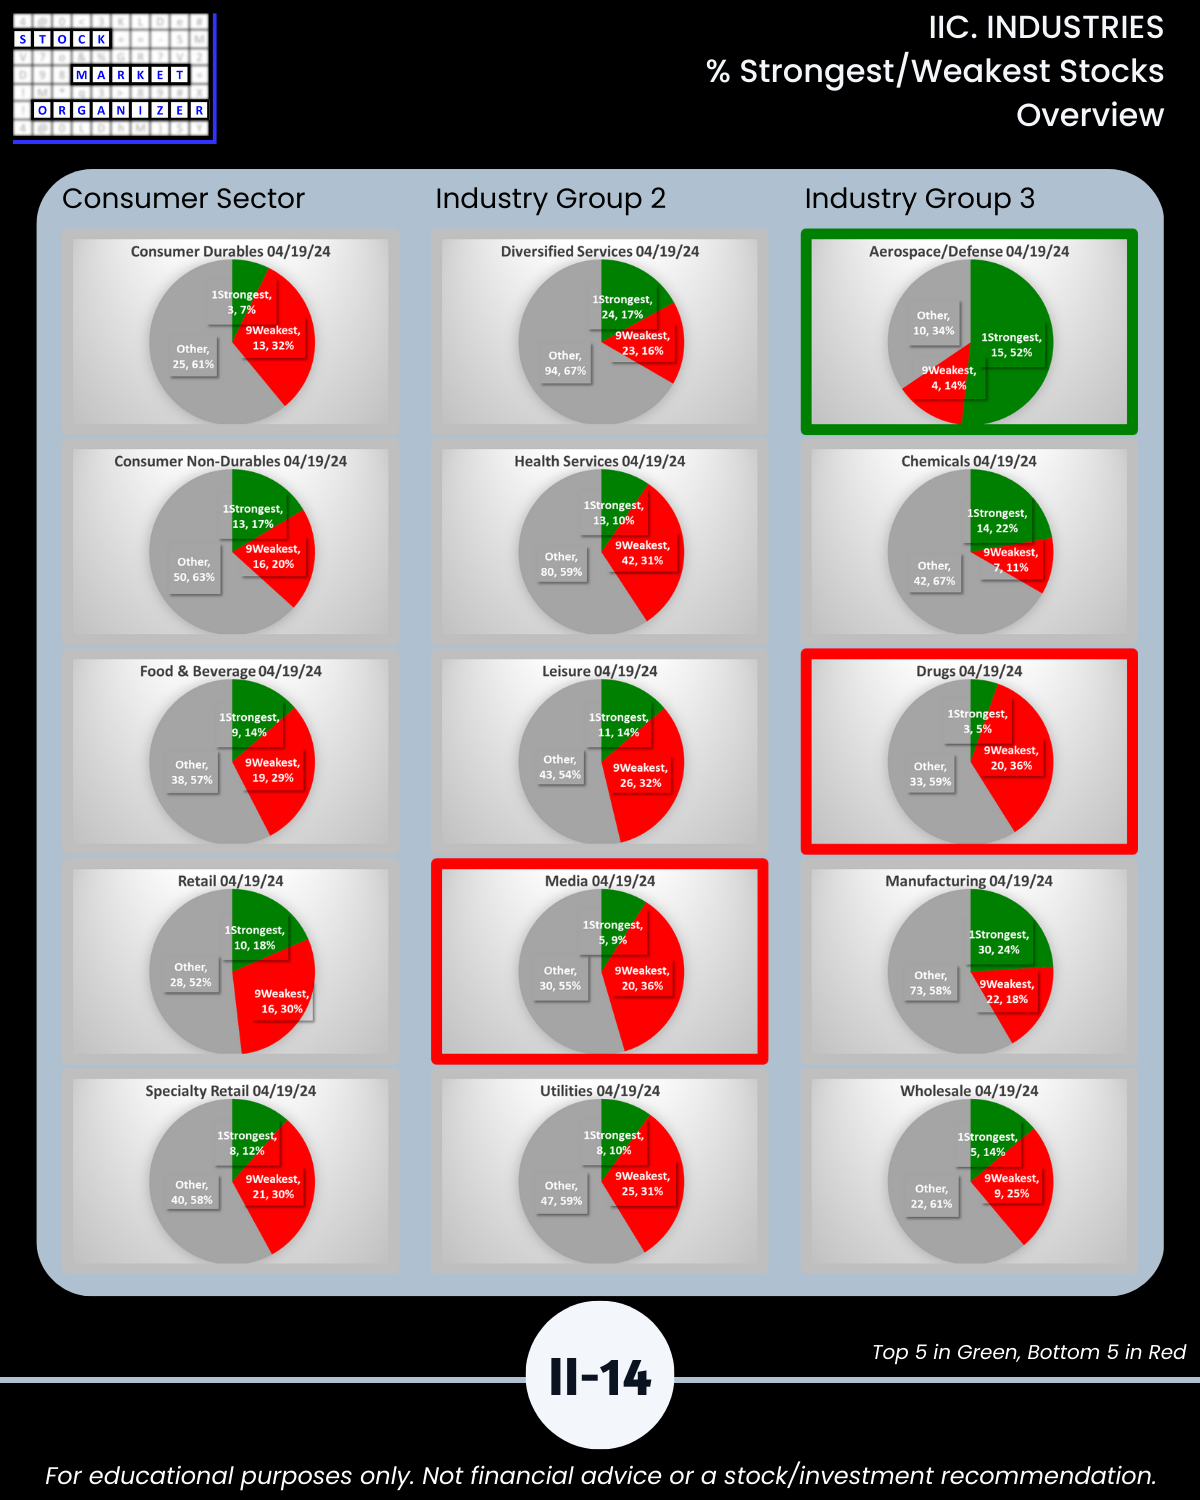
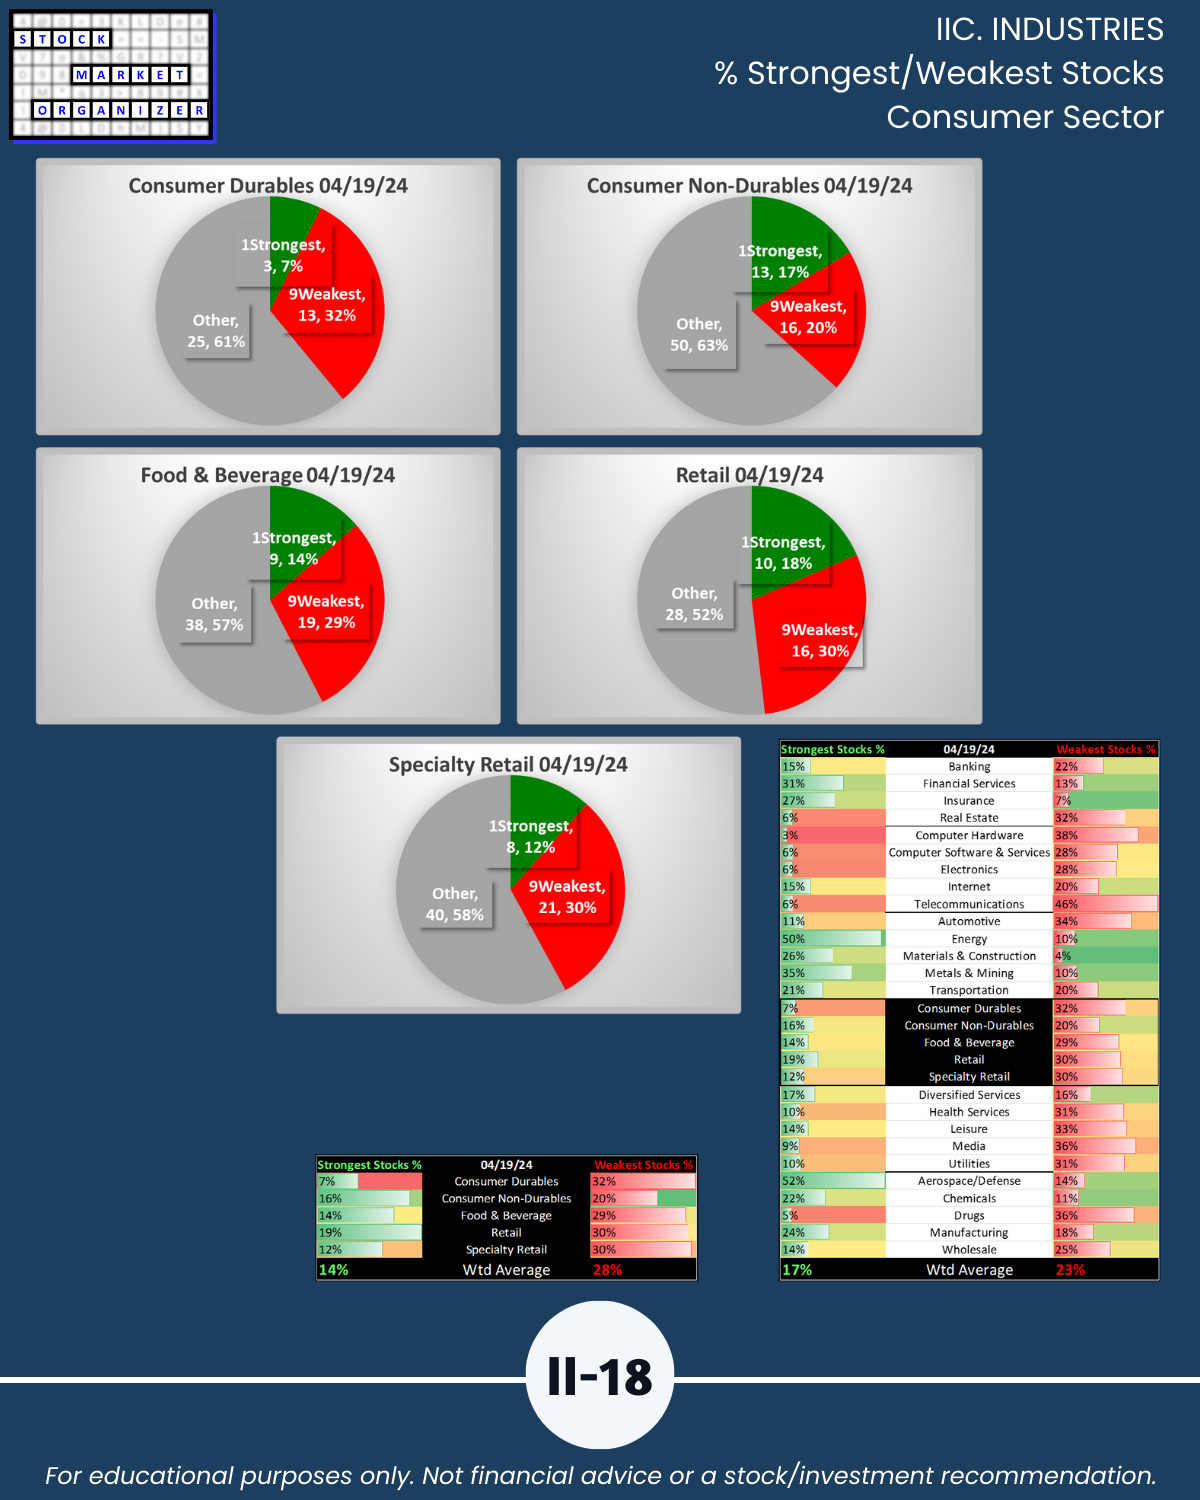
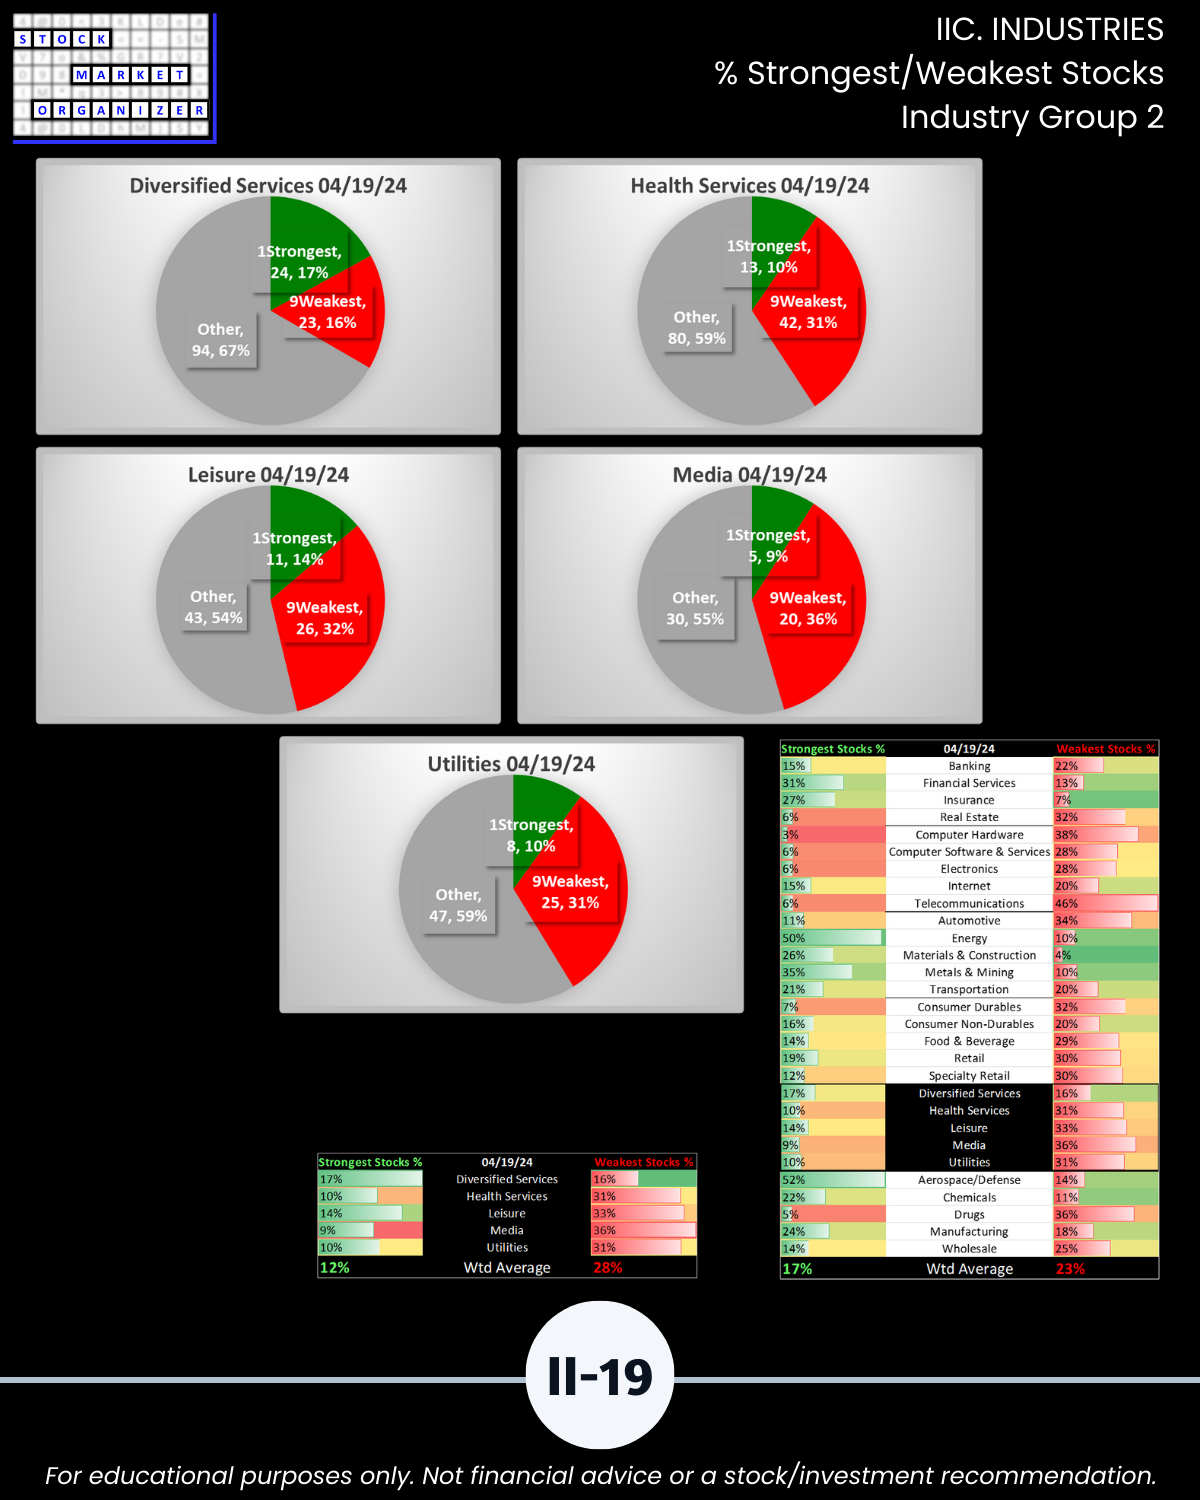
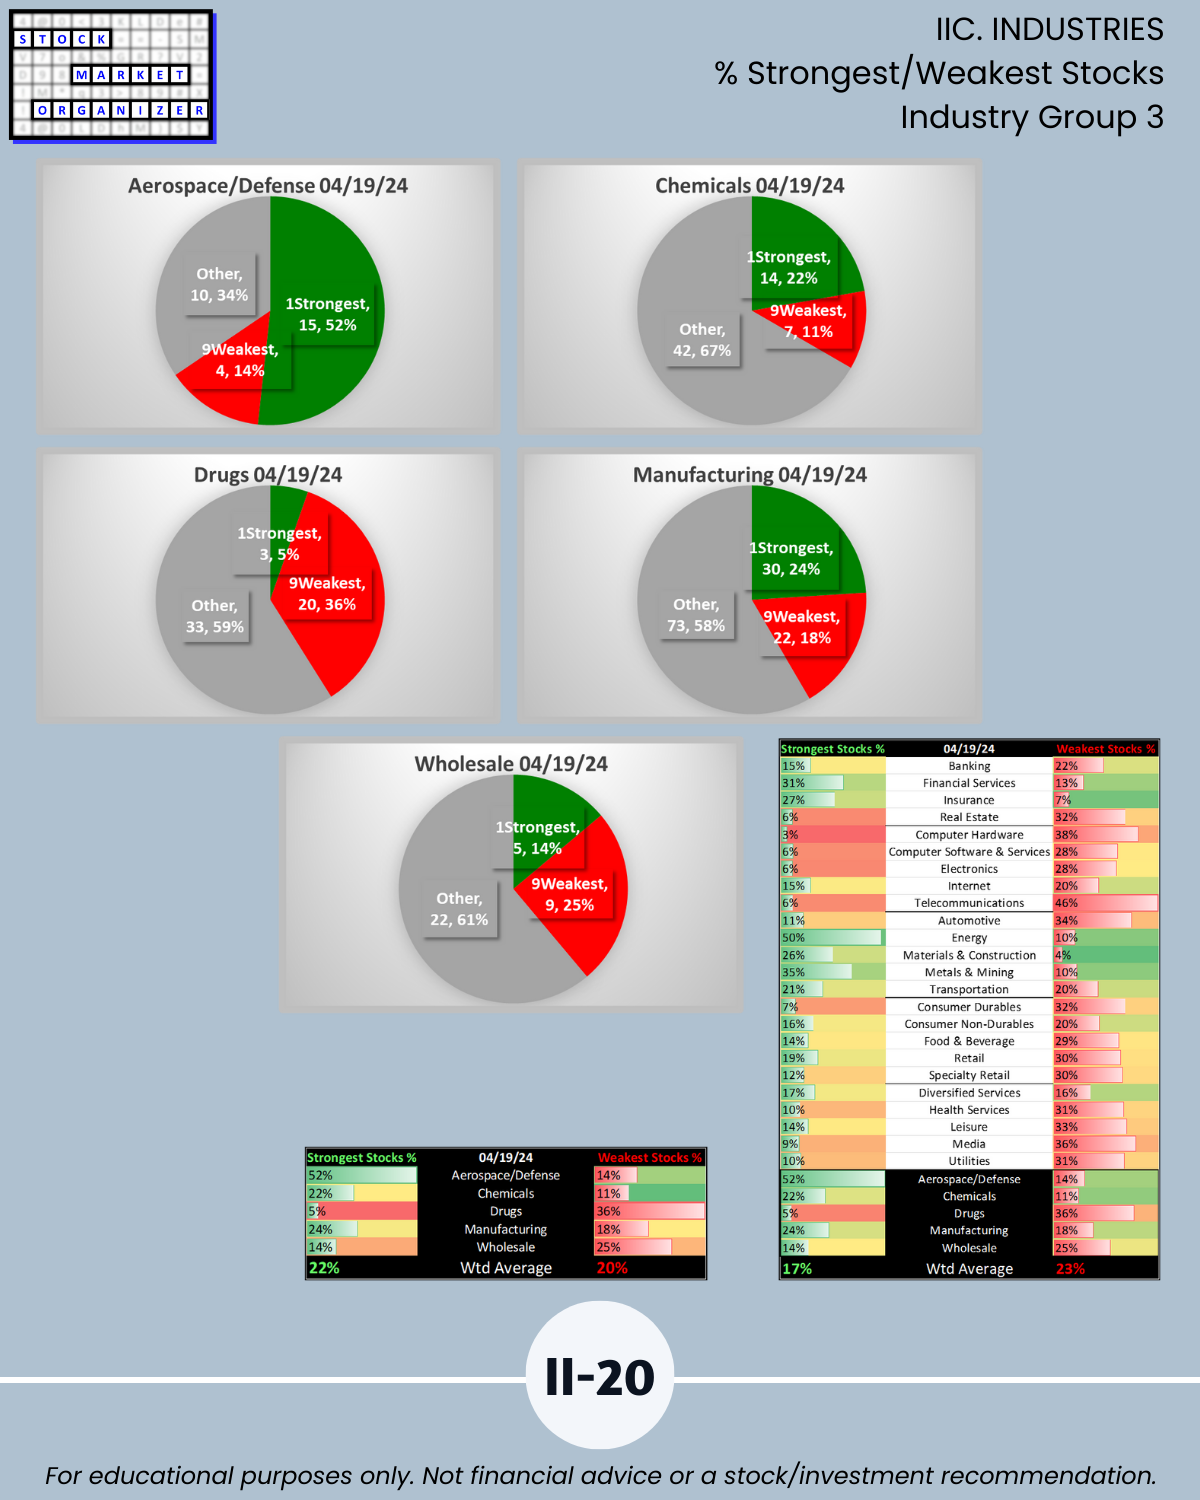
🔹 Stocks rated Strongest 27% to 52% (BELOW last week 40% to 62%)
- Aerospace/Defense 52%
- Energy 50%
- Metals & Mining 35%
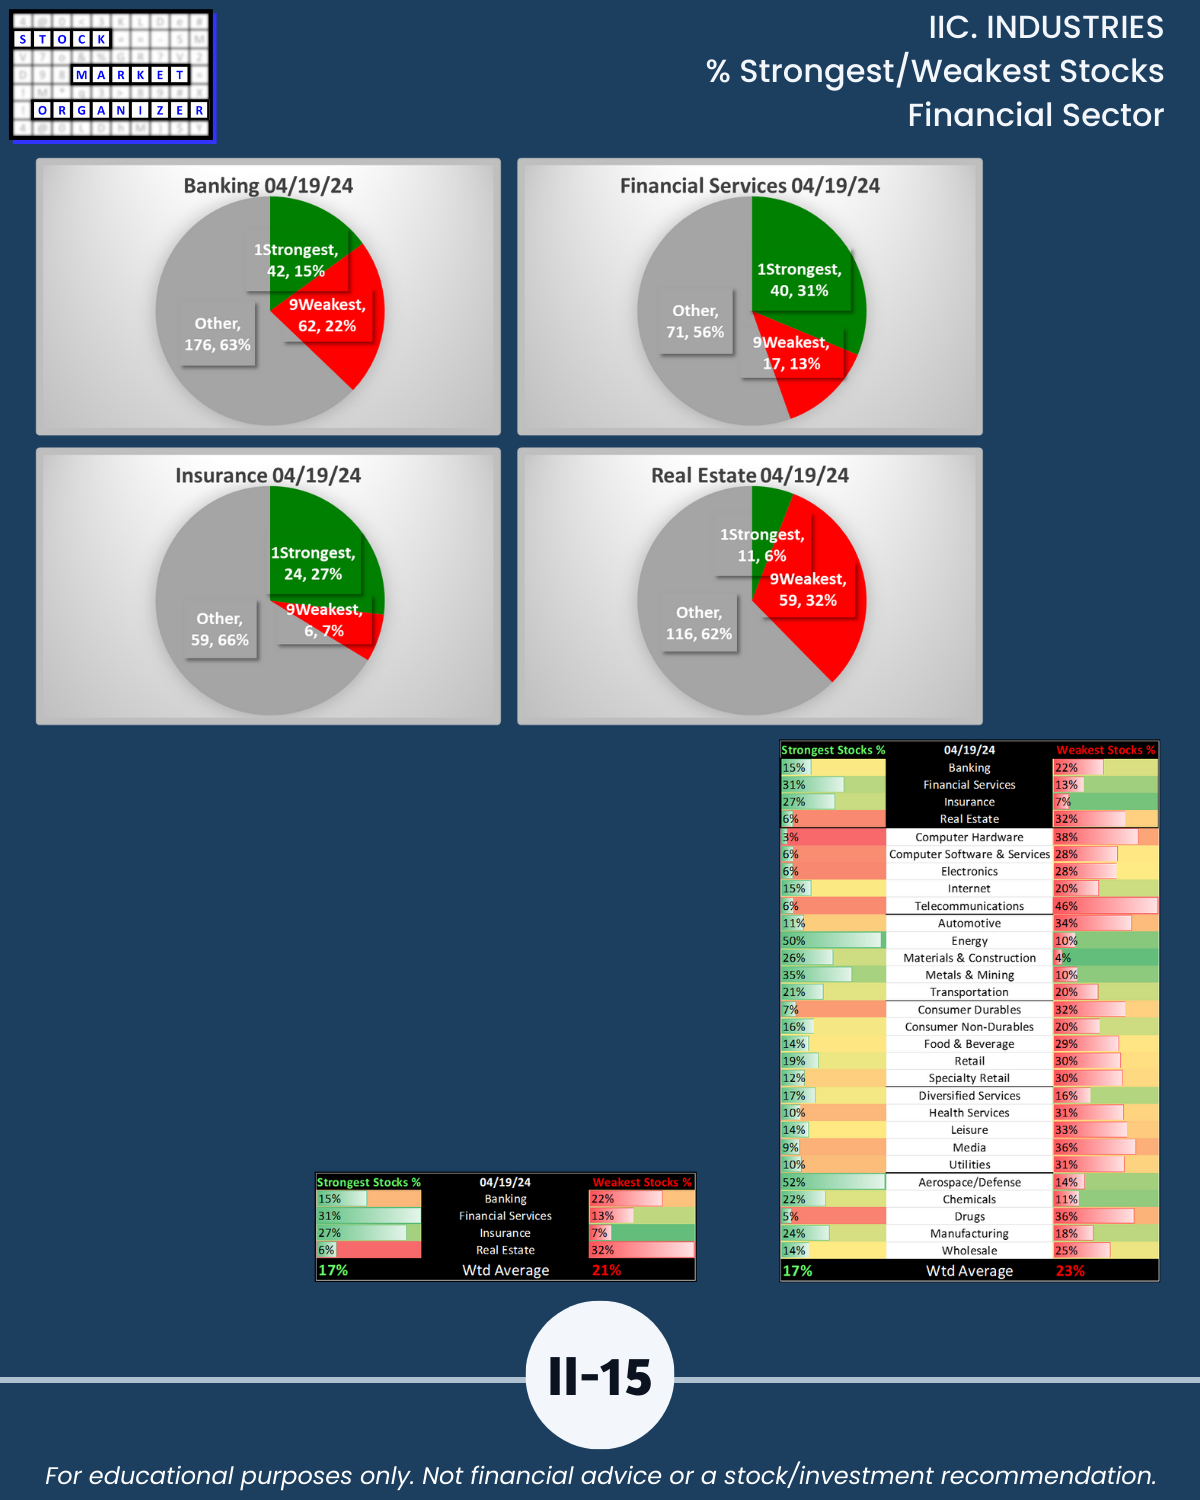
- Financial Services 31%
- Insurance 27%
🔹 Stocks rated Weakest 34% to 46% (SAME AS last week 36% to 45%)
- Telecommunications 46%
- Computer Hardware 38%
- Media 36%
- Drugs 36%
- Automotive 34%
I. MARKET Prologue Critical Concepts/Market Strength Score
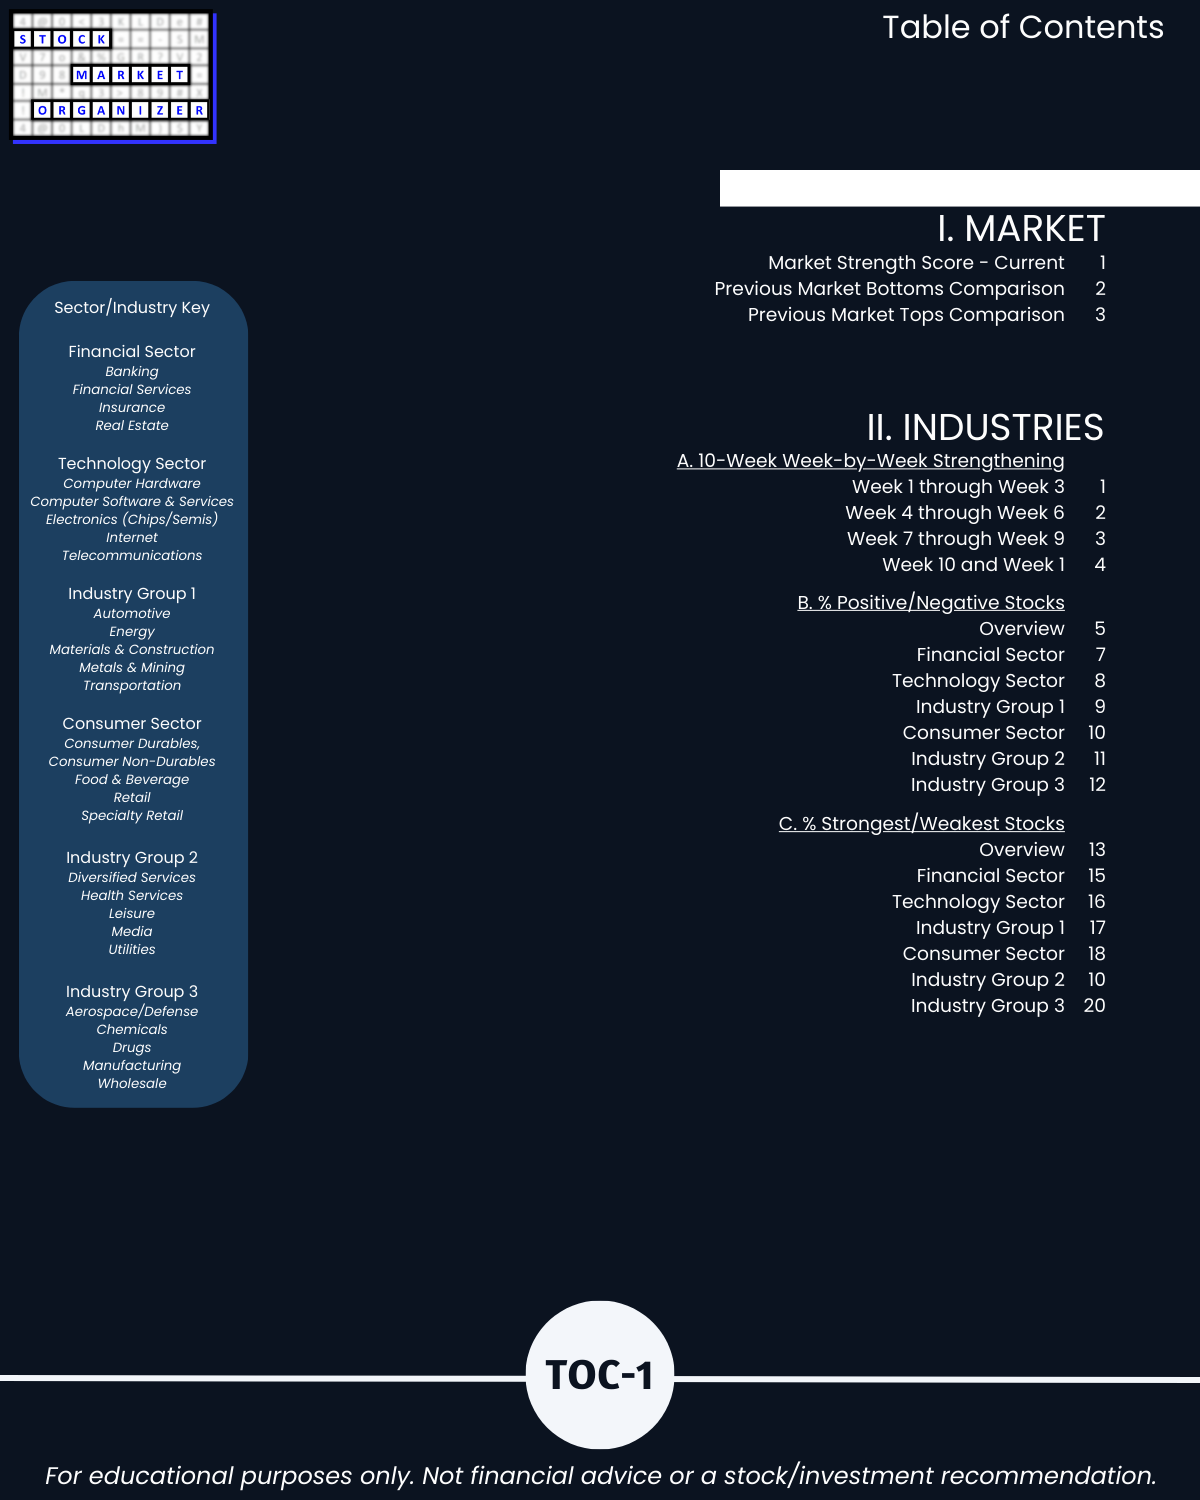
IIA. INDUSTRIES 10-Week Week-by-Week Strengthening
IIB. INDUSTRIES % Positive/Negative Stocks
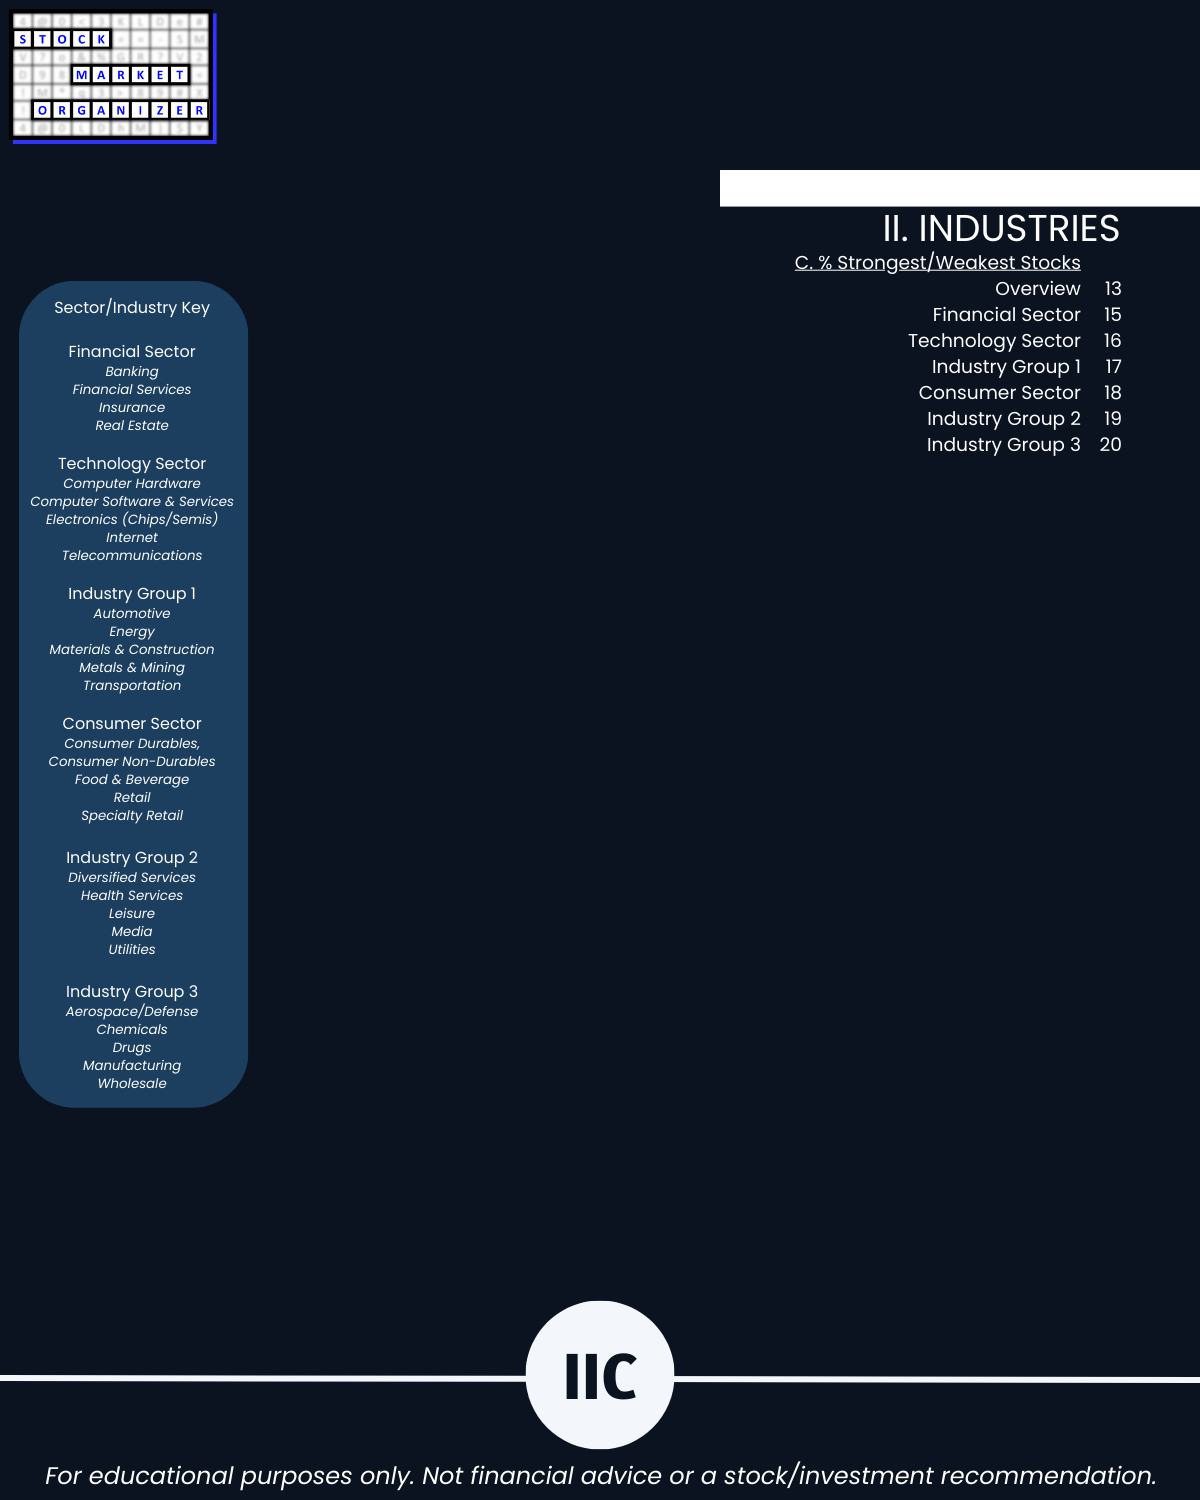
IIC. INDUSTRIES % Strongest/Weakest Stocks
IIIA. SUB-INDUSTRIES 1-Week Strength Summary
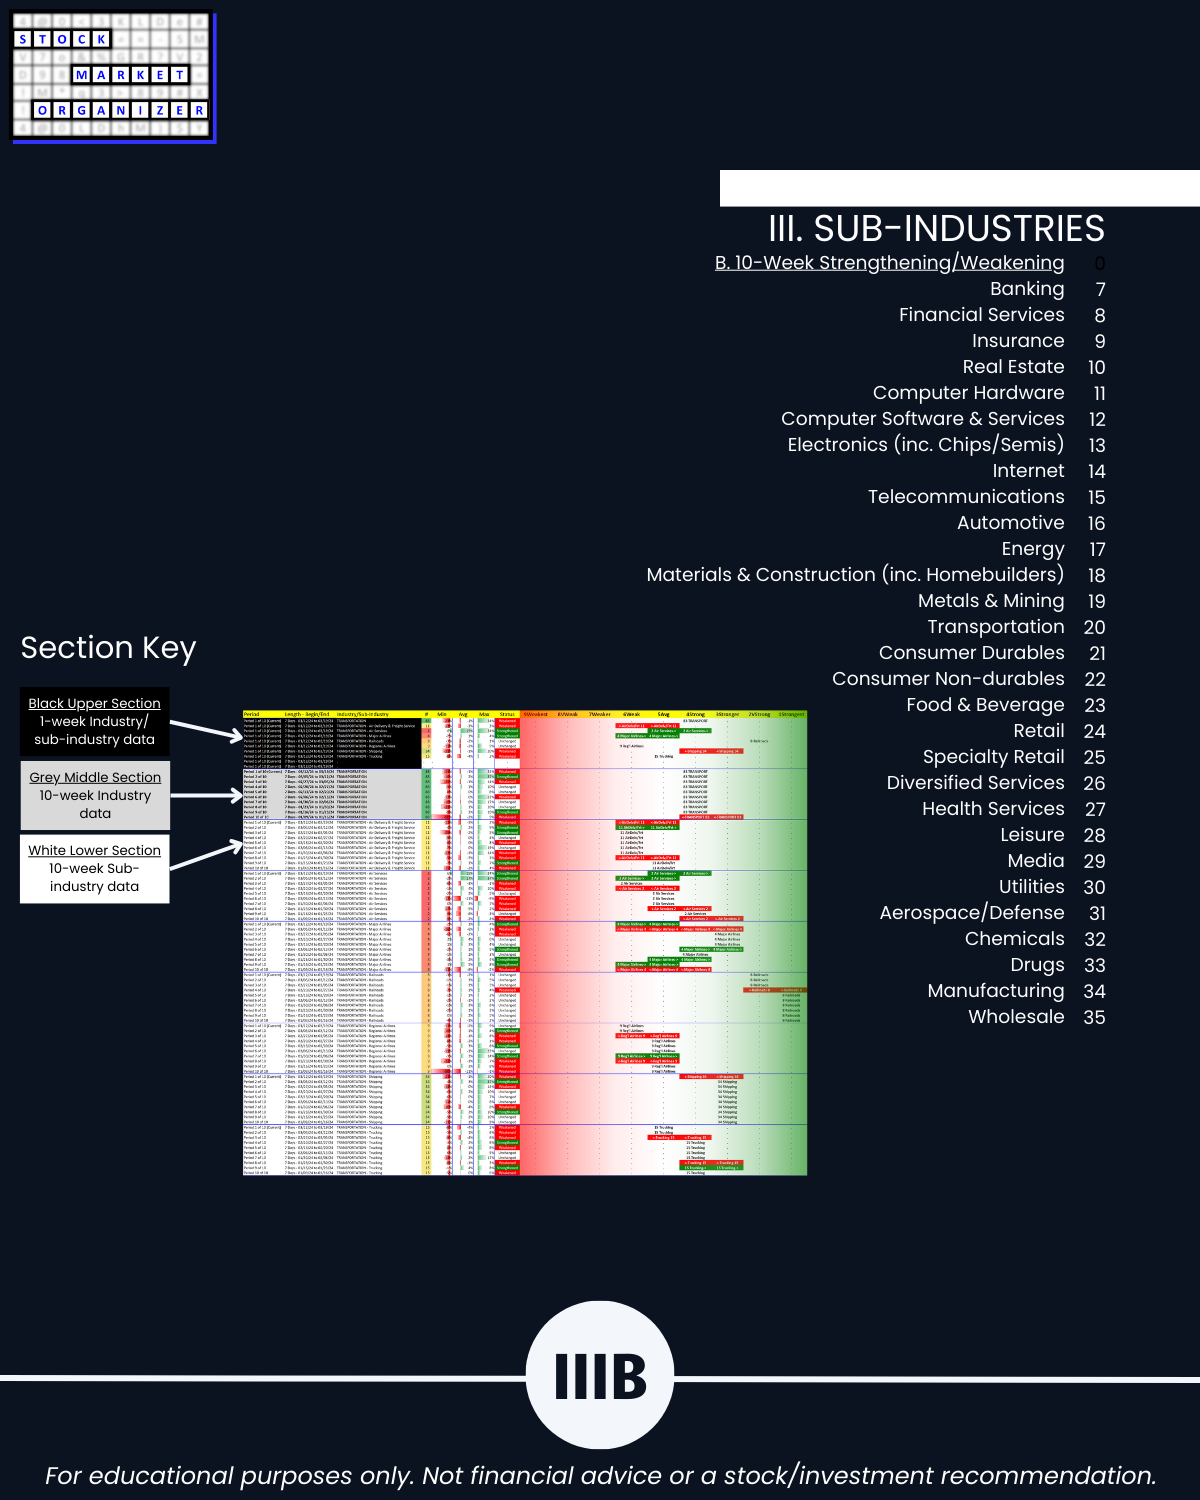
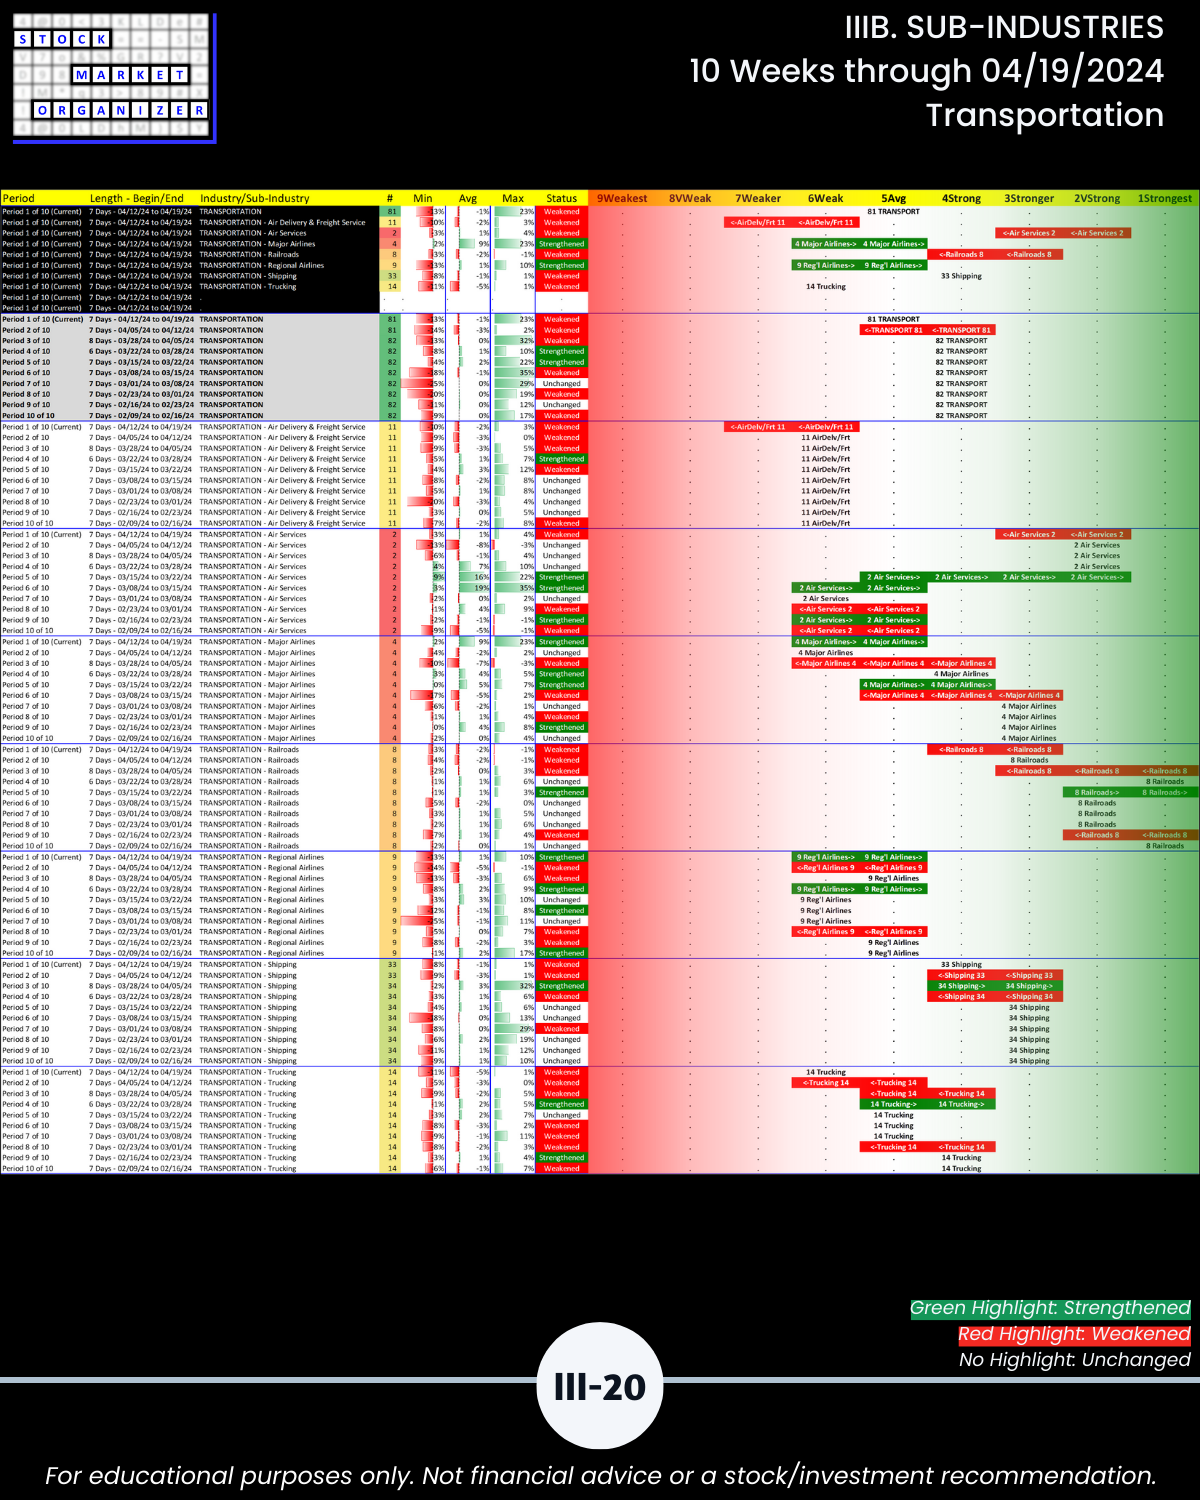
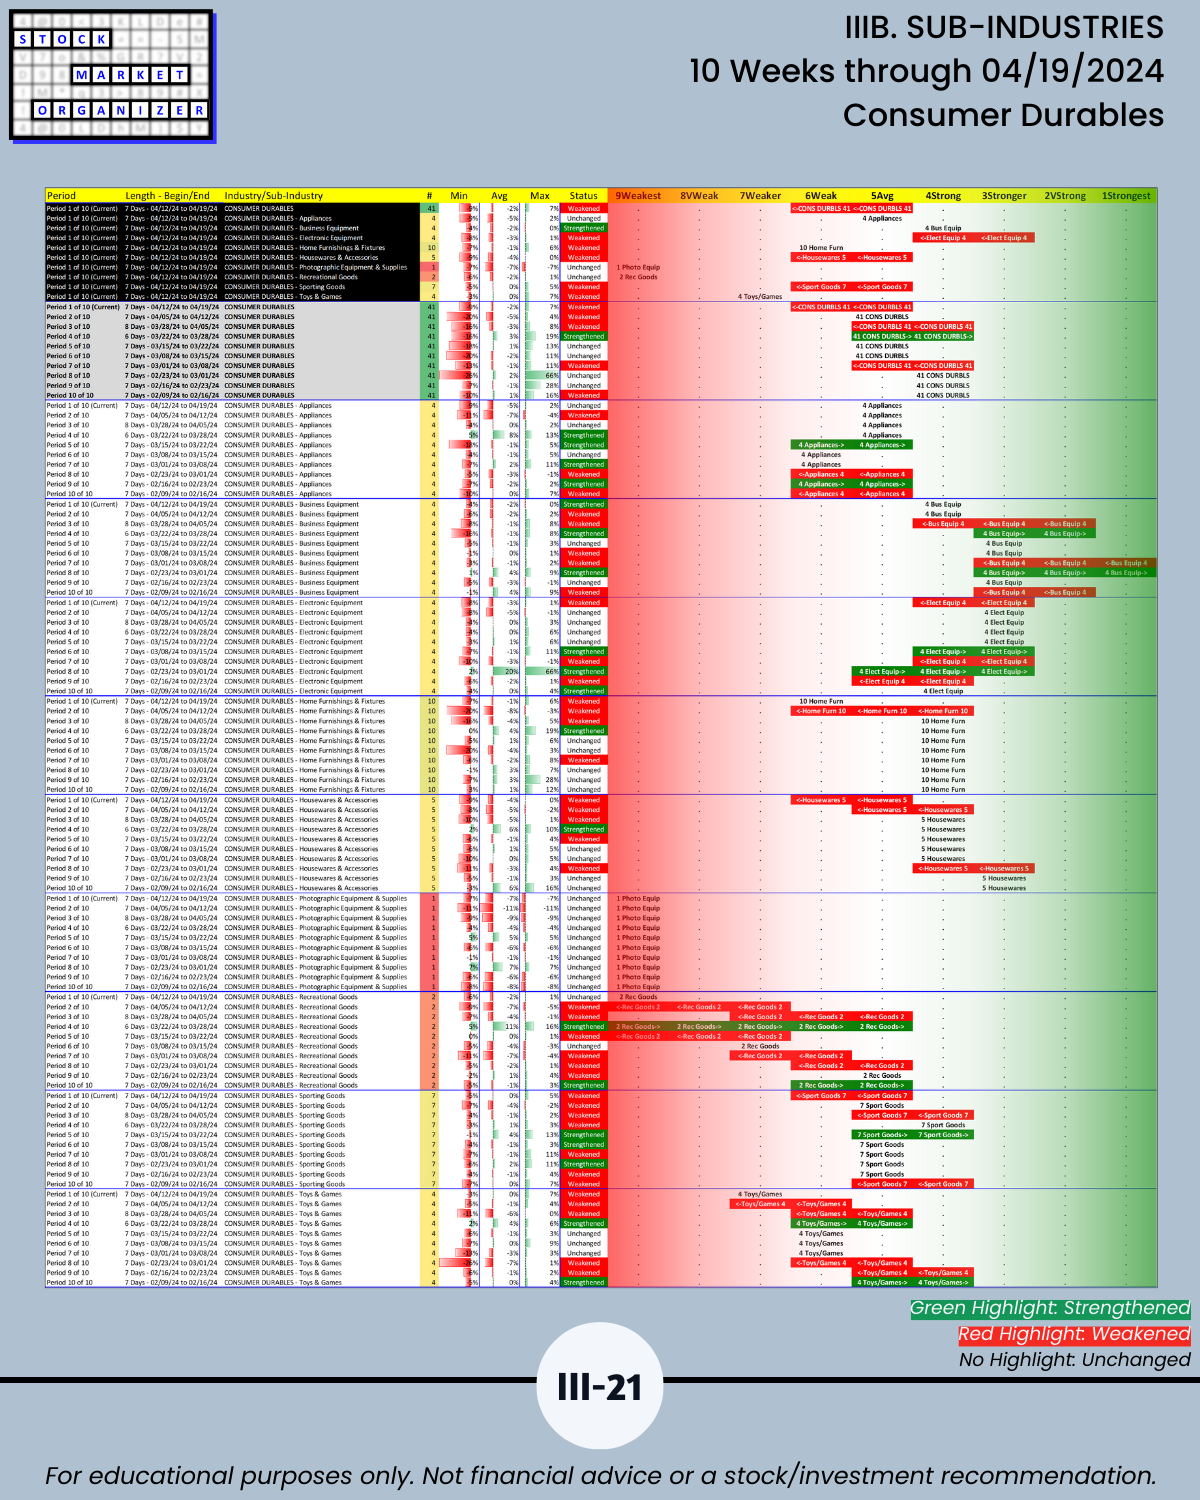
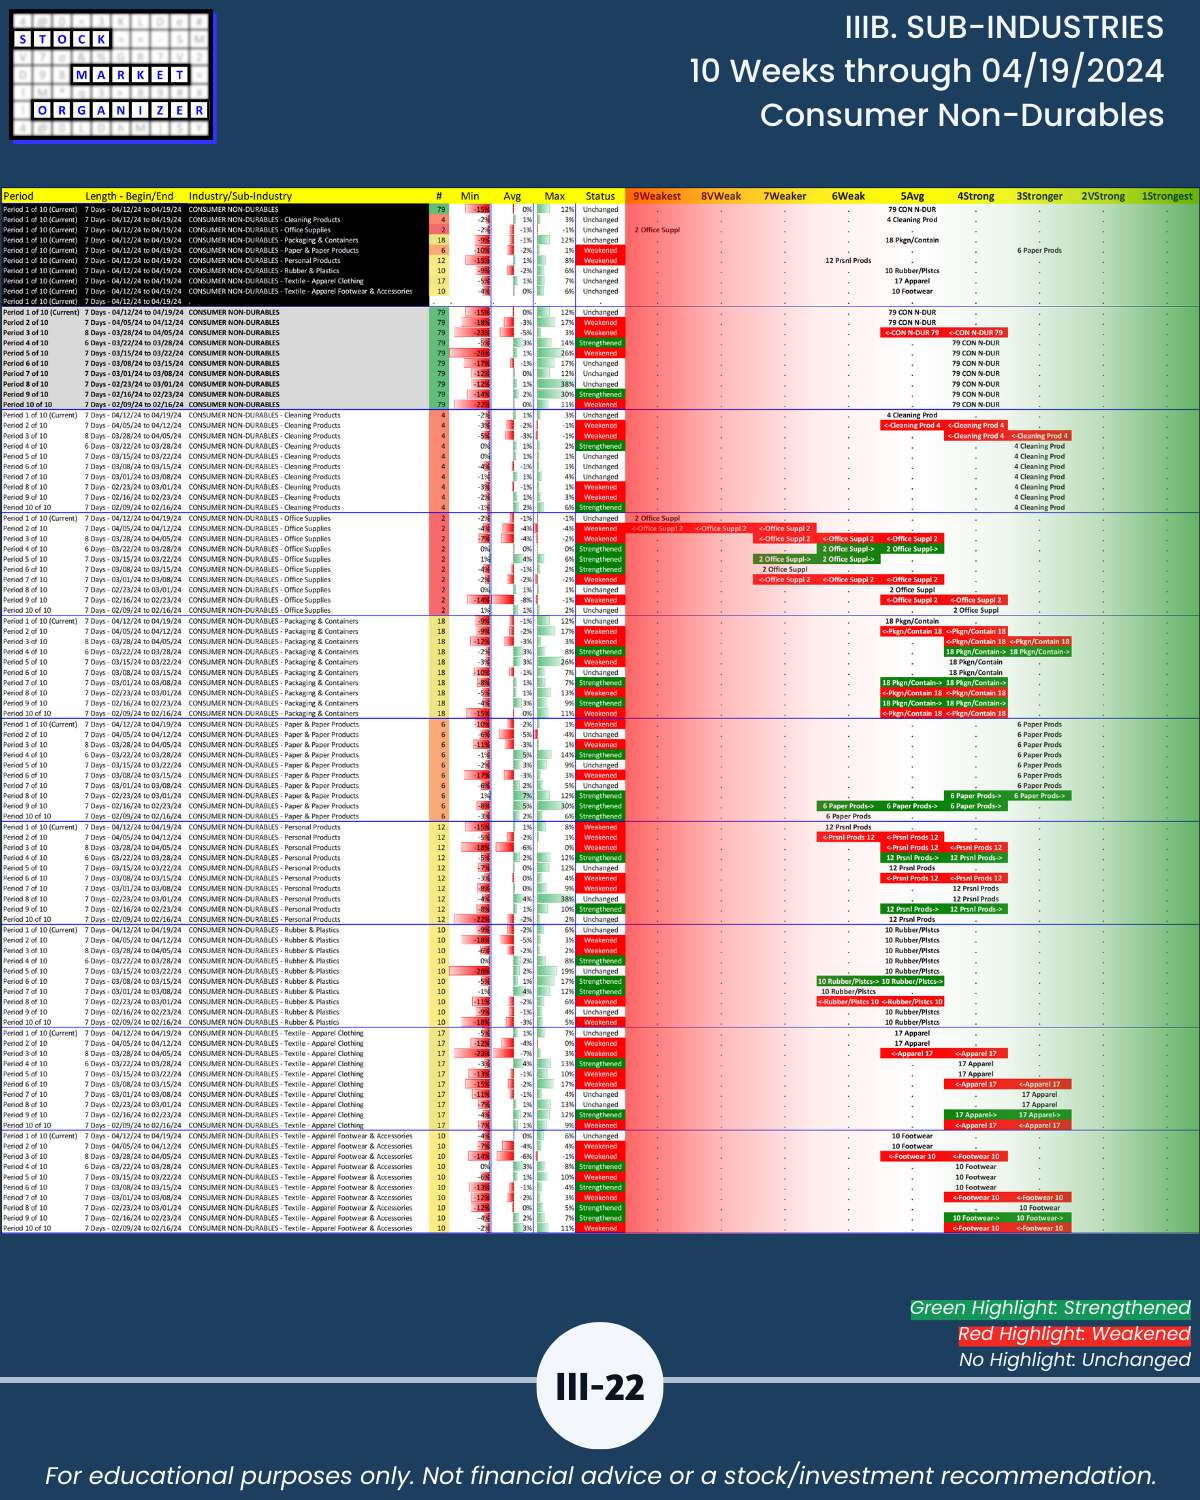
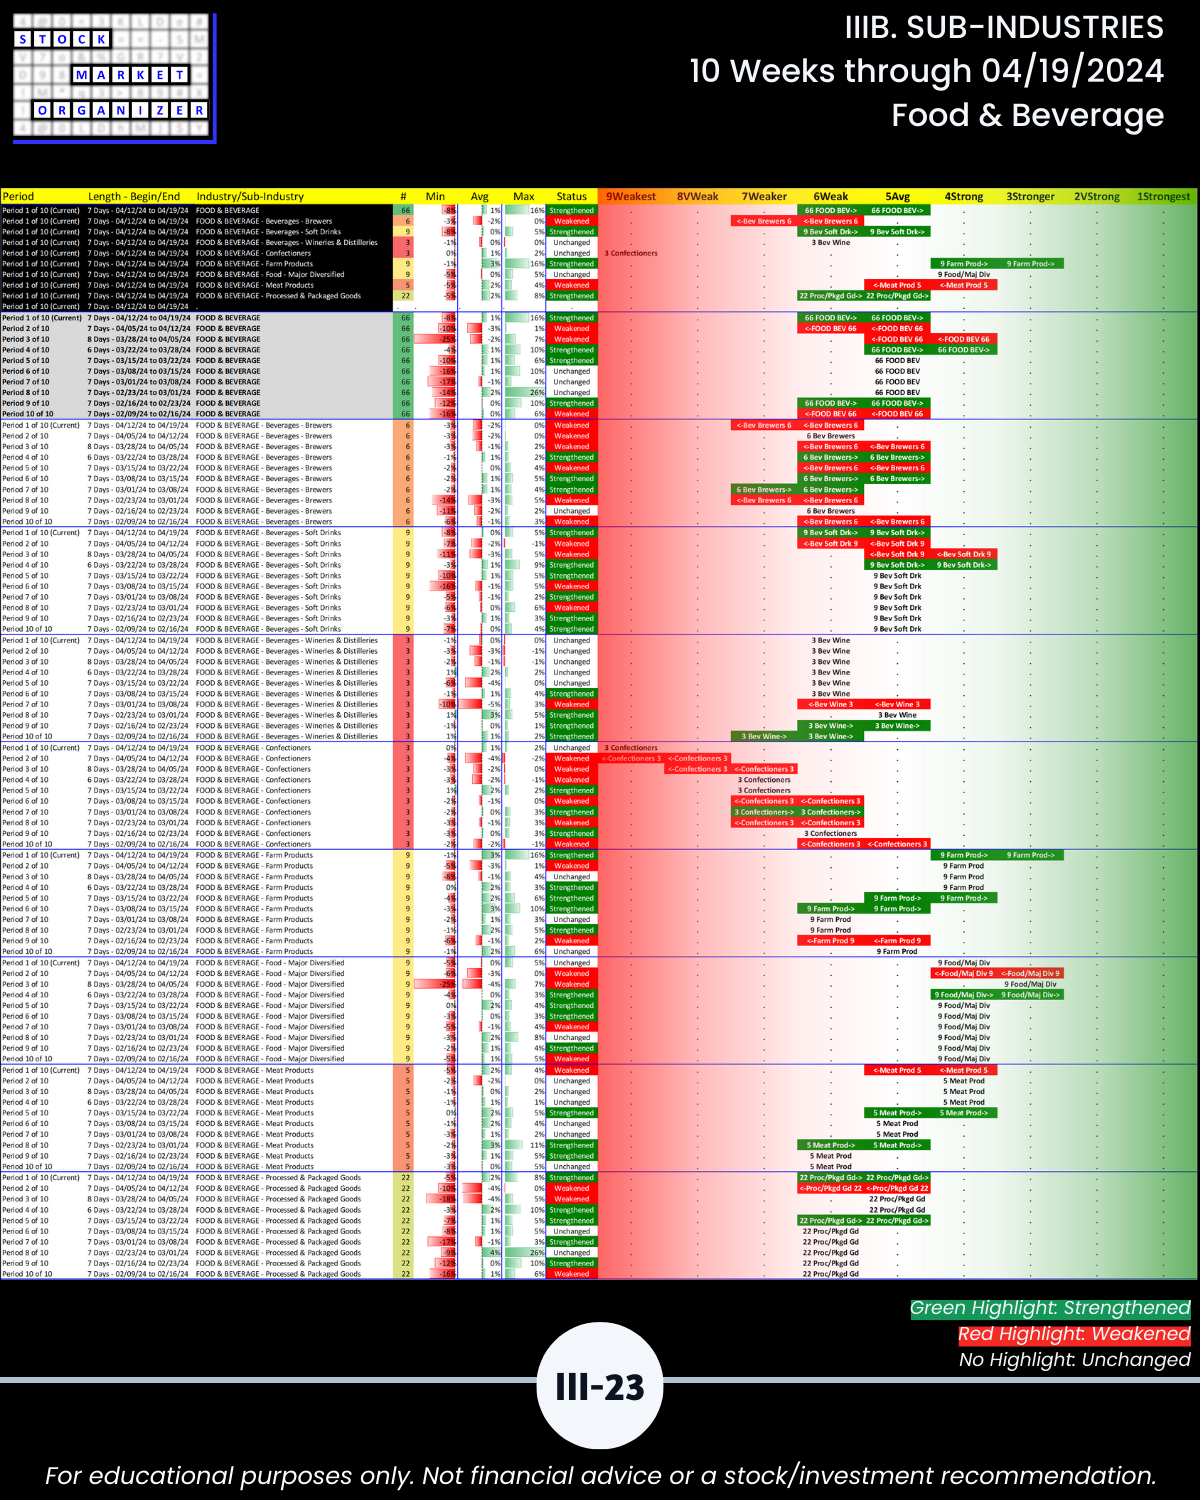
IIIB. SUB-INDUSTRIES 10-Week Strengthening/Weakening
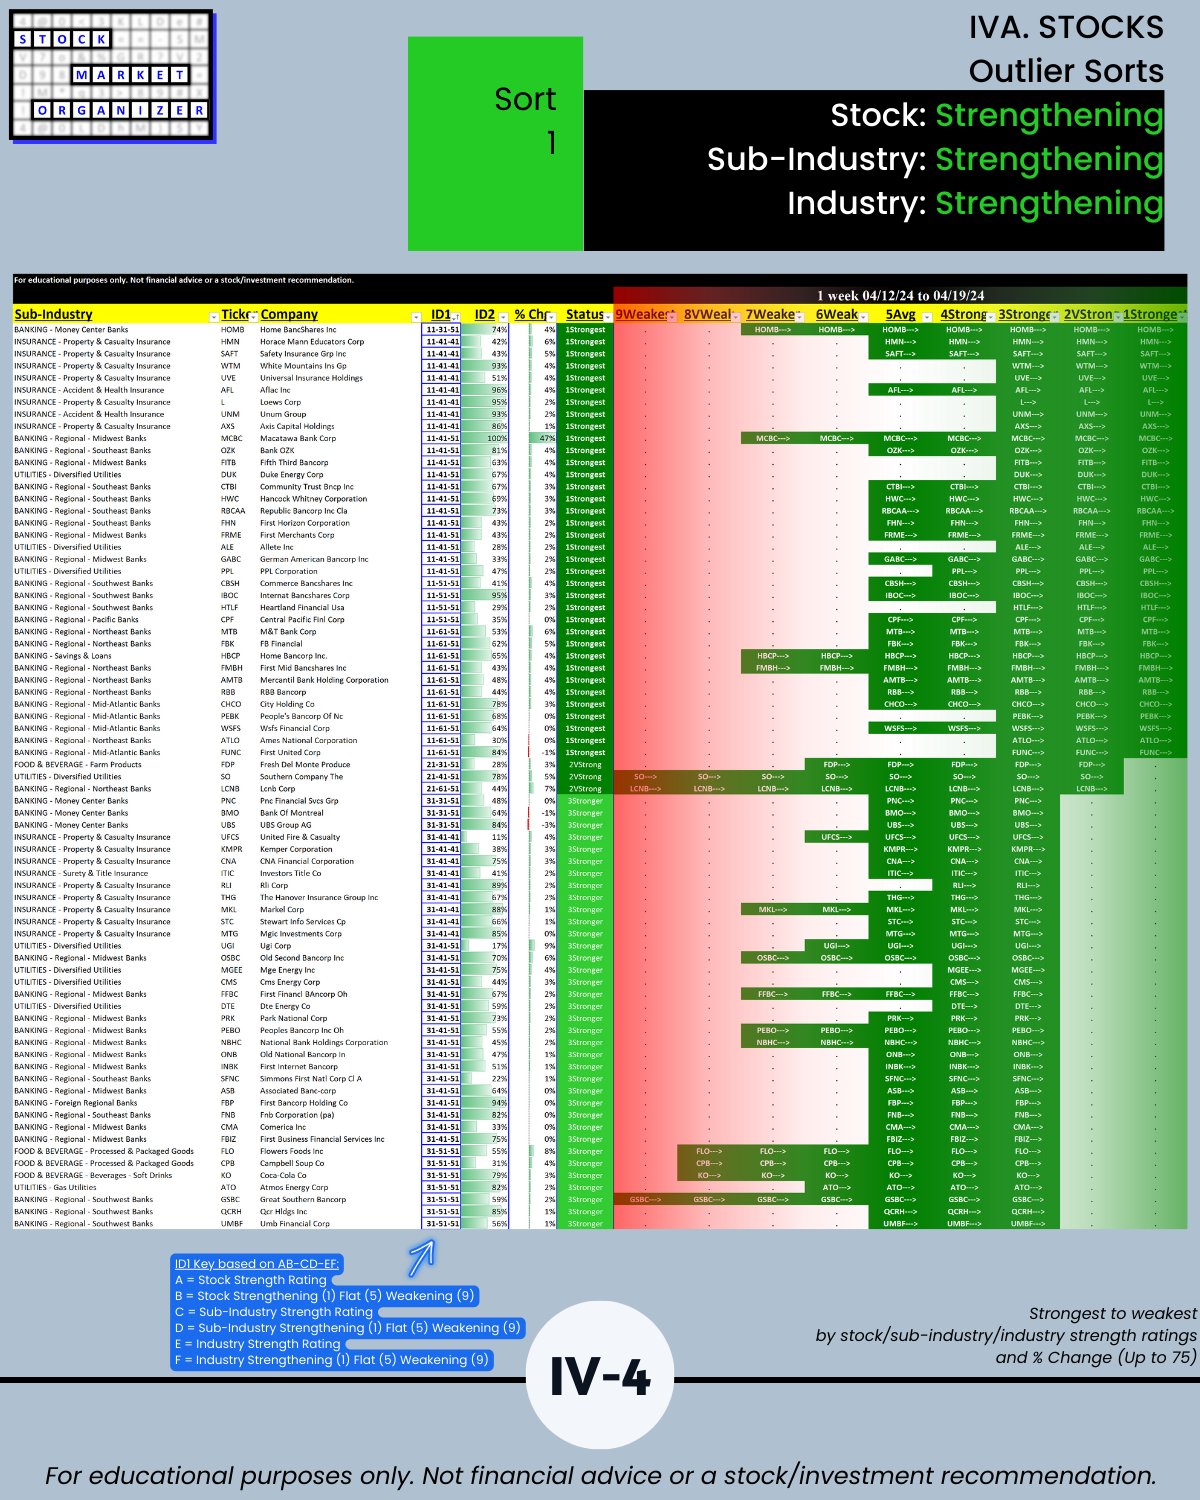
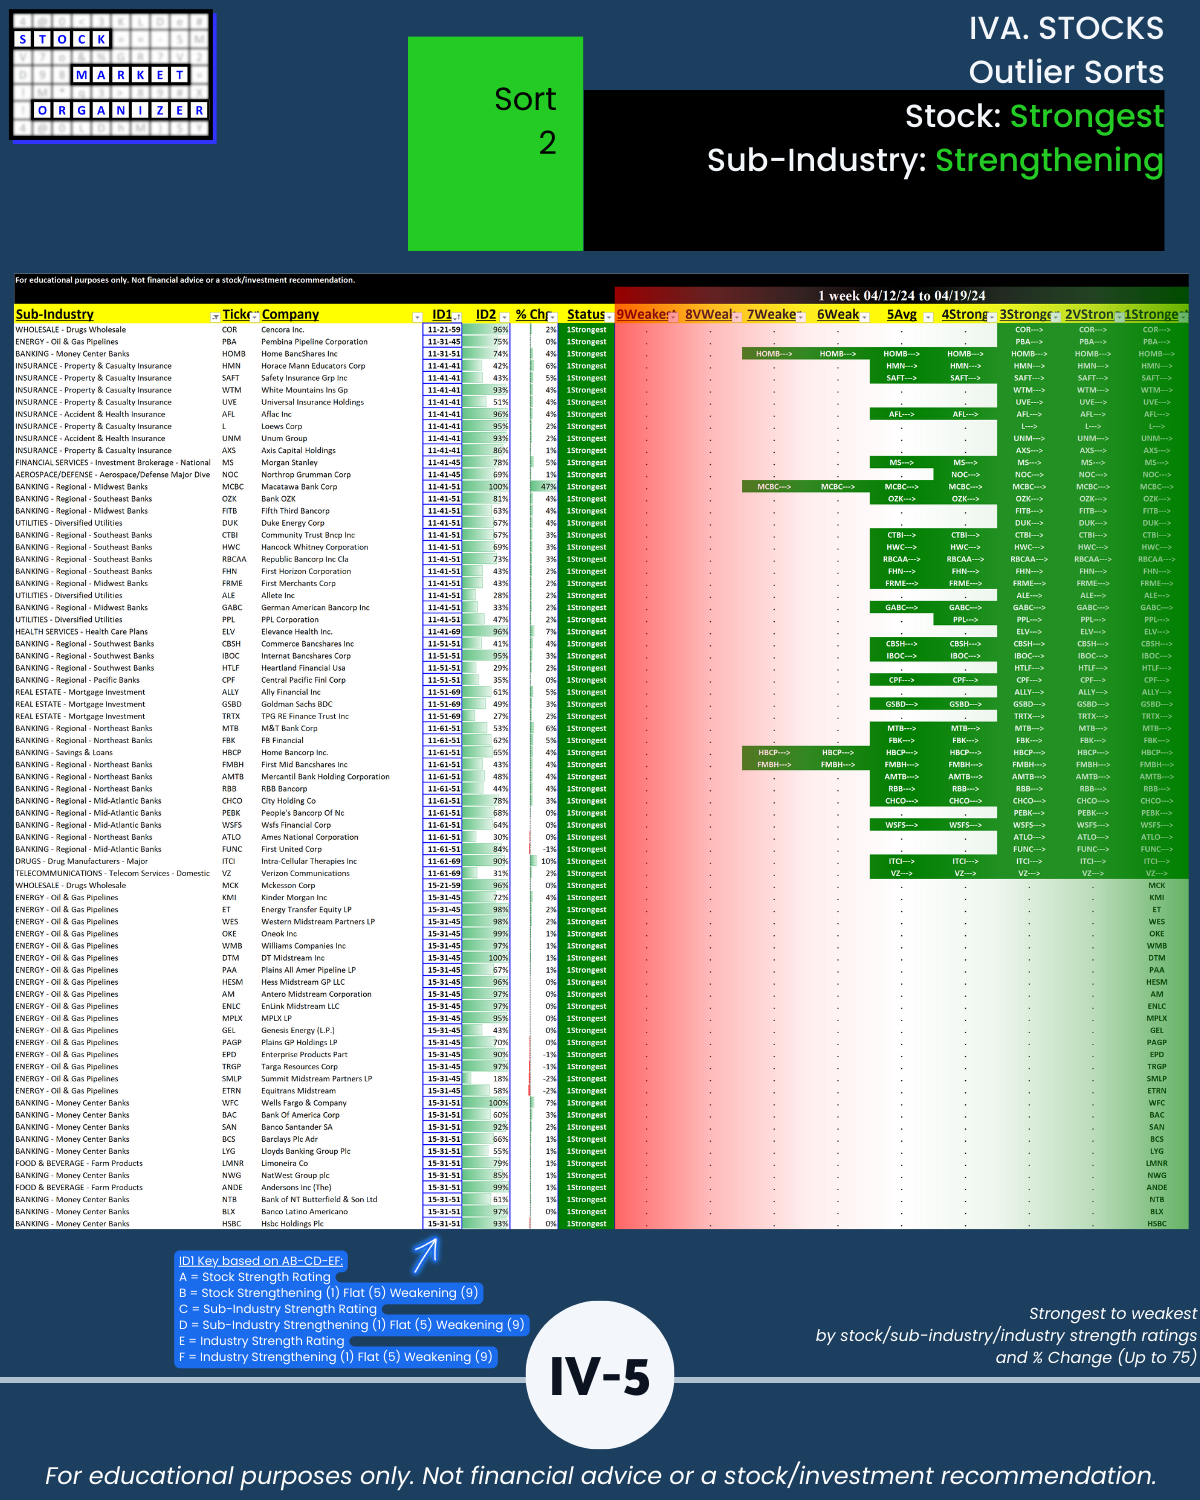
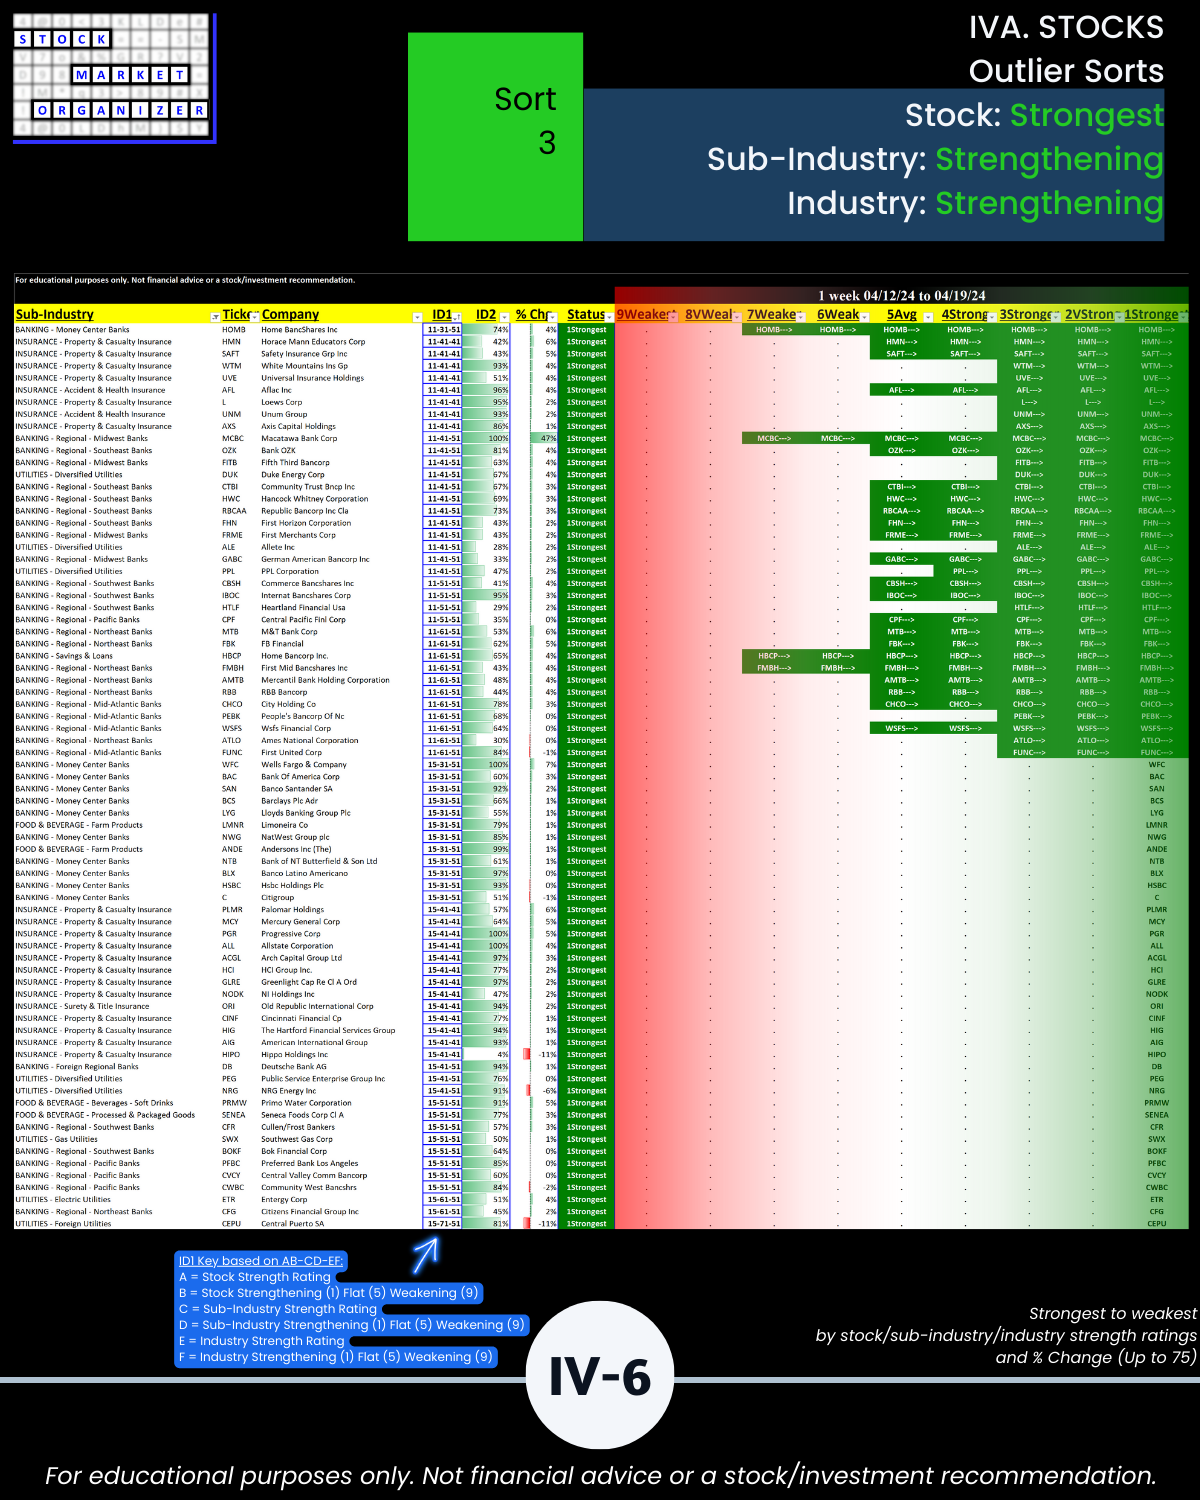
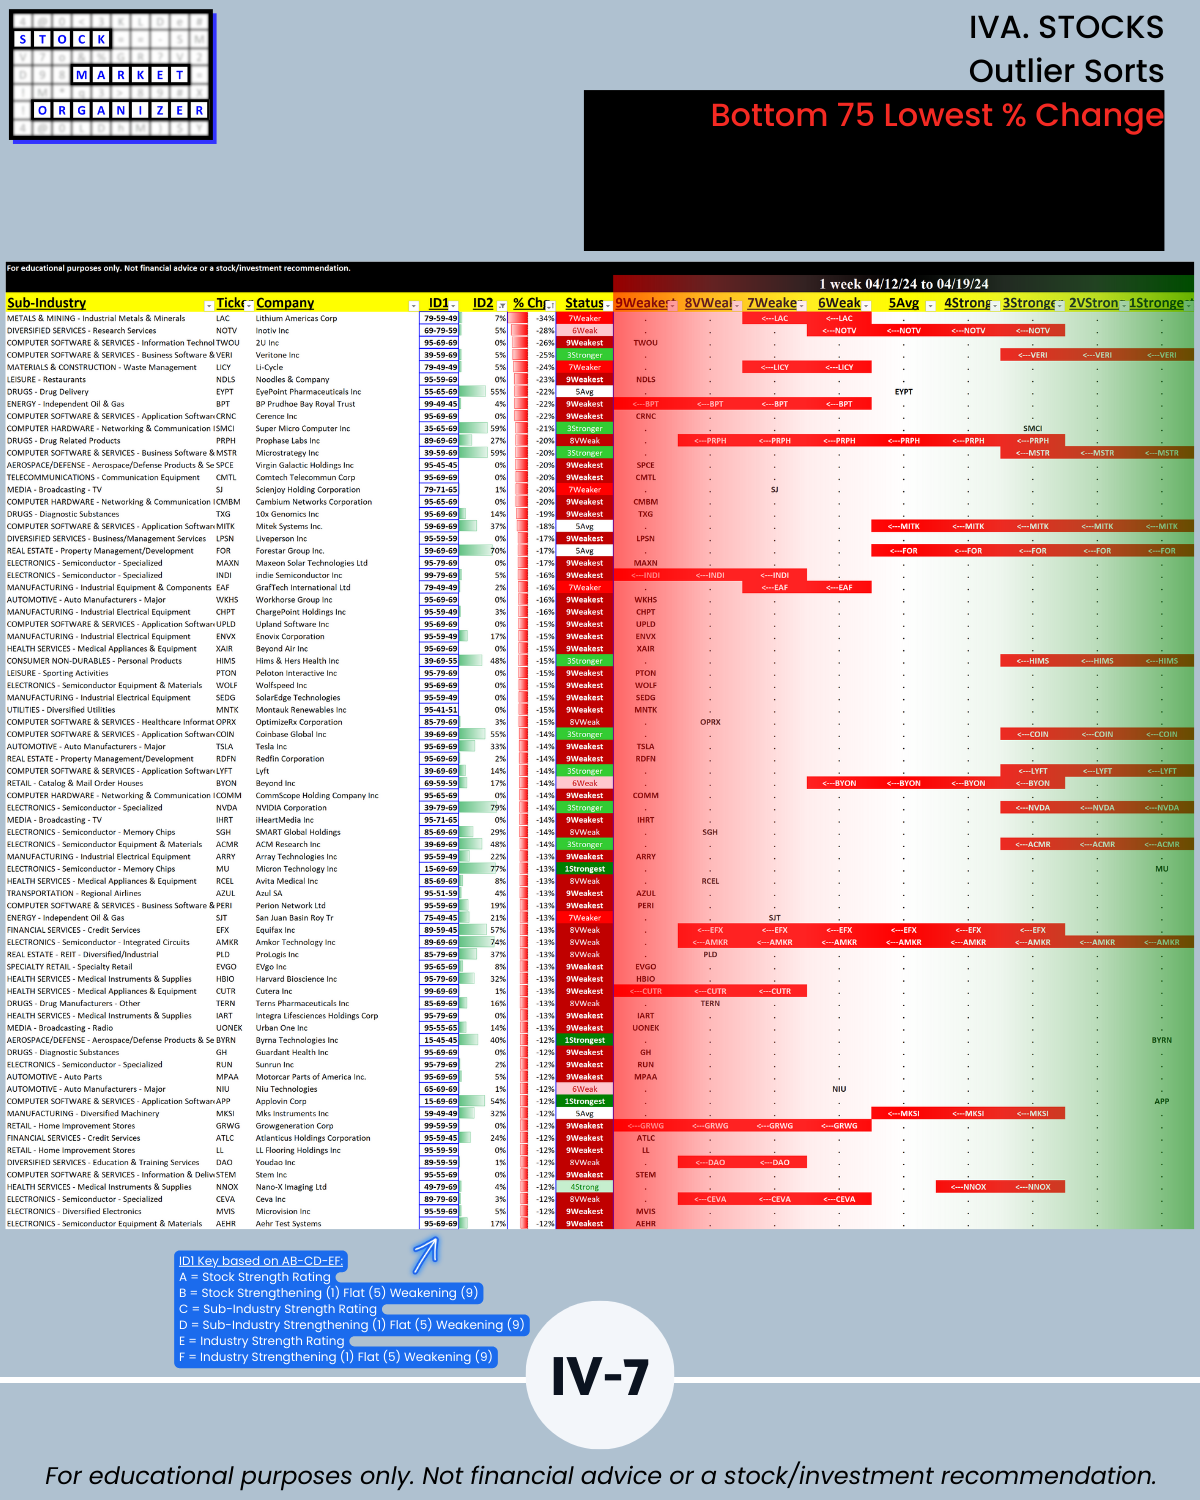
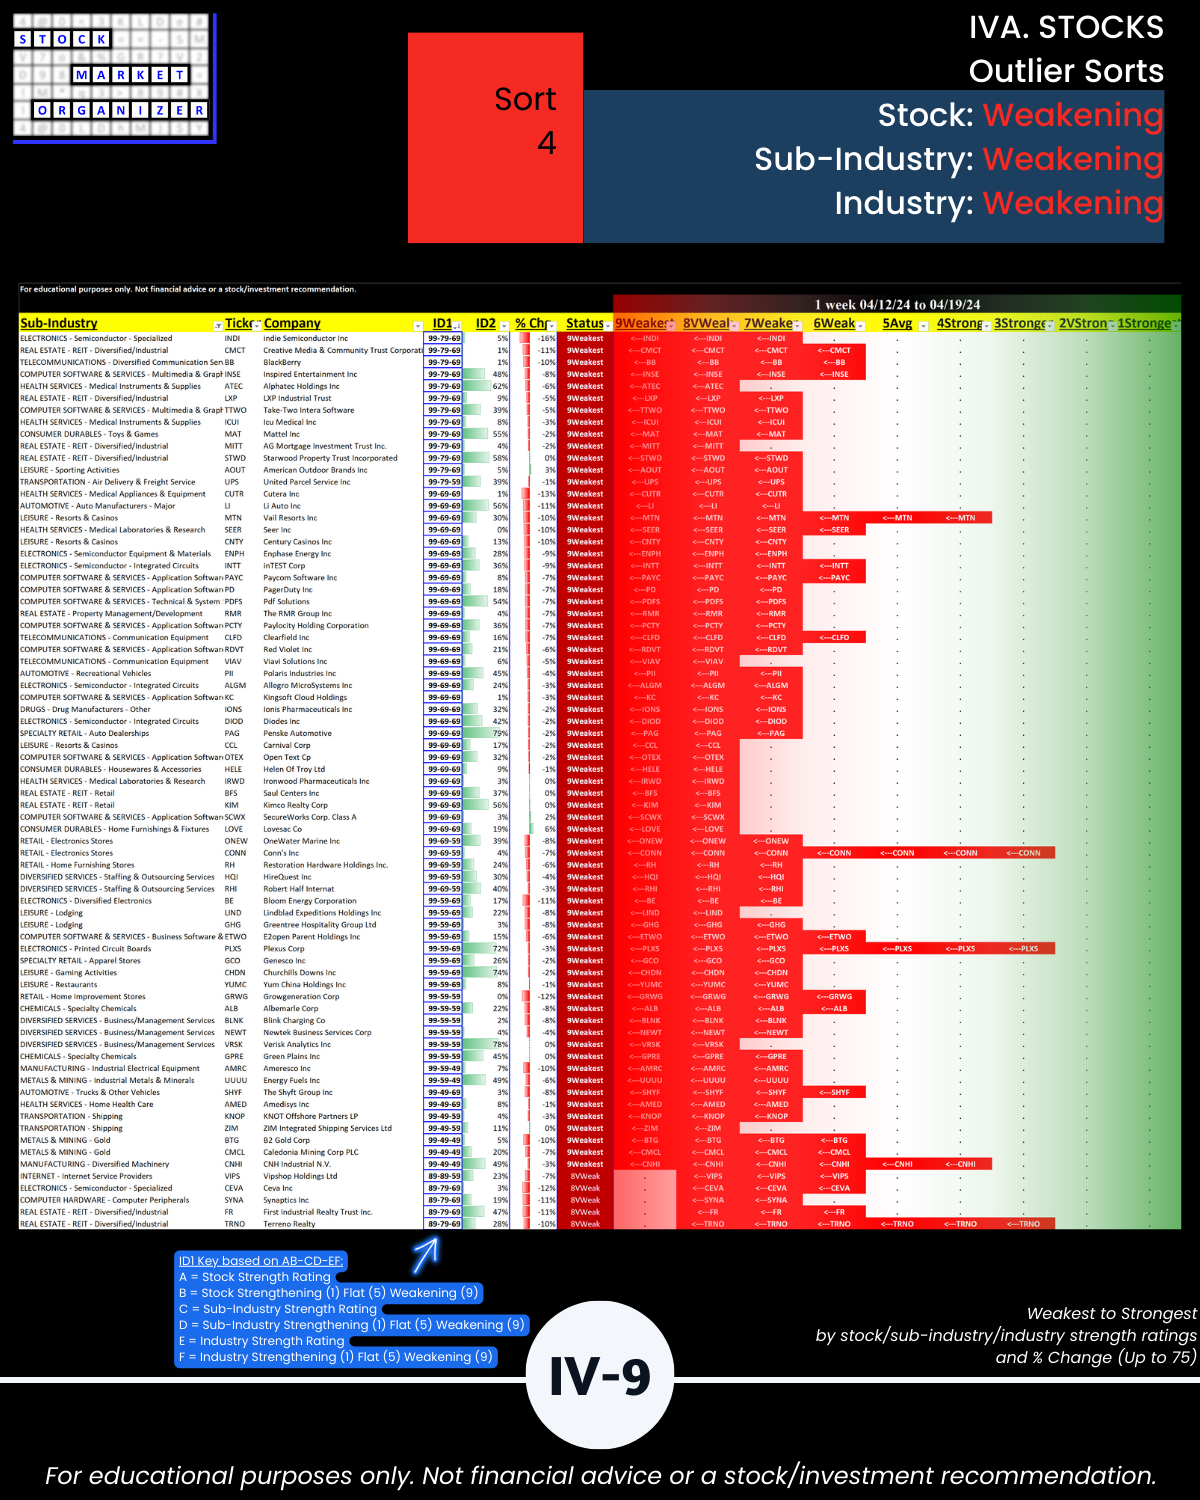
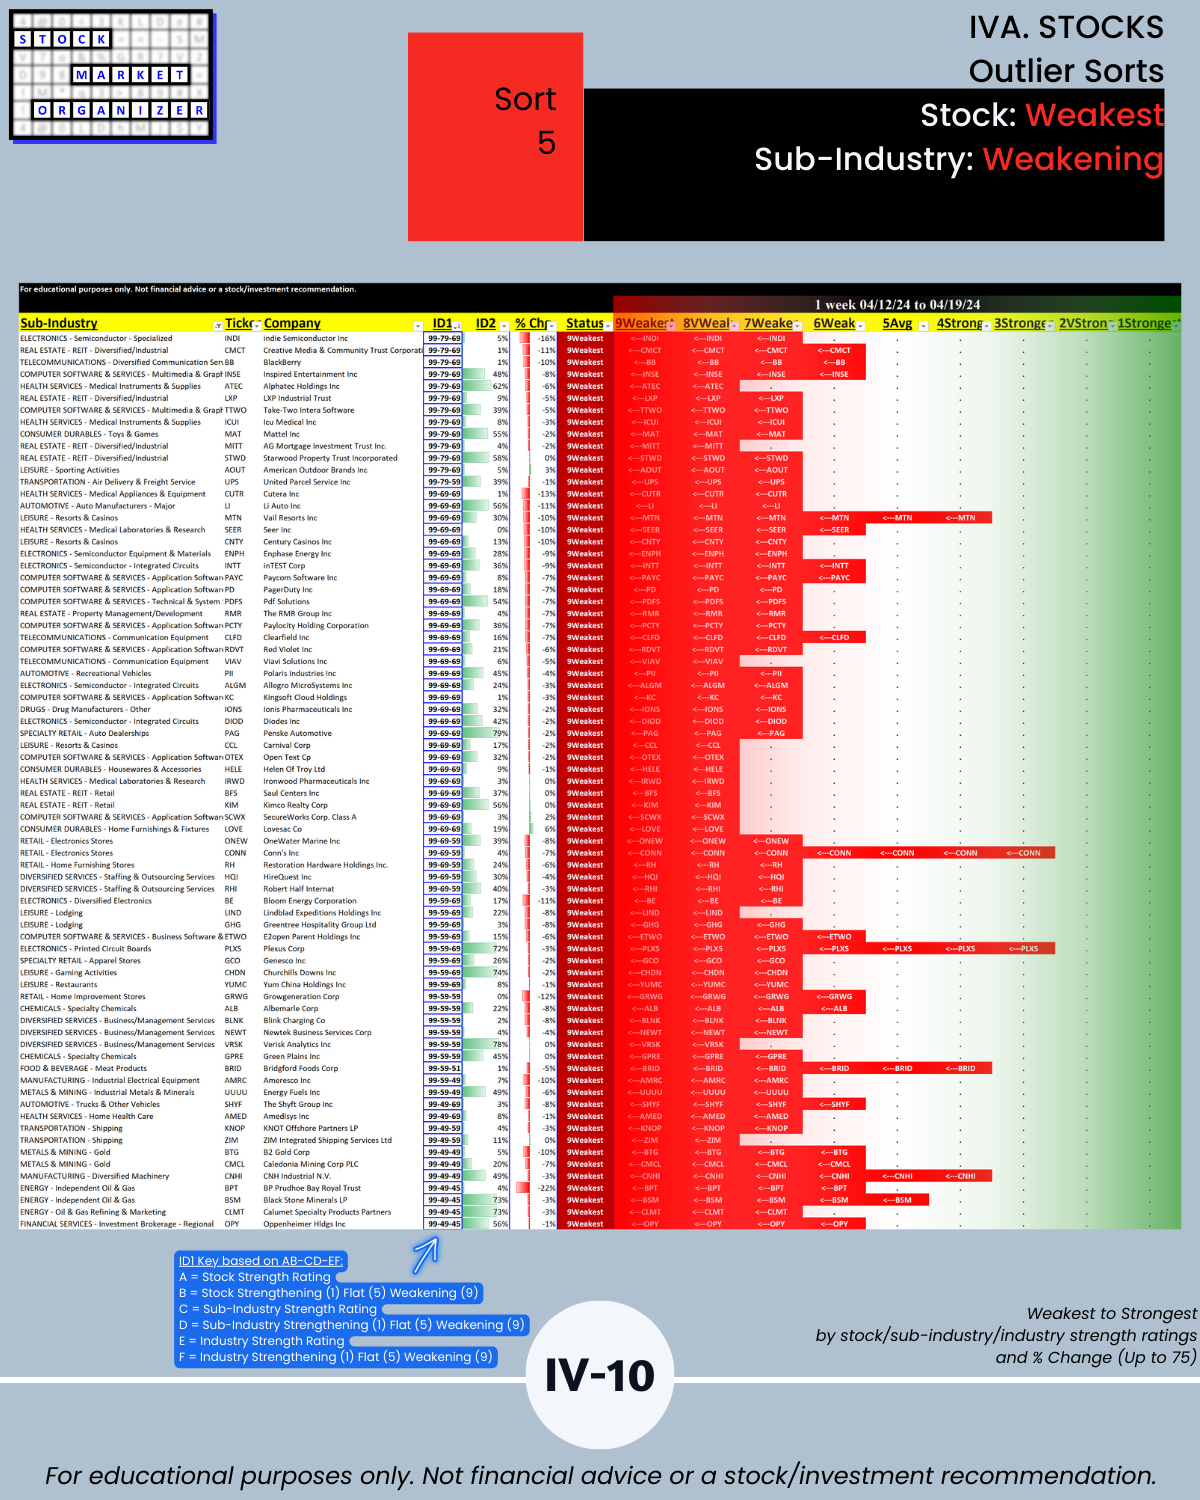
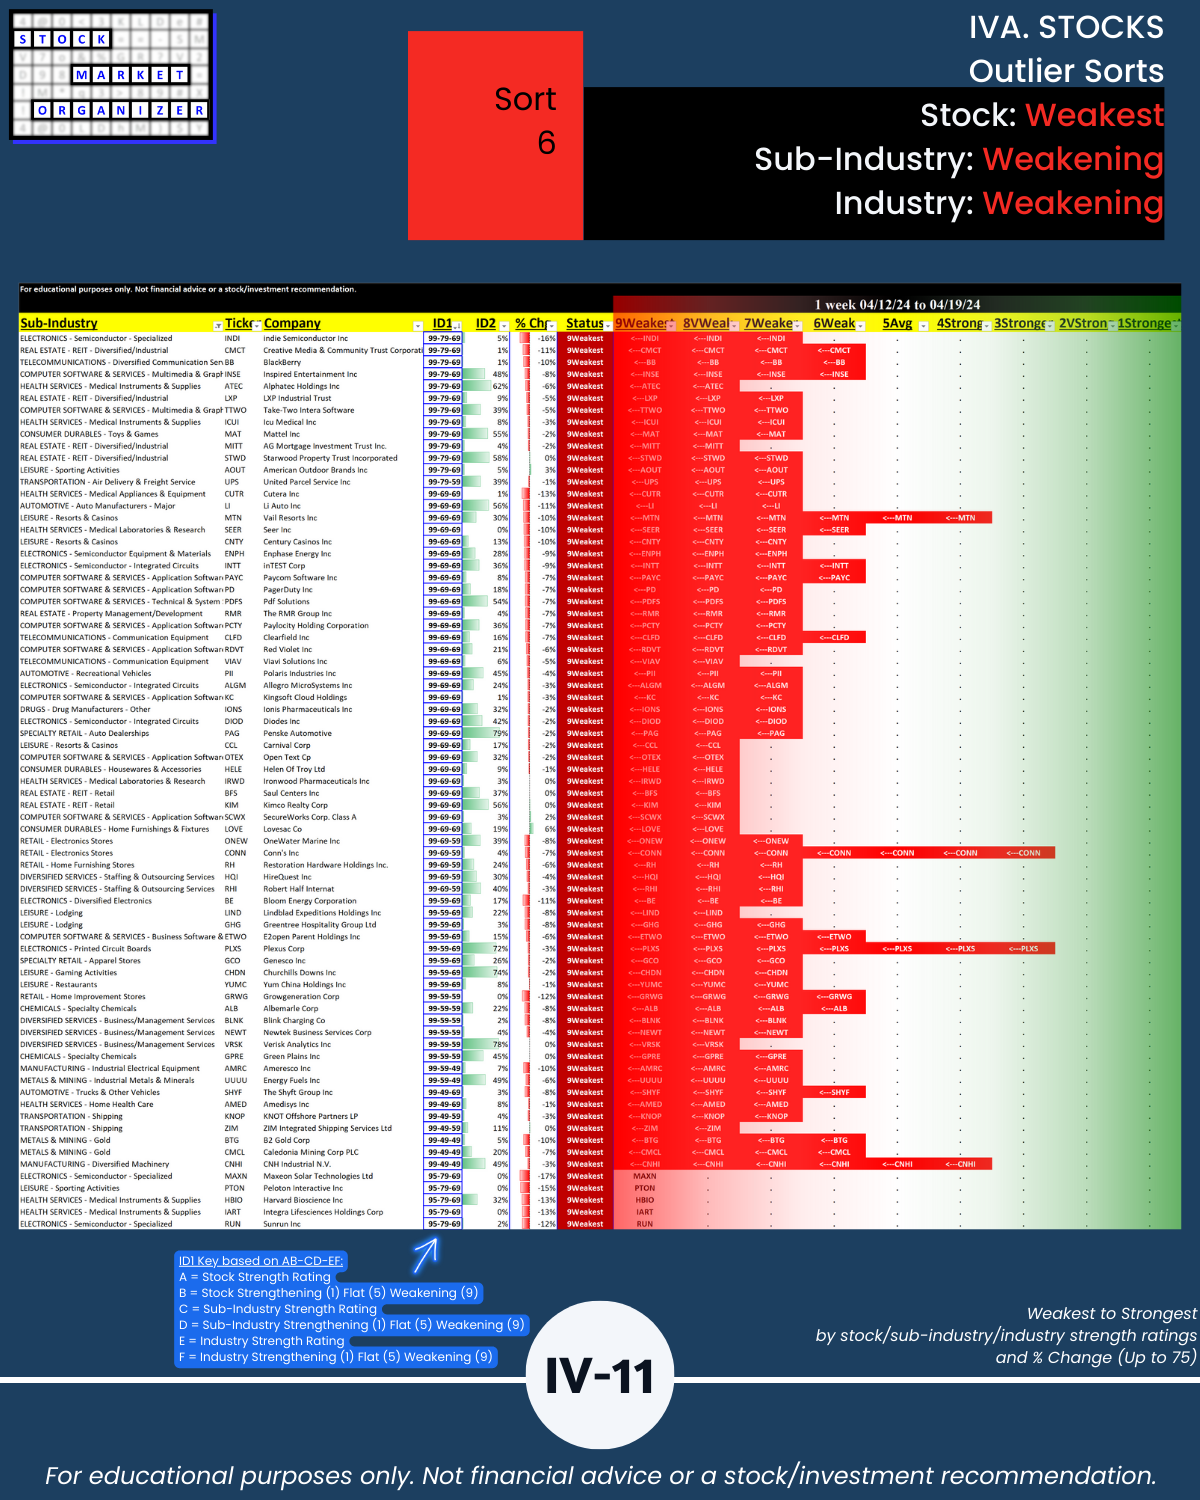
IVA. STOCKS Outlier Sorts
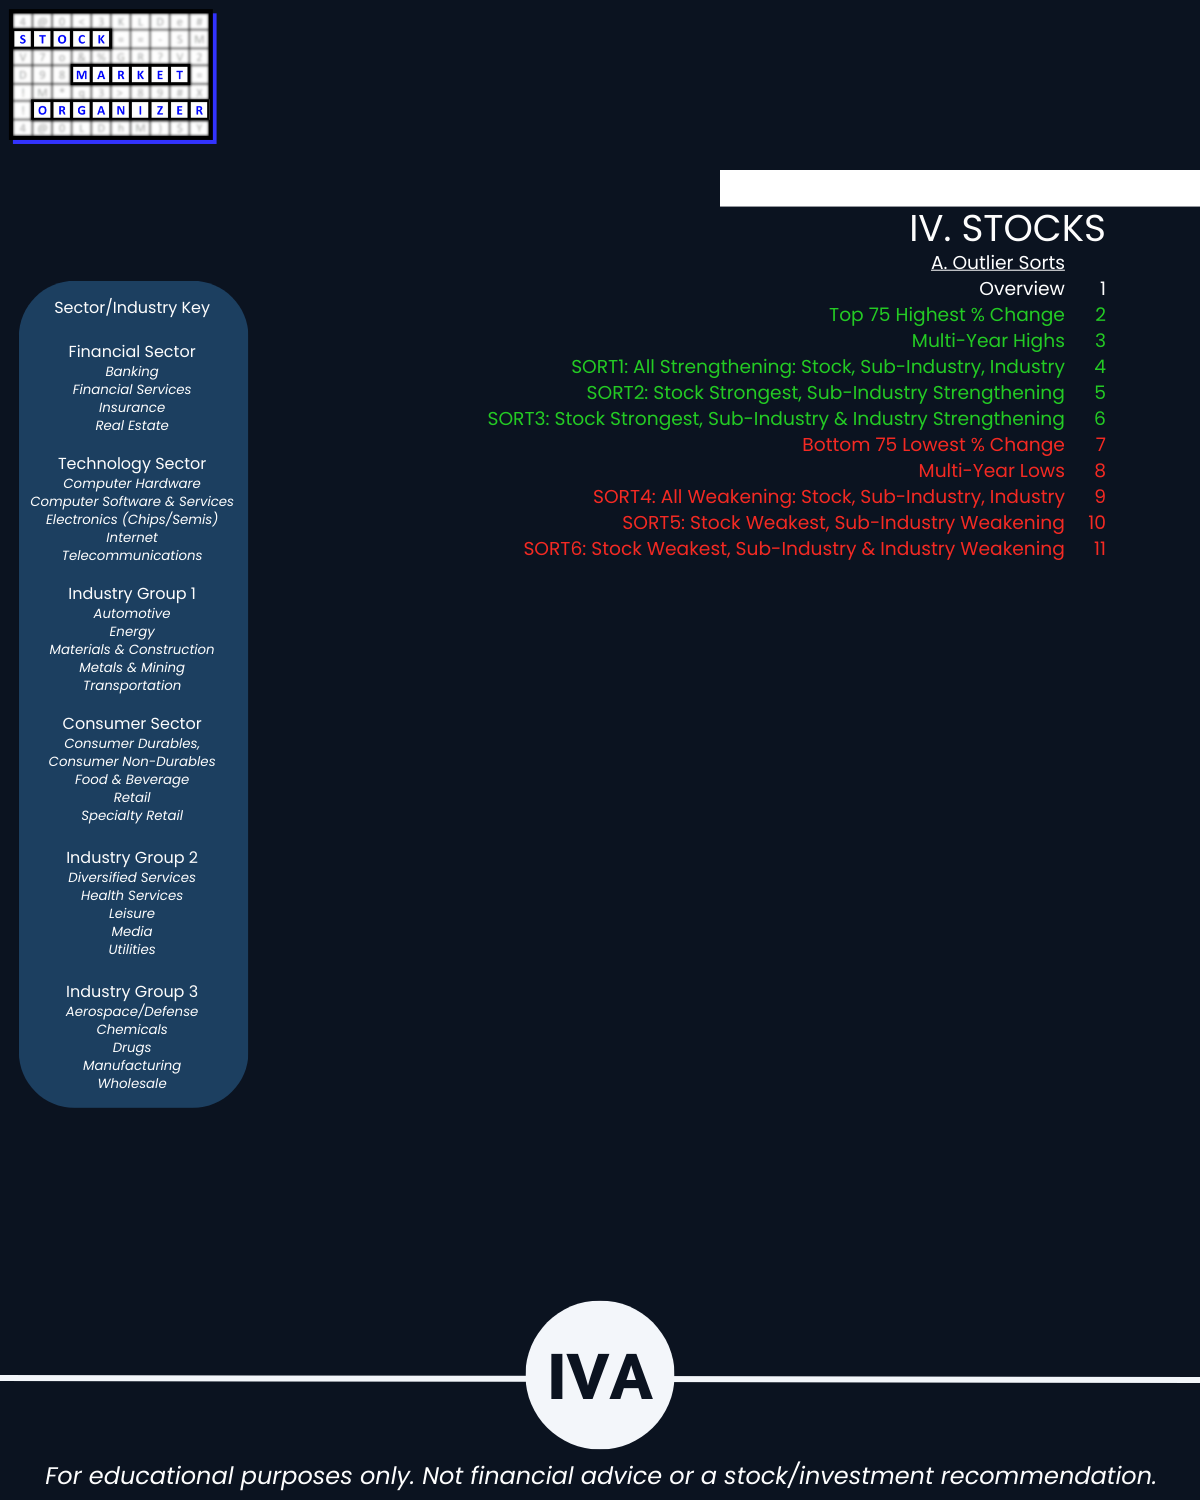
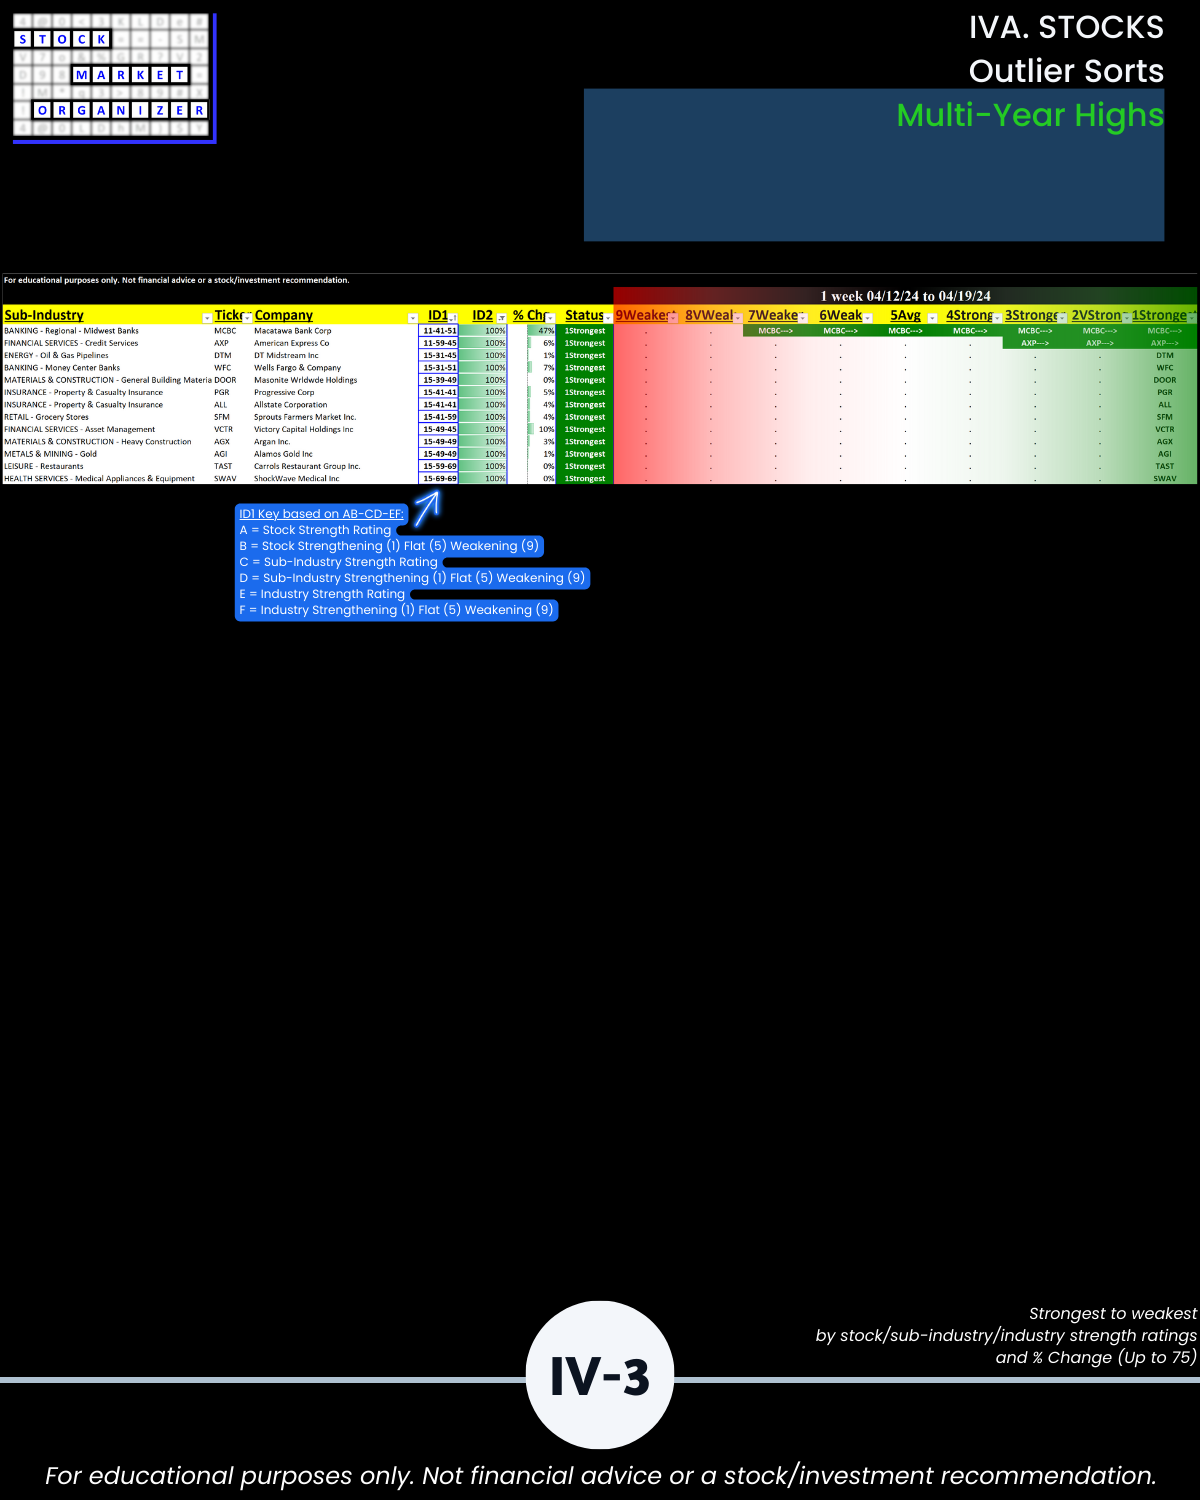
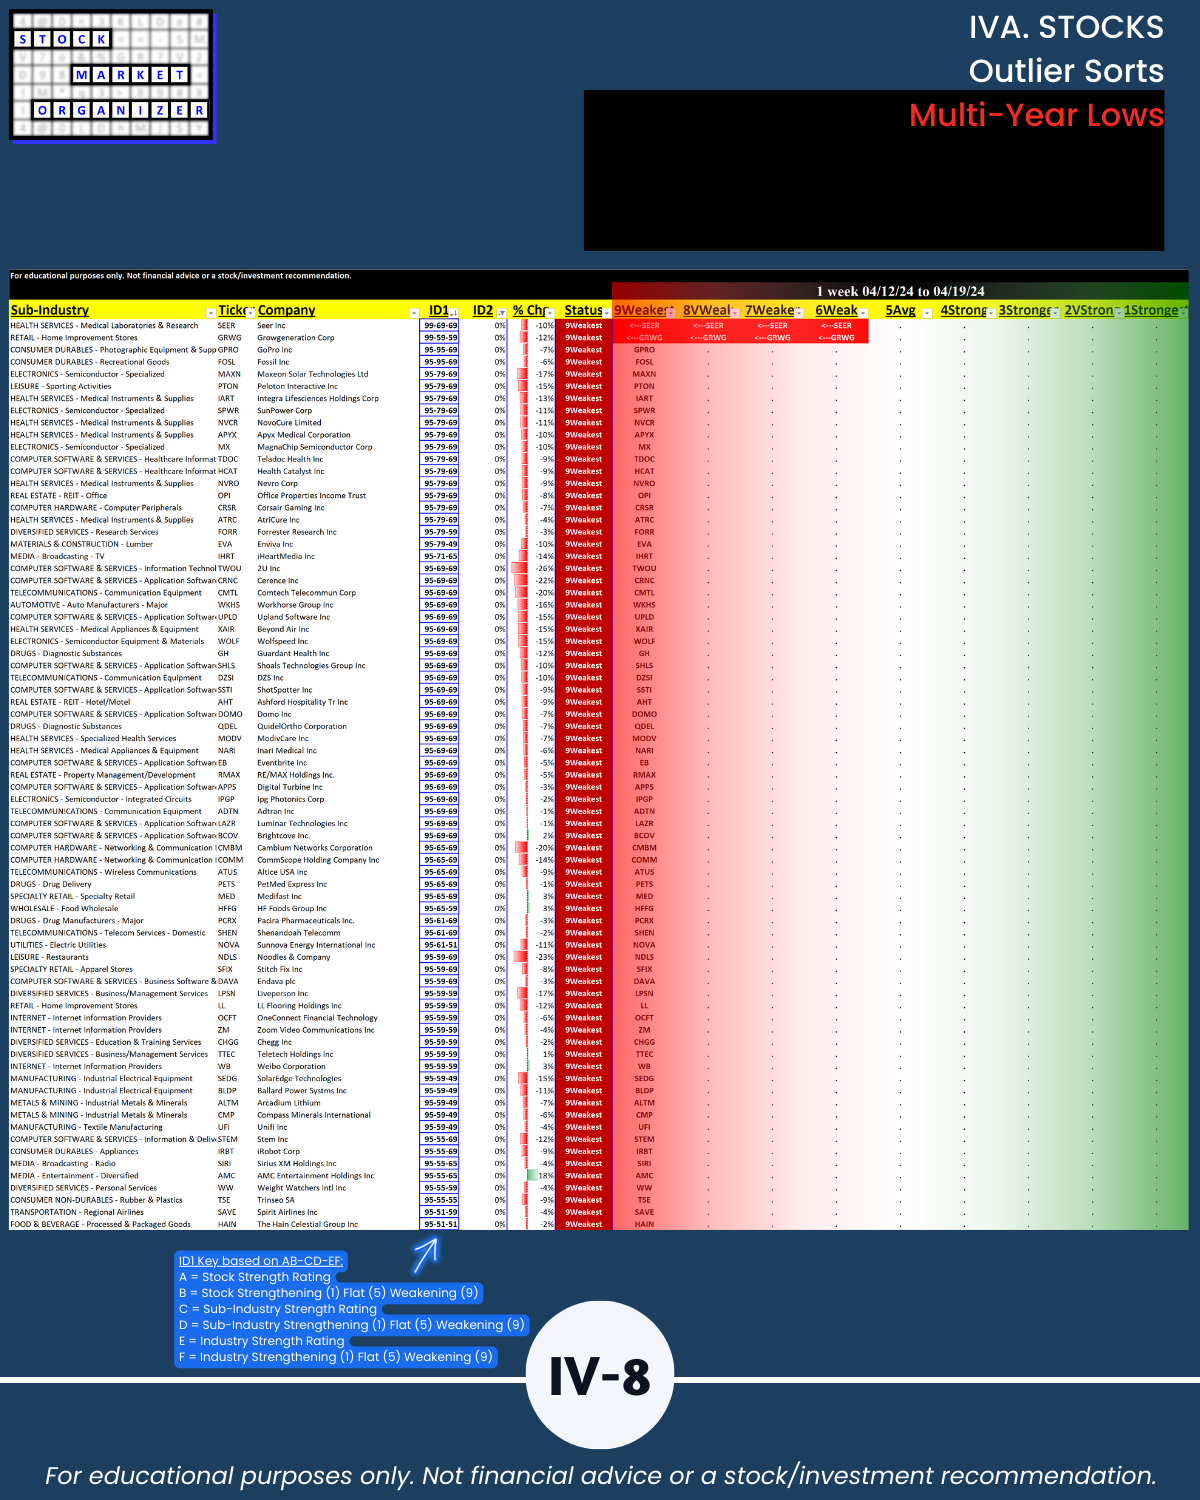
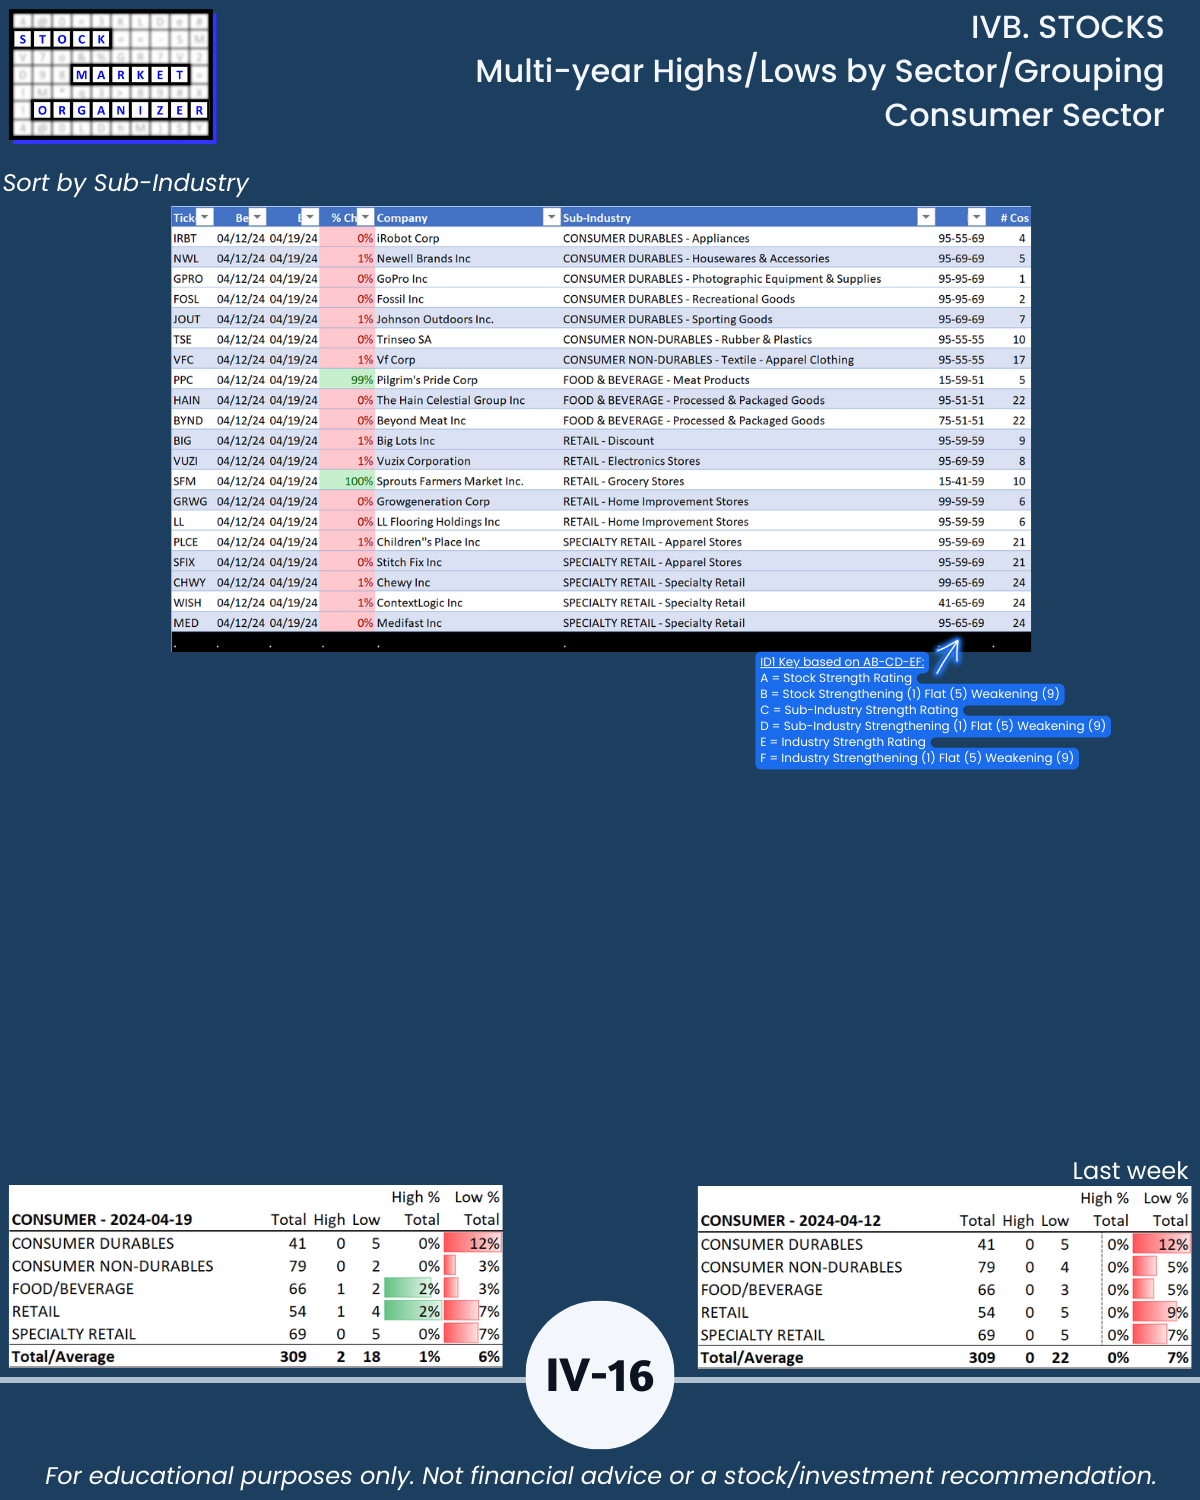
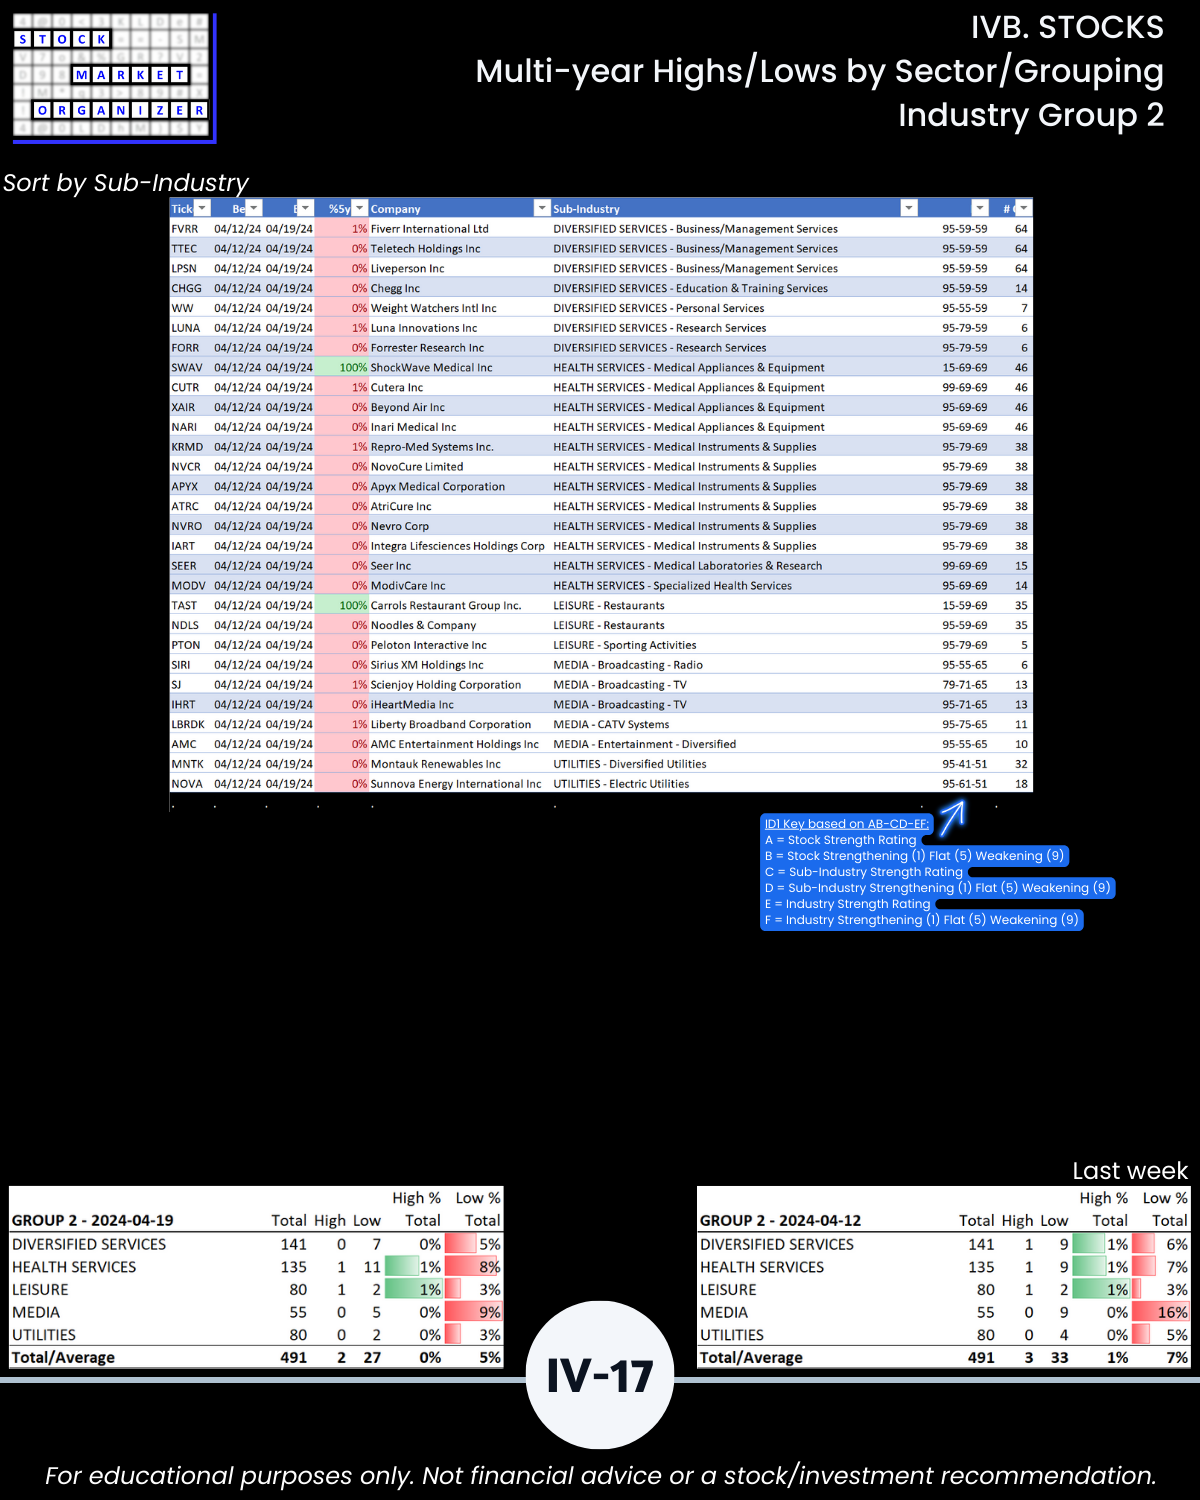
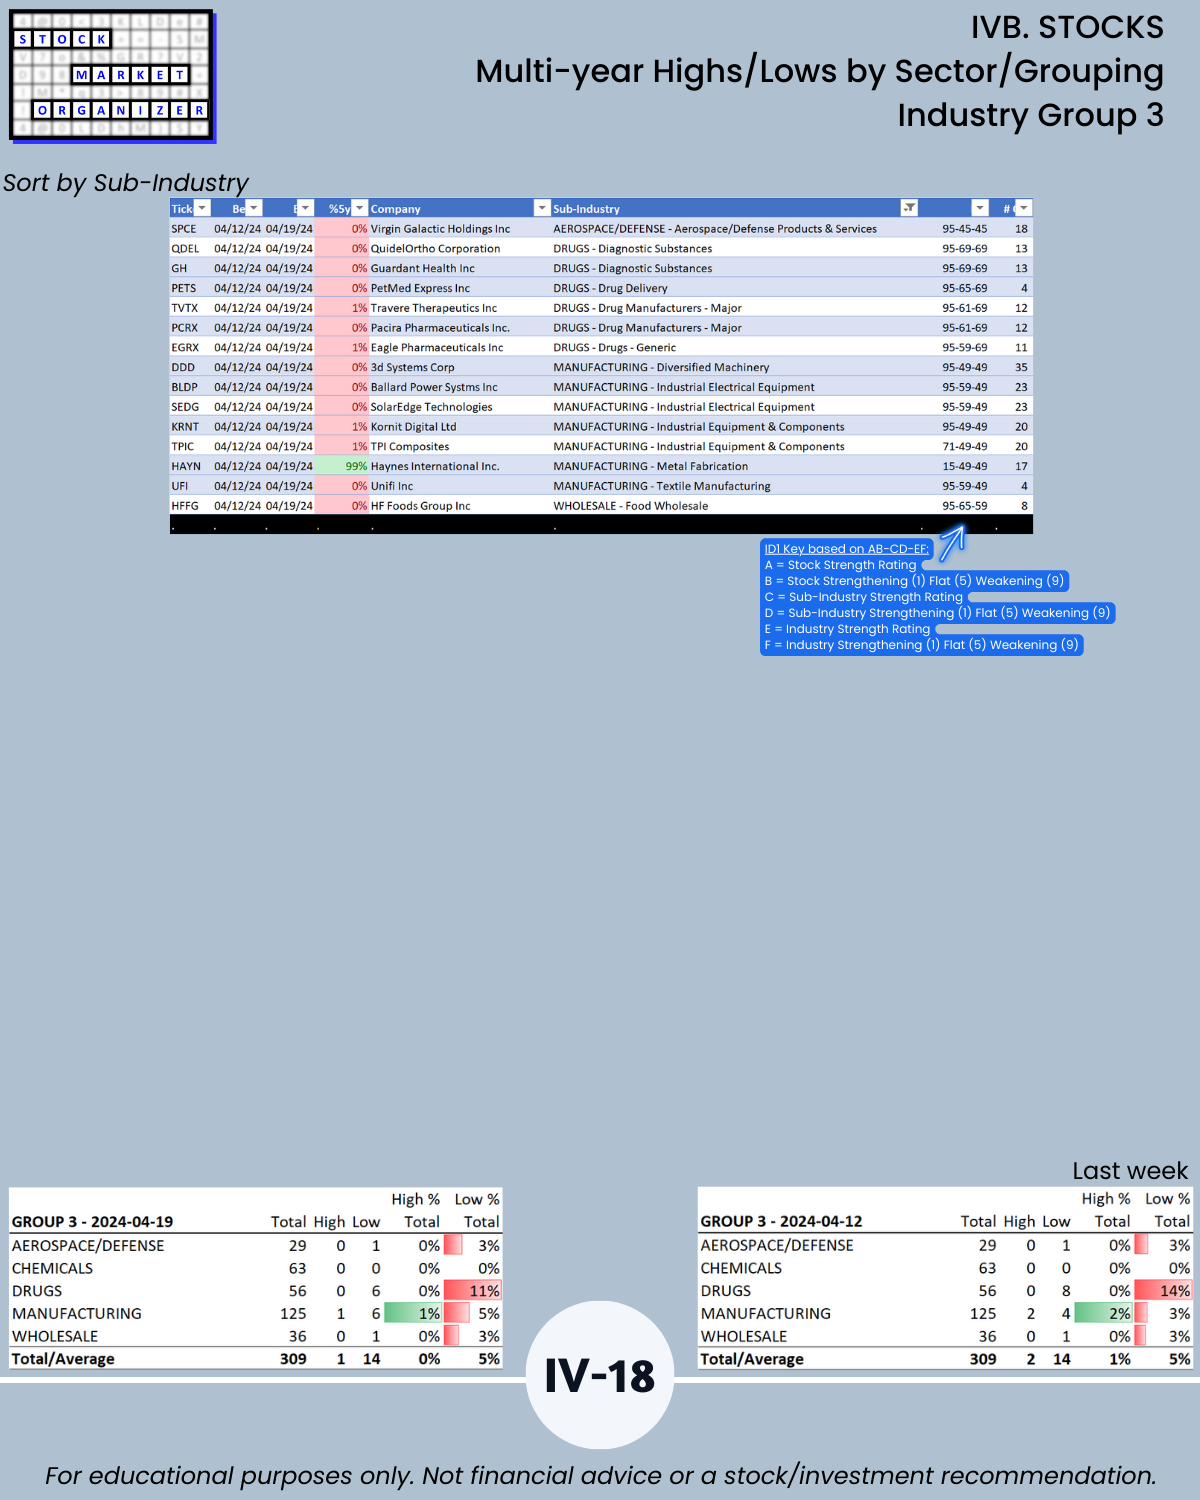
IVB. STOCKS Multi-Year Highs/Lows by Sector/Grouping
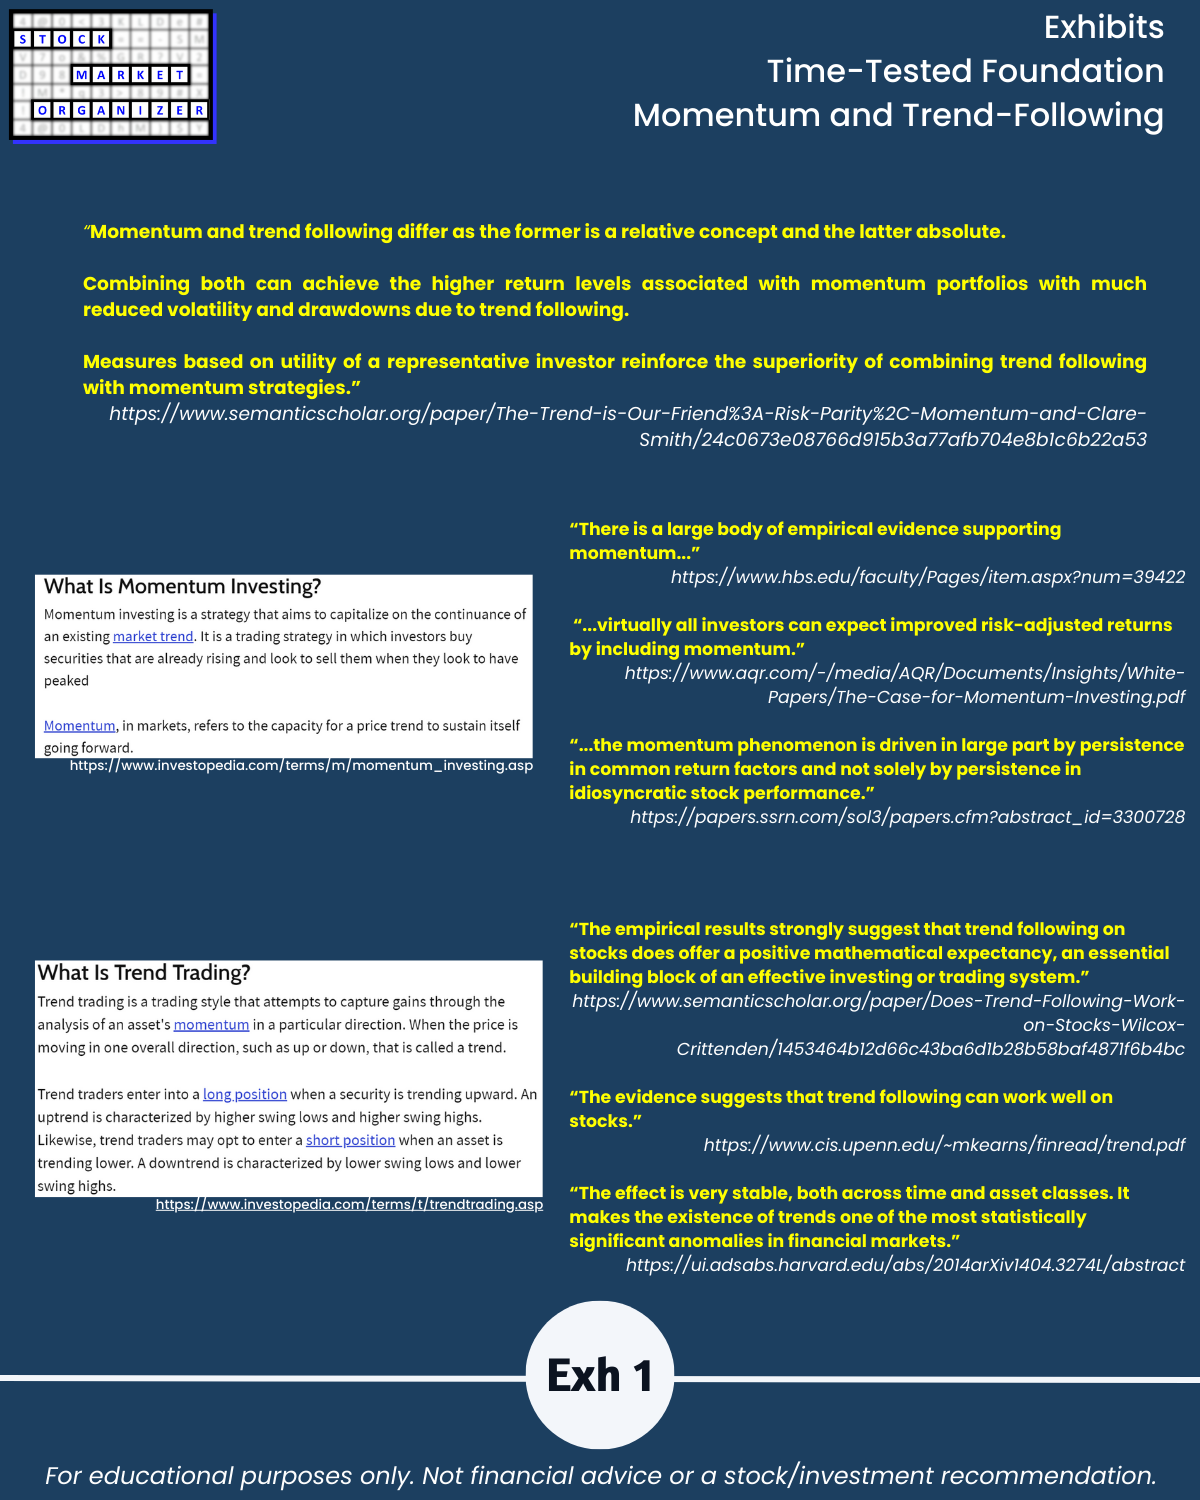
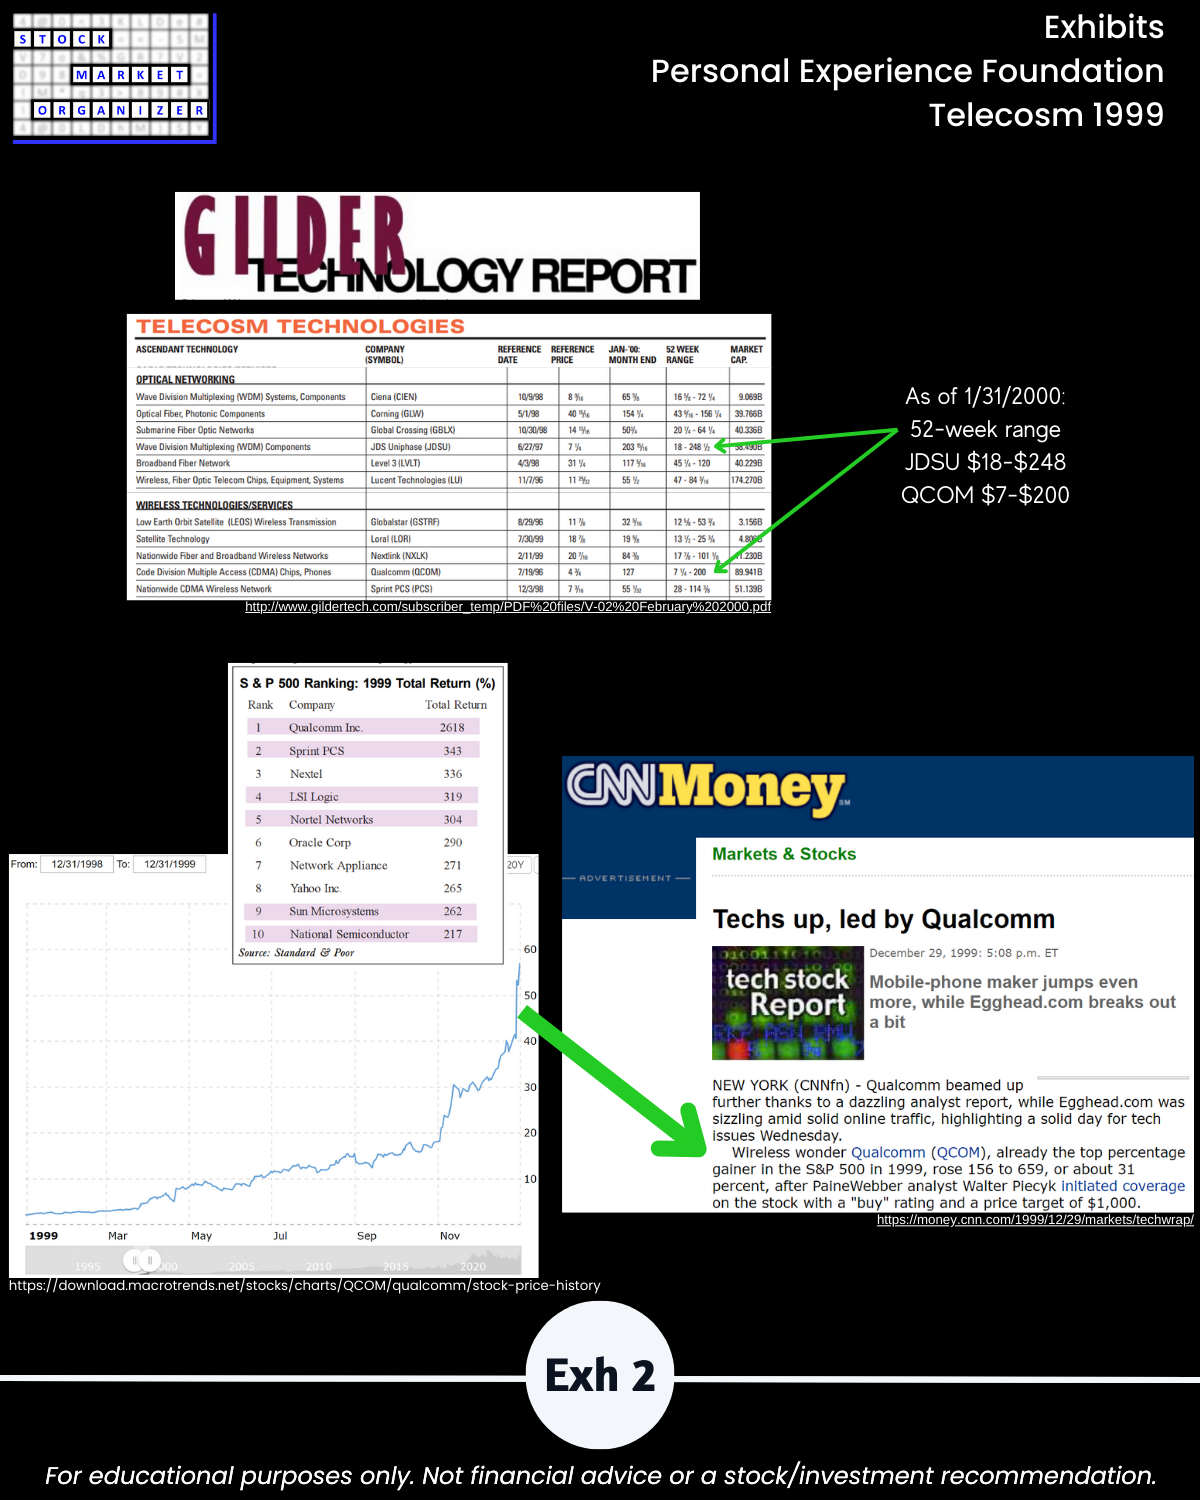
IV. EXHIBITS System Foundations