SMO Exclusive: U.S. Stock Market Strength Report 2024-04-12 (no new Longs)

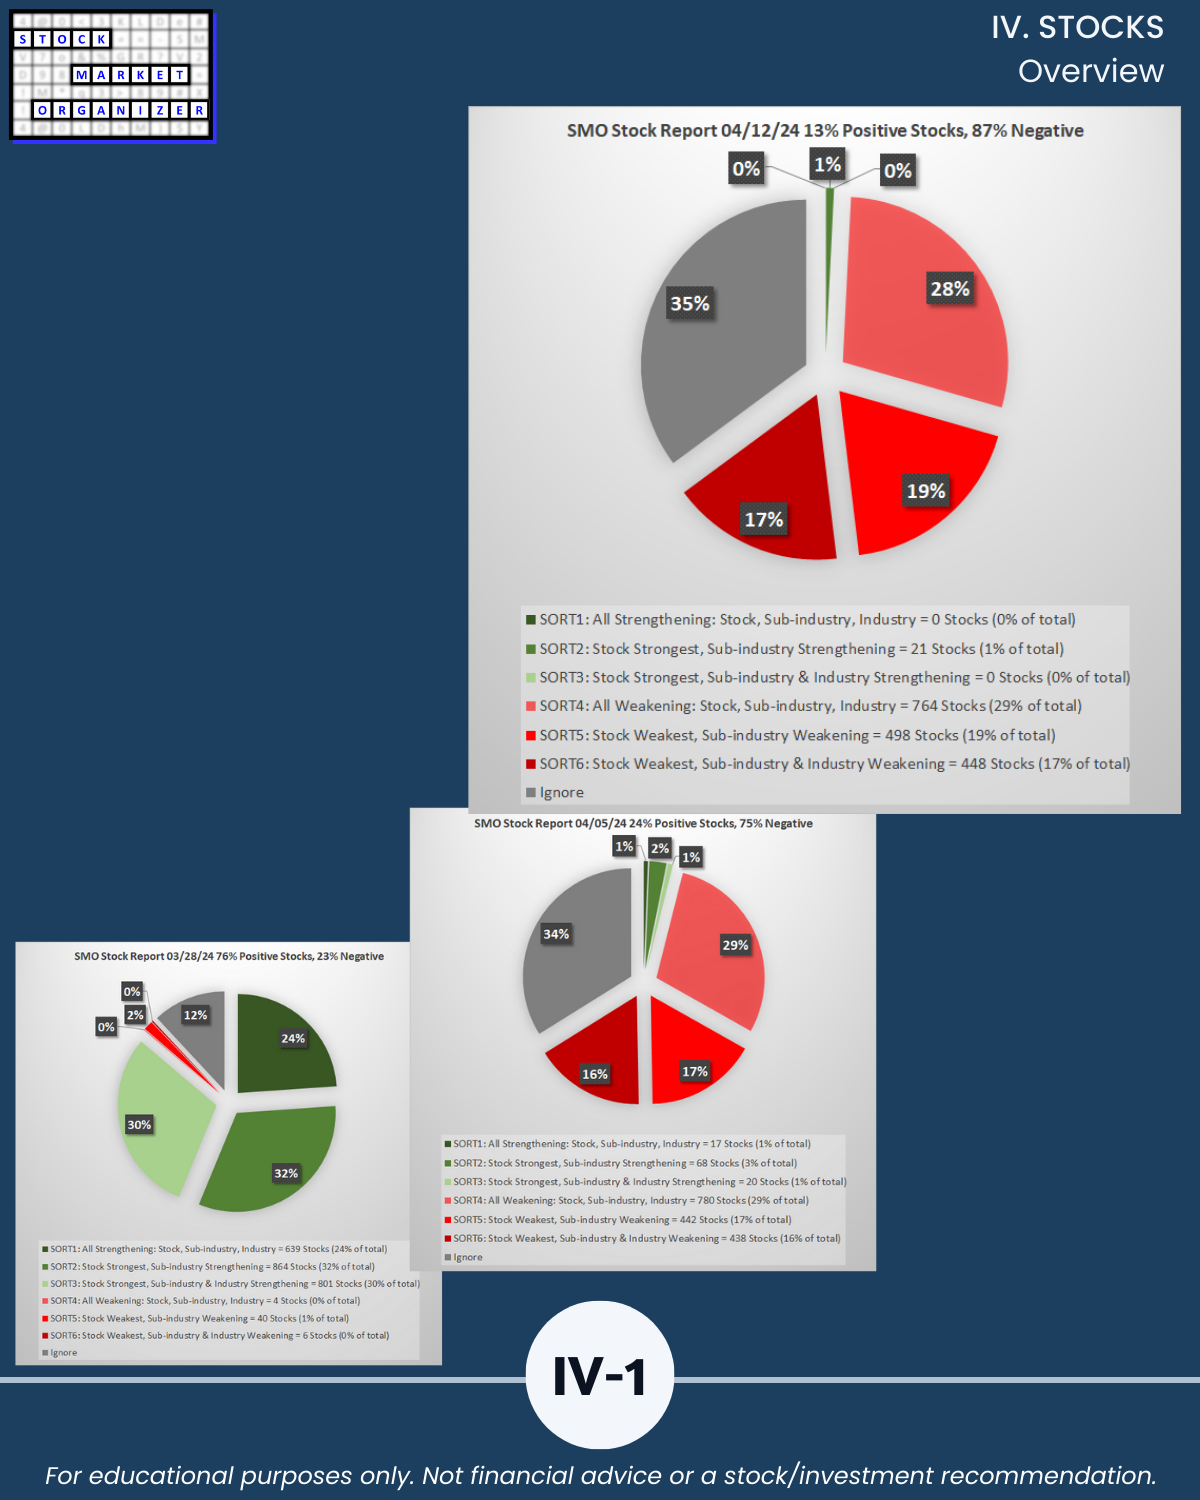
Attached: your cure for 4/12/24 U.S. stock market confusion. Whether retail or institutional, a participant or an advisor, this original and unique strength-focused, top-down, bottom-up, and inside-out perspective can complement your views no matter what they are. BOTTOM LINE – A SECOND WEEK OF BROAD WEAKENING. By the numbers: 🔹 29 industries: 27 weakened (vs. 26 last week), 🔹 198 sub-industries: 74% (vs. 68% last week) weakened, only 5% strengthened 🔹 2,669 stocks: 87% negative (vs. 78% last week).
For more in the attached:
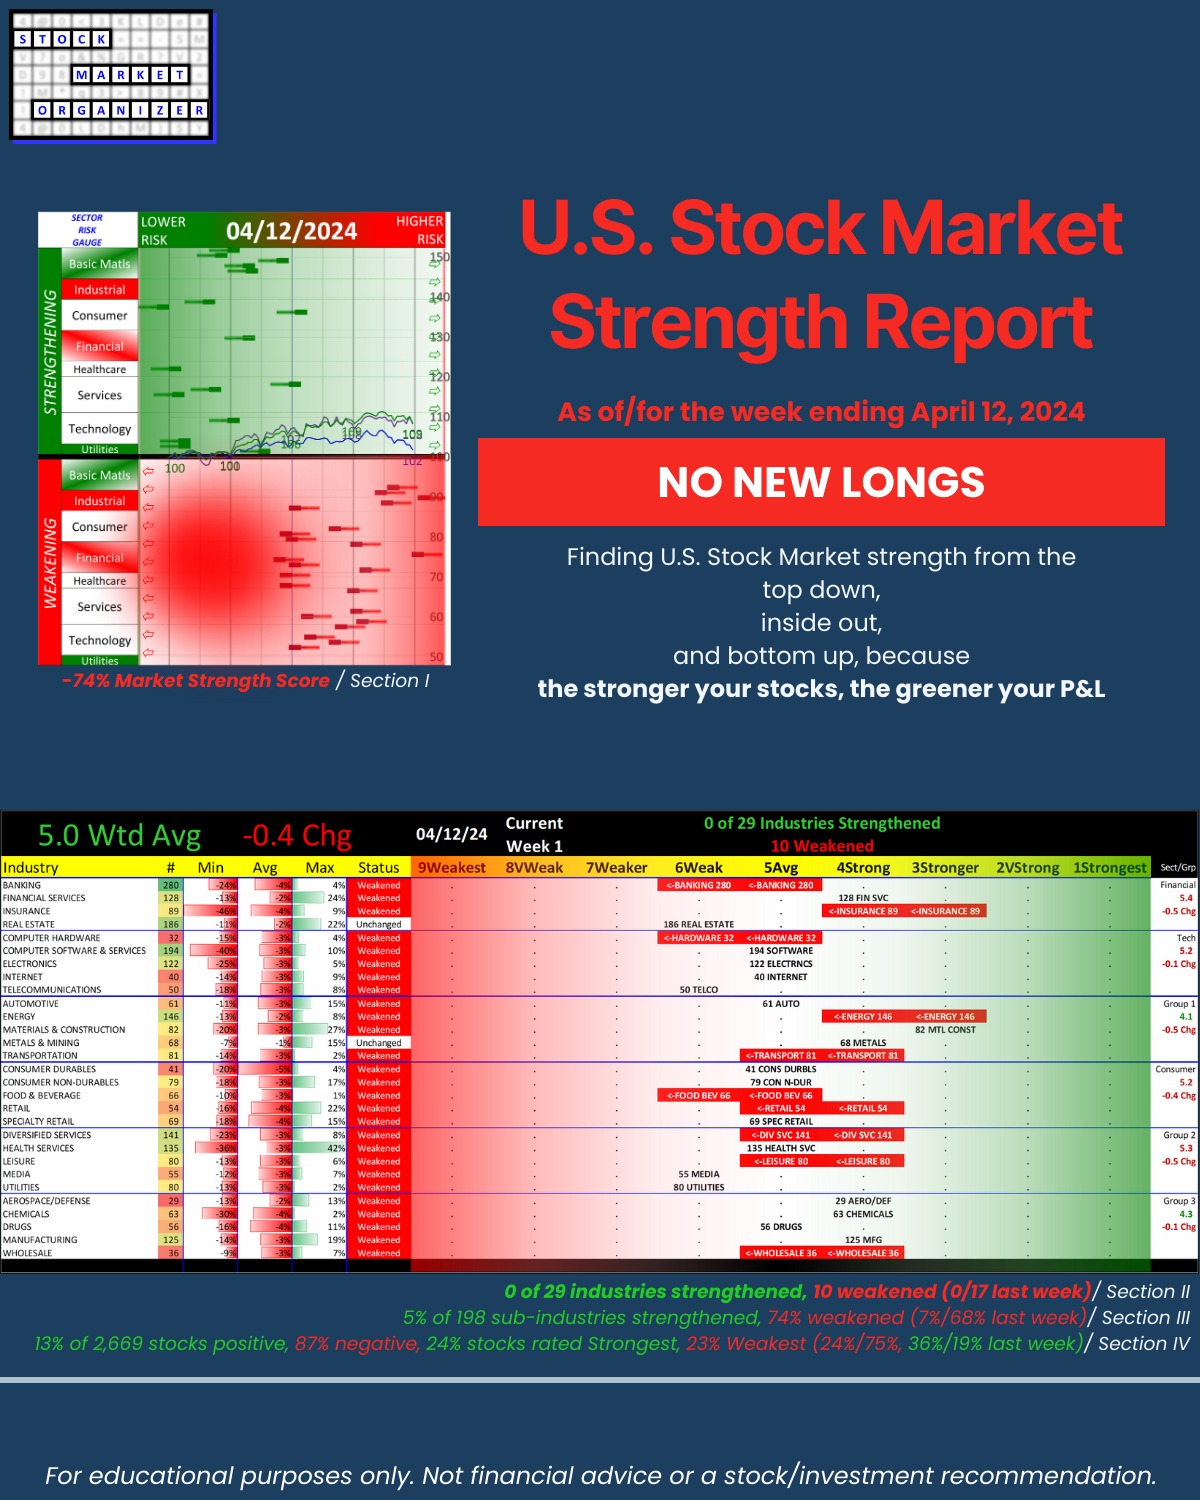
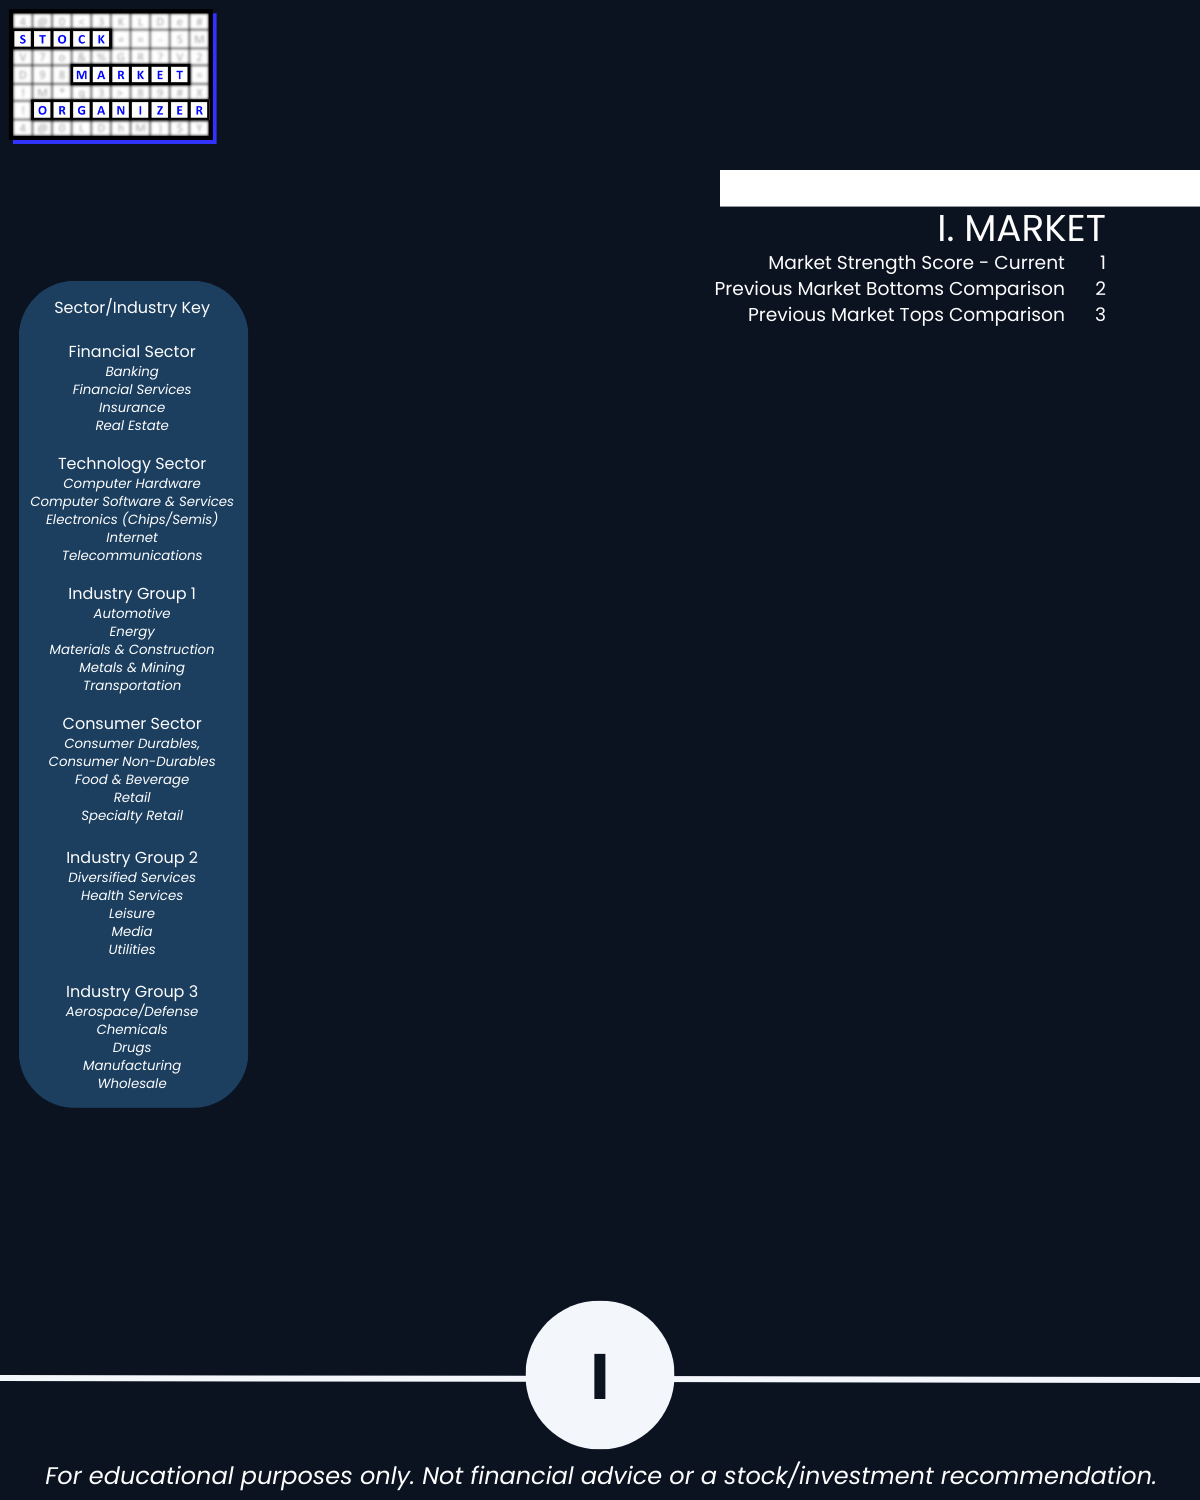
Market: Section I
Industries: Section II
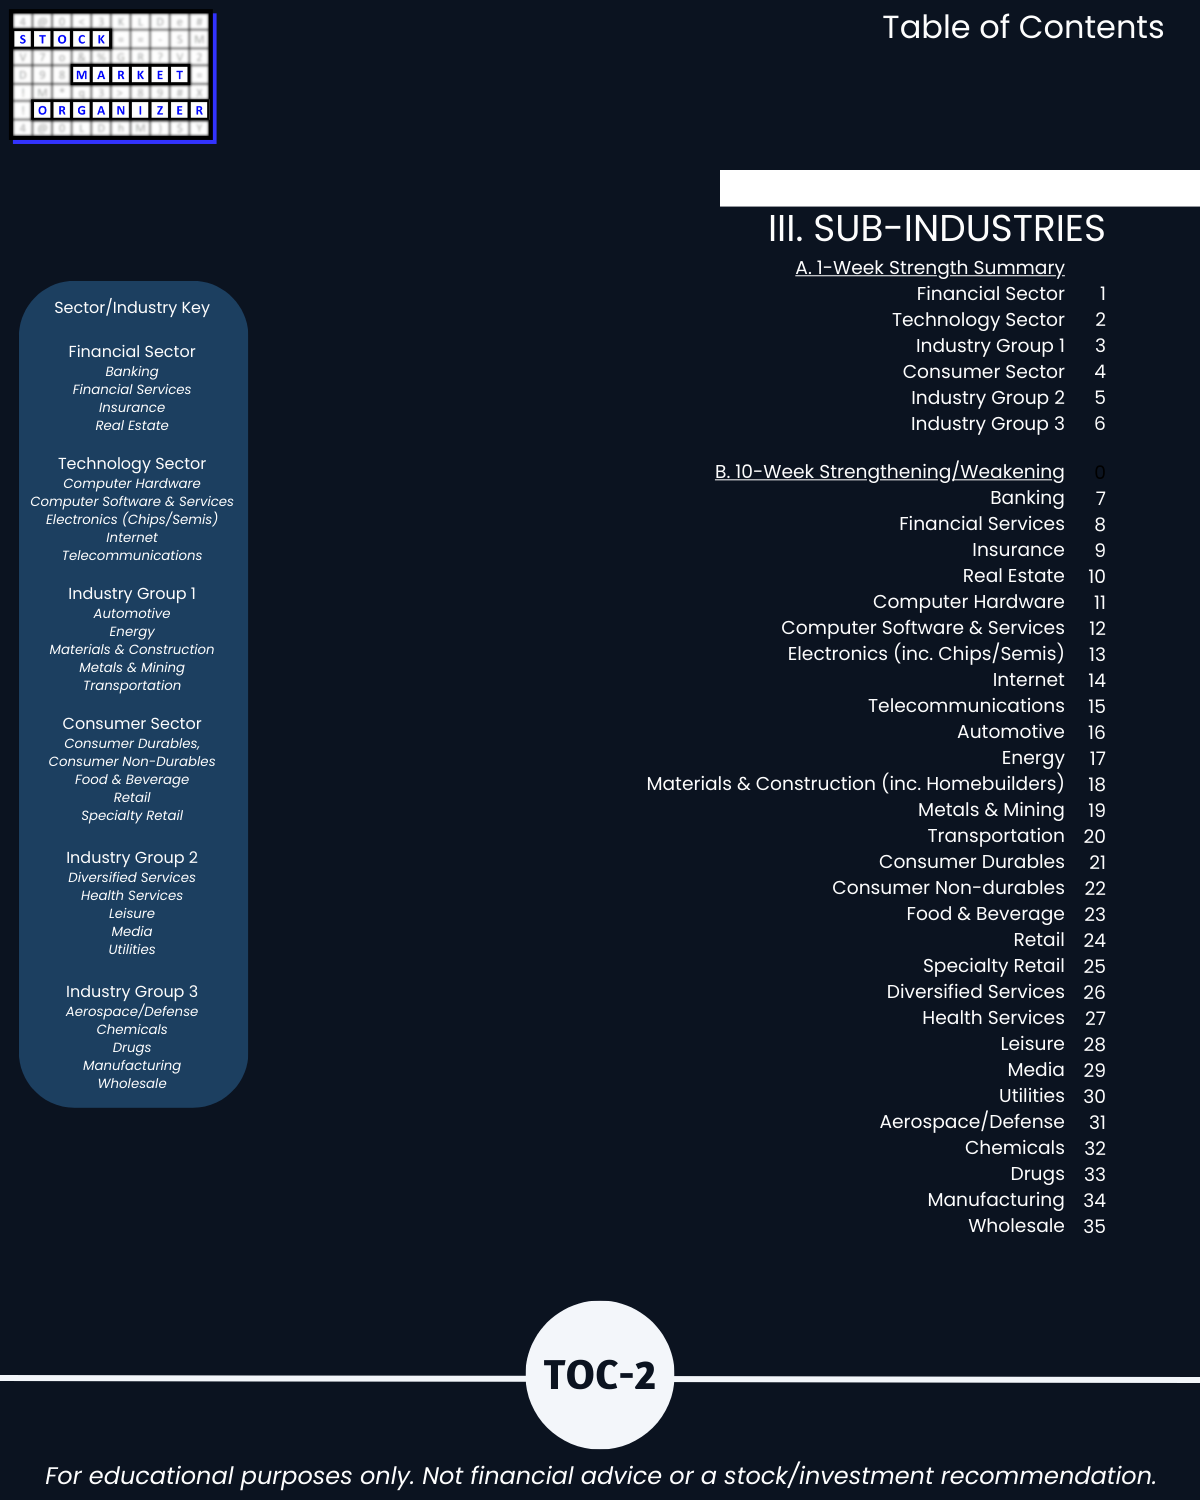
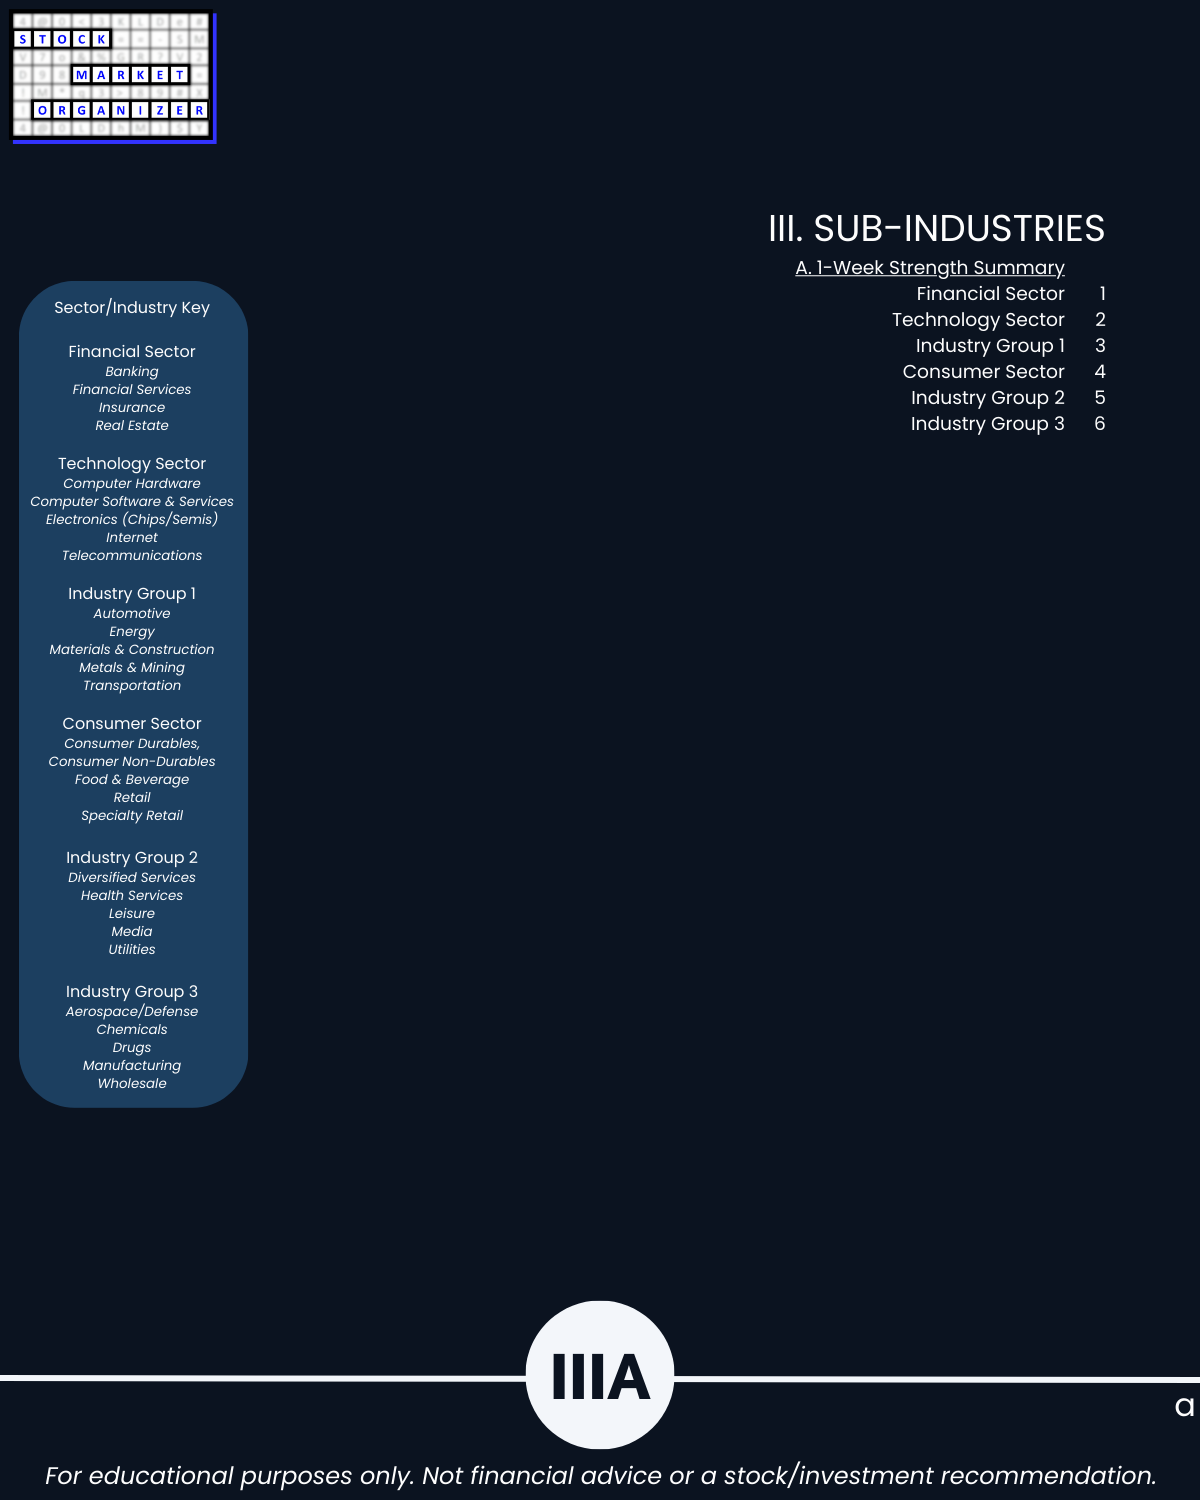
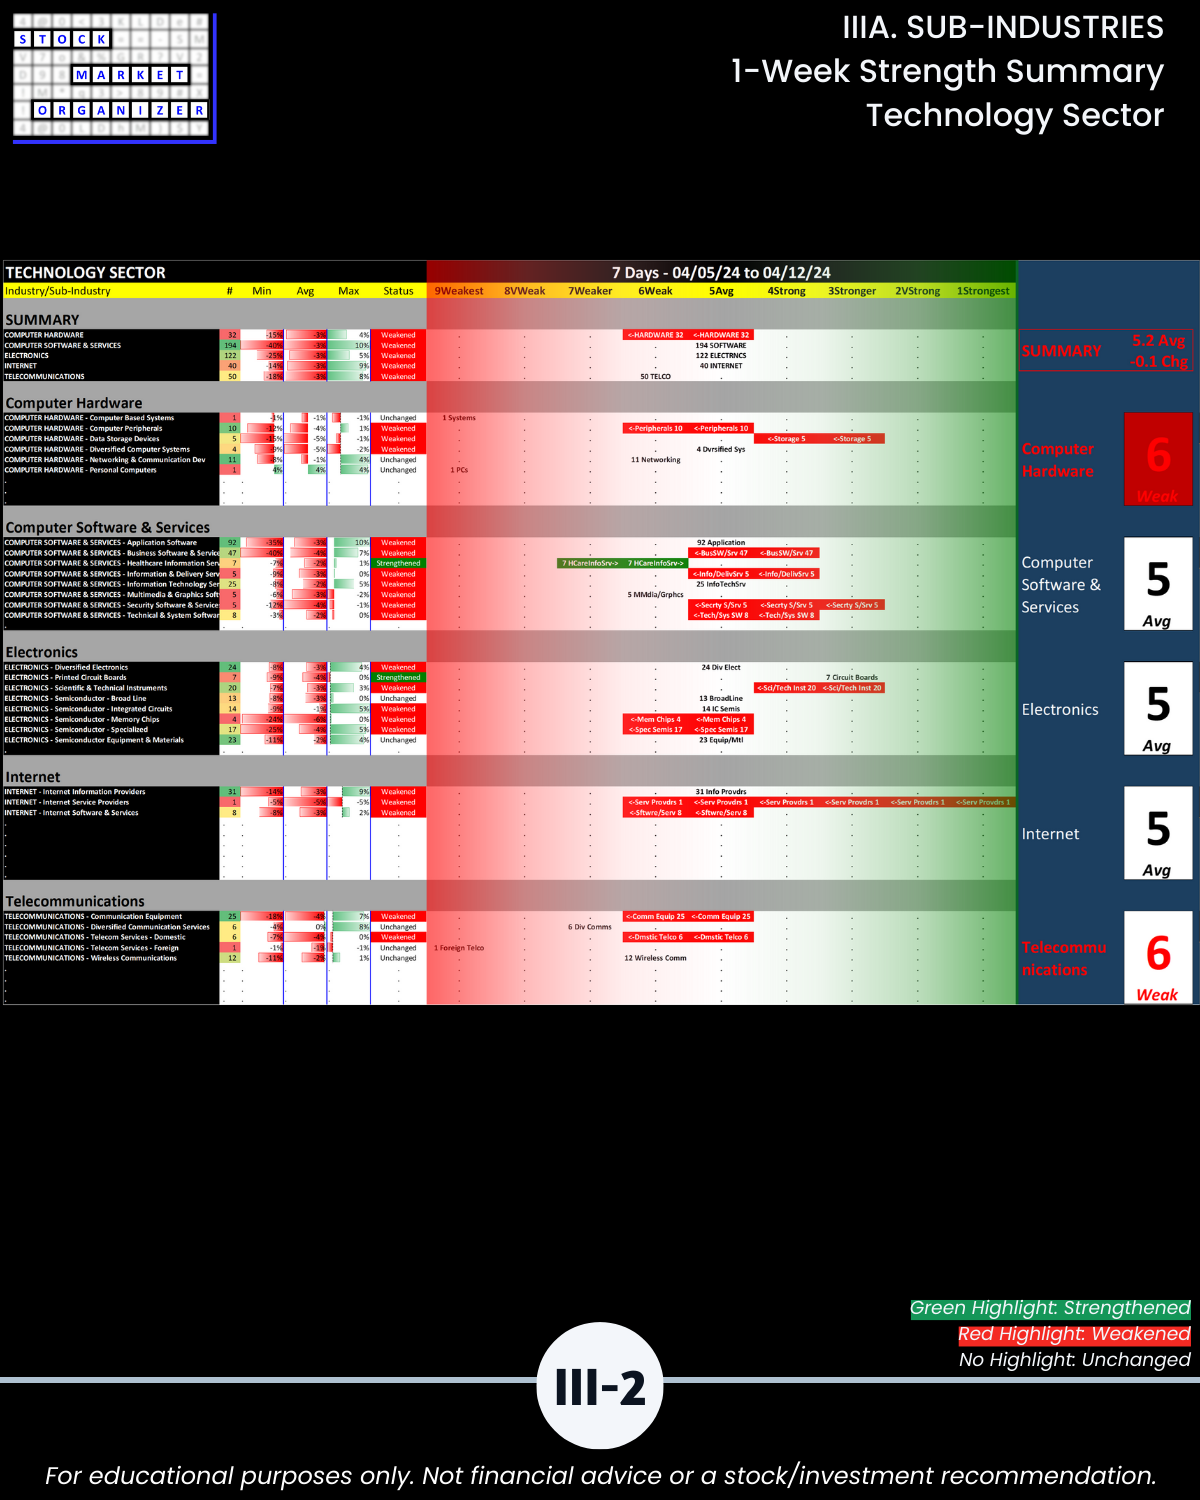
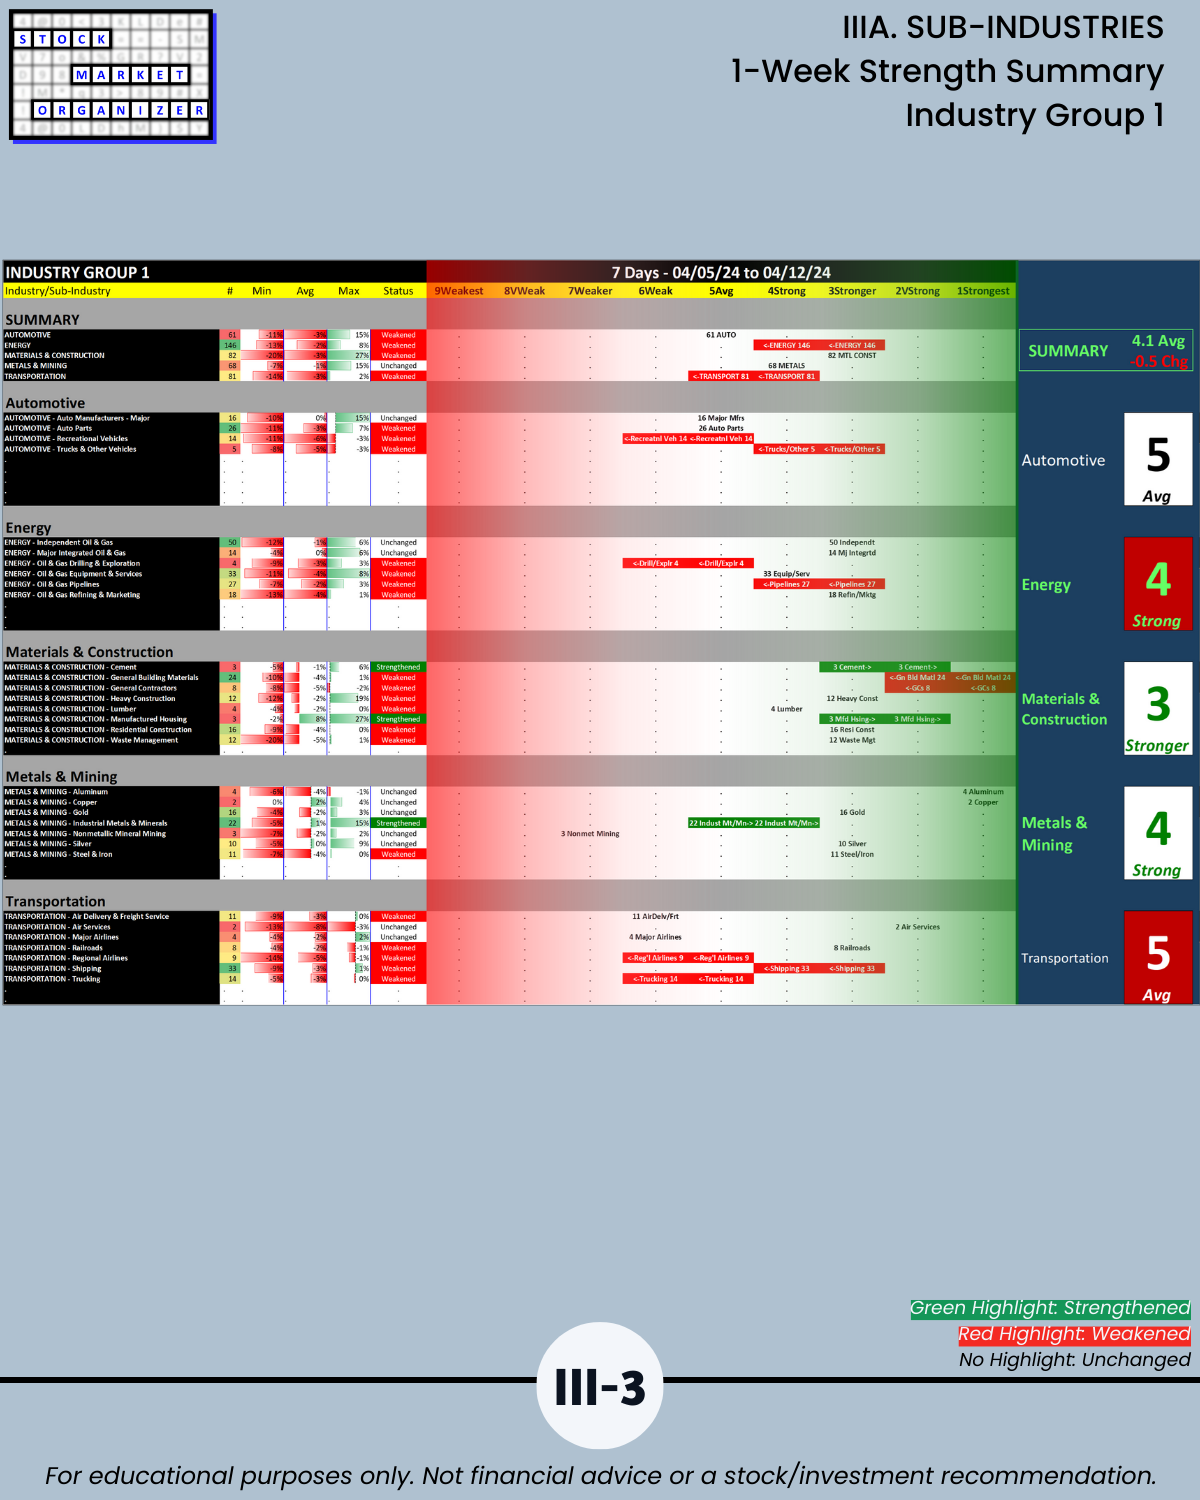
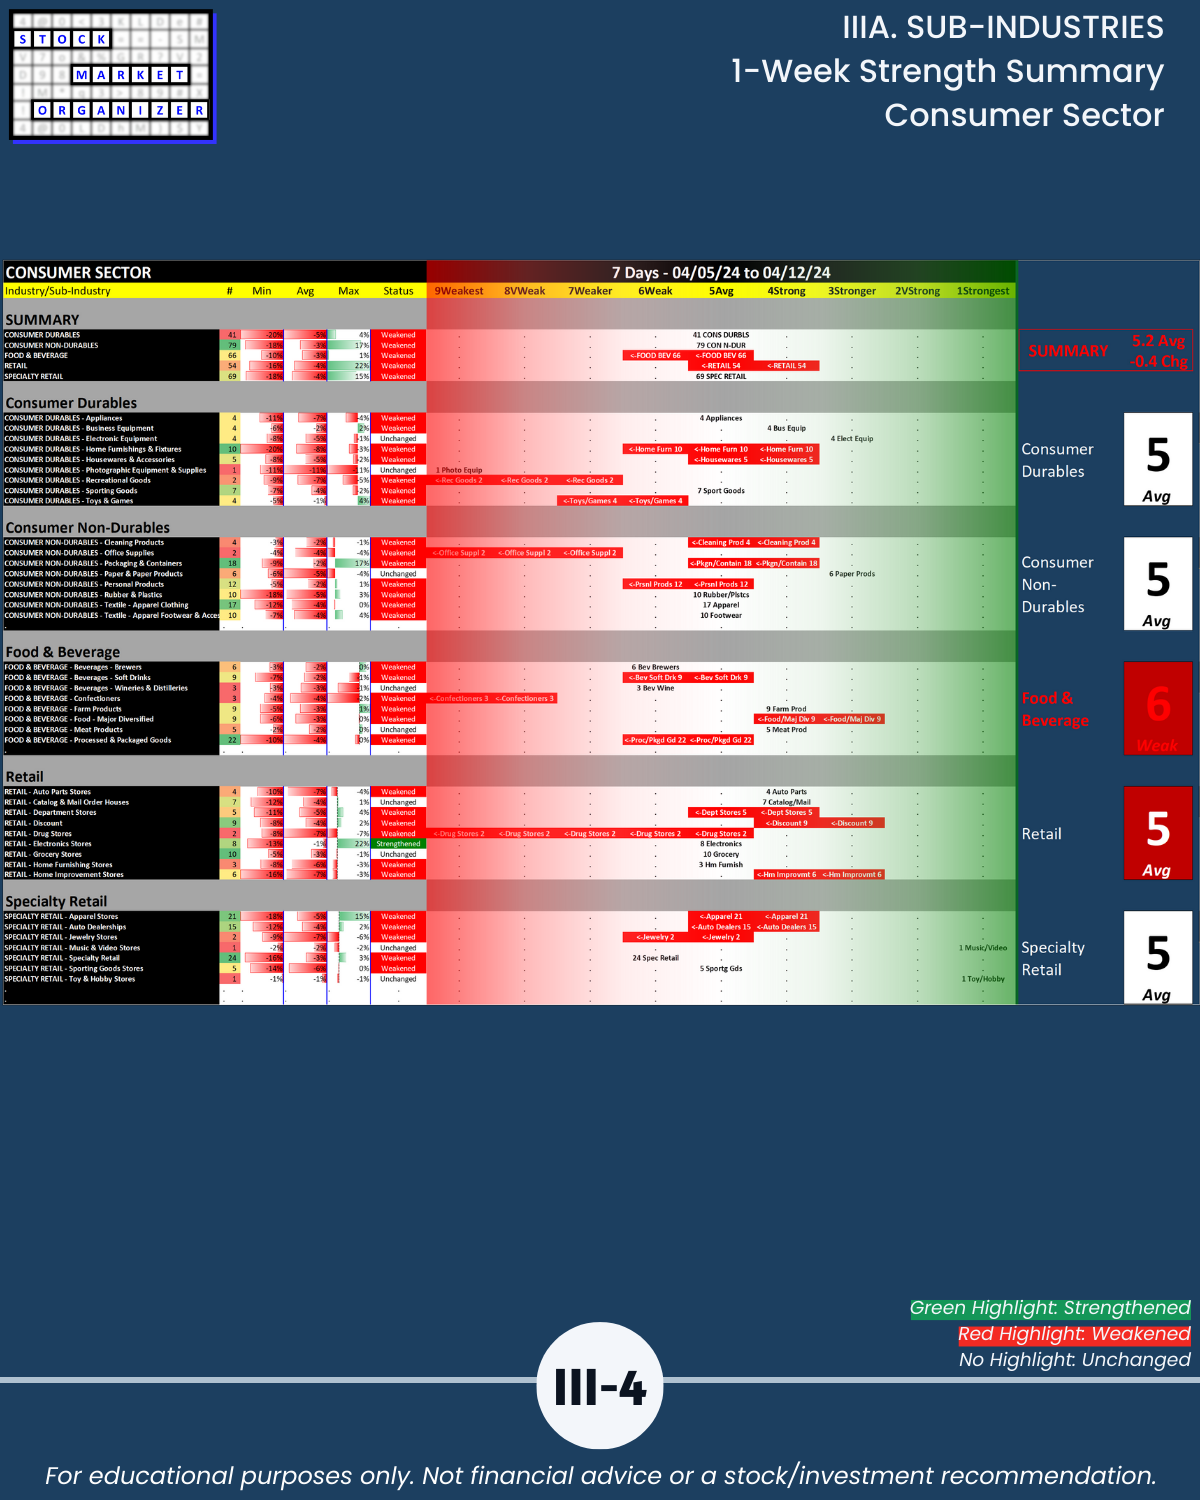
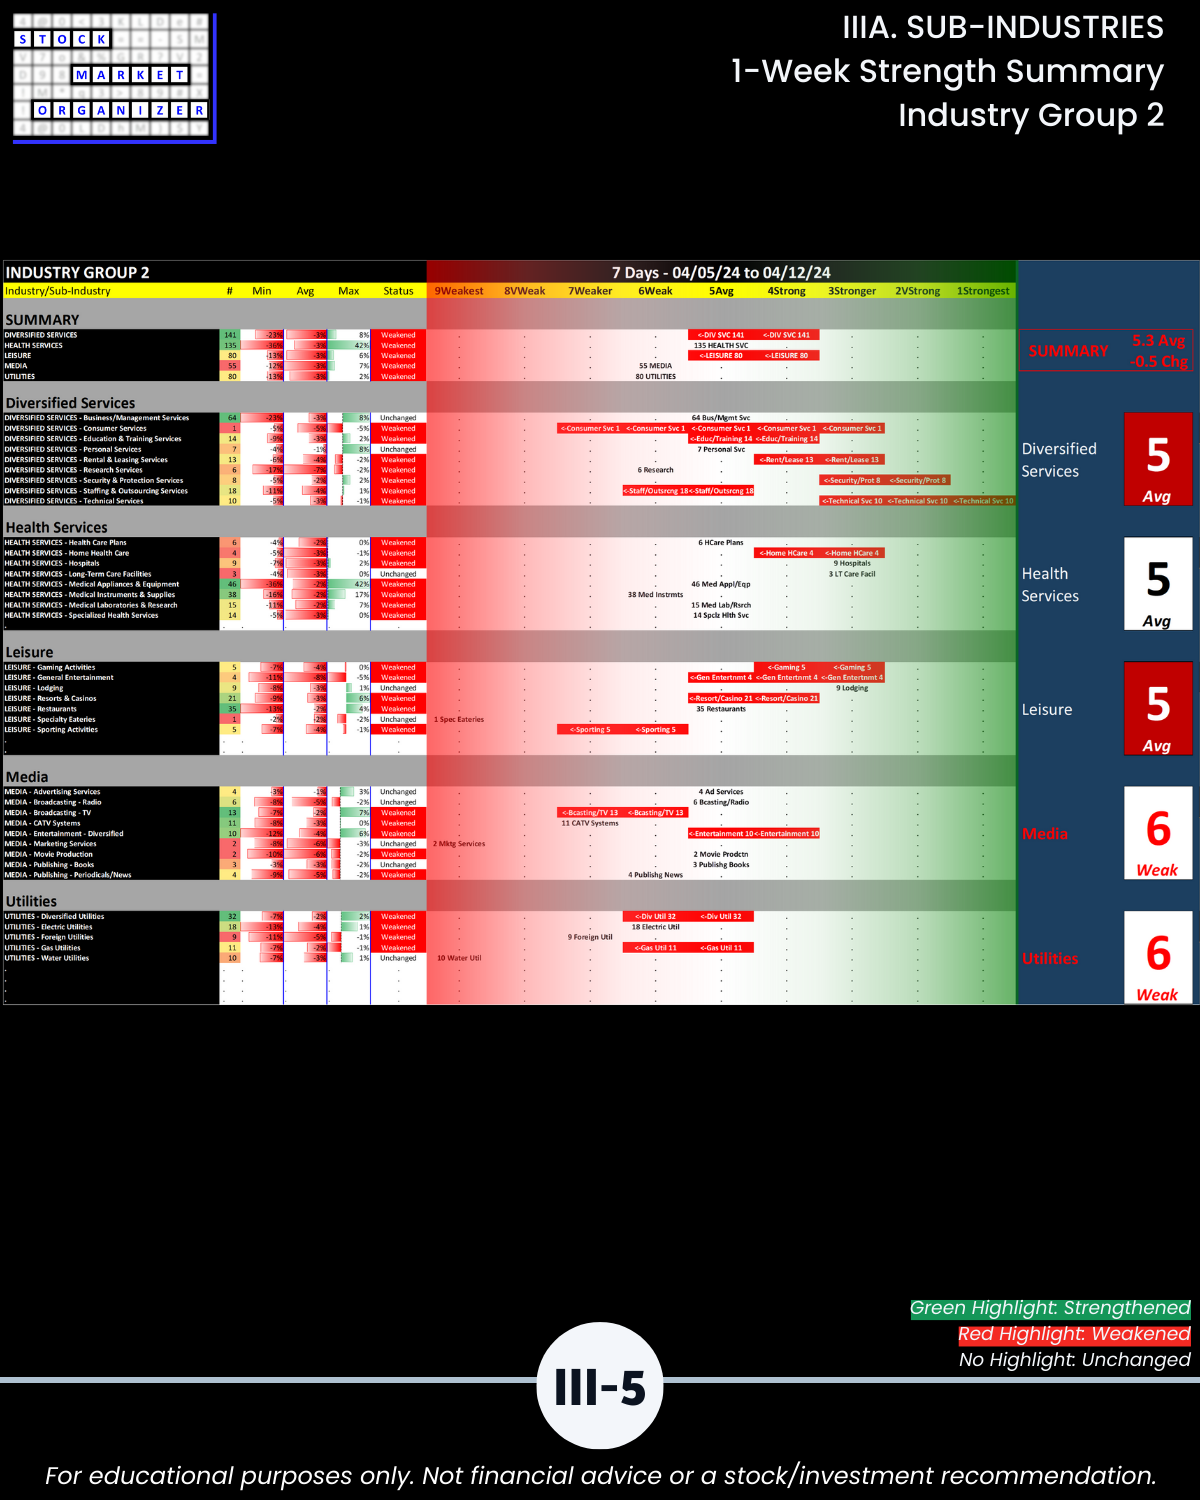
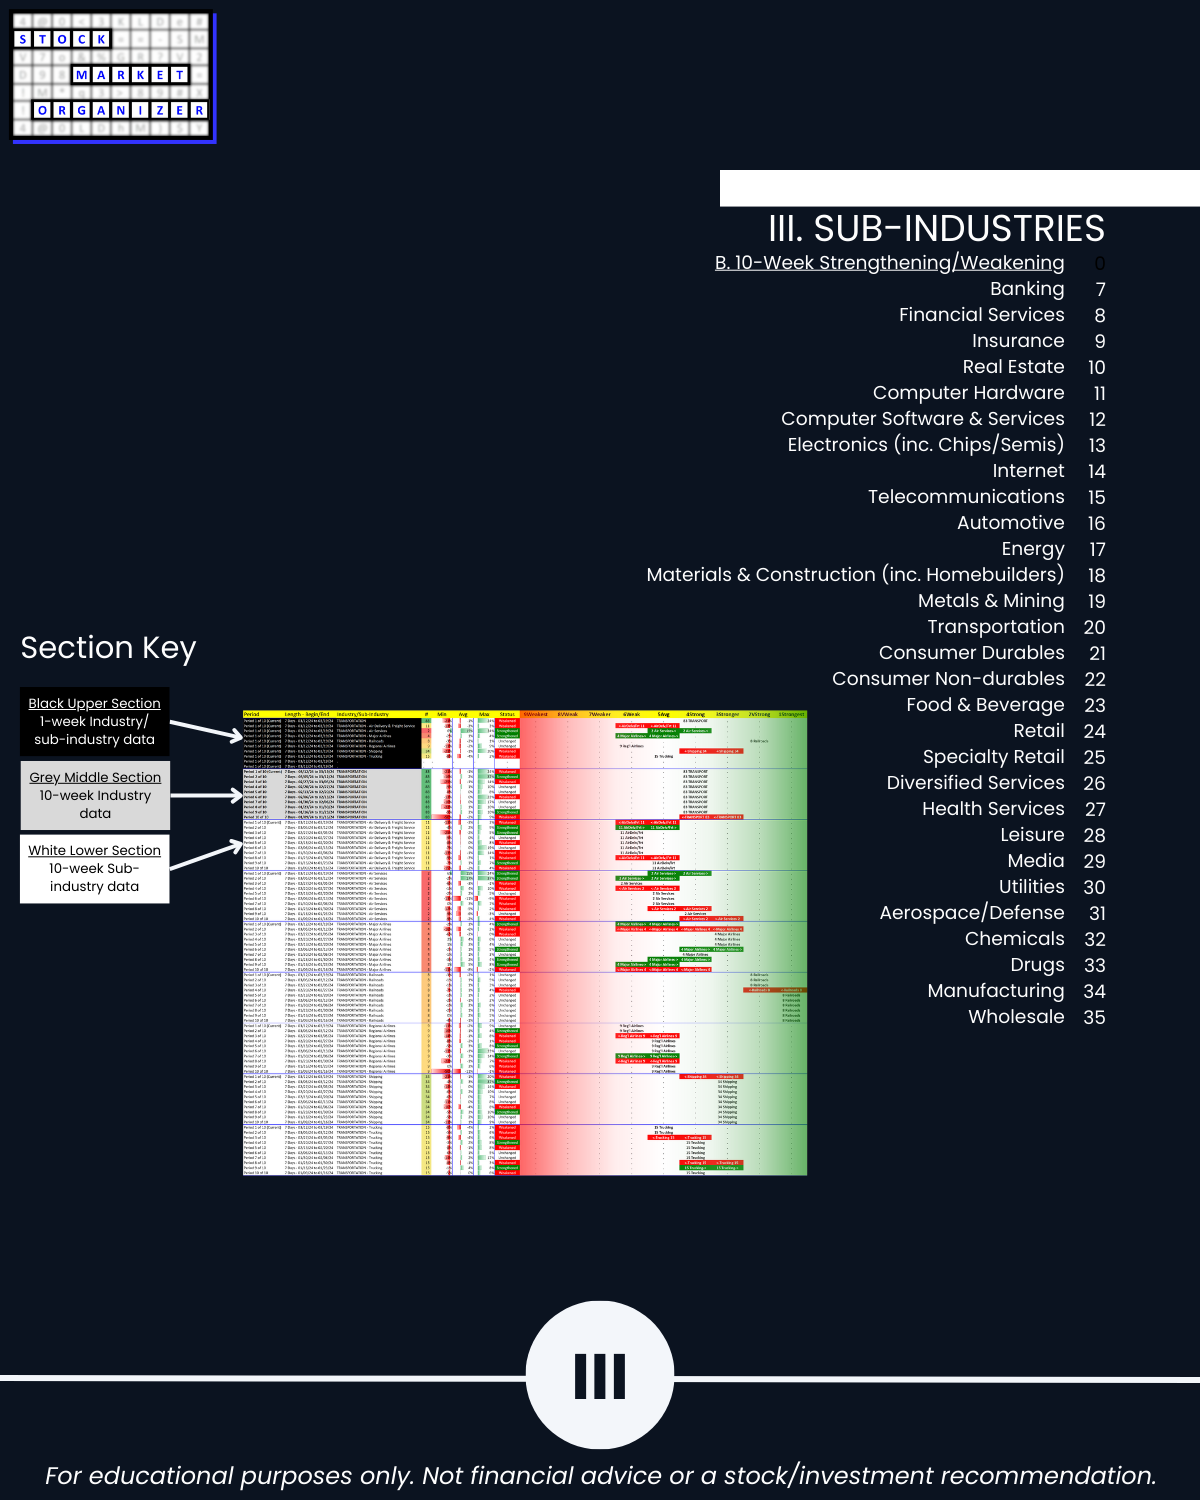
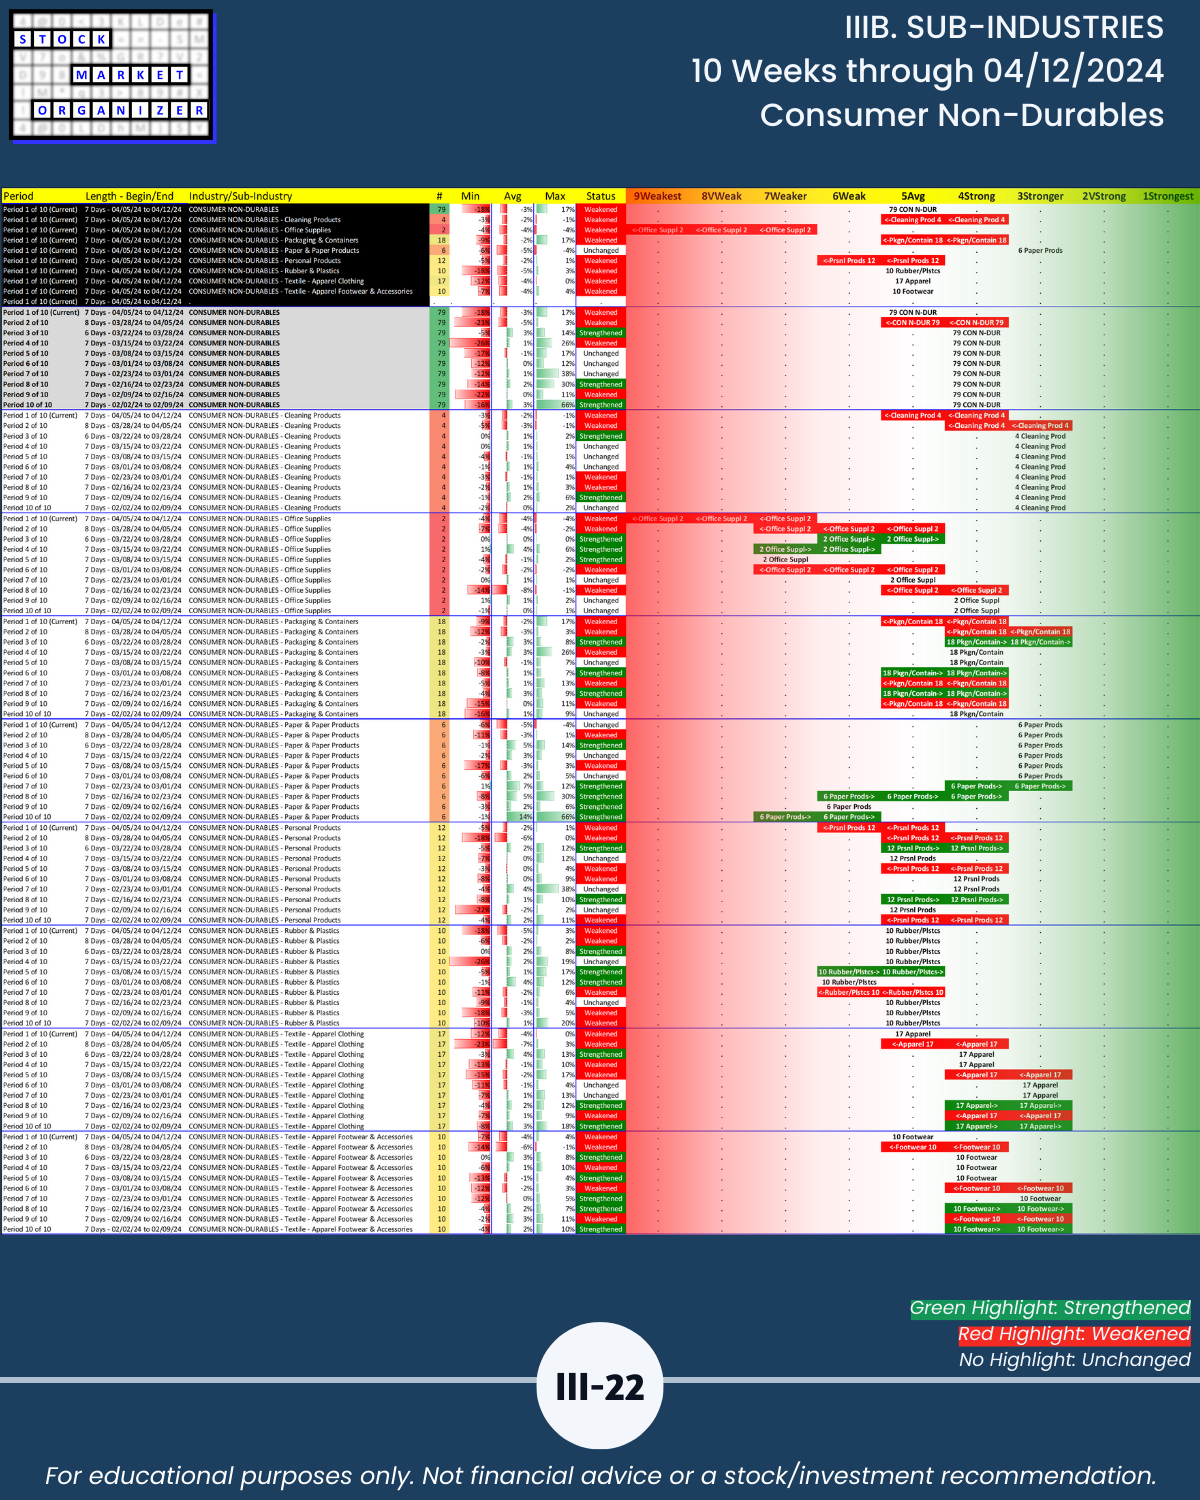
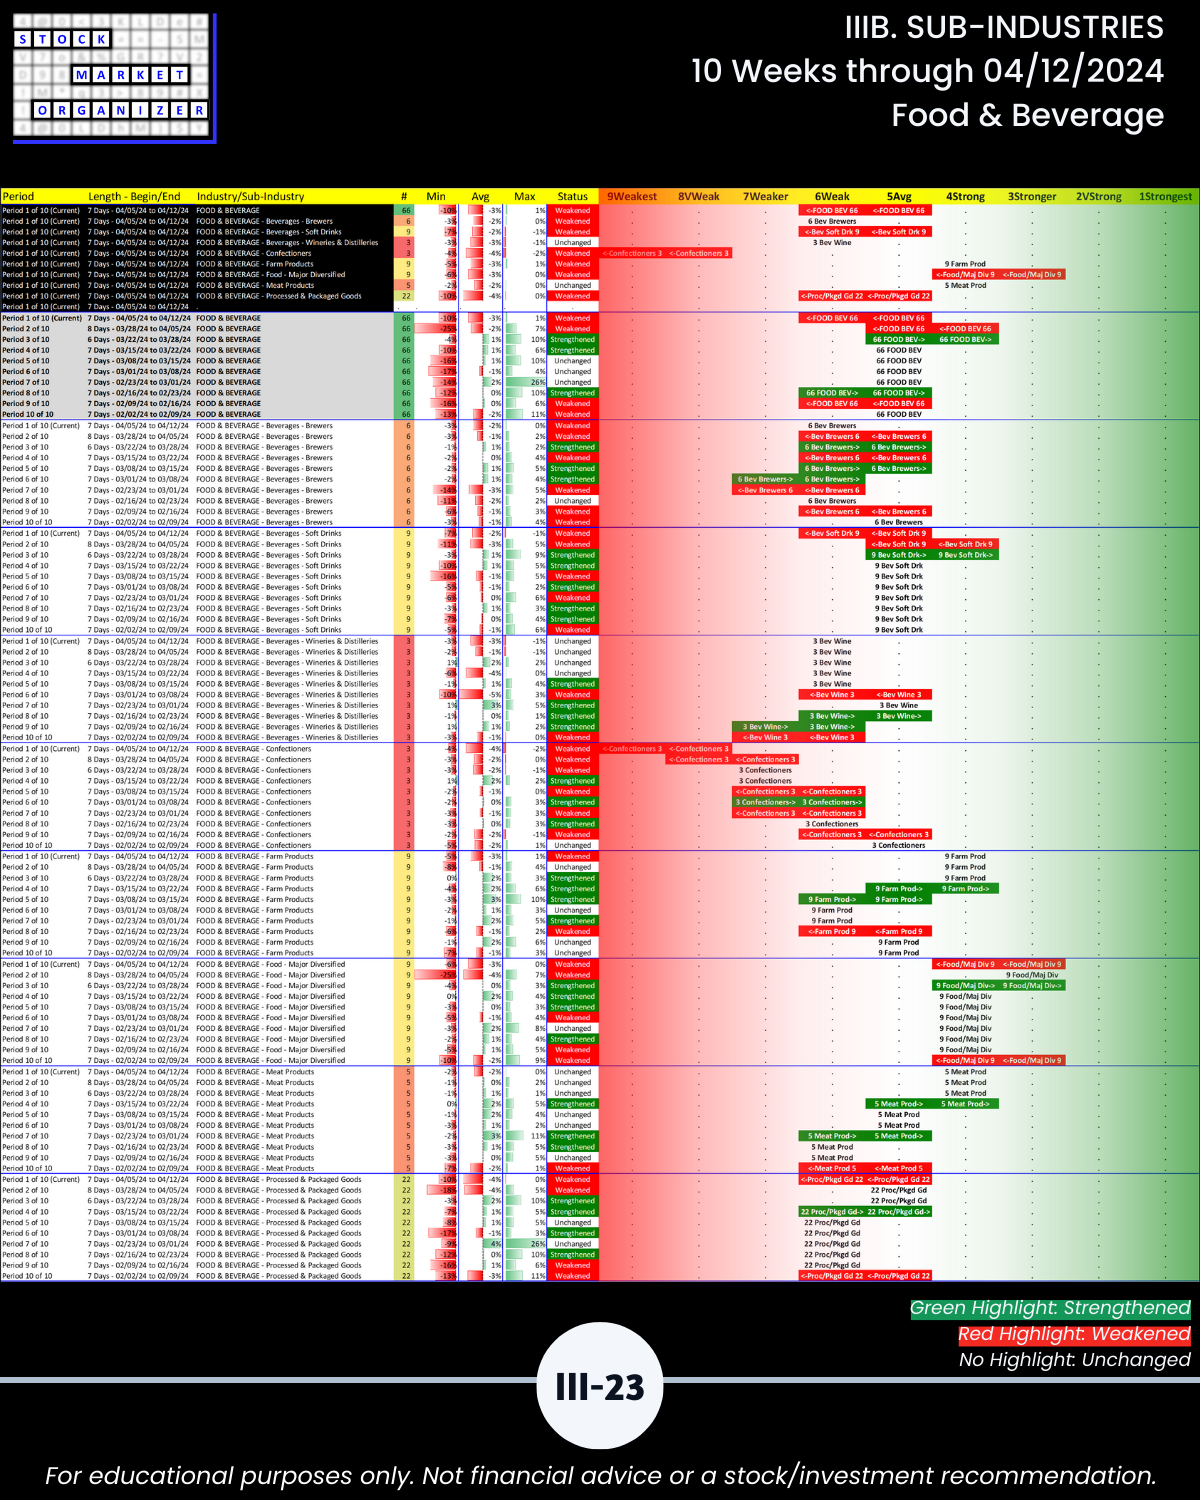
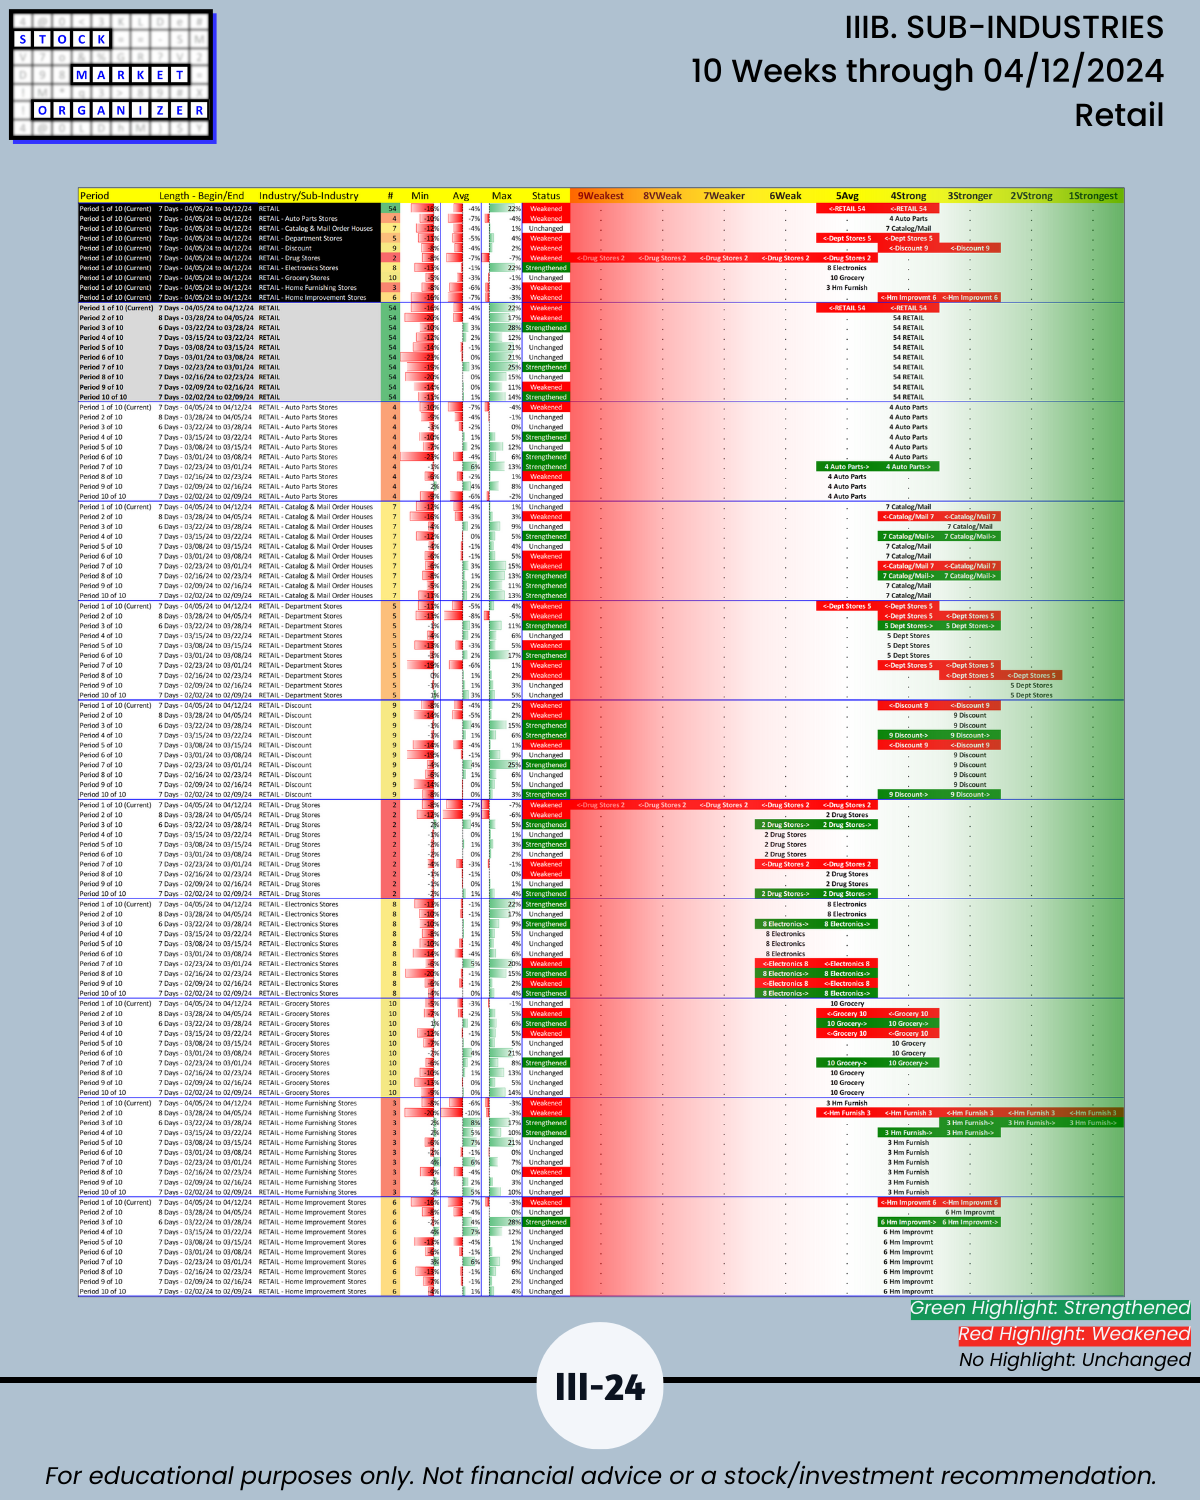
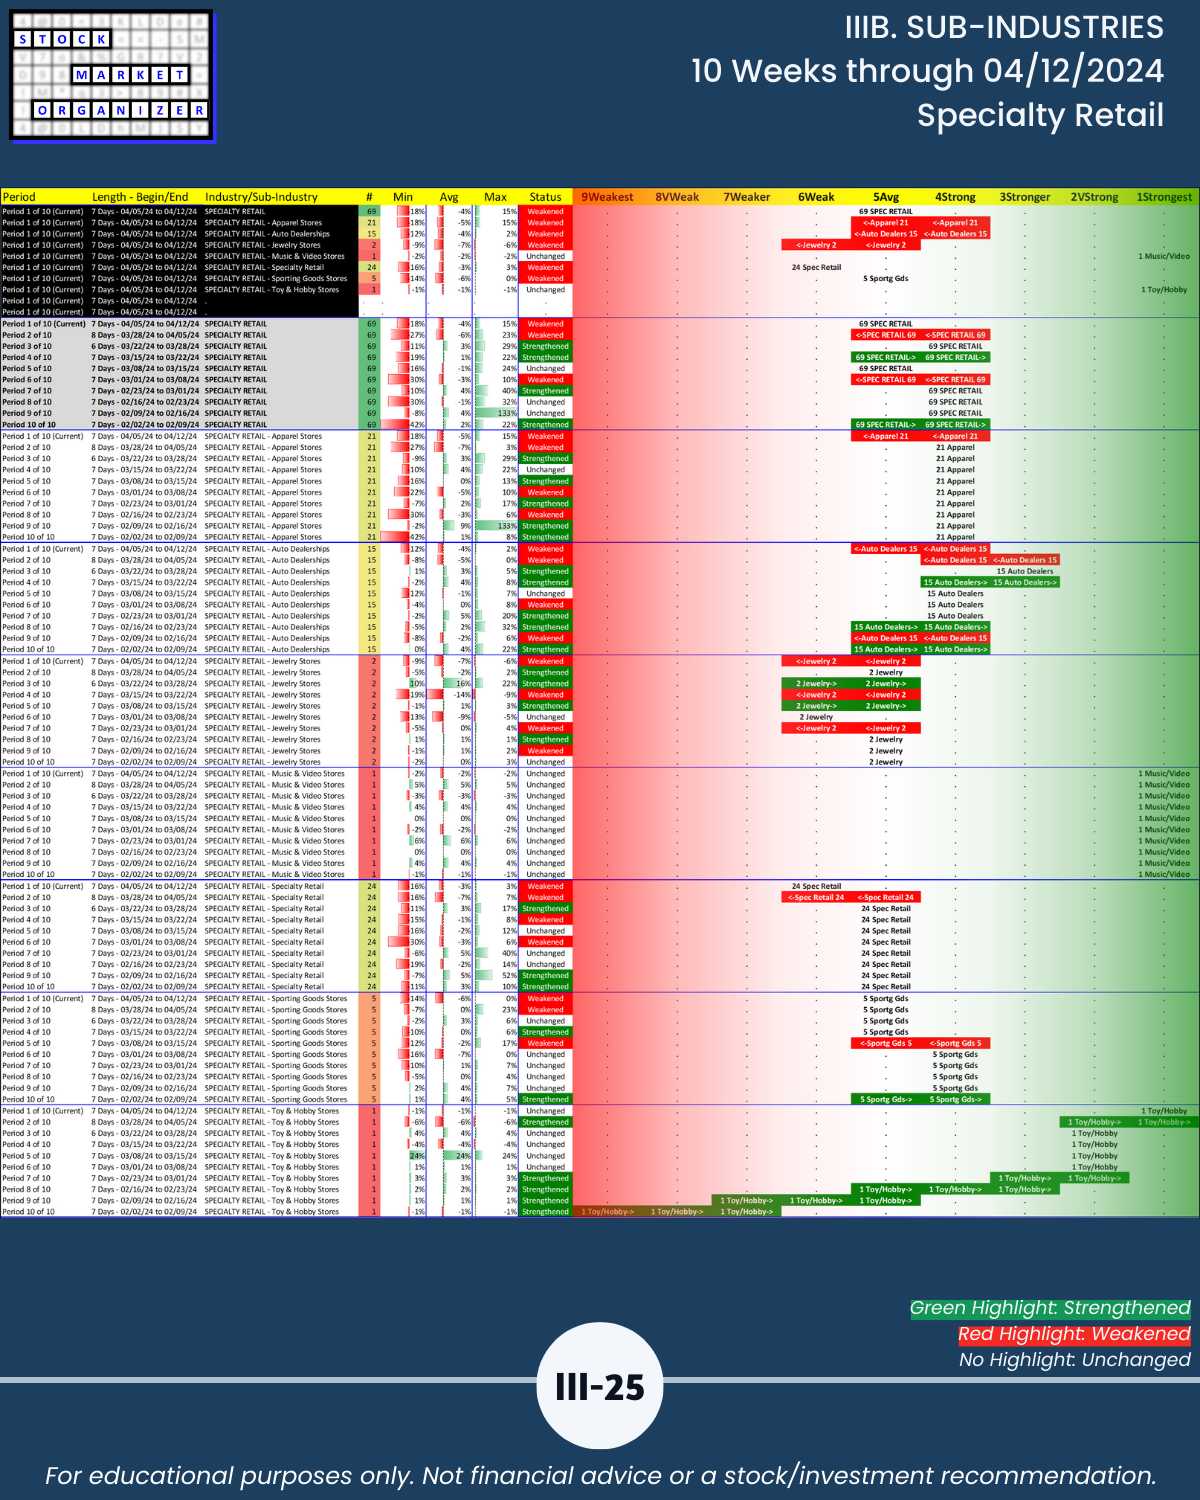
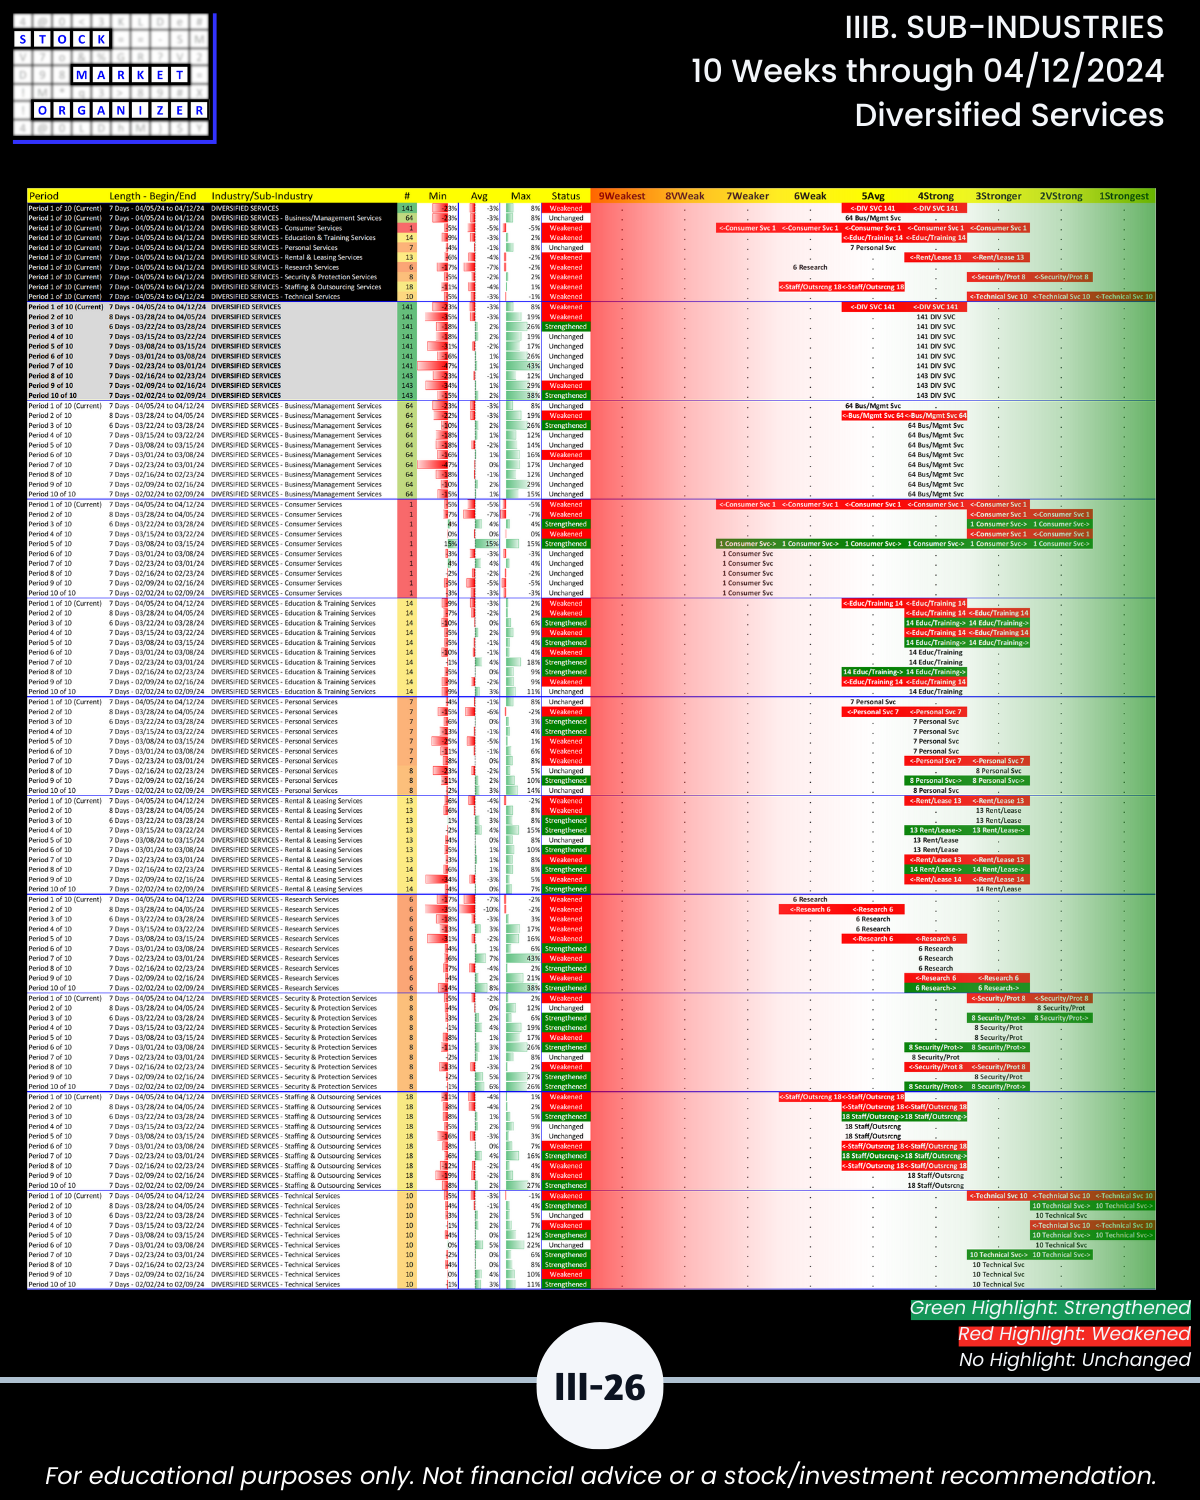
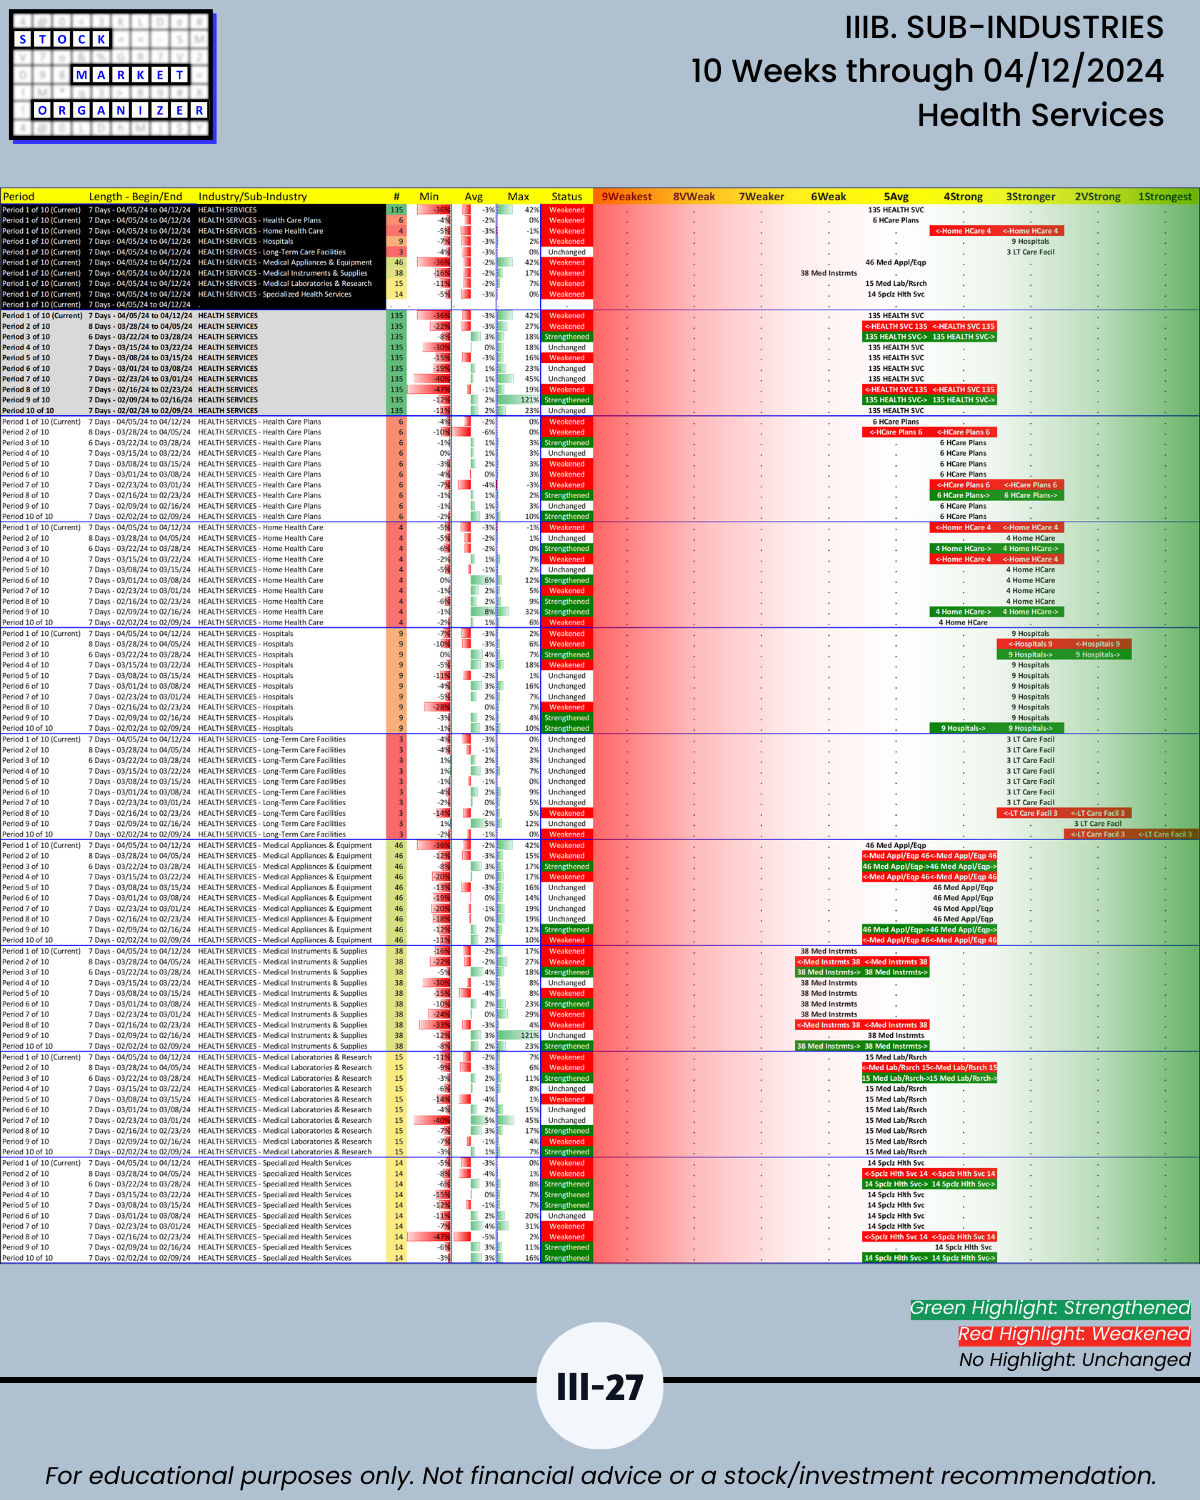
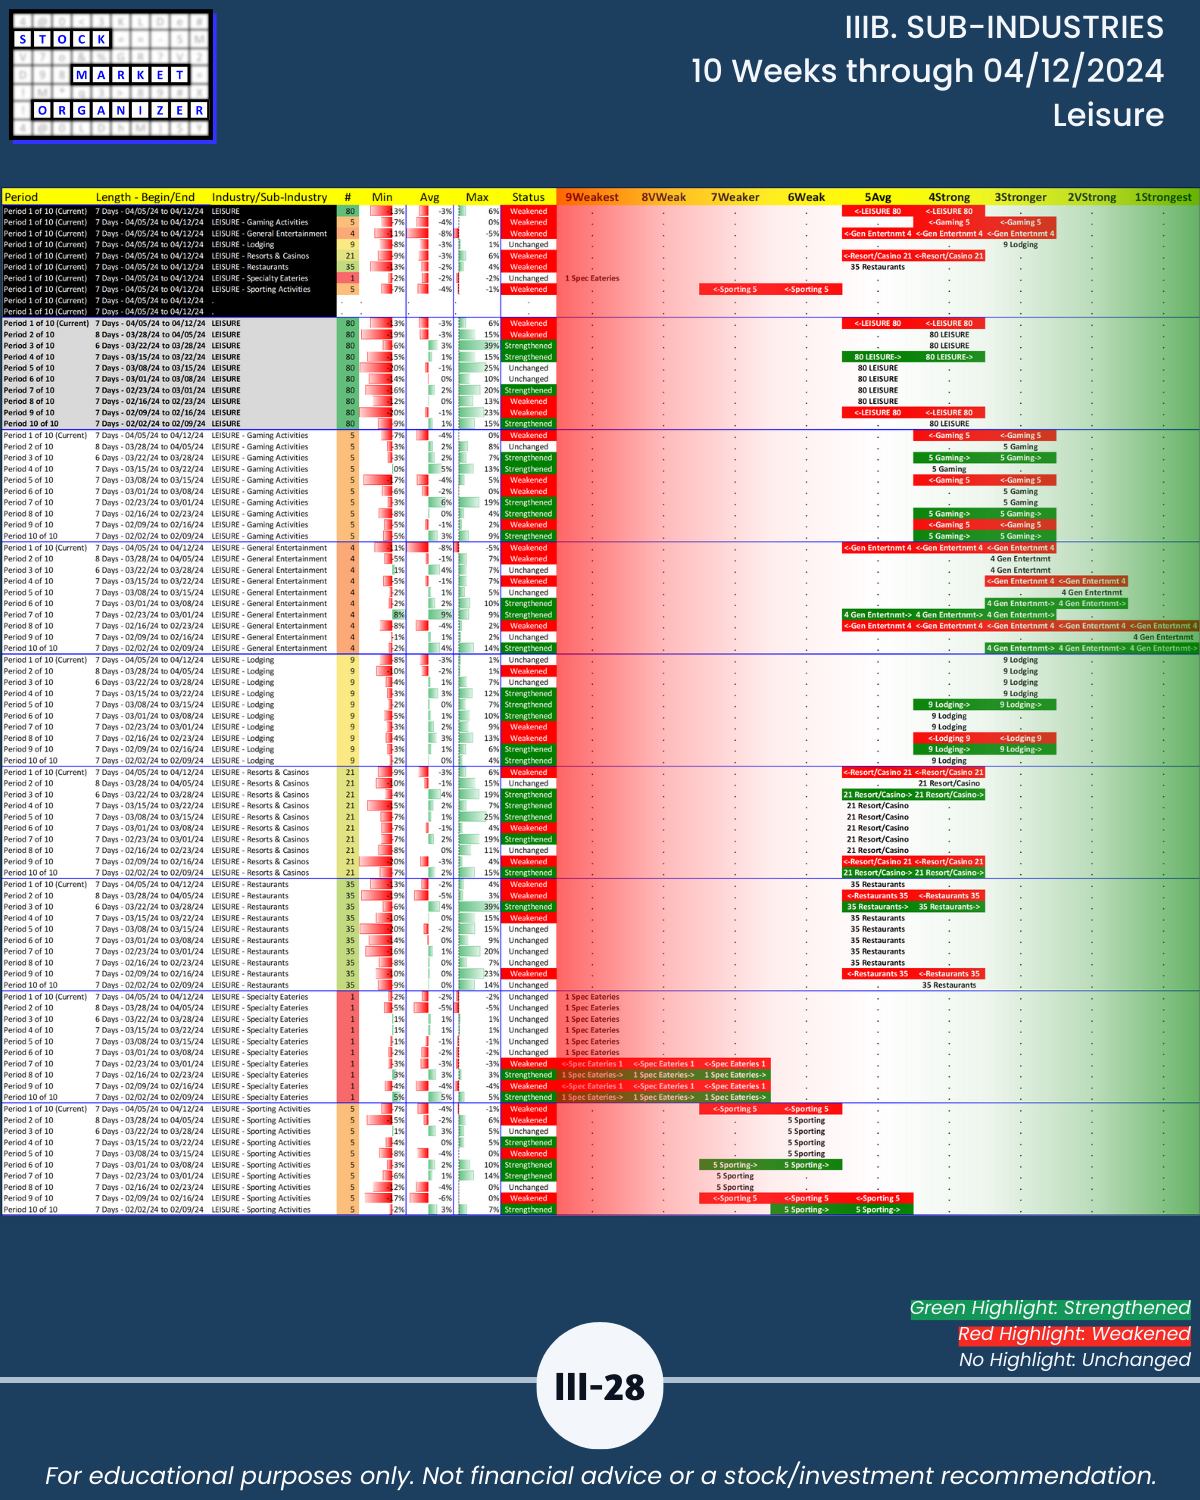
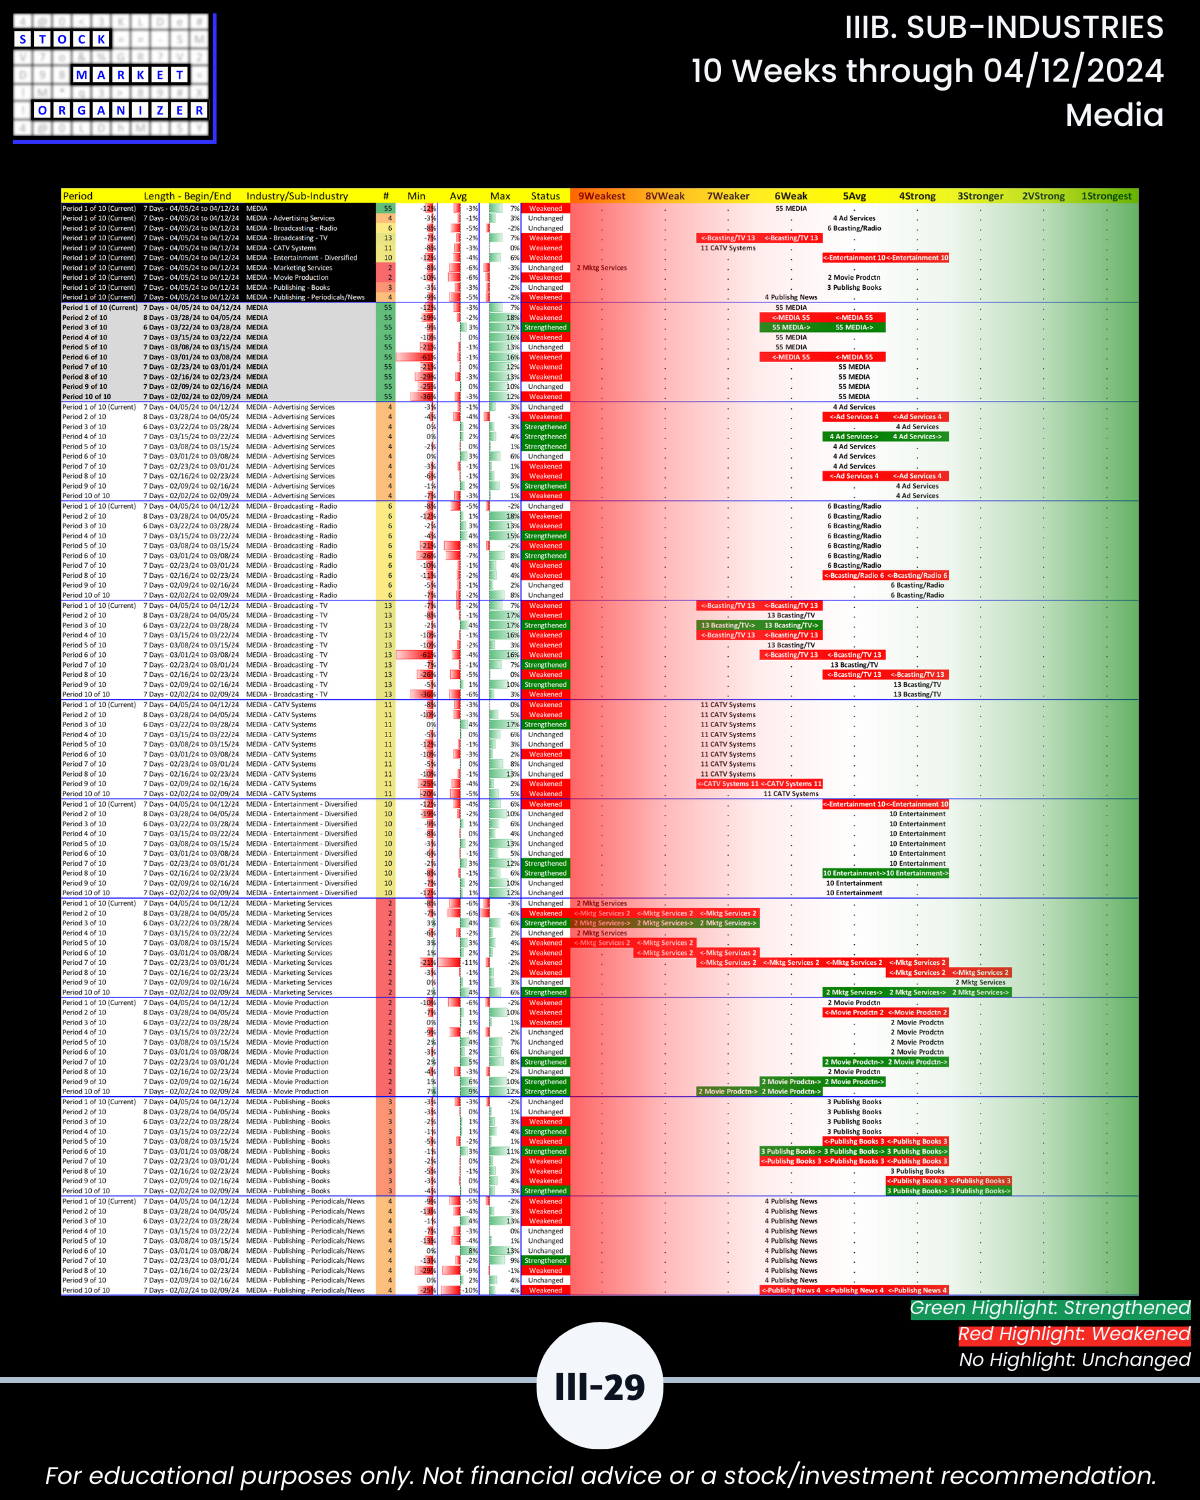
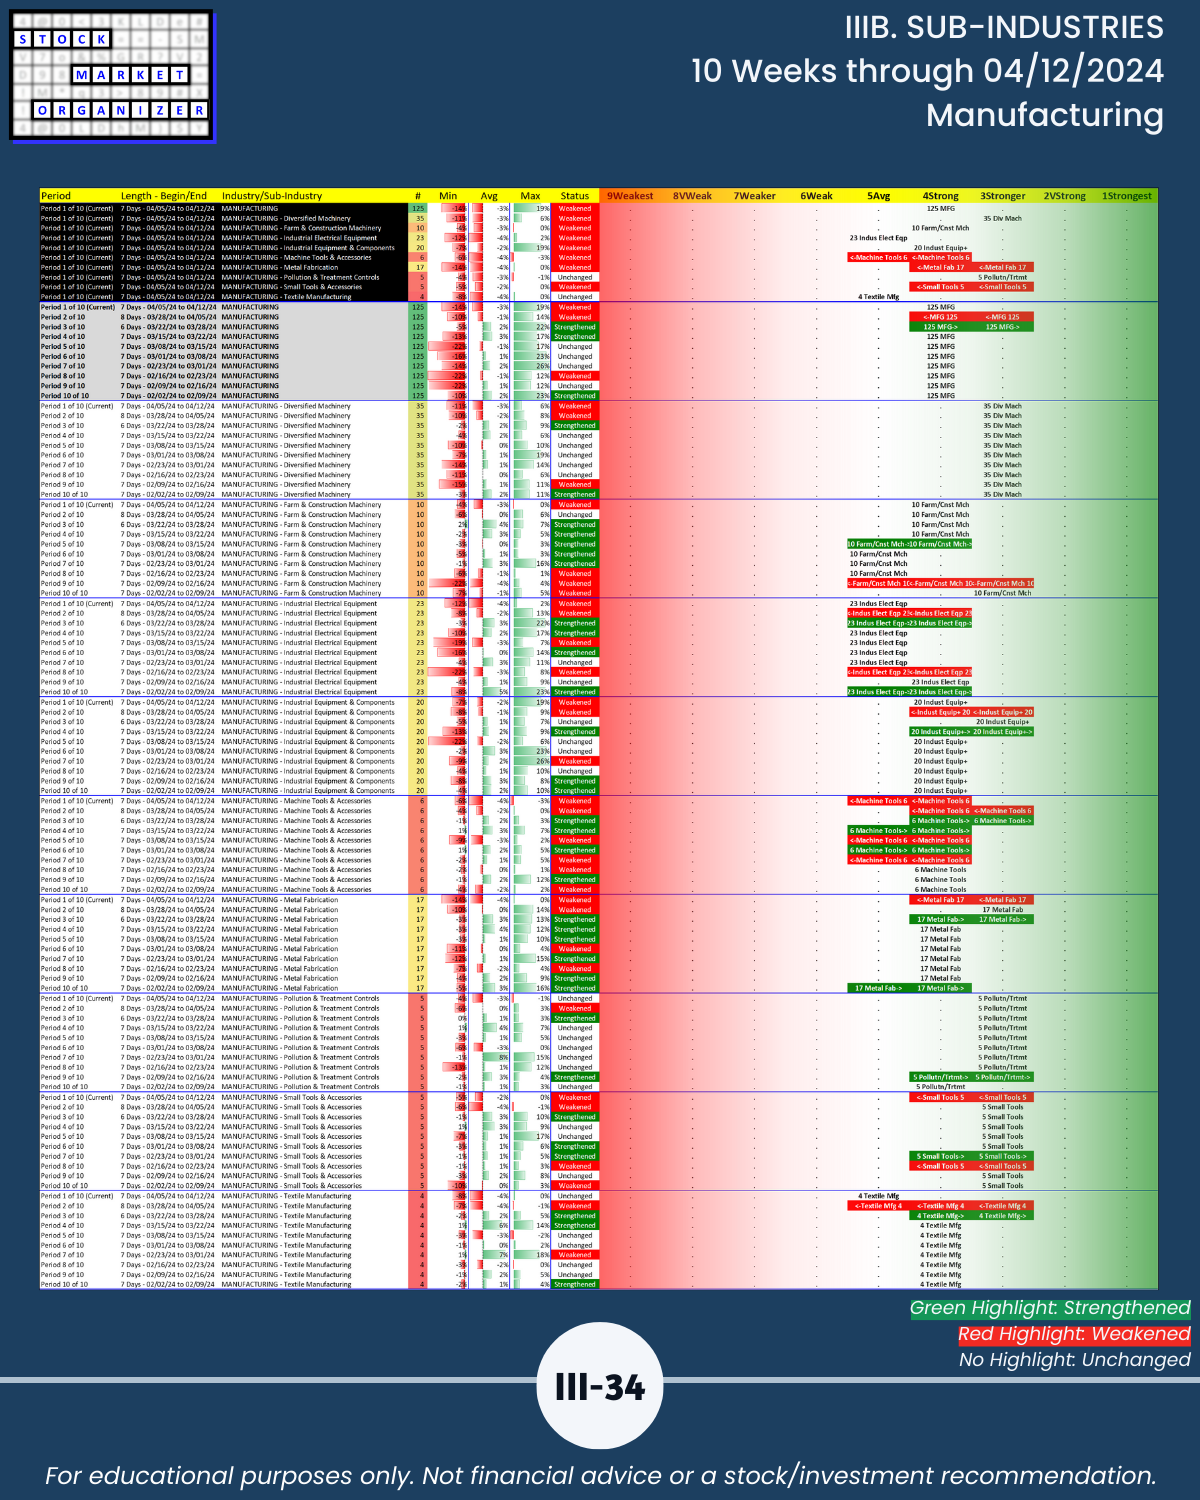
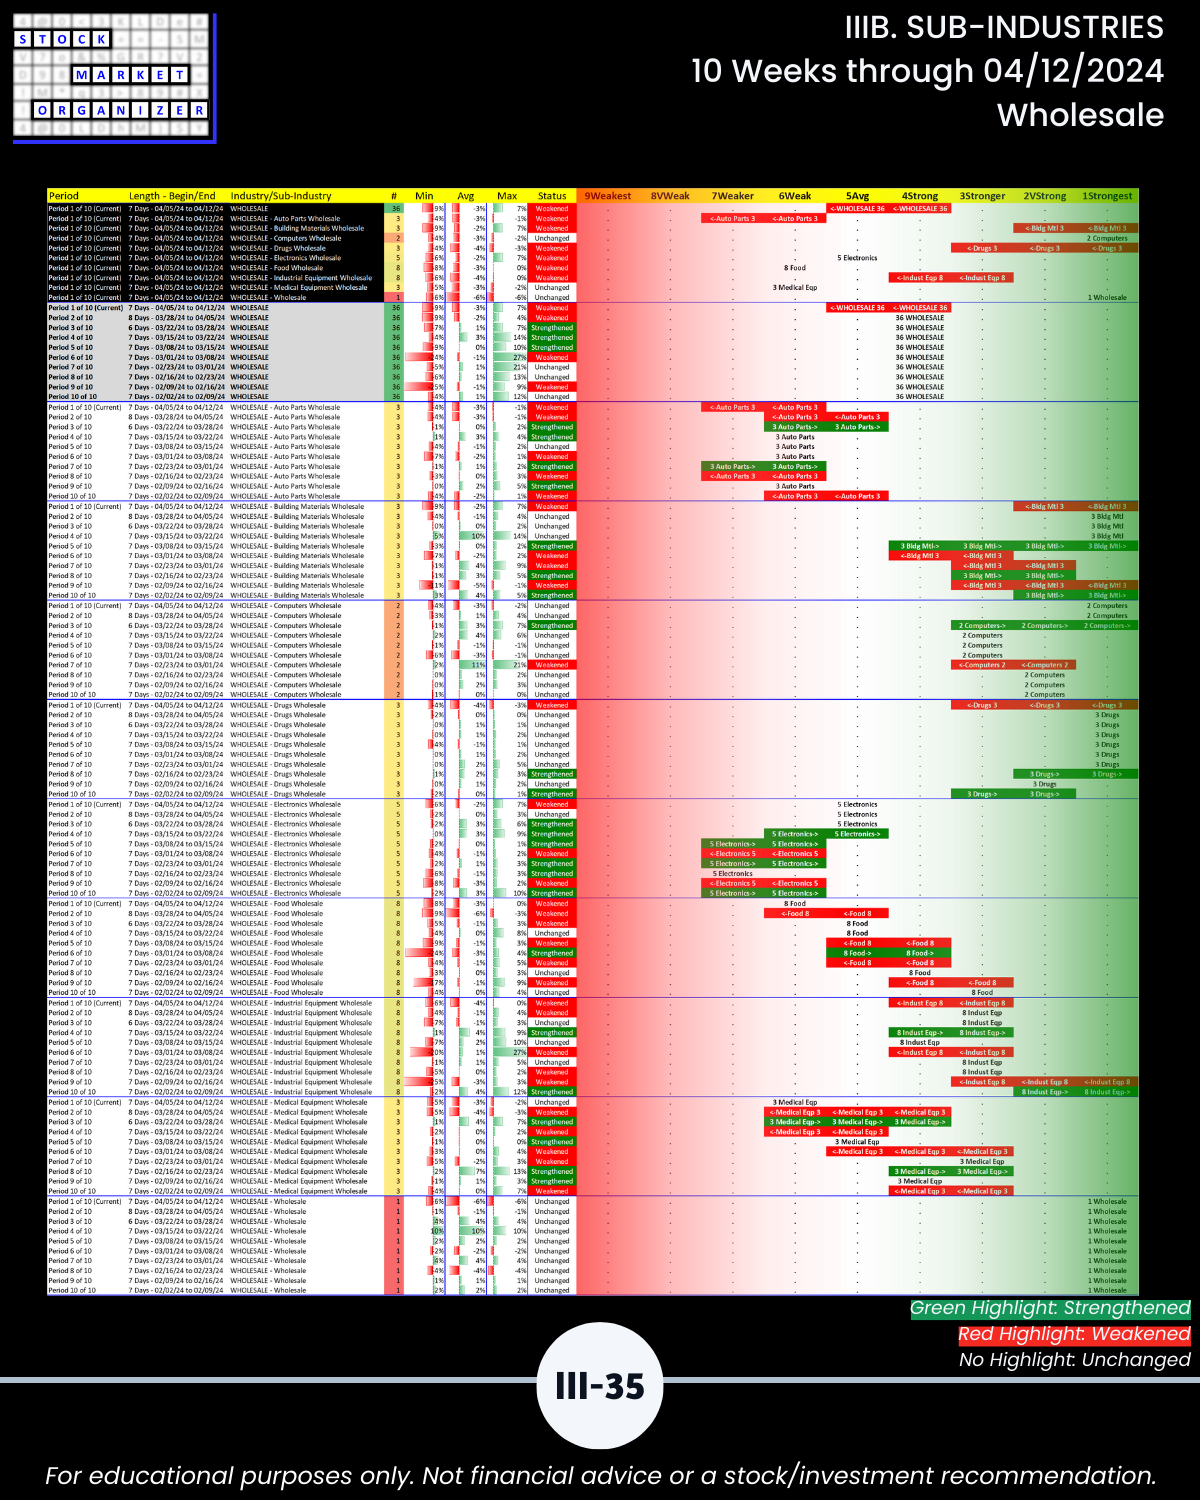
Sub-industries: Section III
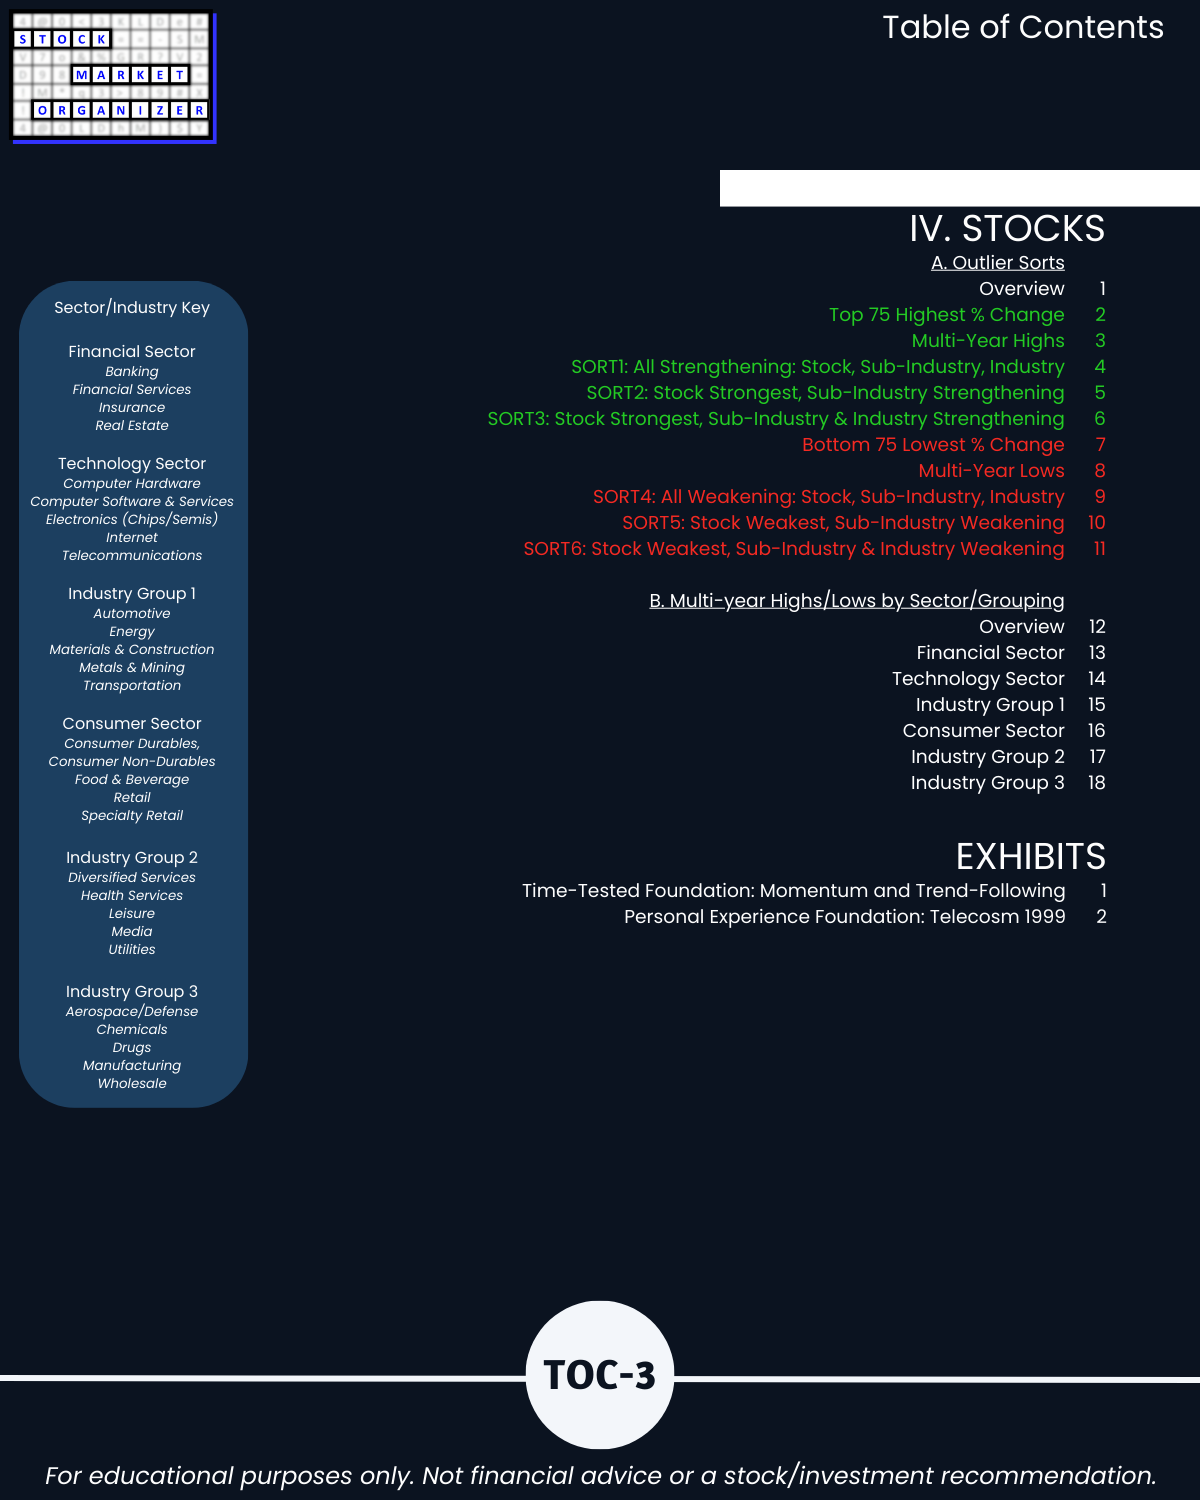
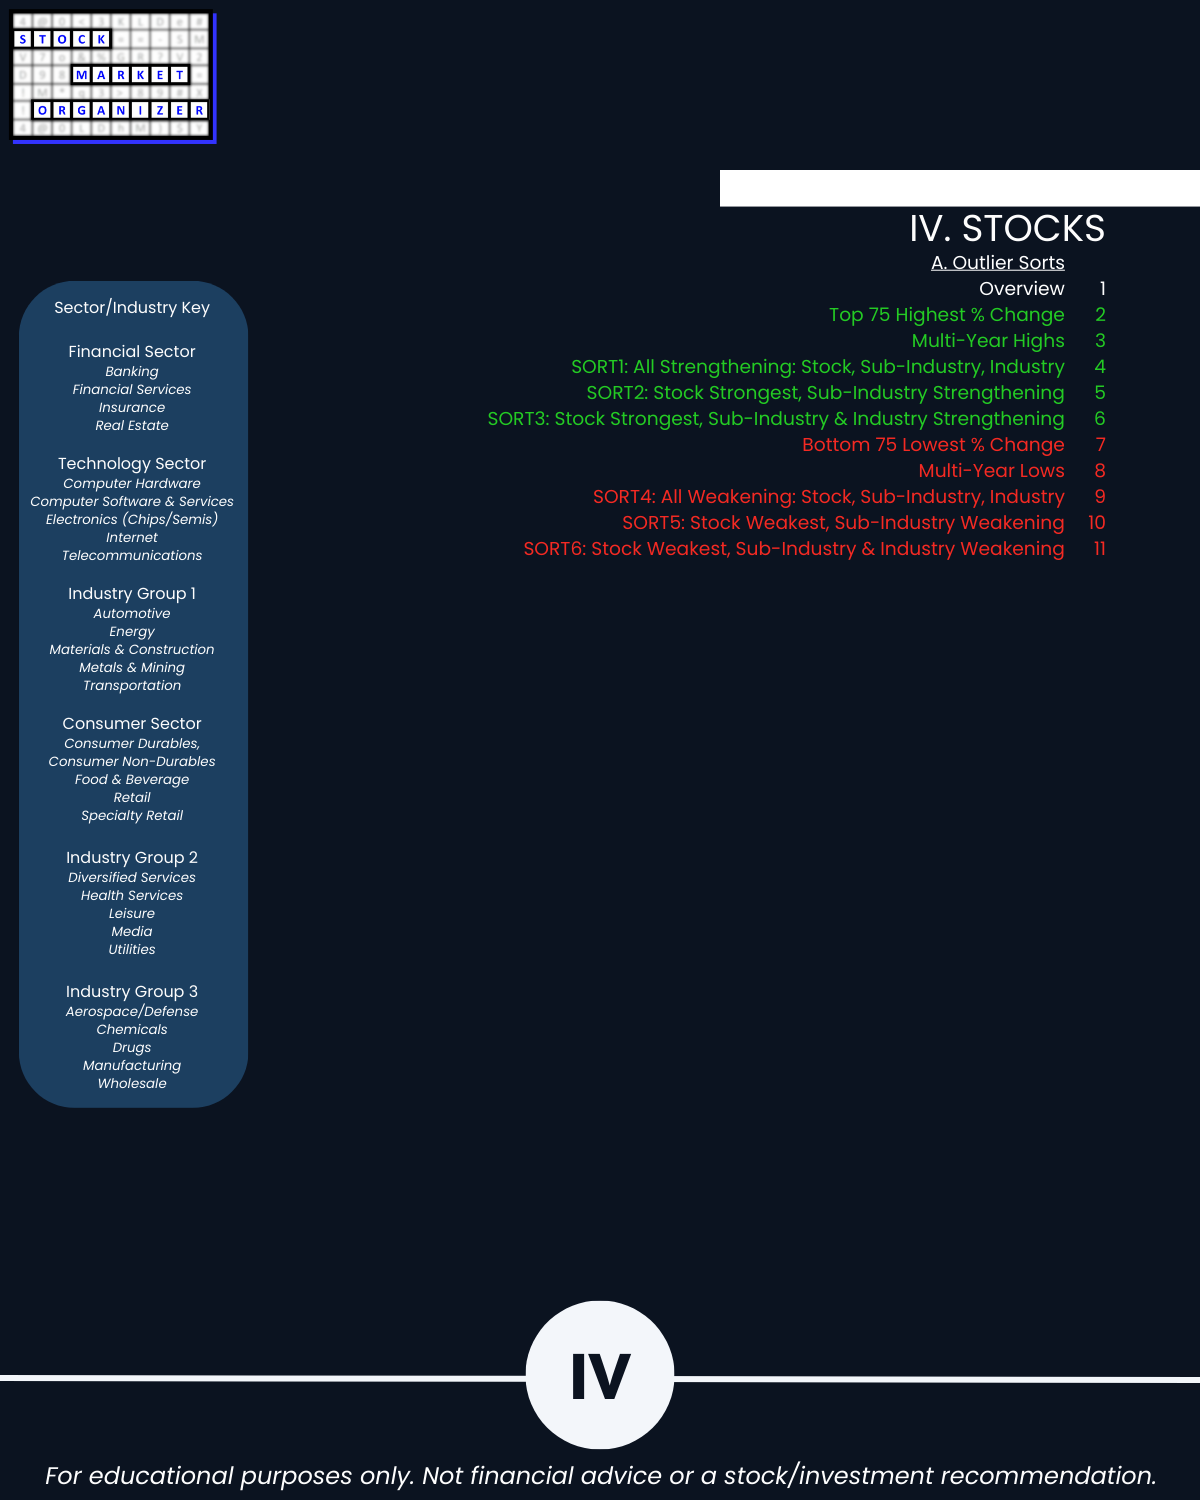
Stocks: Section IV
QUESTIONS FOR YOU
Will 2 weakening weeks turn into 3?
Retail participants – what are your plans for handling this if yes?
Advisors, what are you telling your clients? Are you telling them exactly what your competitors are telling theirs, or are you gaining a competitive edge and standing out with unique, concise market insights that reveal your comprehensive grasp on current conditions?
MORE TOP-DOWN, INSIDE-OUT, AND BOTTOM-UP DETAIL
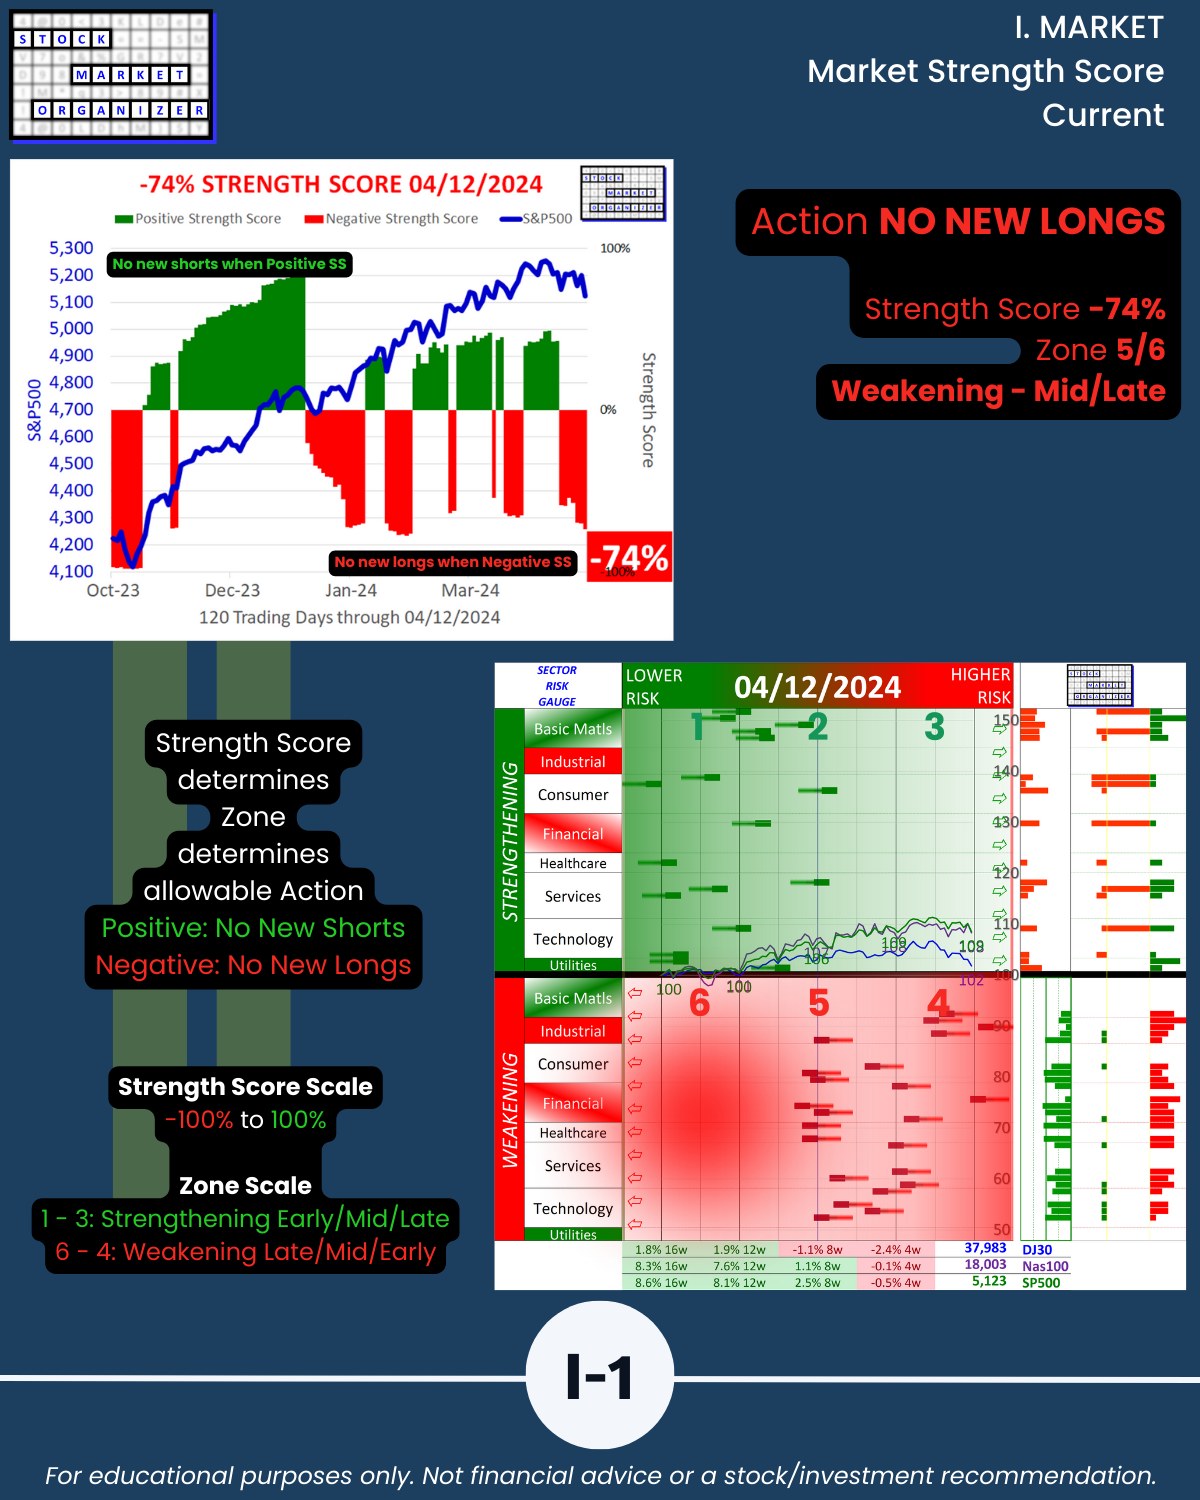
MARKET
🔹 Has a negative Market Strength Score so NO NEW LONGS
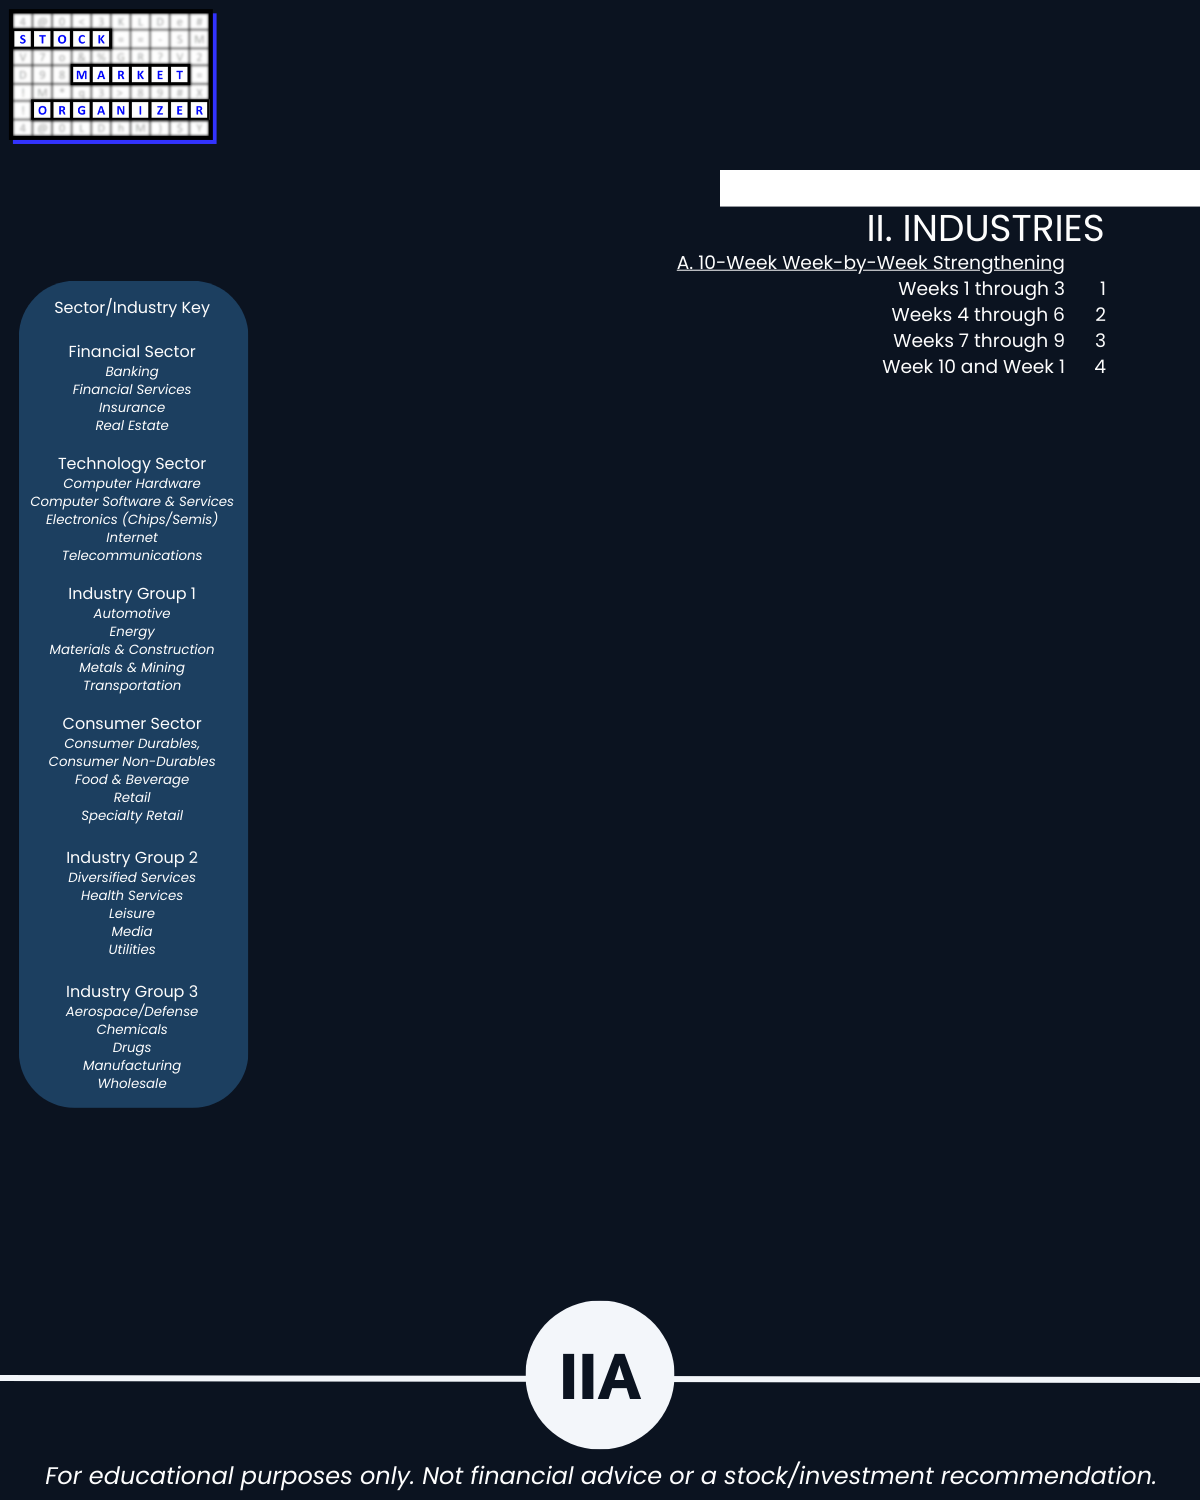
SECTORS/INDUSTRY GROUPINGS (6)
🔹 Overall weighted average strength ranking is 5.0, -0.4 this week
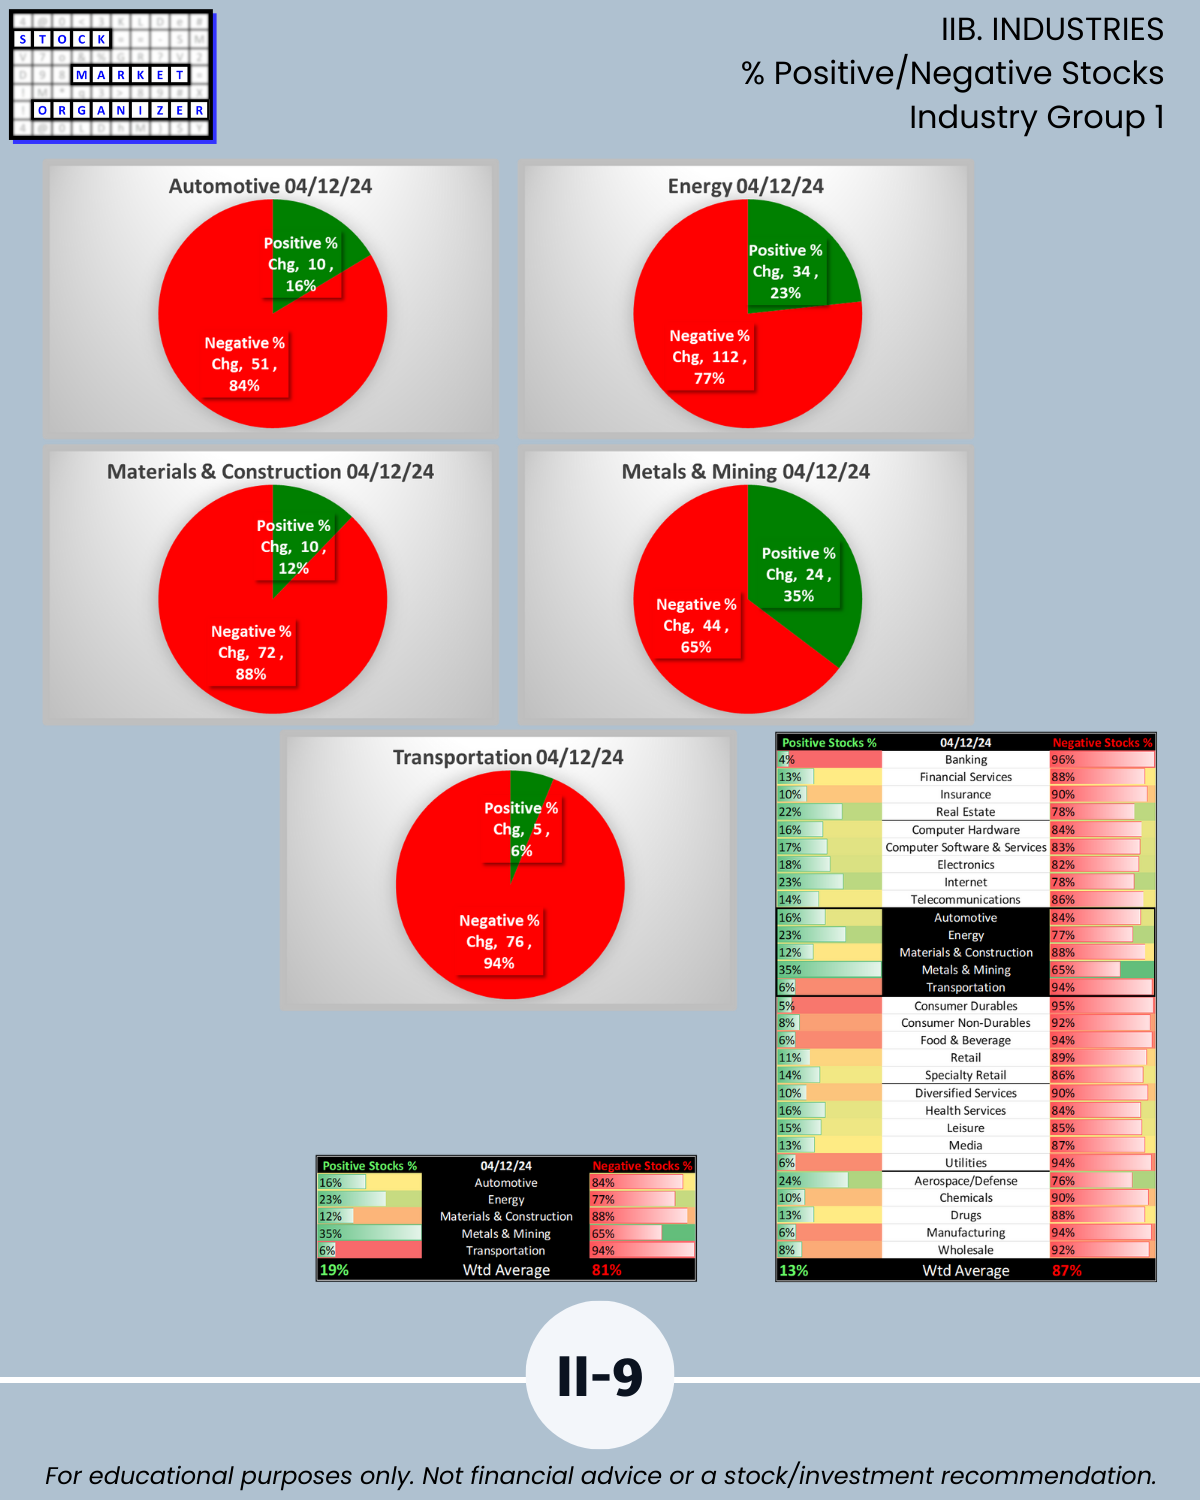
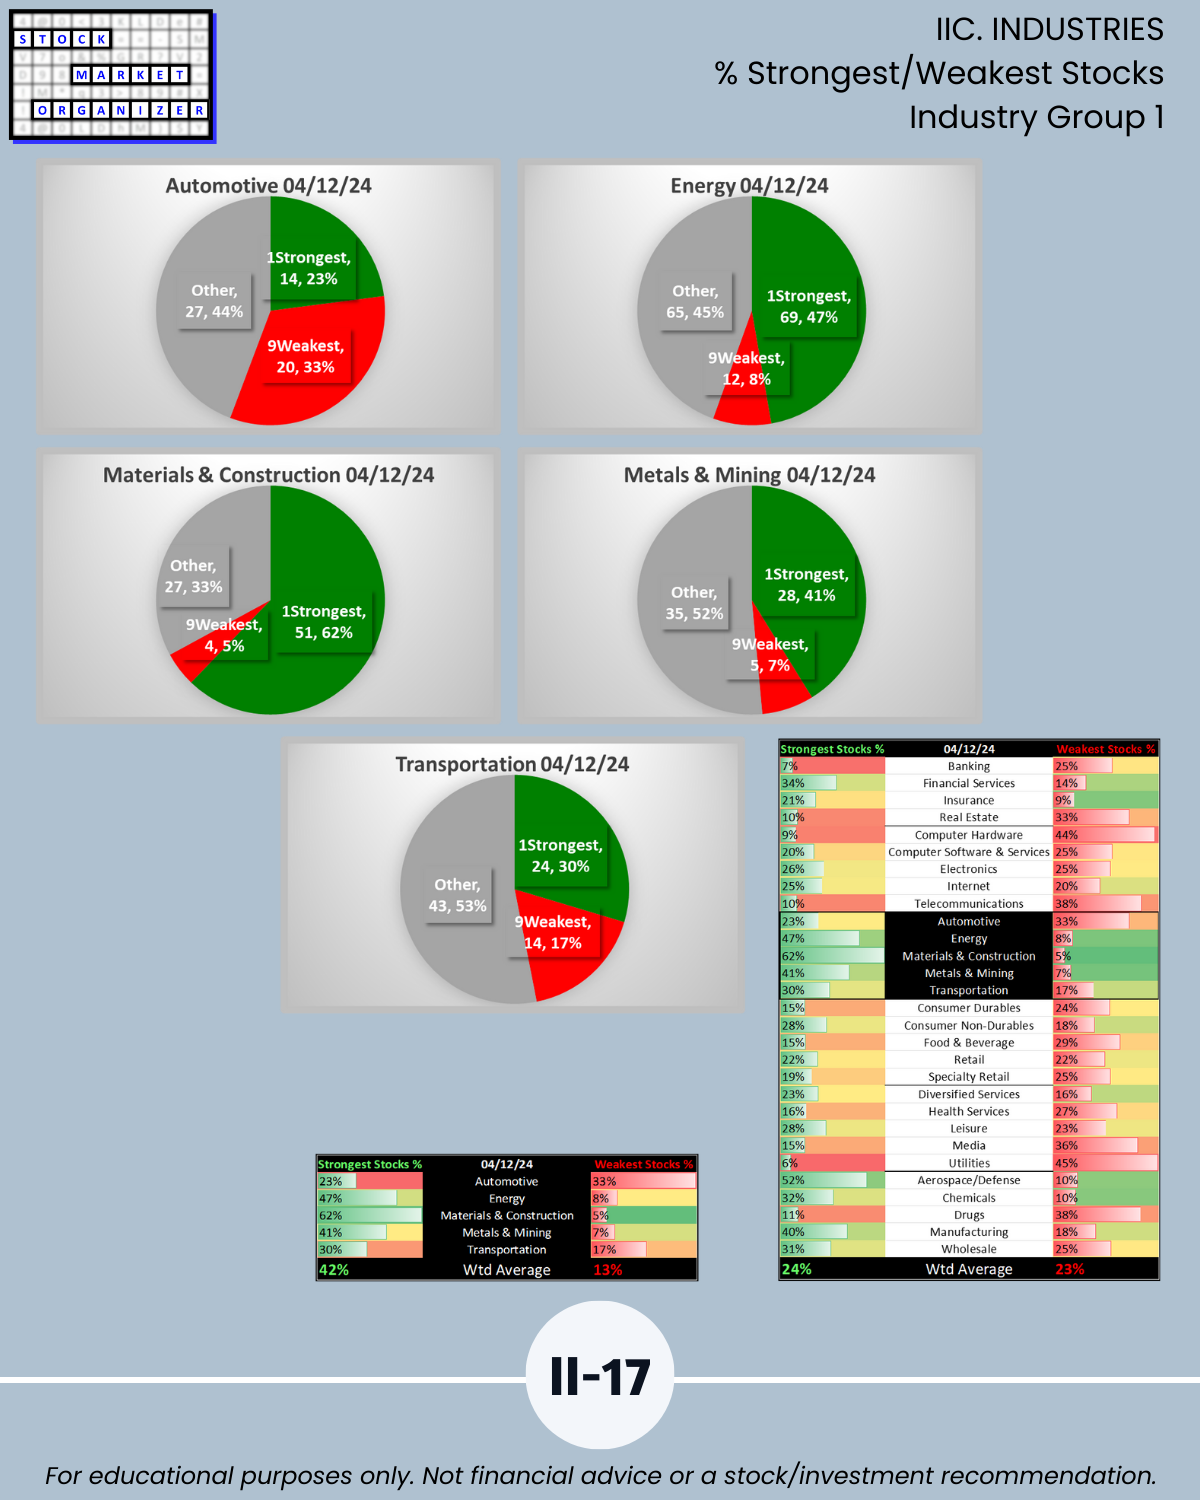
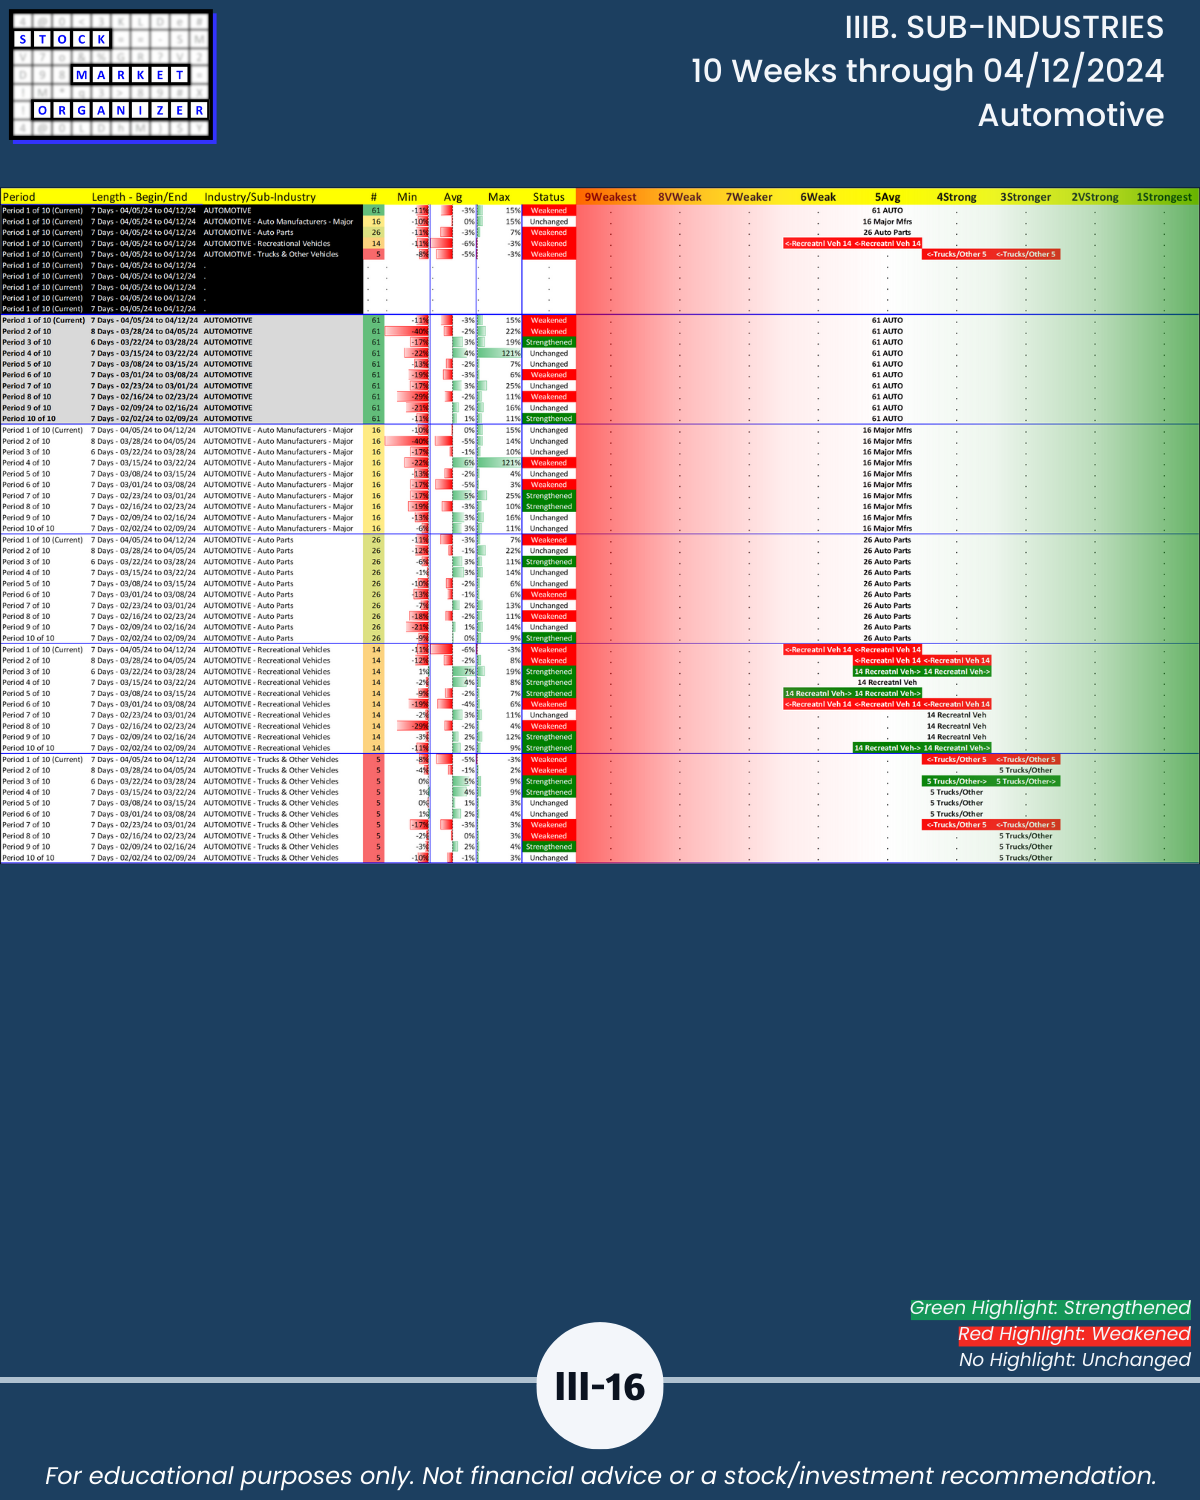
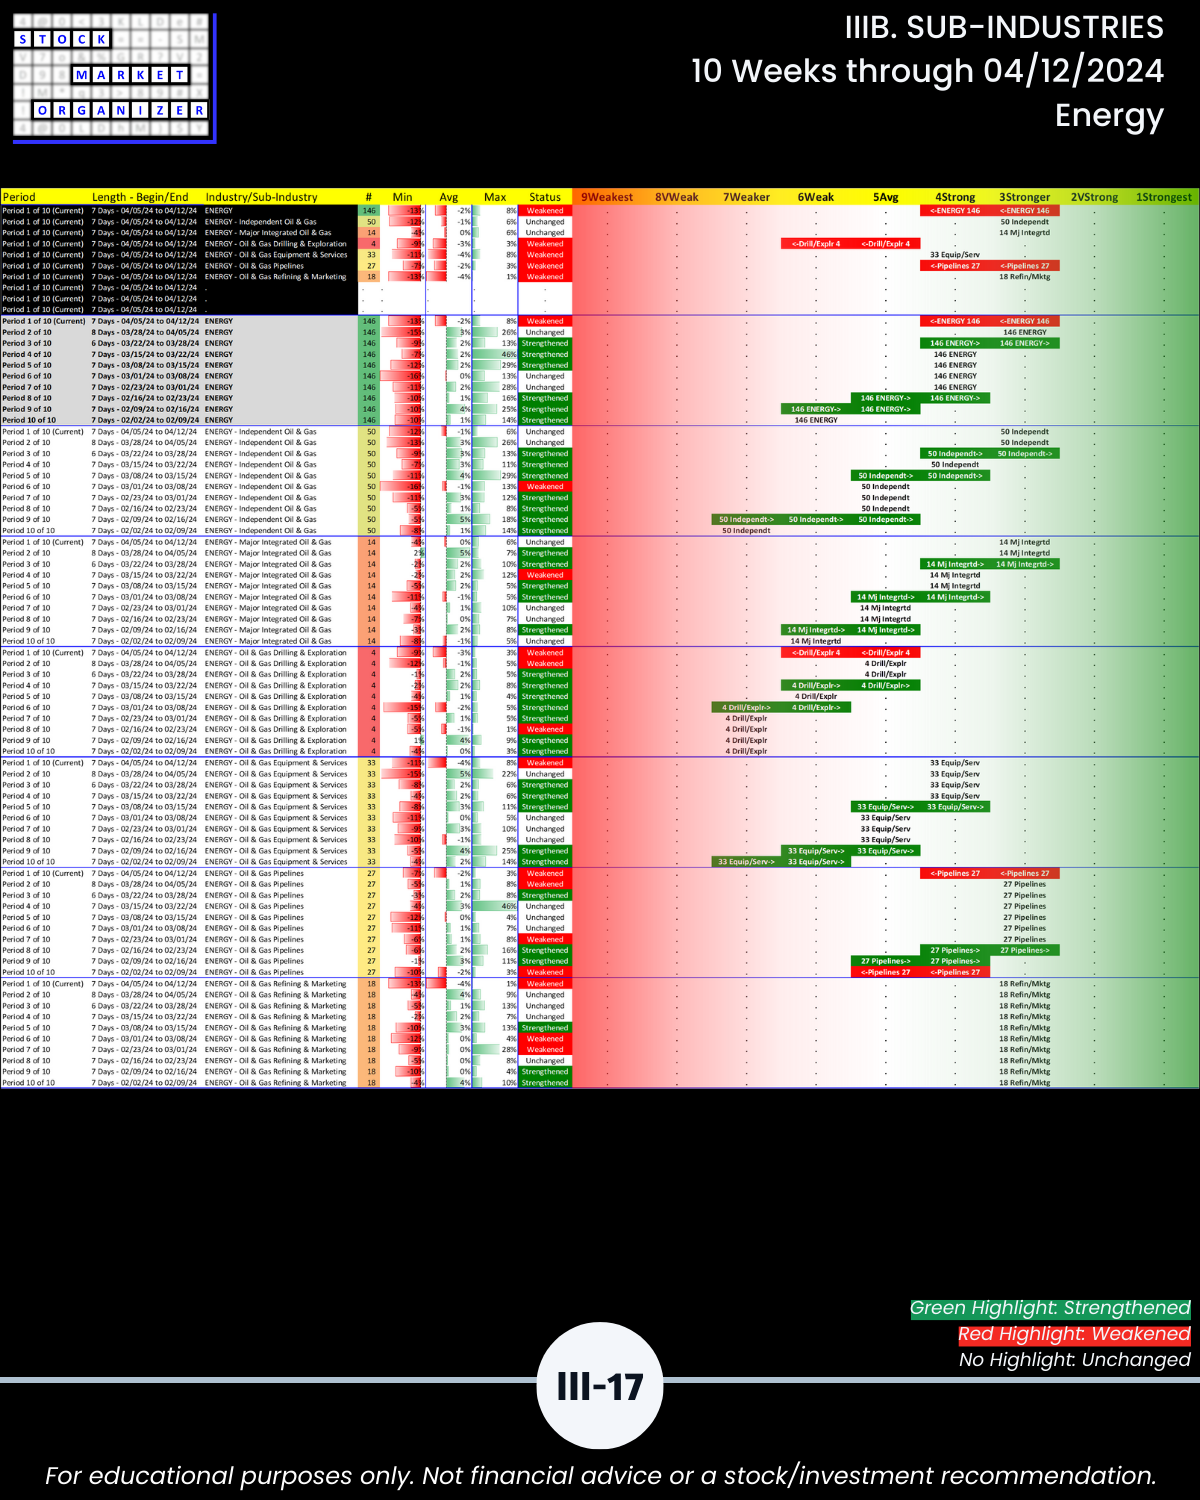
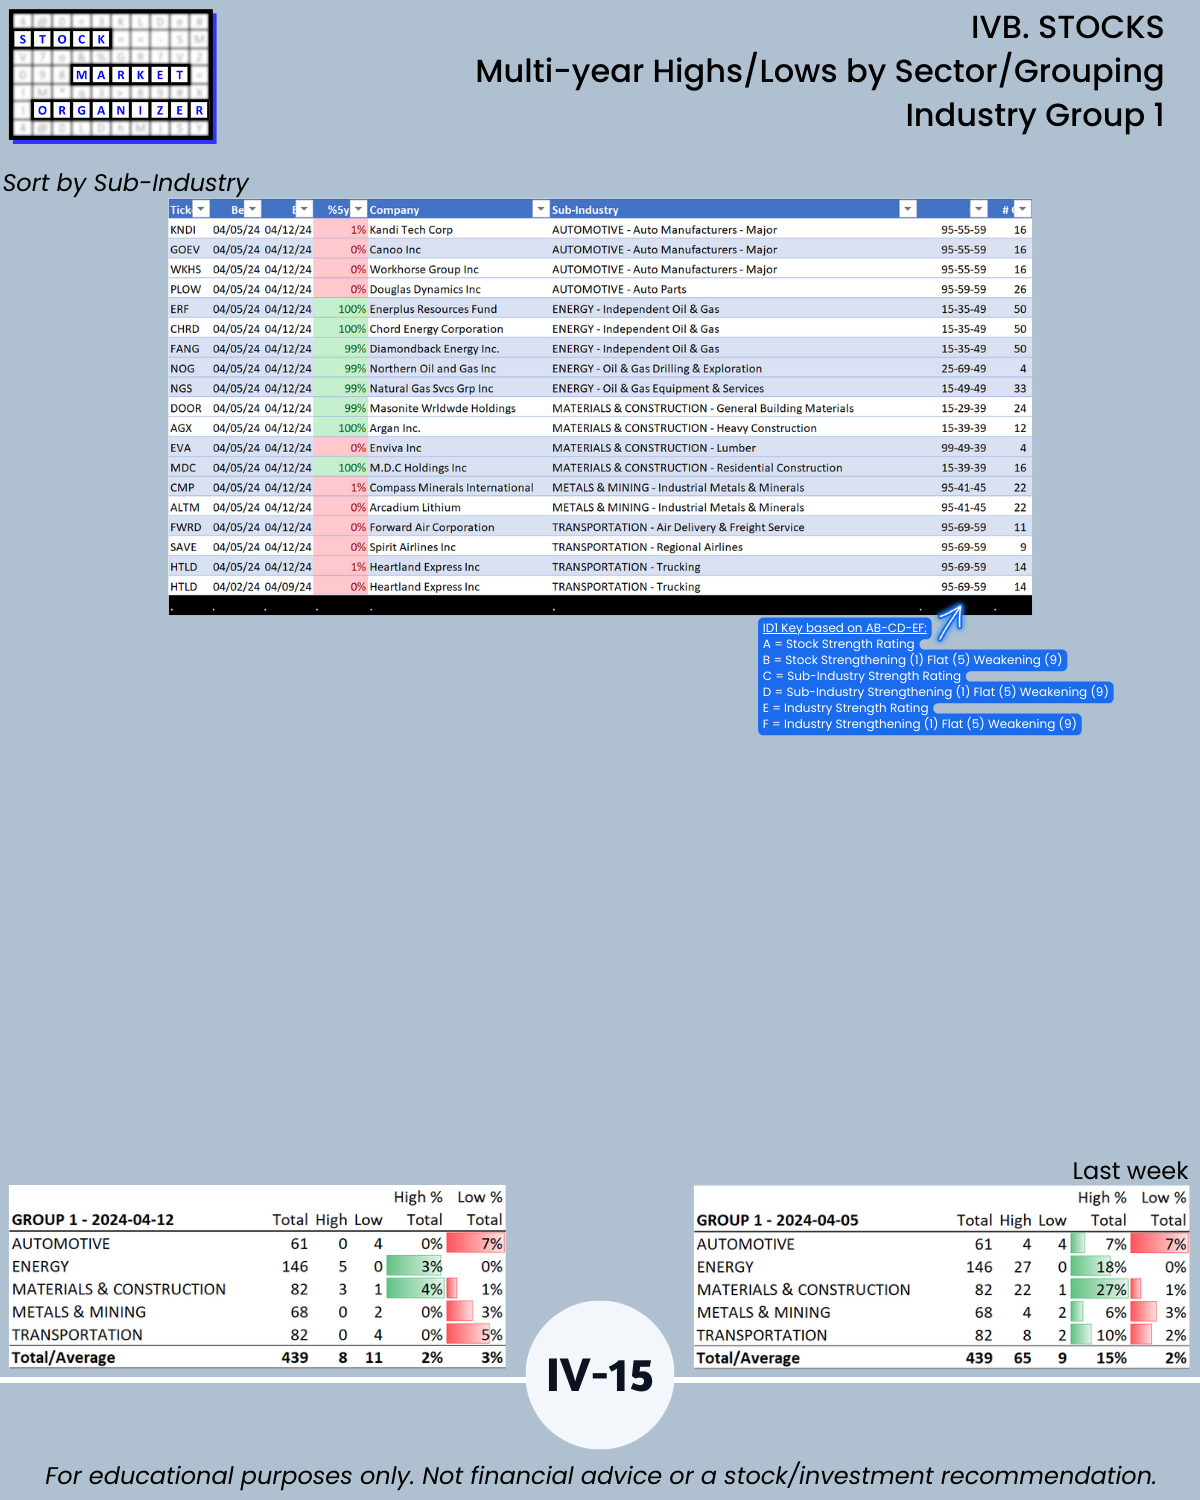
🔹 Best: Industry Group 1, 4.1 (Automotive, Energy, Materials/Construction, Metals/Mining, Transportation)
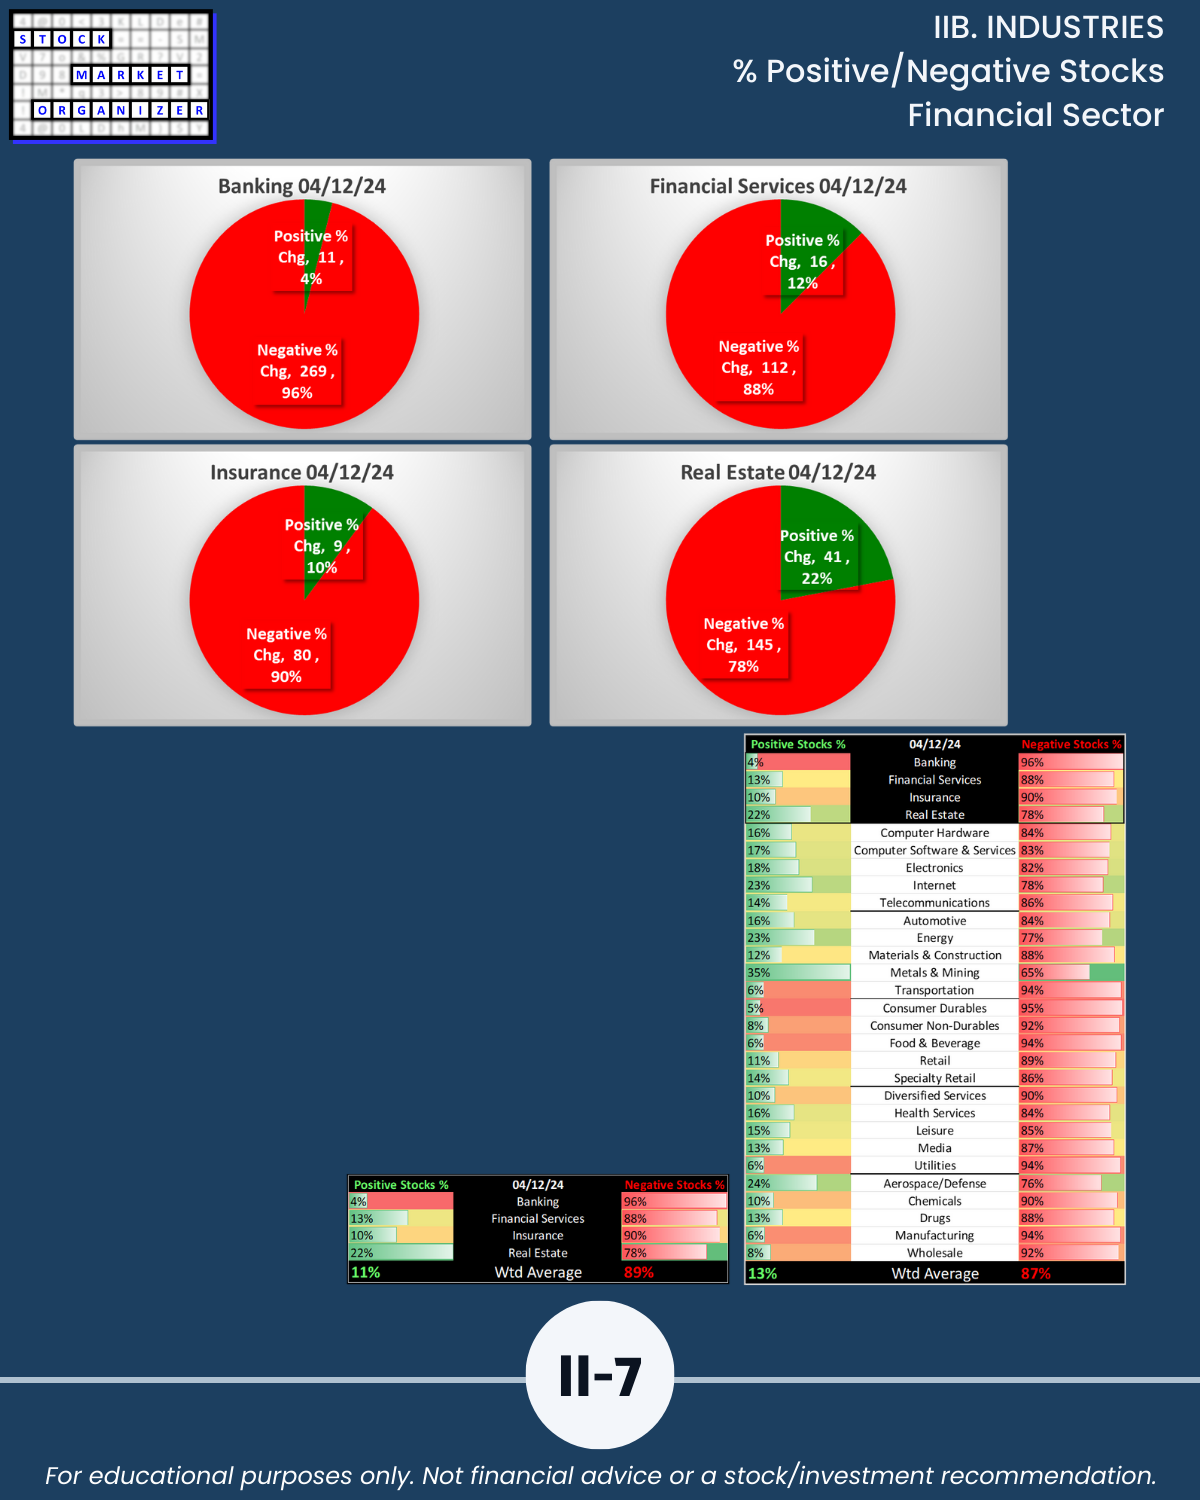
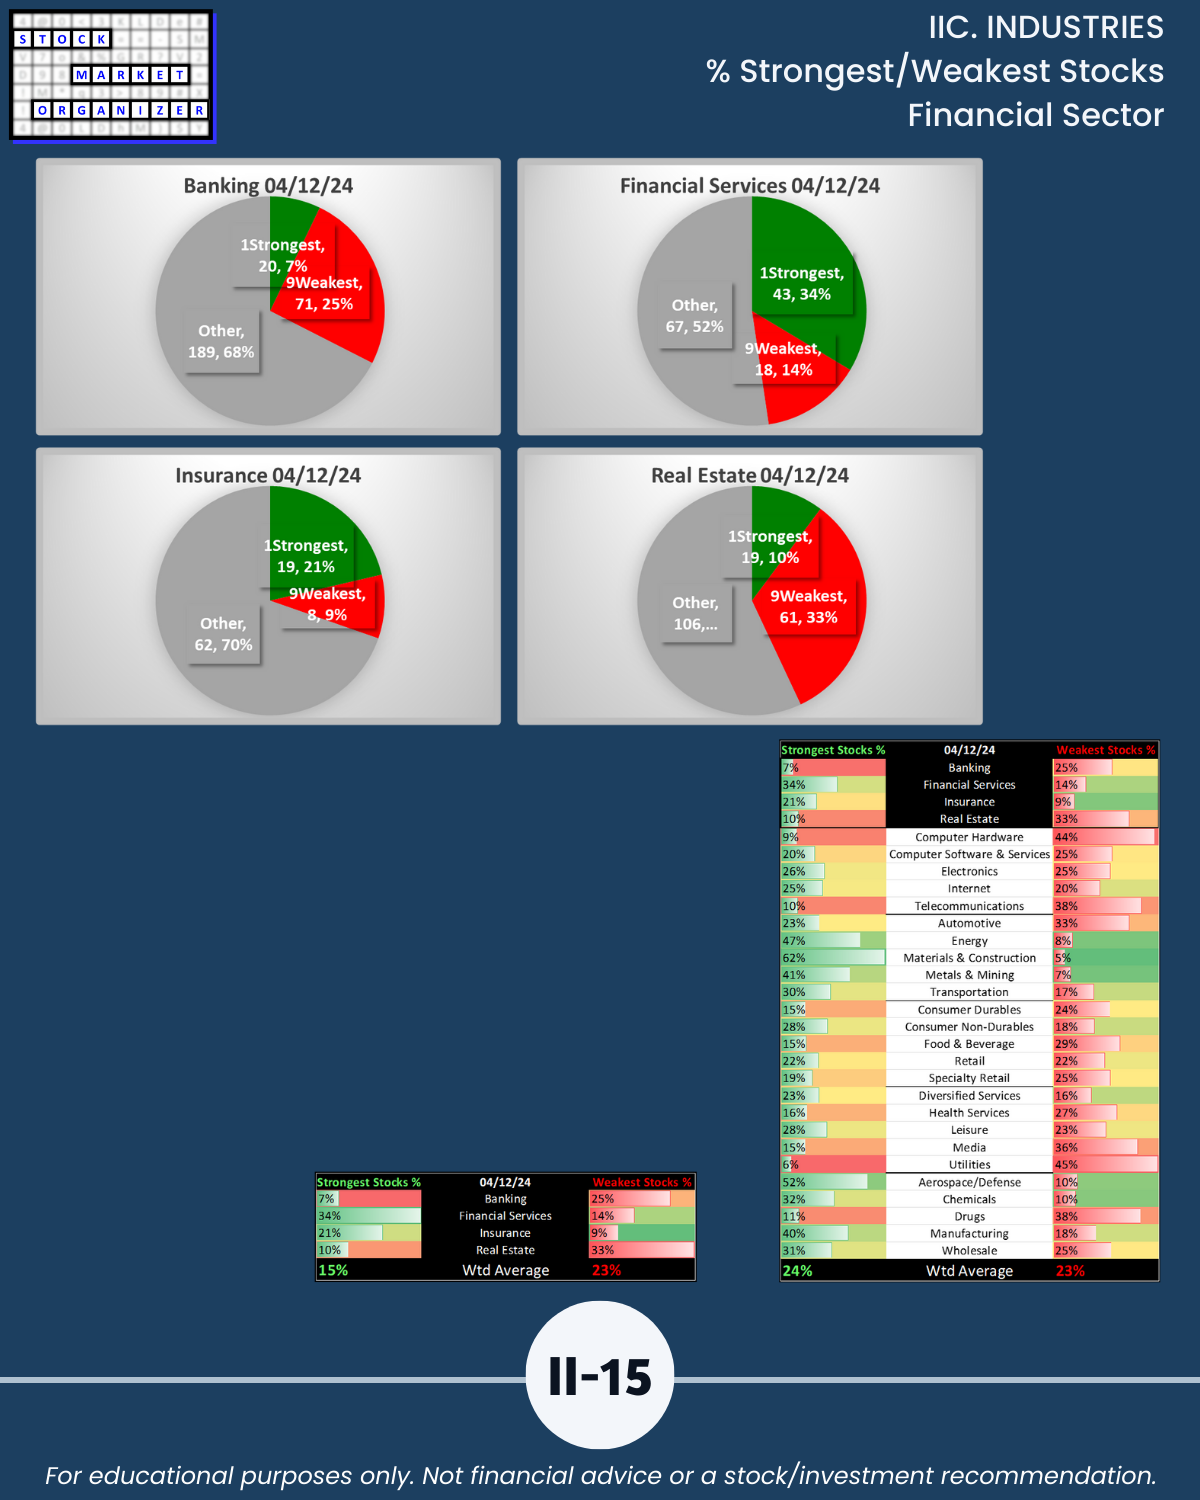
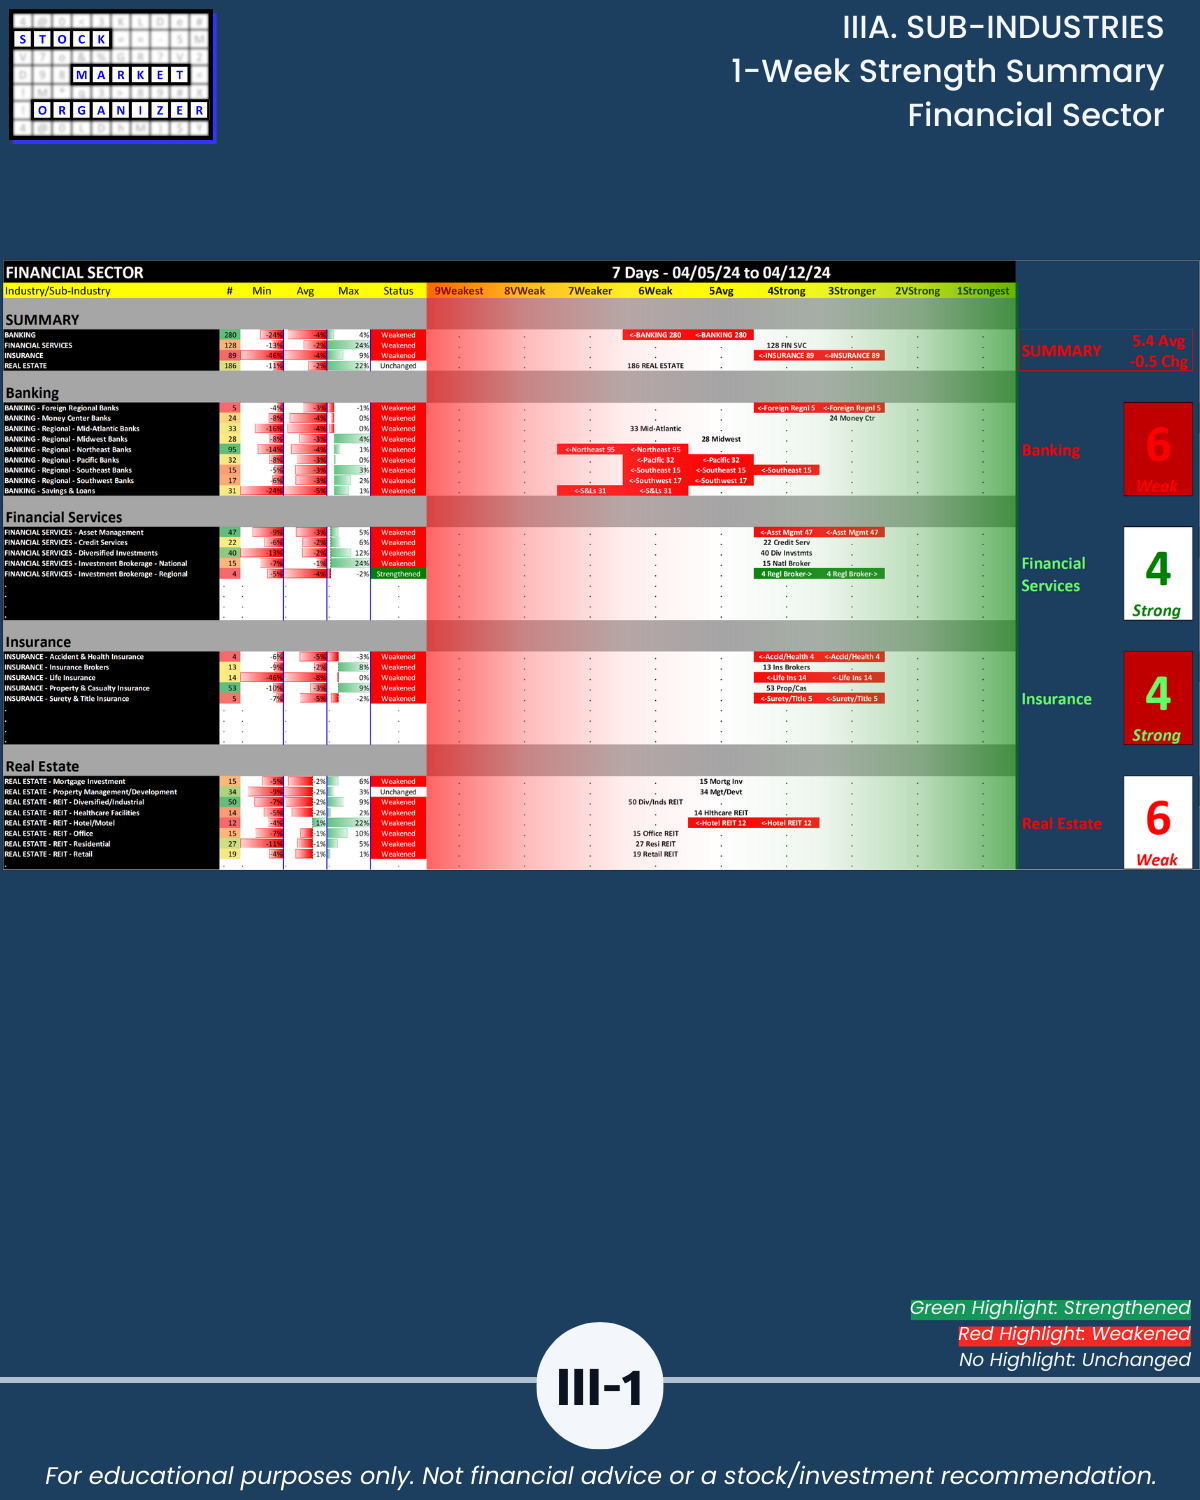
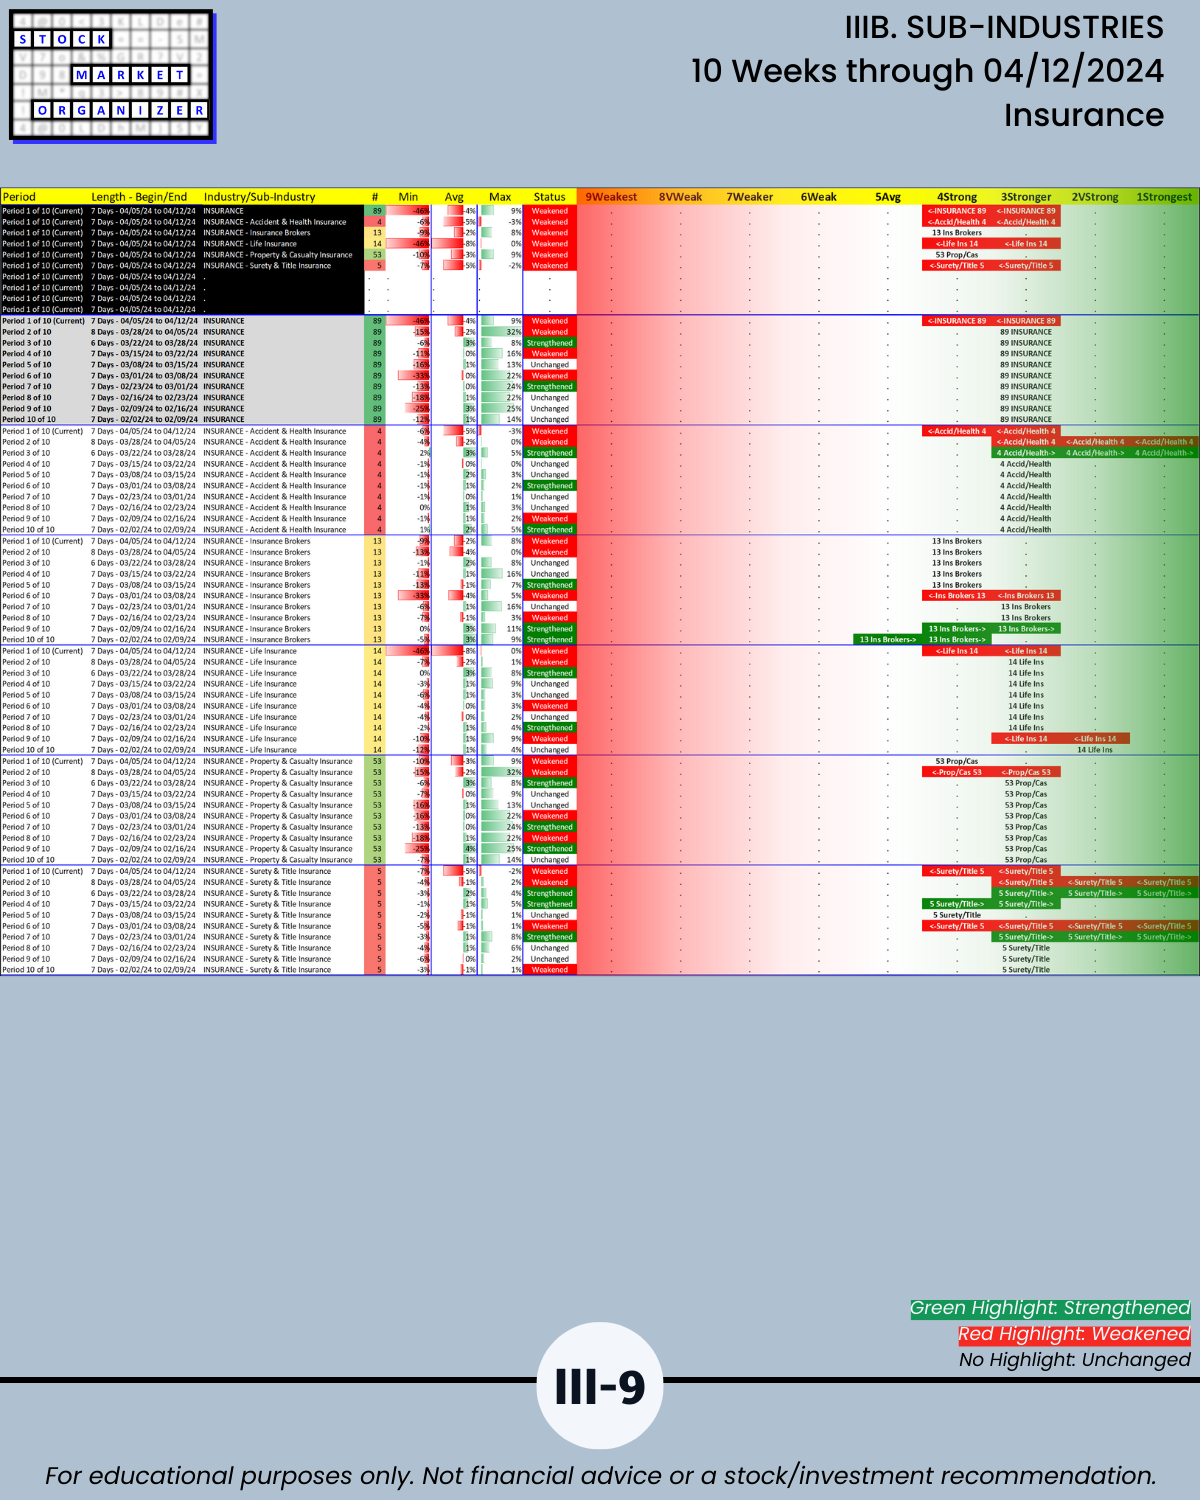
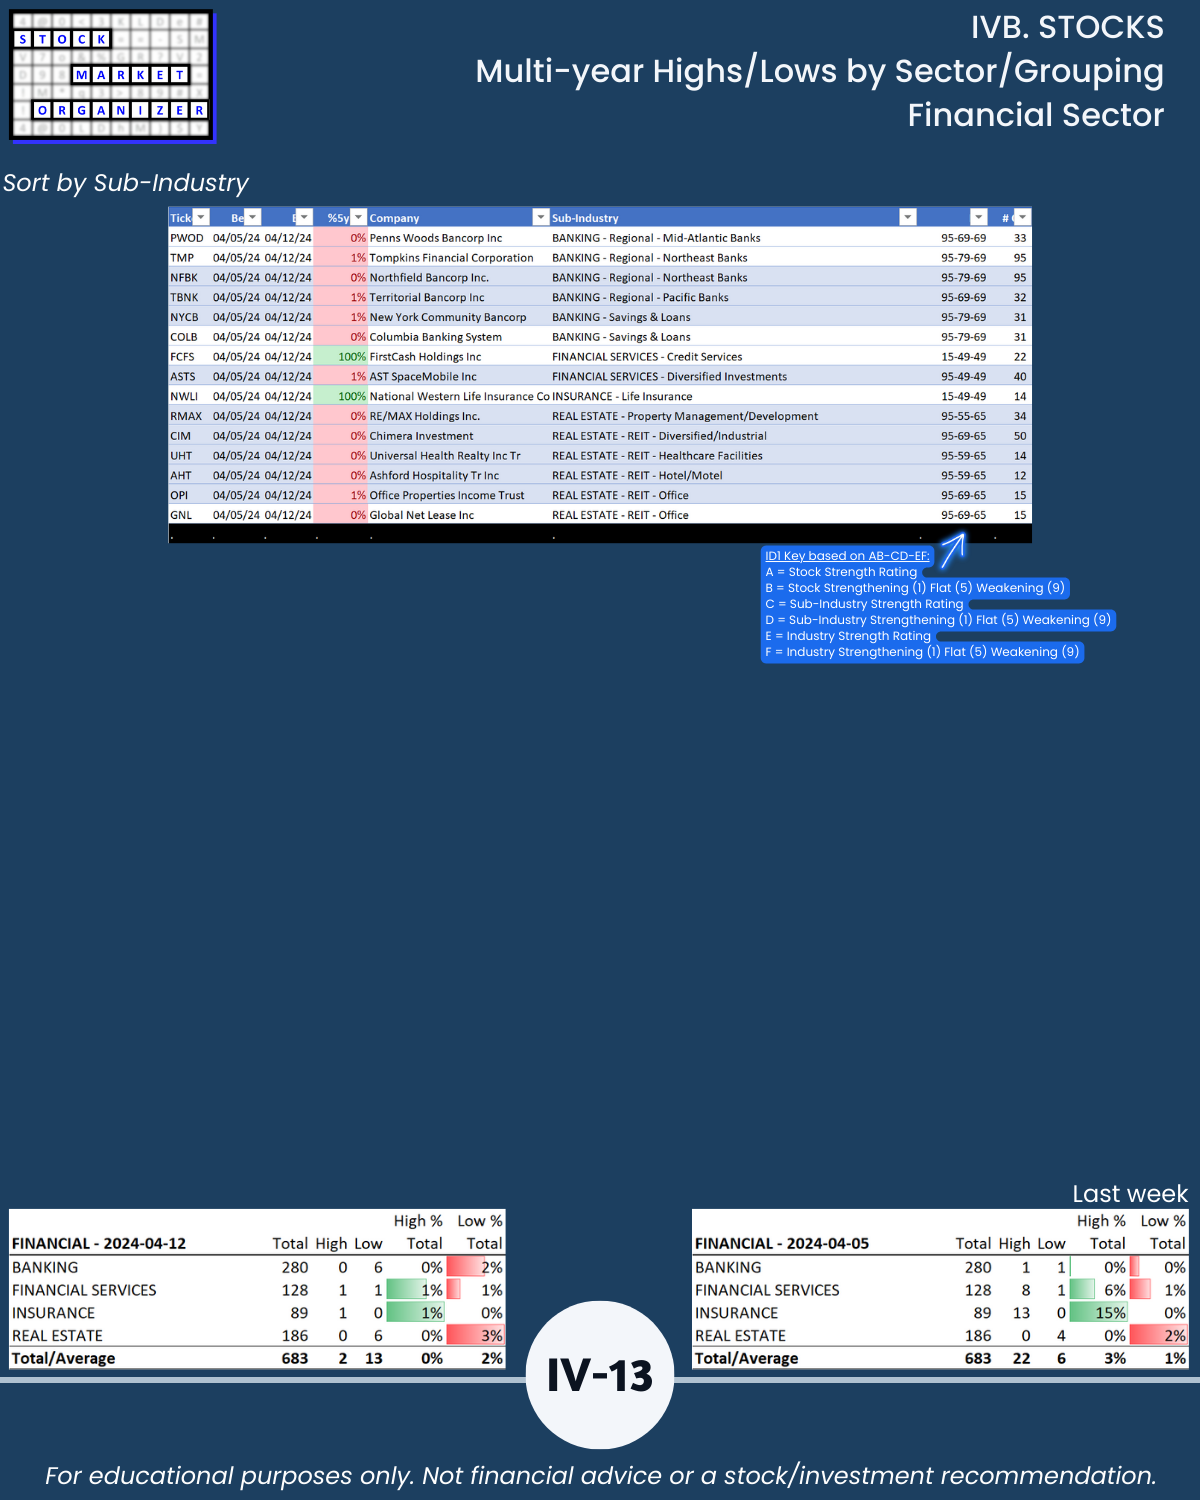
🔹 Worst: Financial Sector, 5.4 (Banking, Financial Services, Insurance, Real Estate)
🔹 Both had the largest declines at -0.5, Financial -1.7 in the past 2 weeks
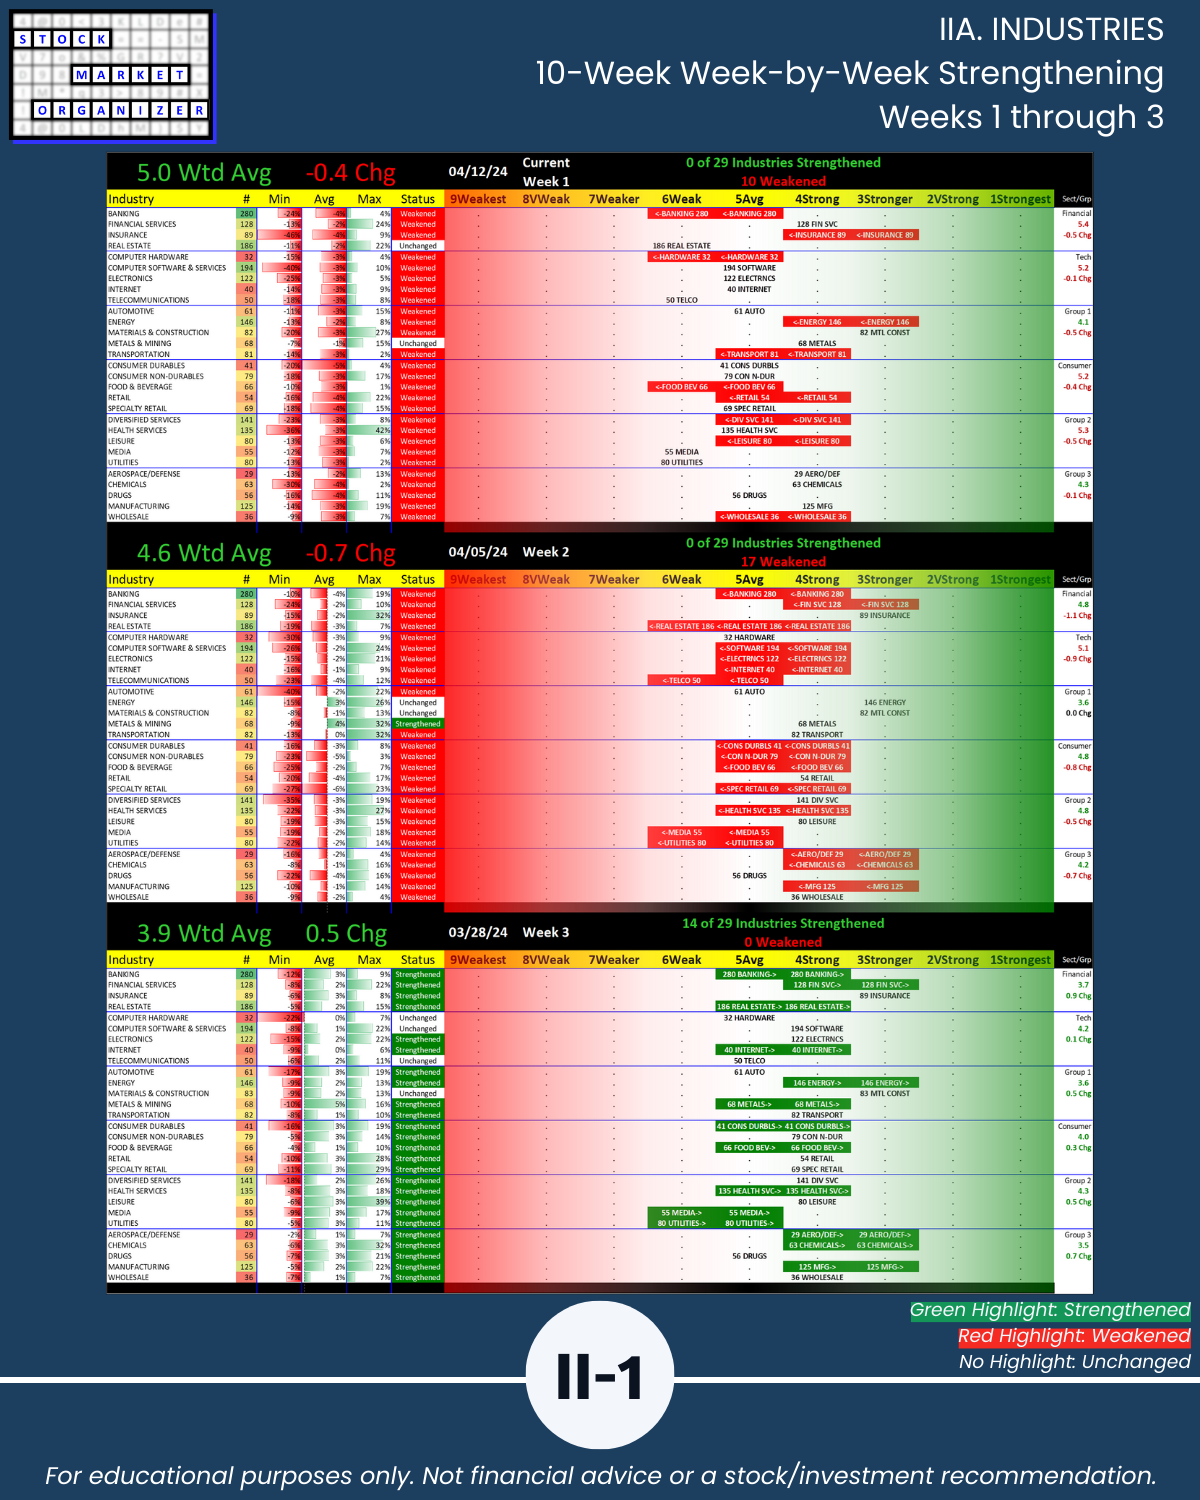
INDUSTRIES
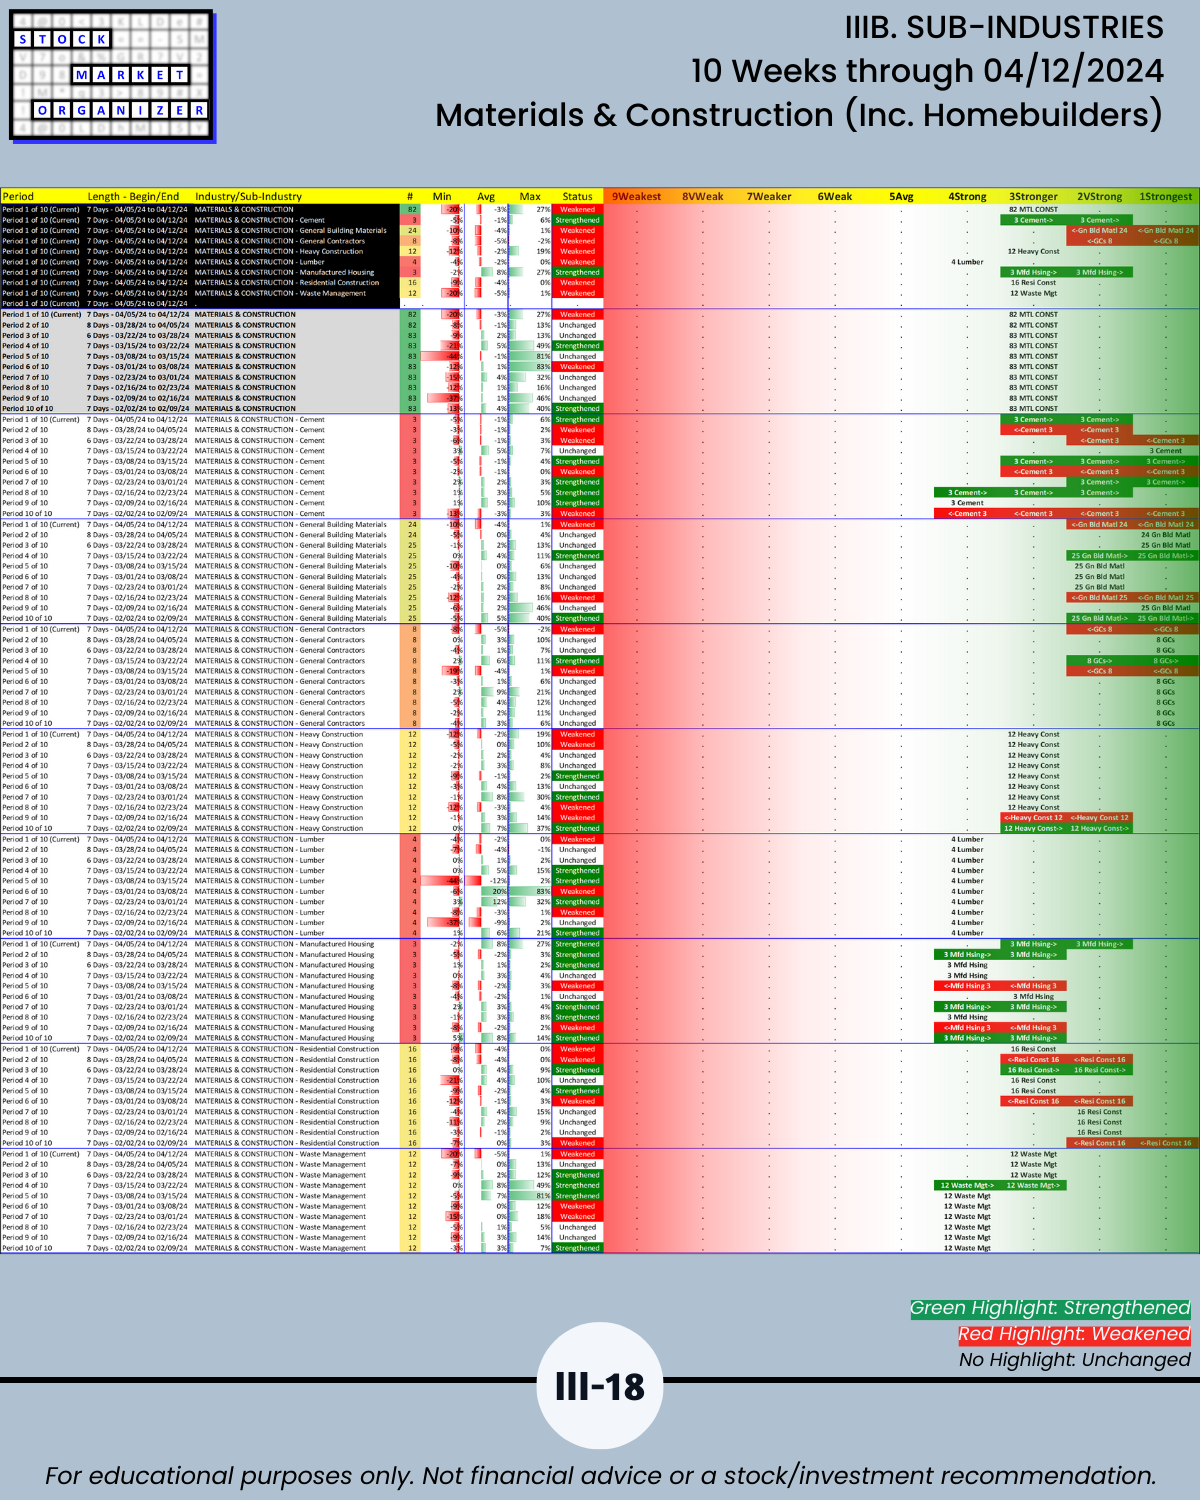
🔹 Strongest: Materials & Construction (Stronger, 3rd strongest of 9 strength levels)
- Insurance finally weakened after more than 10 weeks
- Last week’s co-leader Energy also weakened
🔹 Weakest industries (Weak, 6th strongest):
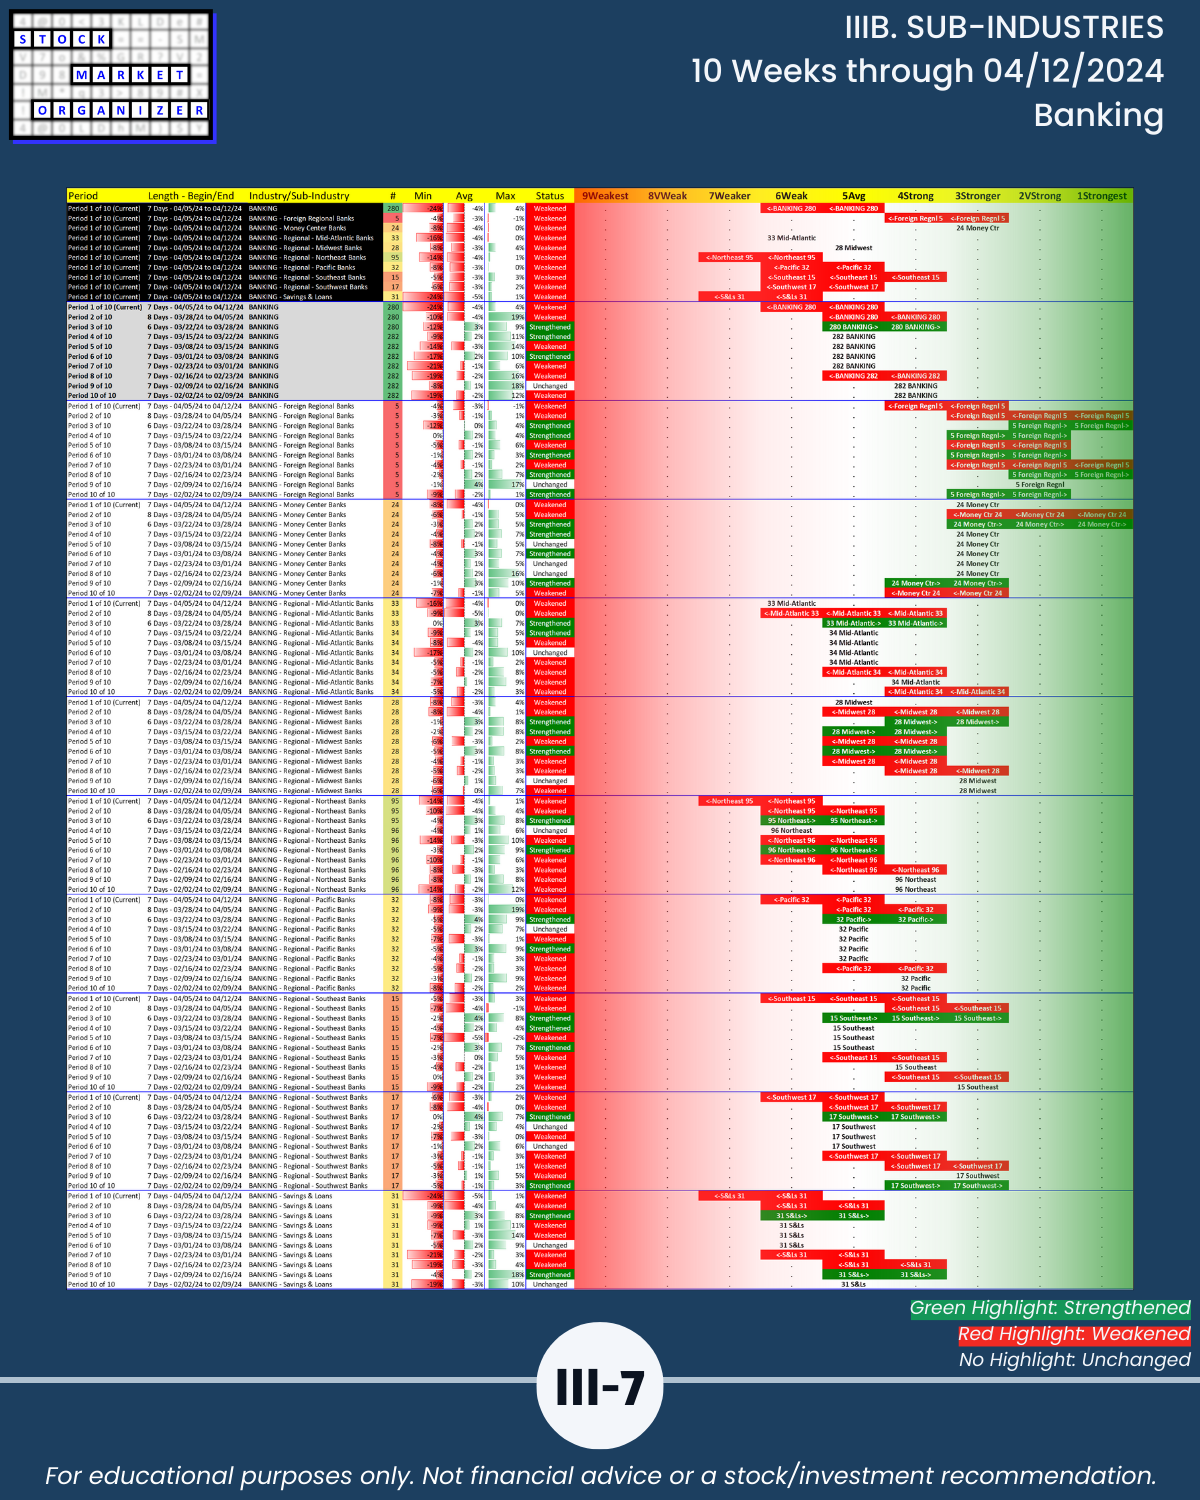
- Banking
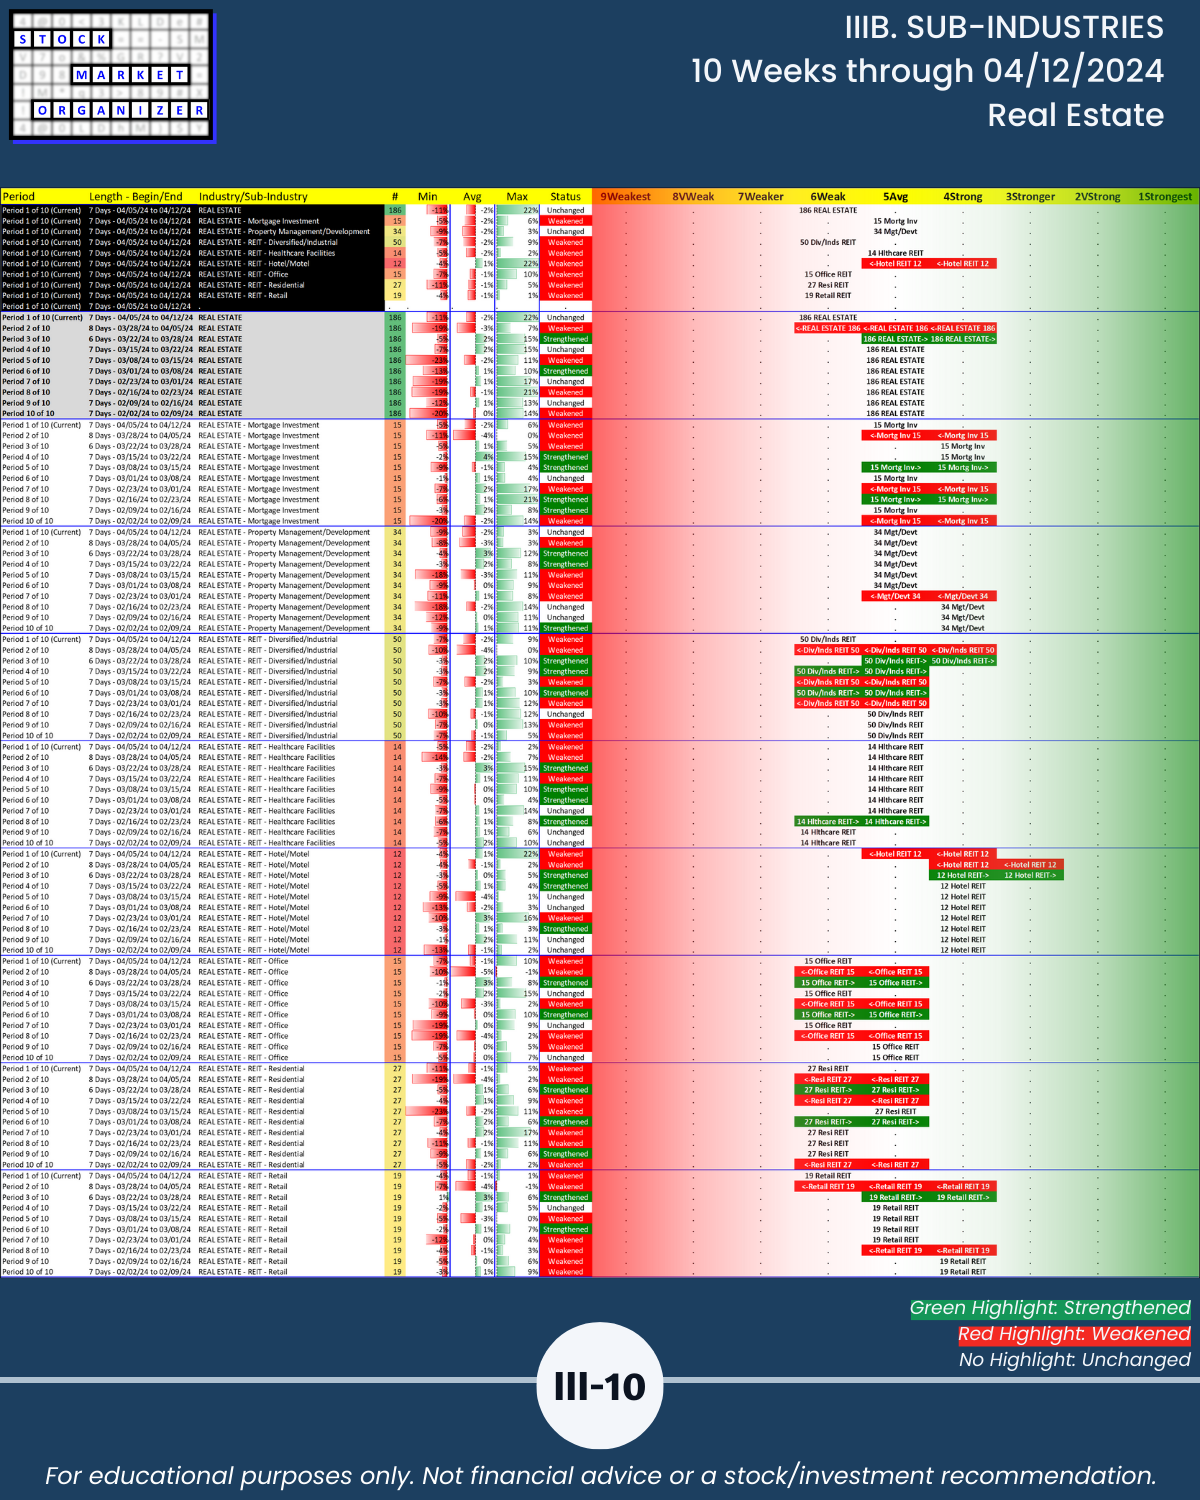
- Real Estate
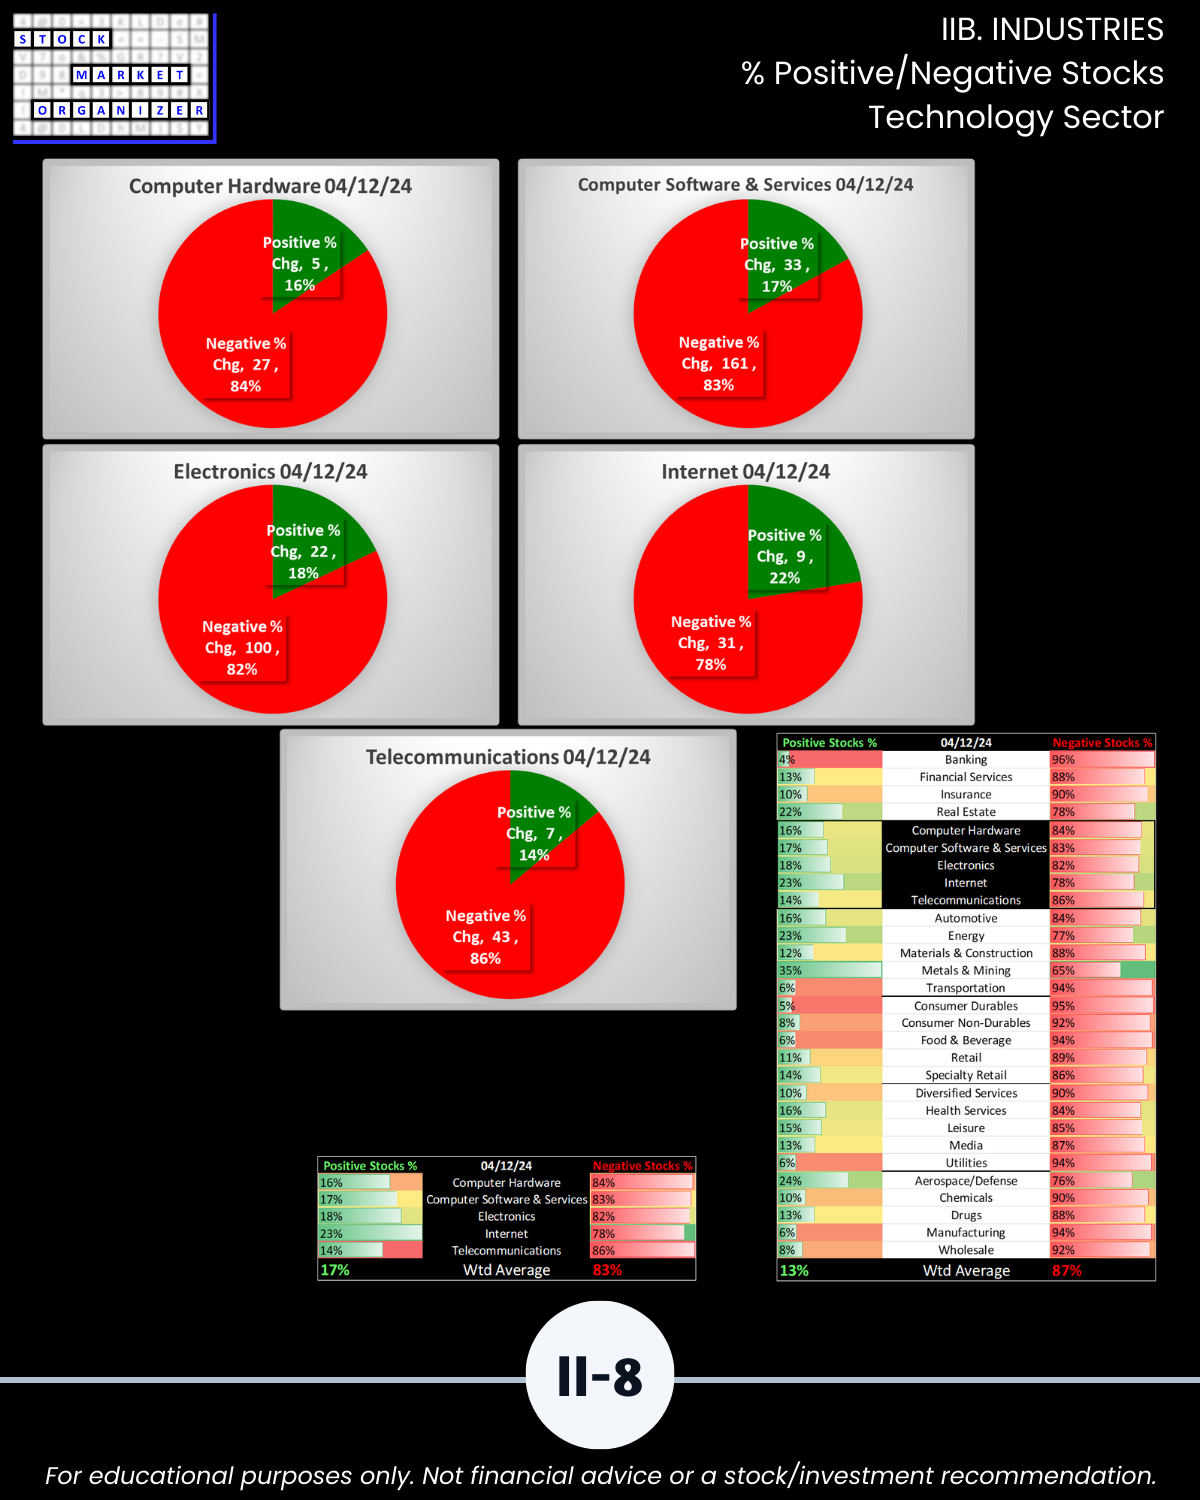
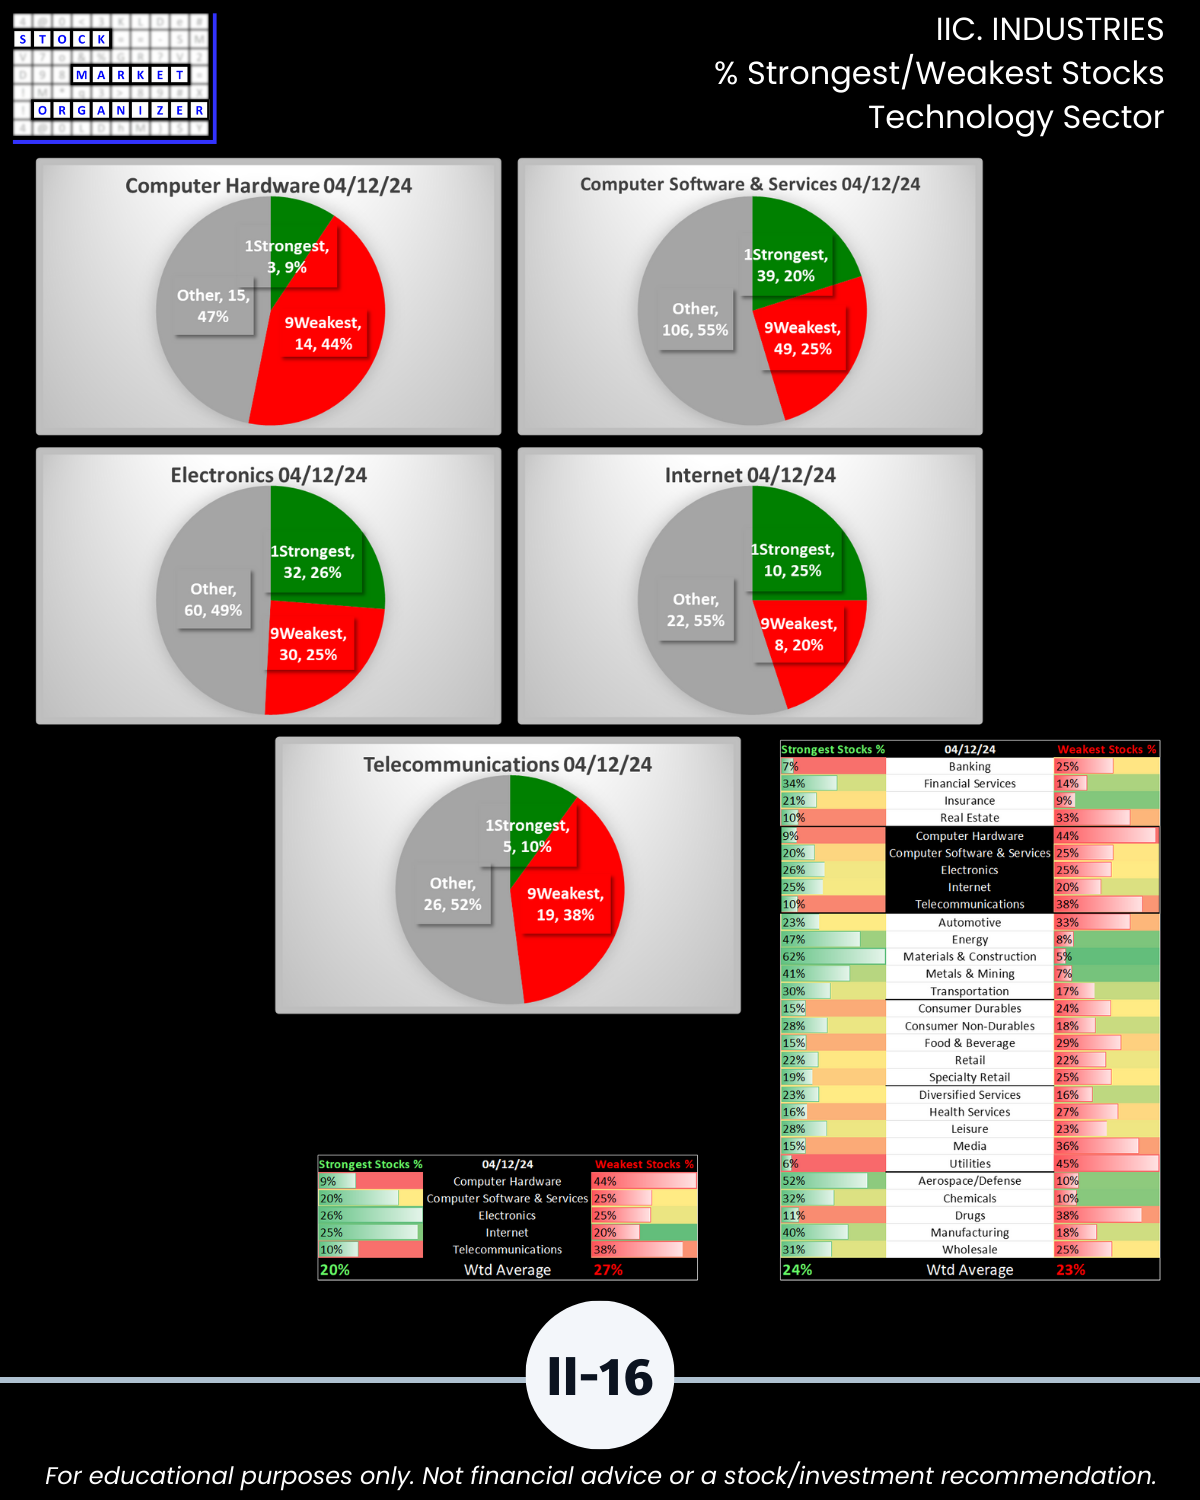
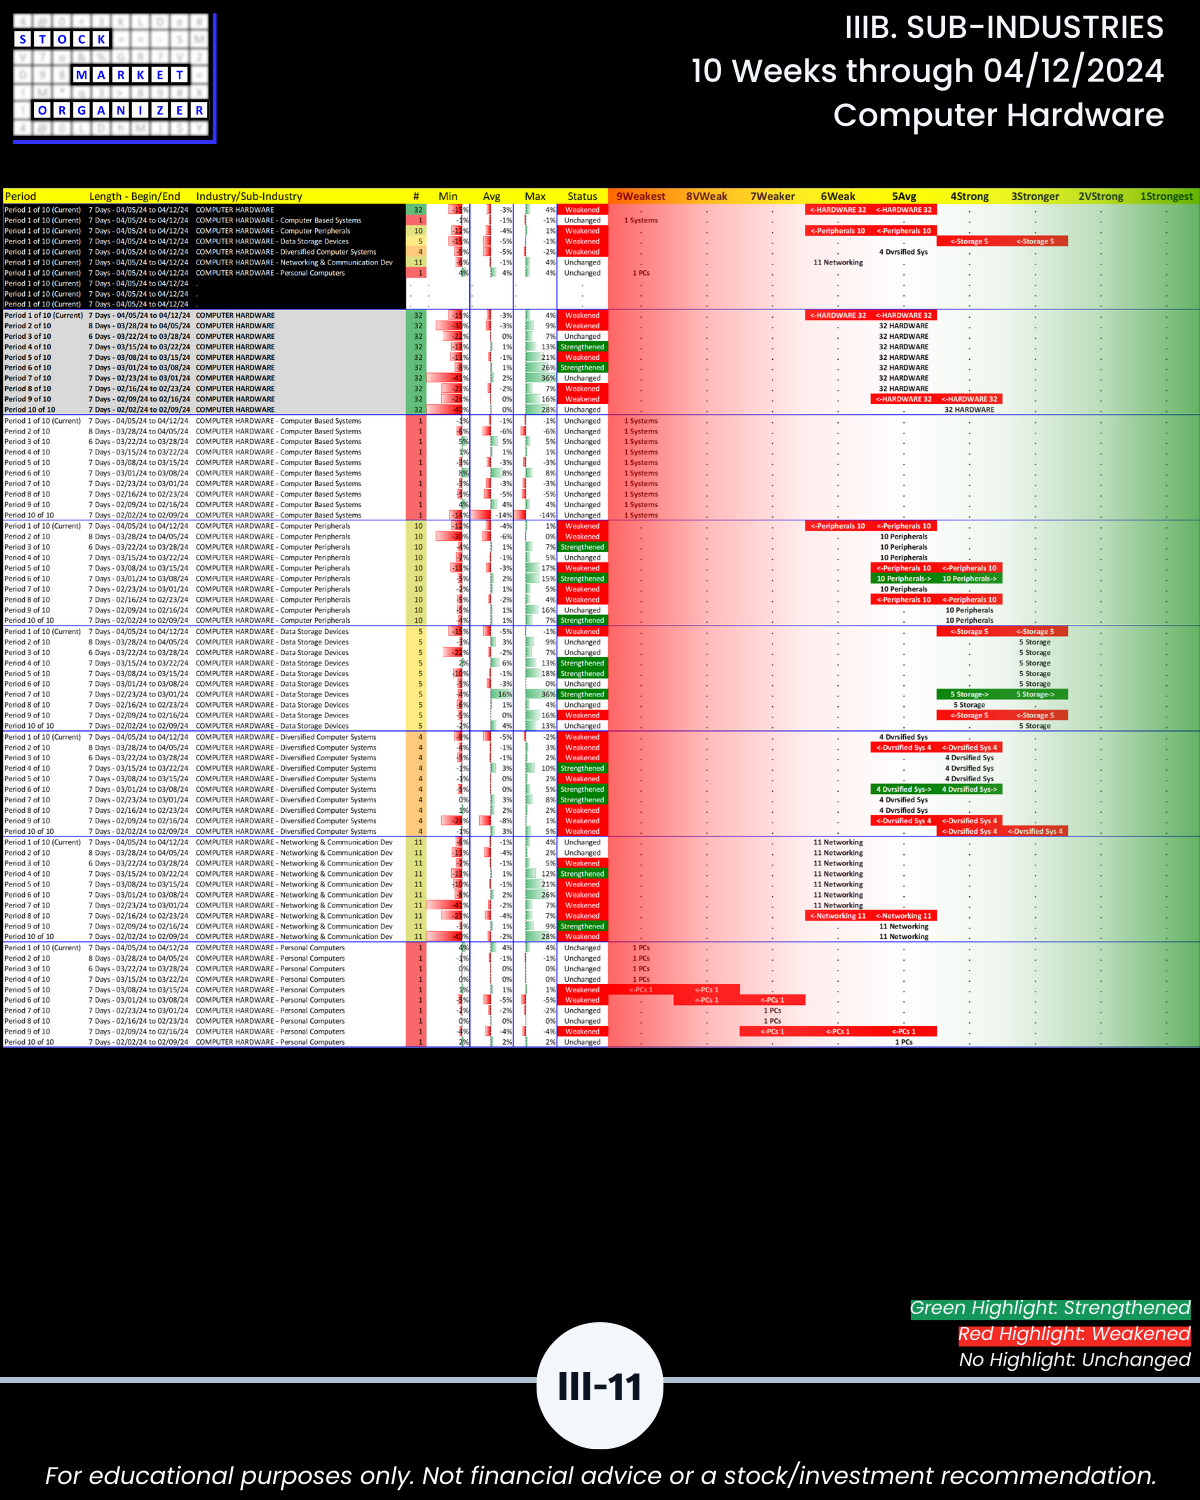
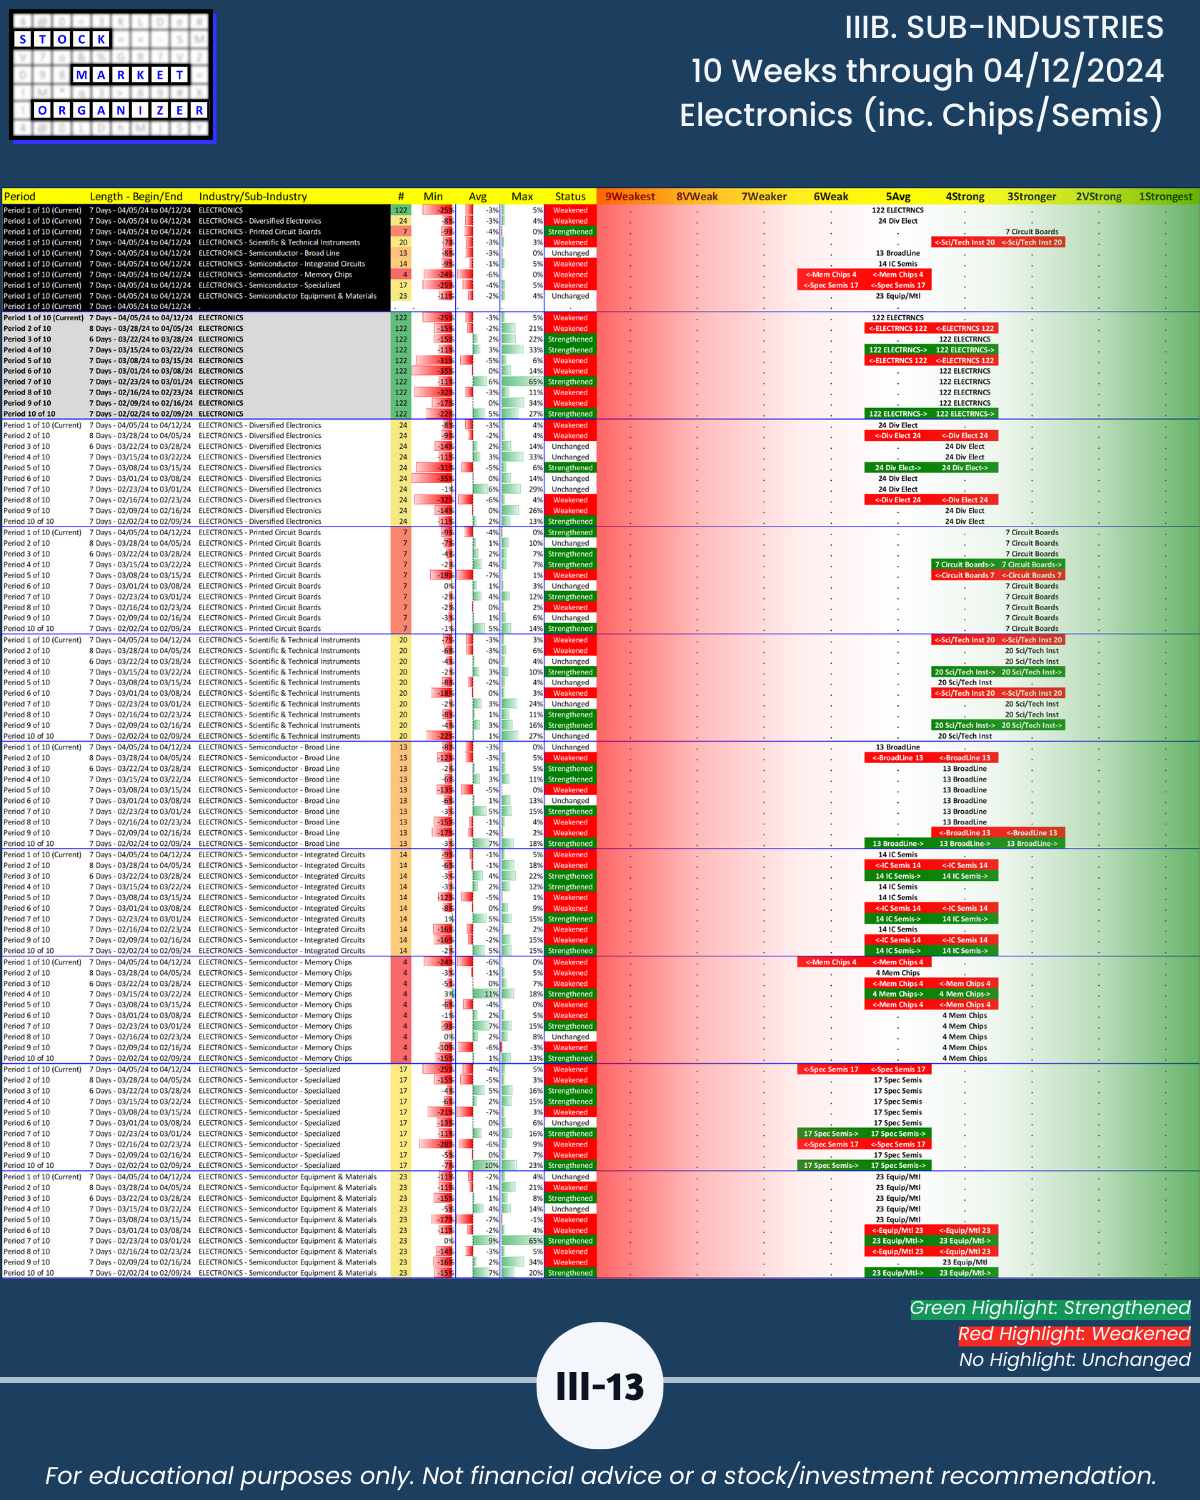
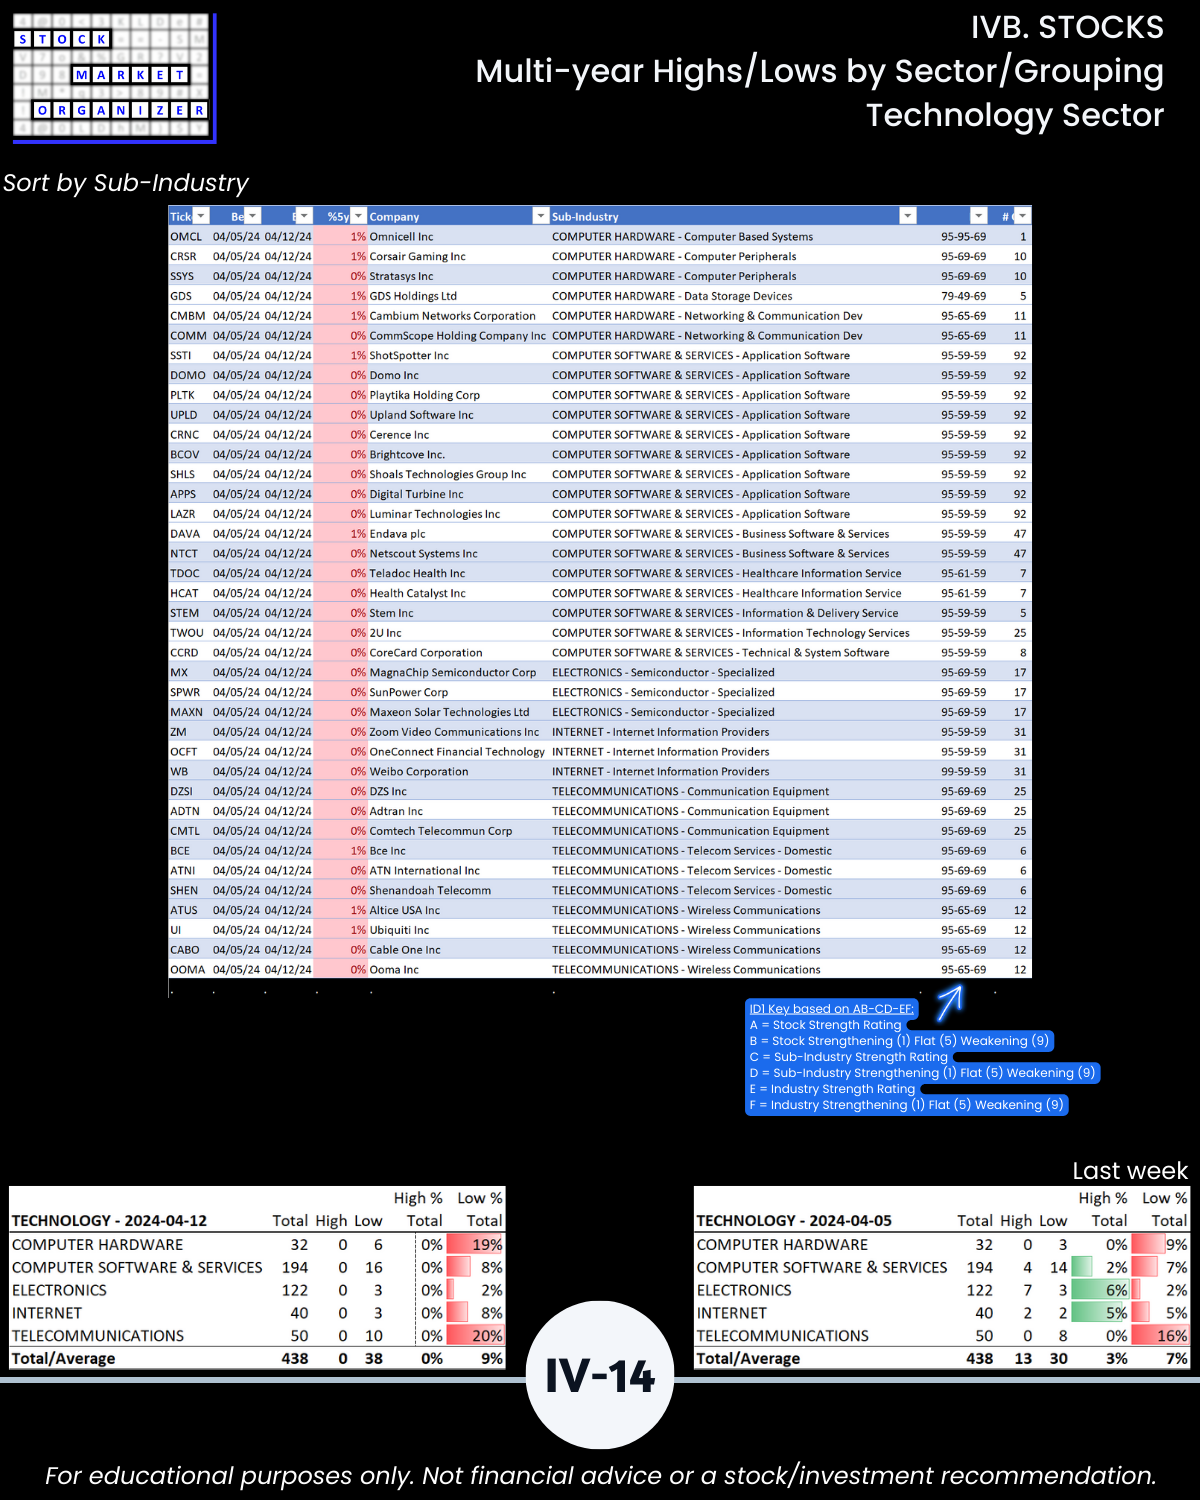
- Computer Hardware
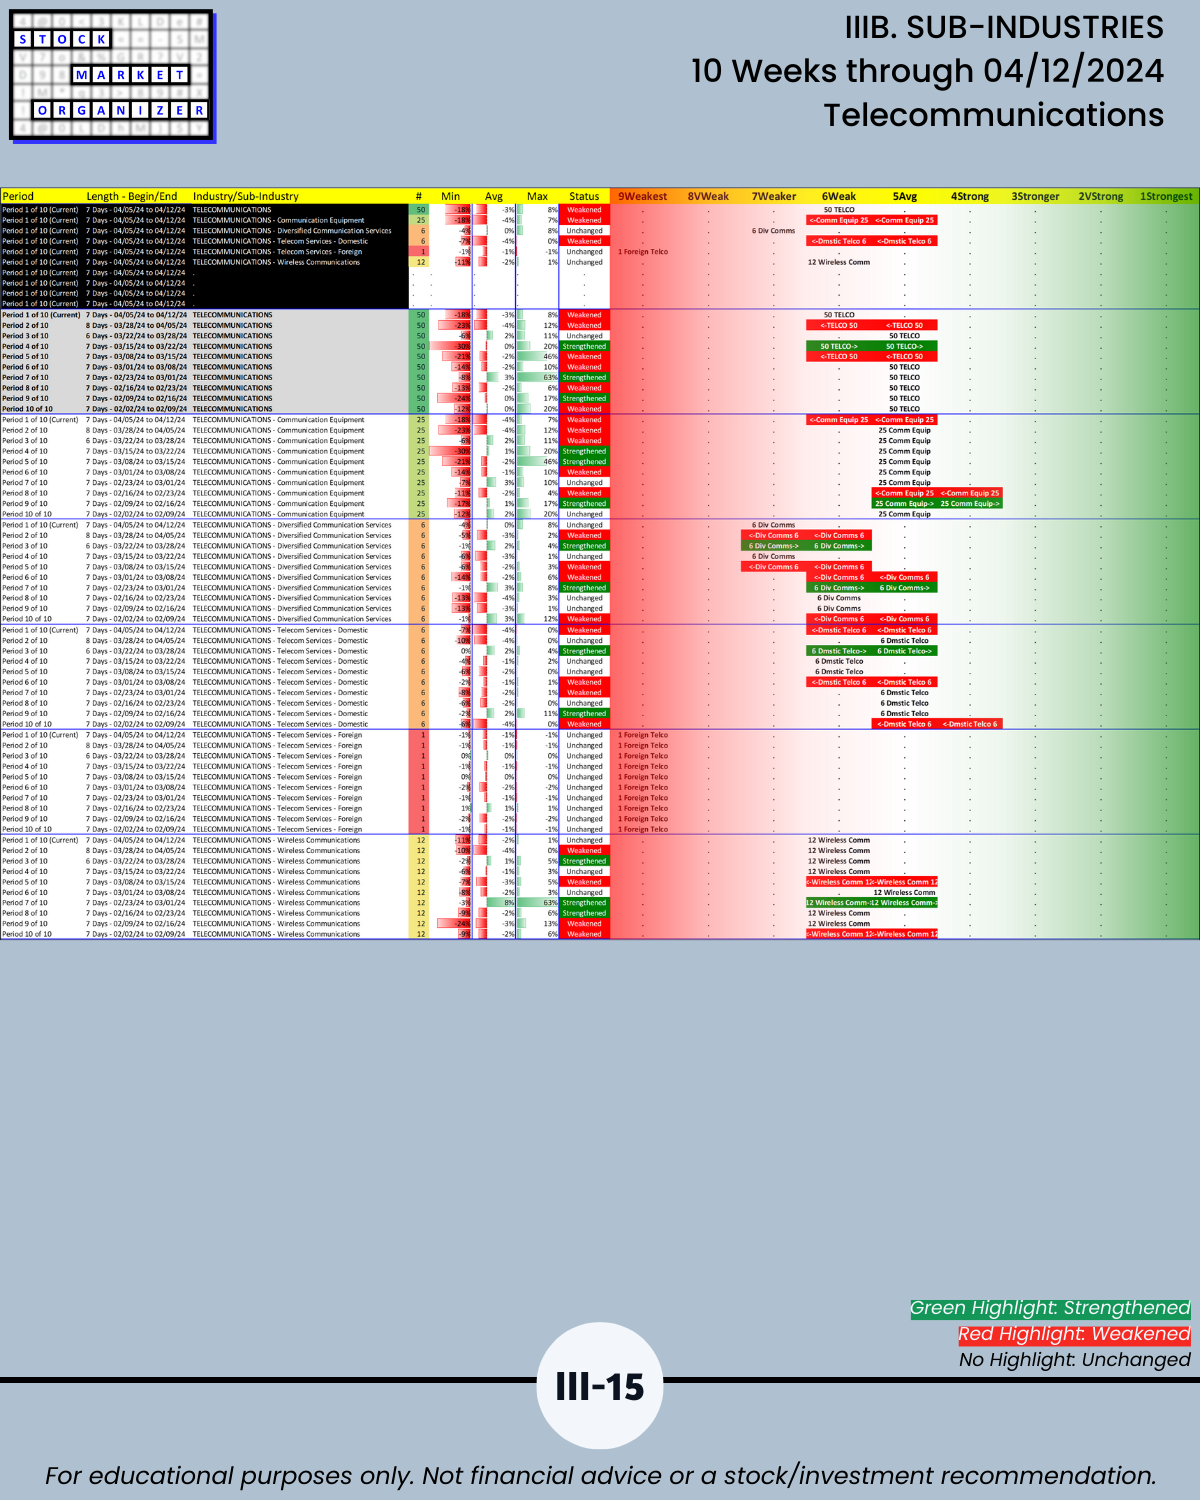
- Telecommunications
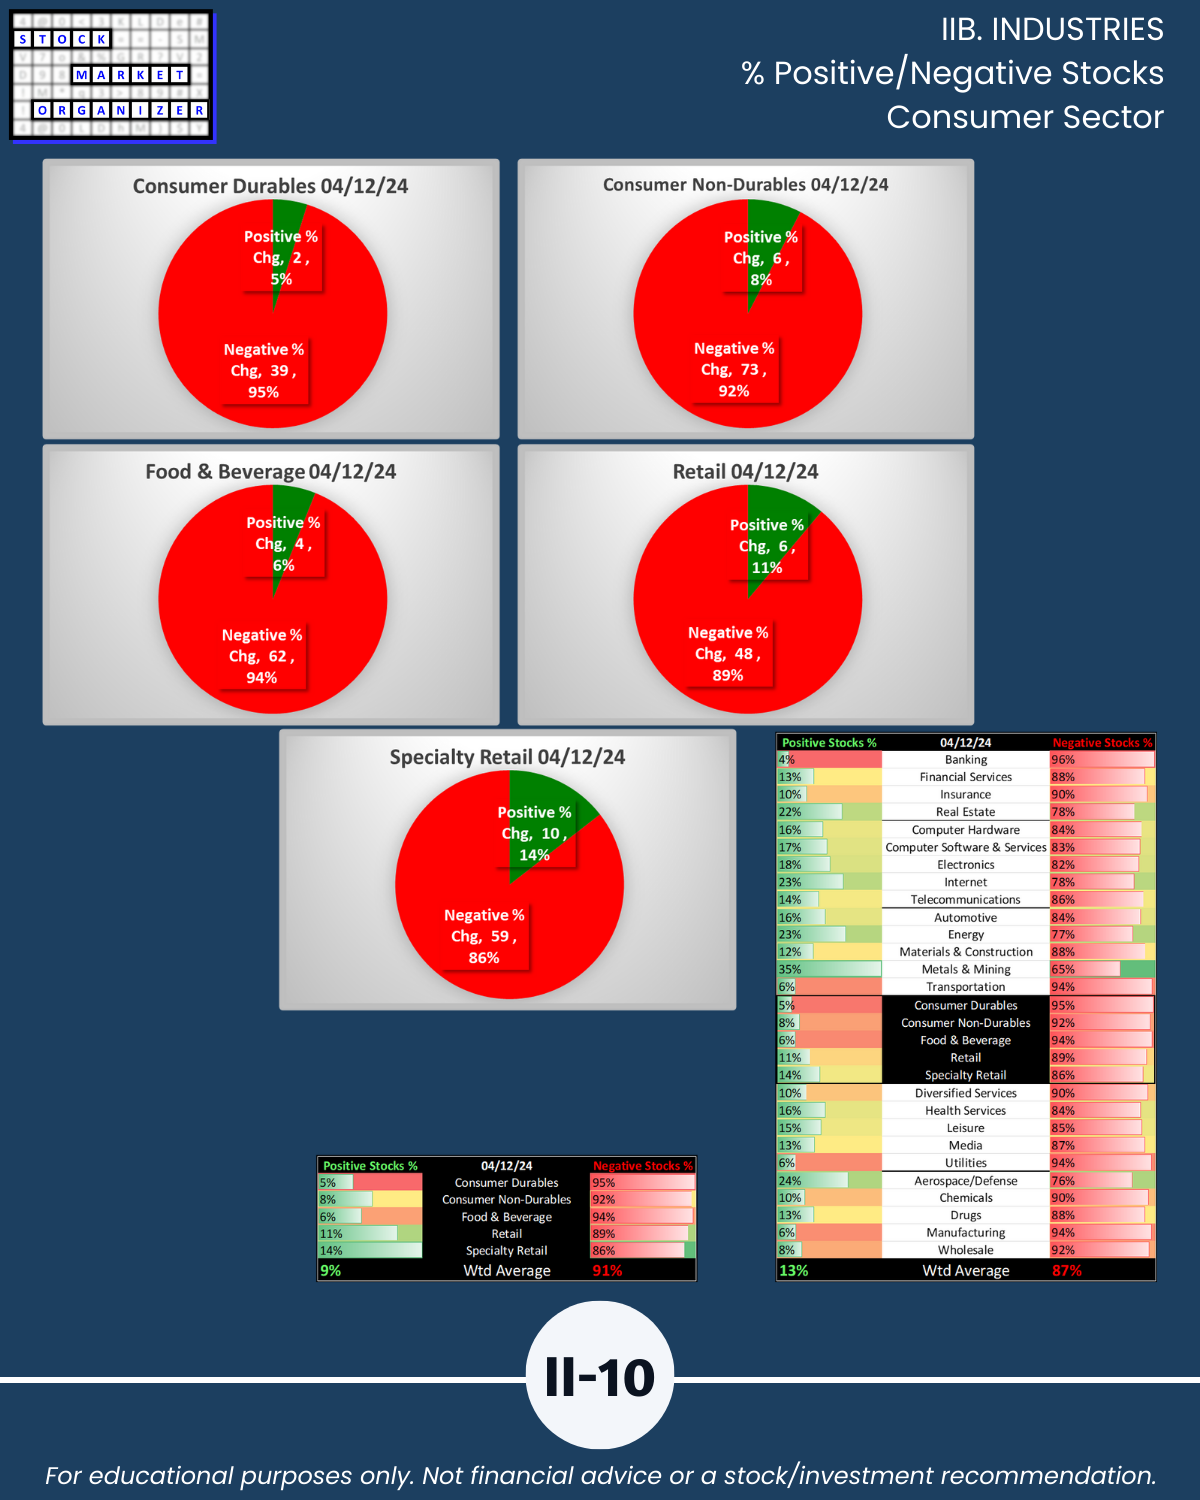
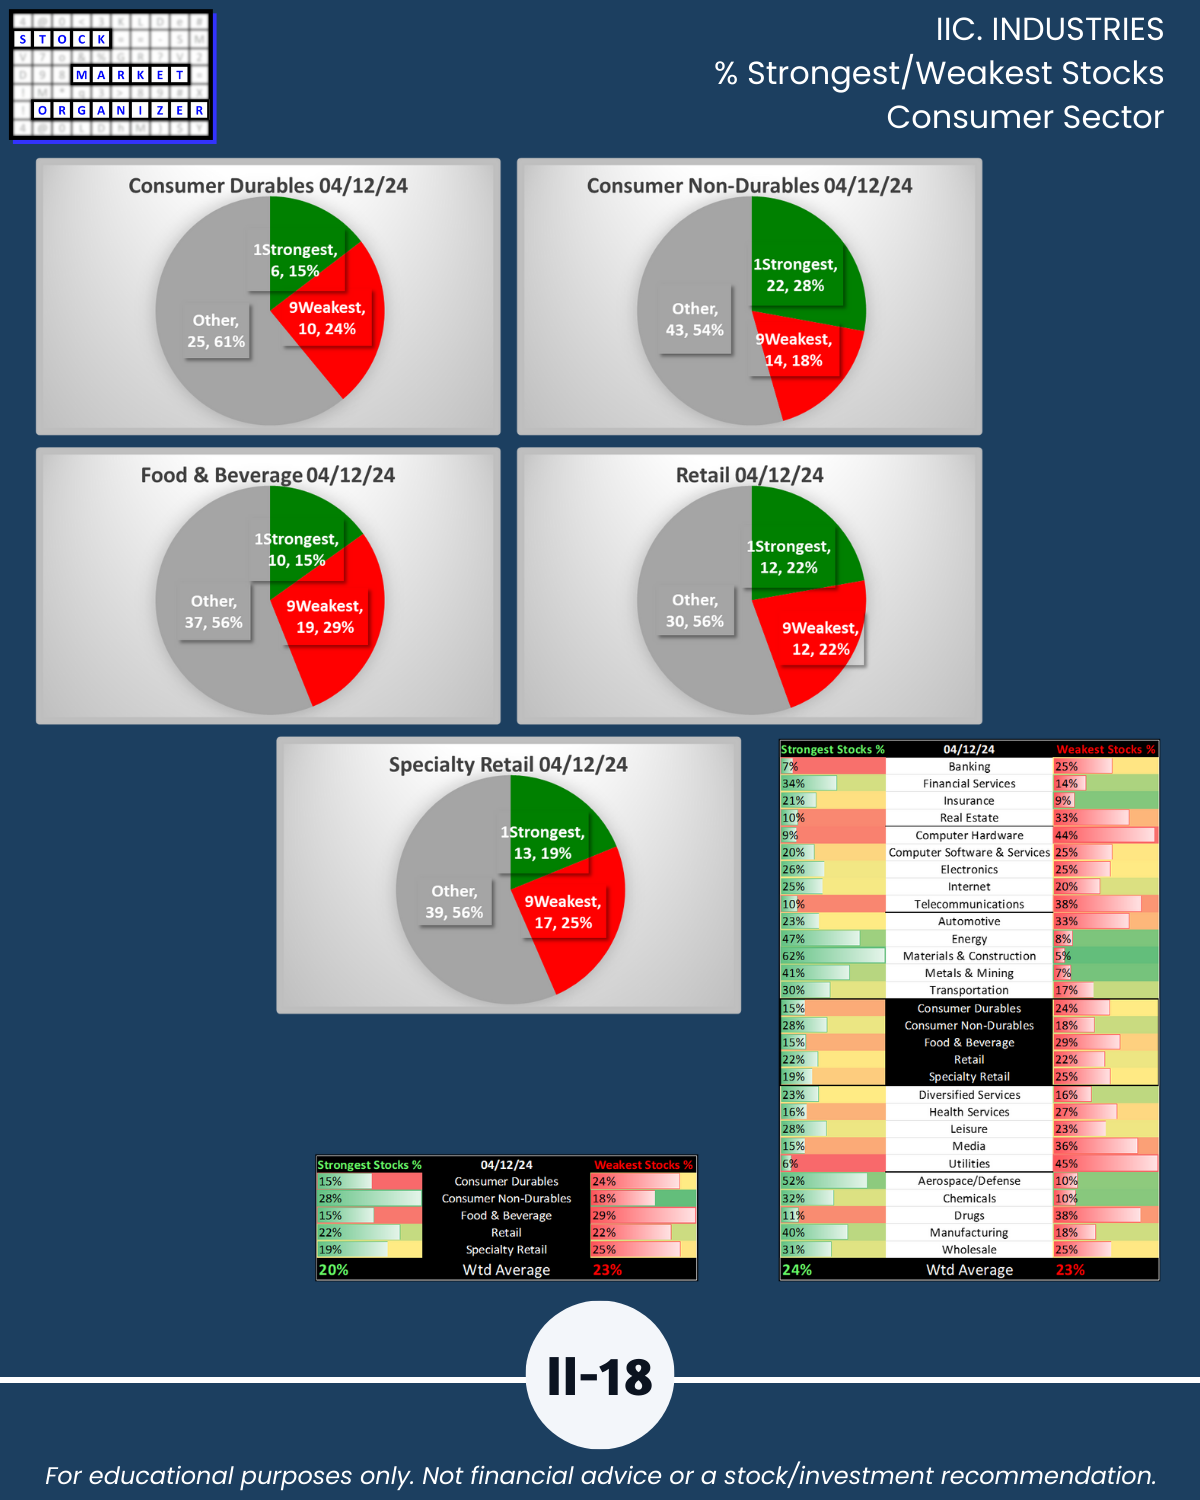
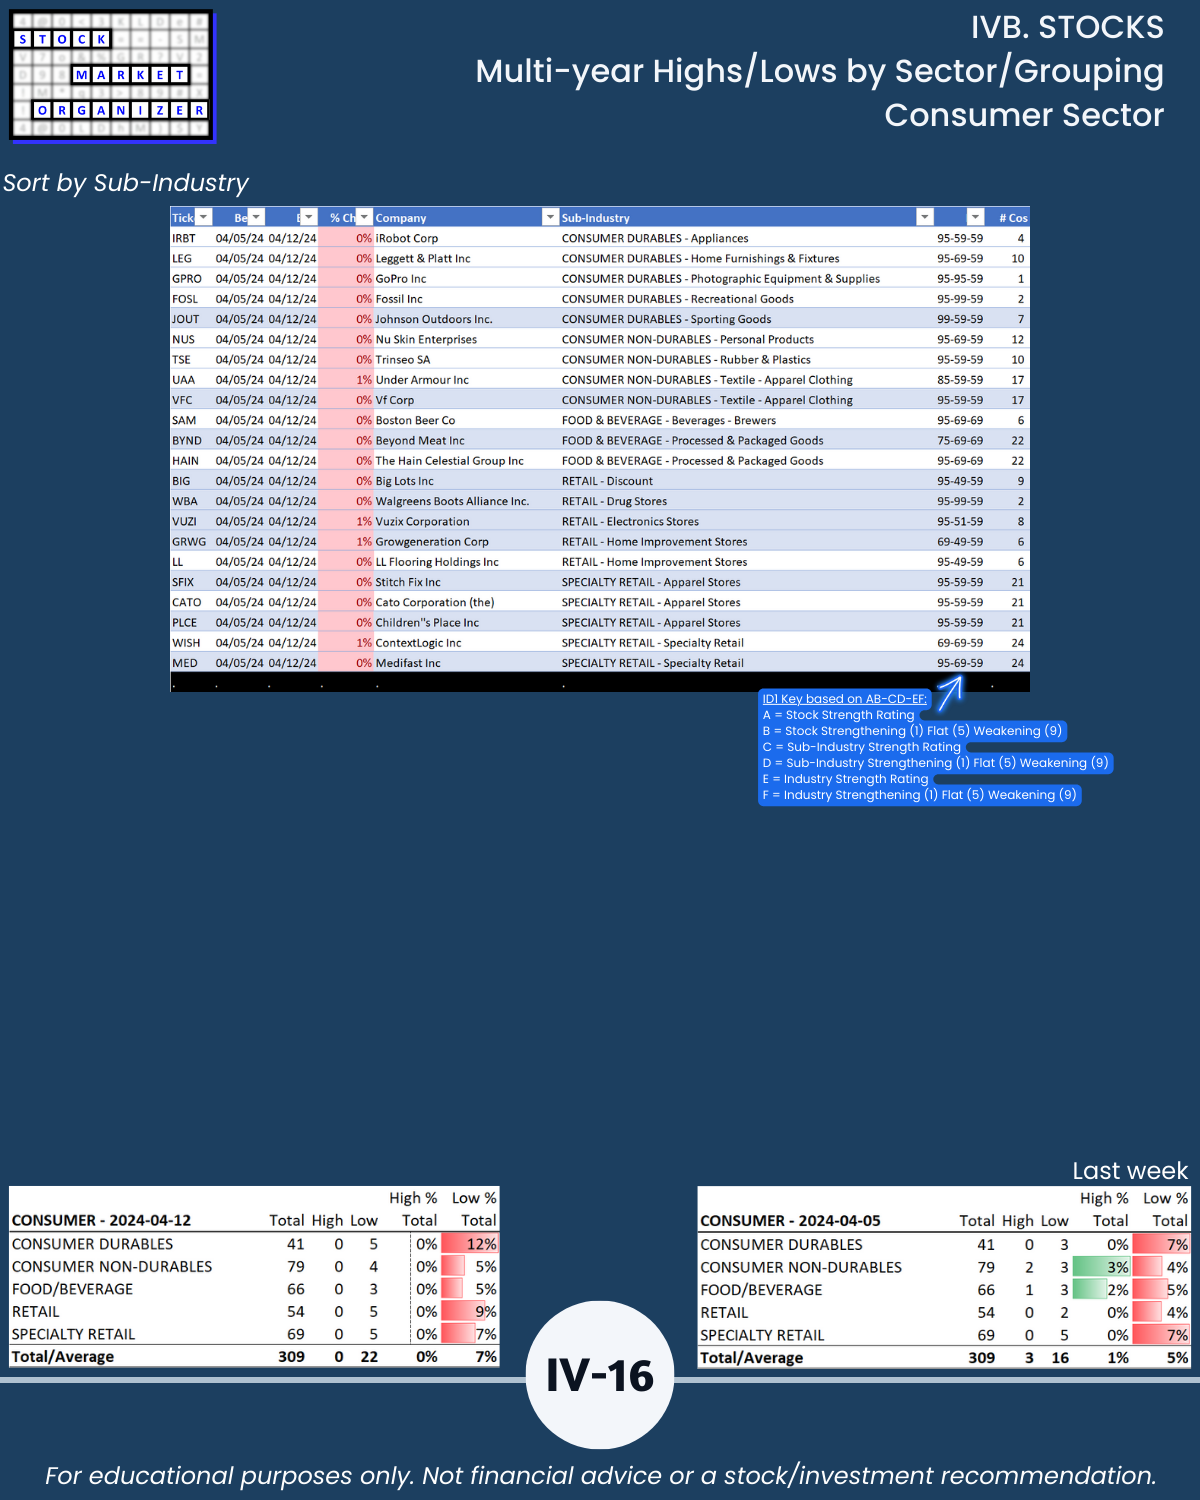
- Food & Beverage
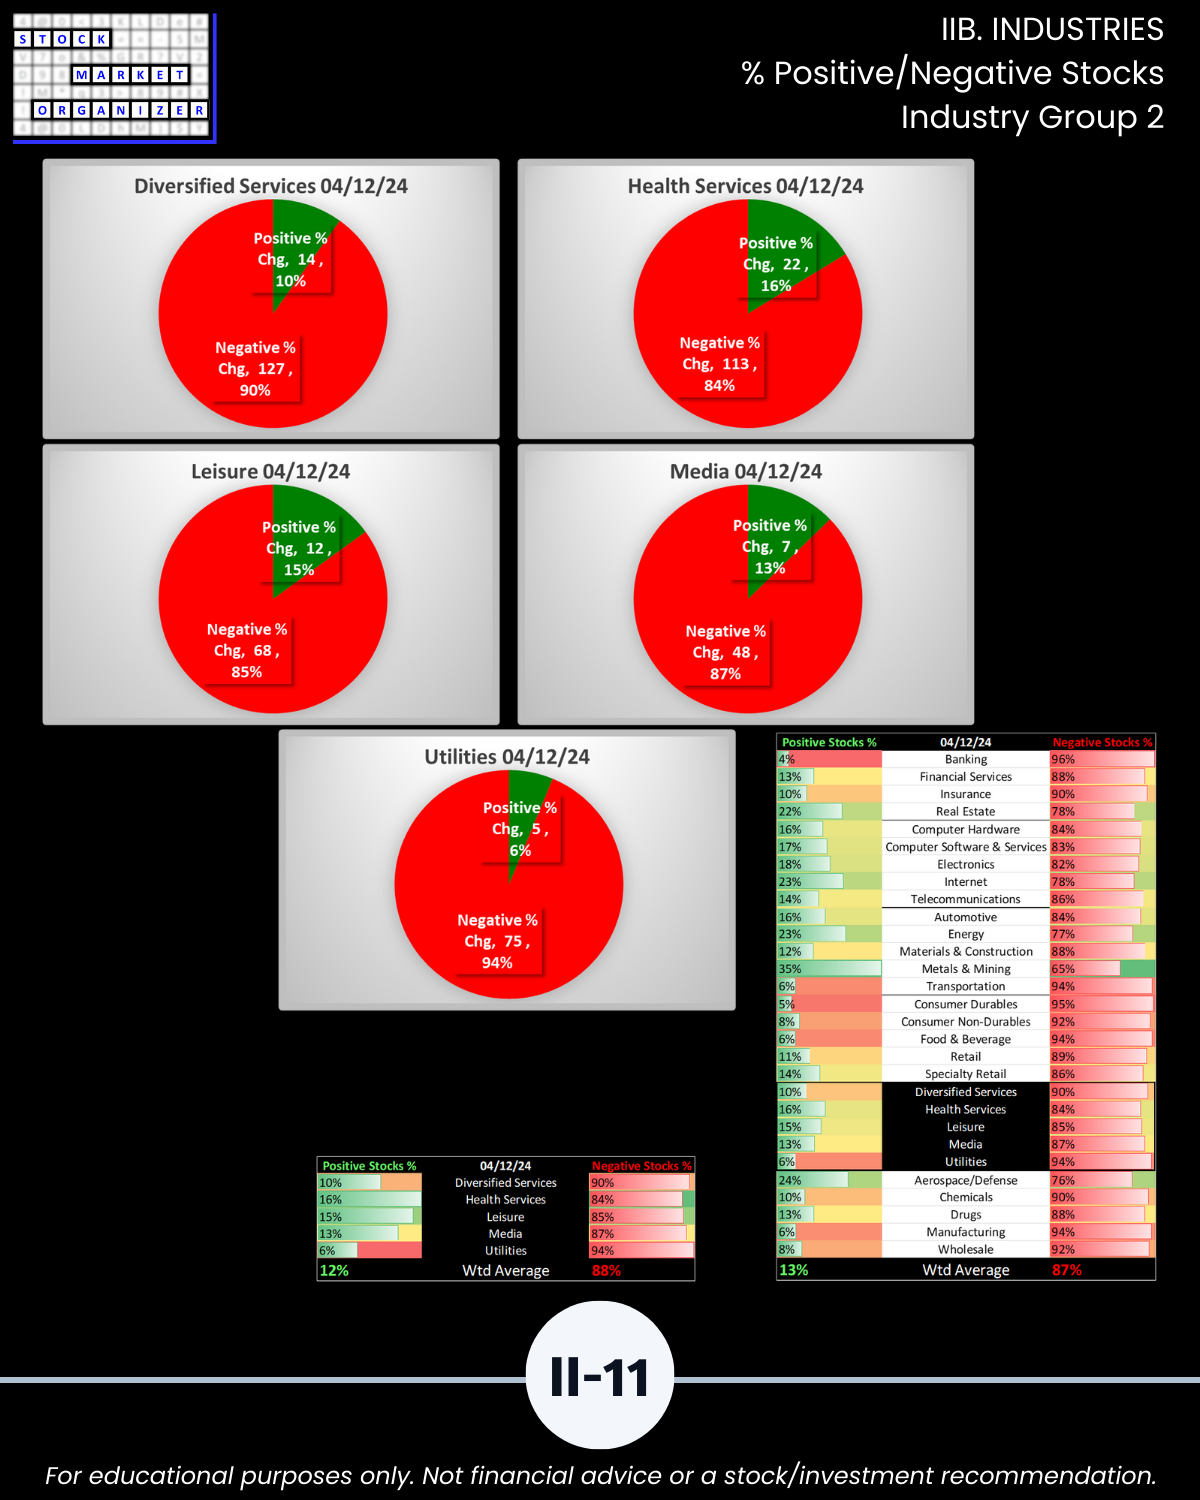
- Media
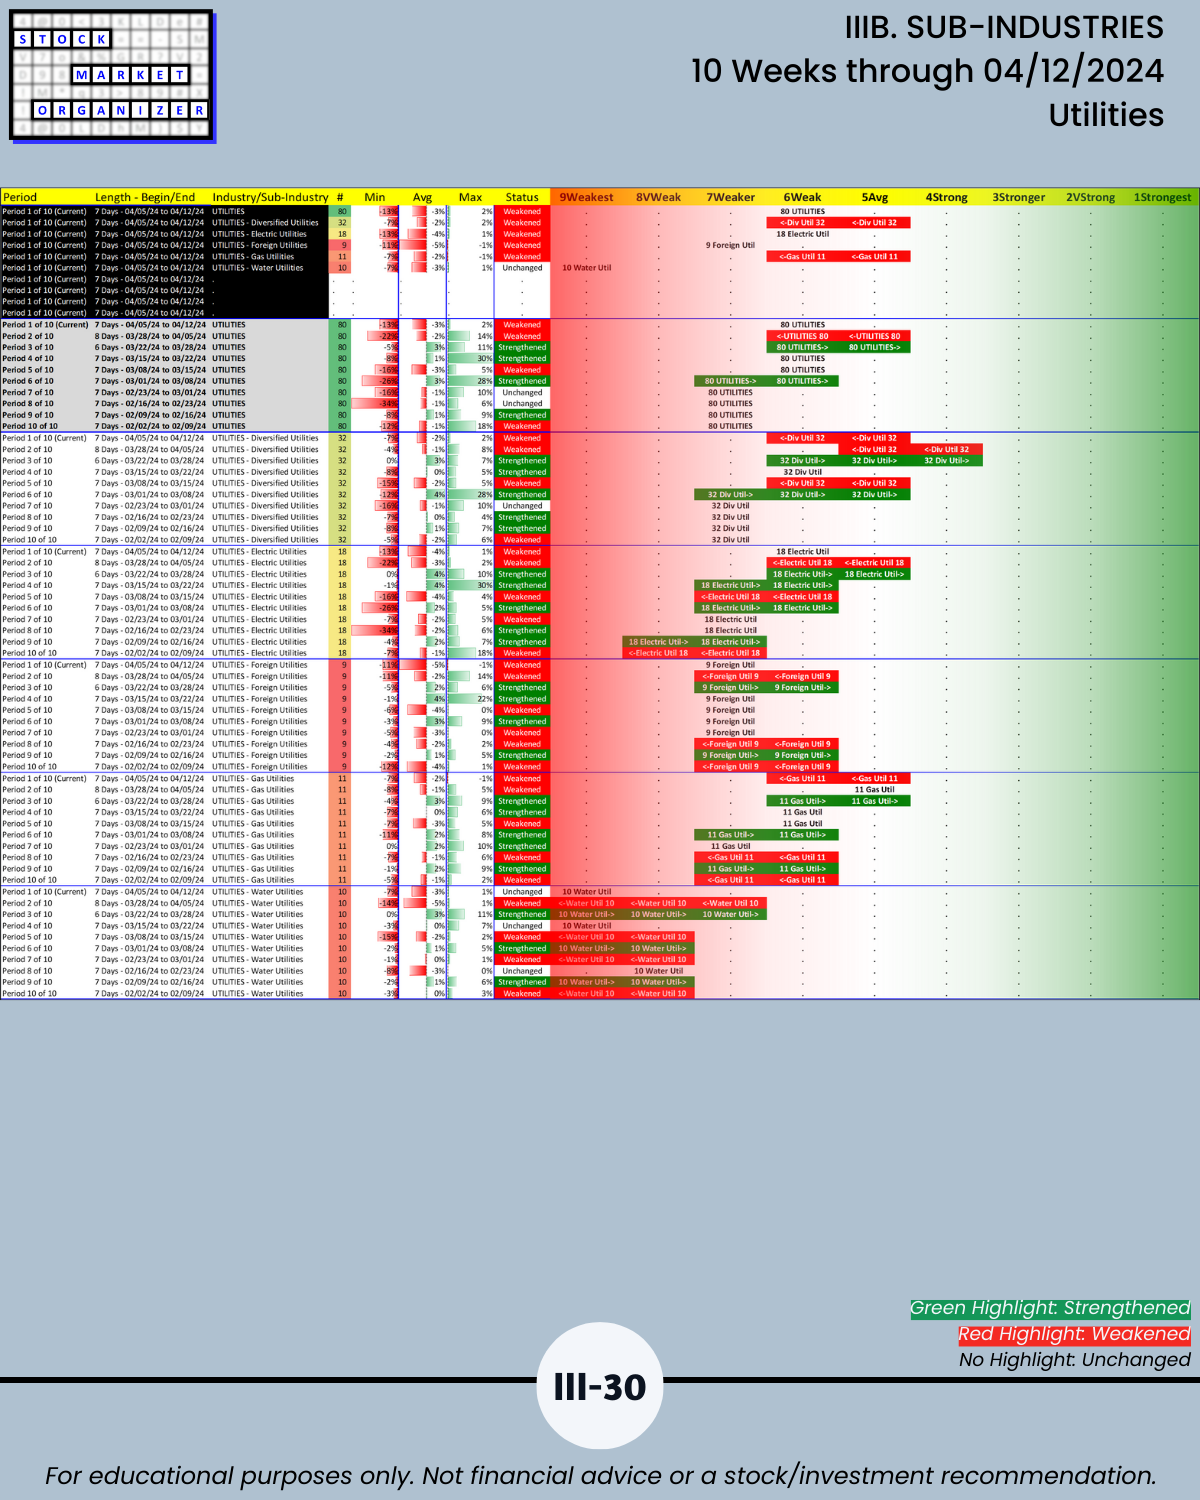
- Utilities
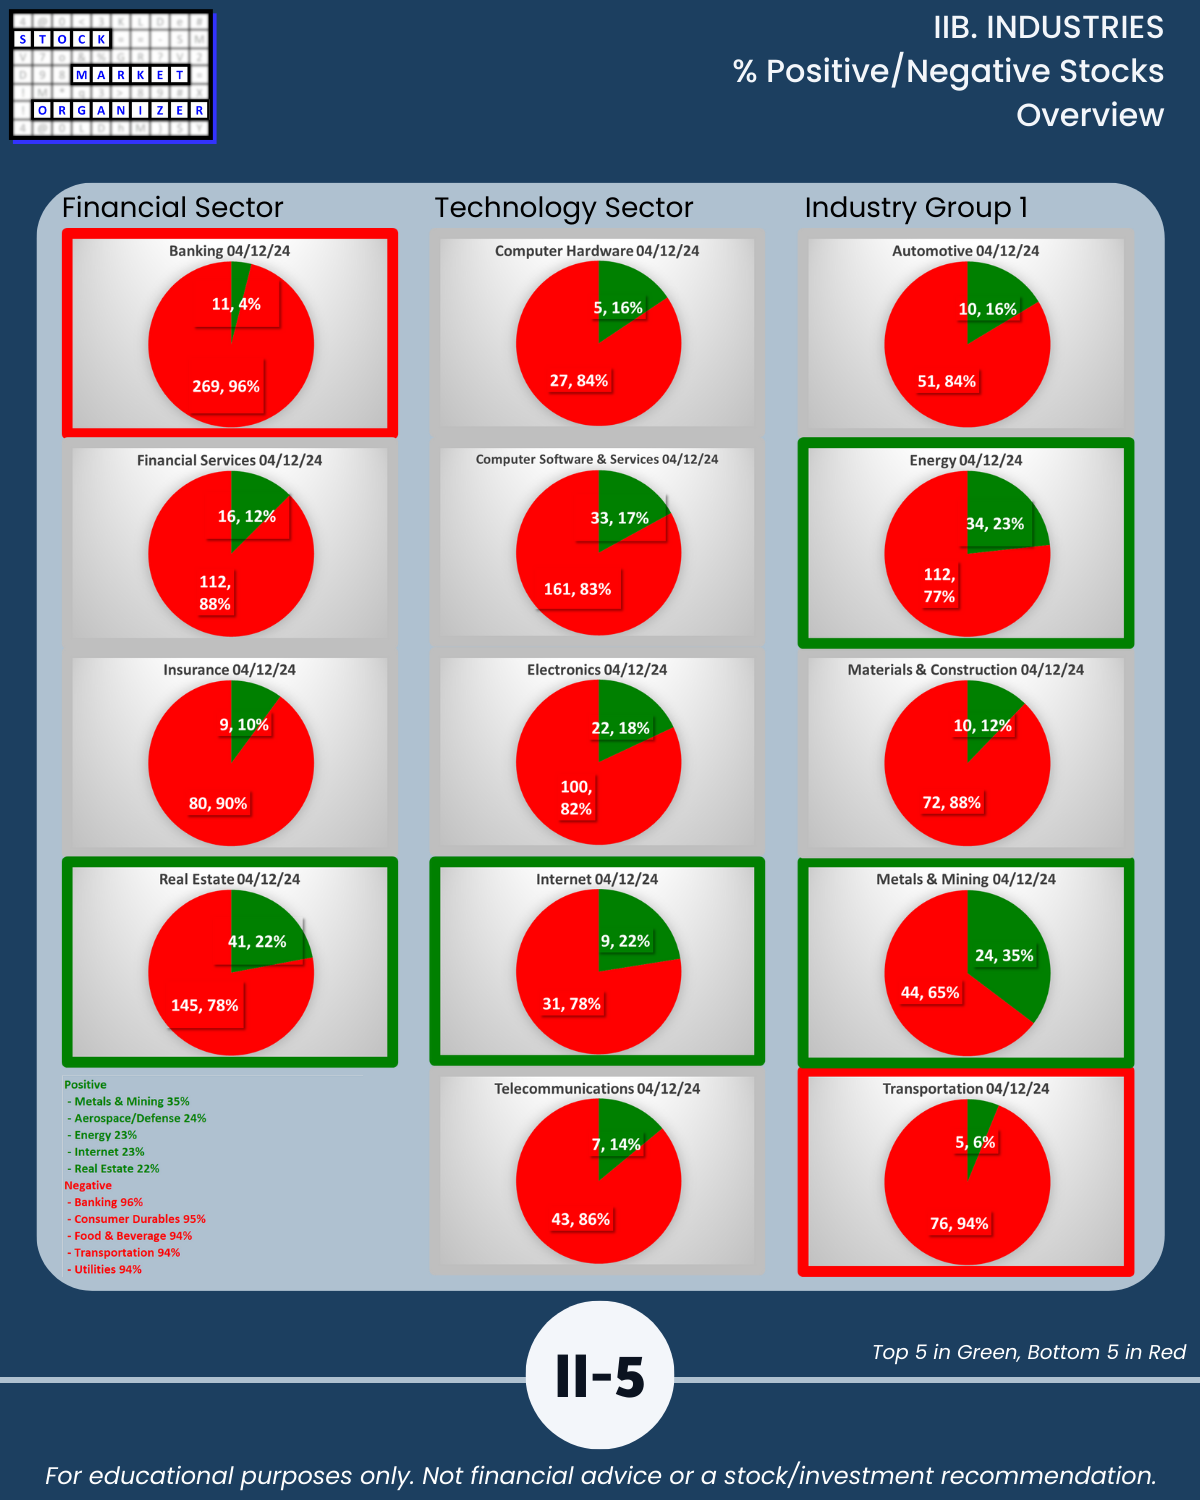
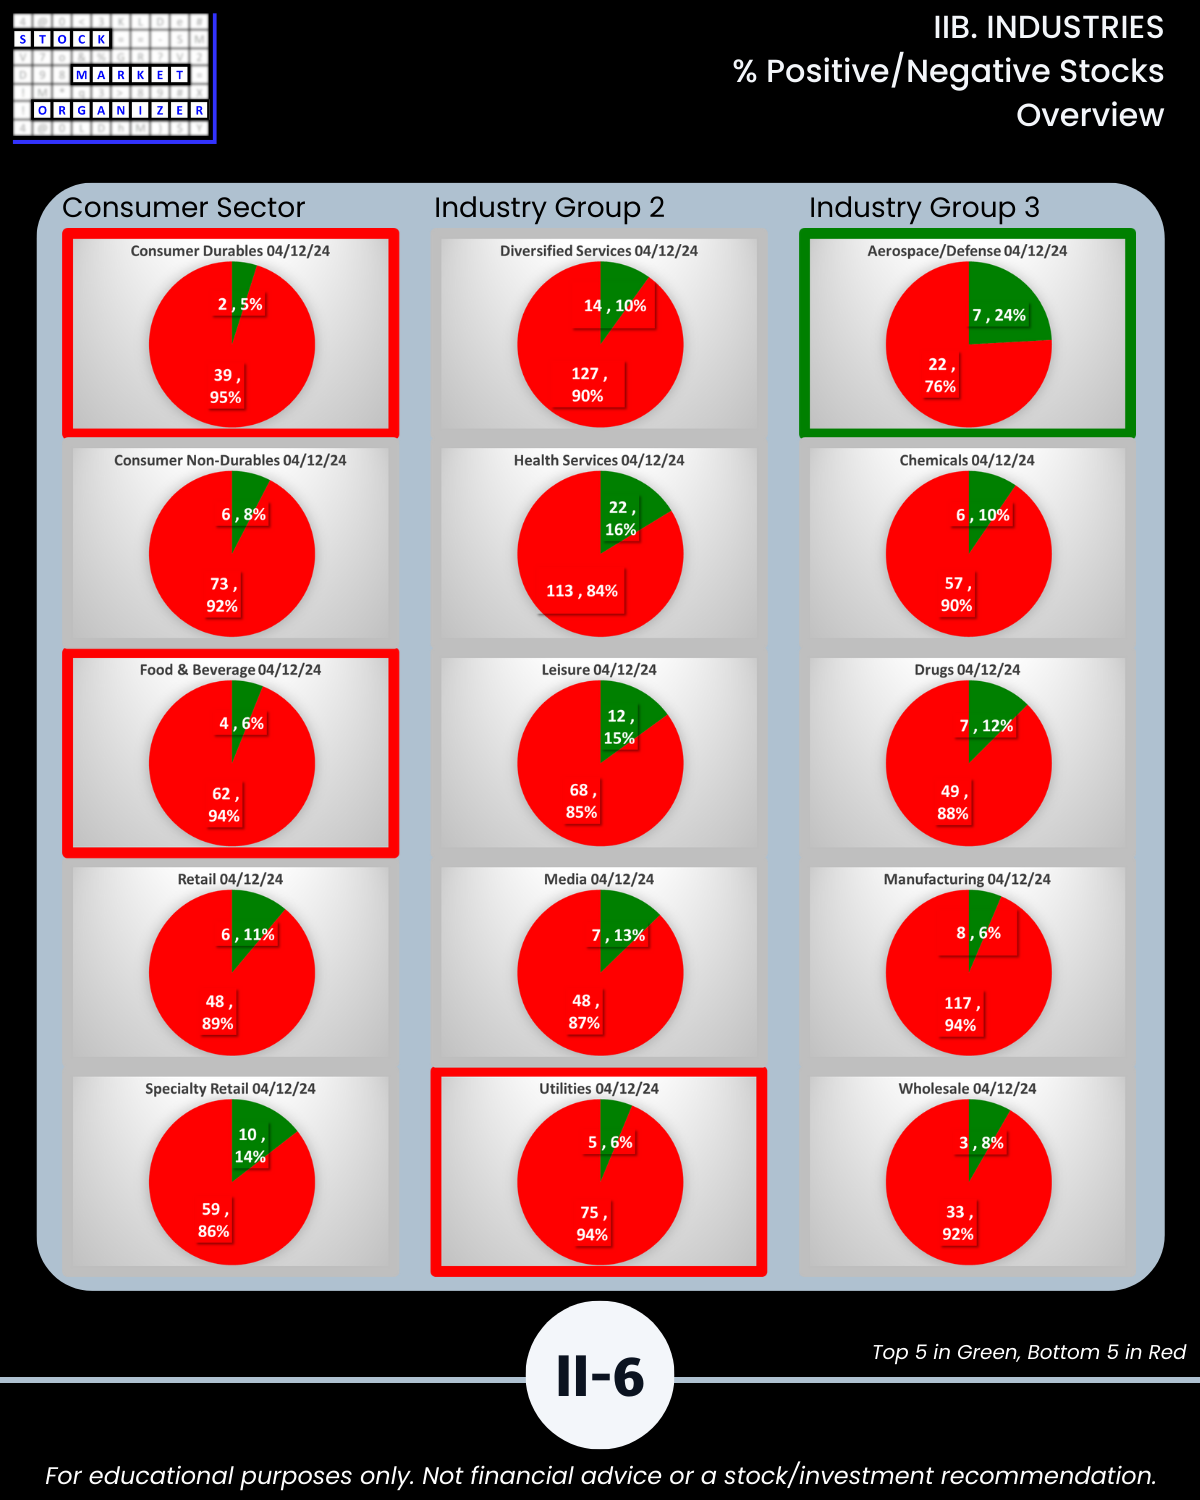
🔹 Highest Positive Stocks 22% to 35% (BELOW last week 35% to 78%)
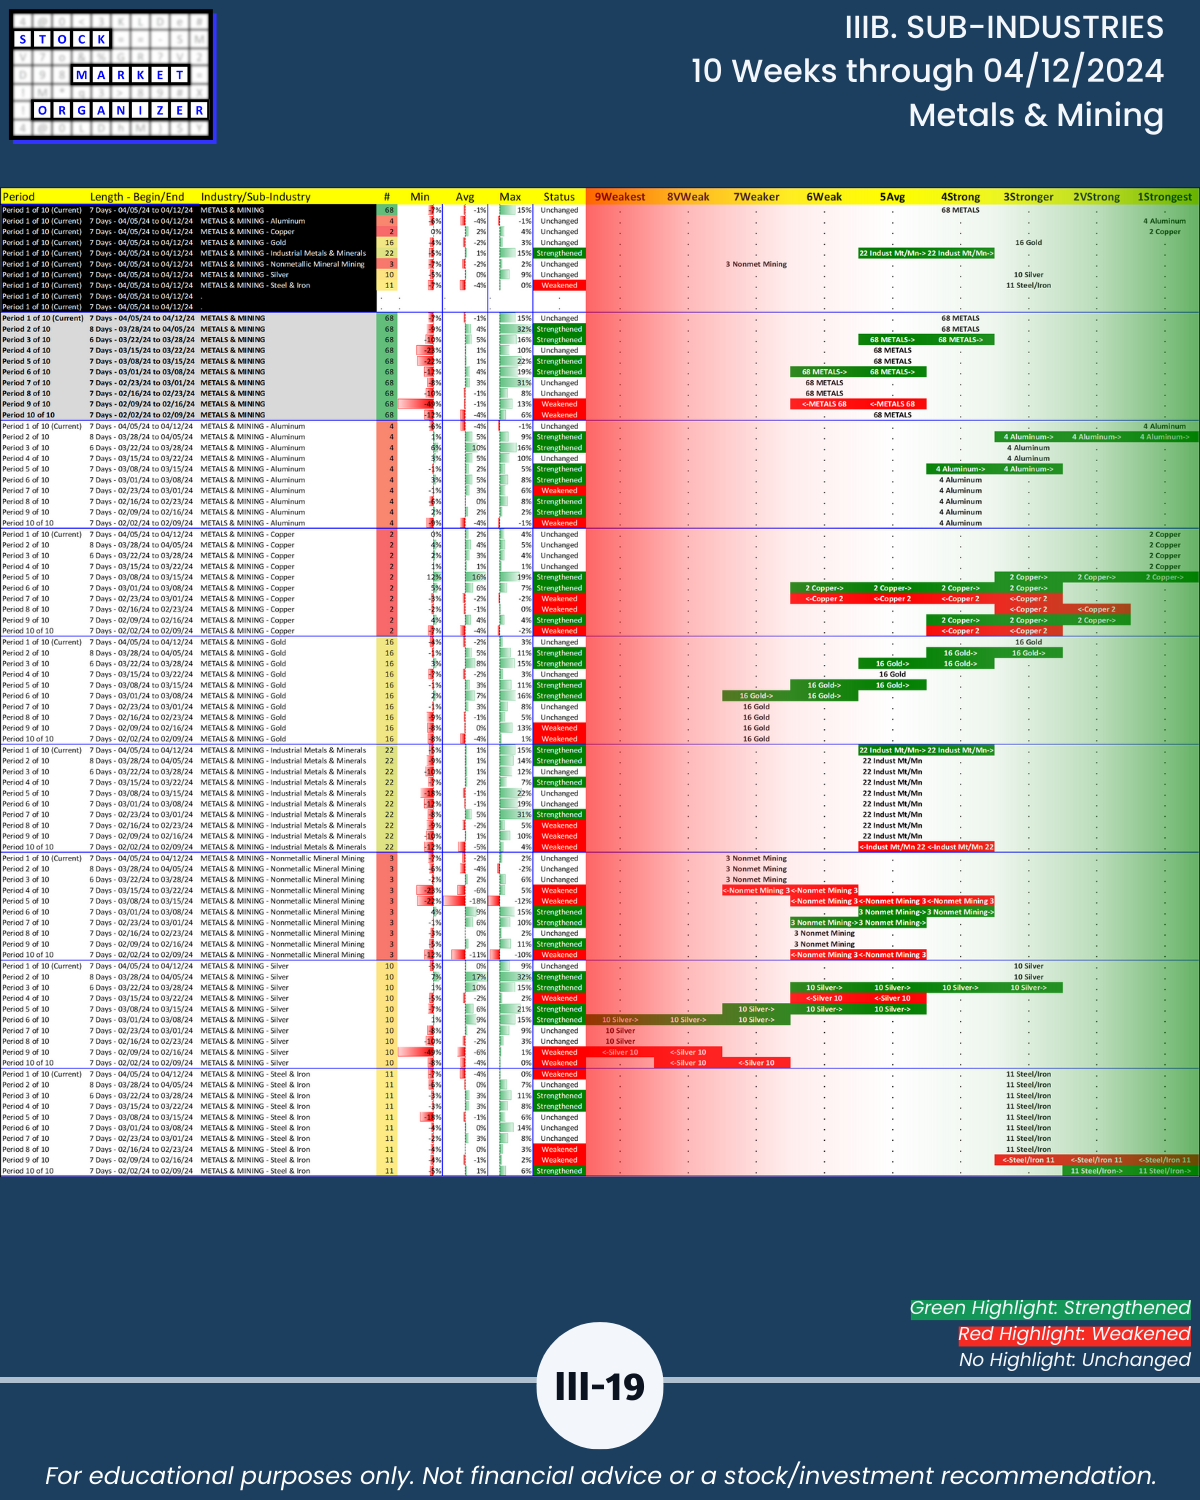
- Metals & Mining 35%
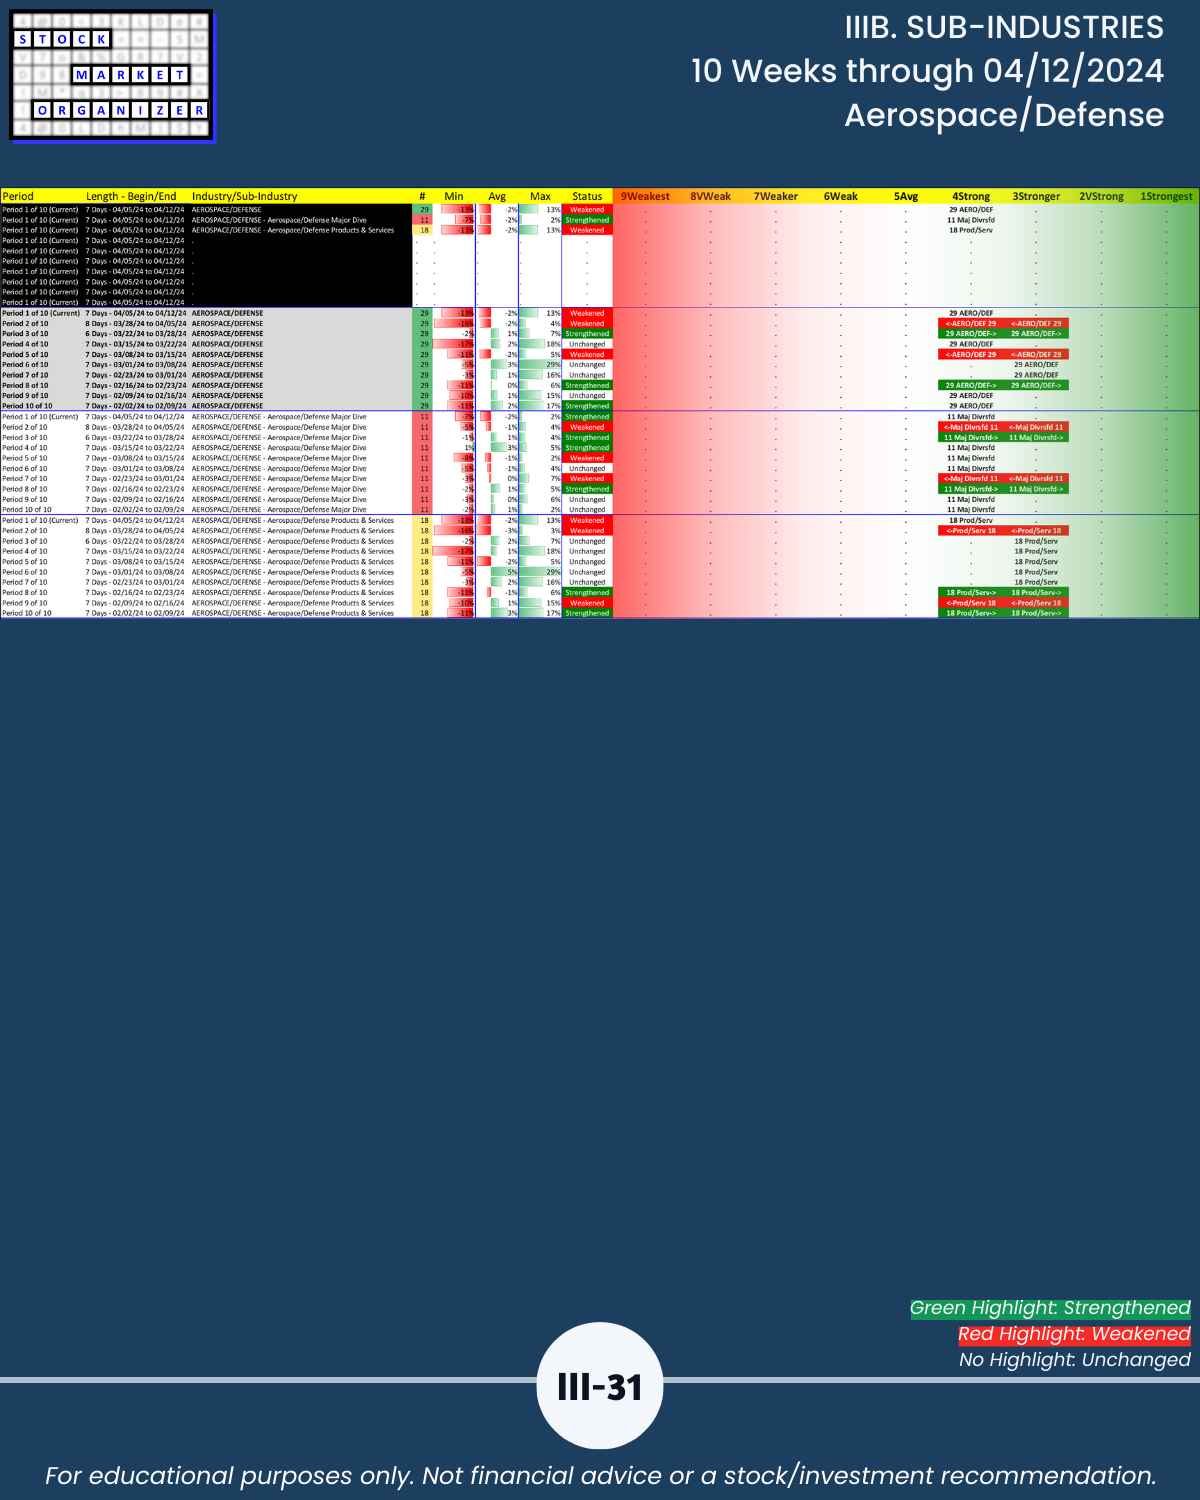
- Aerospace/Defense 24%
- Energy 23%
- Internet 23%
- Real Estate 22%
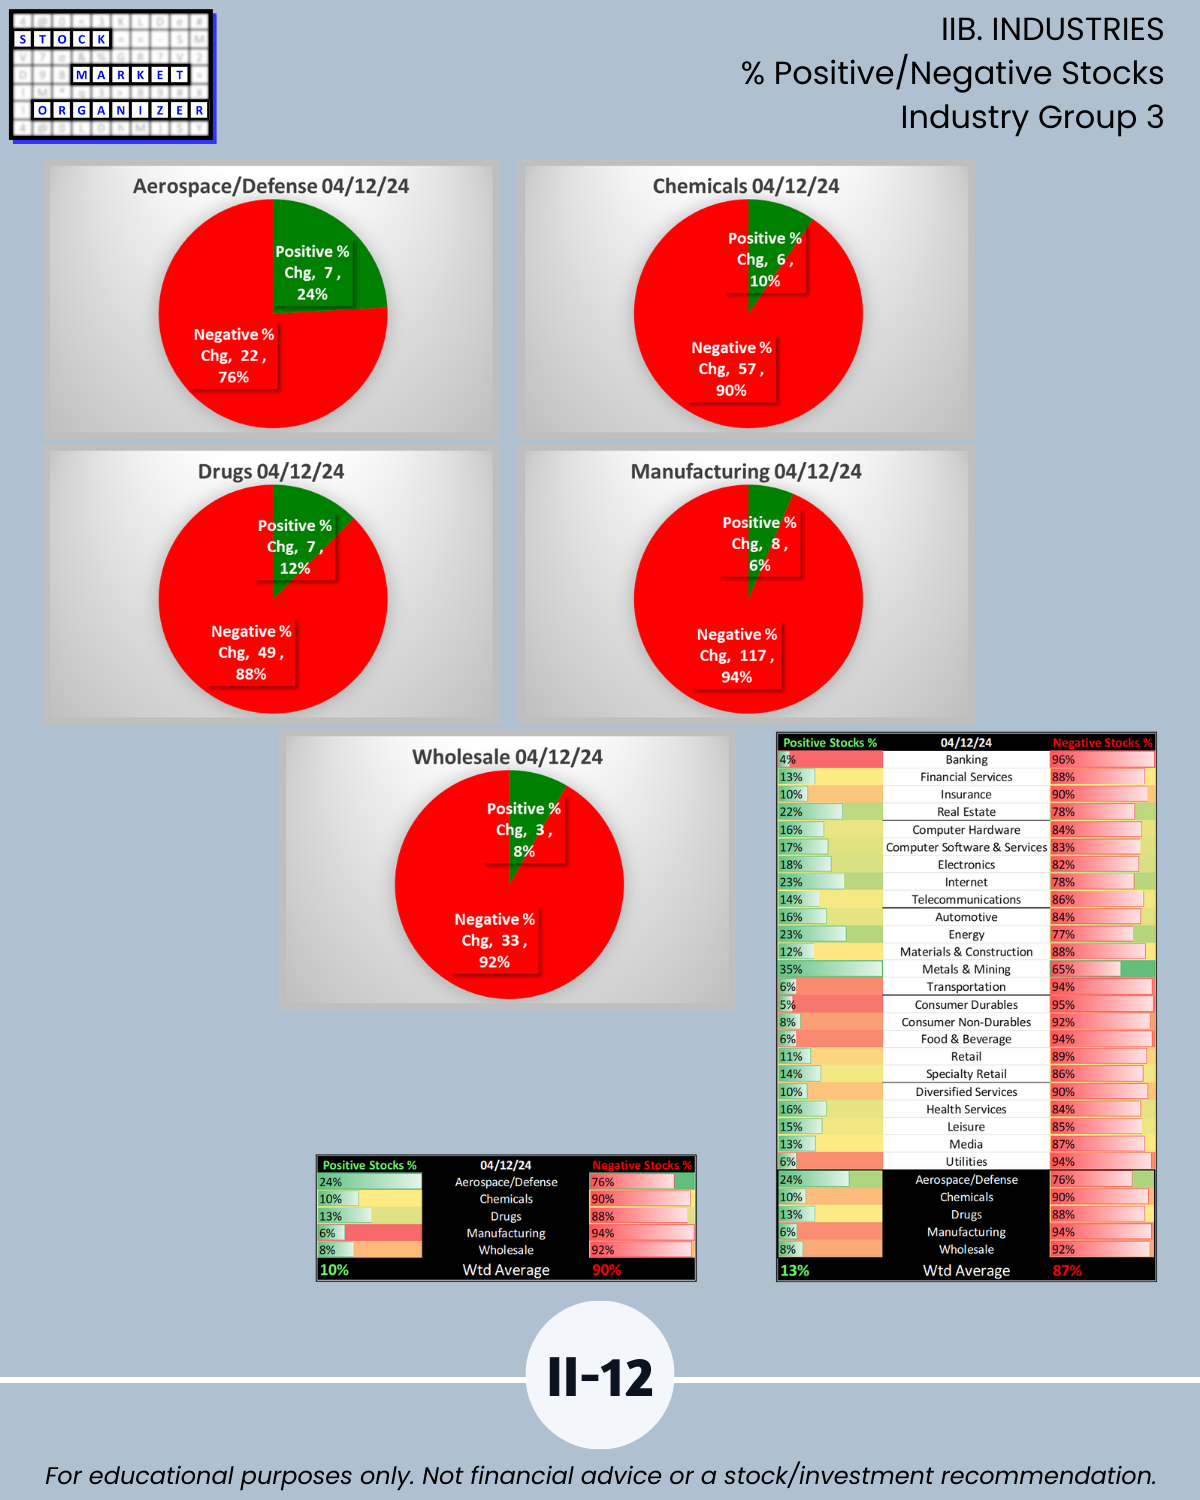
🔹 Highest Negative Stocks 94% to 96% (ABOVE last week 88% to 94%)
- Banking 96%
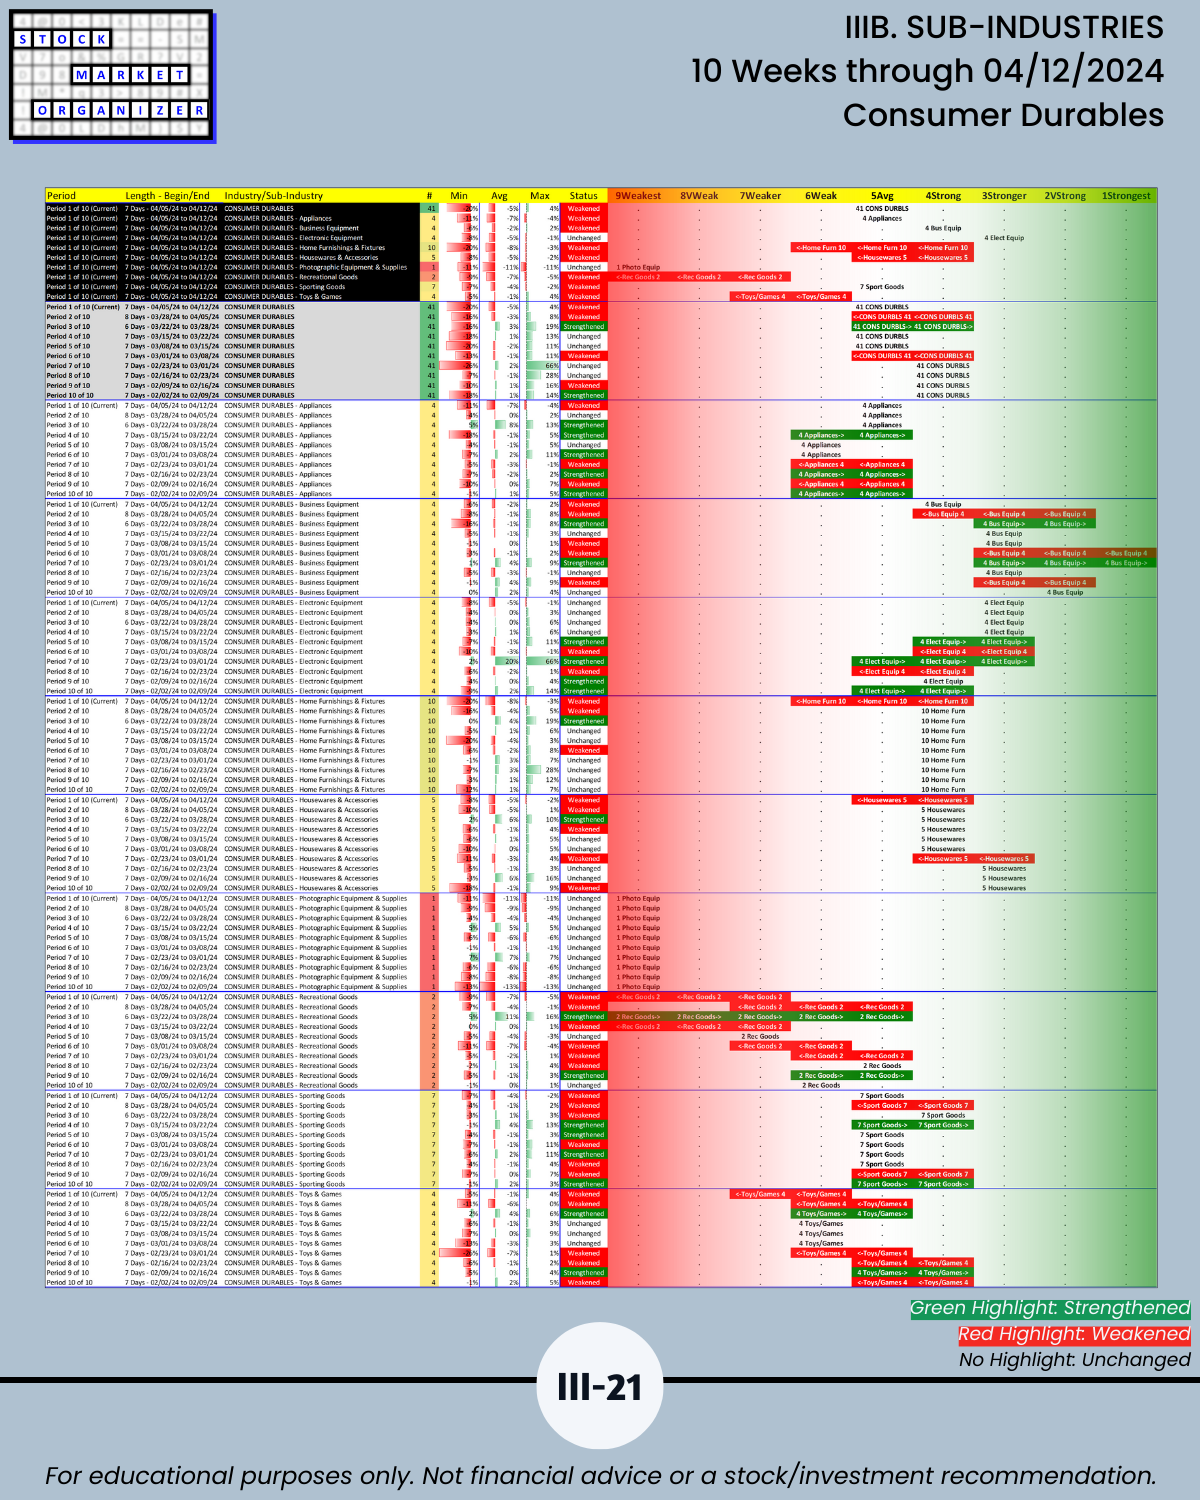
- Consumer Durables 95%
- Food & Beverage 94%
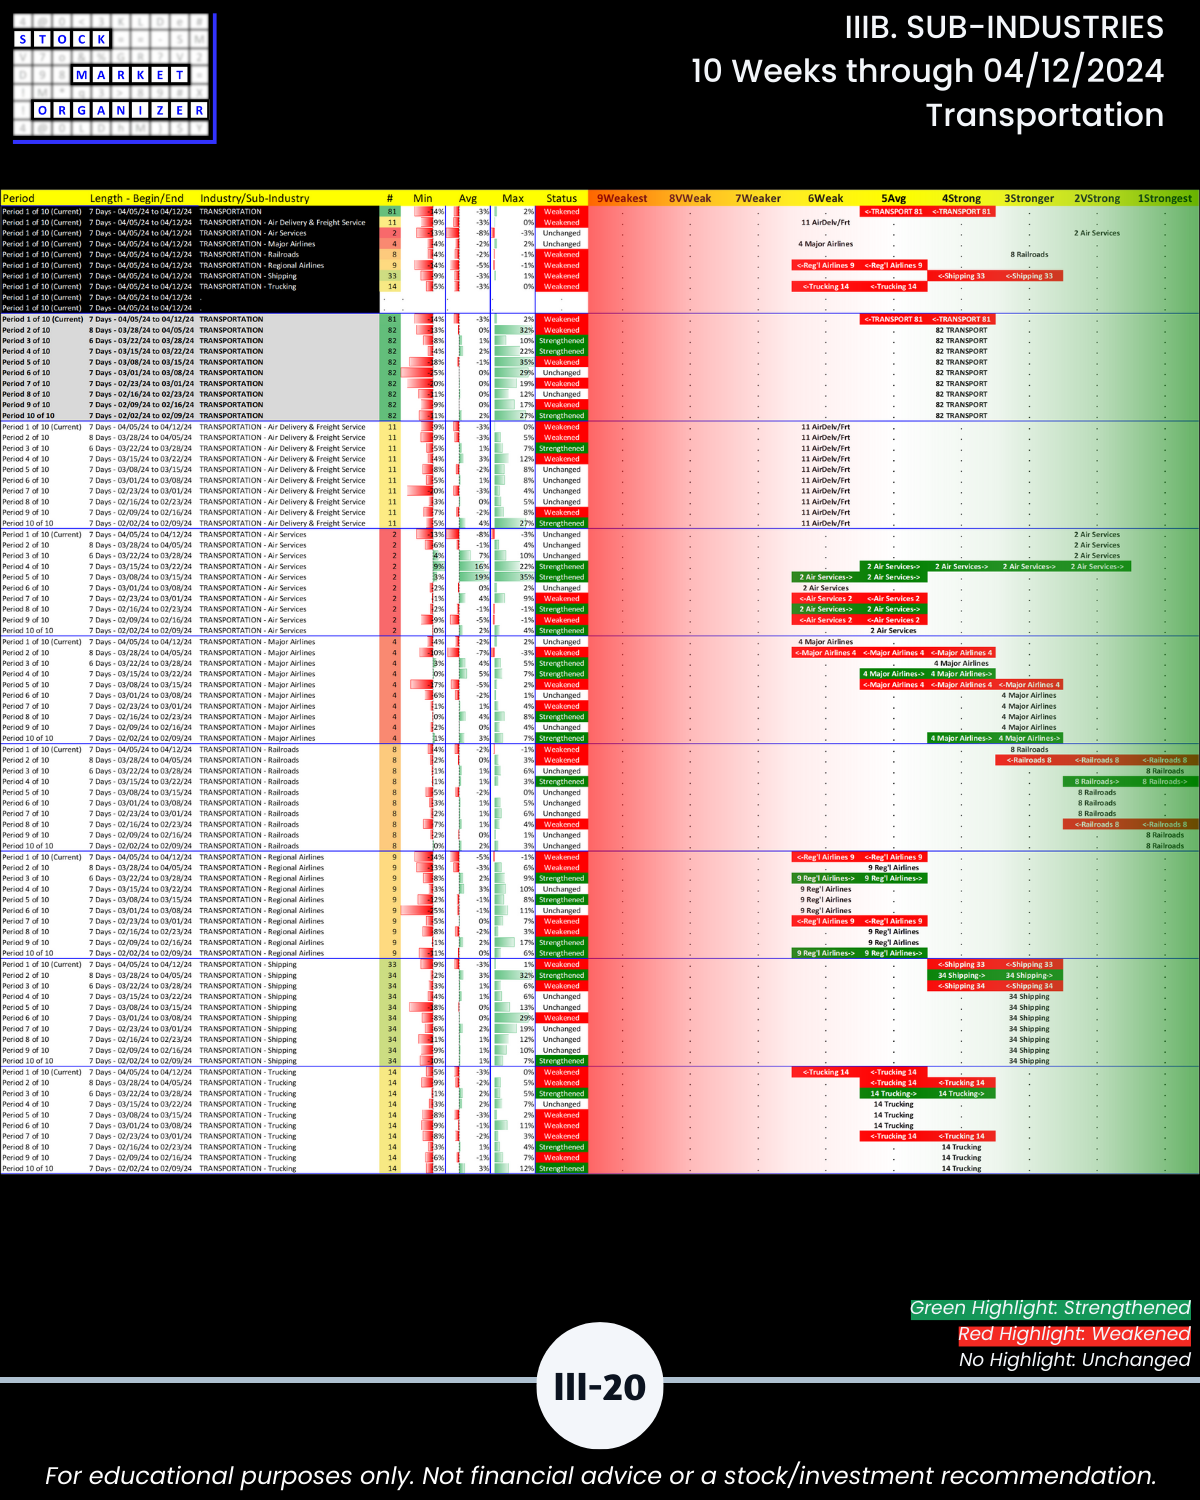
- Transportation 94%
- Utilities 94%
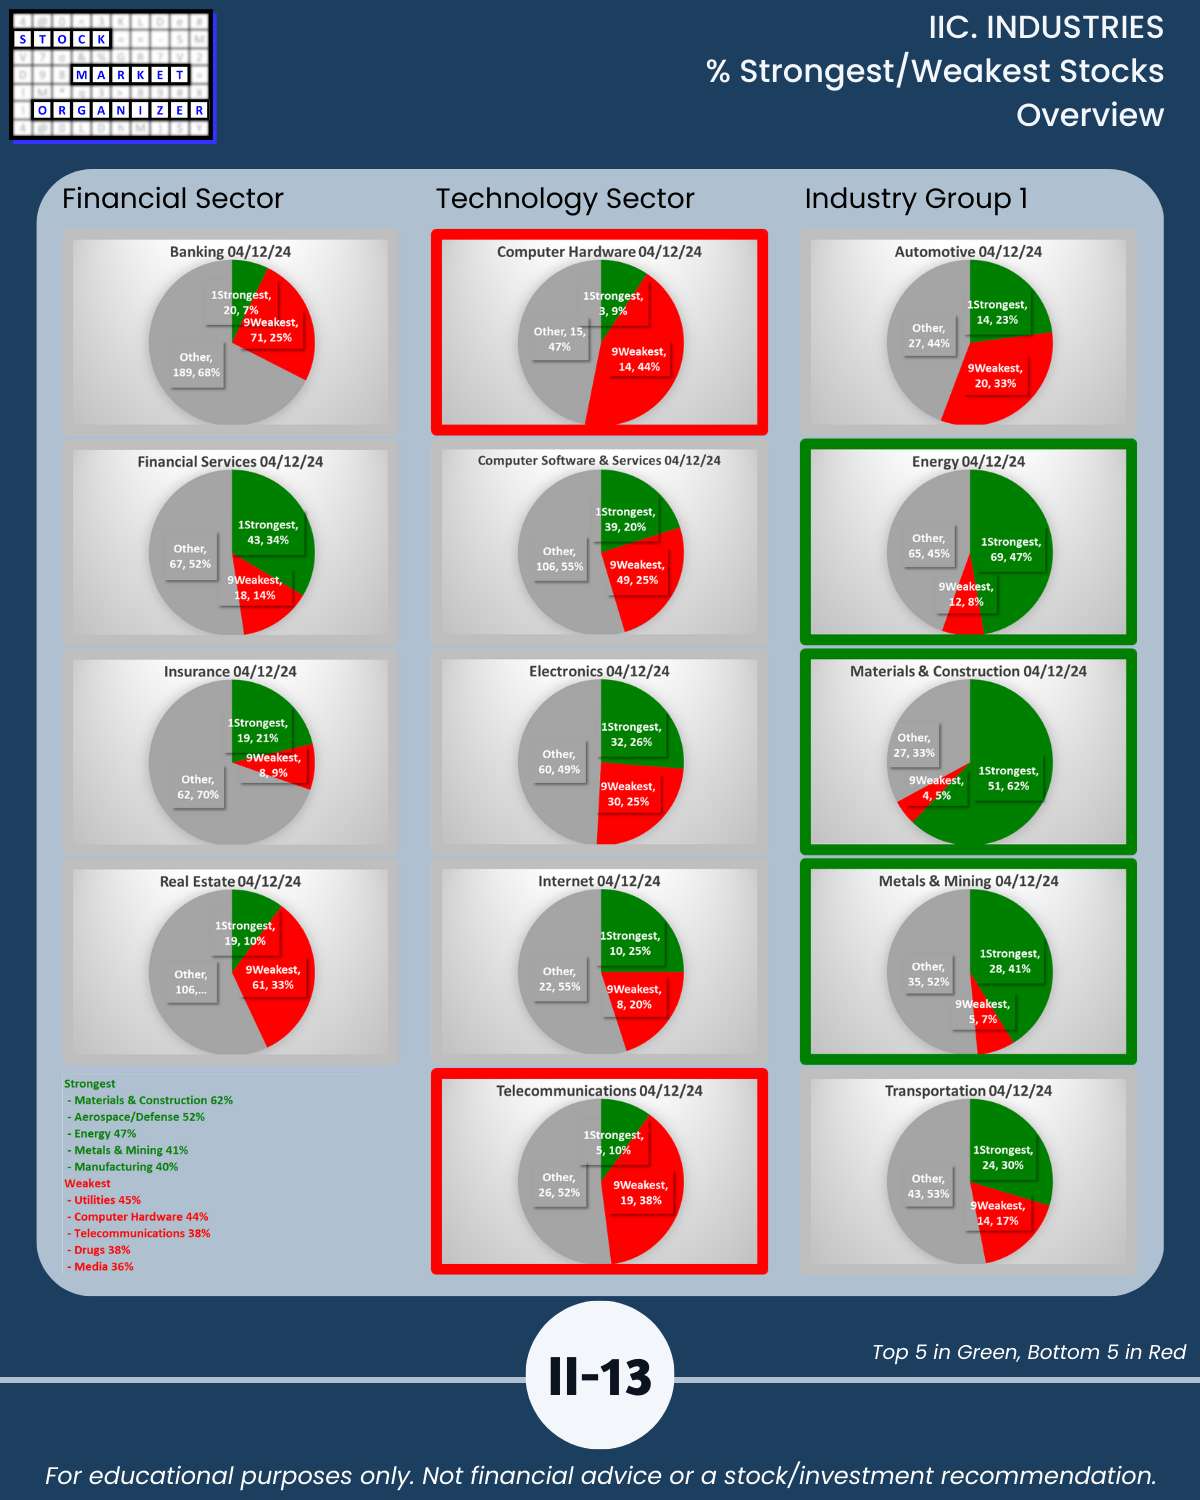
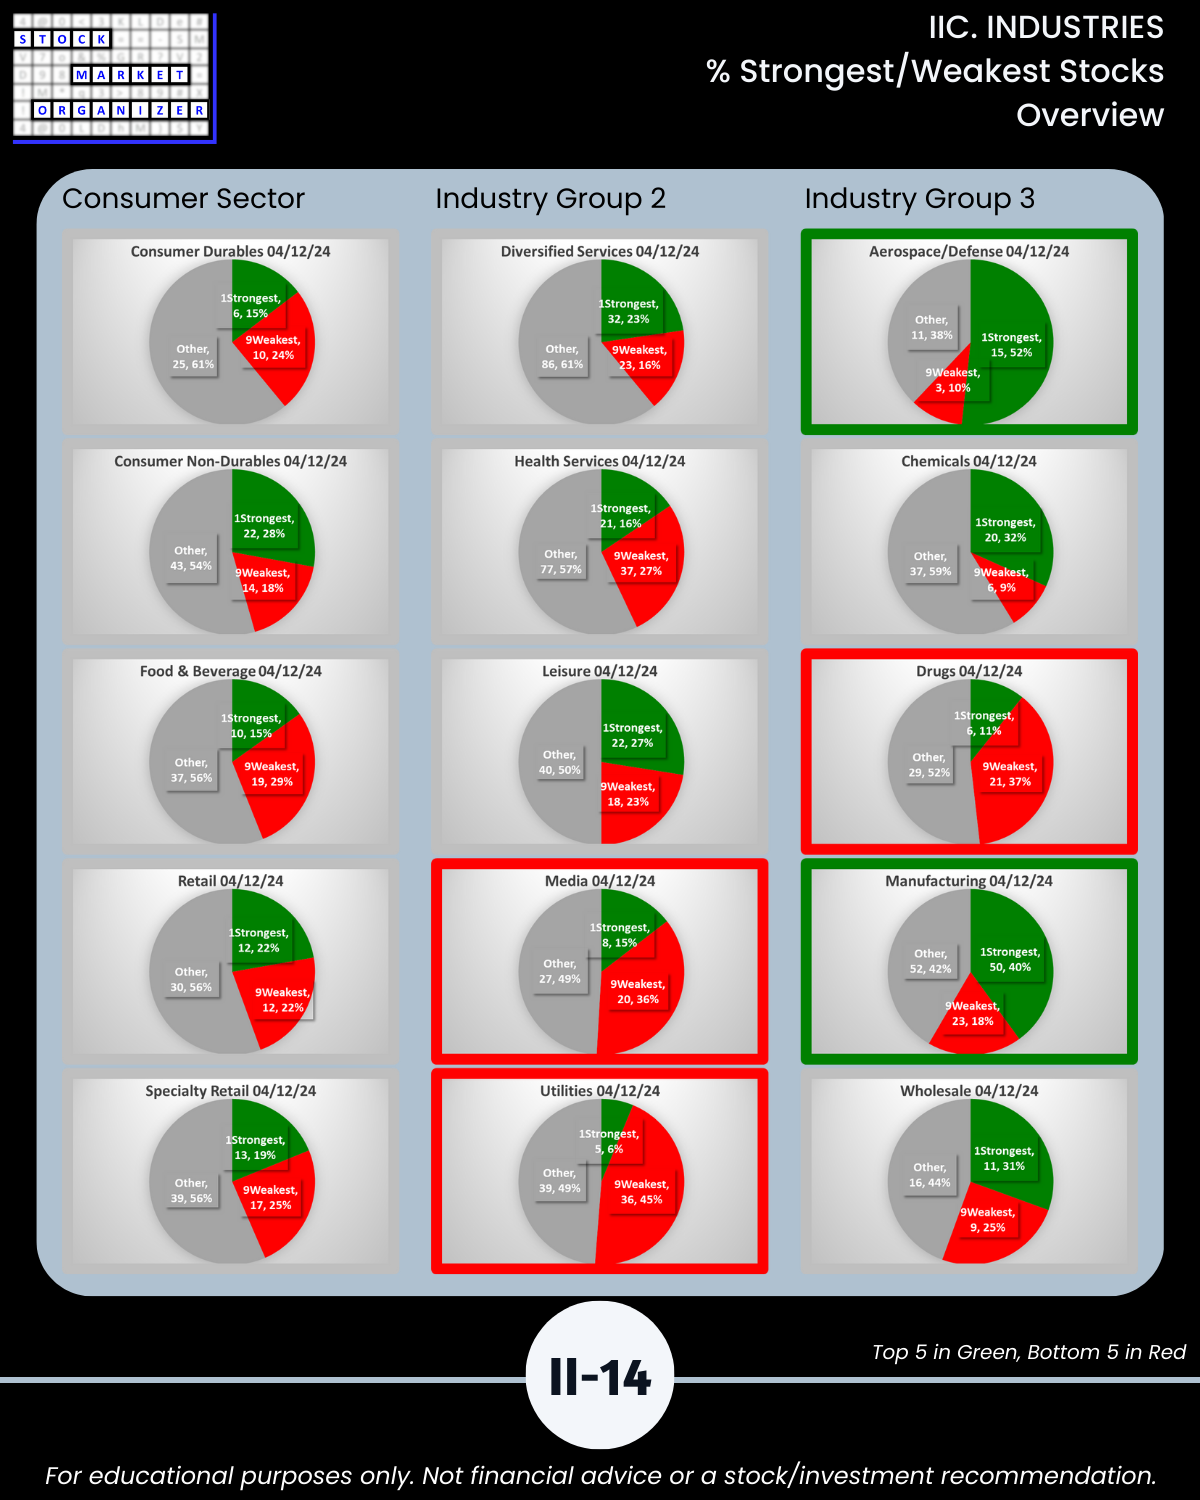
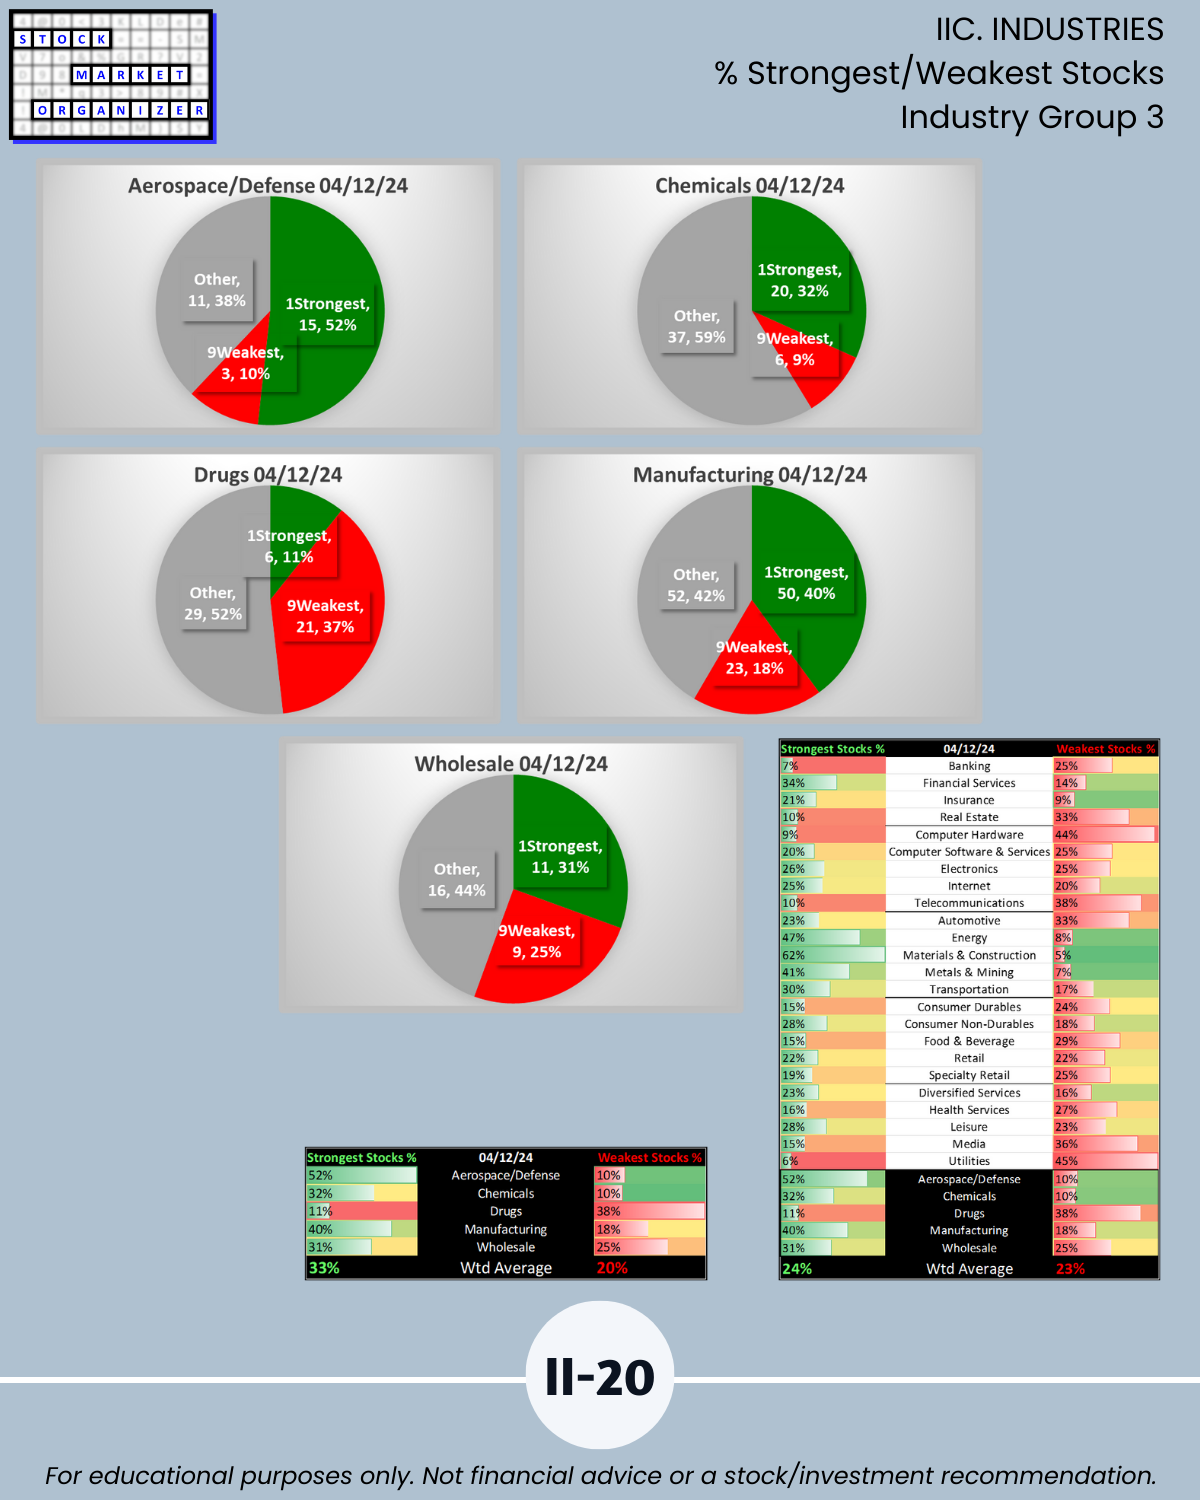
🔹 Stocks rated Strongest 40% to 62% (BELOW last week 49% to 80%)
- Materials & Construction 62%
- Aerospace/Defense 52%
- Energy 47%
- Metals & Mining 41%
- Manufacturing 40%
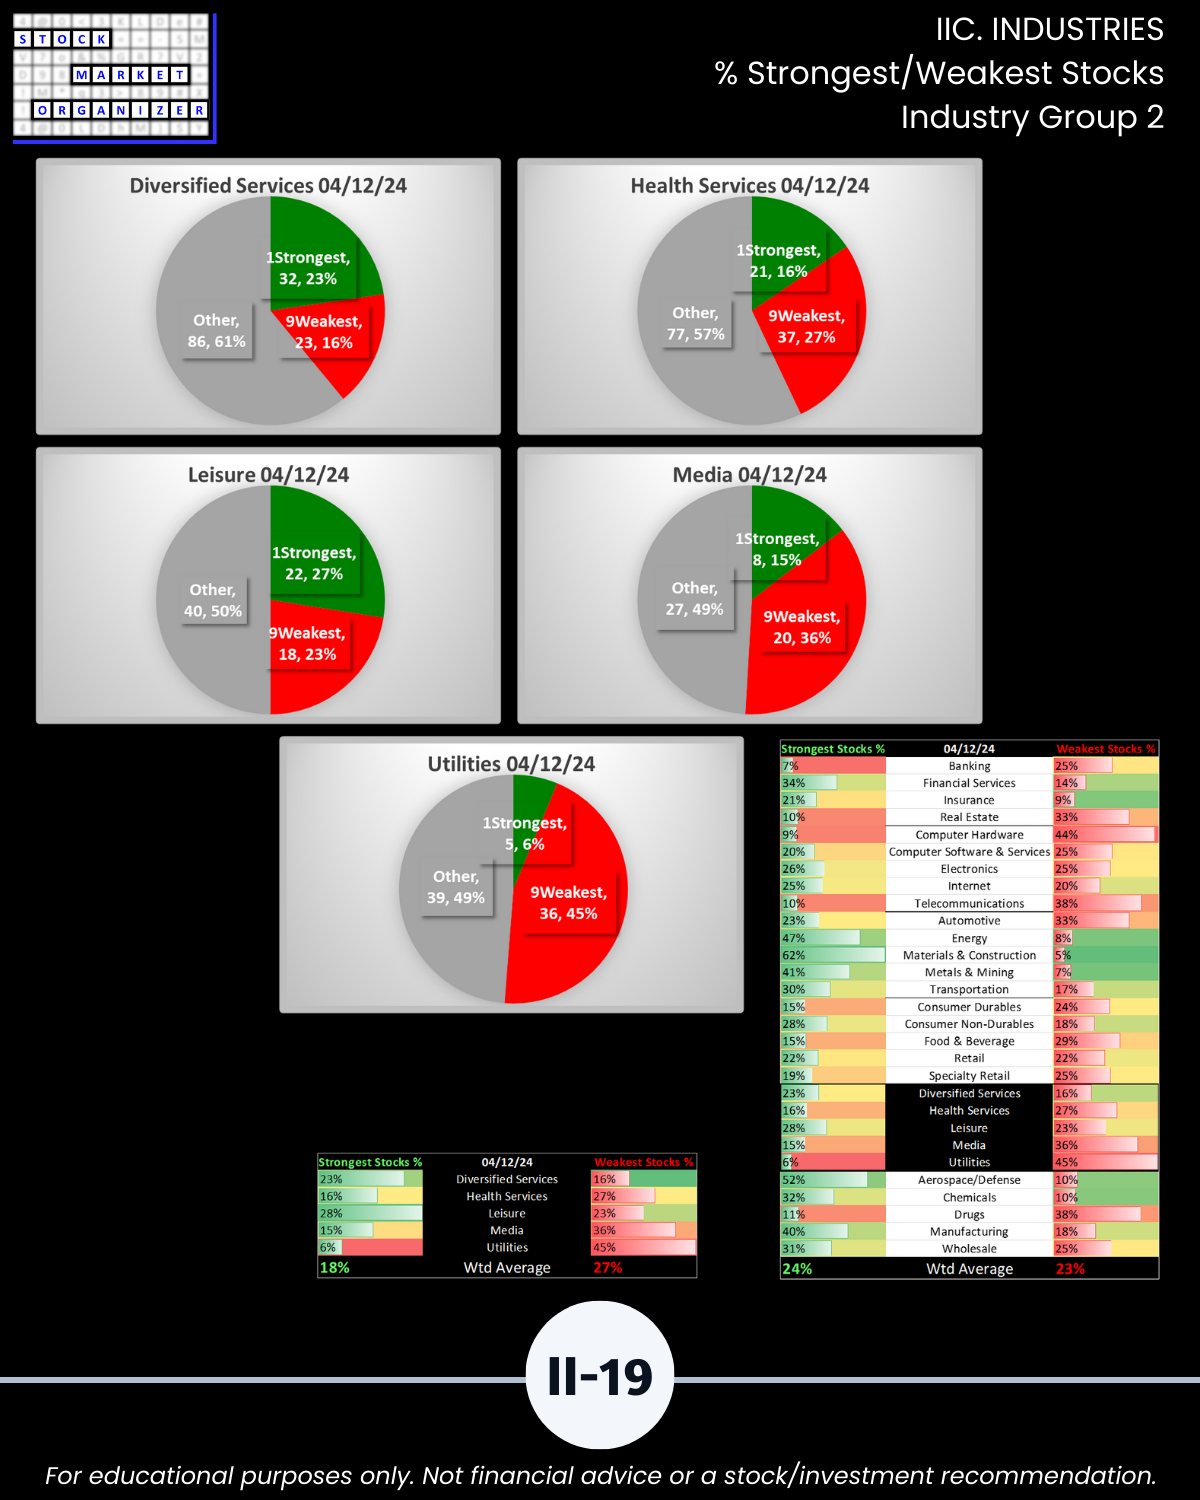
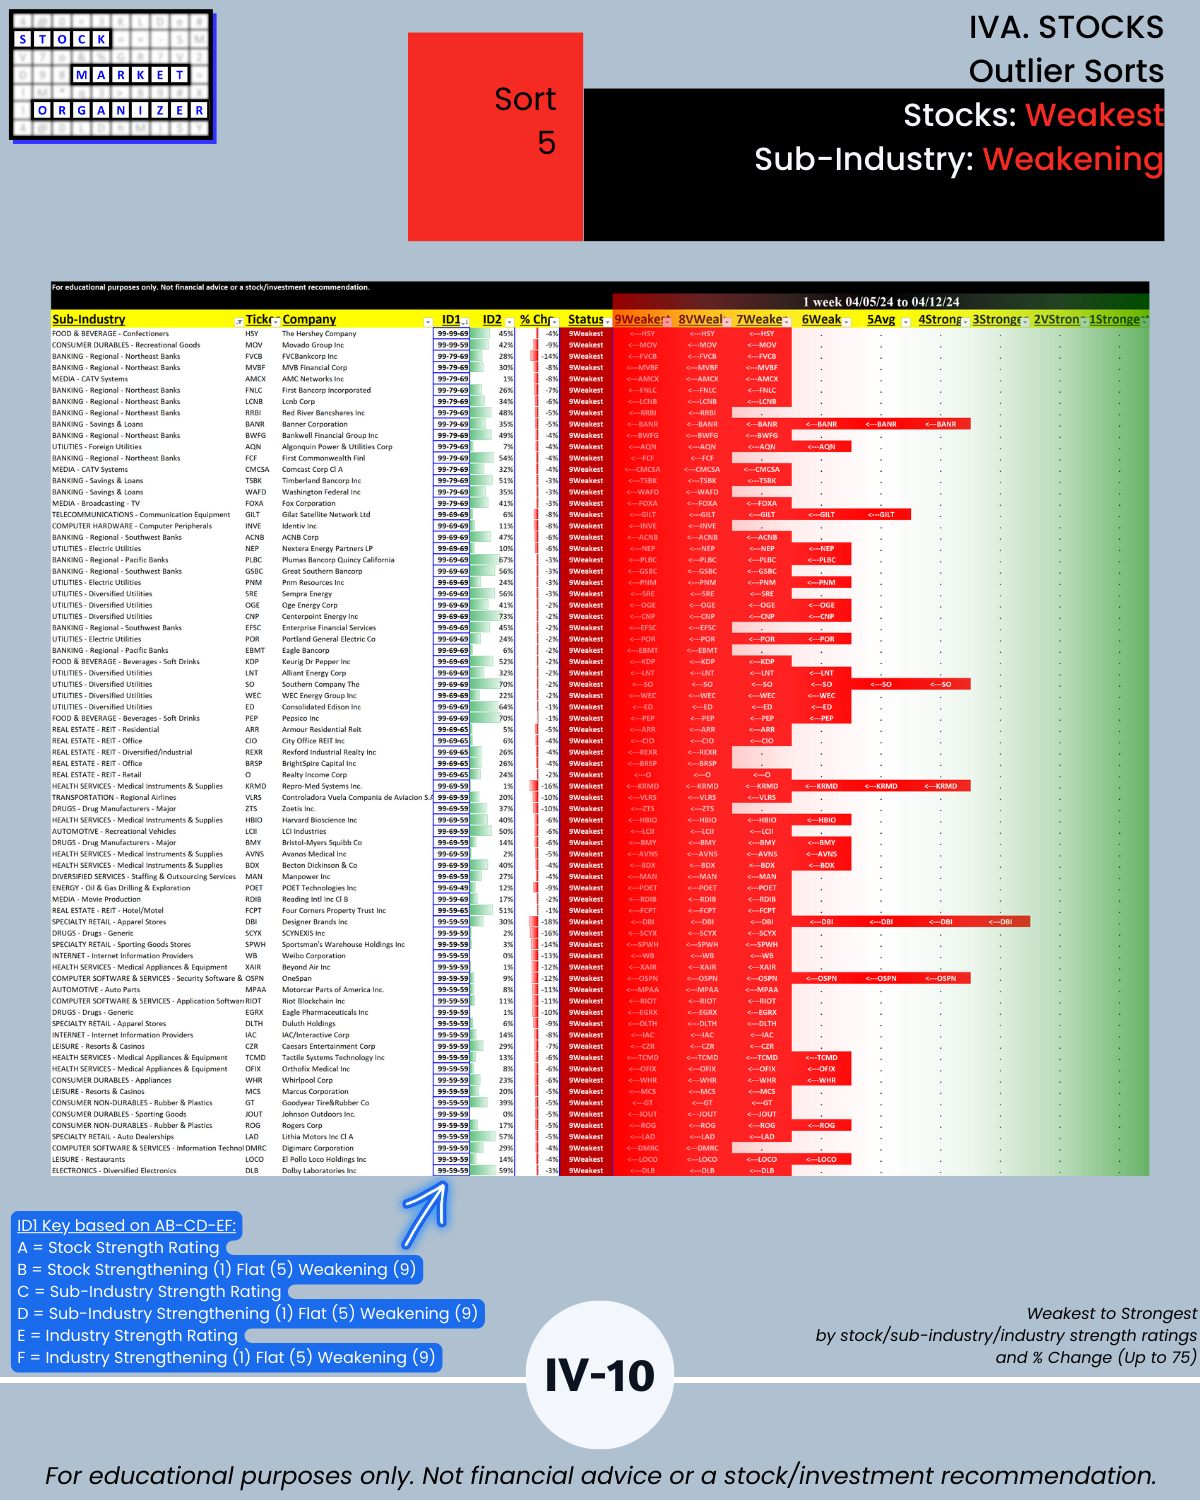
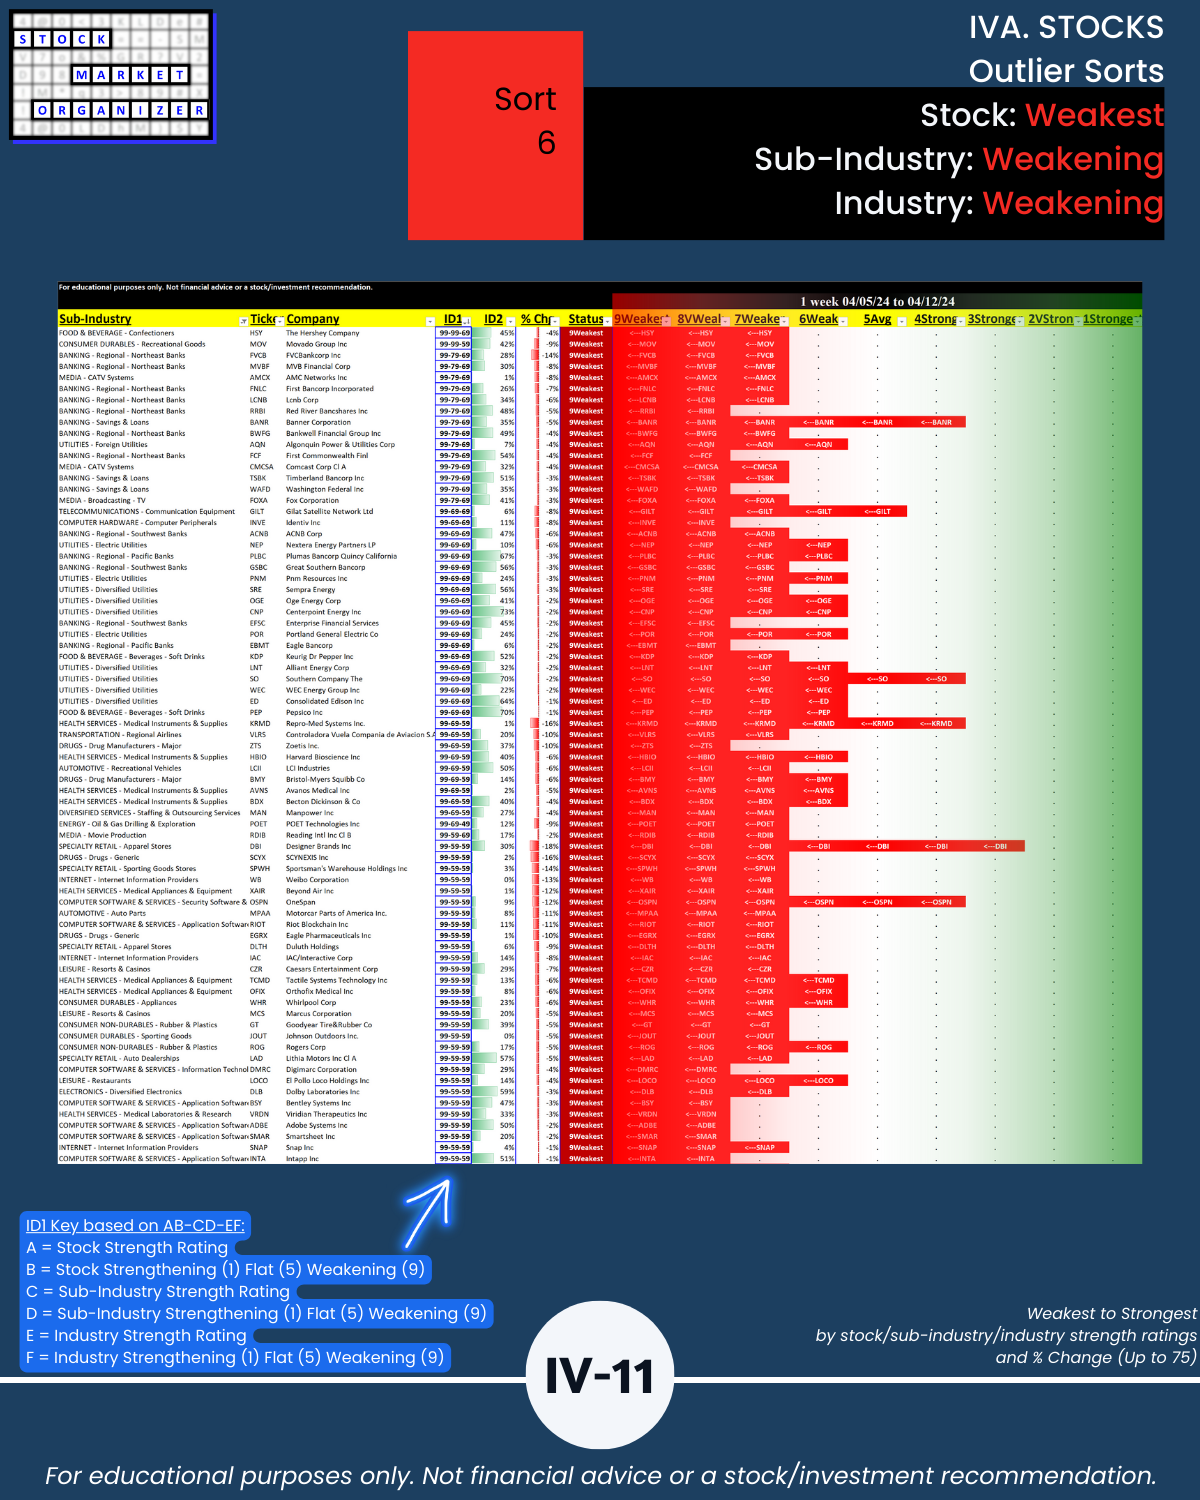
🔹 Stocks rated Weakest 36% to 45% (ABOVE last week 31% to 41%)
- Utilities 45%
- Computer Hardware 44%
- Telecommunications 38%
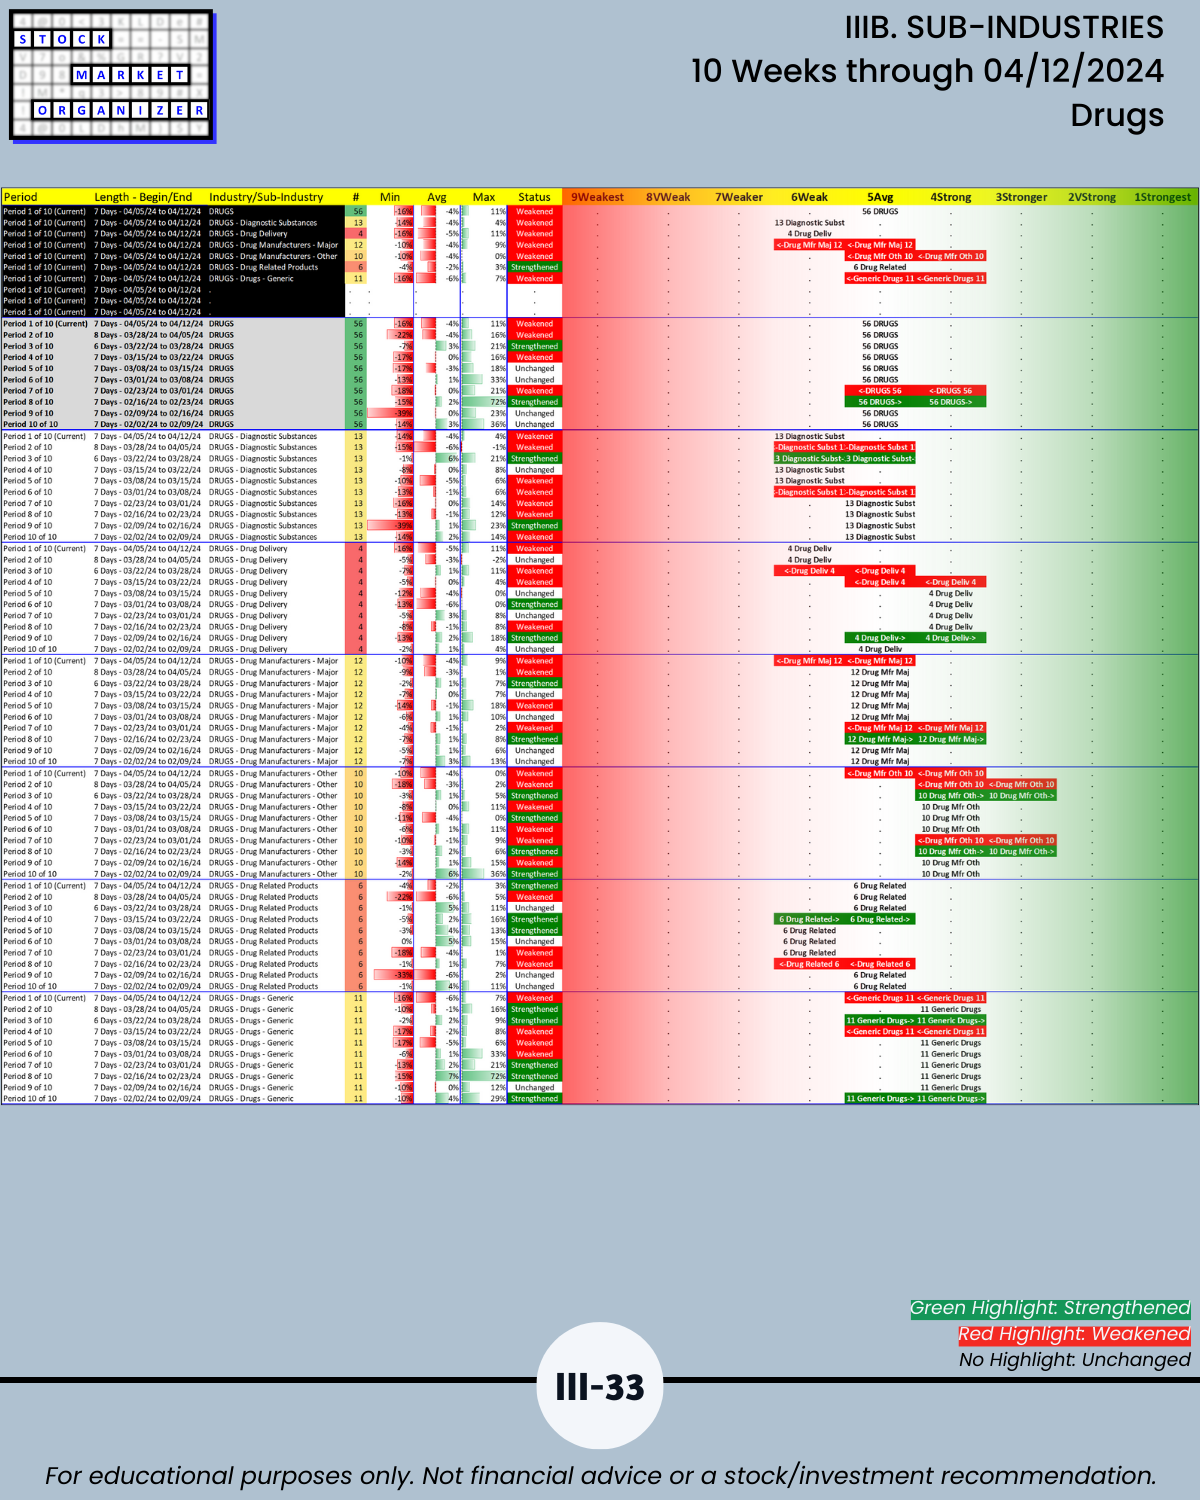
- Drugs 38%
- Media 36%
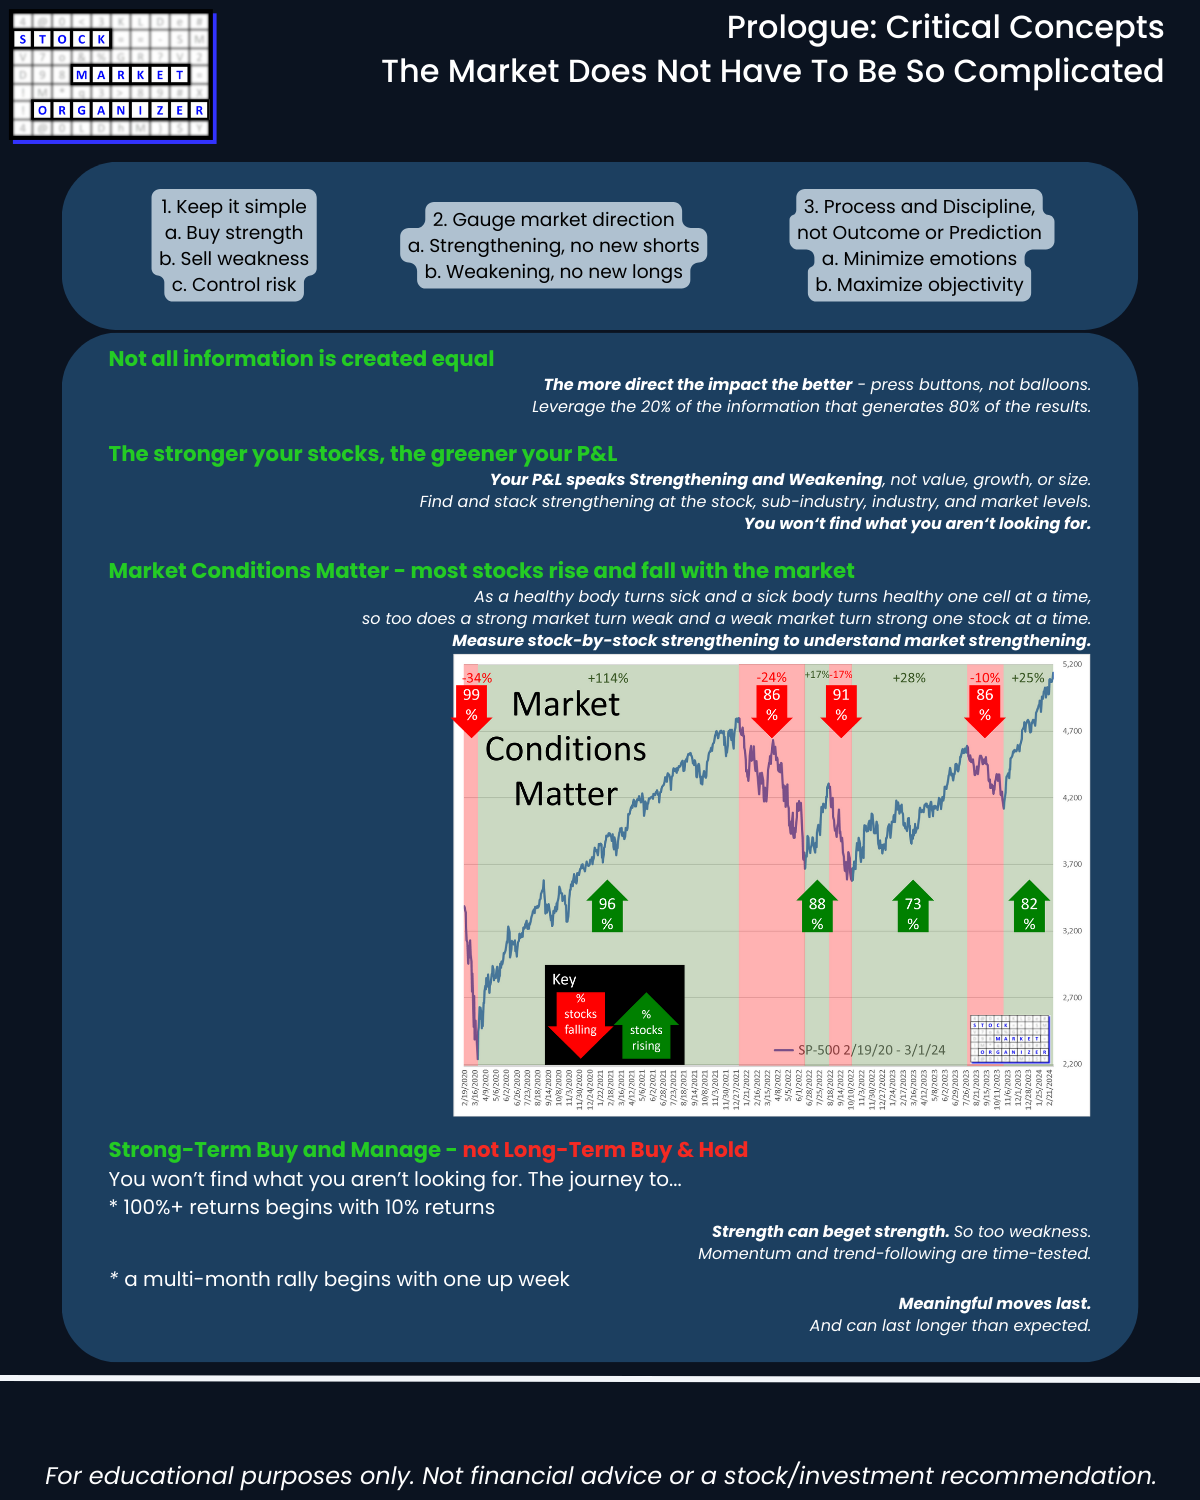
I. MARKET Prologue Critical Concepts/Market Strength Score
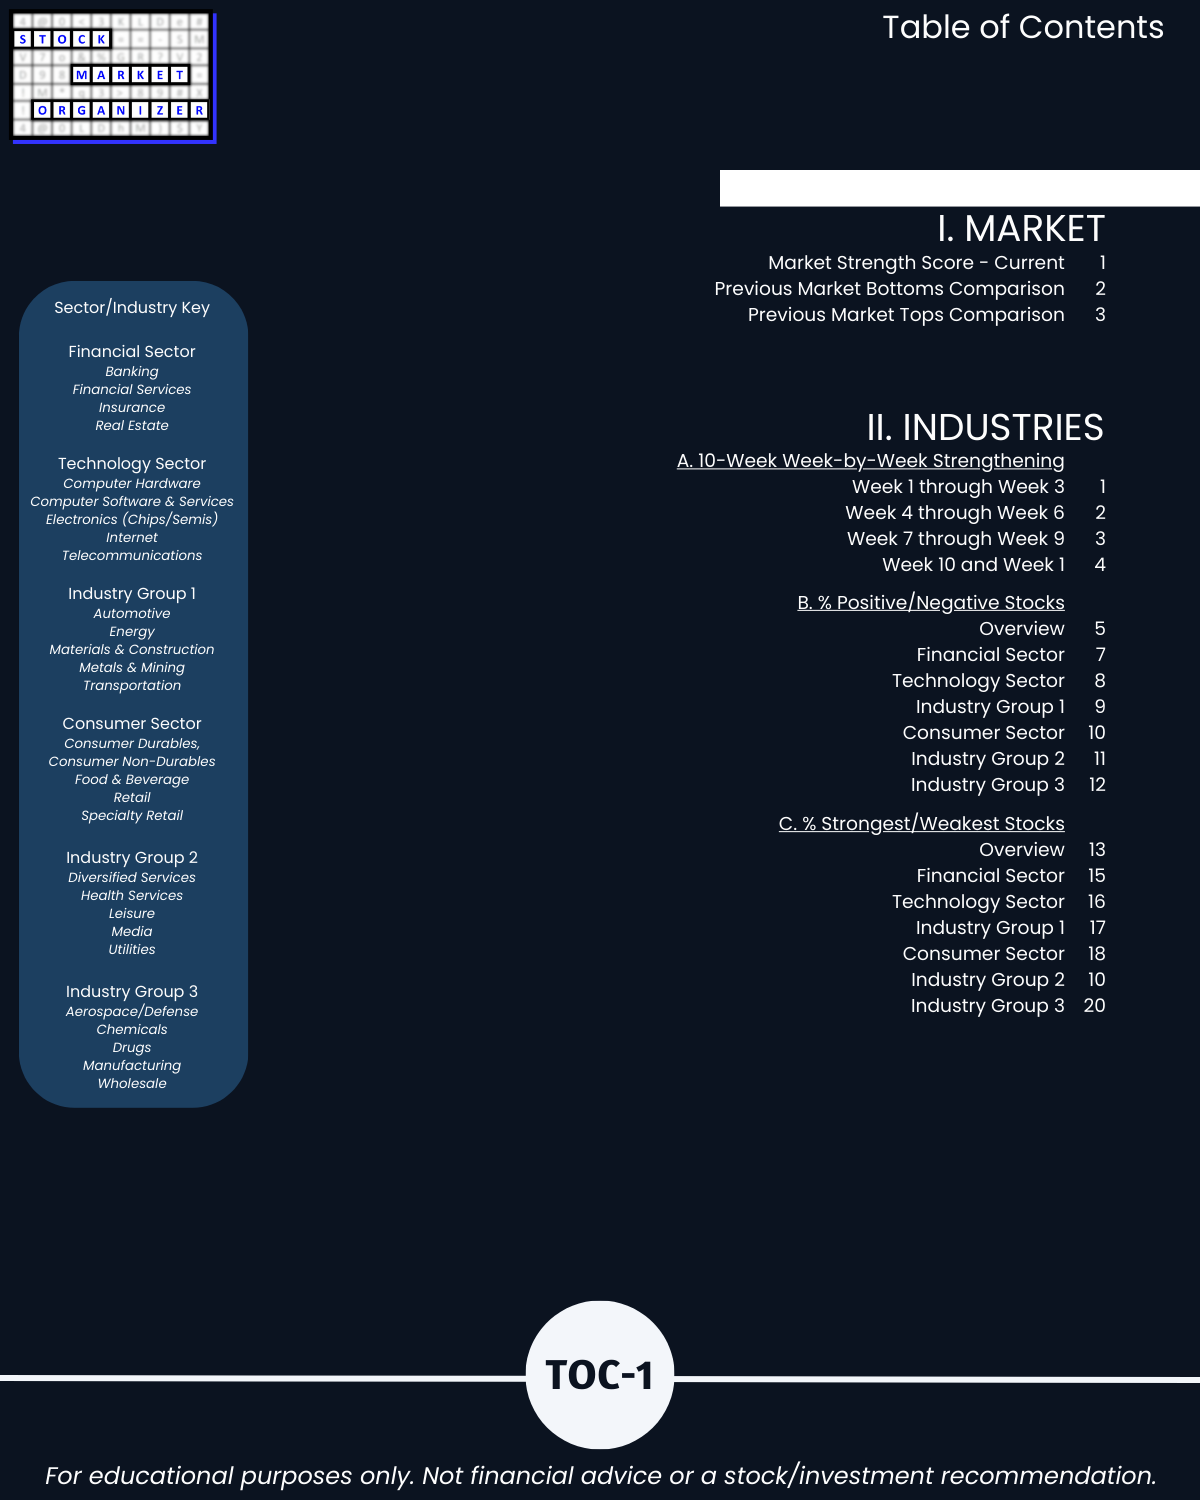
IIA. INDUSTRIES 10-Week Week-by-Week Strengthening
IIB. INDUSTRIES % Positive/Negative Stocks
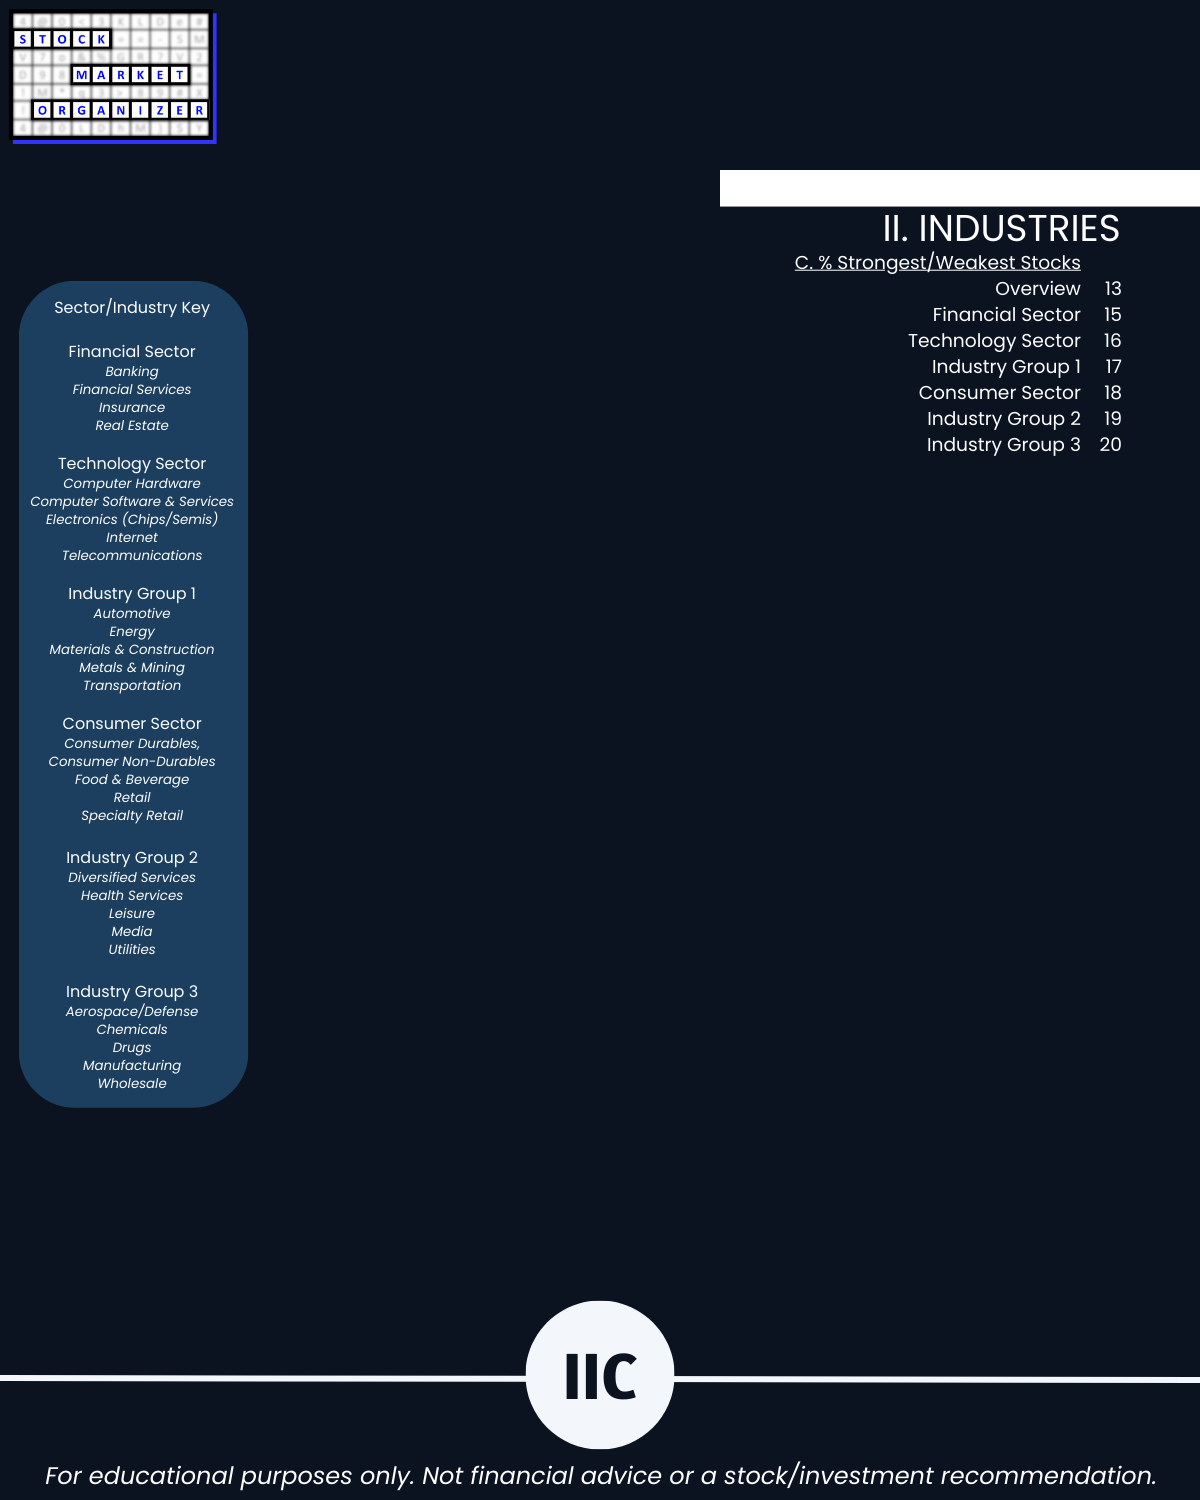
IIC. INDUSTRIES % Strongest/Weakest Stocks
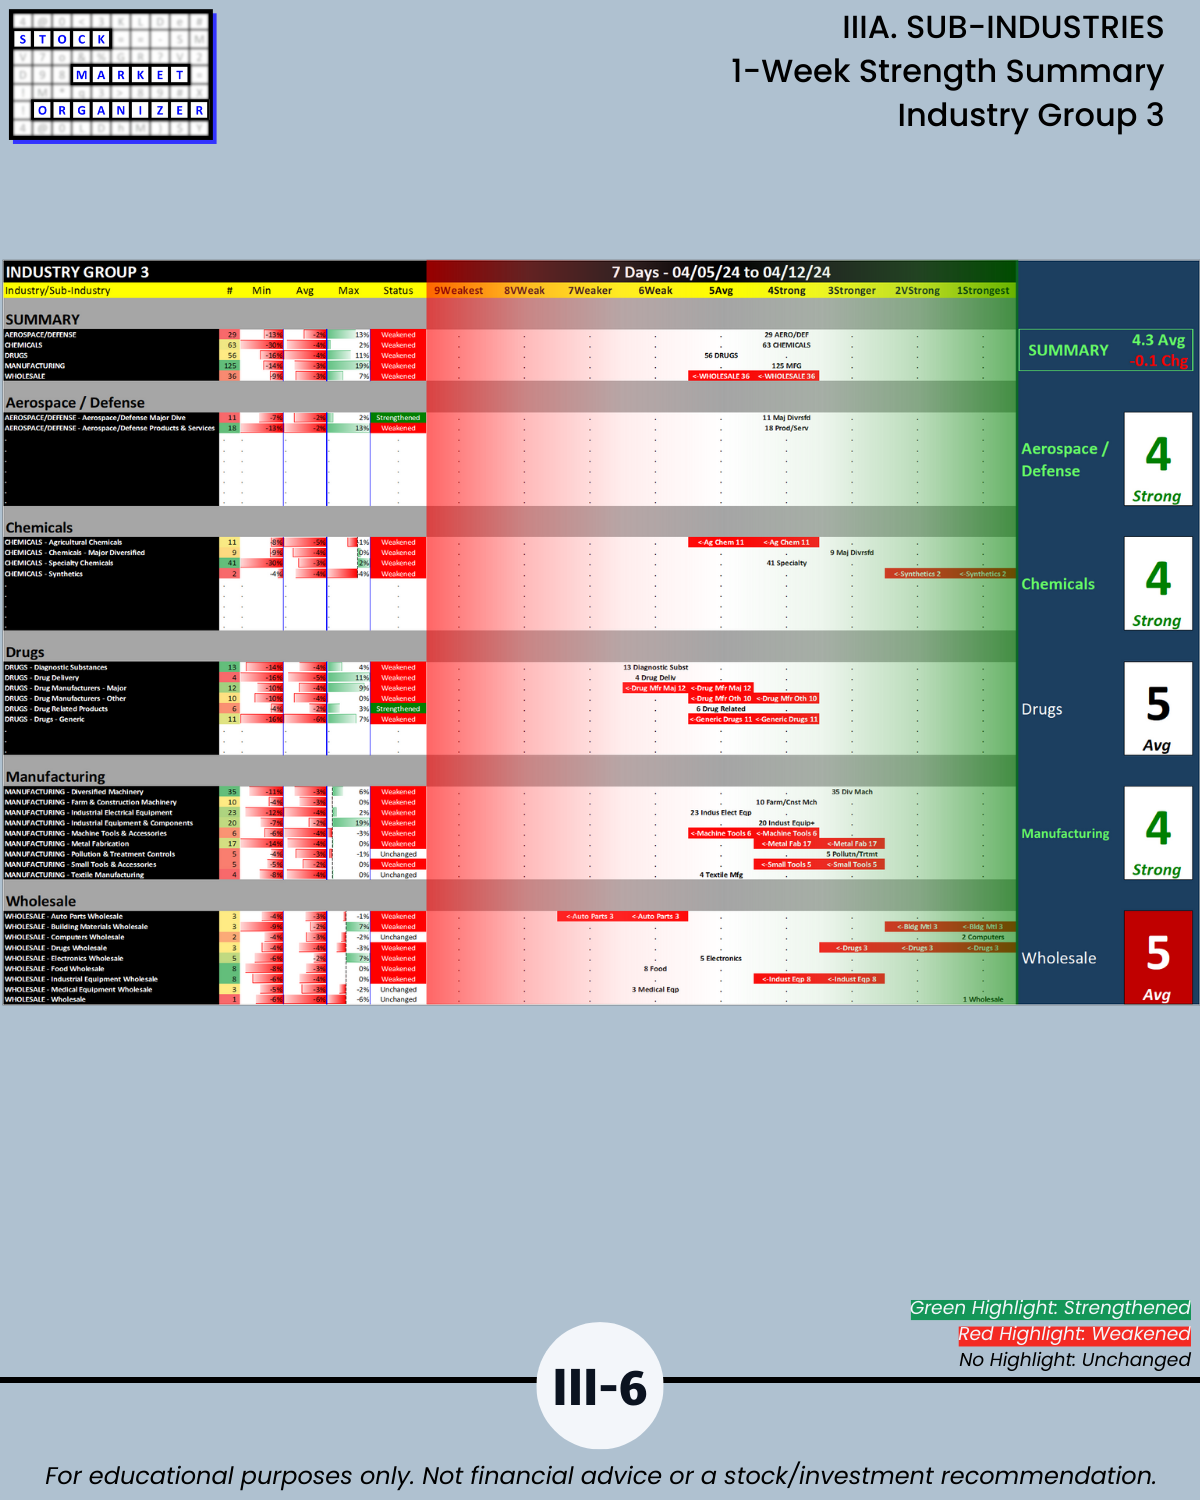
IIIA. SUB-INDUSTRIES 1-Week Strength Summary
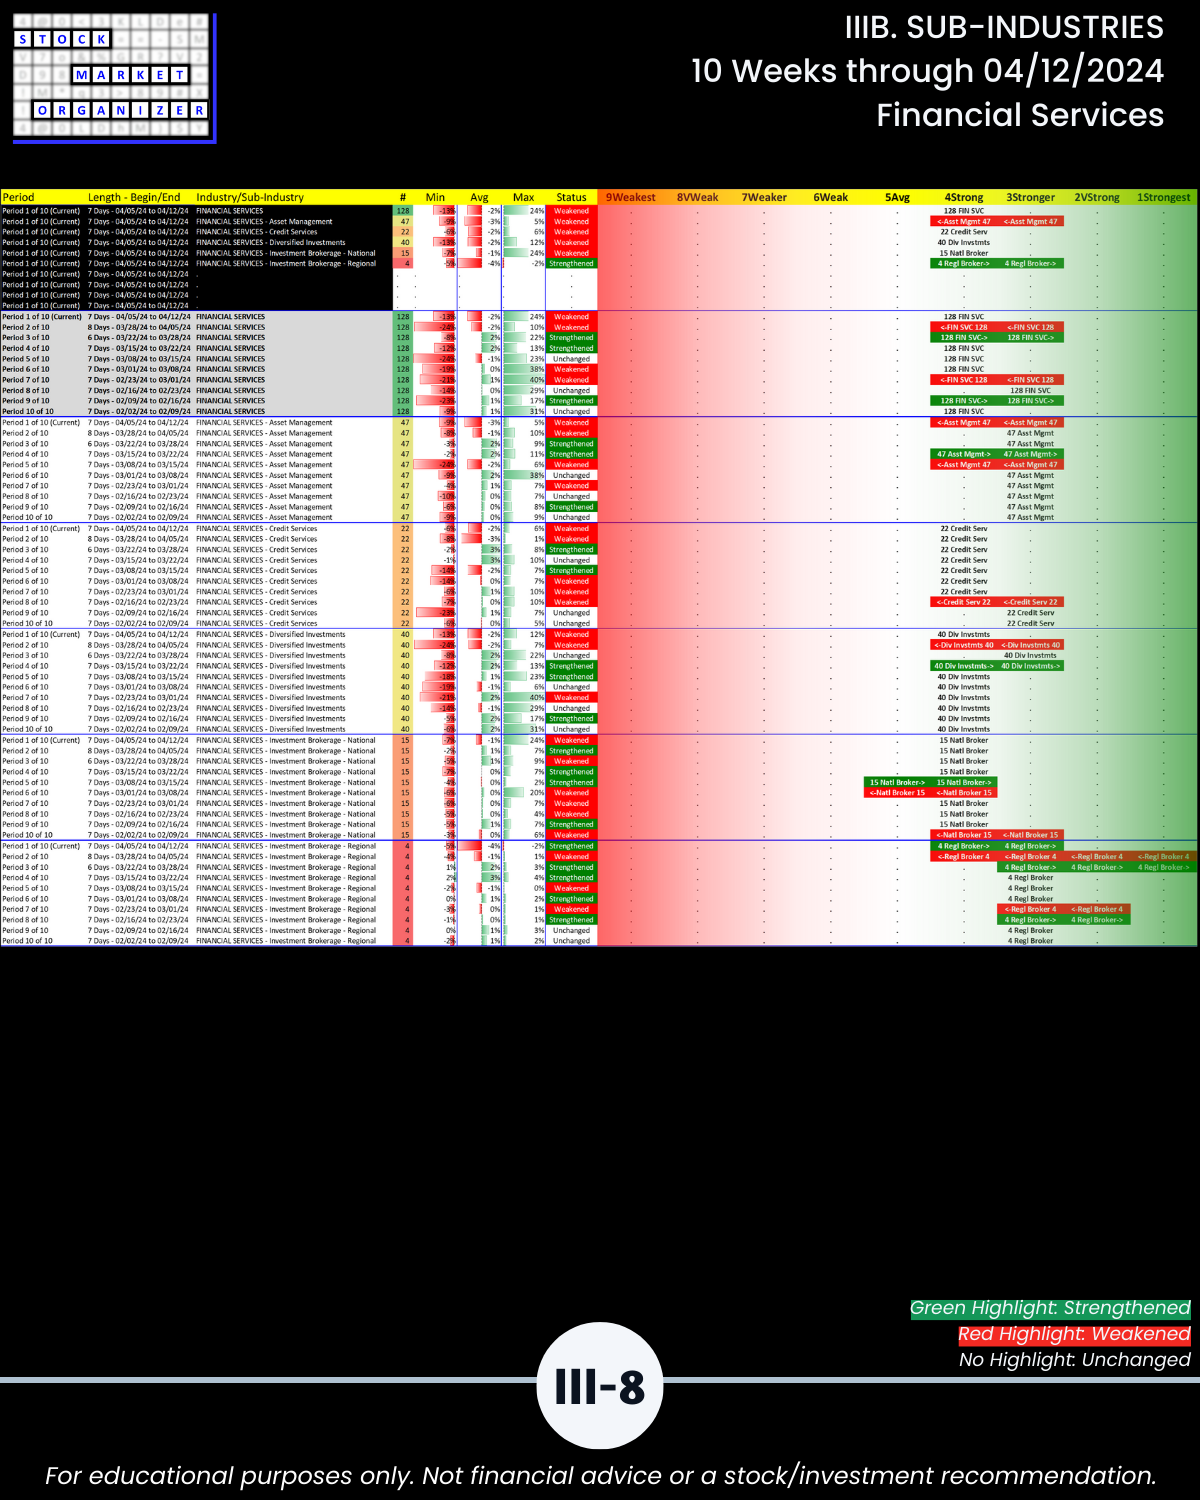
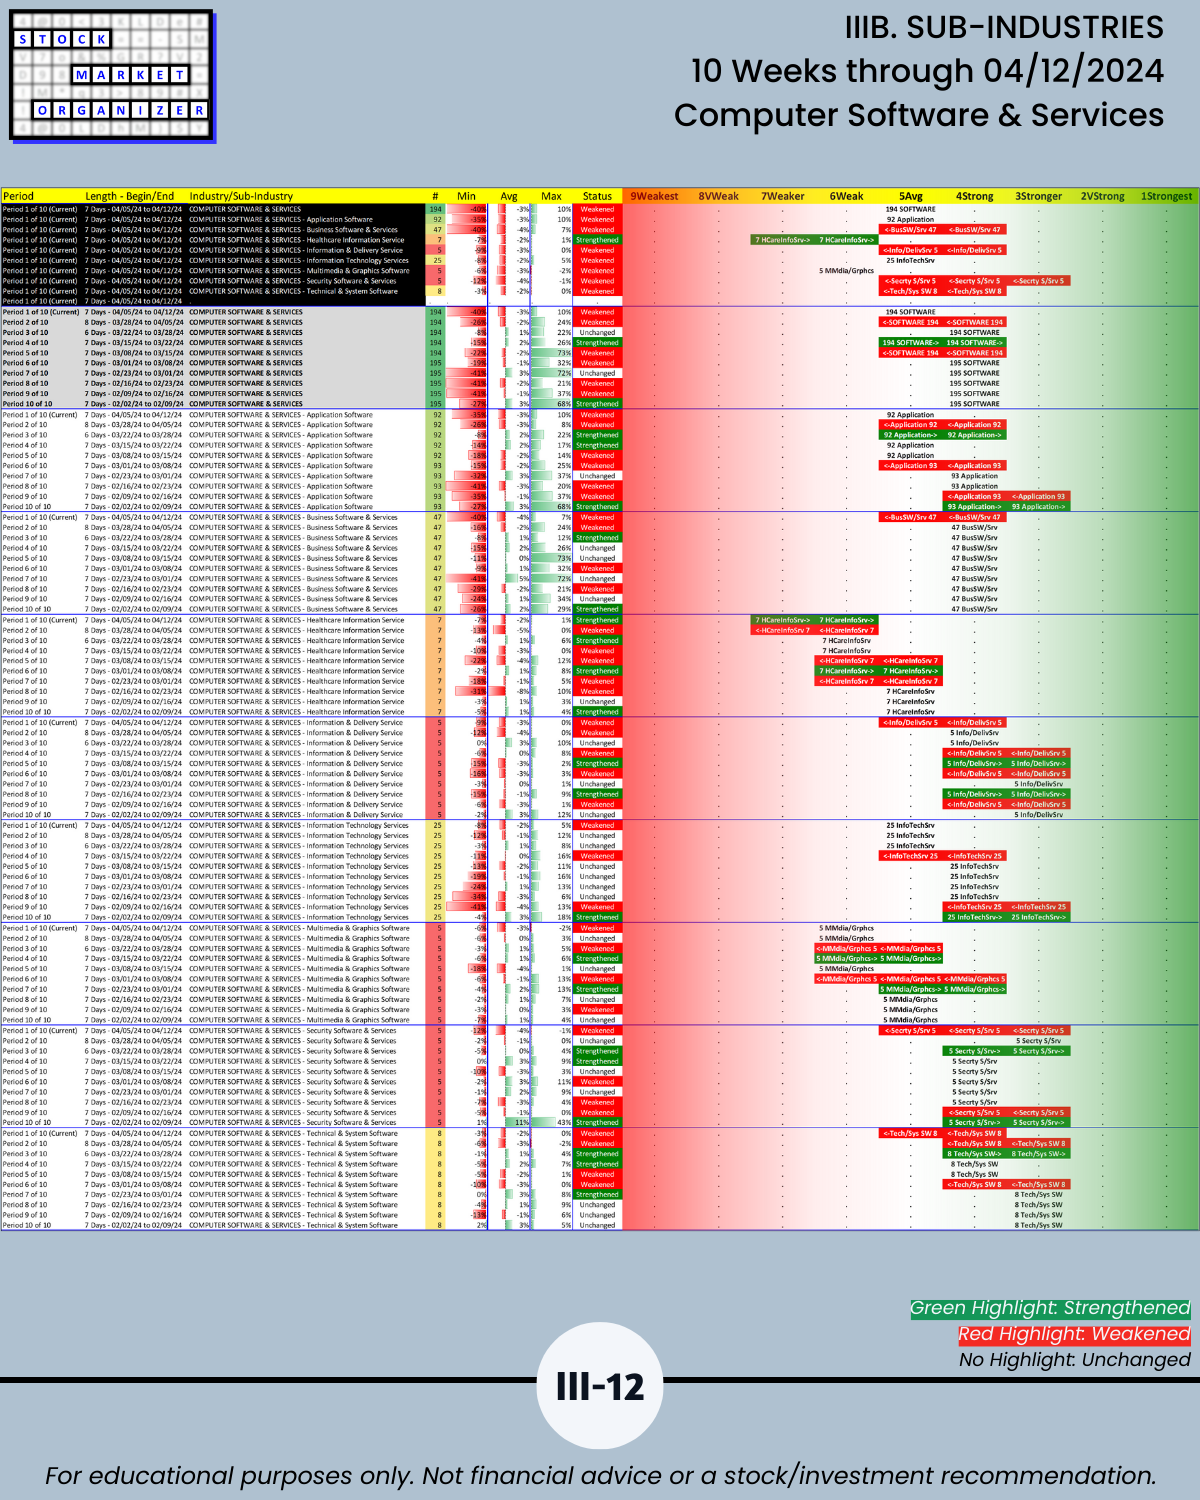
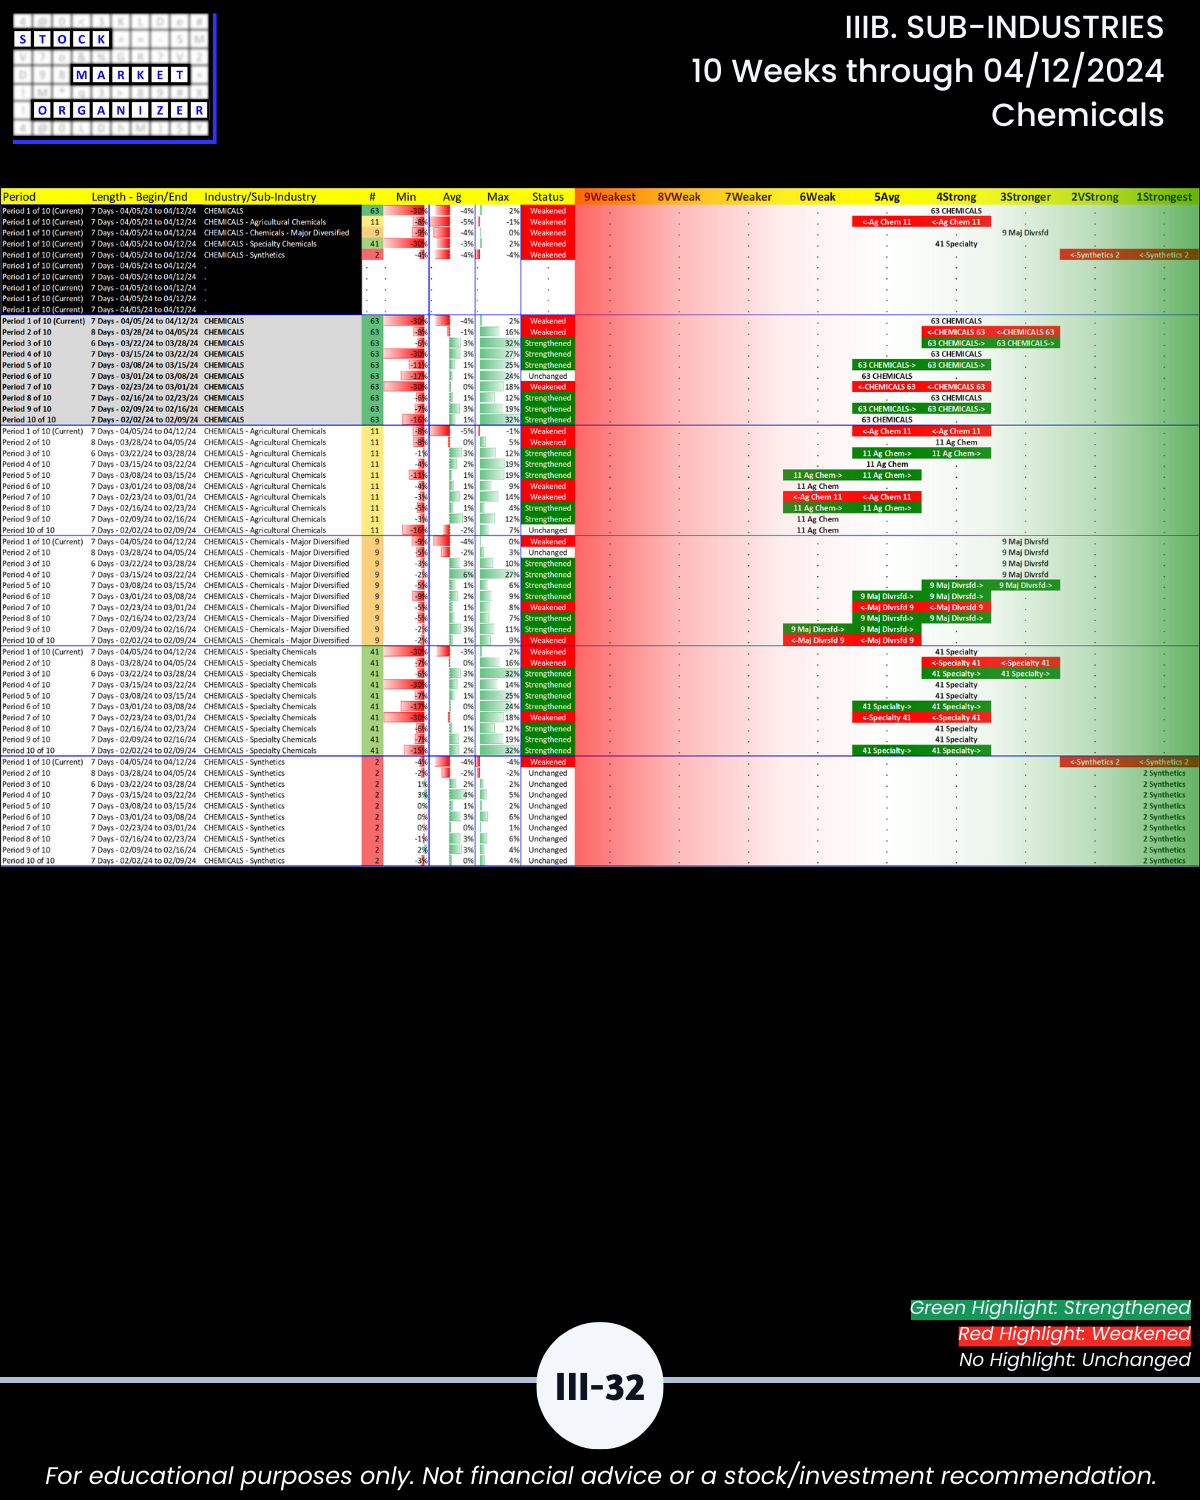
IIIB. SUB-INDUSTRIES 10-Week Strengthening/Weakening

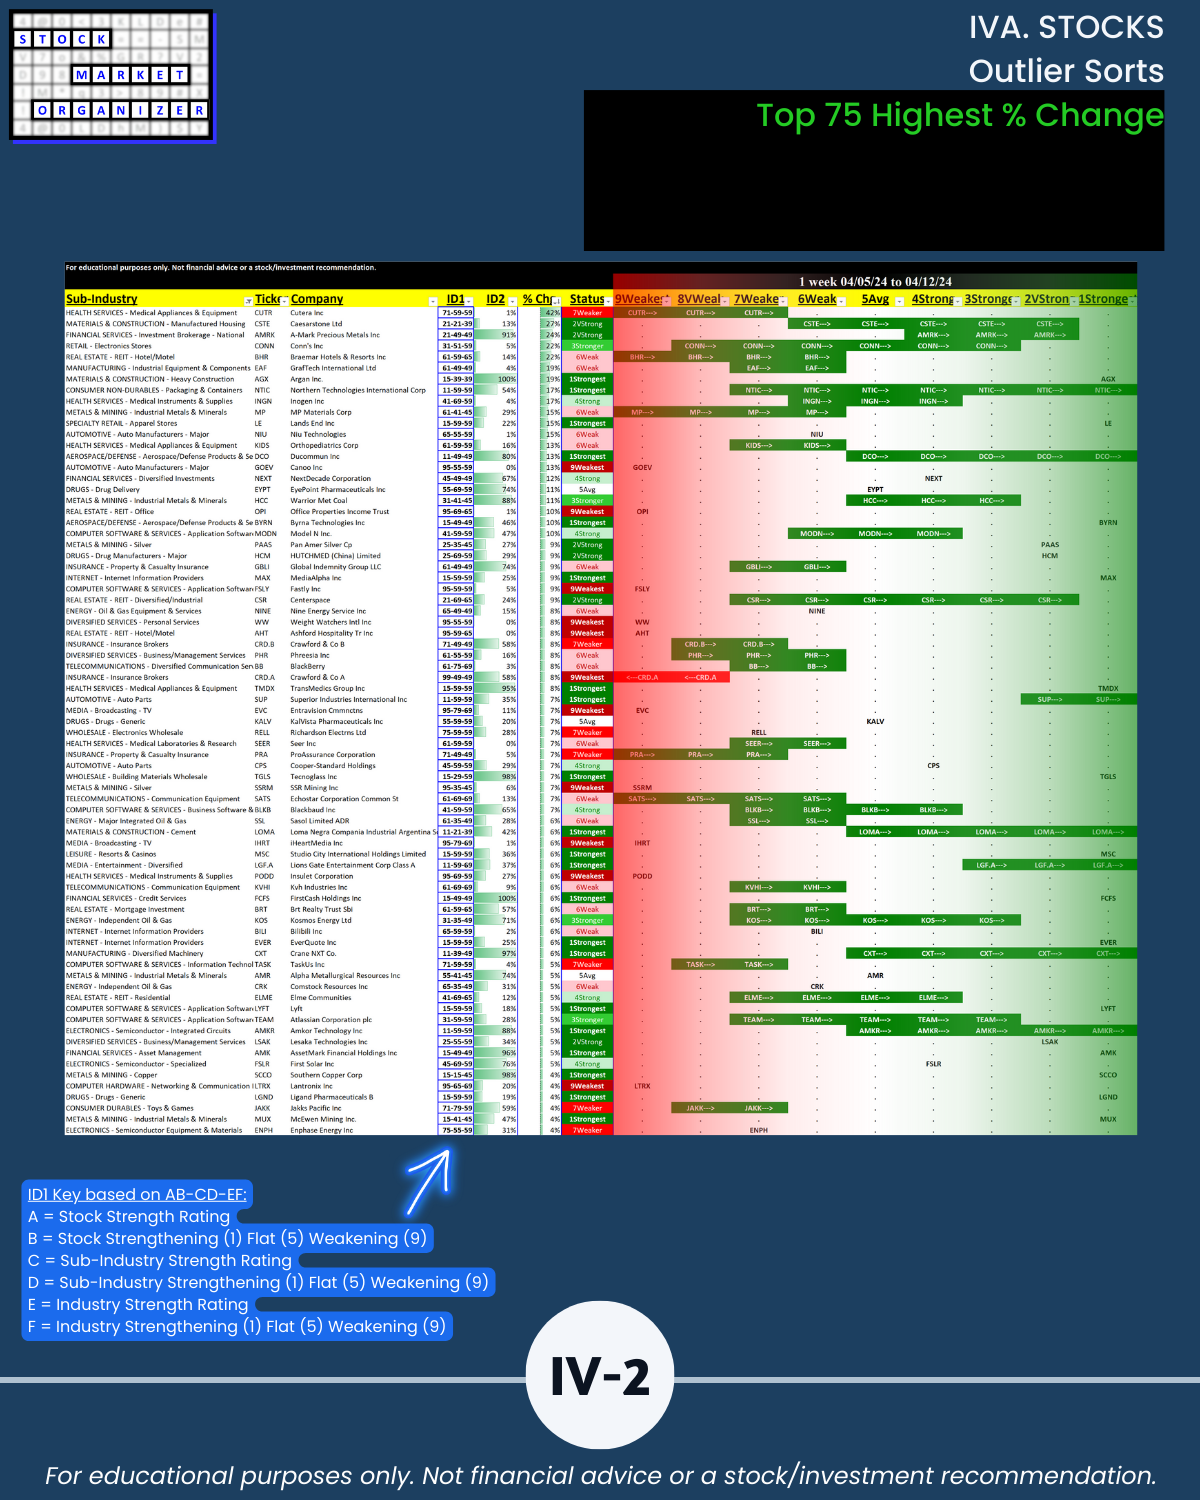
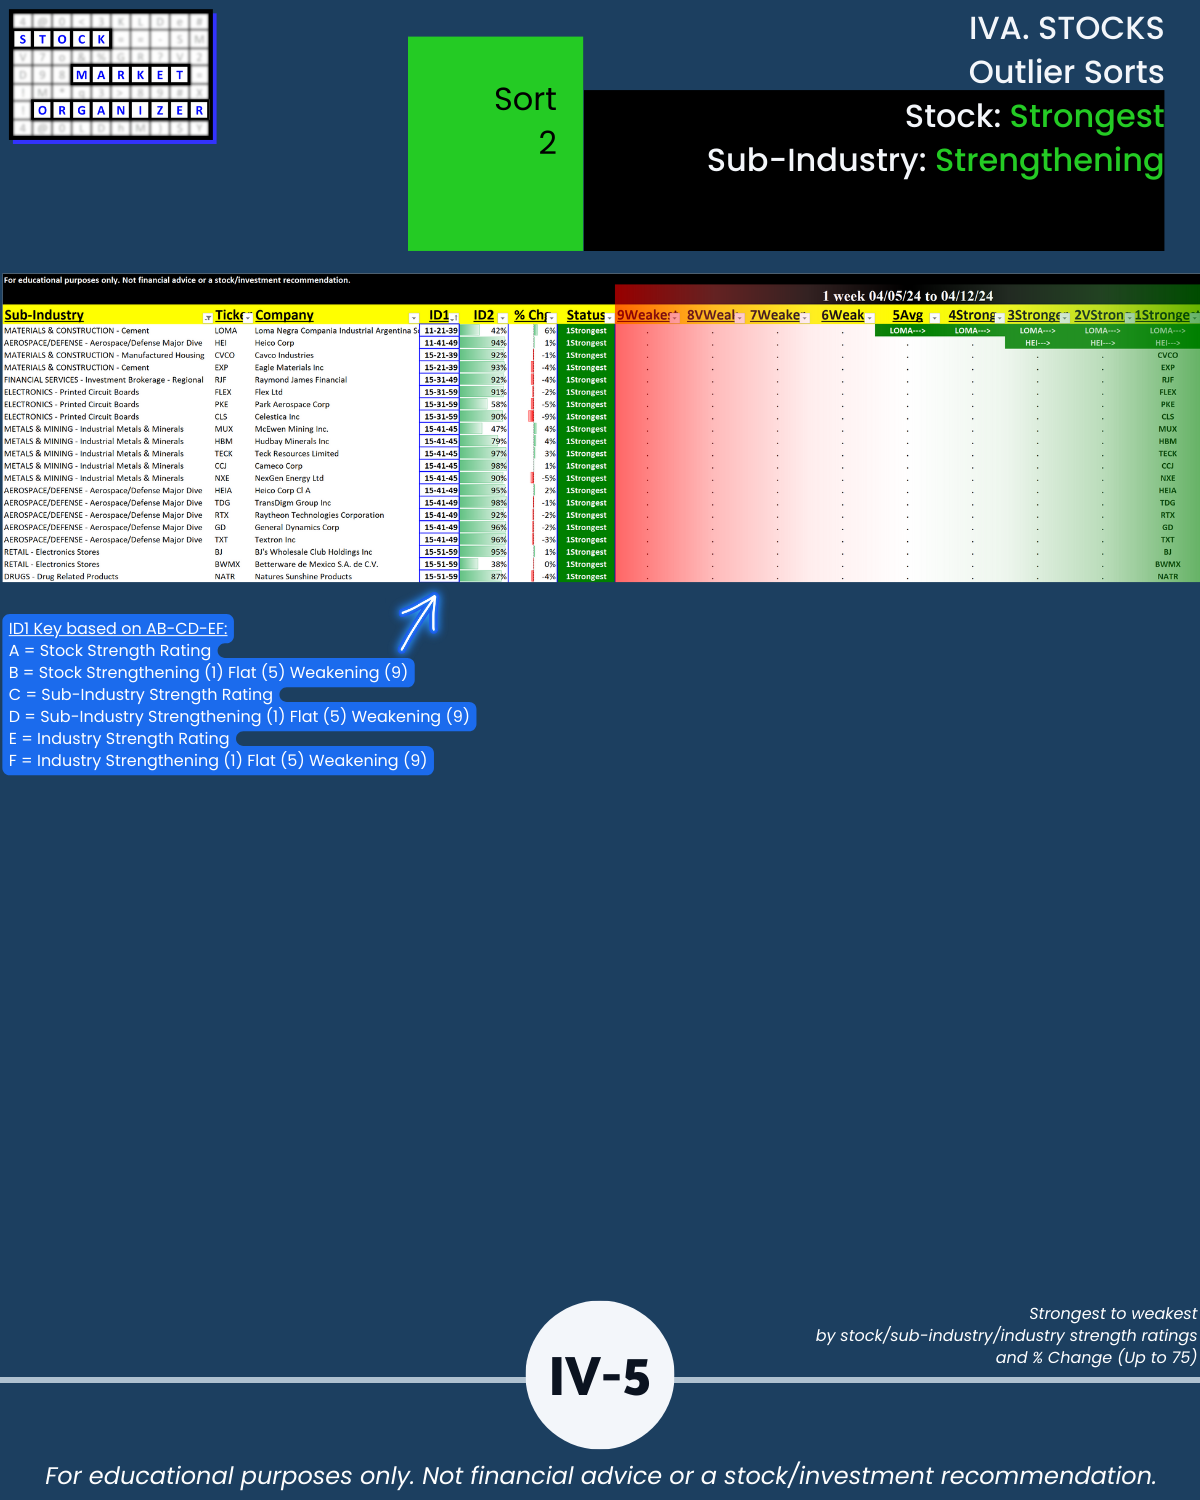
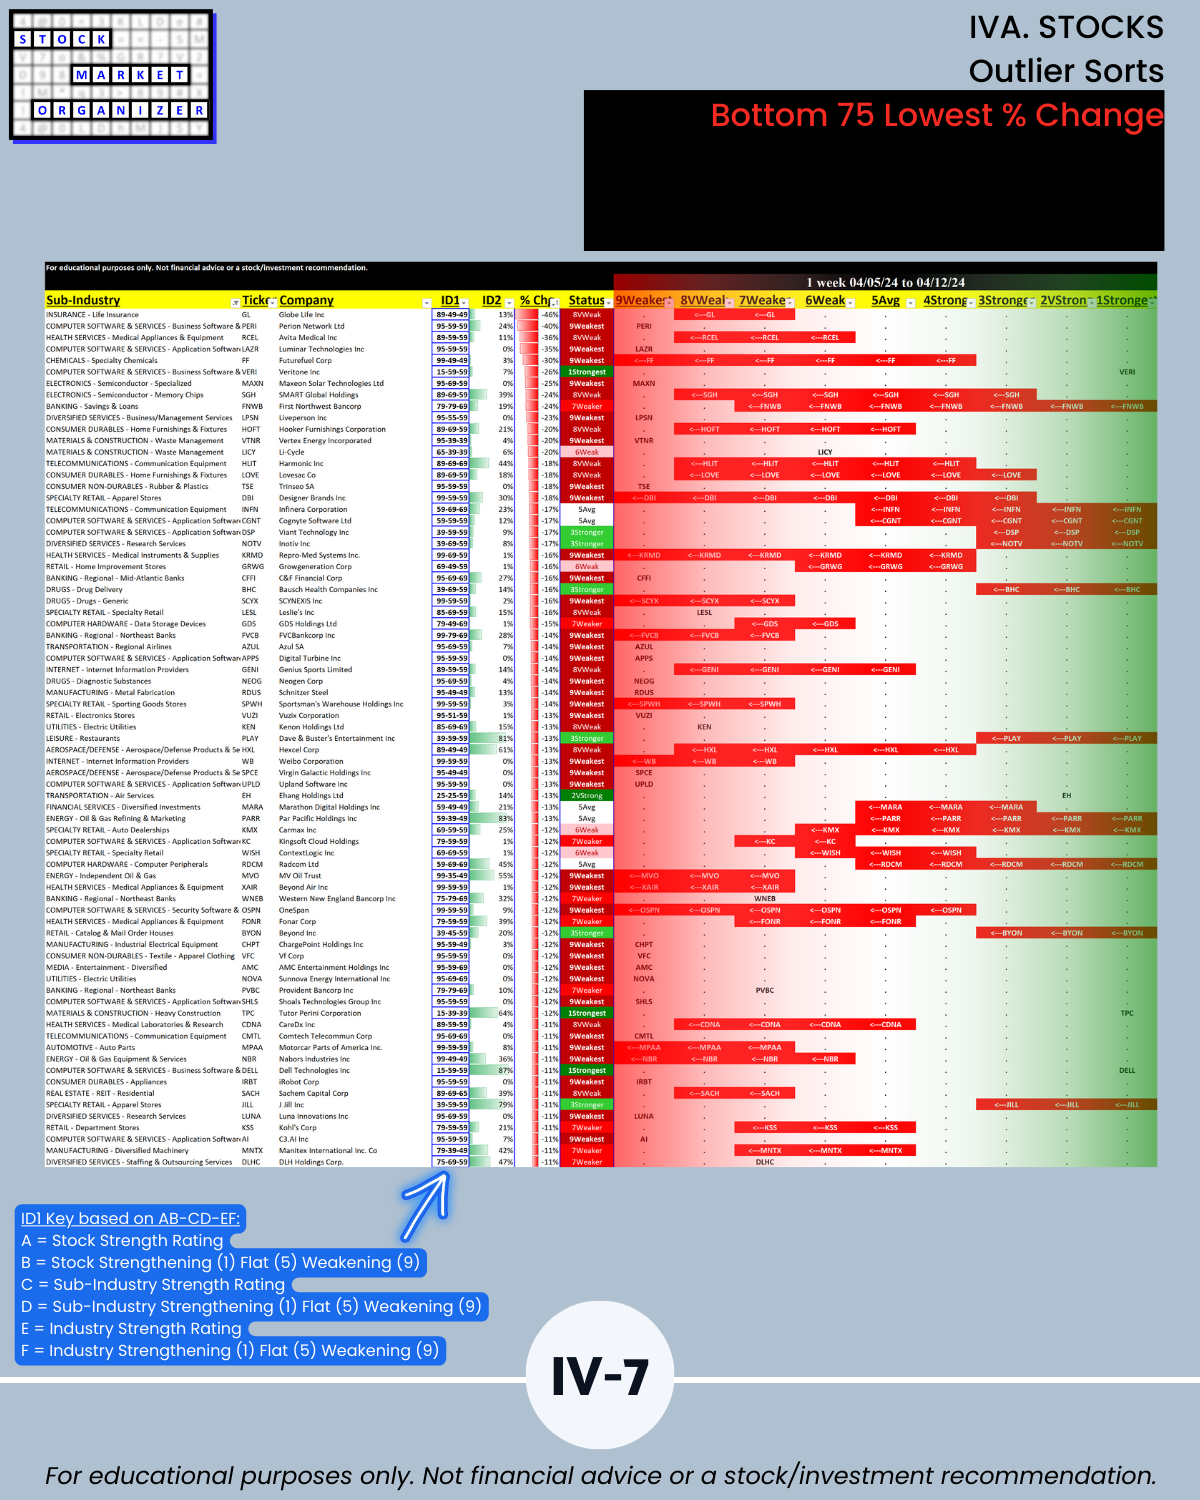
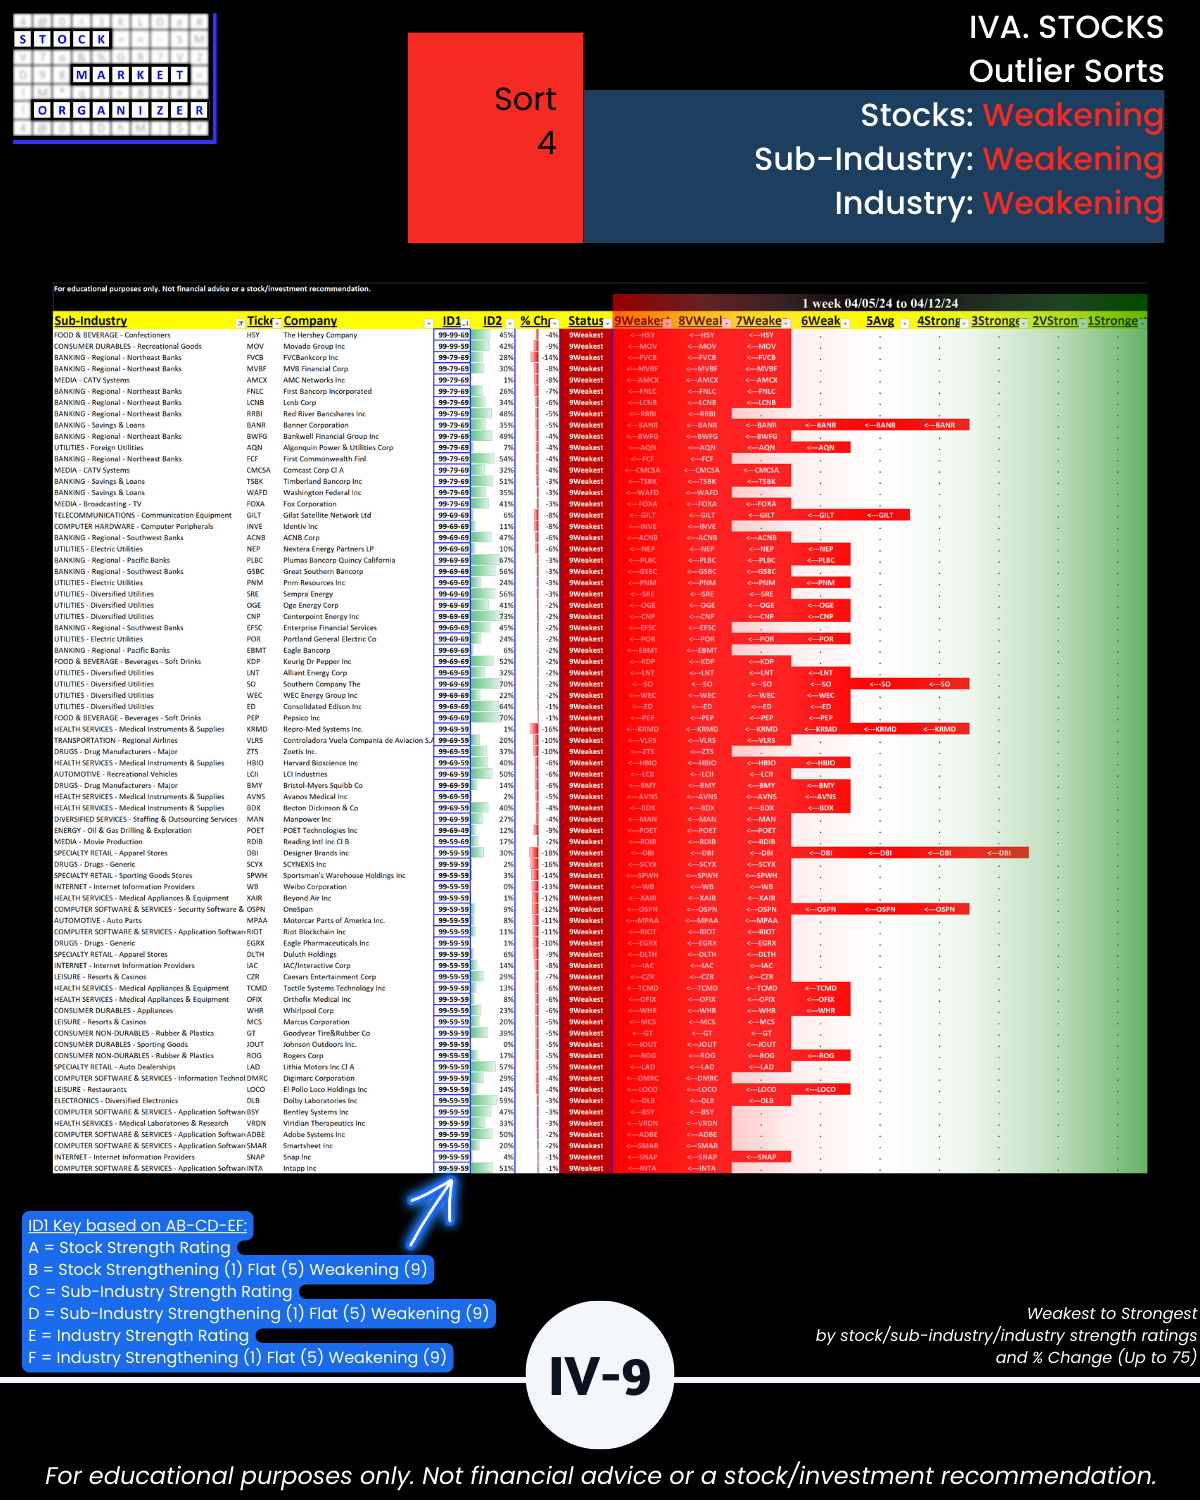
IVA. STOCKS Outlier Sorts
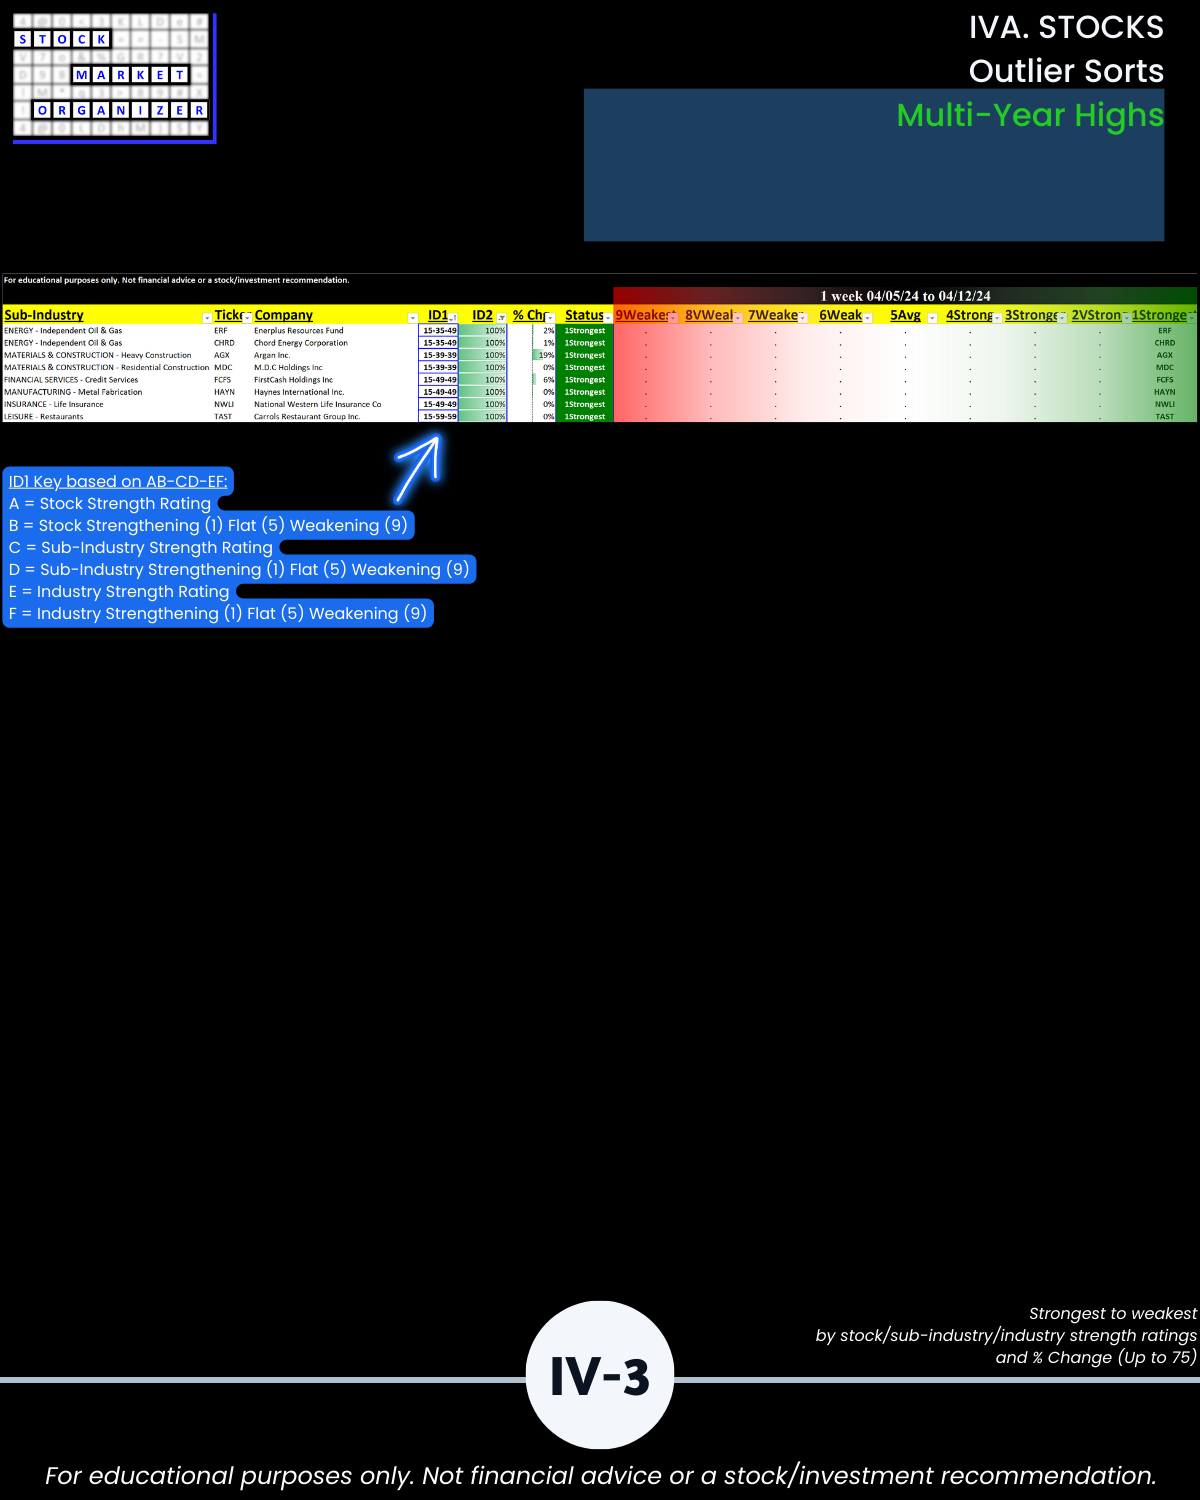
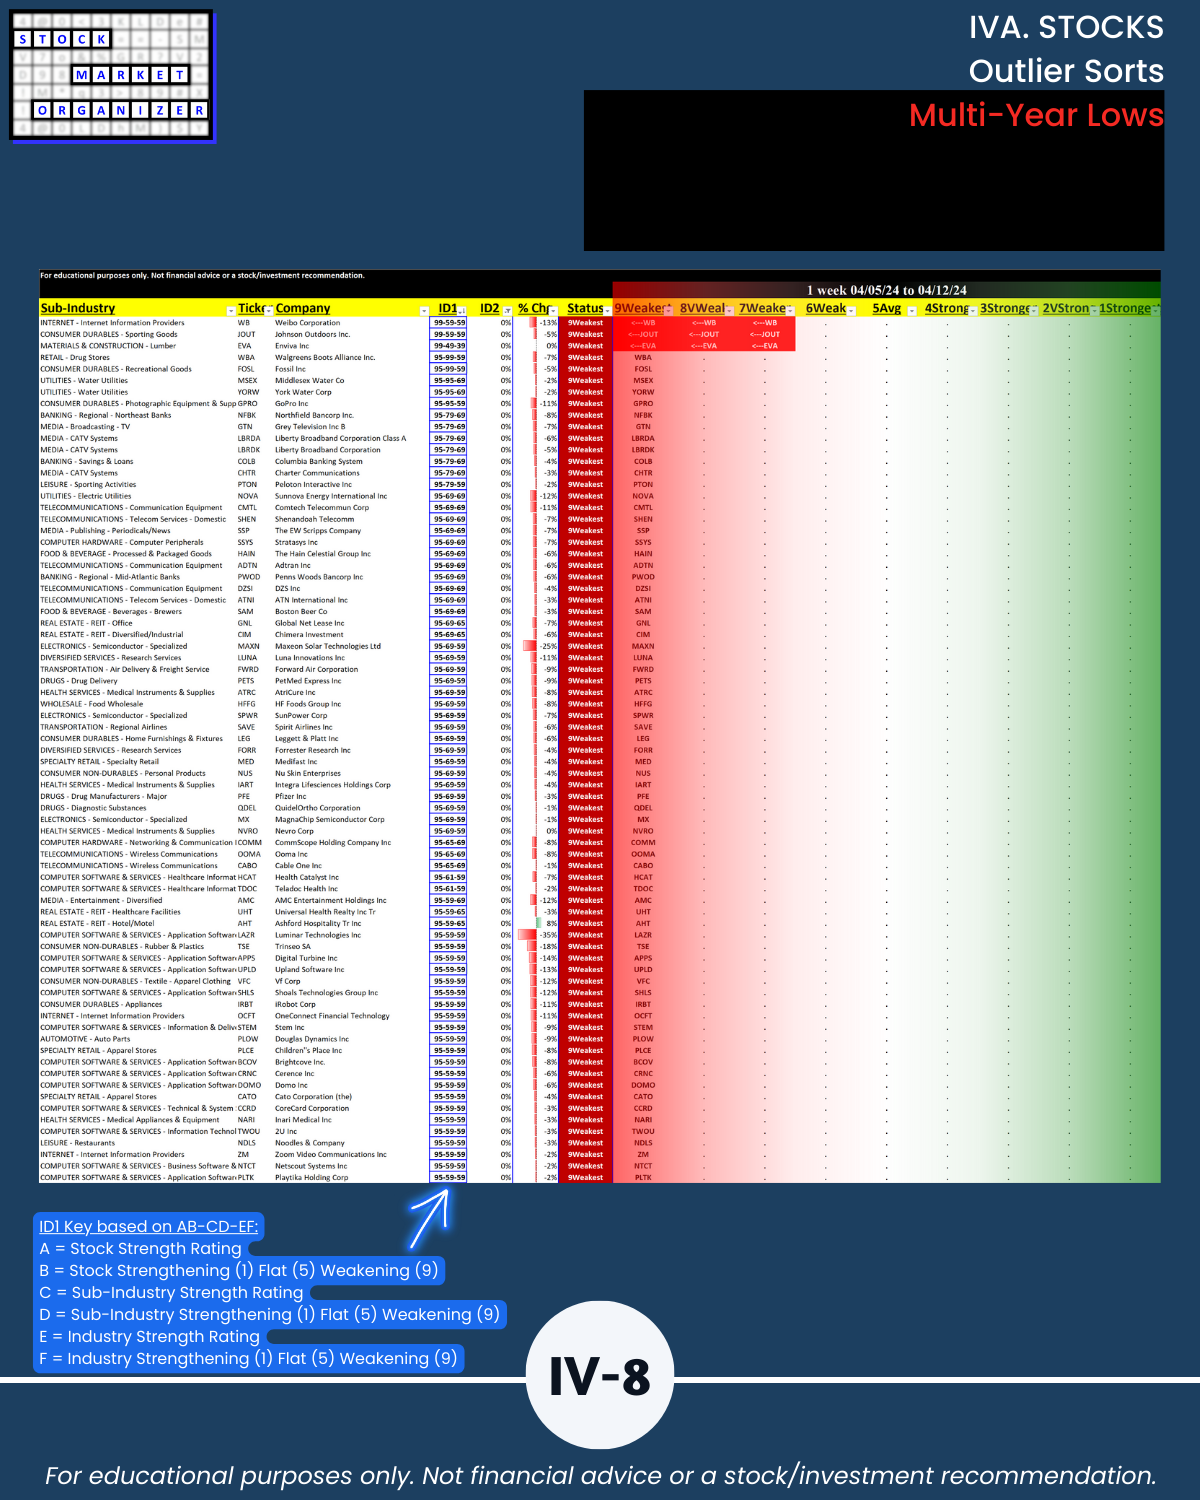
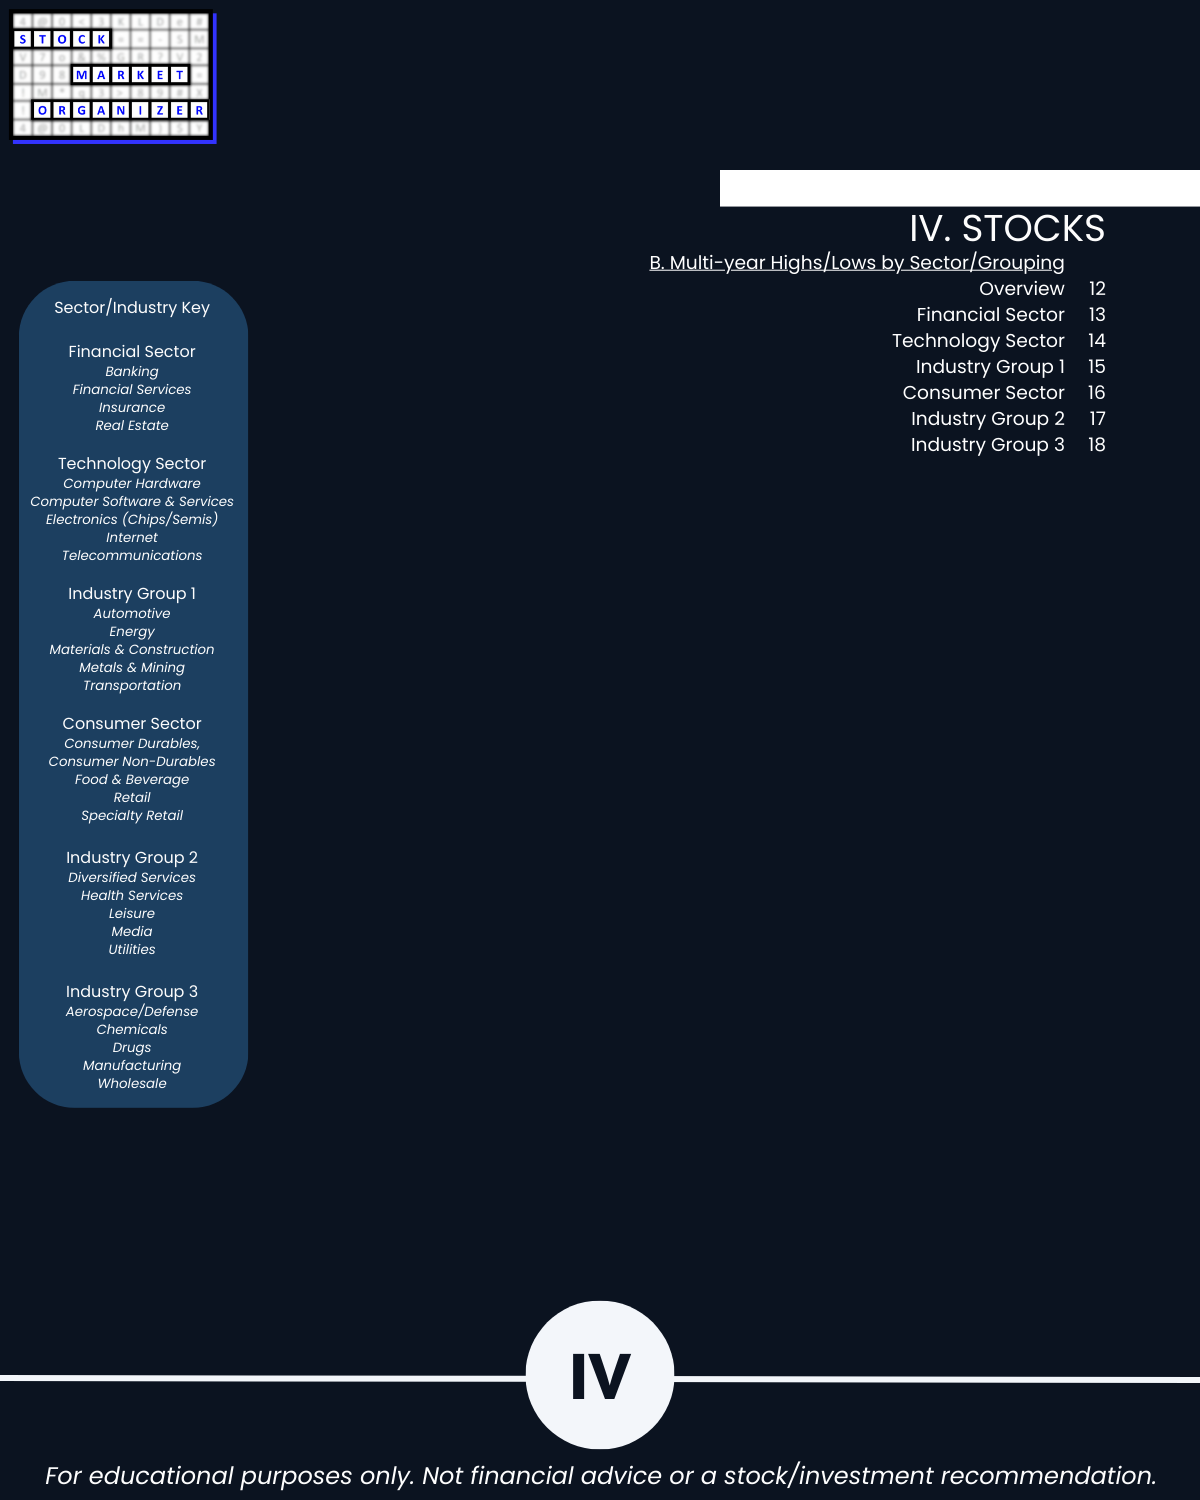
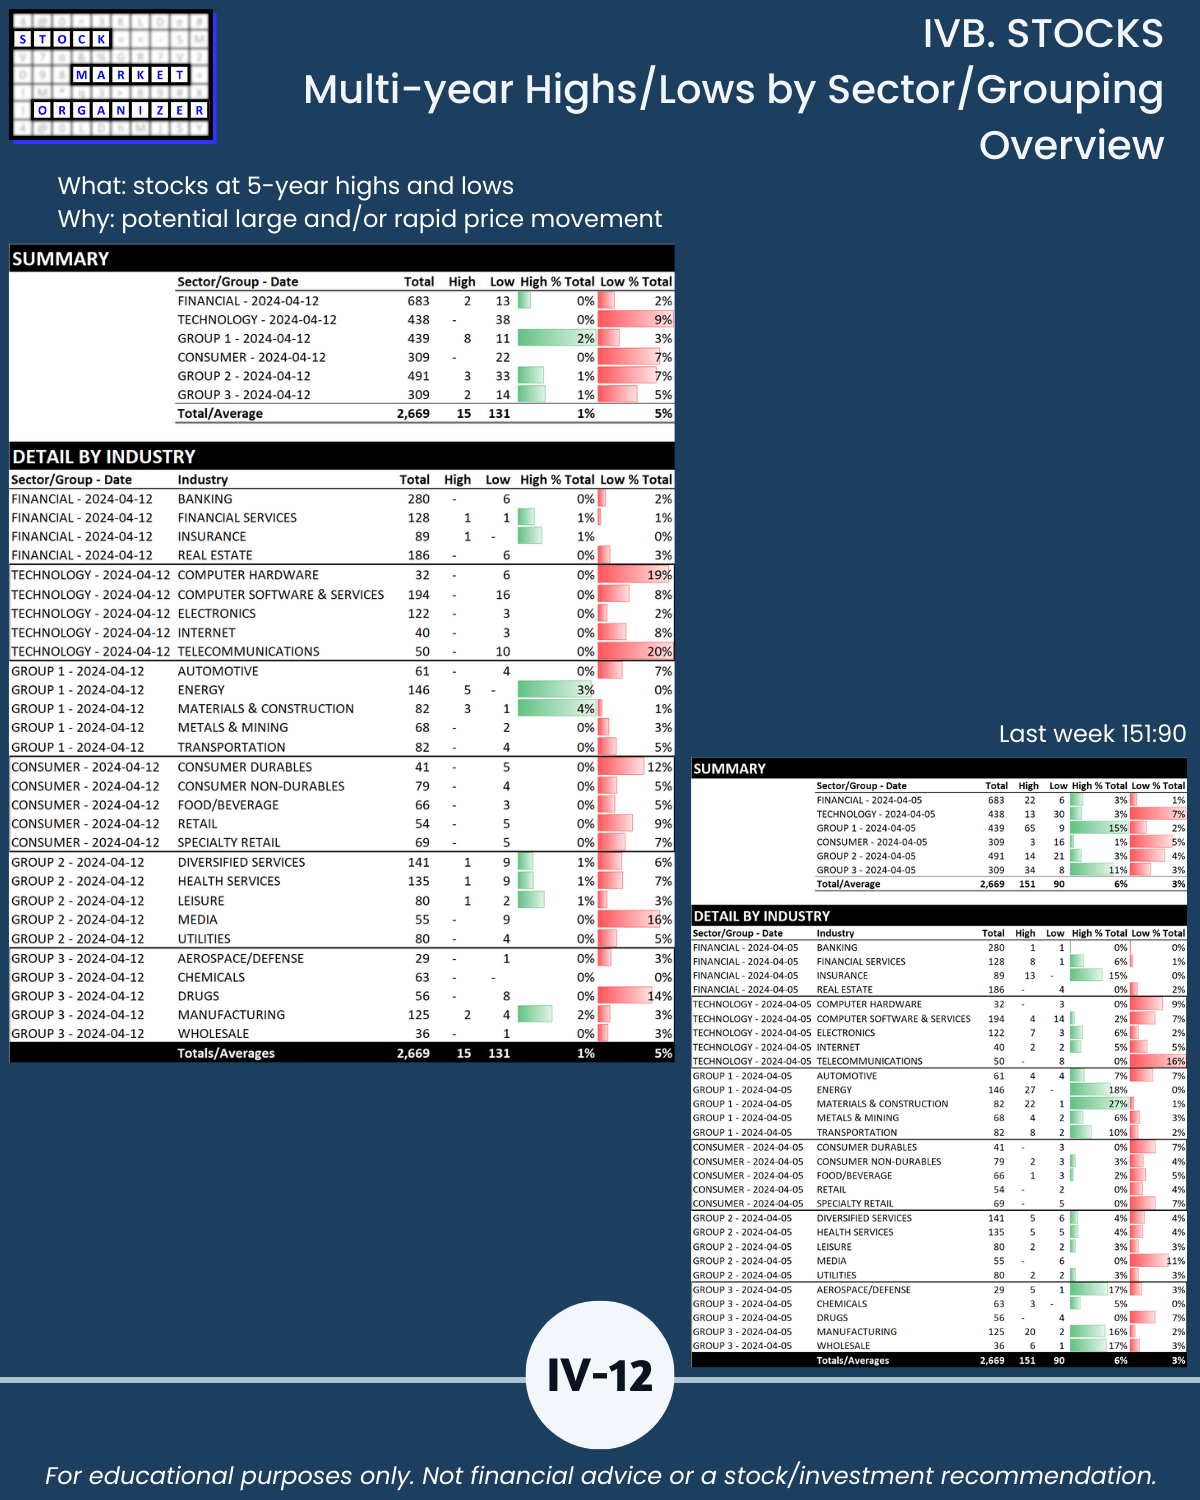
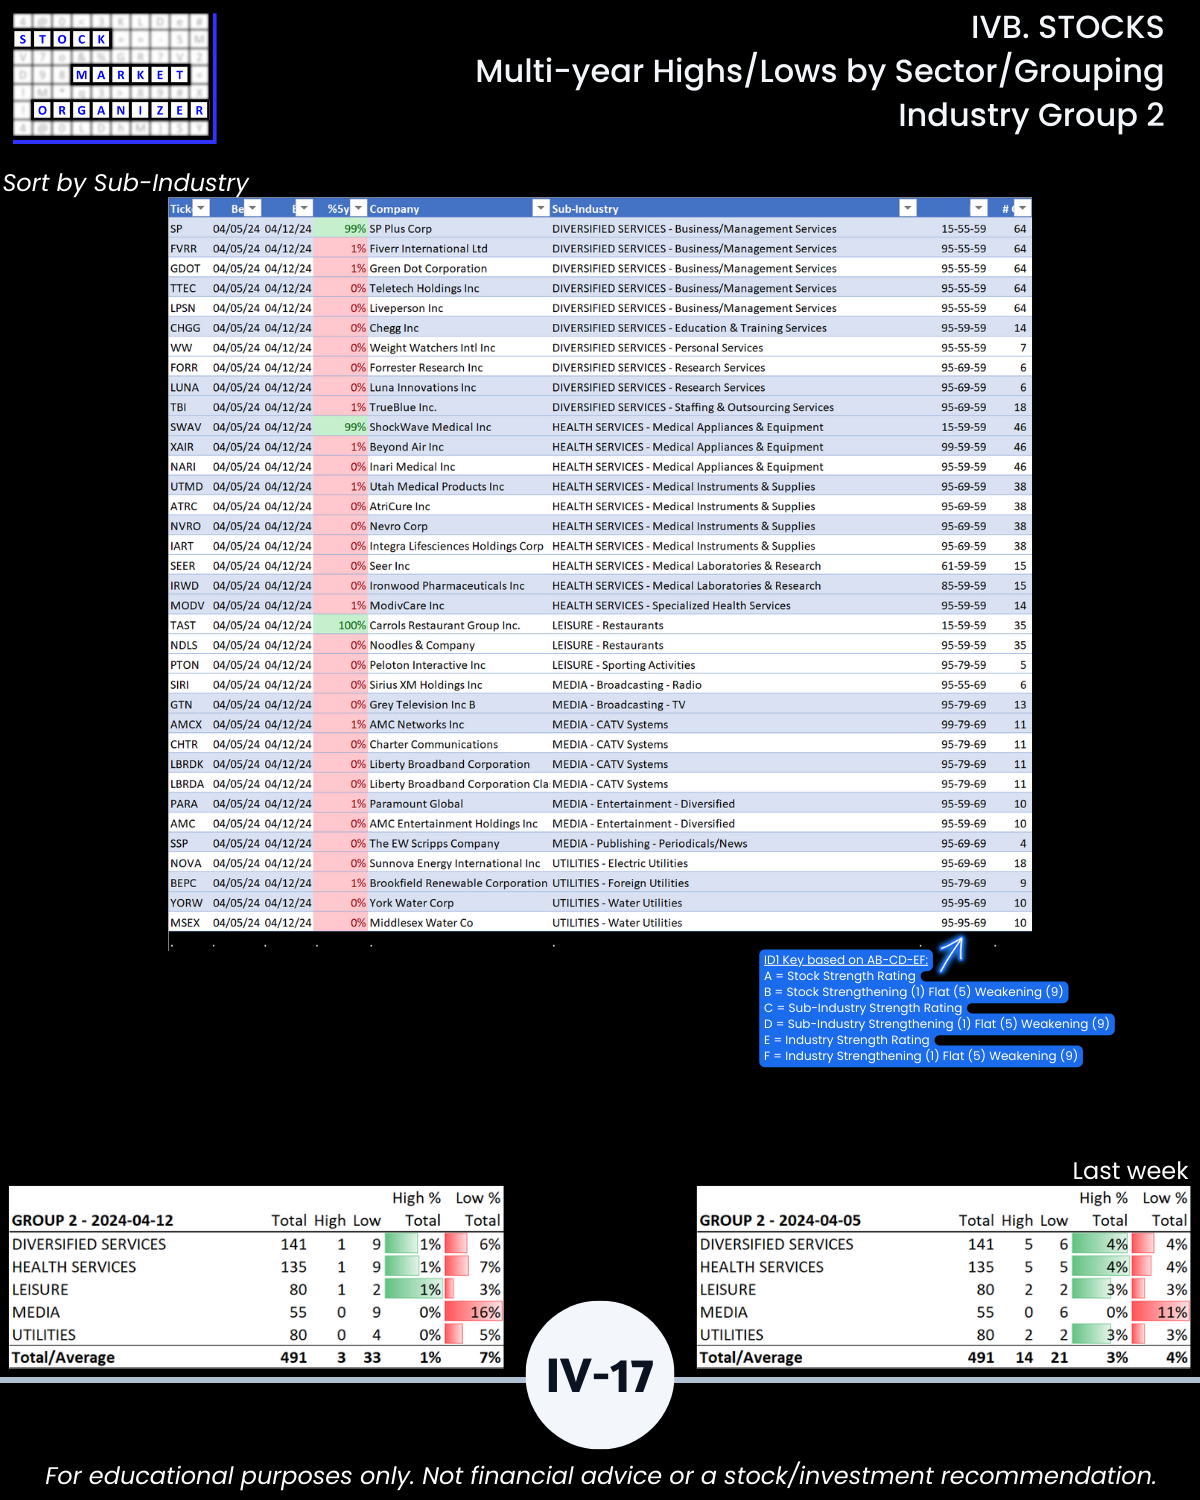
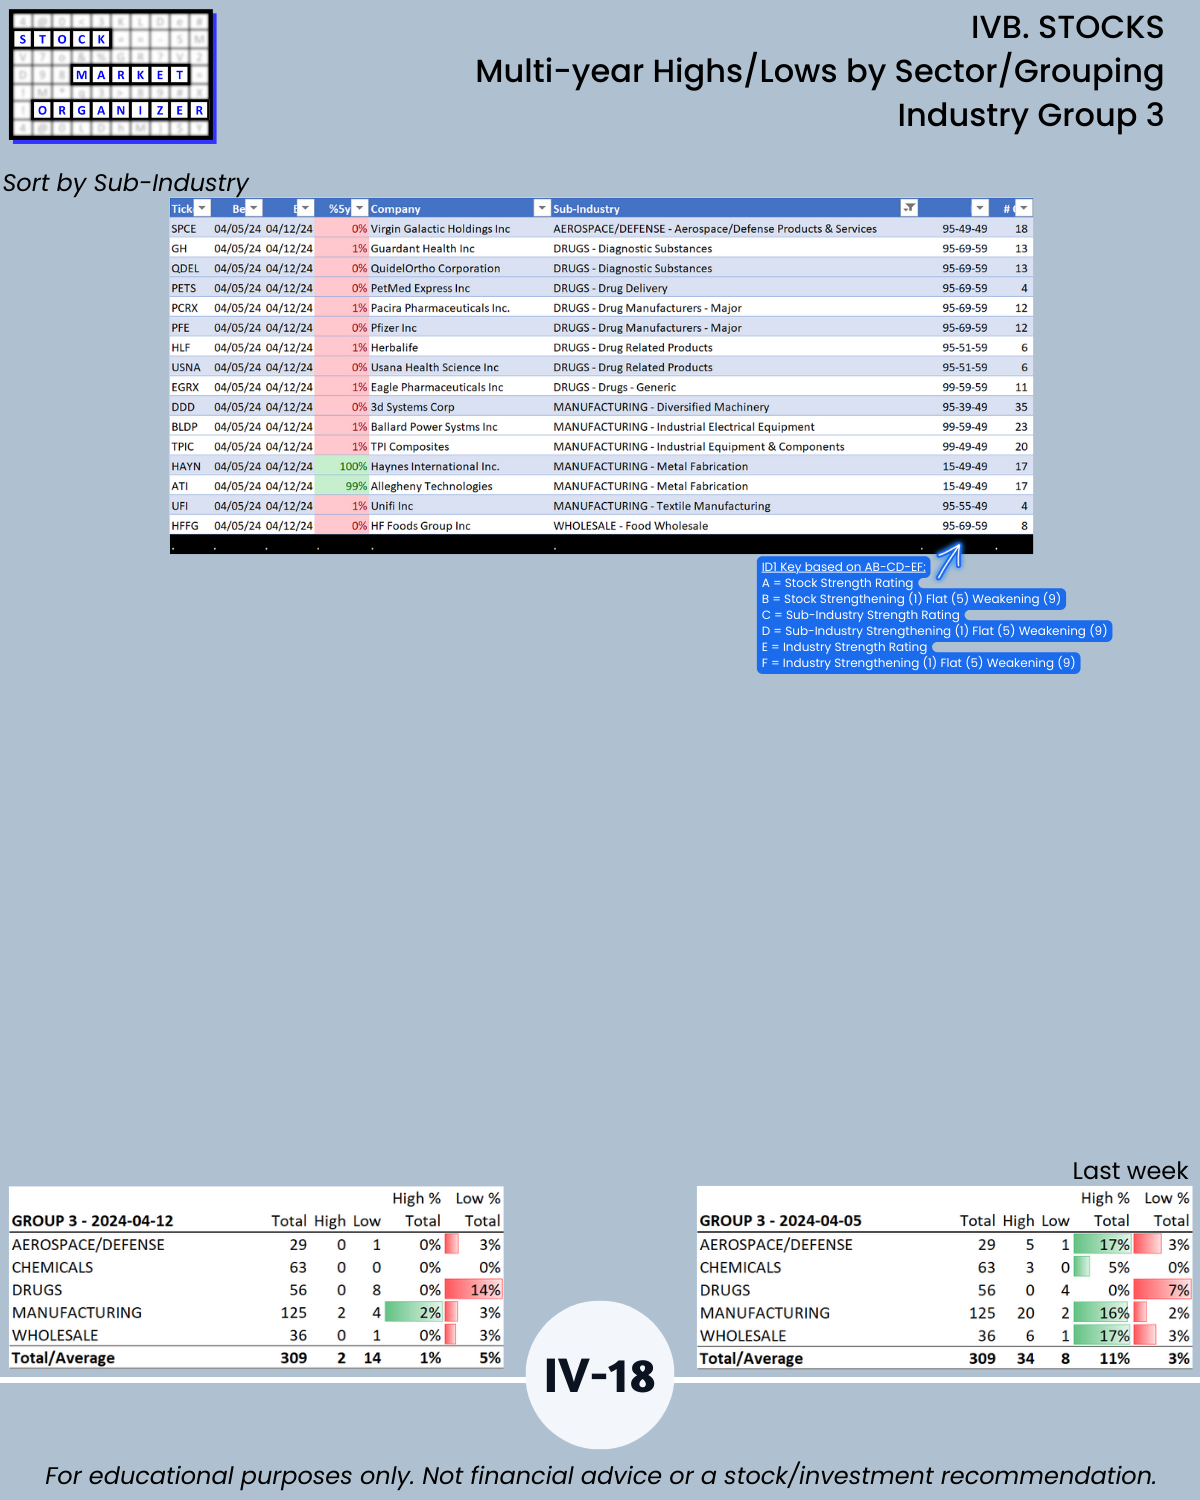
IVB. STOCKS Multi-Year Highs/Lows by Sector/Grouping
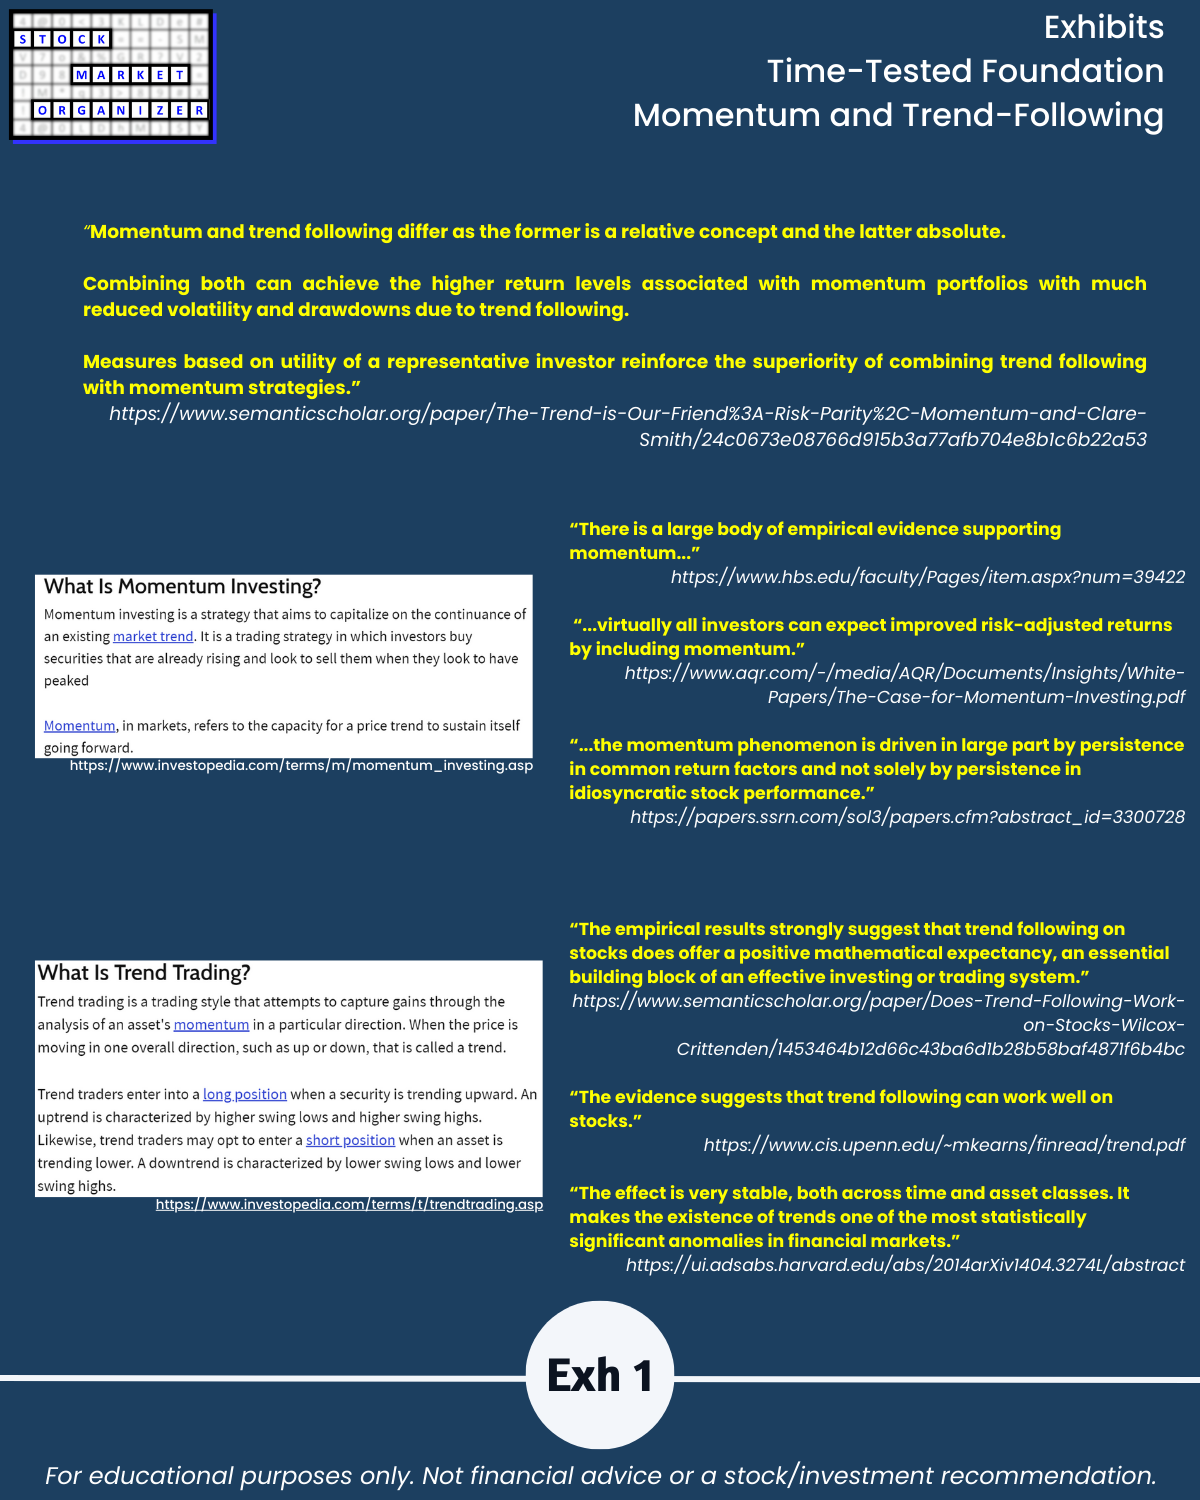
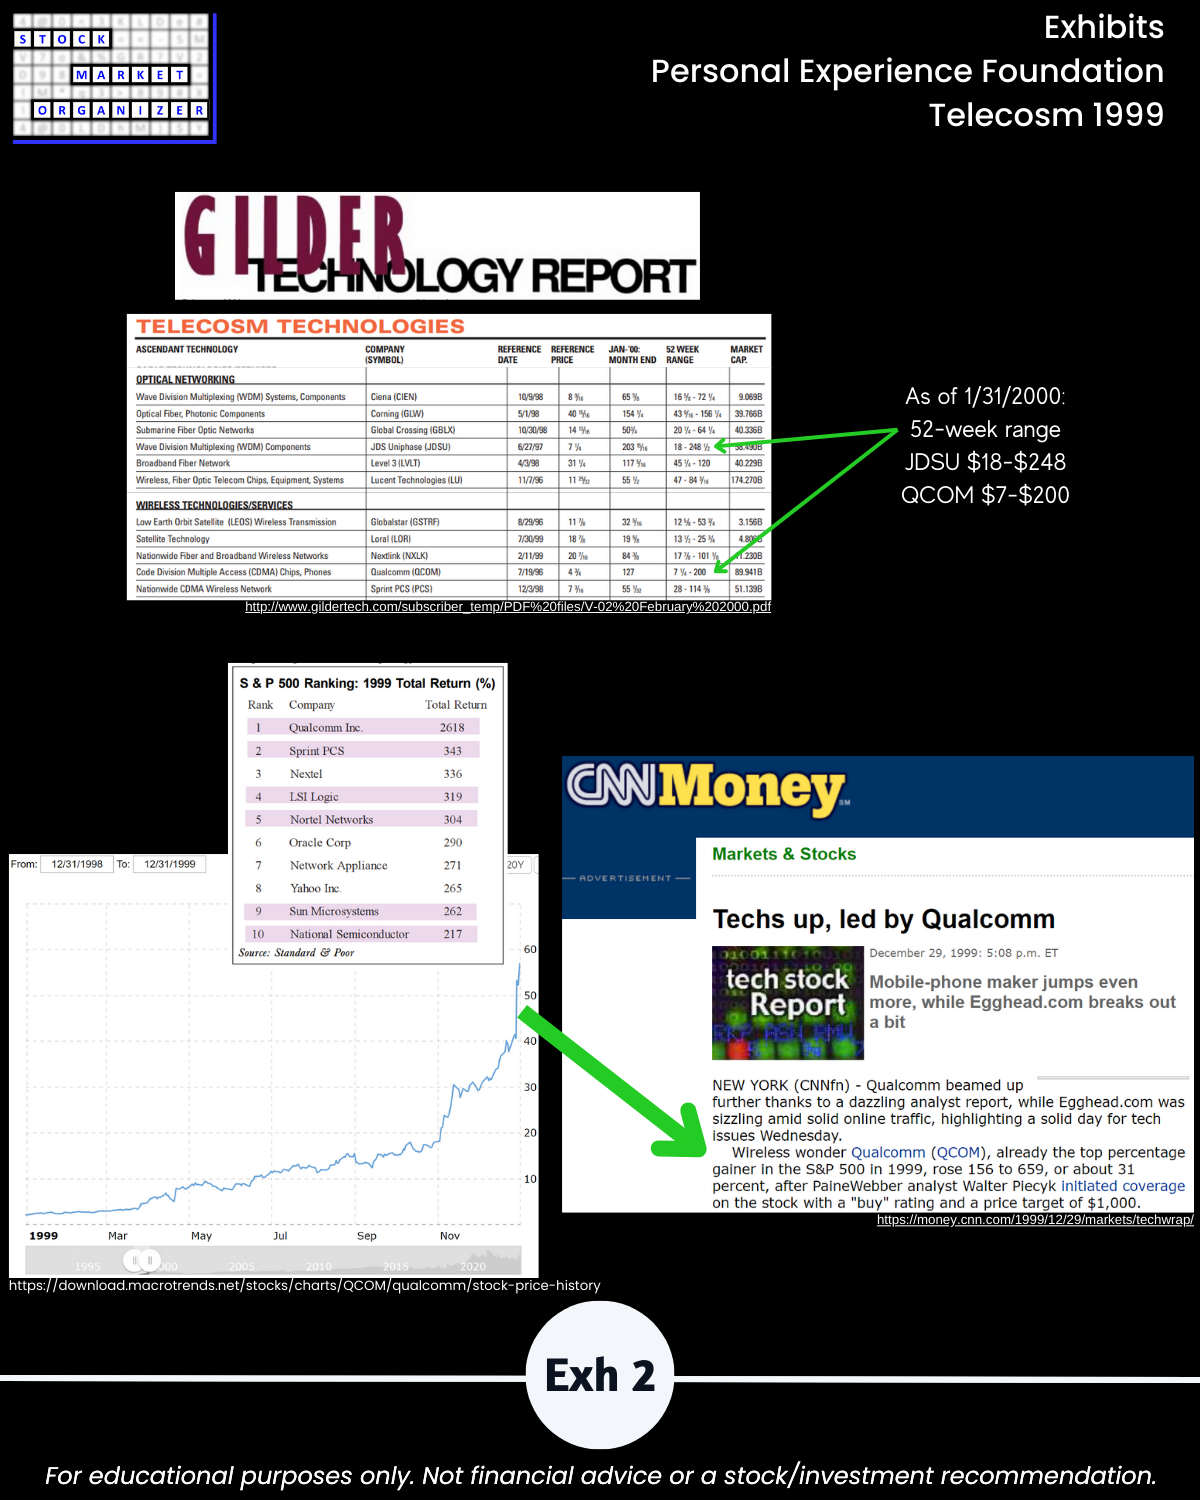
IV. EXHIBITS System Foundations