SMO Exclusive: U.S. Stock Market Strength Report 2024-04-05 (no new Longs)

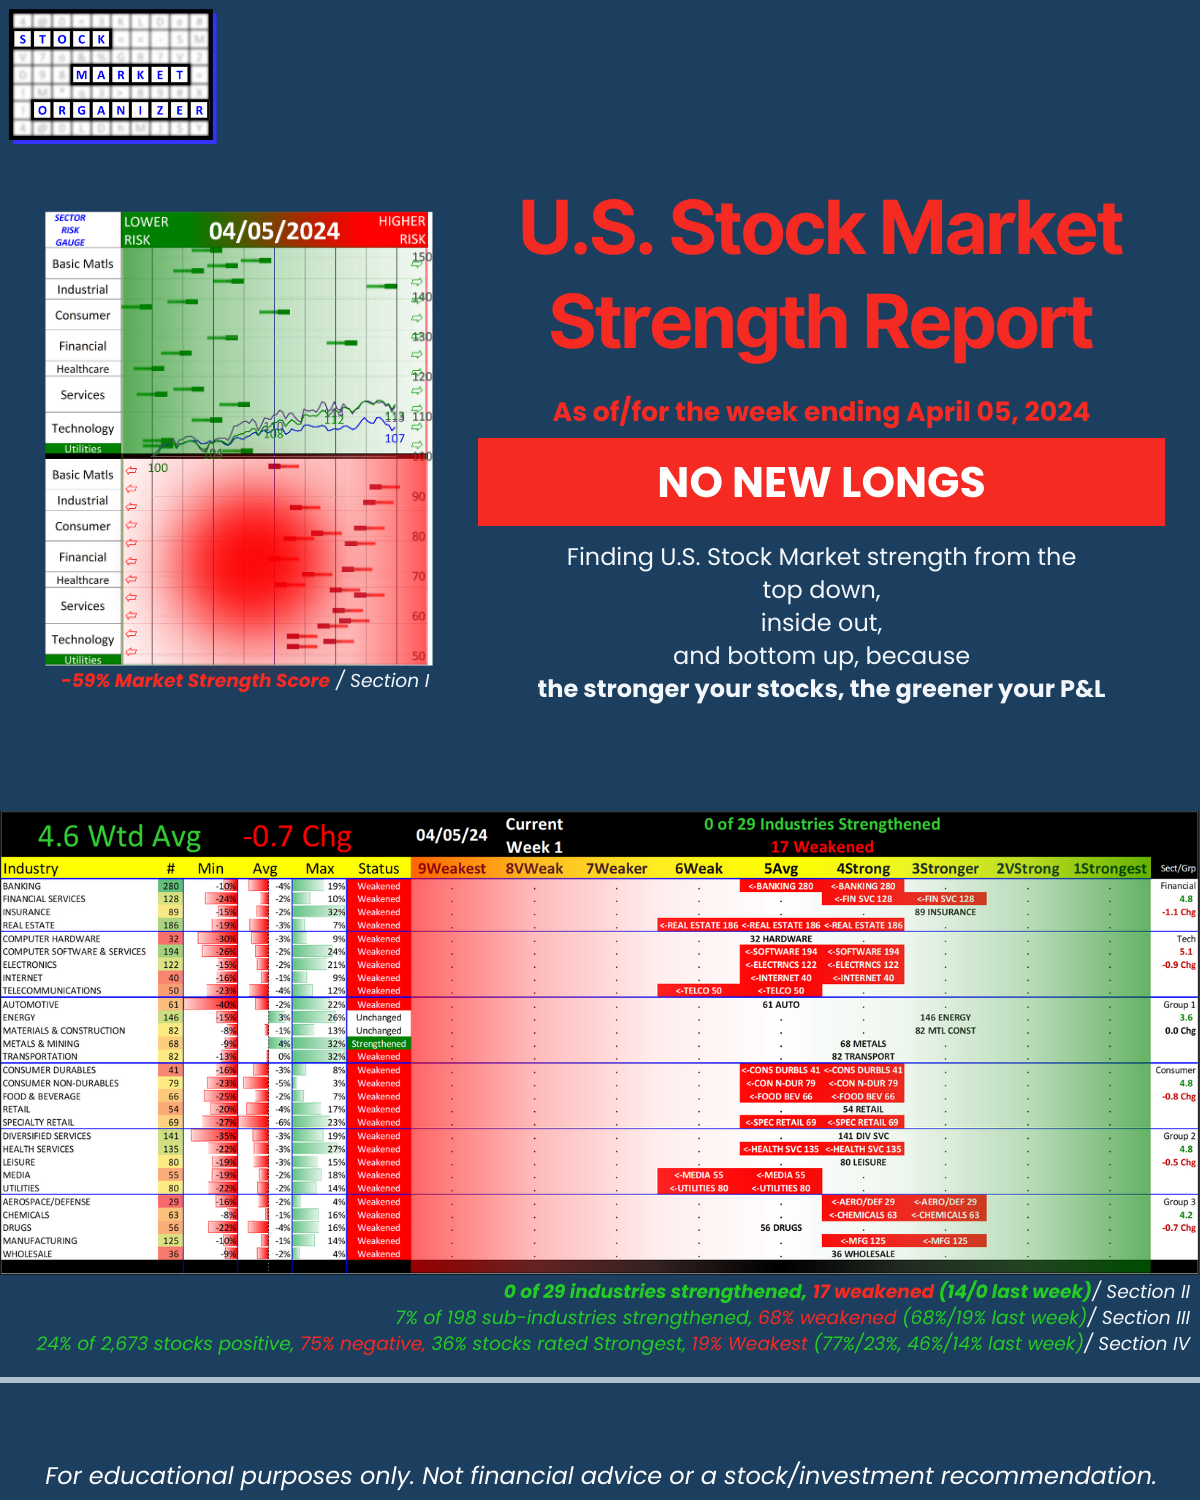
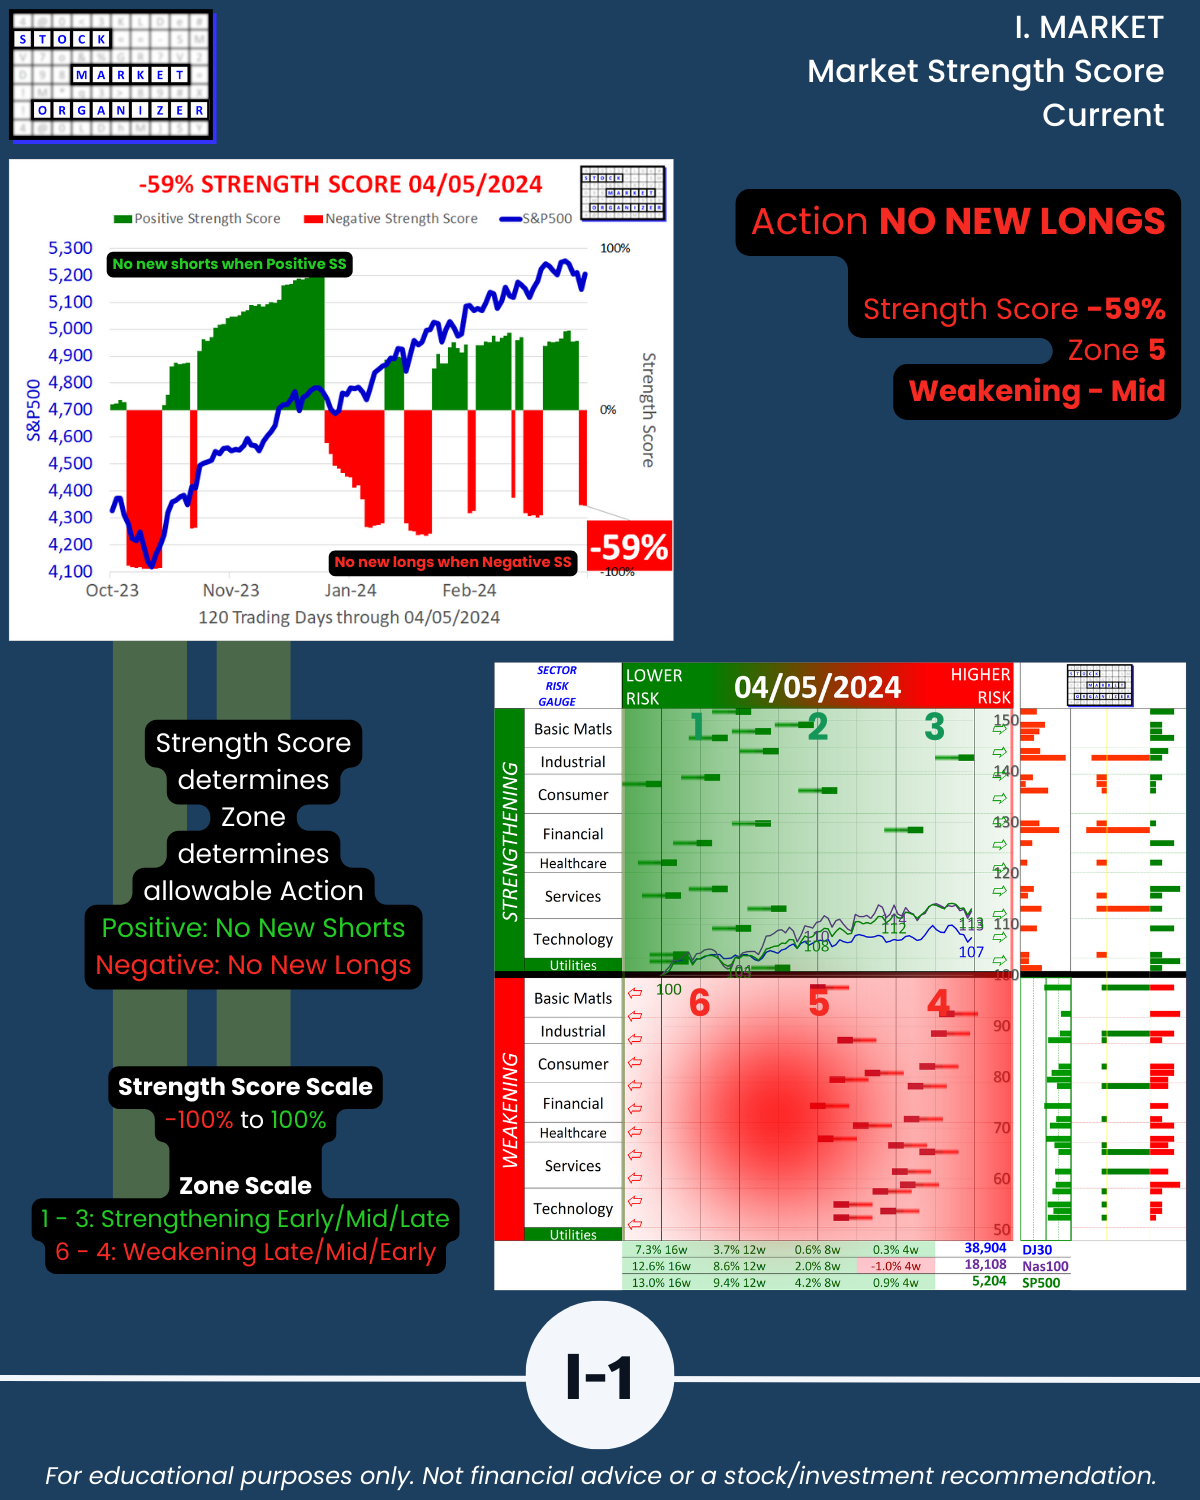
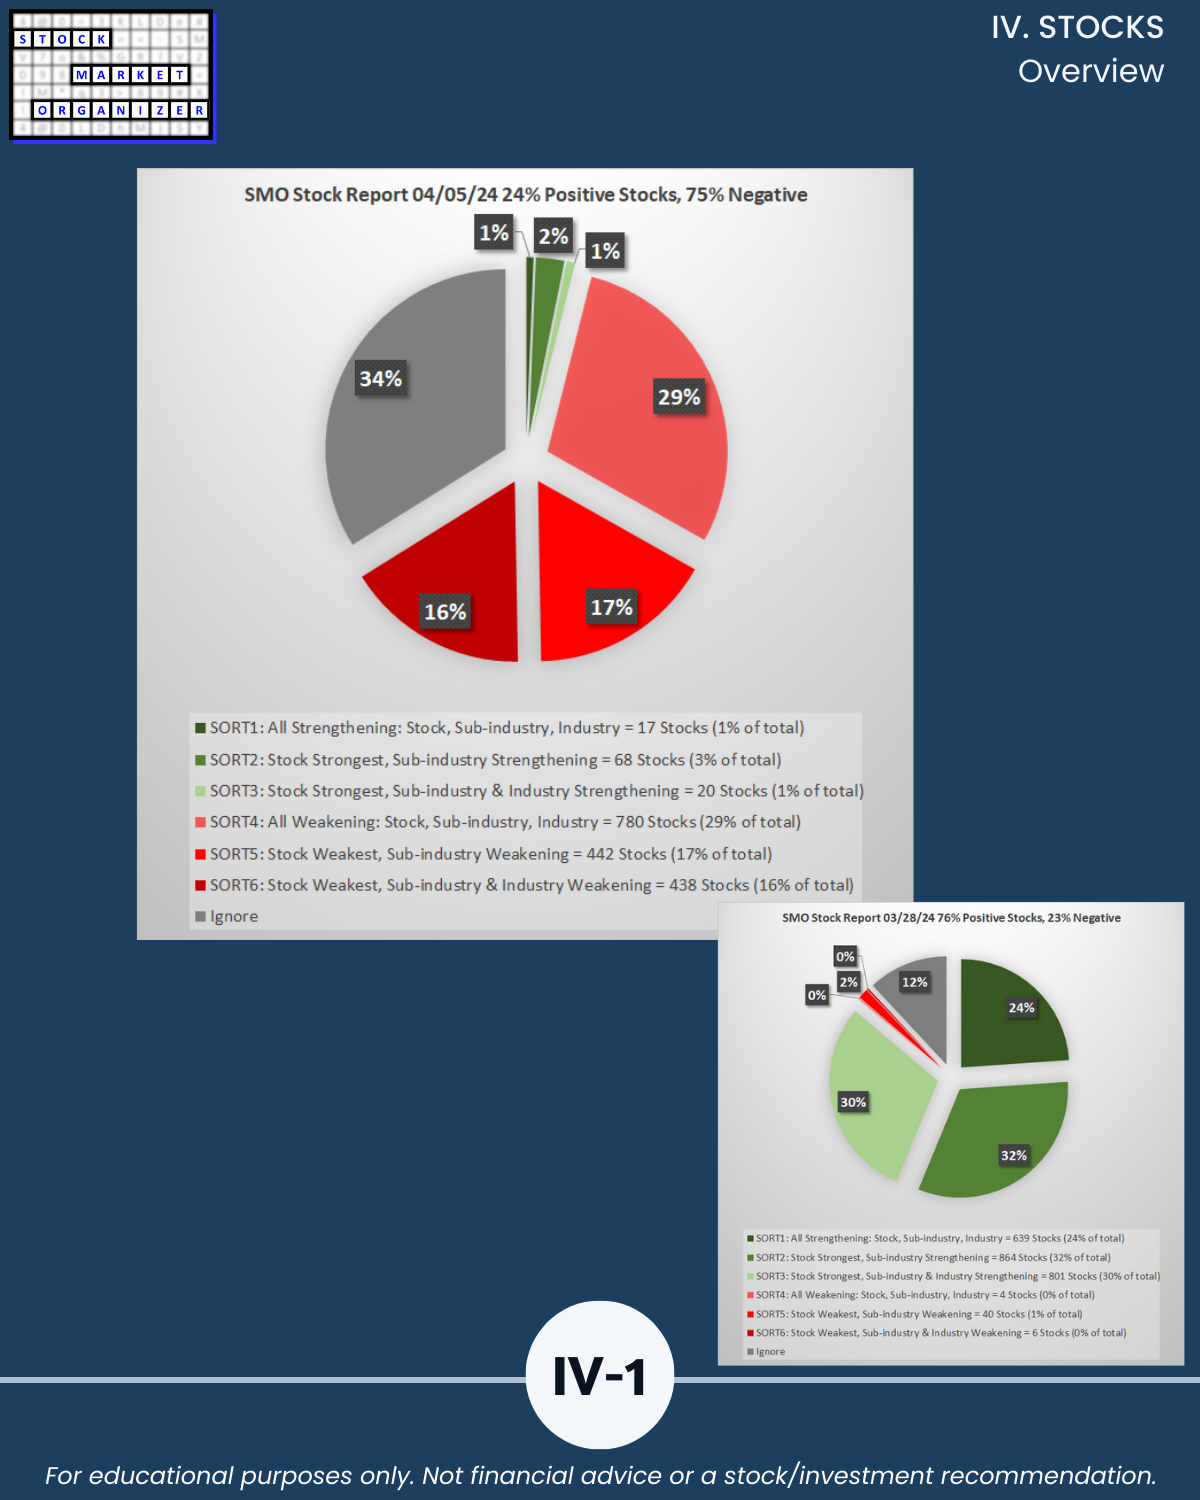
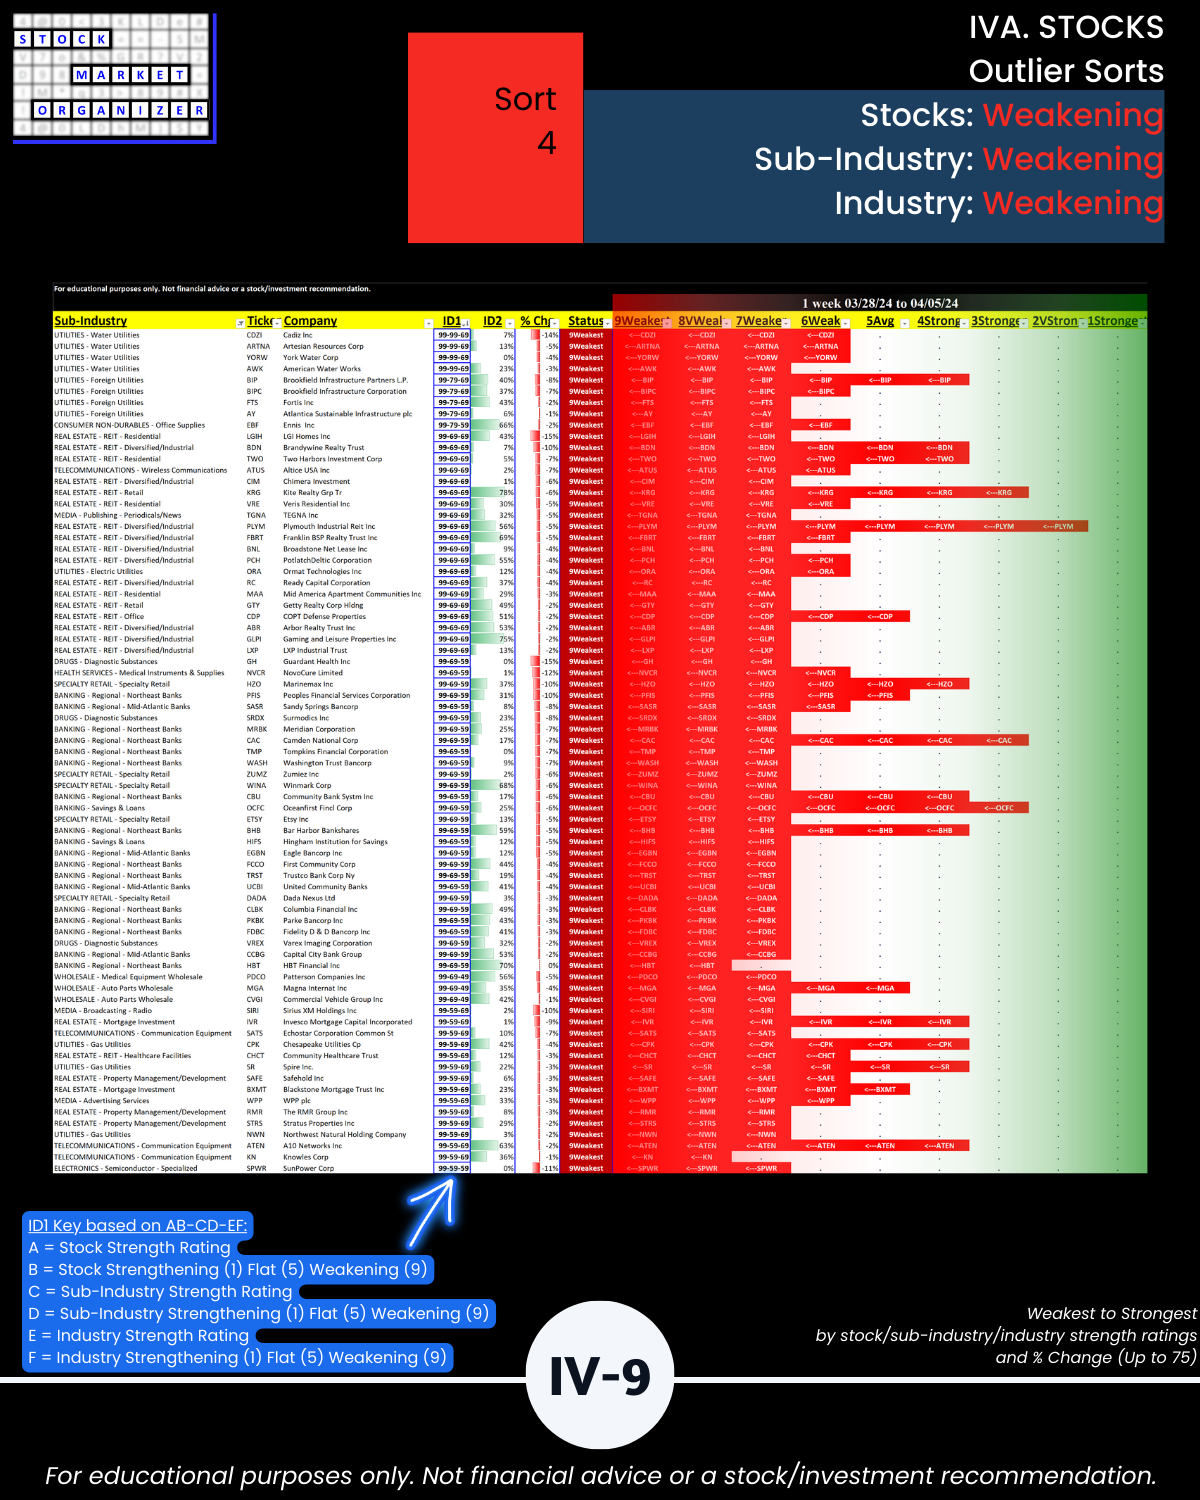
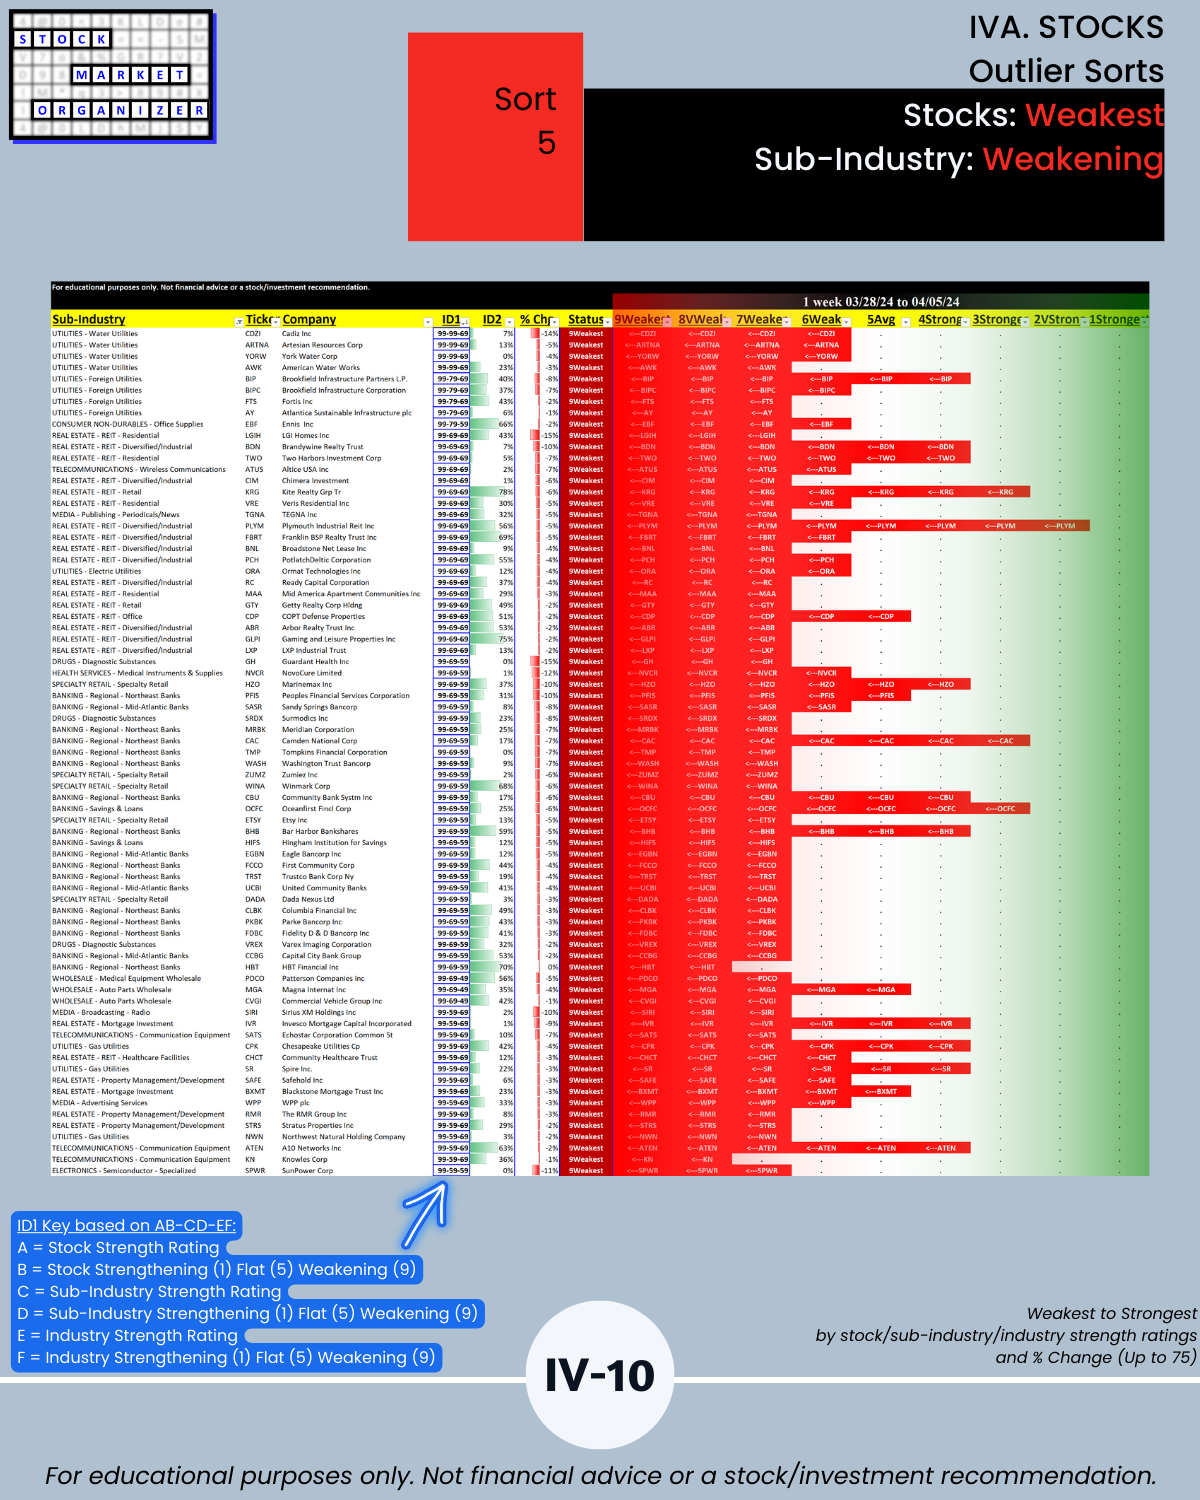
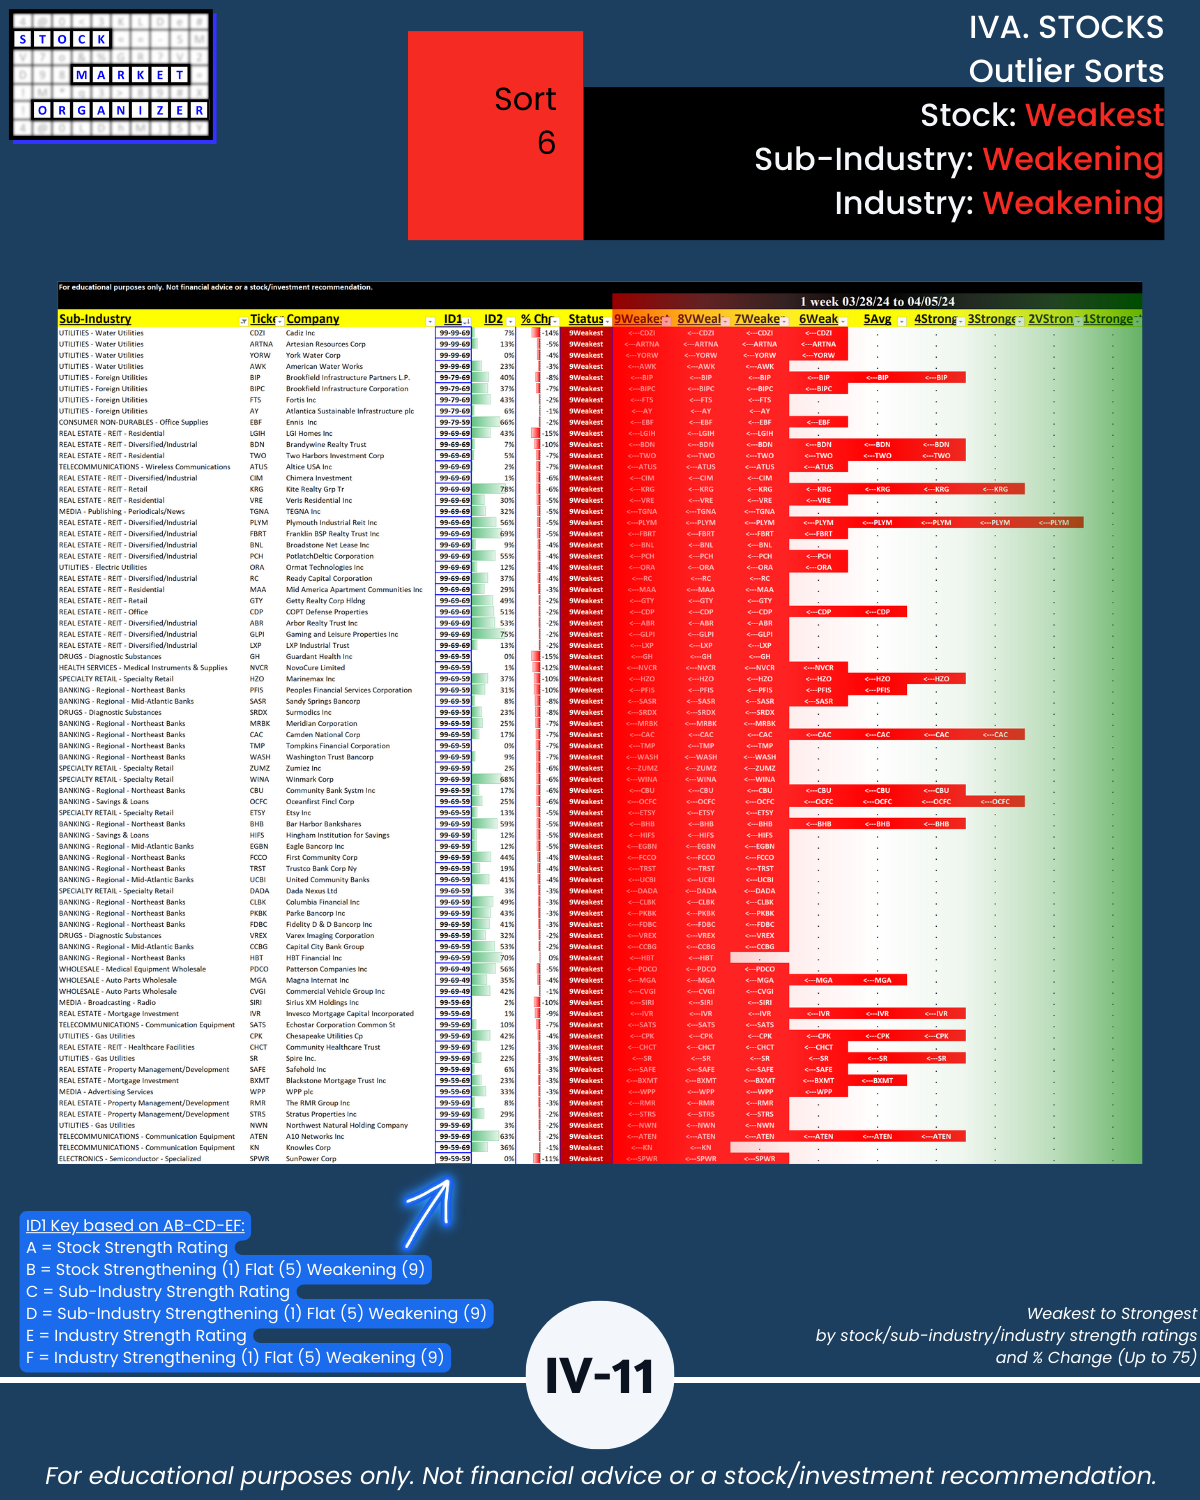
Attached: your comprehensive strength-focused 04/05/24 U.S. stock market report. Bottom line: THIS WEEK’S WEAKENING OFFSET LAST WEEK’S STRENGTHENING. Headline summary, extreme detail in the report: 🔹 -59% market strength score = No New Longs / see Section I 🔹 0 of 29 industries strengthened, 17 weakened (14/0 last week)/ see Section II 🔹 7% of 198 sub-industries strengthened, 68% weakened (68%/19% last week)/ see Section III 🔹 24% of 2,669 stocks positive, 76% negative, 36% stocks rated Strongest, 19% Weakest (77%/23%, 46%/14% last week)/ see Section IV.
What’s here? Measurements and pure objective reporting, not opinions or interpretations.
What’s here? Process, not predictions.
Will strengthening or weakening prevail this week? I don’t know and I make no predictions. I just act based on what IS, not what anyone thinks MIGHT BE.
WHAT’S HAPPENING?
Here, I am
Finding U.S. Stock Market strength from the
top down,
inside out,
and bottom up, because
the stronger your stocks, the greener your P&L.
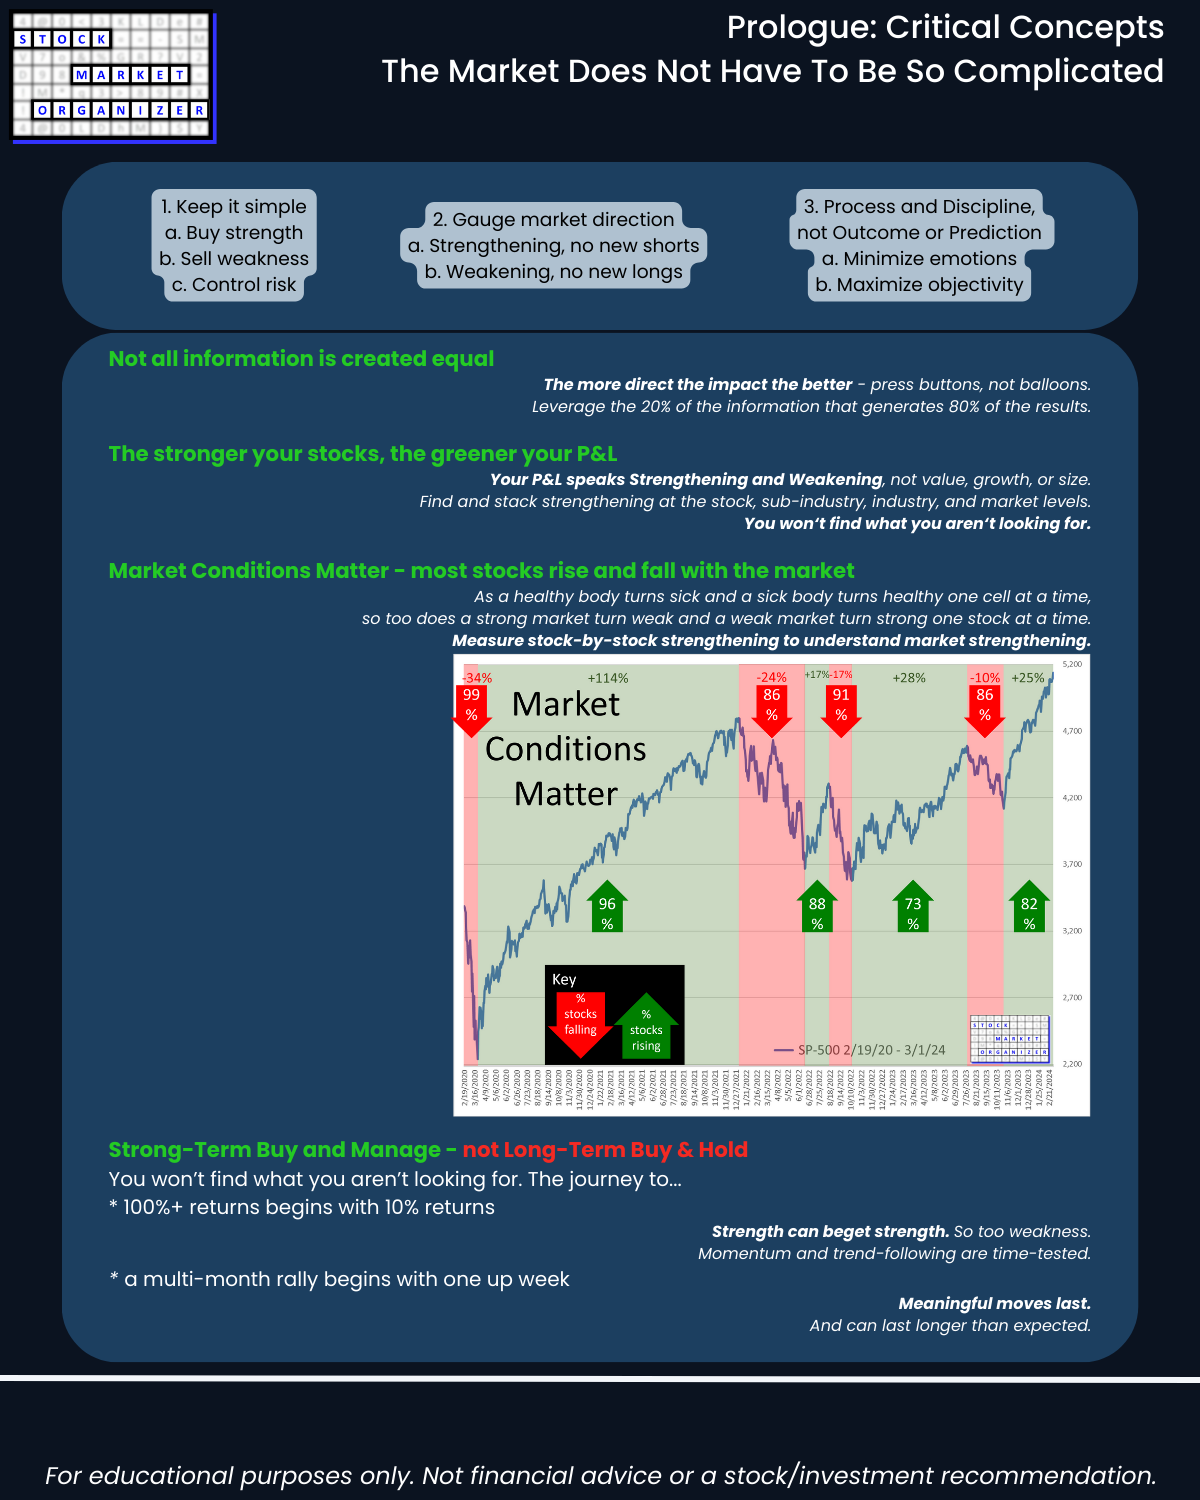
The market does not need to be so complicated.
WHAT CAN I TELL YOU THAT YOU MAY NOT KNOW?
(and this doesn’t come from analyzing or charting harder)
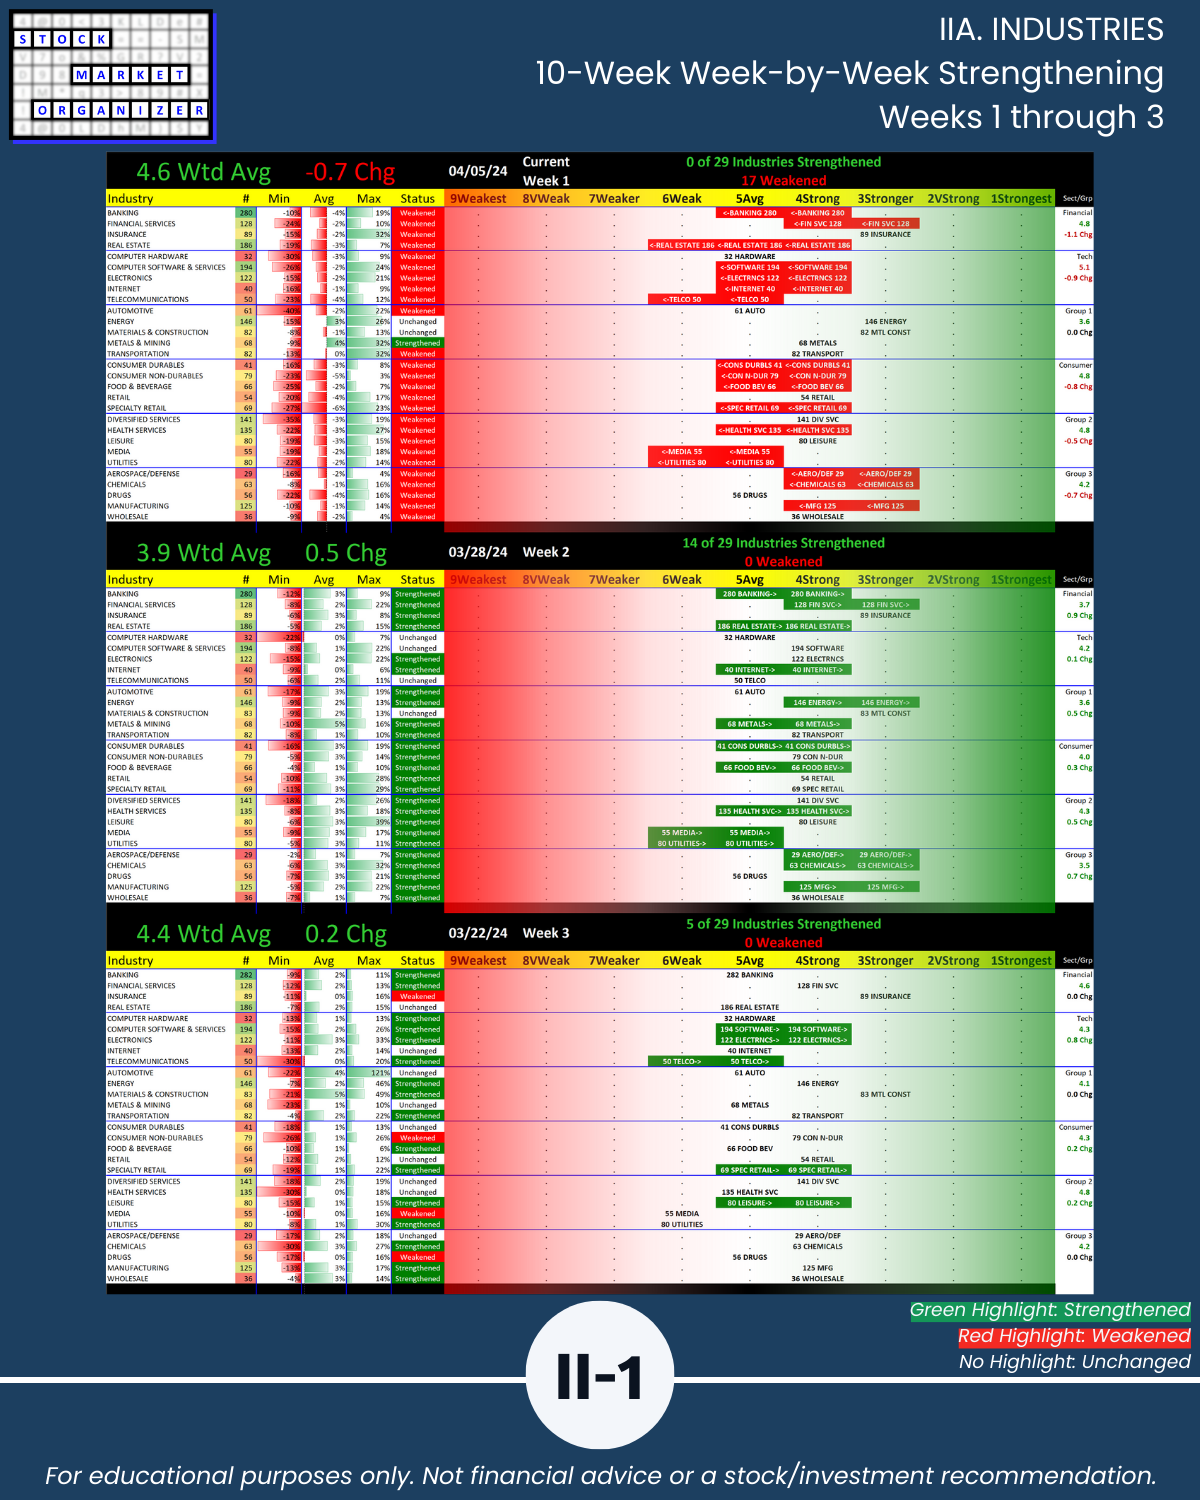
🔹 Last week 3.9 composite strength score (1 = strongest, 9 = weakest), +0.5 points. This week: 4.6 score, -0.7 points change.
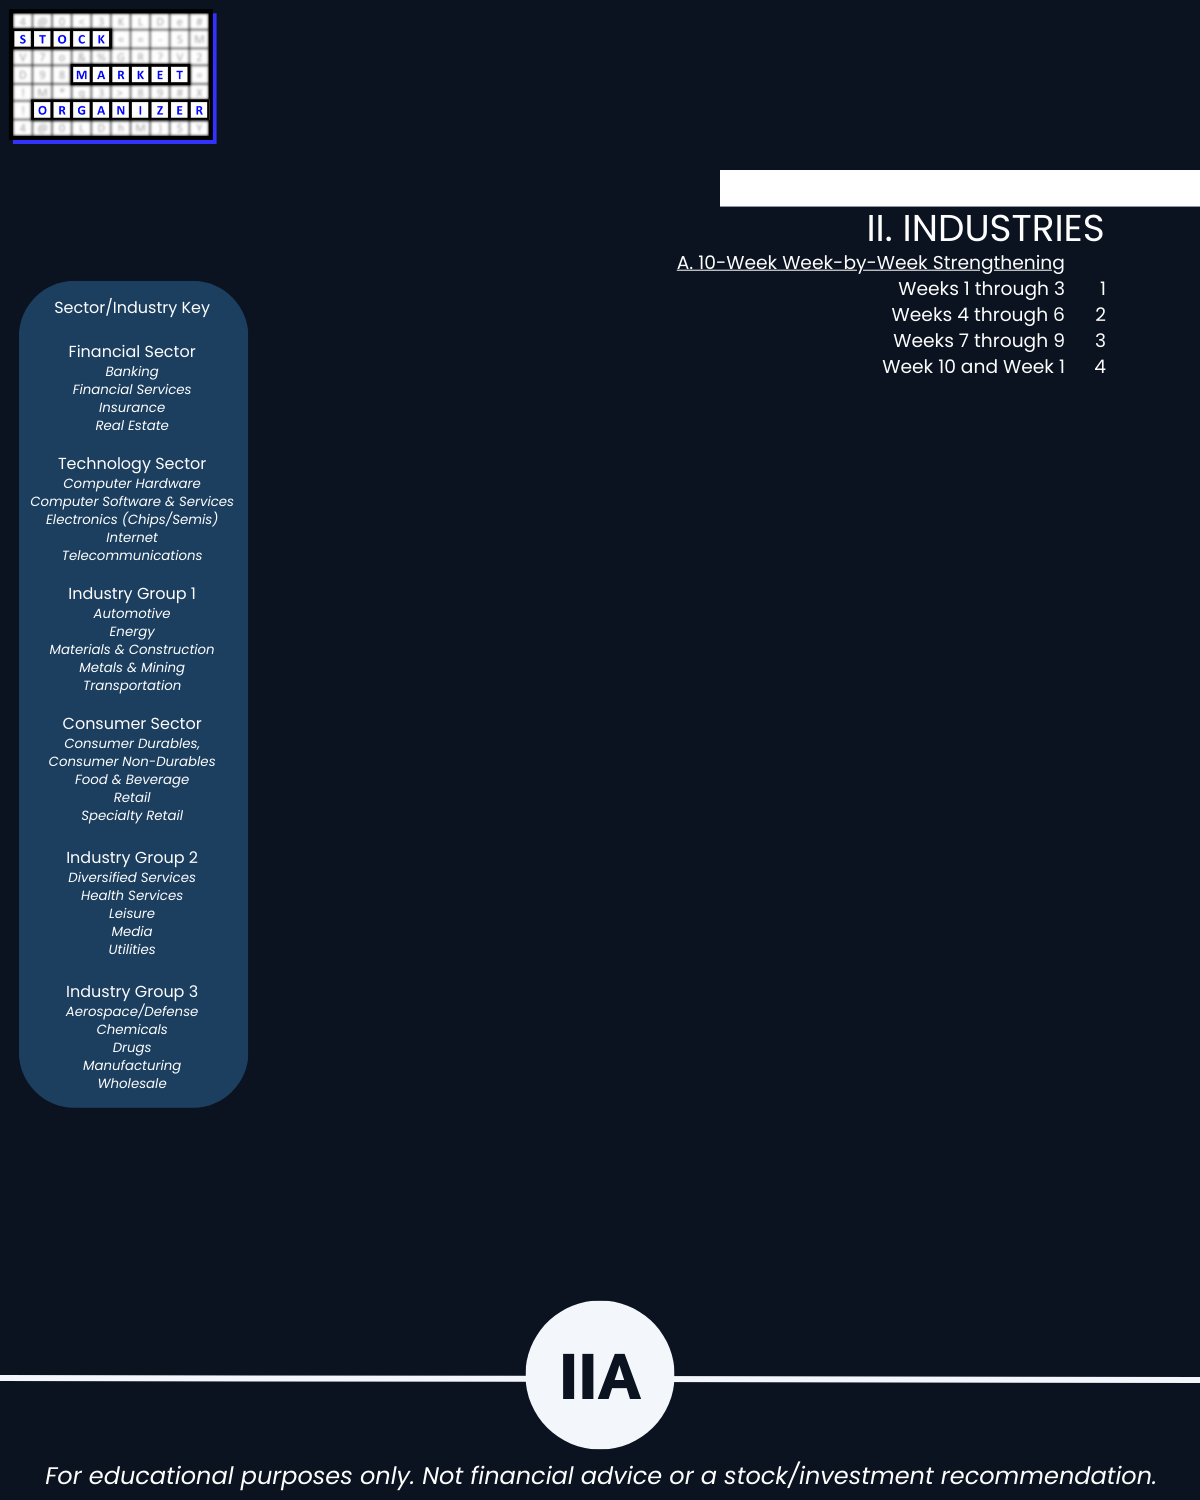
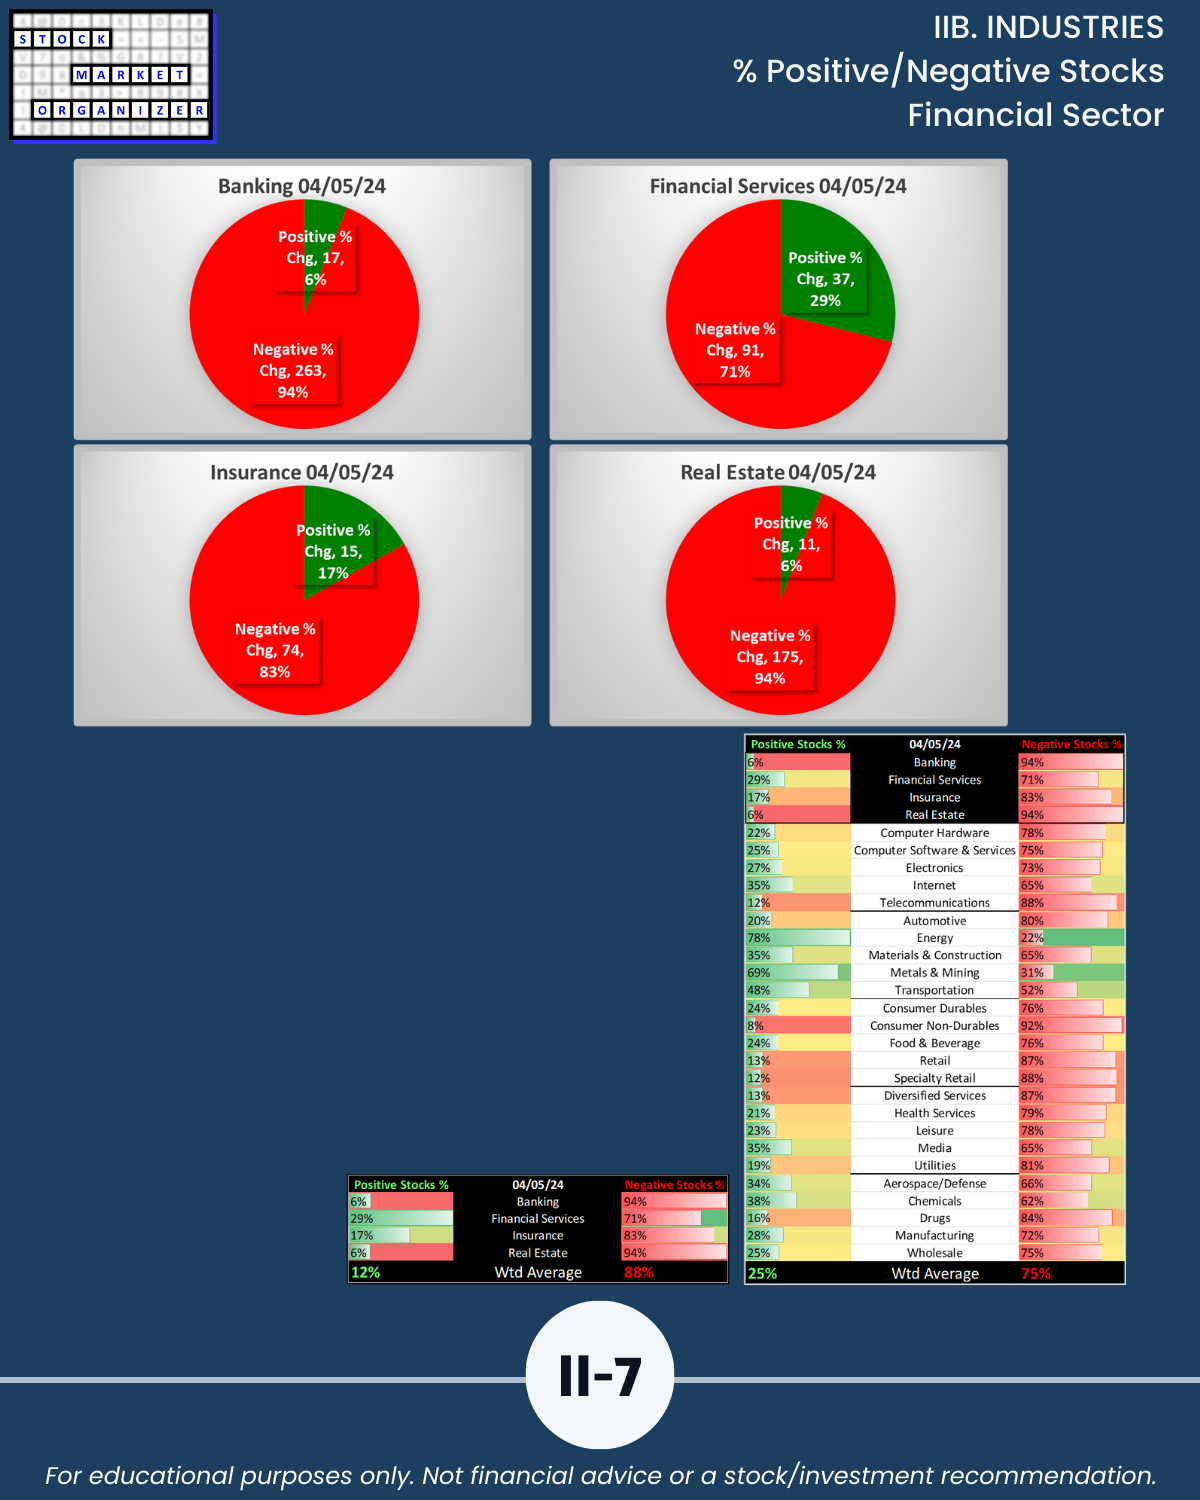
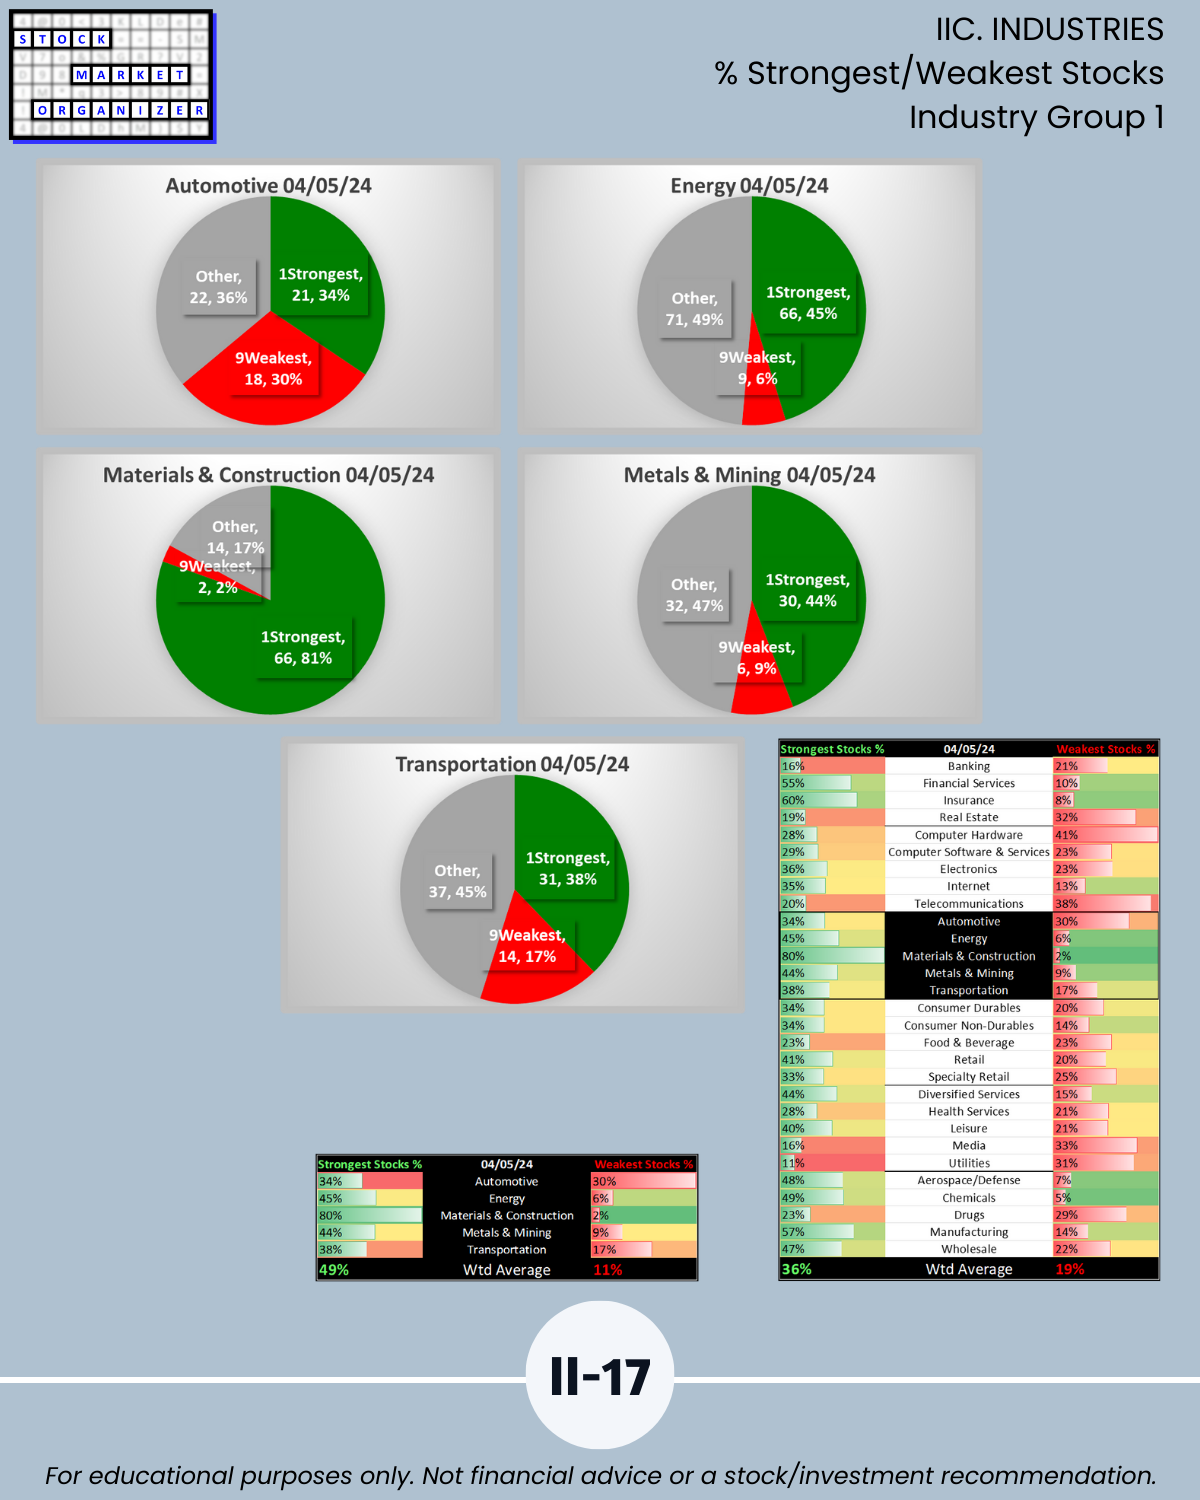
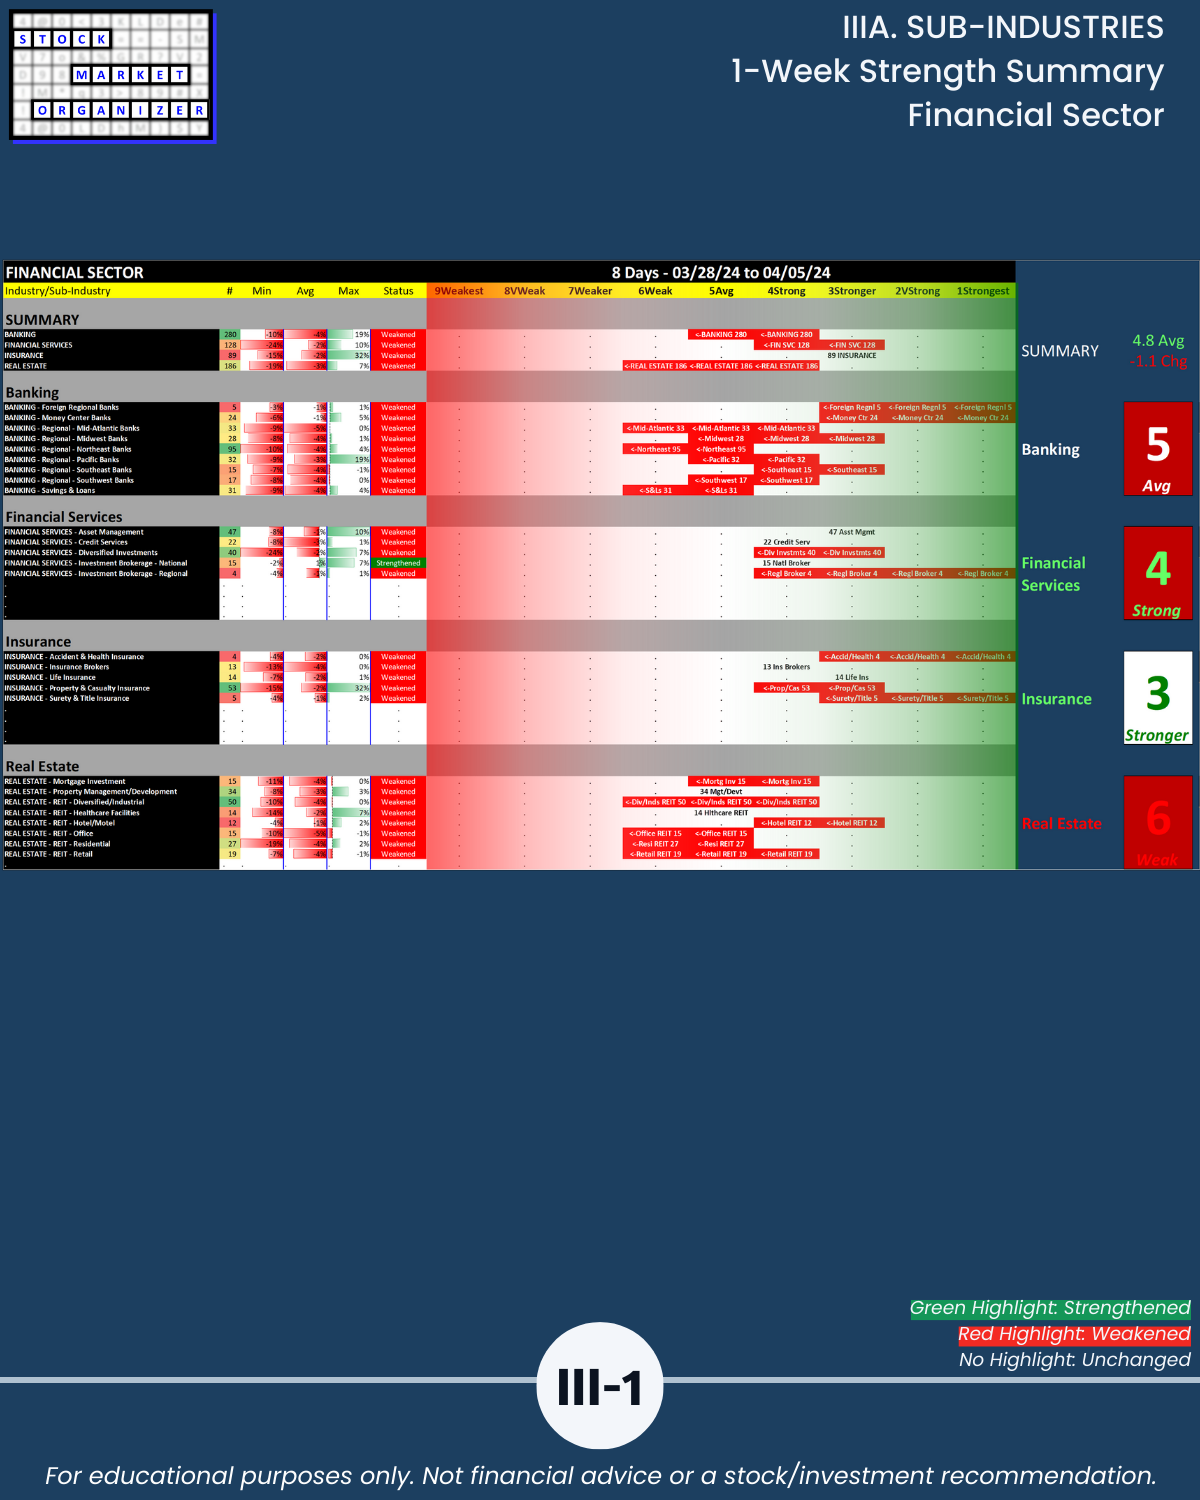
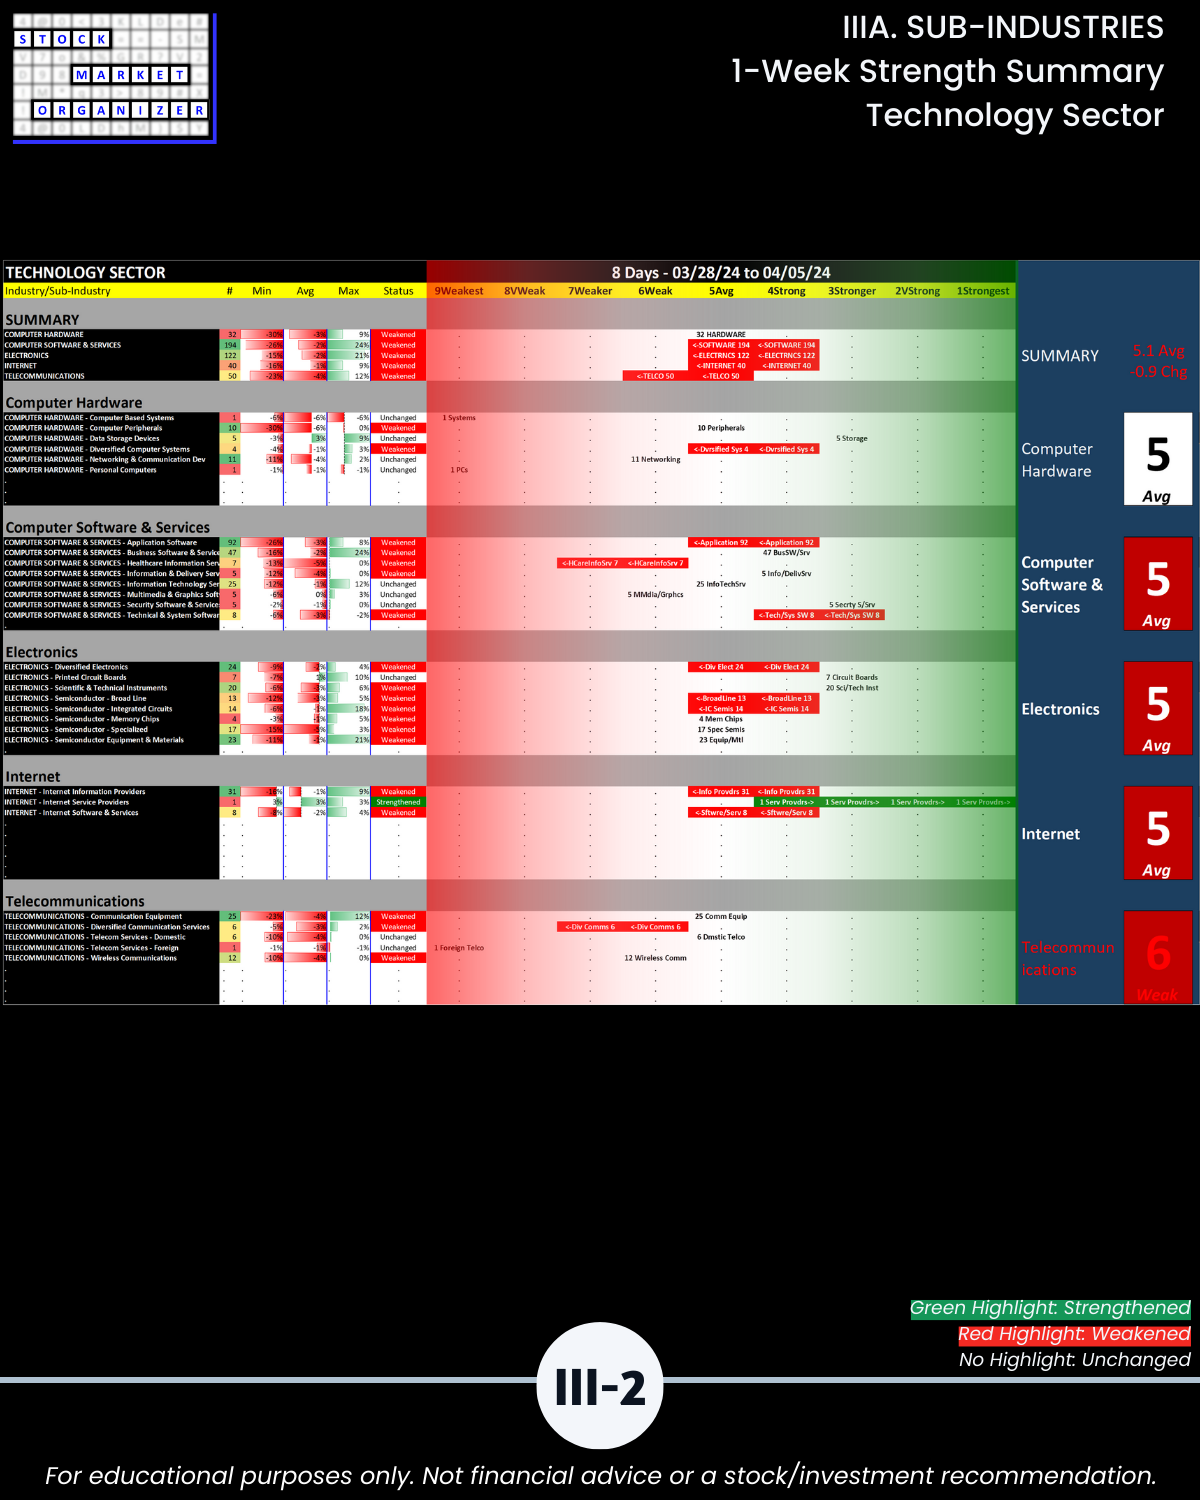
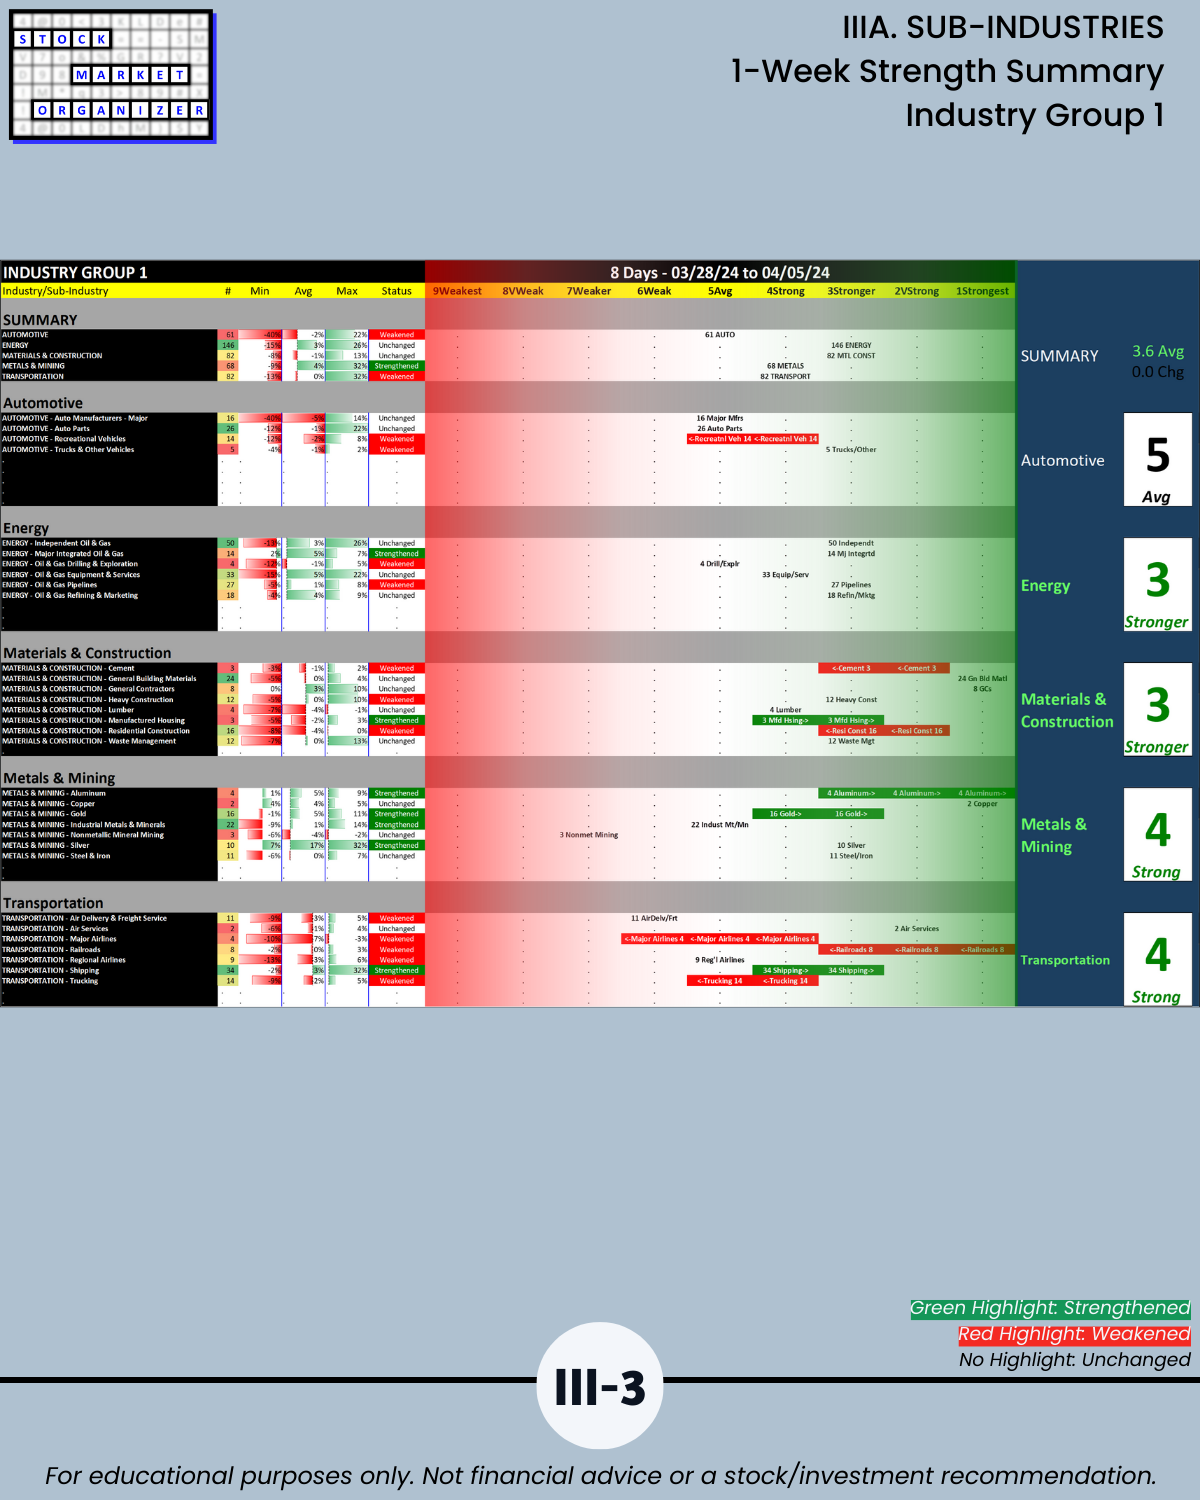
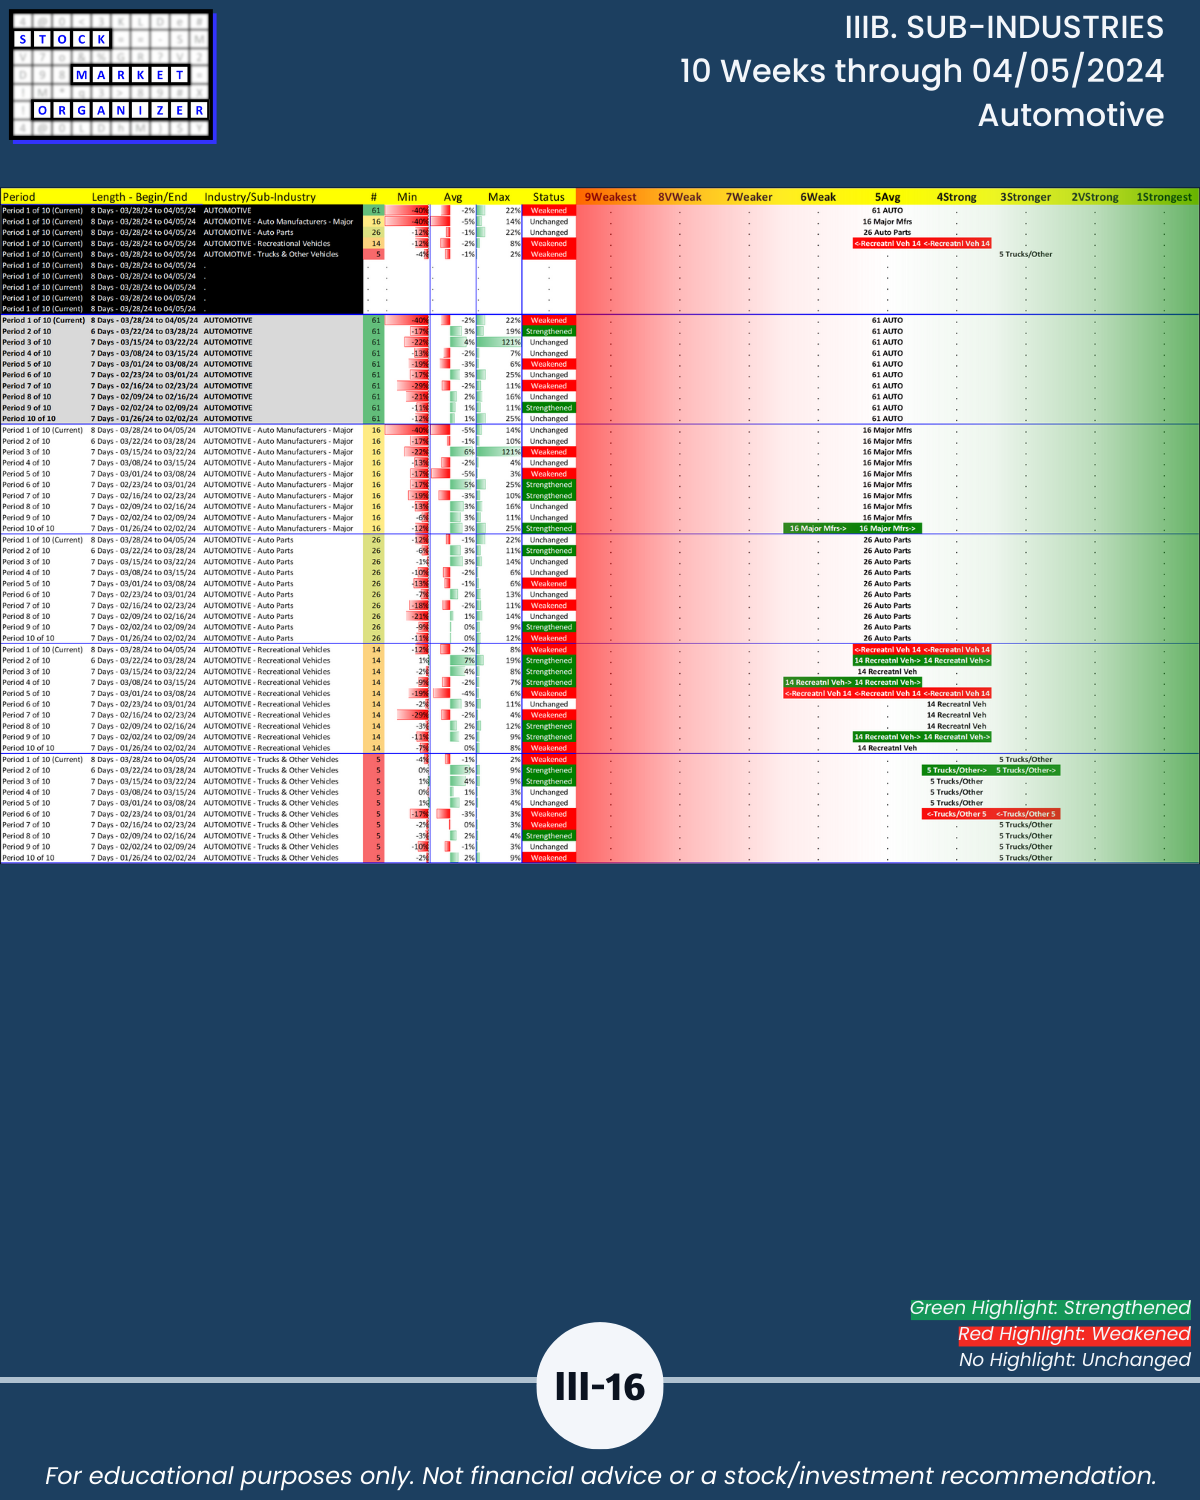
🔹 Financial (Banking, Financial Services, Insurance, Real Estate) lagged among the 6 sectors/industry groupings and weakened by a large -1.1 to 4.8. Tech has the worst score at 5.1. Group 1 has the best score at 3.6 (Automotive, Energy, Materials/Construction, Metals/Mining, Transportation).
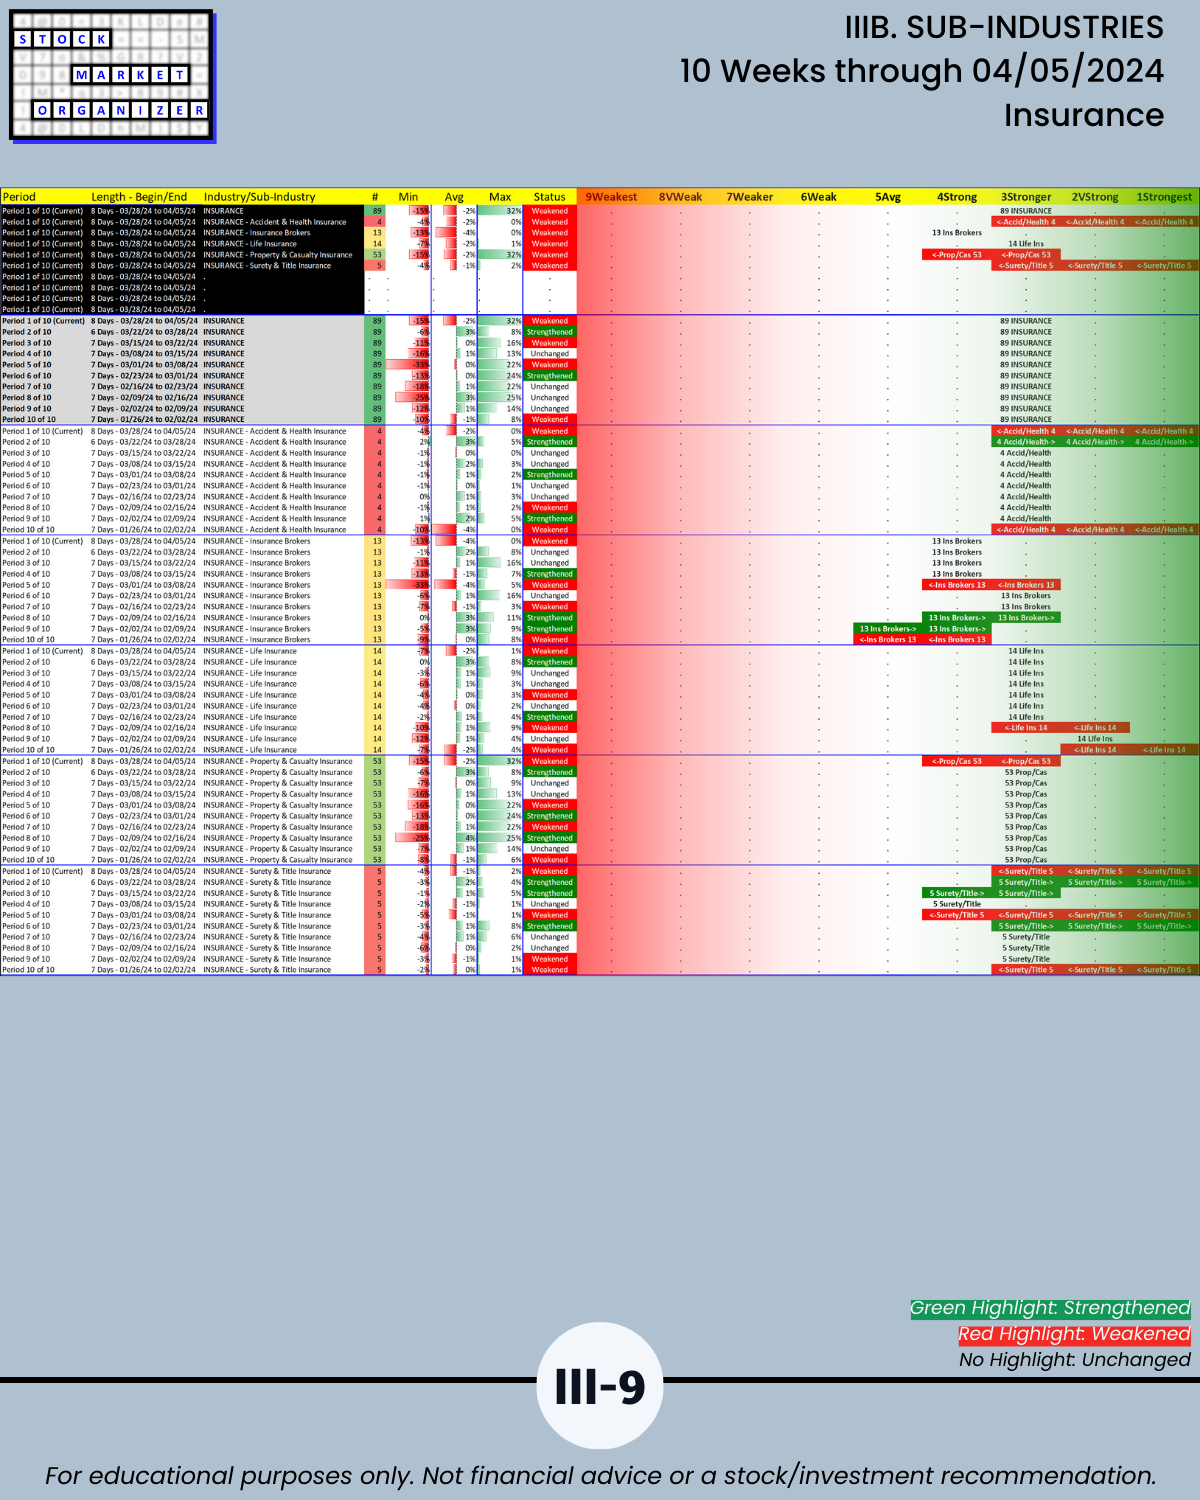
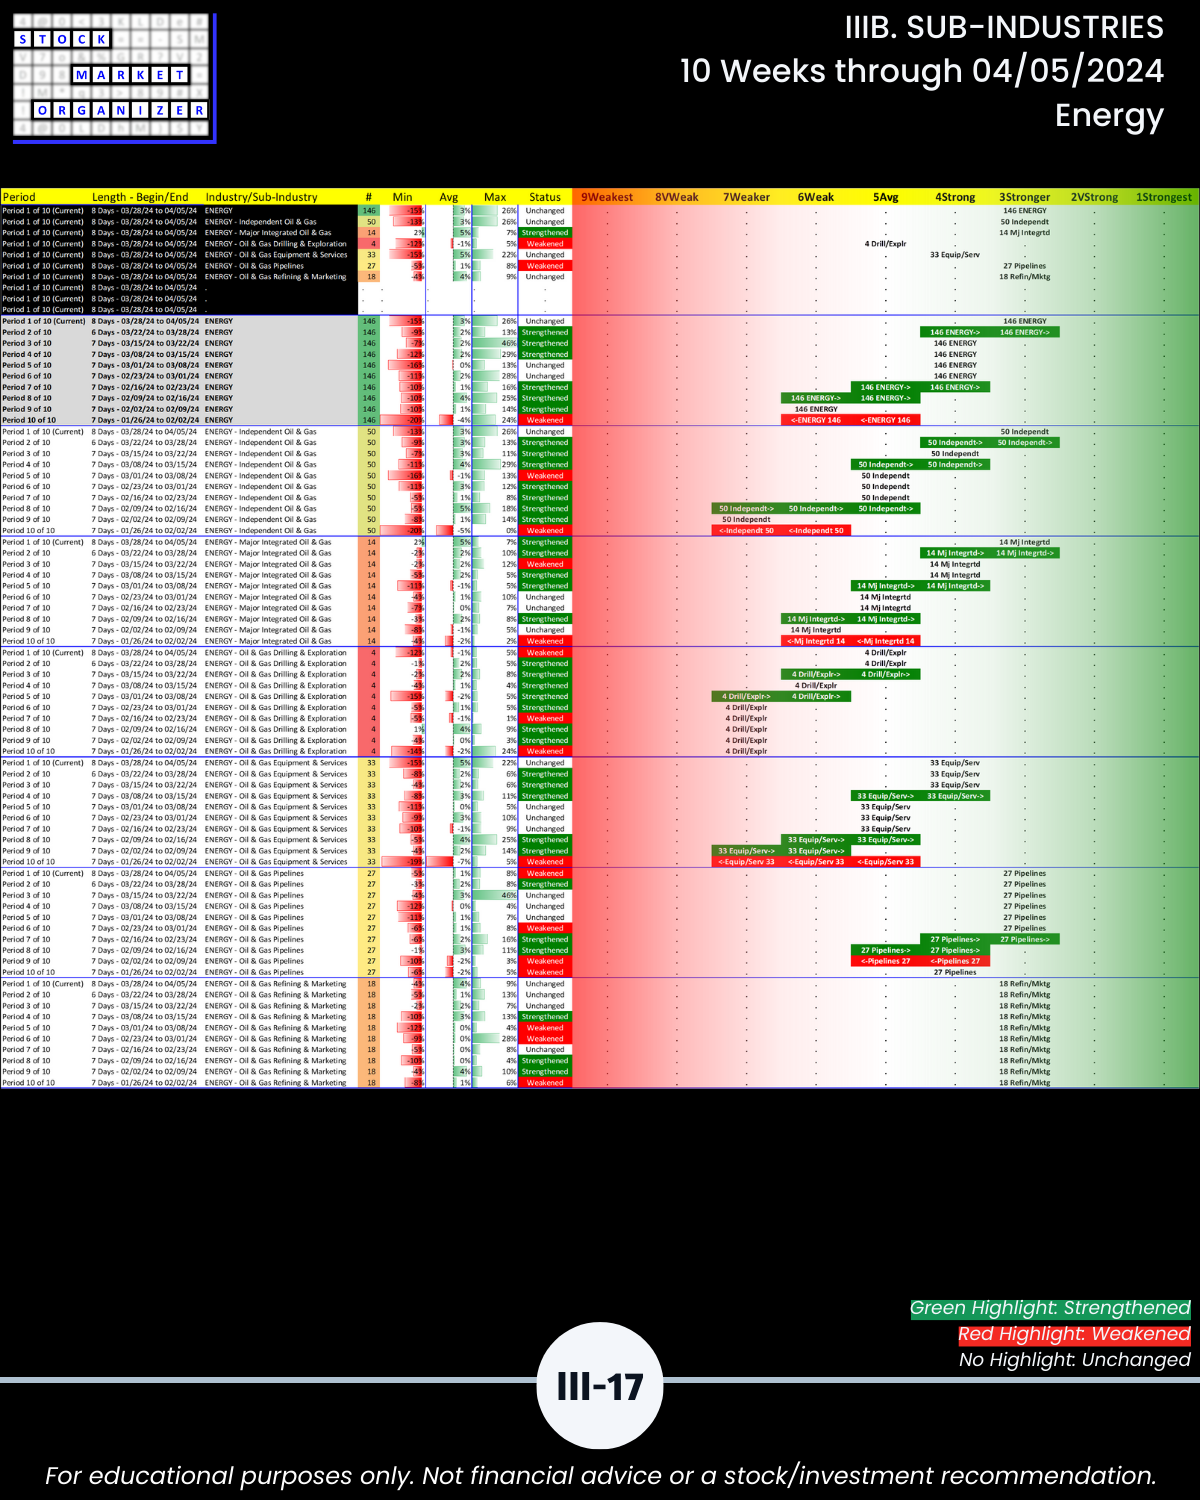
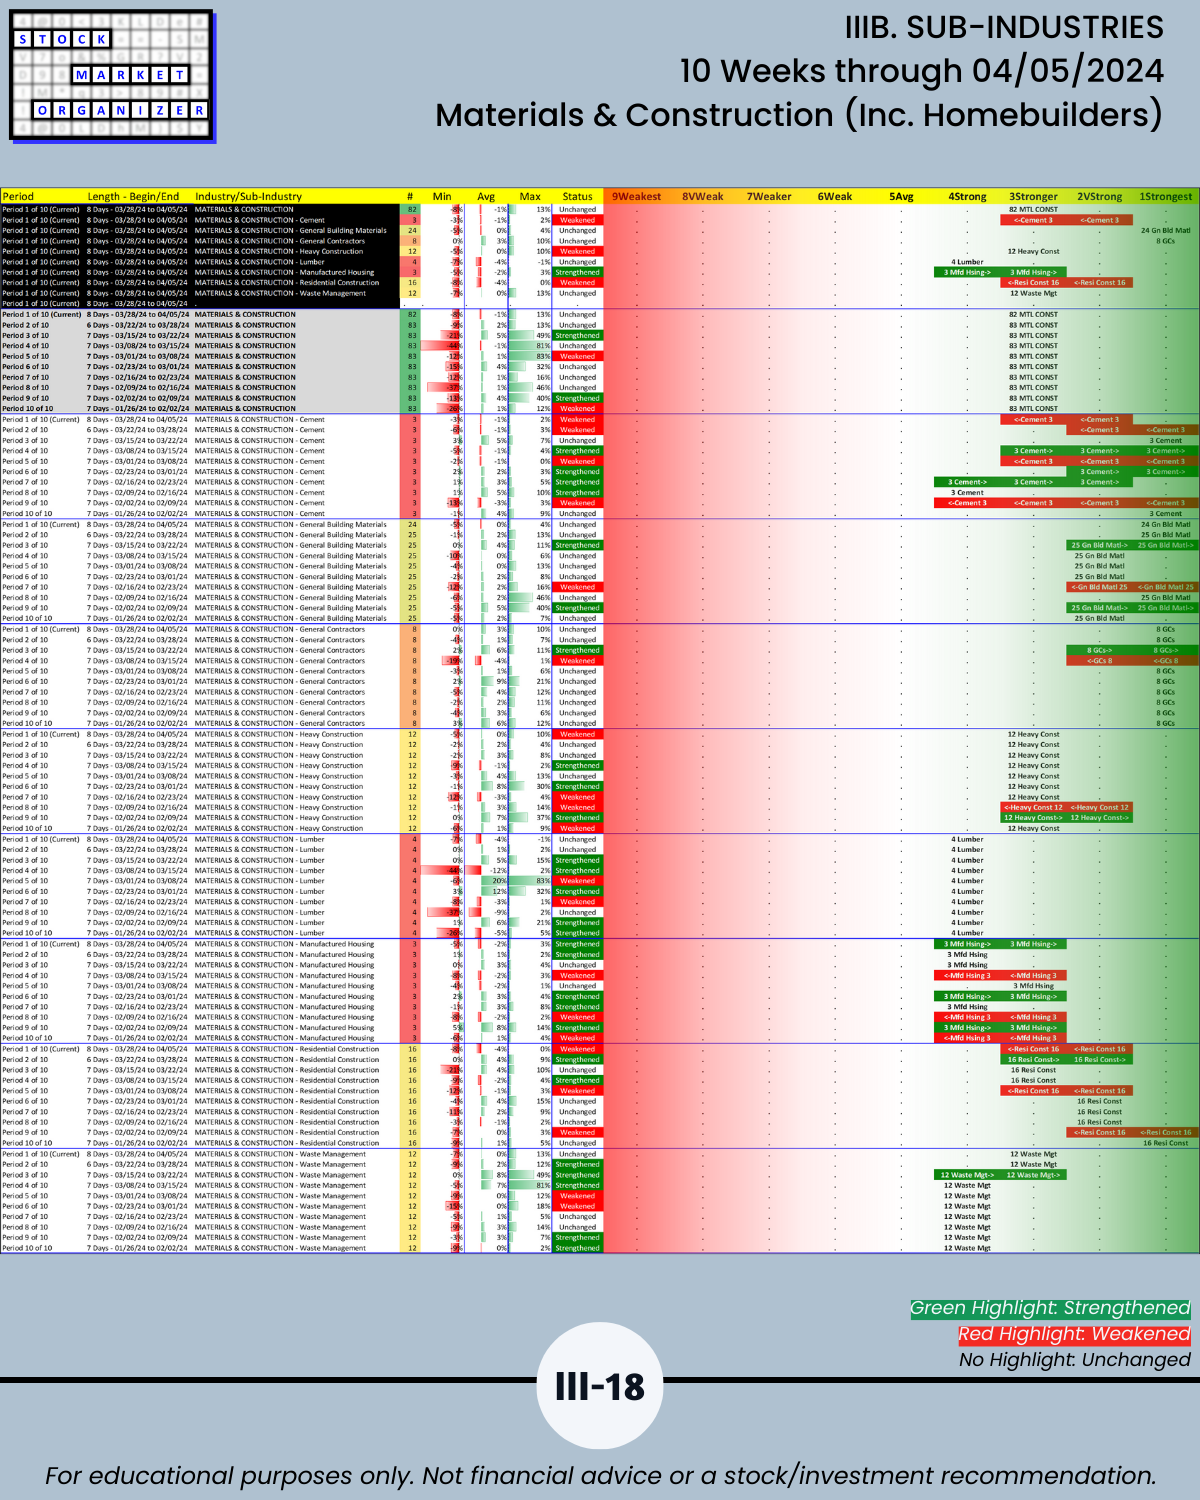
🔹 Longtime industry leaders Insurance and Materials & Construction remained Stronger (3rd strongest of 9 strength levels) along with new leader Energy.
🔹 The 4 weakest industries now rated Weak (6th strongest) all weakened this week:
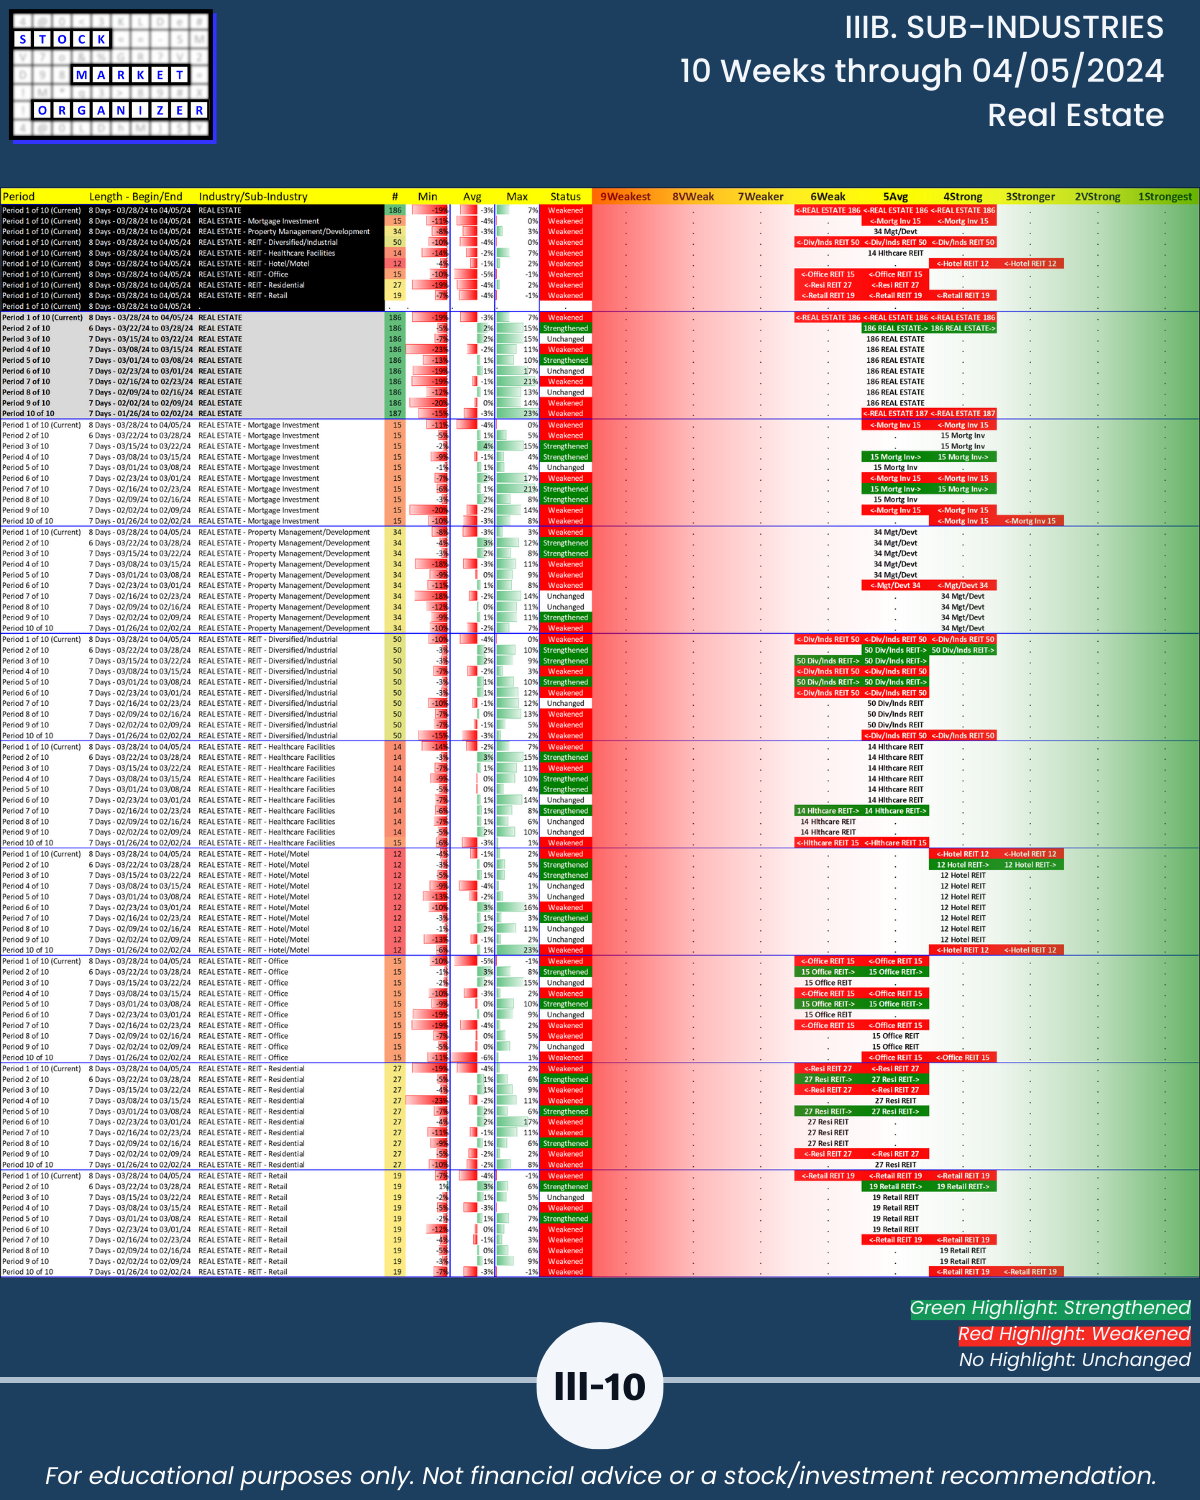
- Real Estate (weakened 2 levels)
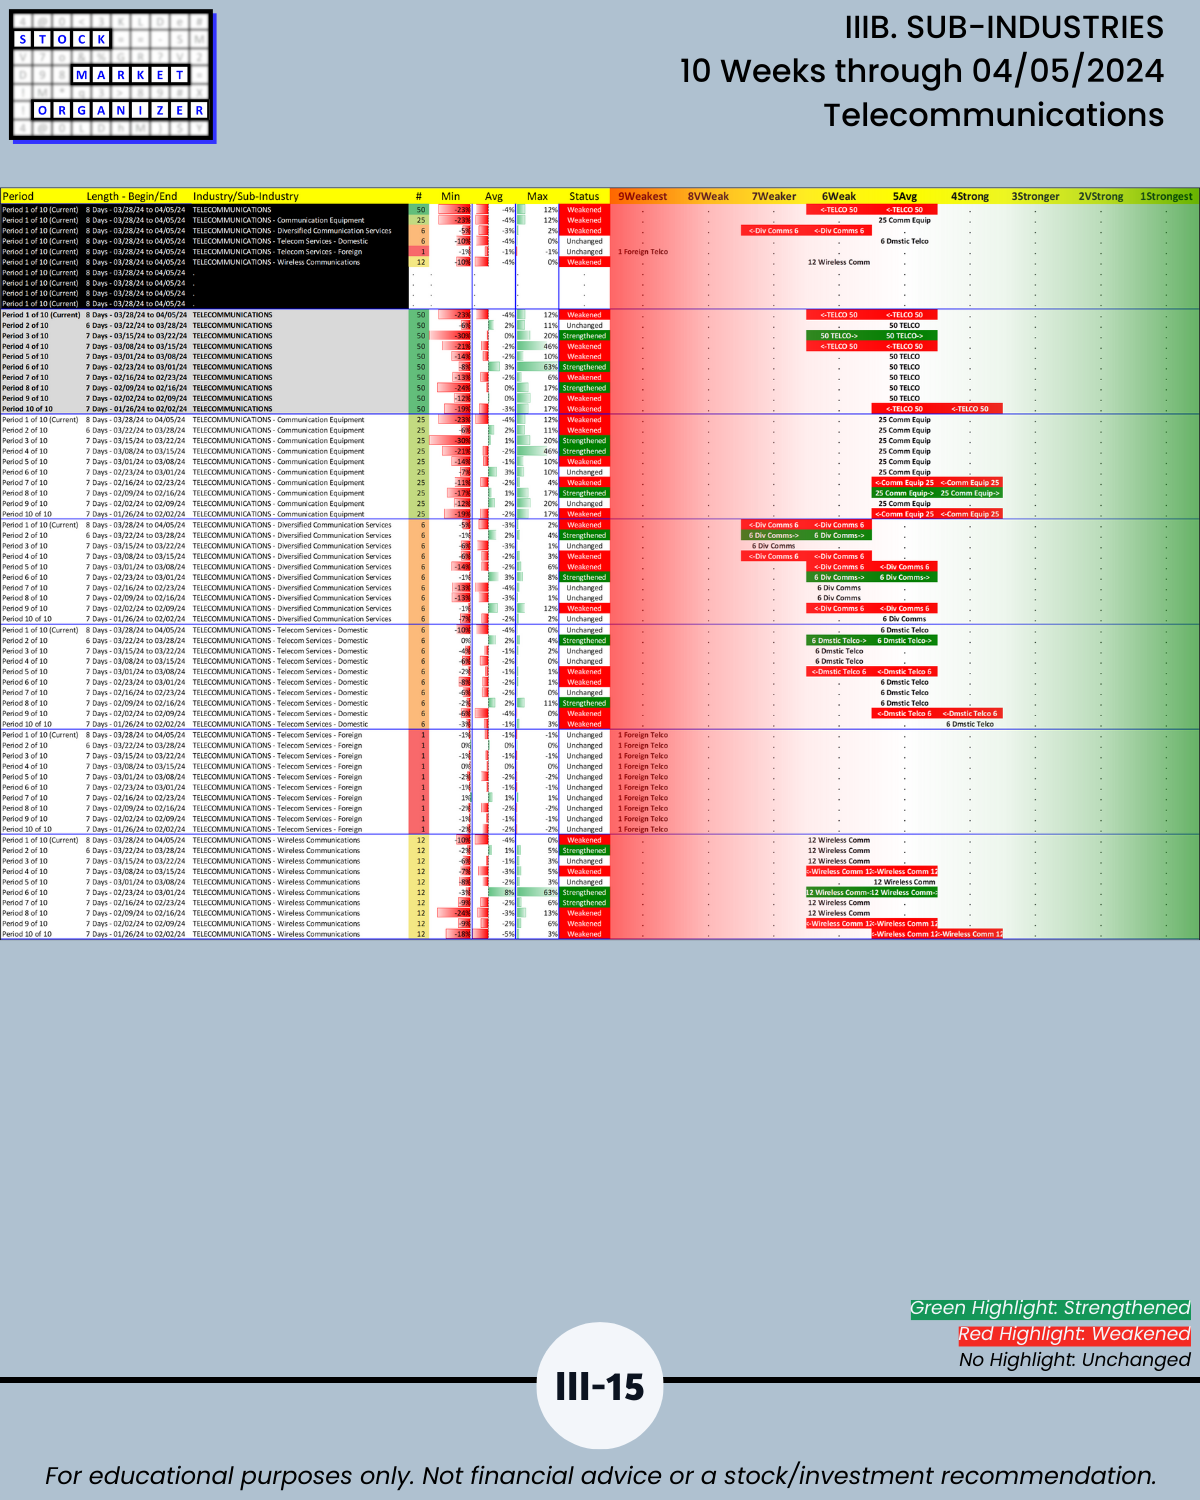
- Telecommunications
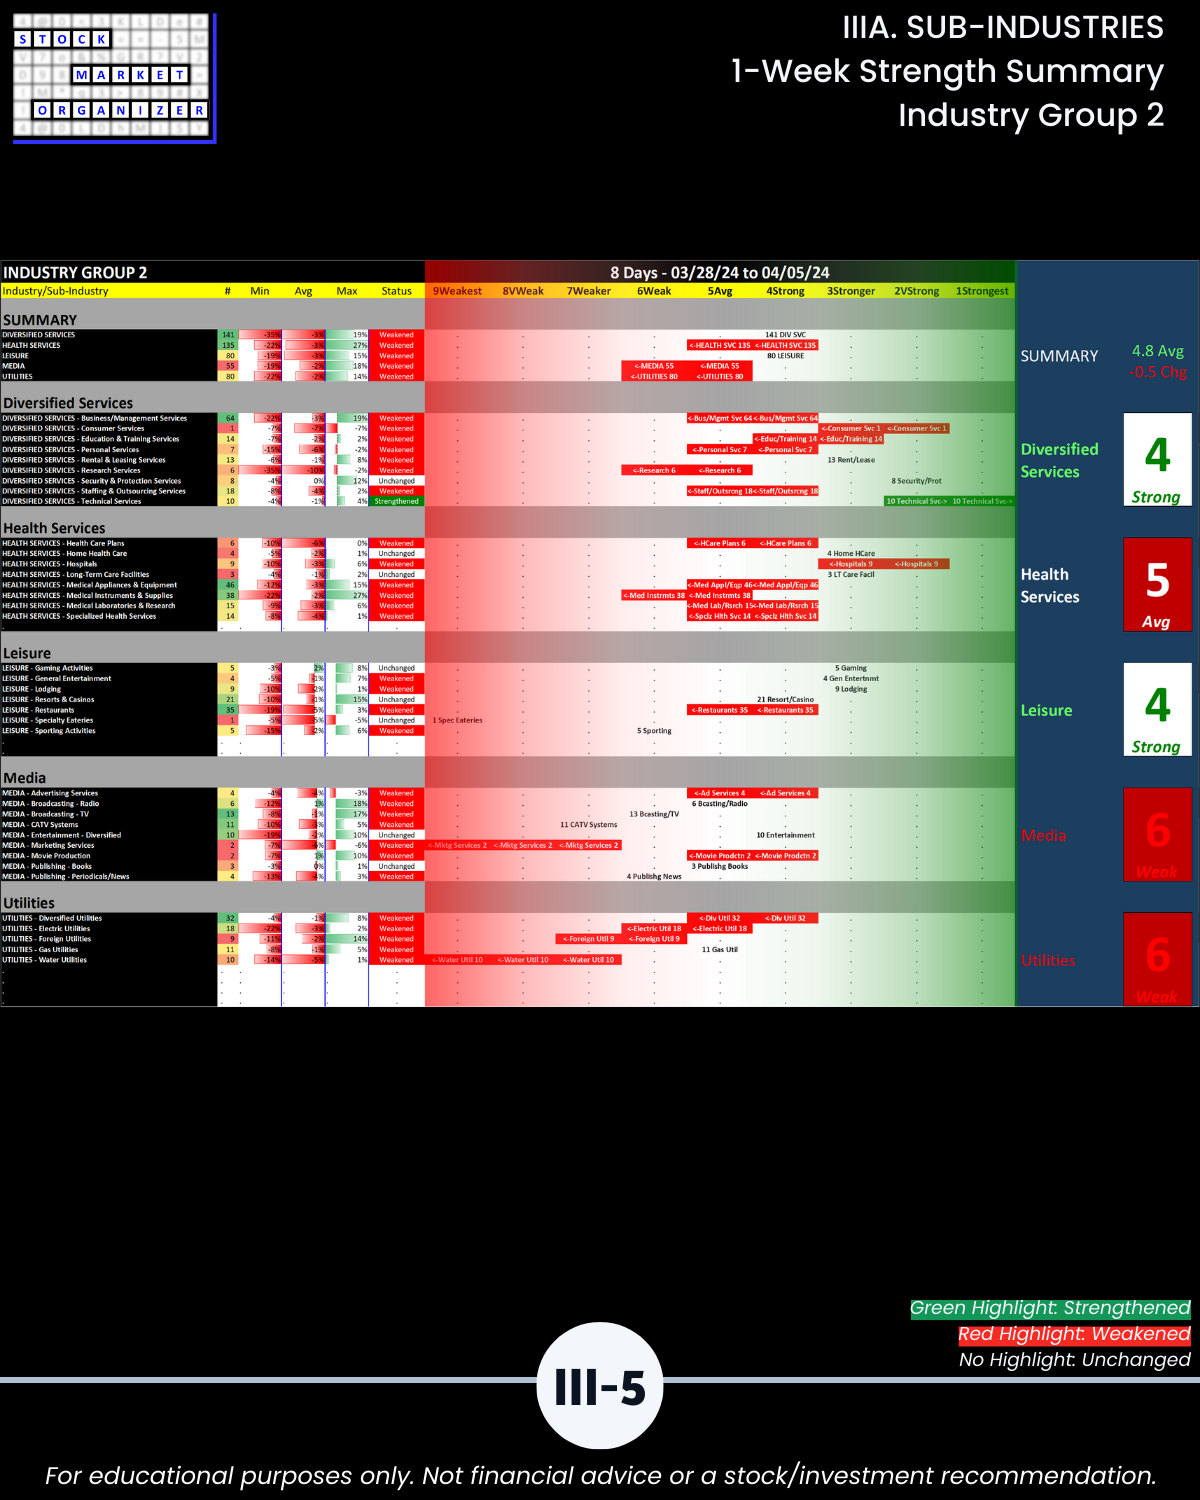
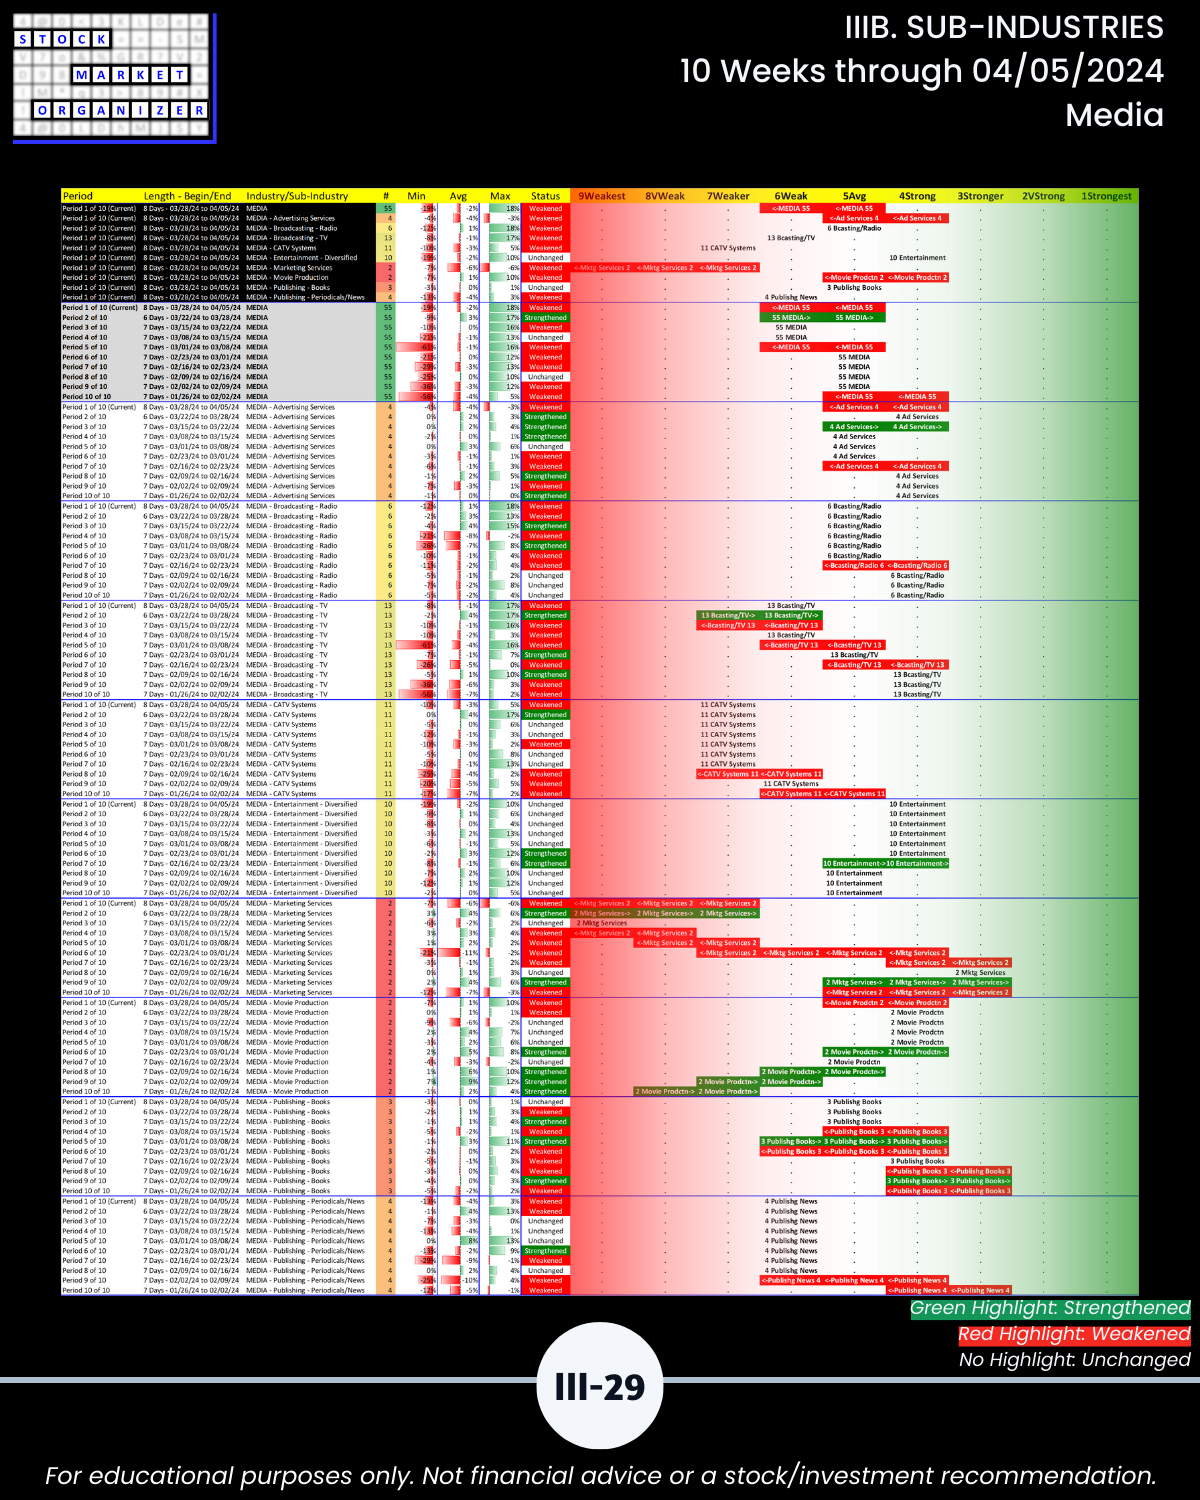
- Media
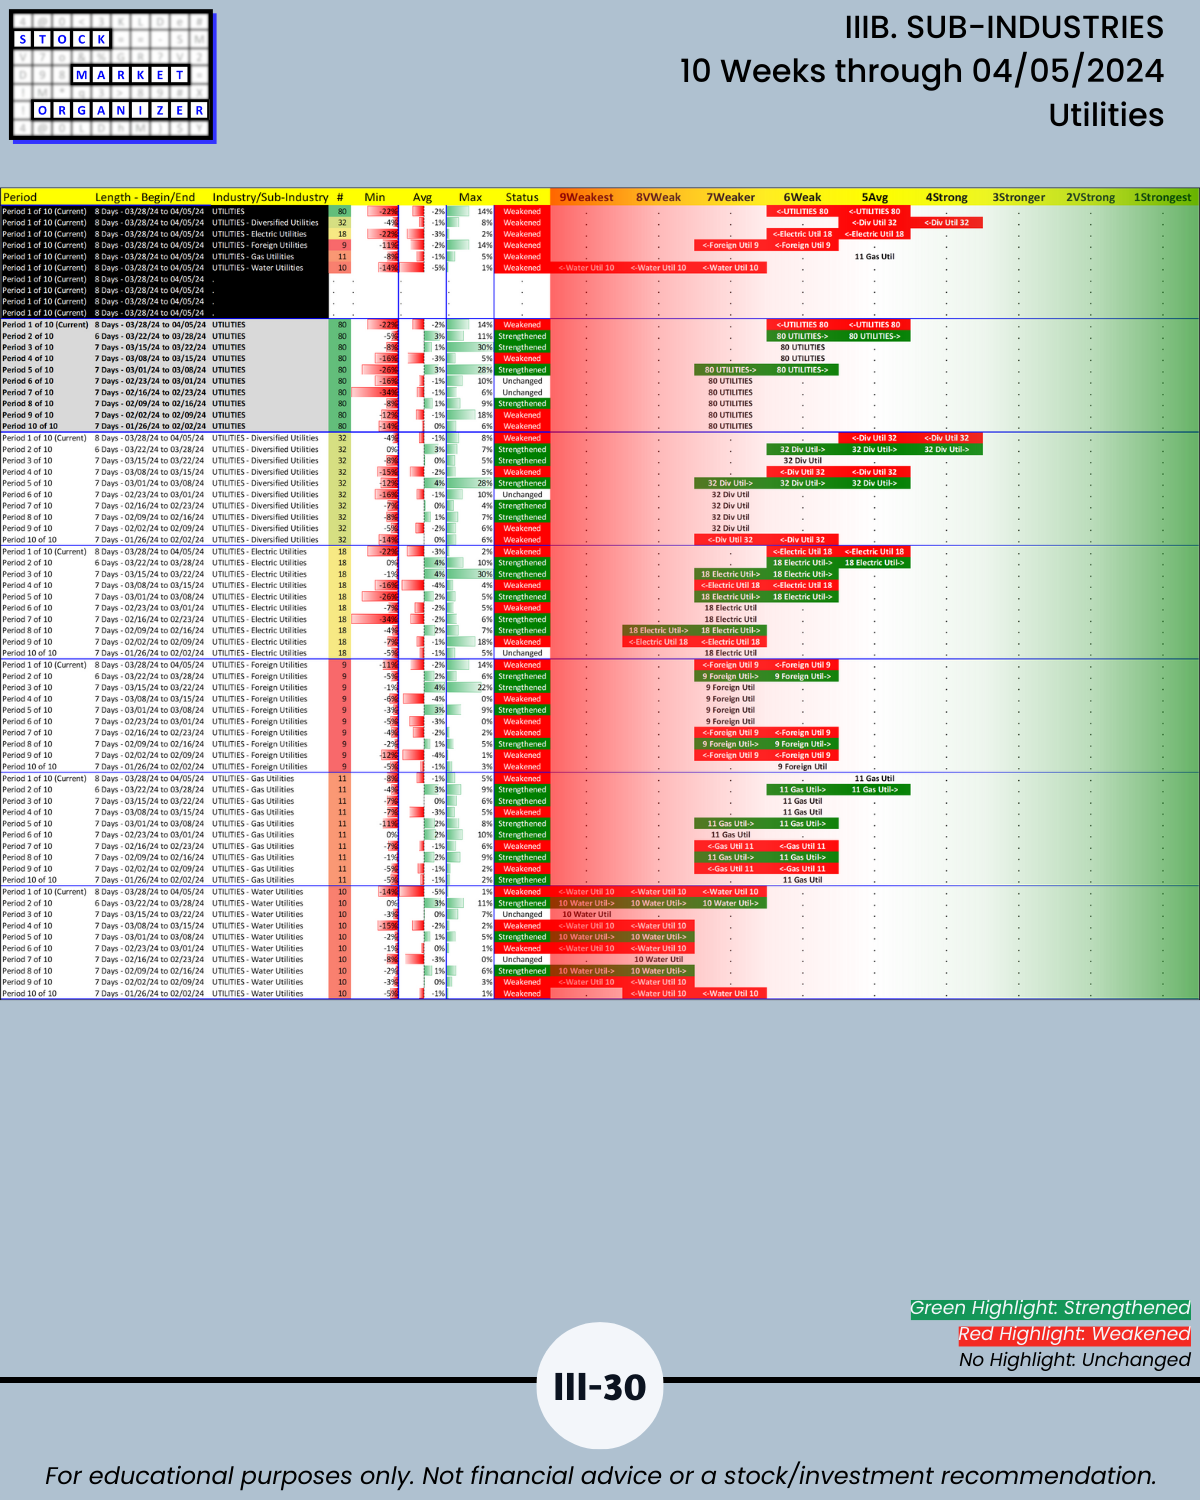
- Utilities
🔹 26 of 29 industries weakened, 17 enough to fall at least one strength level rating. (Last week 25/29 industries strengthened, 14 changed at least one strength level rating)
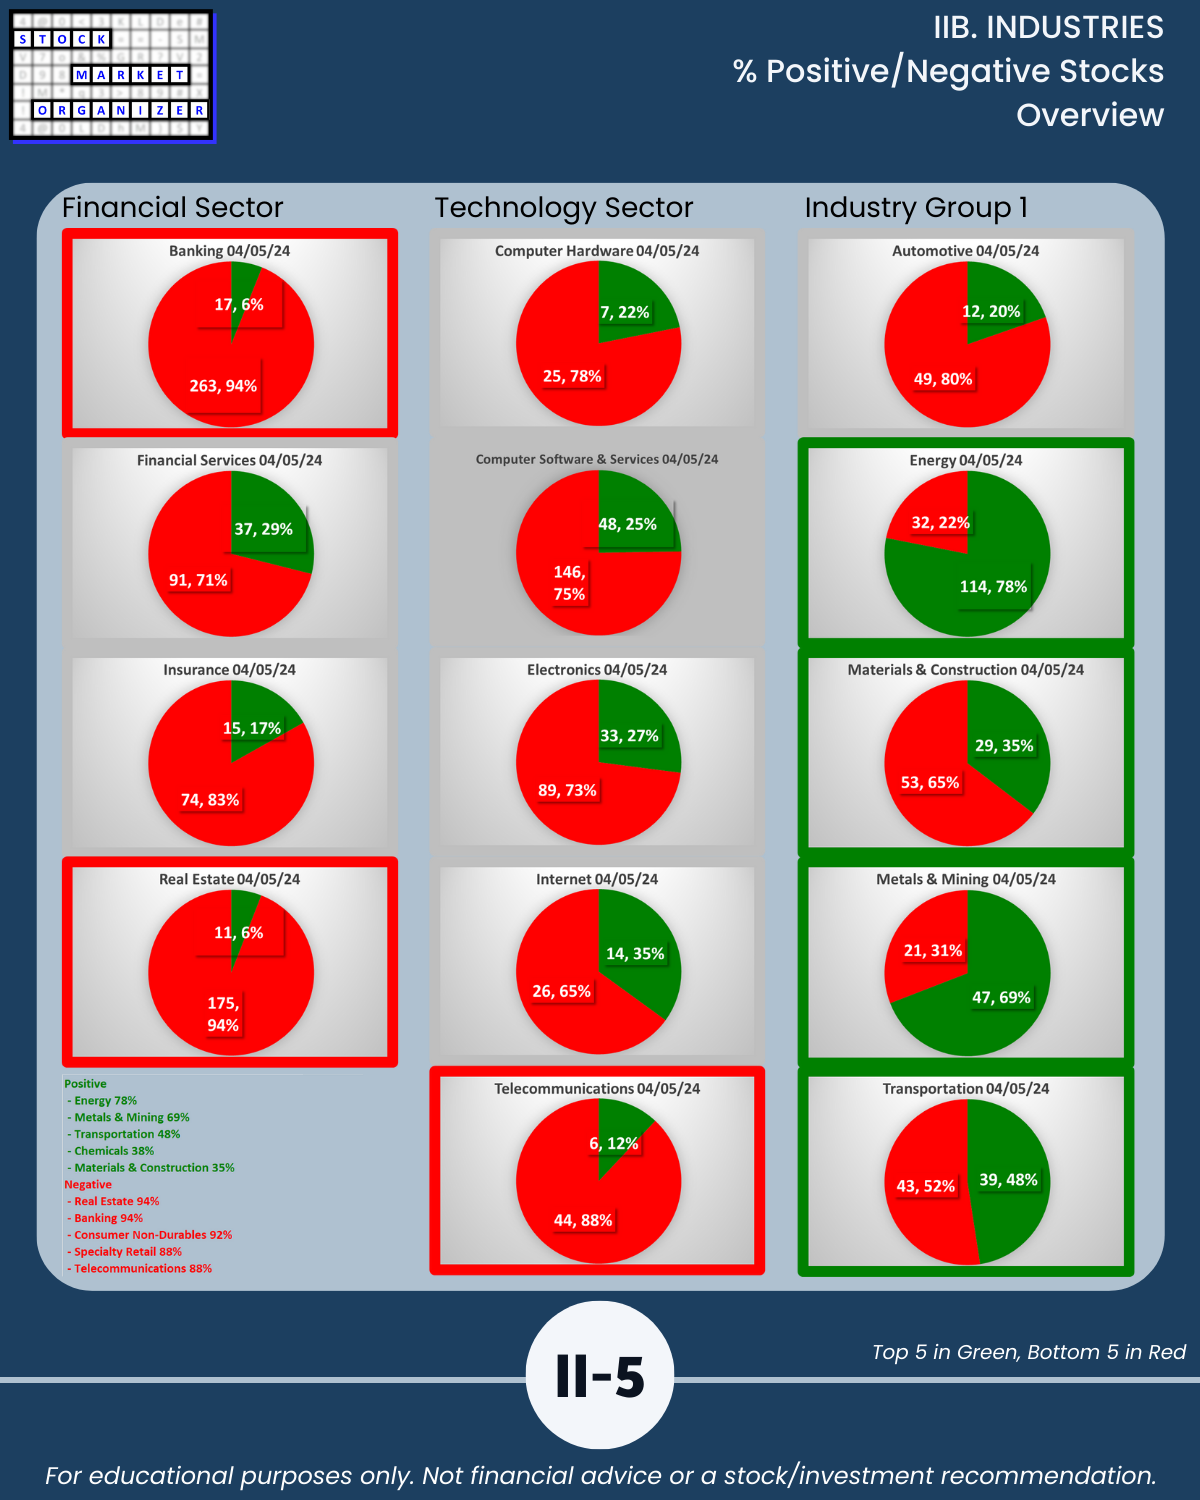
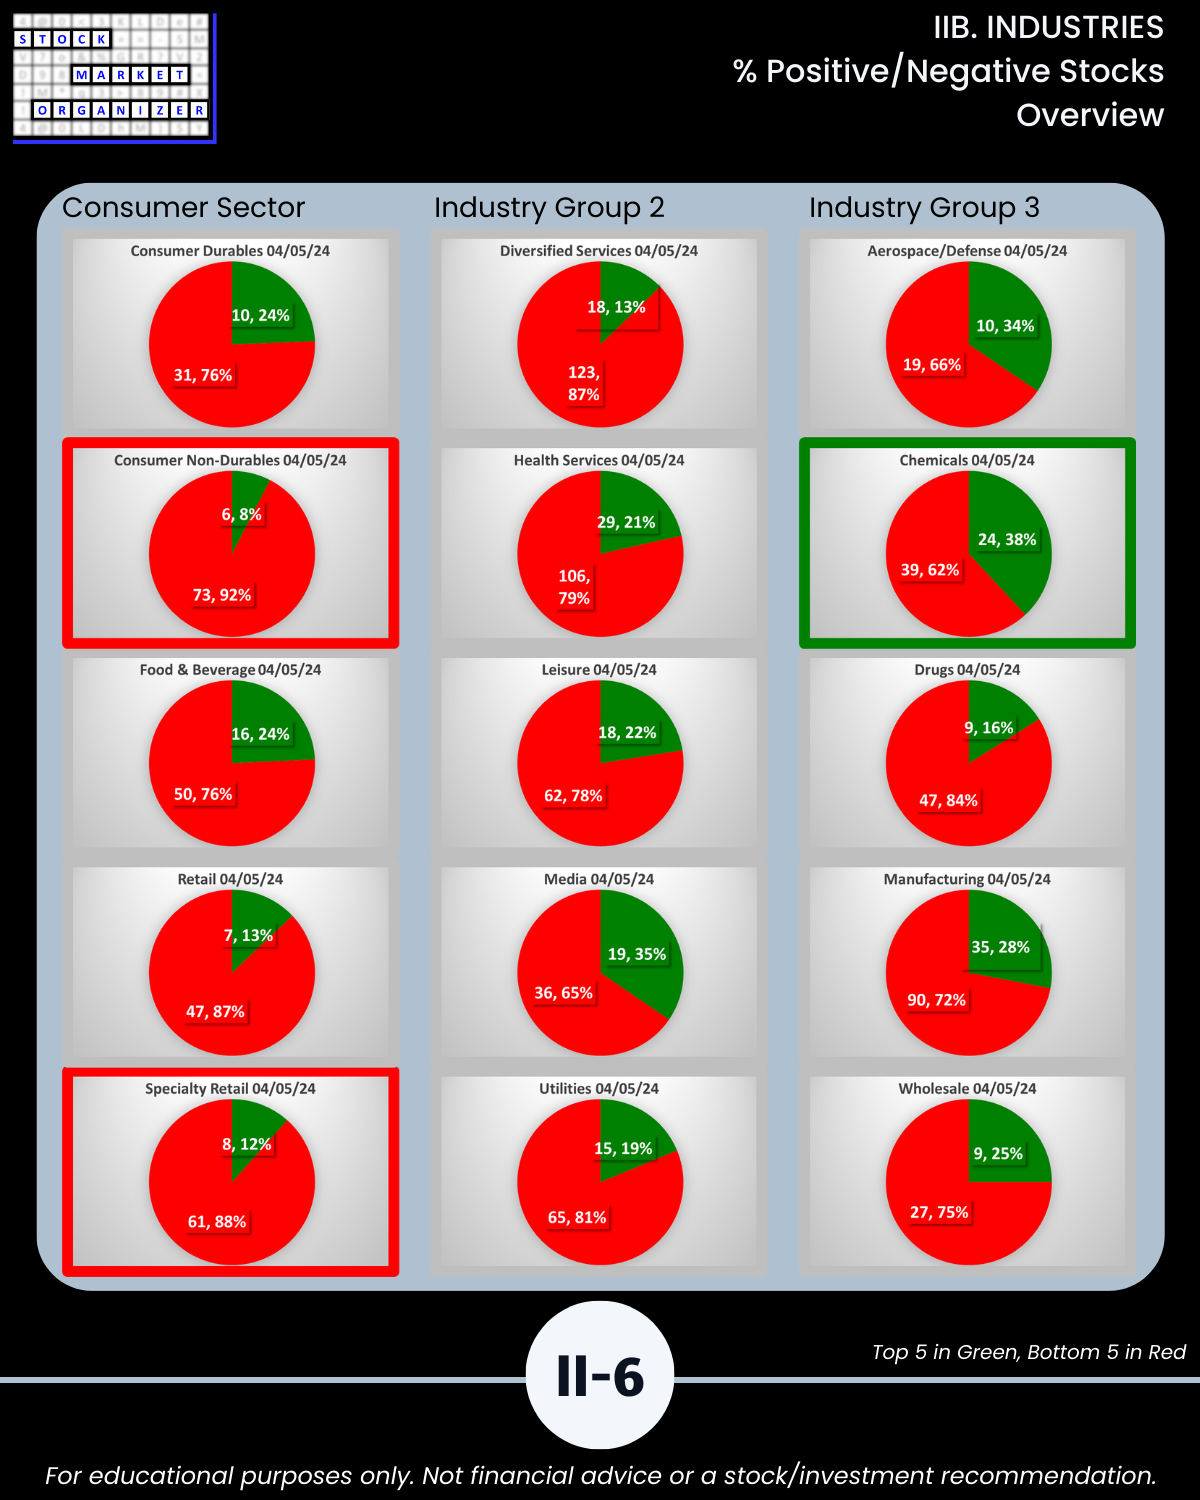
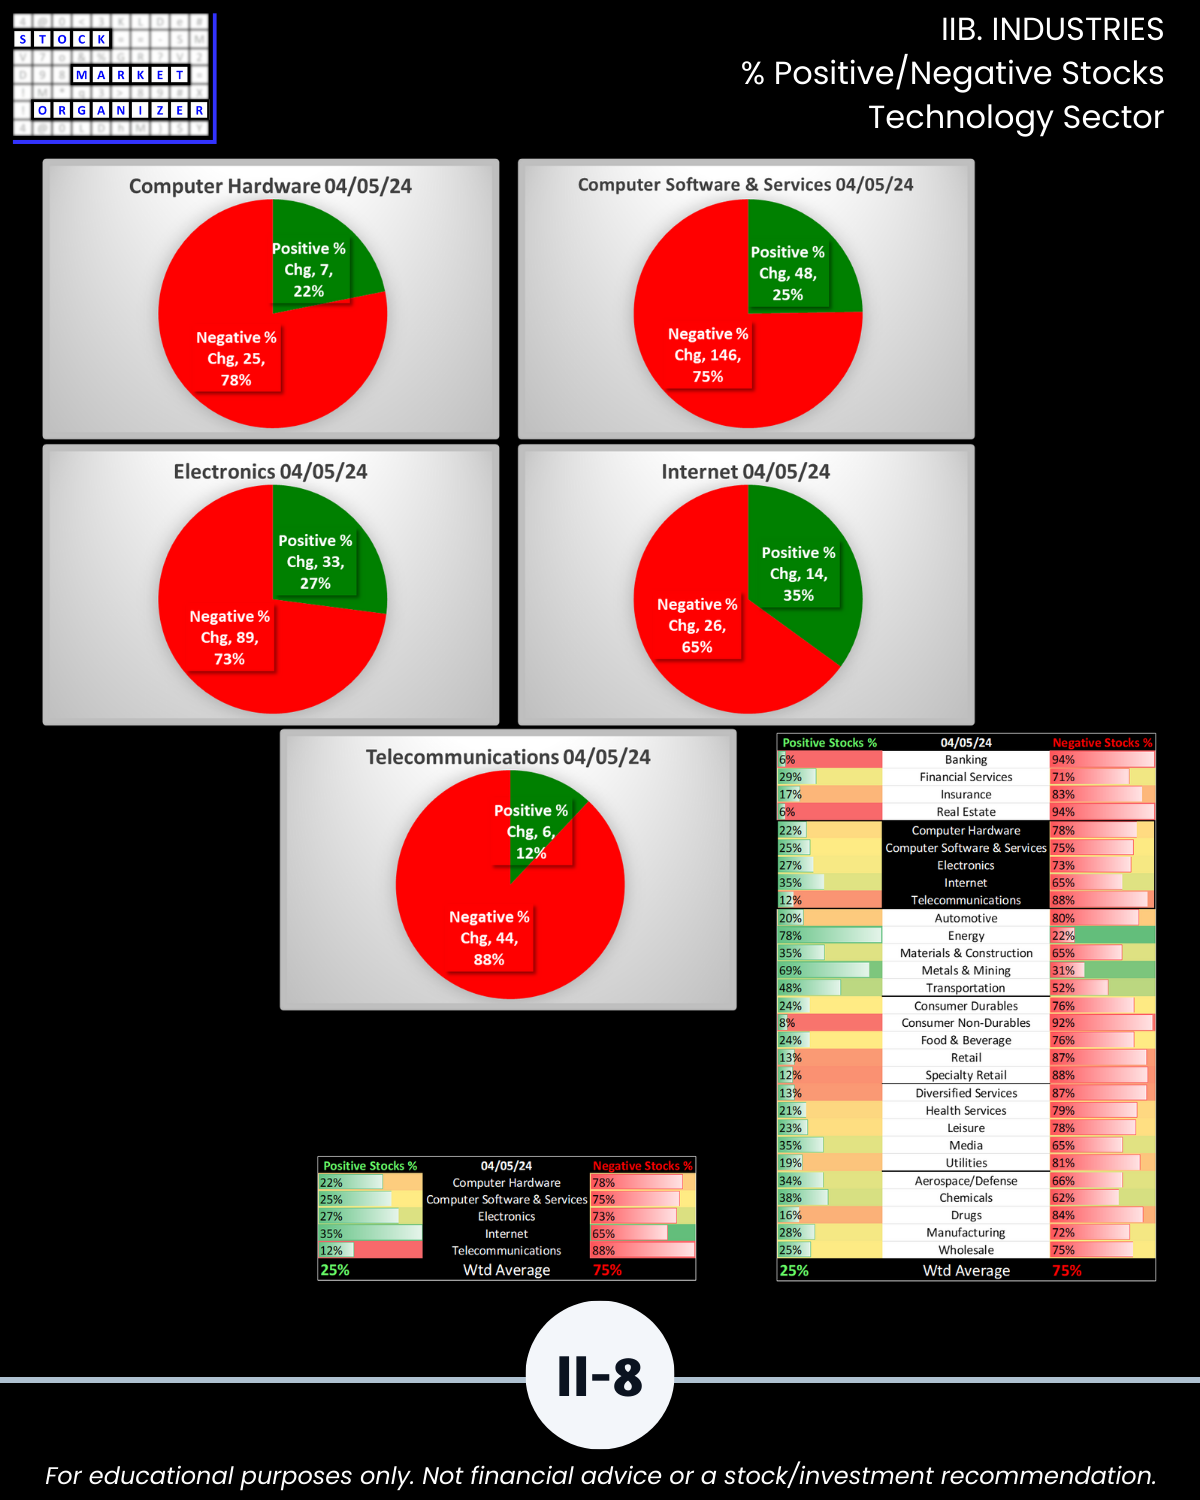
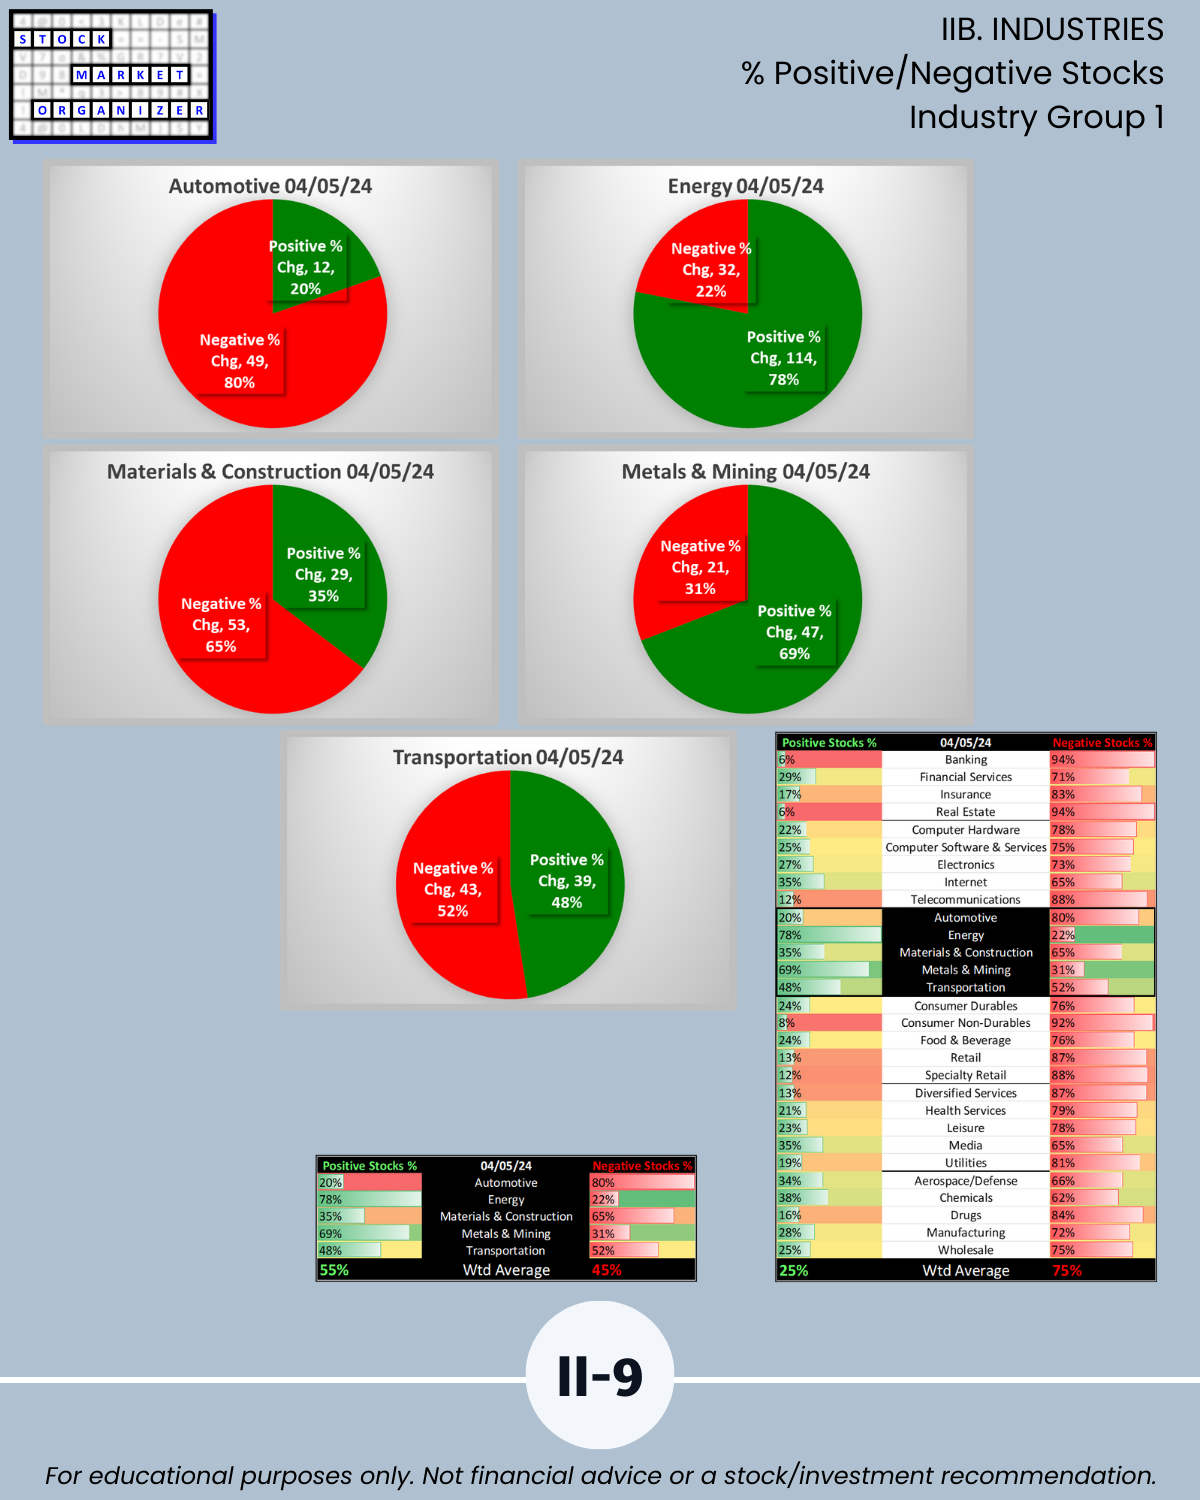
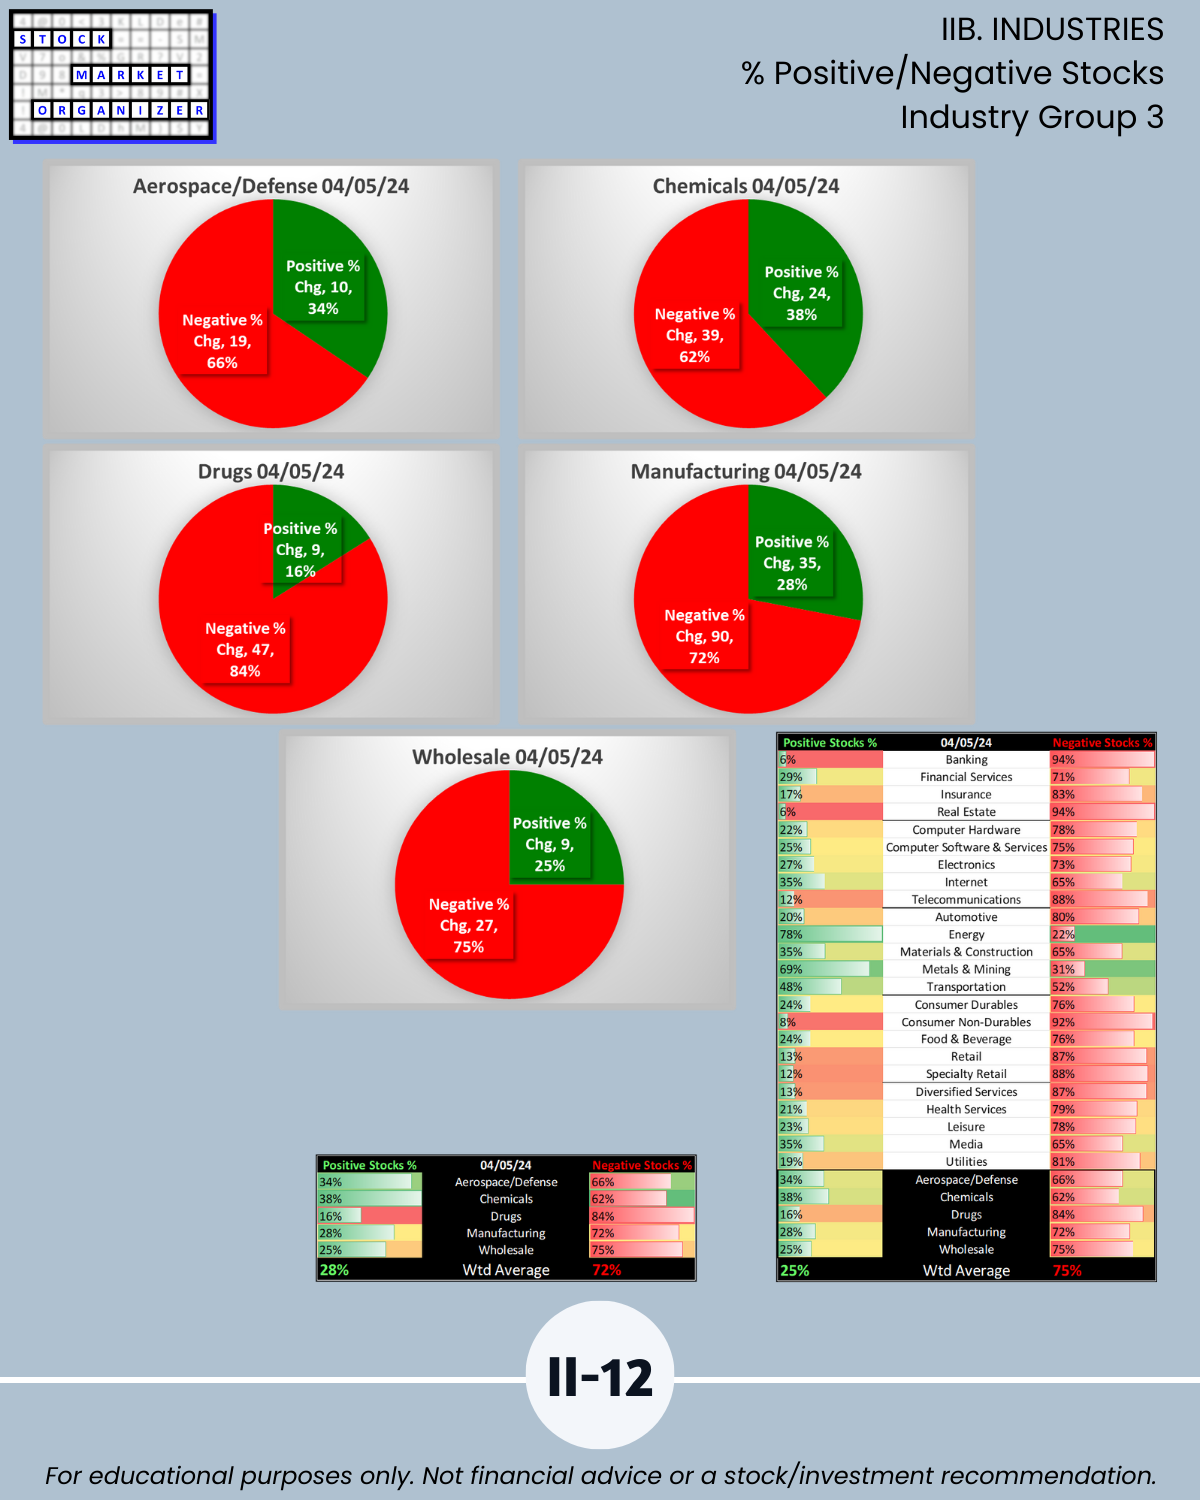
🔹 Highest Positive Stocks 35% to 78% (last week 87% to 93%)
- Energy 78%
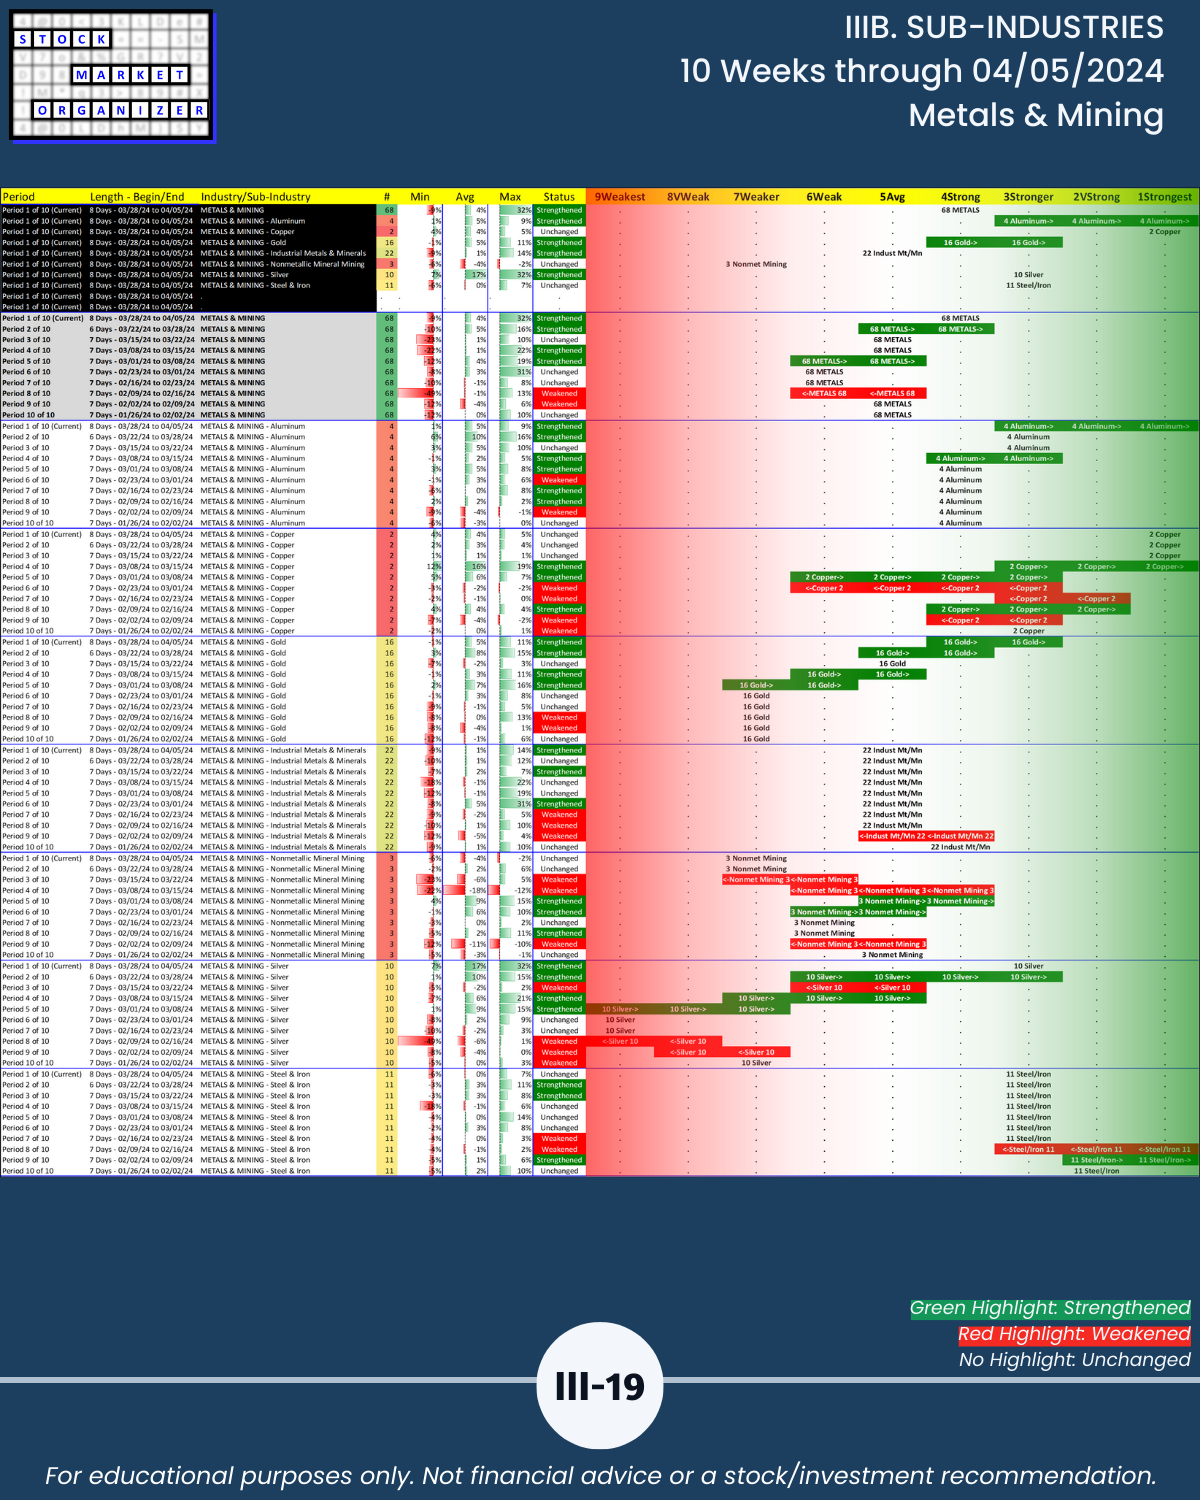
- Metals/Mining 69%
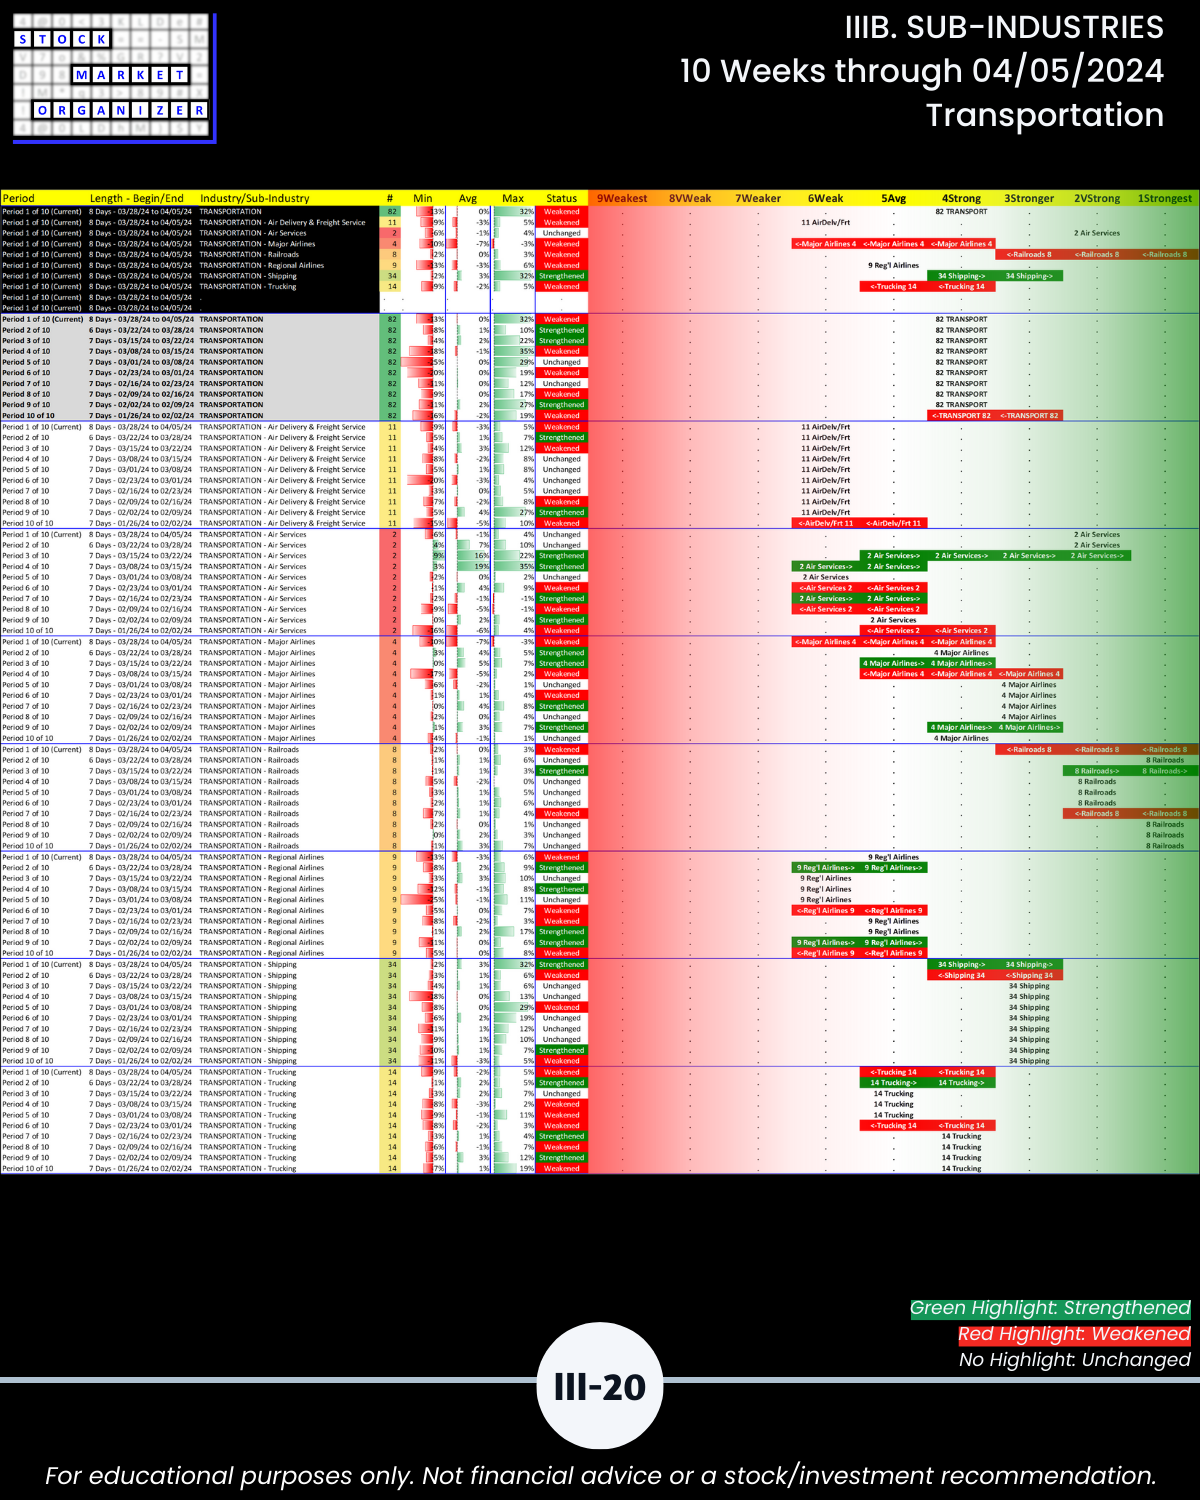
- Transportation 48%
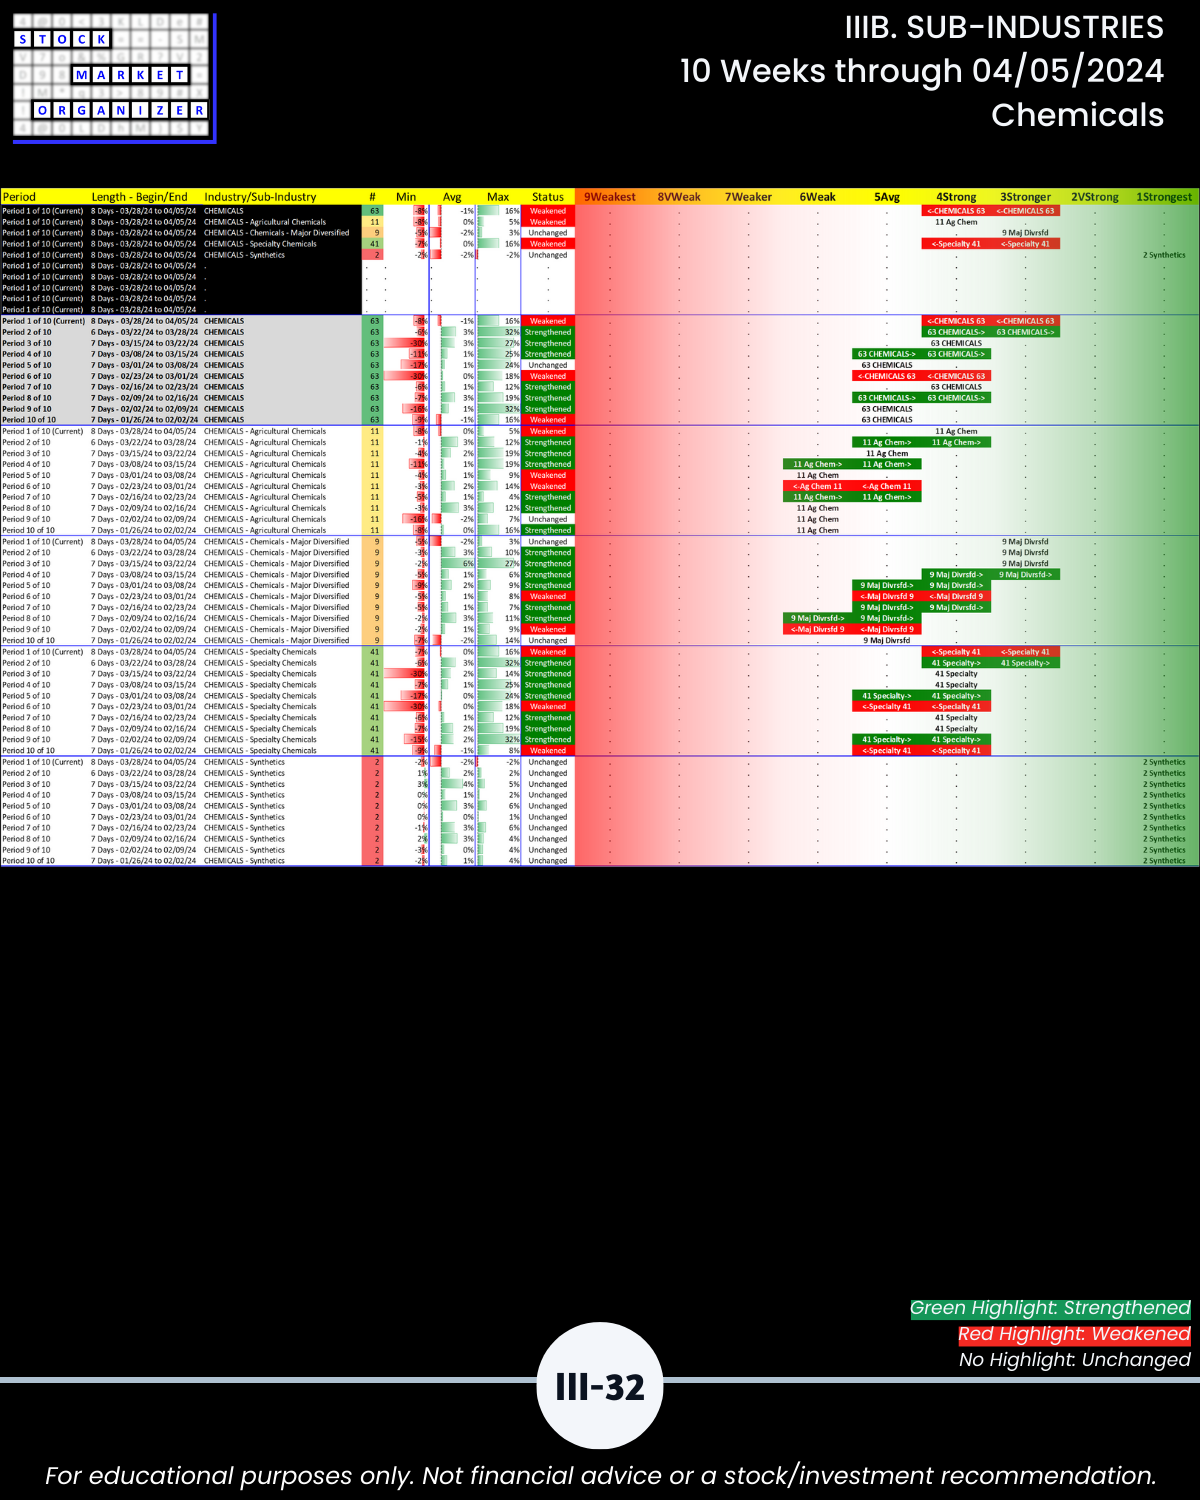
- Chemicals 38%
- Materials/Construction 35%
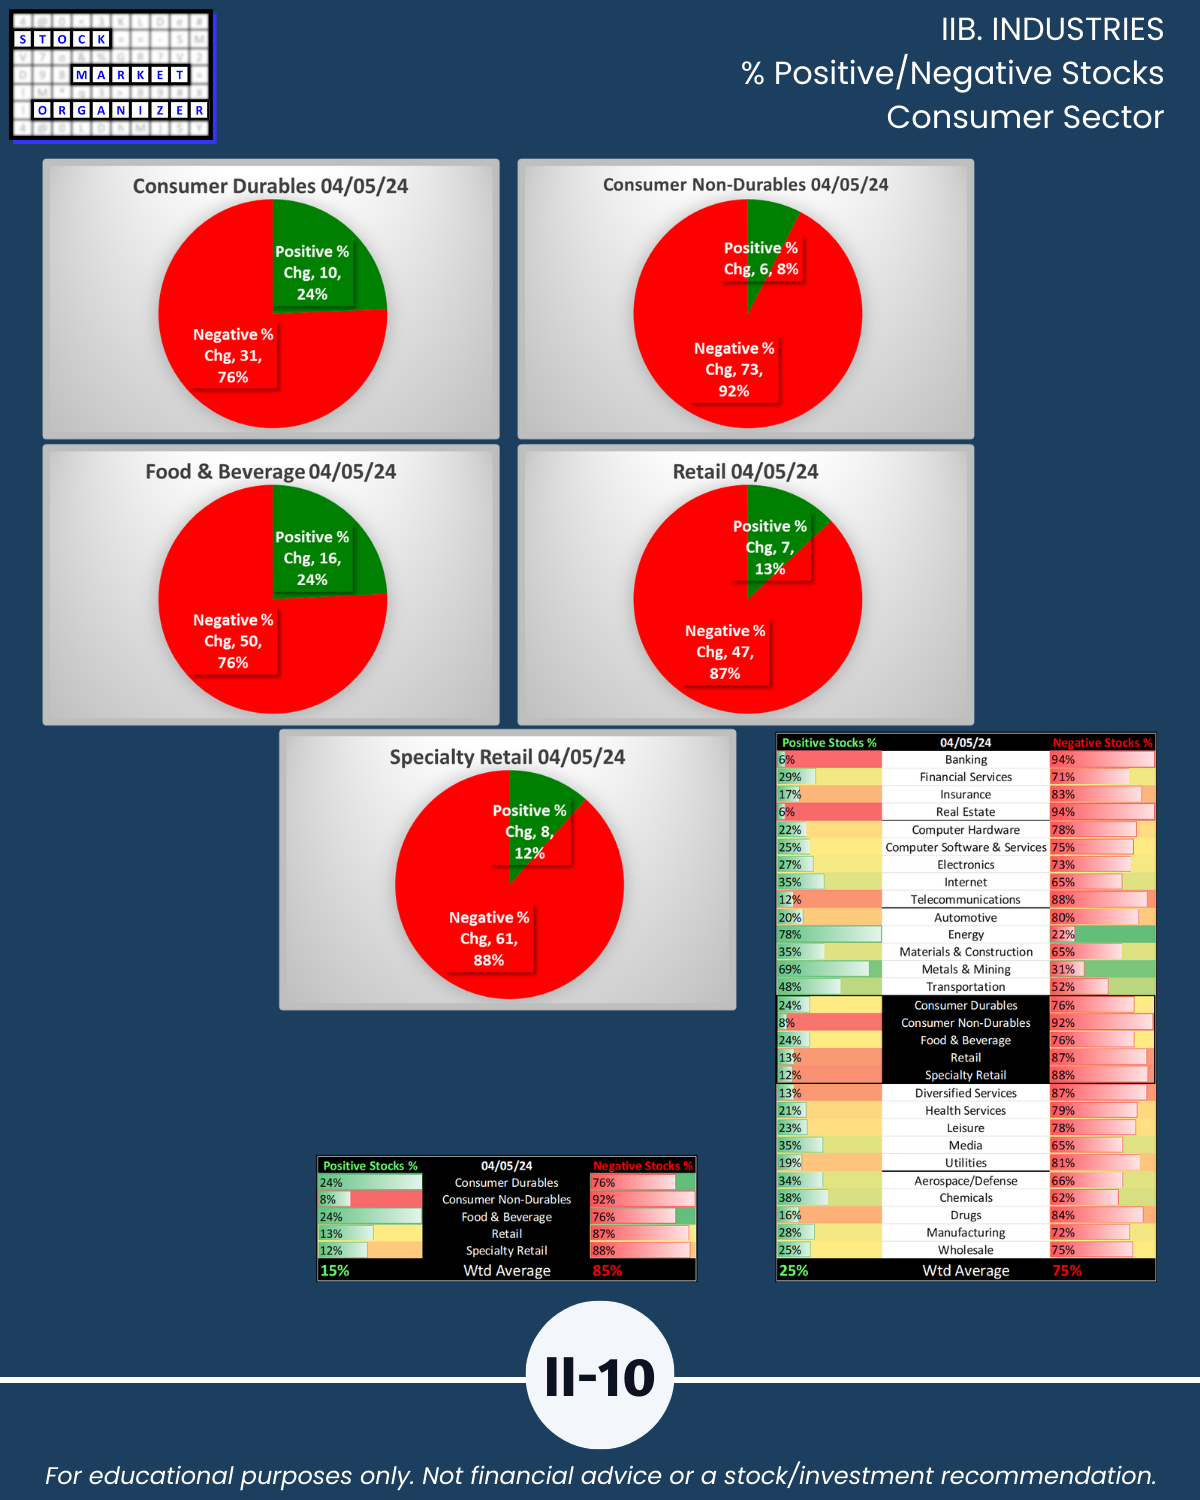
🔹 Highest Negative Stocks 88% to 94% (last week 42% to 53%)
- Real Estate 94%
- Banking 94%
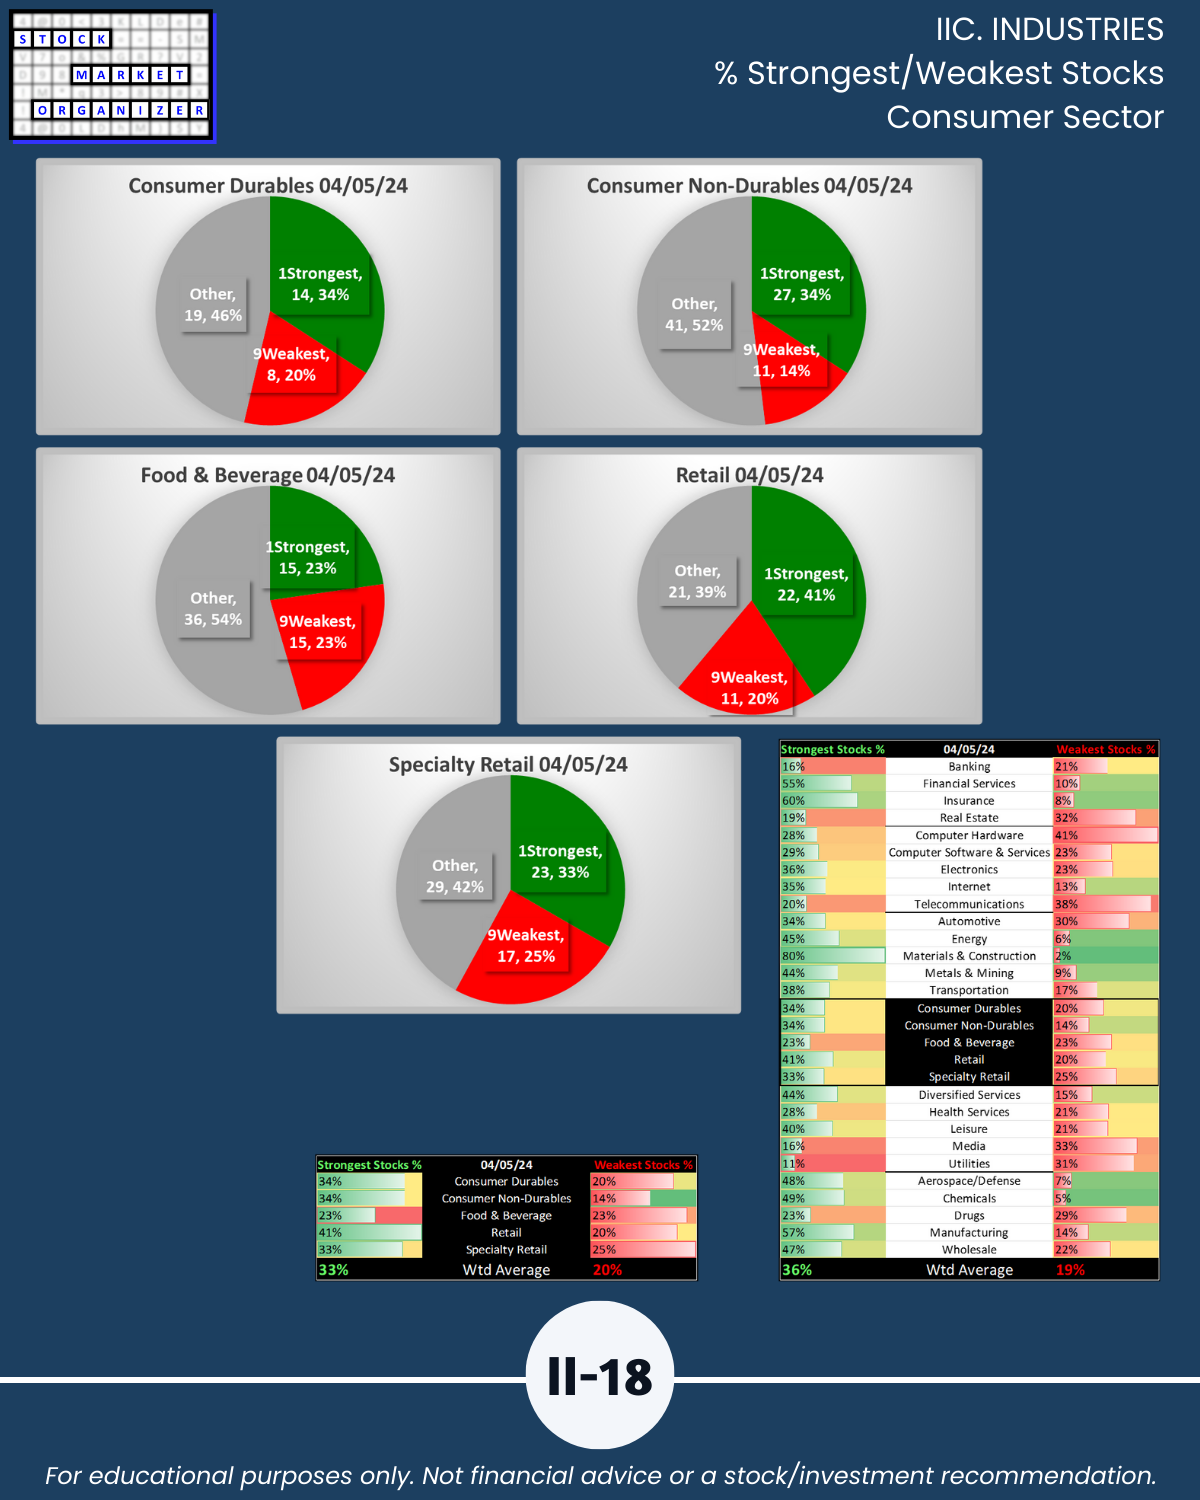
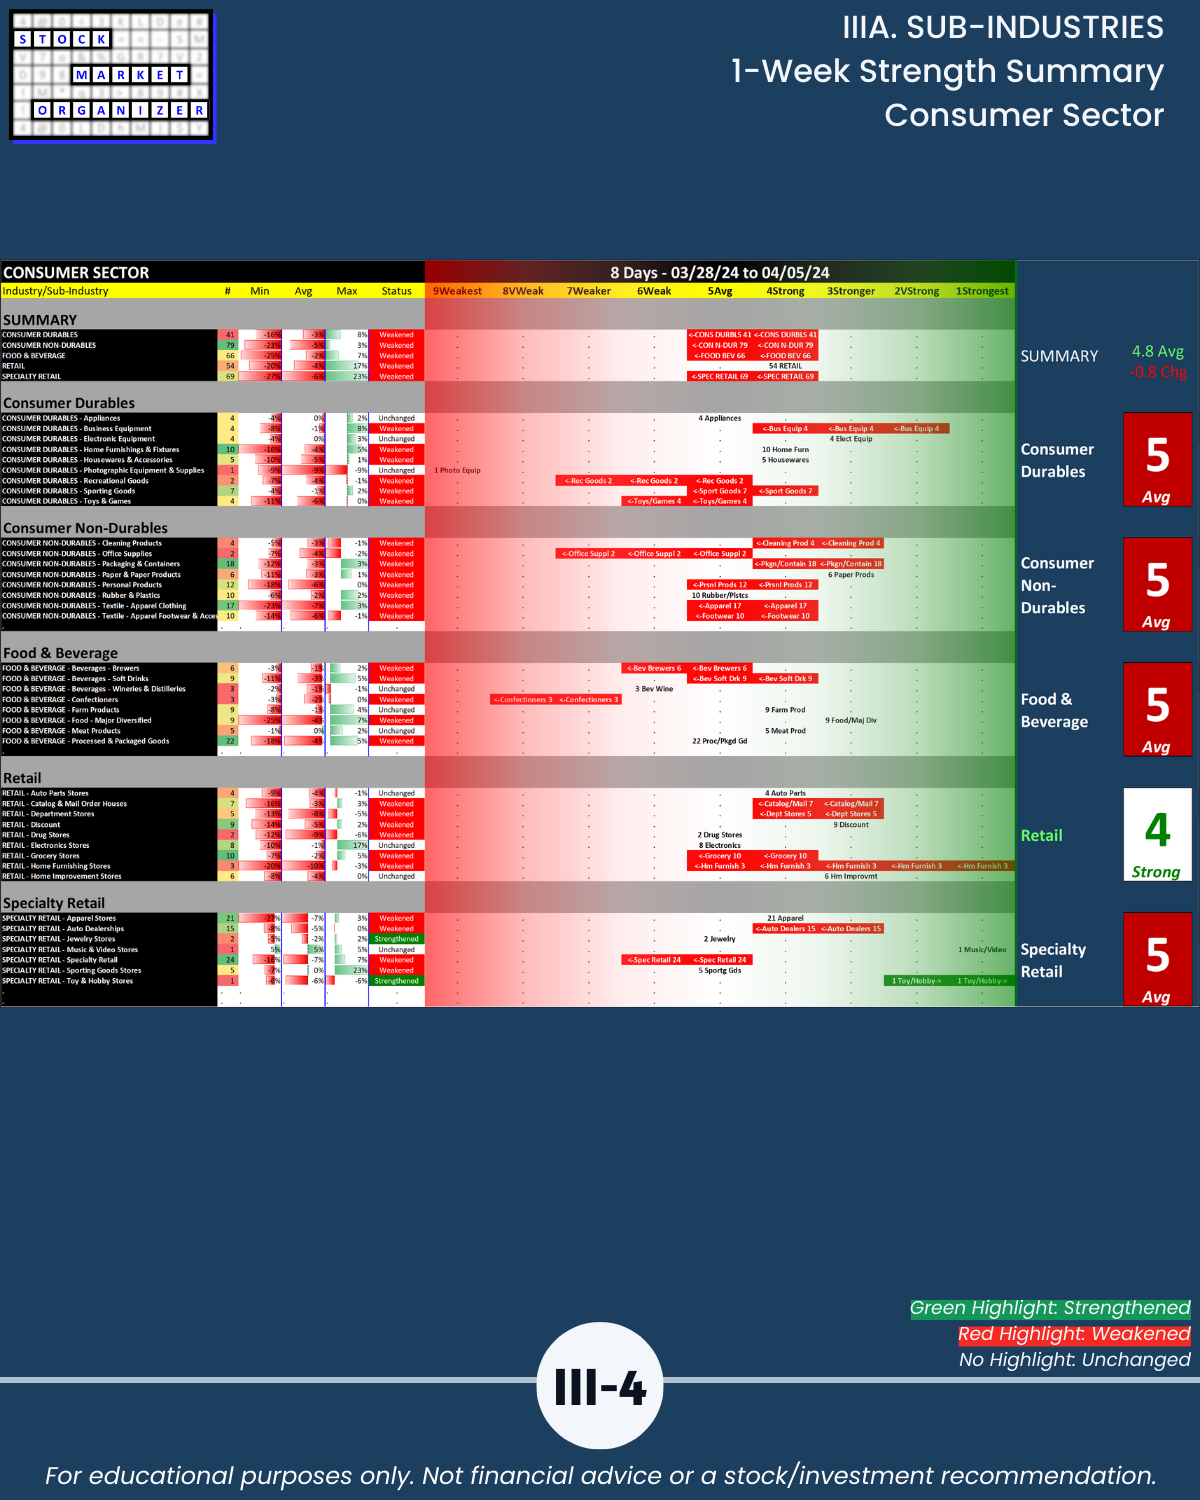
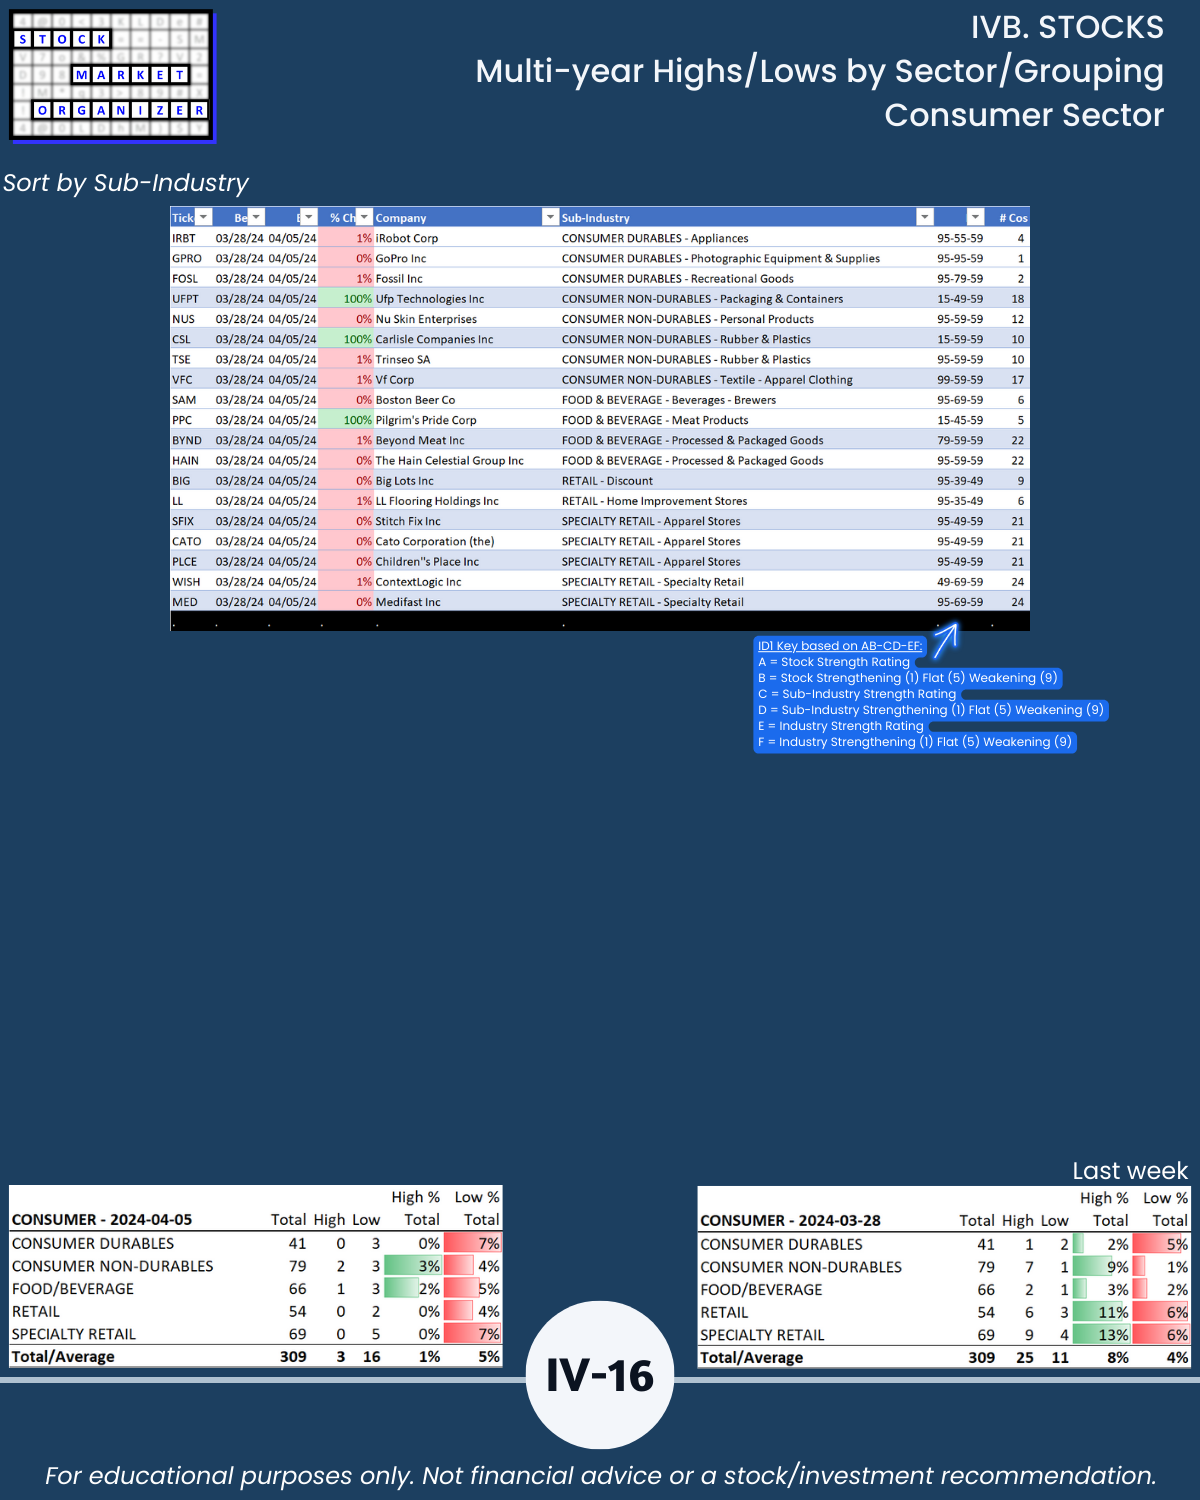
- Consumer Non-Durables 92%
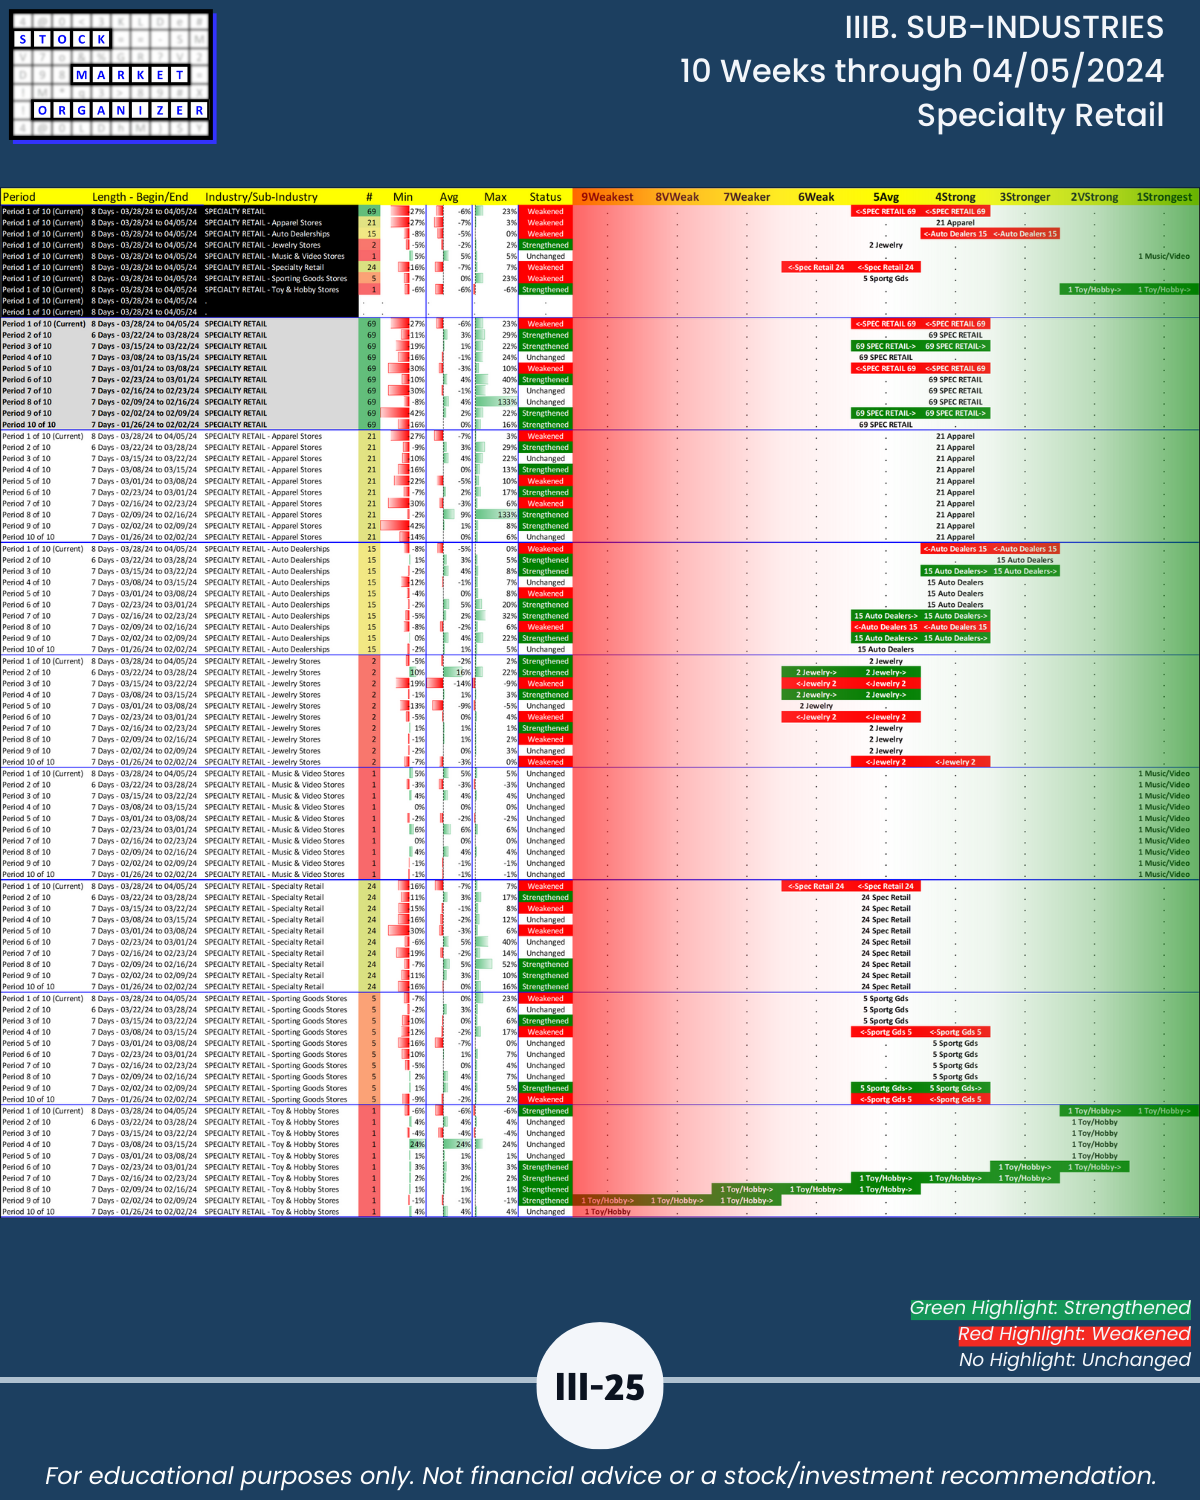
- Specialty Retail 88%
- Telecommunications 88%
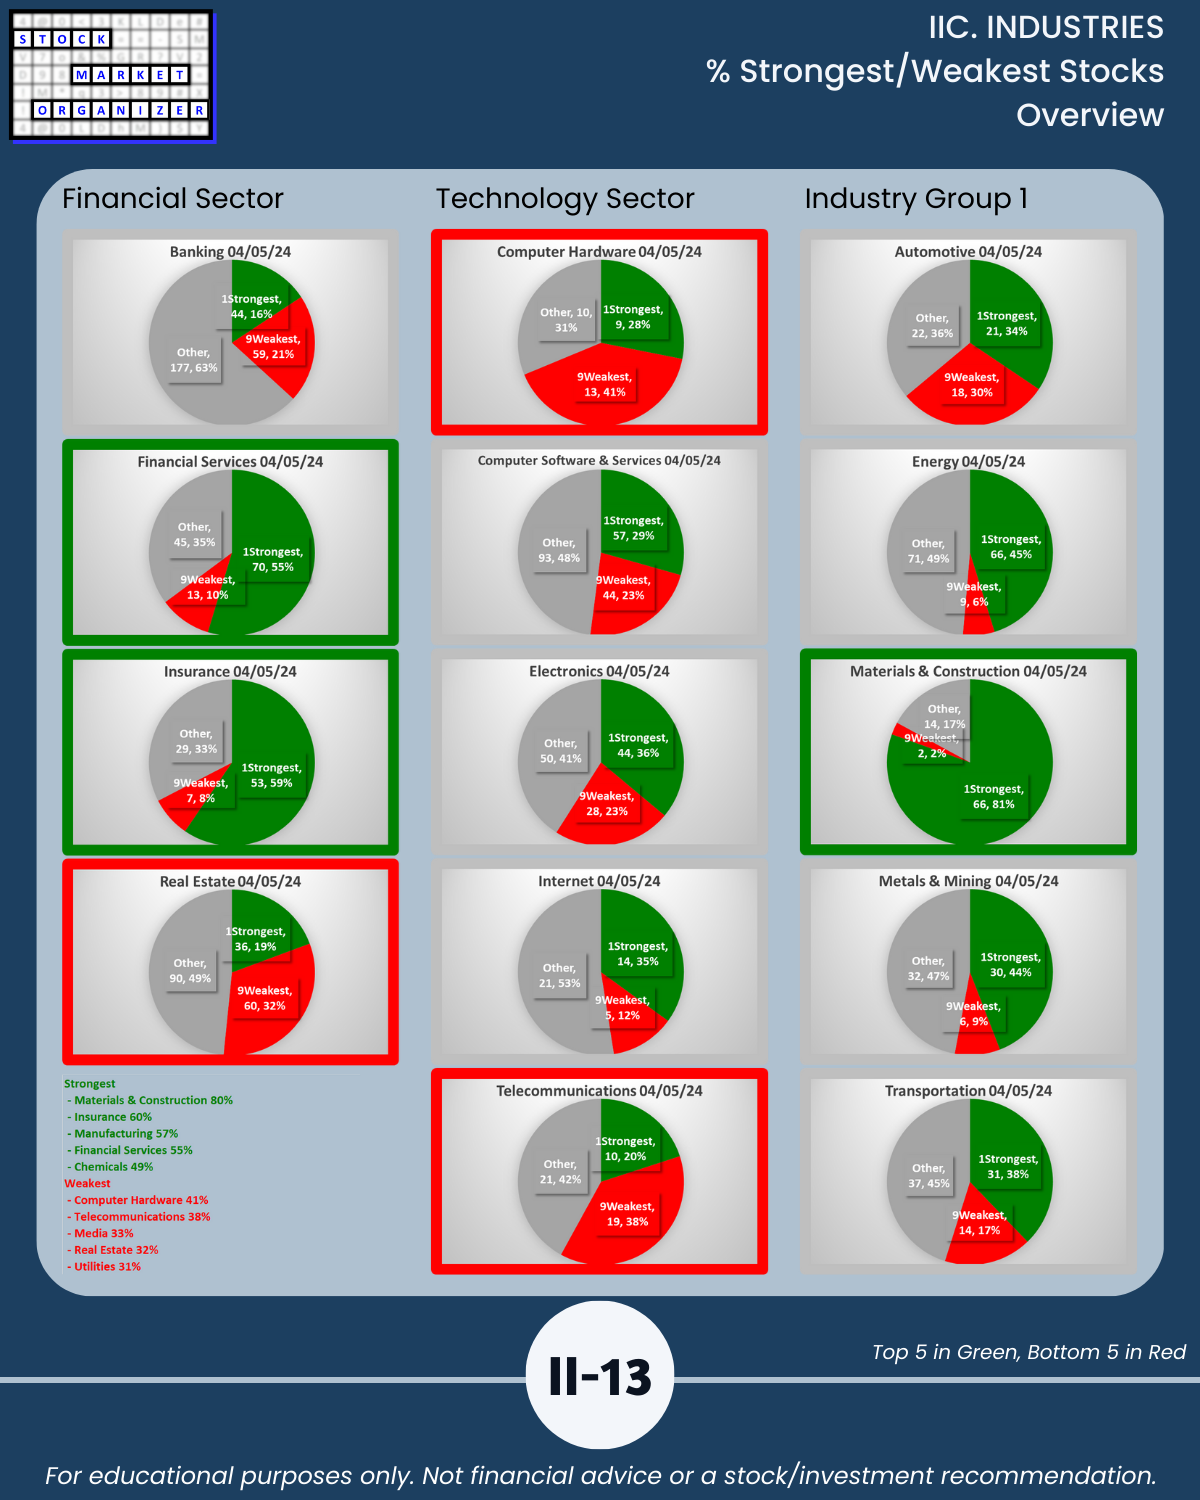
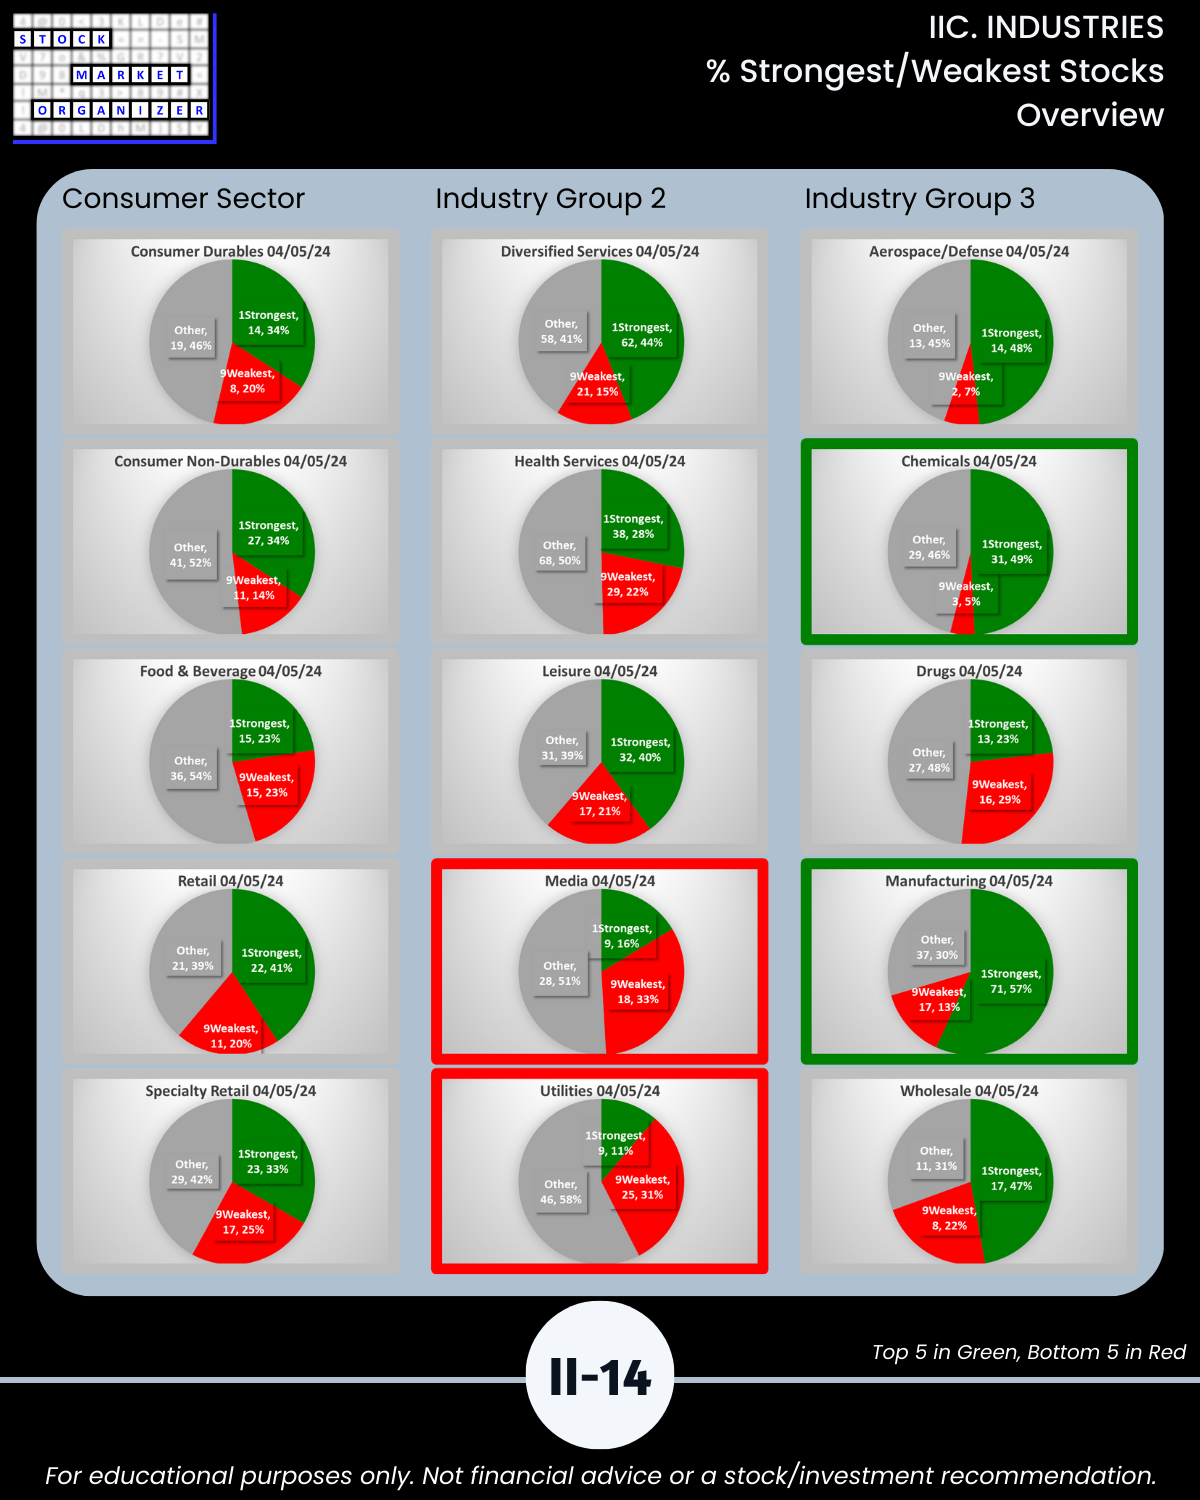
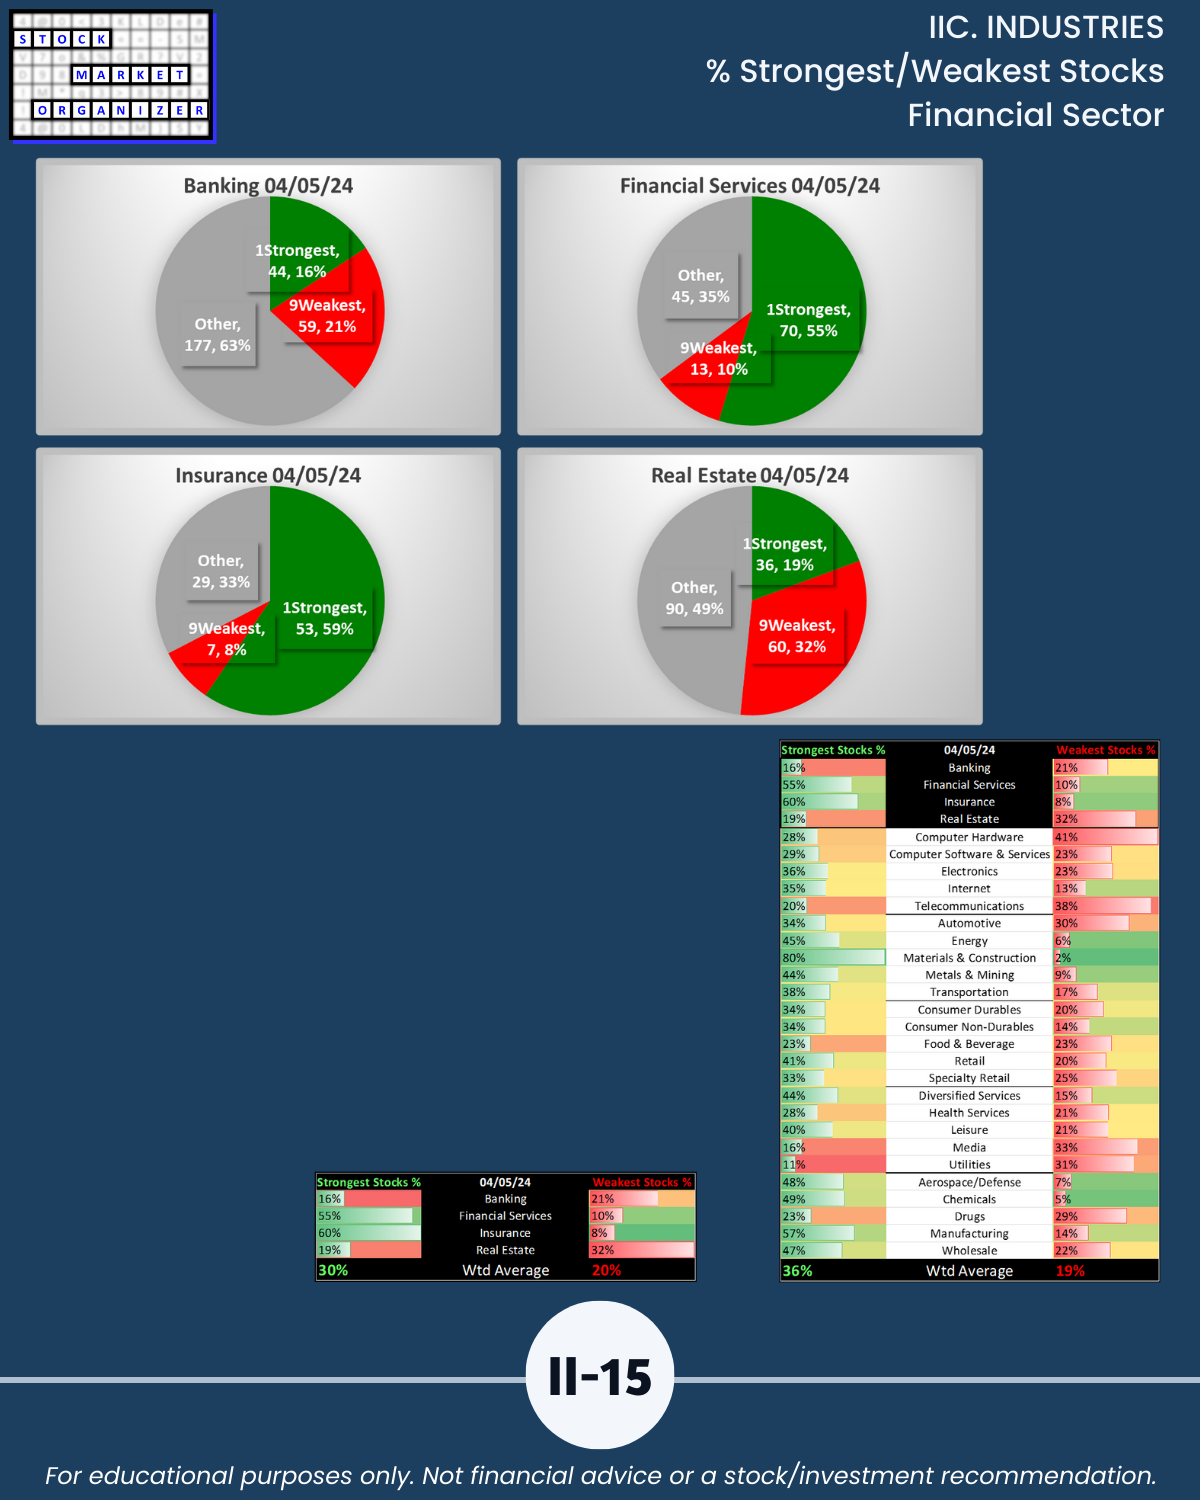
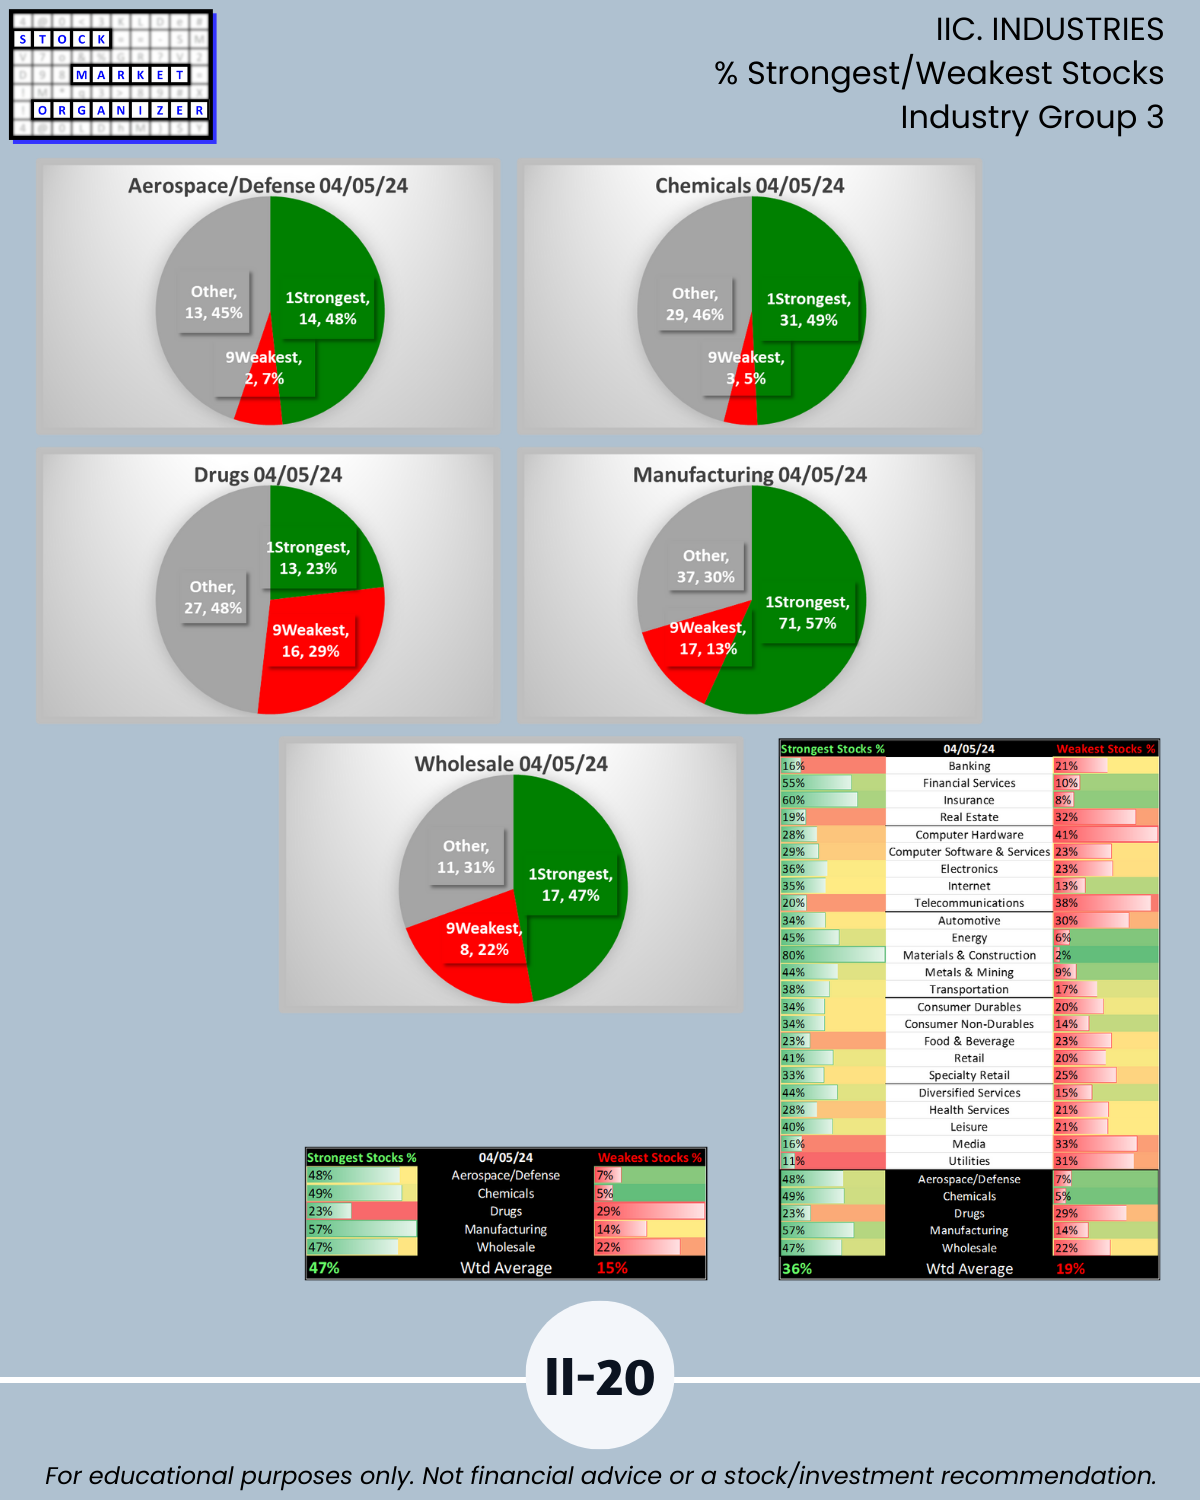
🔹 Stocks rated Strongest 49% to 80% (last week 63% to 86%)
- Materials & Construction 80%
- Insurance 60%
- Manufacturing 57%
- Financial Services 55%
- Chemicals 49%
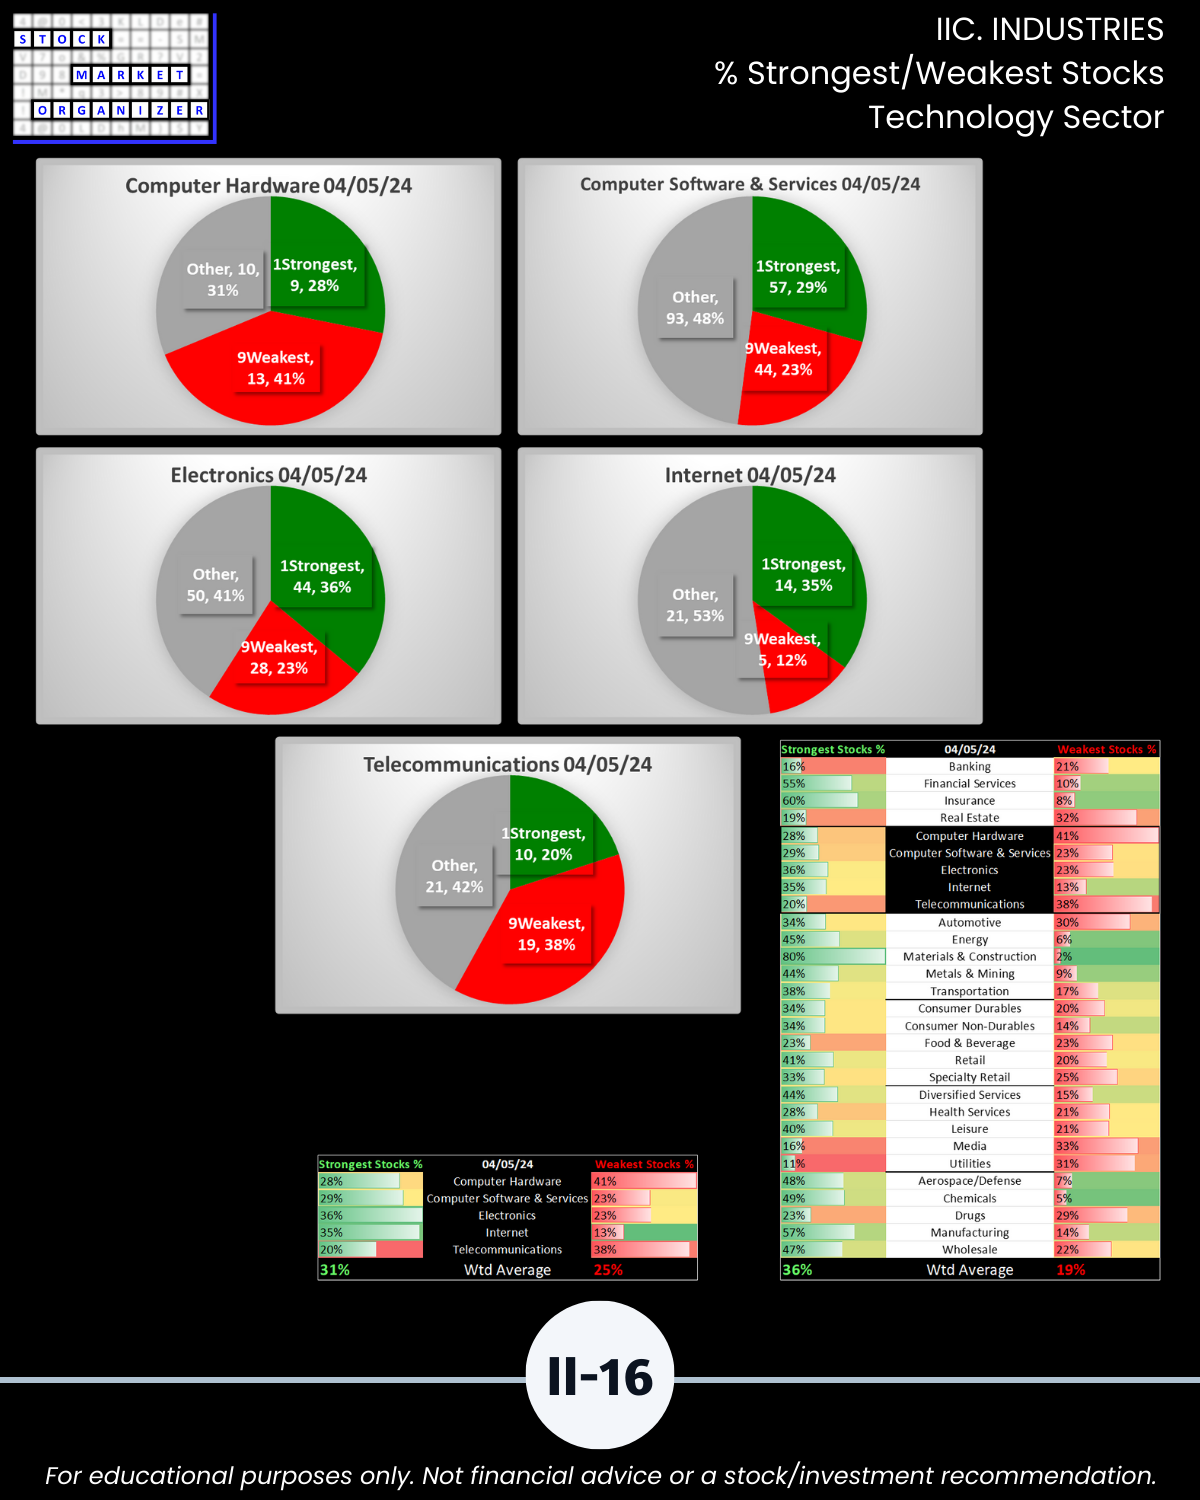
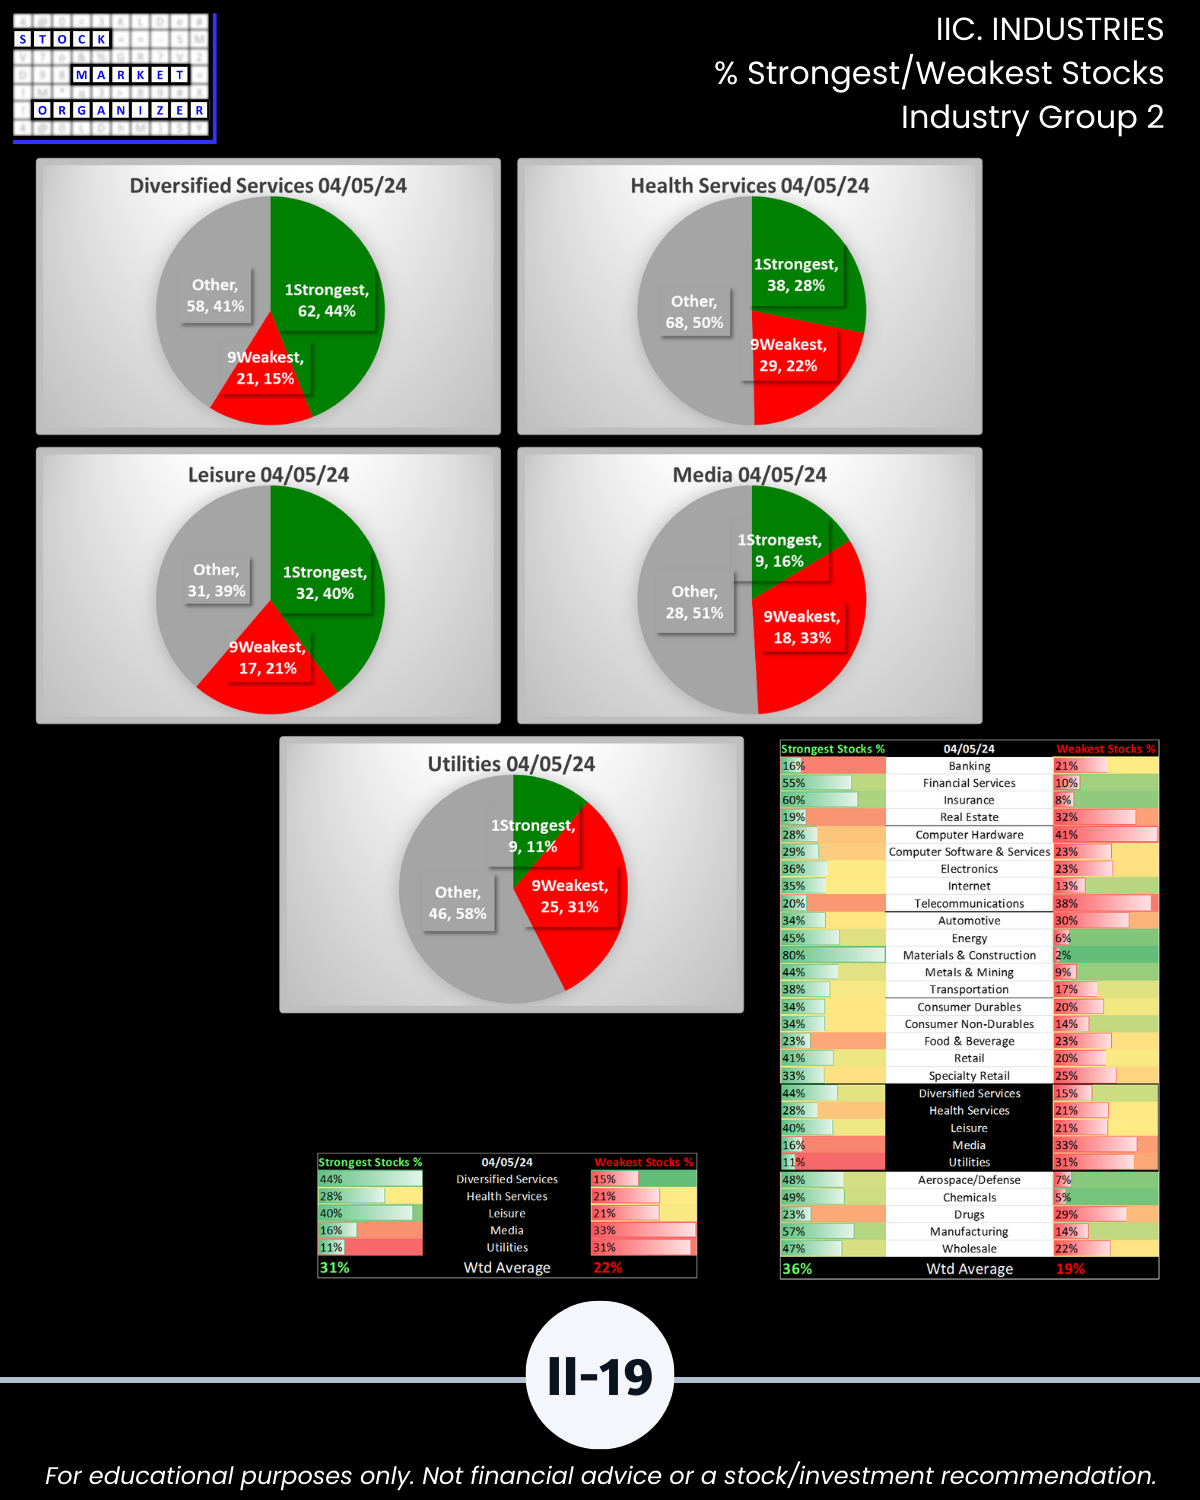
🔹 Stocks rated Weakest 31% to 41% (last week 20% to 34%)
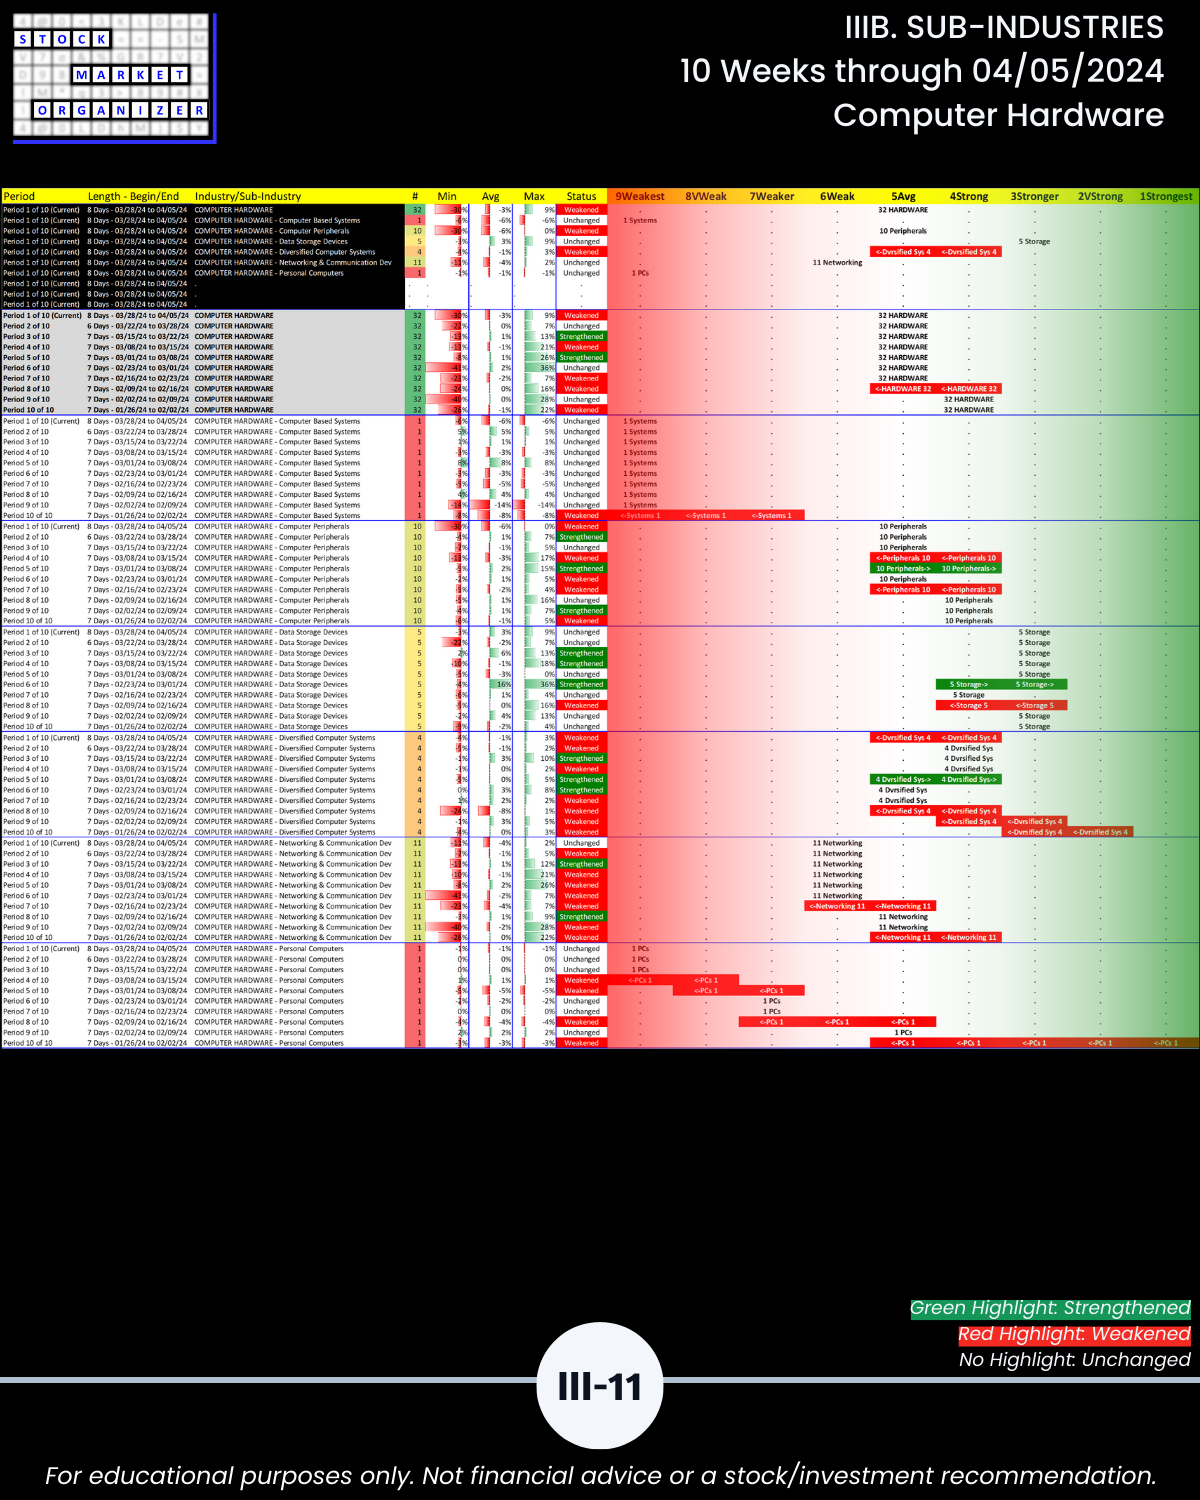
- Computer Hardware 41%
- Telecommunications 38%
- Media 33%
- Real Estate 32%
- Utilities 31%
Don’t care about the above? There’s much more in the attached.
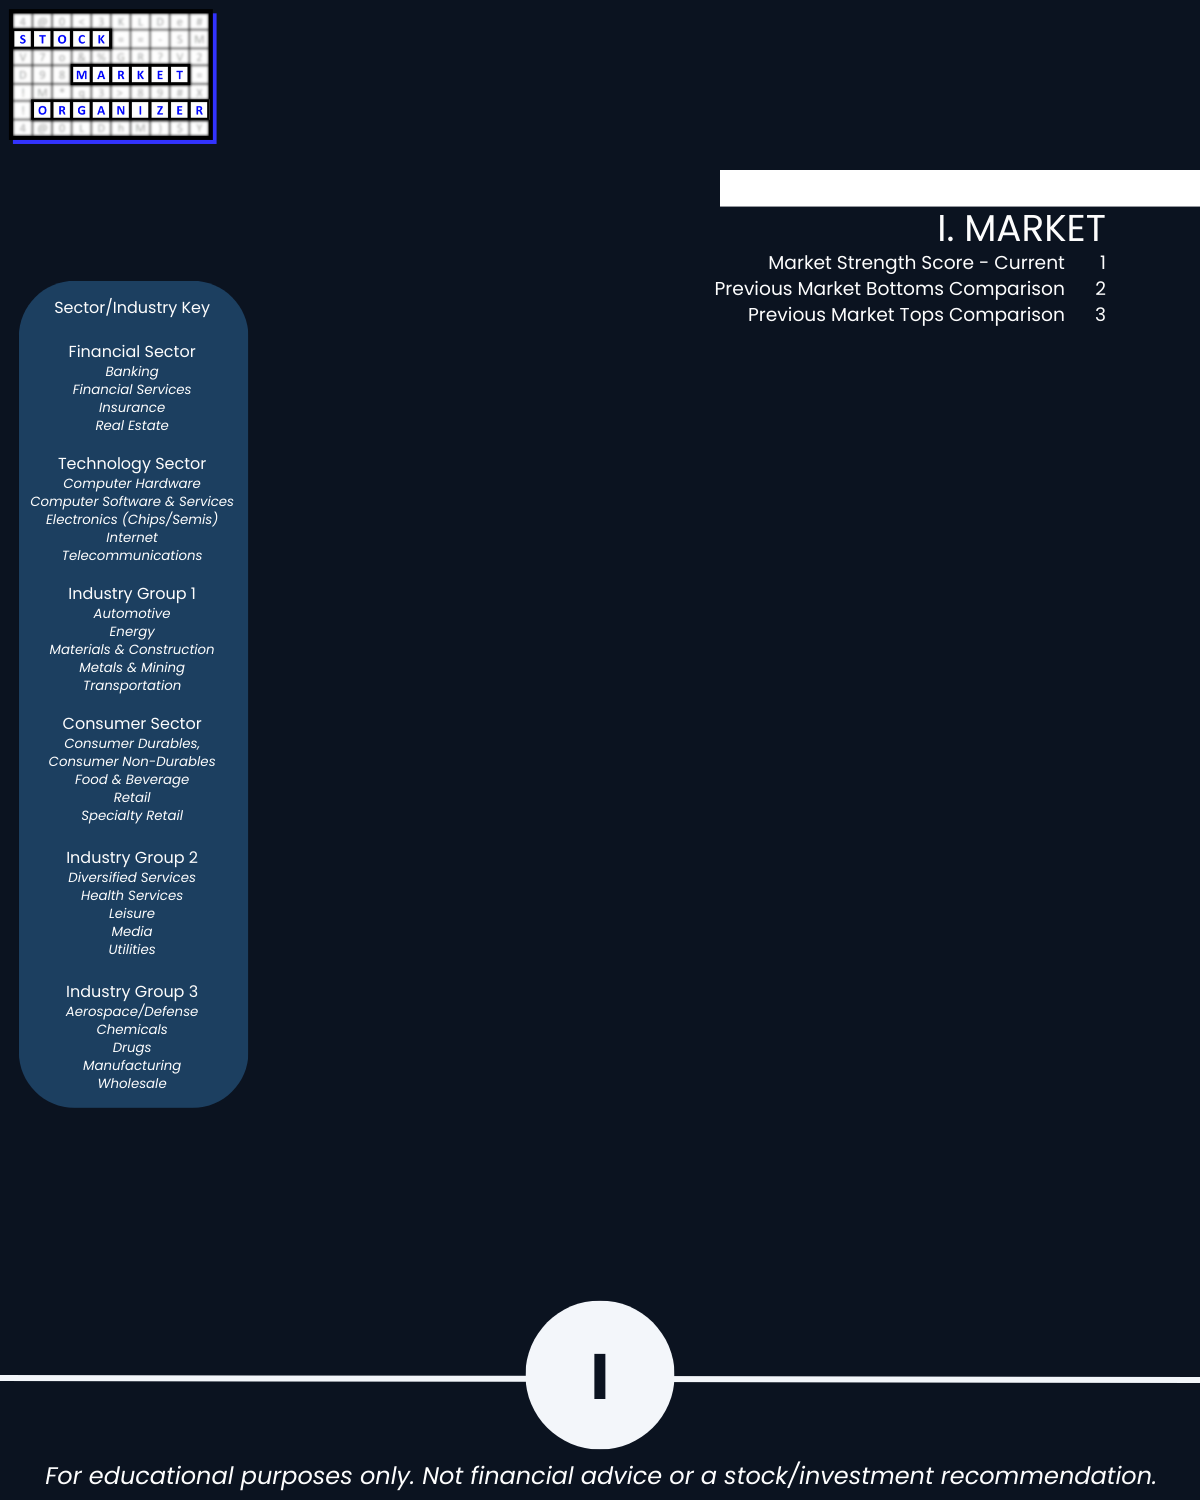
I. MARKET Prologue Critical Concepts/Market Strength Score
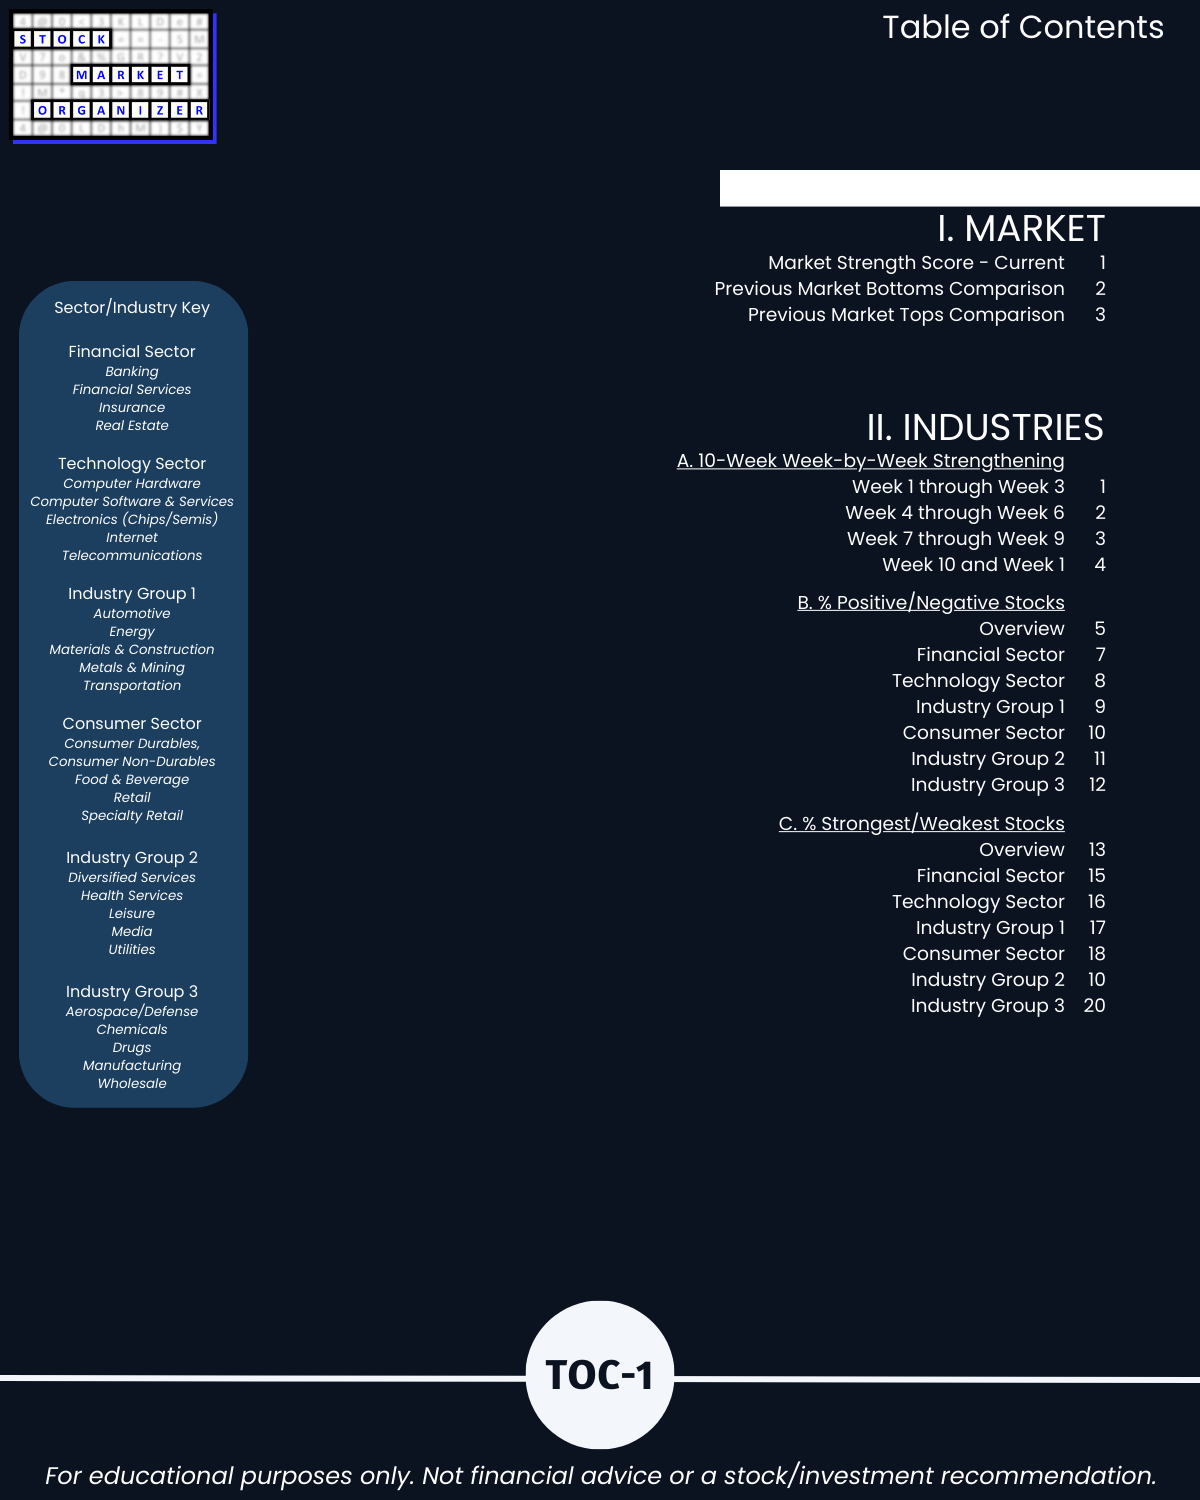
IIA. INDUSTRIES 10-Week Week-by-Week Strengthening
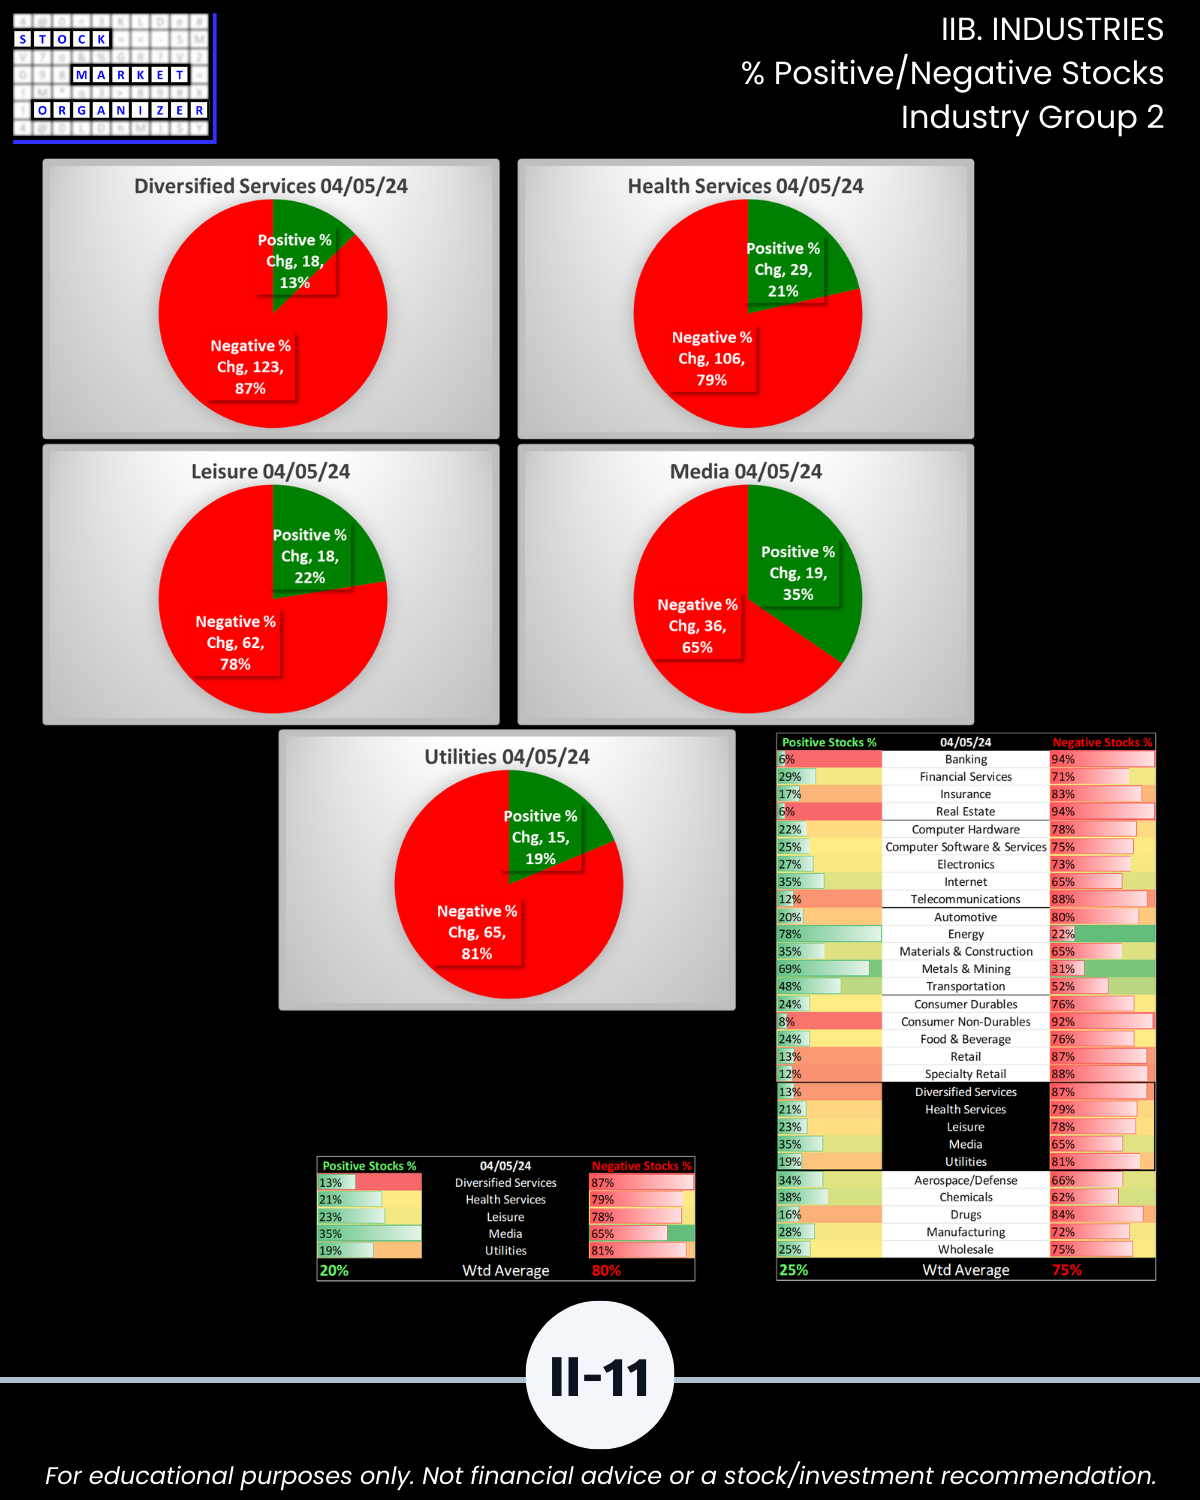
IIB. INDUSTRIES % Positive/Negative Stocks
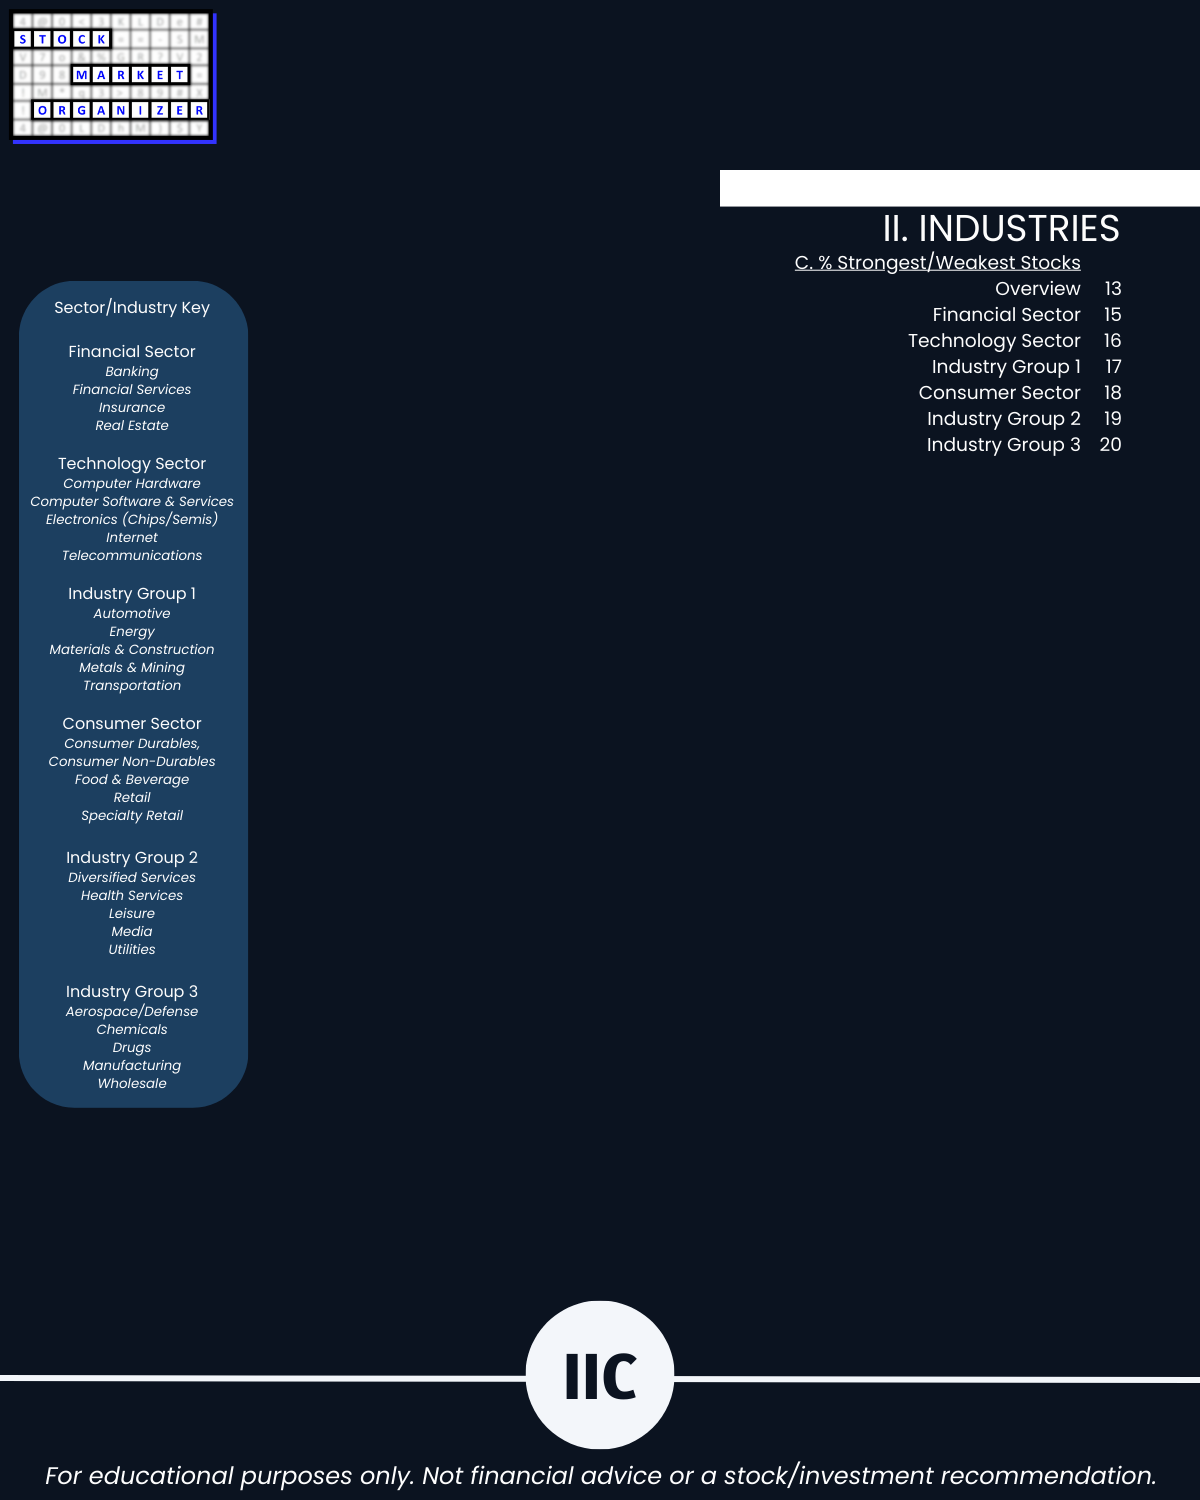
IIC. INDUSTRIES % Strongest/Weakest Stocks
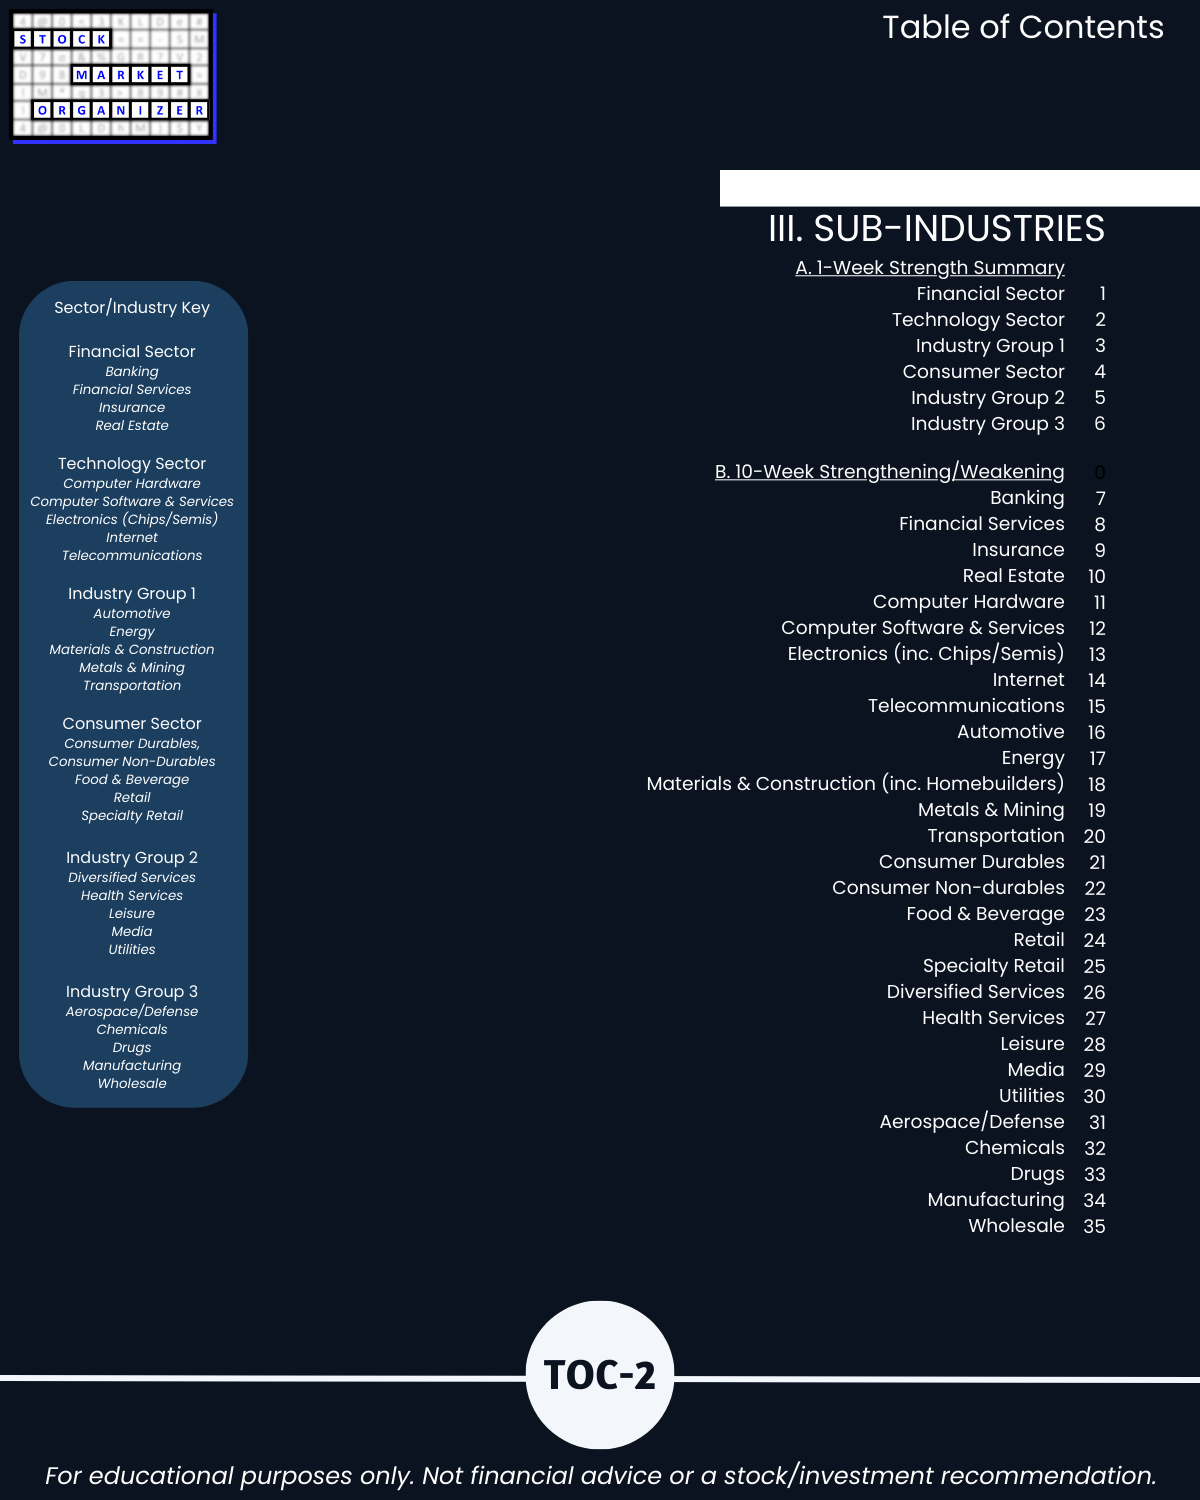
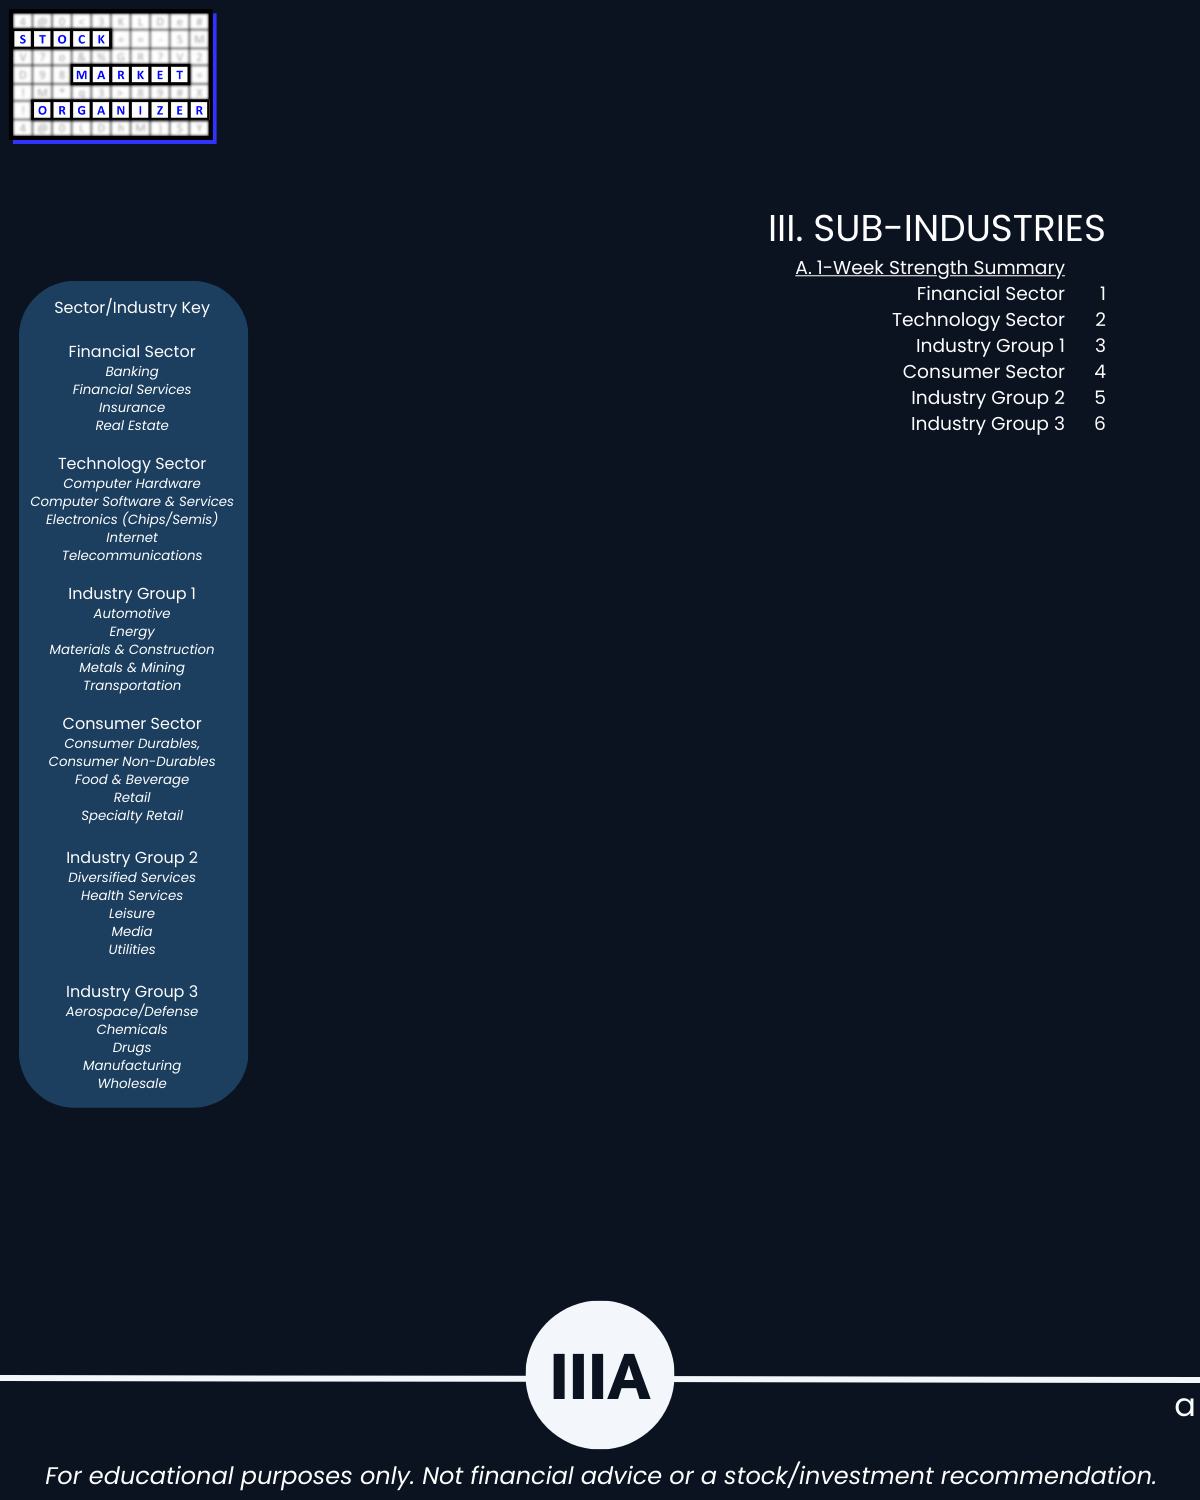
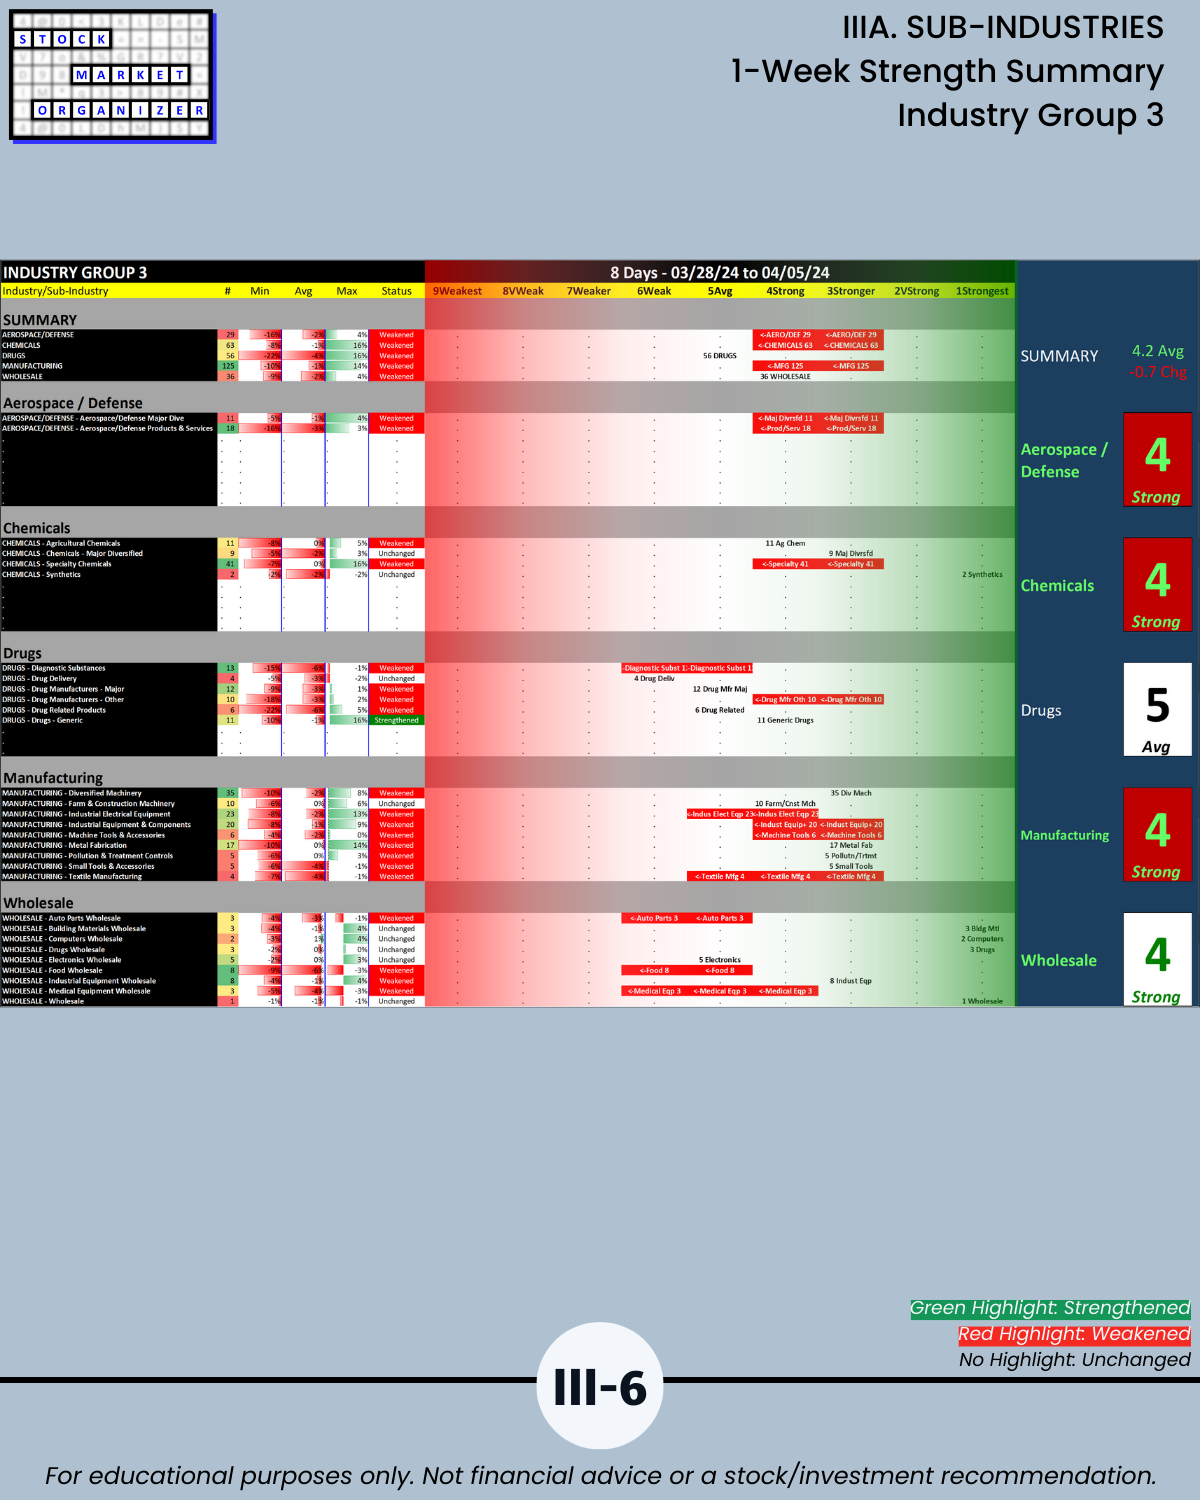
IIIA. SUB-INDUSTRIES 1-Week Strength Summary
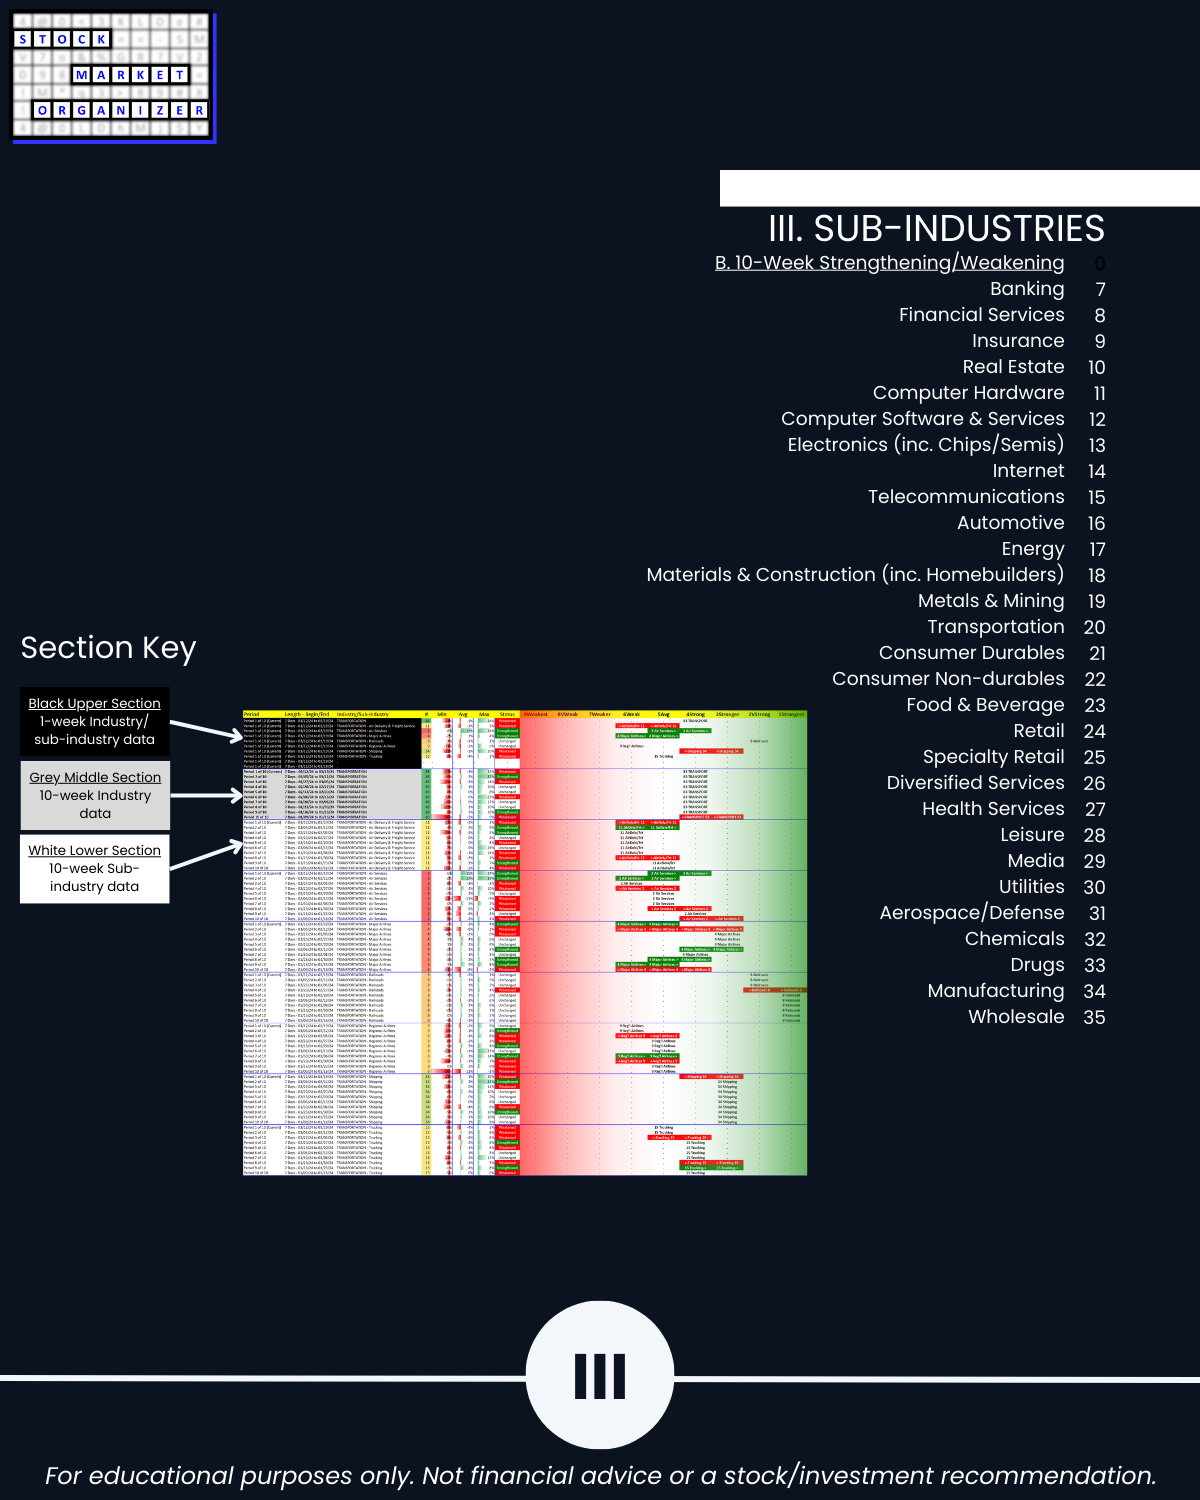
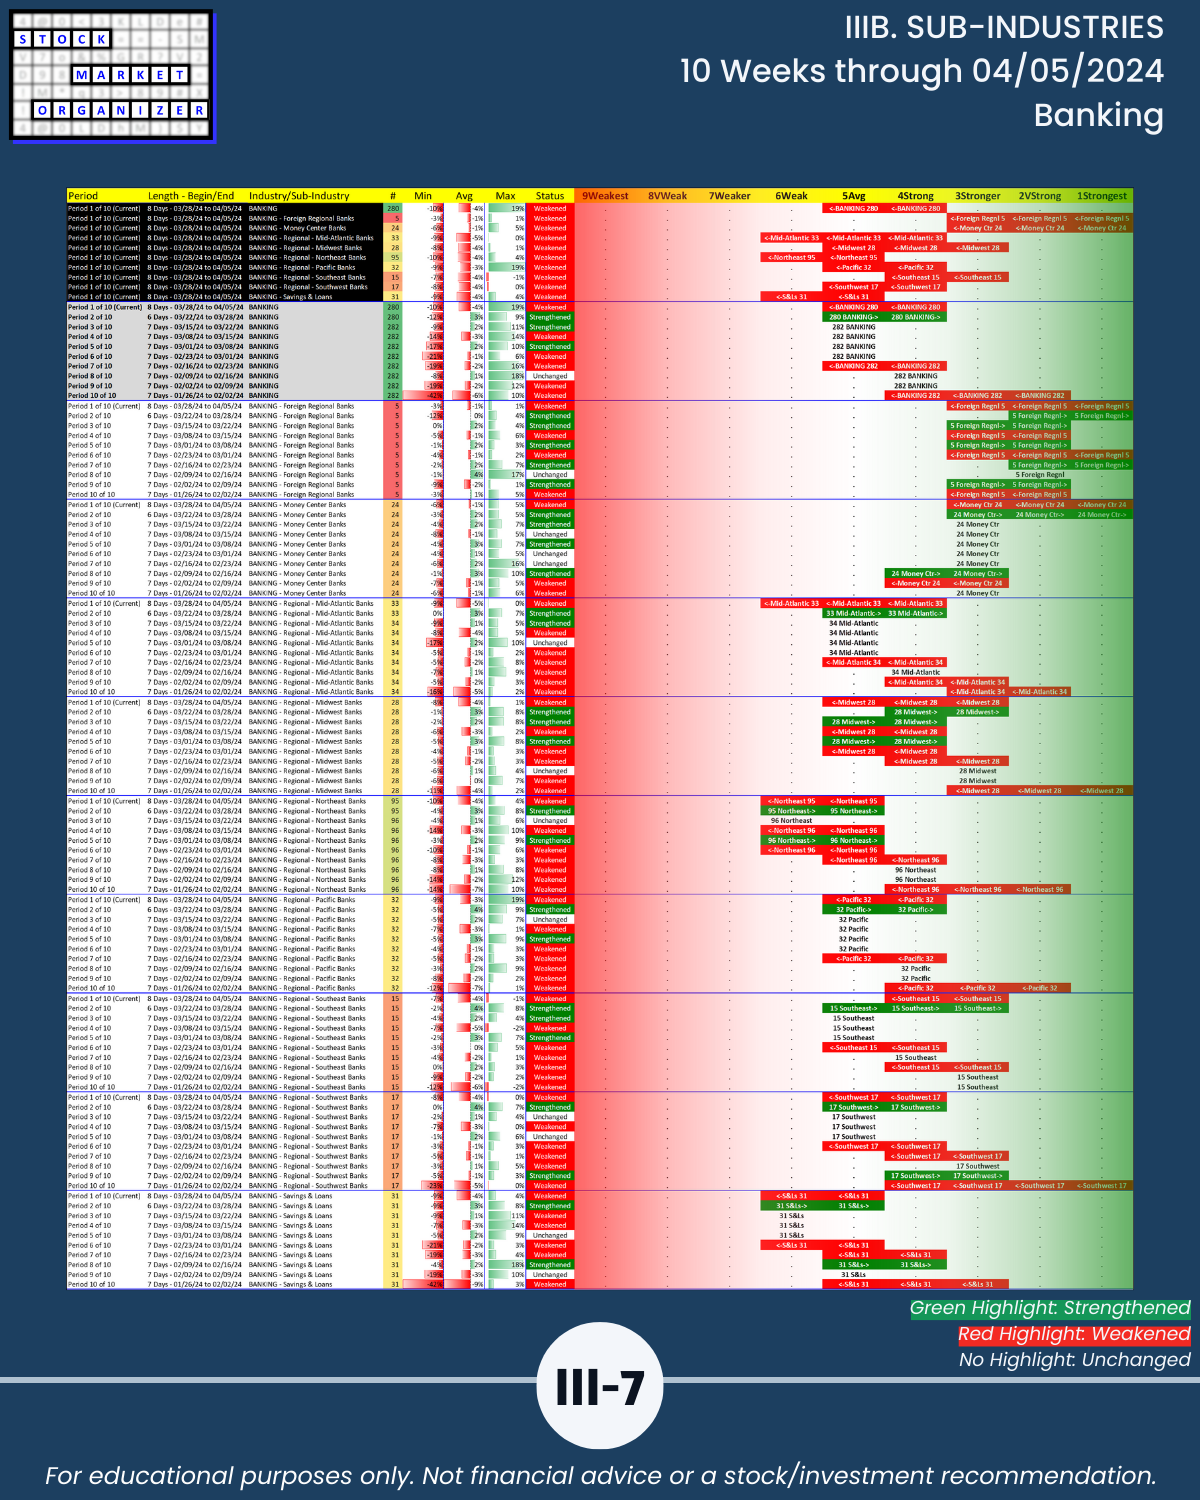
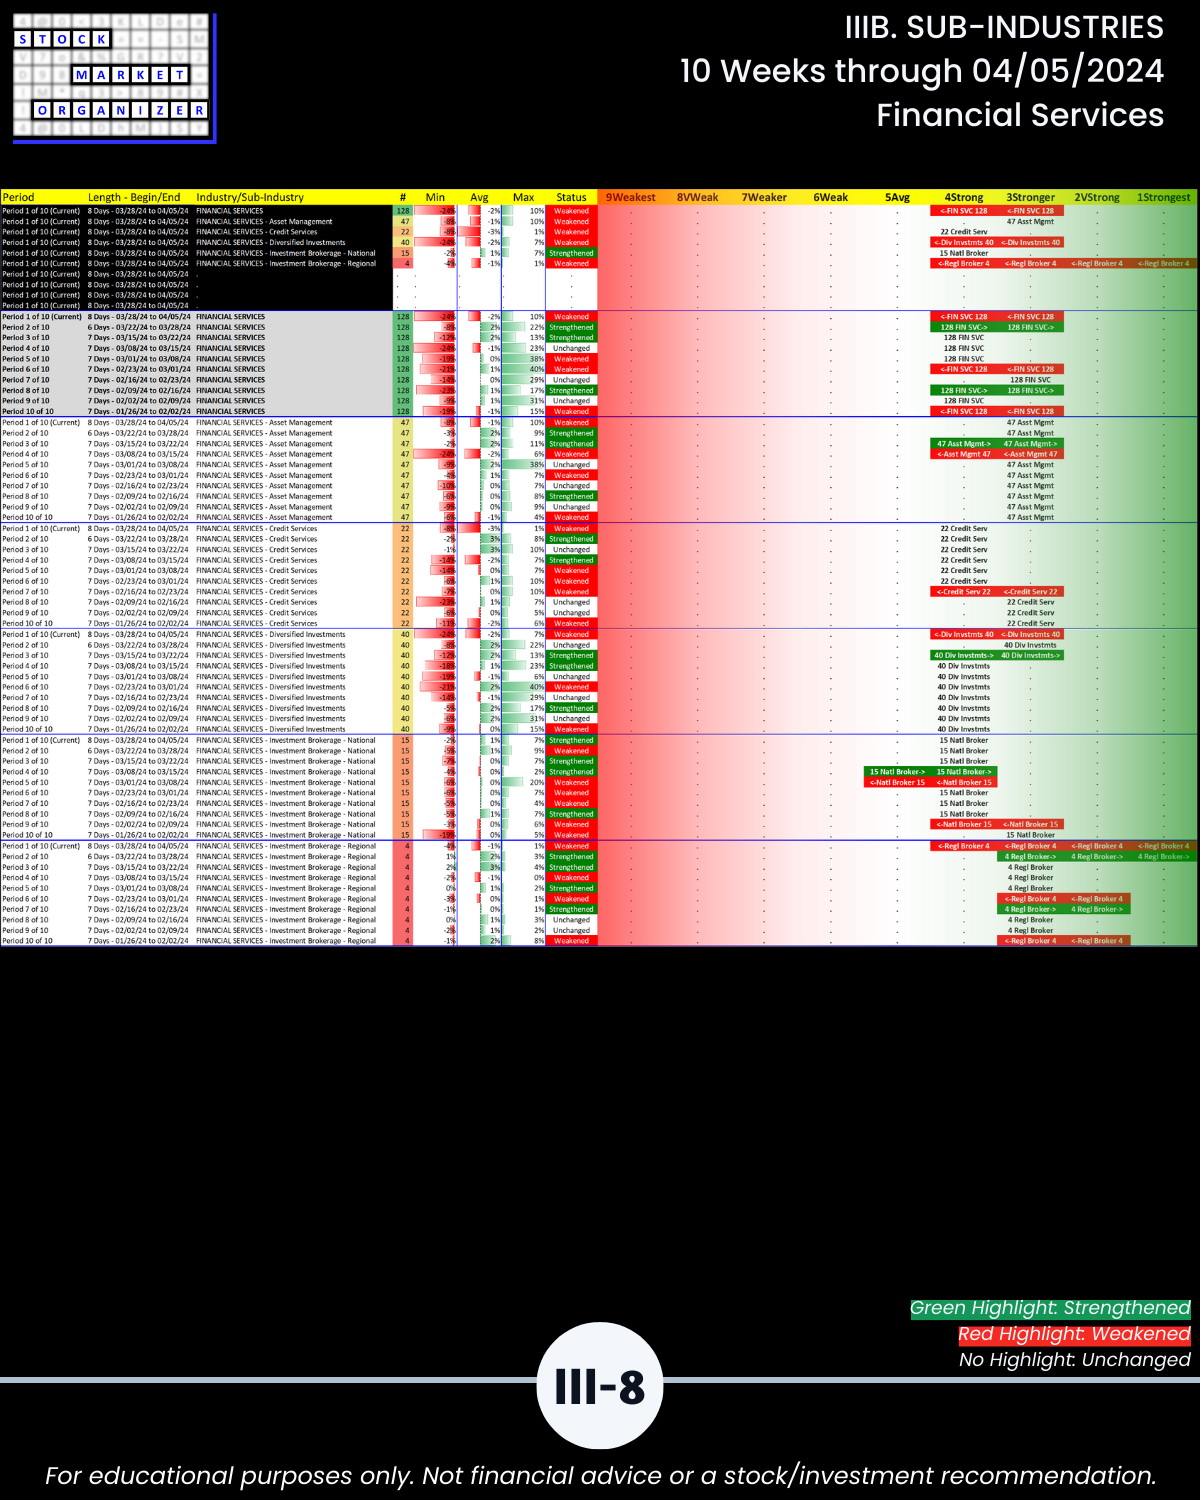
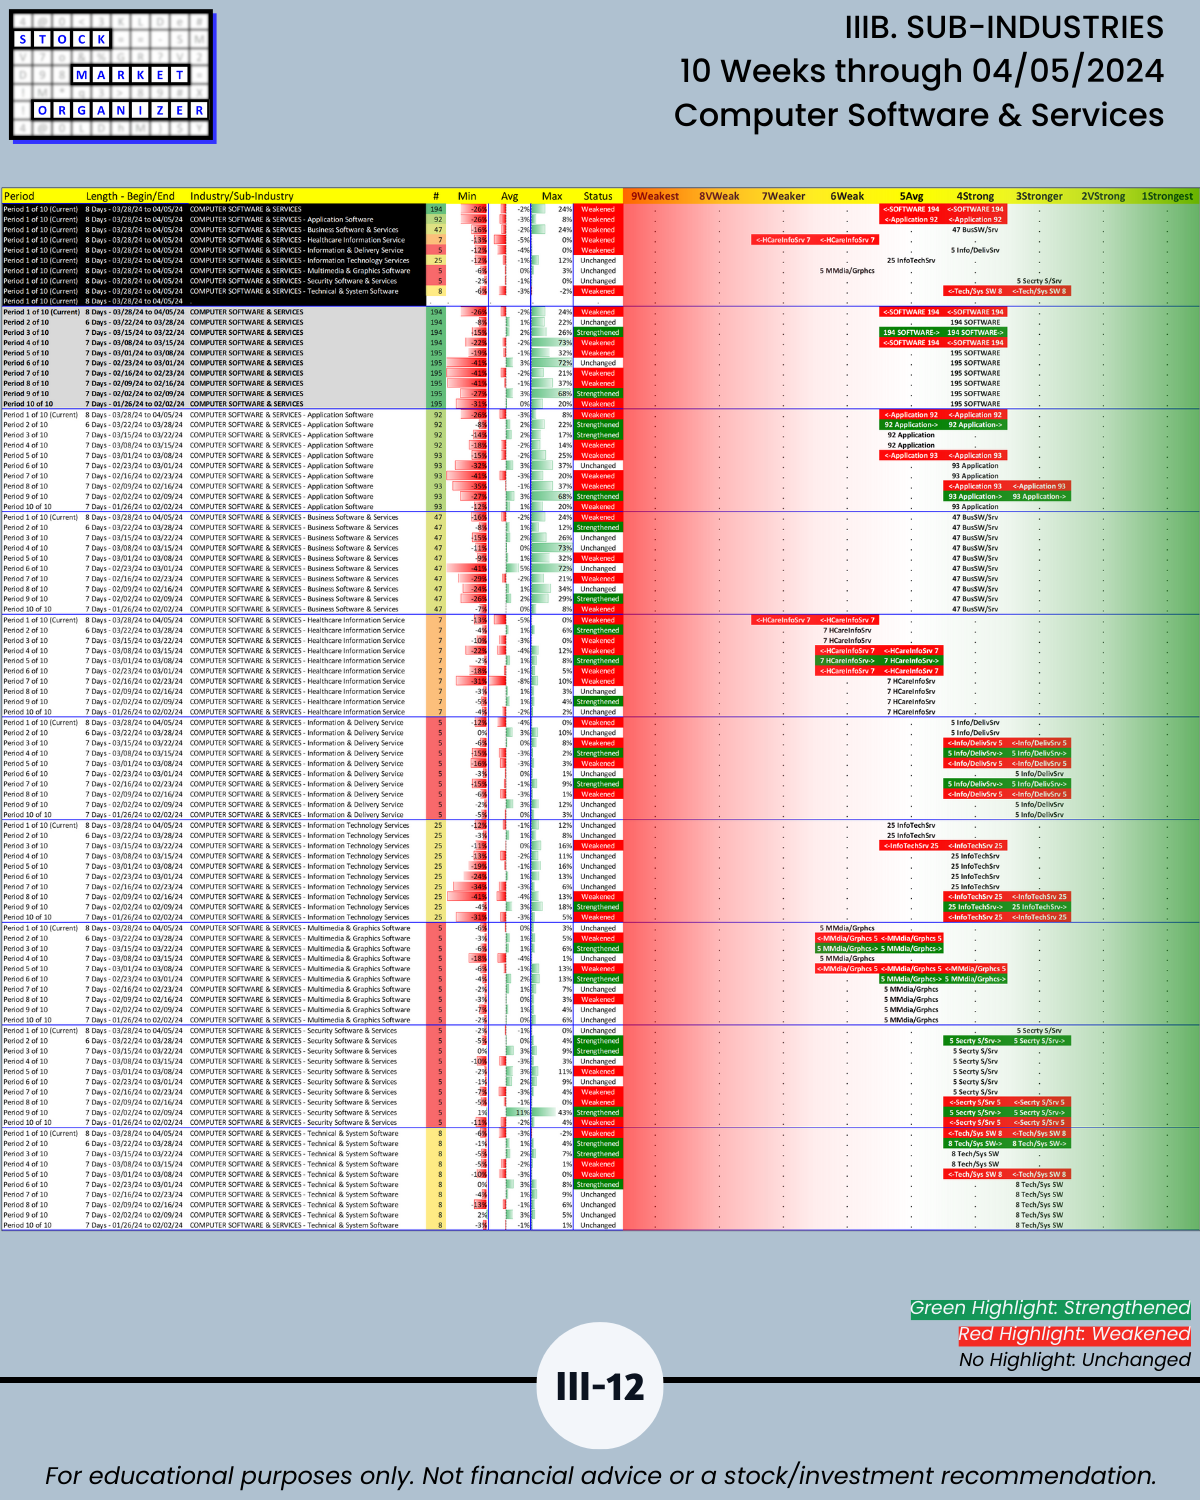
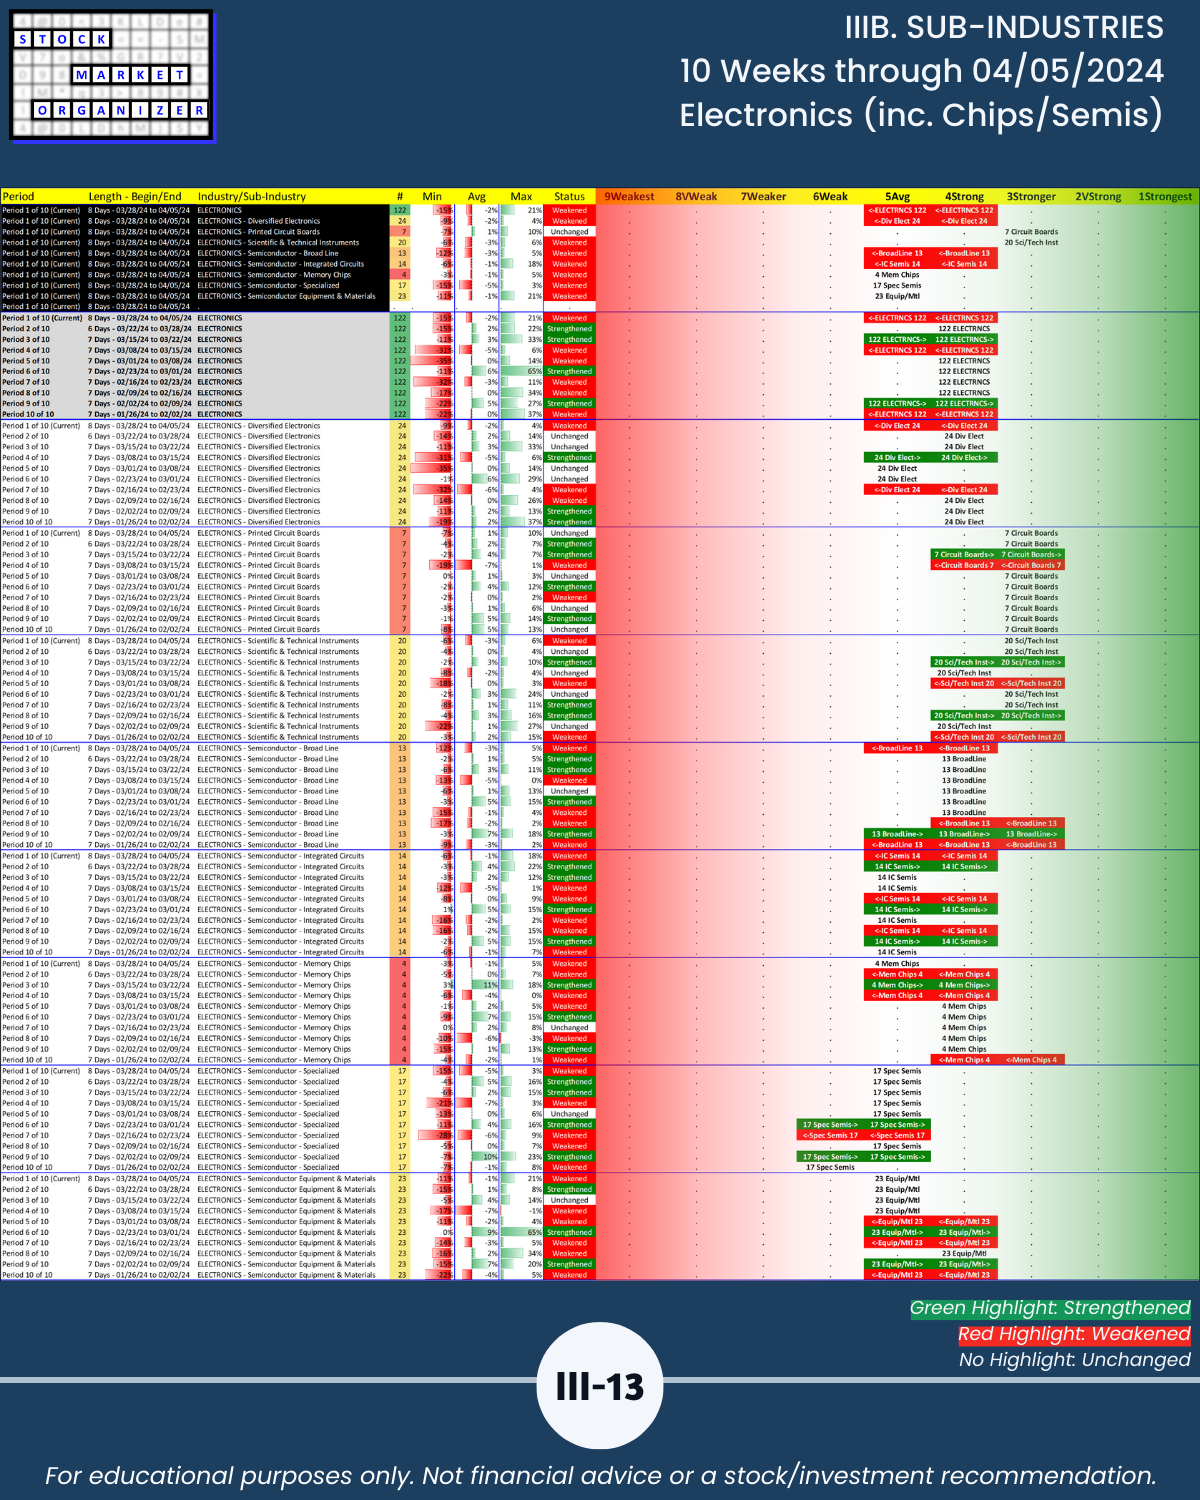
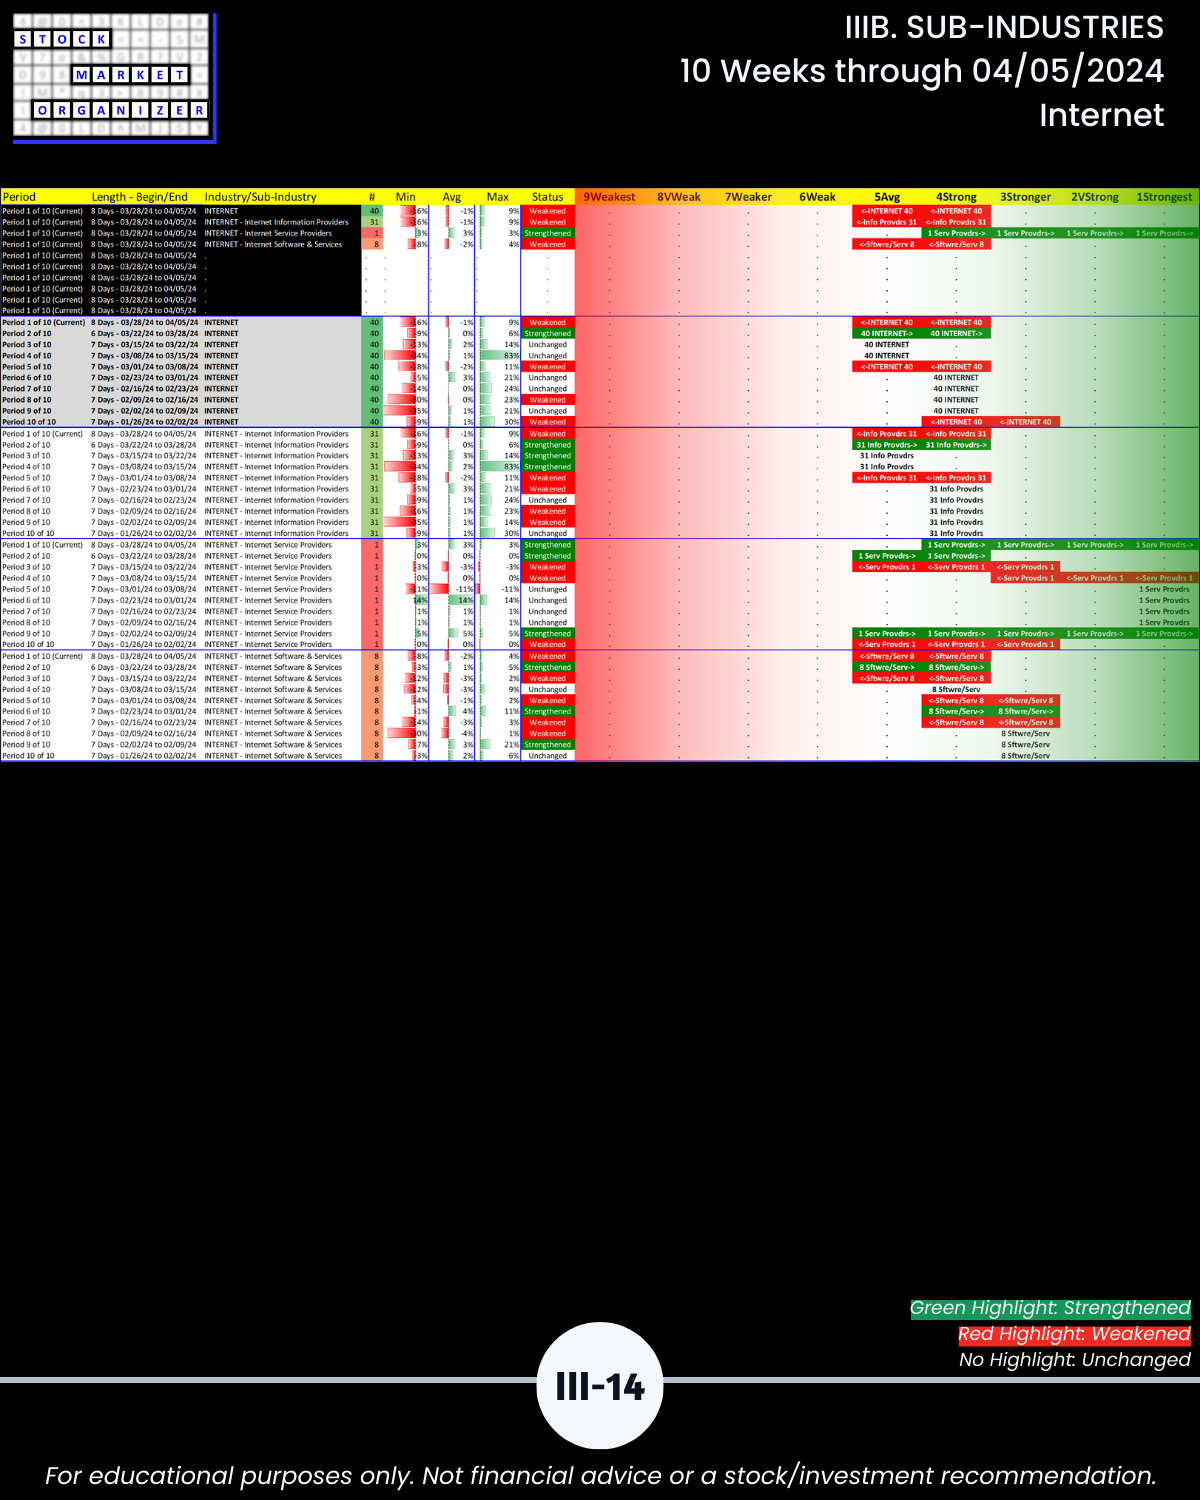
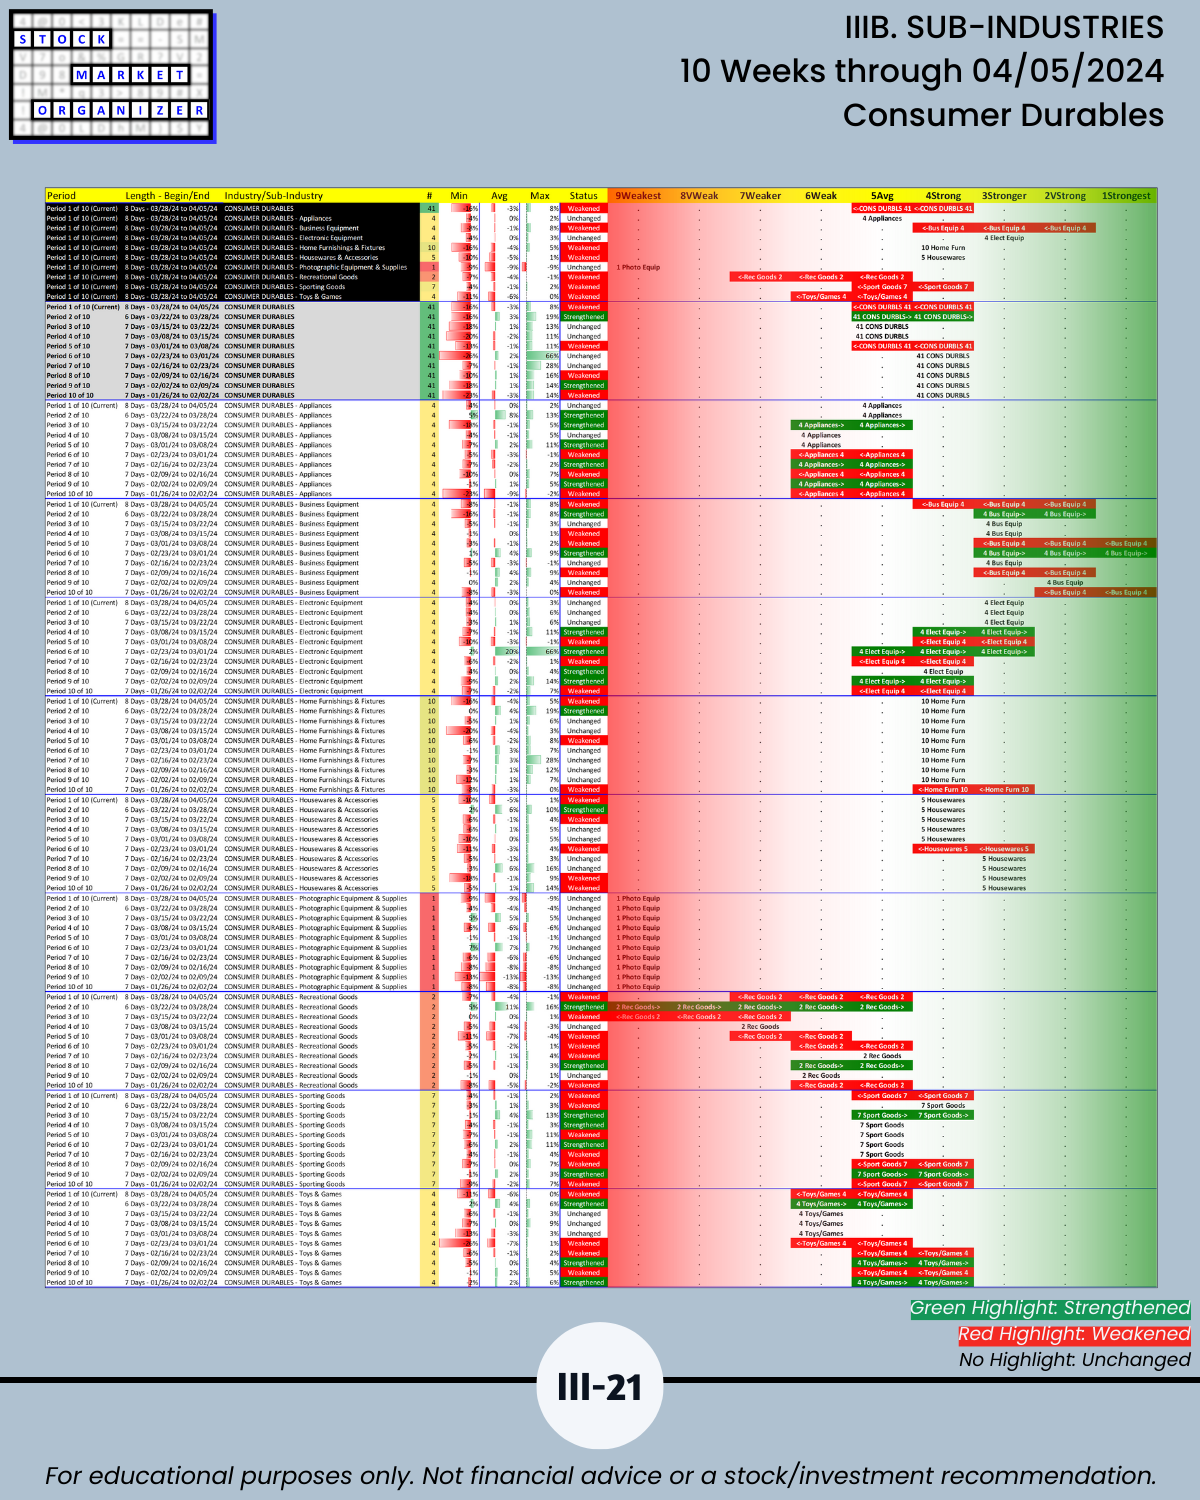
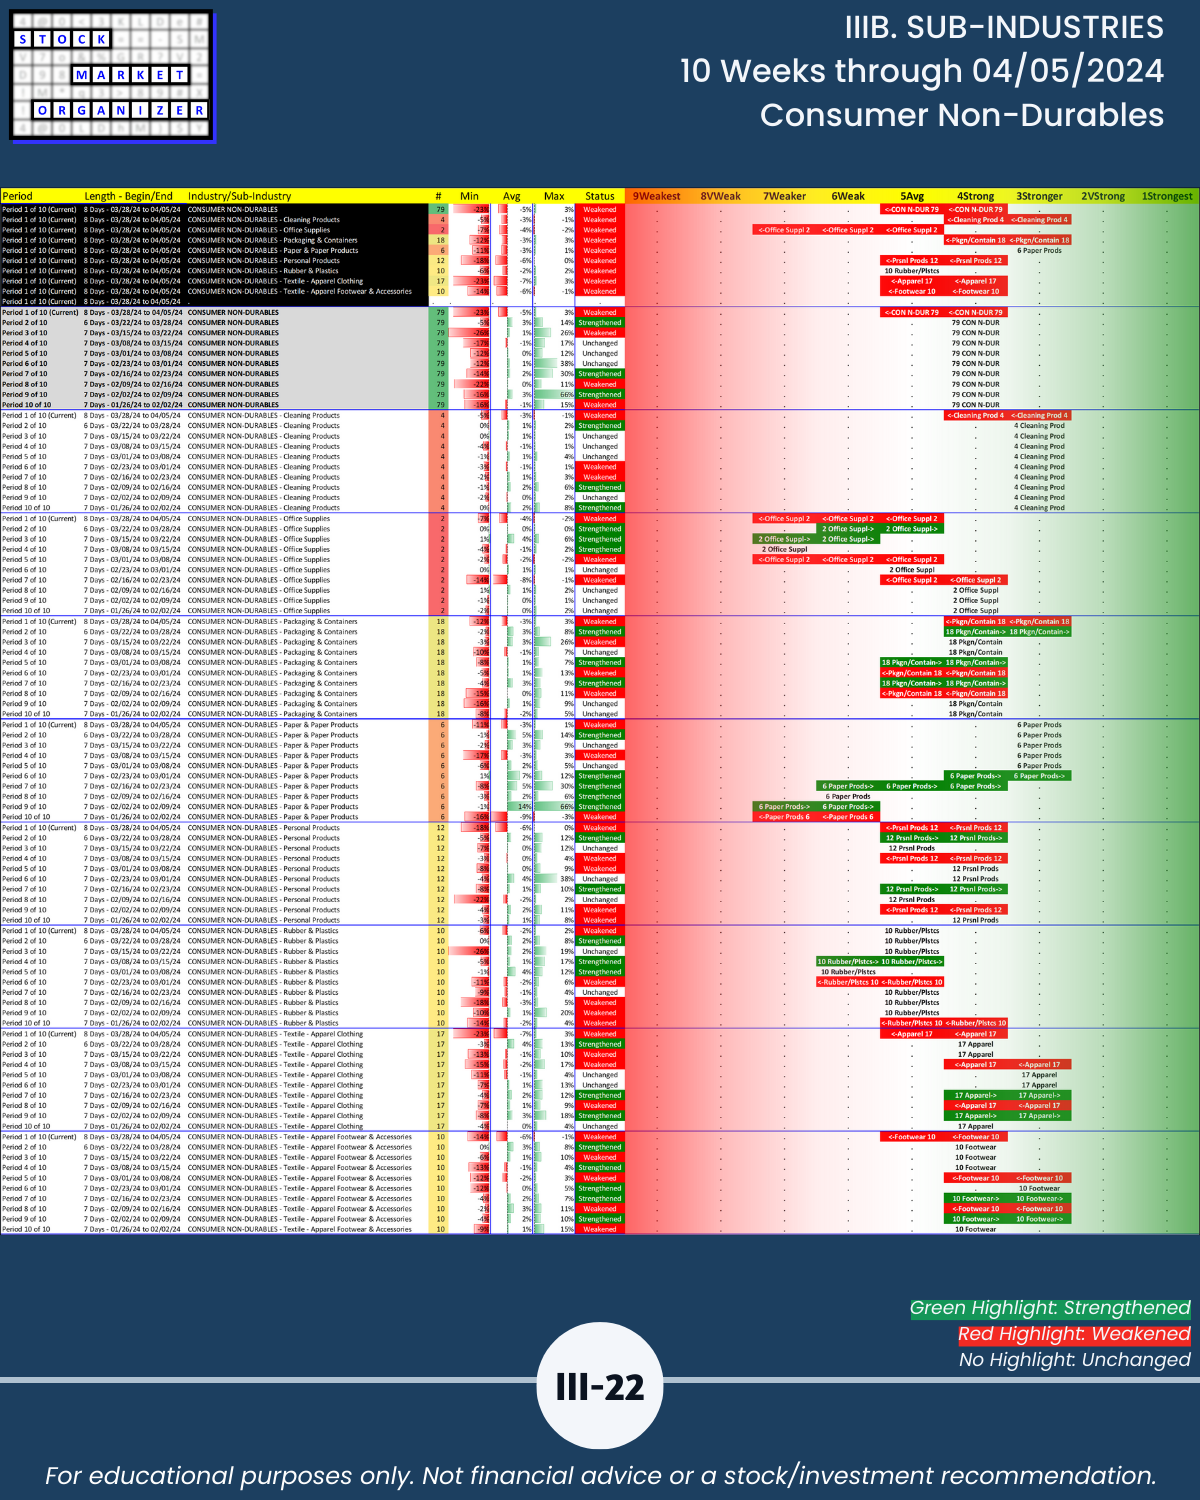
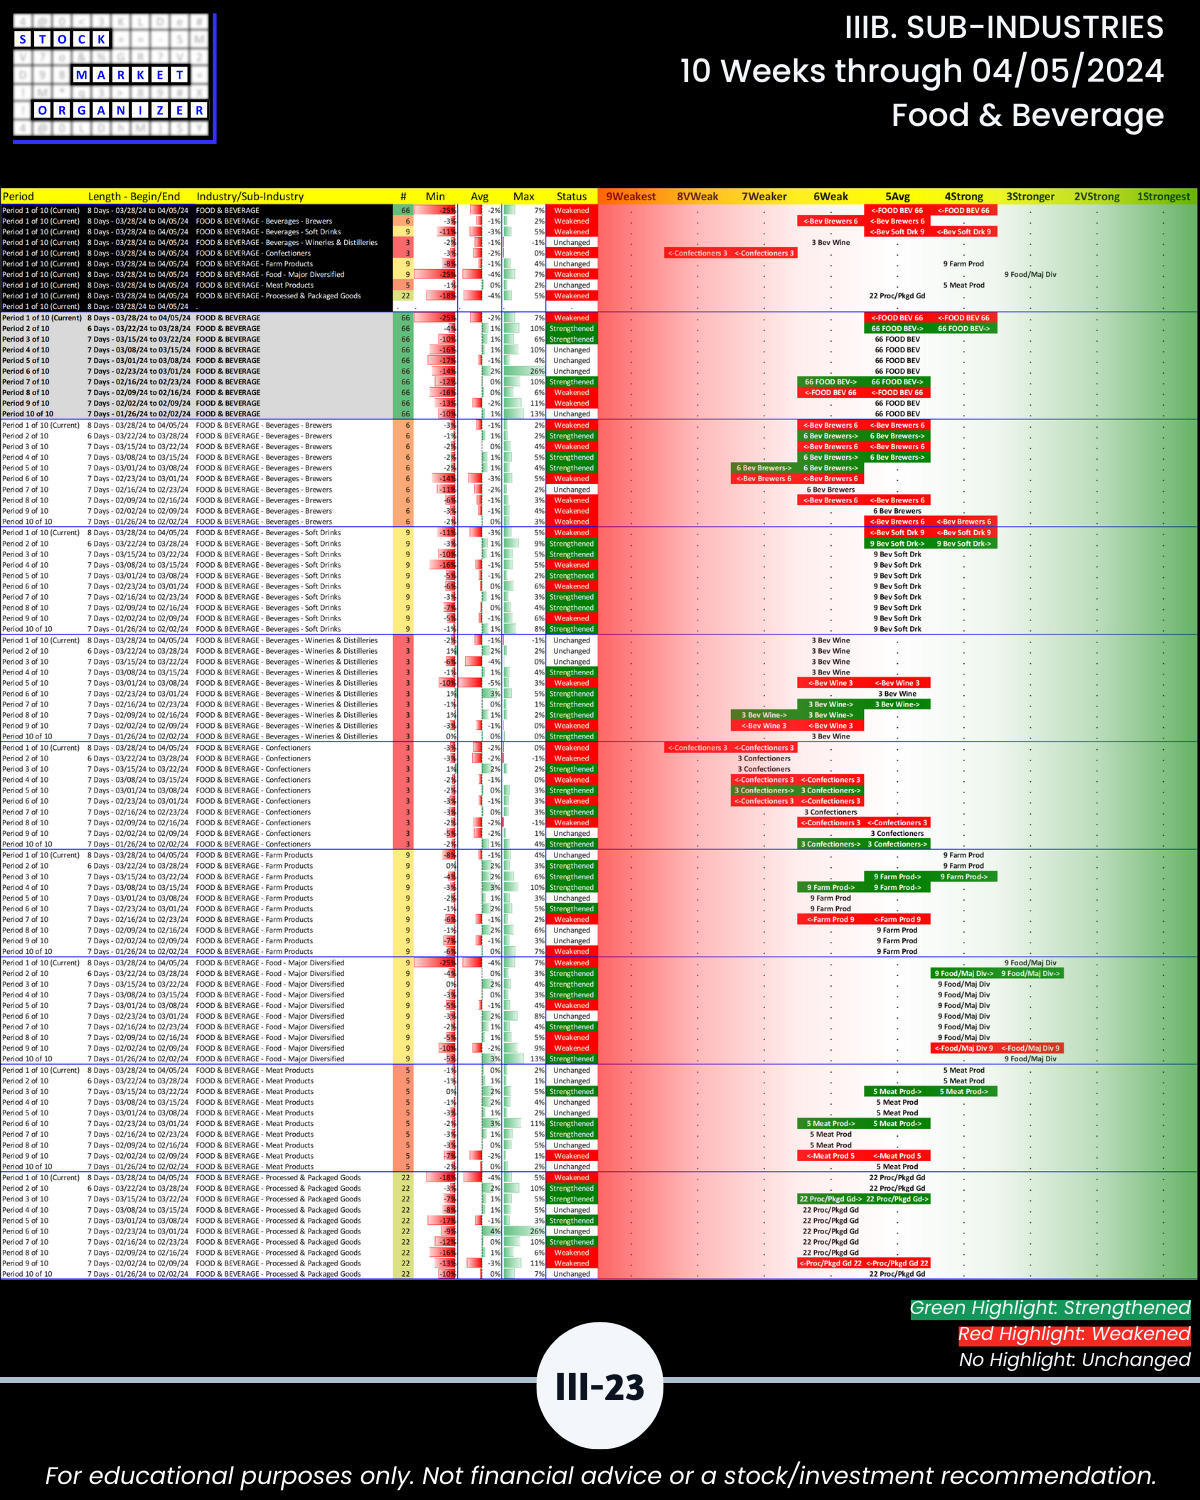
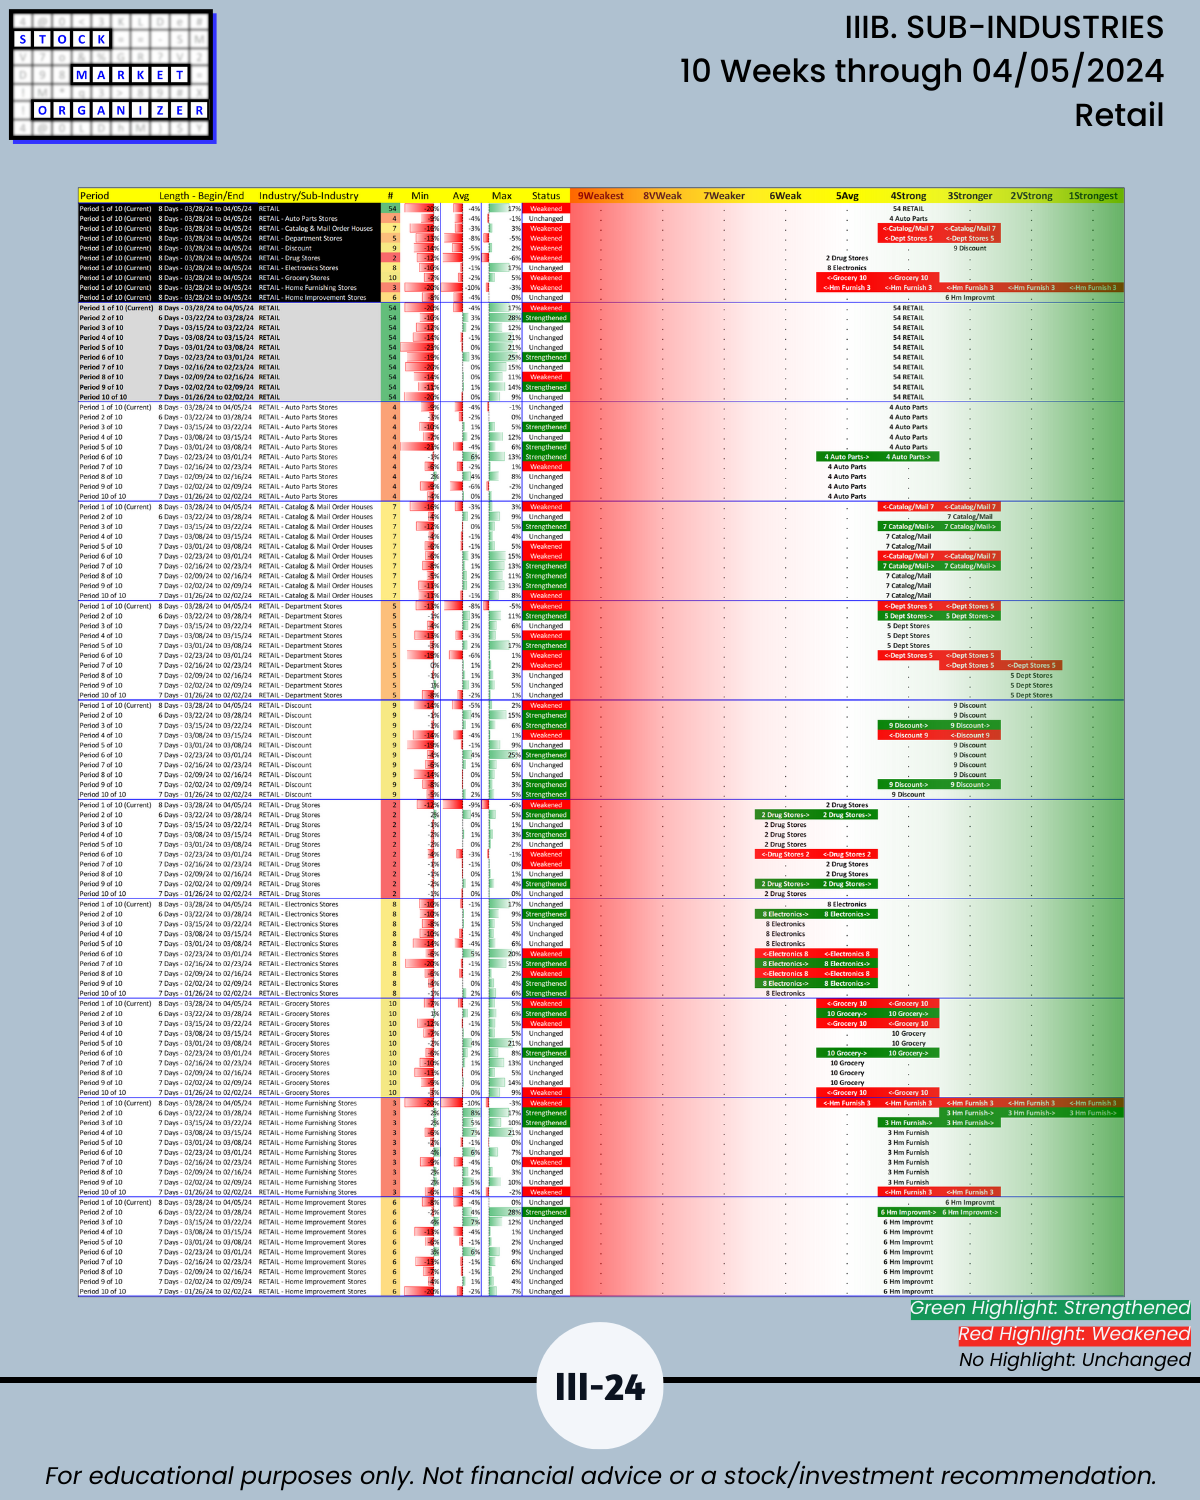
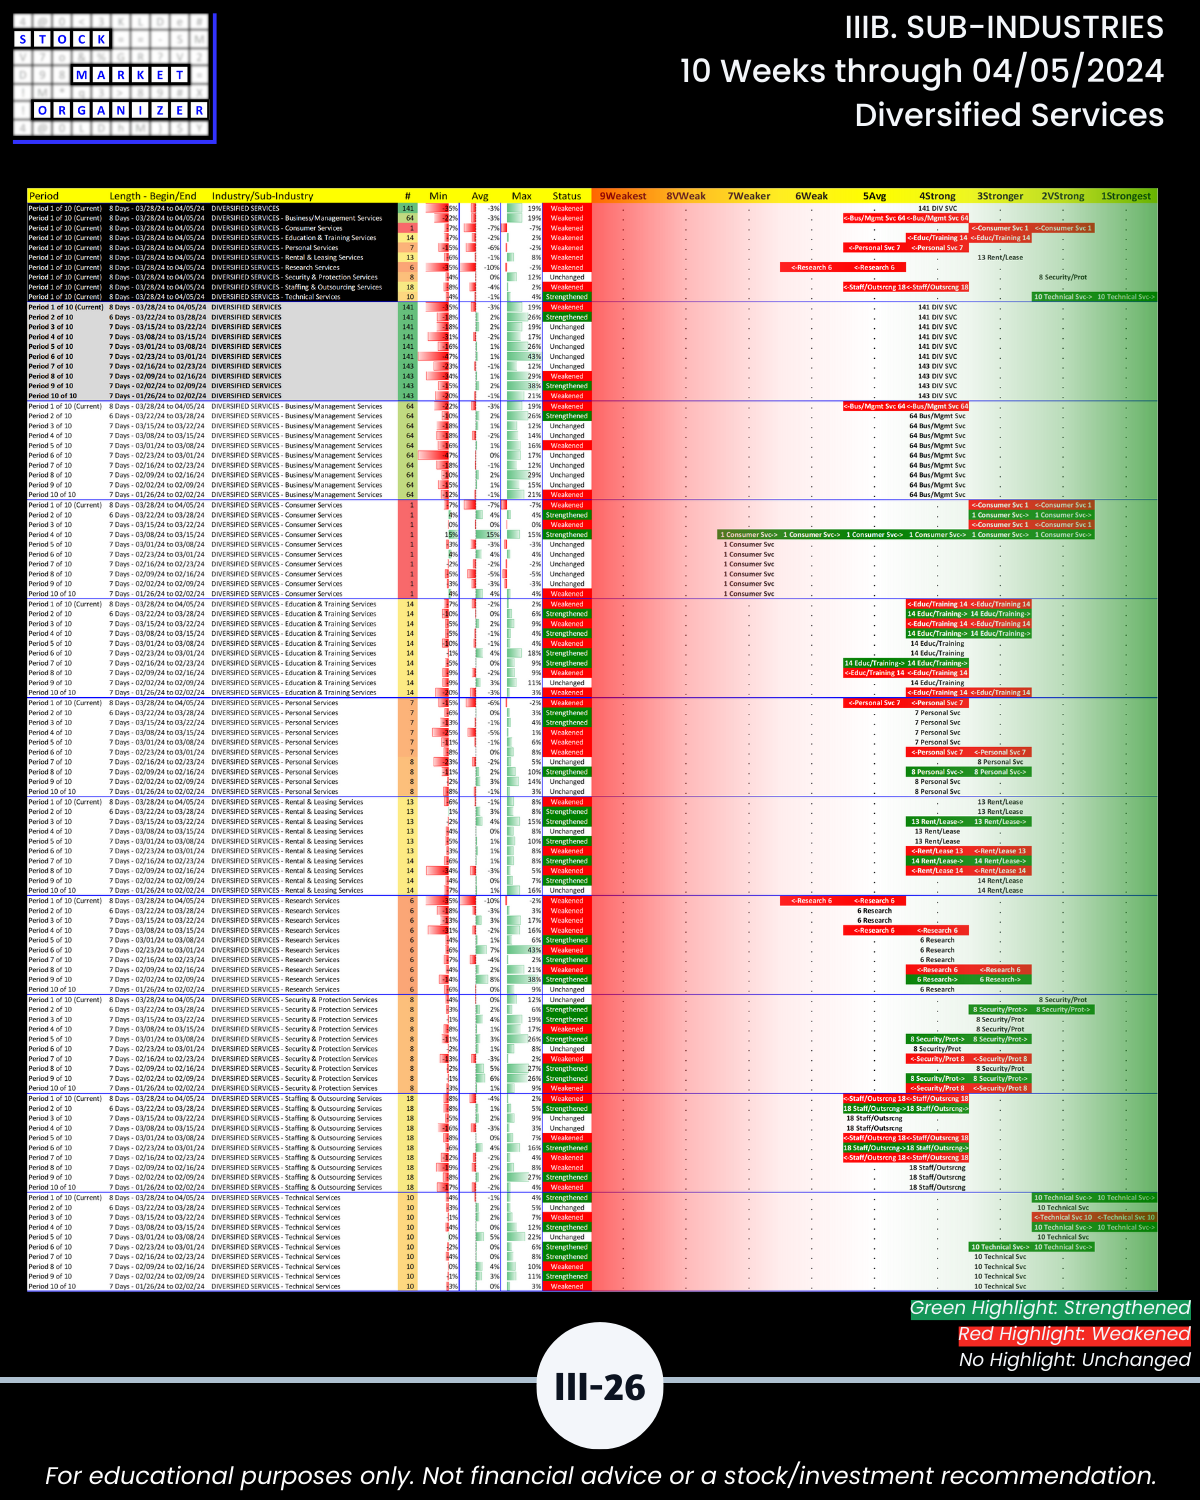
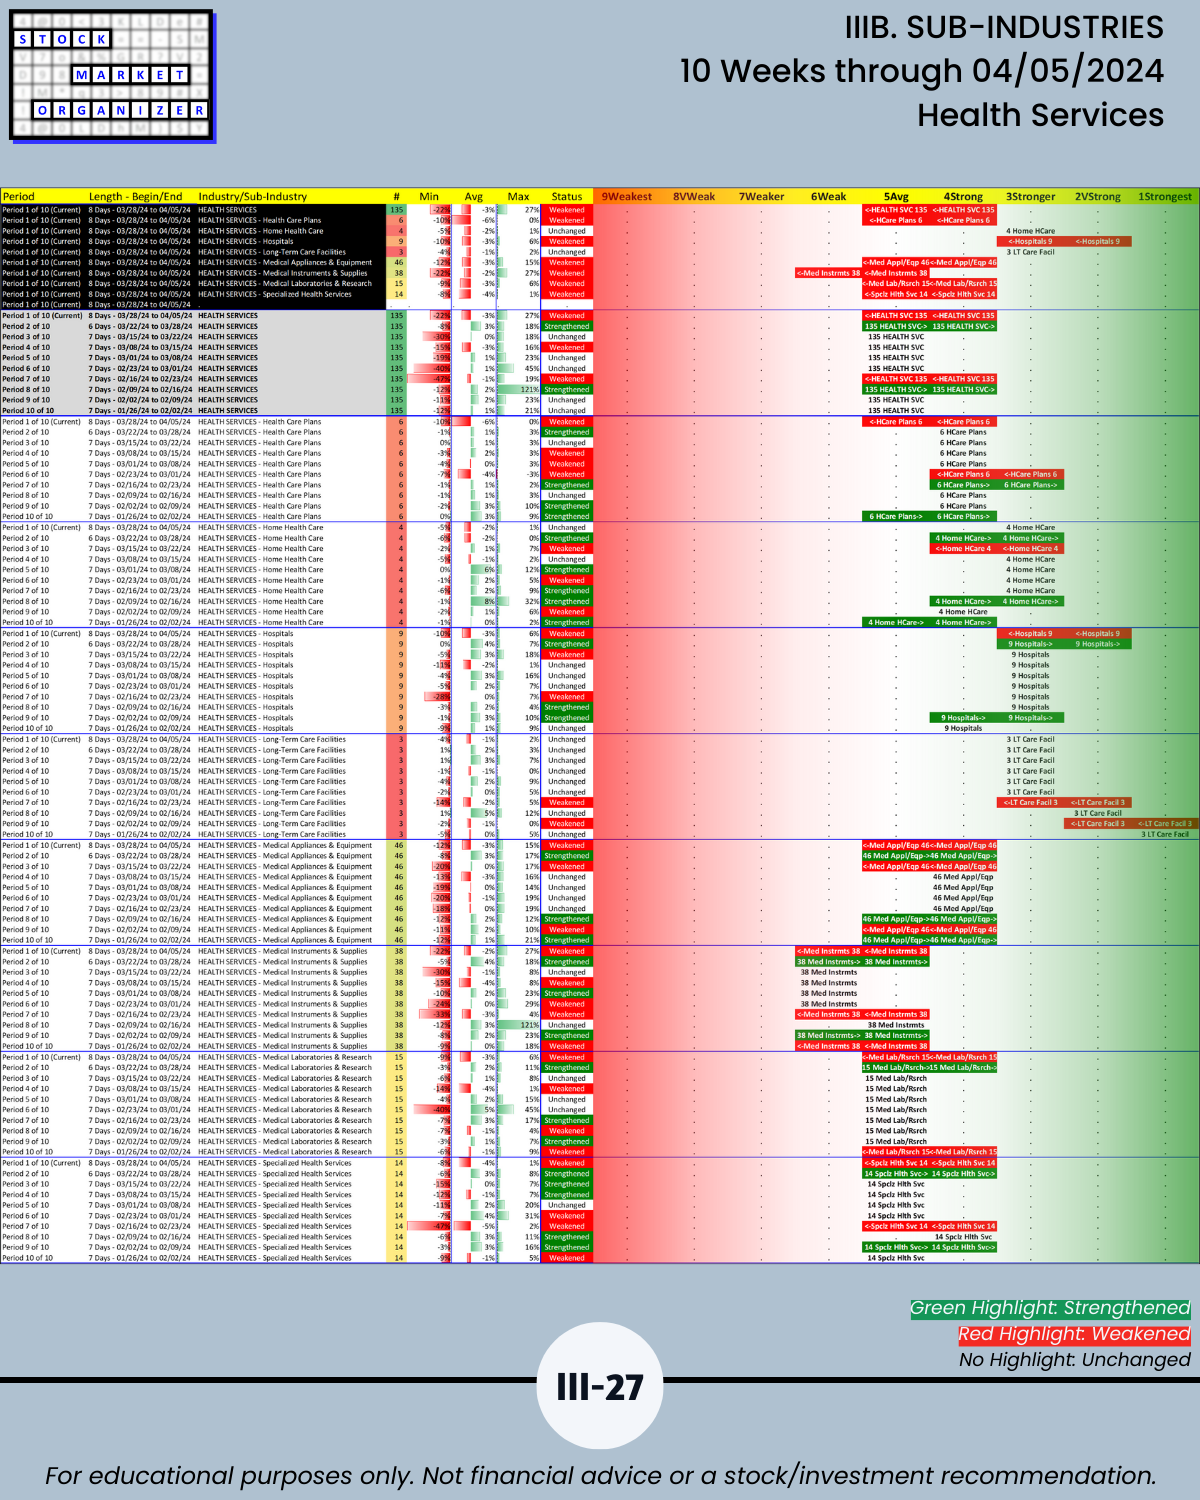
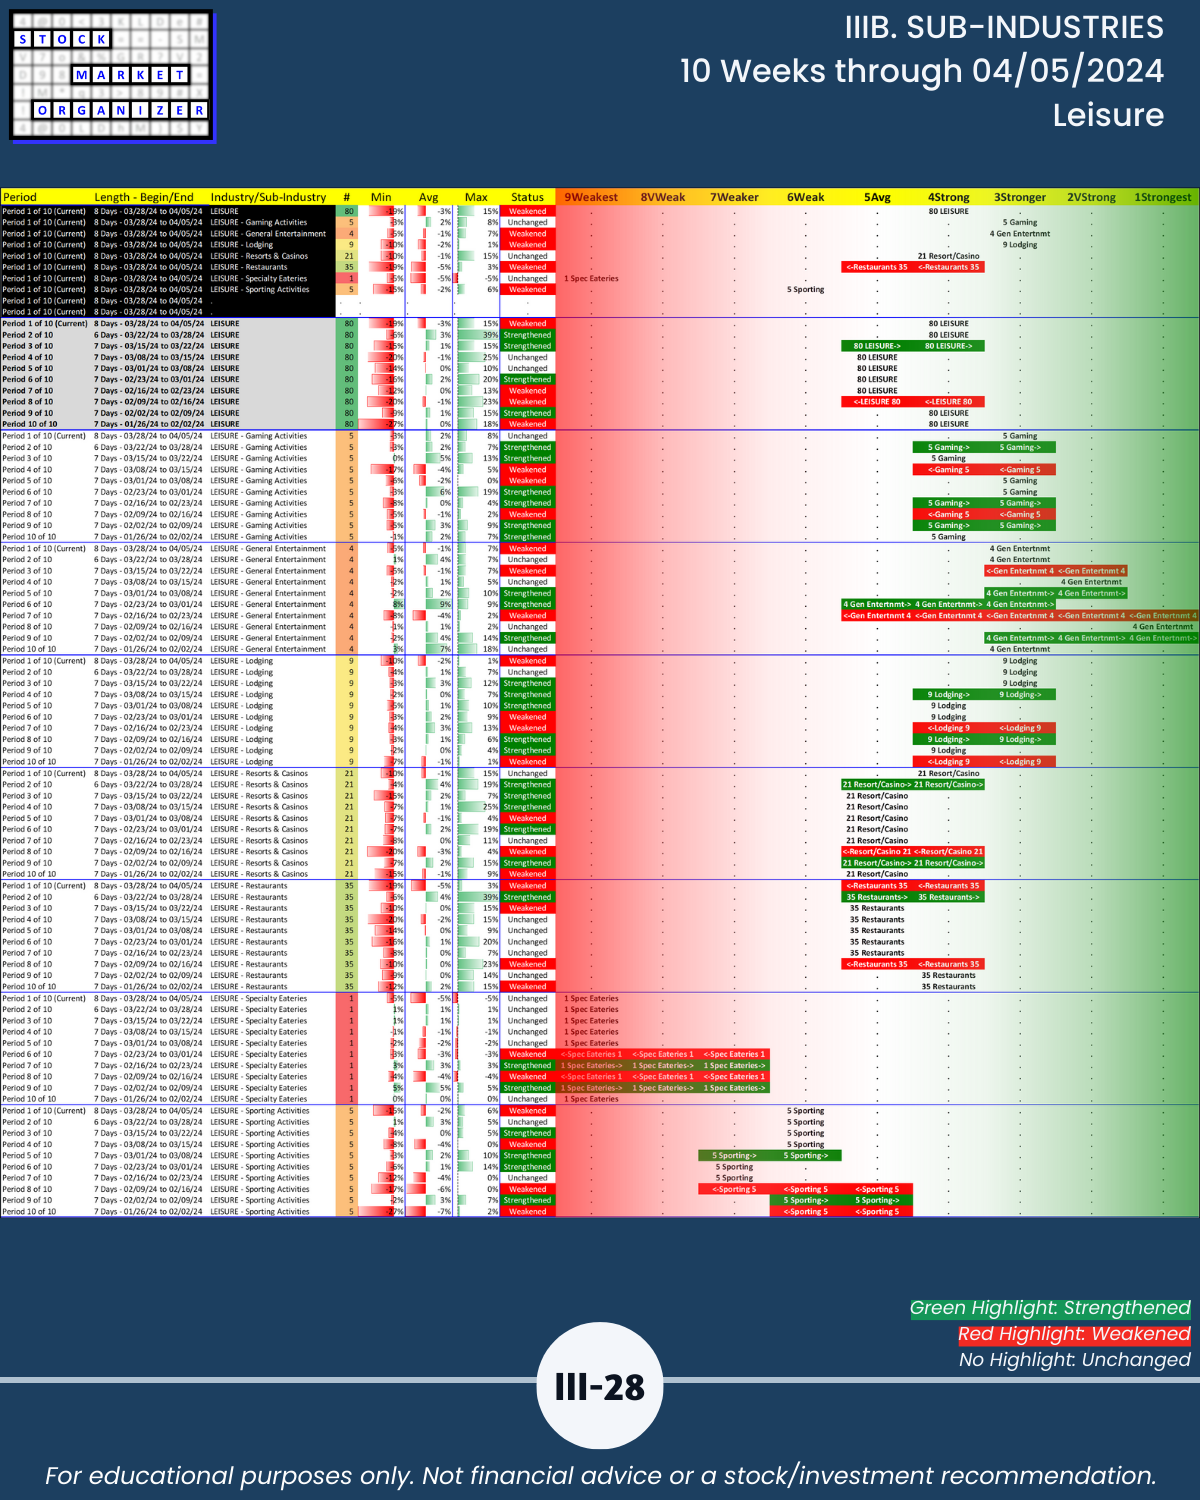
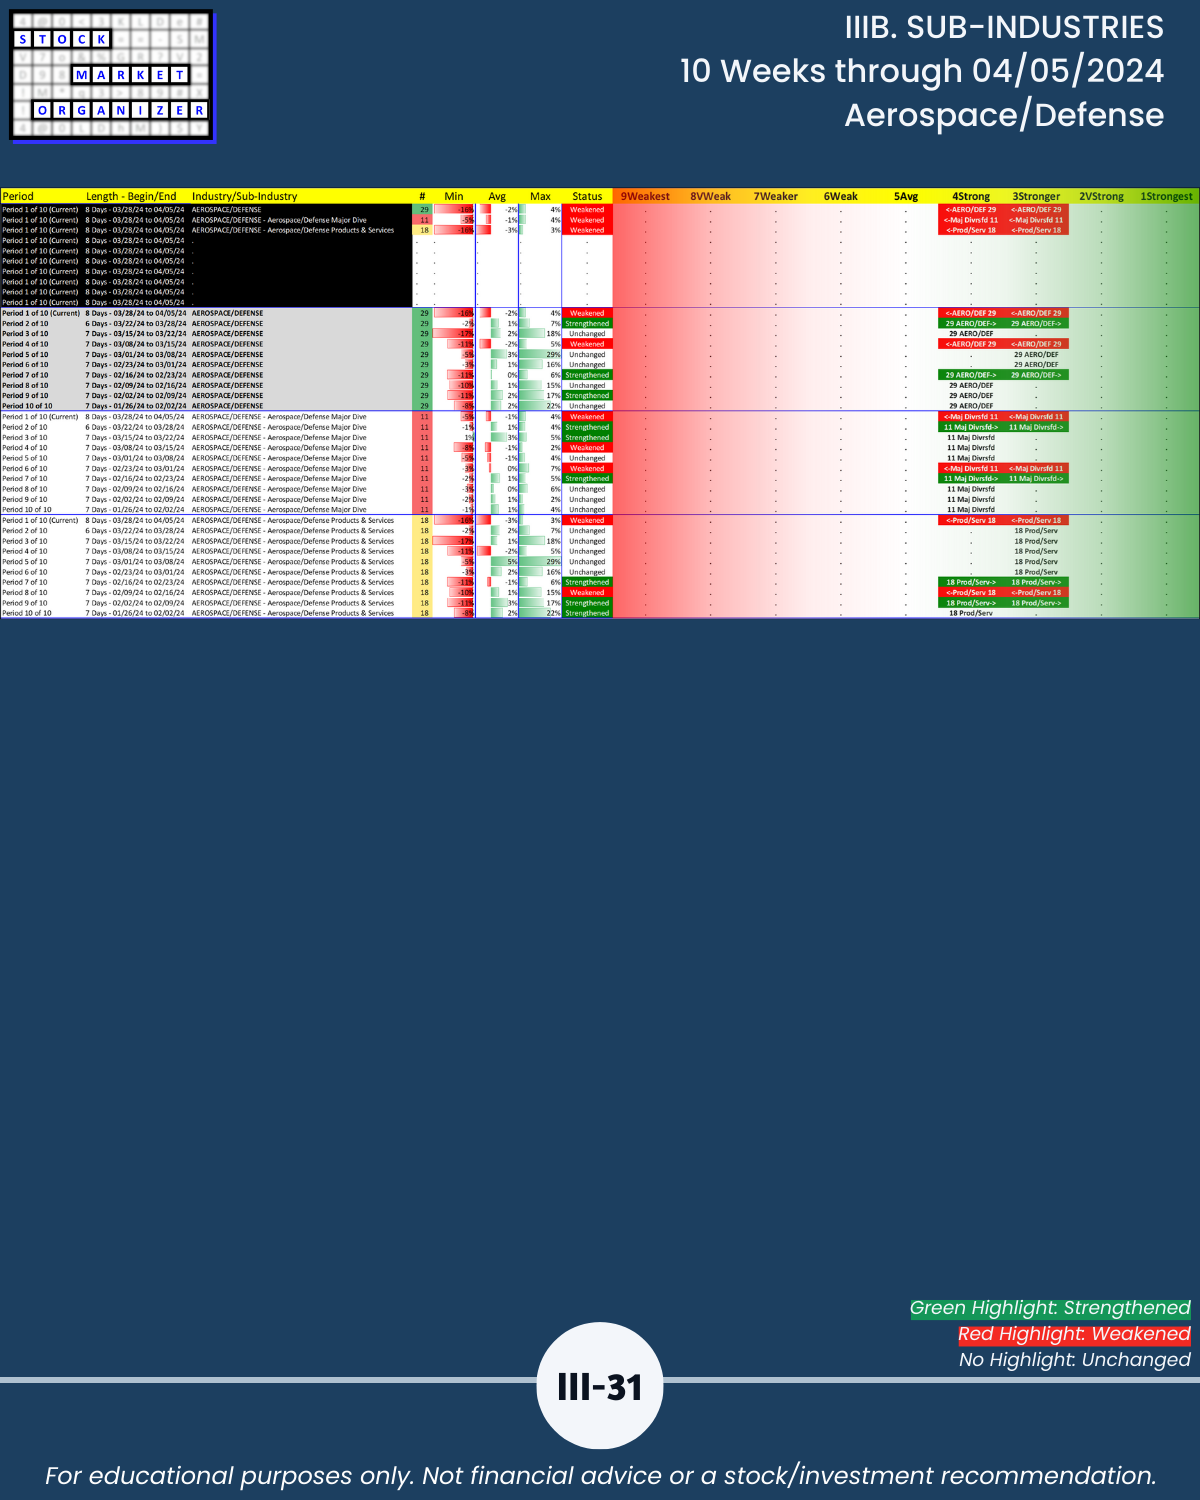
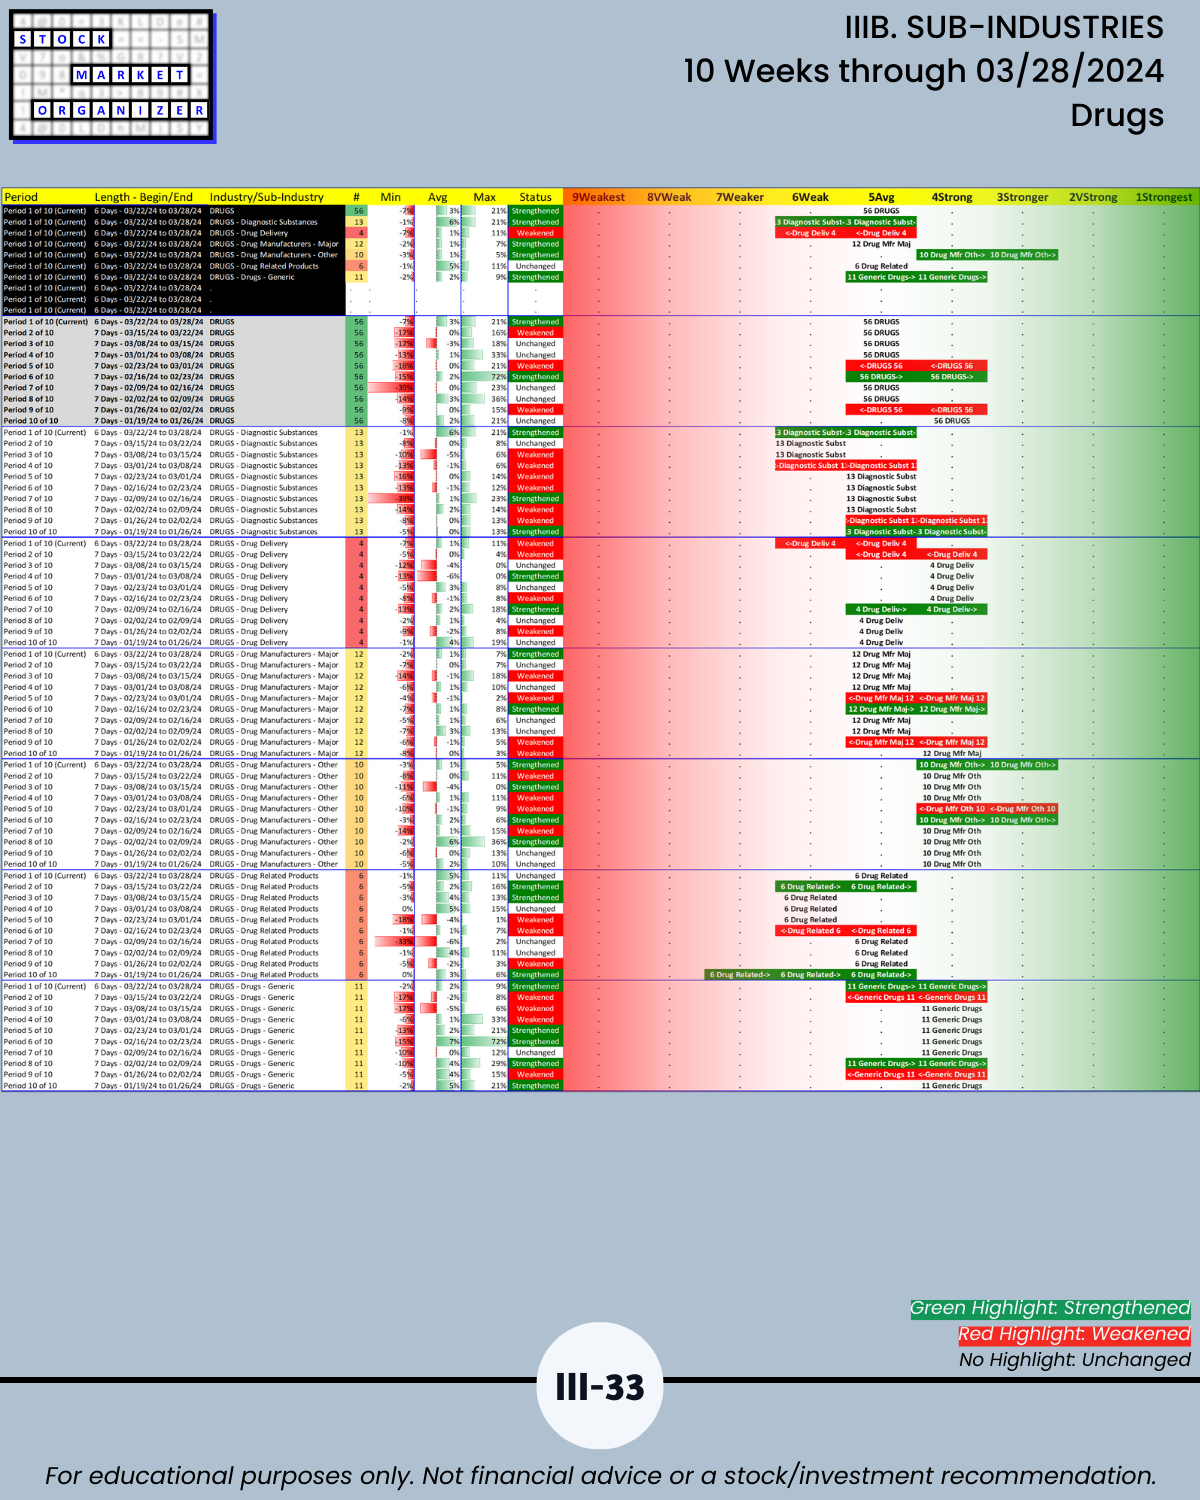
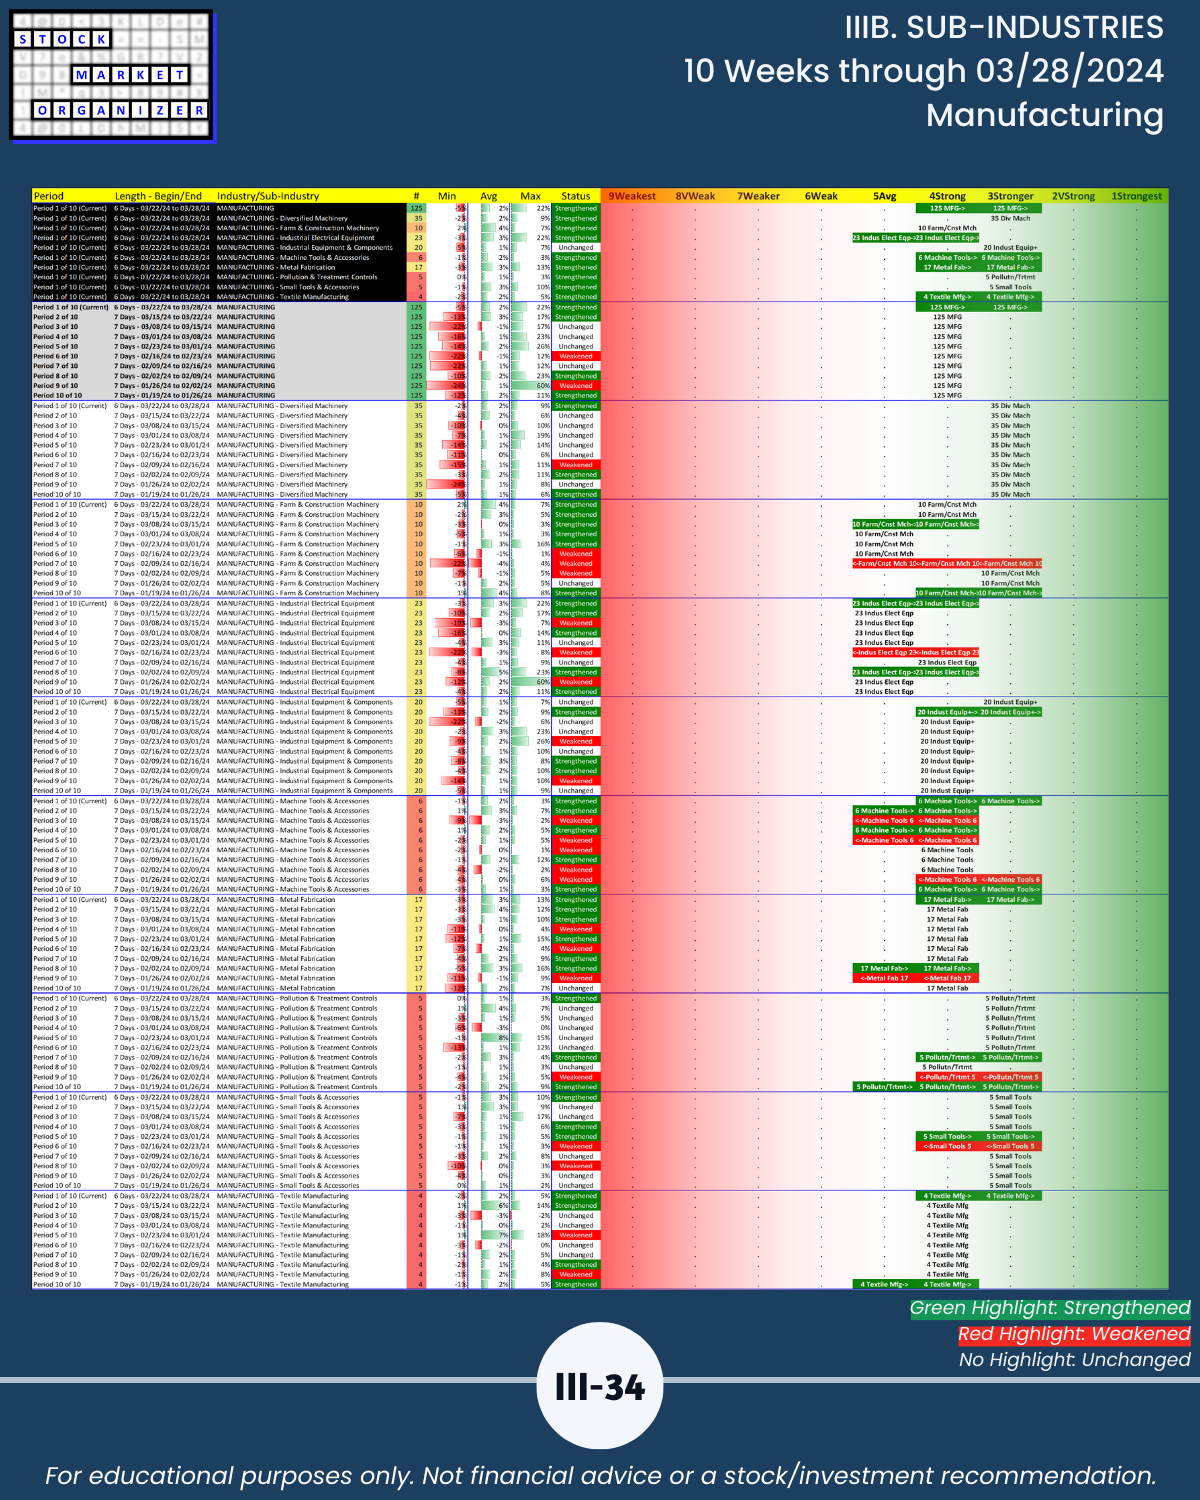
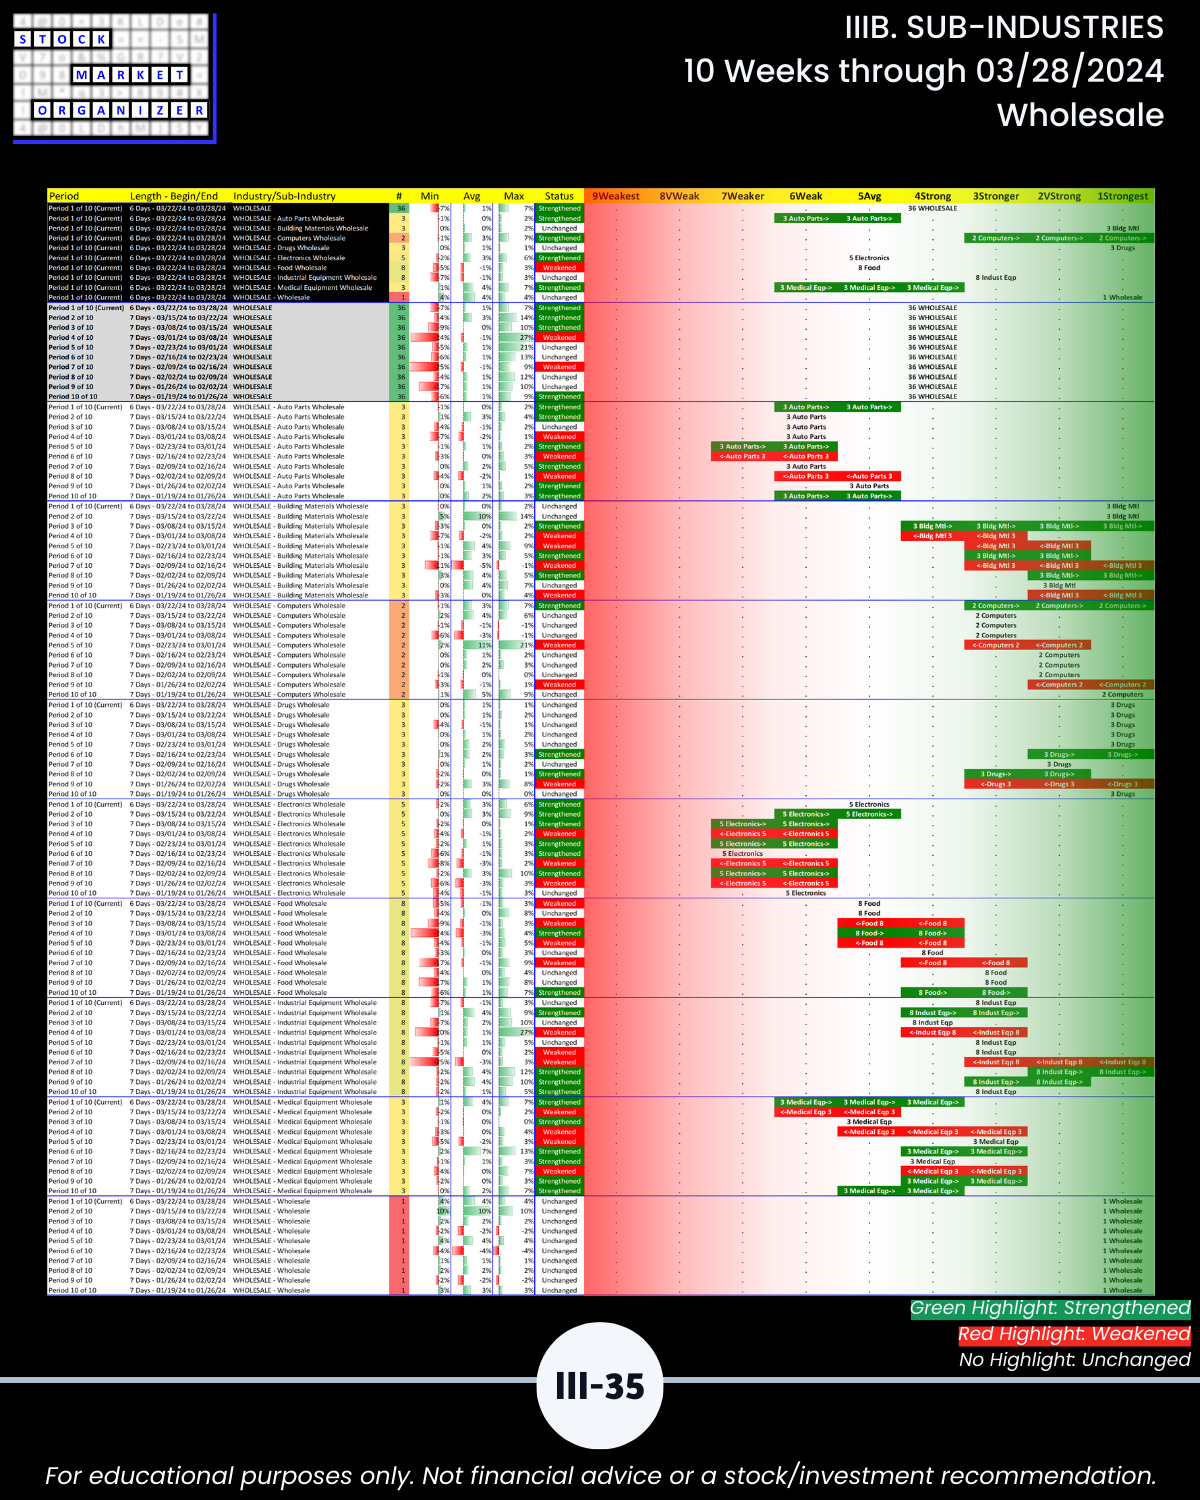
IIIB. SUB-INDUSTRIES 10-Week Strengthening/Weakening
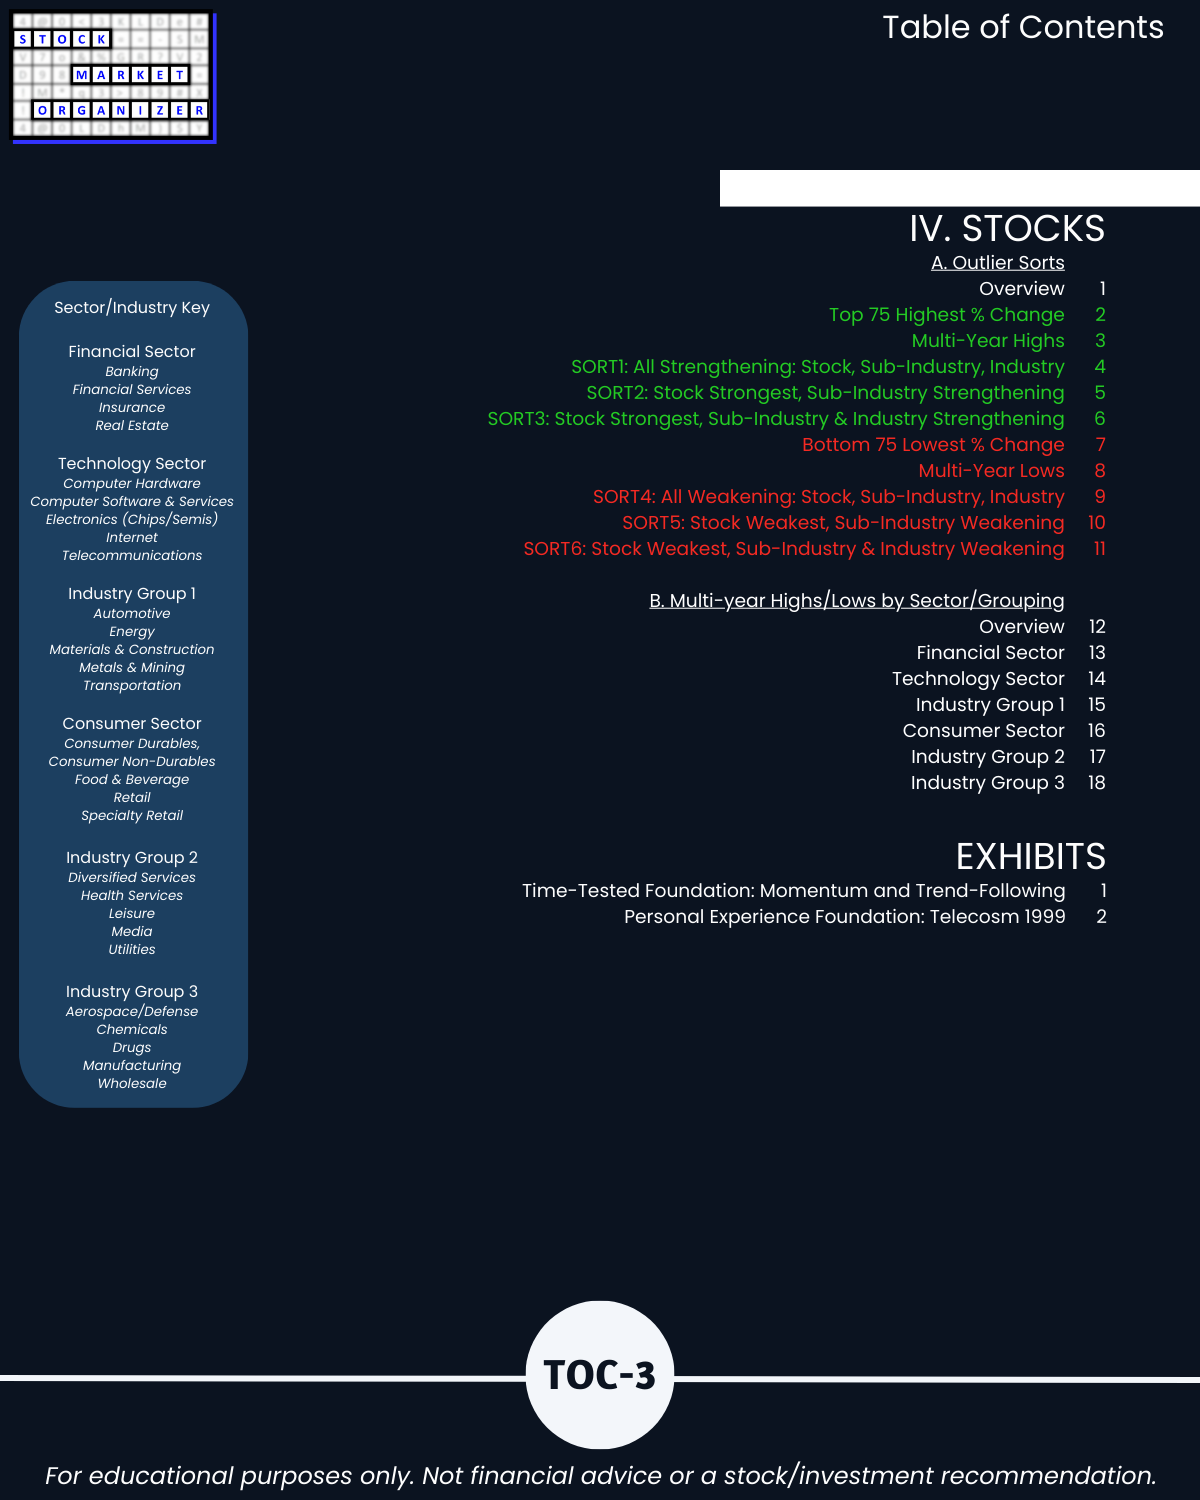
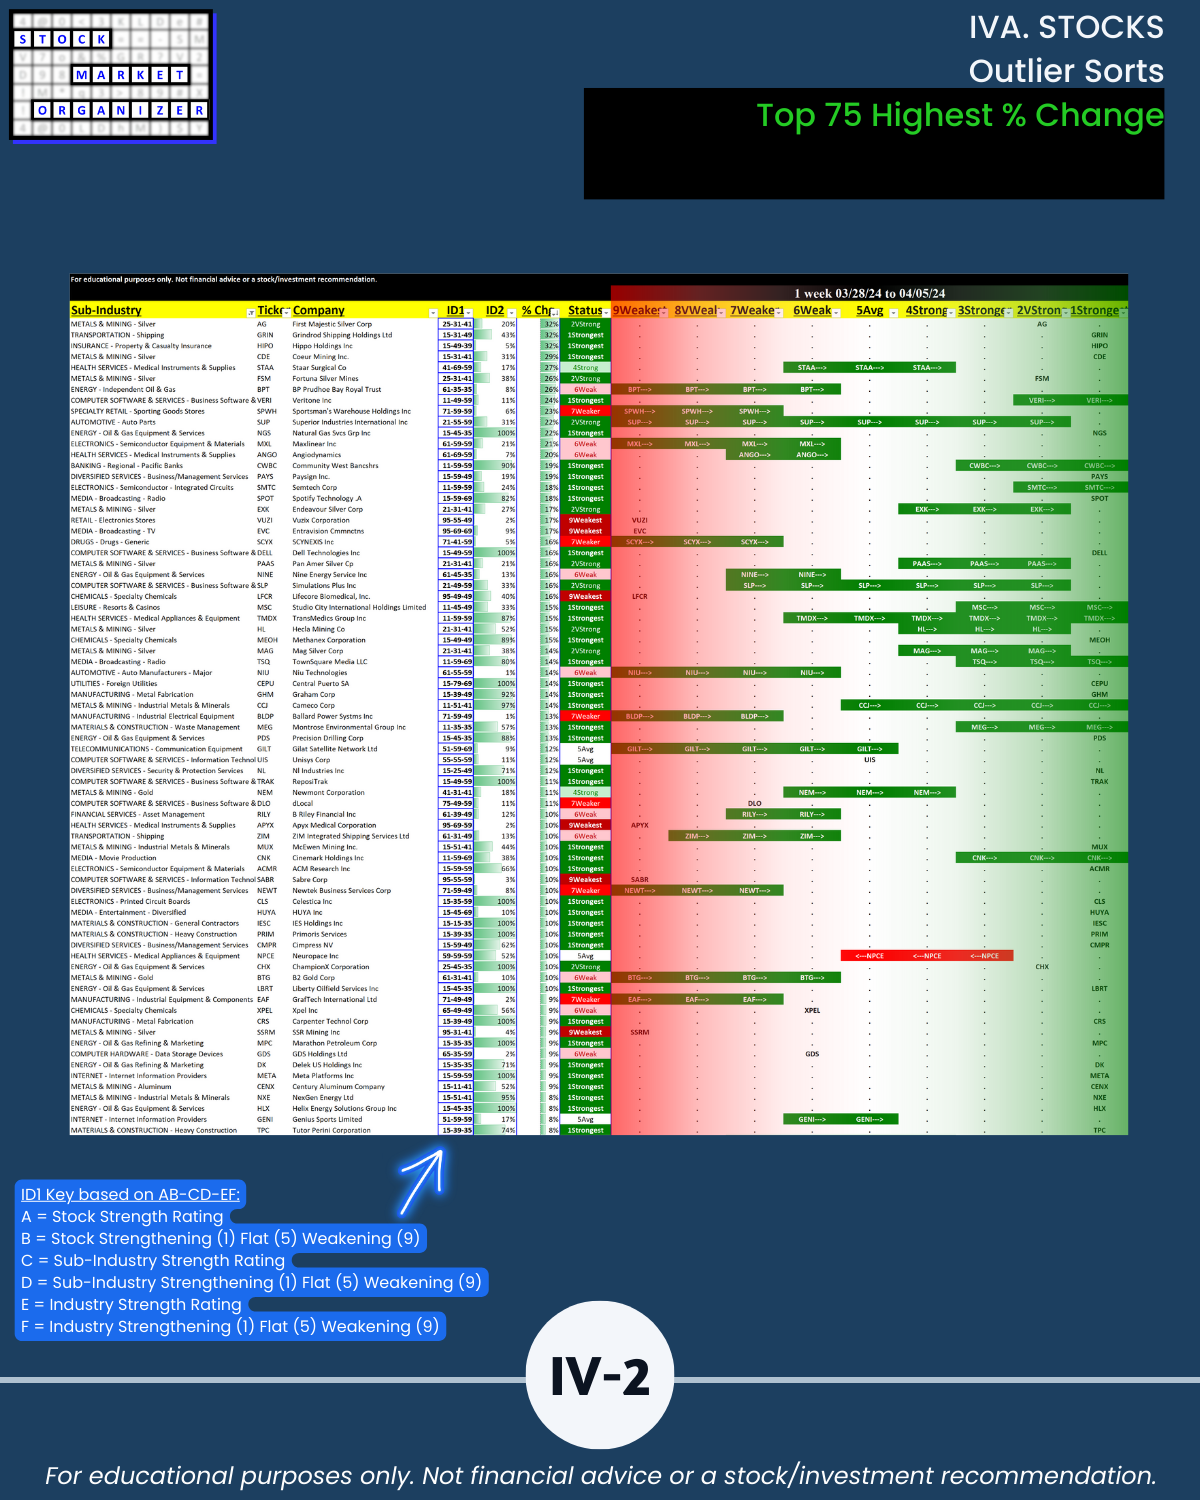
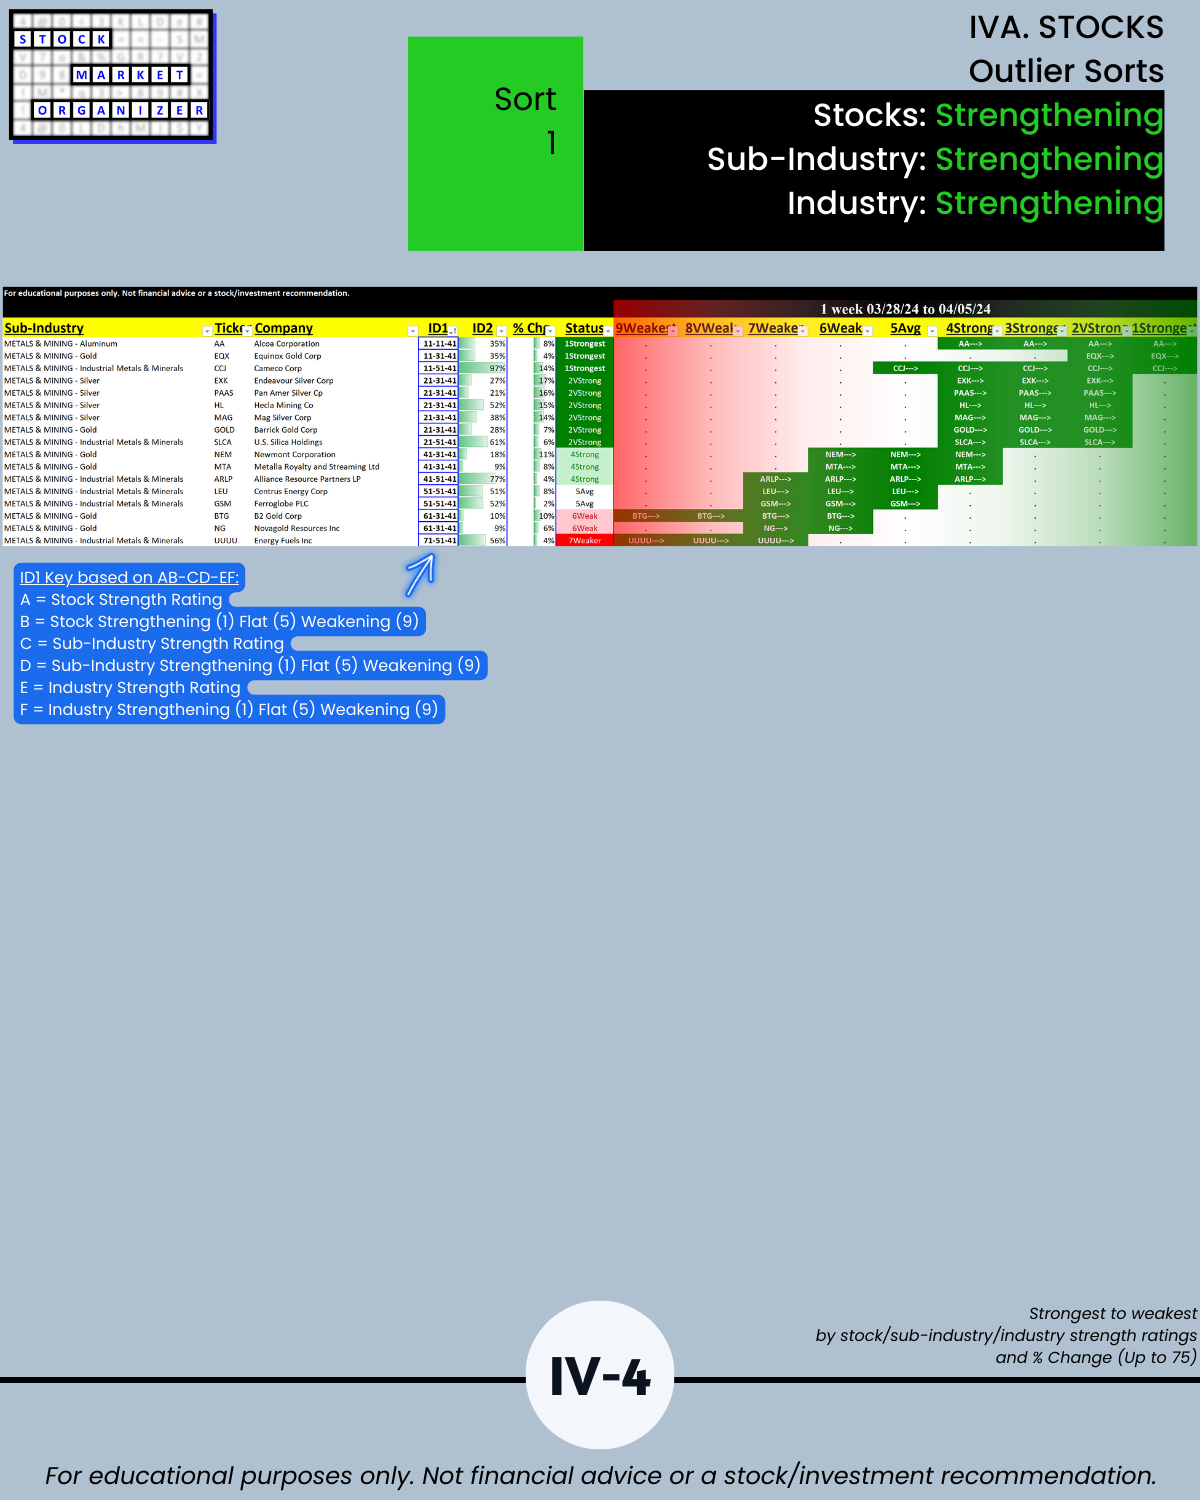
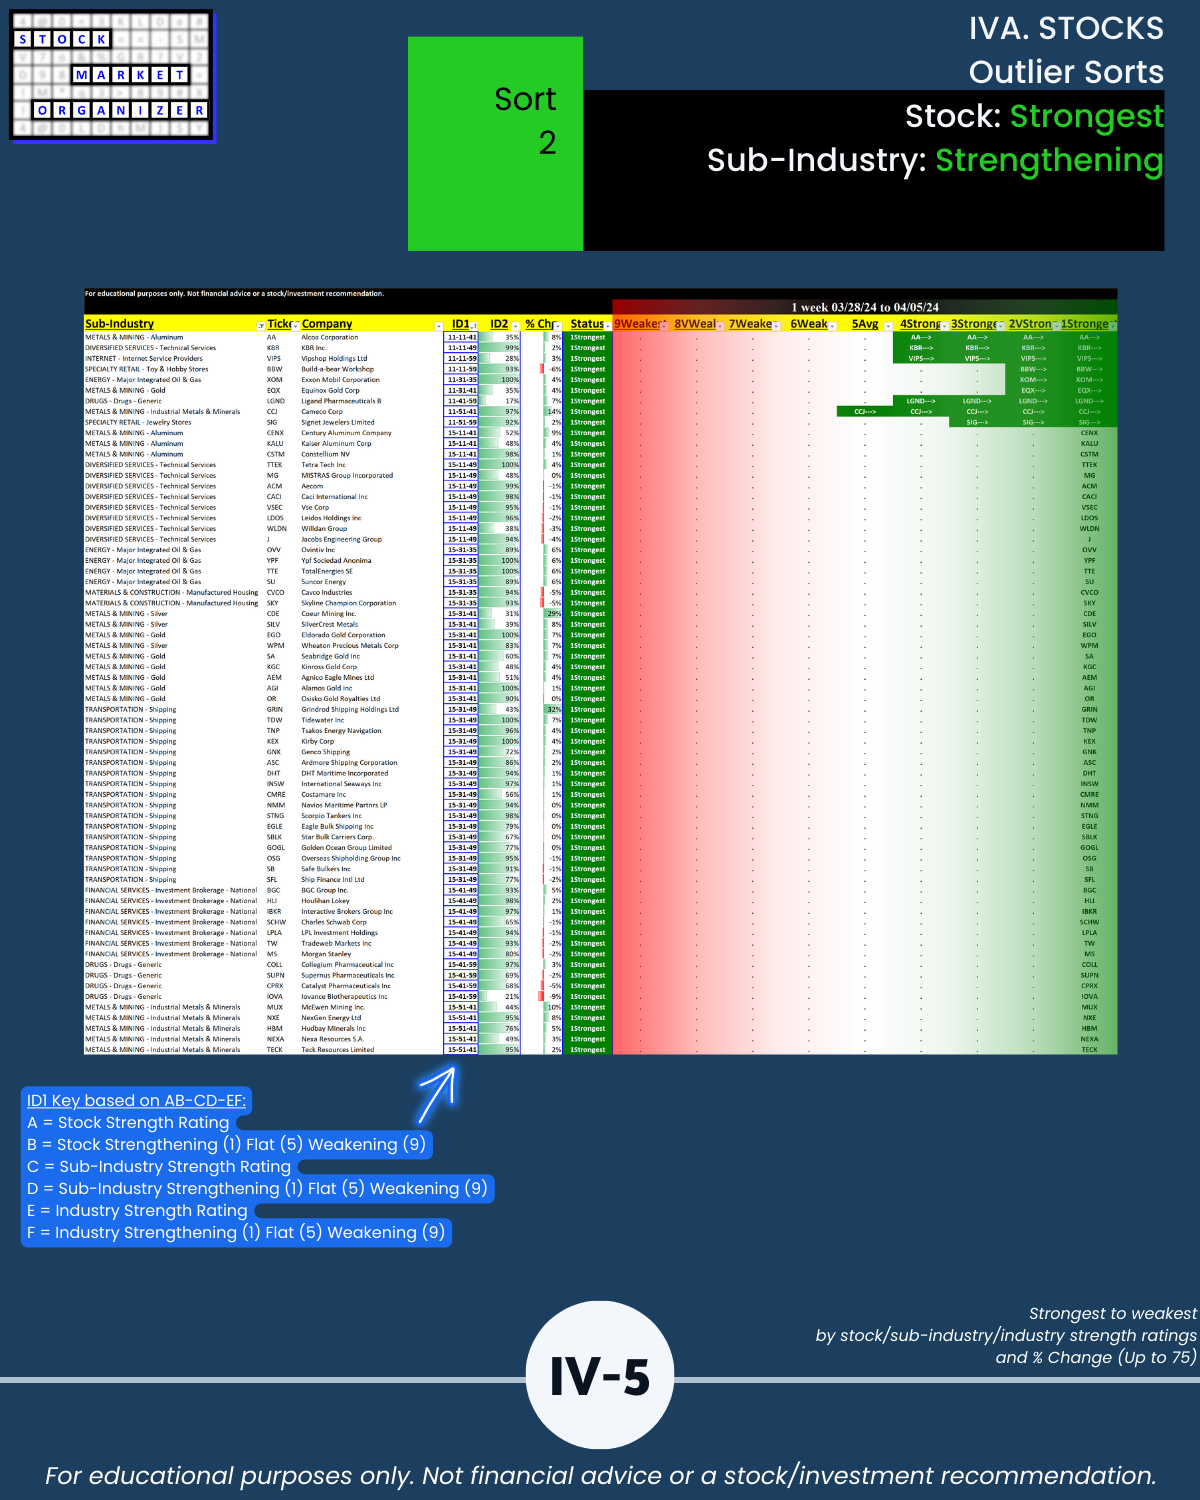
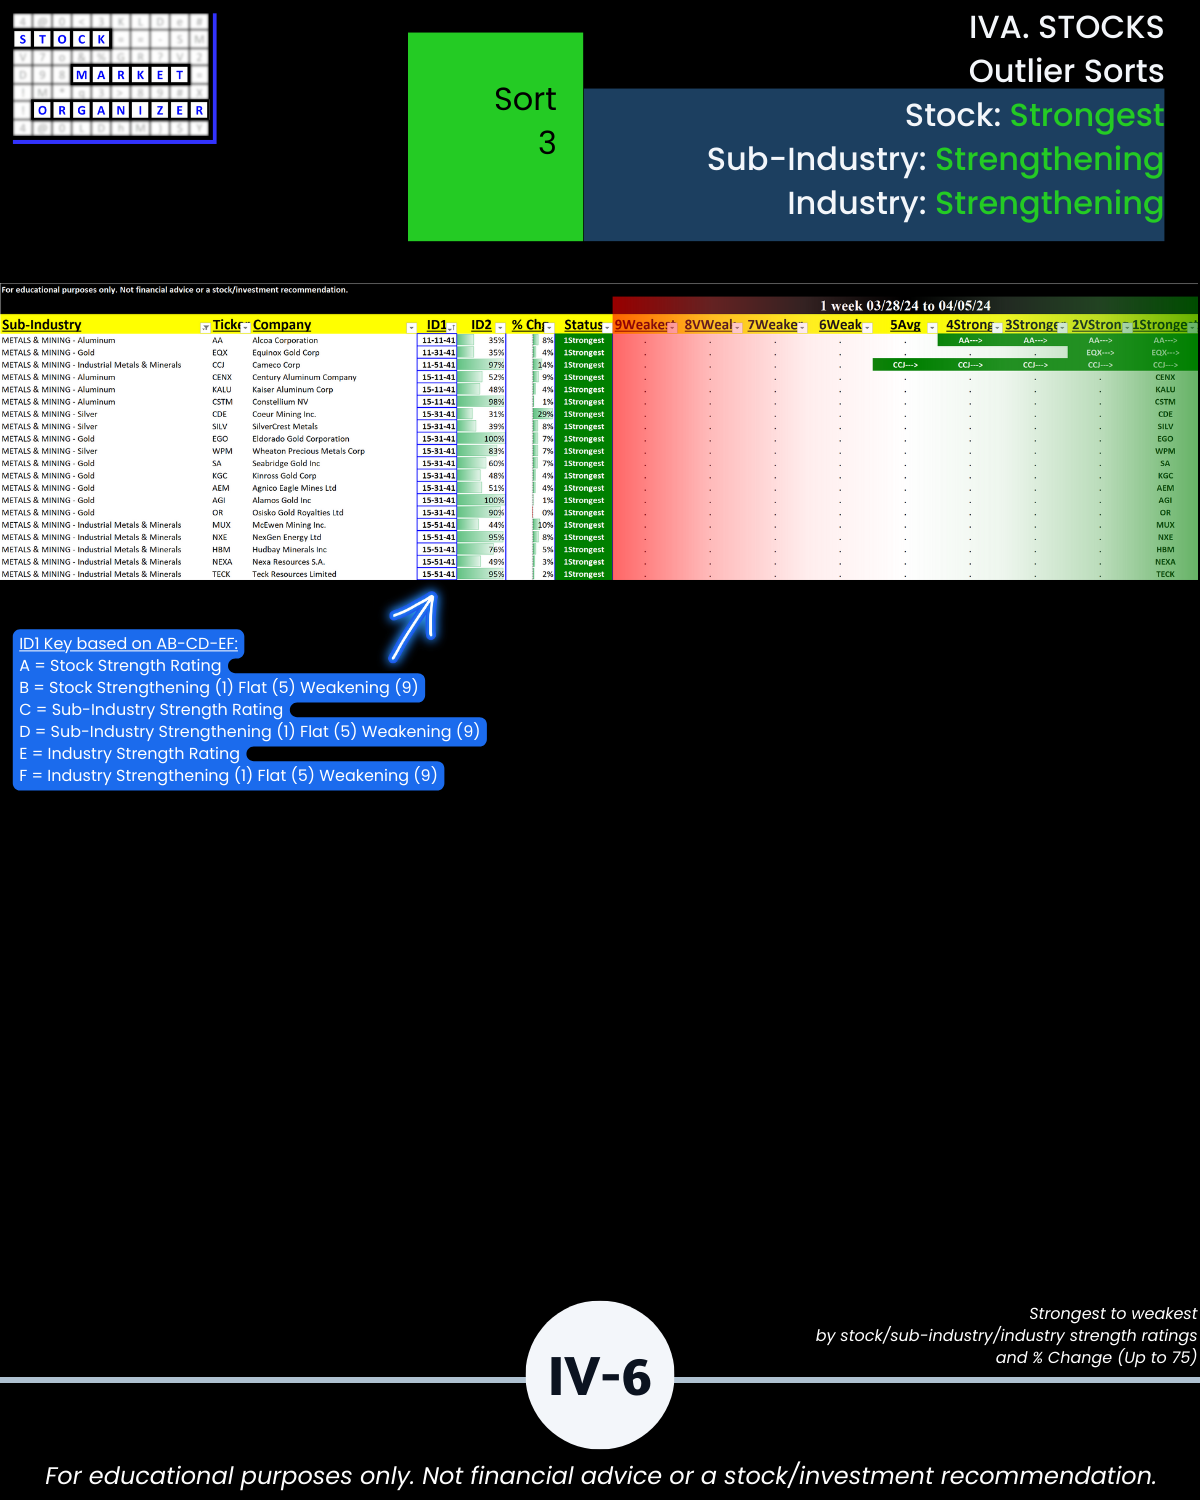
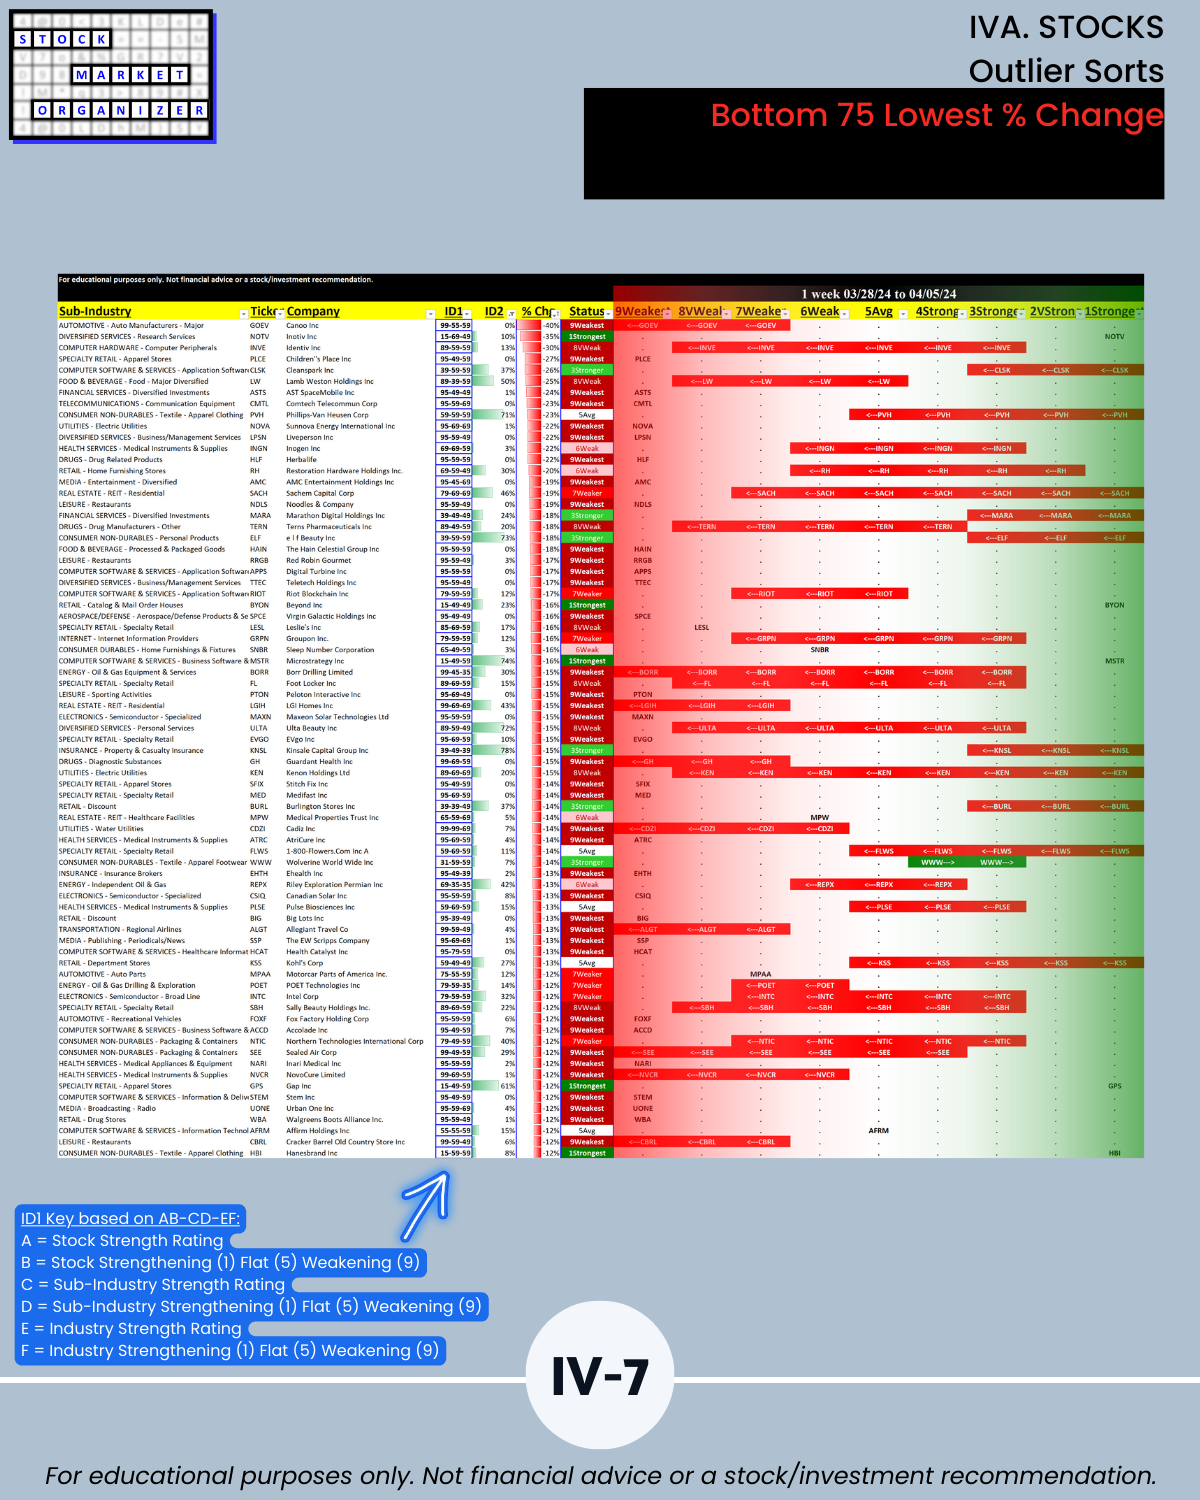
IVA. STOCKS Outlier Sorts
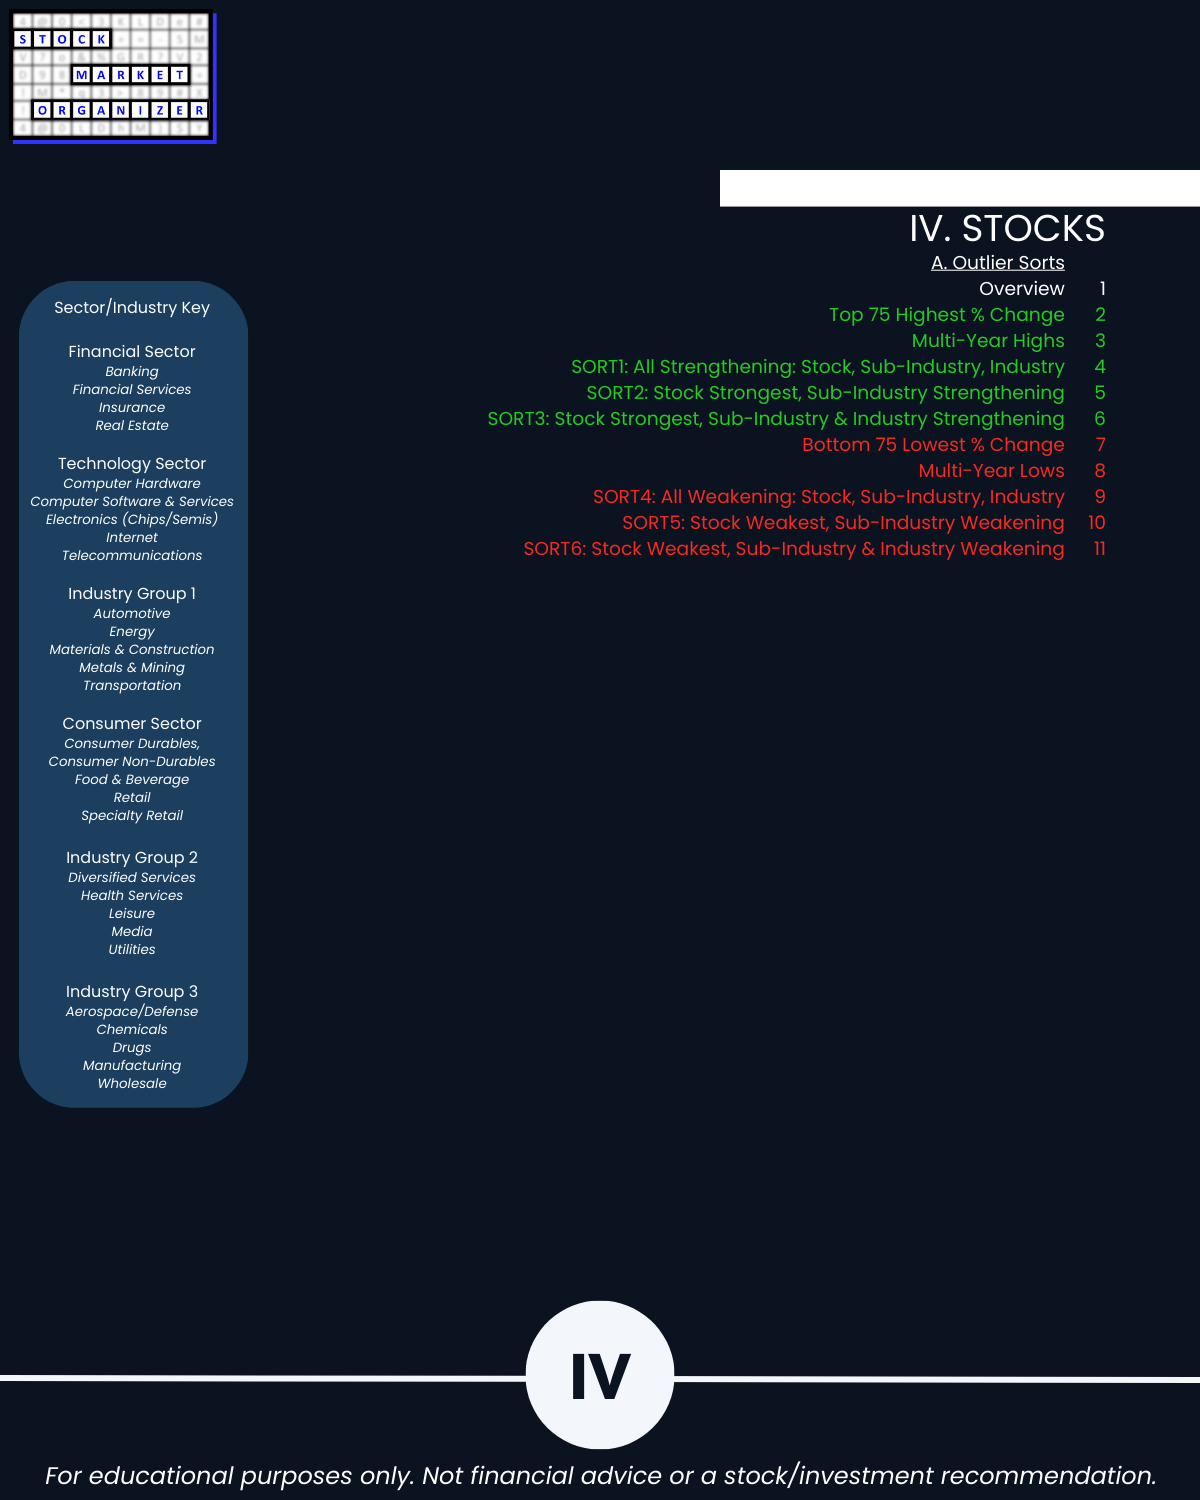
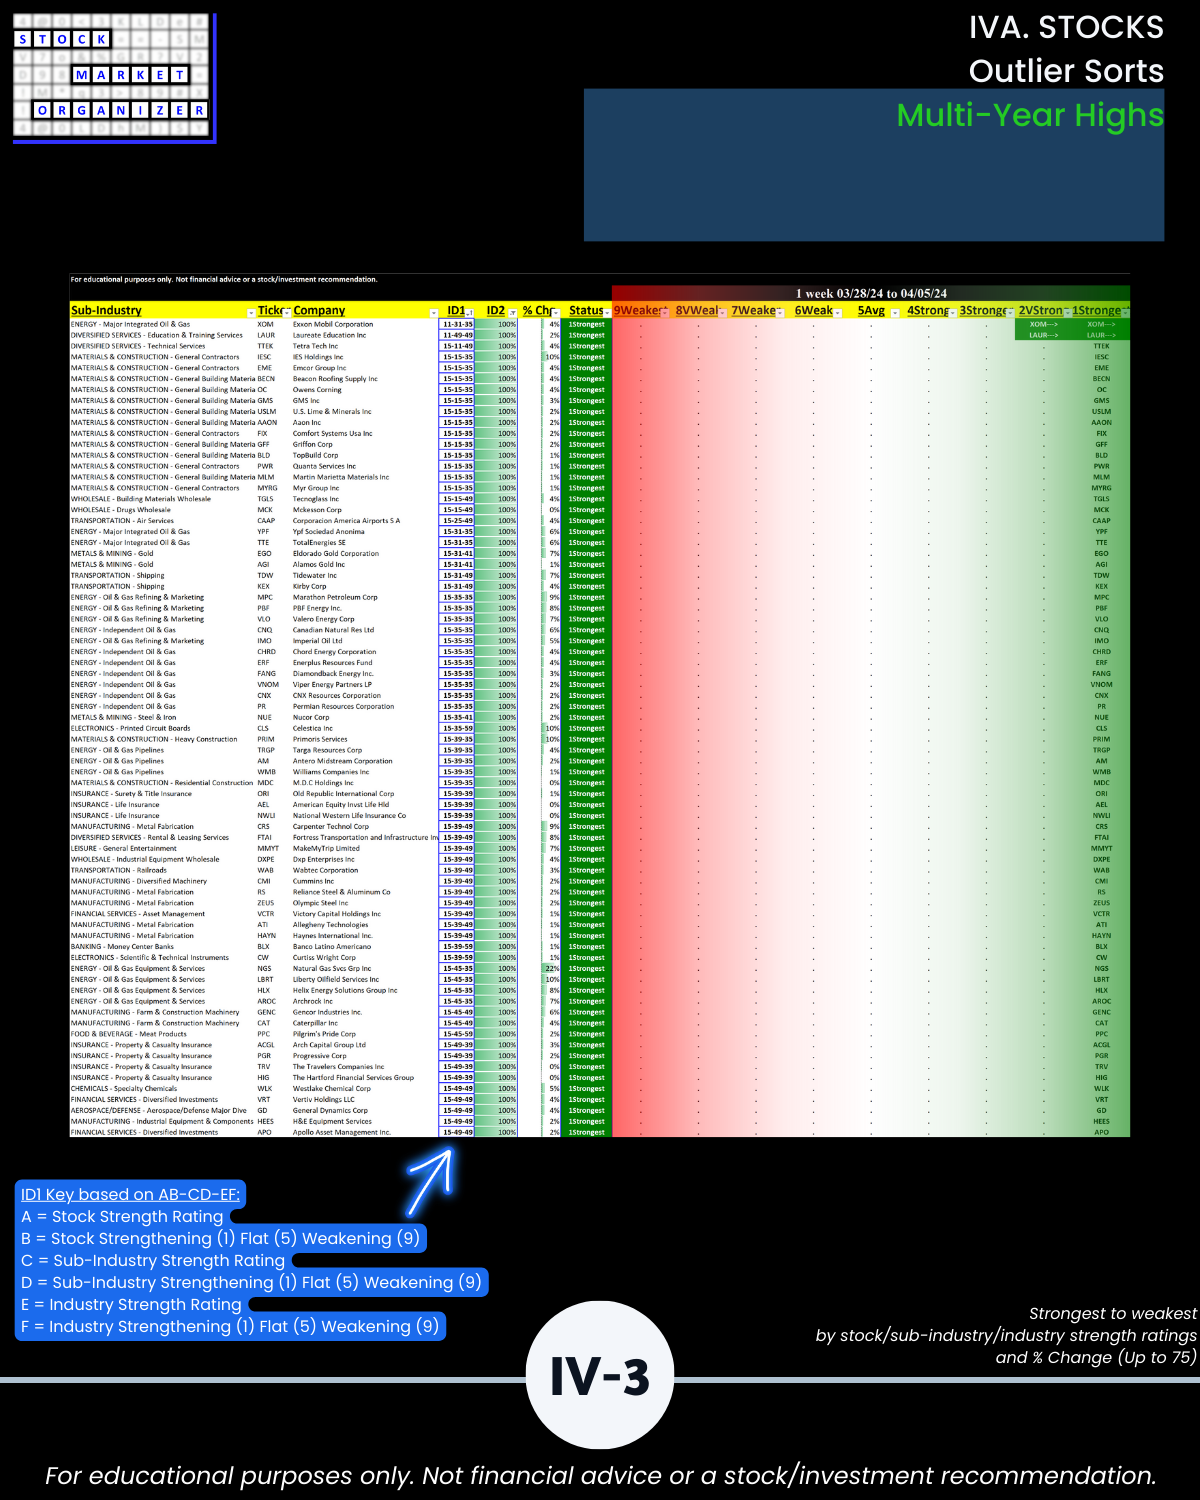
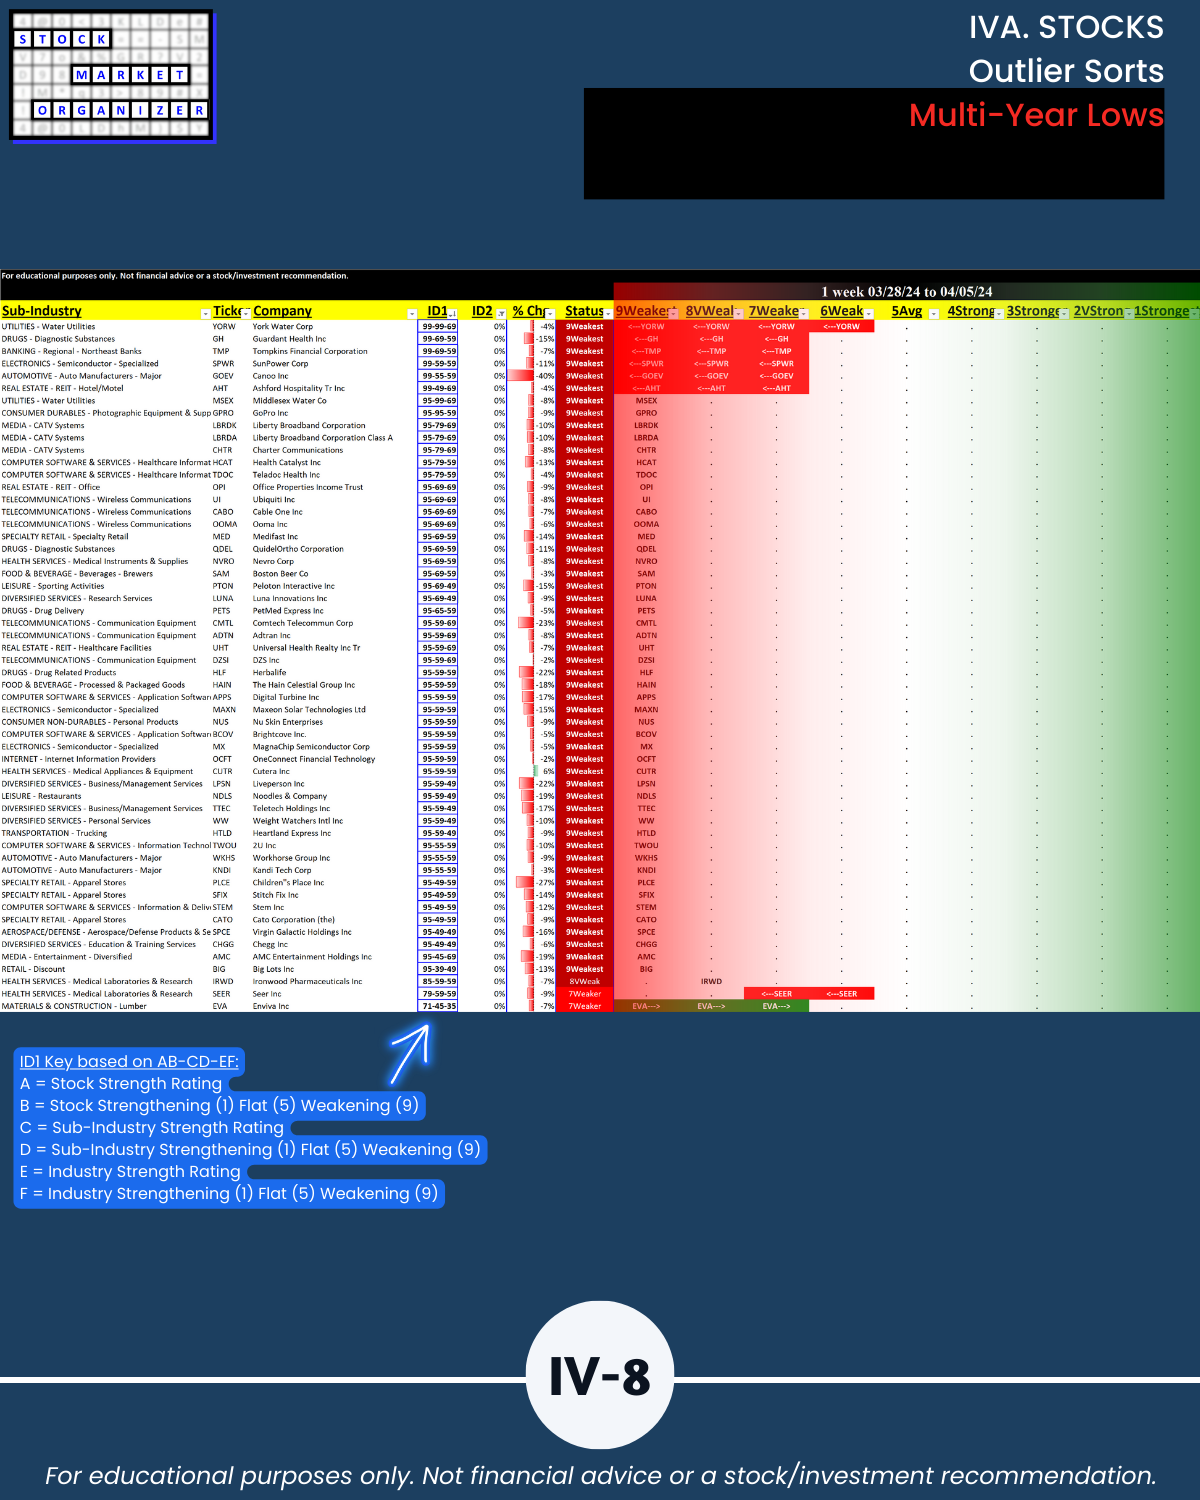
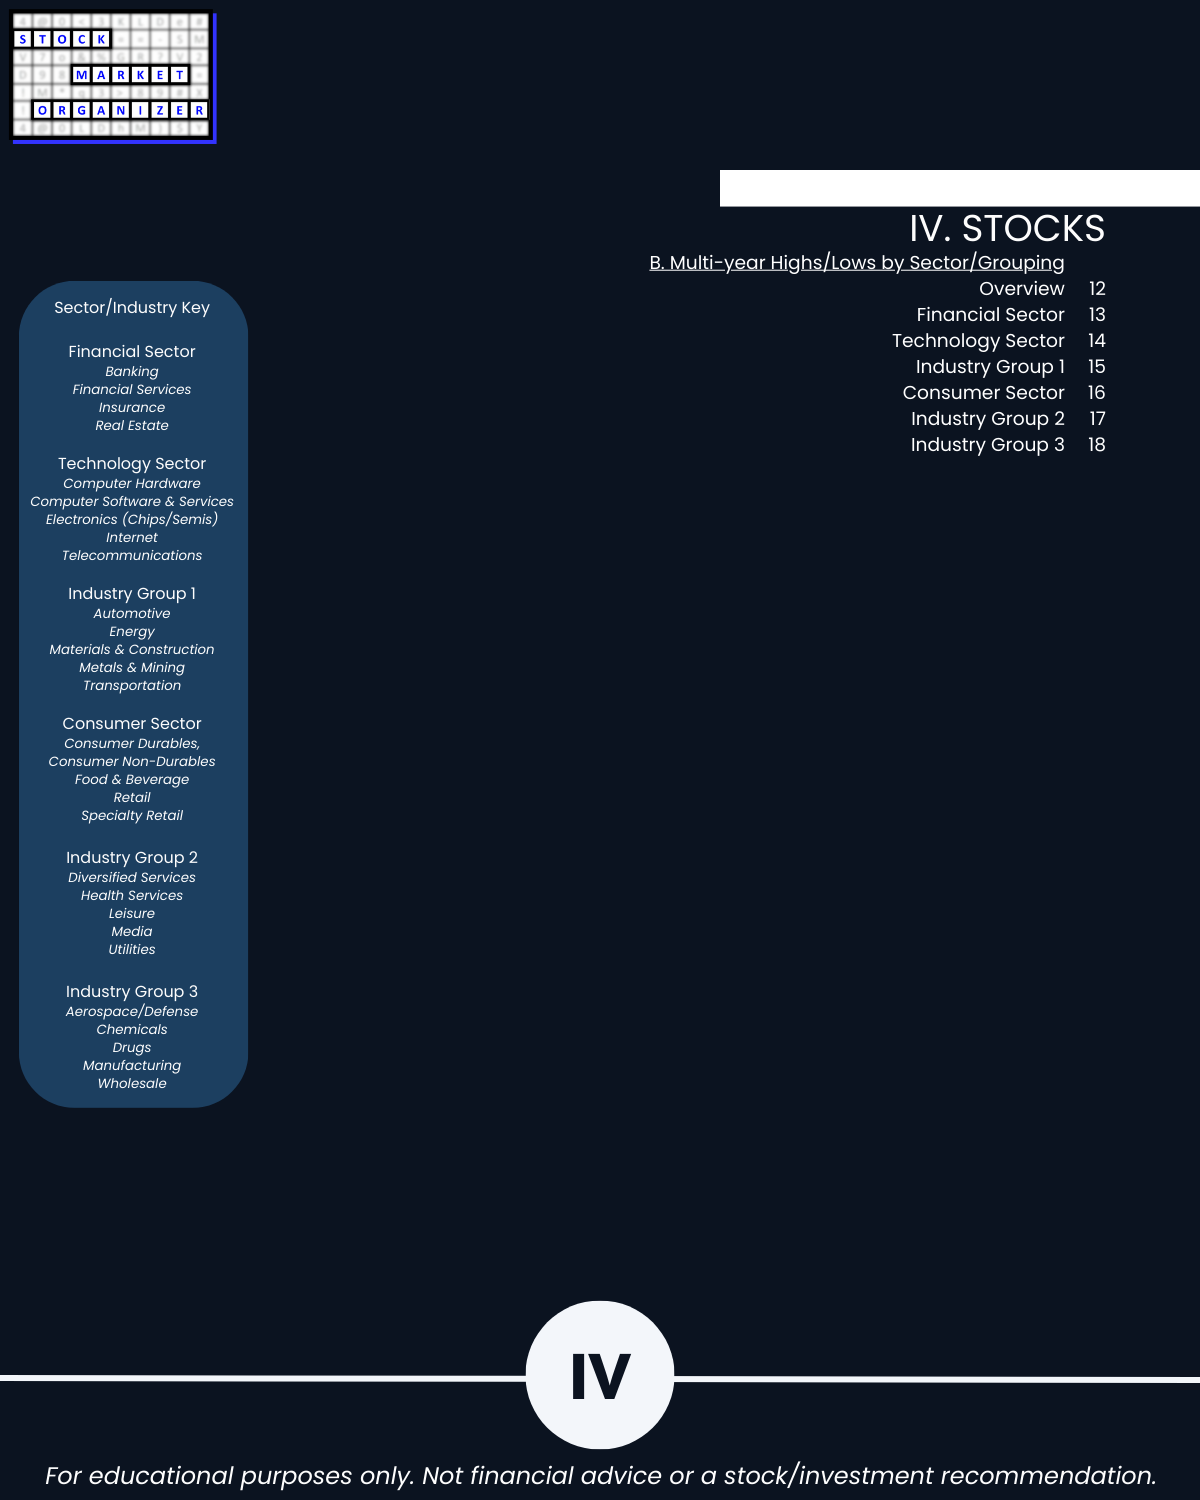
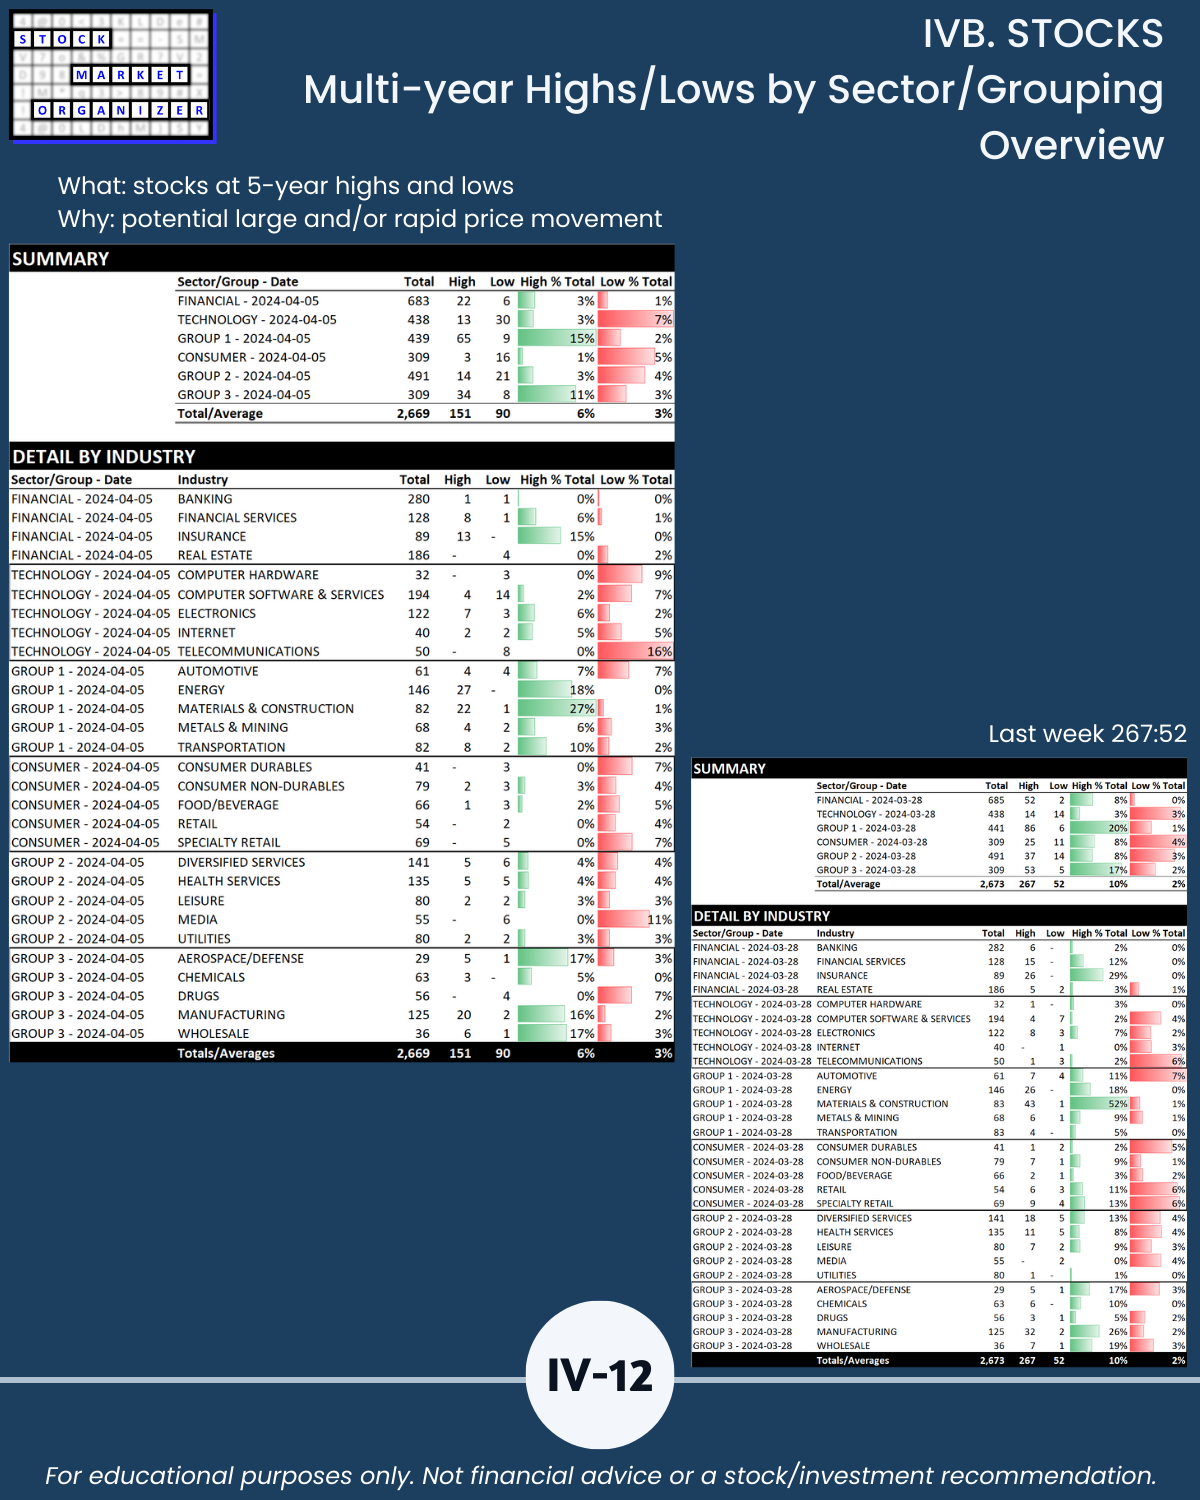
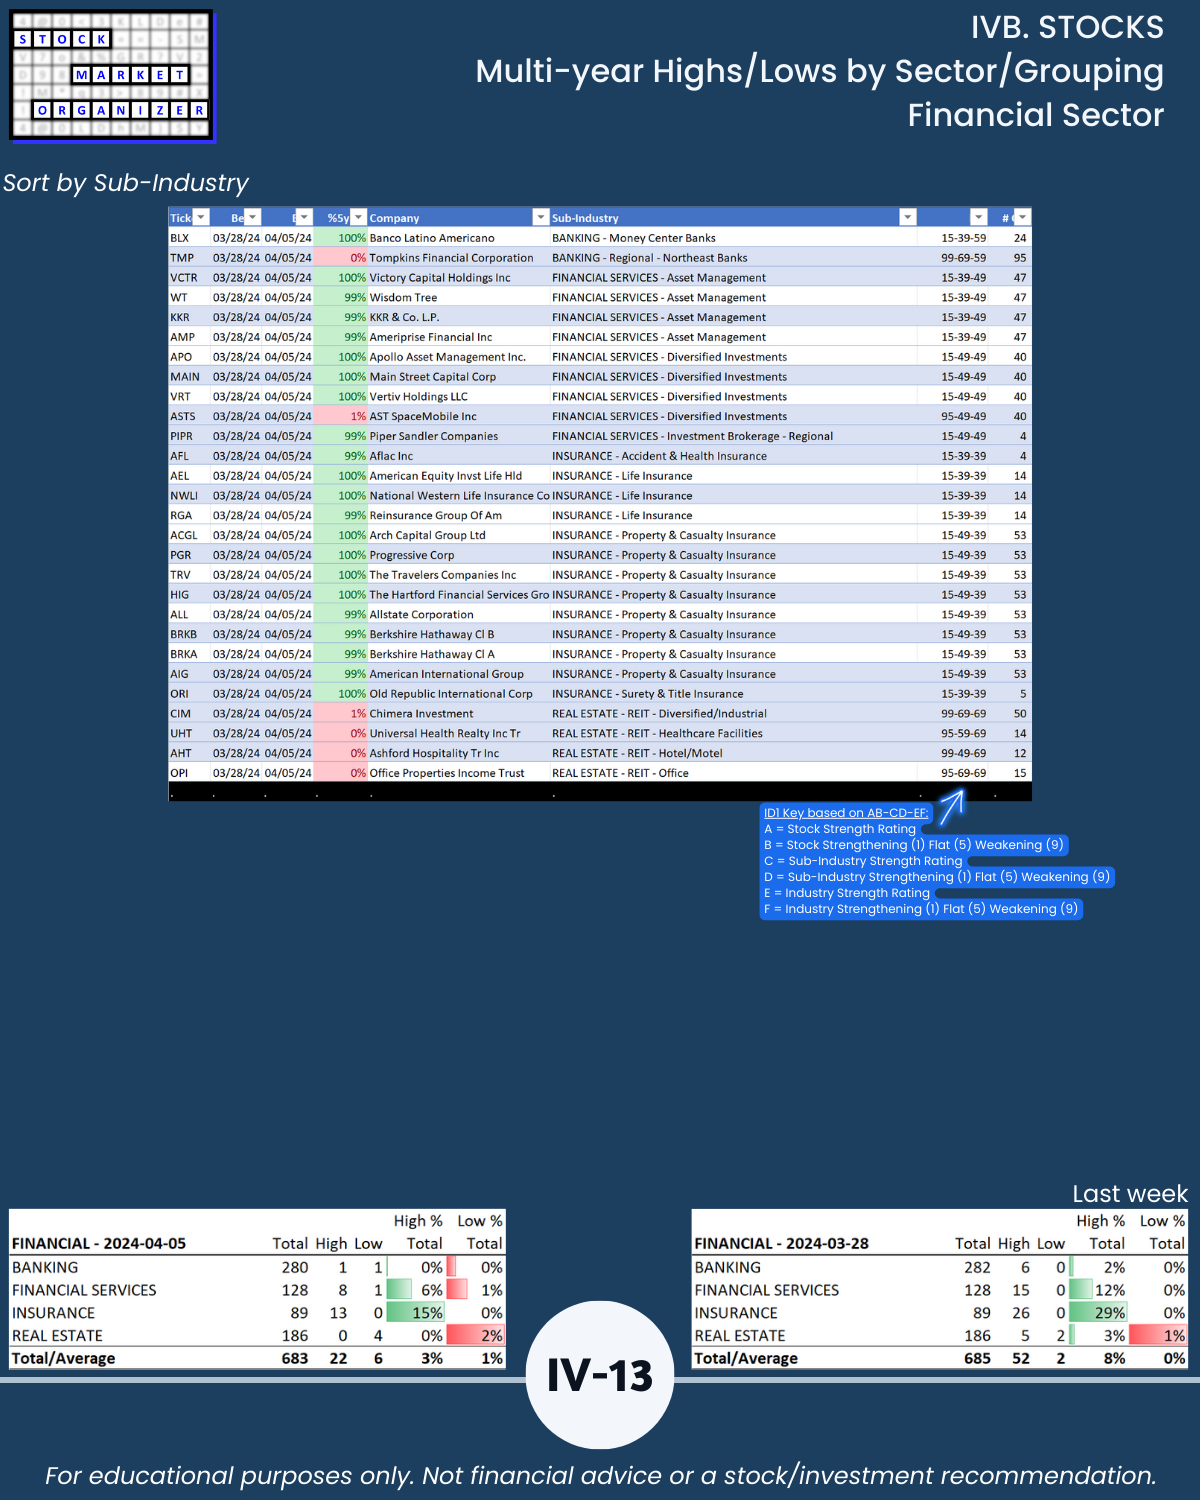
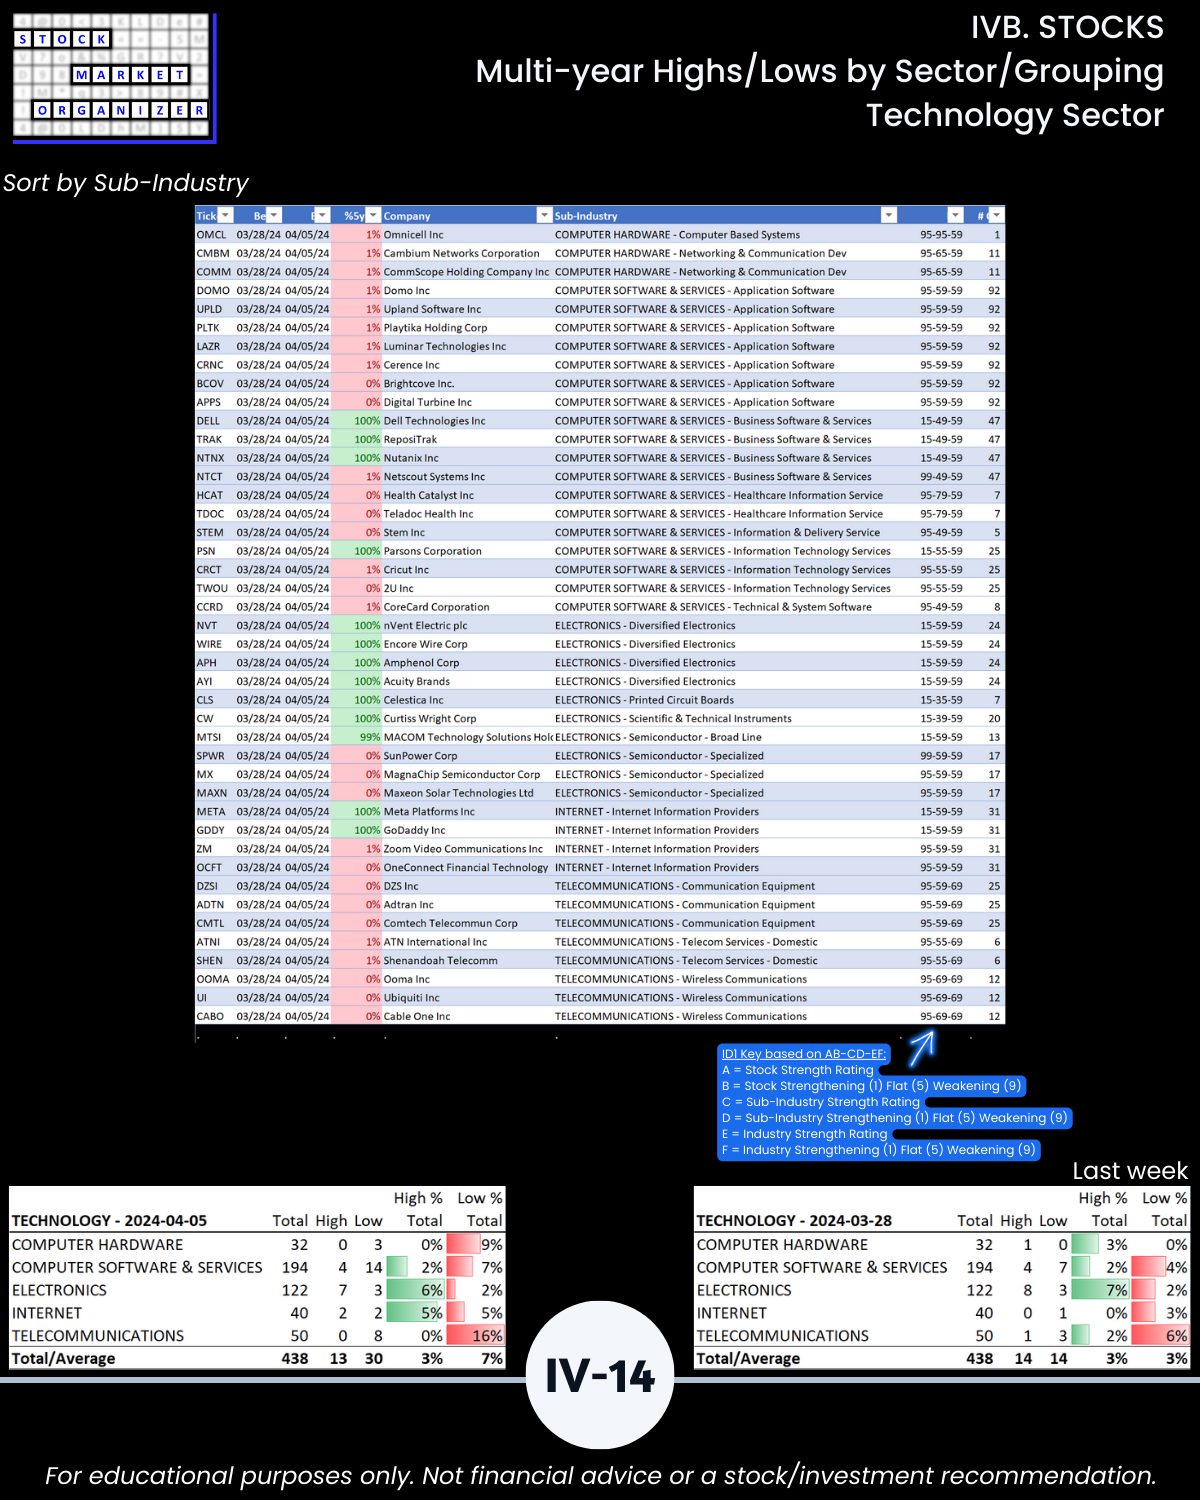
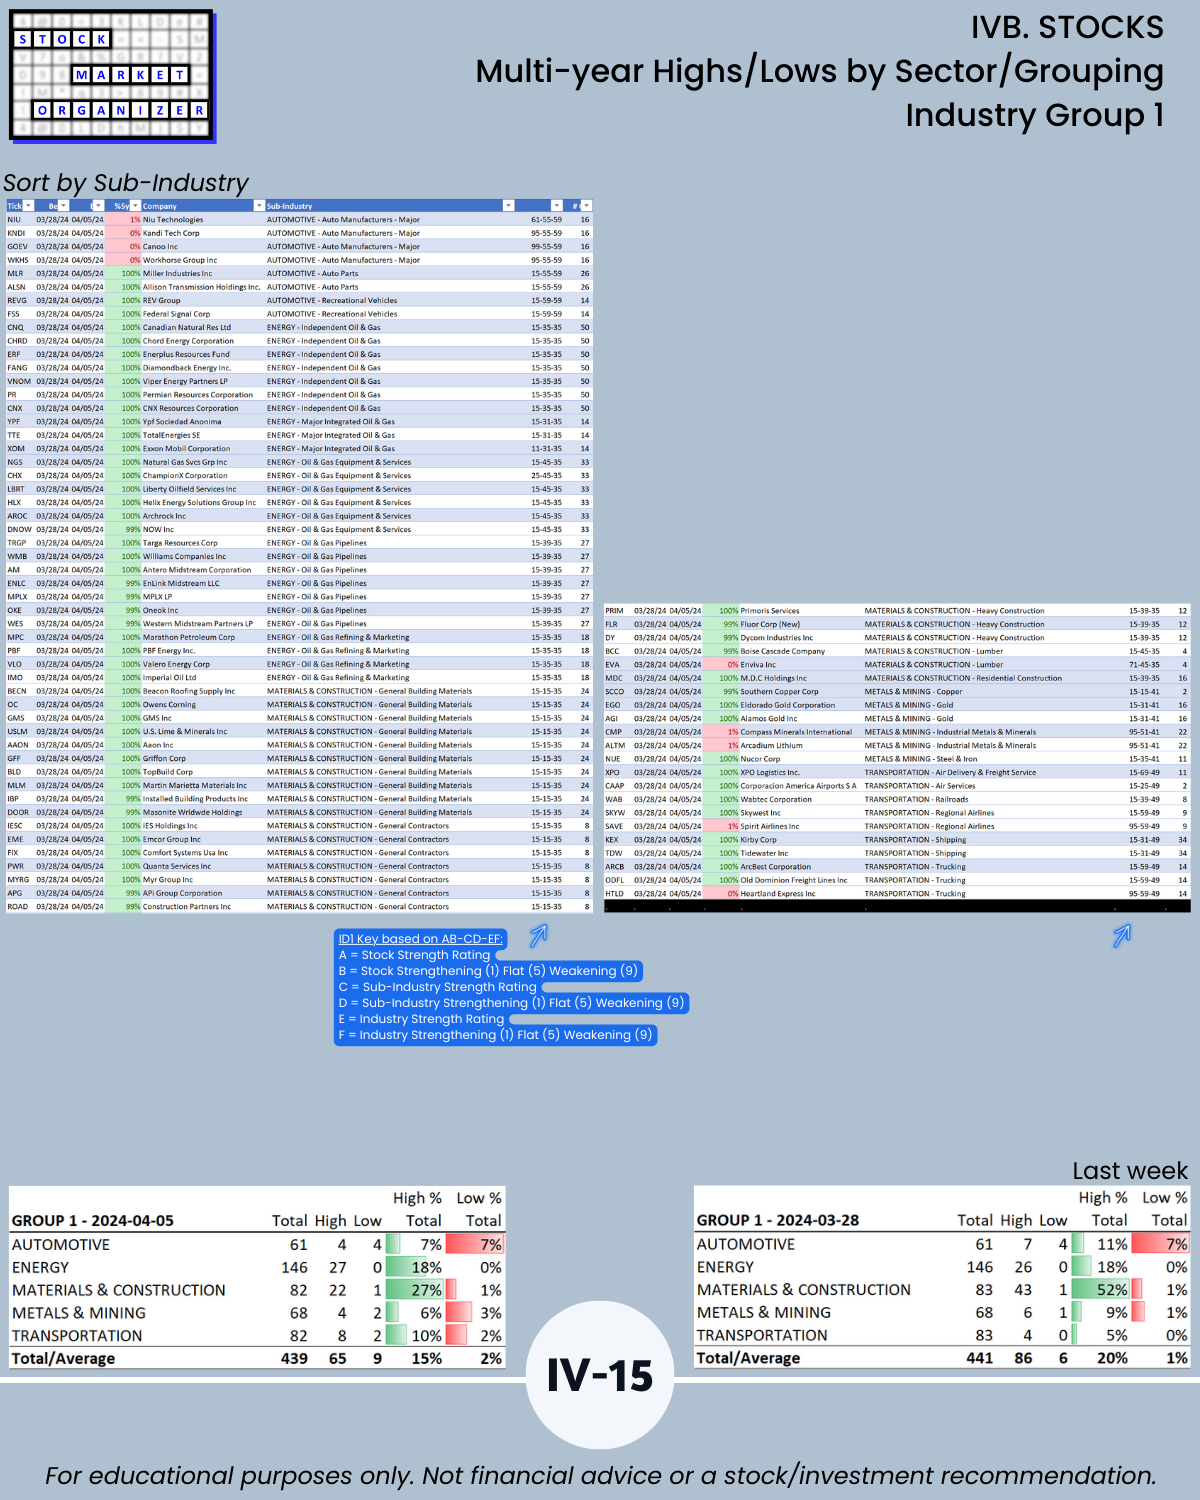
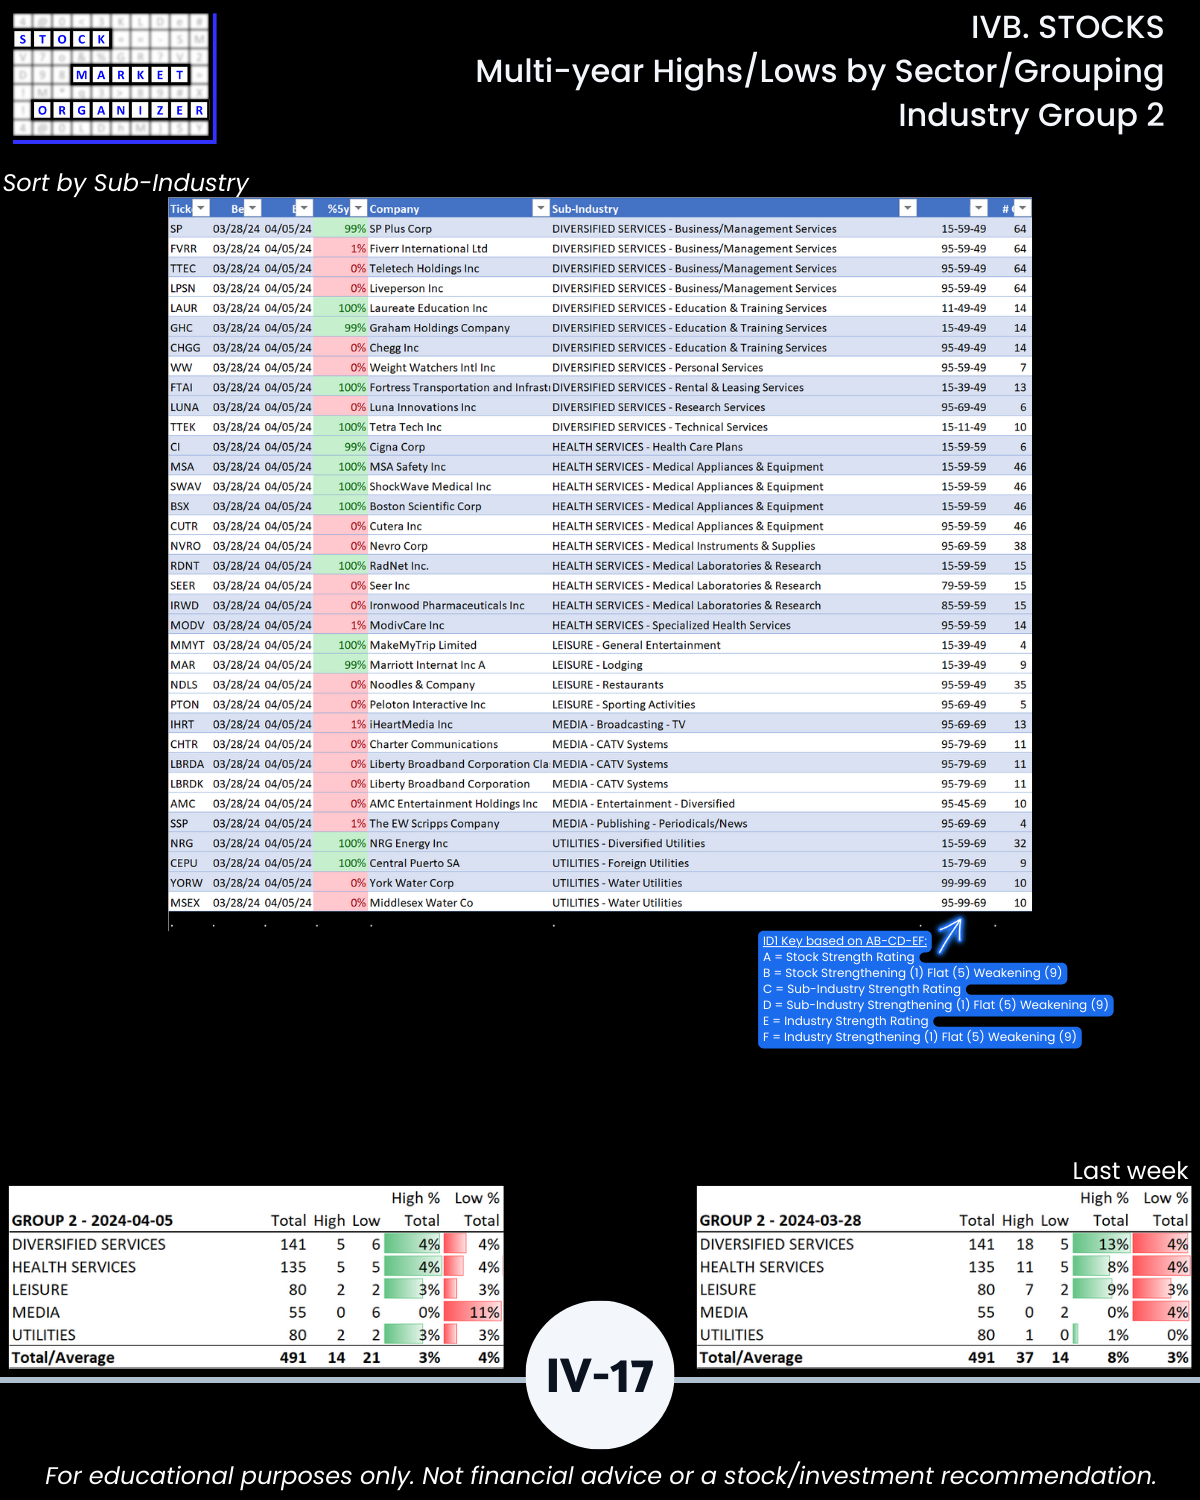
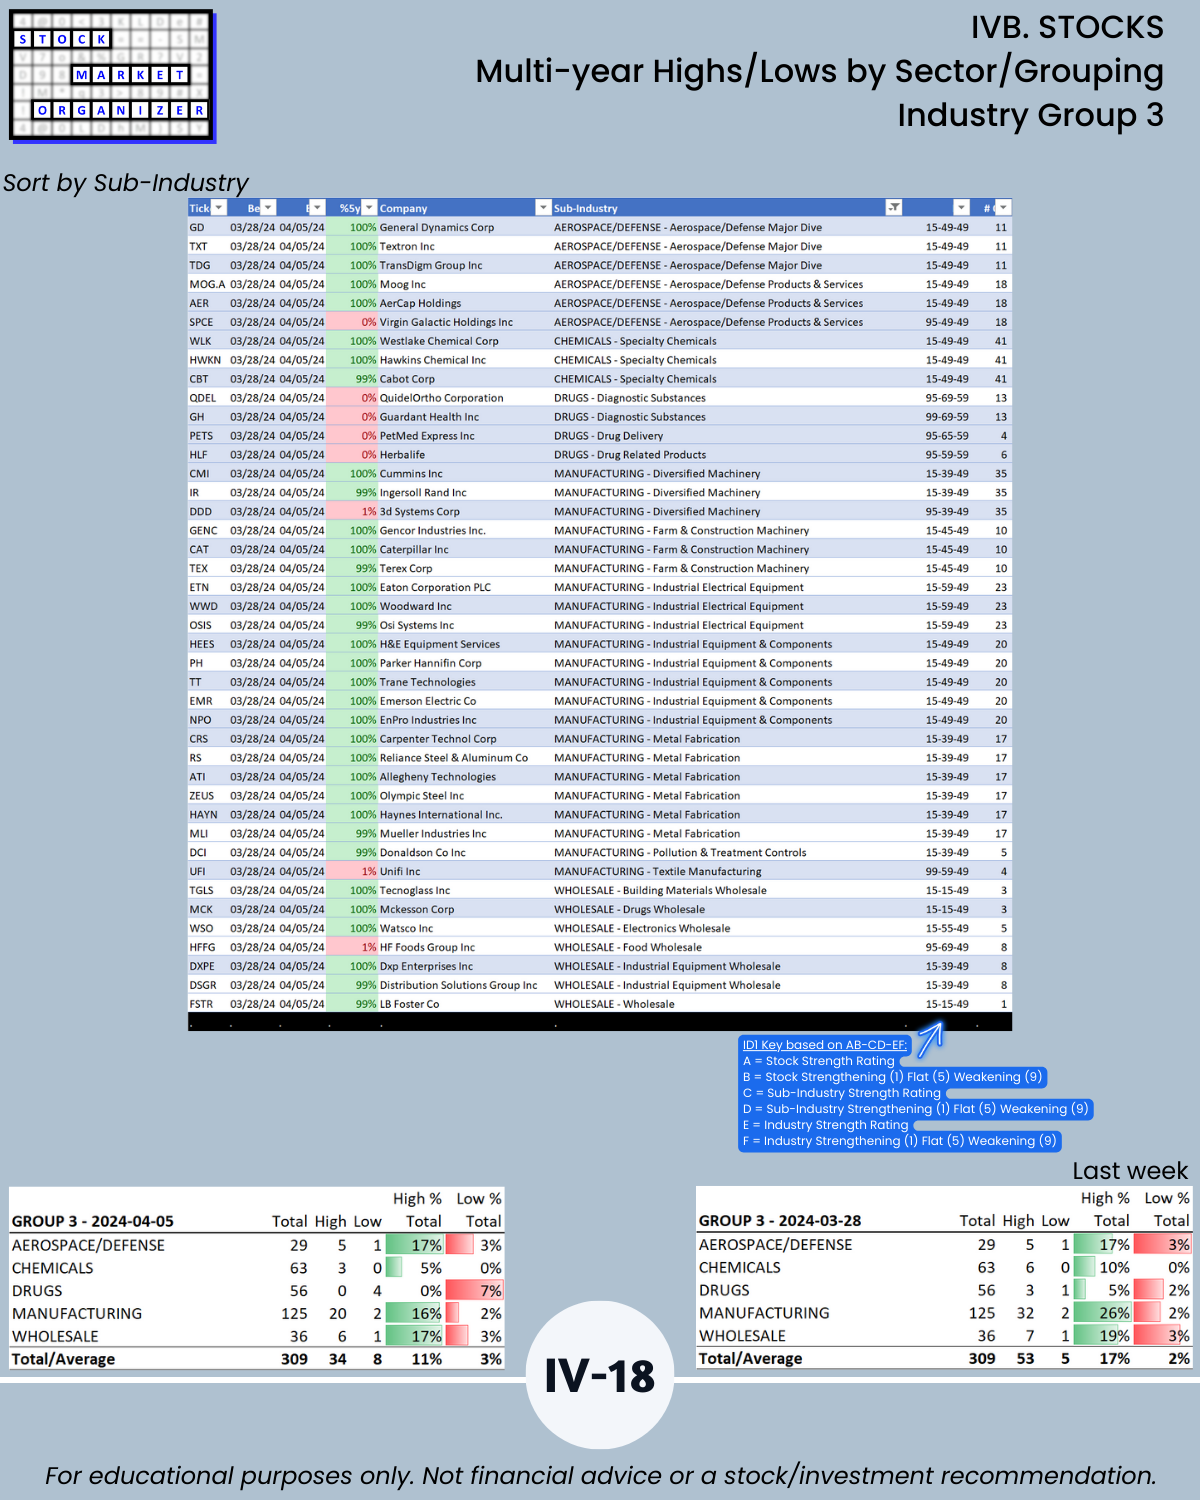
IVB. STOCKS Multi-Year Highs/Lows by Sector/Grouping
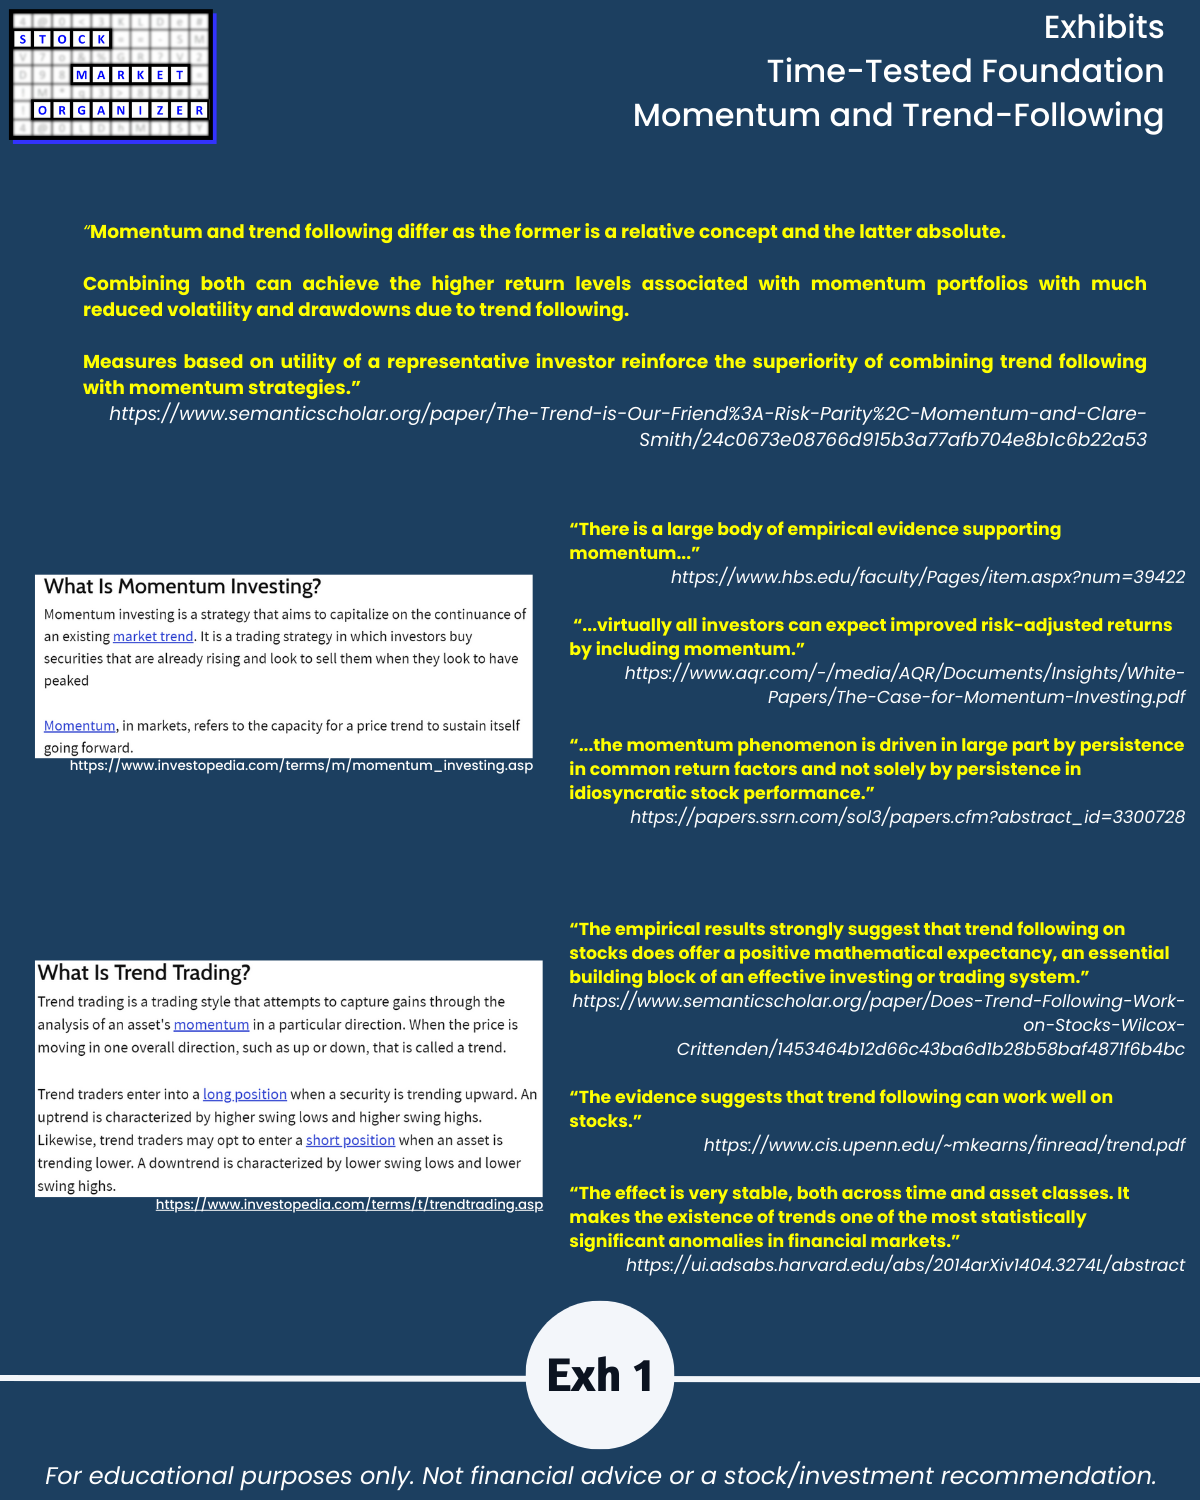
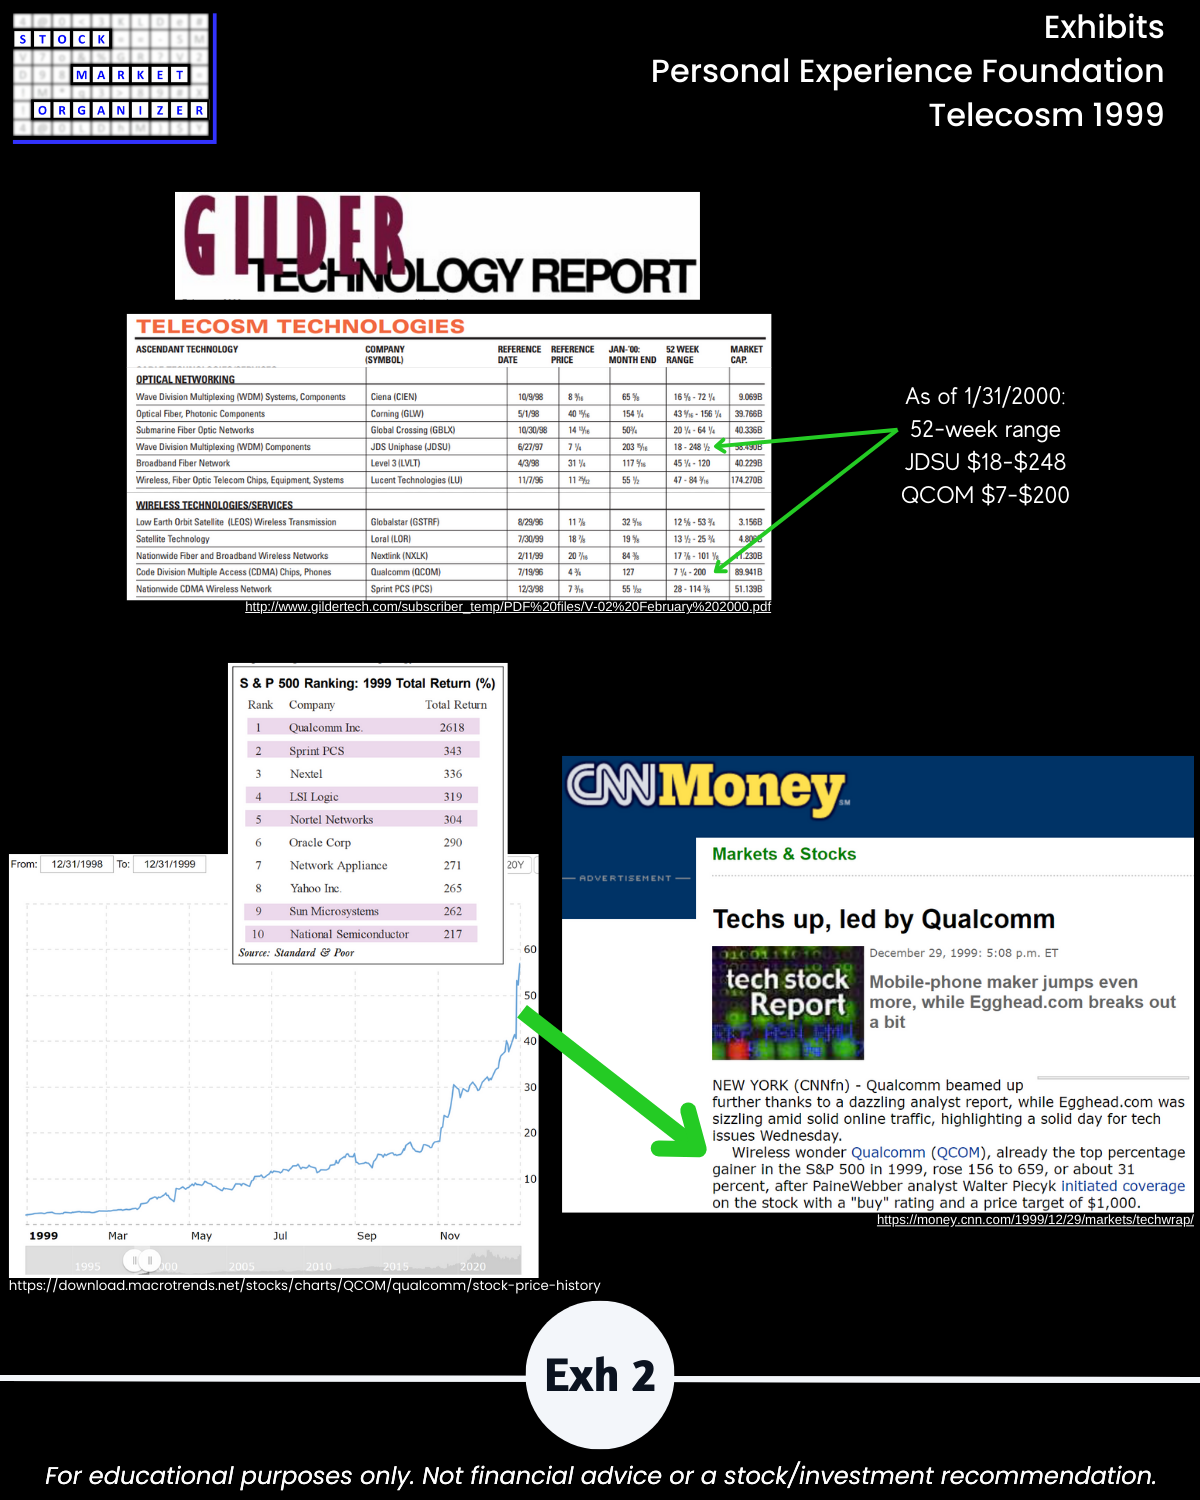
IV. EXHIBITS System Foundations