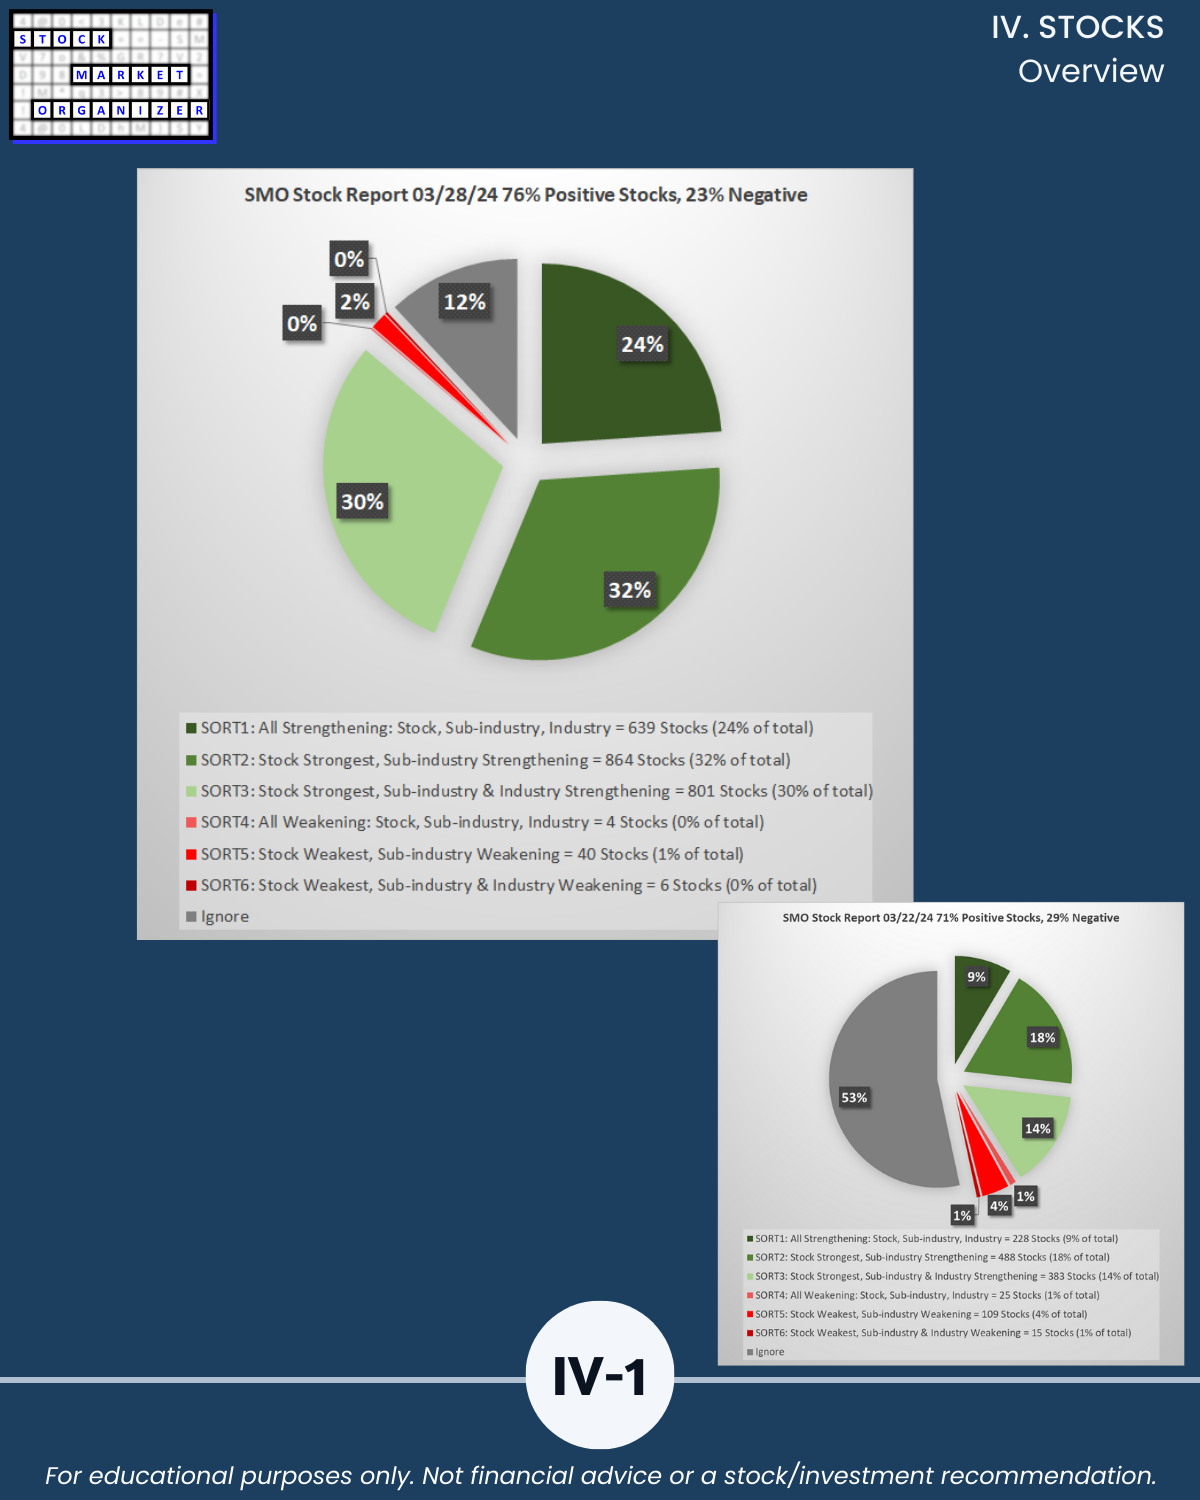
SMO Exclusive: U.S. Stock Market Strength Report 2024-03-28 (no new Shorts)

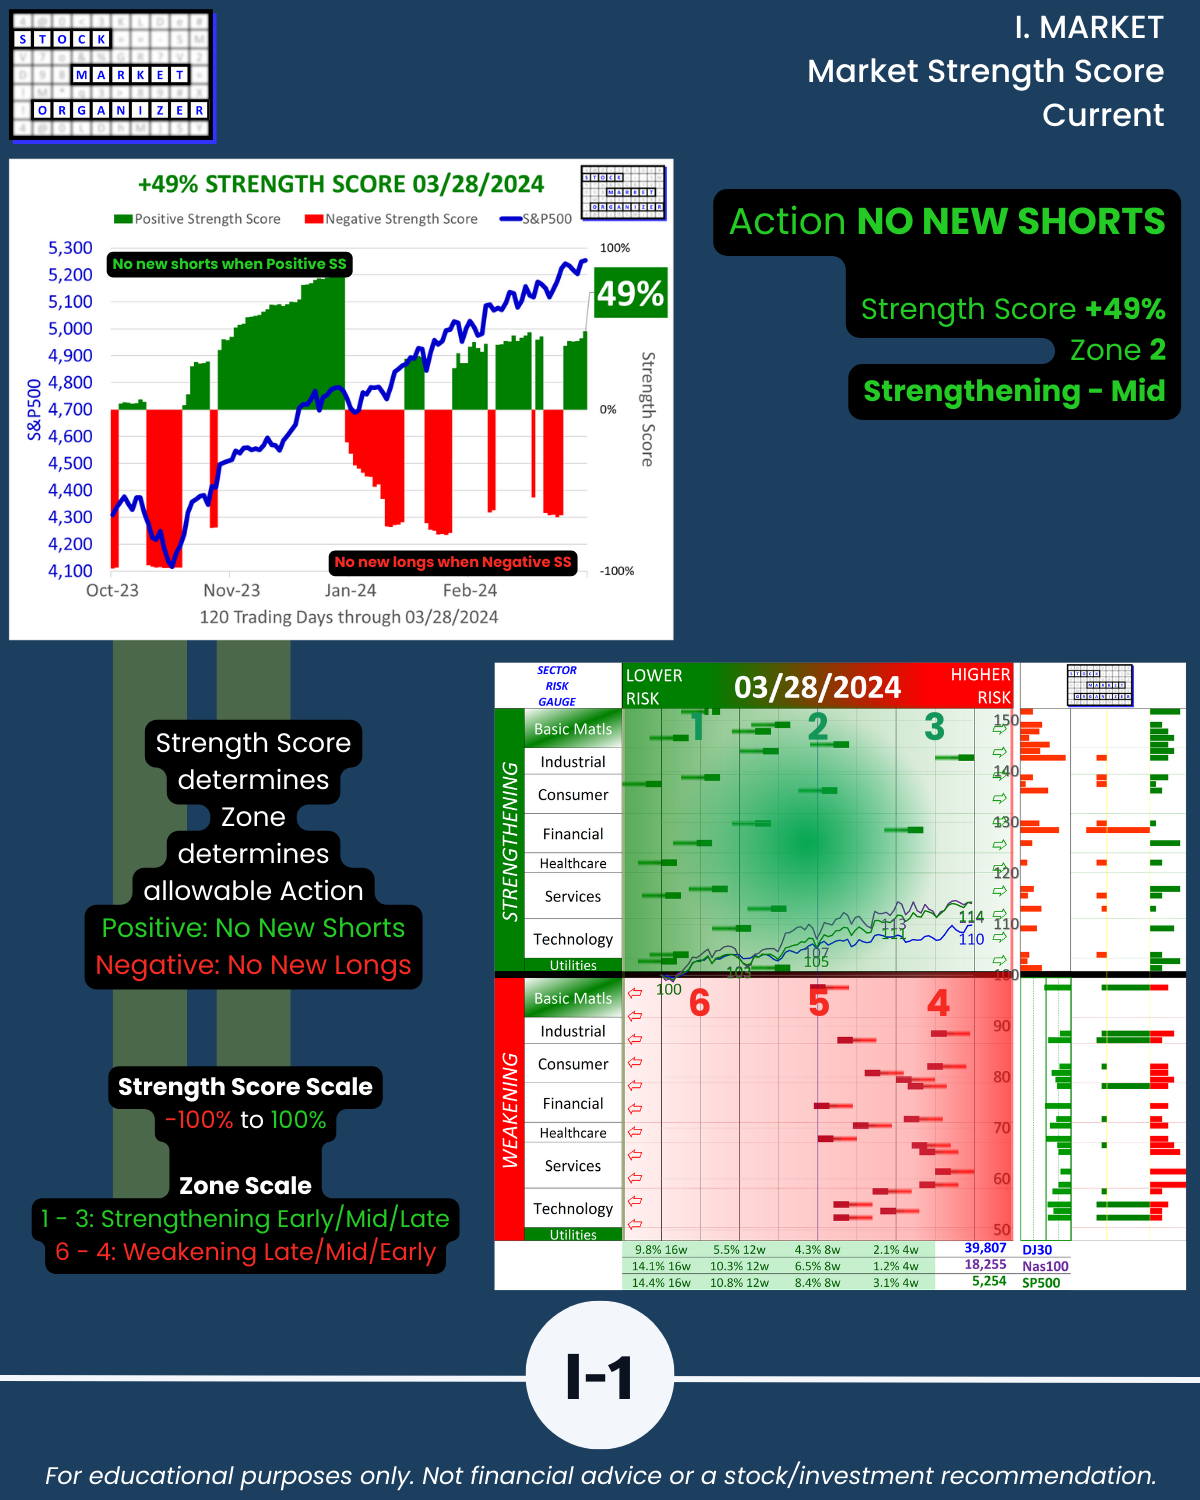
3/28/24 U.S. Market report bottom line: BROAD STRENGTHENING THIS WEEK. (But tech lagged. See below.) A short week didn’t inhibit action. If you were wondering whether the rest of the market would start to catch up to the previous narrow leadership, this week’s answer is YES. I don’t predict so I don’t know if this will continue, but multi-week rallies begin with one up week and 100% gains start with 10% gains.
Extreme detail attached.
And as you read this, I will guarantee you that you have not seen this presented this way anywhere else.
So it can complement whatever perspective you have.
Why am I so confident about that?
Because I created this from scratch. Here, I am
Finding U.S. Stock Market strength from the
top down,
inside out,
and bottom up, because
the stronger your stocks, the greener your P&L.
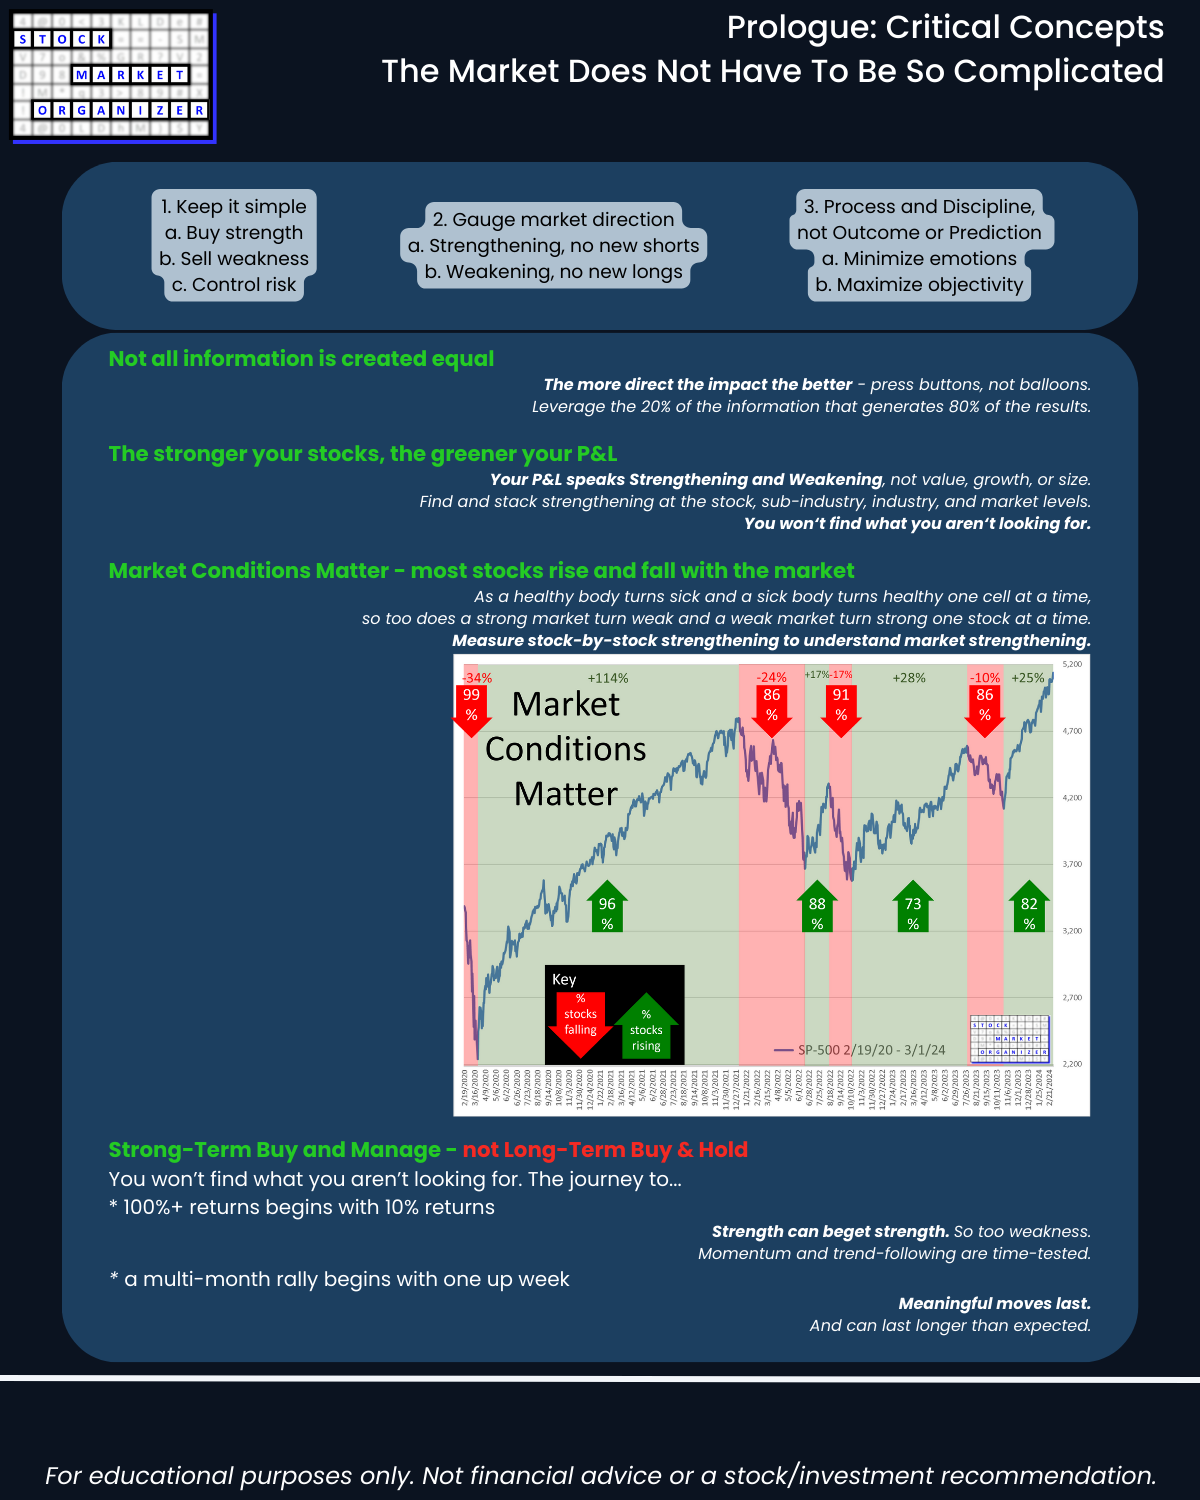
The market does not need to be so complicated.
WHAT CAN I TELL YOU THAT YOU MAY NOT KNOW?
(and this doesn’t come from analyzing or charting harder)
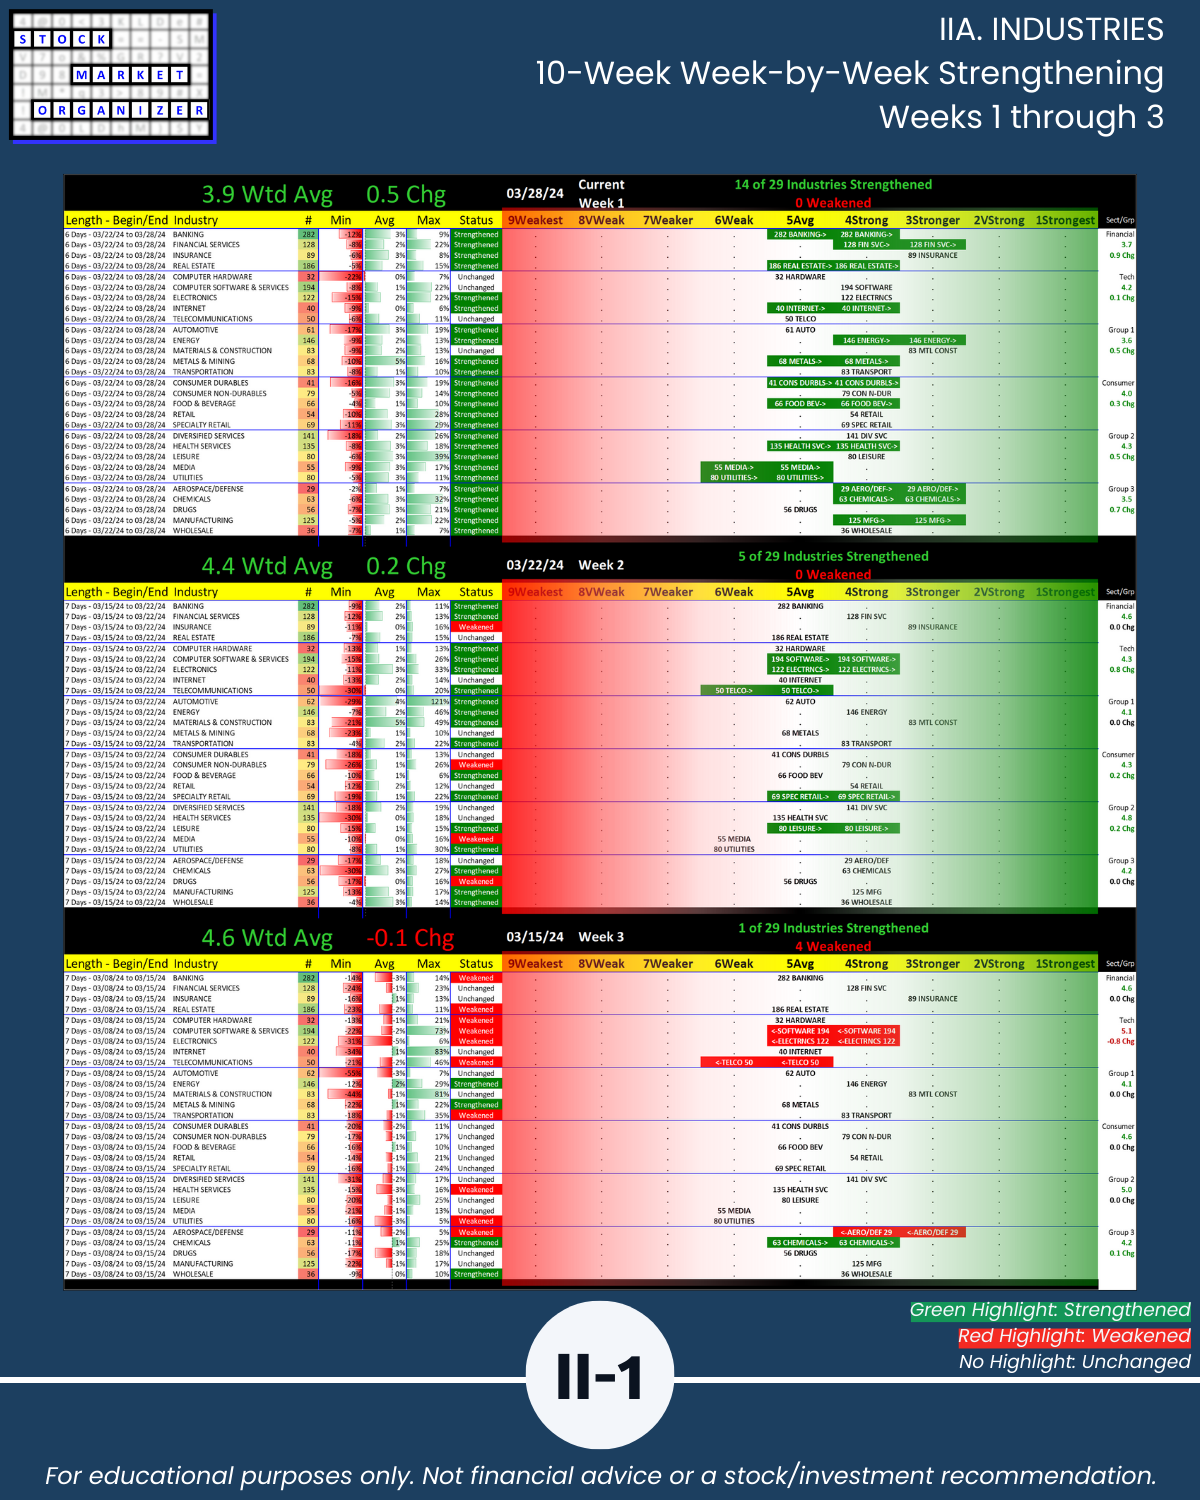
🔹 The market had its best strengthening week in 10 and has a 3.9 composite strength score (1 = strongest, 9 = weakest), +0.5 points from last week’s 4.4.
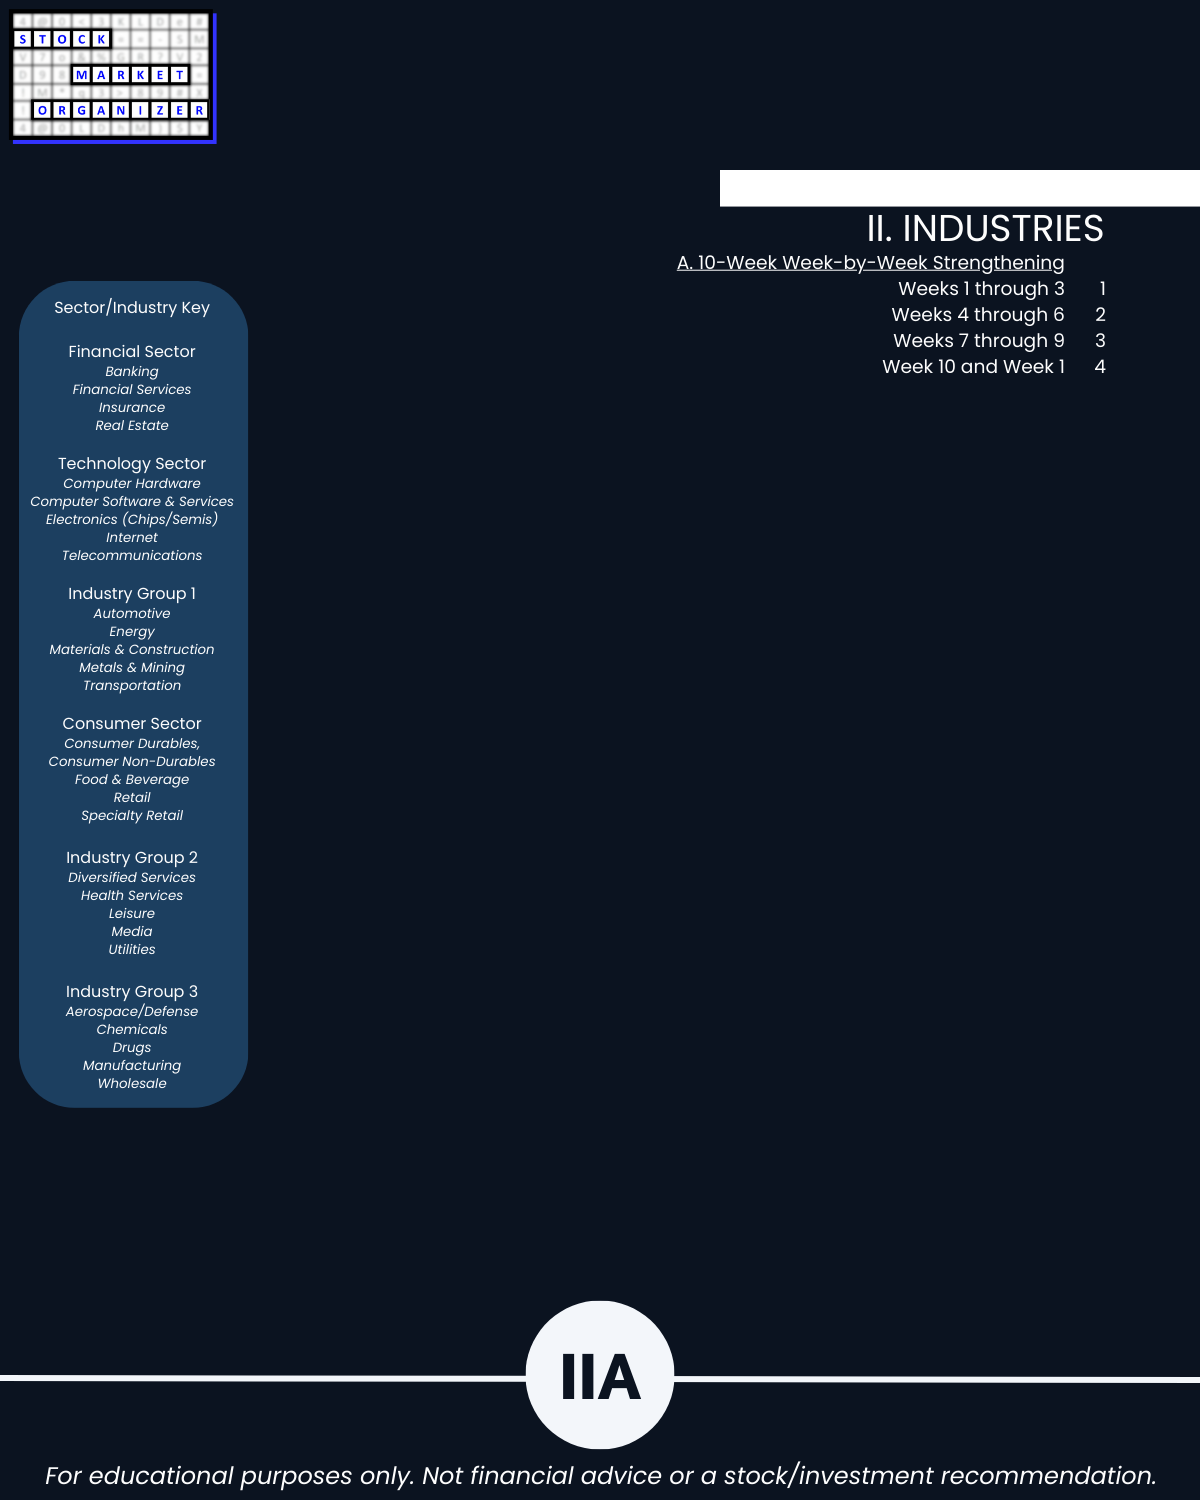
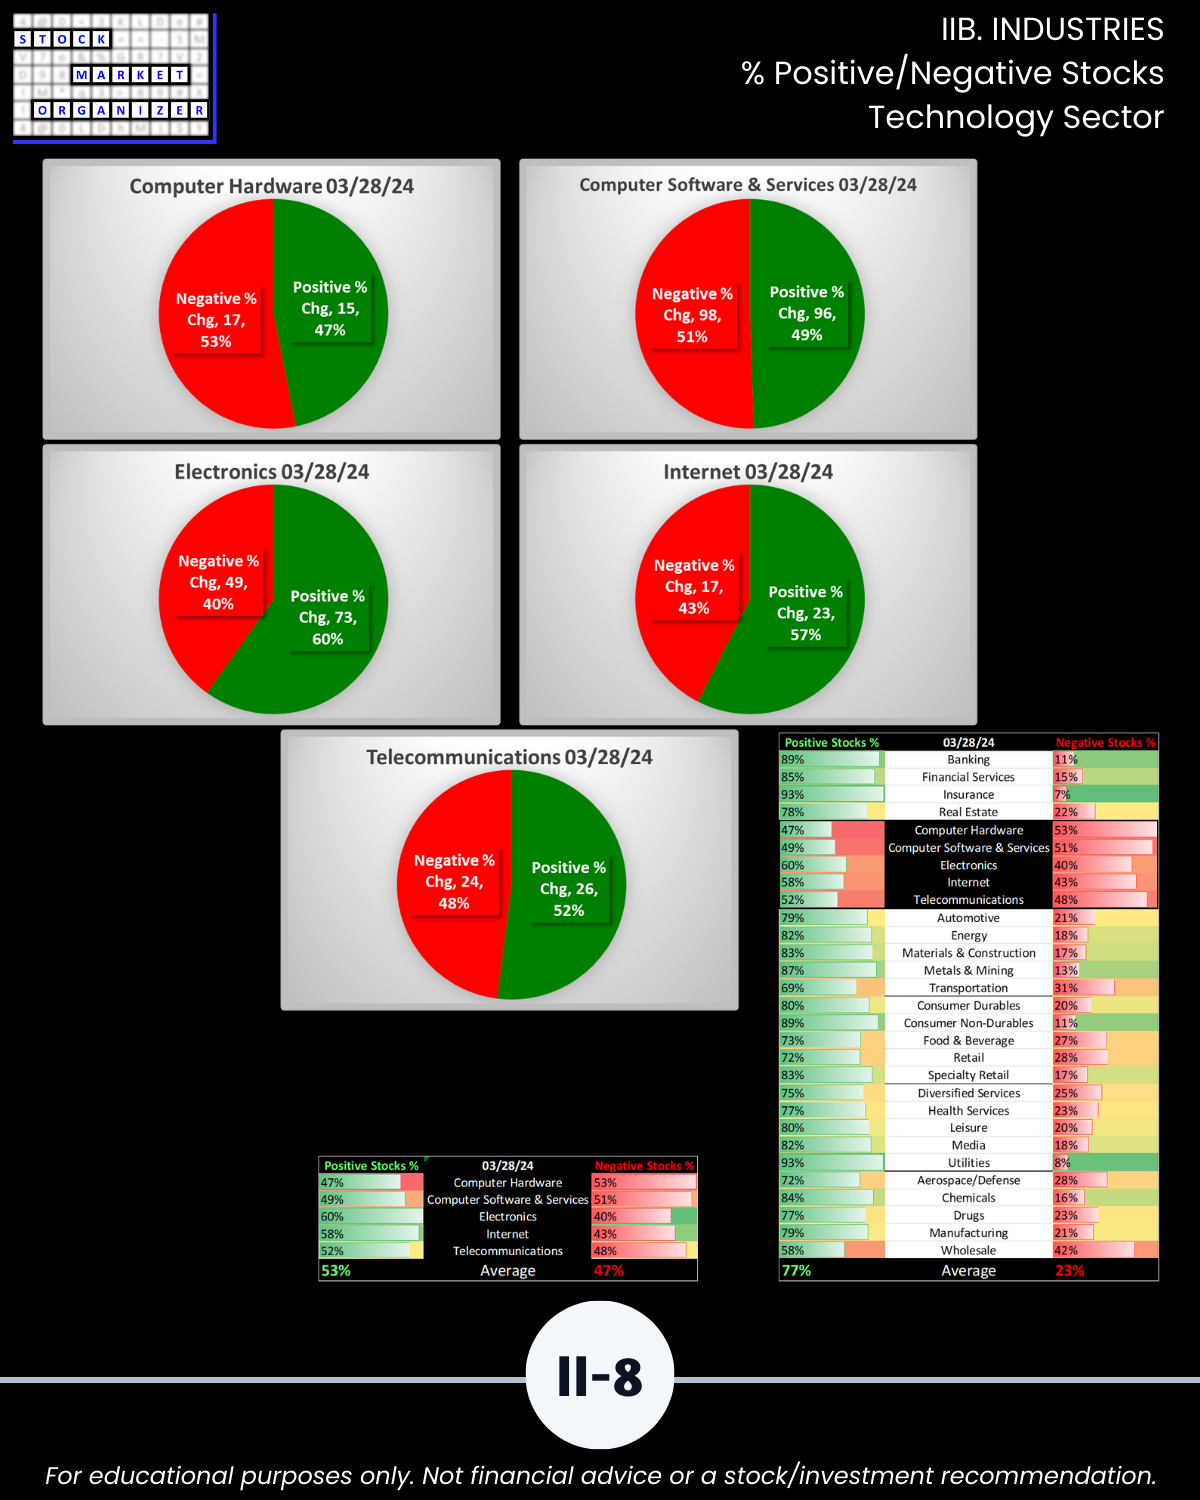
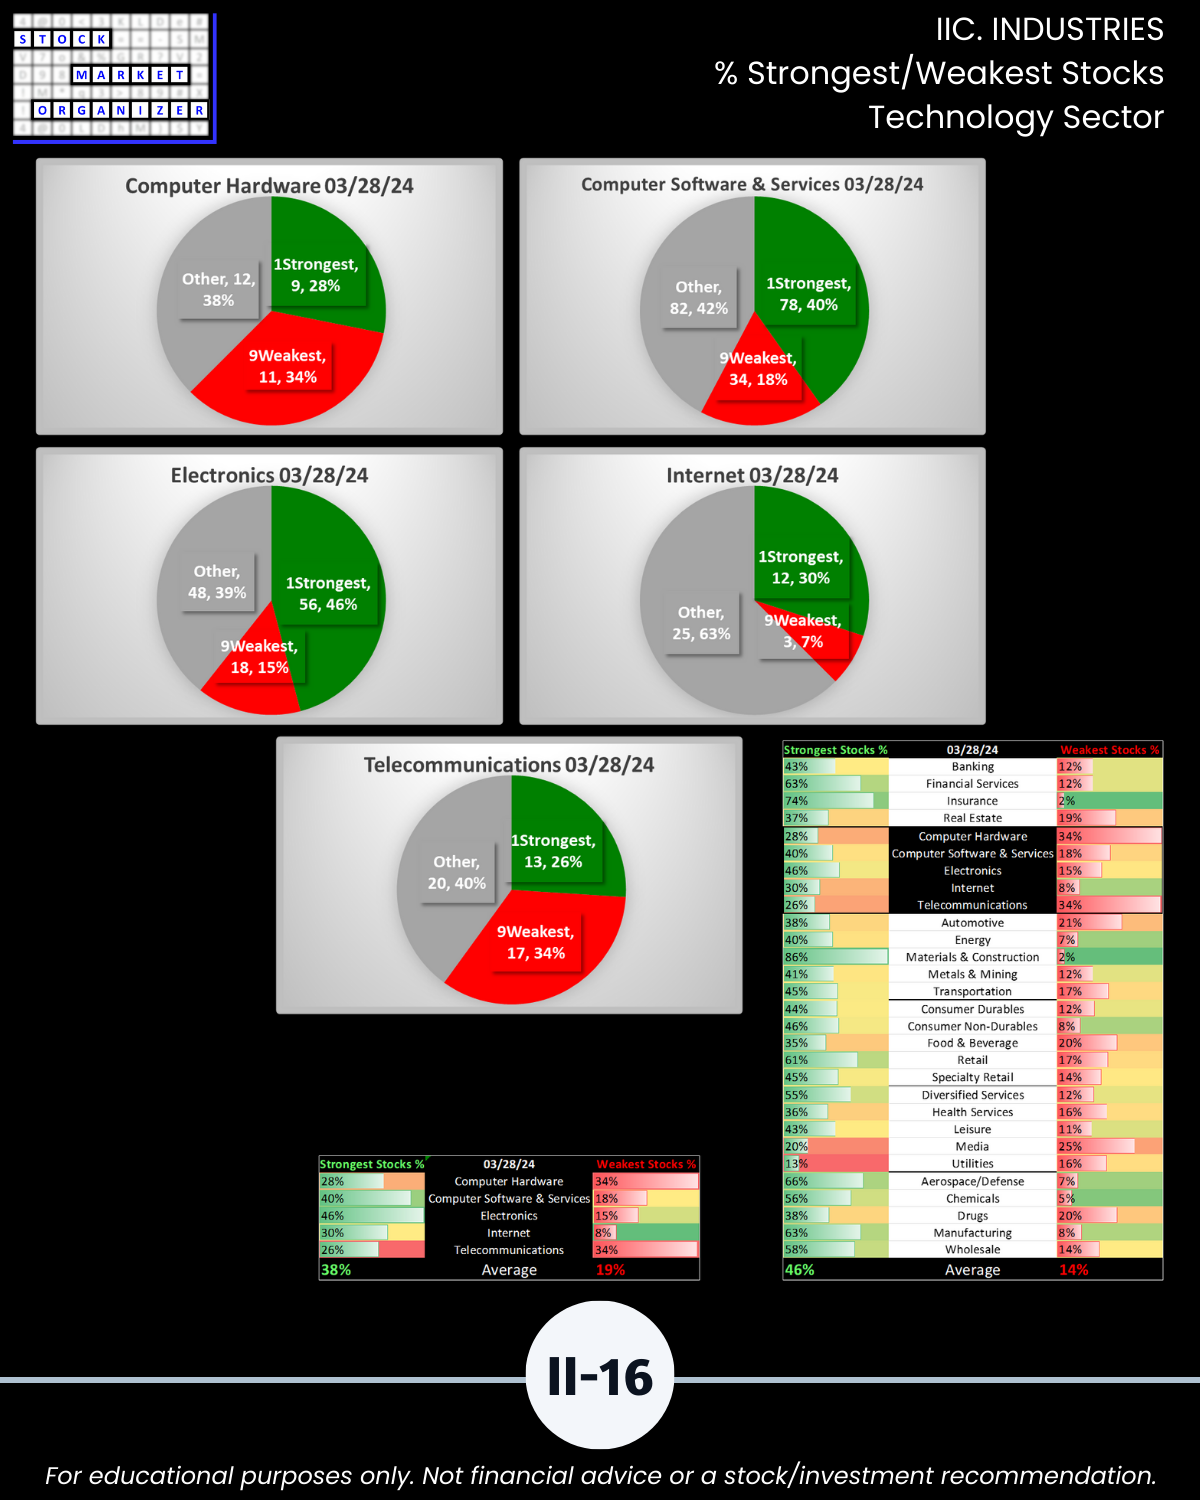
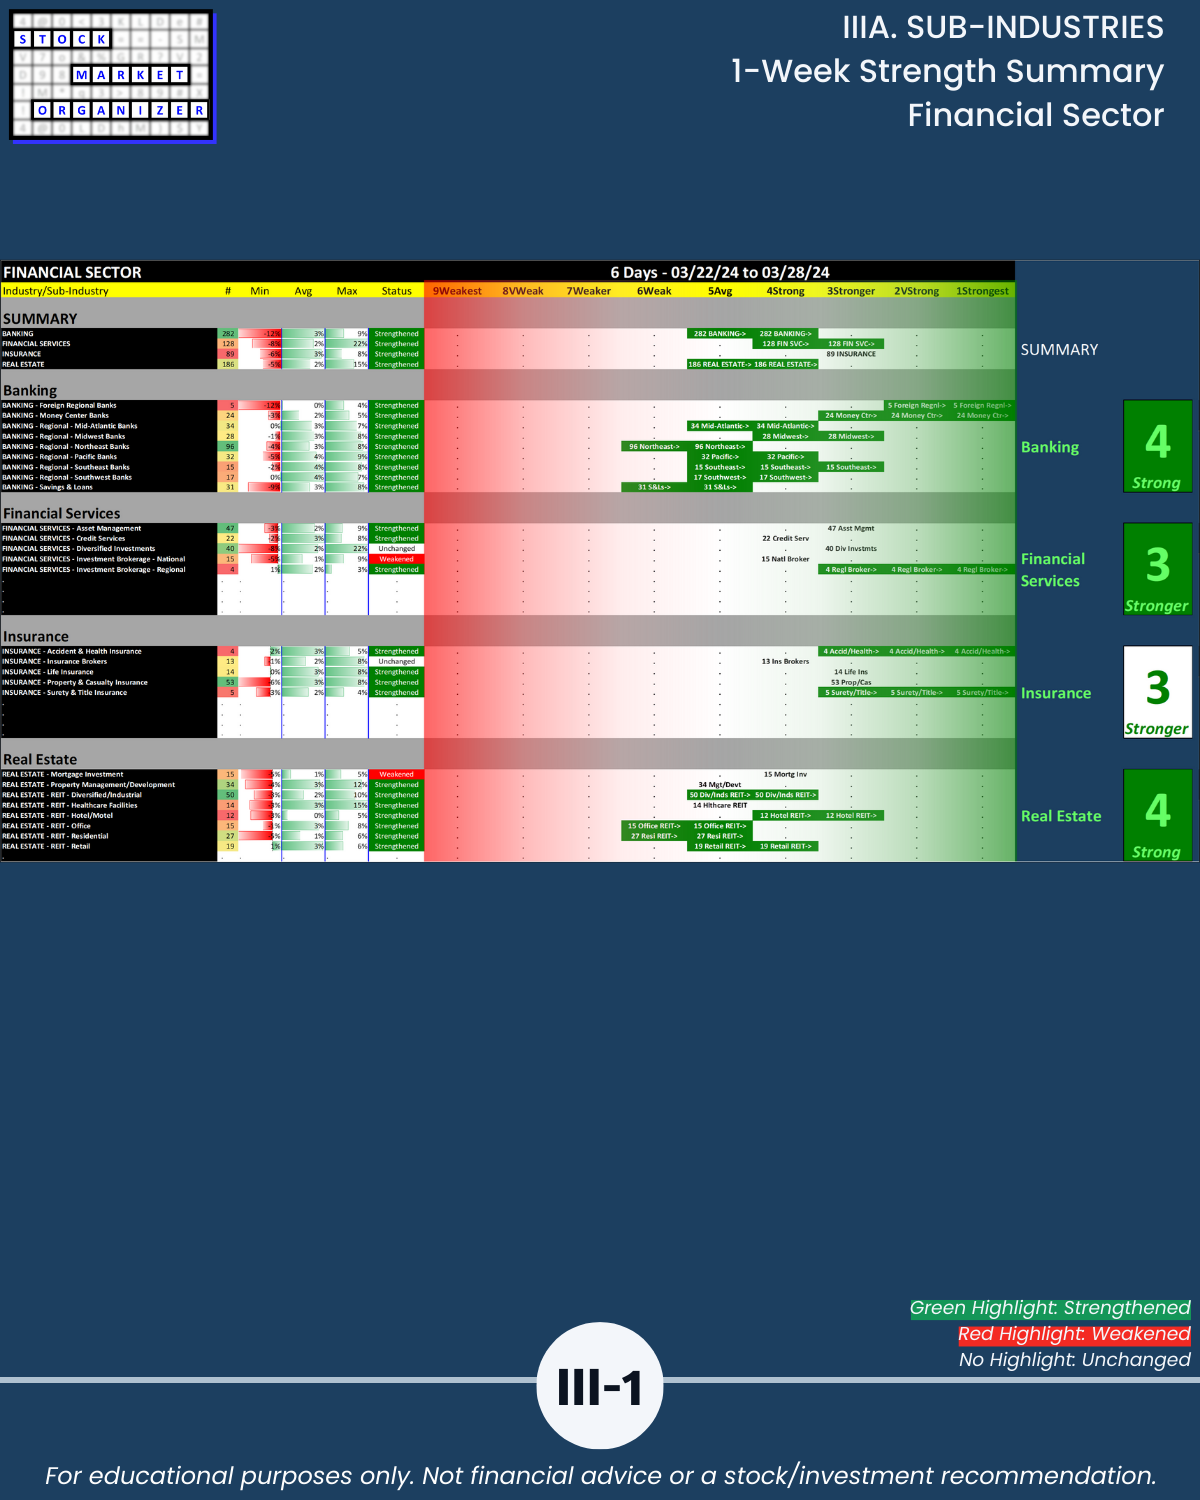
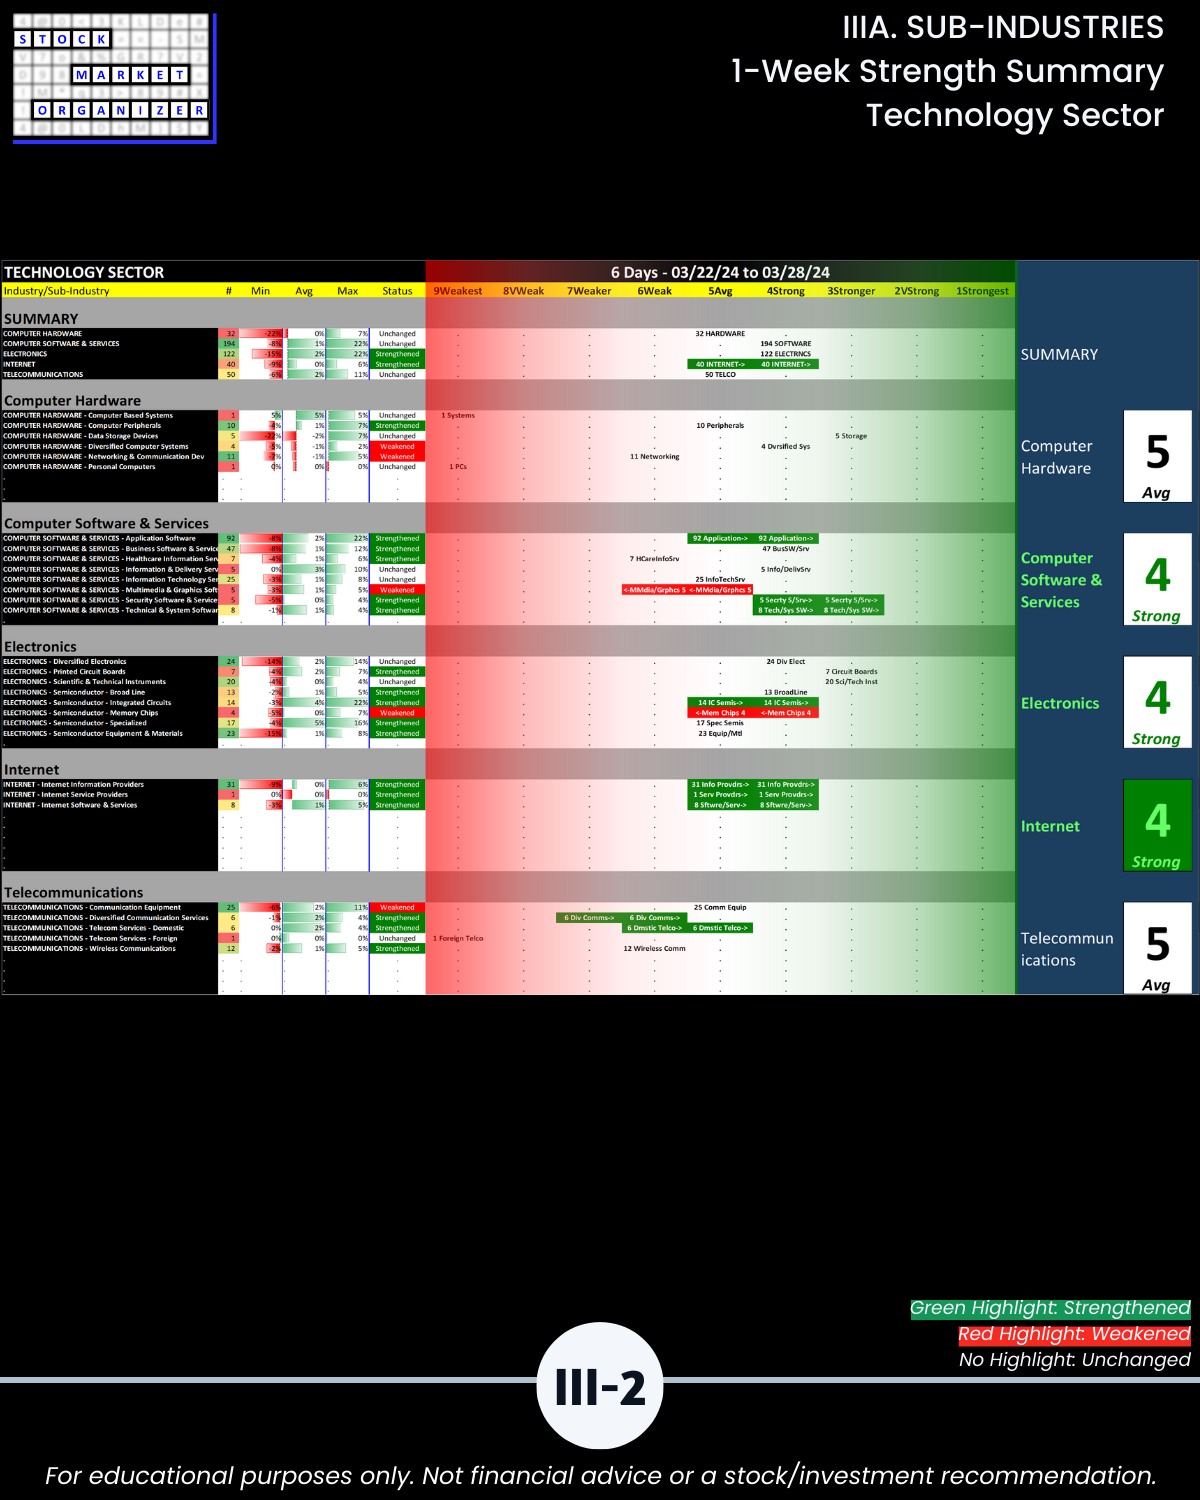
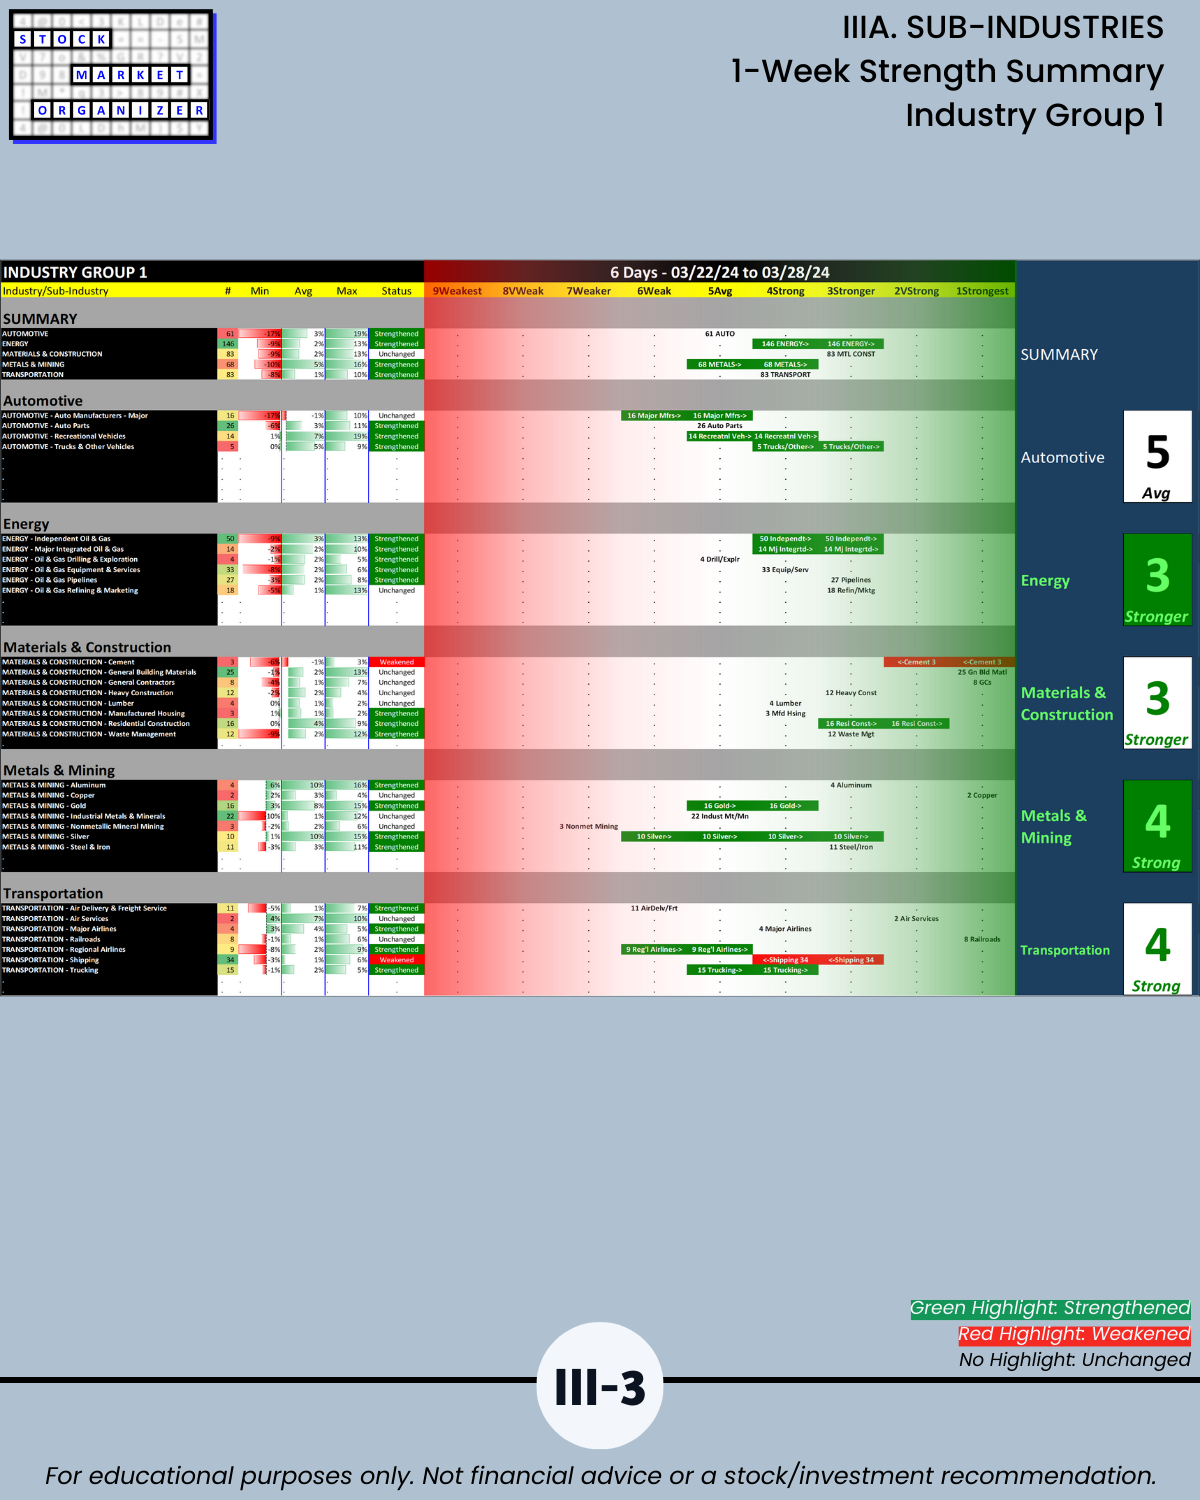
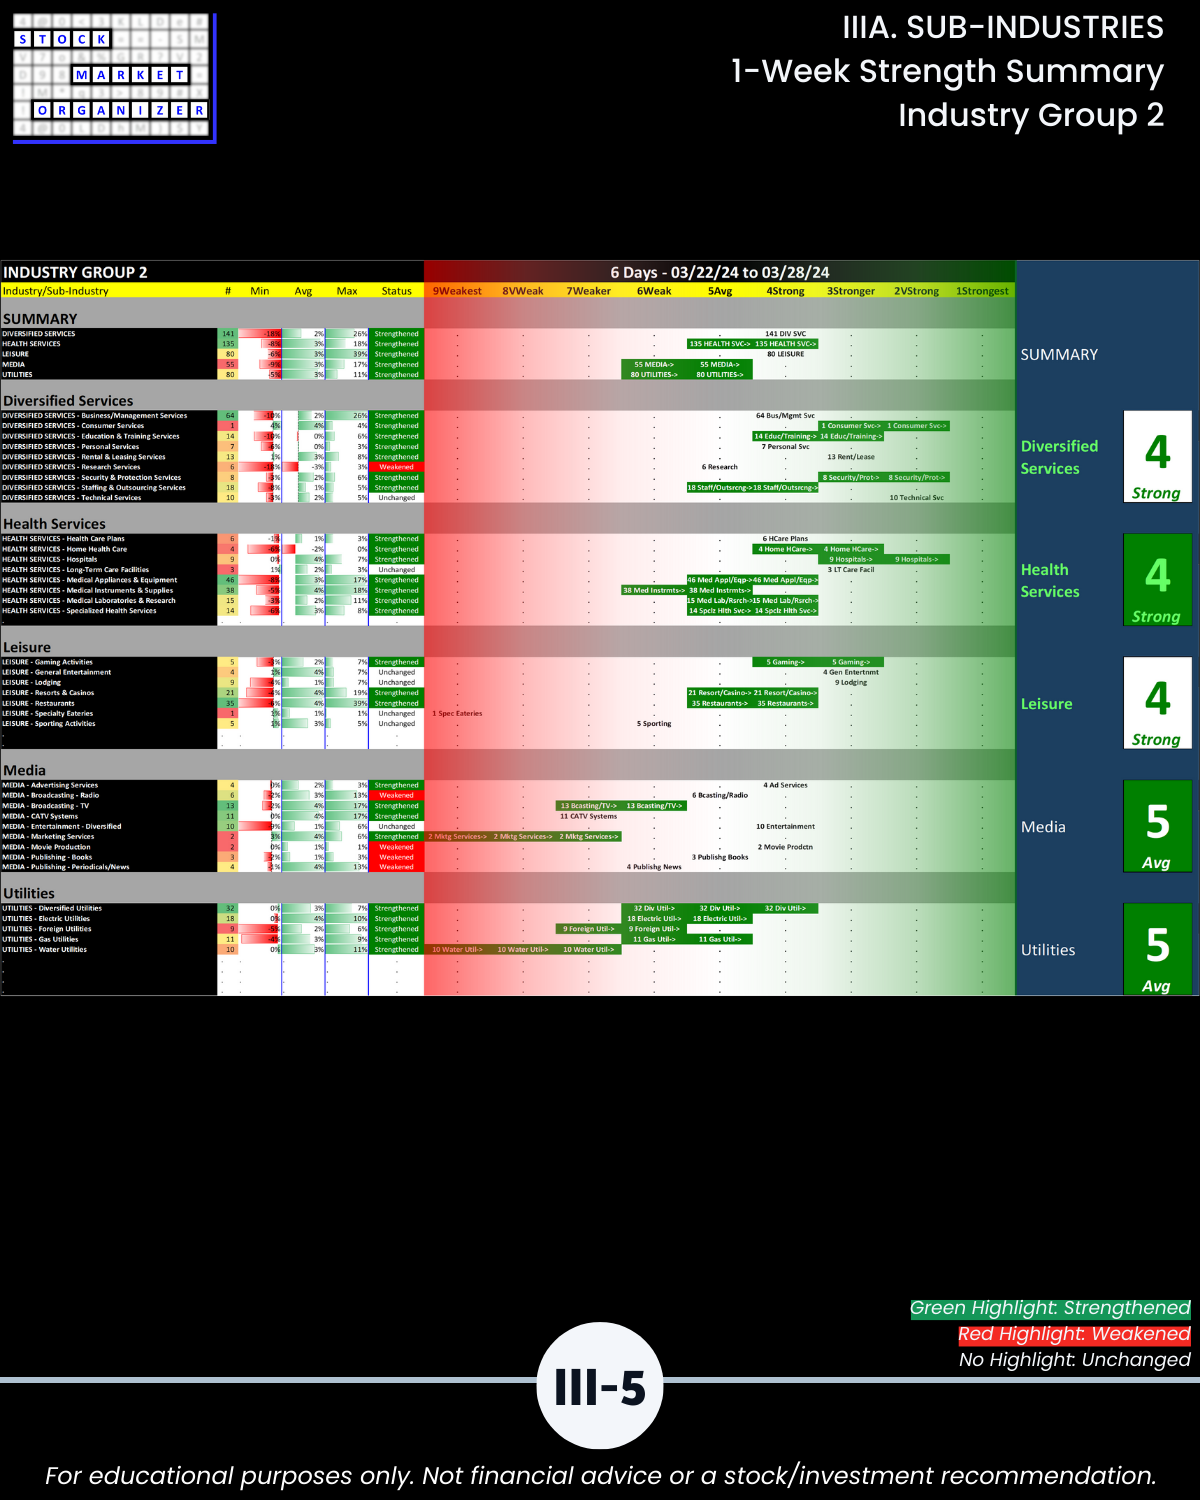
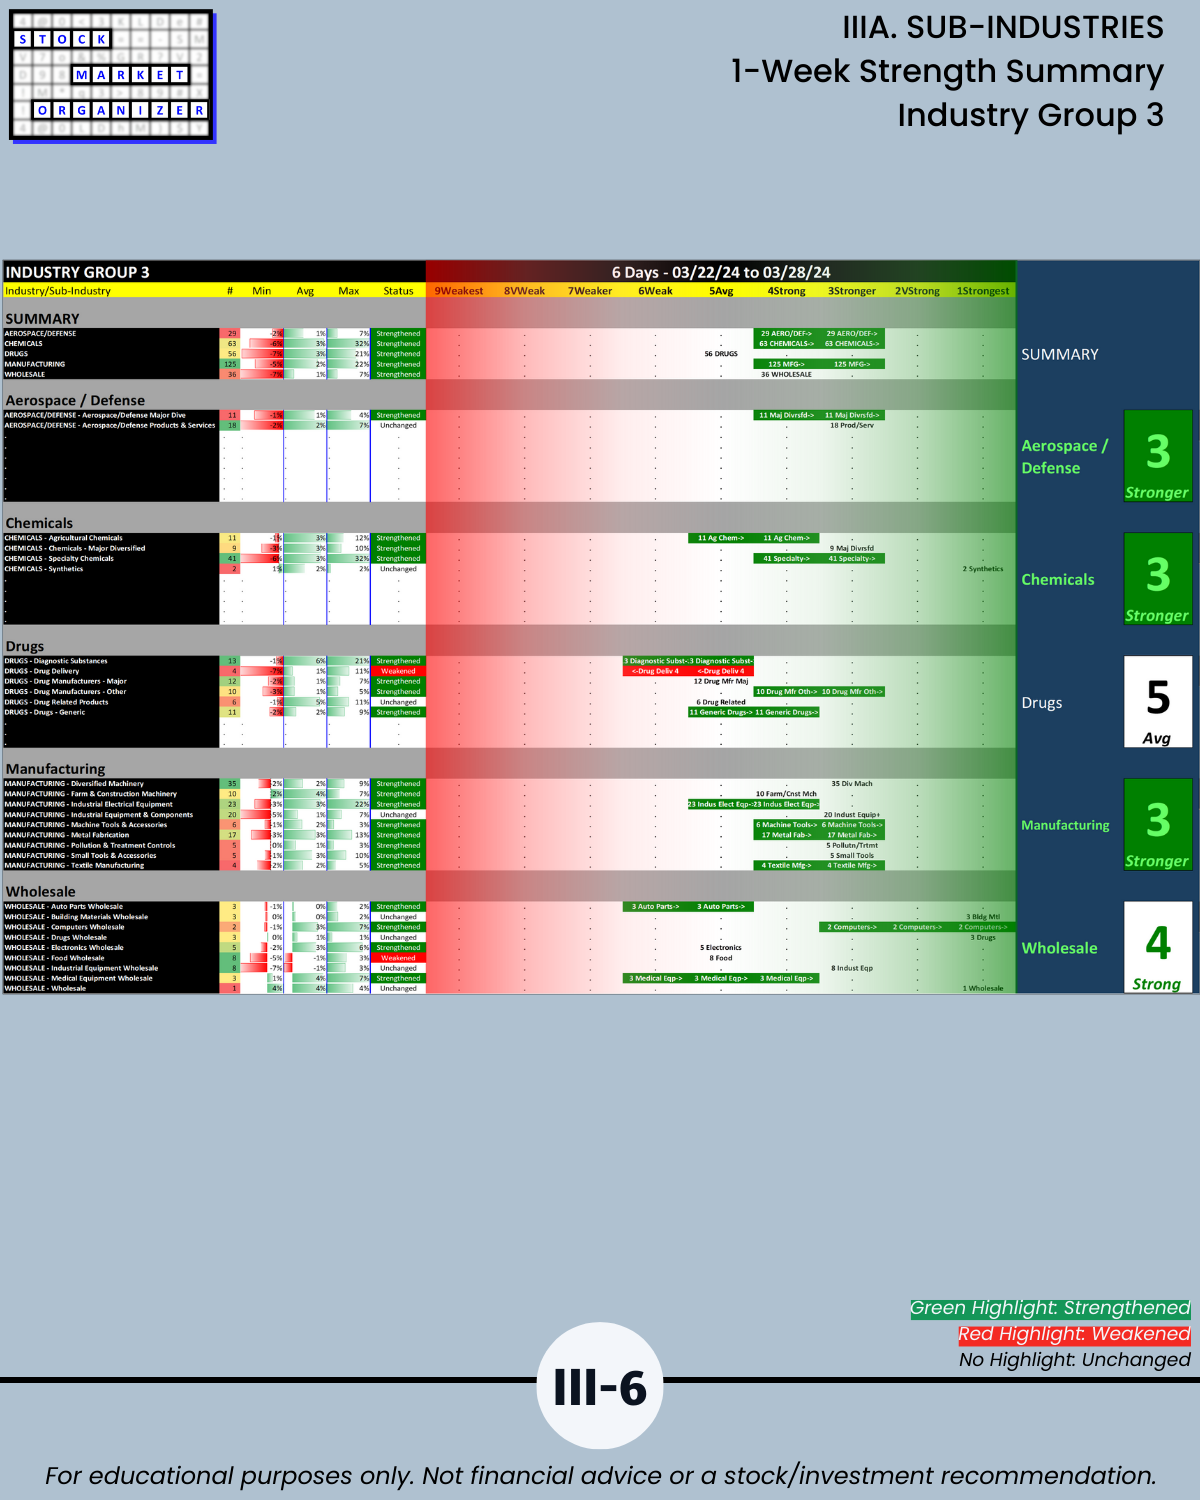
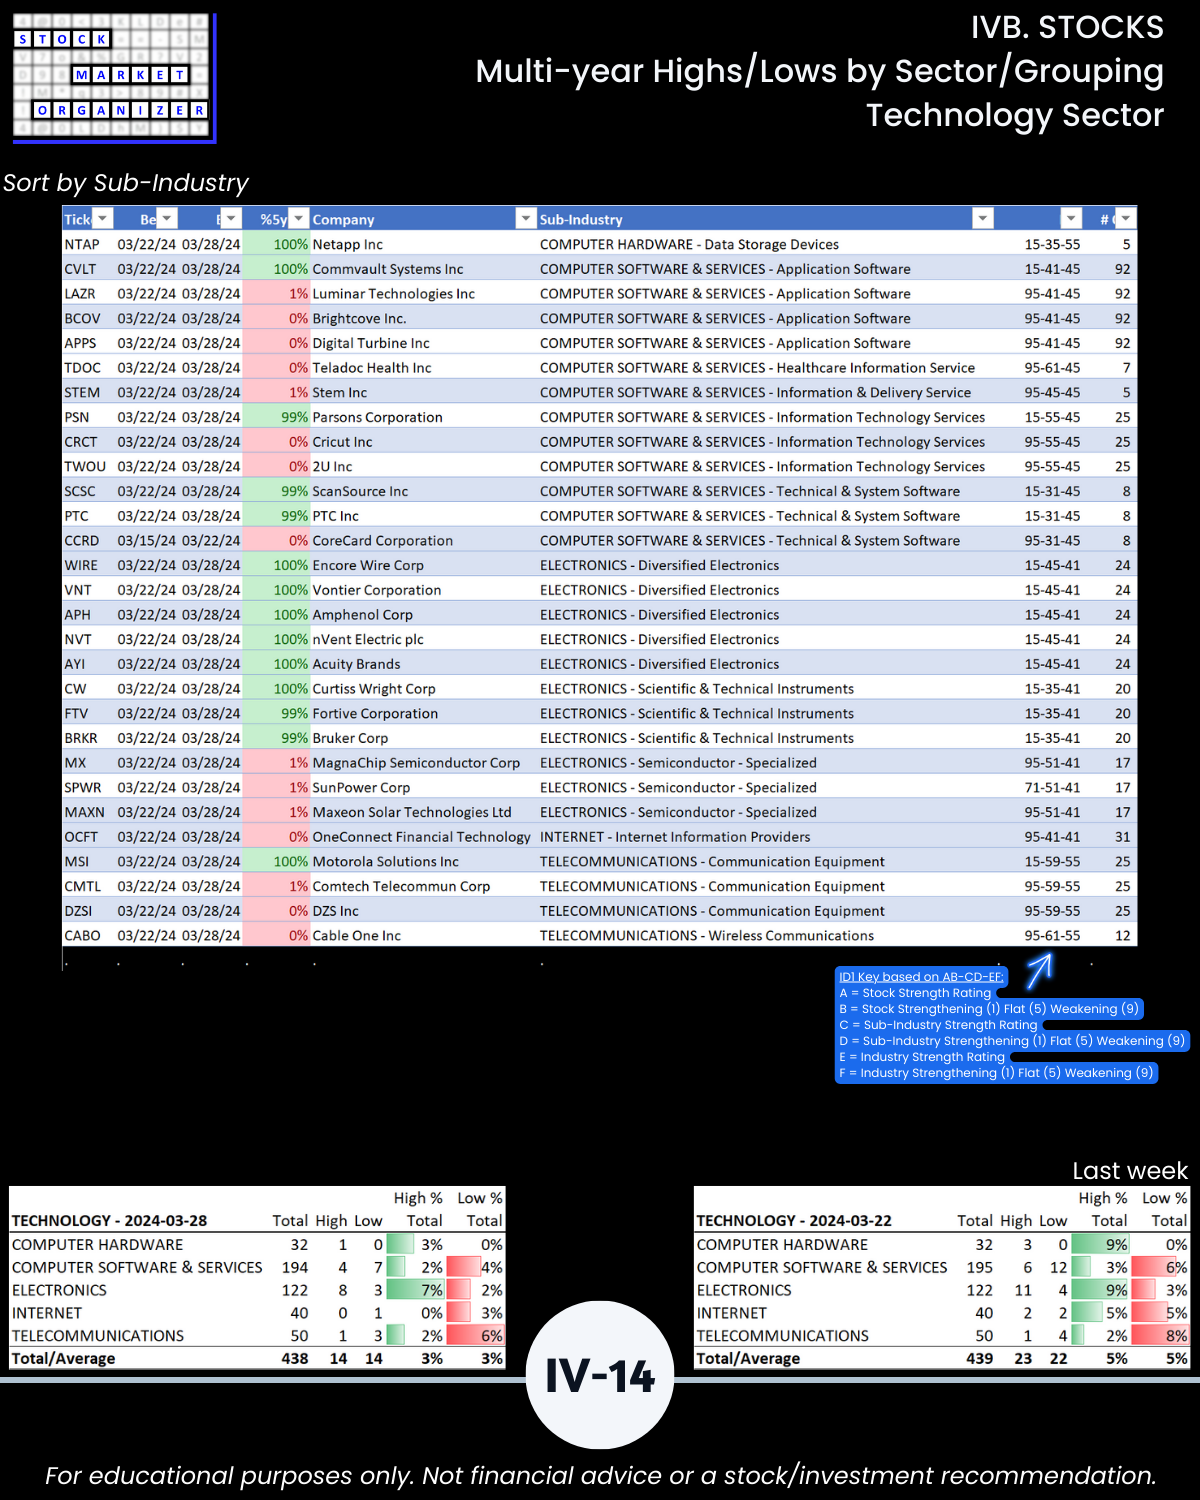
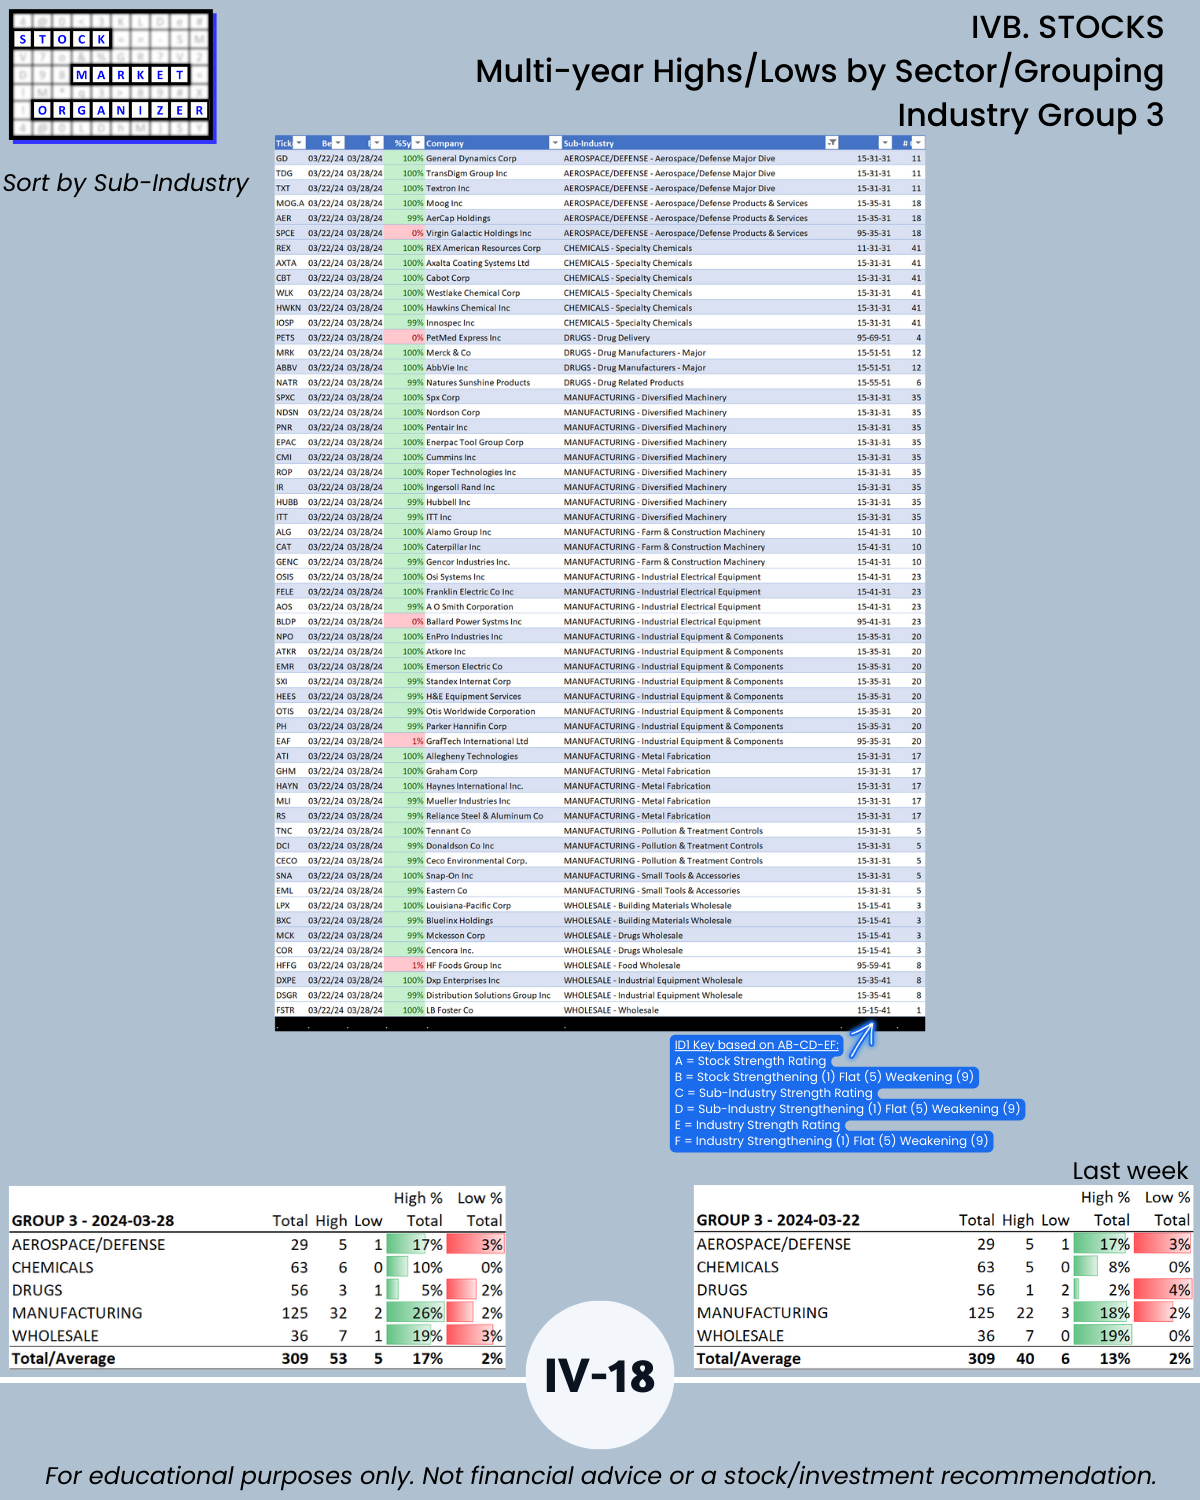
🔹 Tech (Hardware, Software/Services, Electronics aka Chips/Semis, Internet, Telecommunications) lagged among the 6 sectors/industry groupings and strengthened by only +0.1 to 4.2. The average sector/group strengthening was +0.5 and Financials were best at +0.9. Group 3 has the best score at 3.5 (Aerospace Defense, Chemicals, Drugs, Manufacturing, and Wholesale).
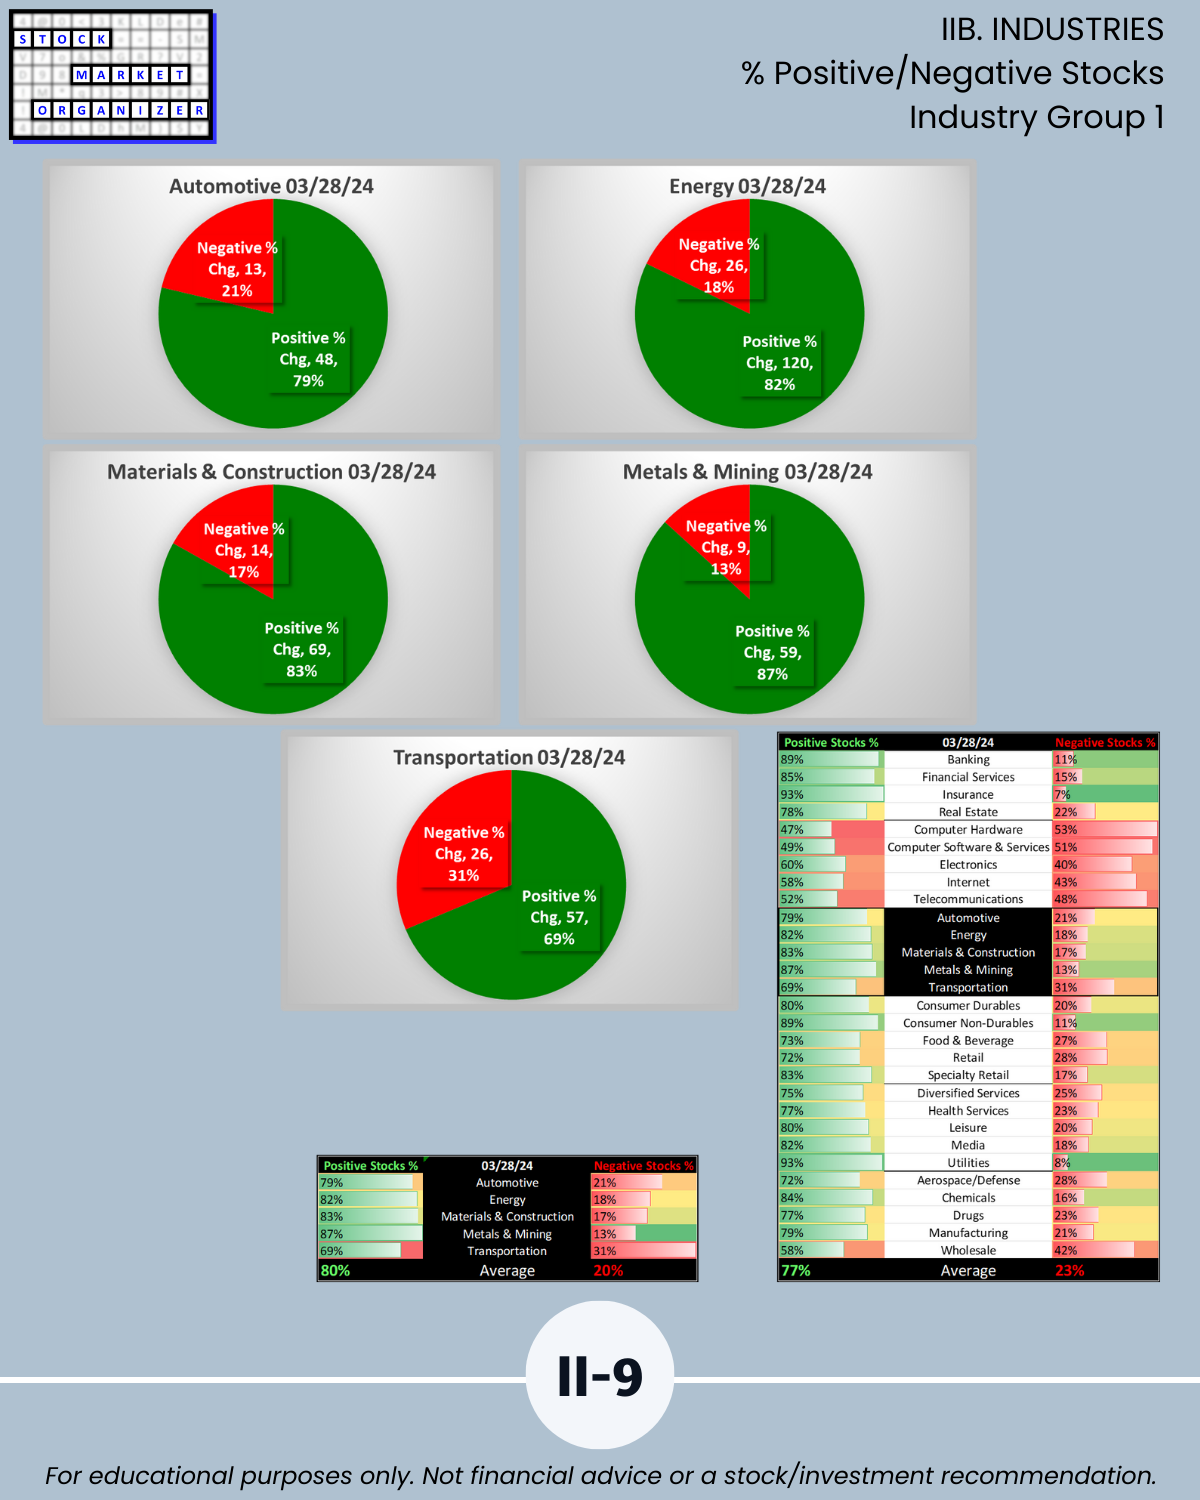
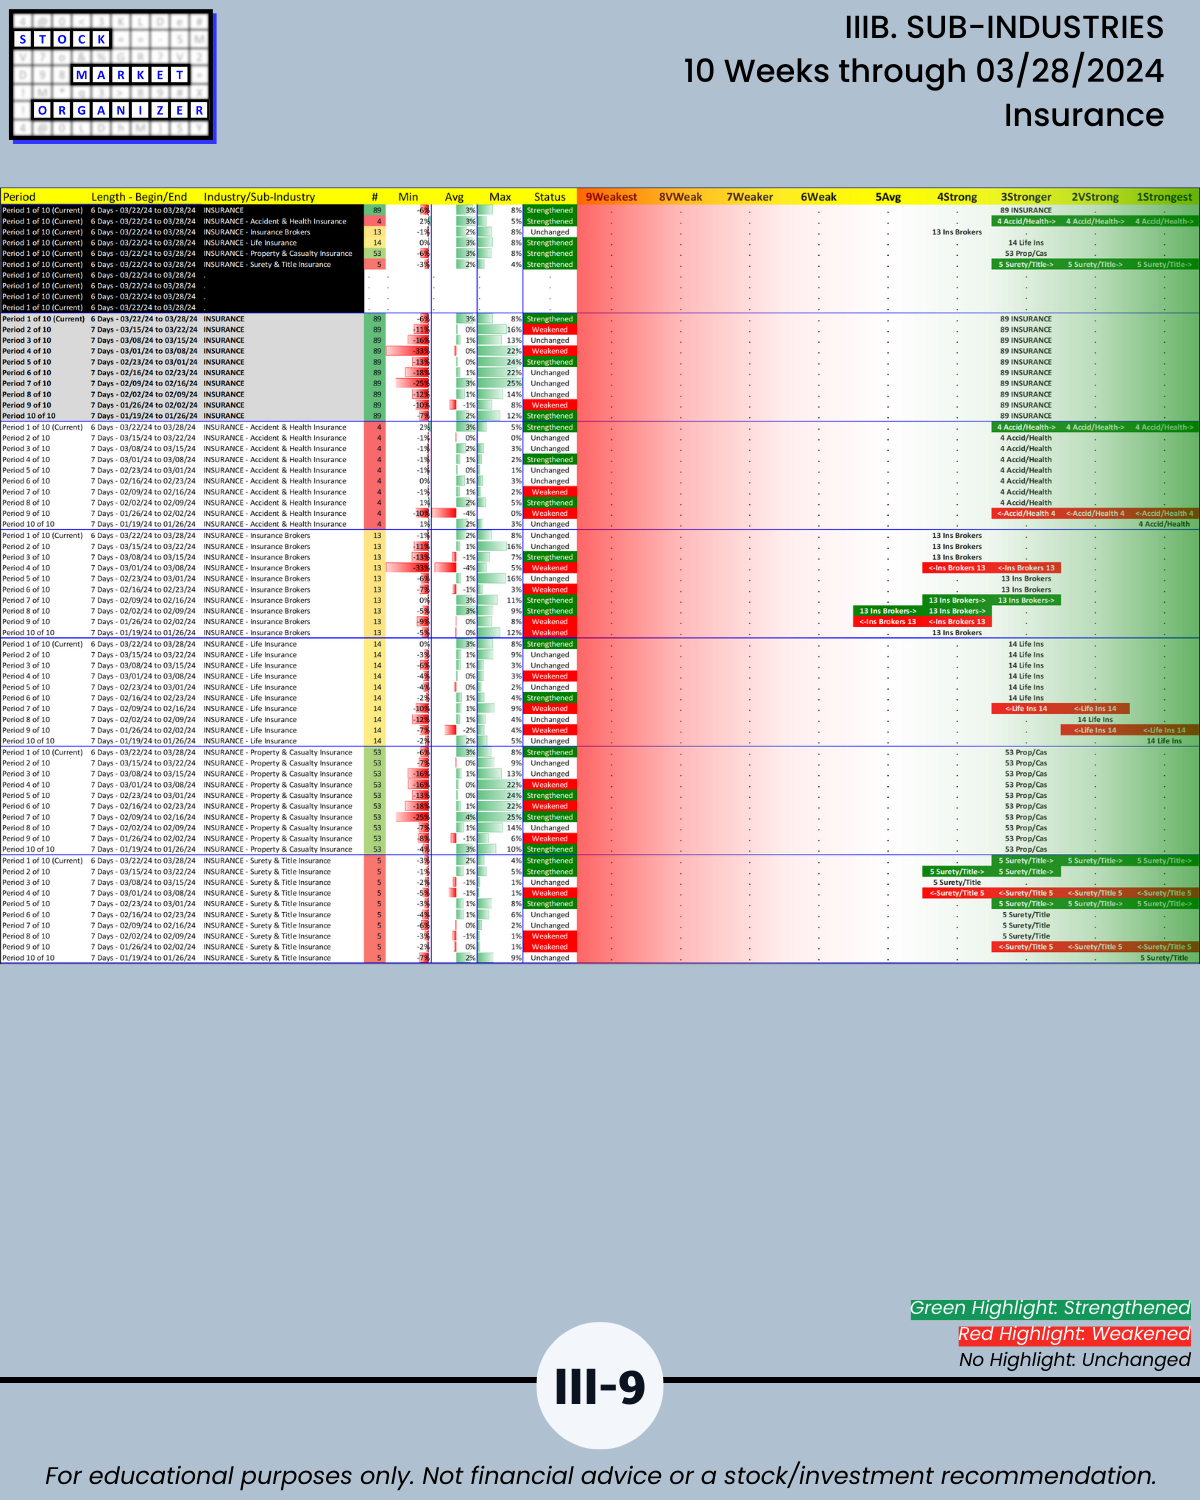
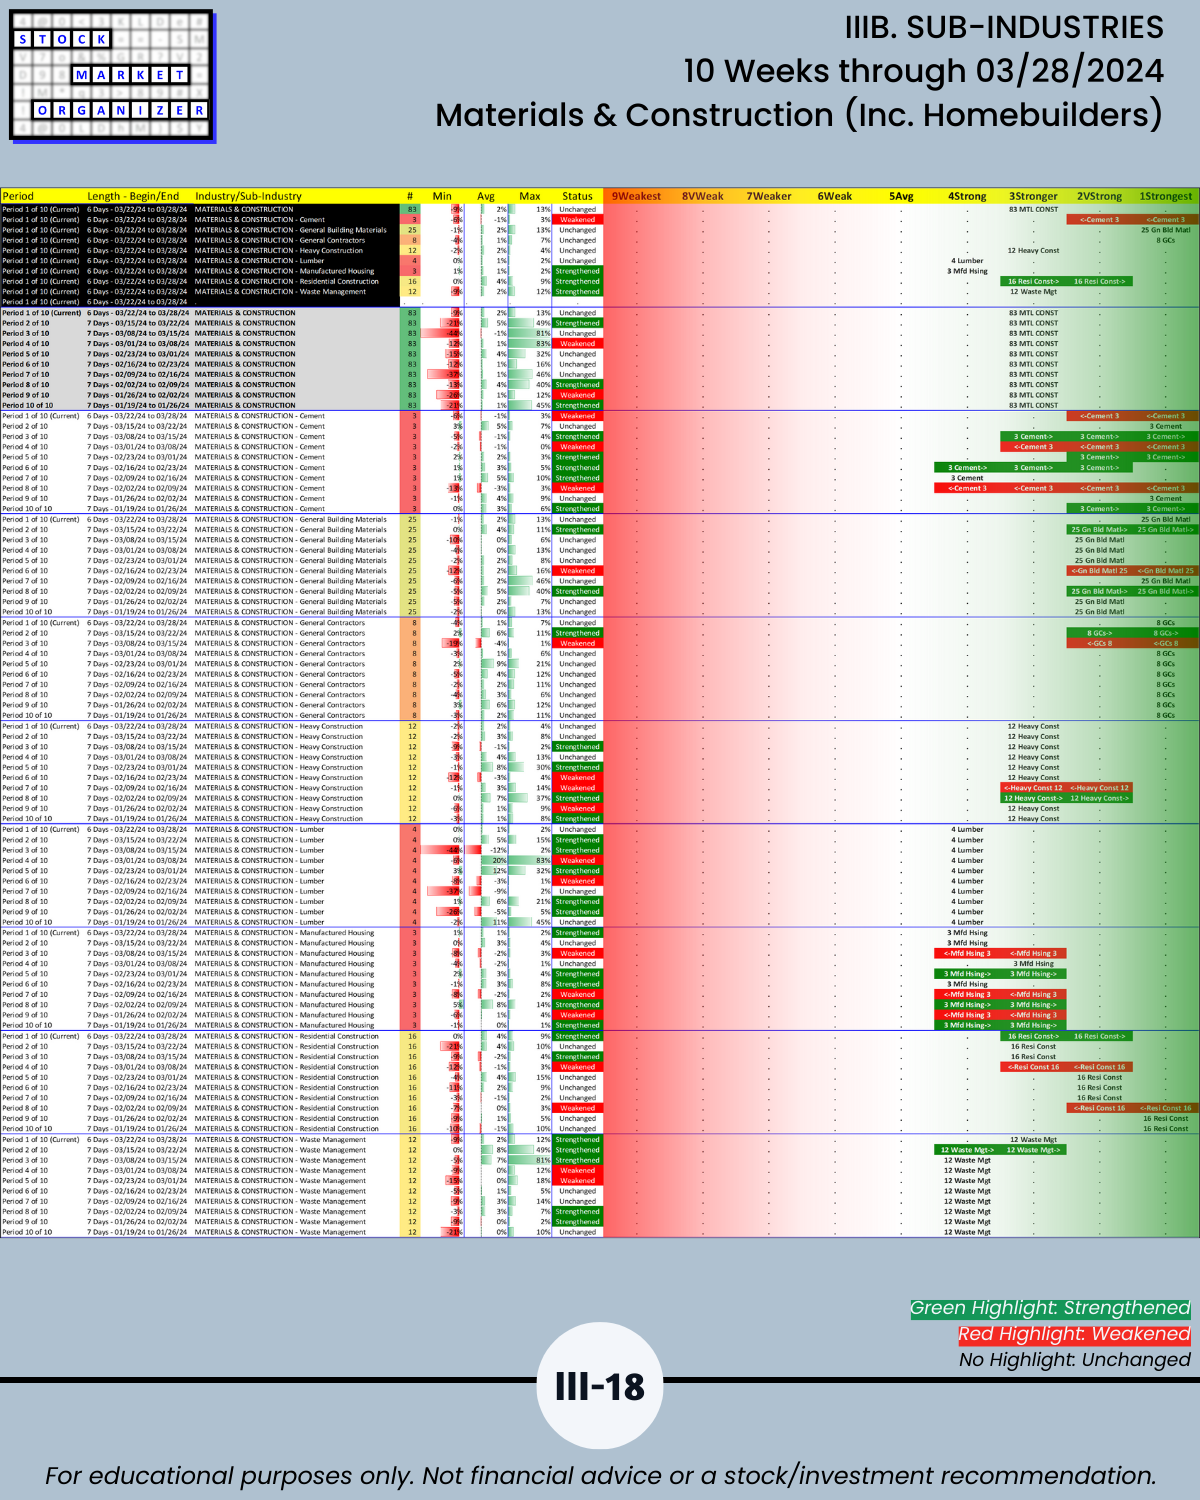
🔹 Longtime industry leaders Insurance and Materials & Construction were joined at the Stronger rating (3rd strongest of 9 strength levels) by the following 5 industries:
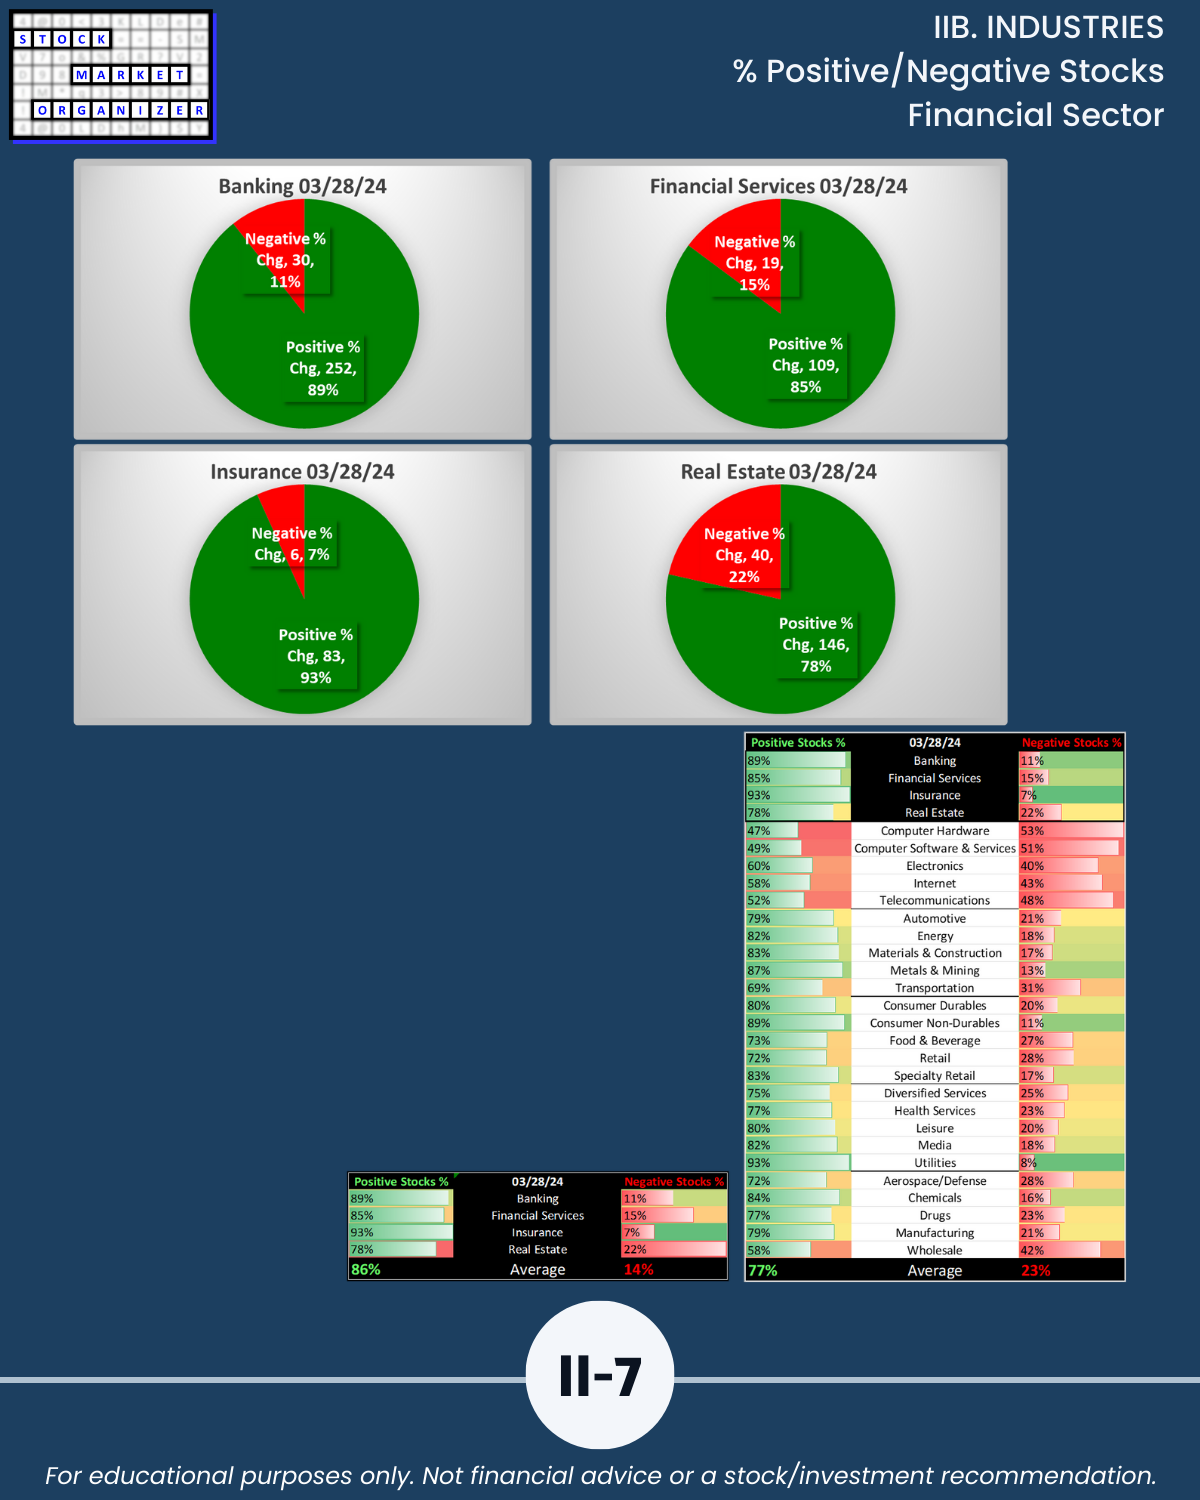
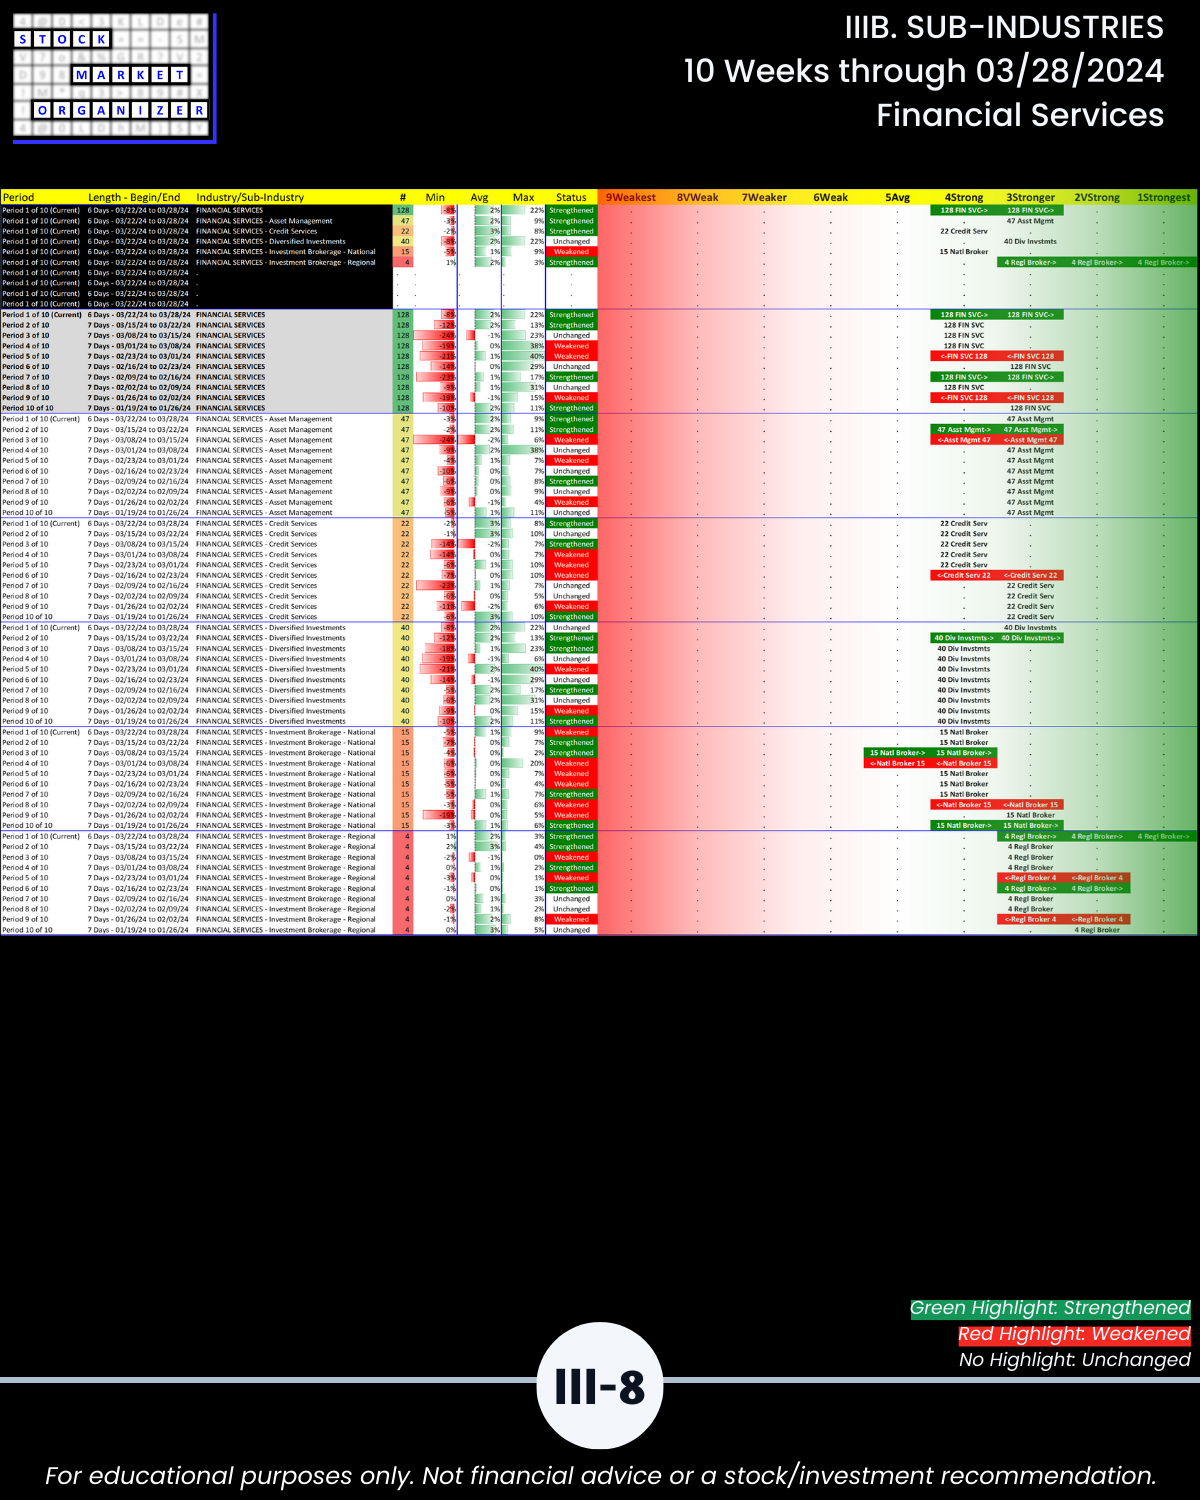
- Financial Services
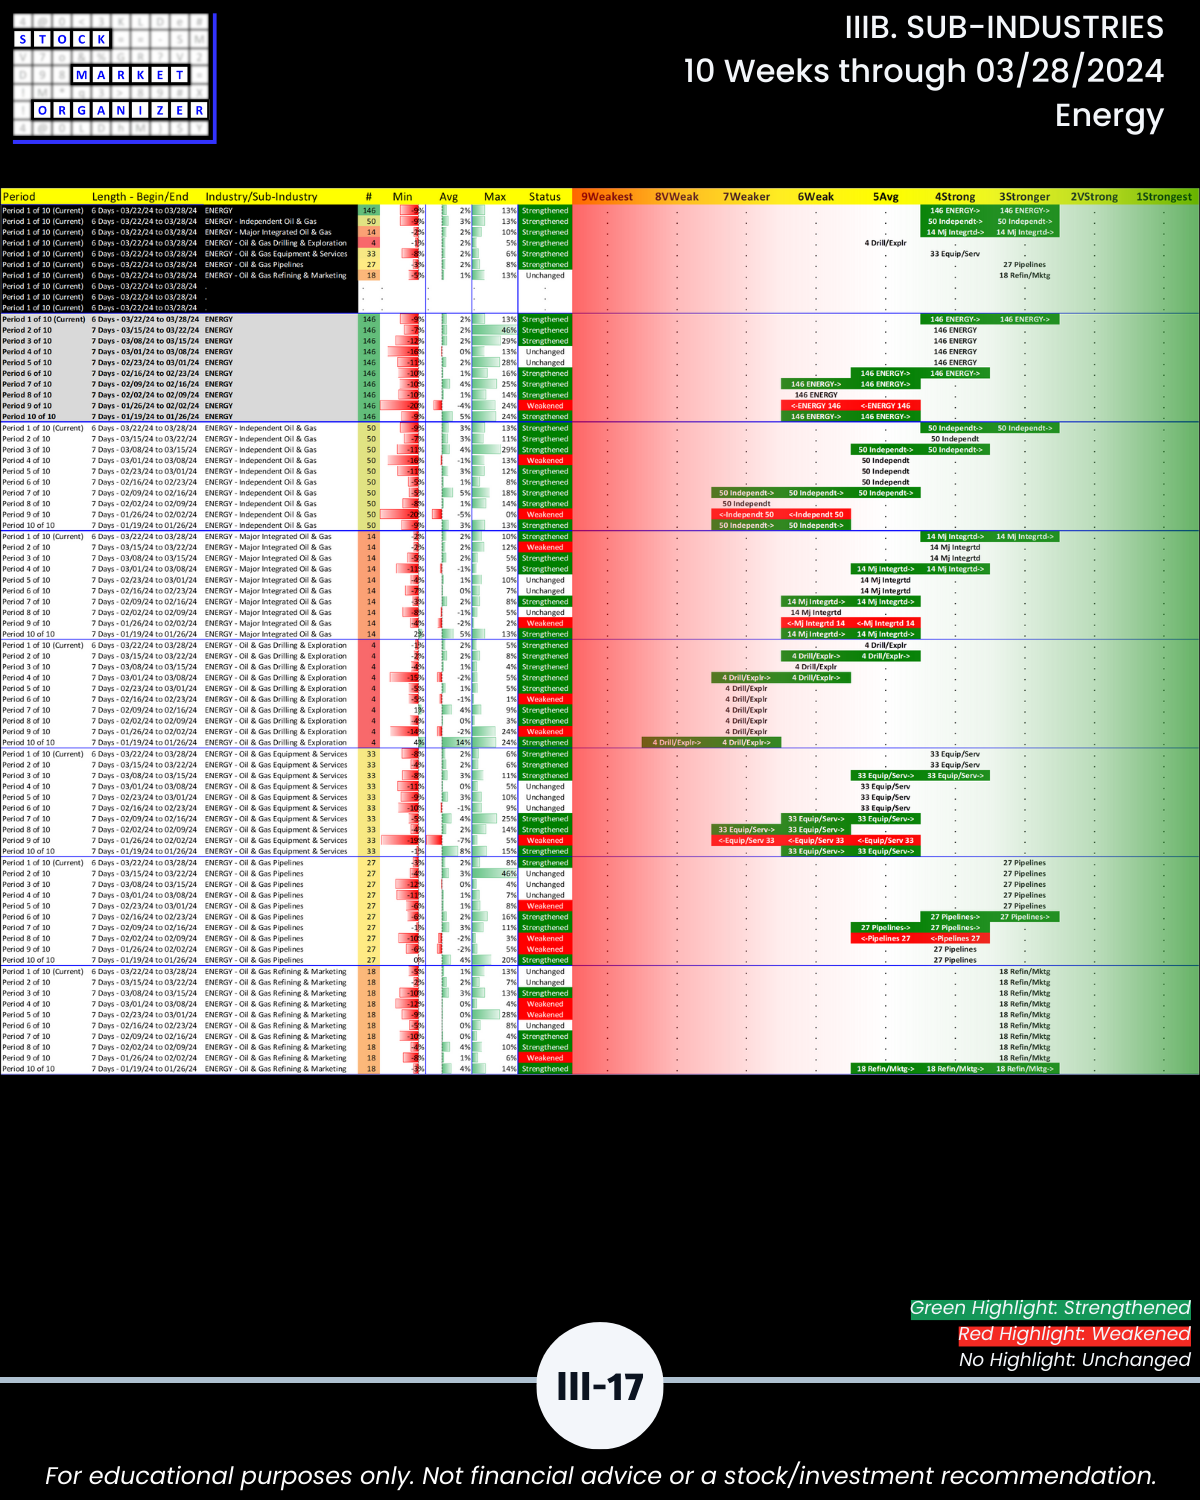
- Energy
- Aerospace Defense
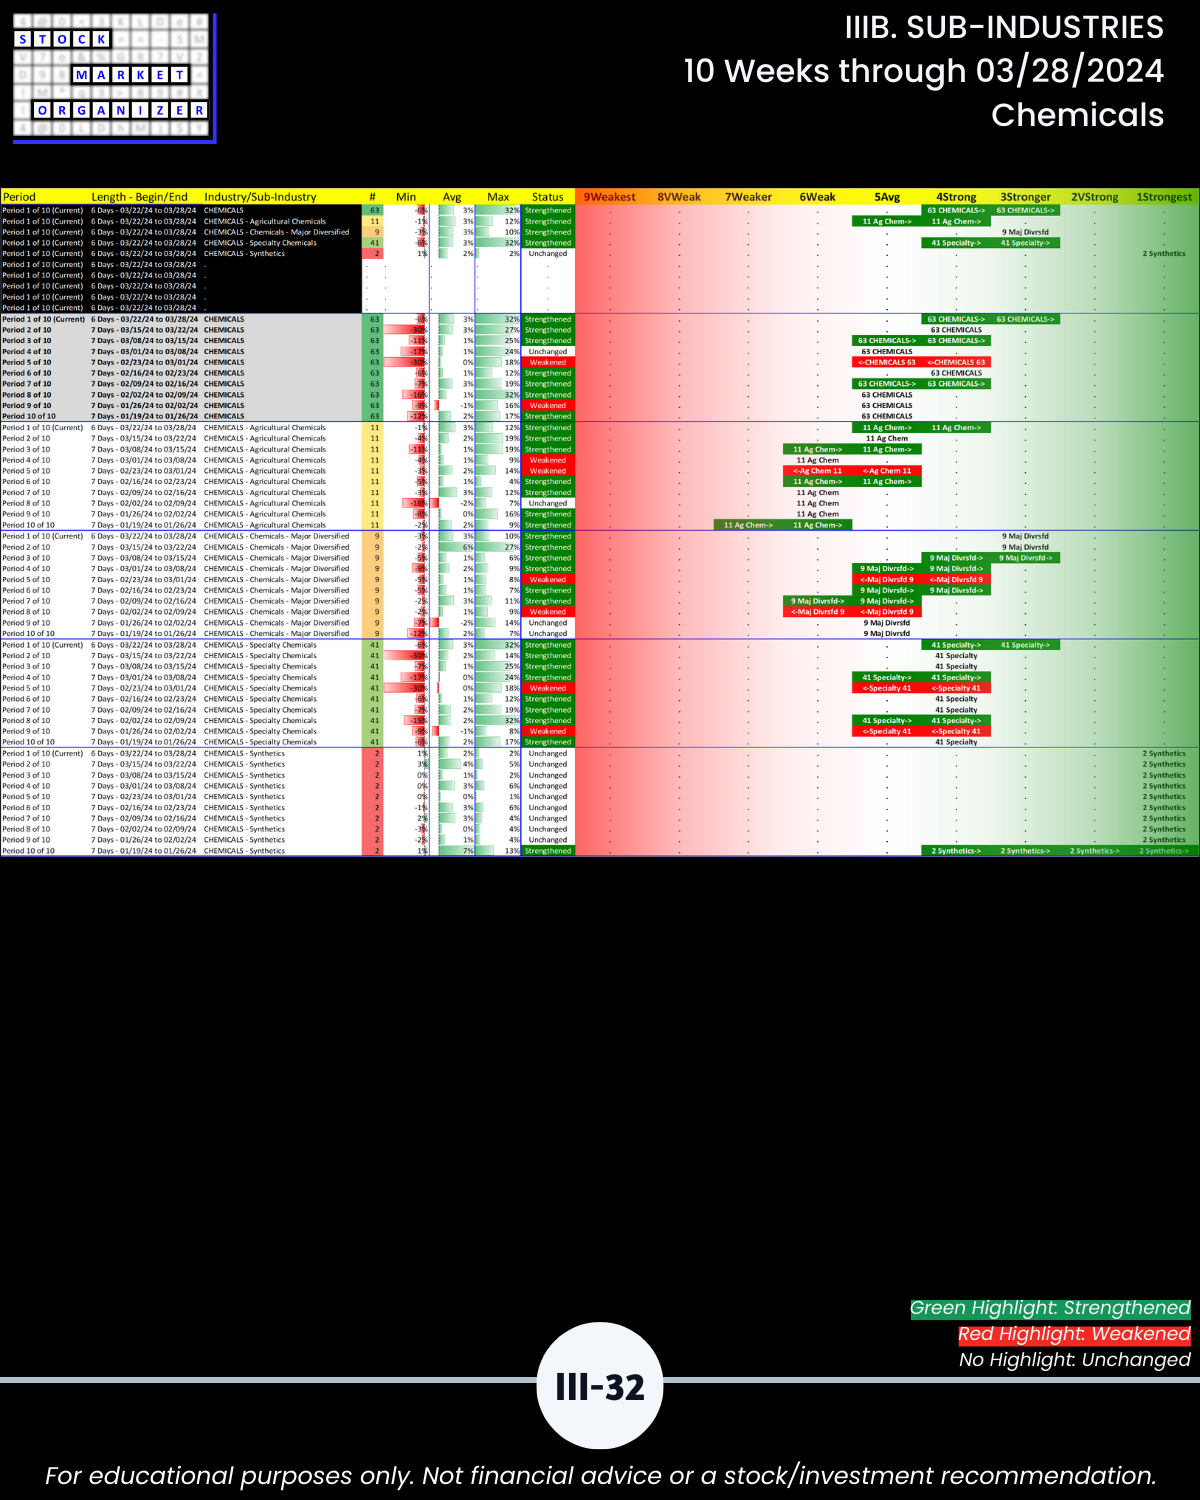
- Chemicals
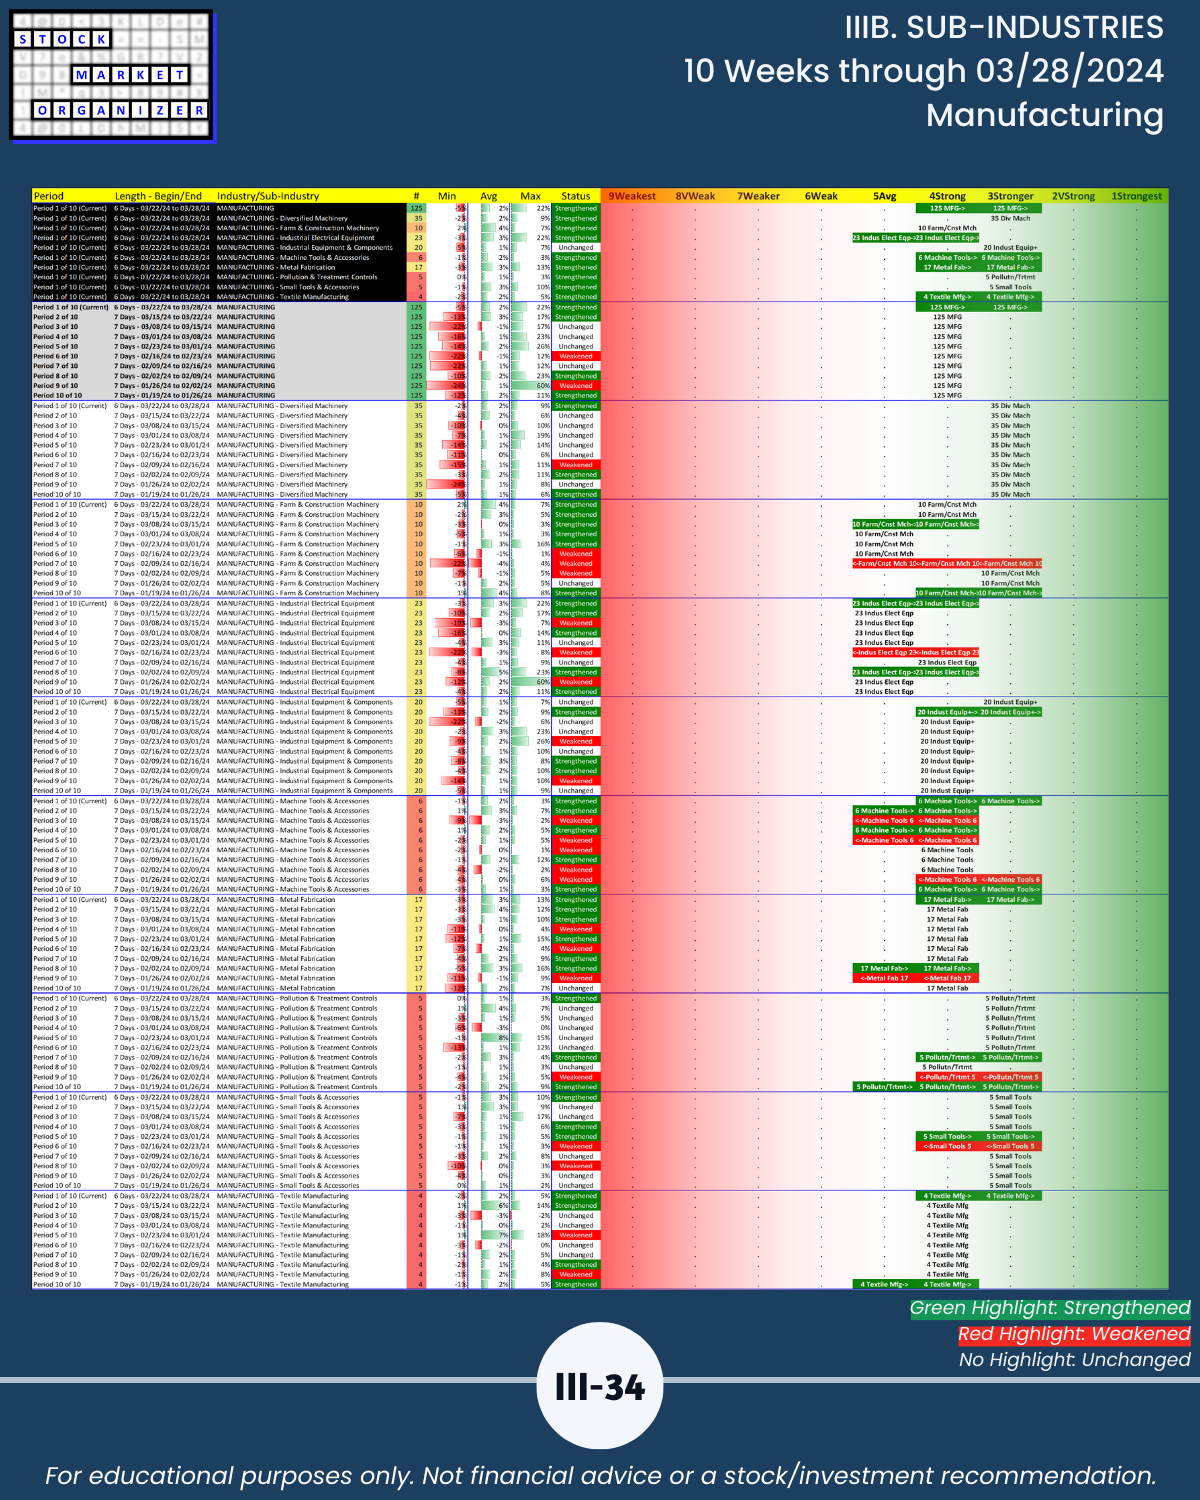
- Manufacturing
🔹 The 6 “weakest” industries are all rated Average:
- Computer Hardware
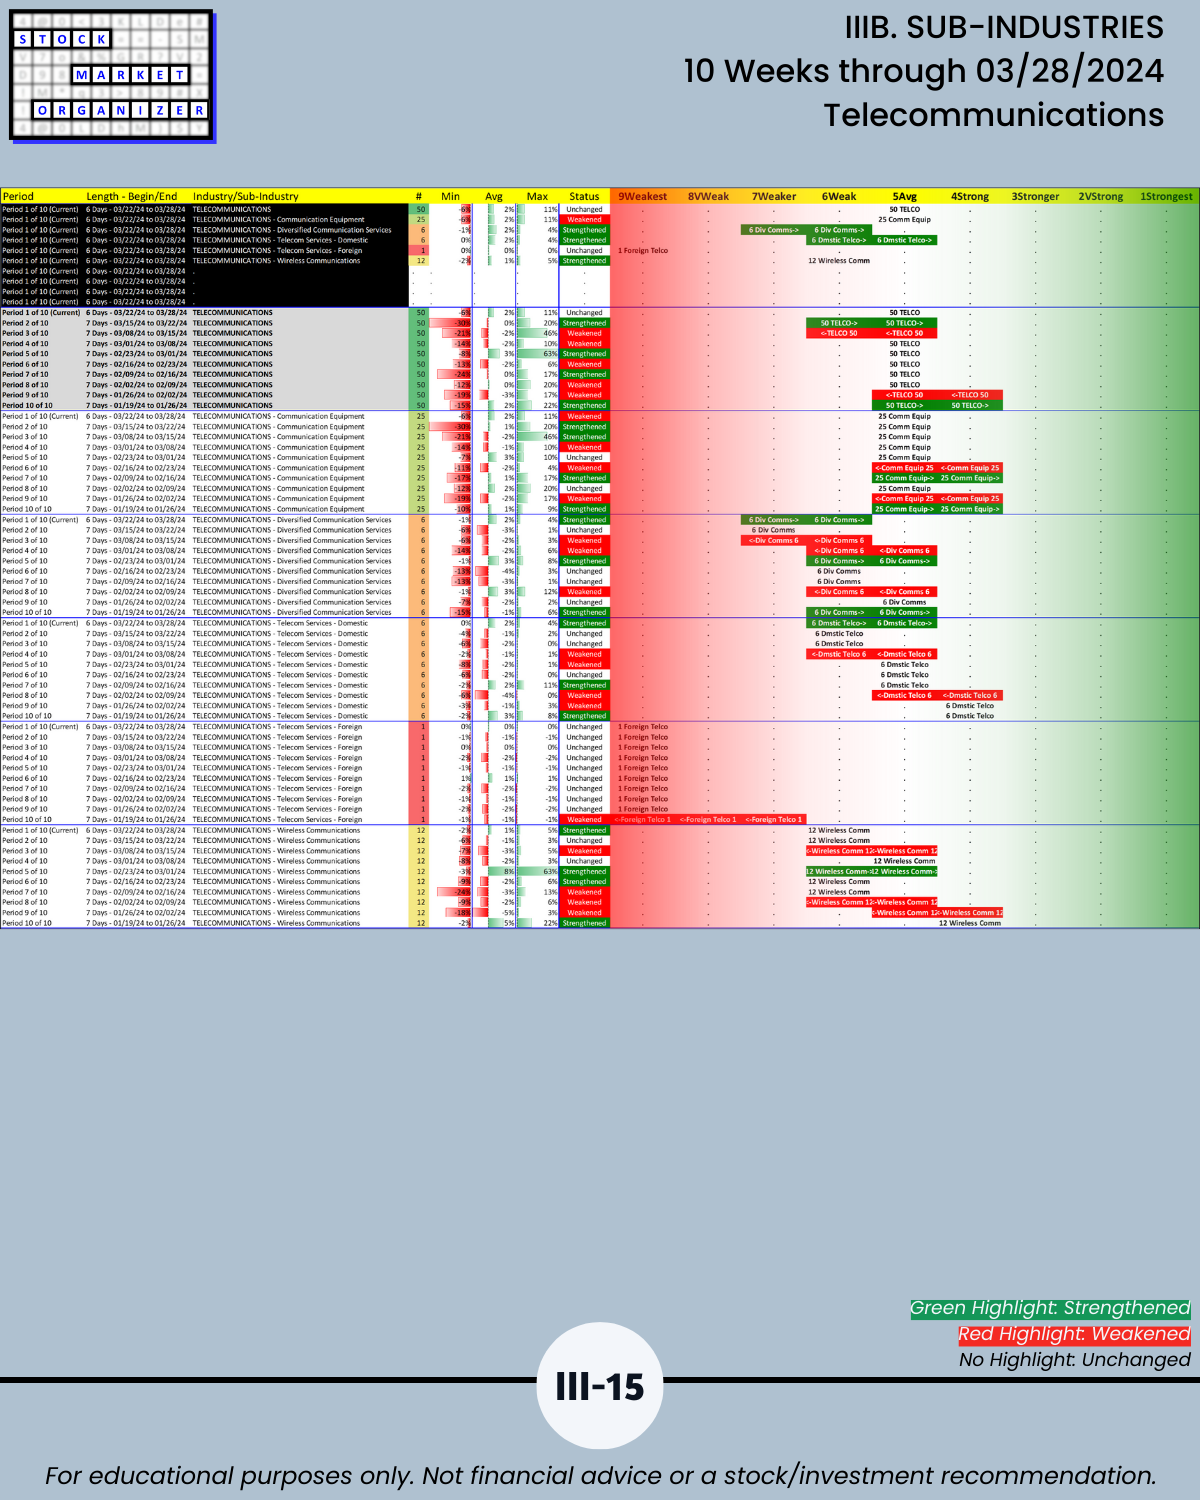
- Telecommunications
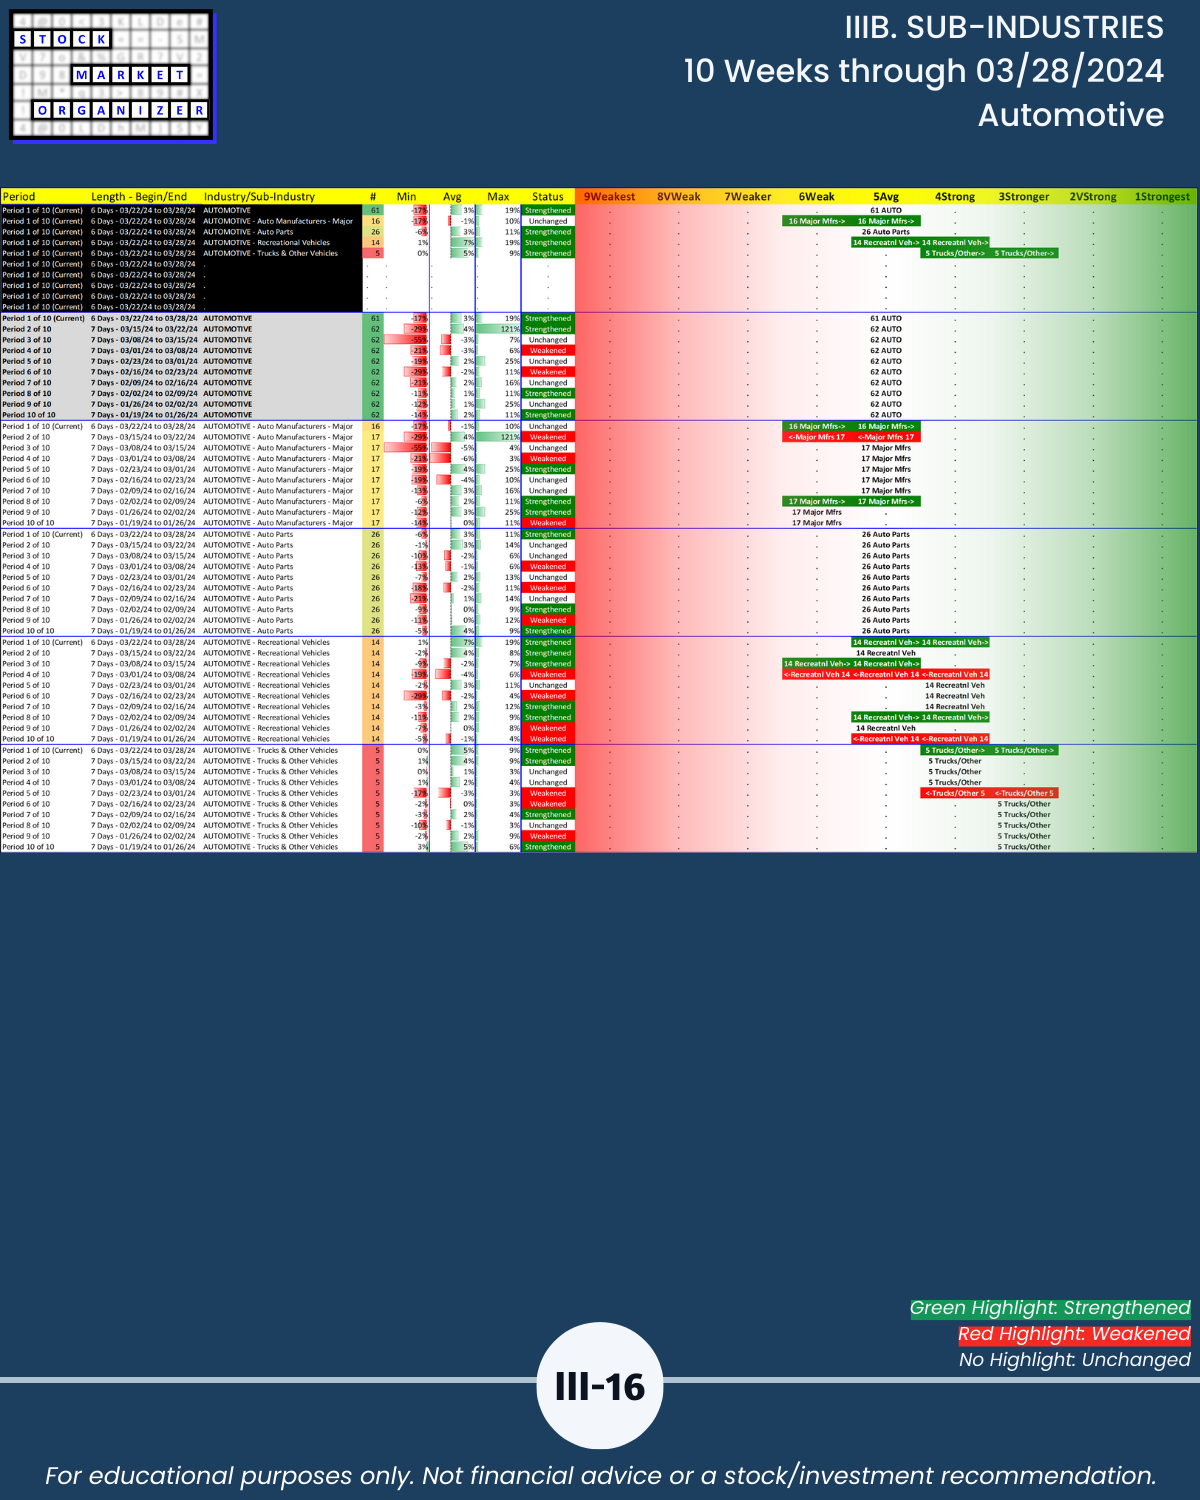
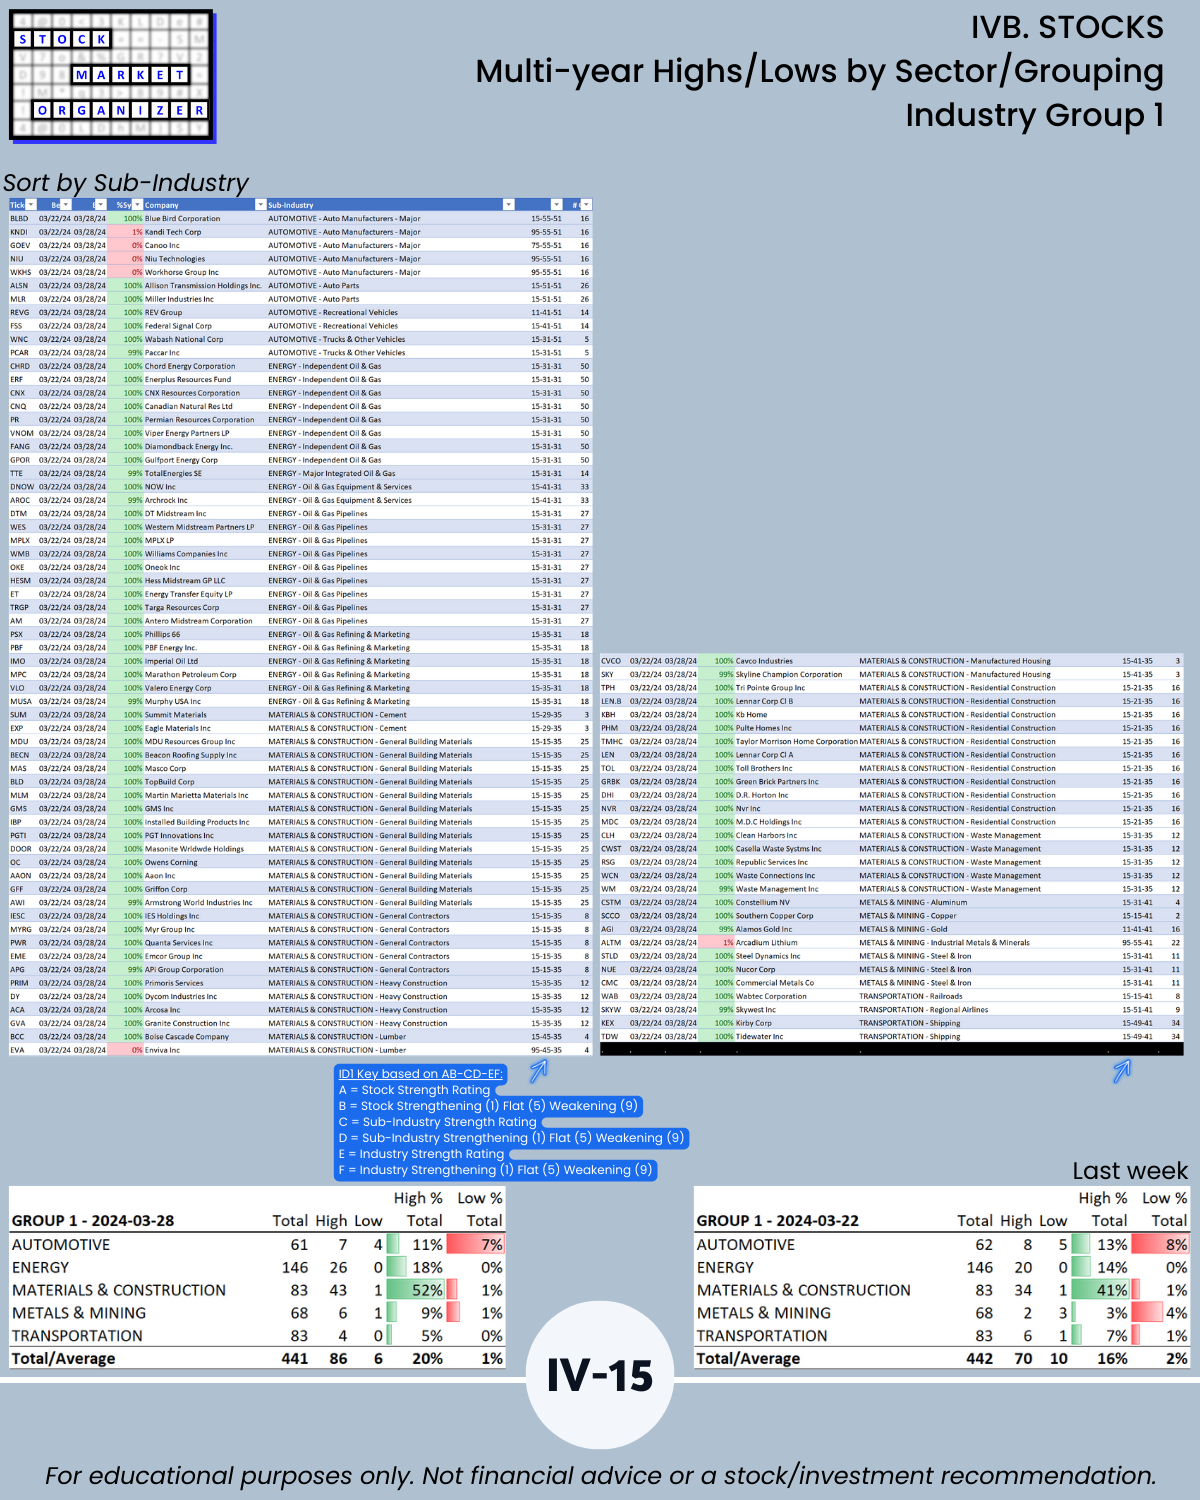
- Automotive
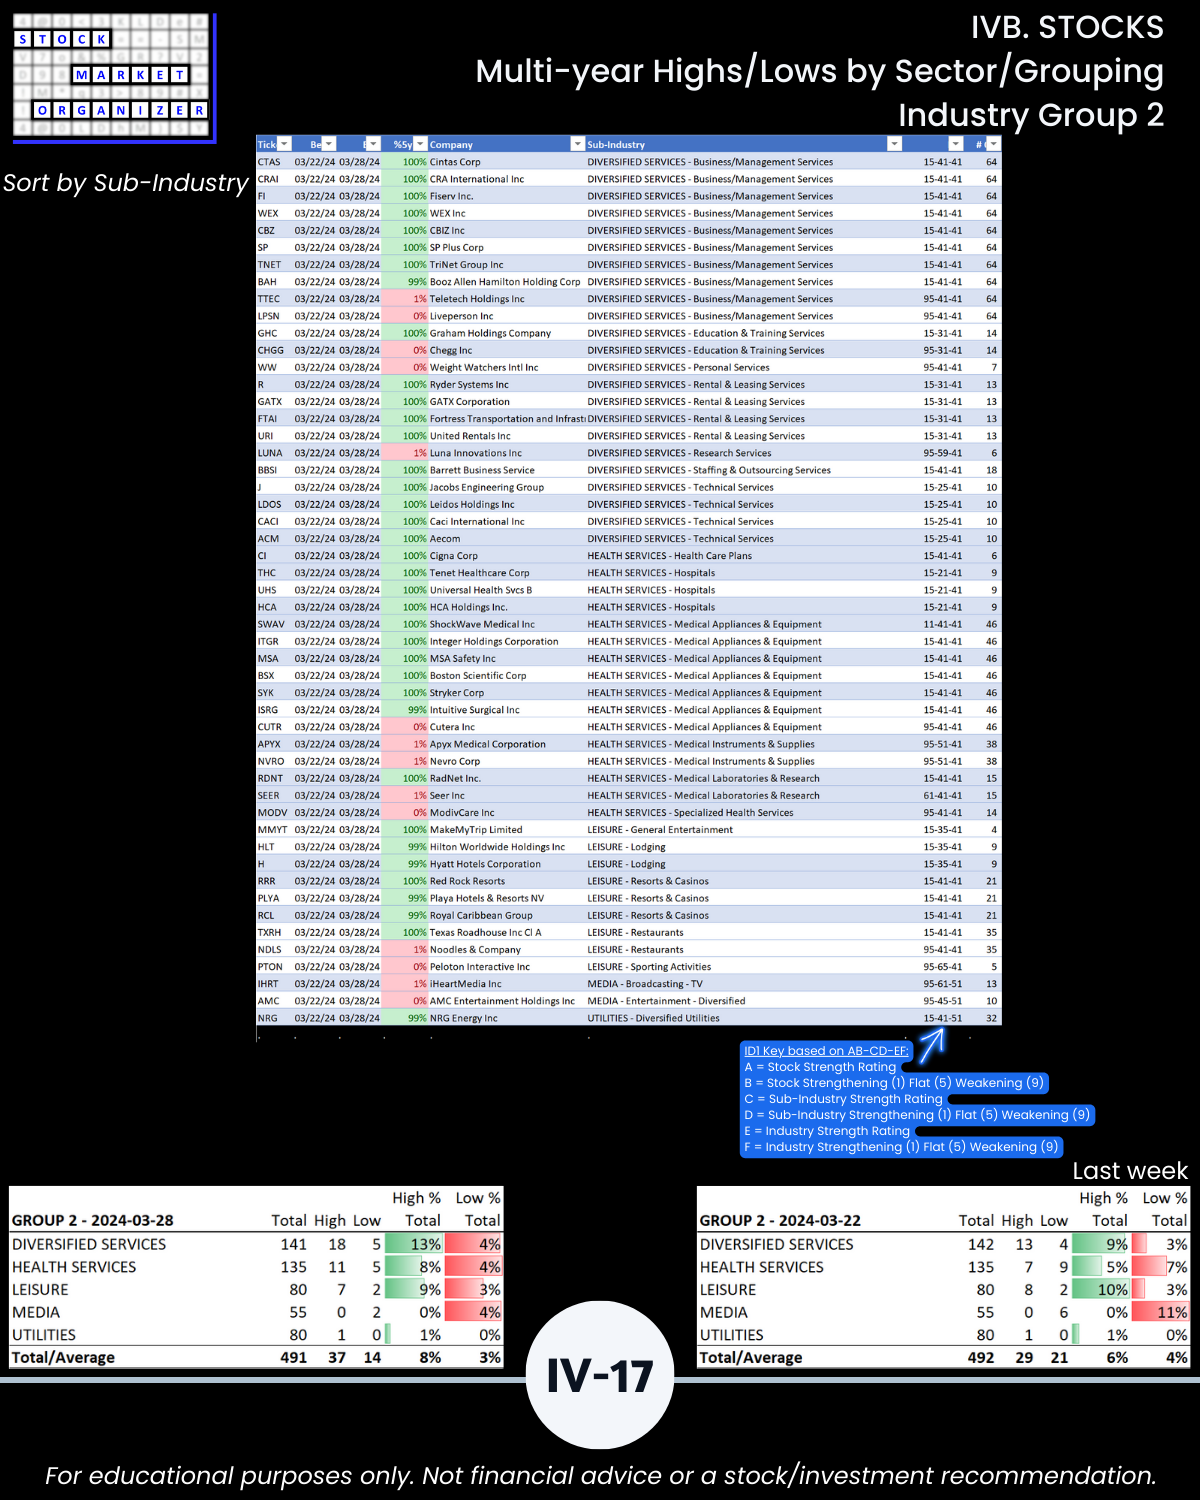
- Media
- Utilities
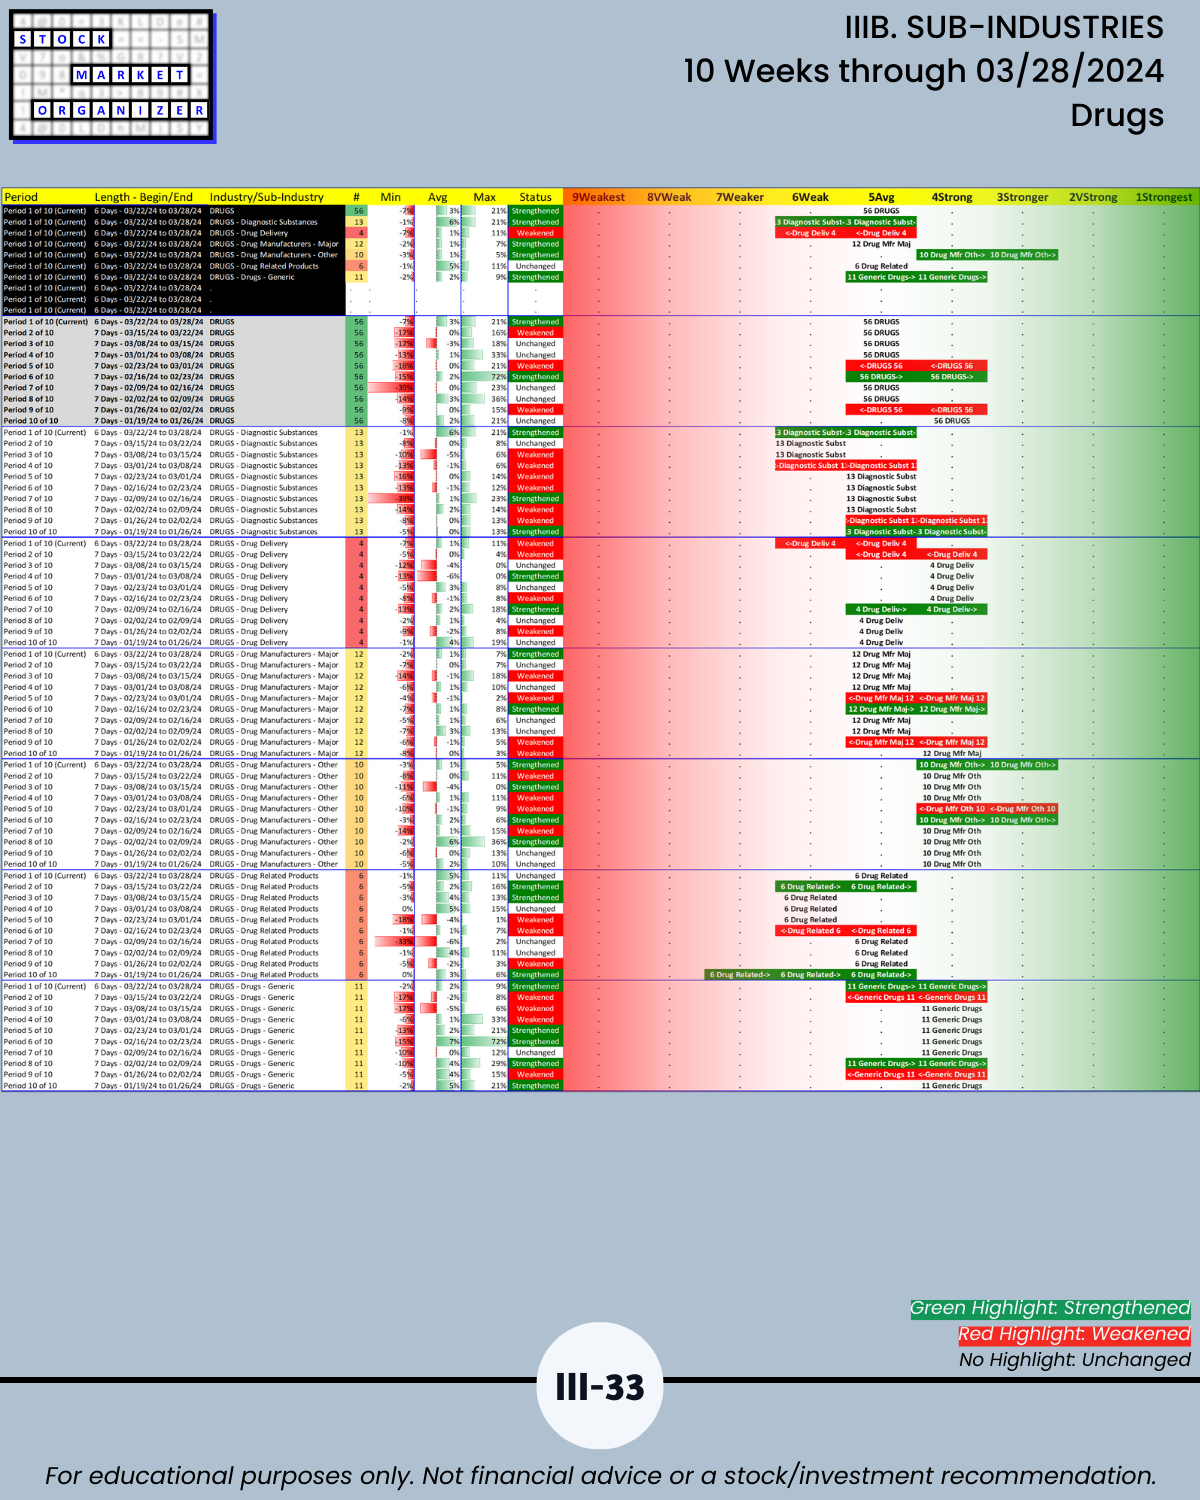
- Drugs
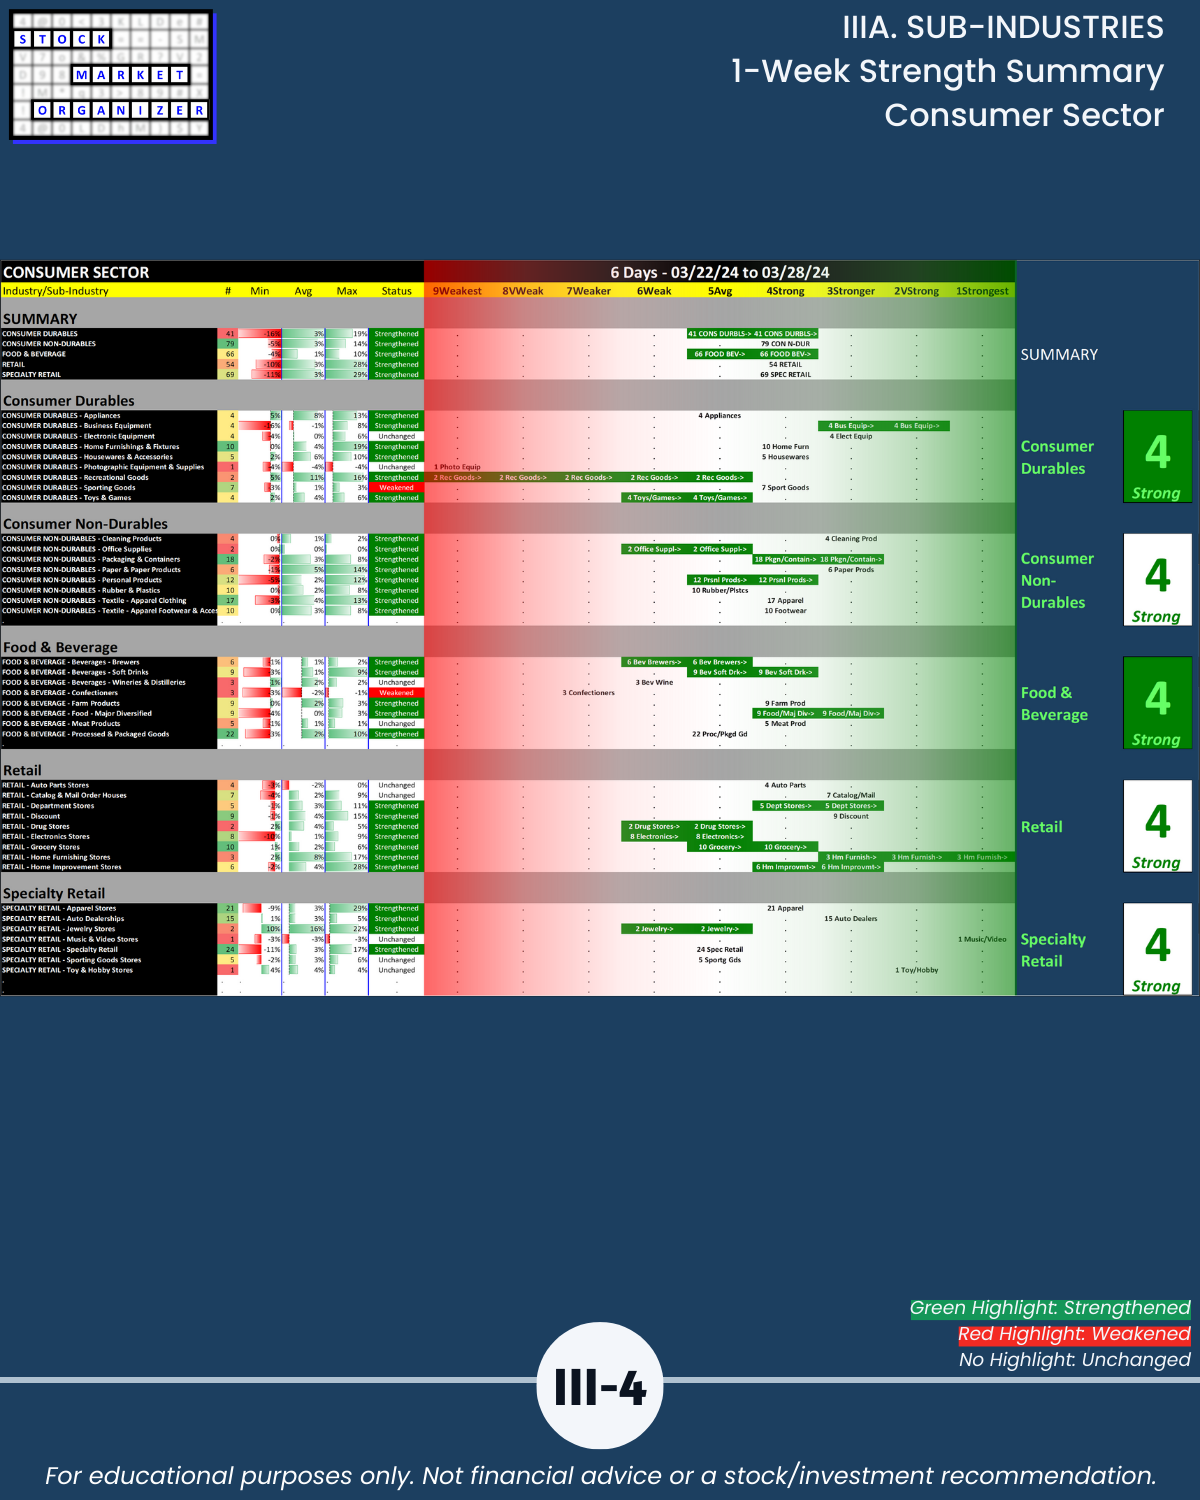
🔹 25 of 29 industries strengthened, 14 enough to increase at least one strength level rating
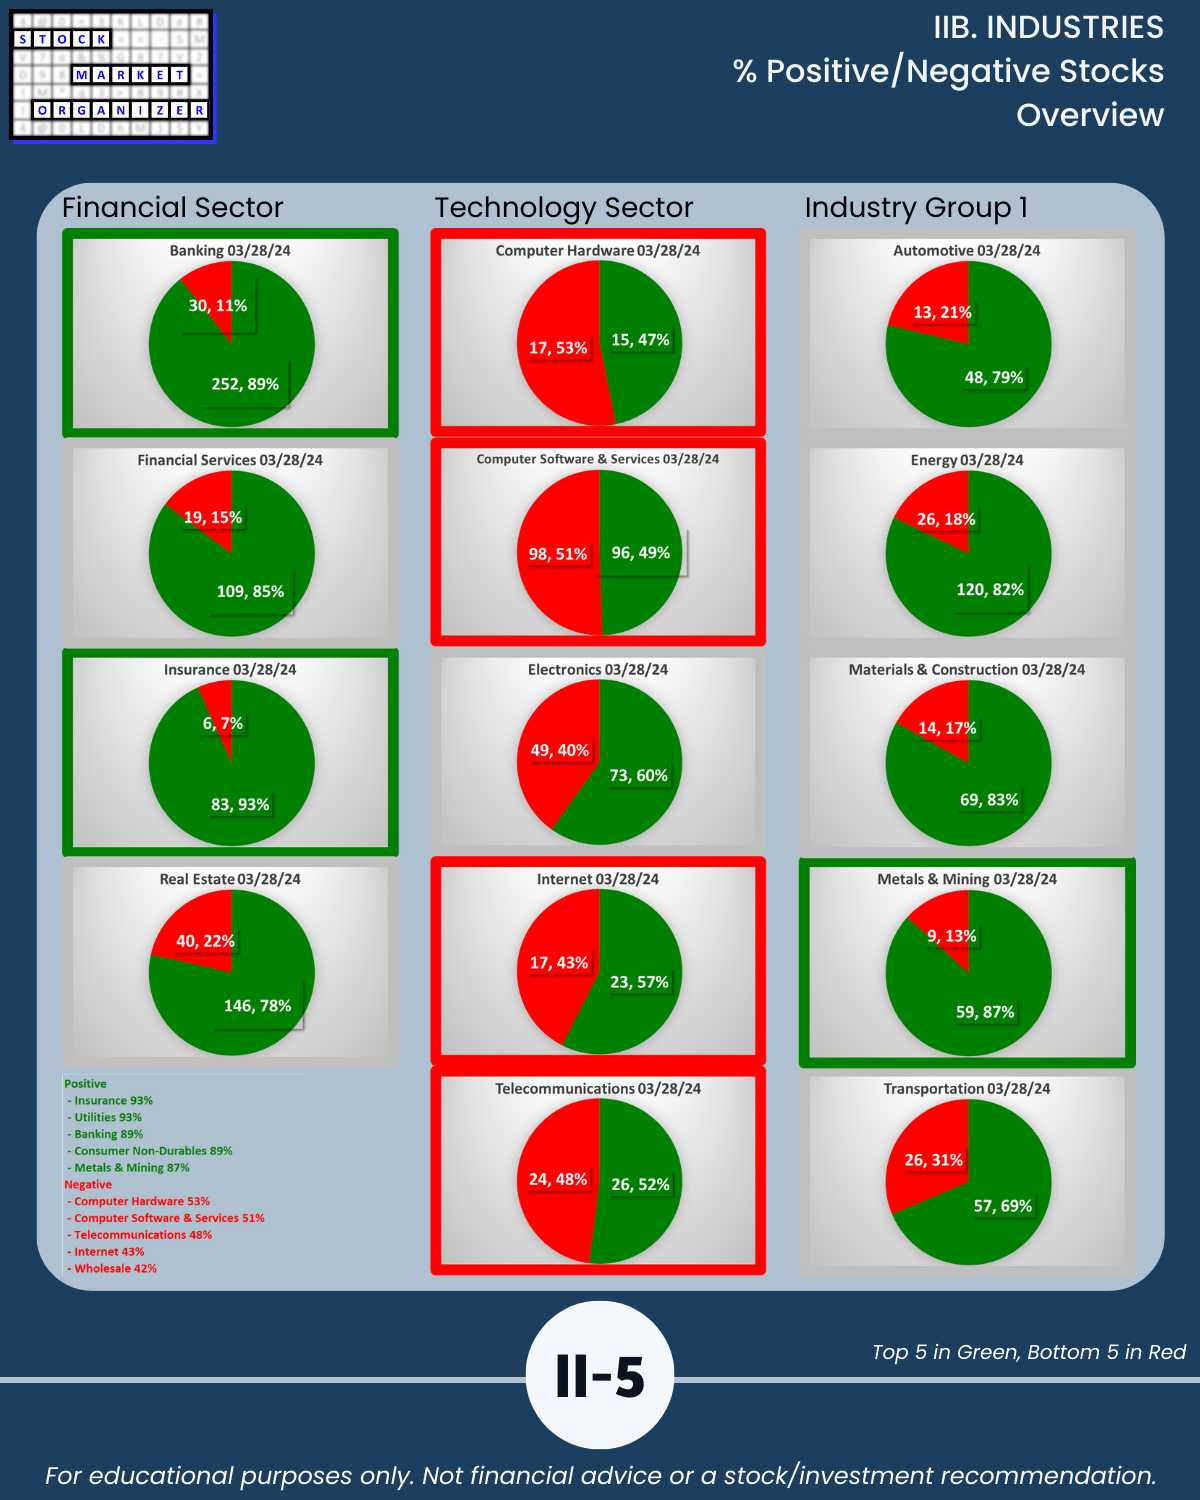
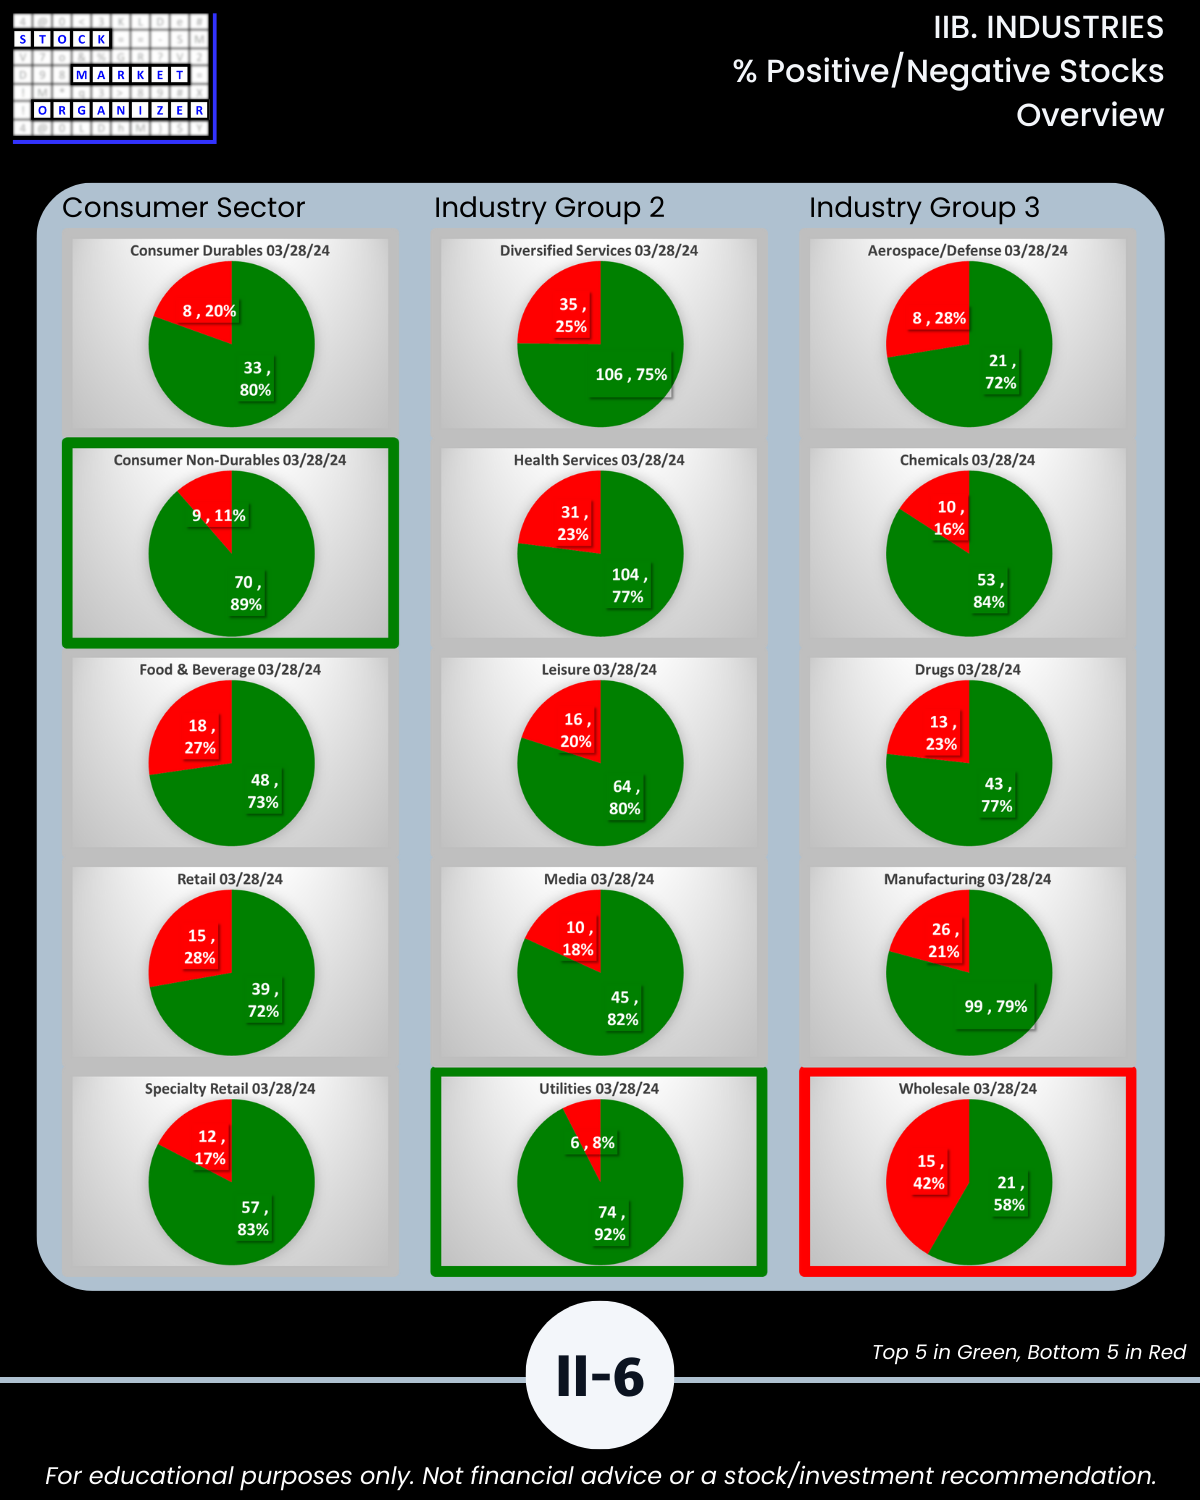
🔹 Highest Positive Stocks %
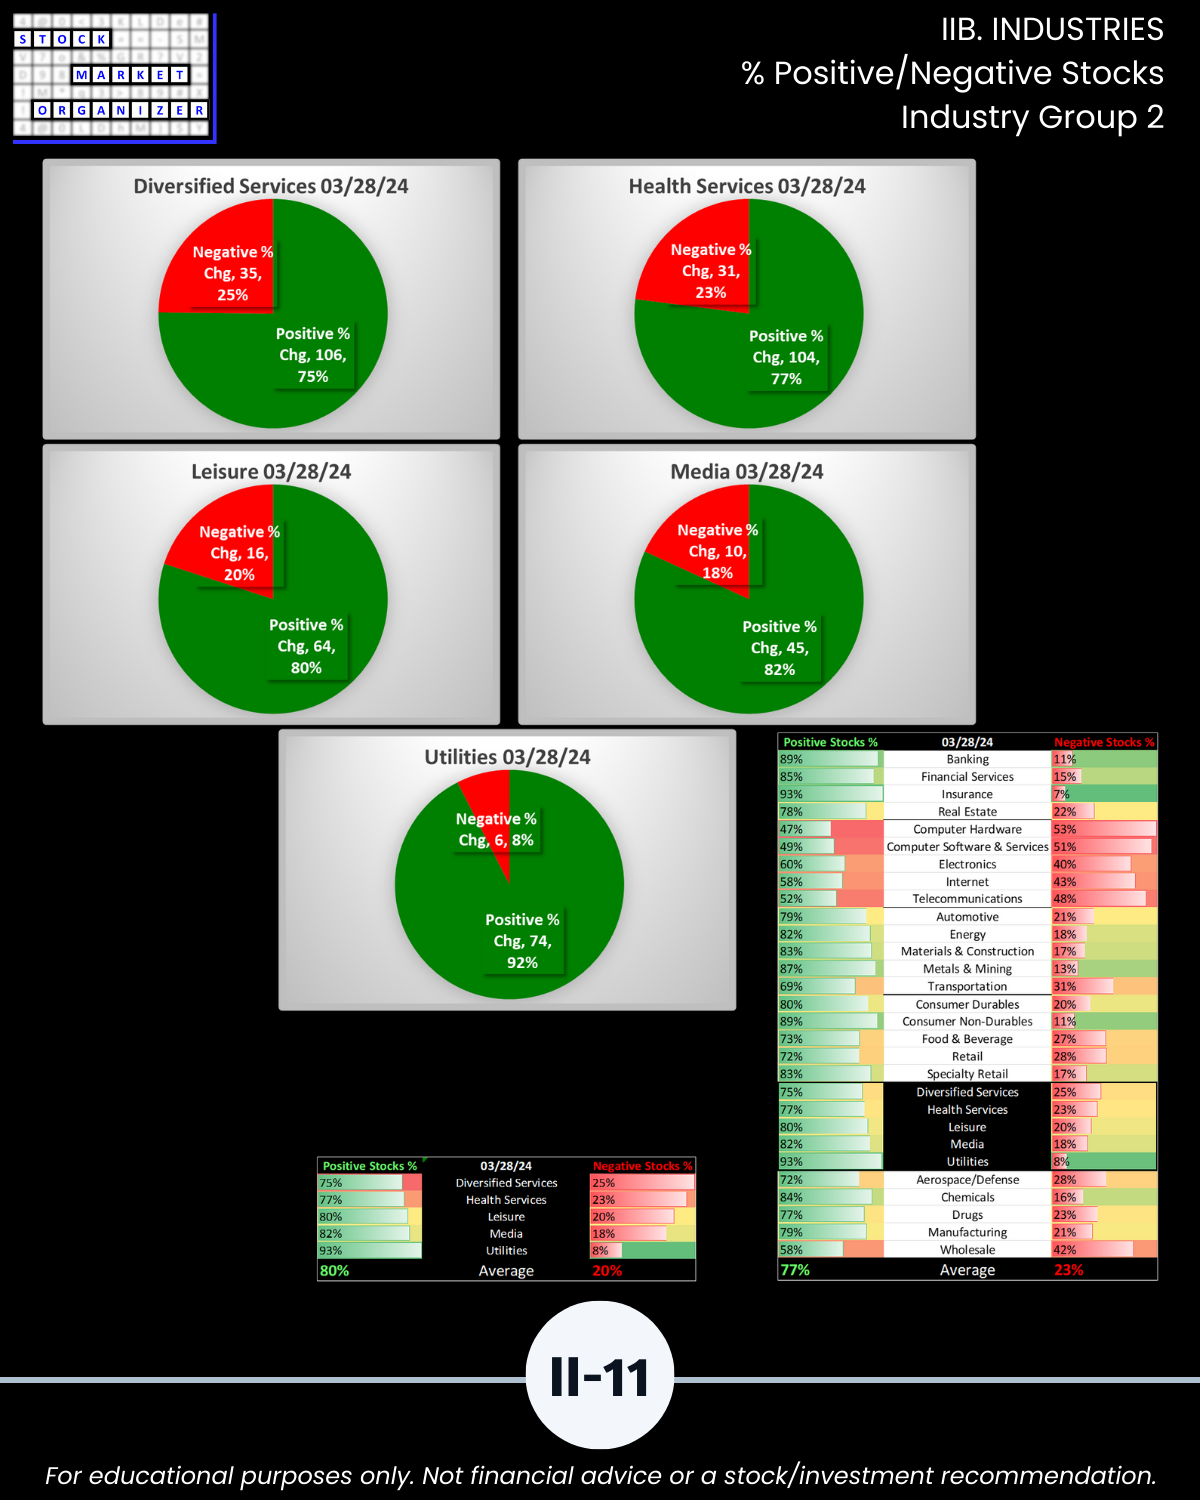
- Insurance 93%
- Utilities 93%
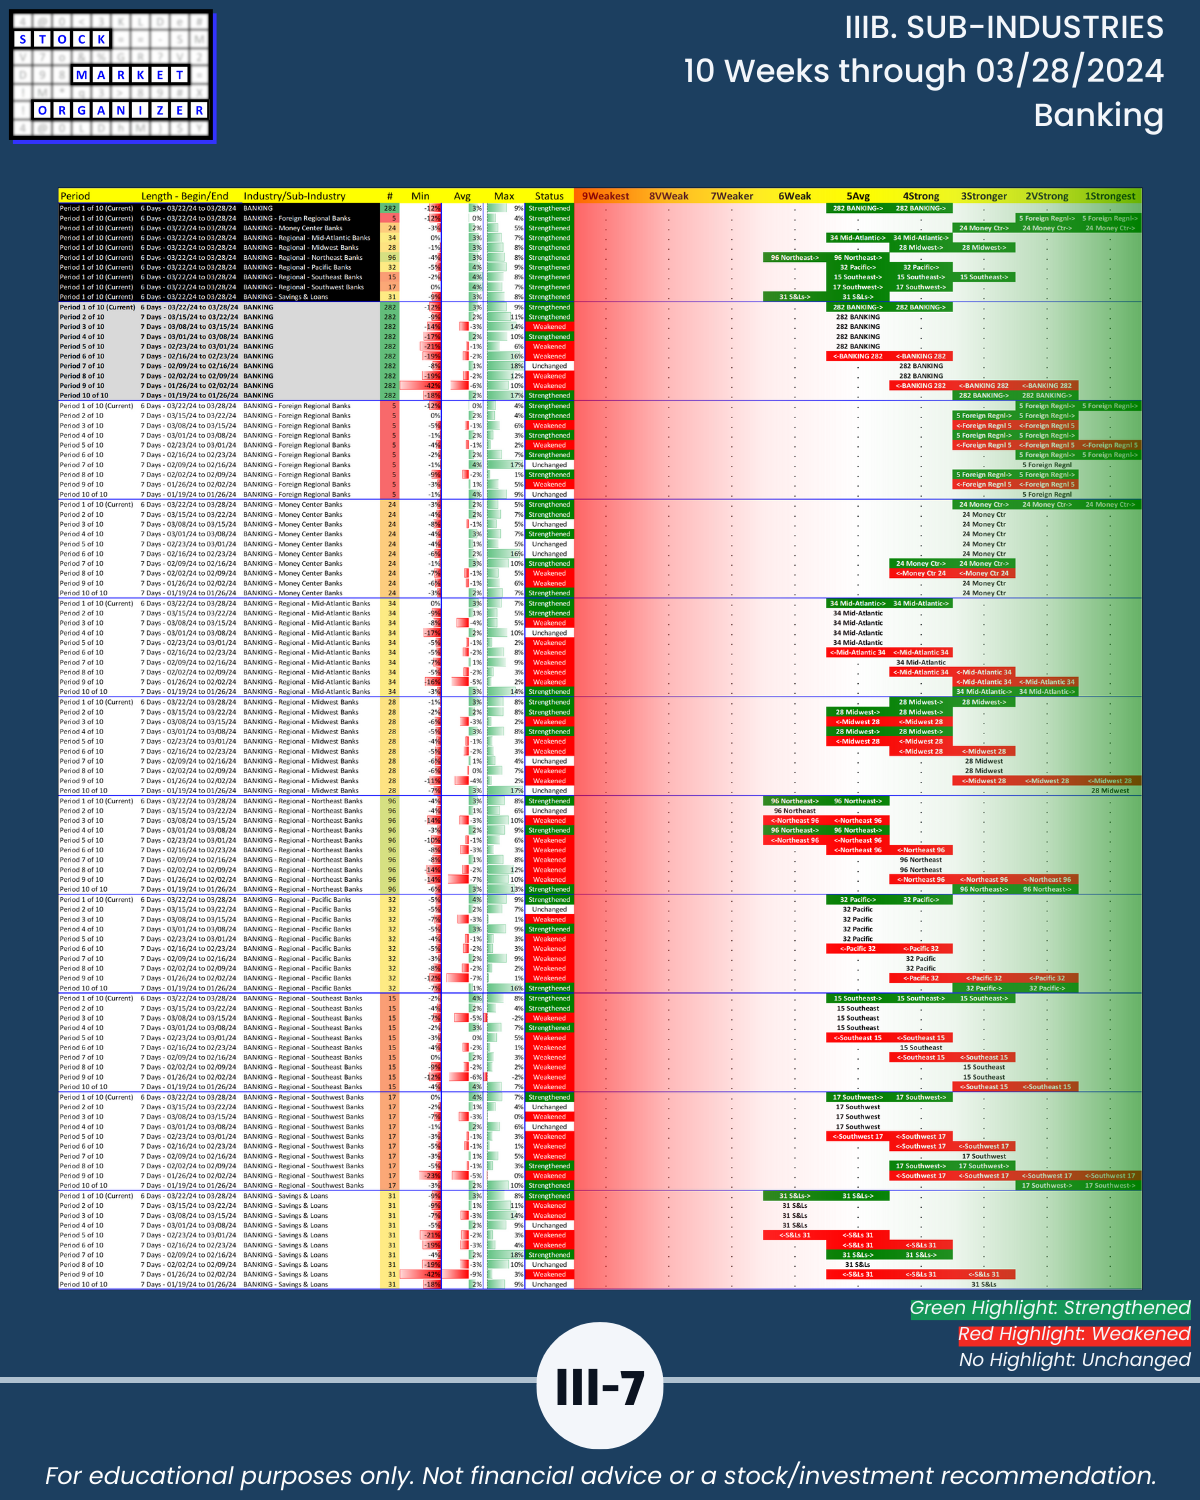
- Banking 89%
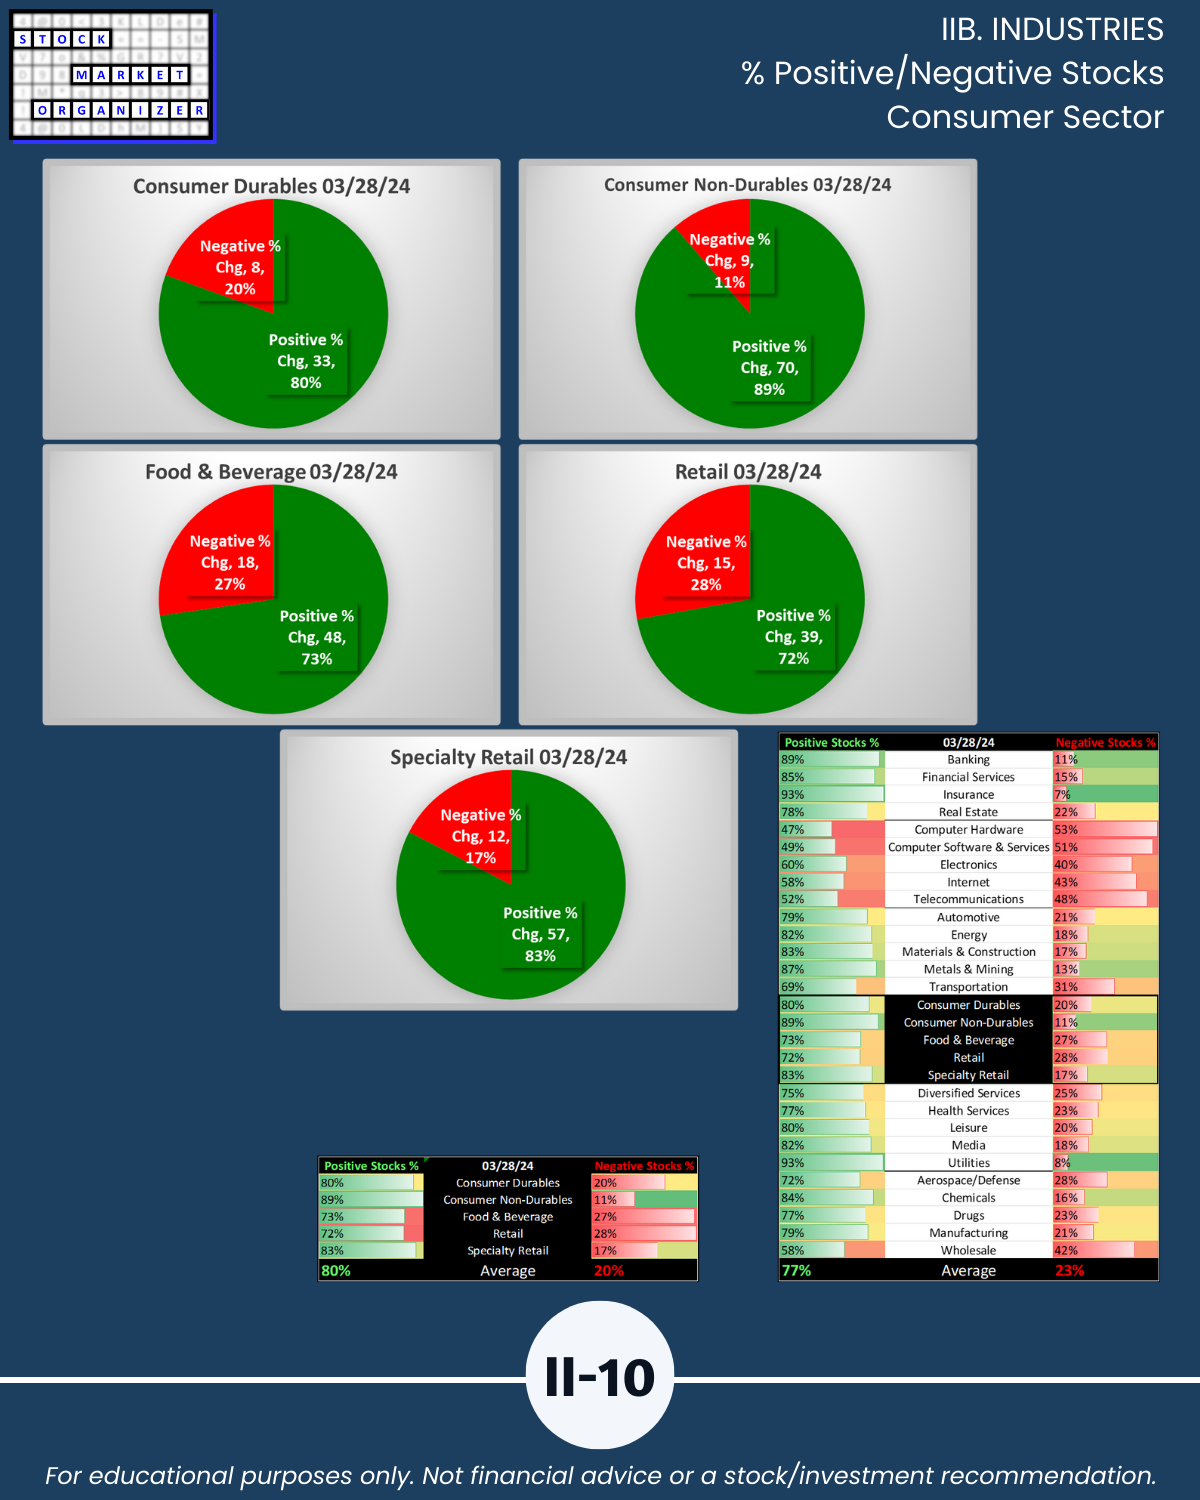
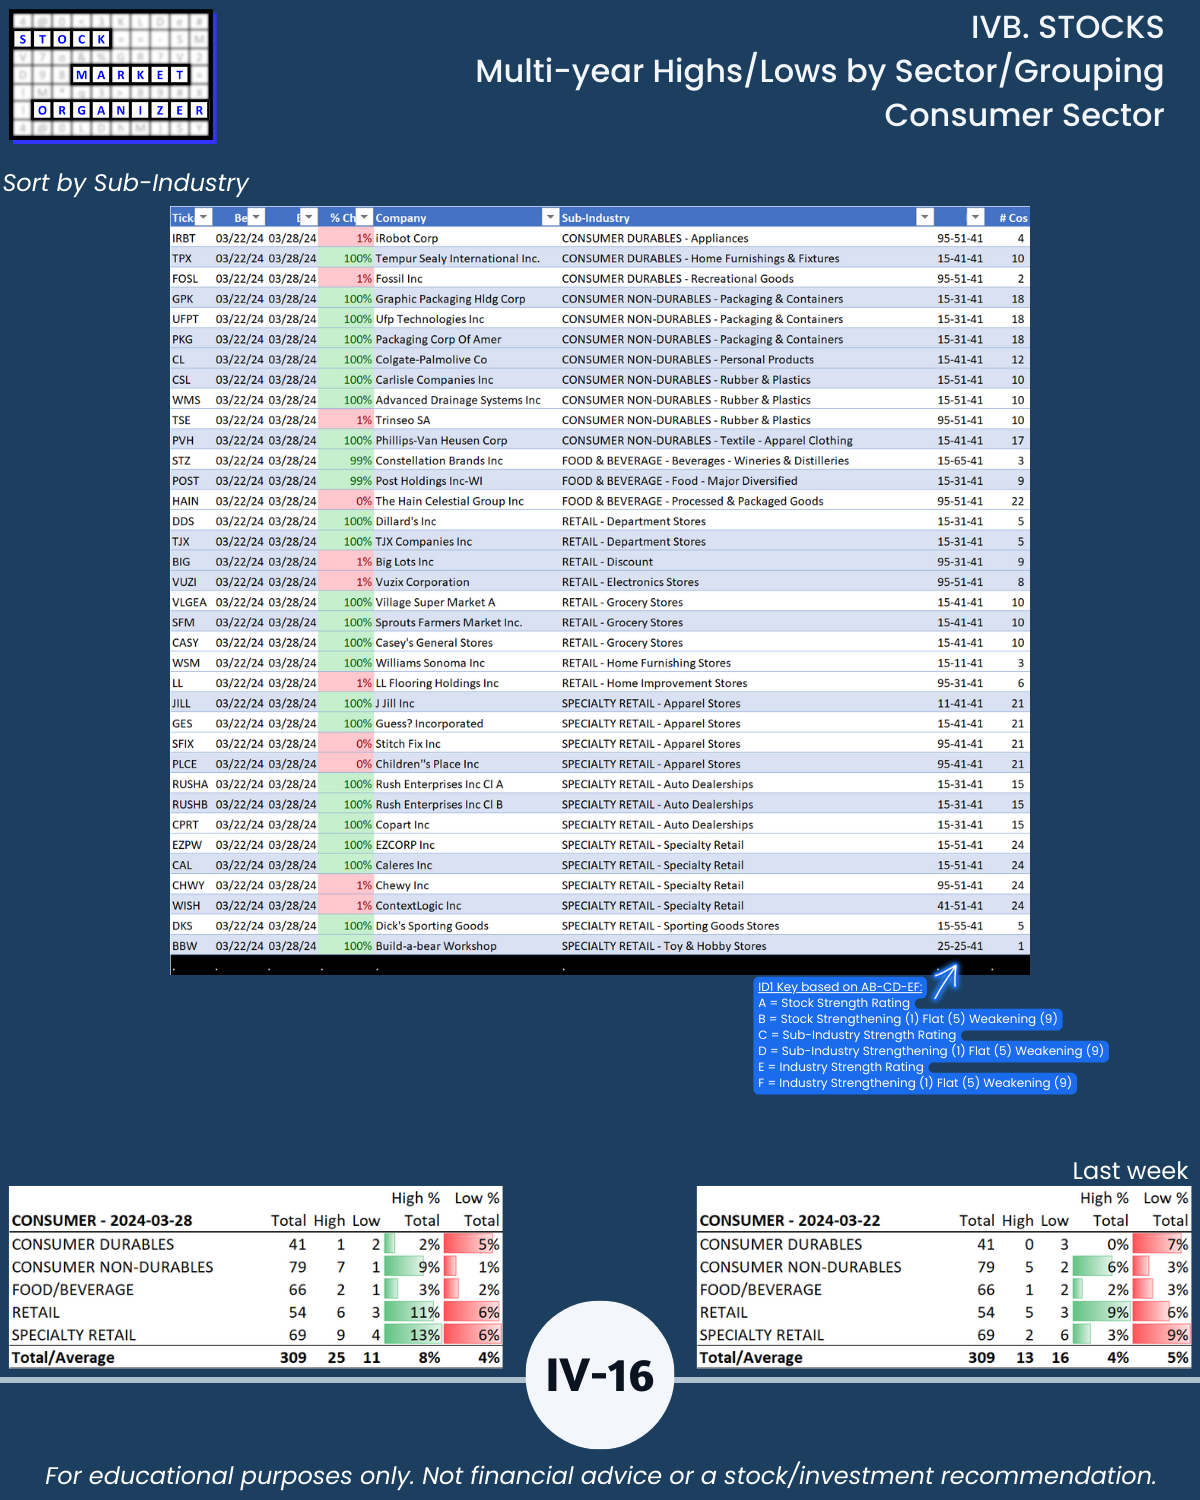
- Consumer Non-Durables 89%
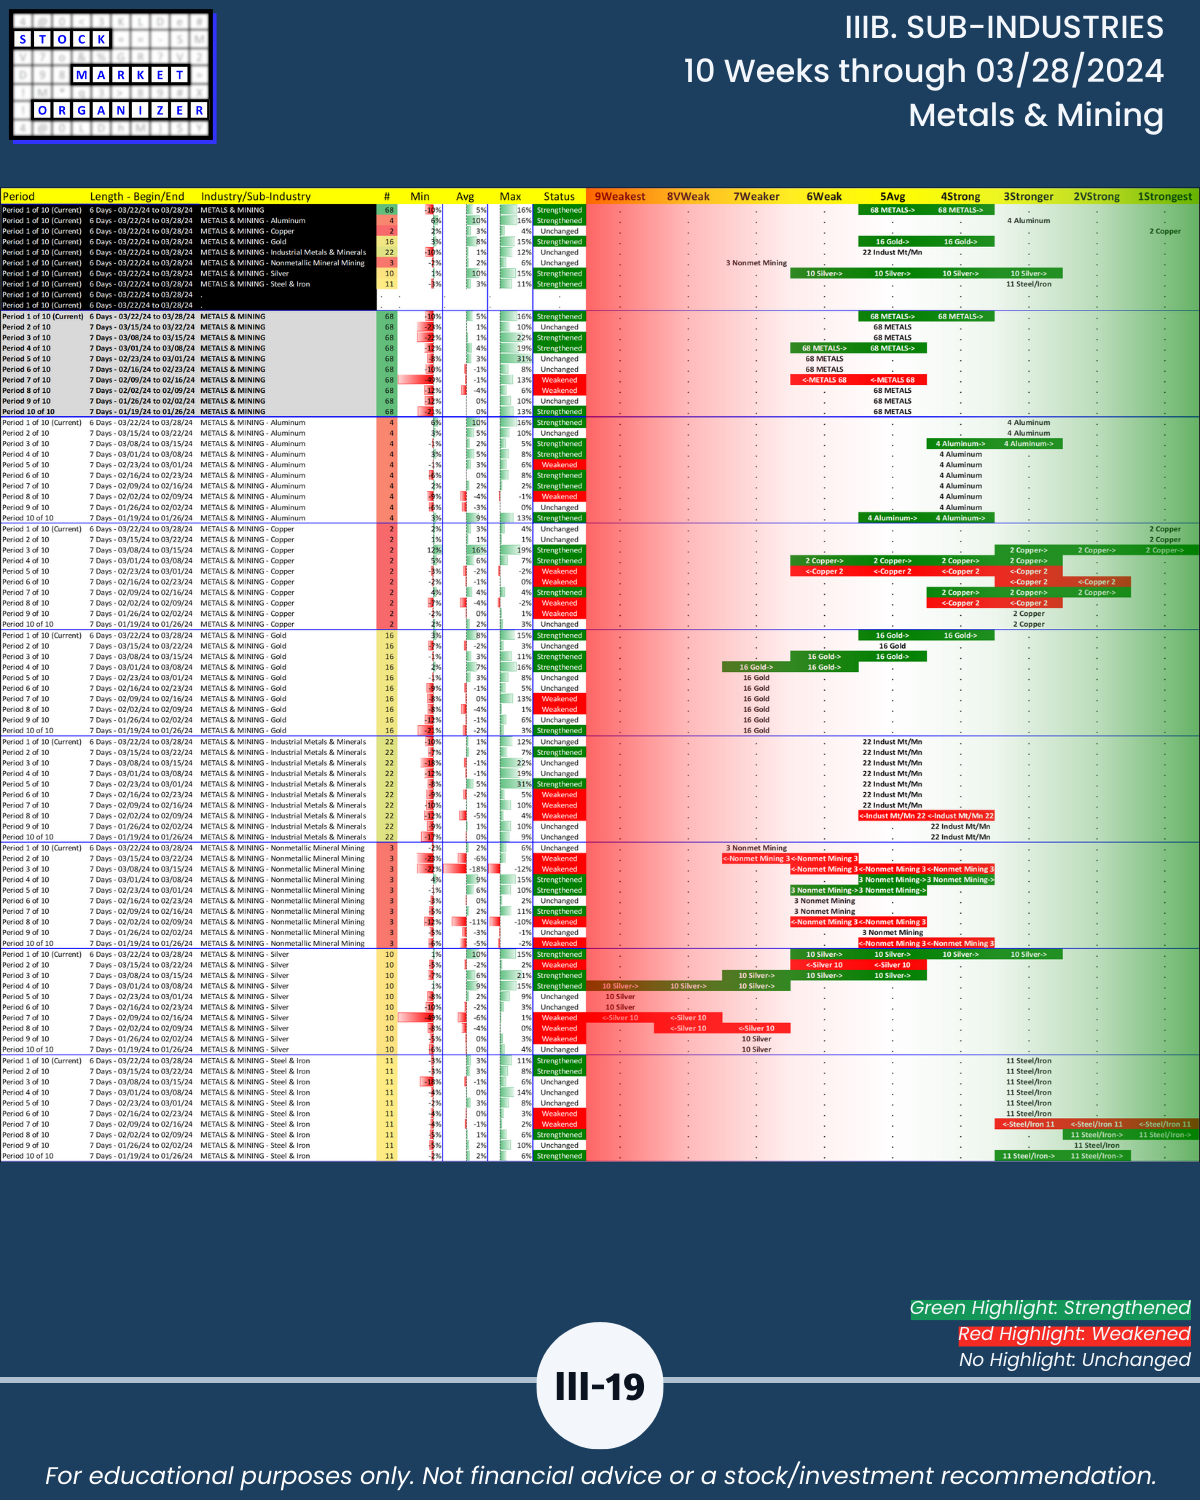
- Metals & Mining 87%
🔹 Highest Negative Stocks %
- Computer Hardware 53%
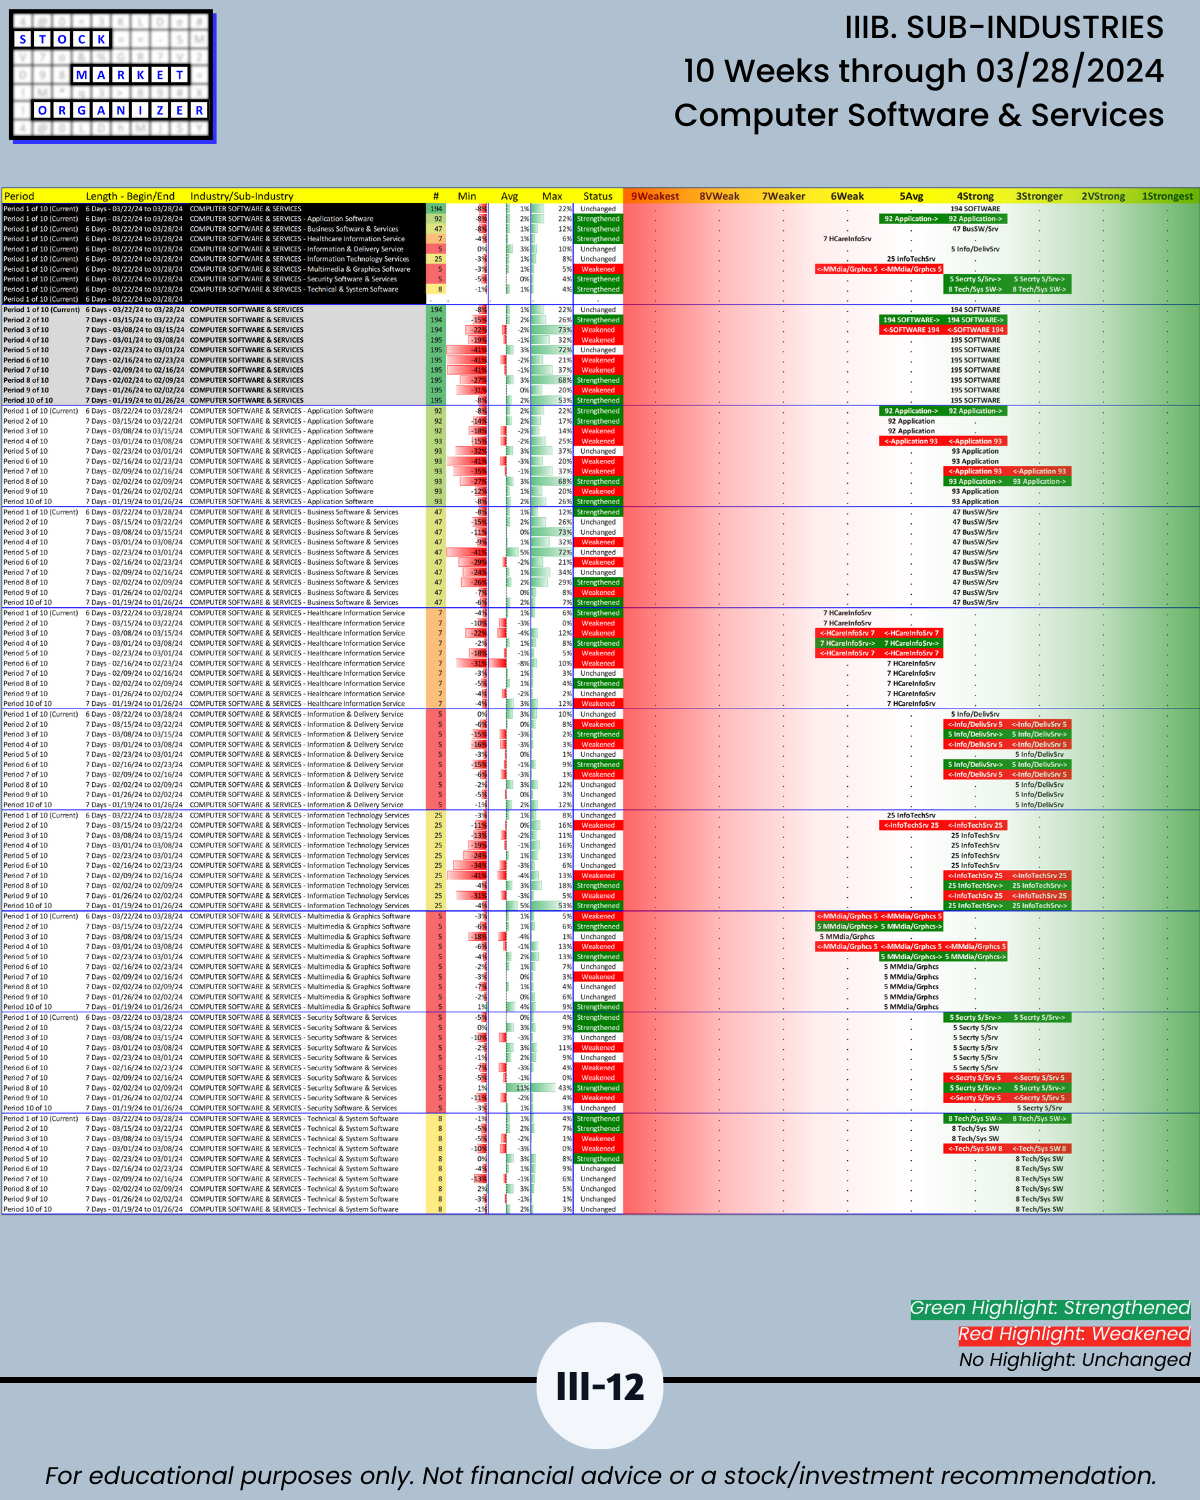
- Computer Software & Services 51%
- Telecommunications 48%
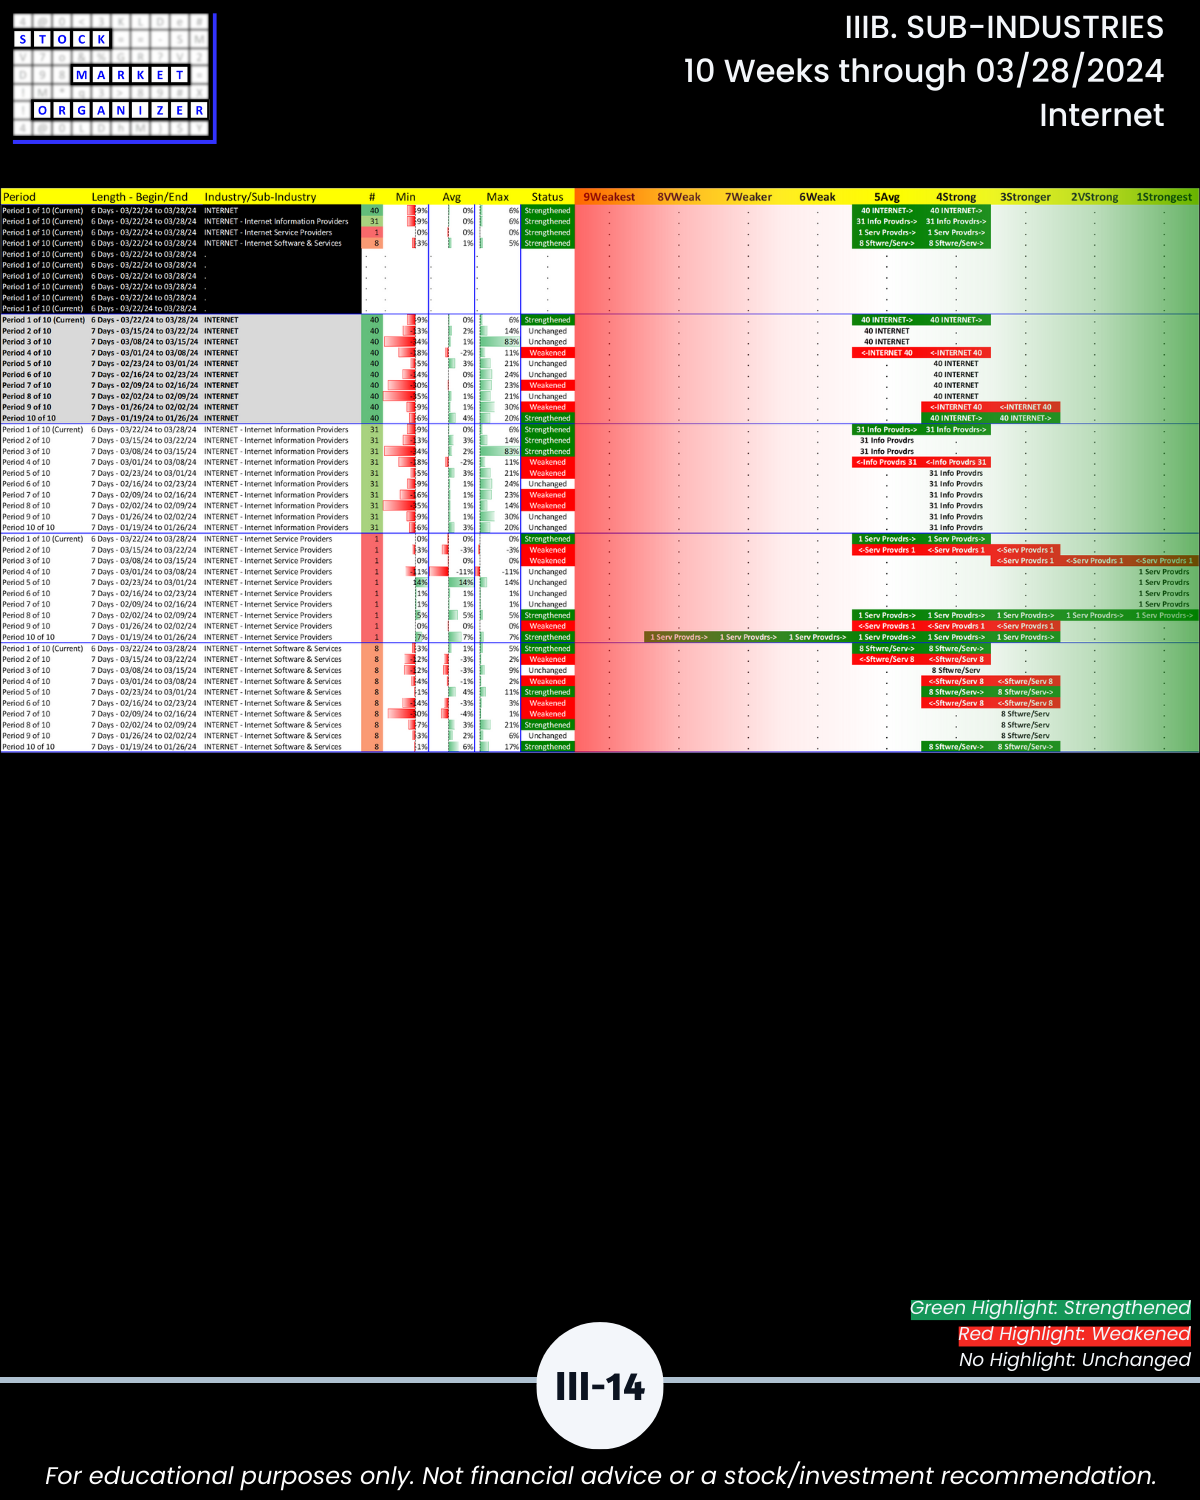
- Internet 43%
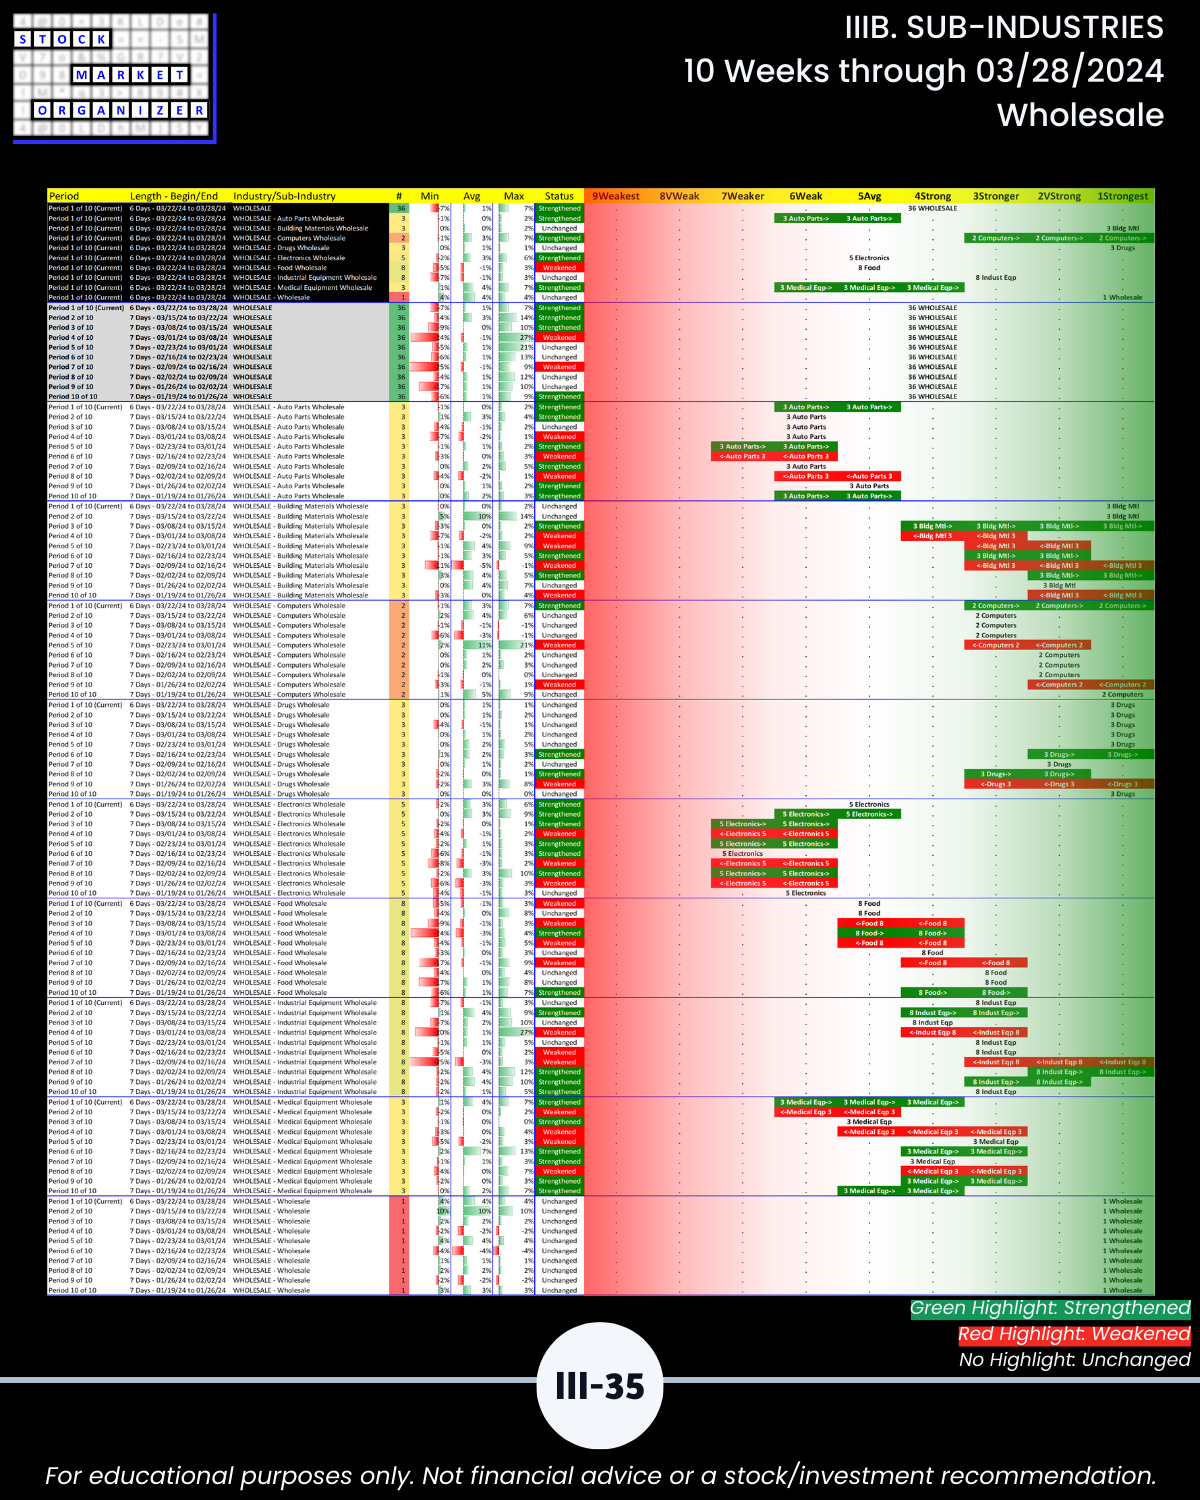
- Wholesale 42%
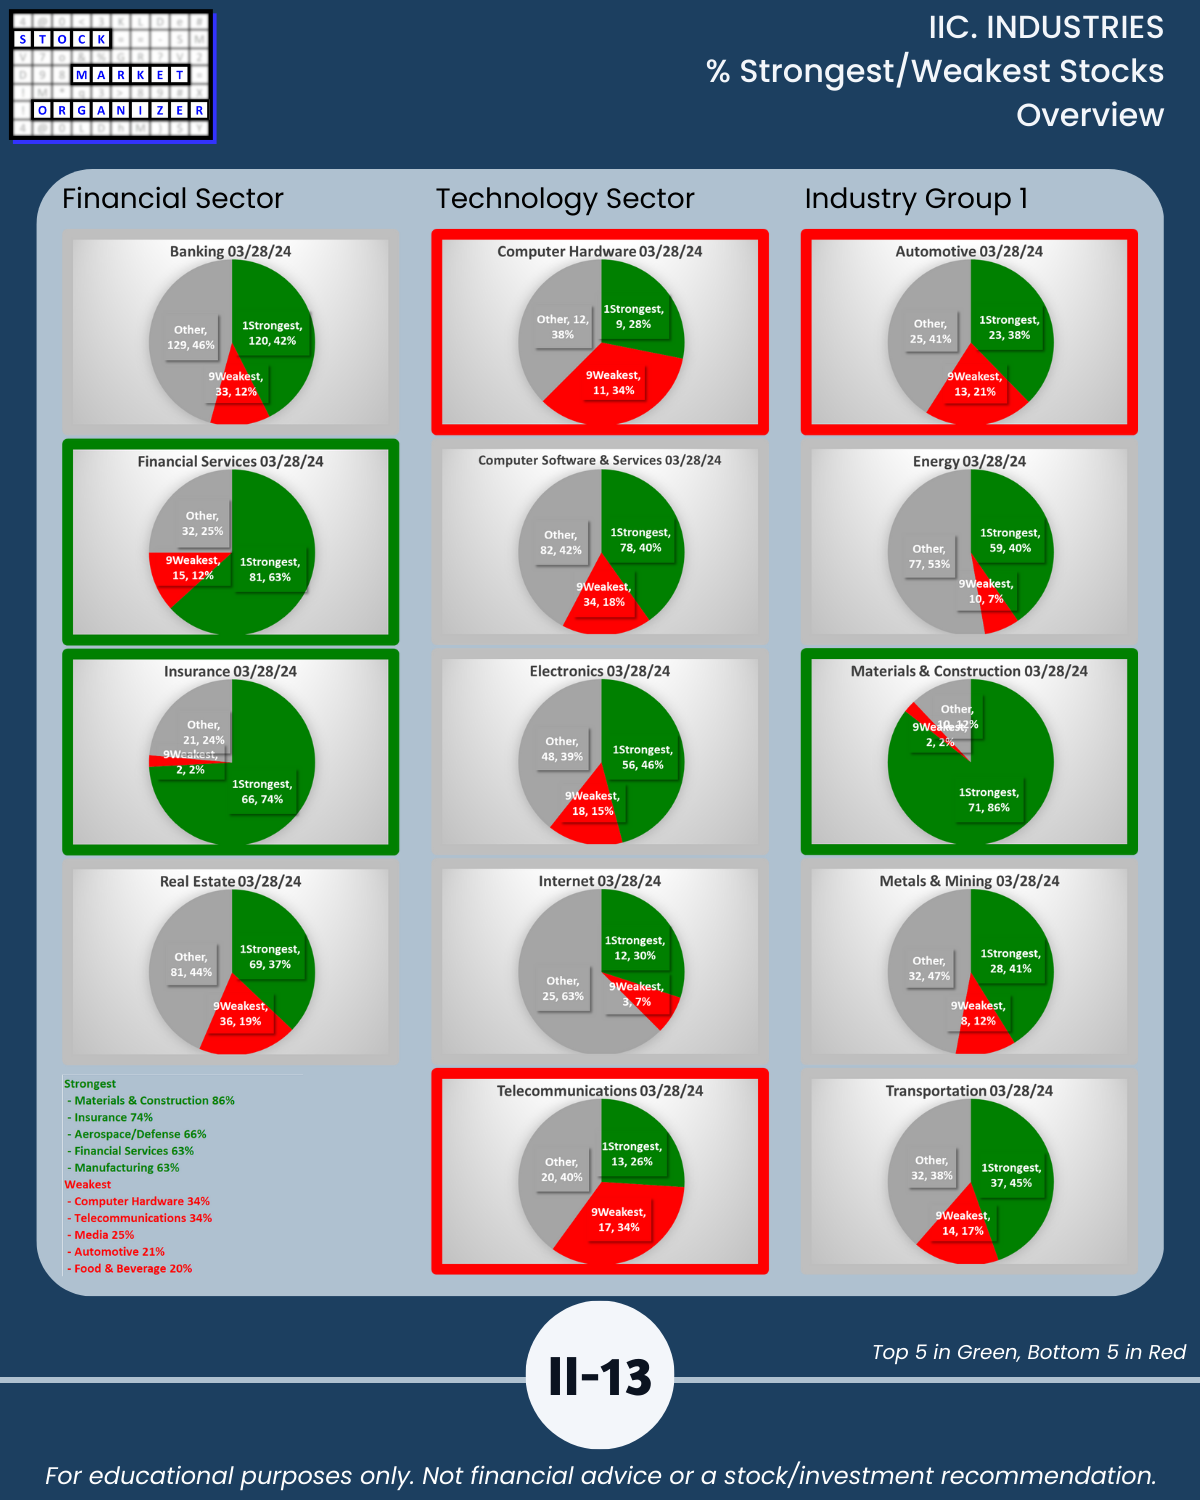
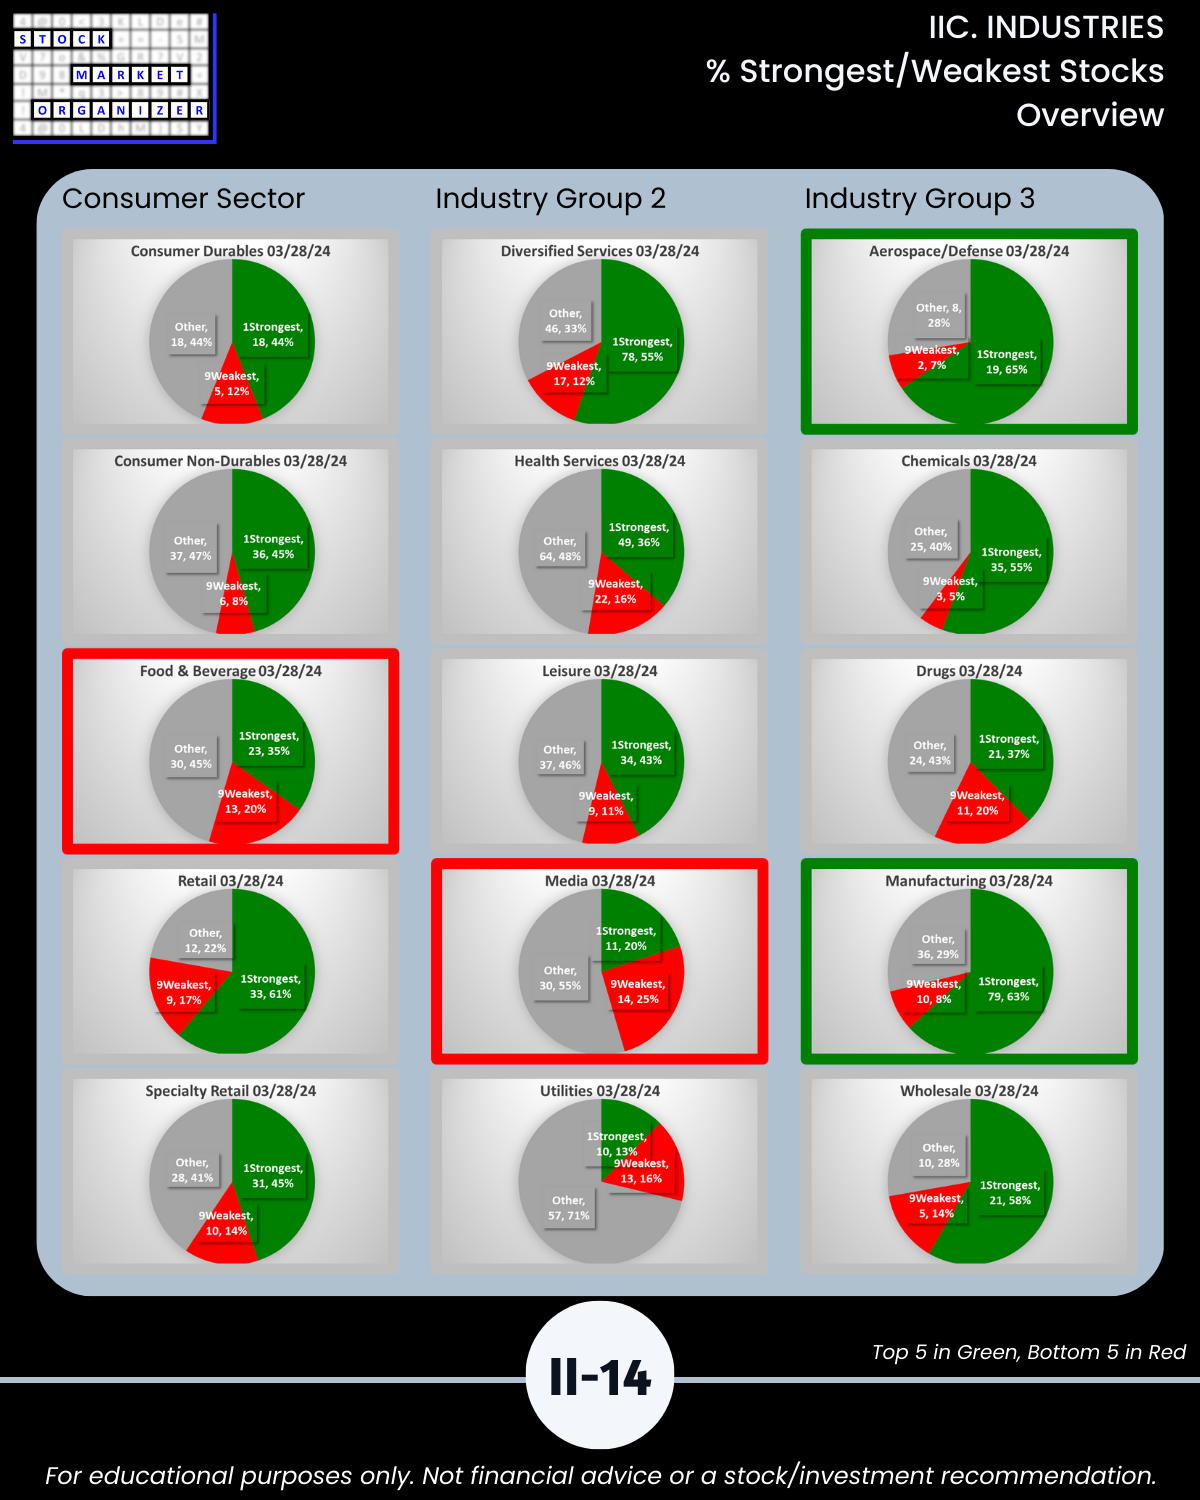
🔹 Stocks rated Strongest
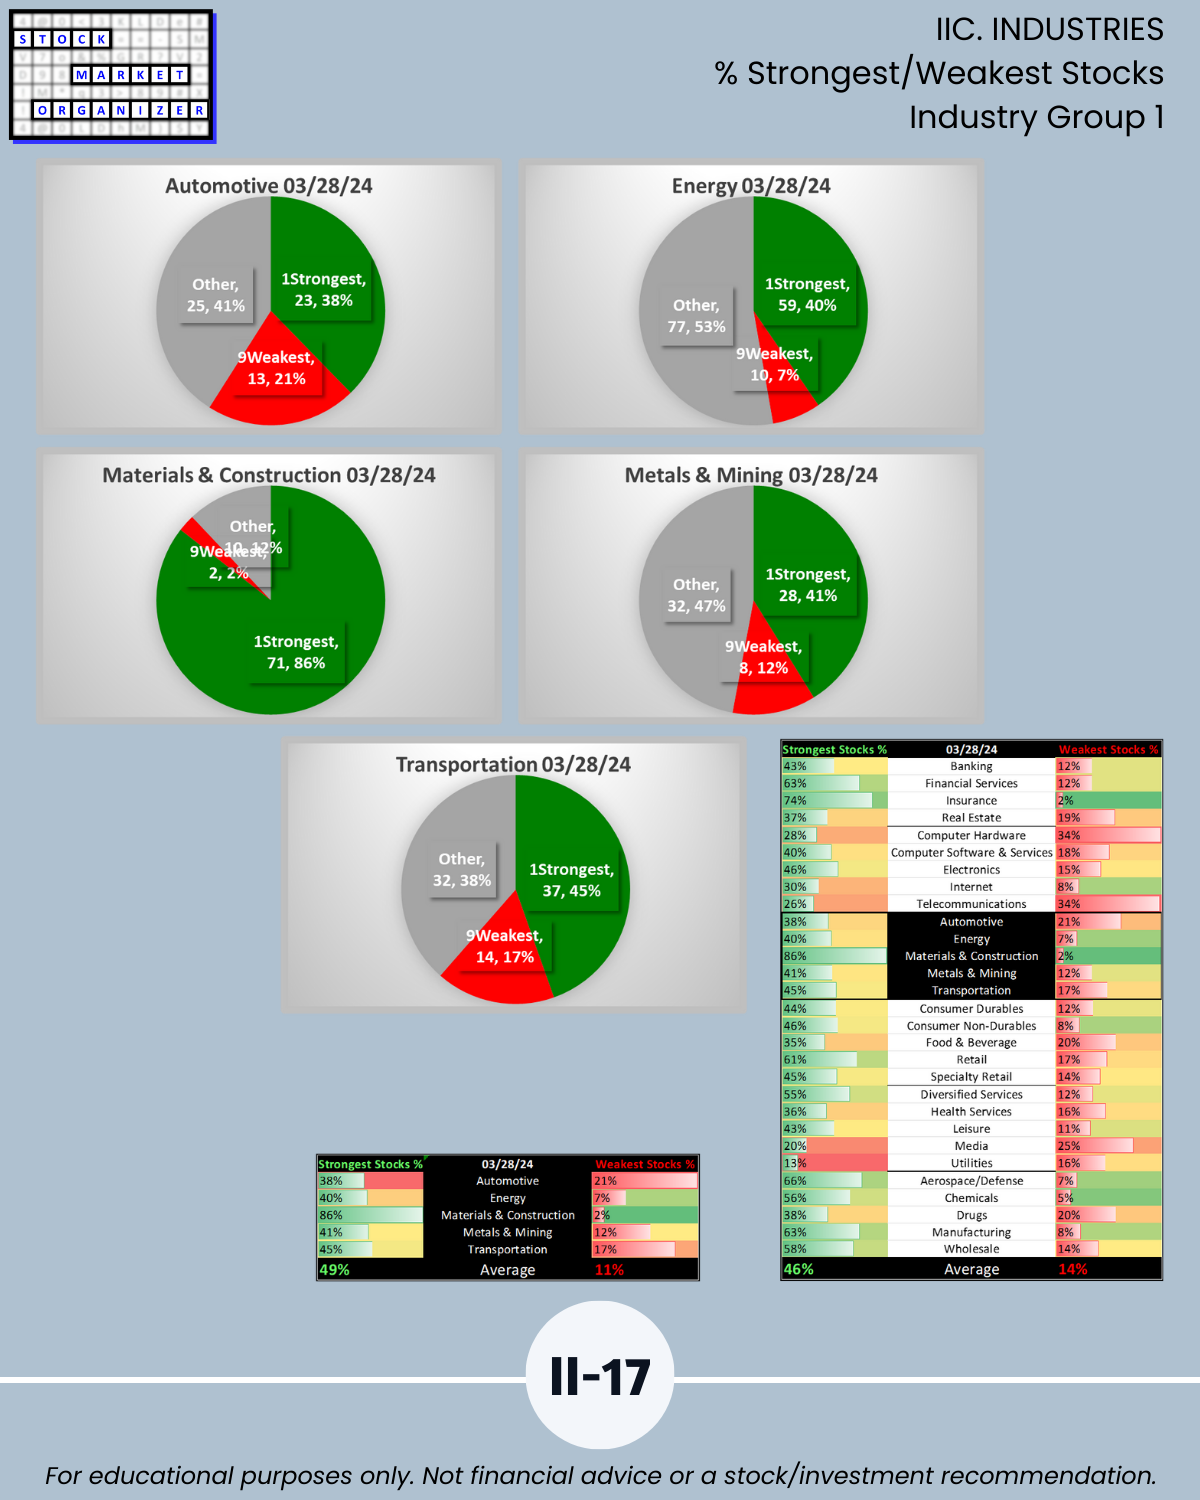
- Materials & Construction 86%
- Insurance 74%
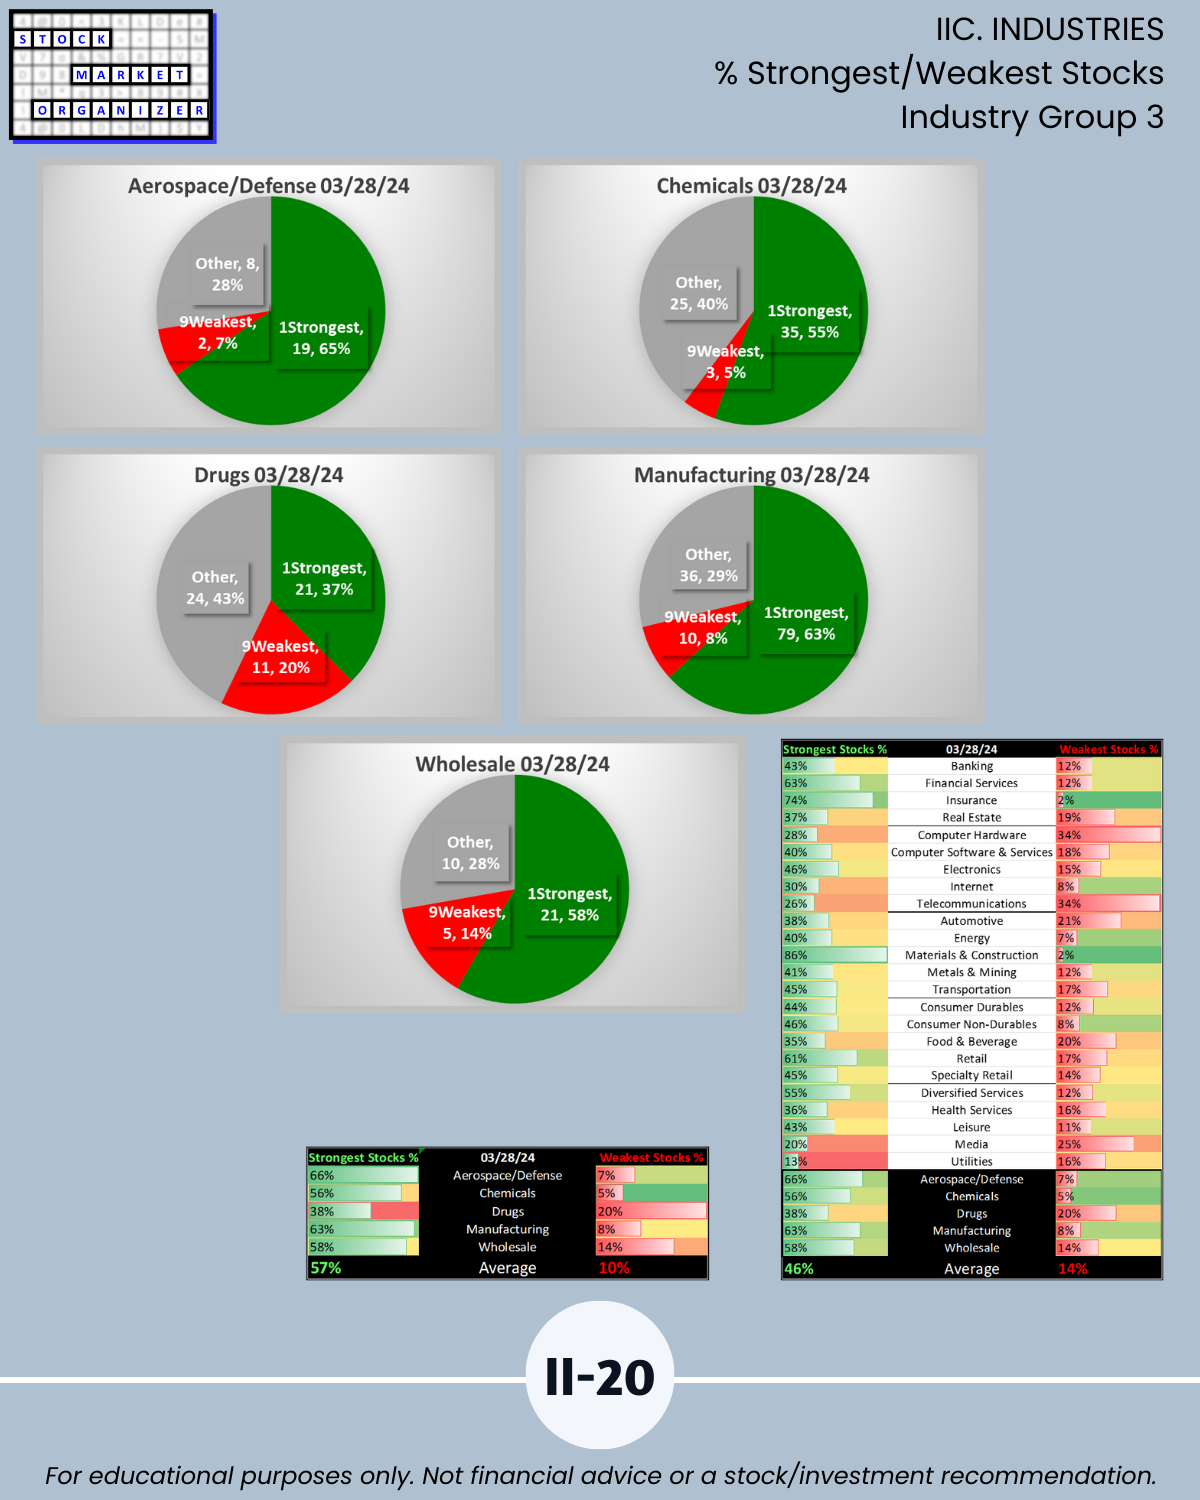
- Aerospace/Defense 66%
- Financial Services 63%
- Manufacturing 63%
🔹 Stocks rated Weakest
- Computer Hardware 34%
- Telecommunications 34%
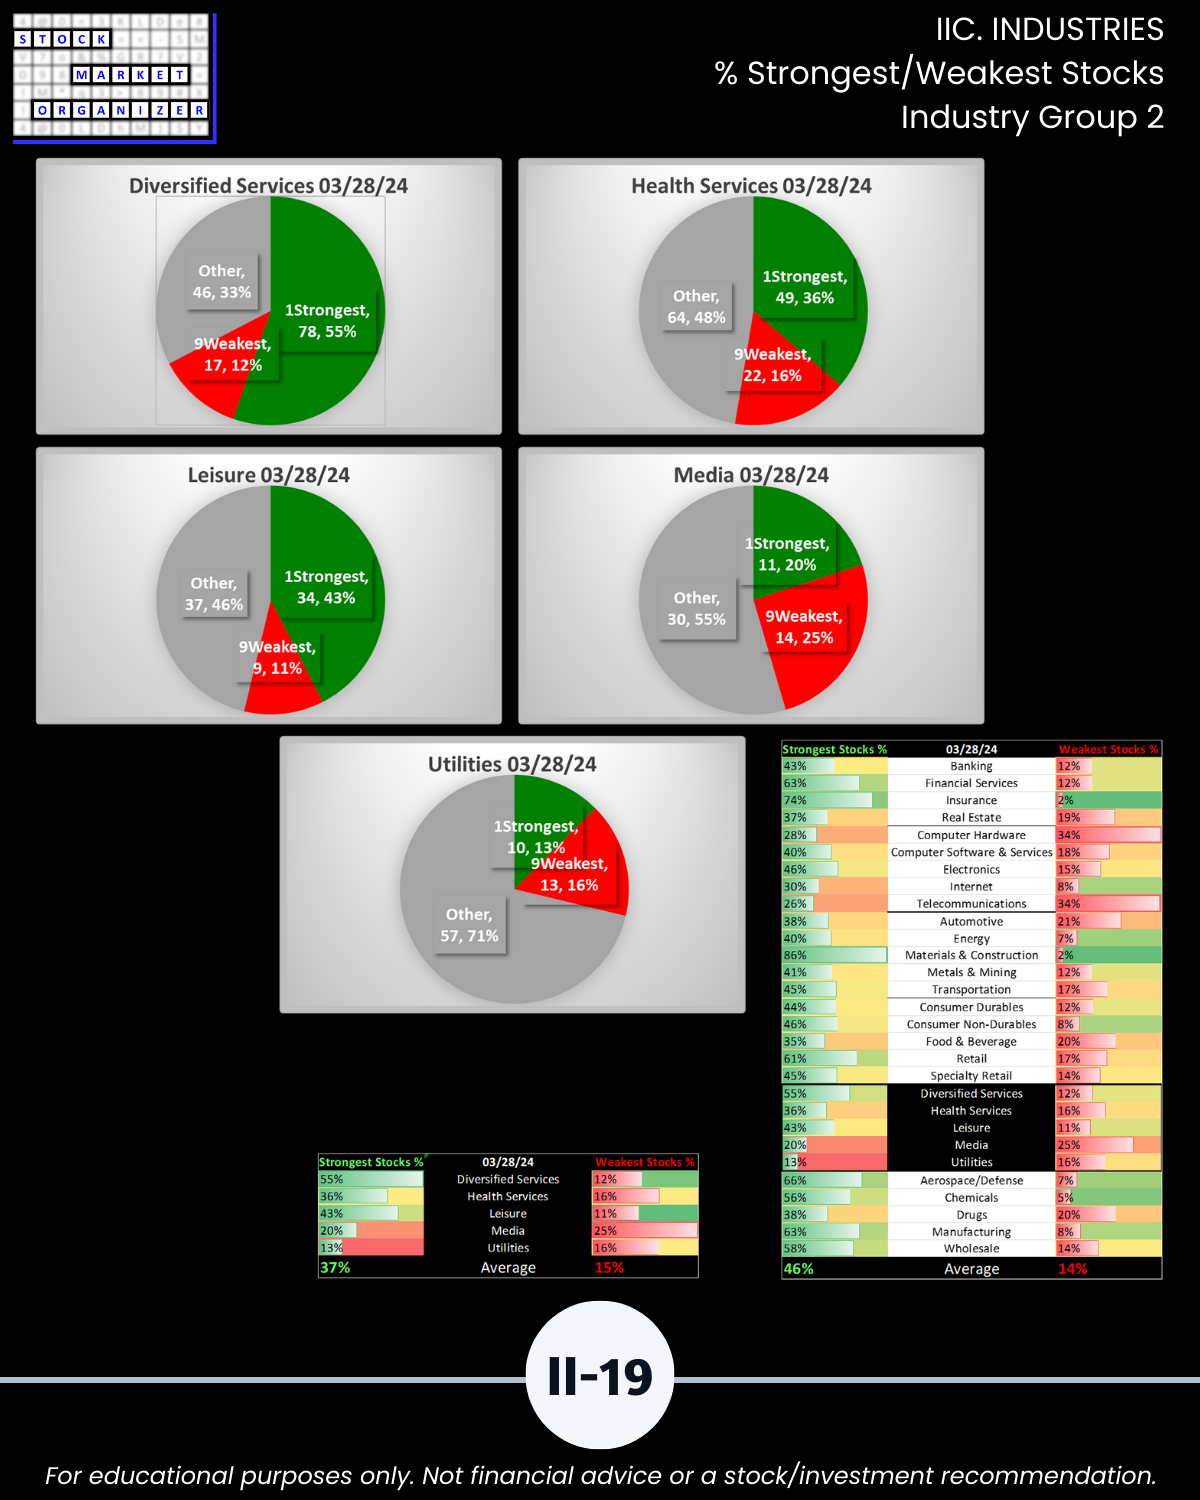
- Media 25%
- Automotive 21%
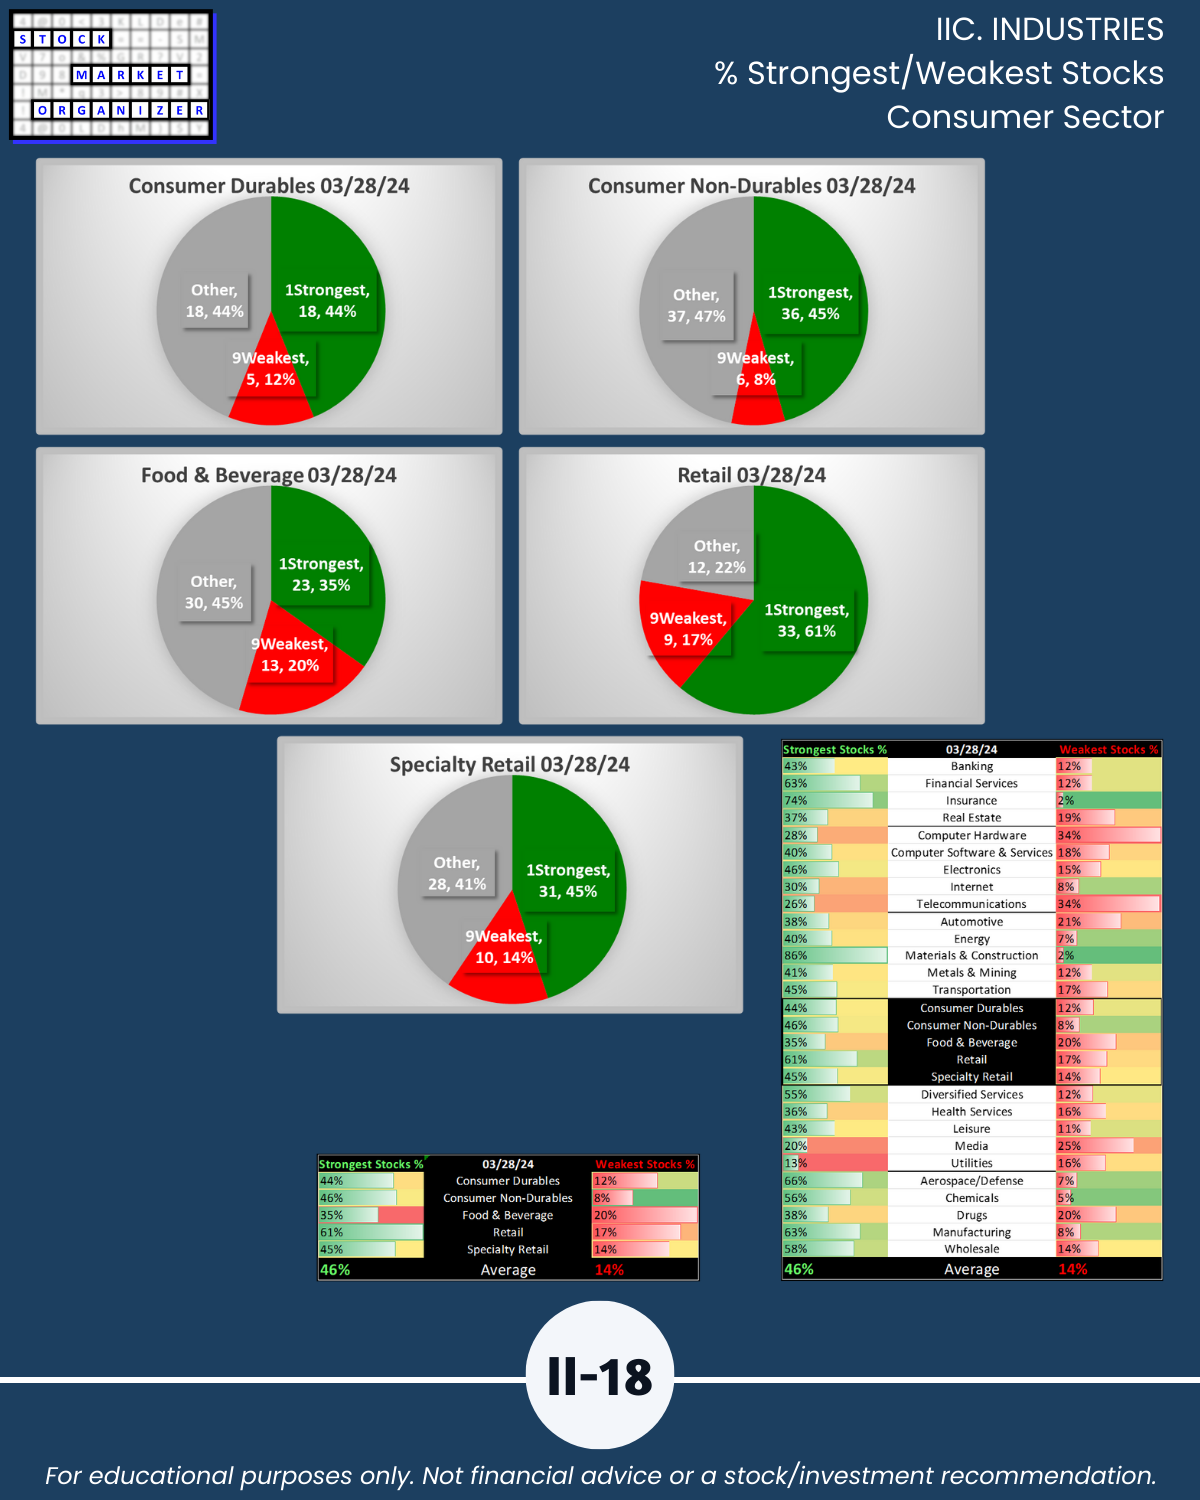
- Food & Beverage 20%
Don’t care about the above? There’s much more in the attached.
CAN YOU BANK ON THIS CONTINUING?
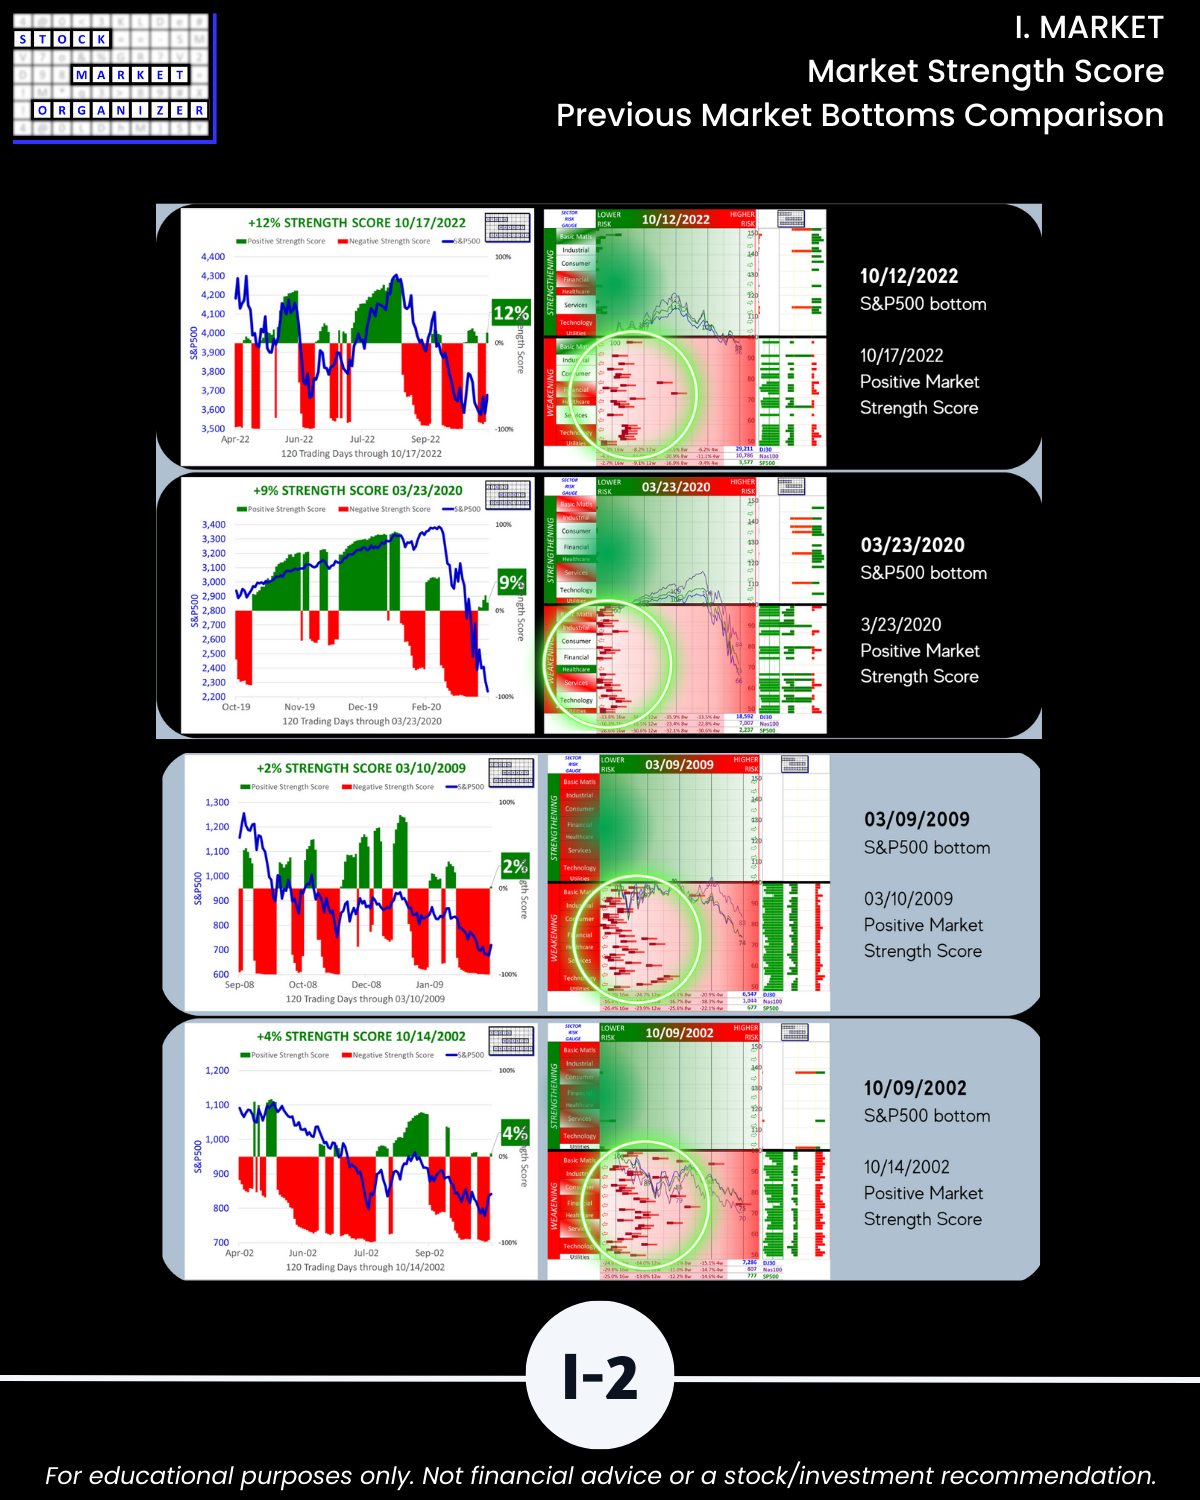
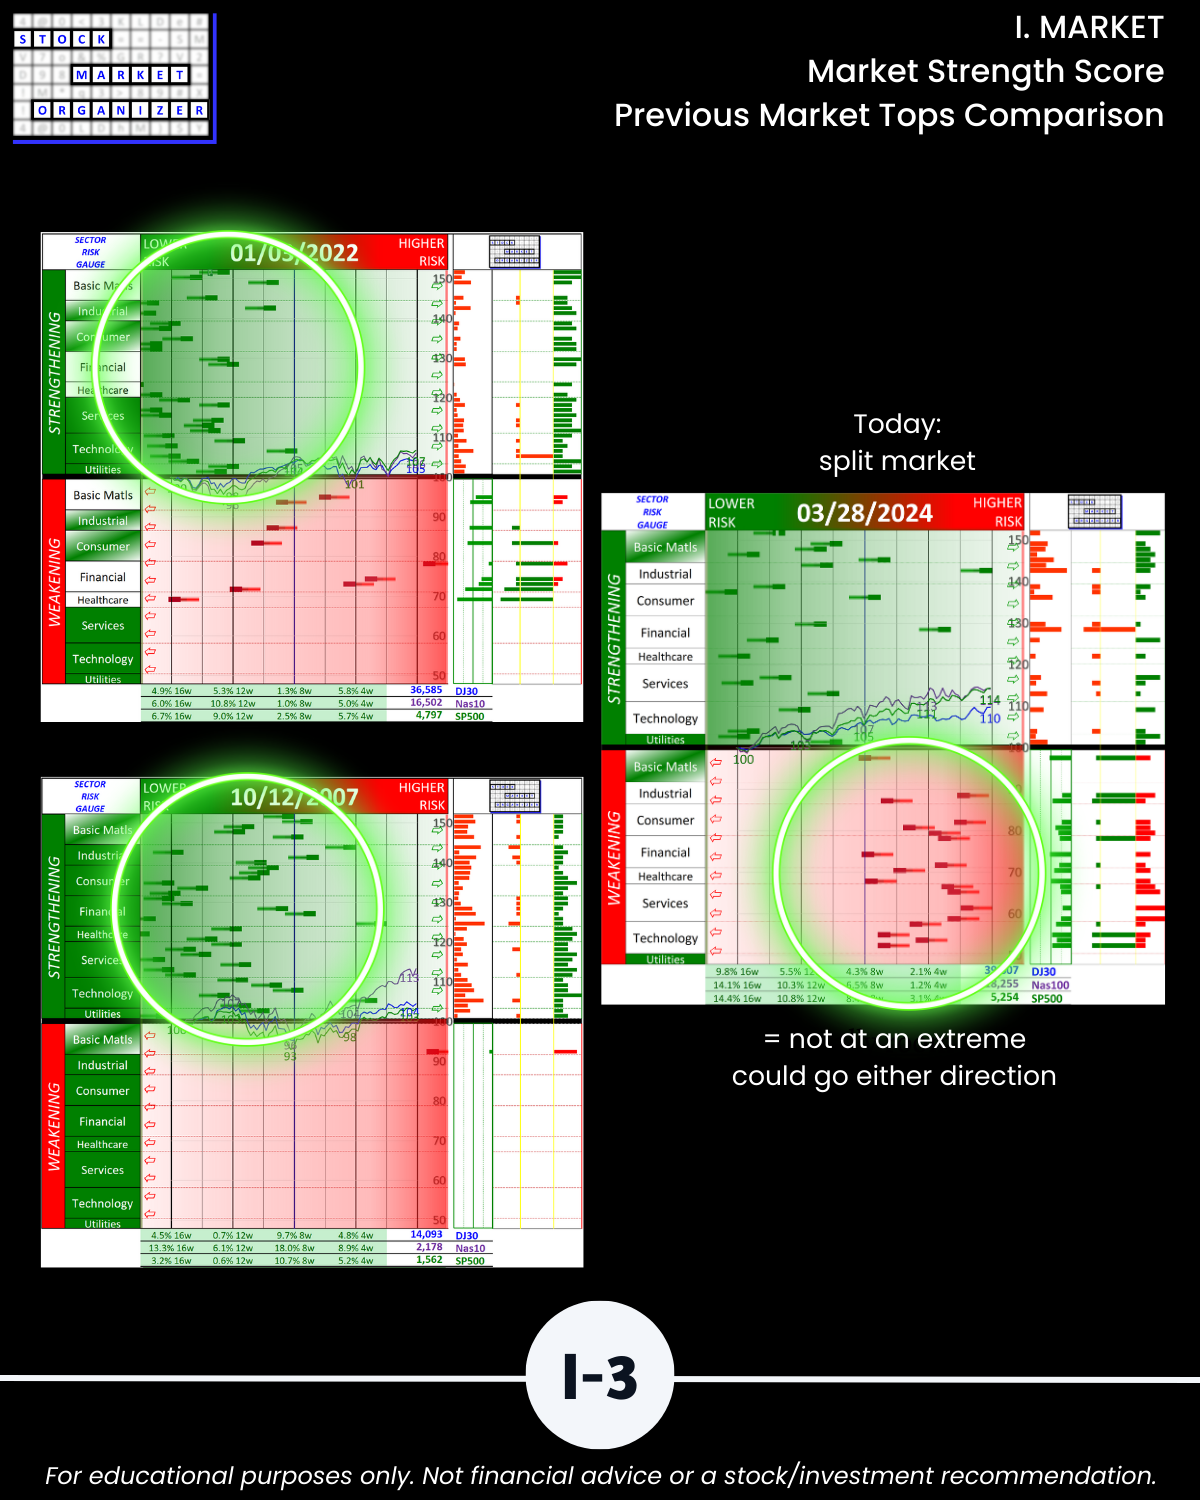
Of course not. But market tops are processes, not events, and if you stack strength (as this analytical method supports) you can enhance your potential profitability as (if) the market makes a top.
Following are galleries with page-by-page views of this report.
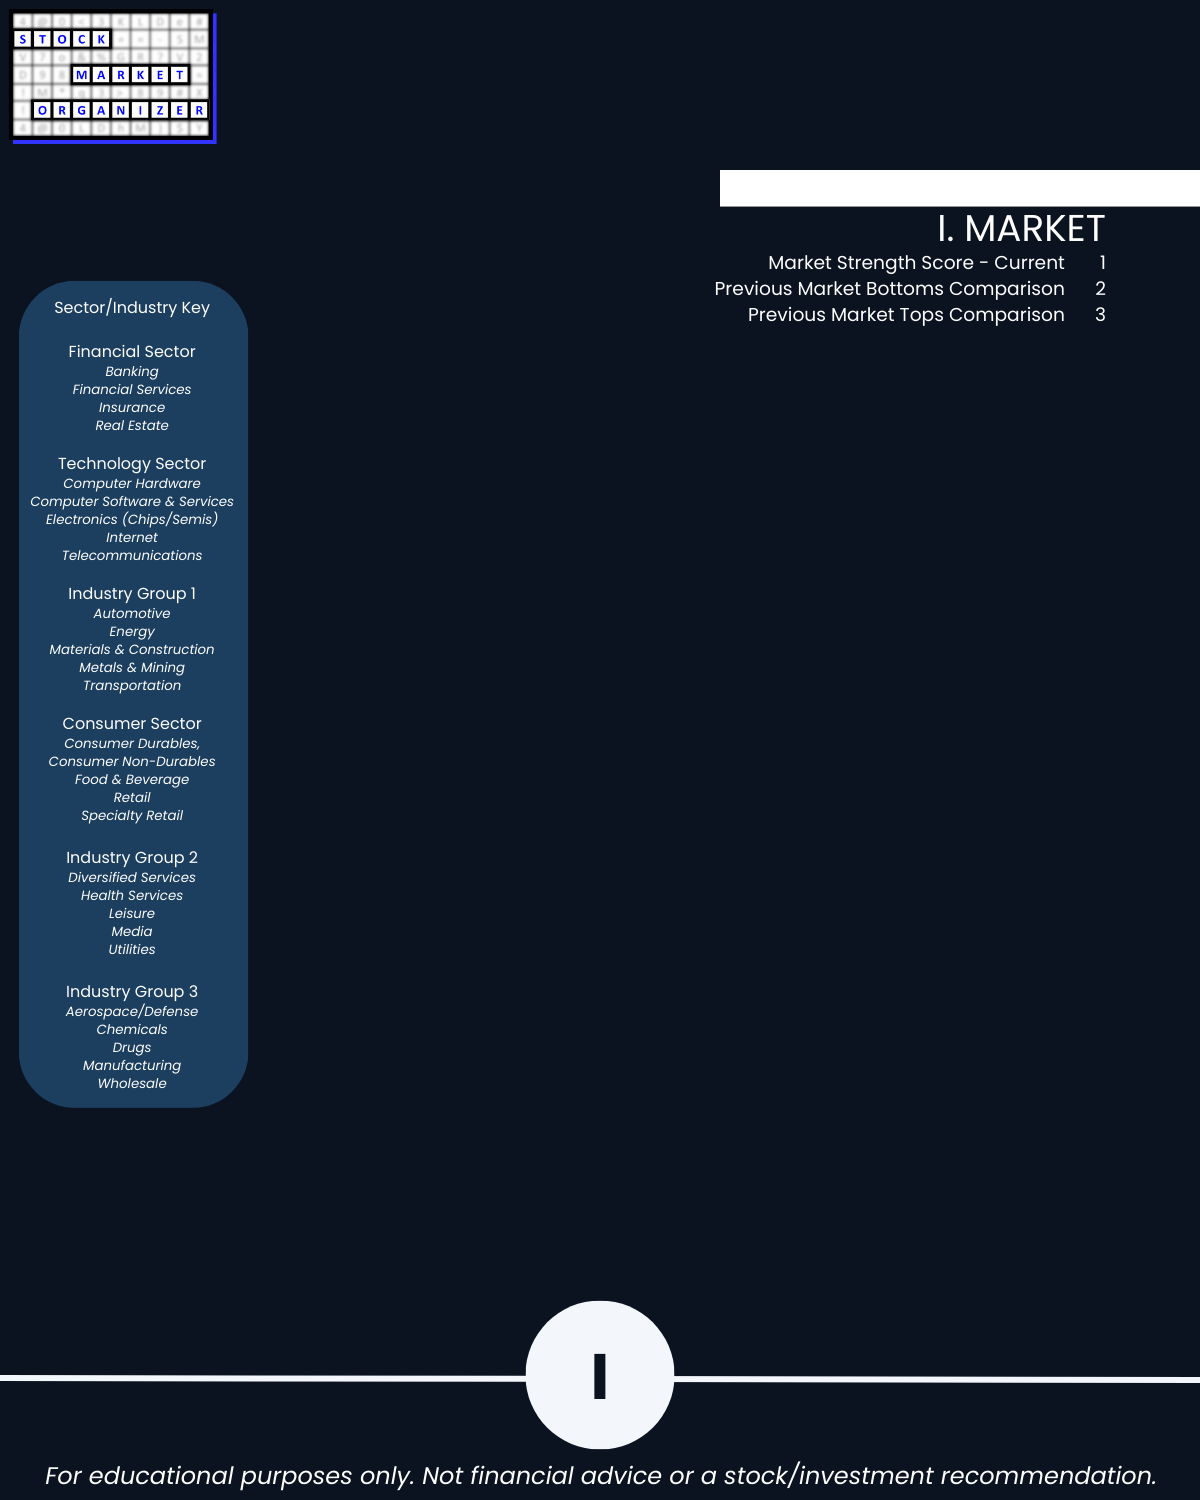
I. MARKET Prologue Critical Concepts/Market Strength Score
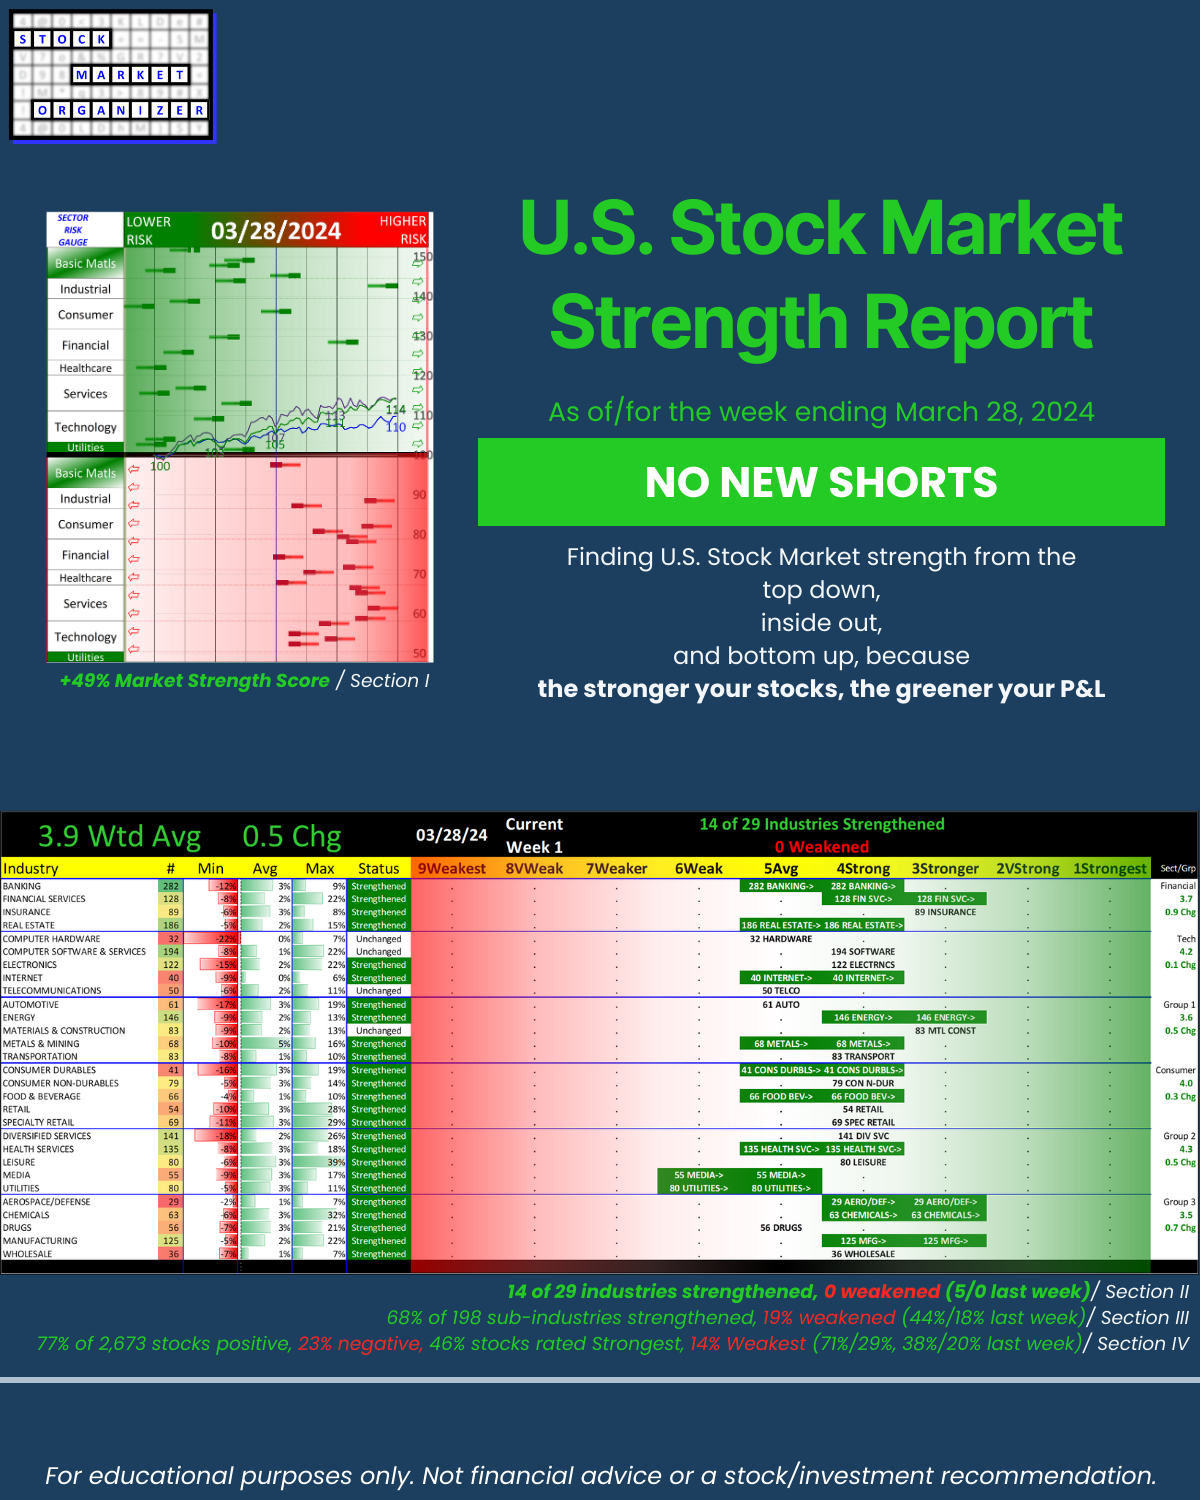
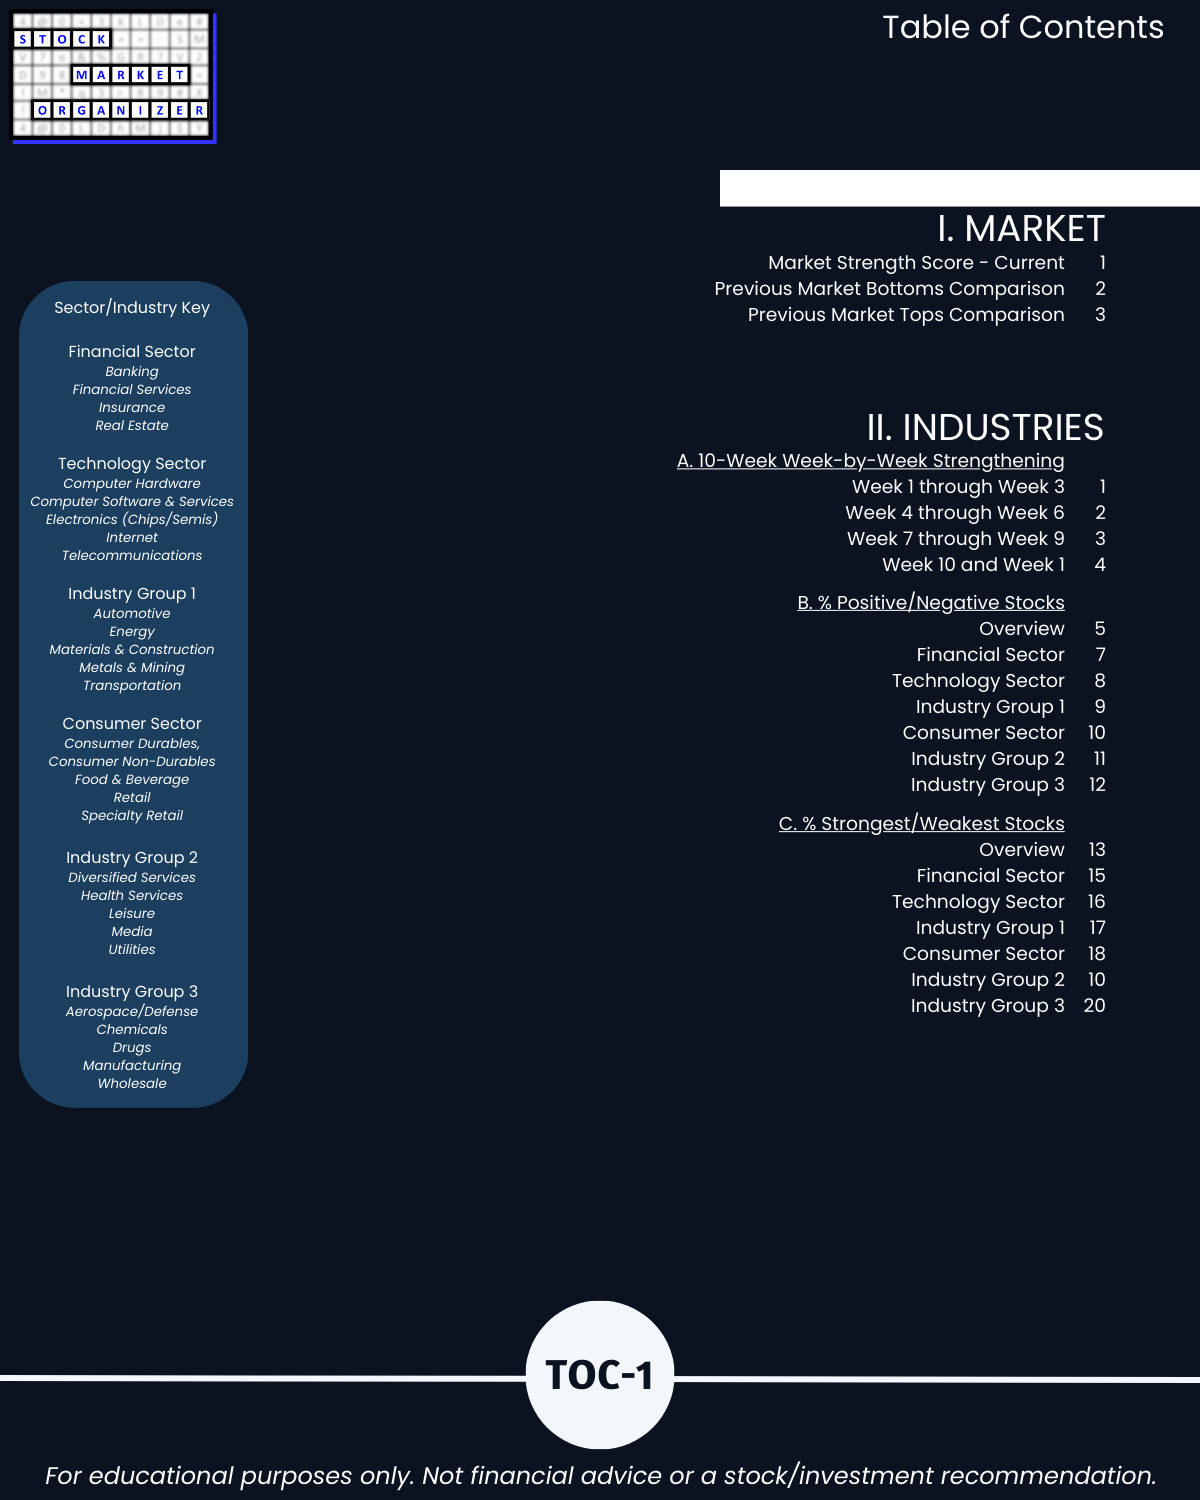
IIA. INDUSTRIES 10-Week Week-by-Week Strengthening
IIB. INDUSTRIES % Positive/Negative Stocks

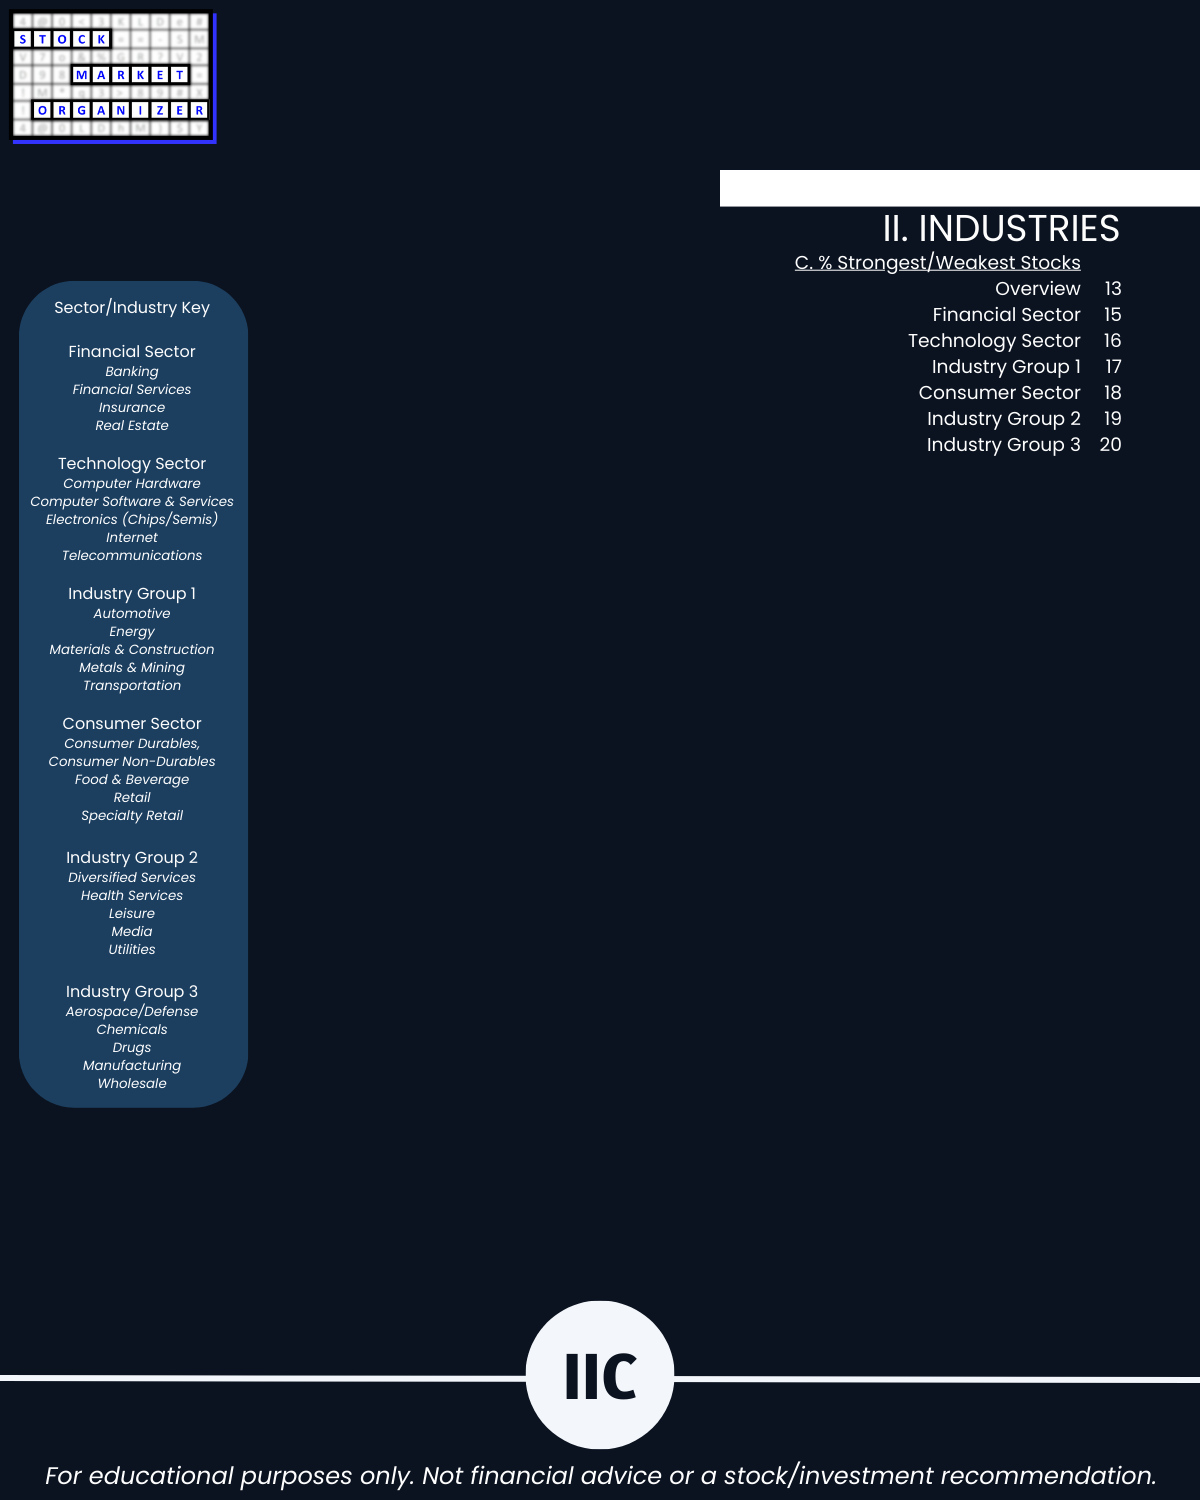
IIC. INDUSTRIES % Strongest/Weakest Stocks

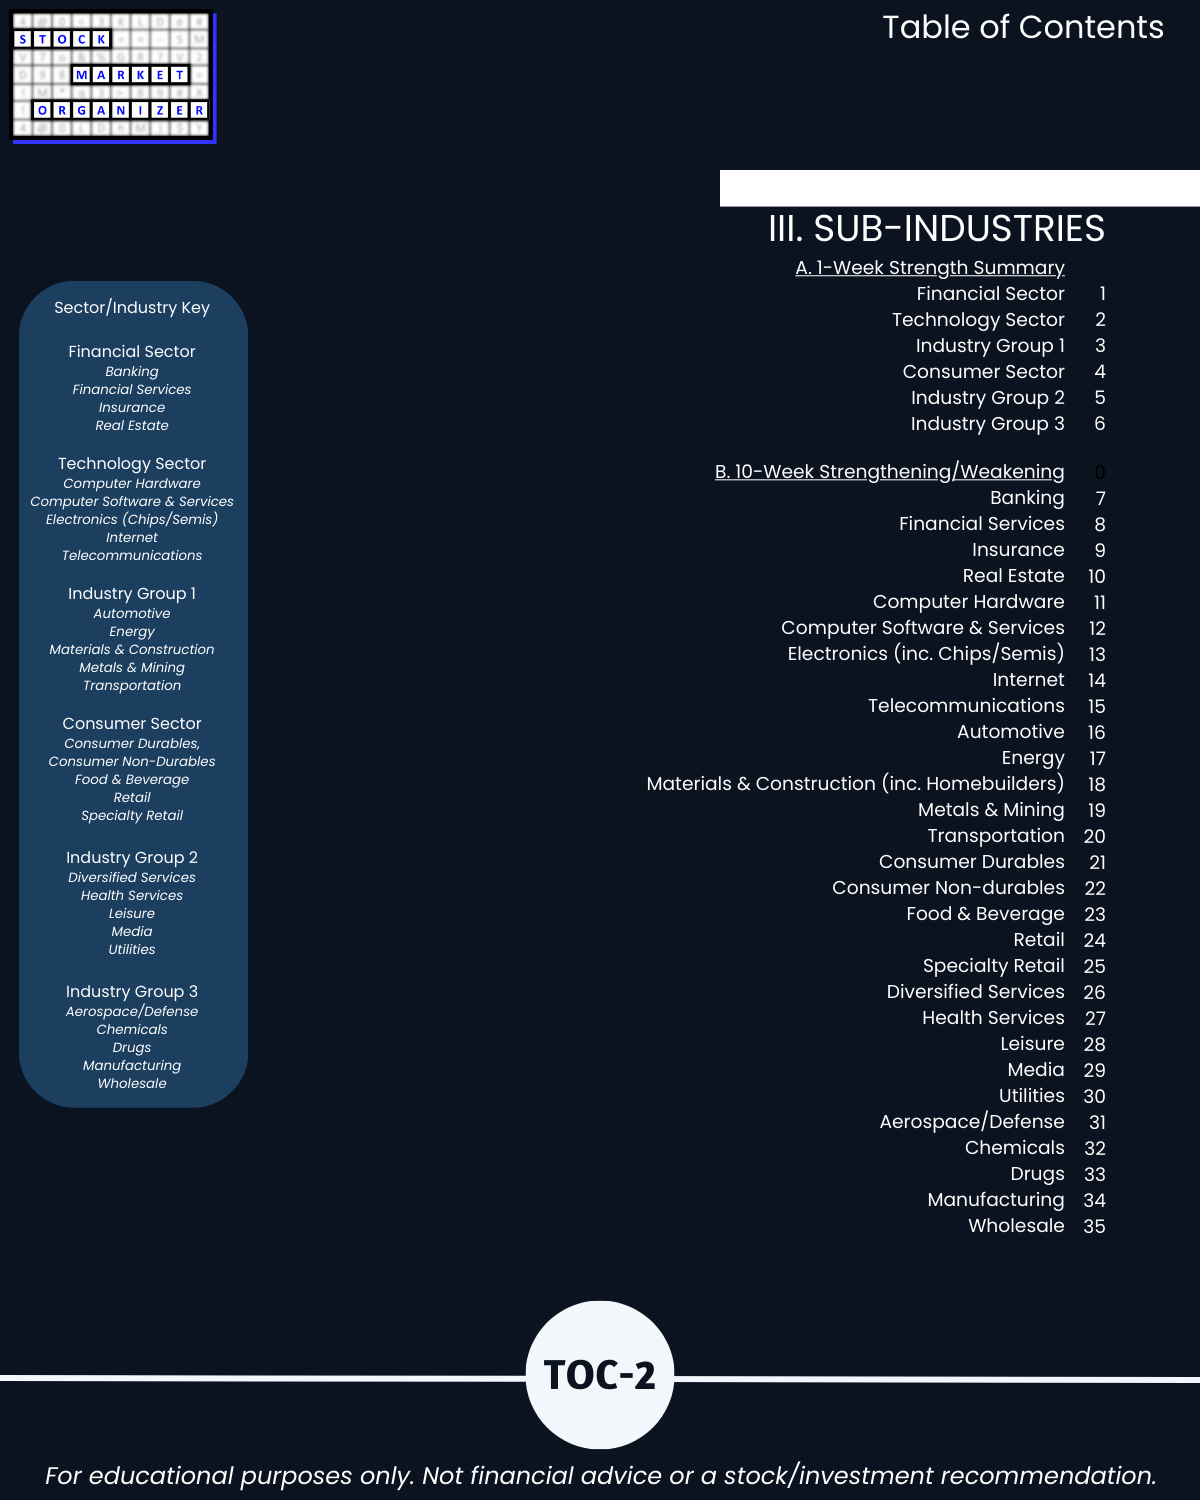
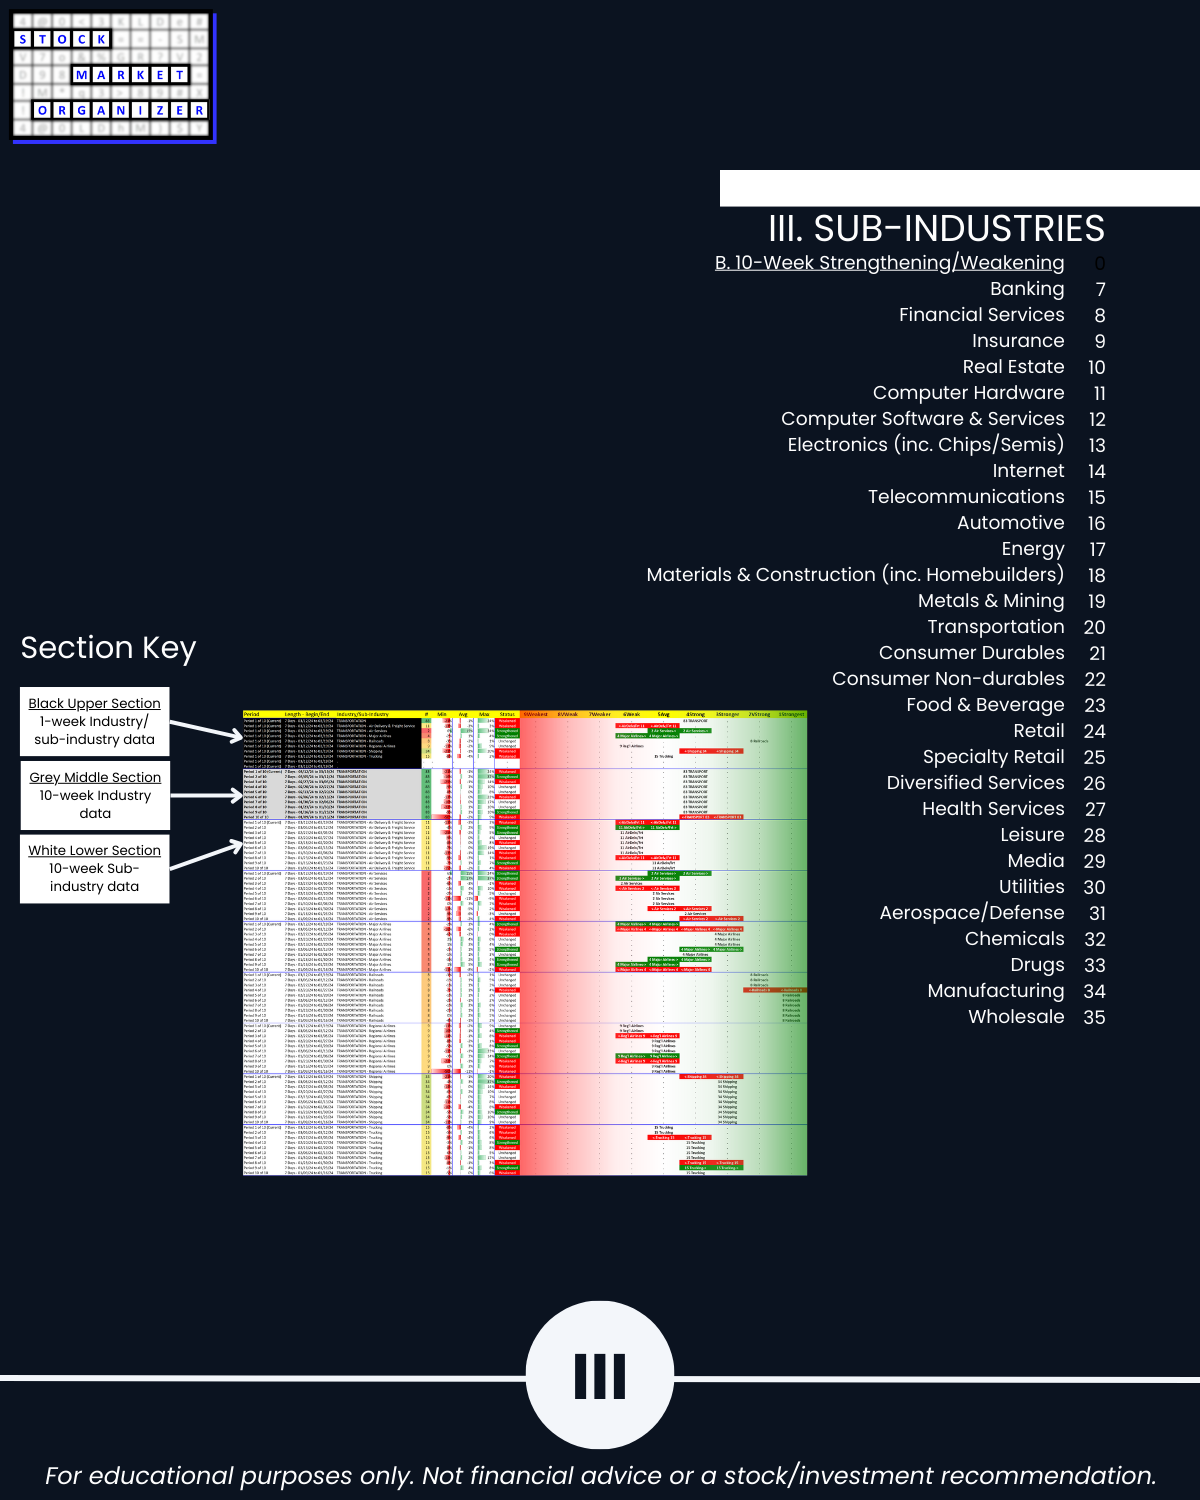
IIIA. SUB-INDUSTRIES 1-Week Strength Summary
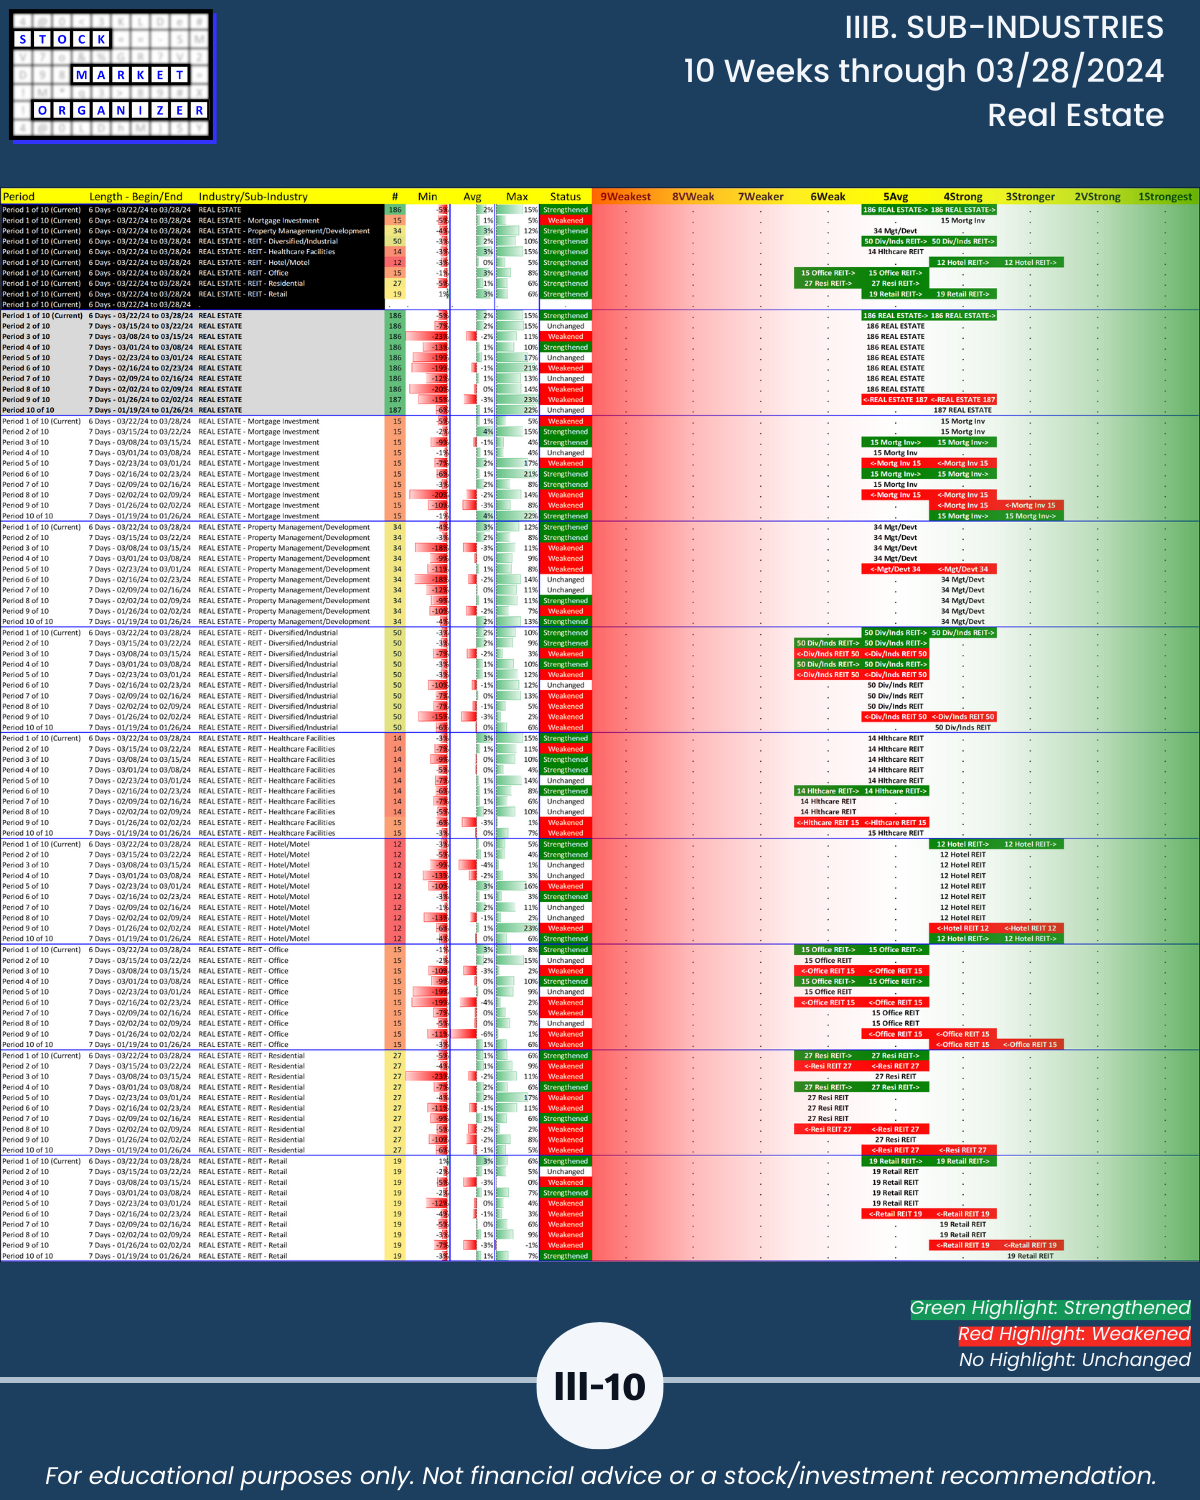
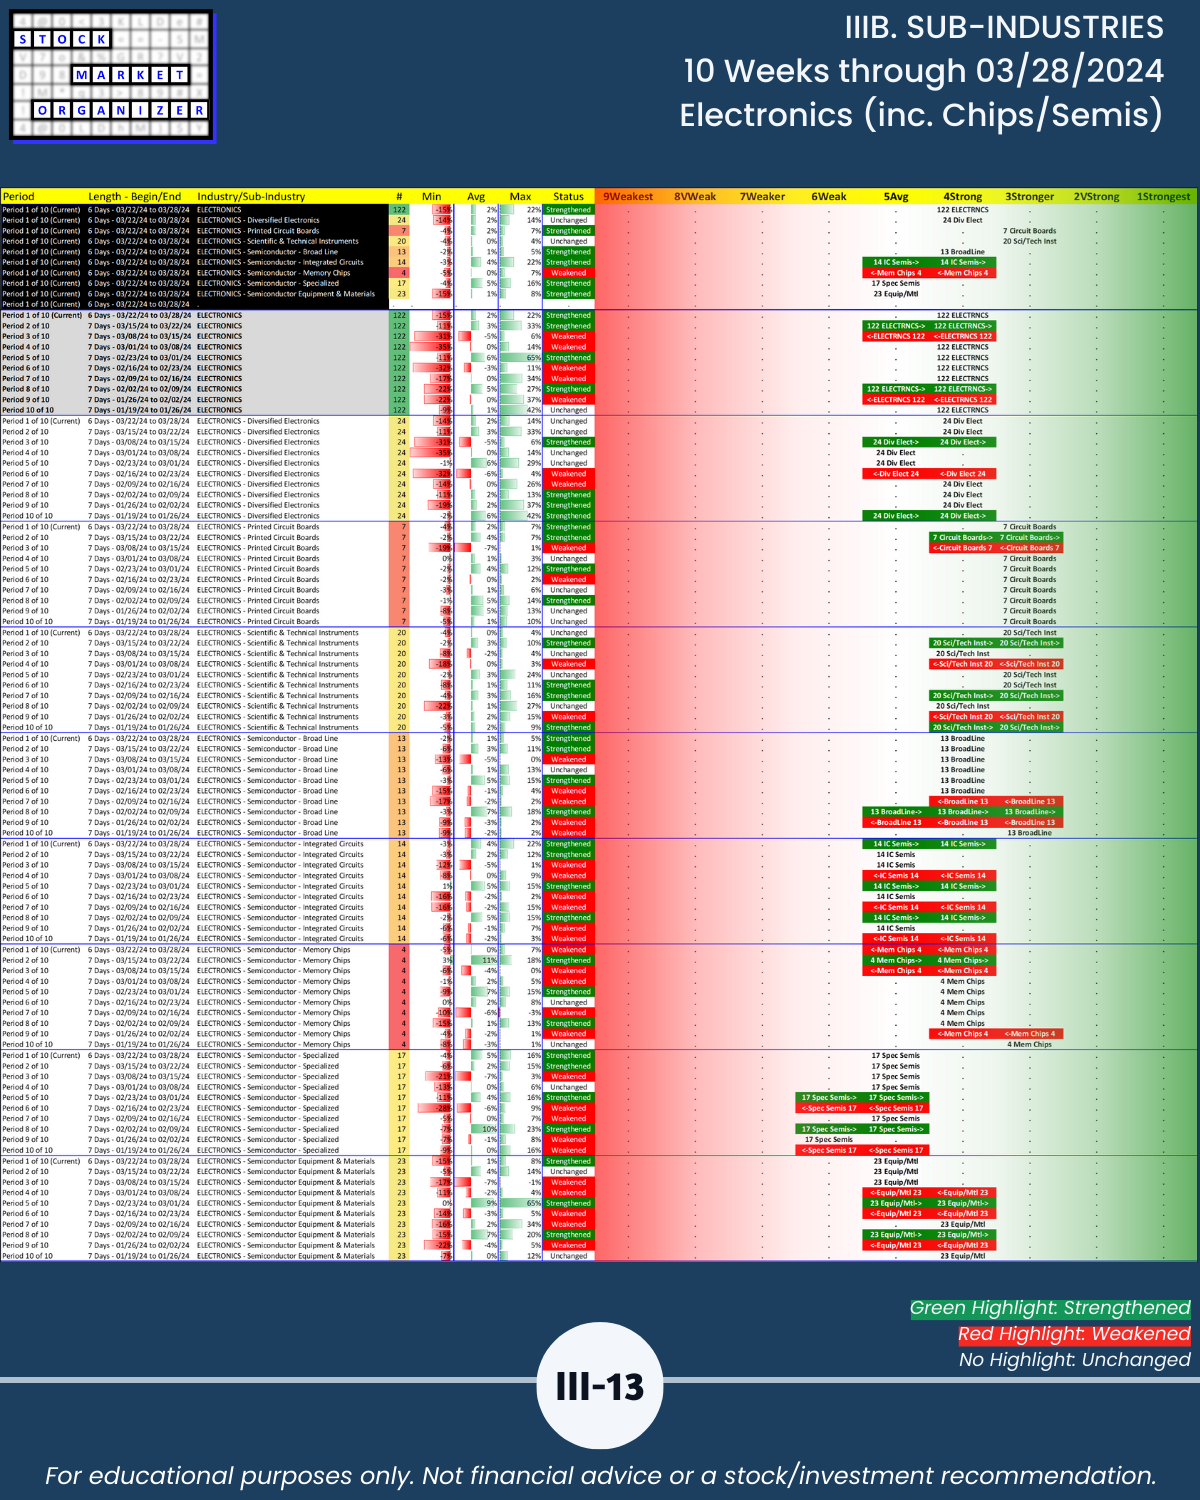
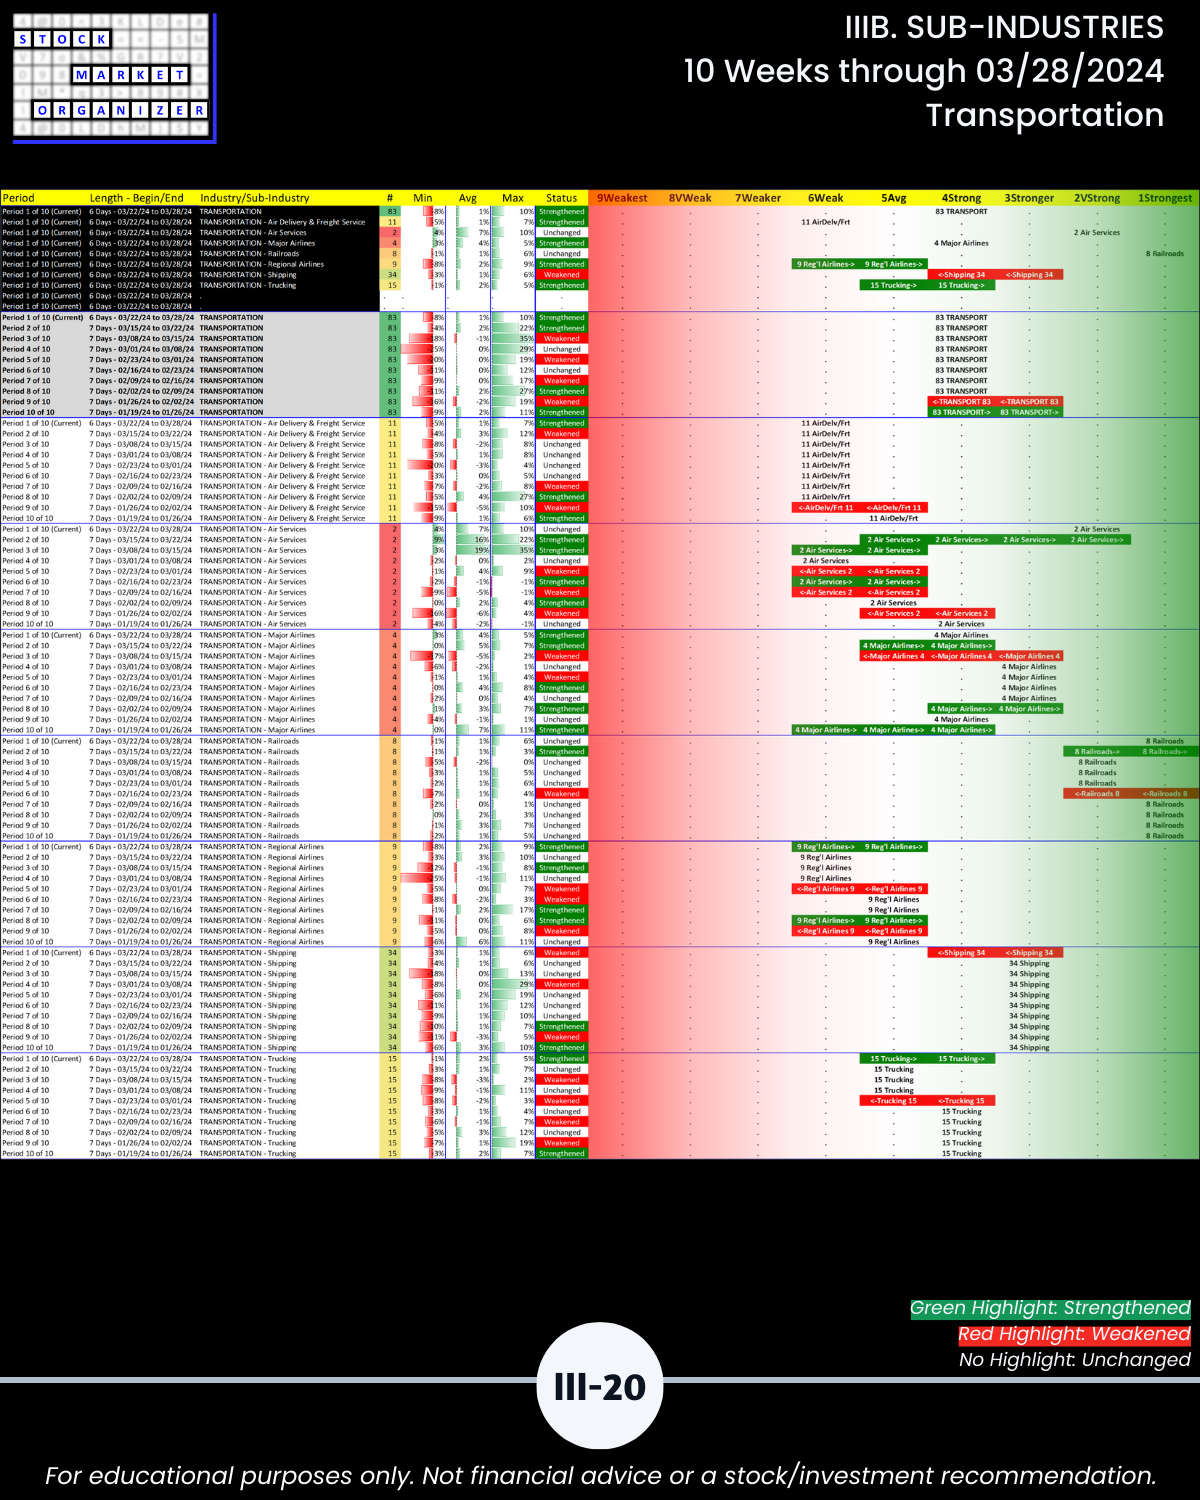
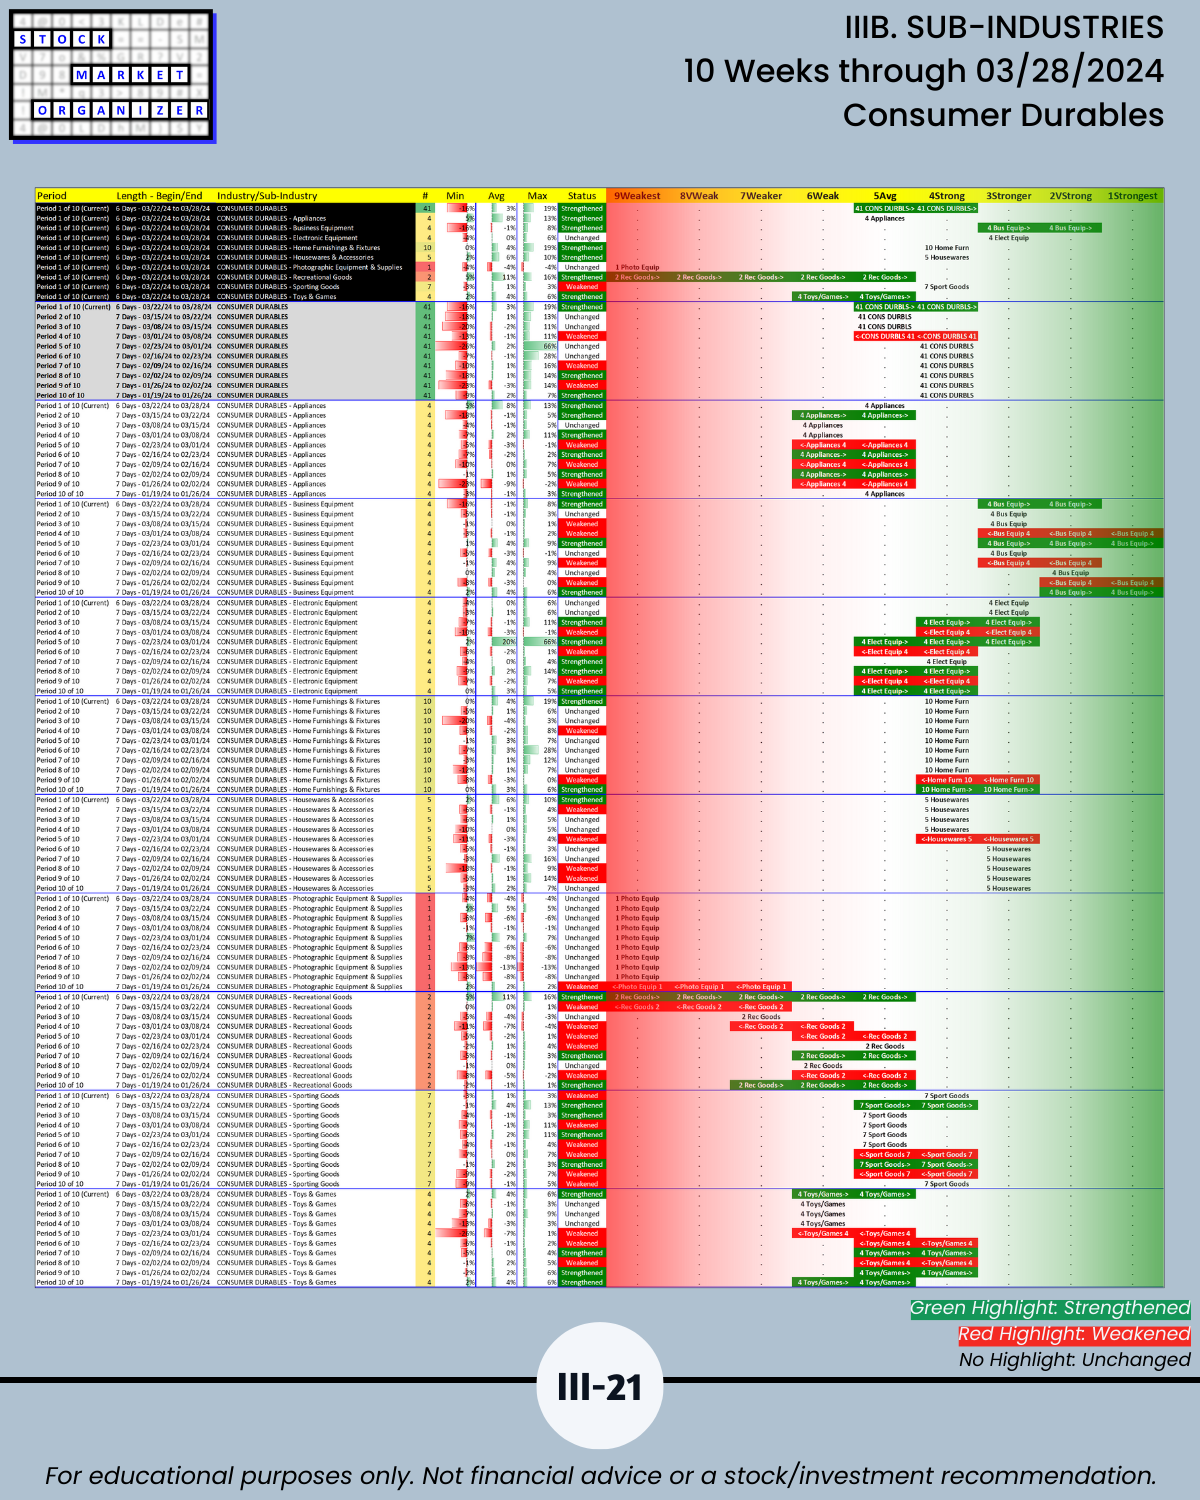
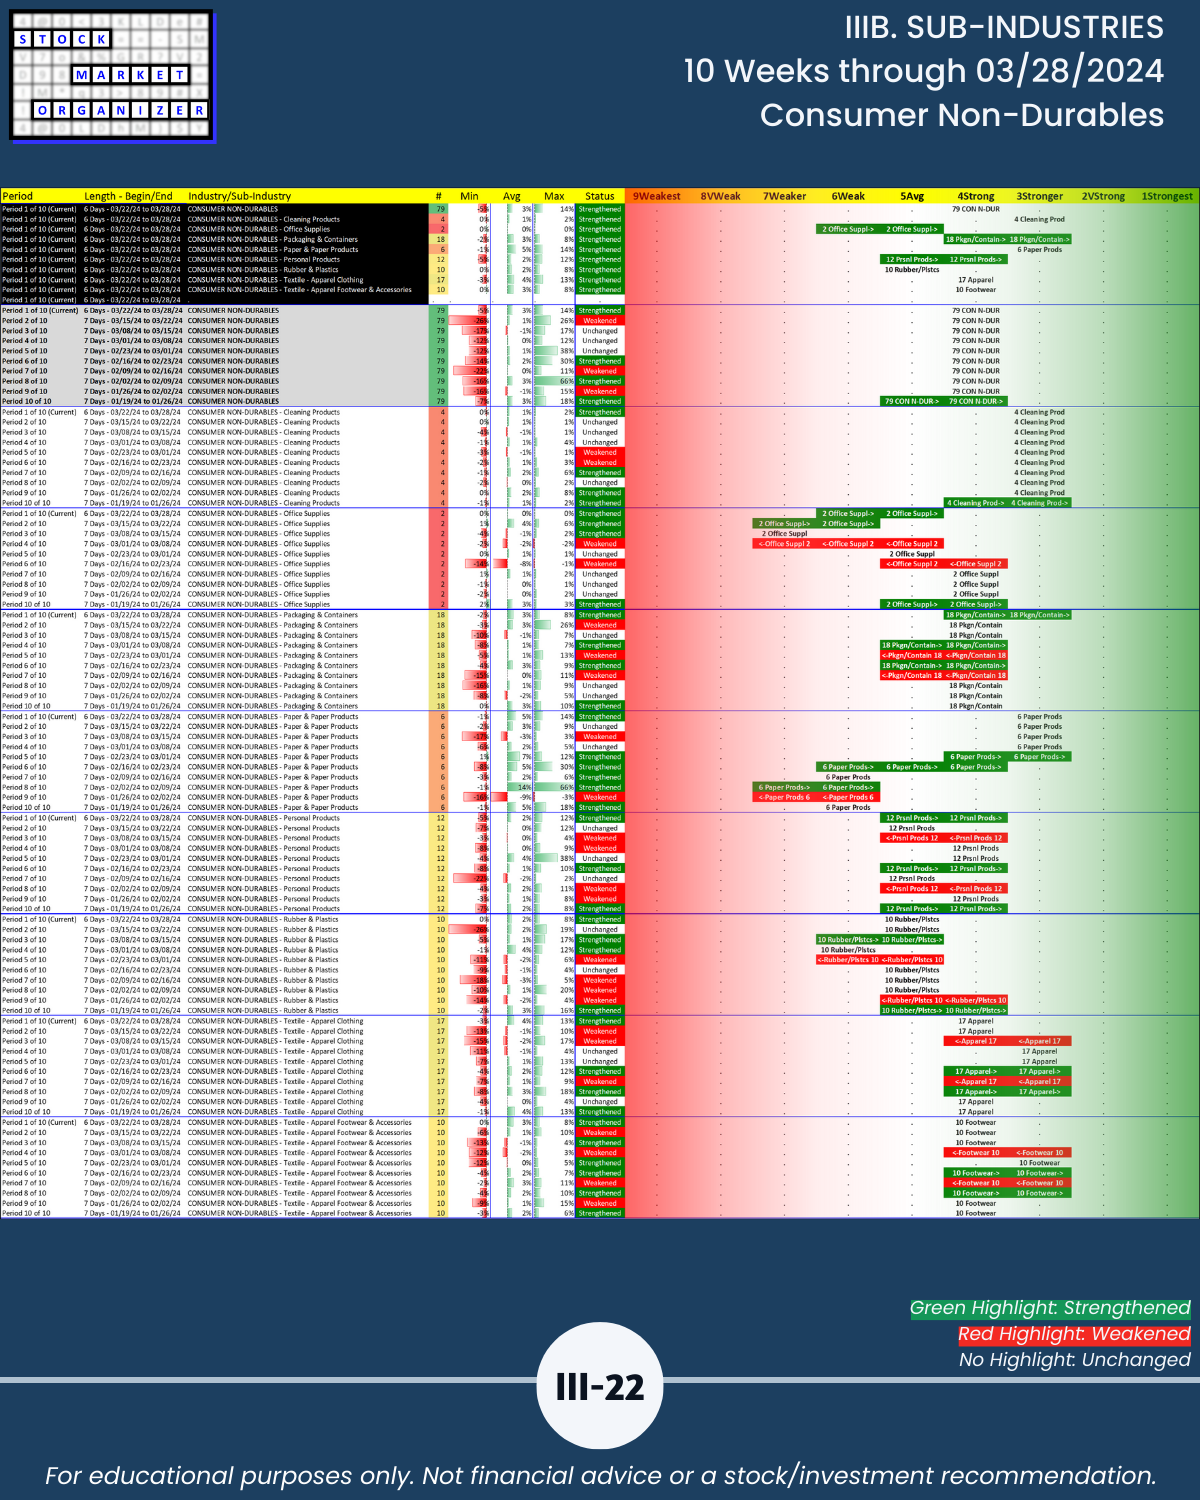
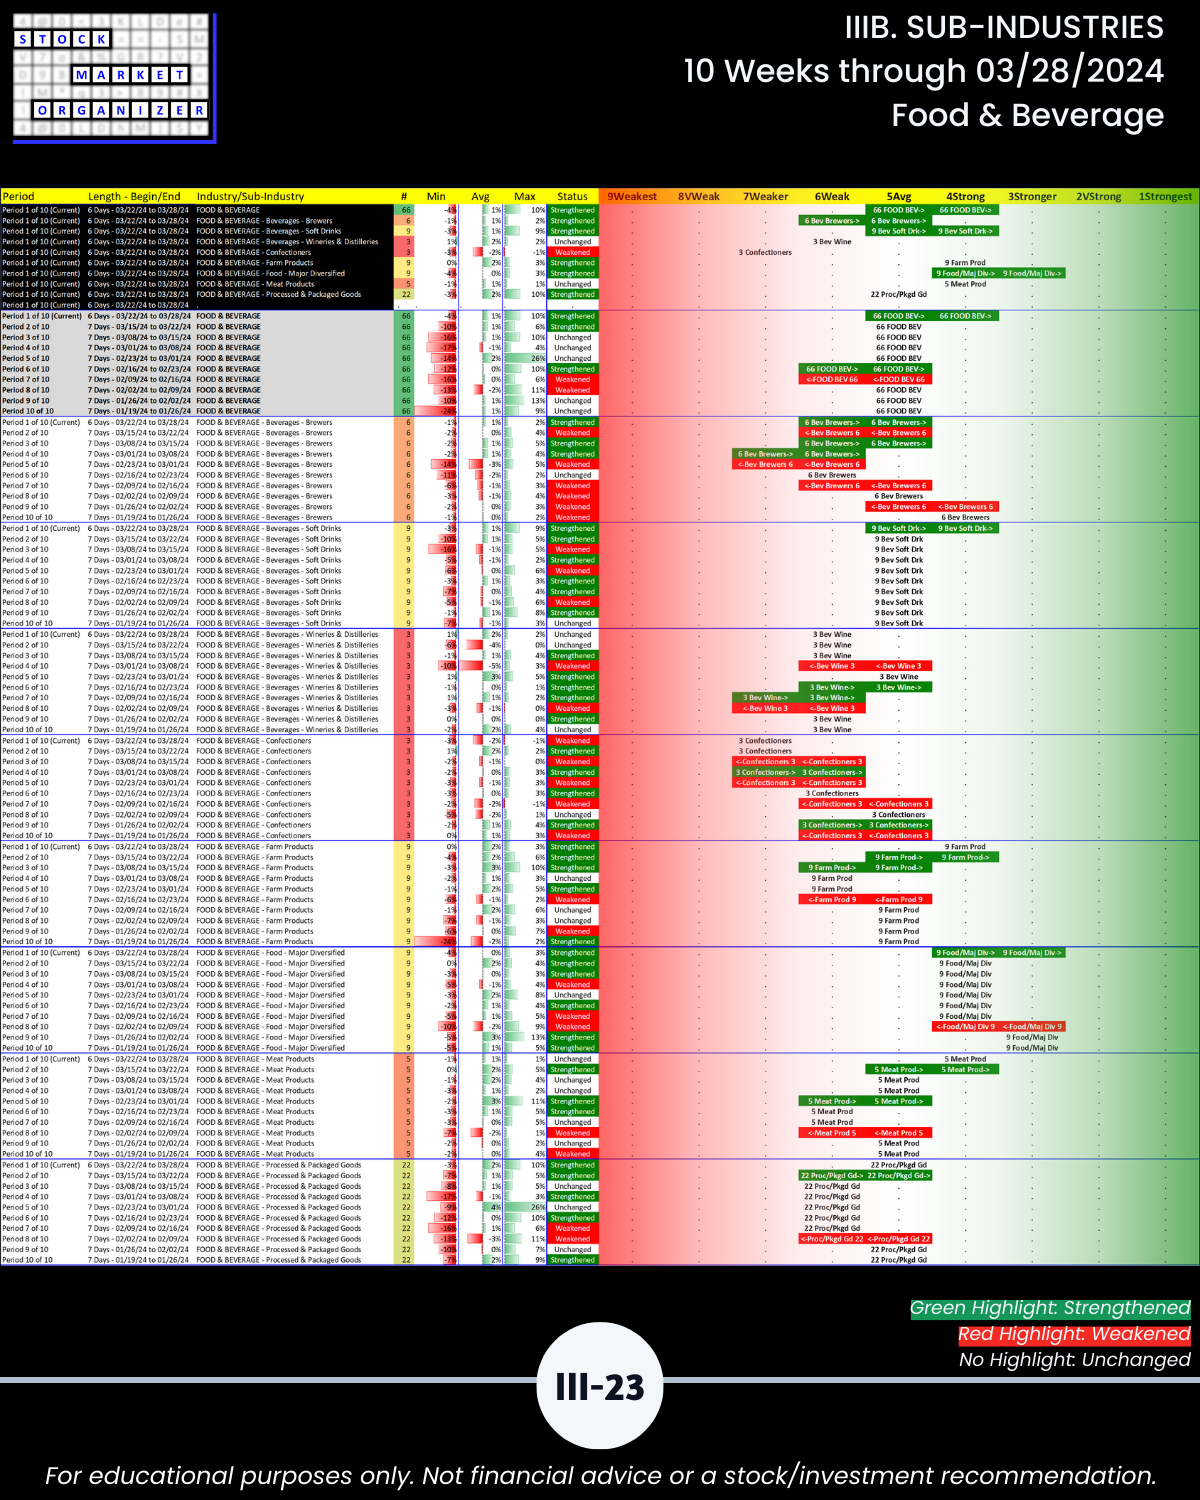
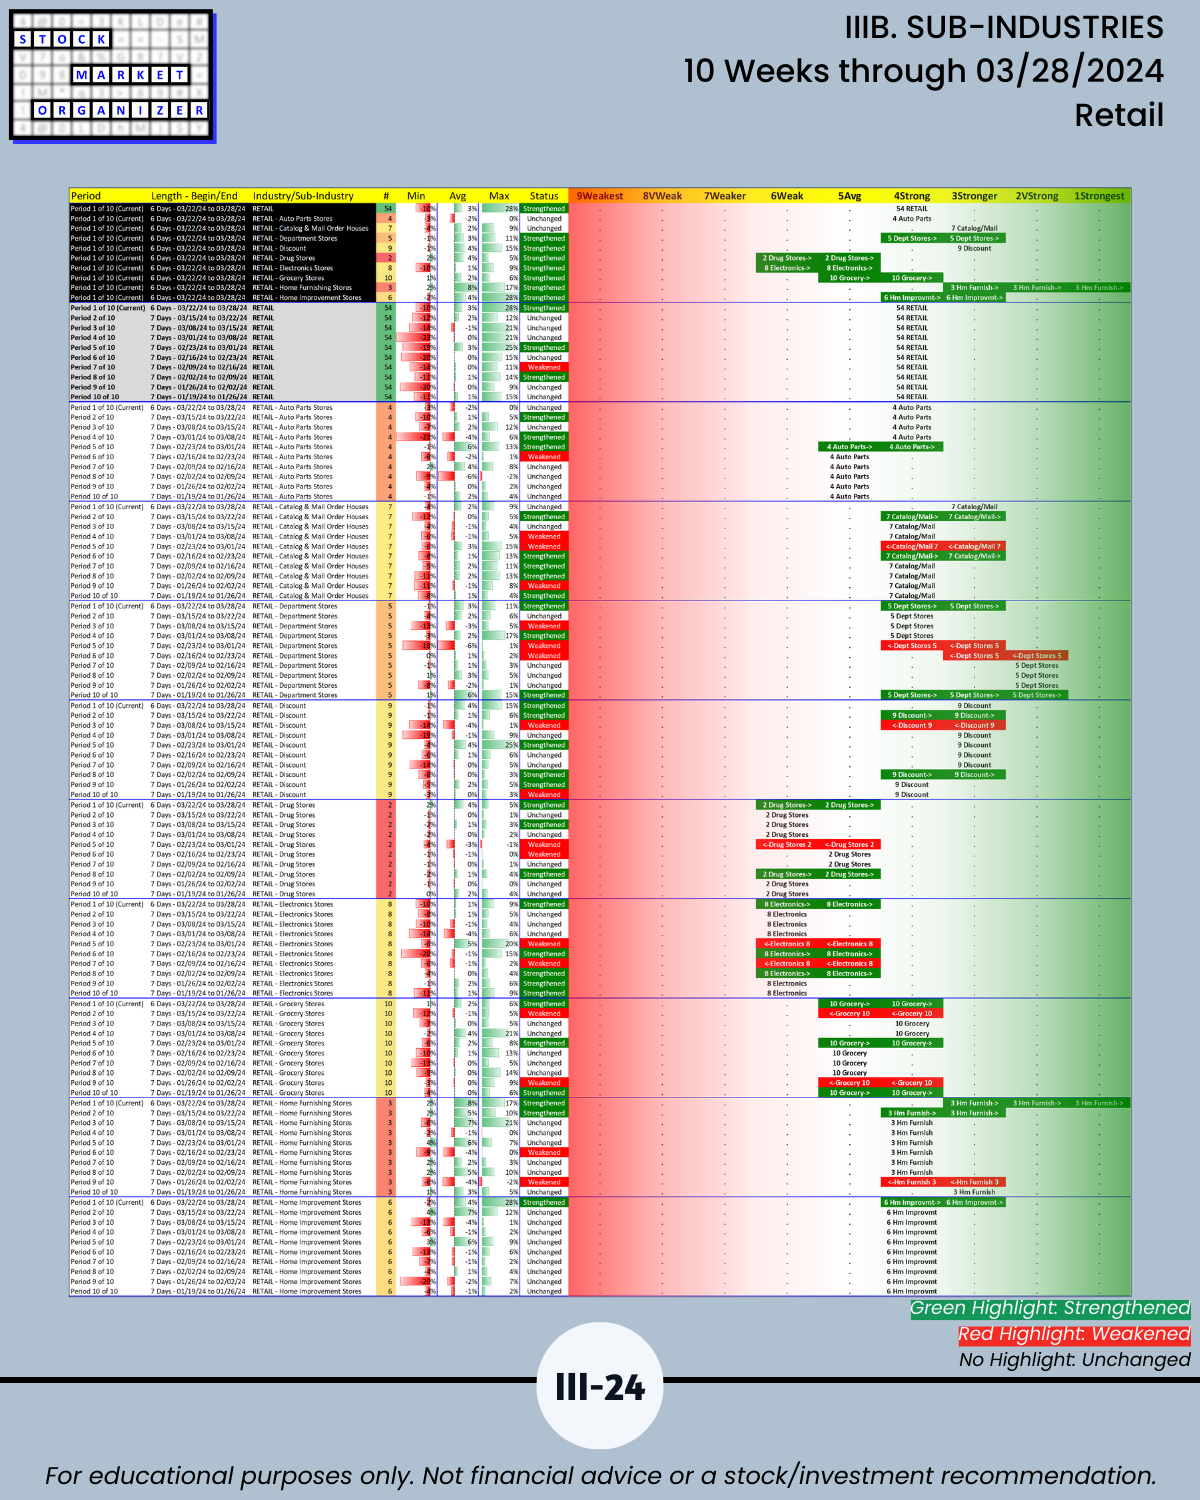
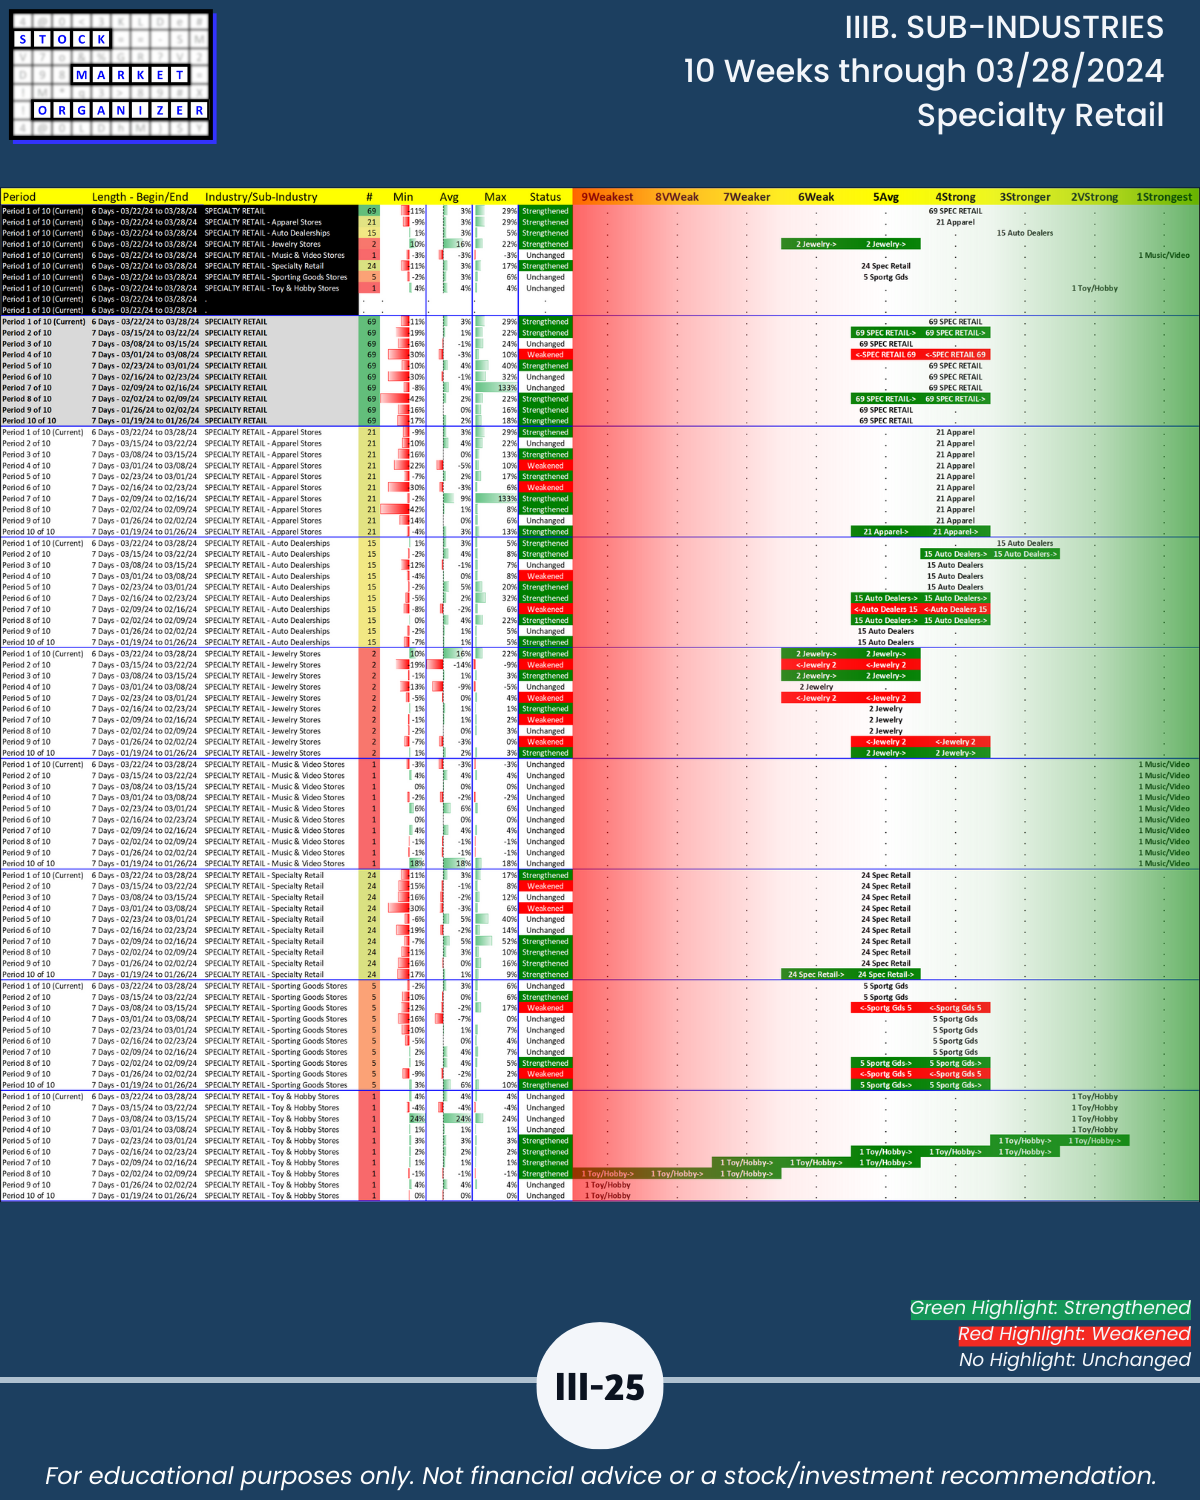
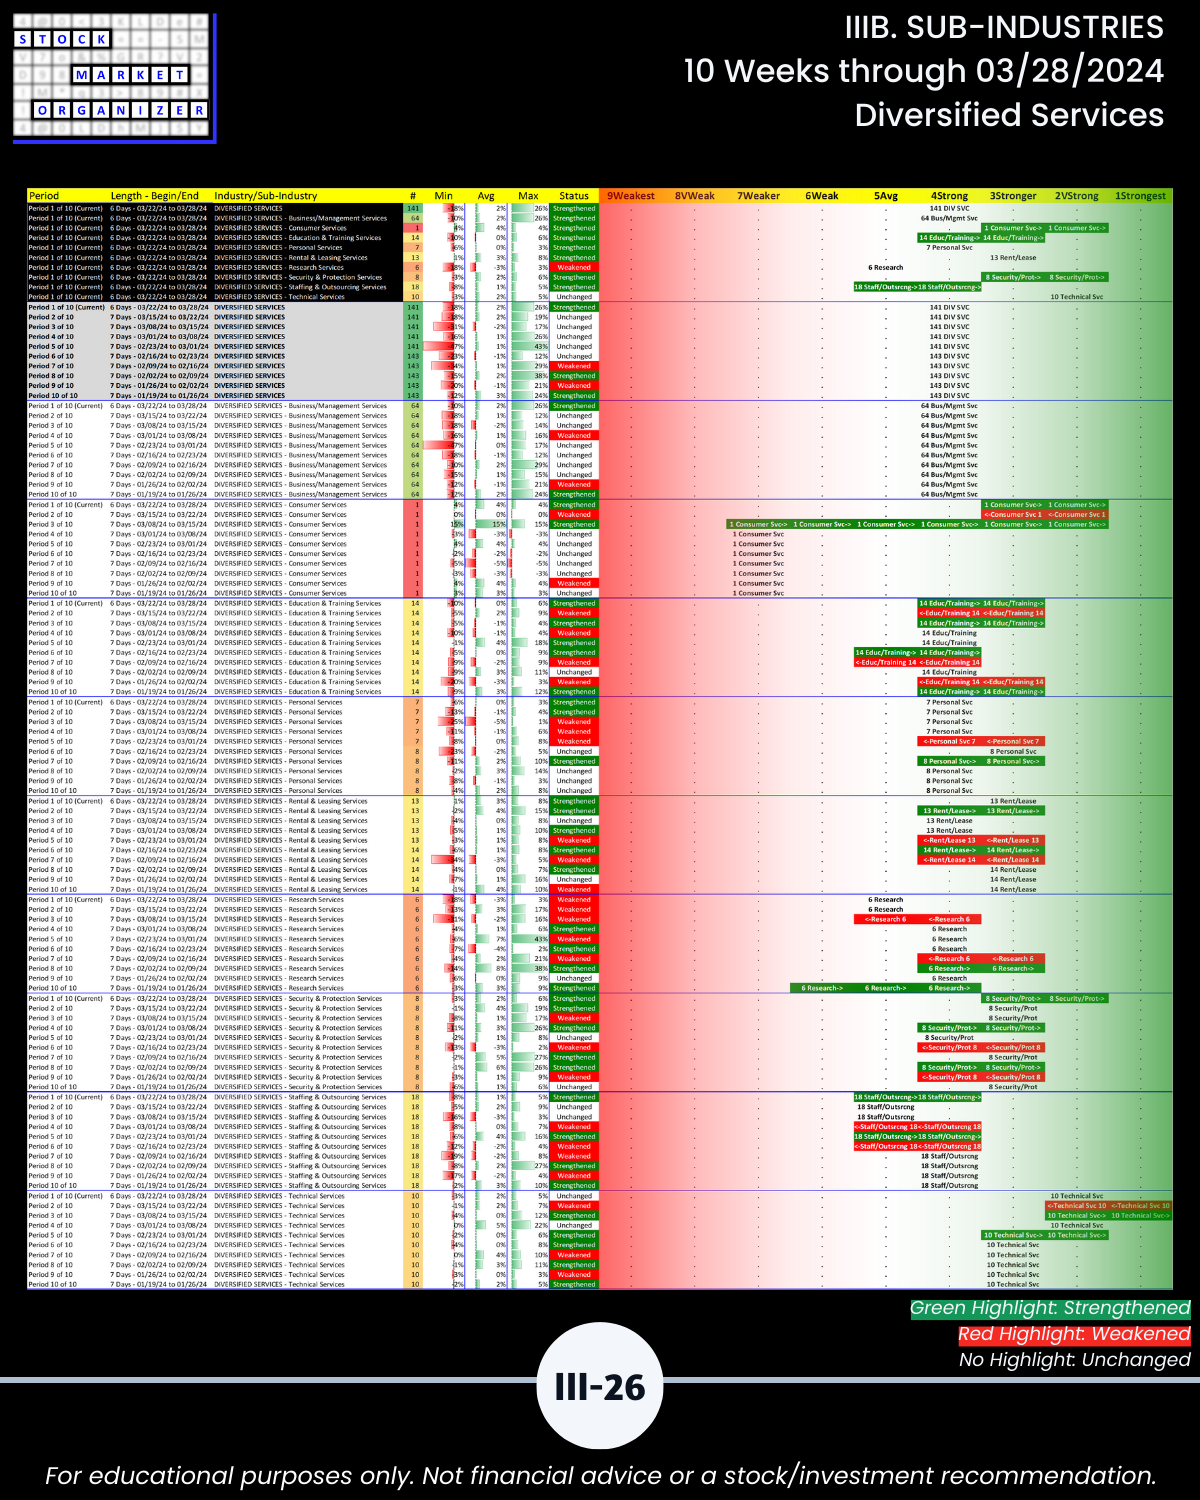
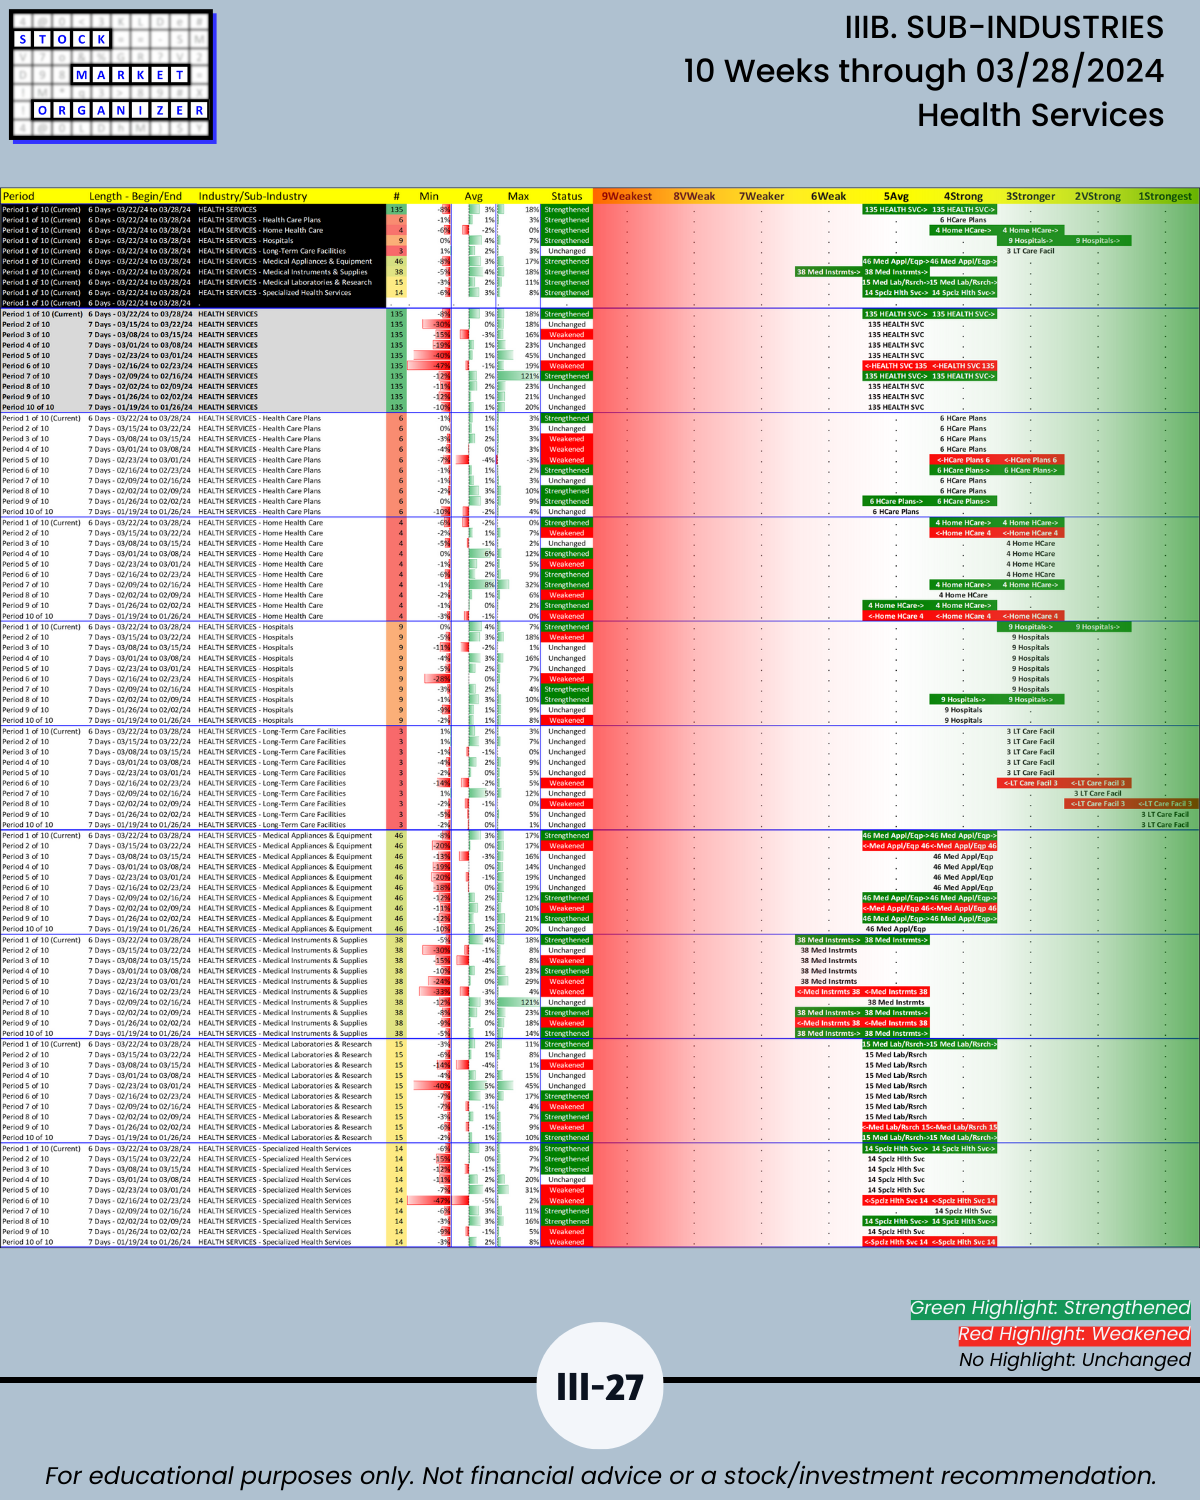
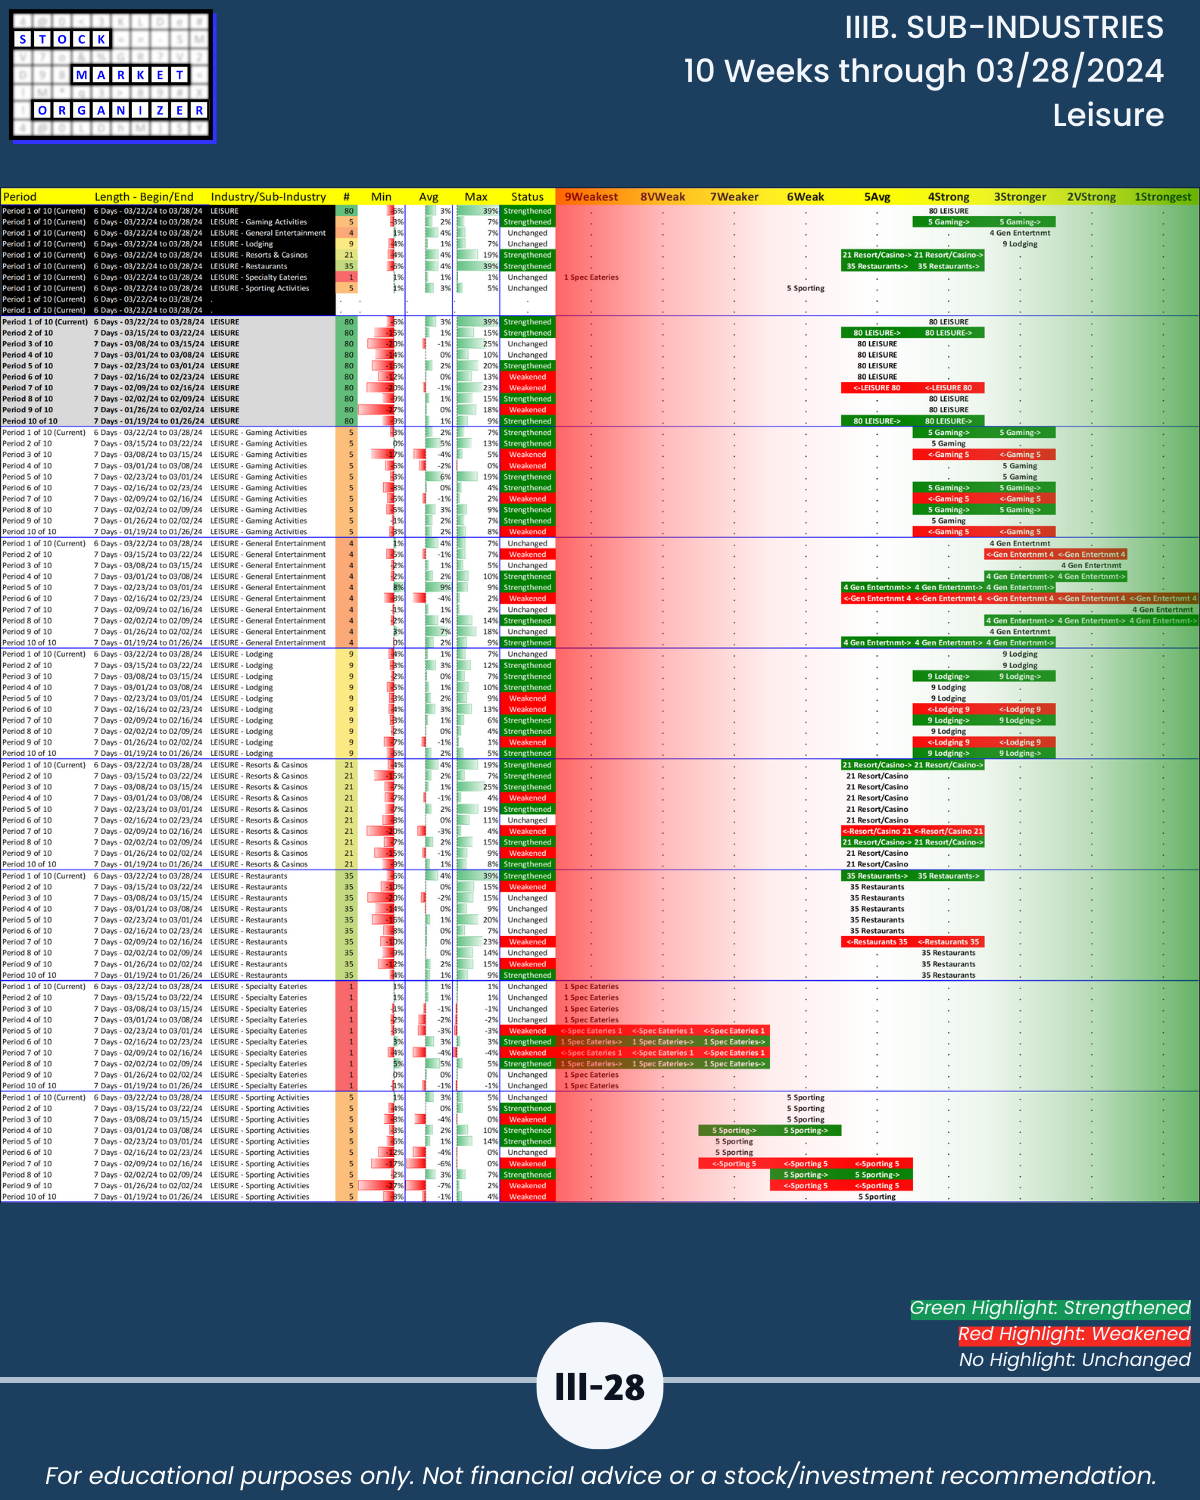
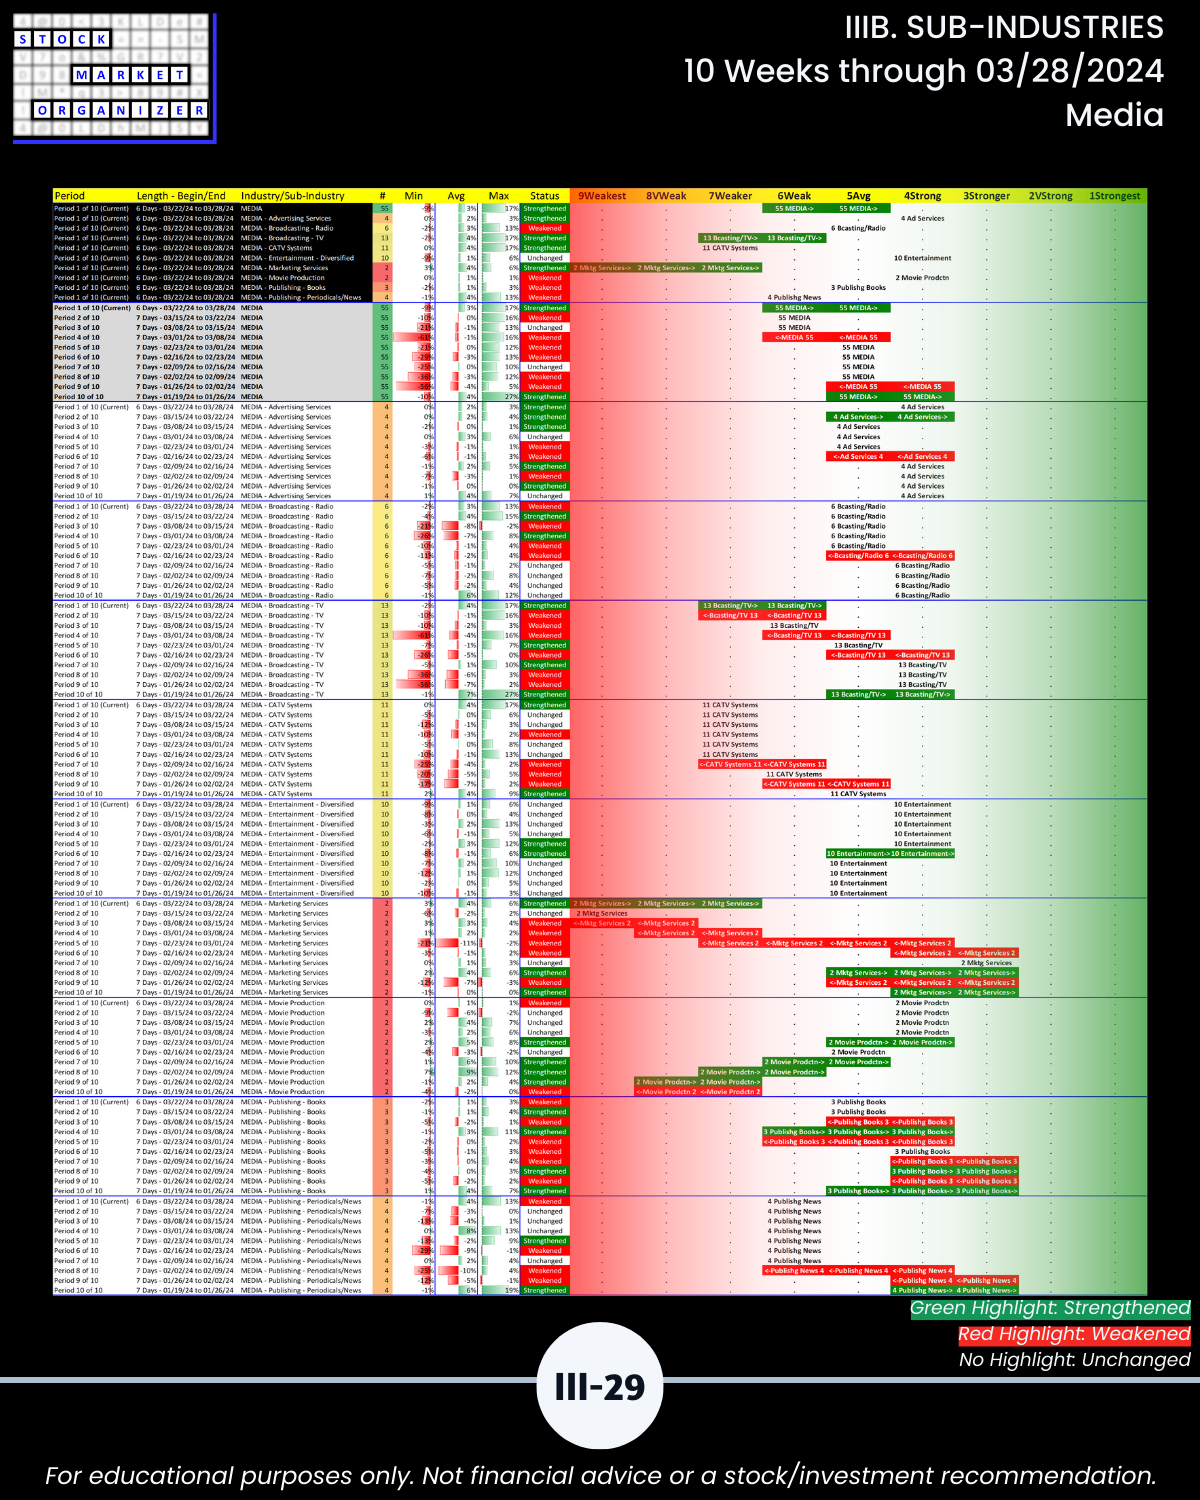
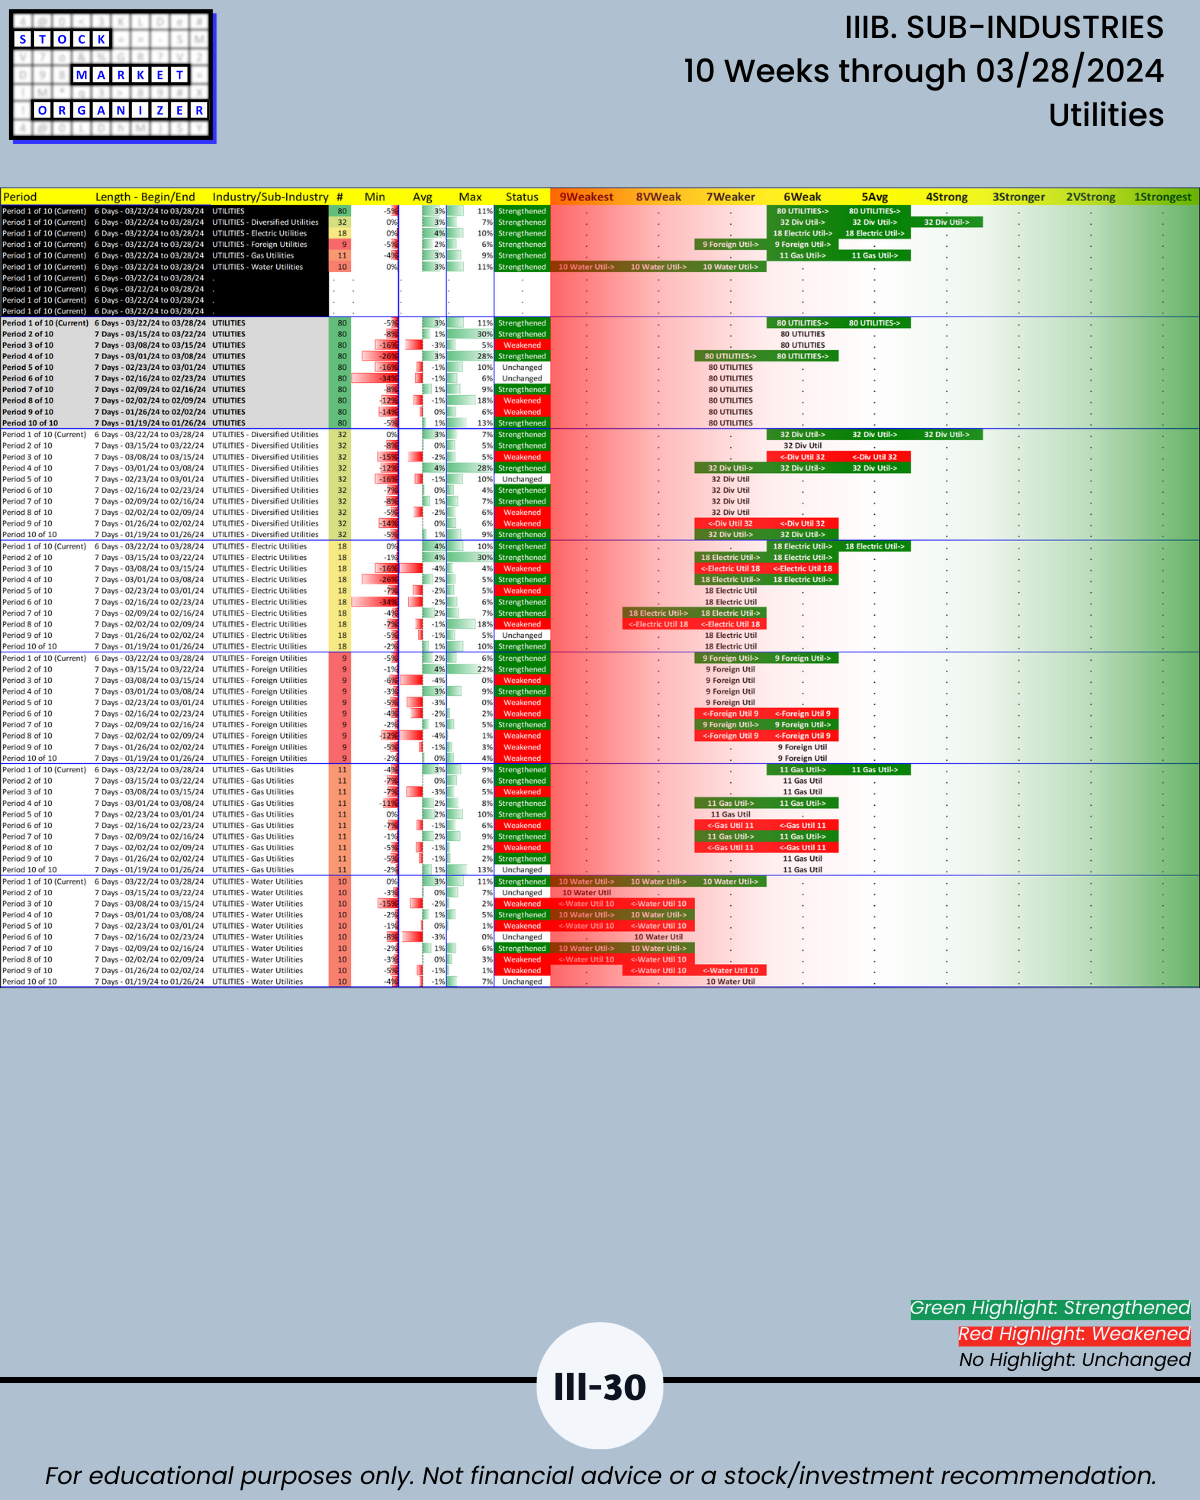
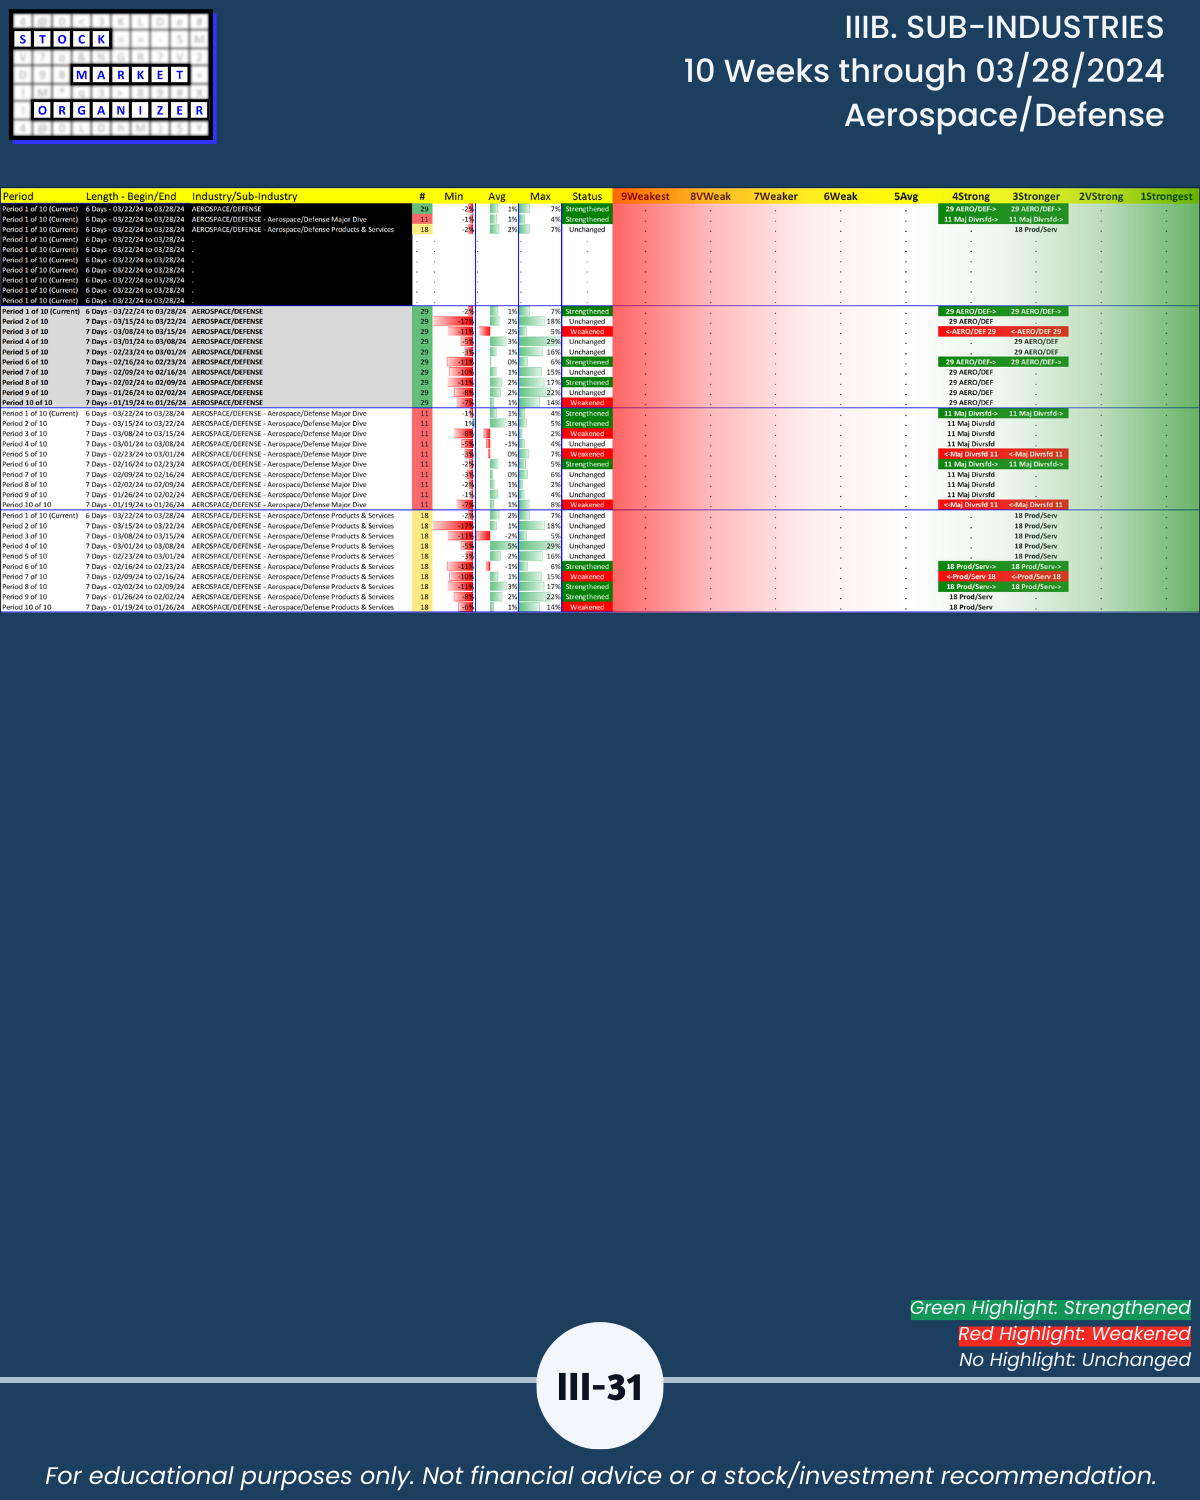
IIIB. SUB-INDUSTRIES 10-Week Strengthening/Weakening

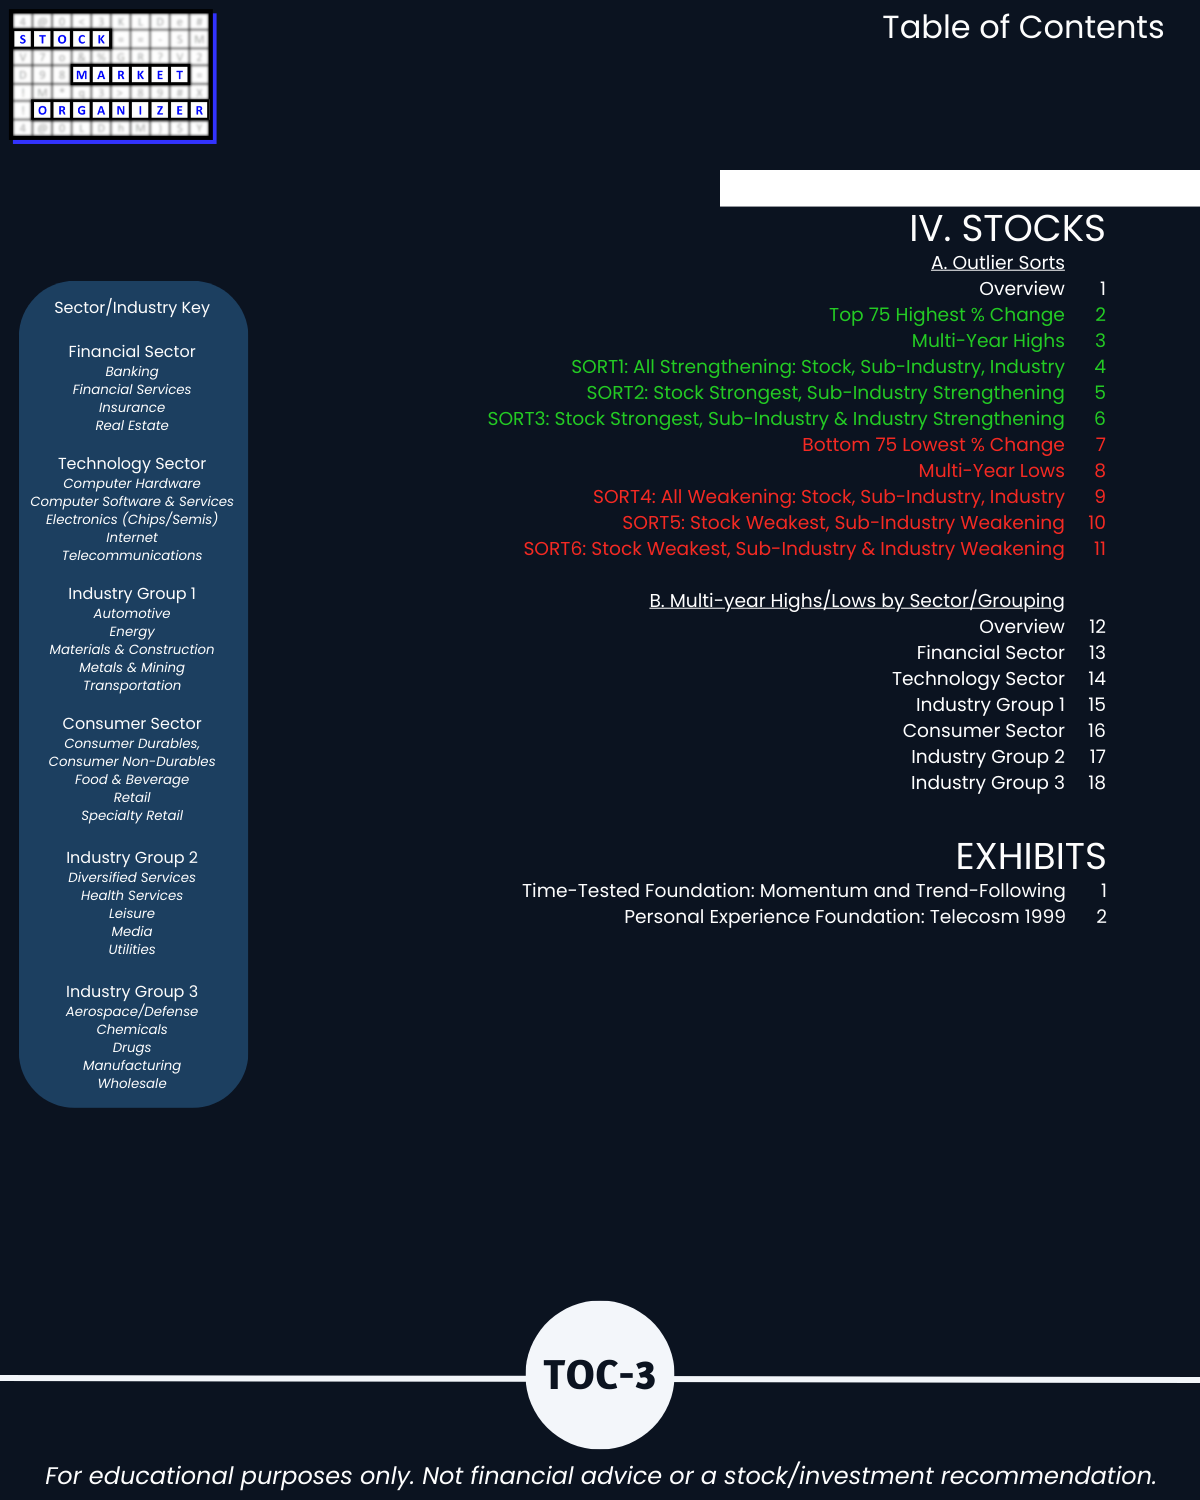
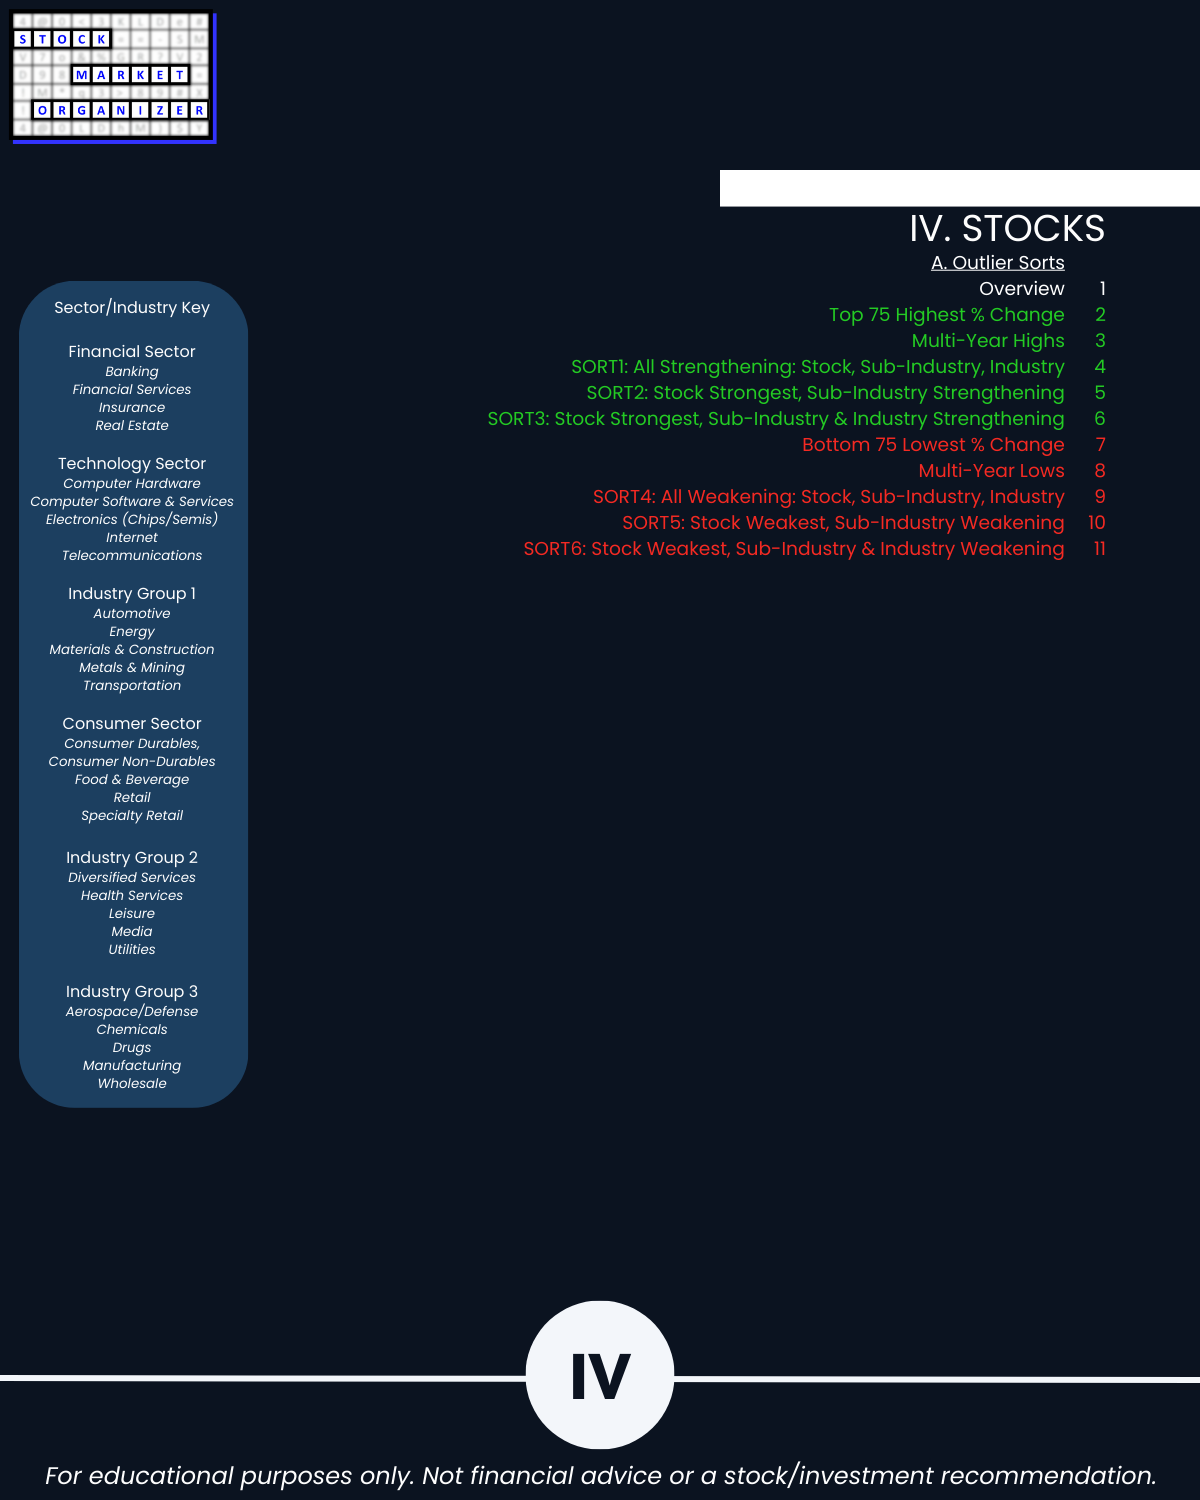
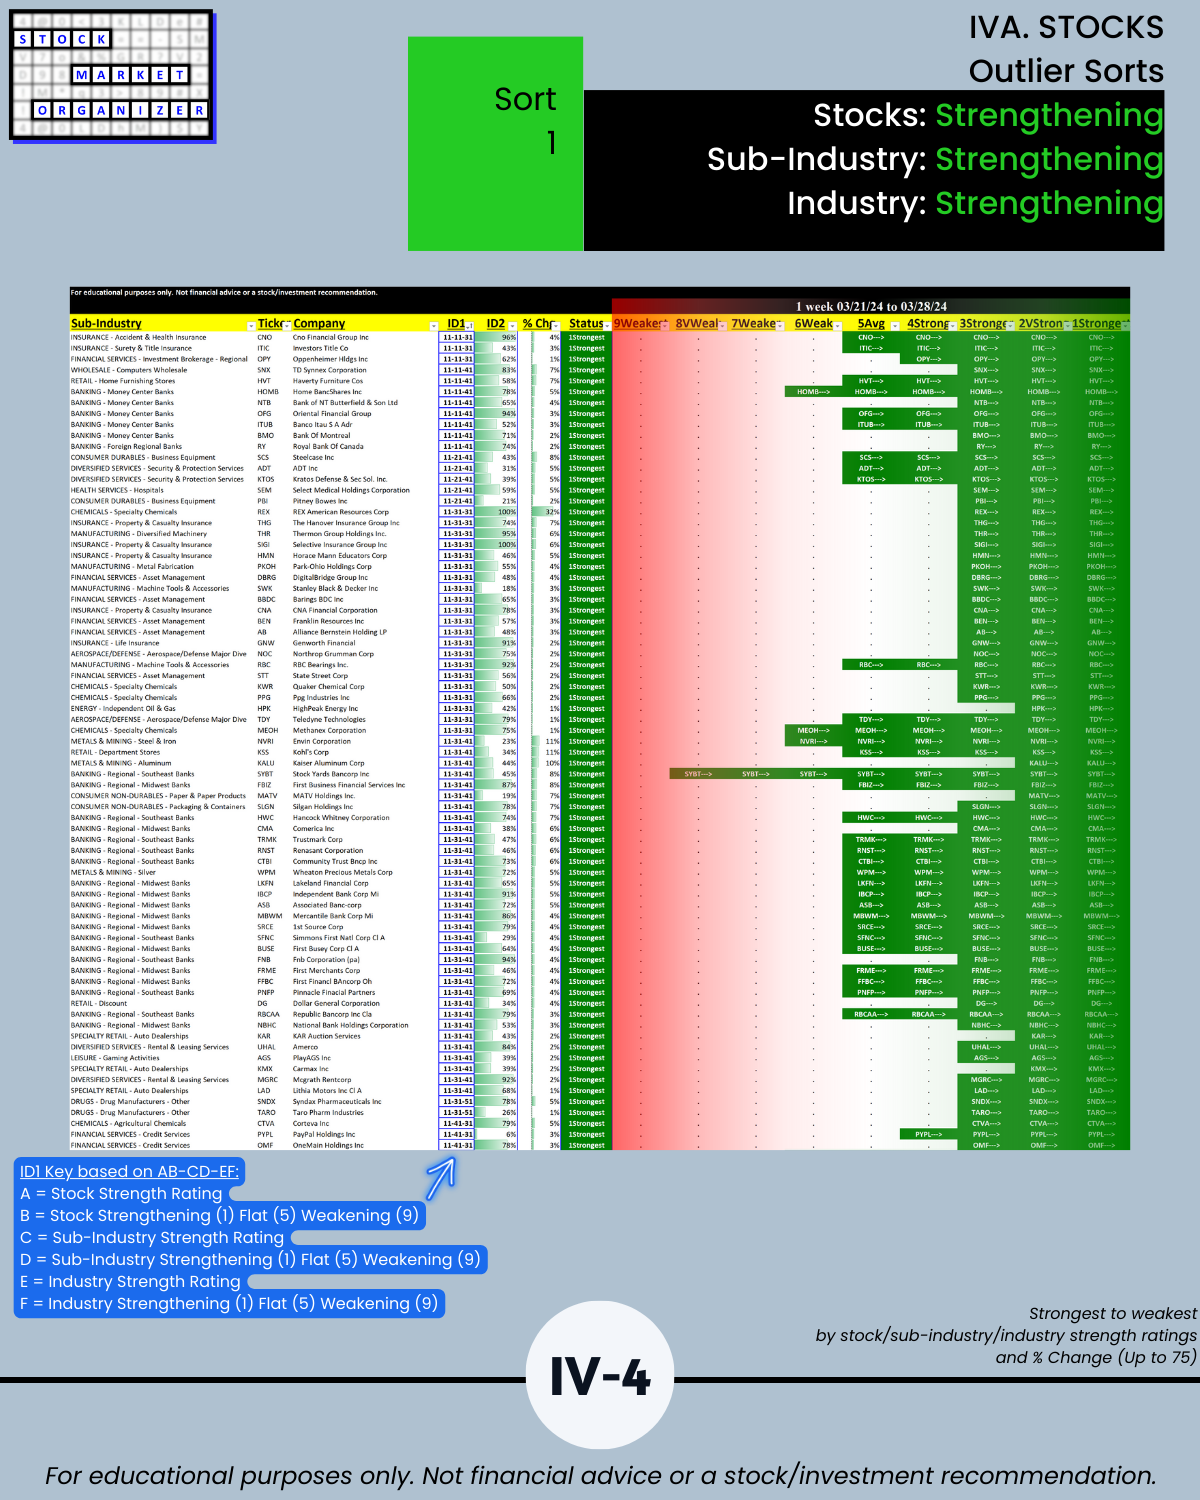
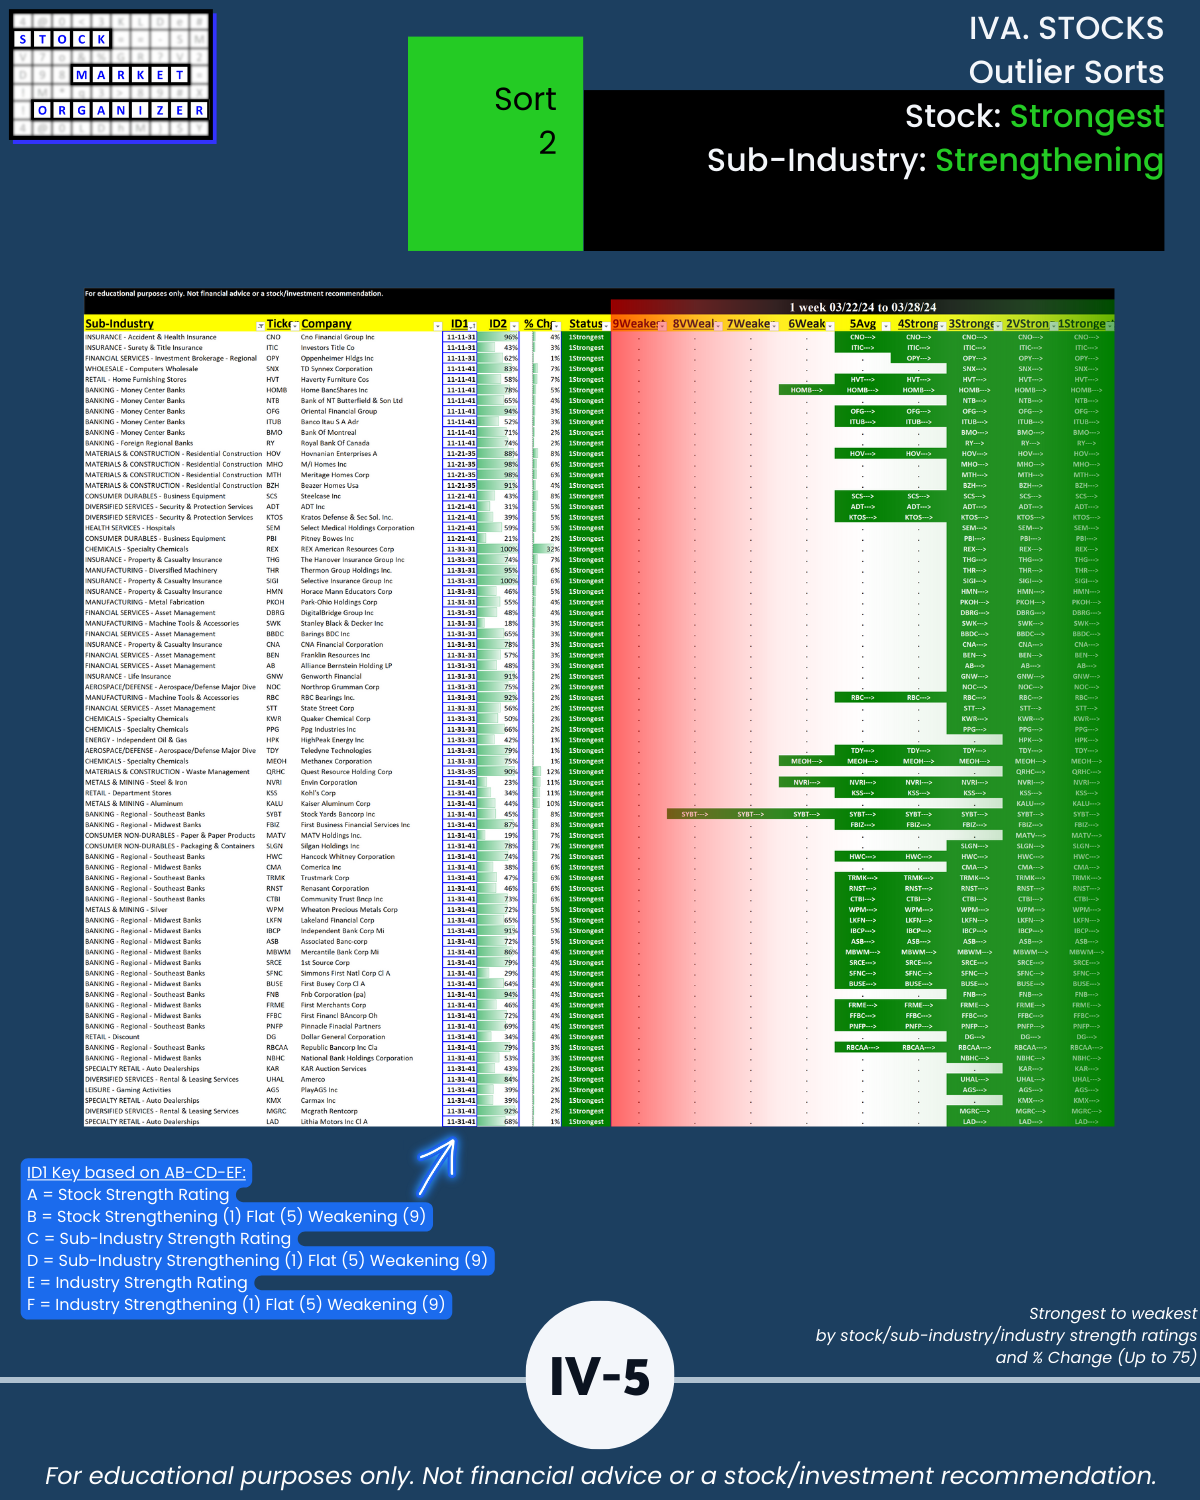
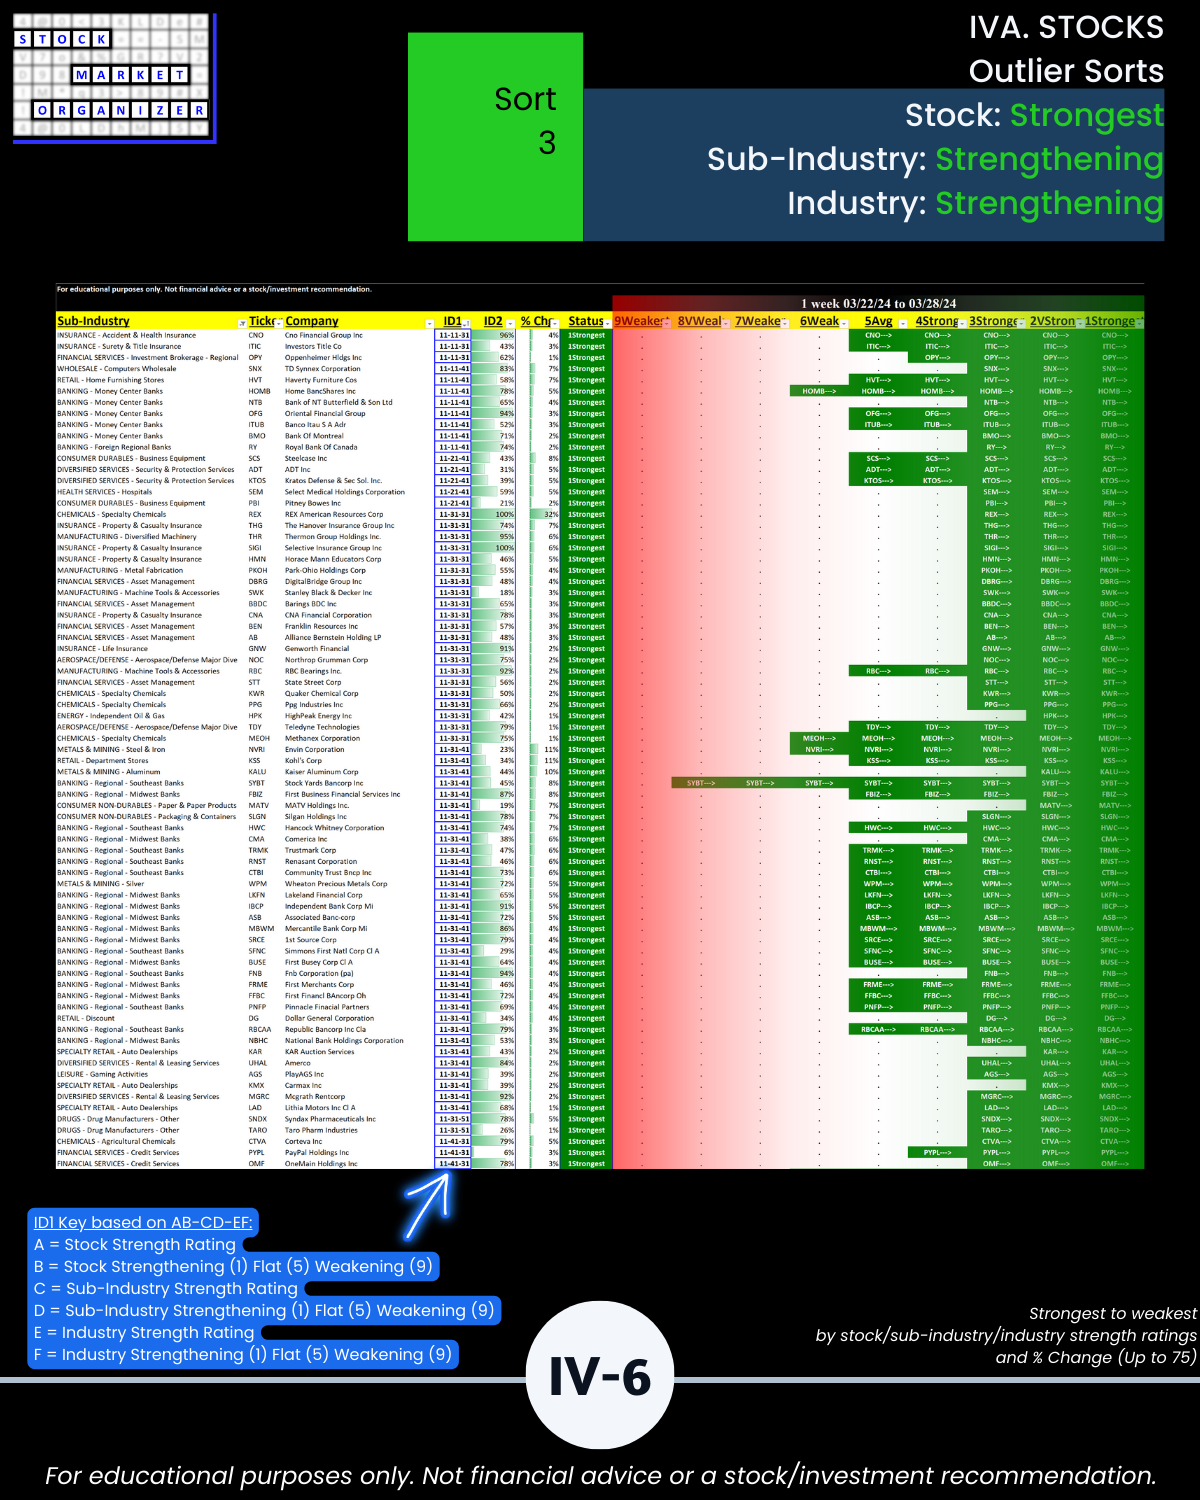
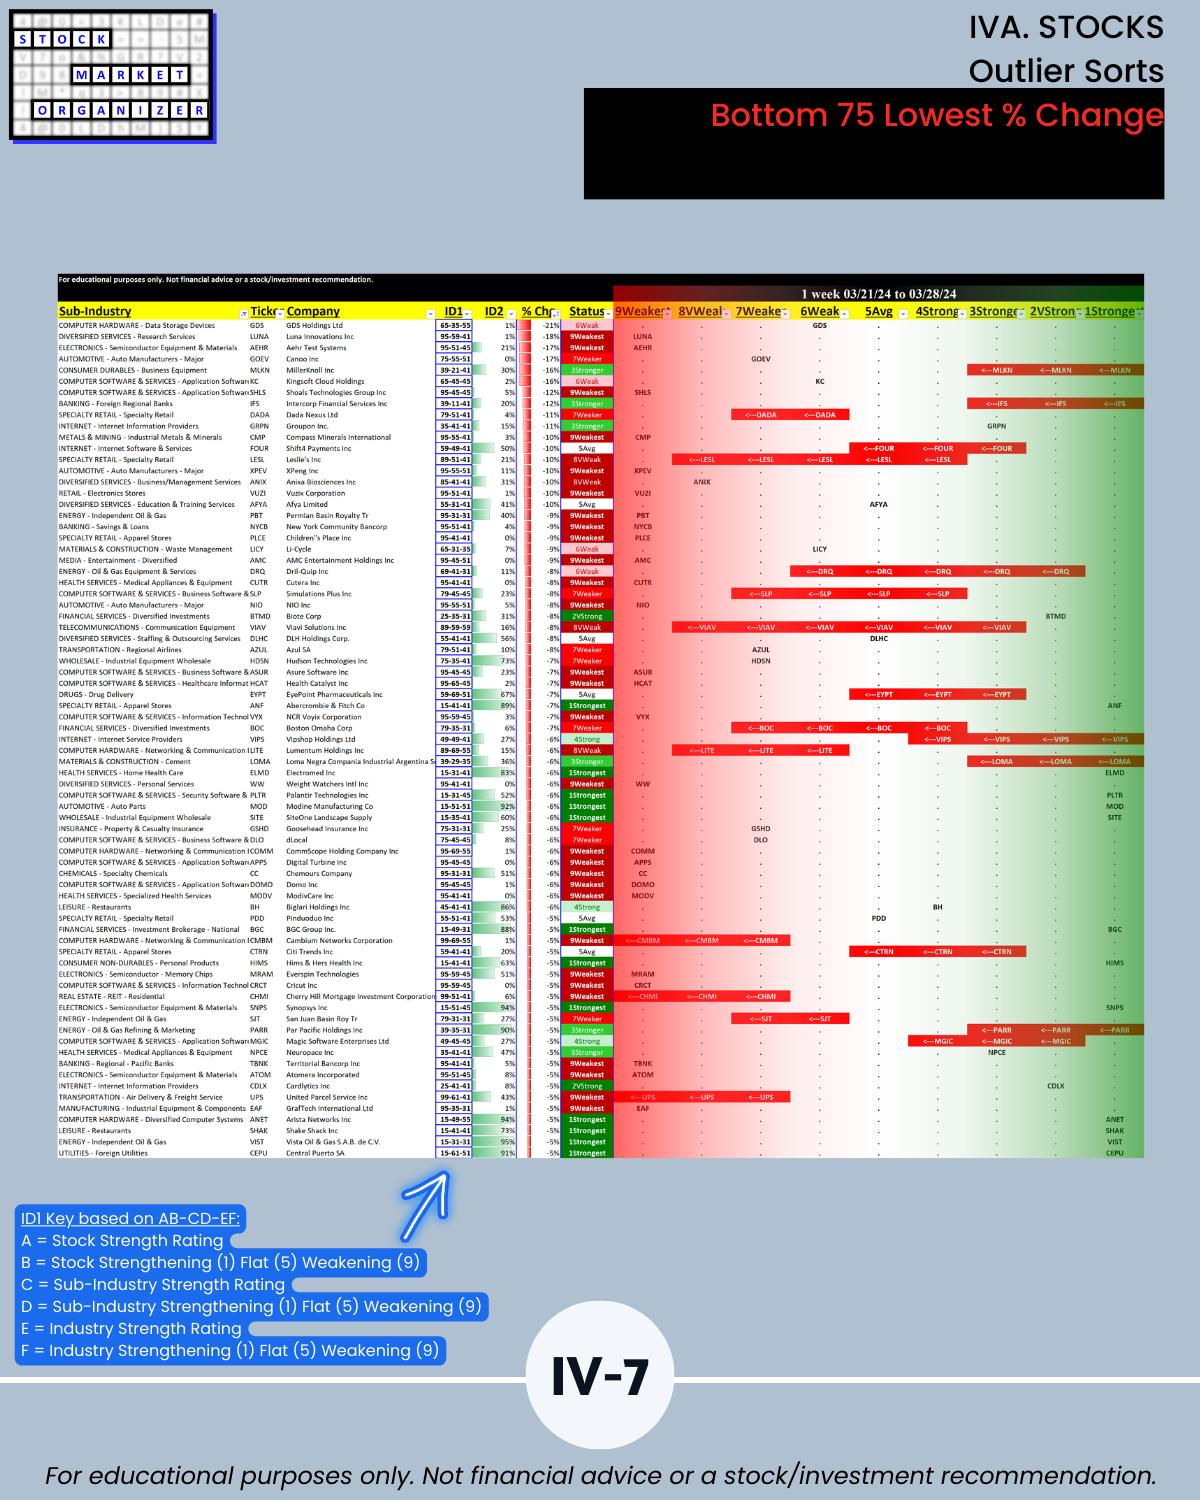
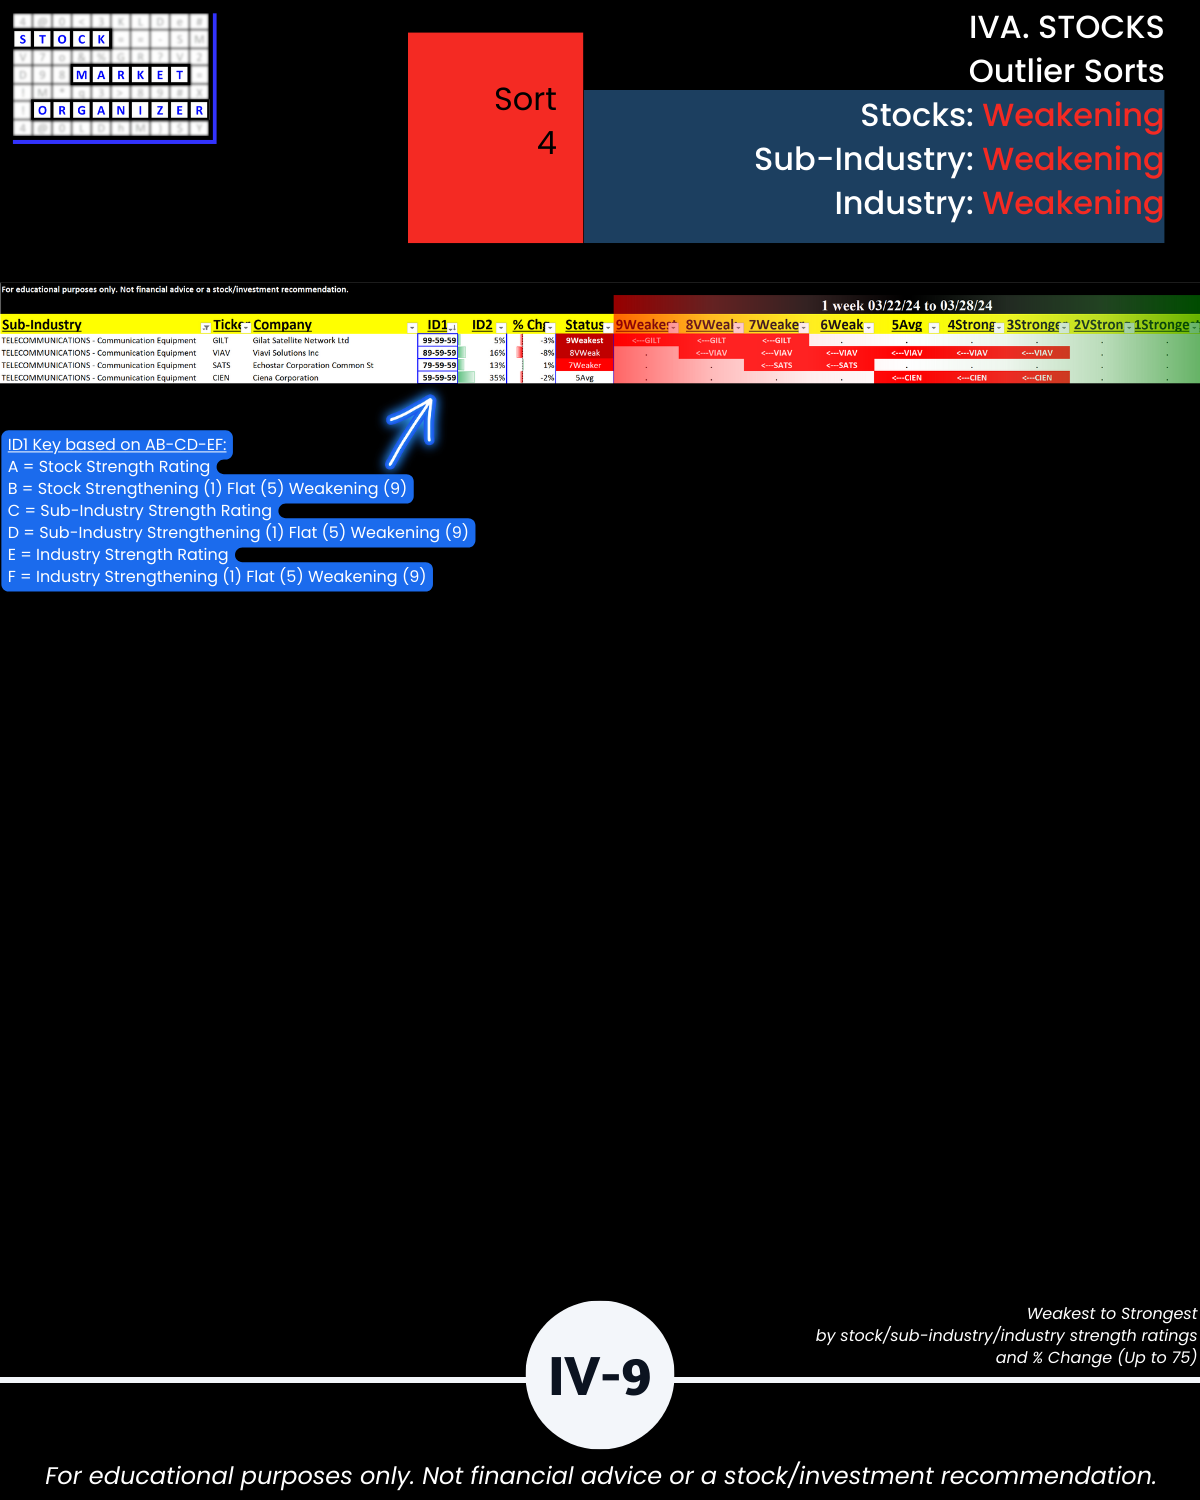
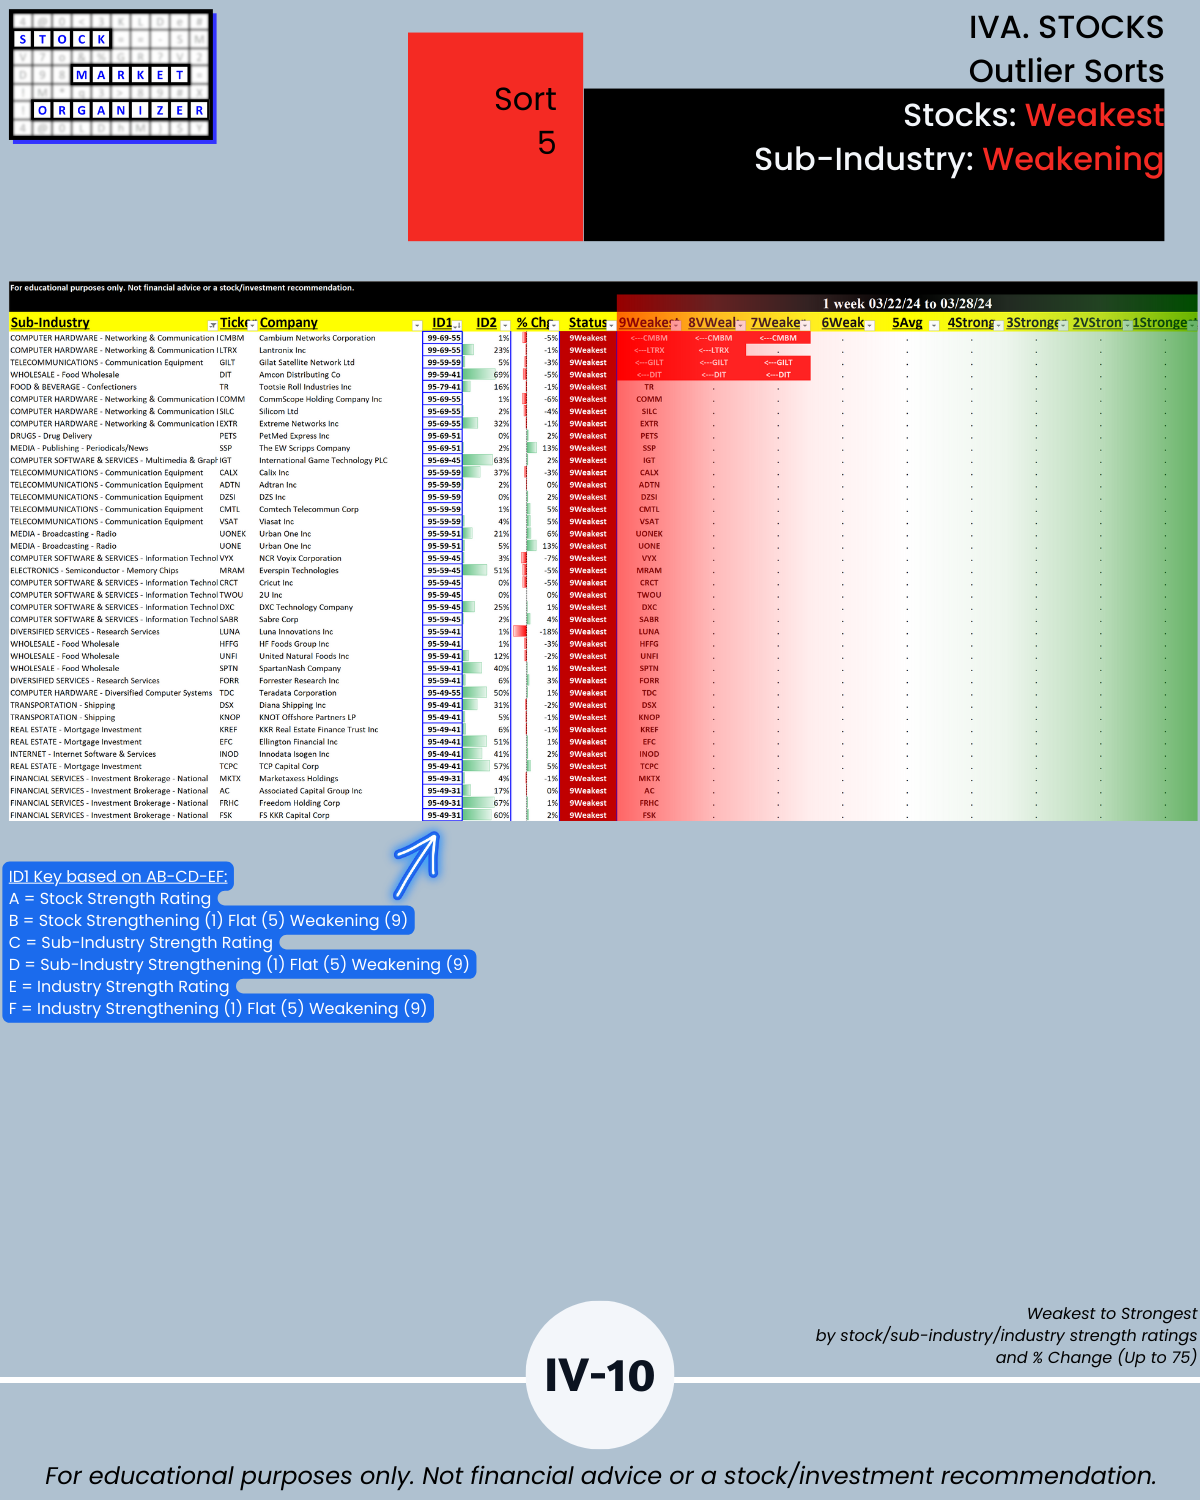
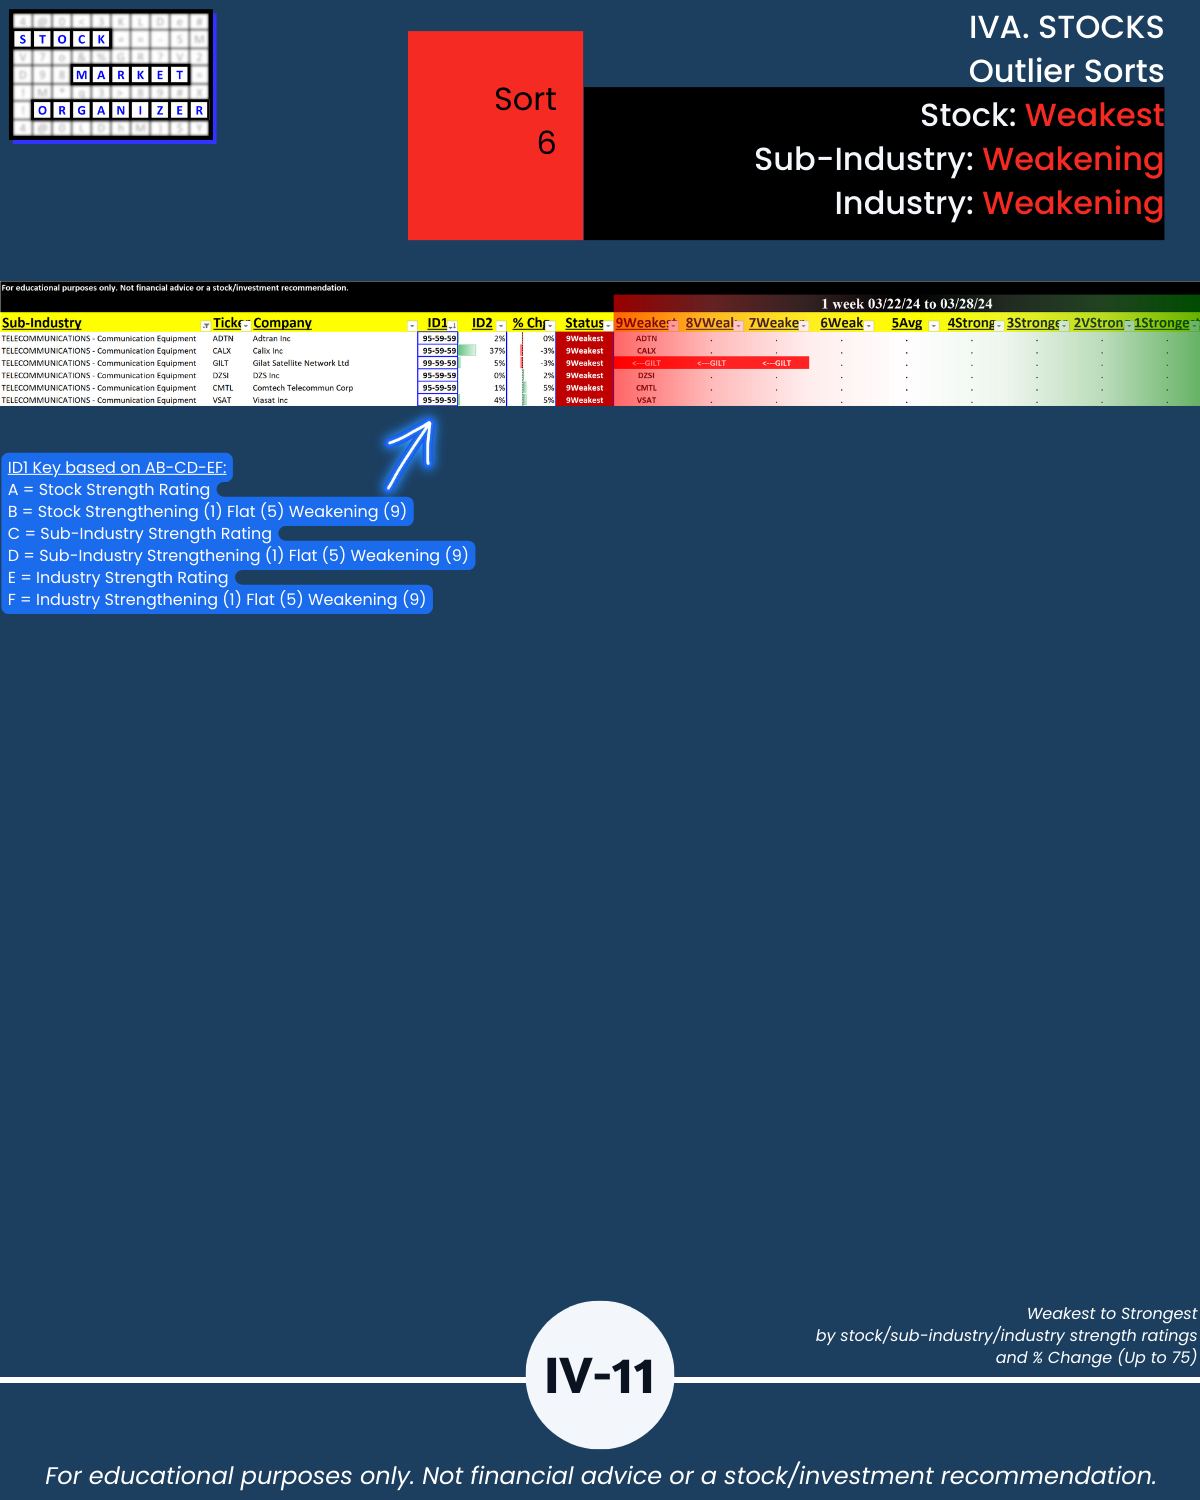
IVA. STOCKS Outlier Sorts
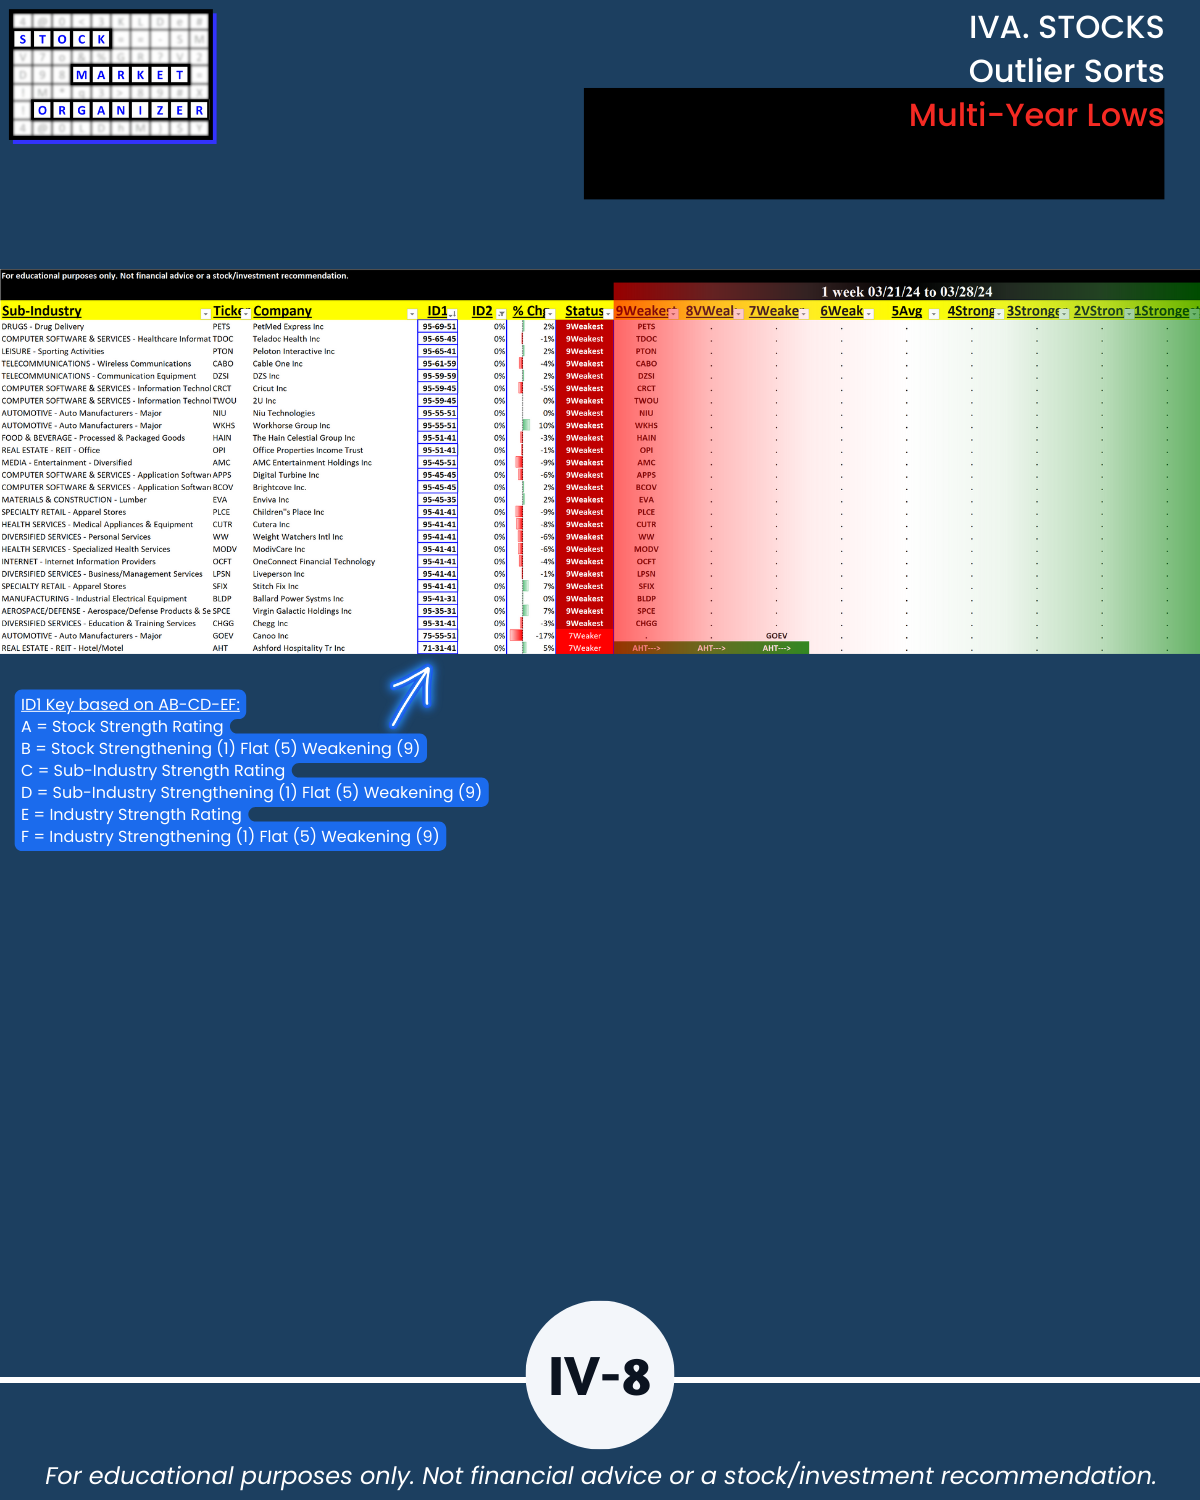
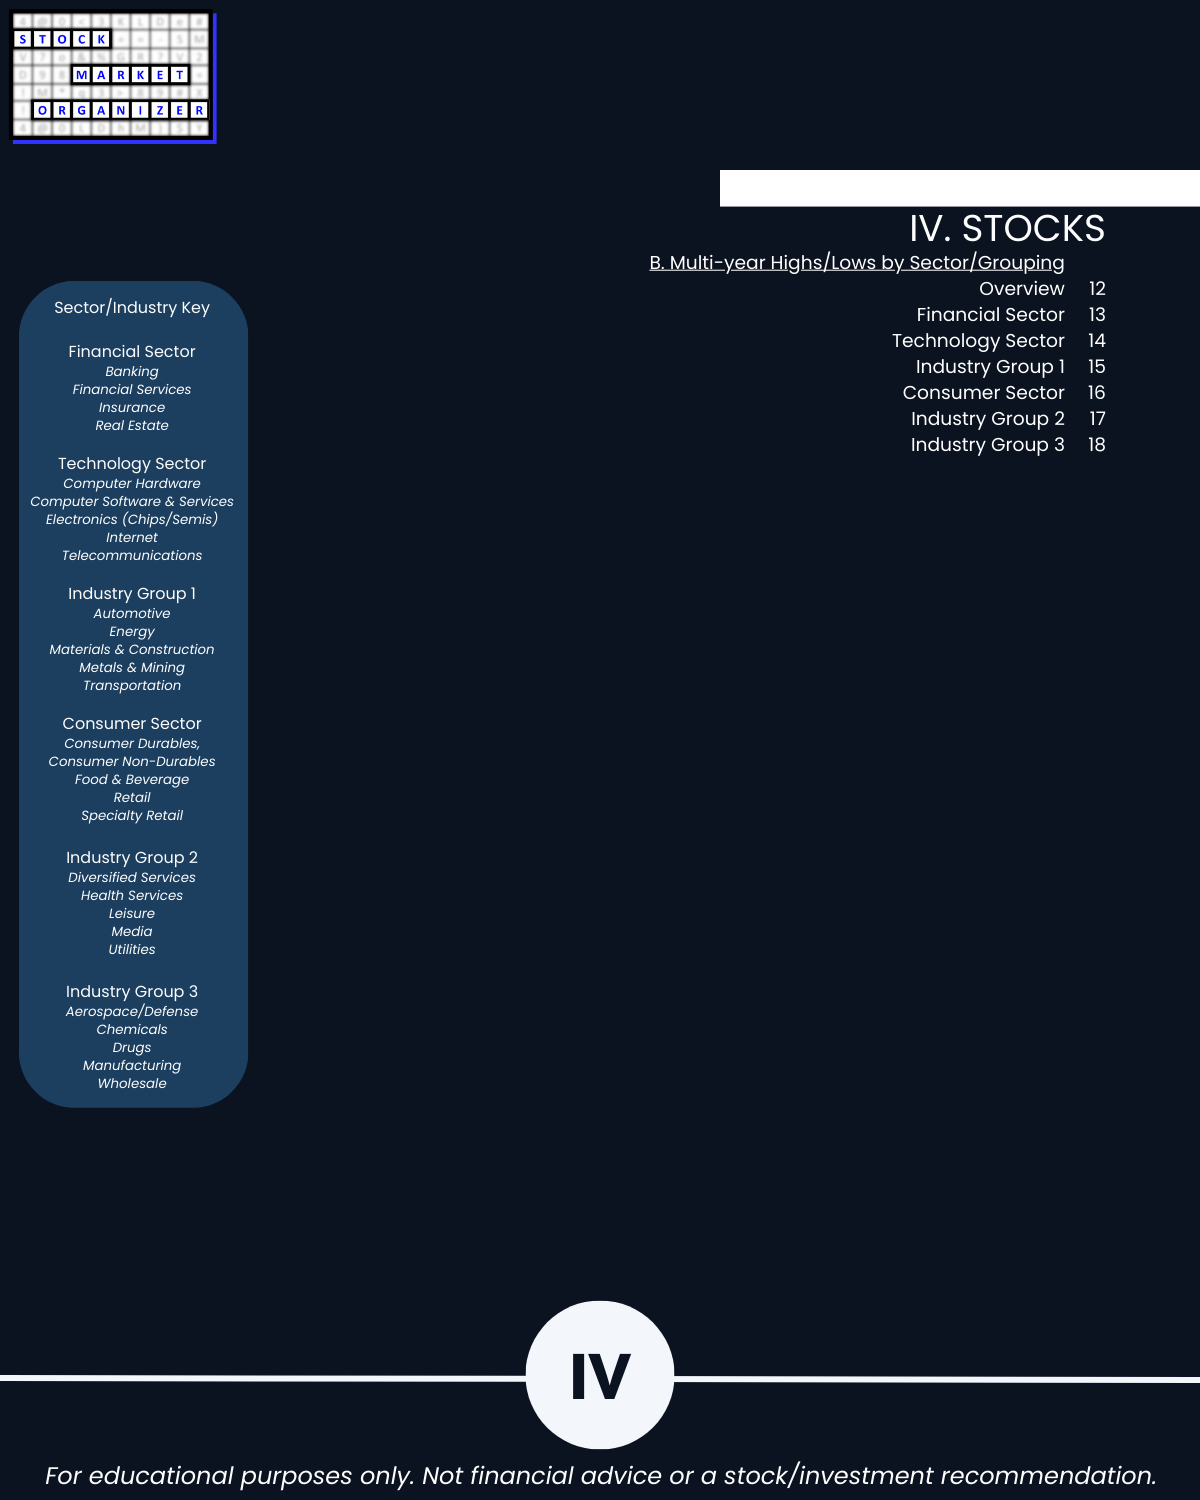
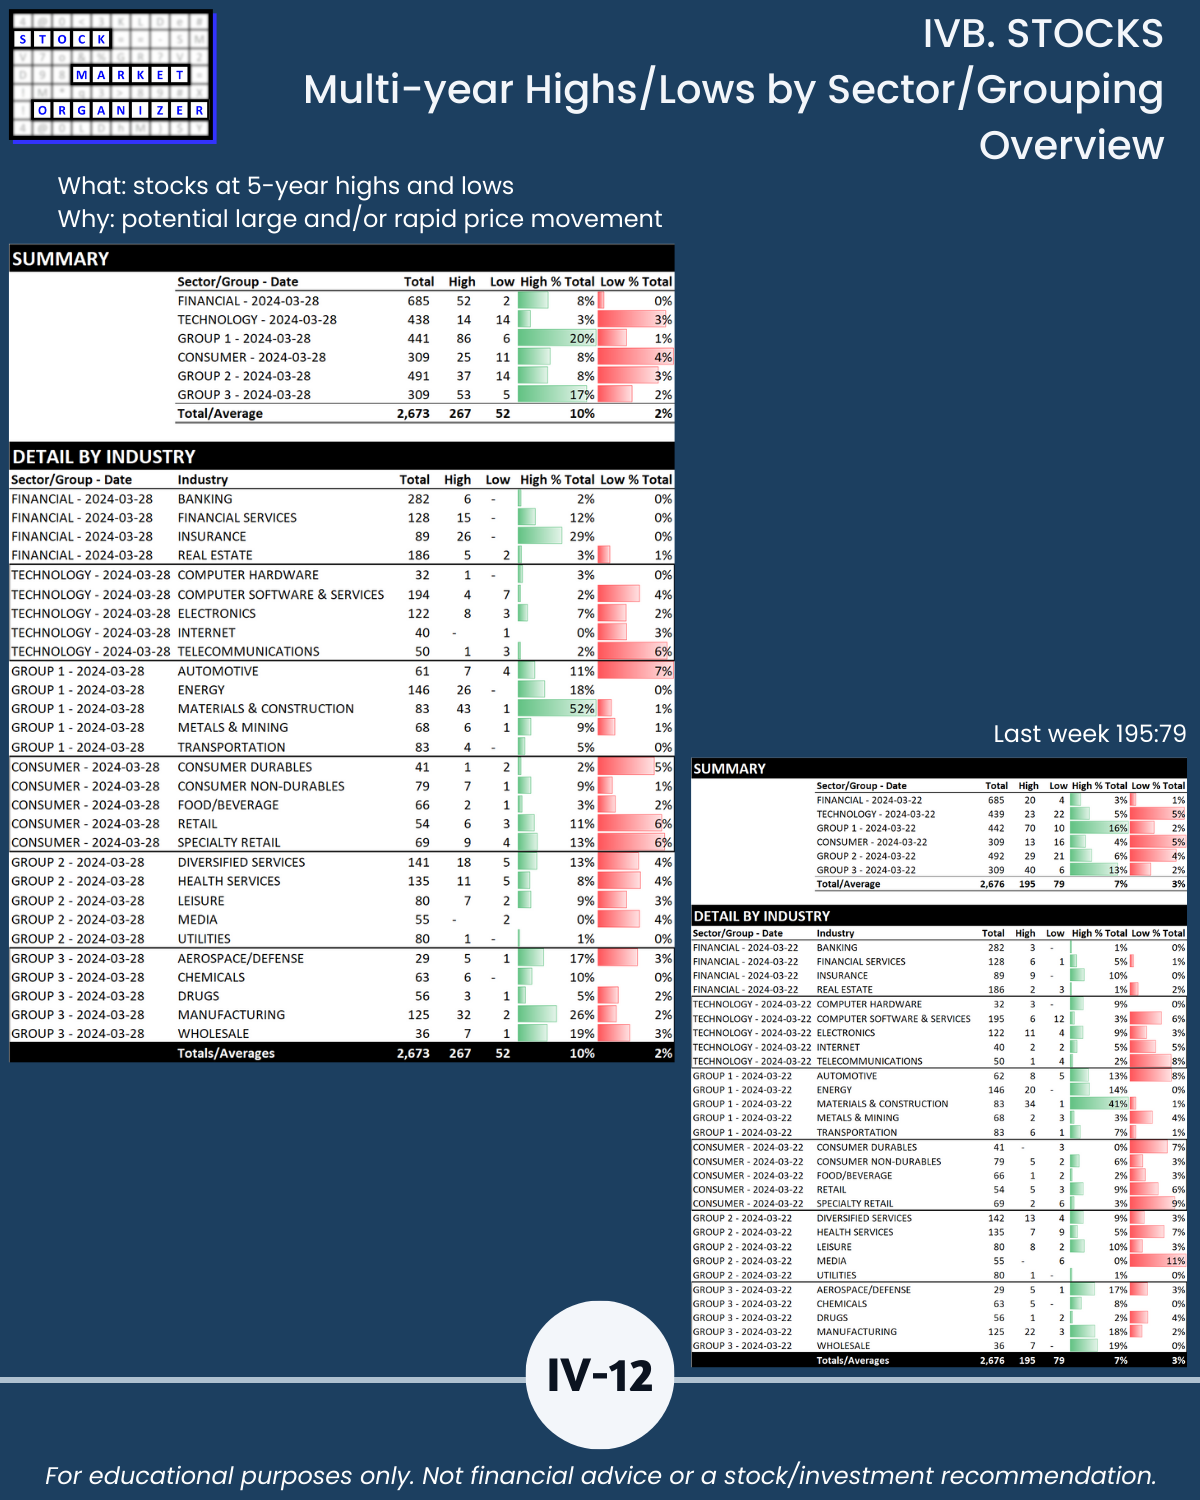
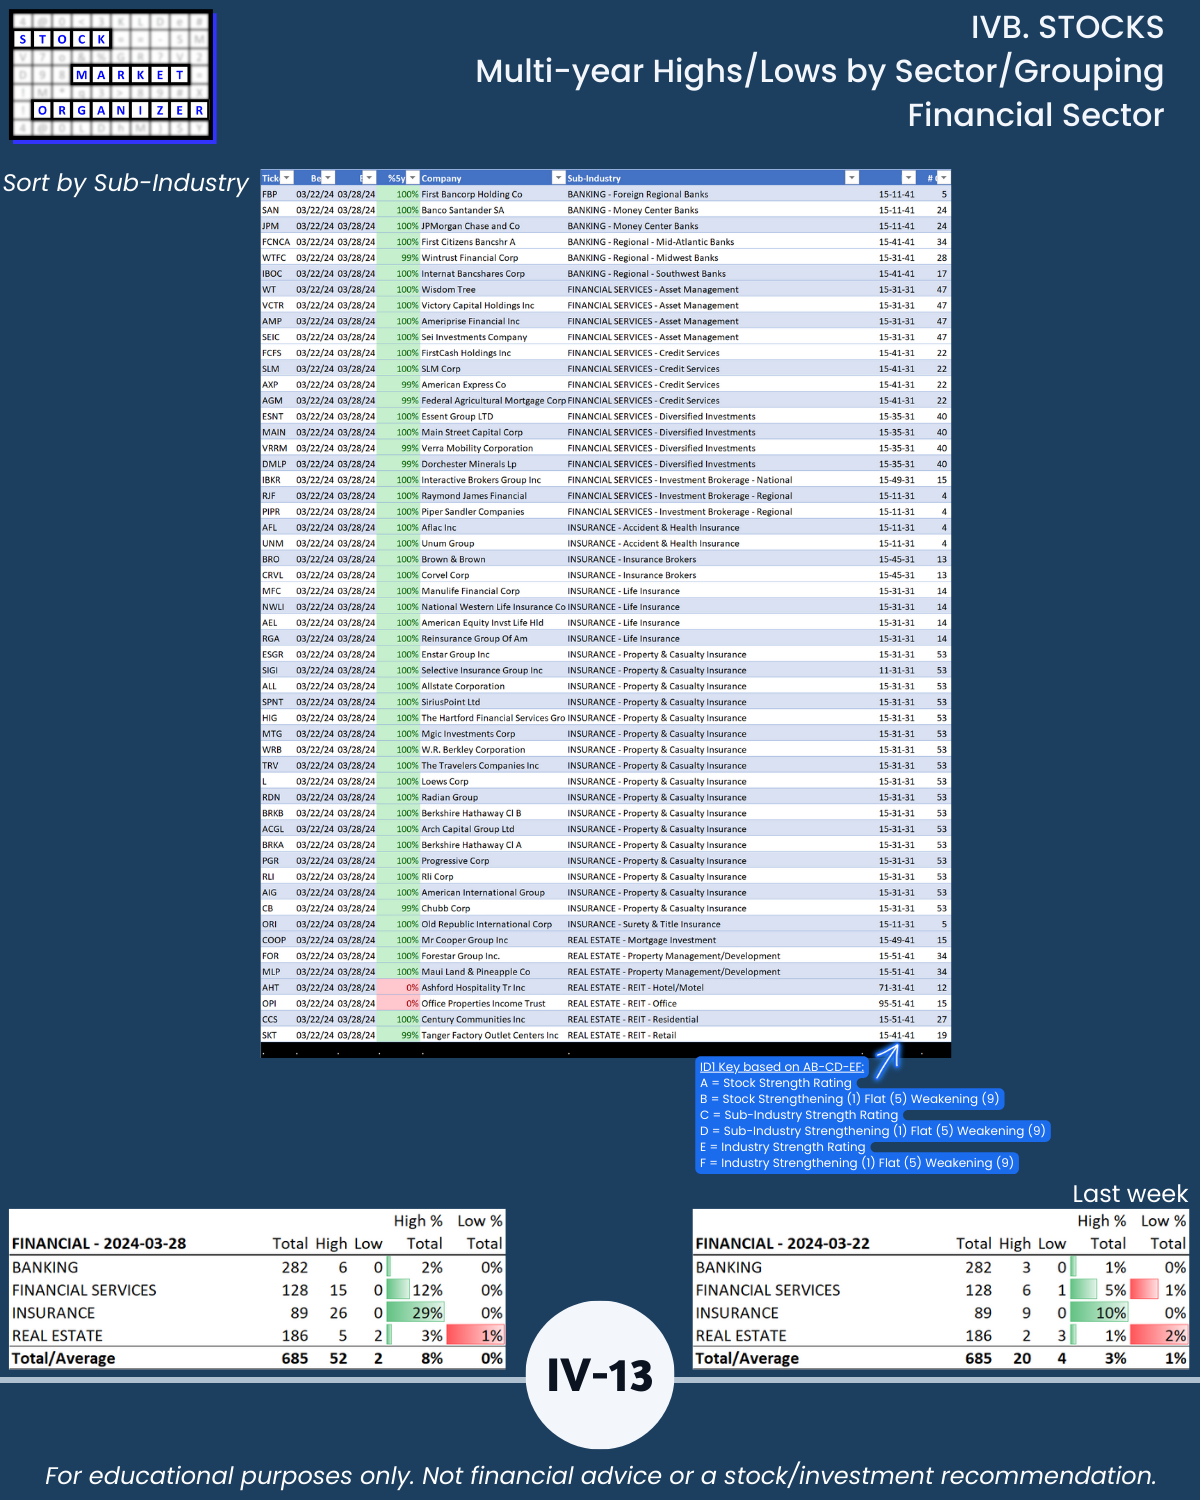
IVB. STOCKS Multi-Year Highs/Lows by Sector/Grouping
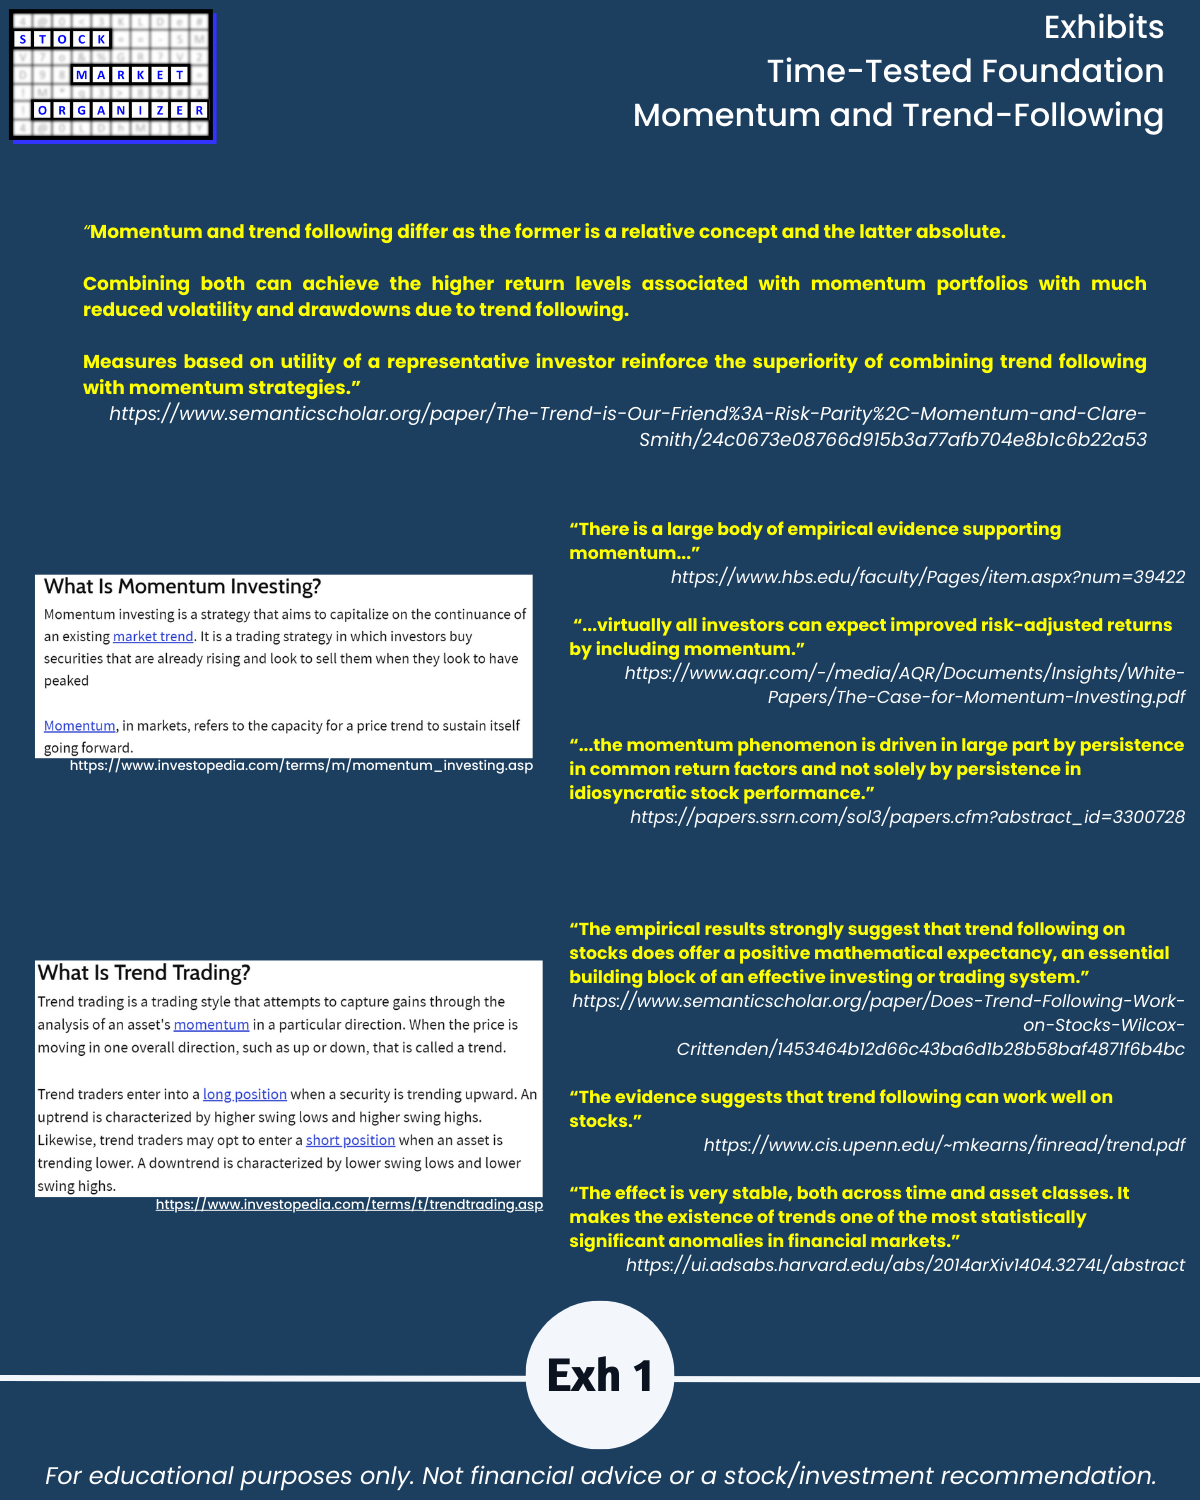
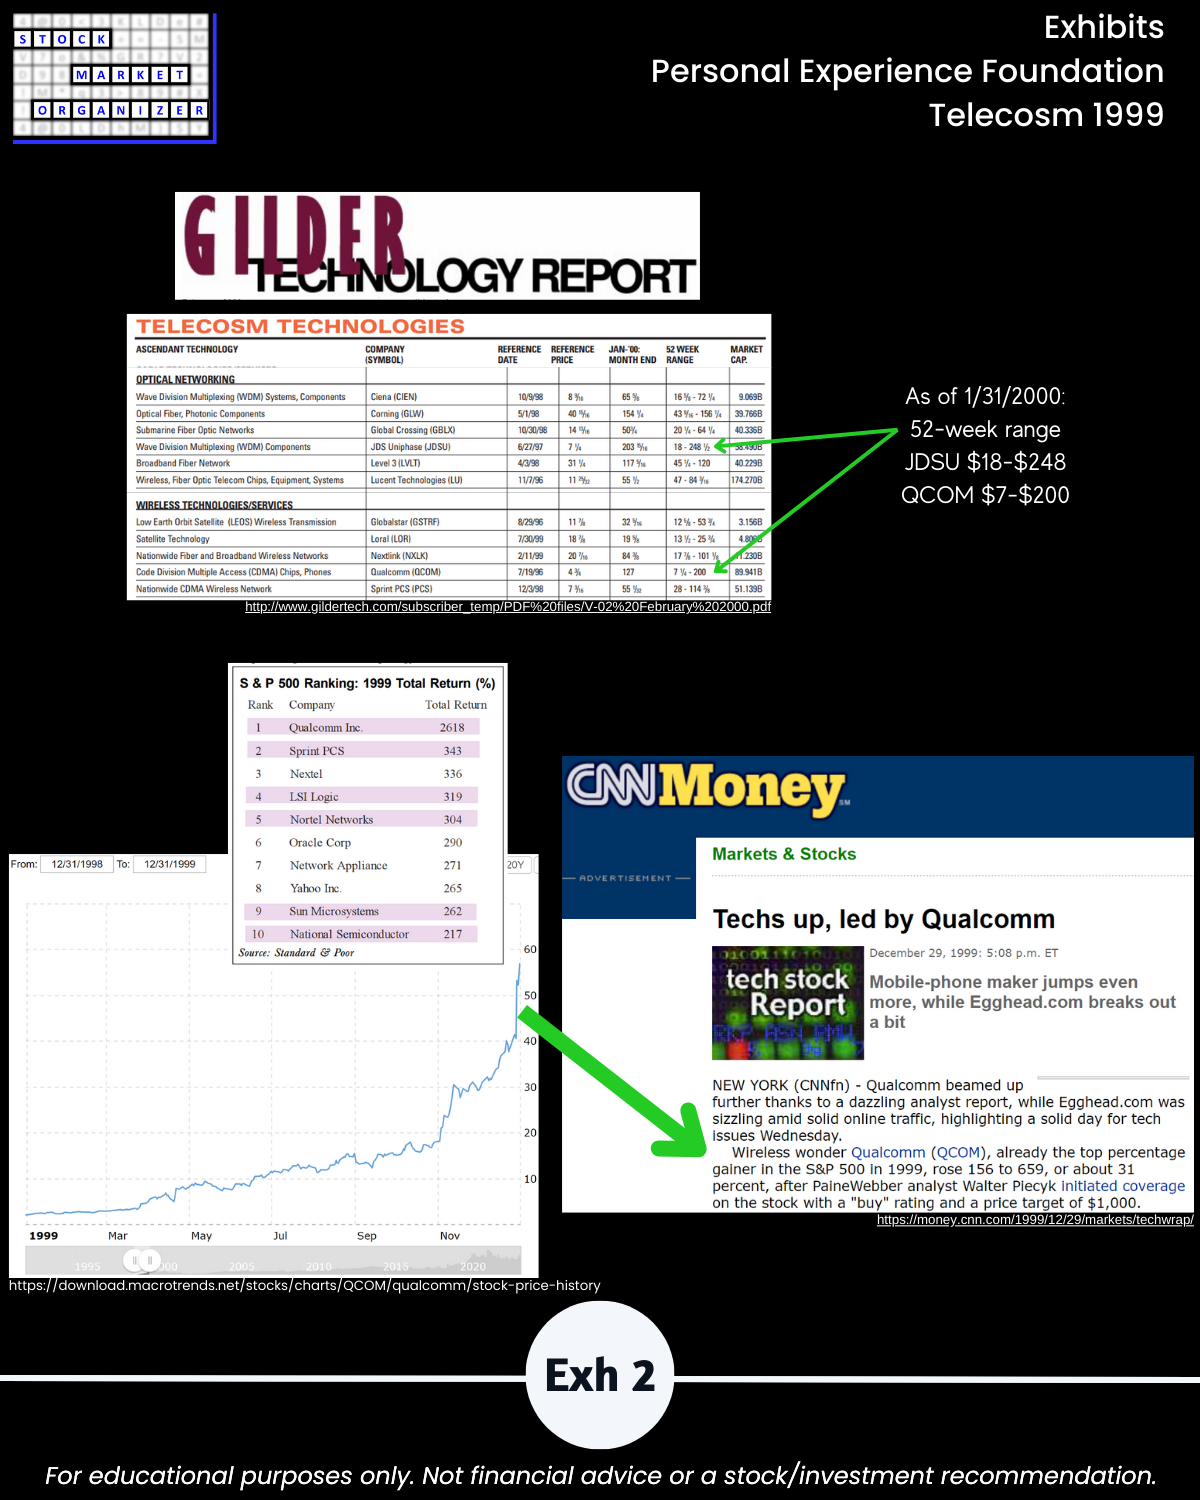
IV. EXHIBITS System Foundations