SMO Exclusive: U.S. Stock Market Strength Report 2024-03-15 (no new Longs)

The attached 3/15/24 report can give you a complete and actionable handle on the current U.S. stock market. What’s this? A quick and unique answer to the question “what is happening in the market NOW?” I built this view from the ground up so 🔹 you’ll see material not seen elsewhere and 🔹 this can complement your perspective, regardless of what it is.
KEY CONCEPTS
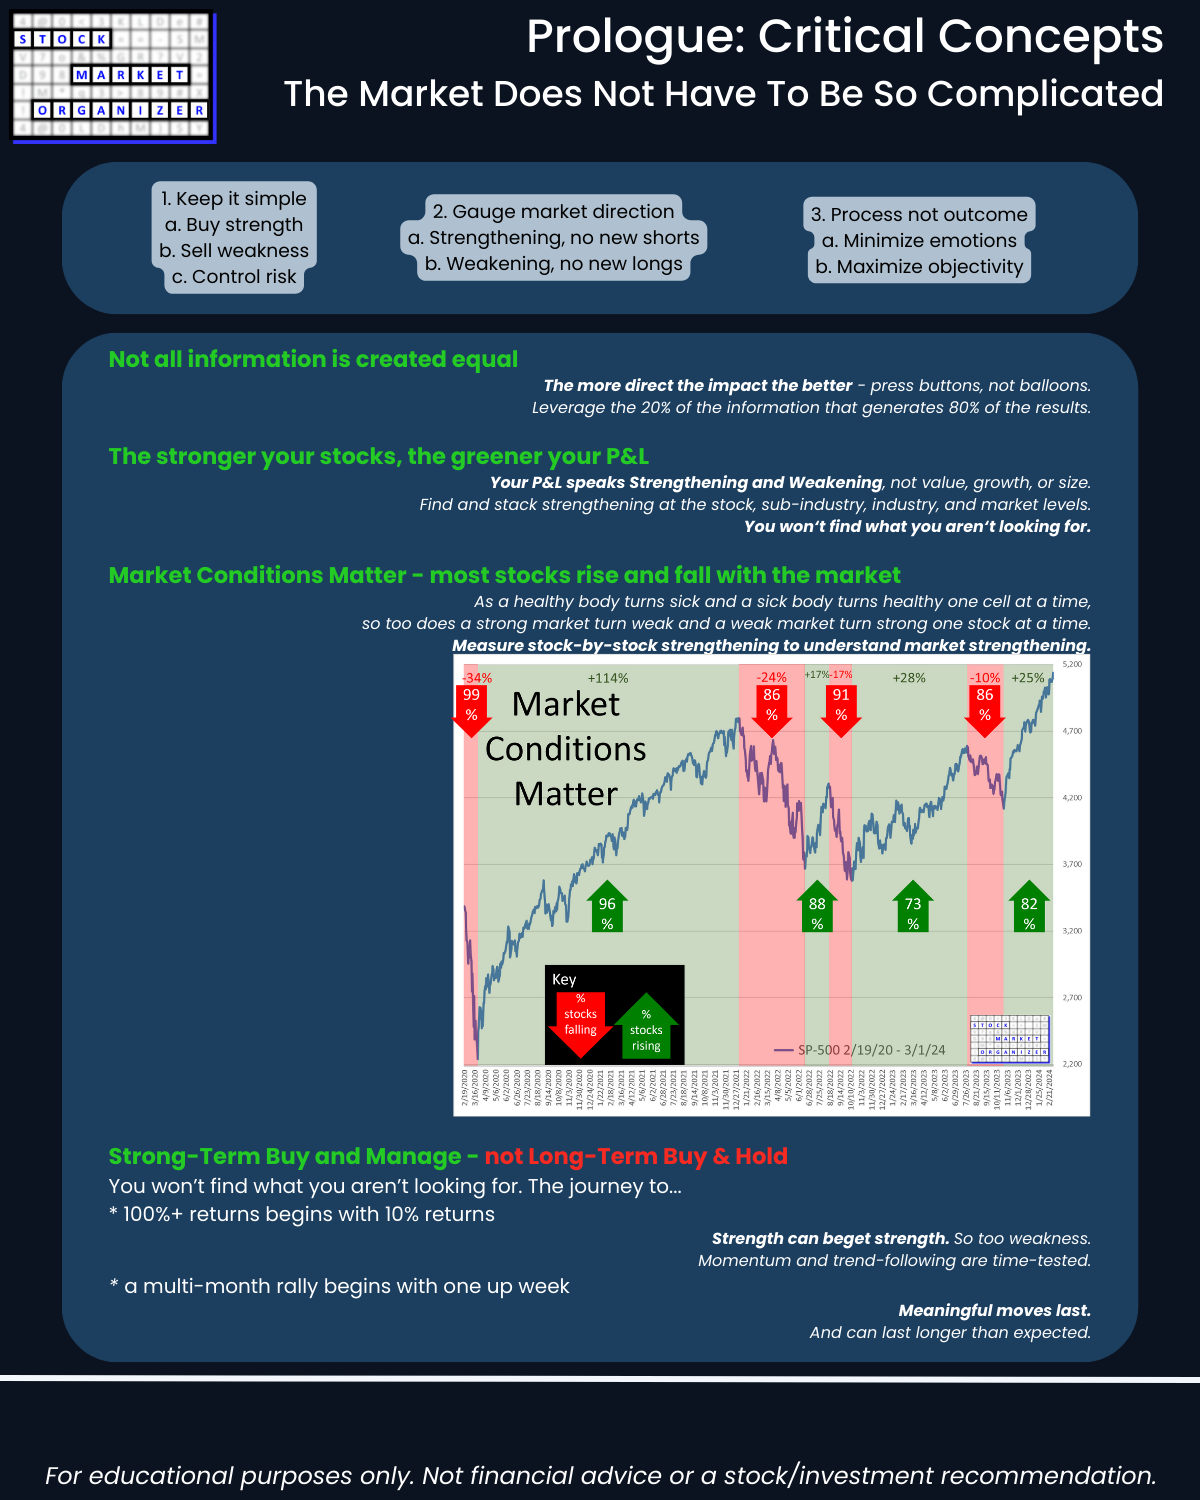
🔹 The market does not have to be so complicated
🔹 Prices uncoupled from fundamentals = opportunity
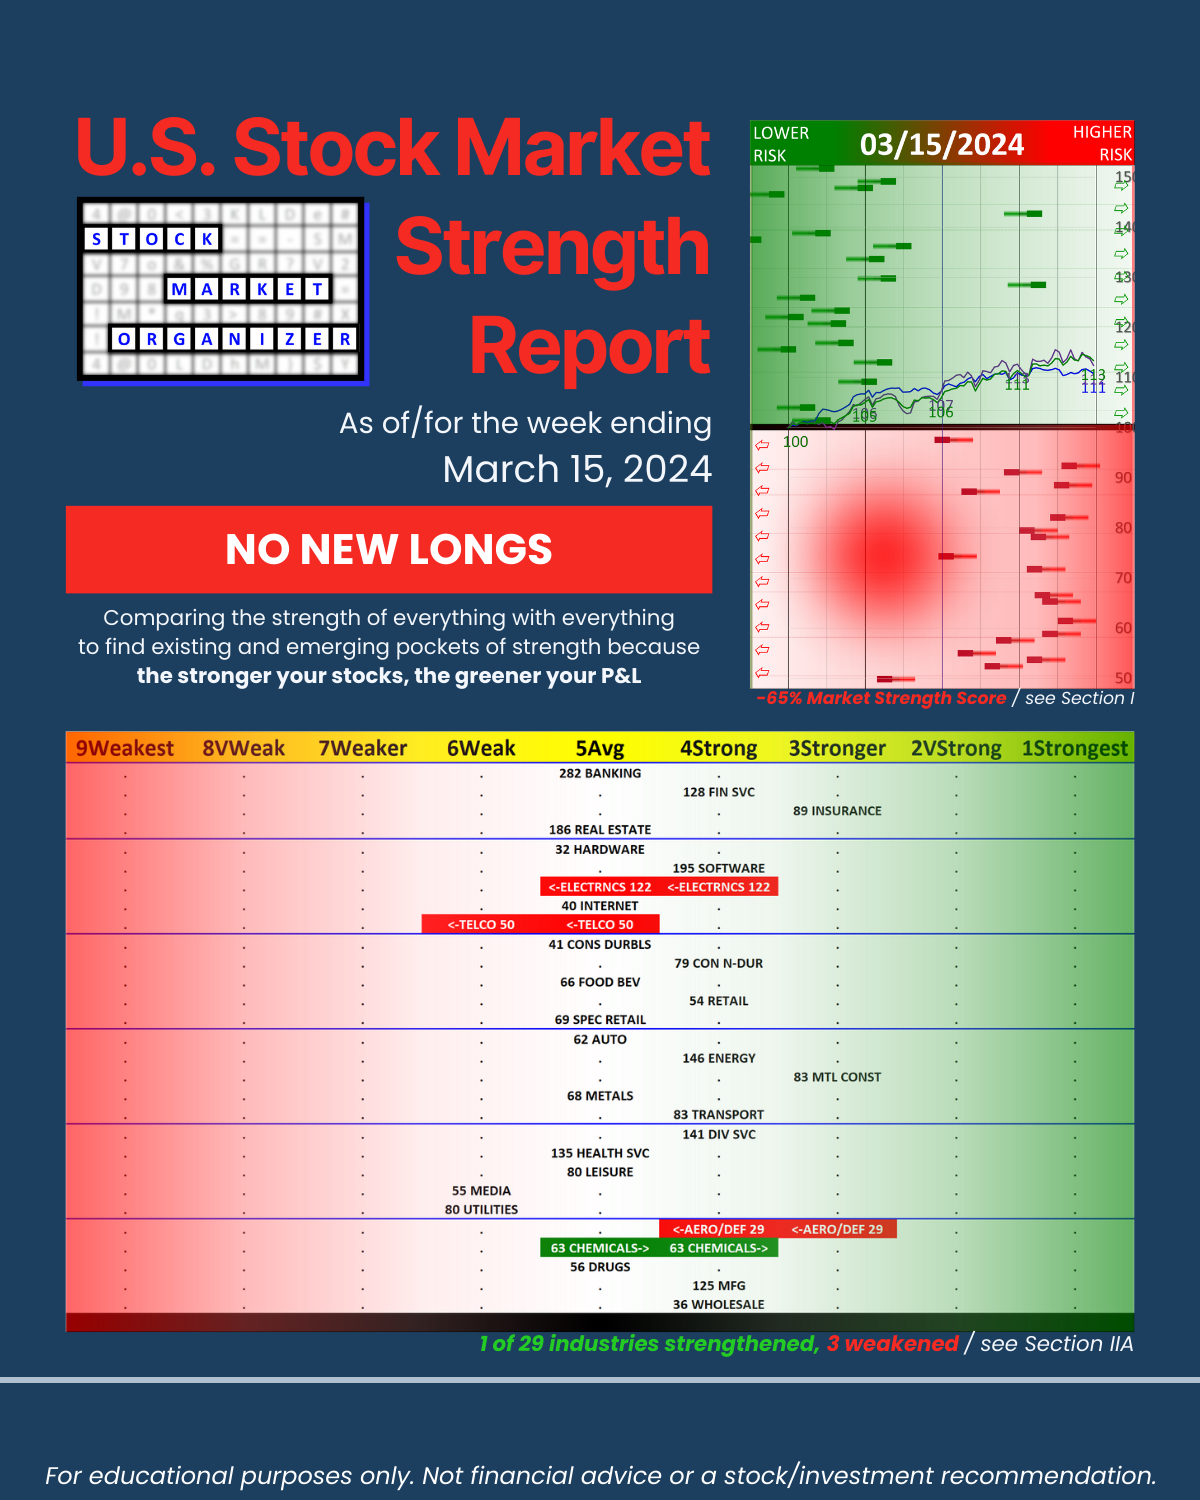
🔹 The stronger your stocks the greener your P&L
🔹 Market conditions matter
🔹 Multi-month+ rallies begin with one up week
🔹 100%+ returns start as 10% returns
🔹 You won’t find what you aren’t looking for
MODEL
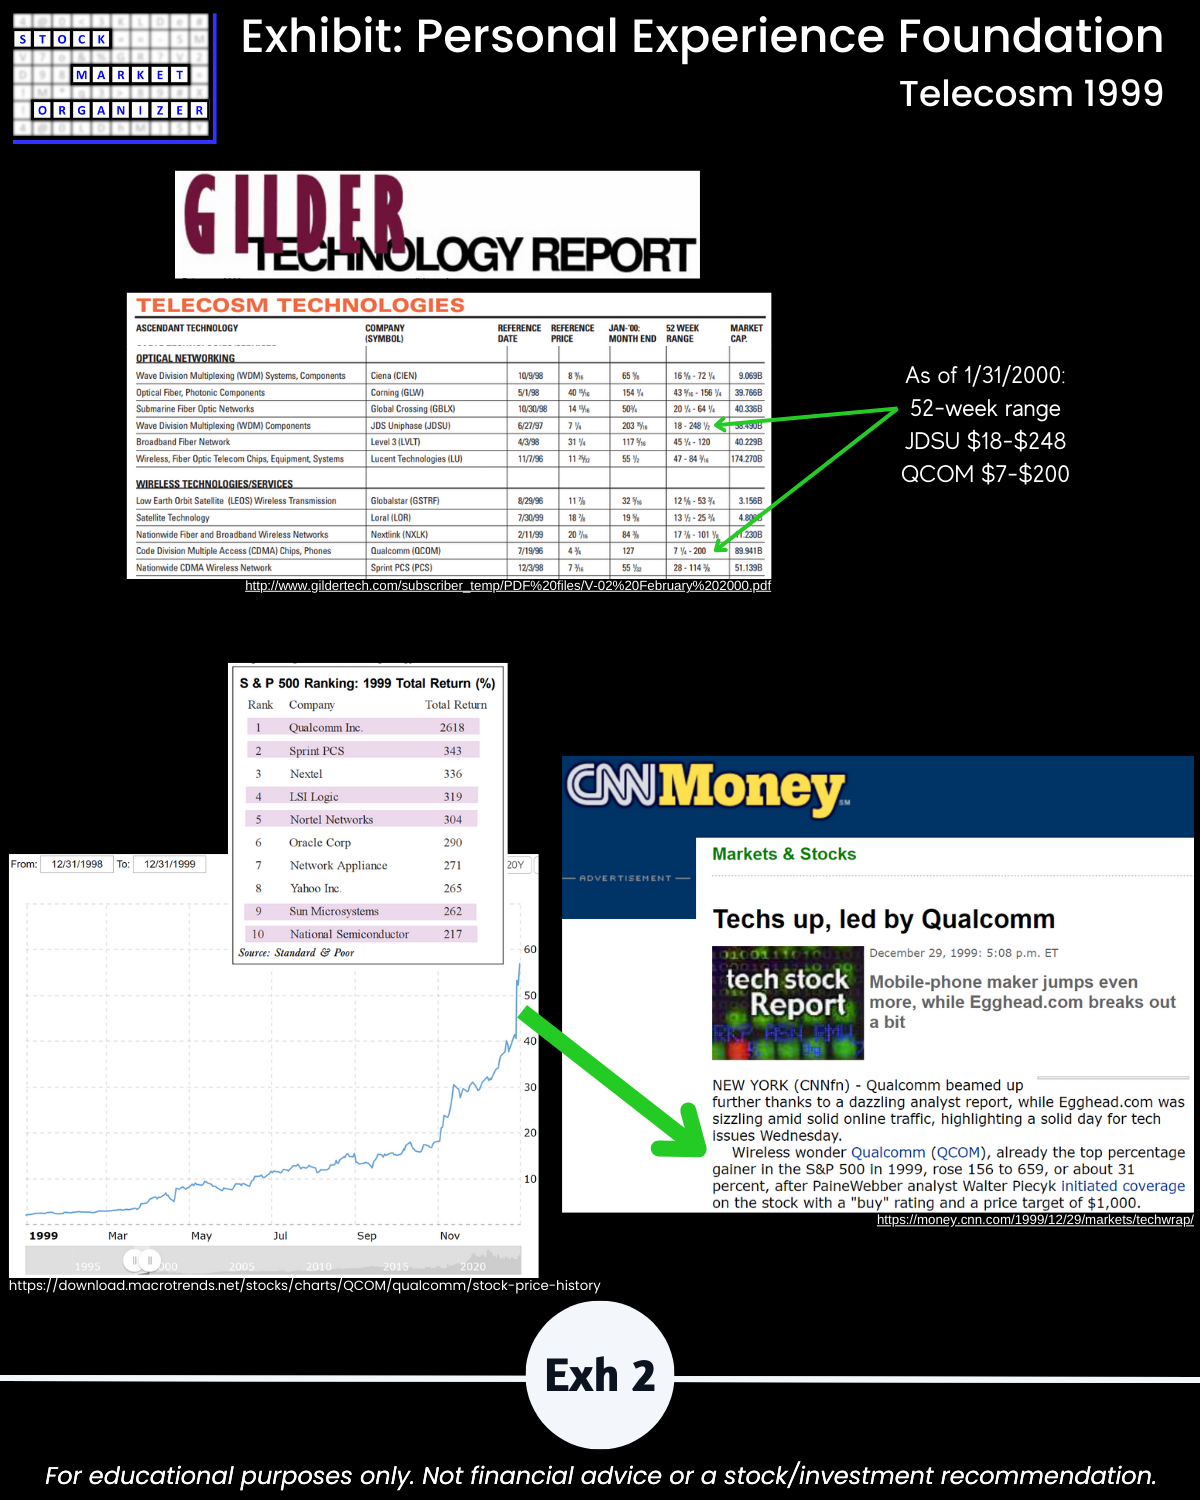
NVDA now: a rising outlier stock in a rising industry grouping (AI) in a rising market.
CSCO 1999: a rising outlier stock in a rising industry grouping (internet buildout) in a rising market.
(See Exhibit 2)
GOAL
To stack strength in the direction of outlier stocks.
TO ADDRESS THE ABOVE, THIS REPORT:
🔹 Uncovers for you strength wherever it is trying to hide in the market
🔹 Covers all levels of the U.S. stock market:
- 6 sectors/logical industry groupings covering
- 29 industries comprised of
- 198 sub-industries and
- 2,677 stocks.
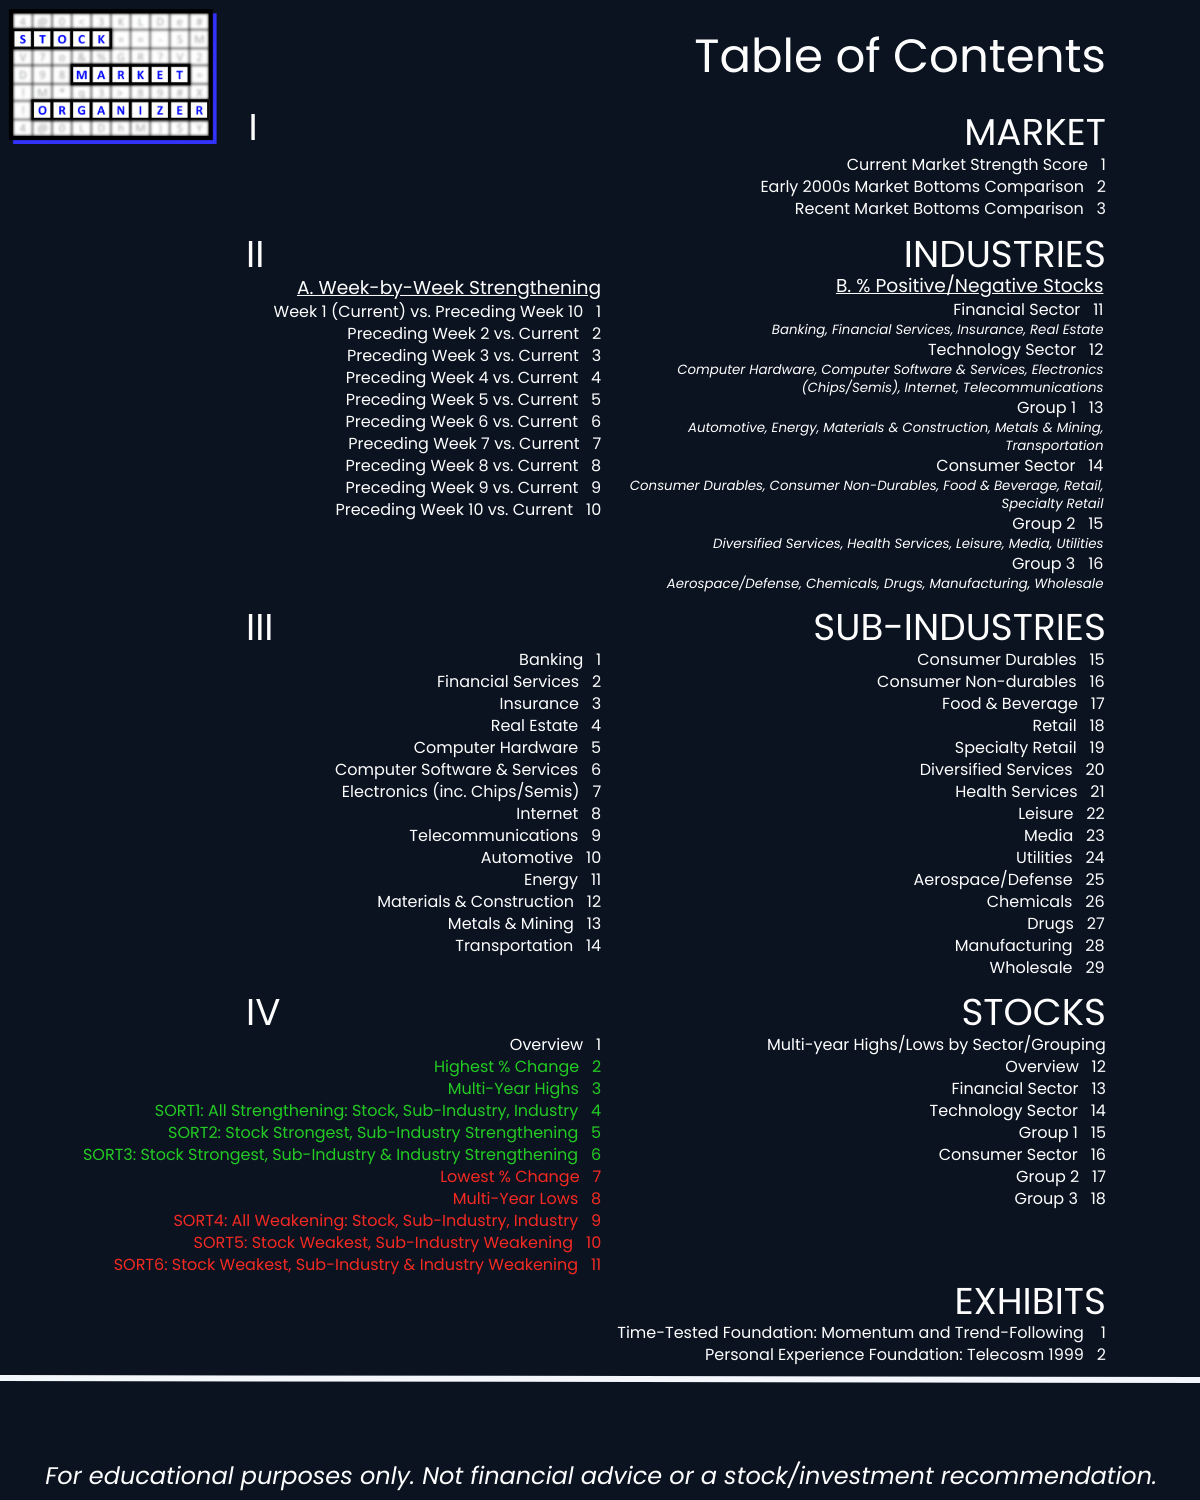
CONTENTS
A logically arranged top-down analysis with streamlined detail summarized per below.
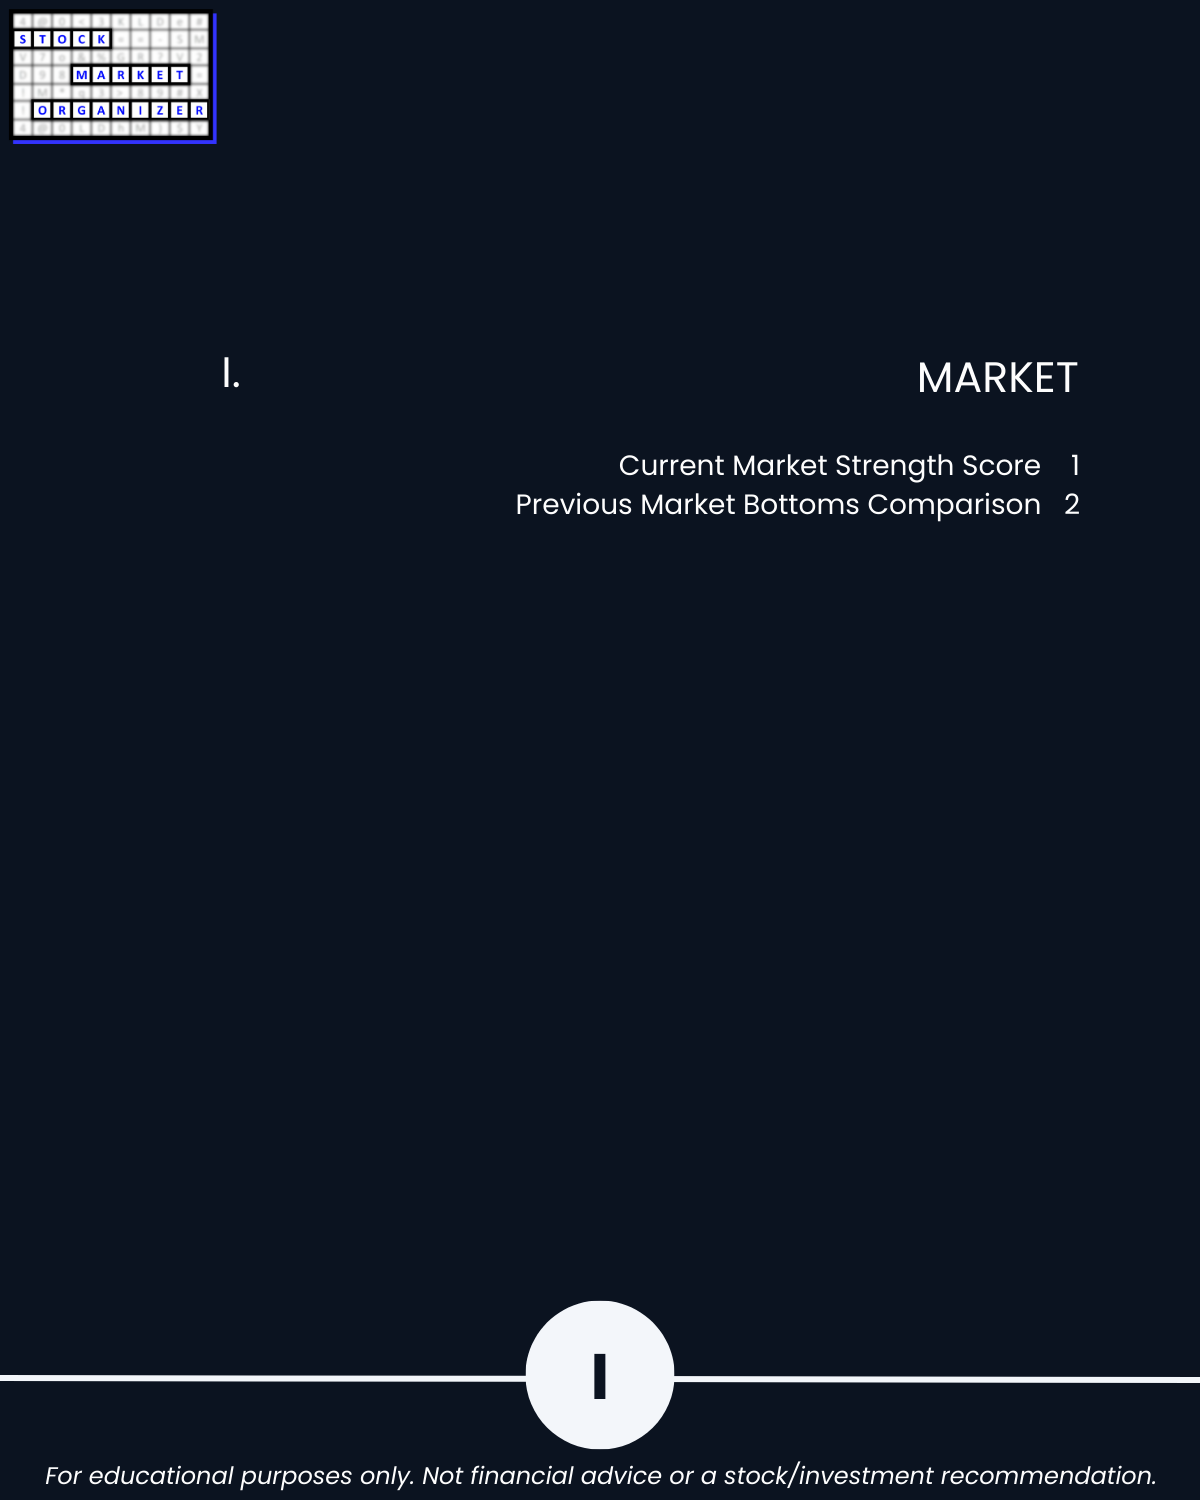
SECTION I Market level:
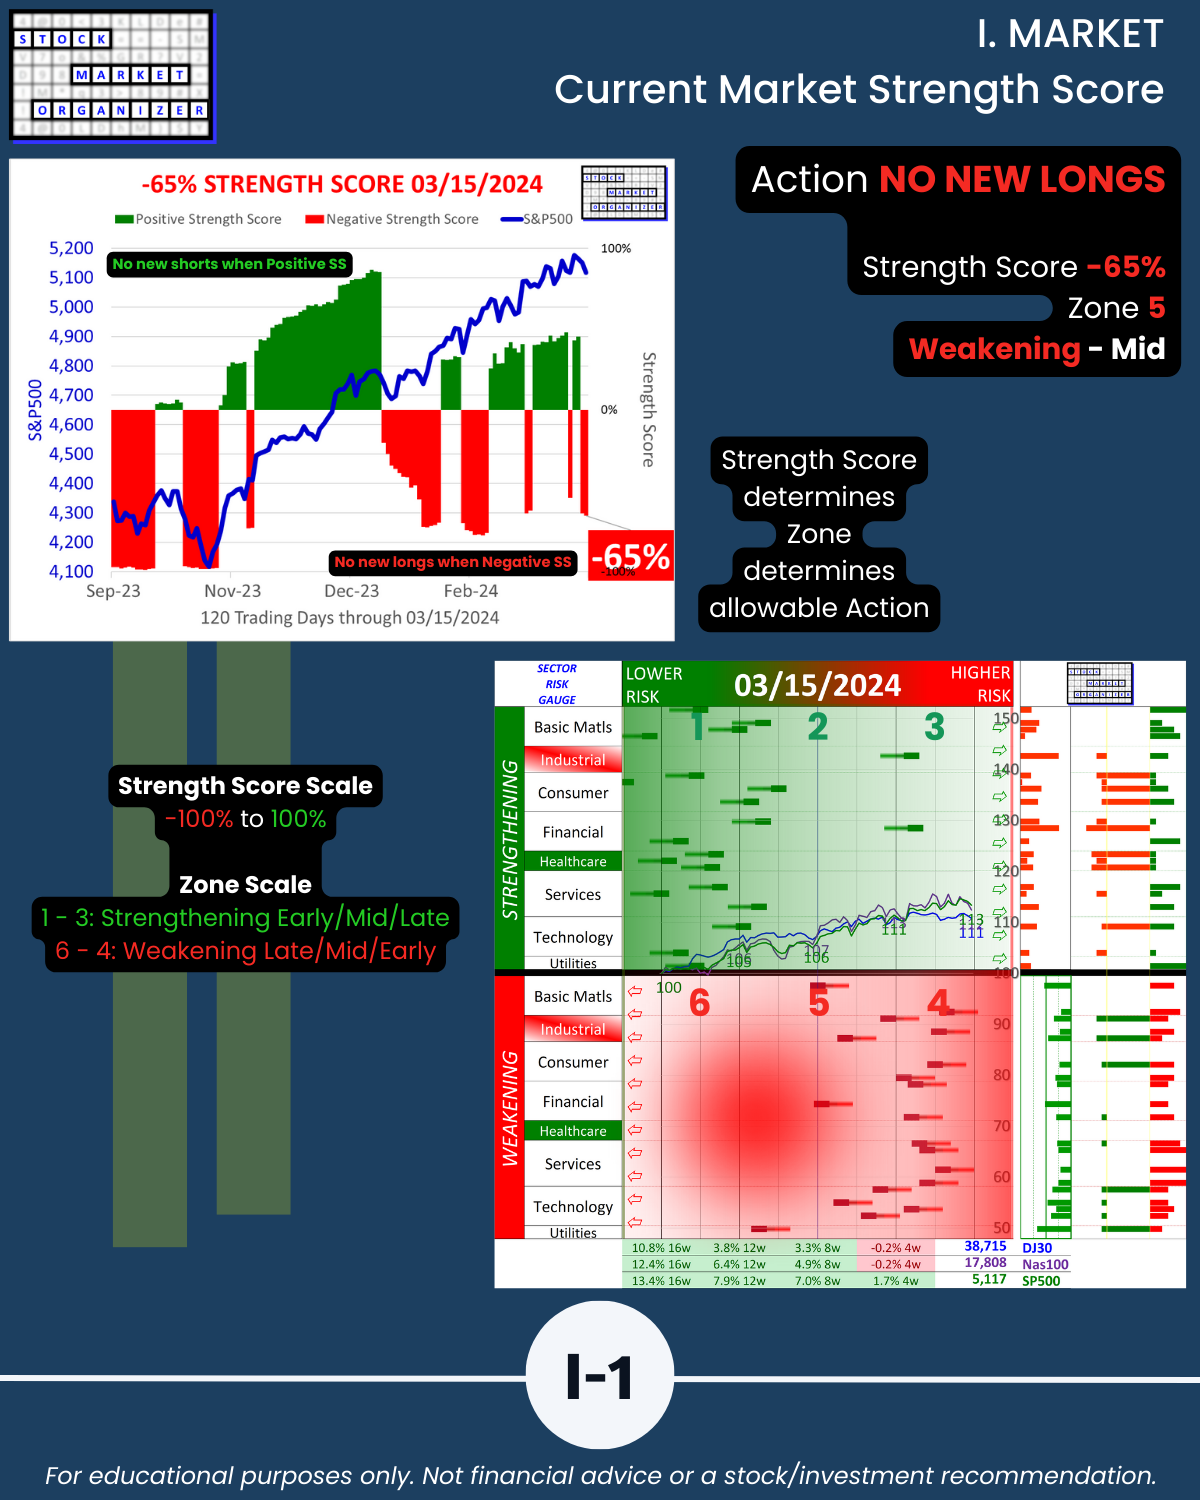
🔹 Current market environment: NO NEW LONGS
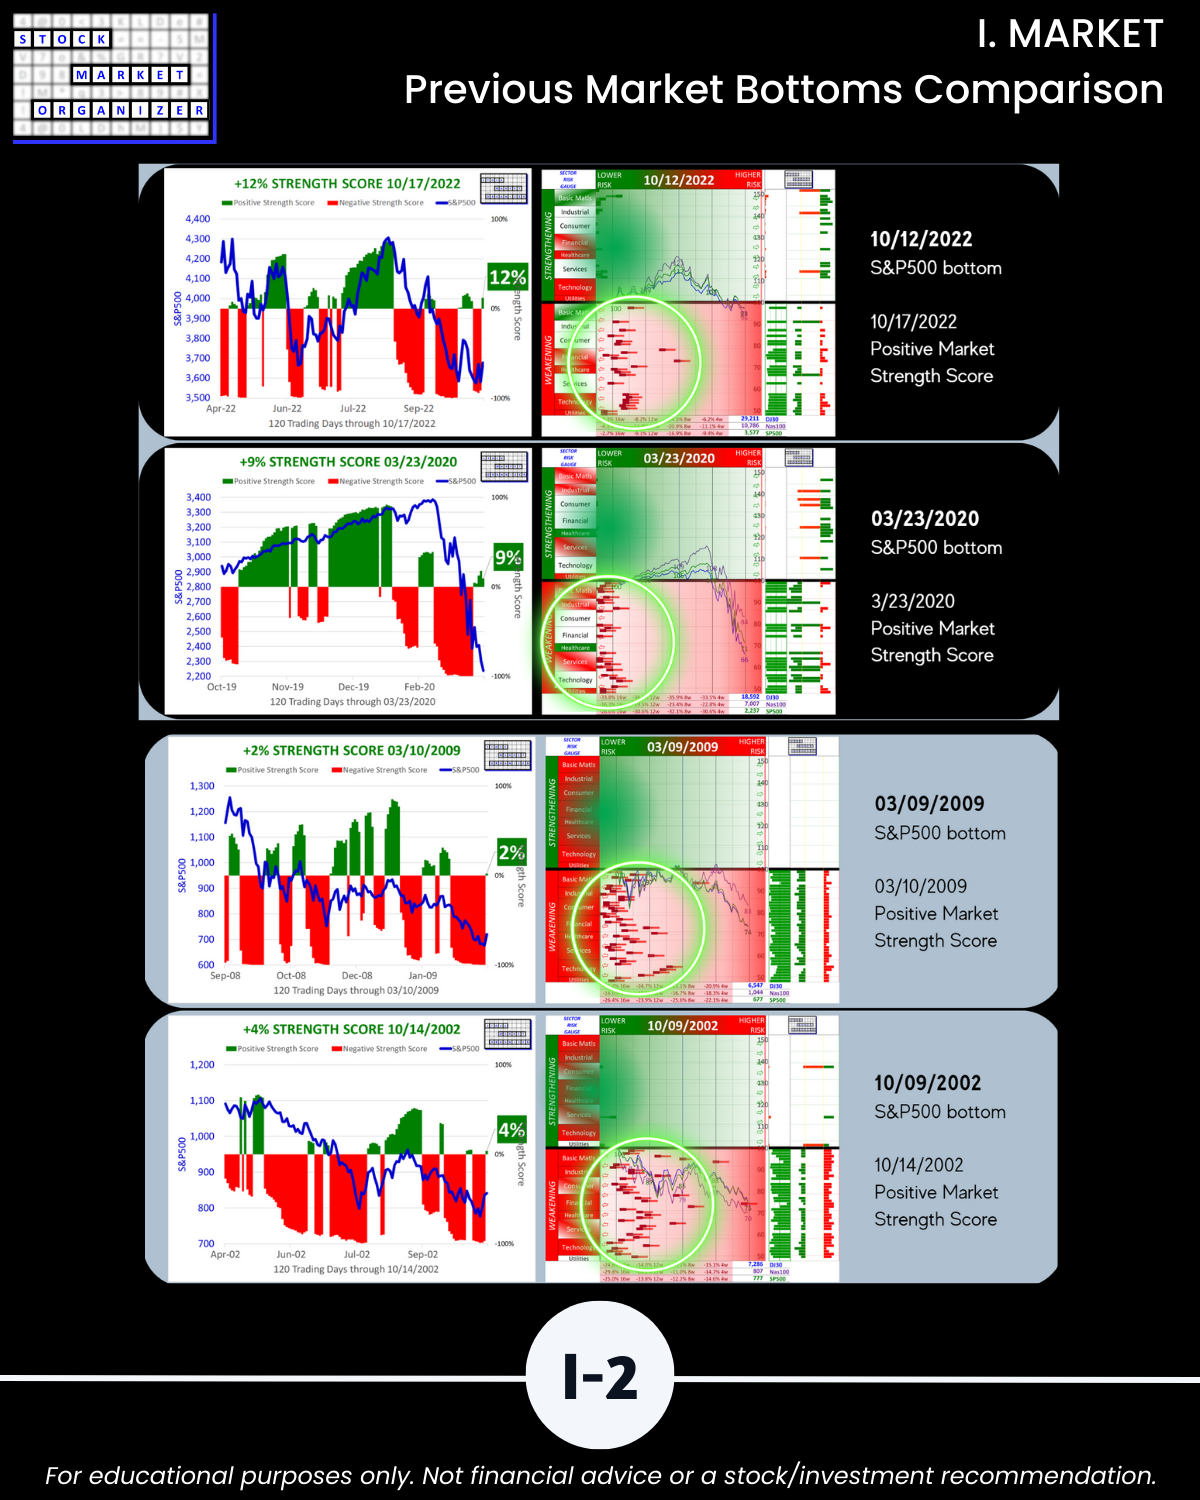
Includes Sector Risk Gauge (a Stock Market Organizer exclusive) examples of 2022, 2020, 2009, and 2002 market bottoms for context. At those bottoms per this gauge it is clear the market was extended.
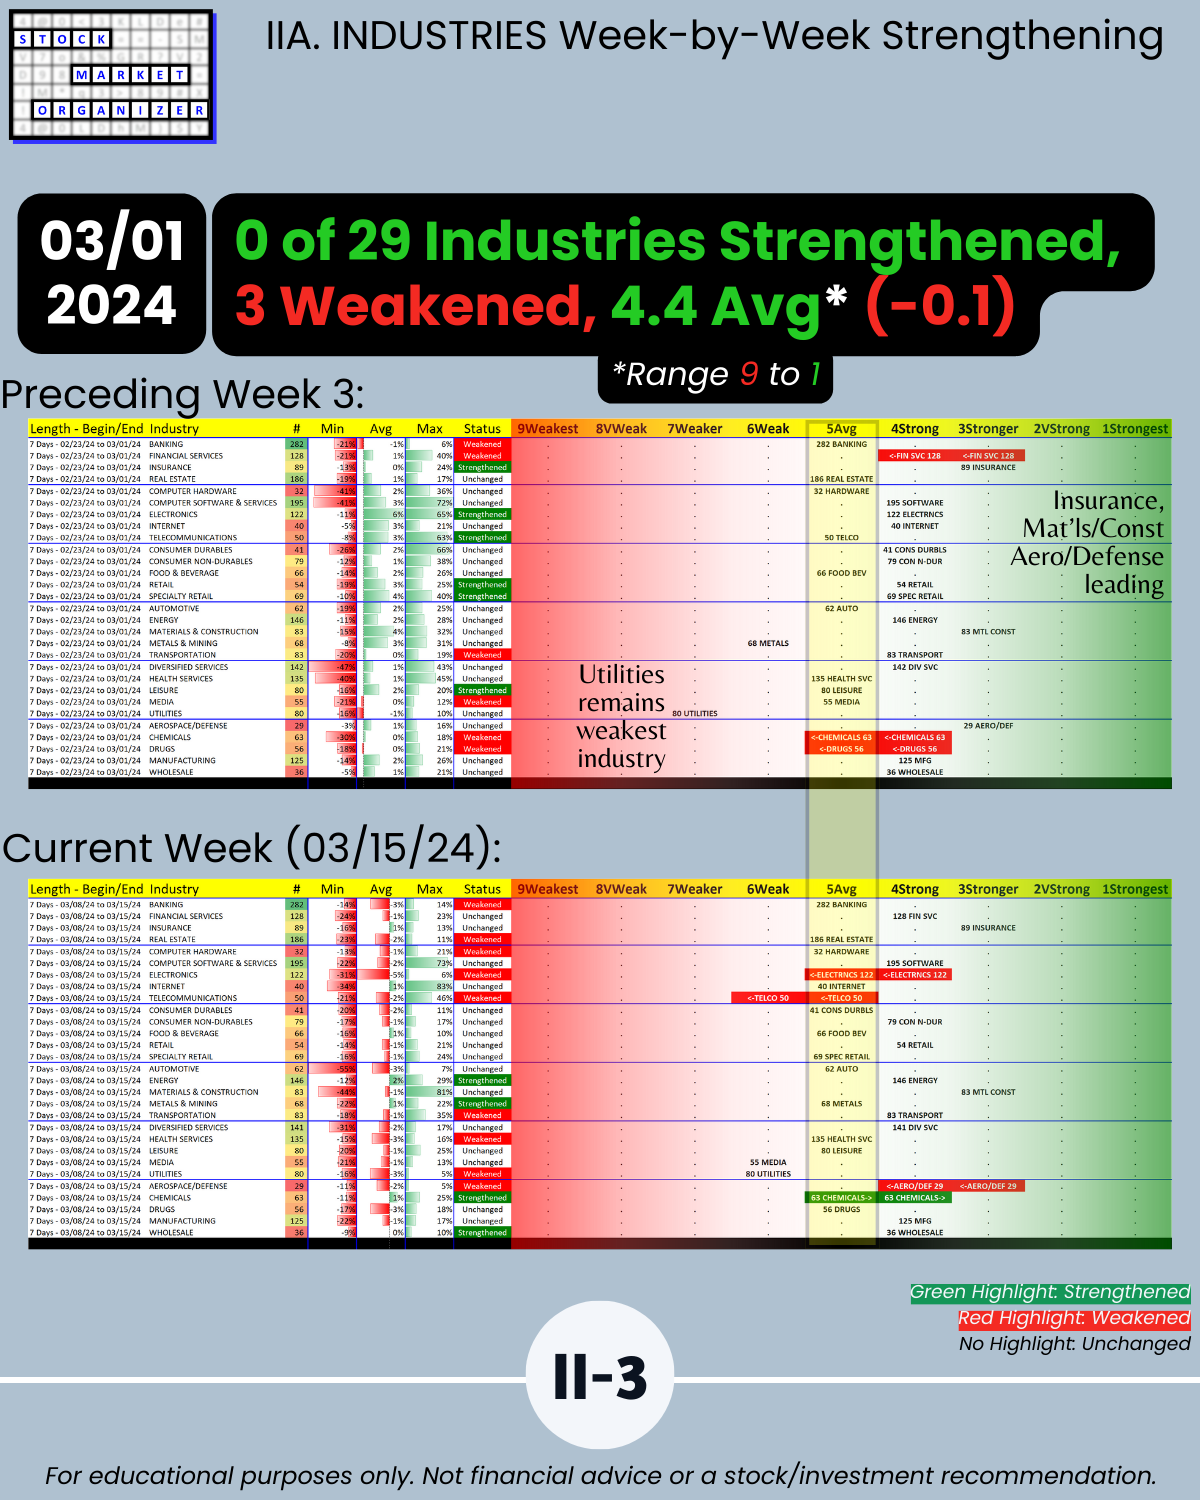
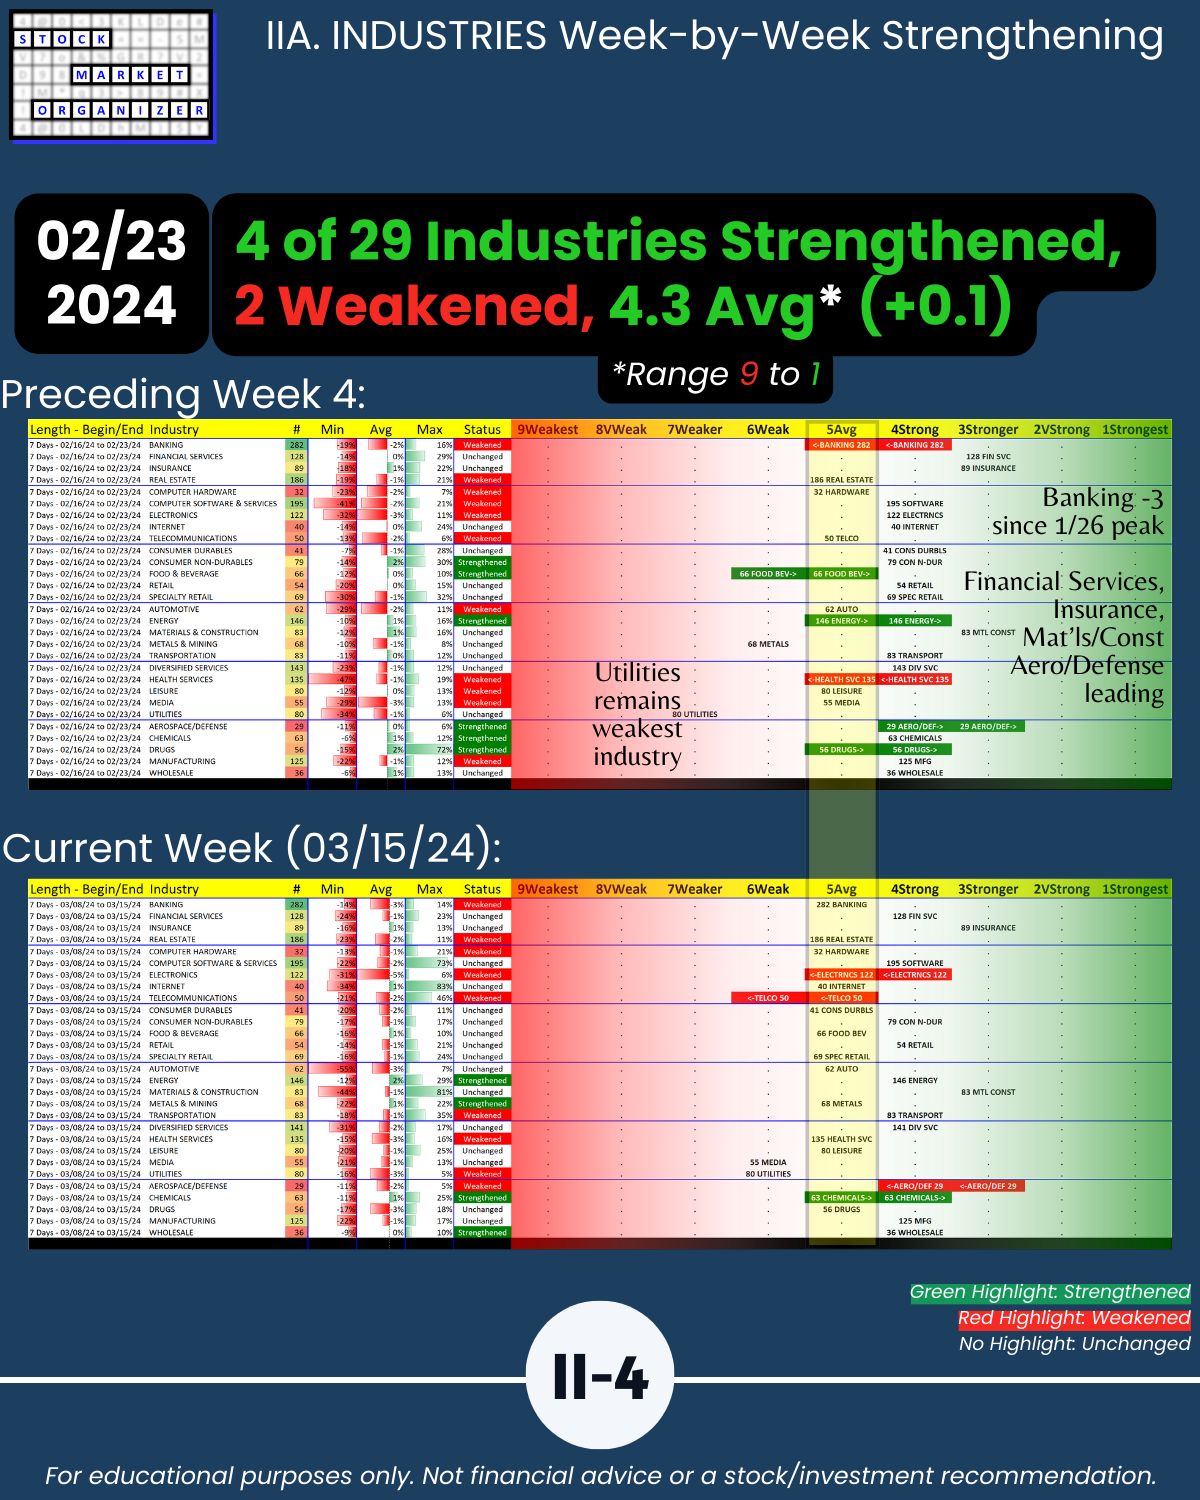
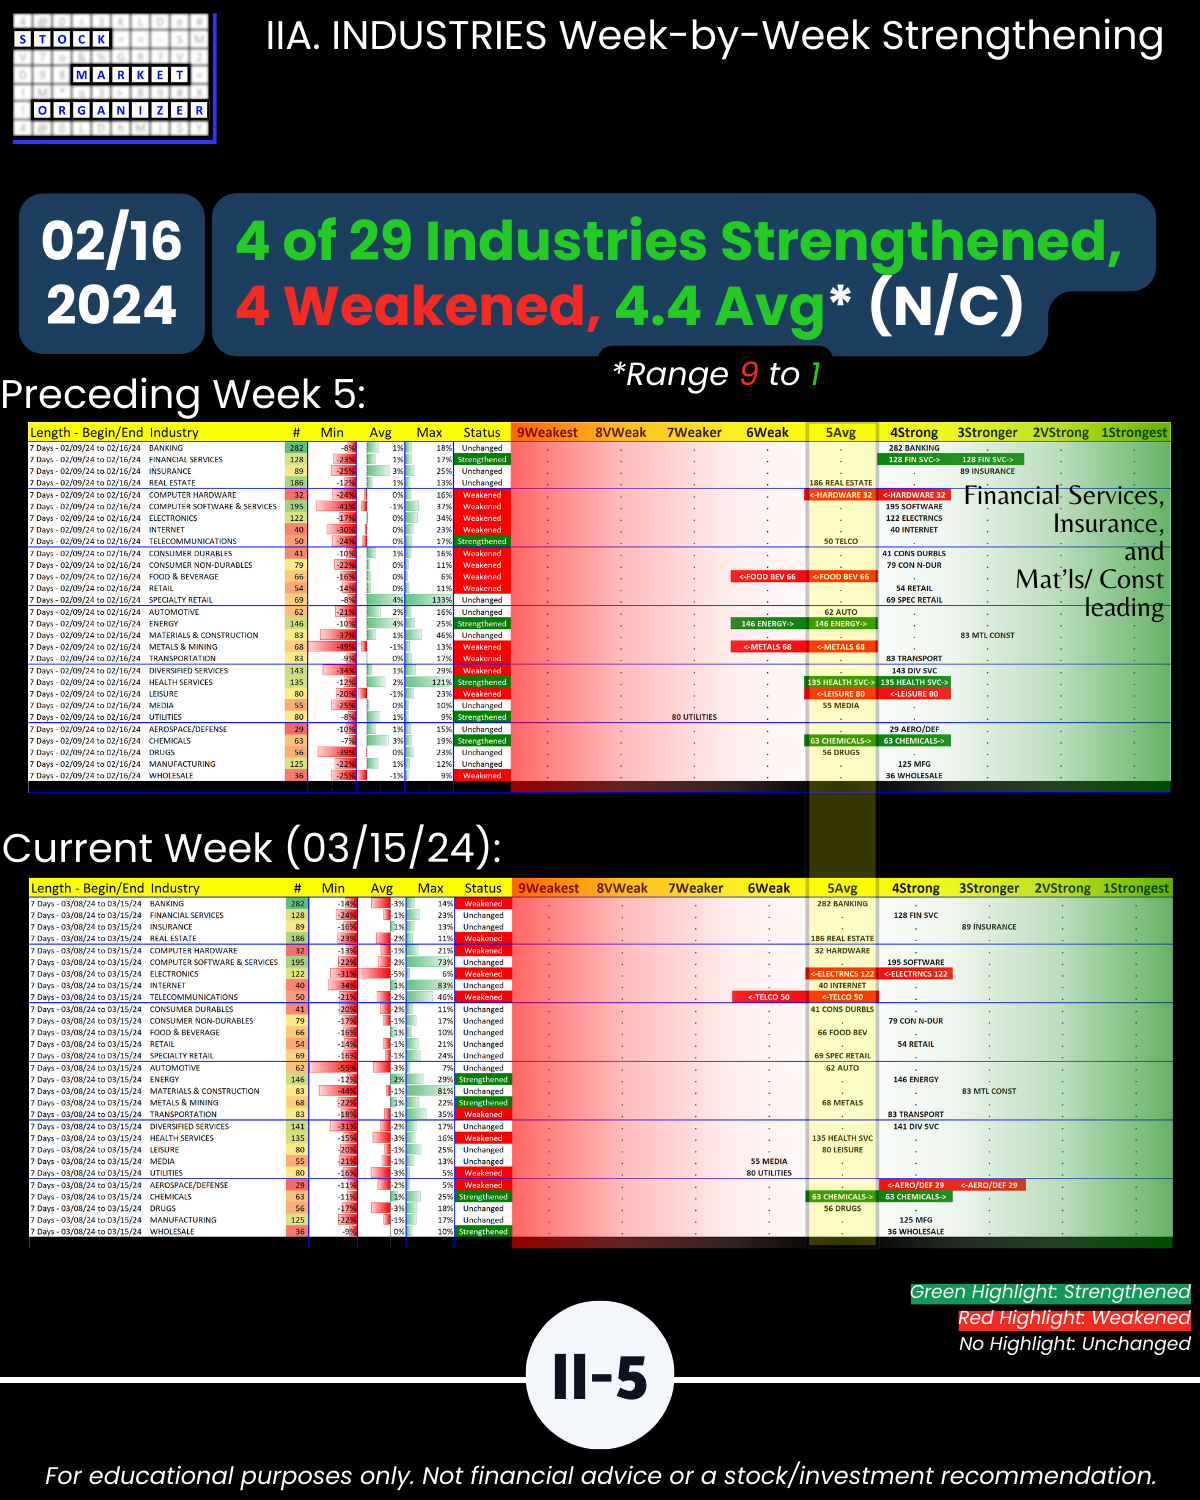
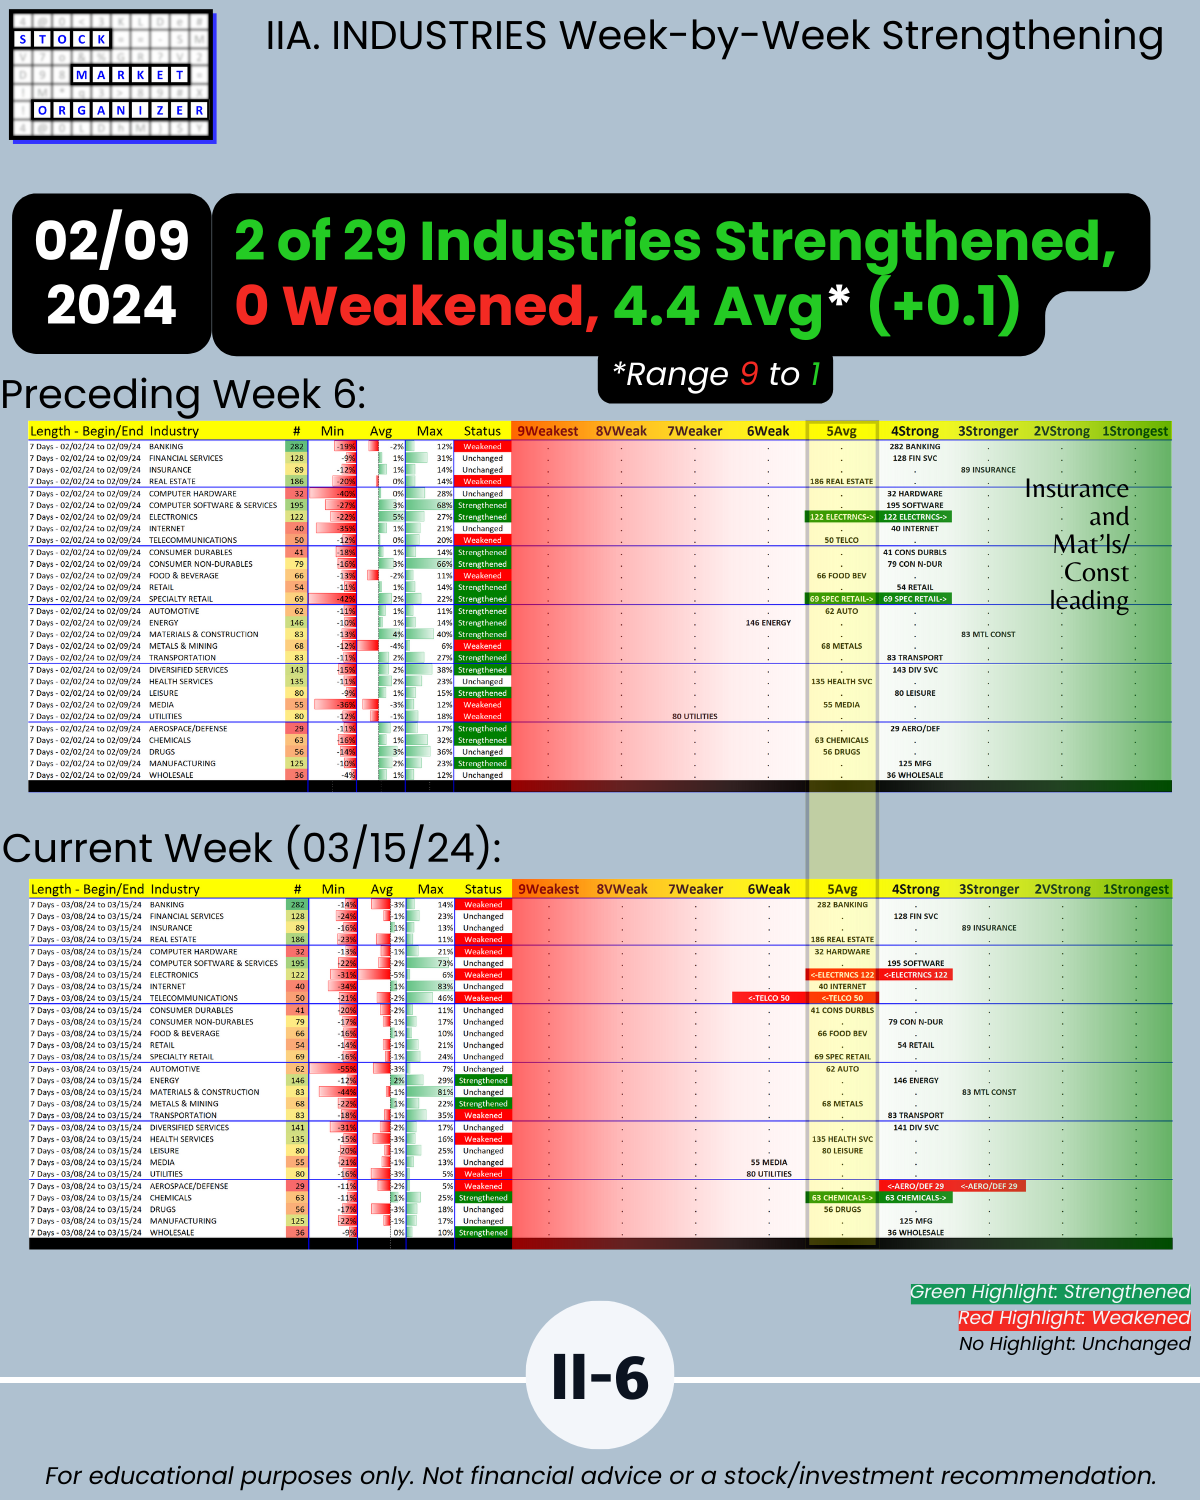
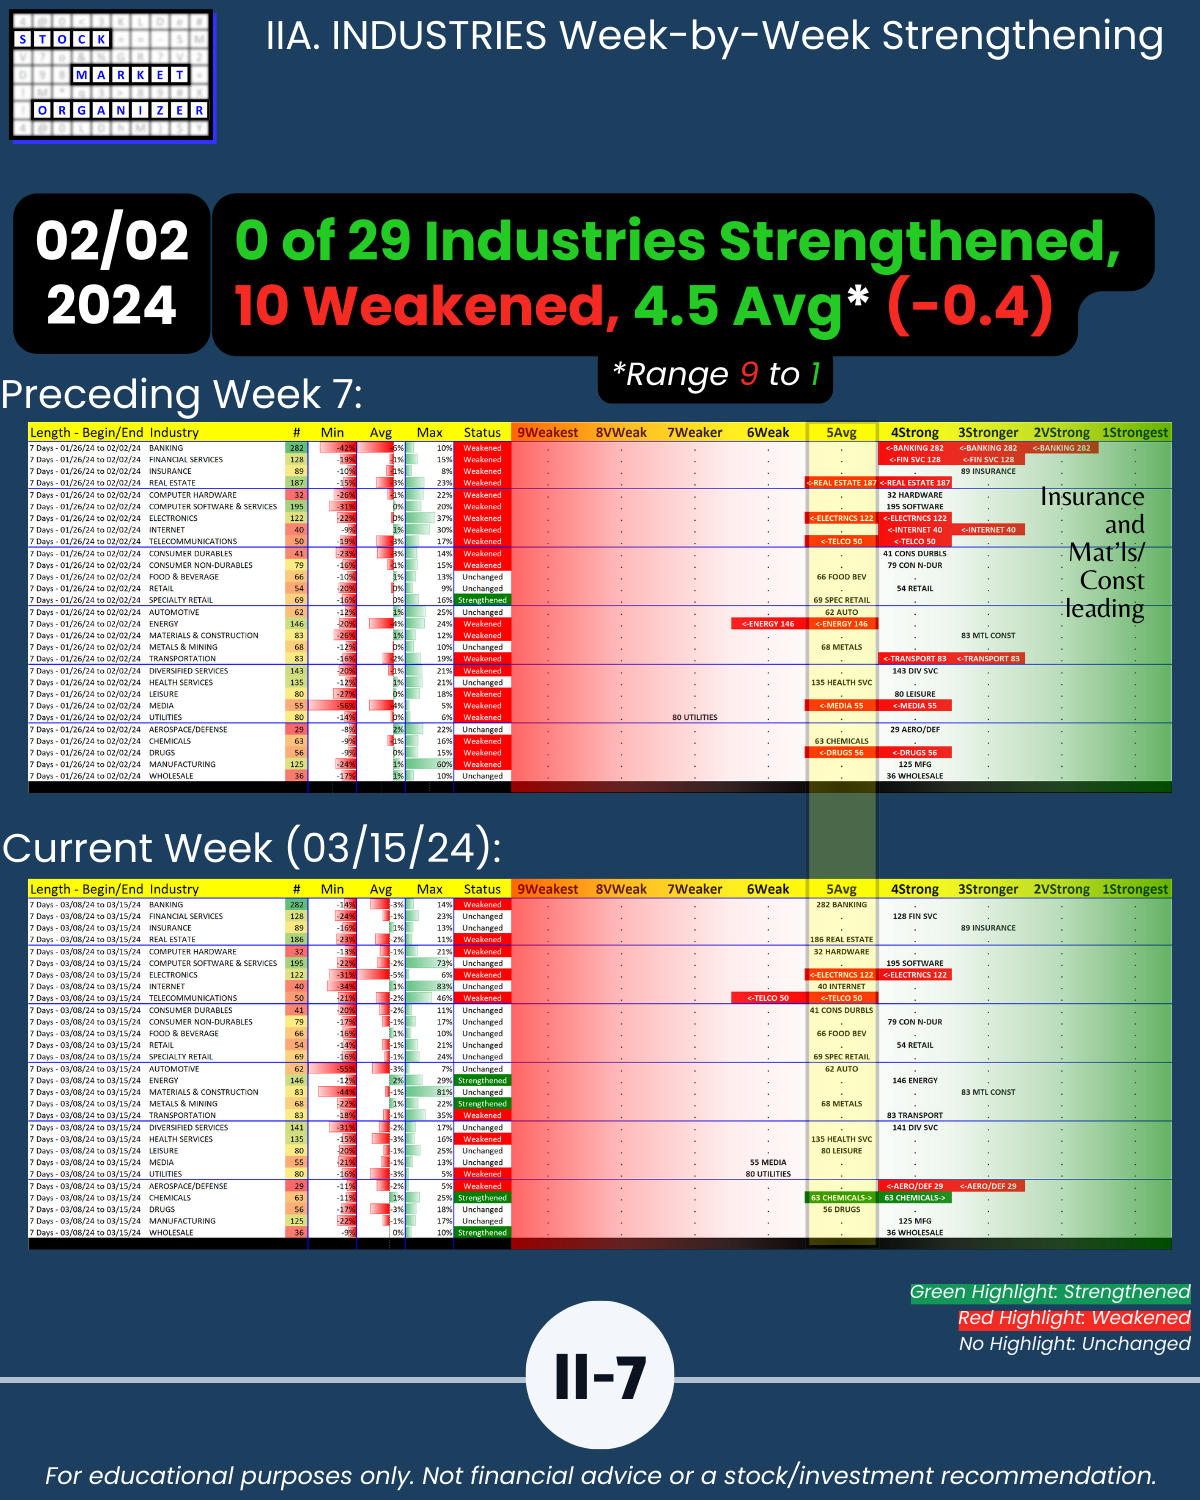
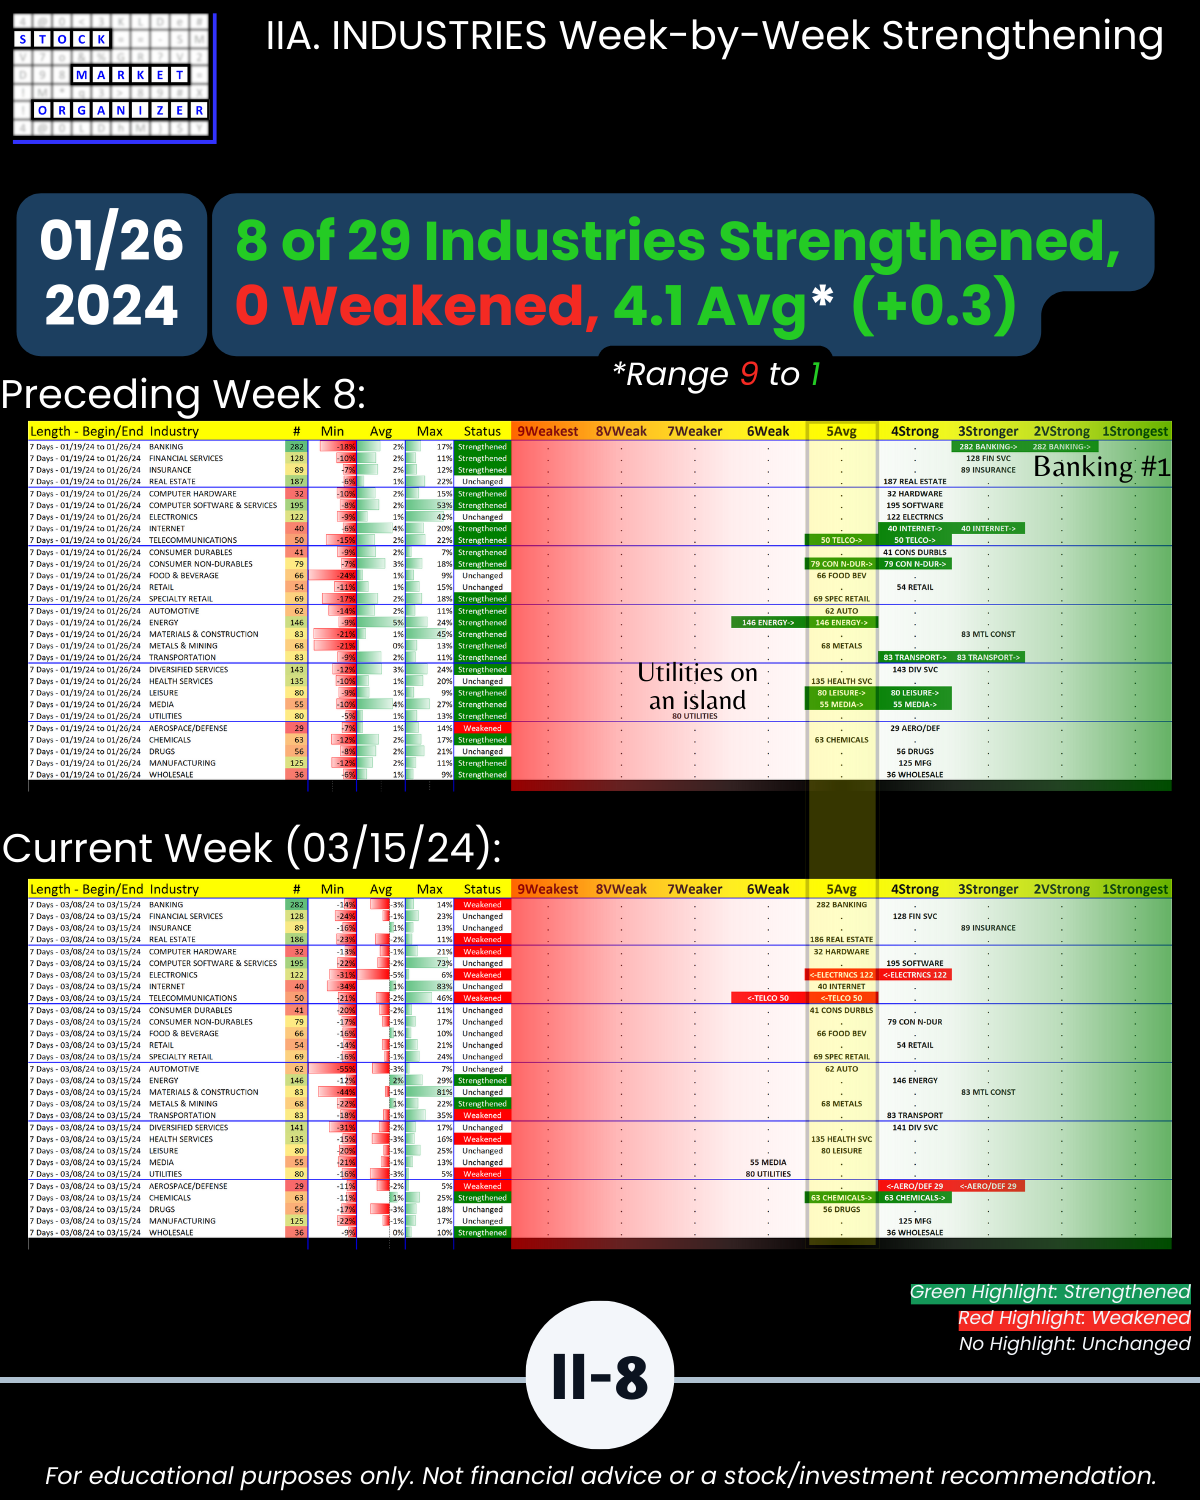
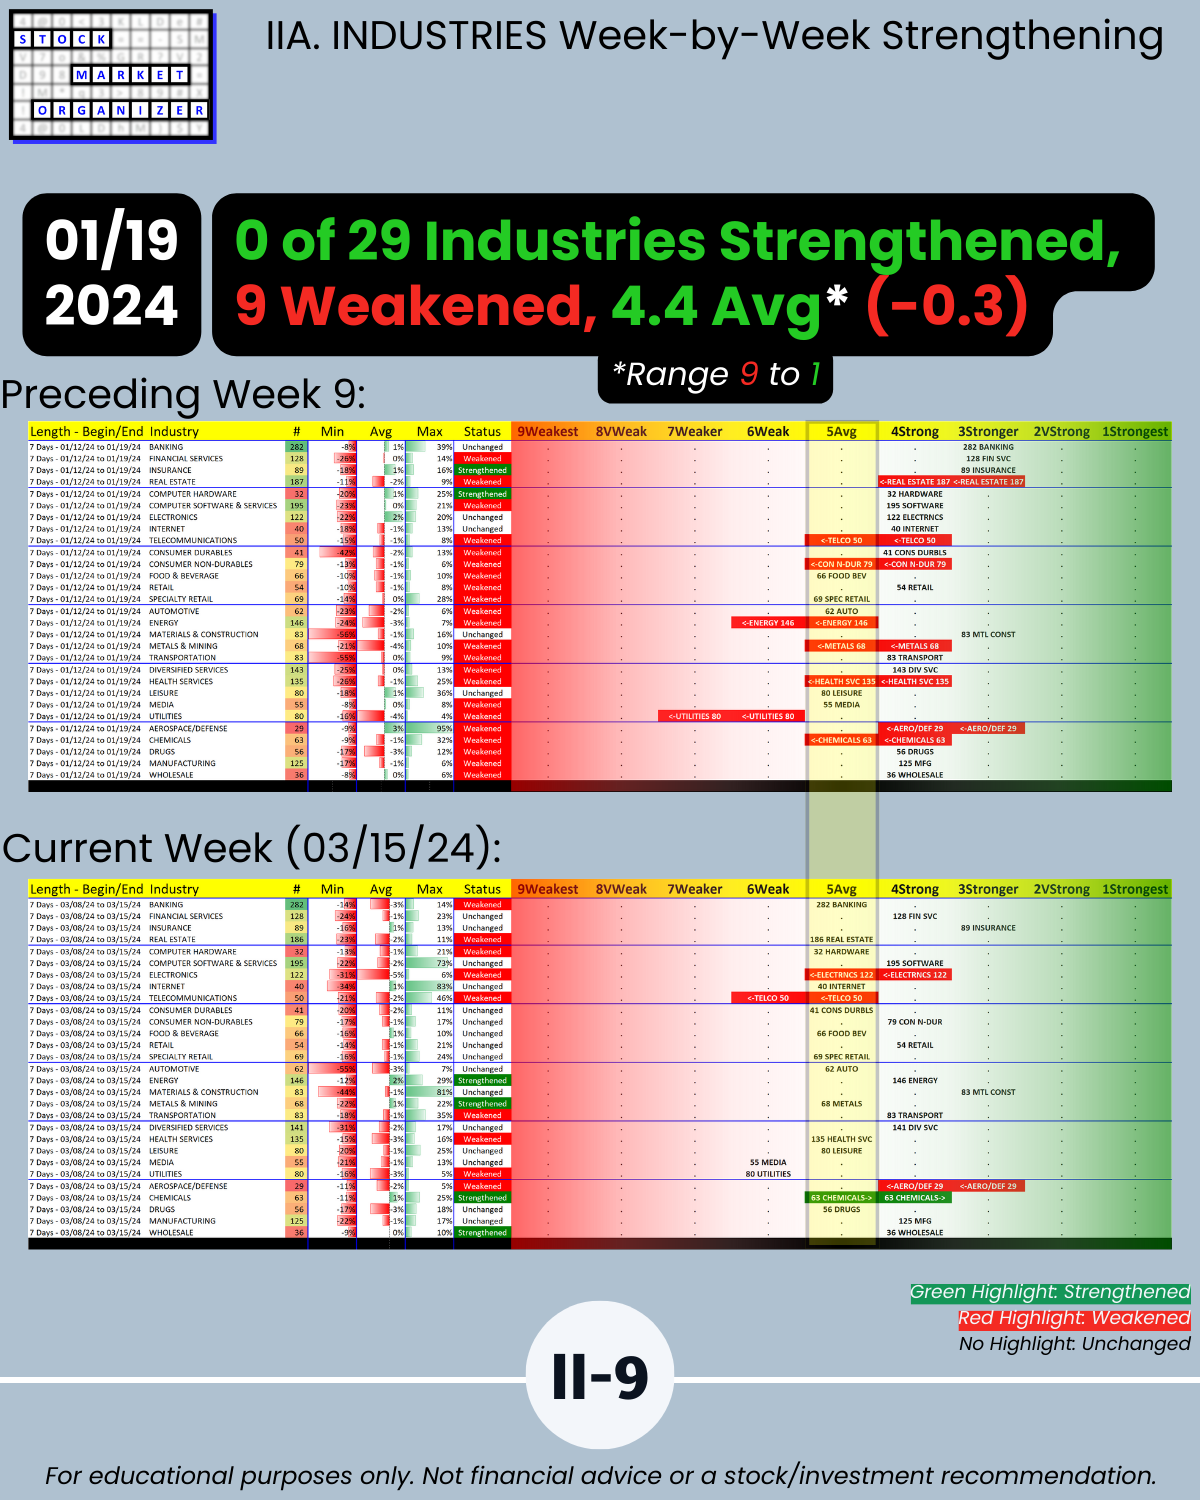
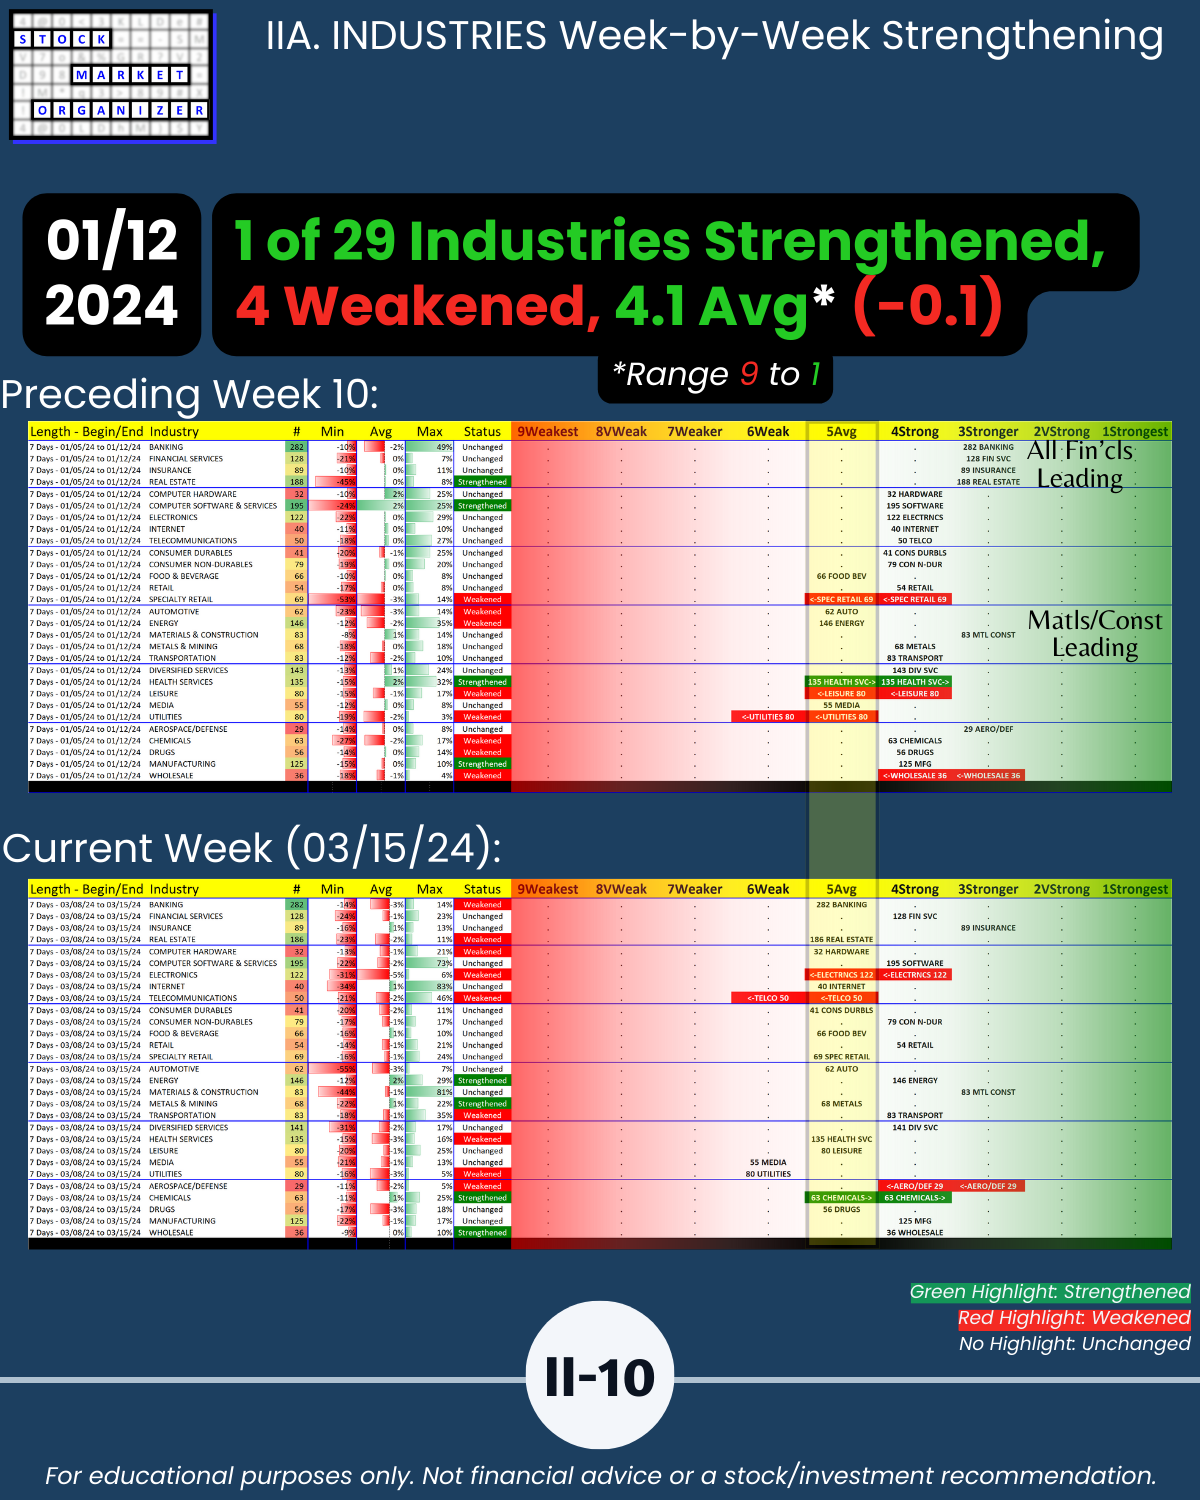
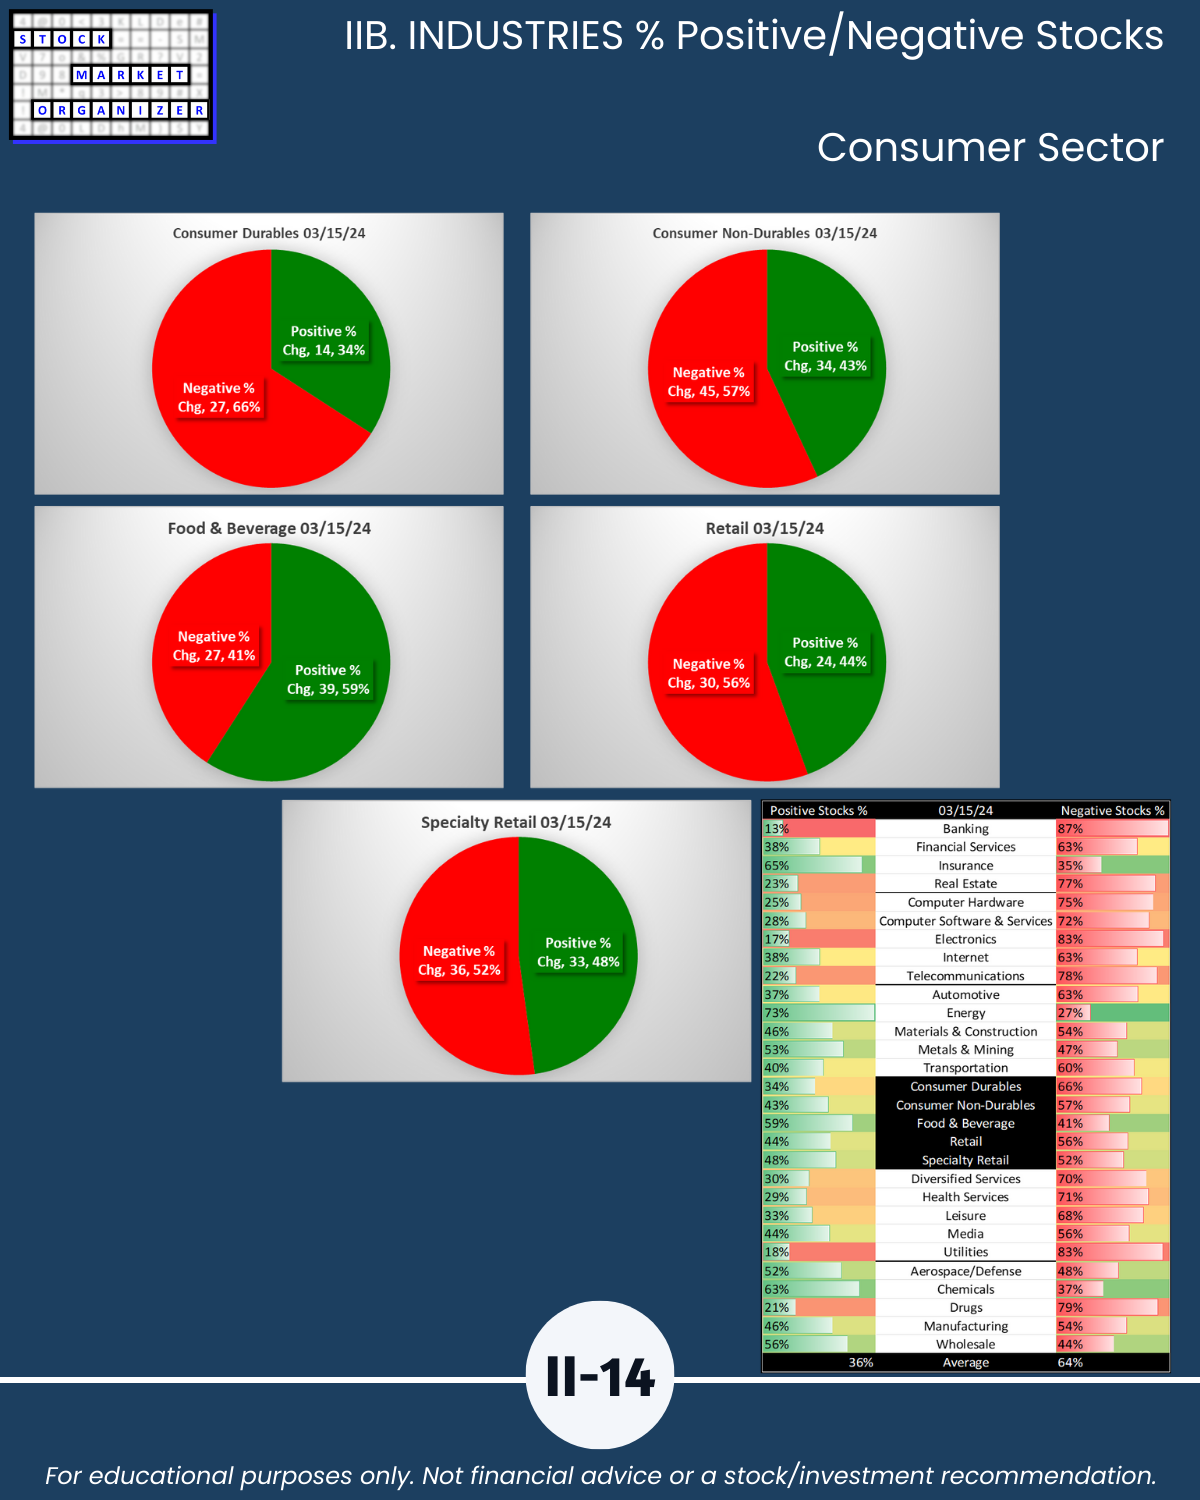
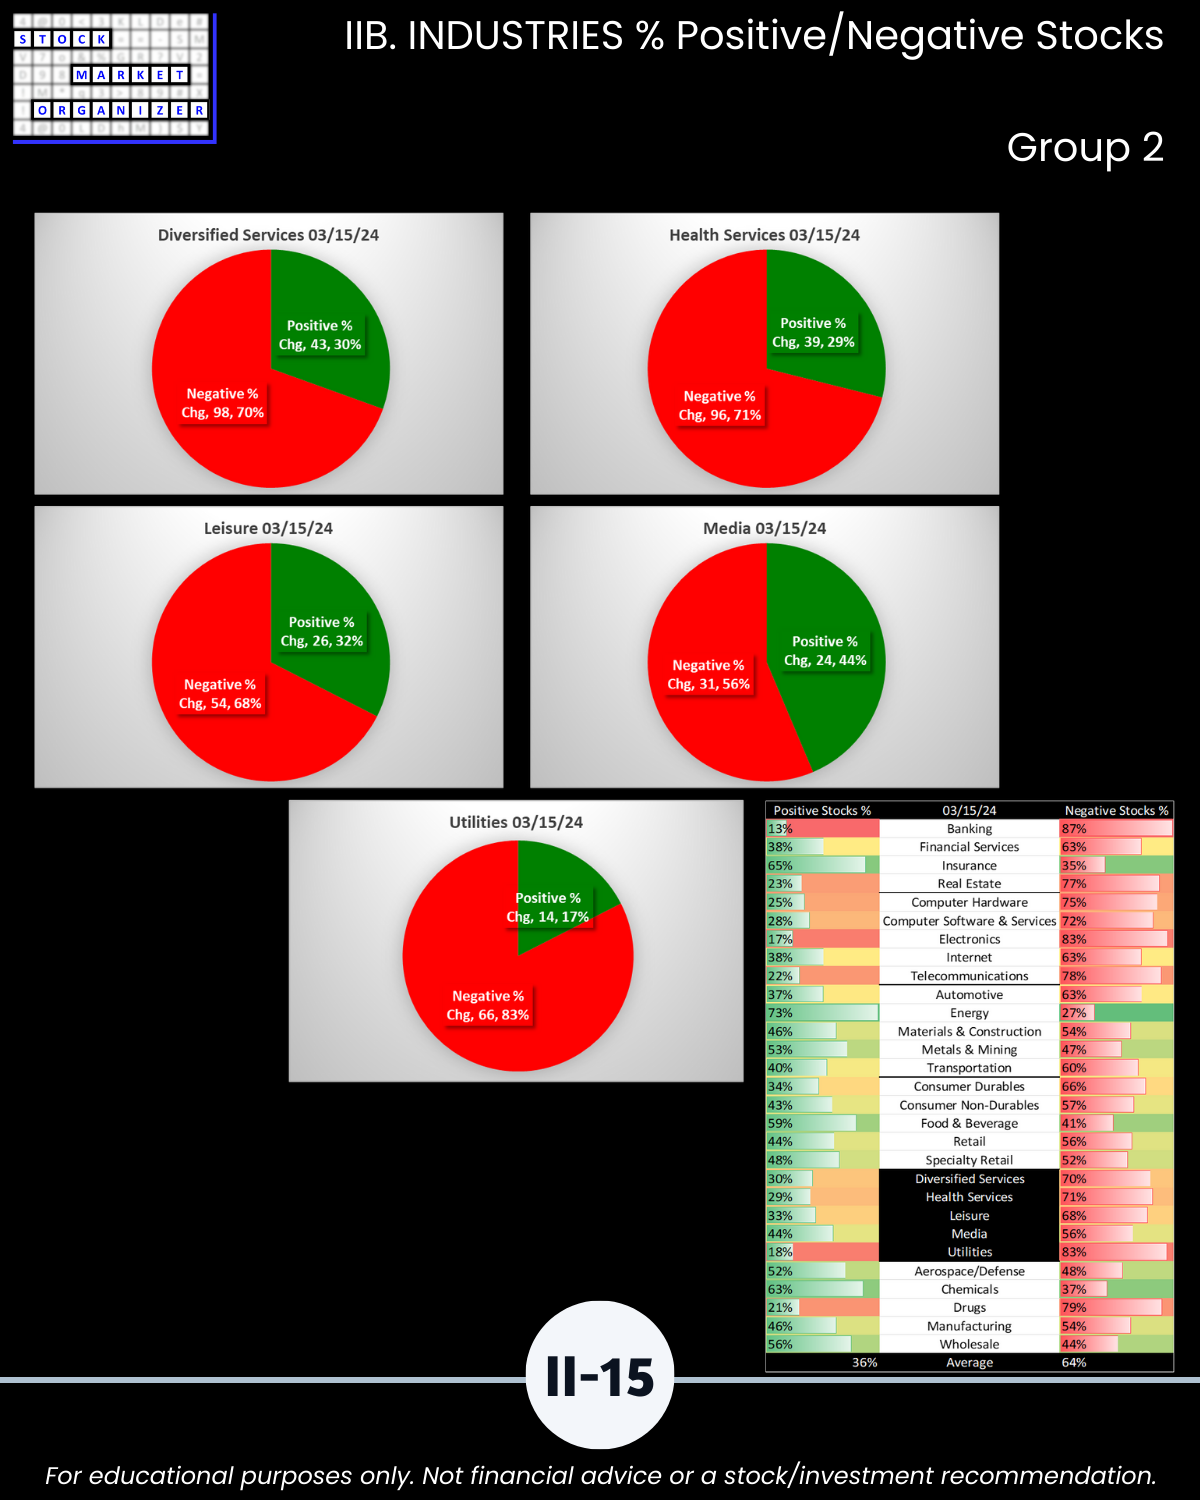
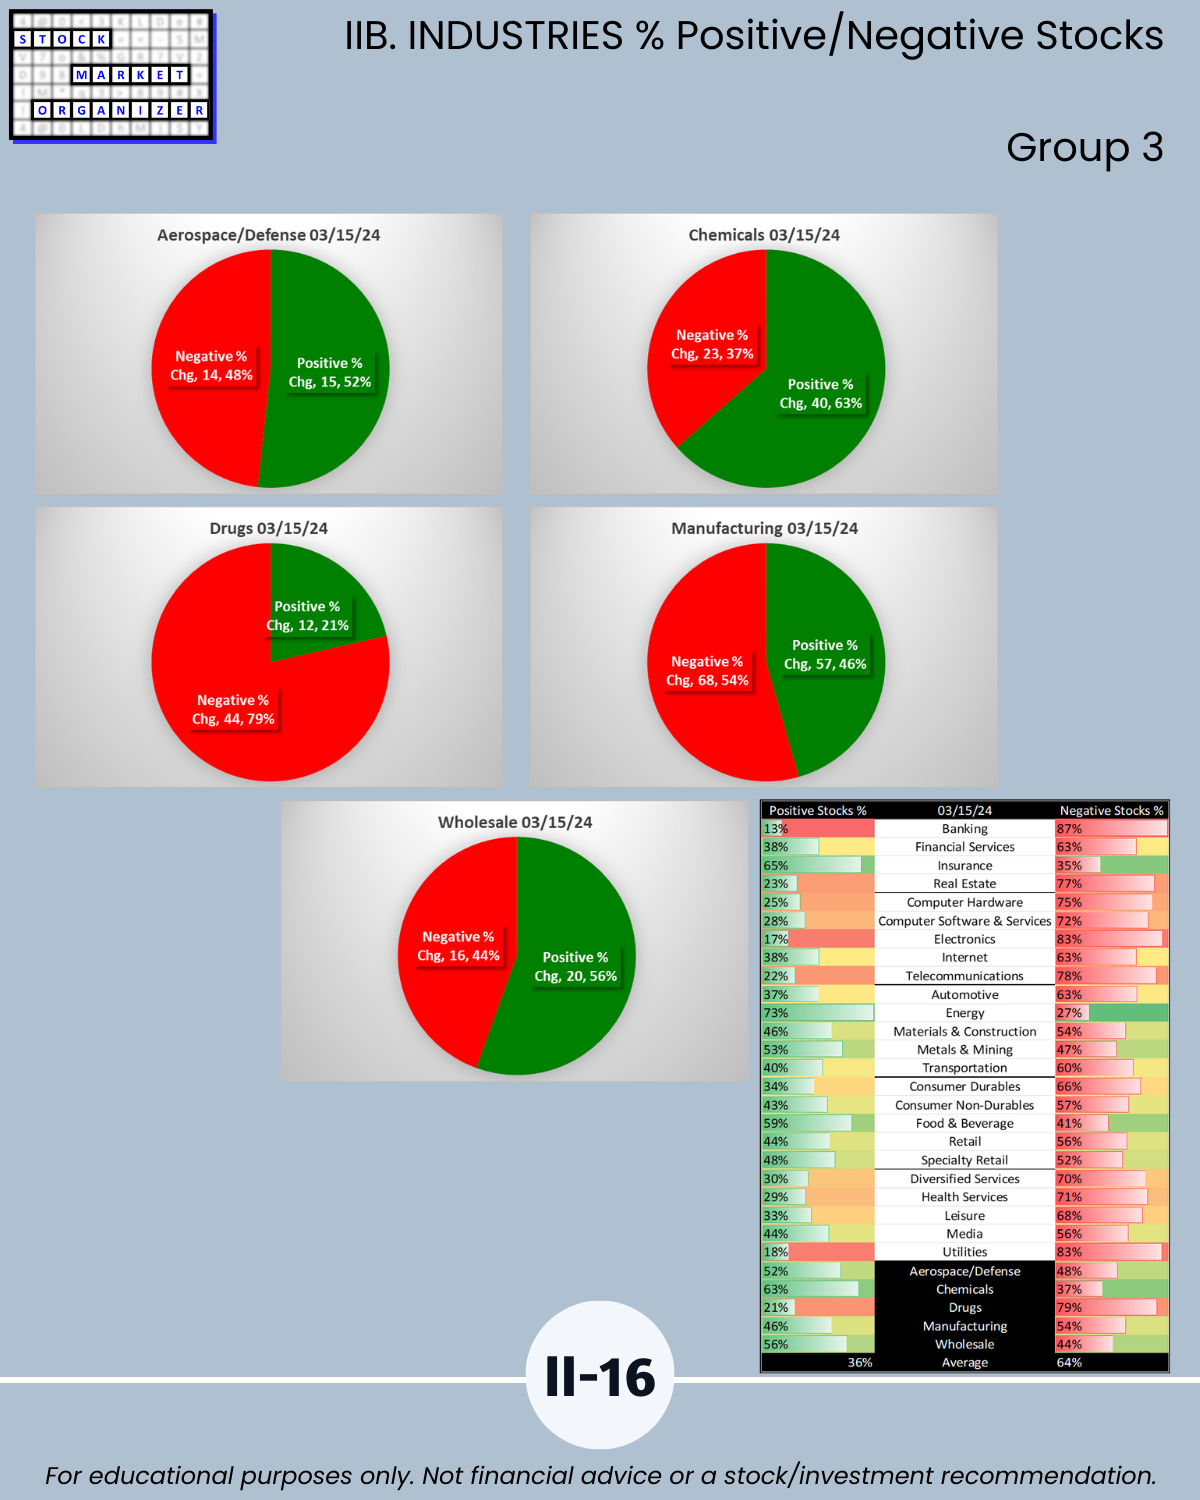
SECTION II Sectors/Industries level:
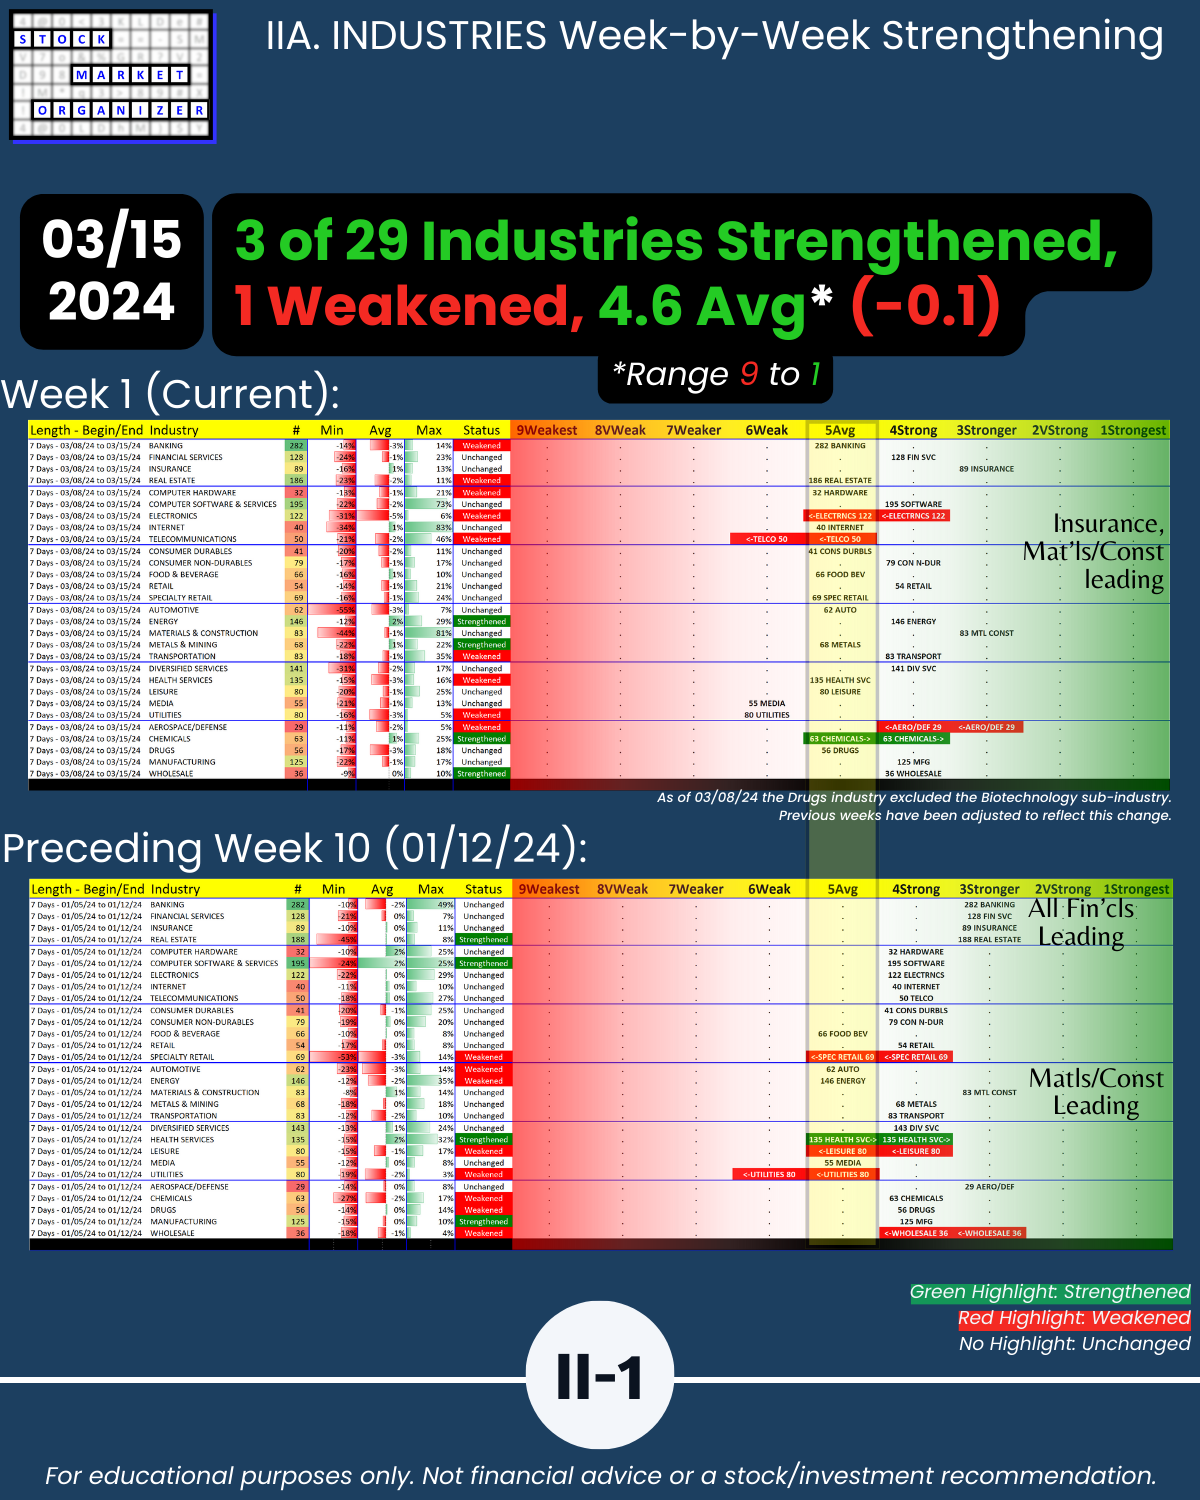
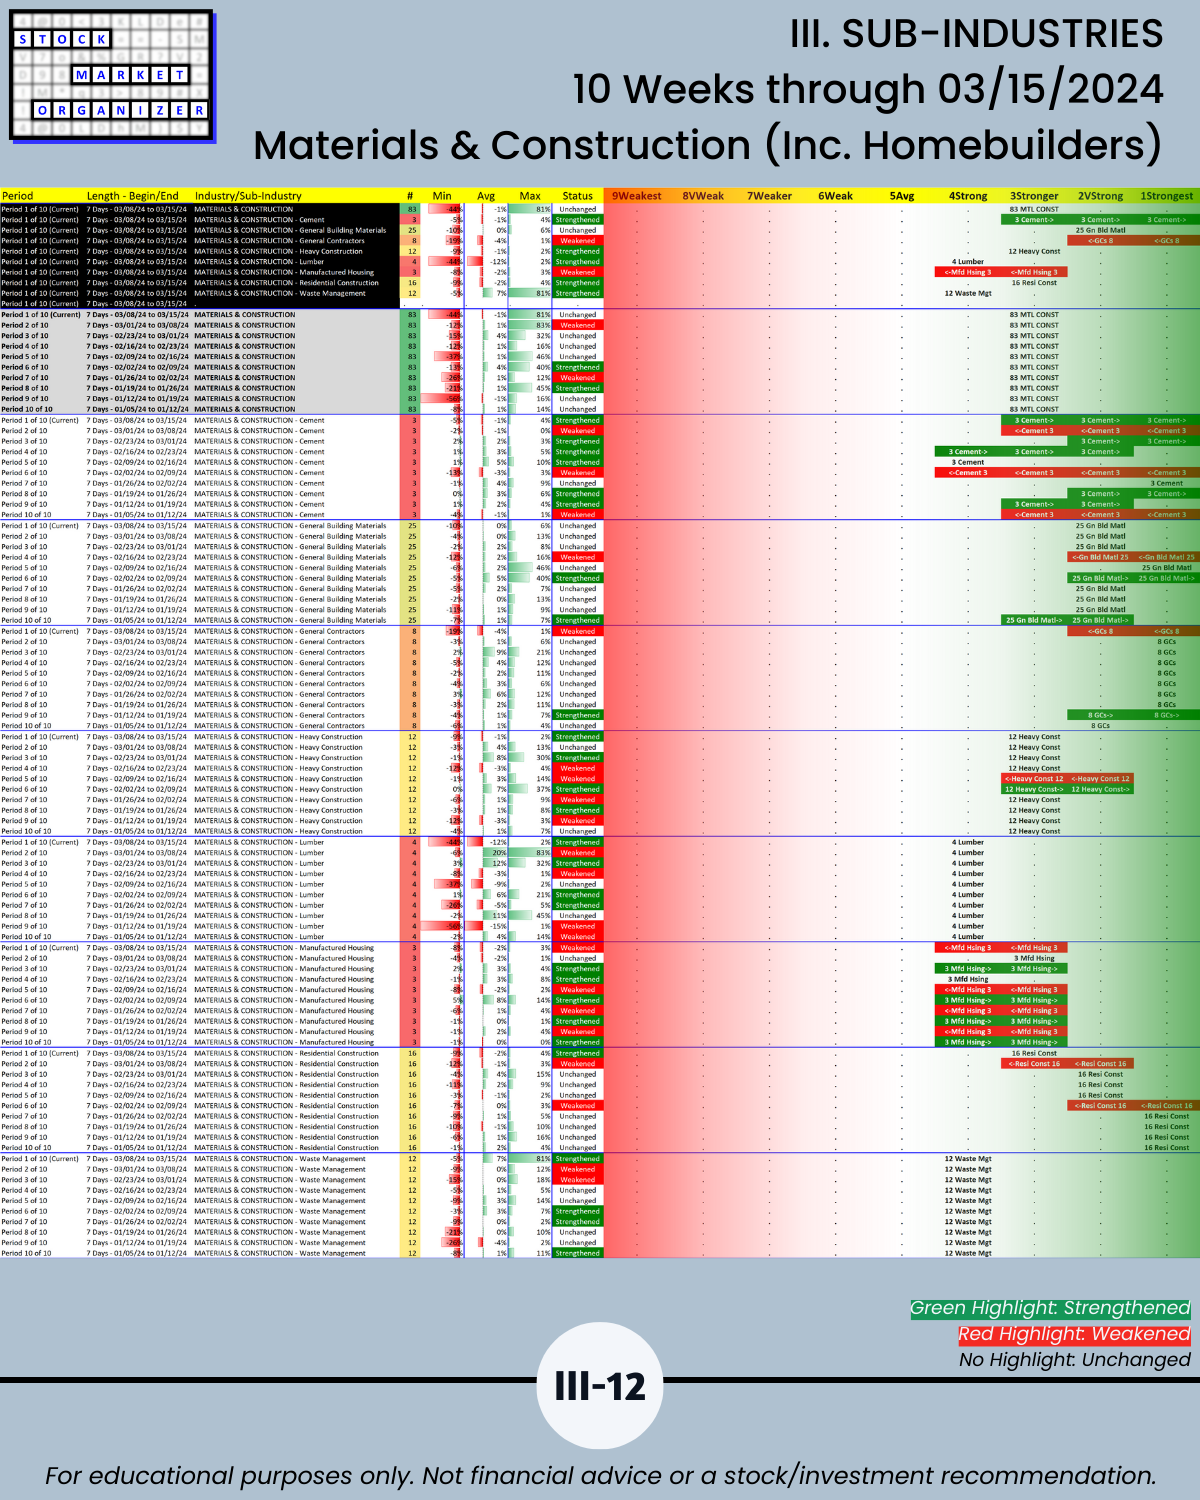
🔹 Industry Leaders, rated Stronger (3rd strongest of 9 levels): Insurance, Materials & Construction
🔹 Laggards, rated Weak (6th strongest): Media, Telecommunications, Utilities
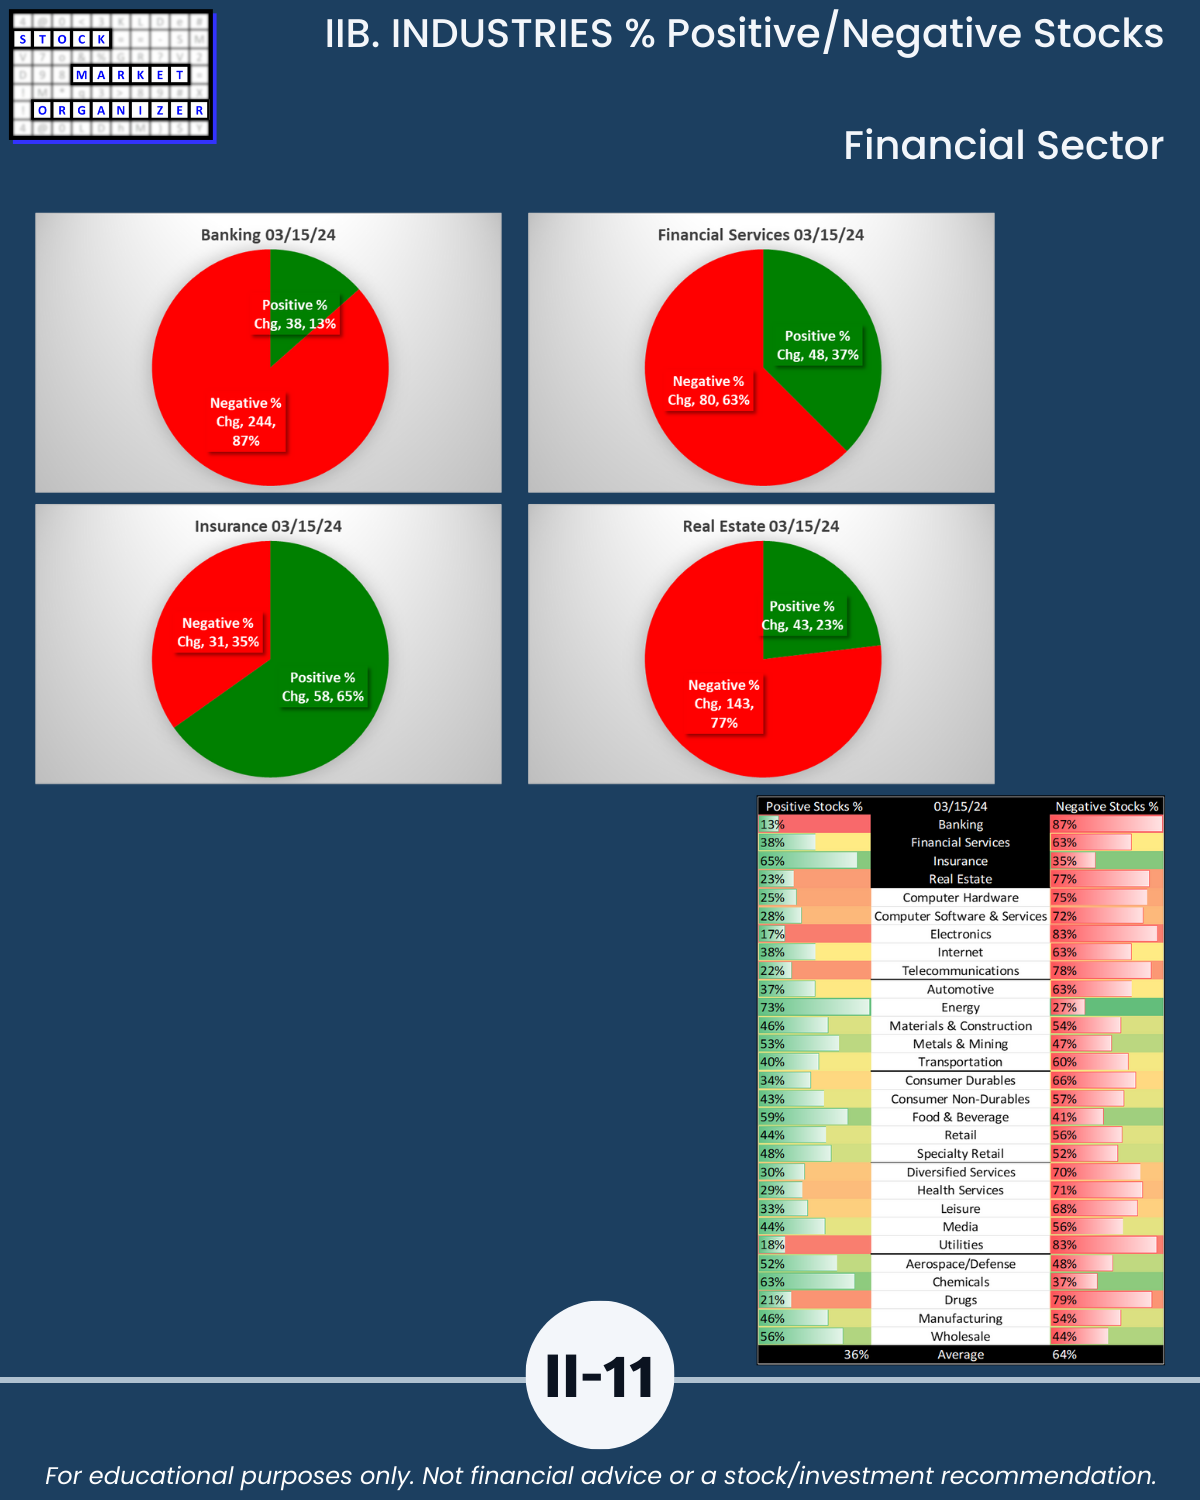
🔹 Only 36% of stocks were positive last week
Best:
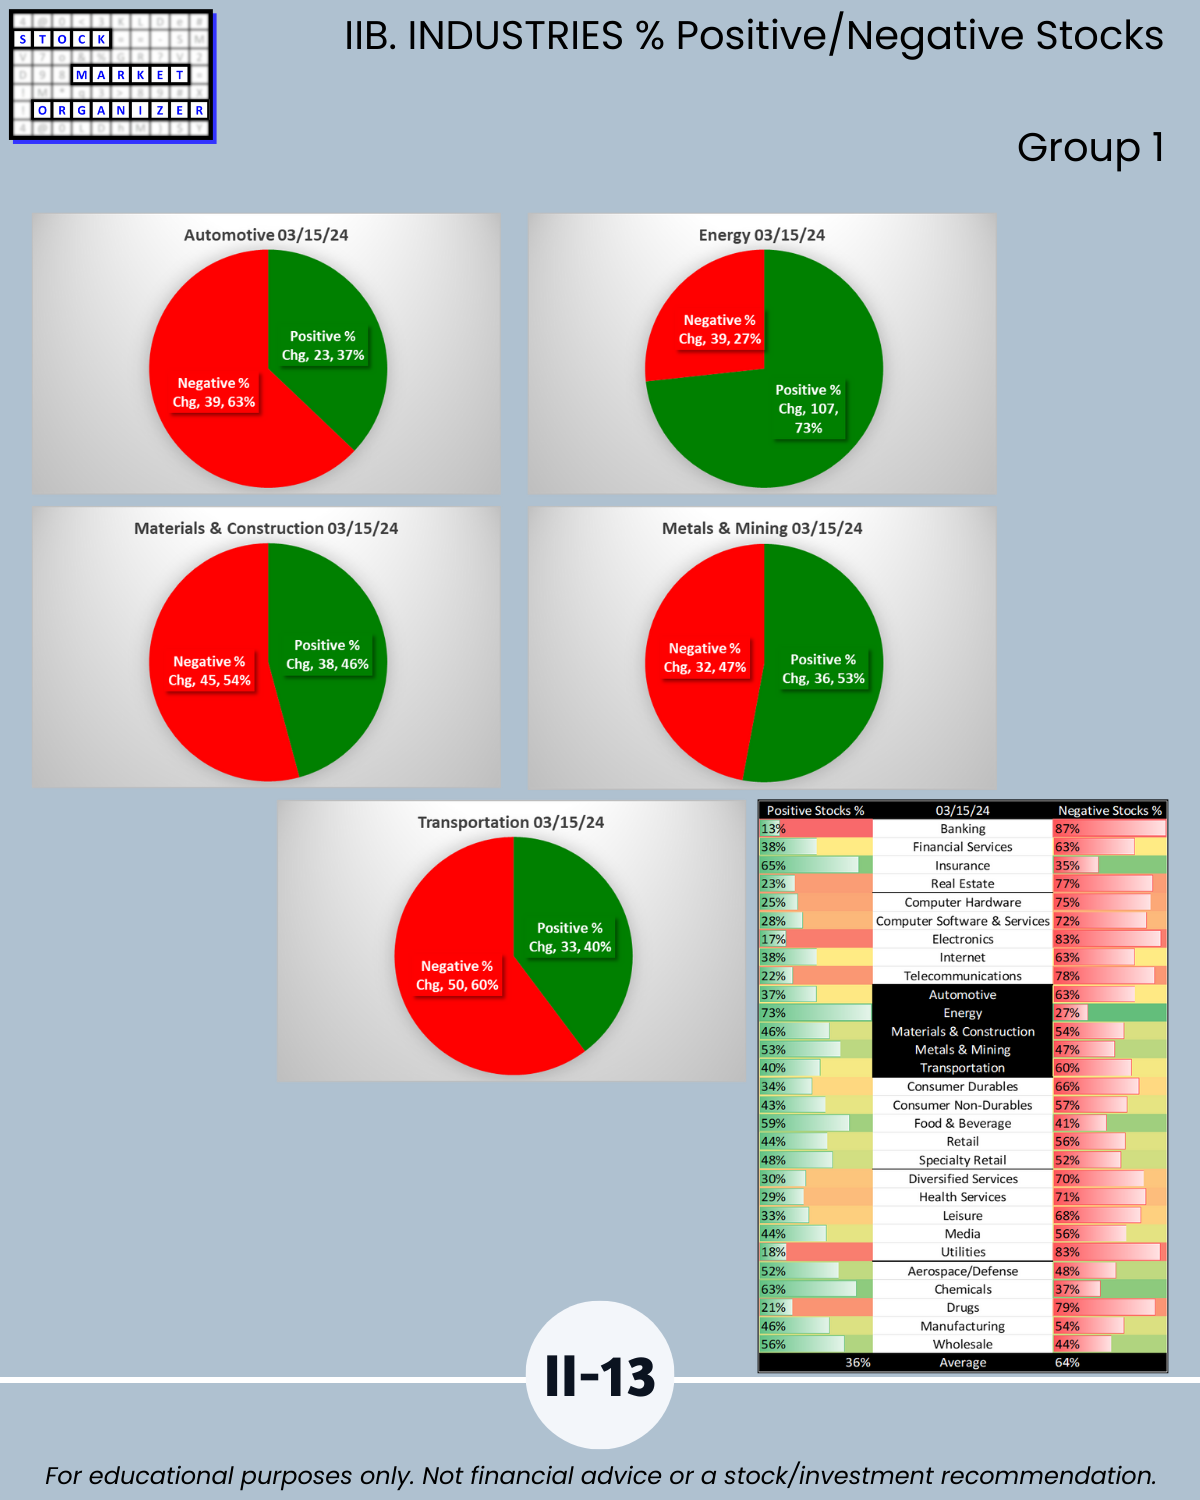
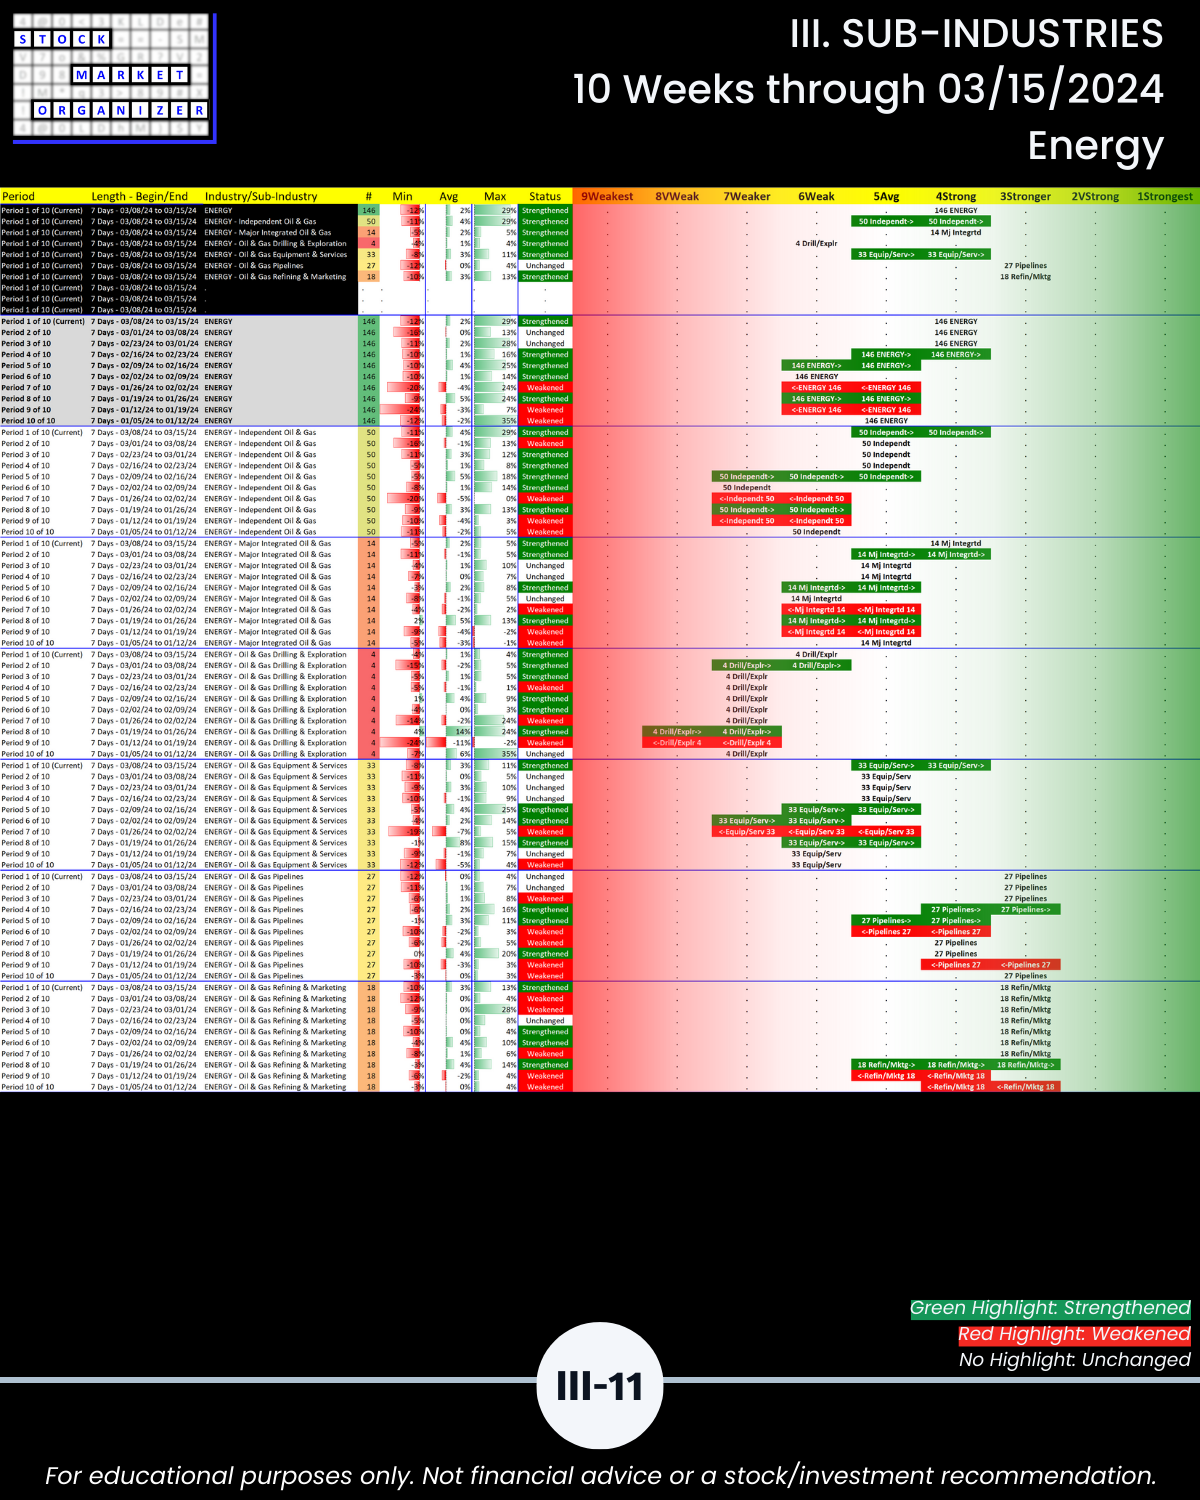
- Energy 73% positive stocks
- Insurance 65%
- Chemicals 63%
- Food & Beverage 59%
- Wholesale 56%
Worst:
- Banking 13%
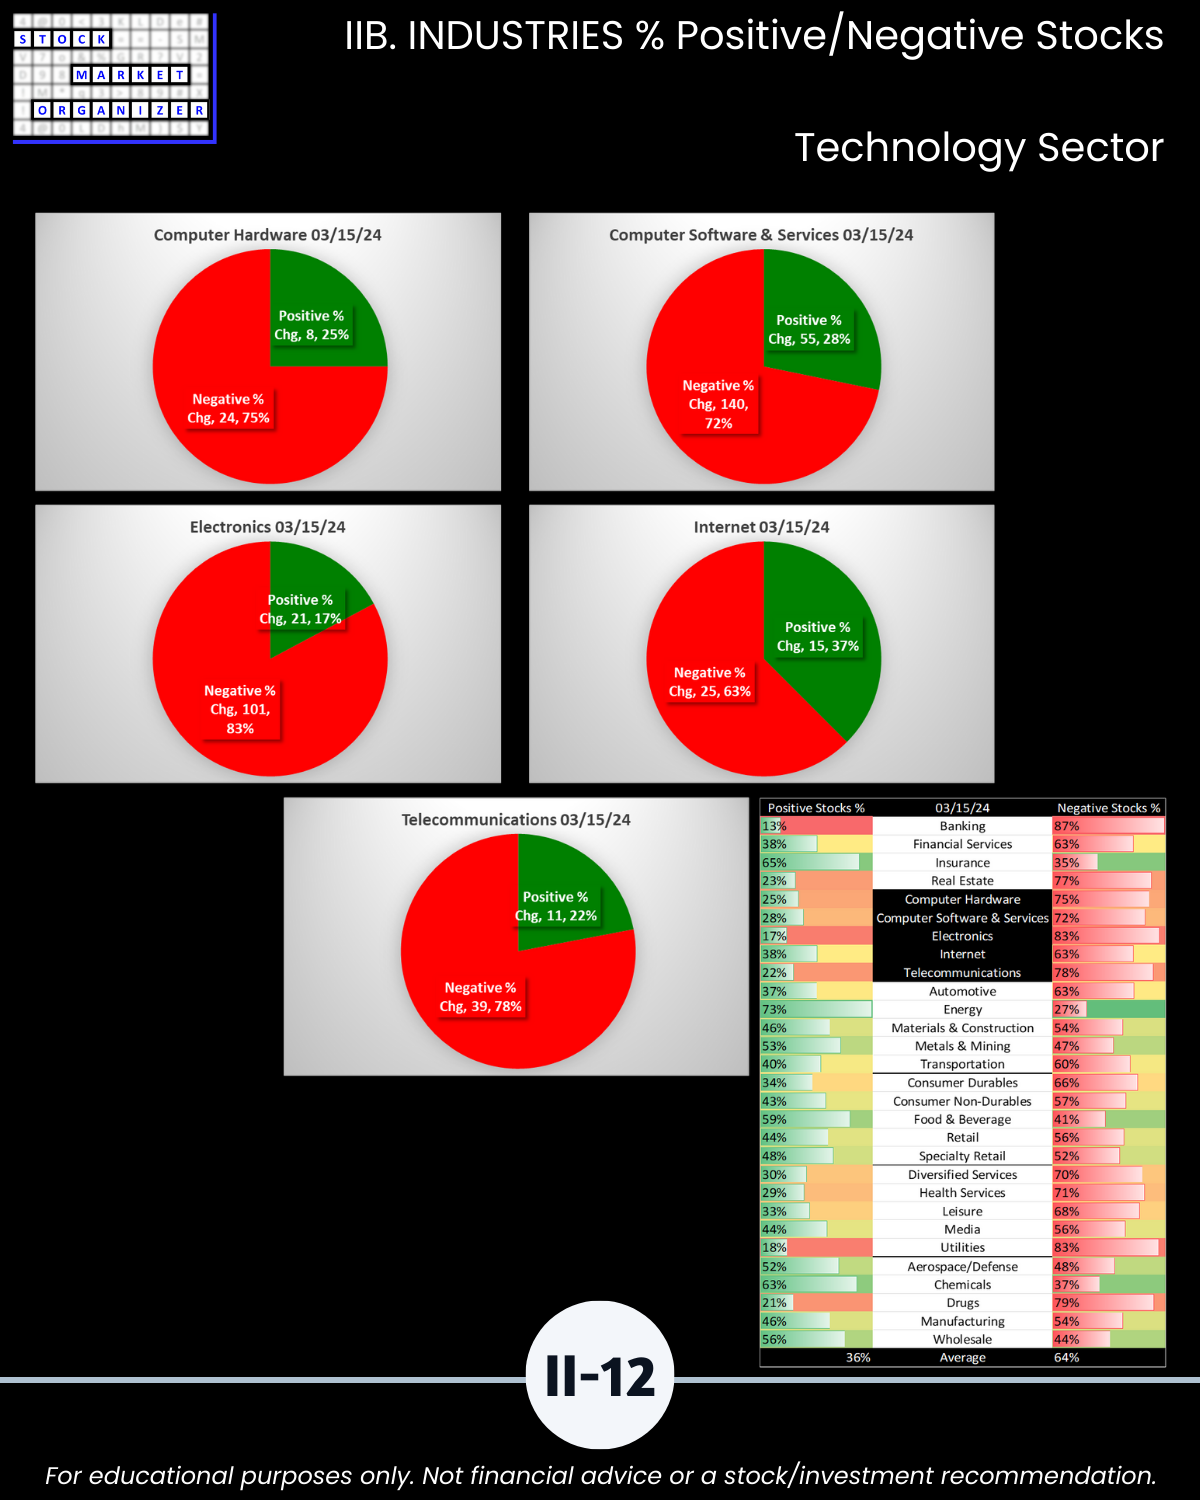
- Electronics 17%
- Utilities 18%
- Drugs 21%
- Telco 22%
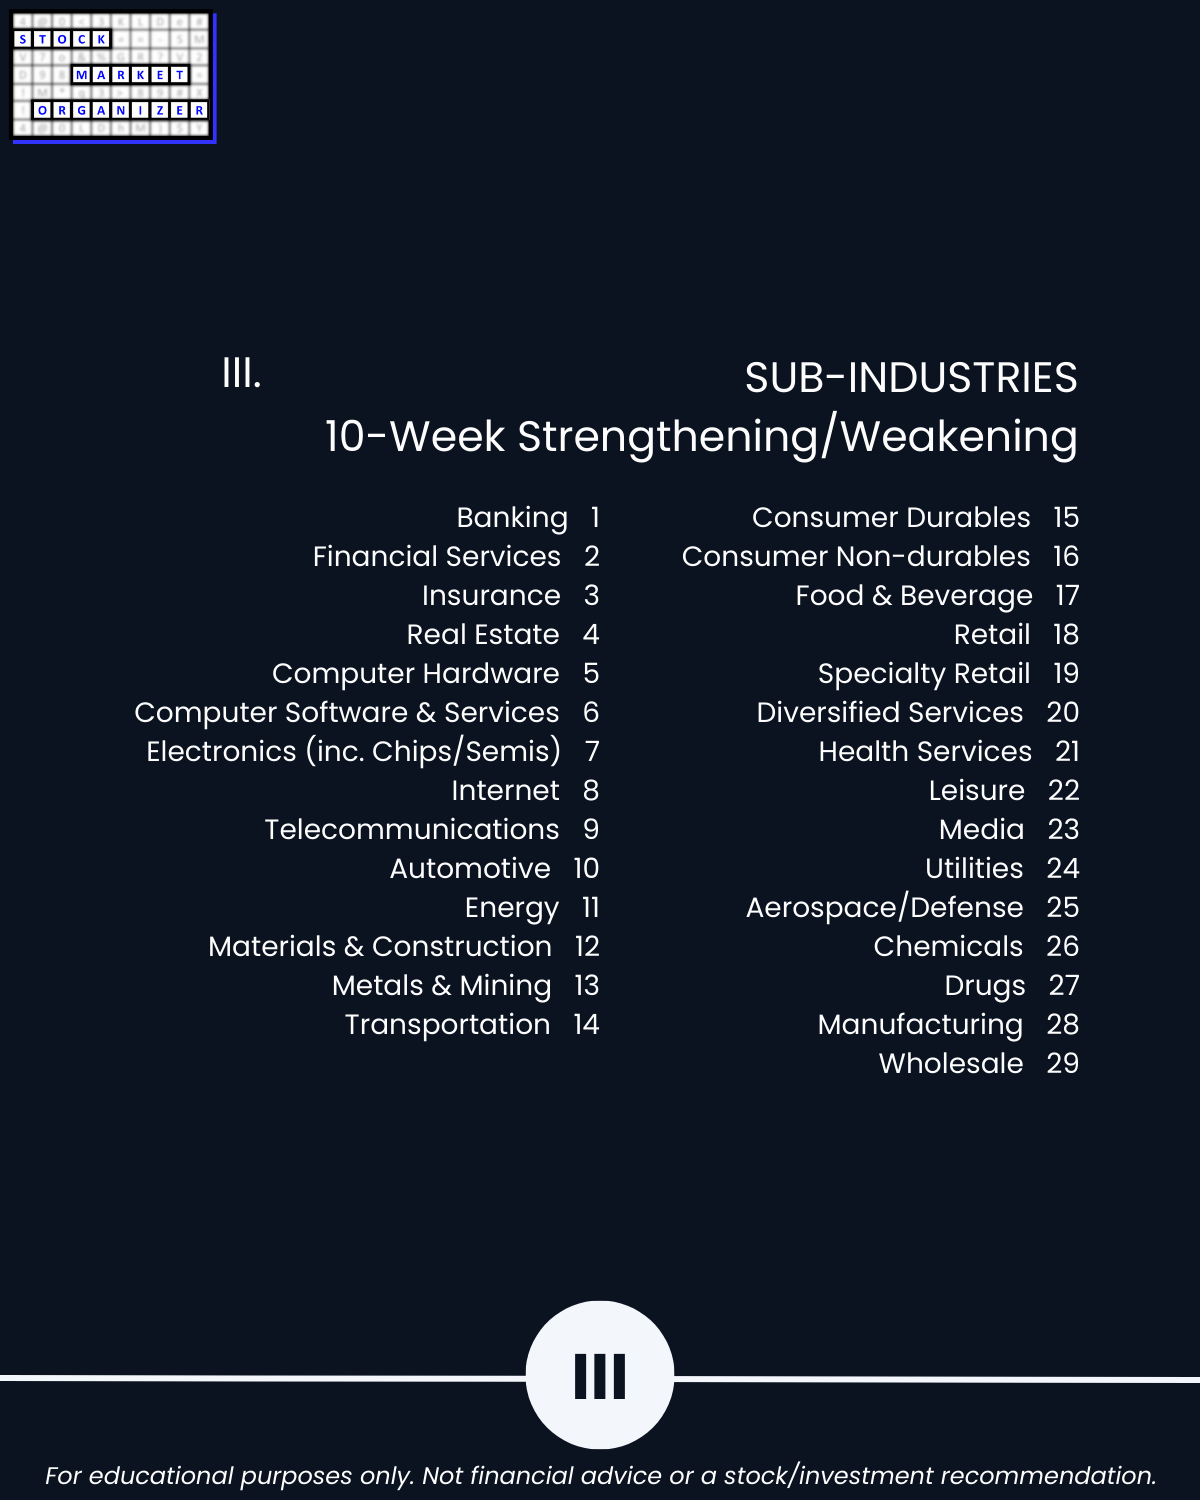
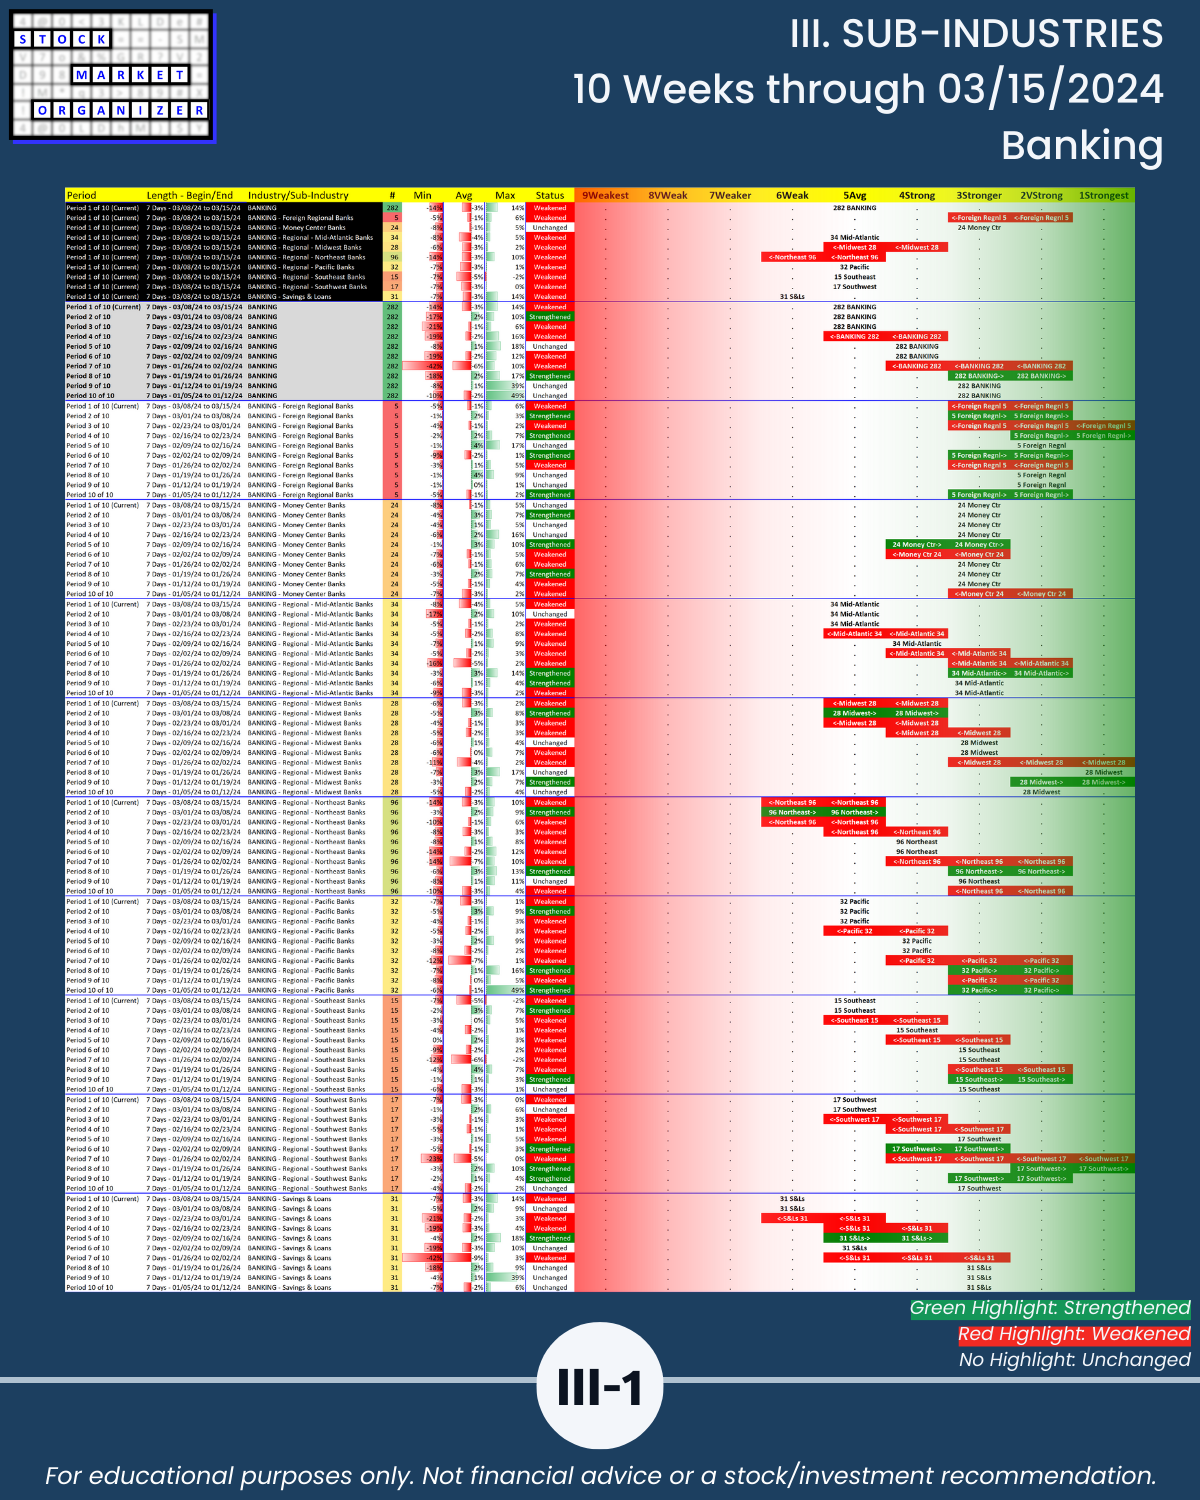
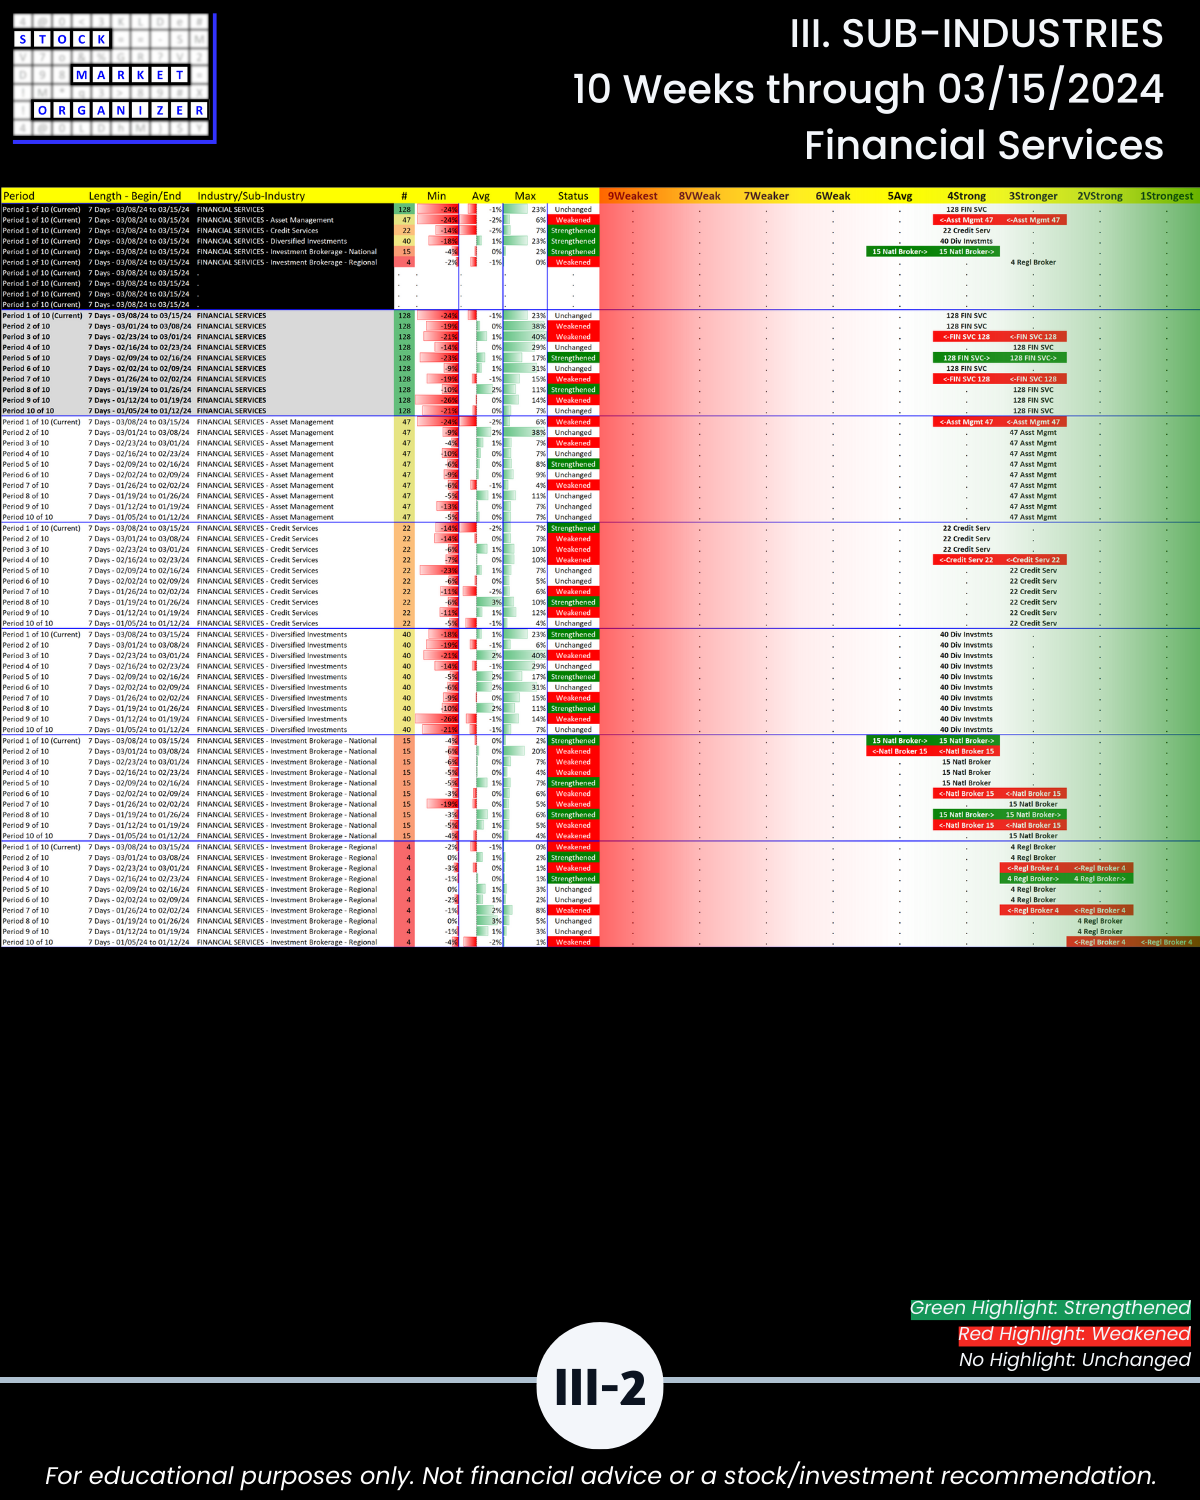
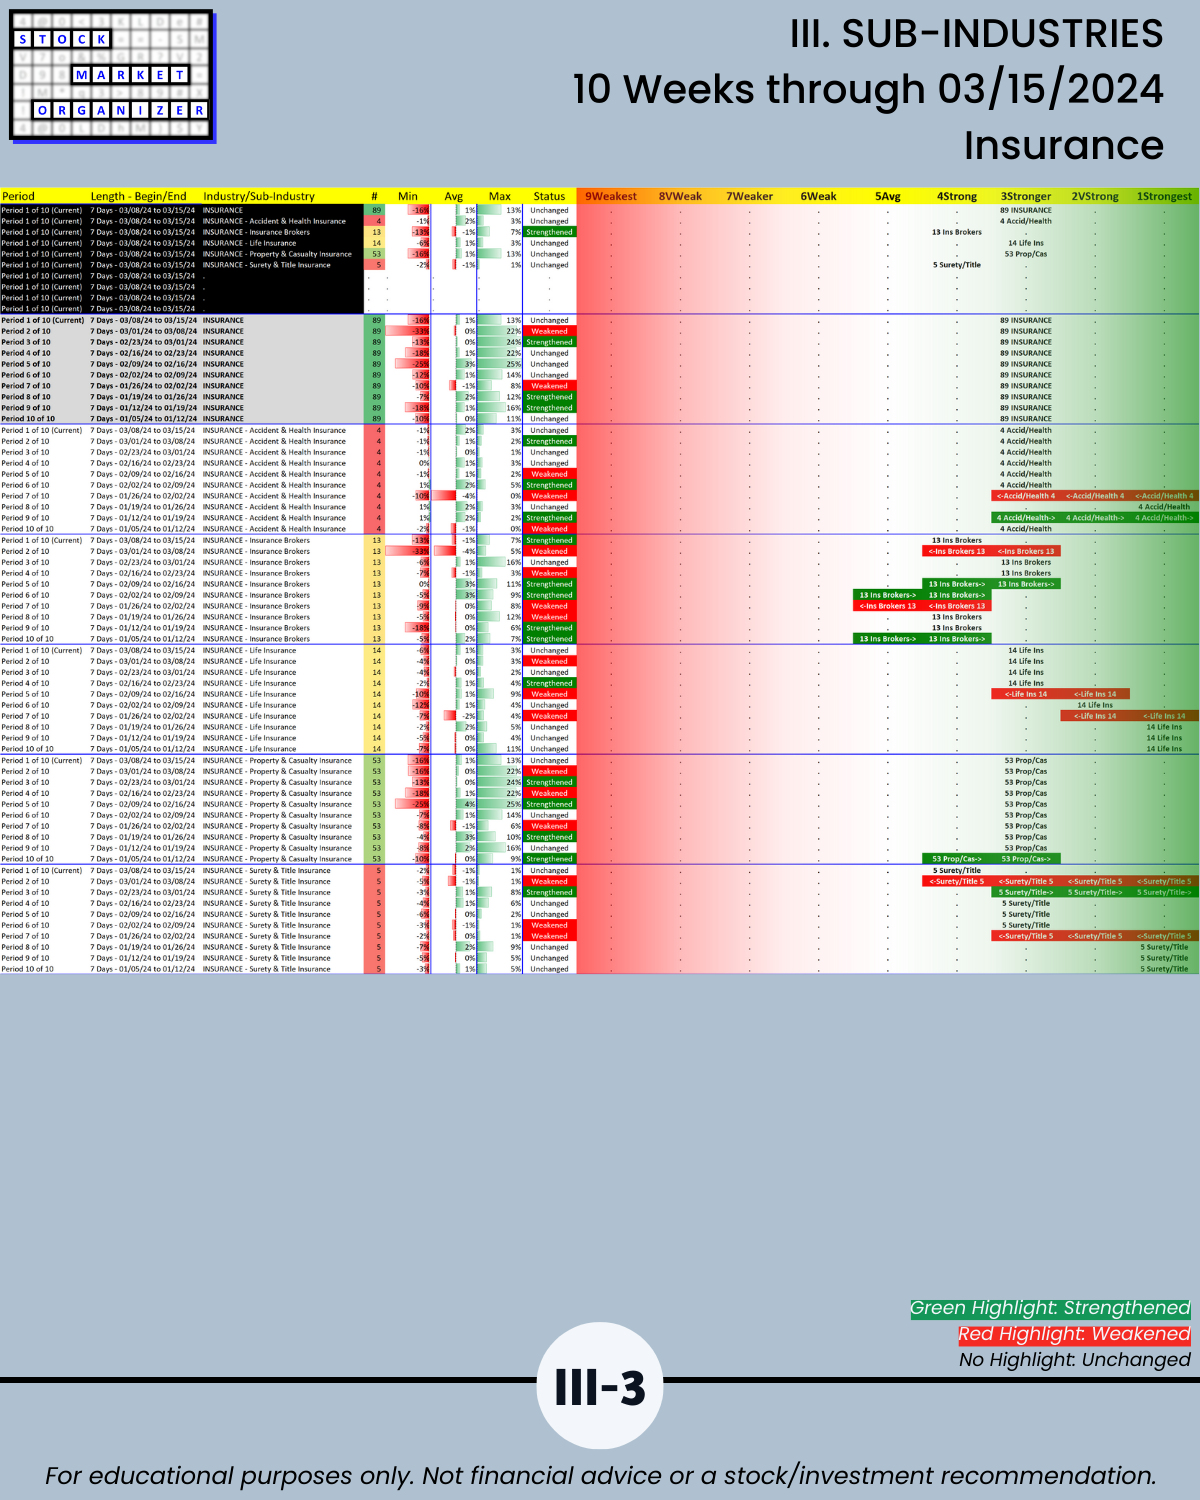
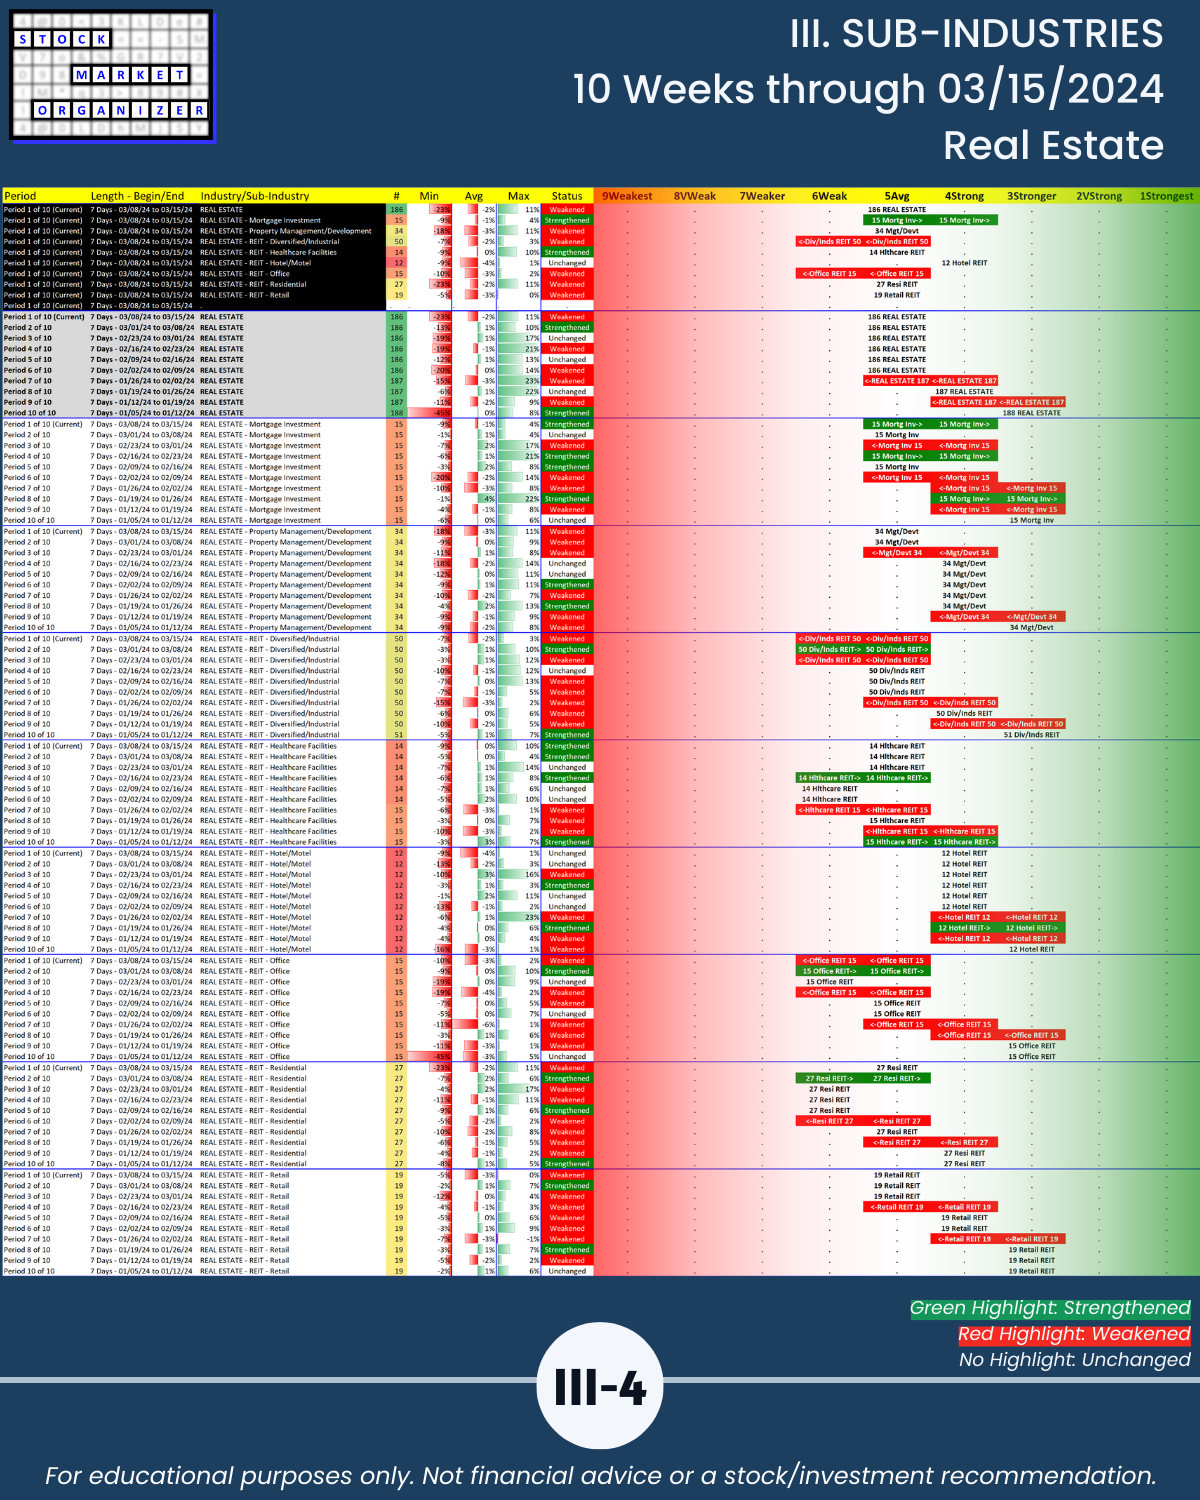
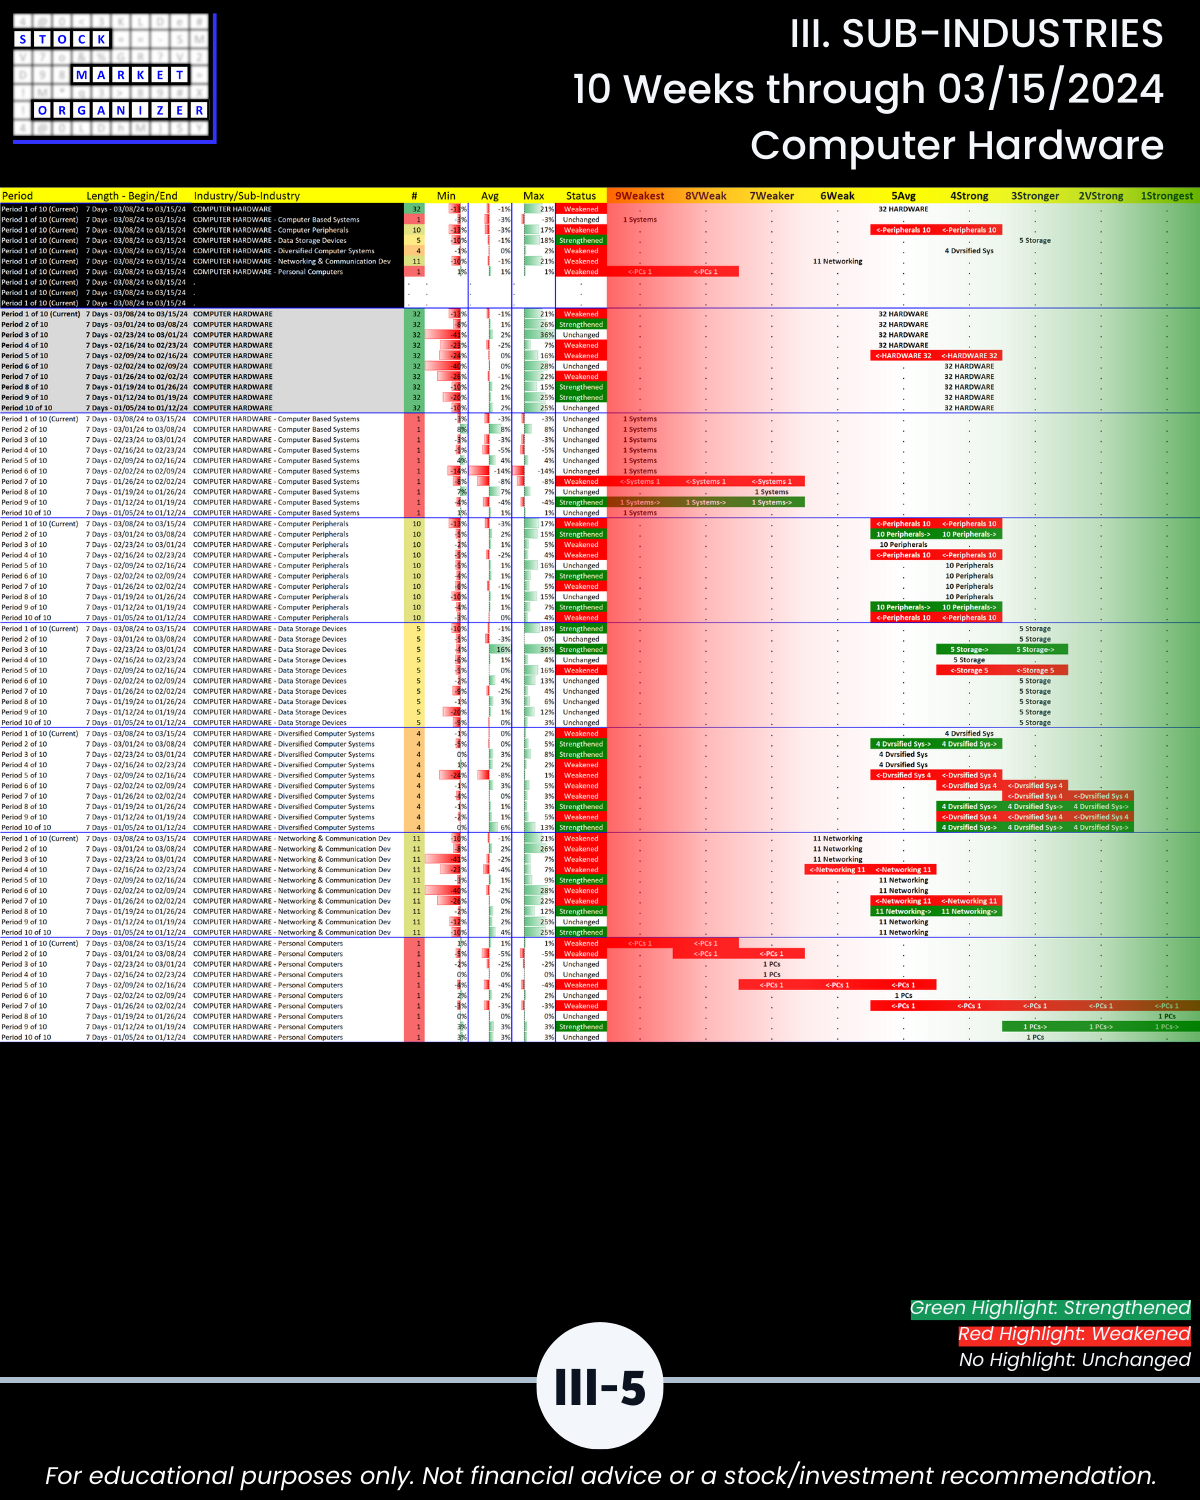
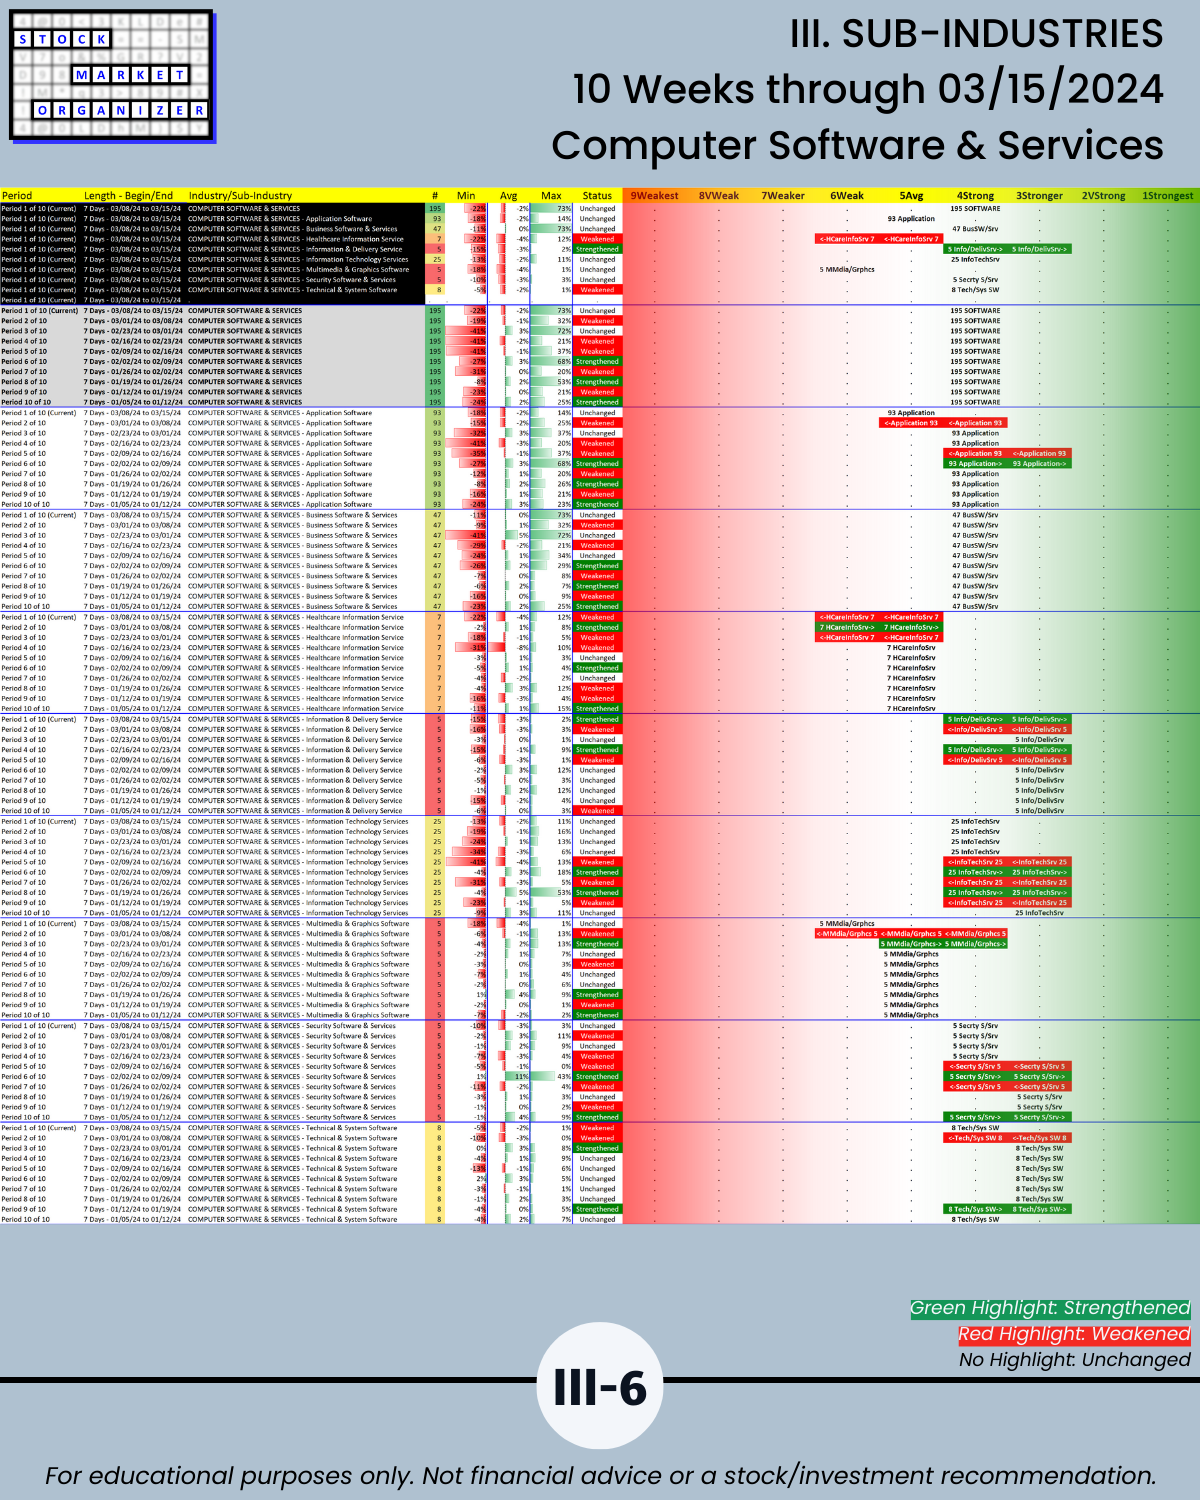
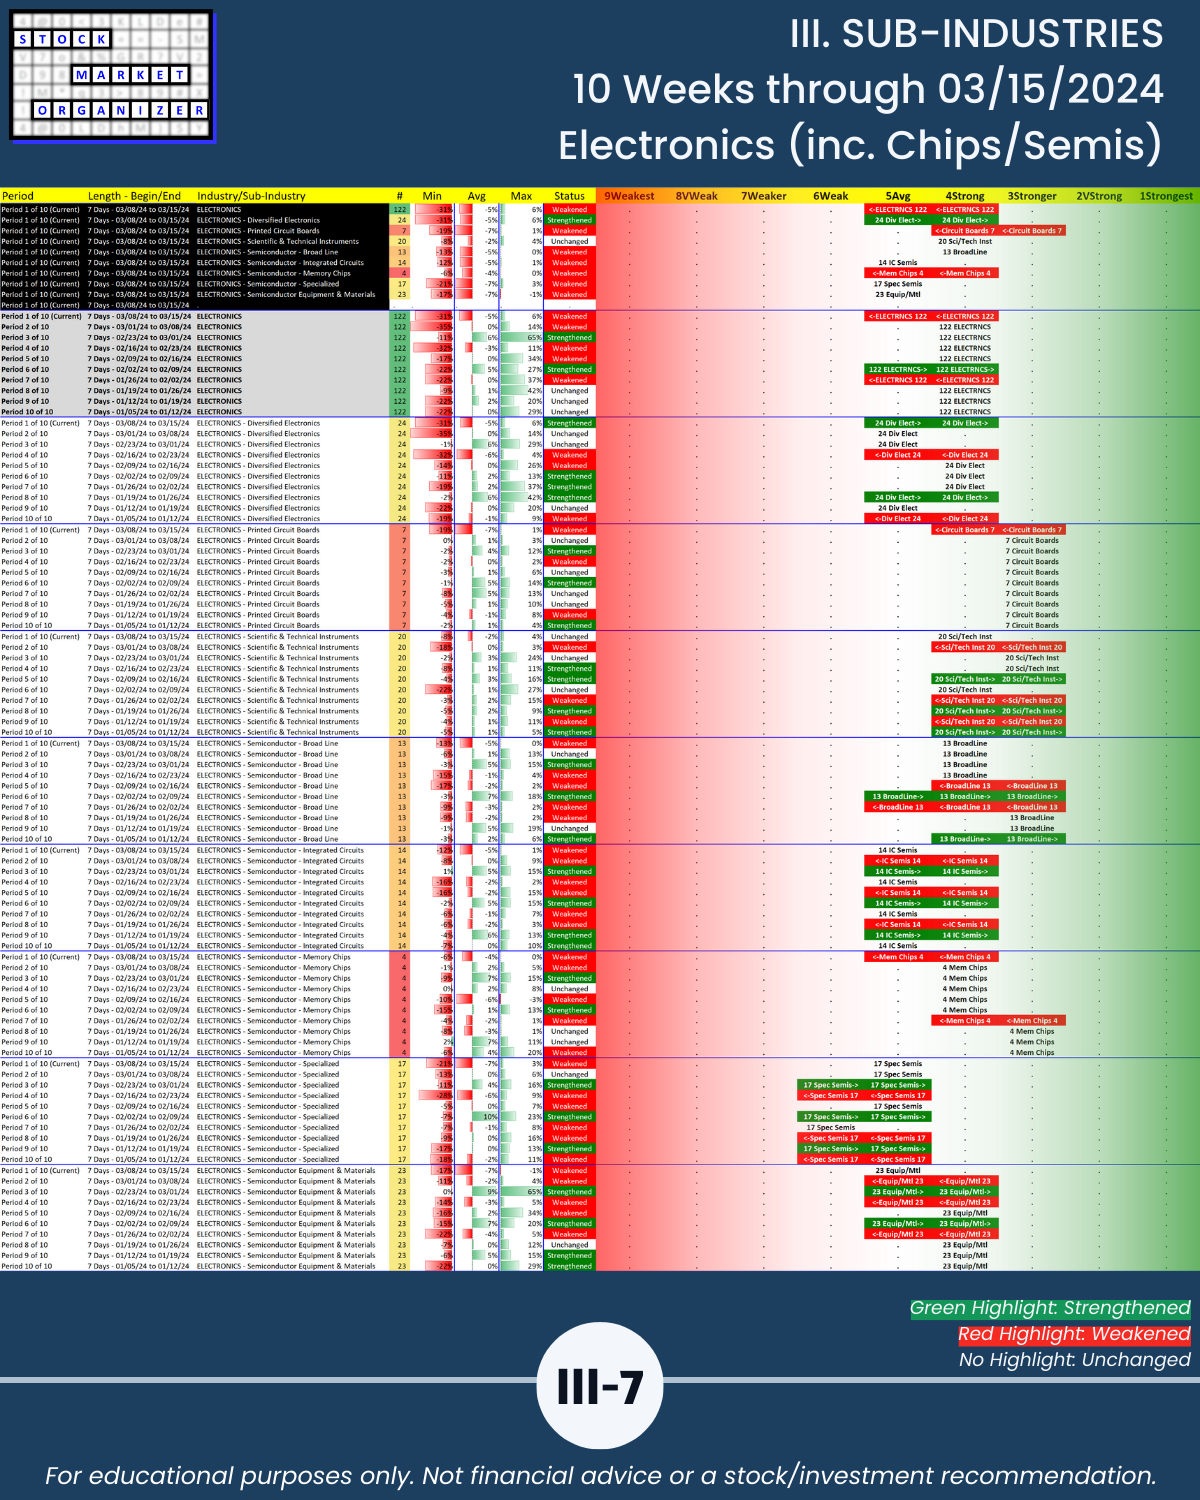
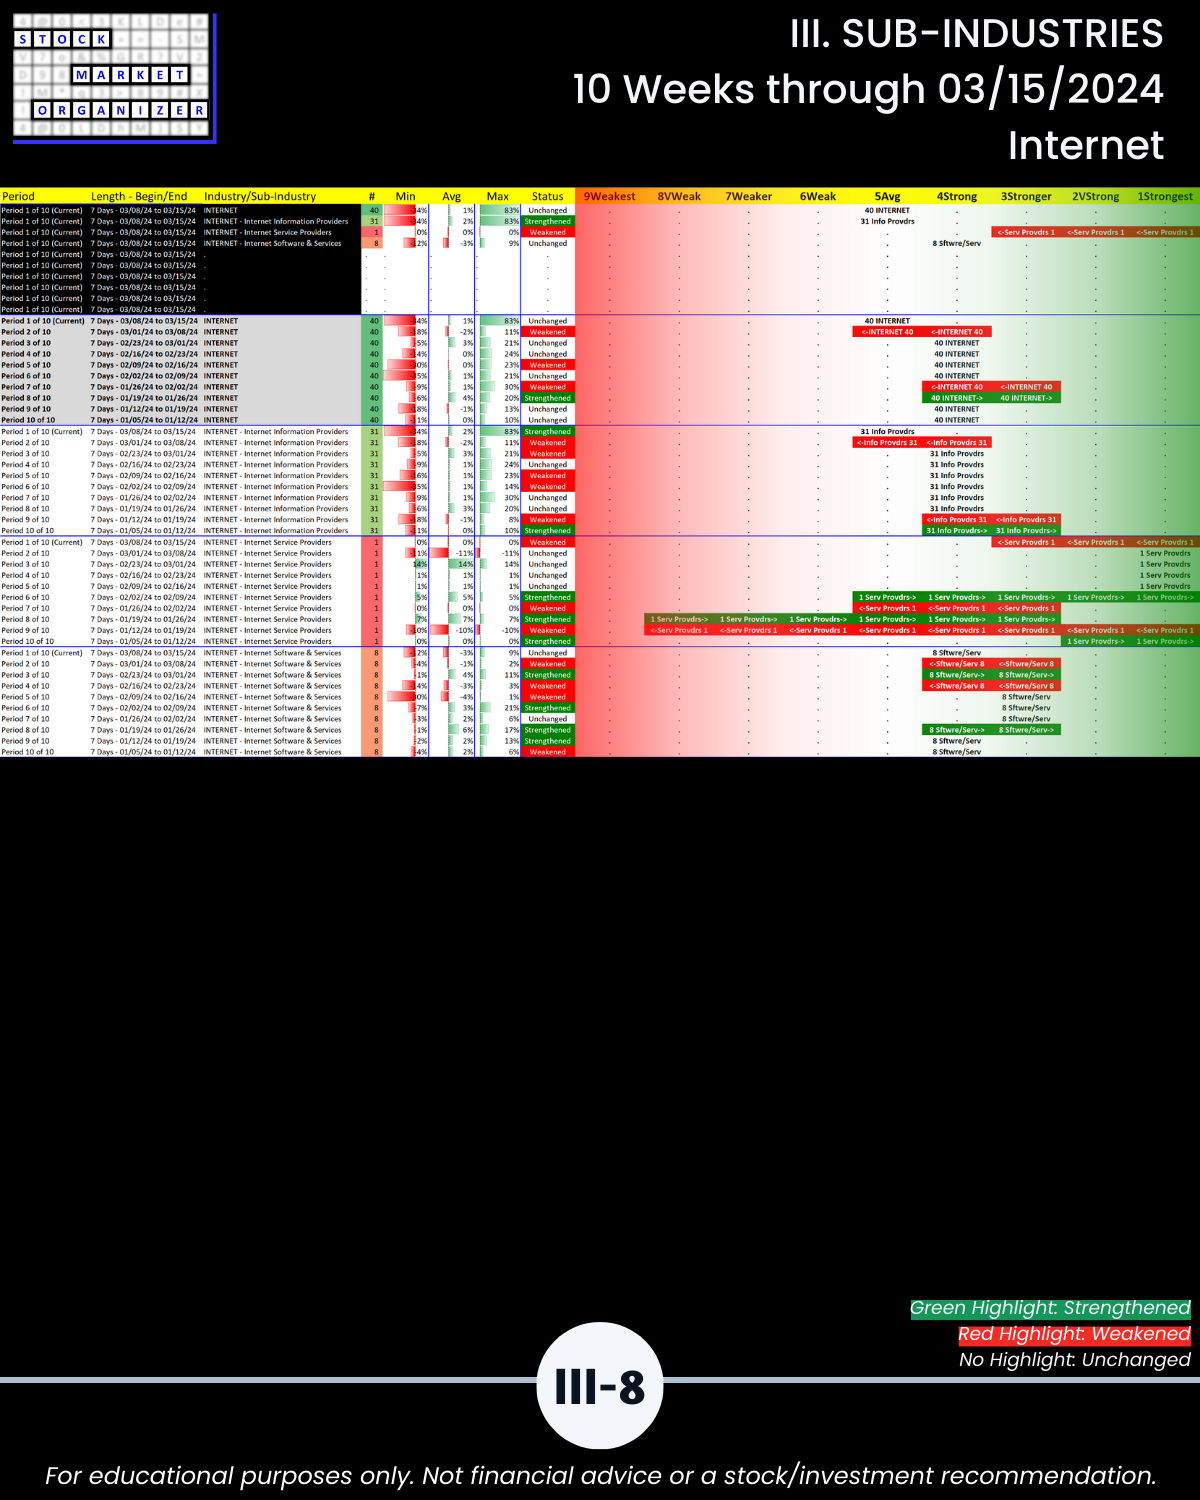
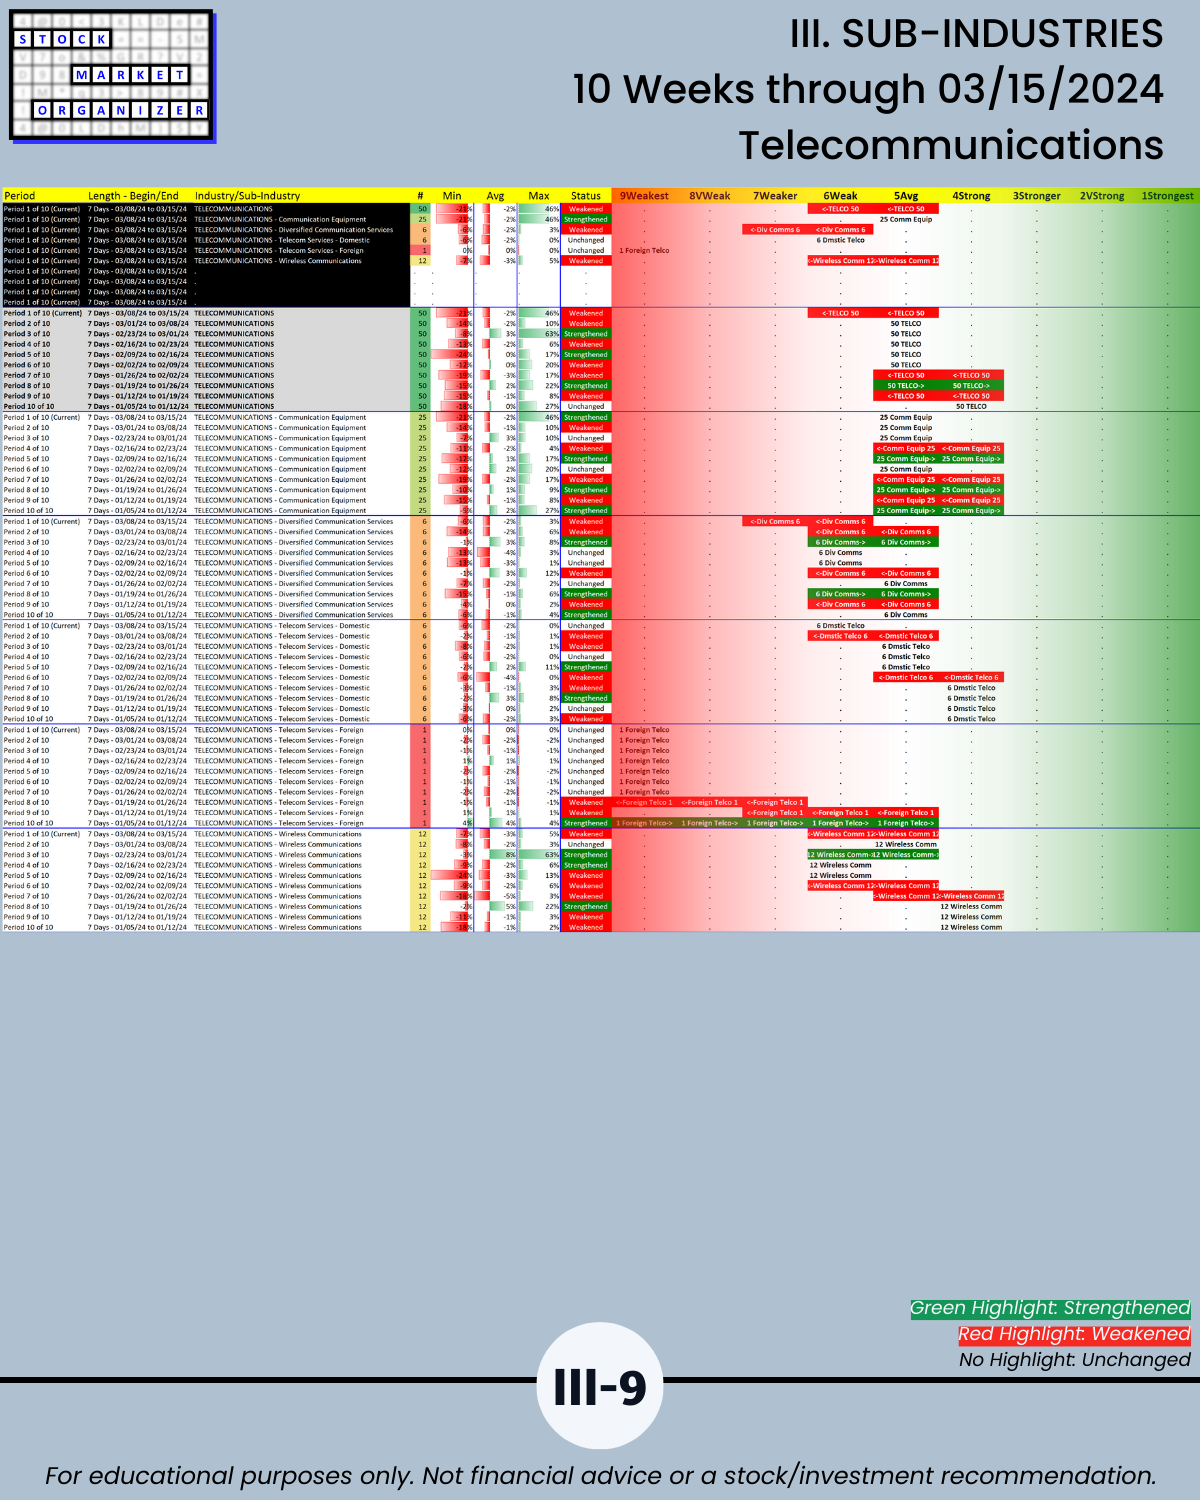
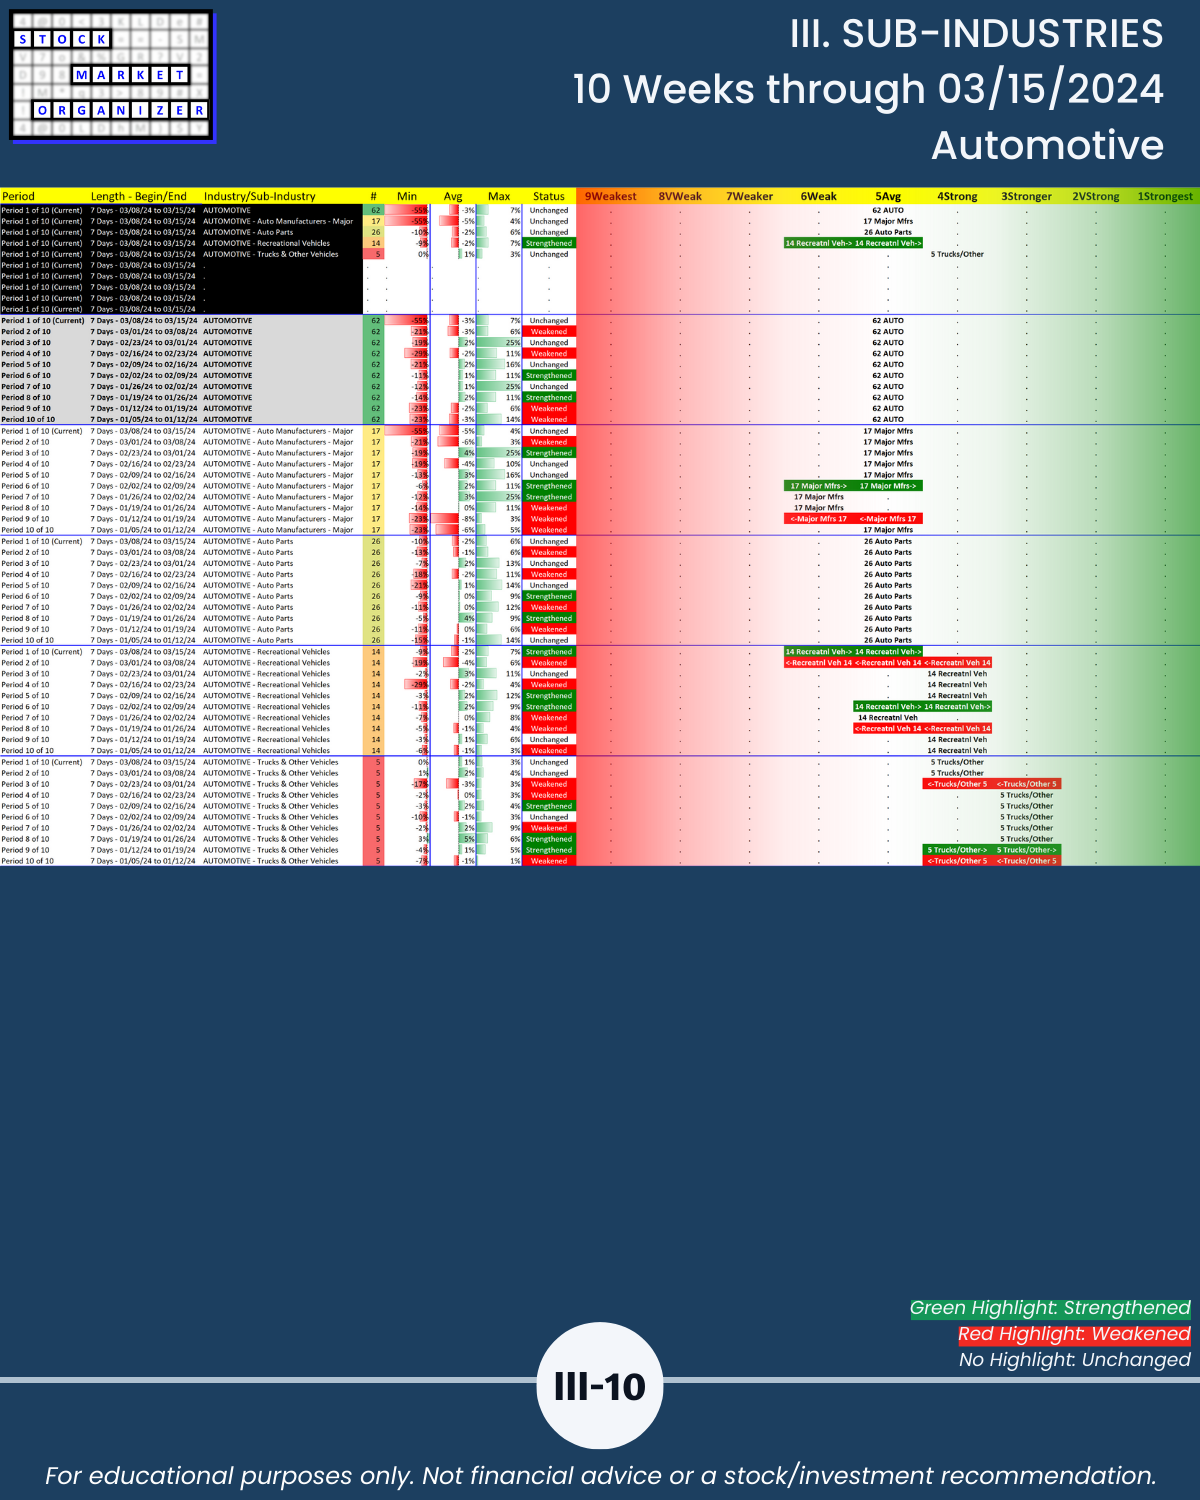
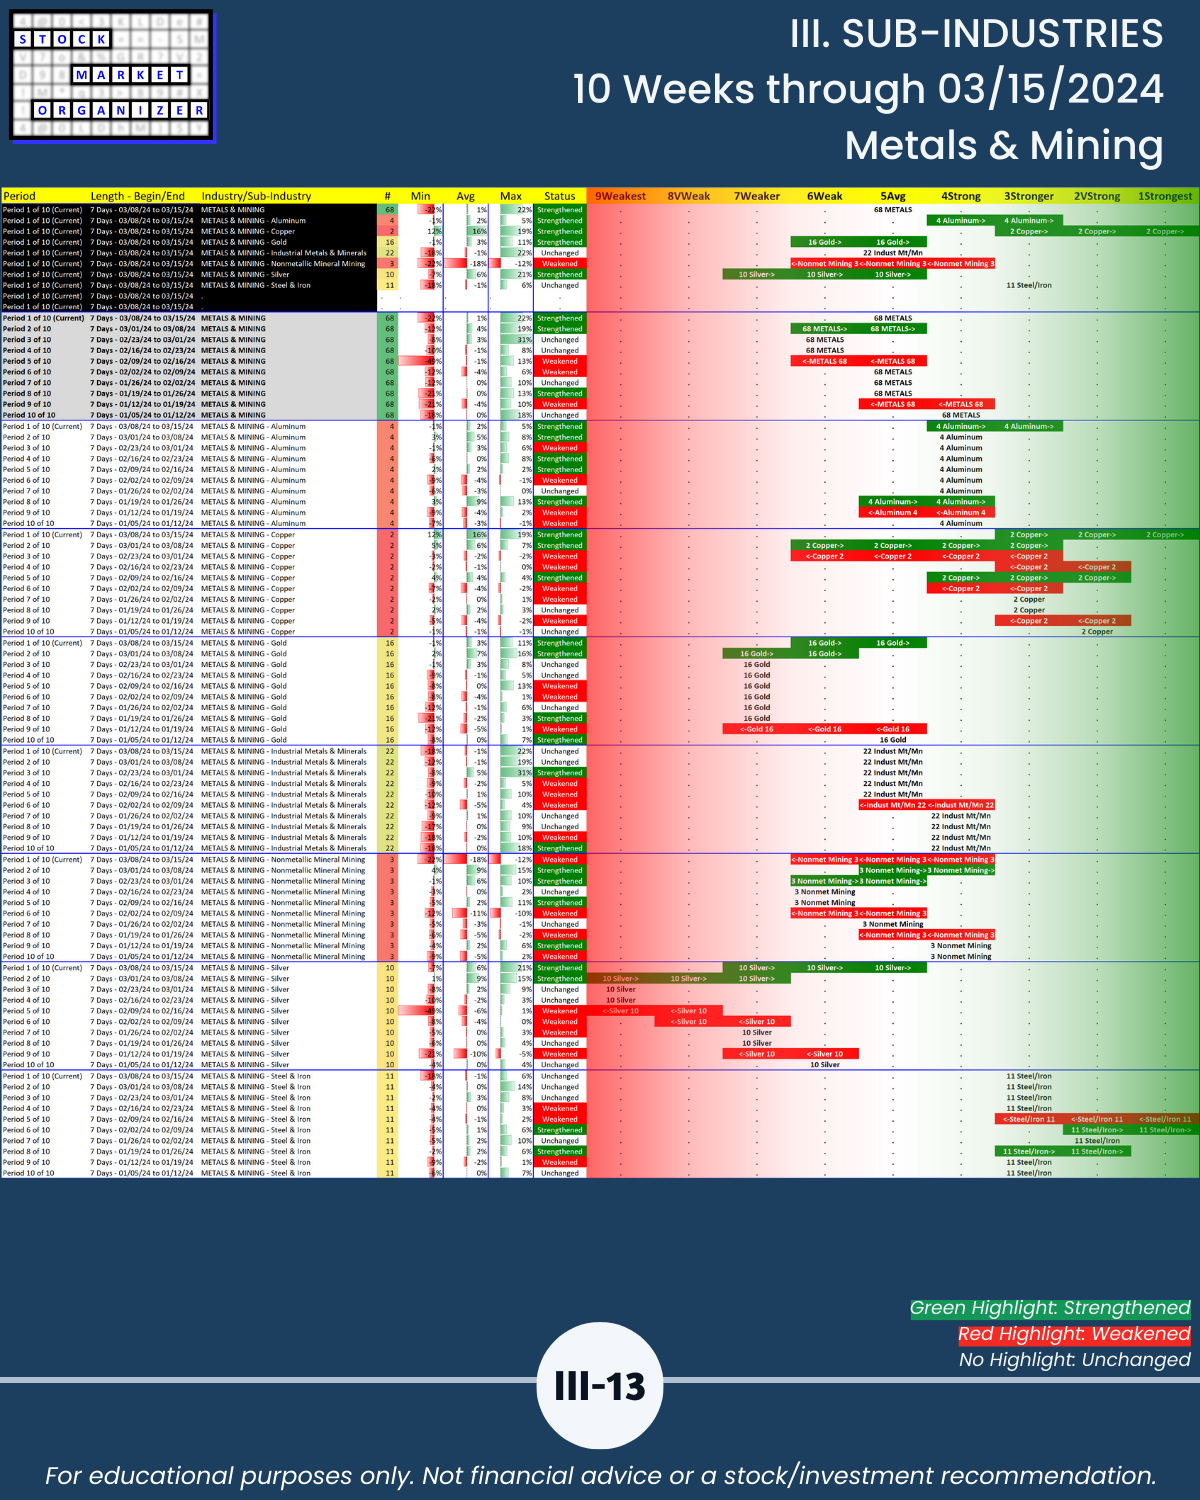
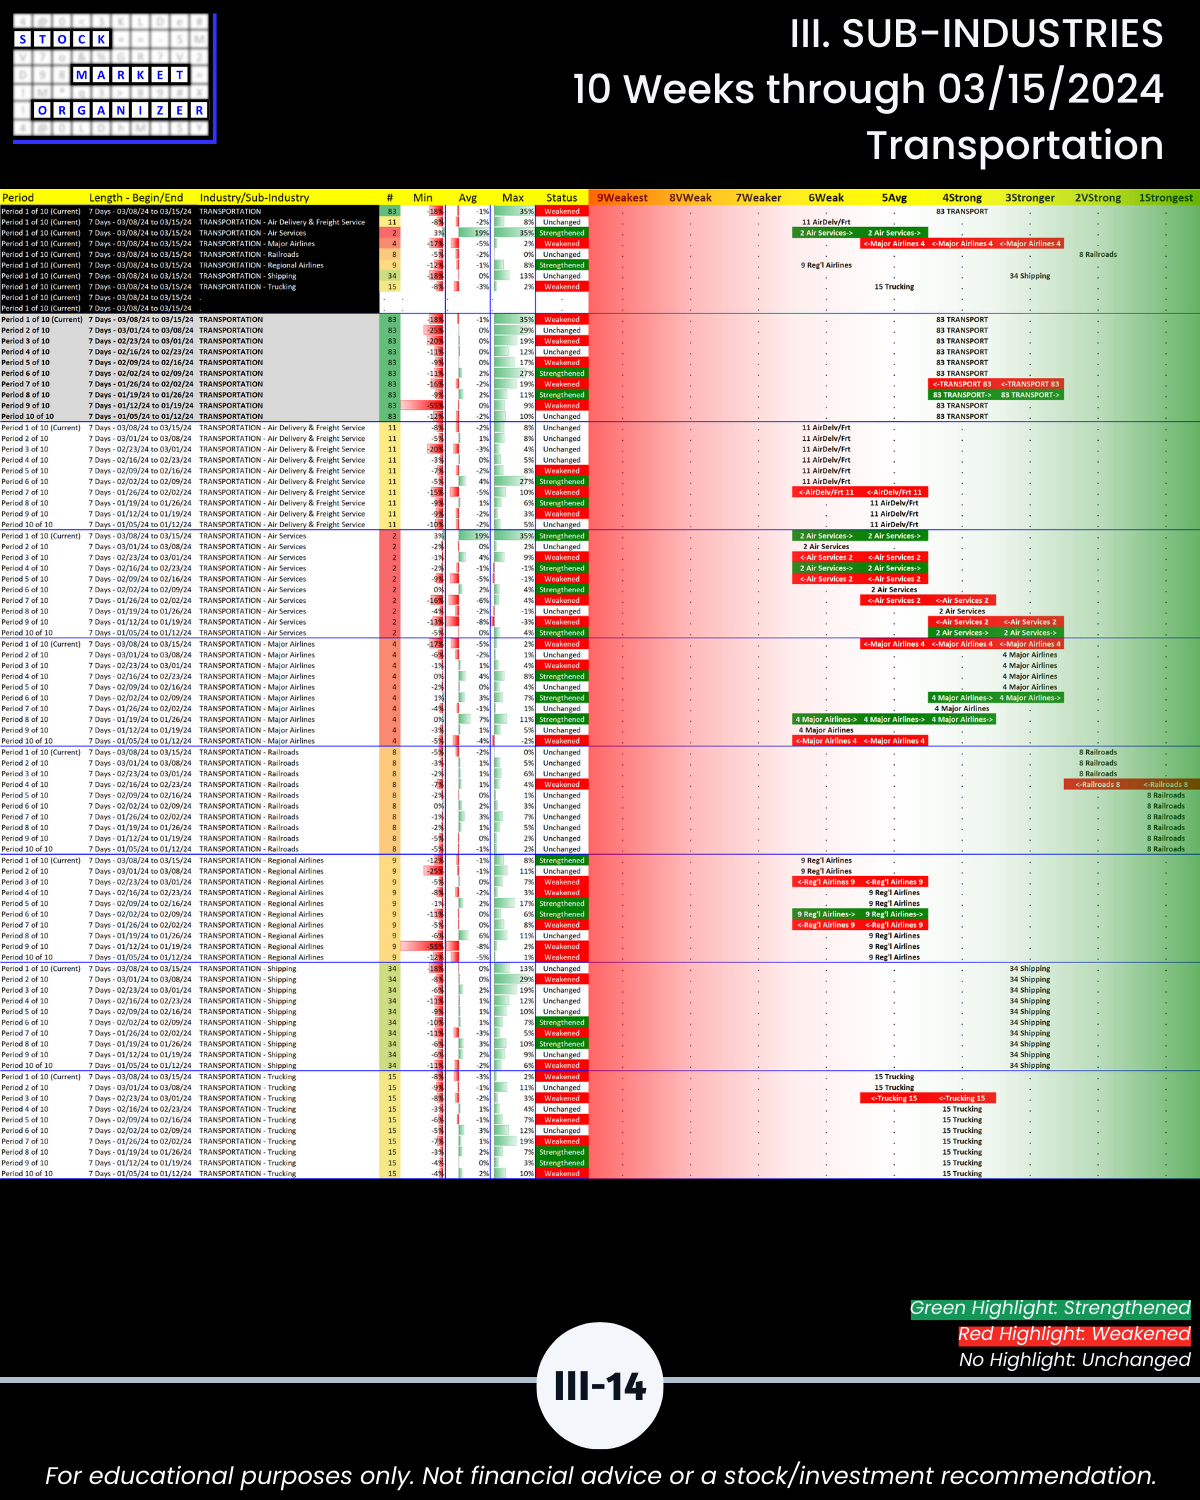
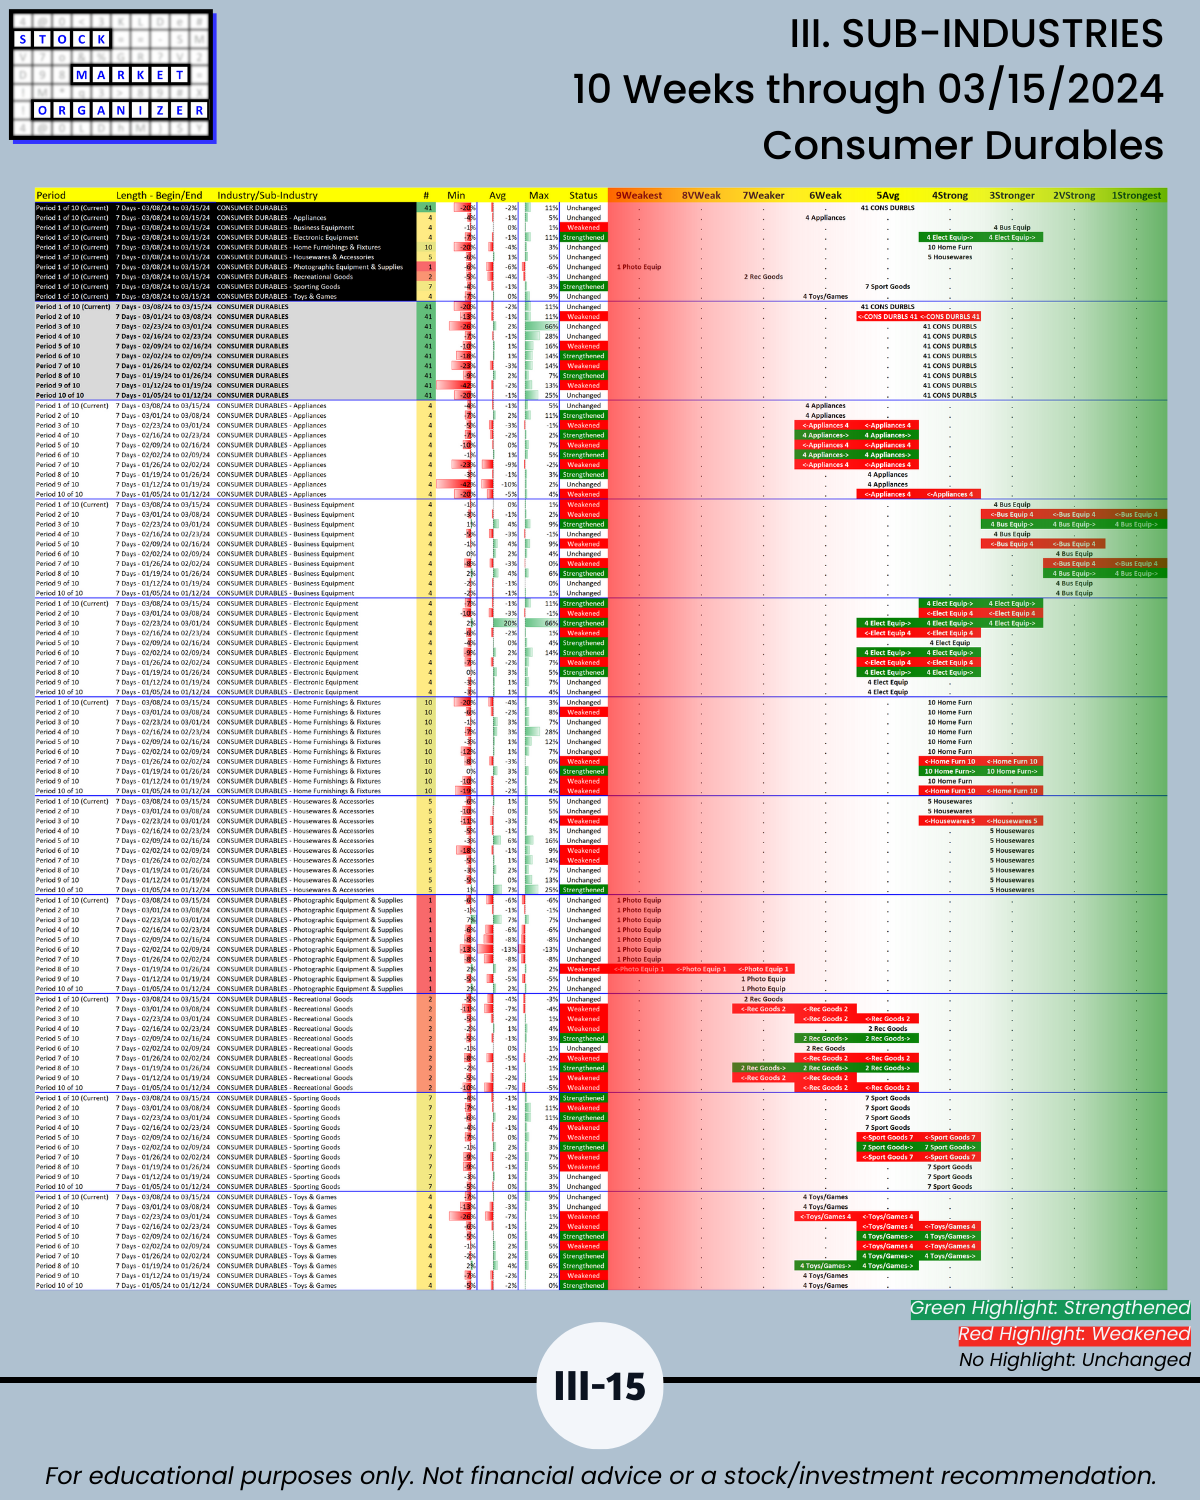
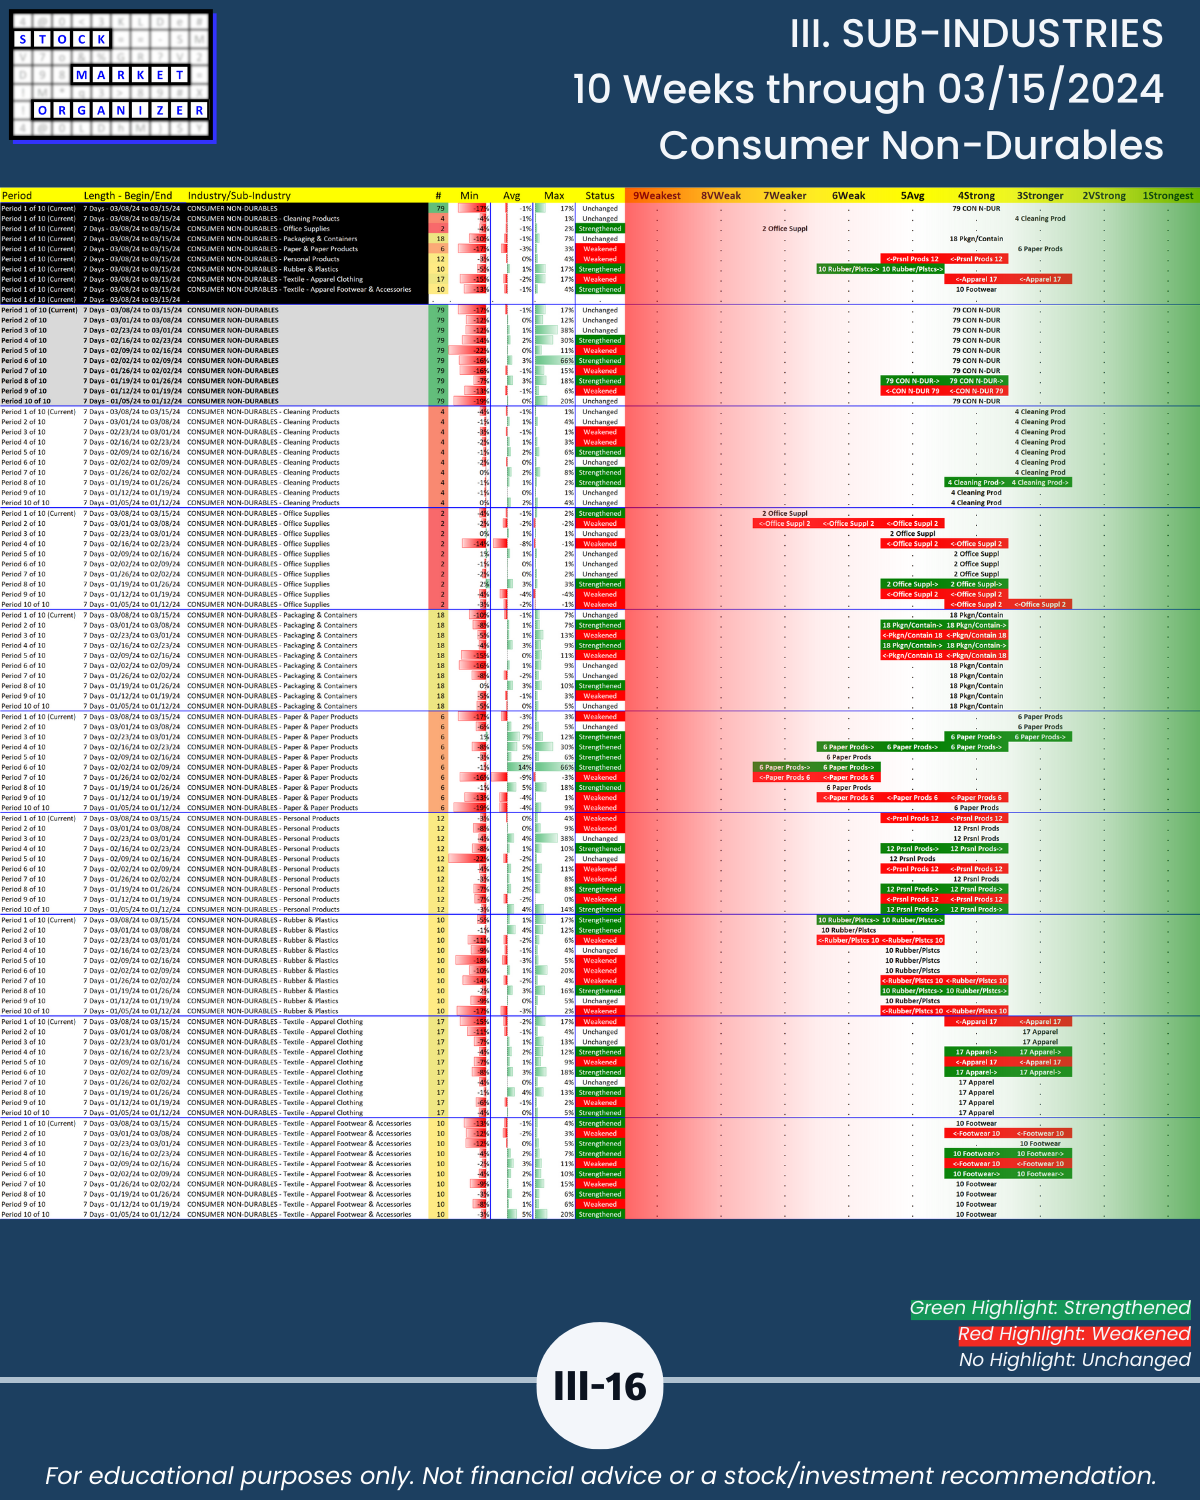
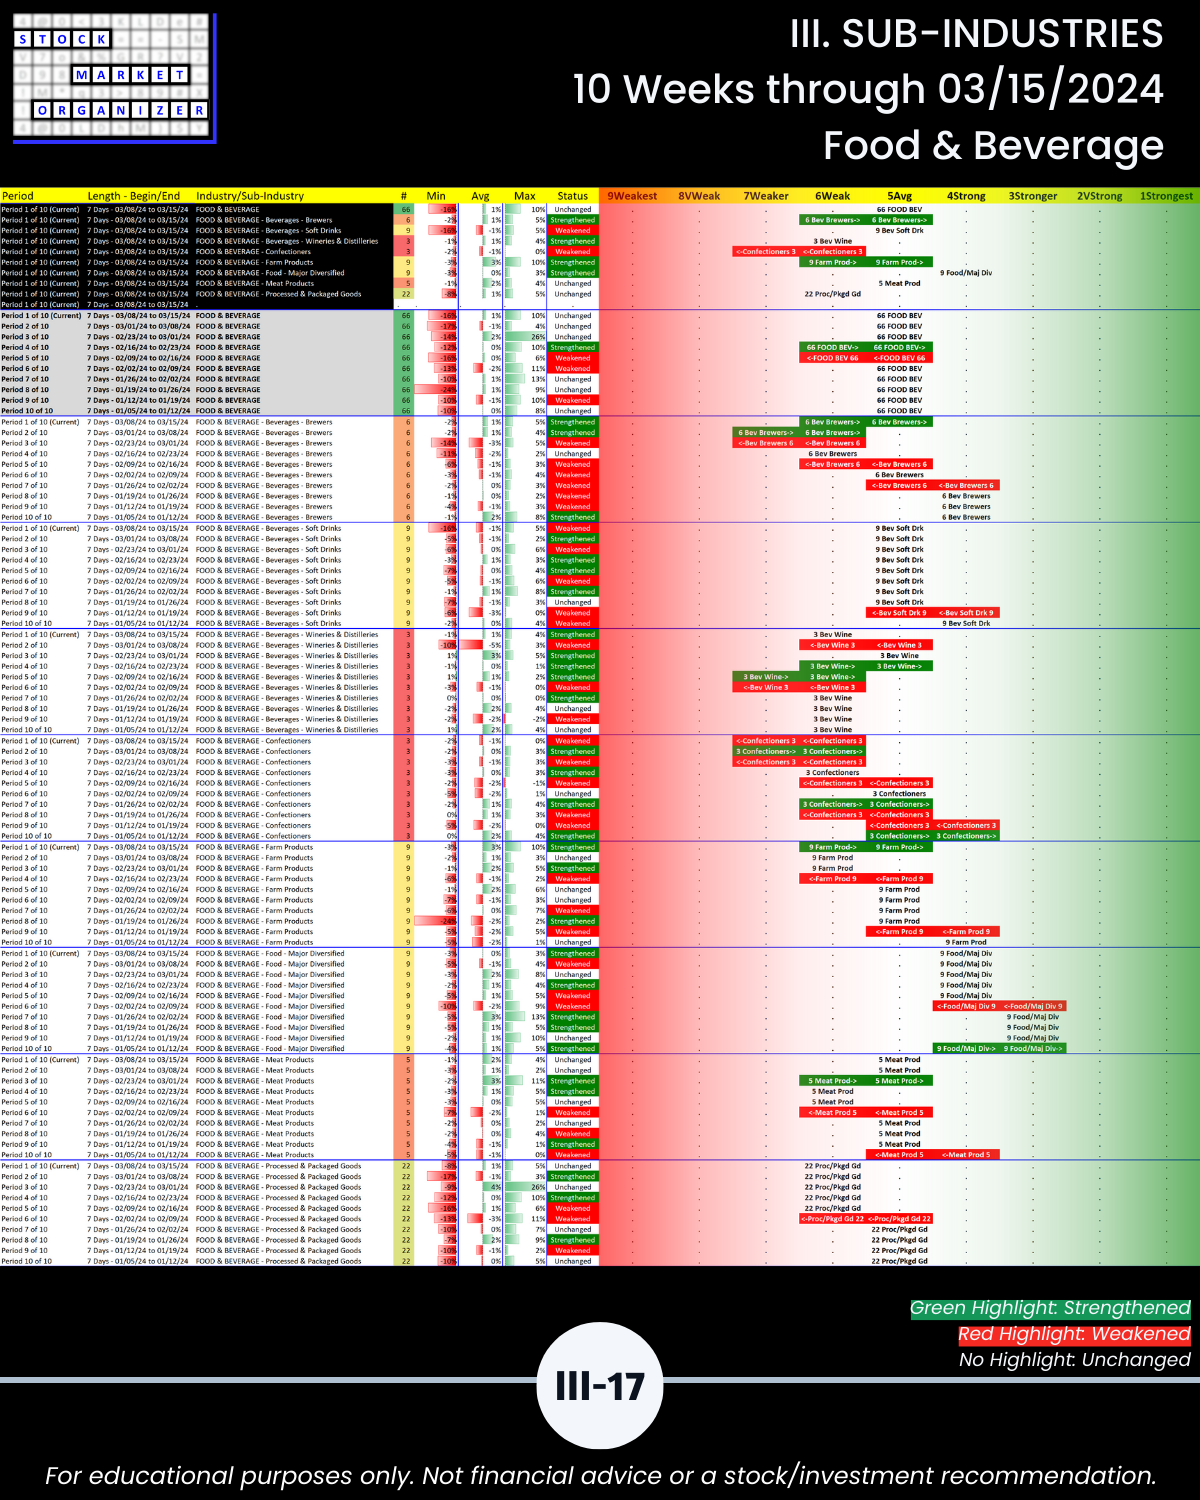
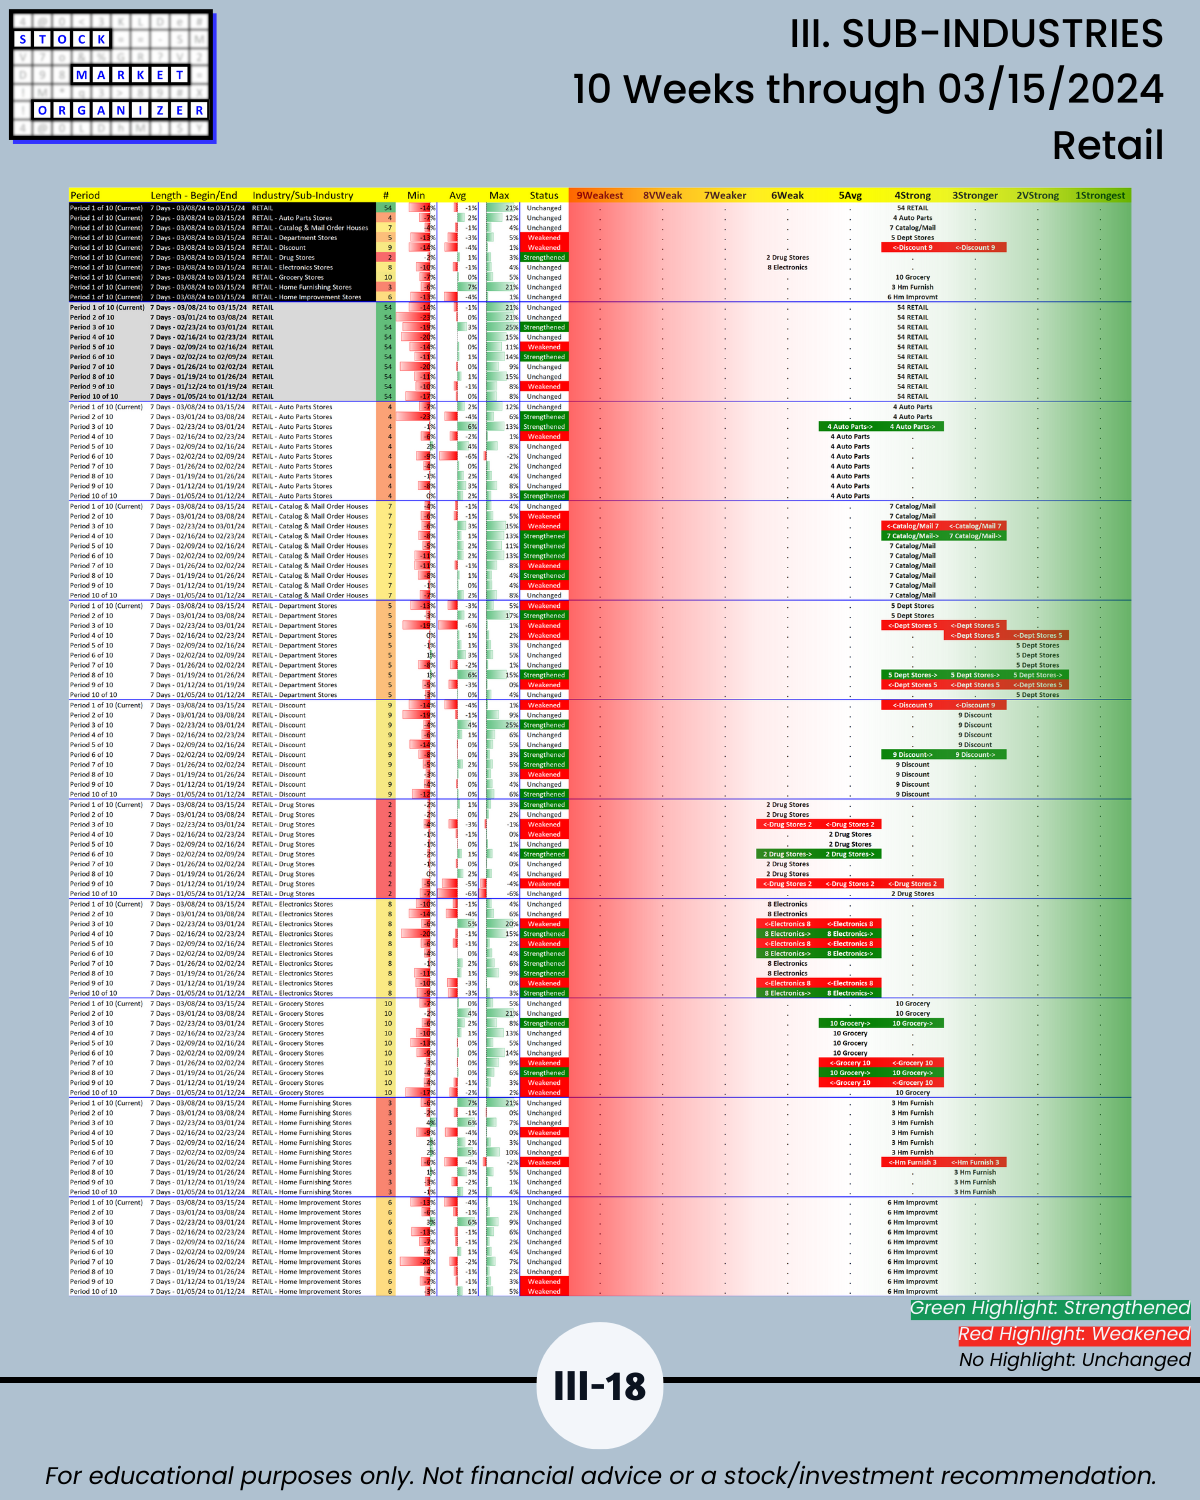
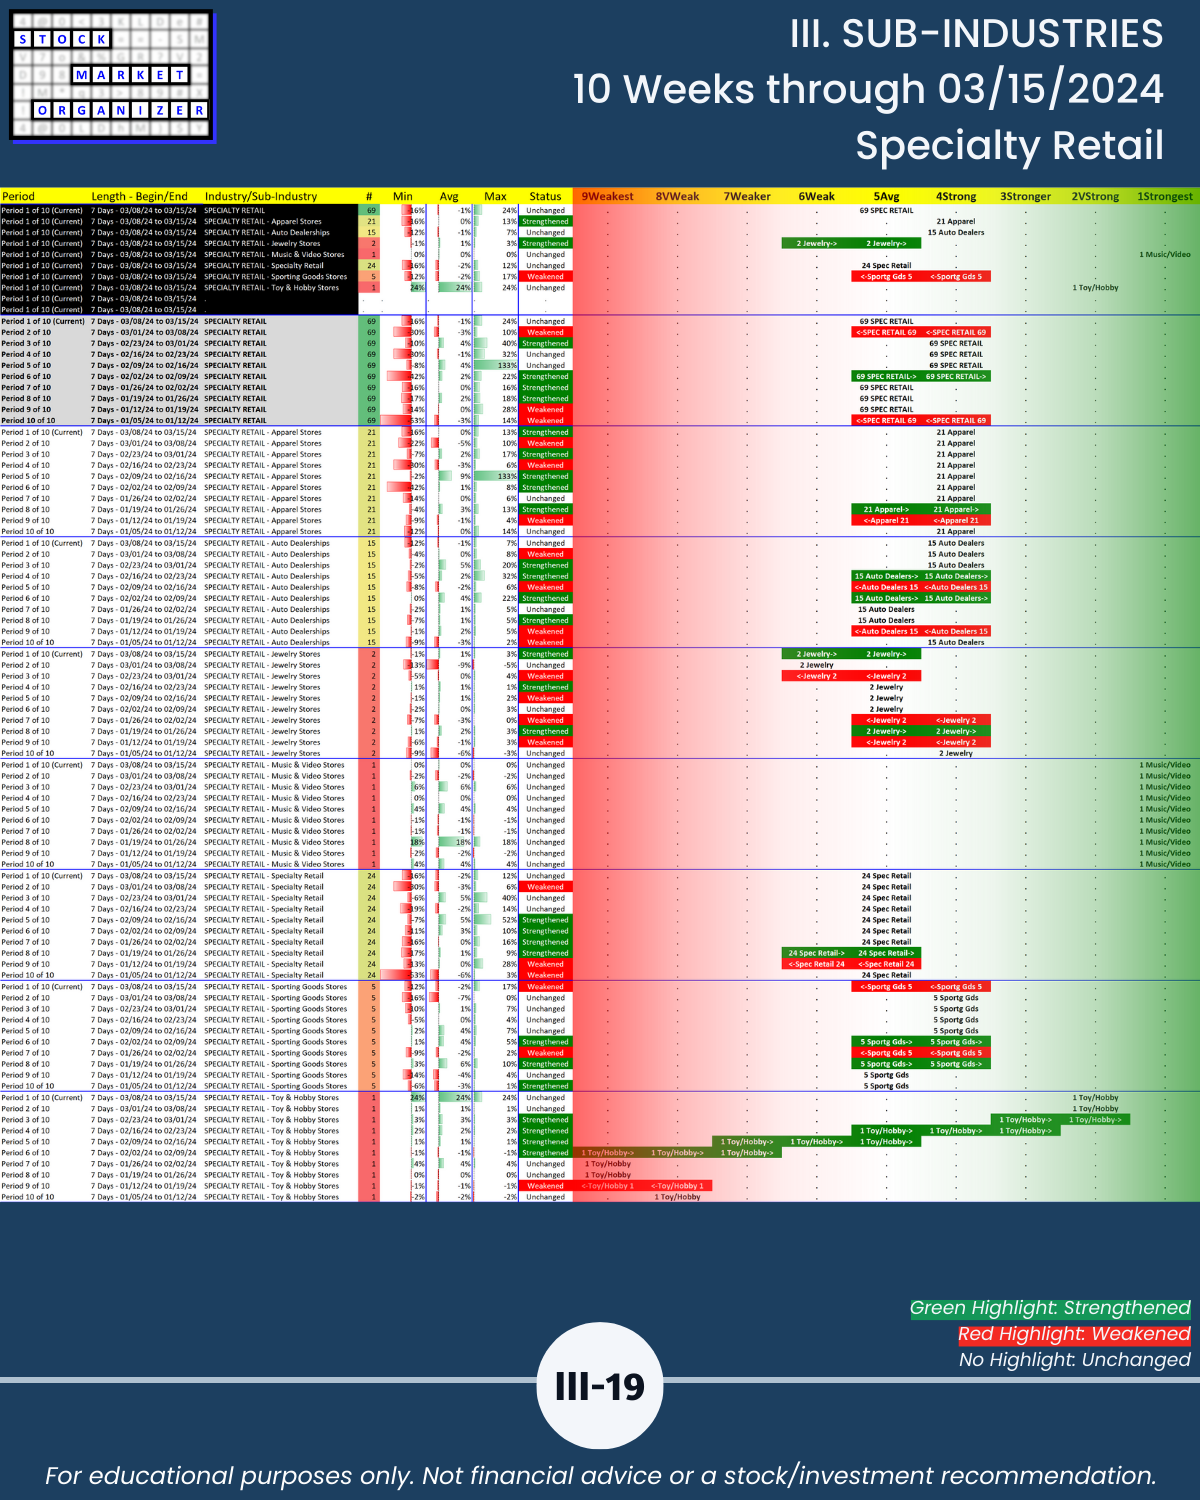
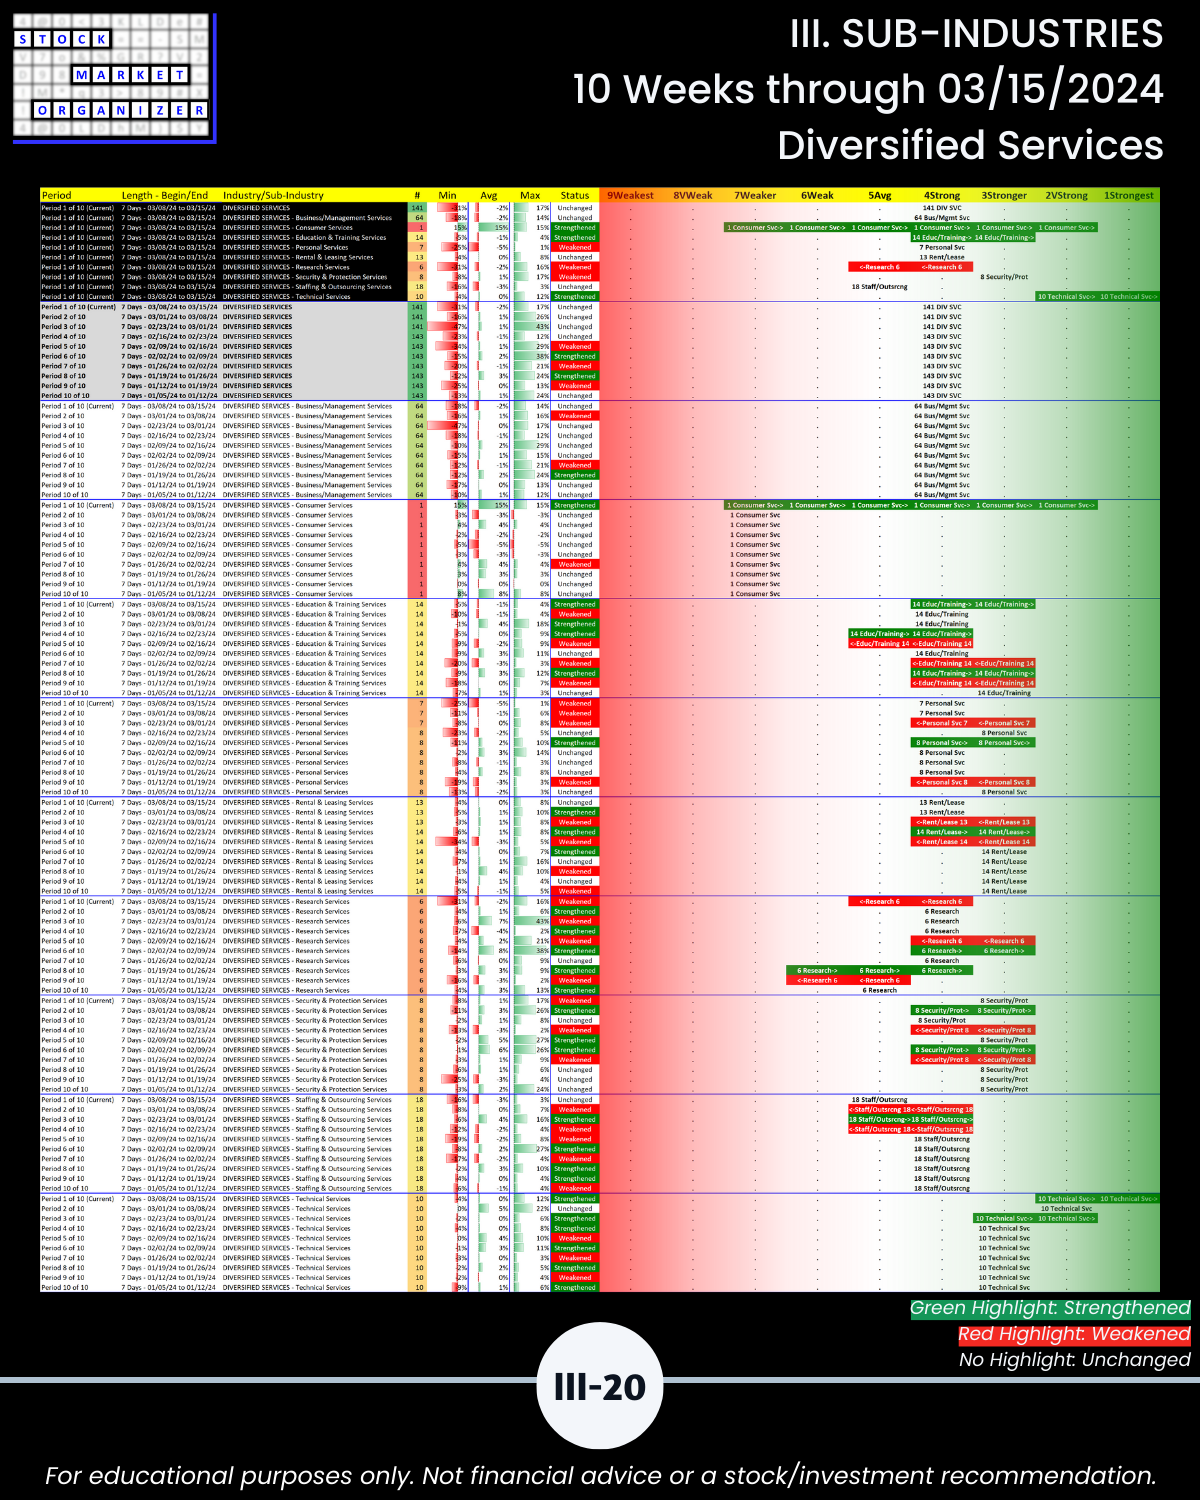
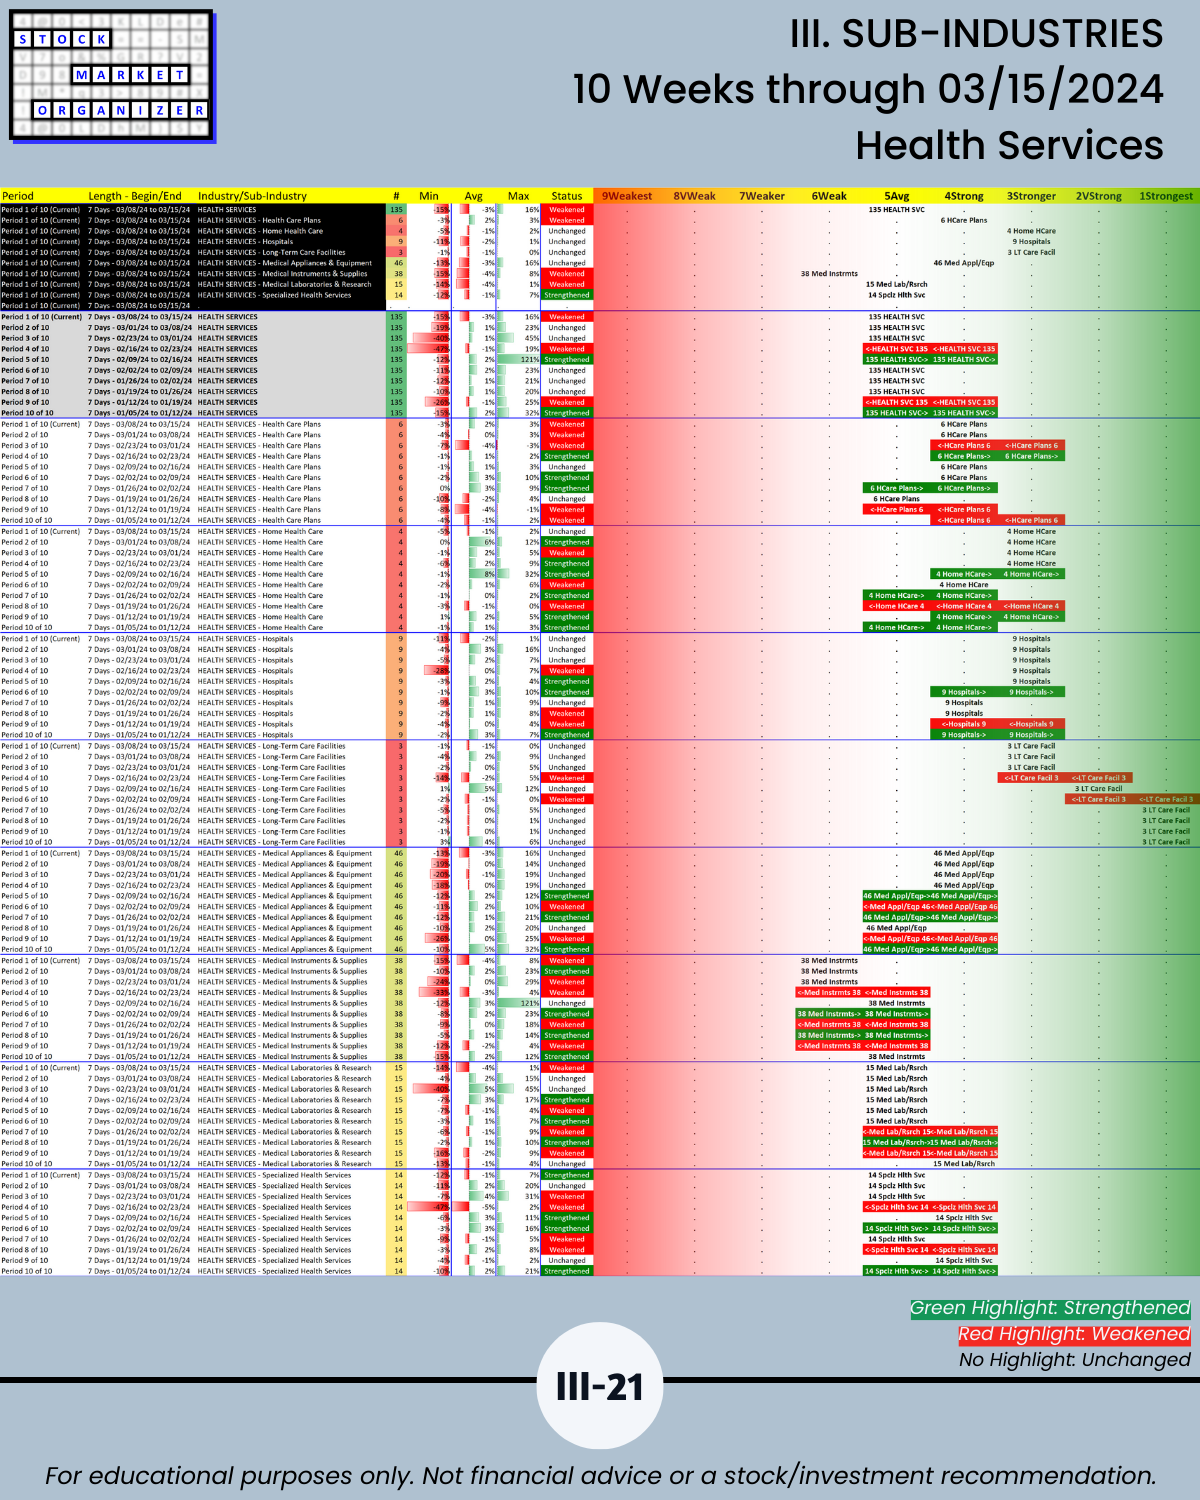
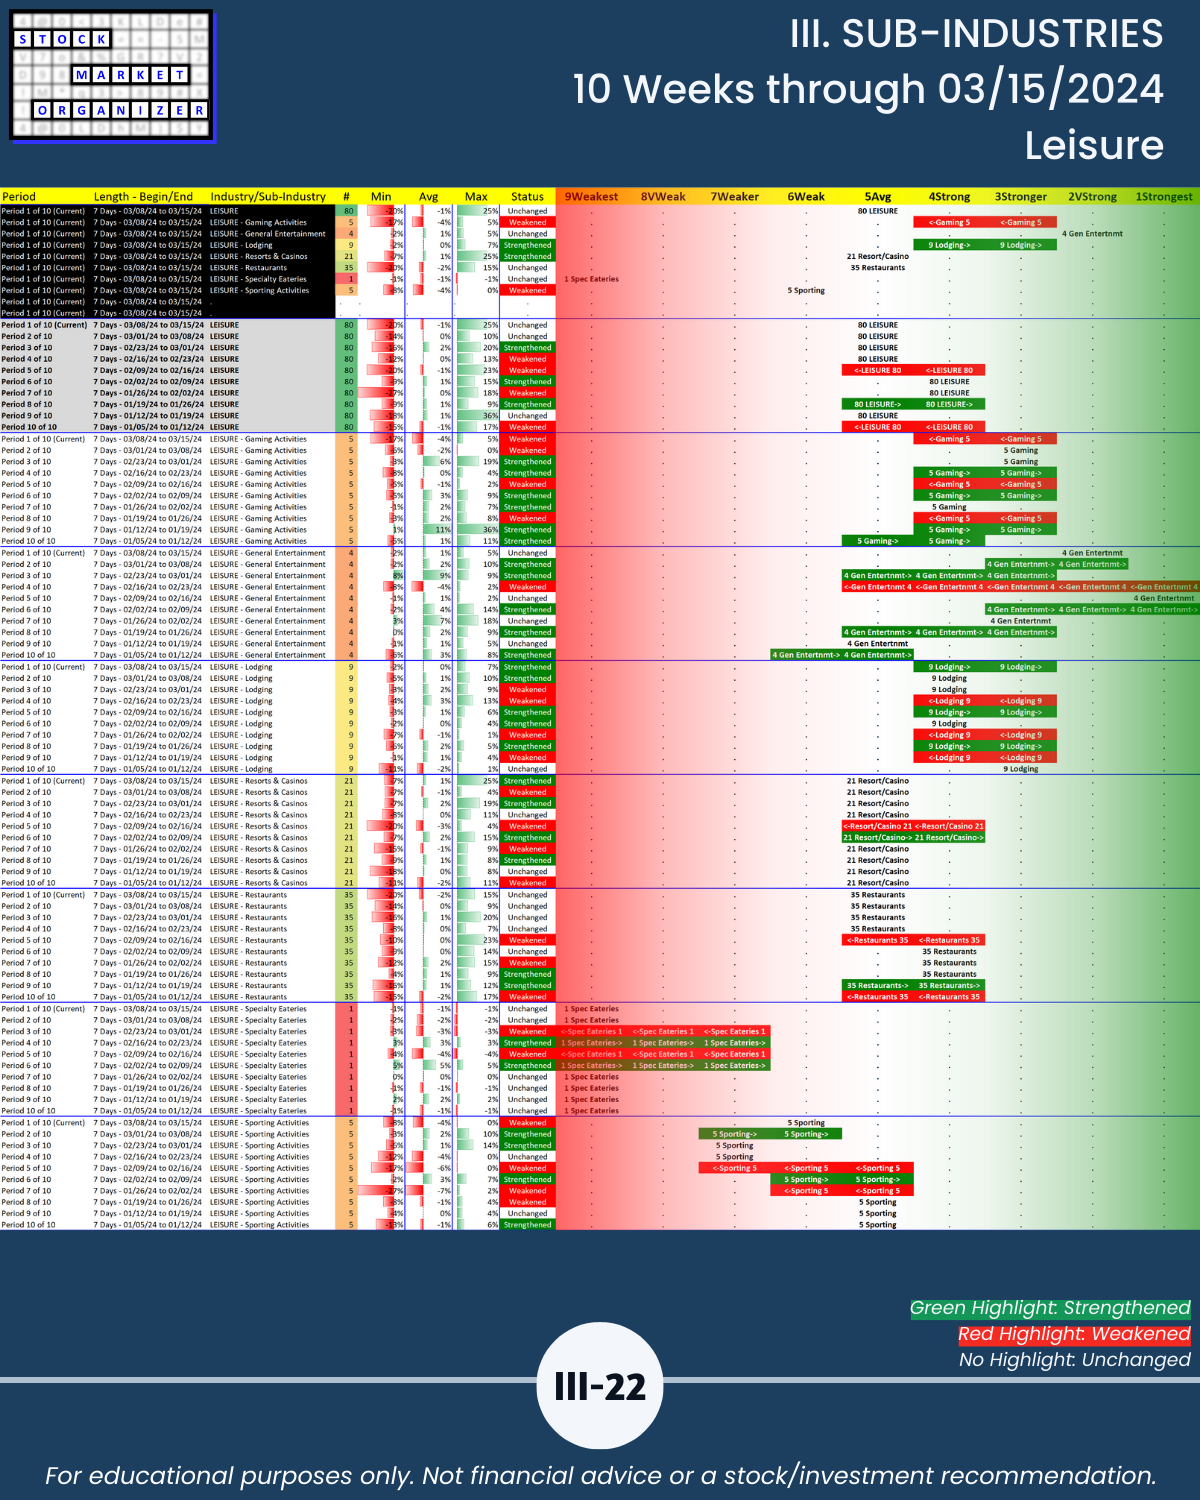
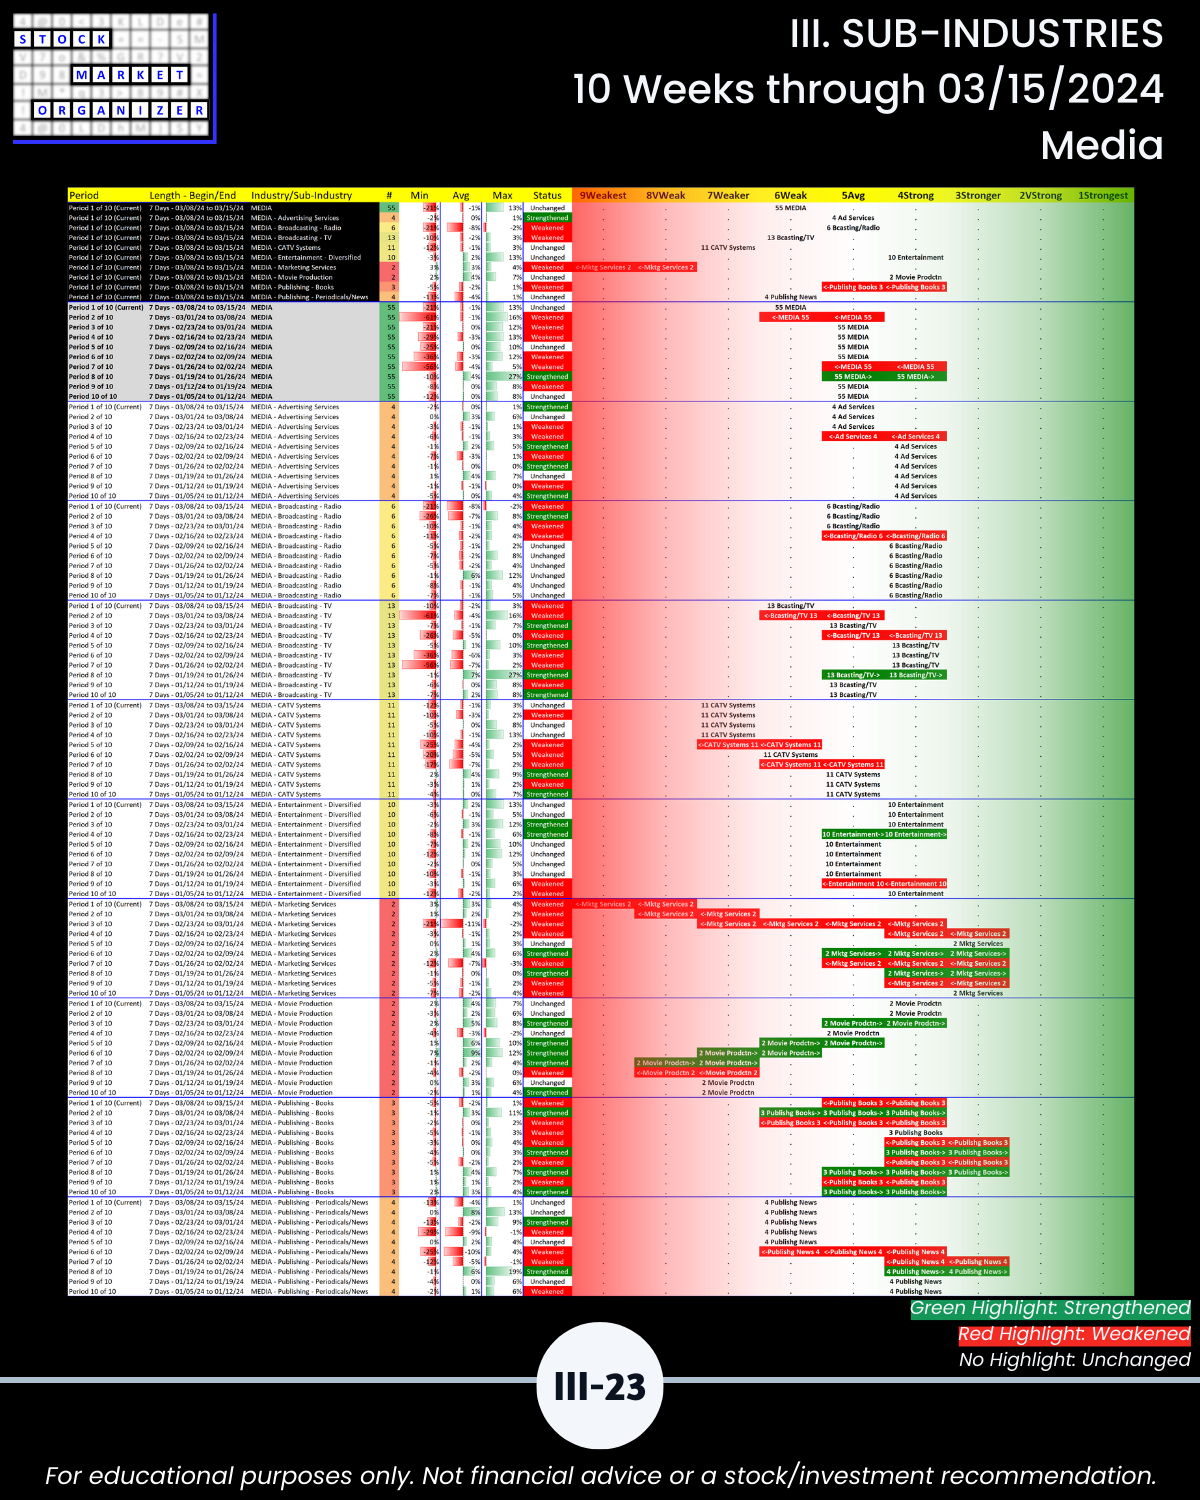
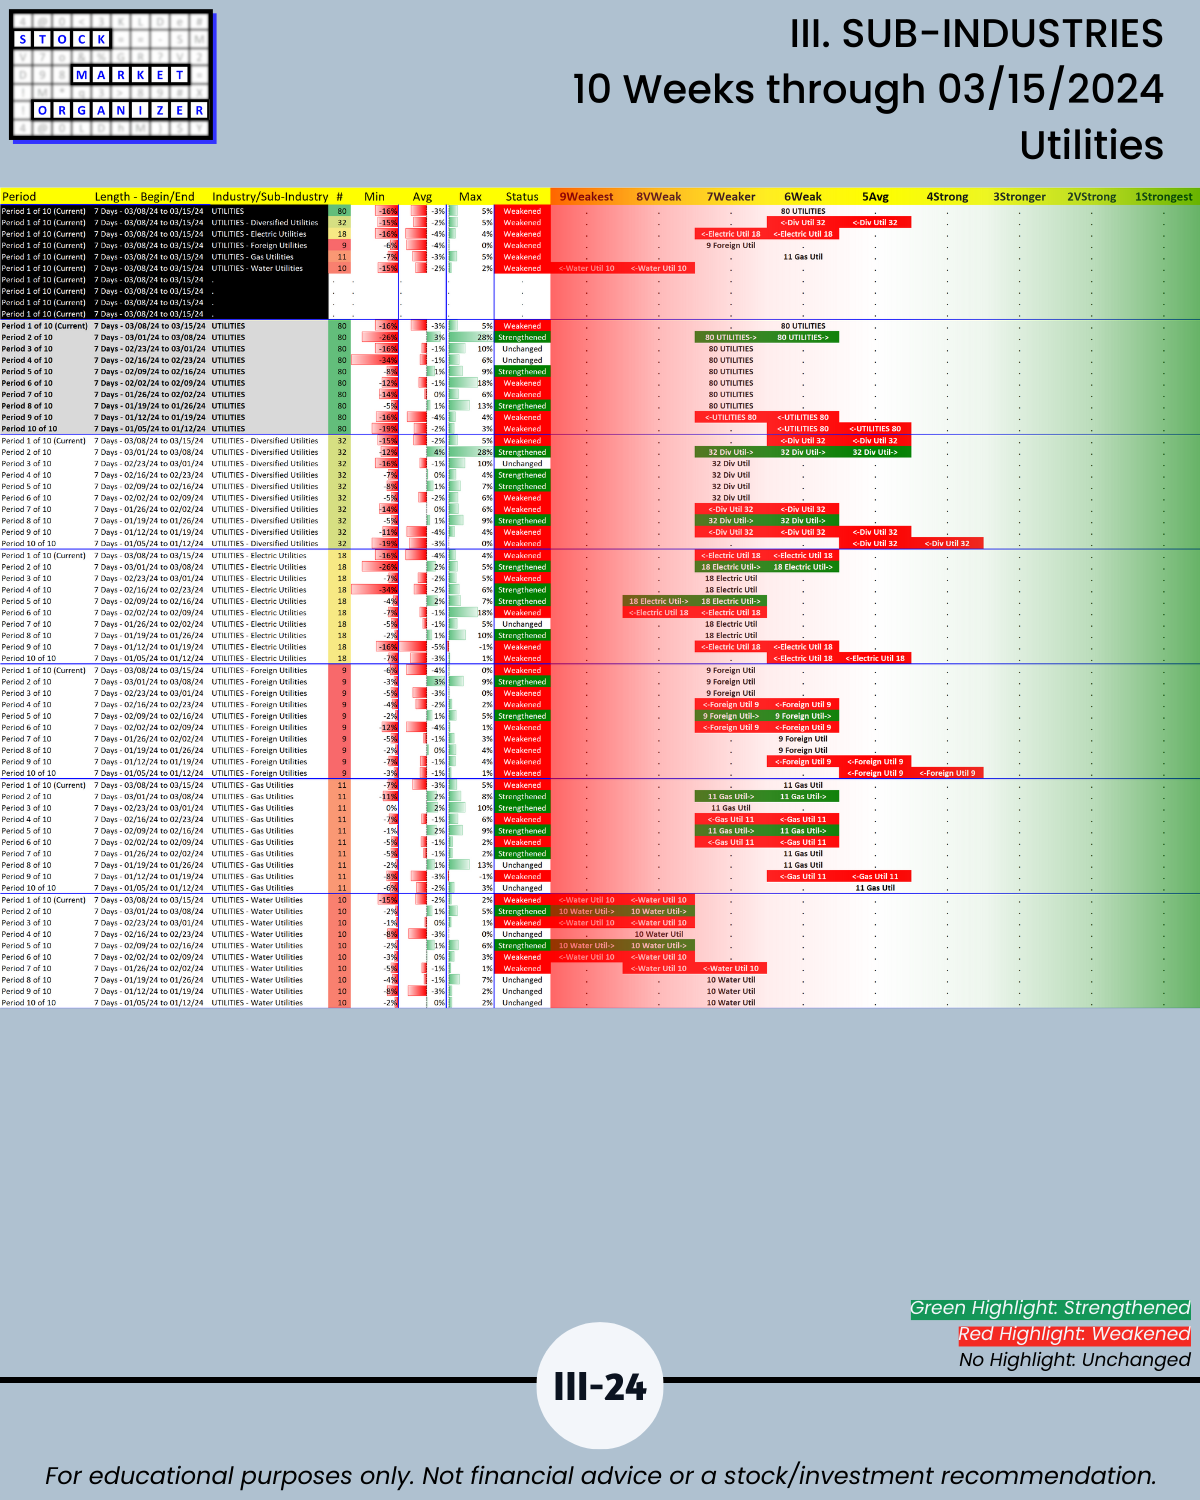
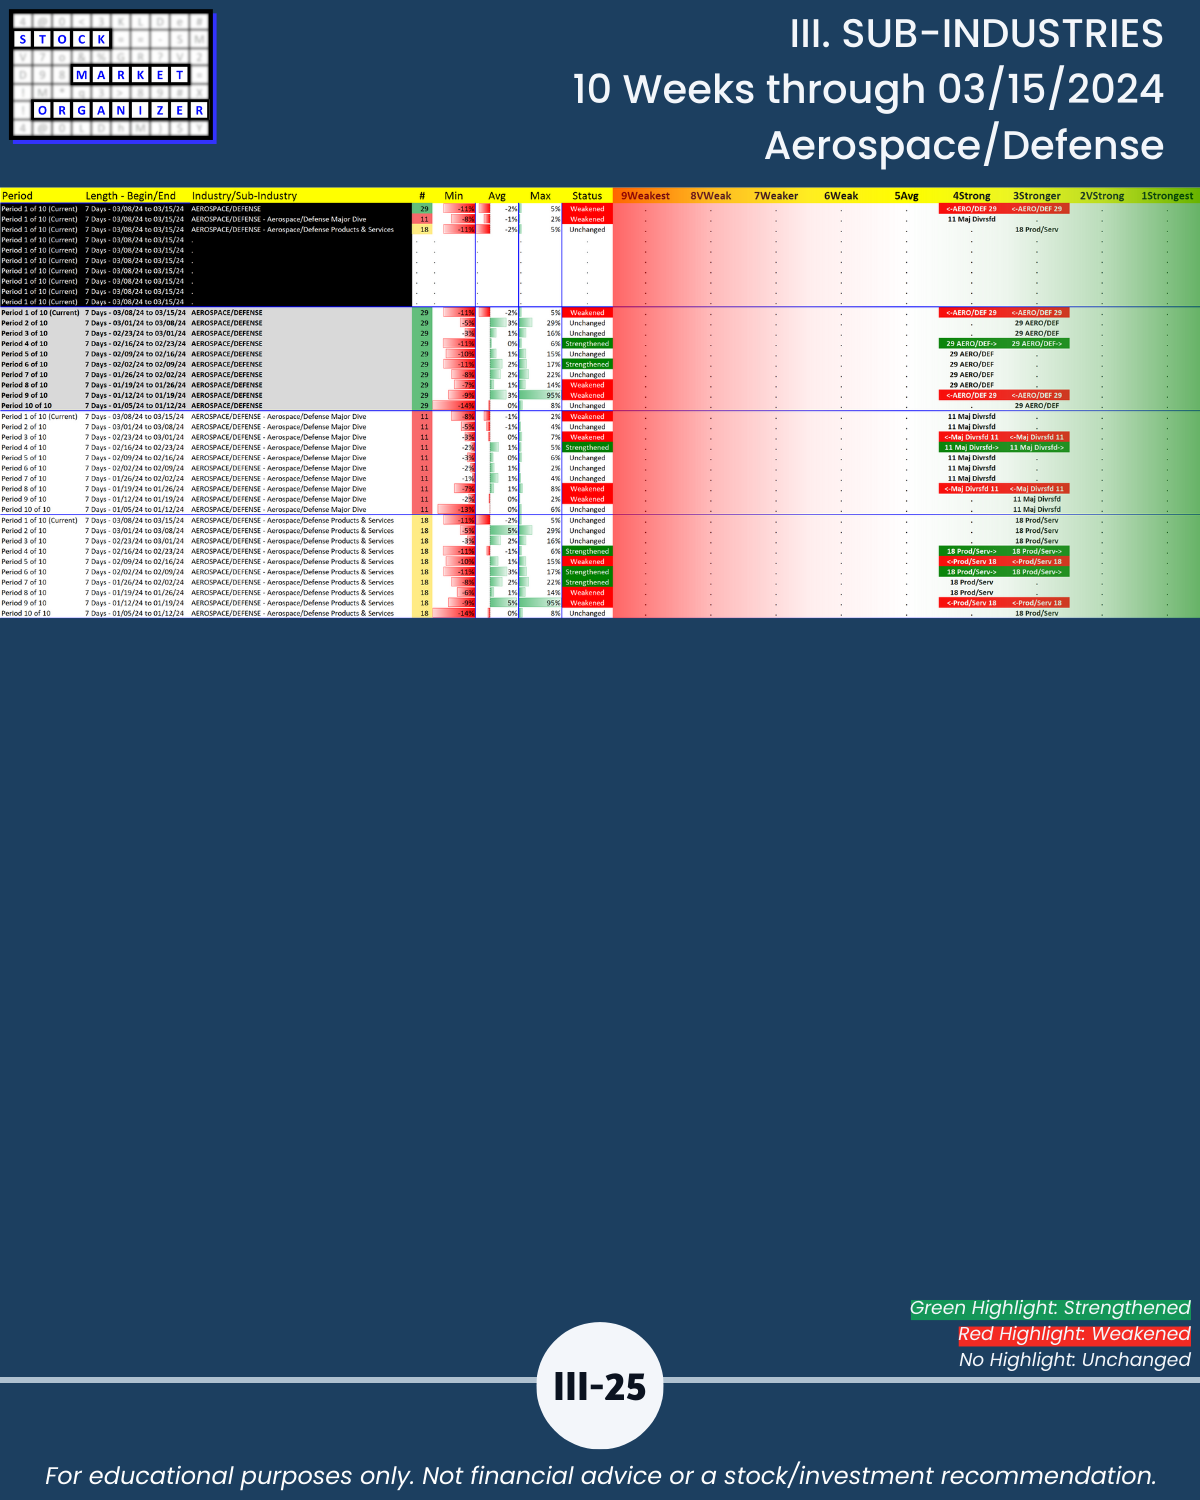
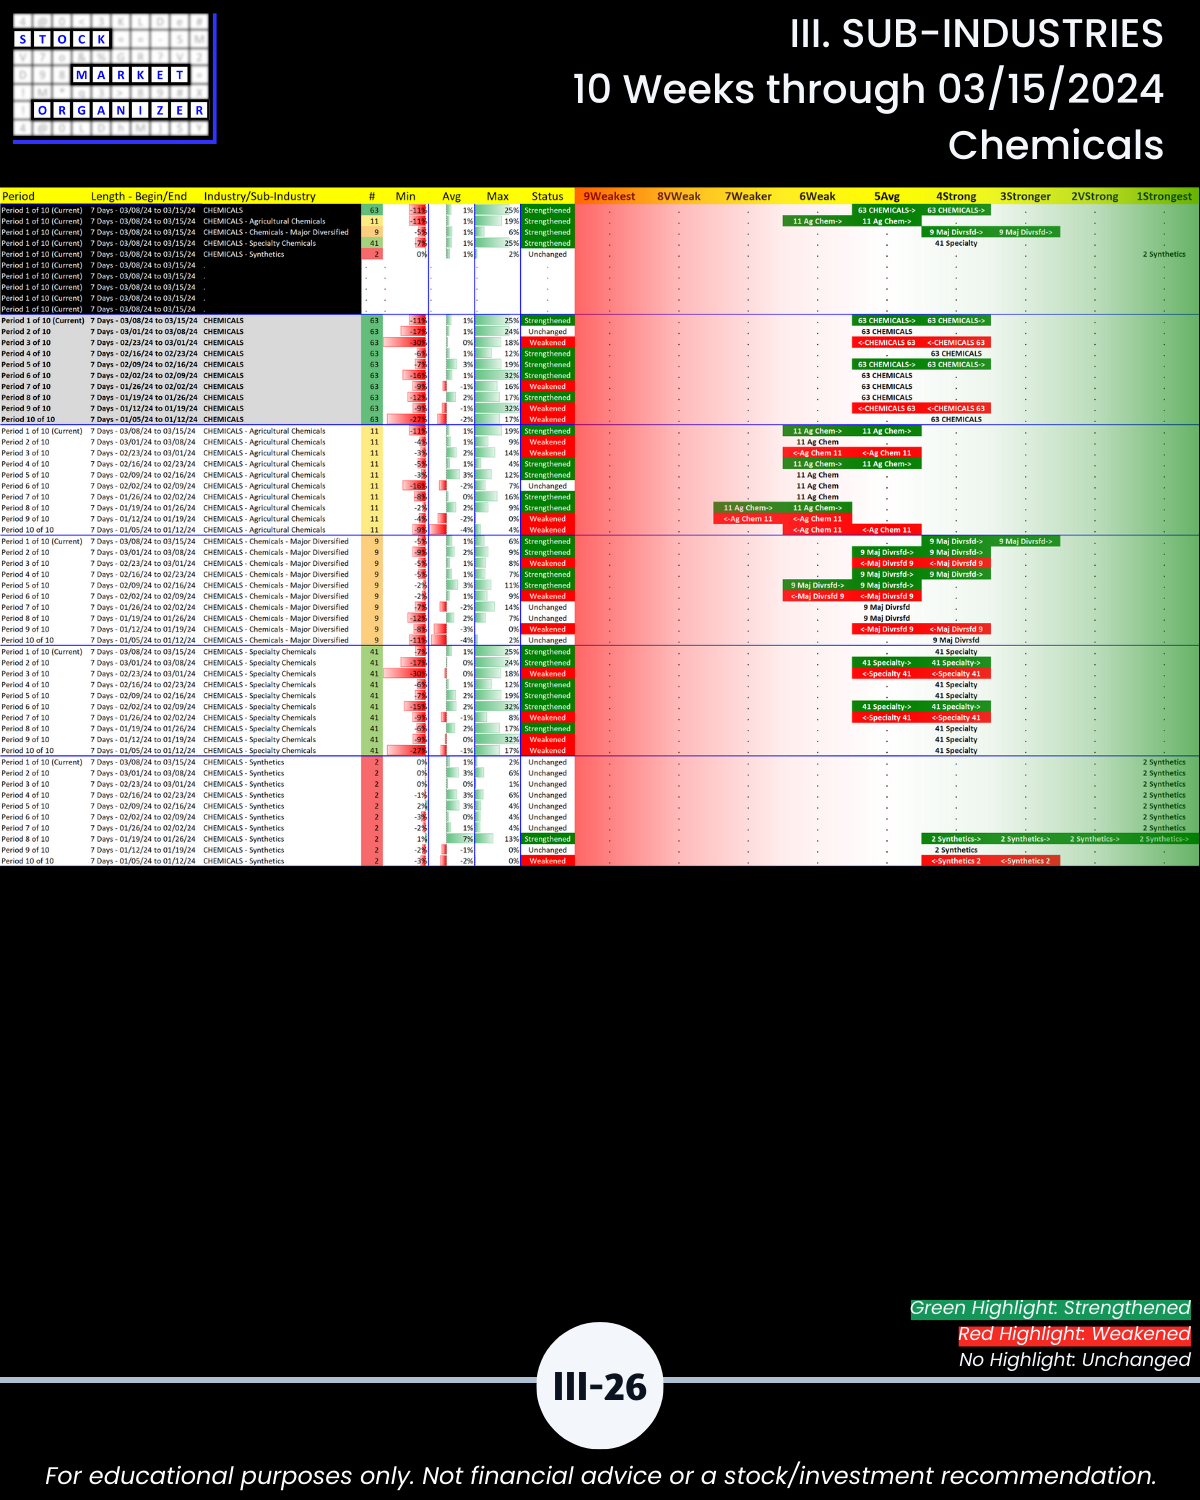
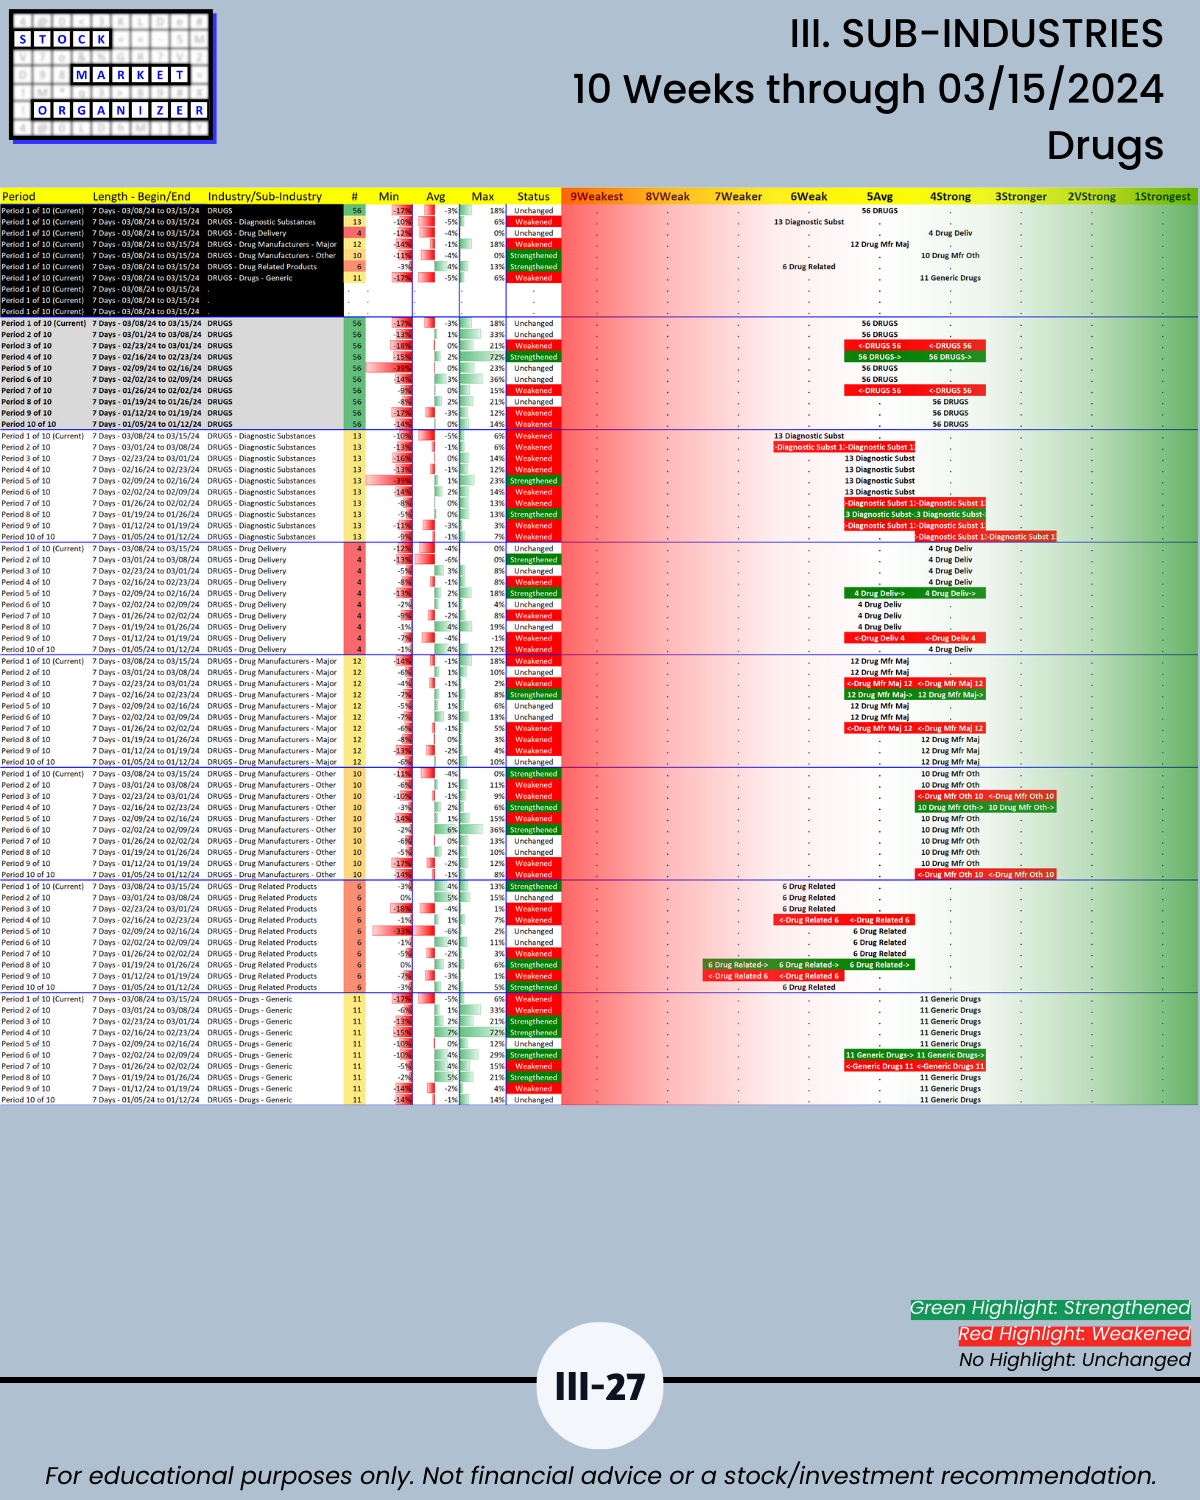
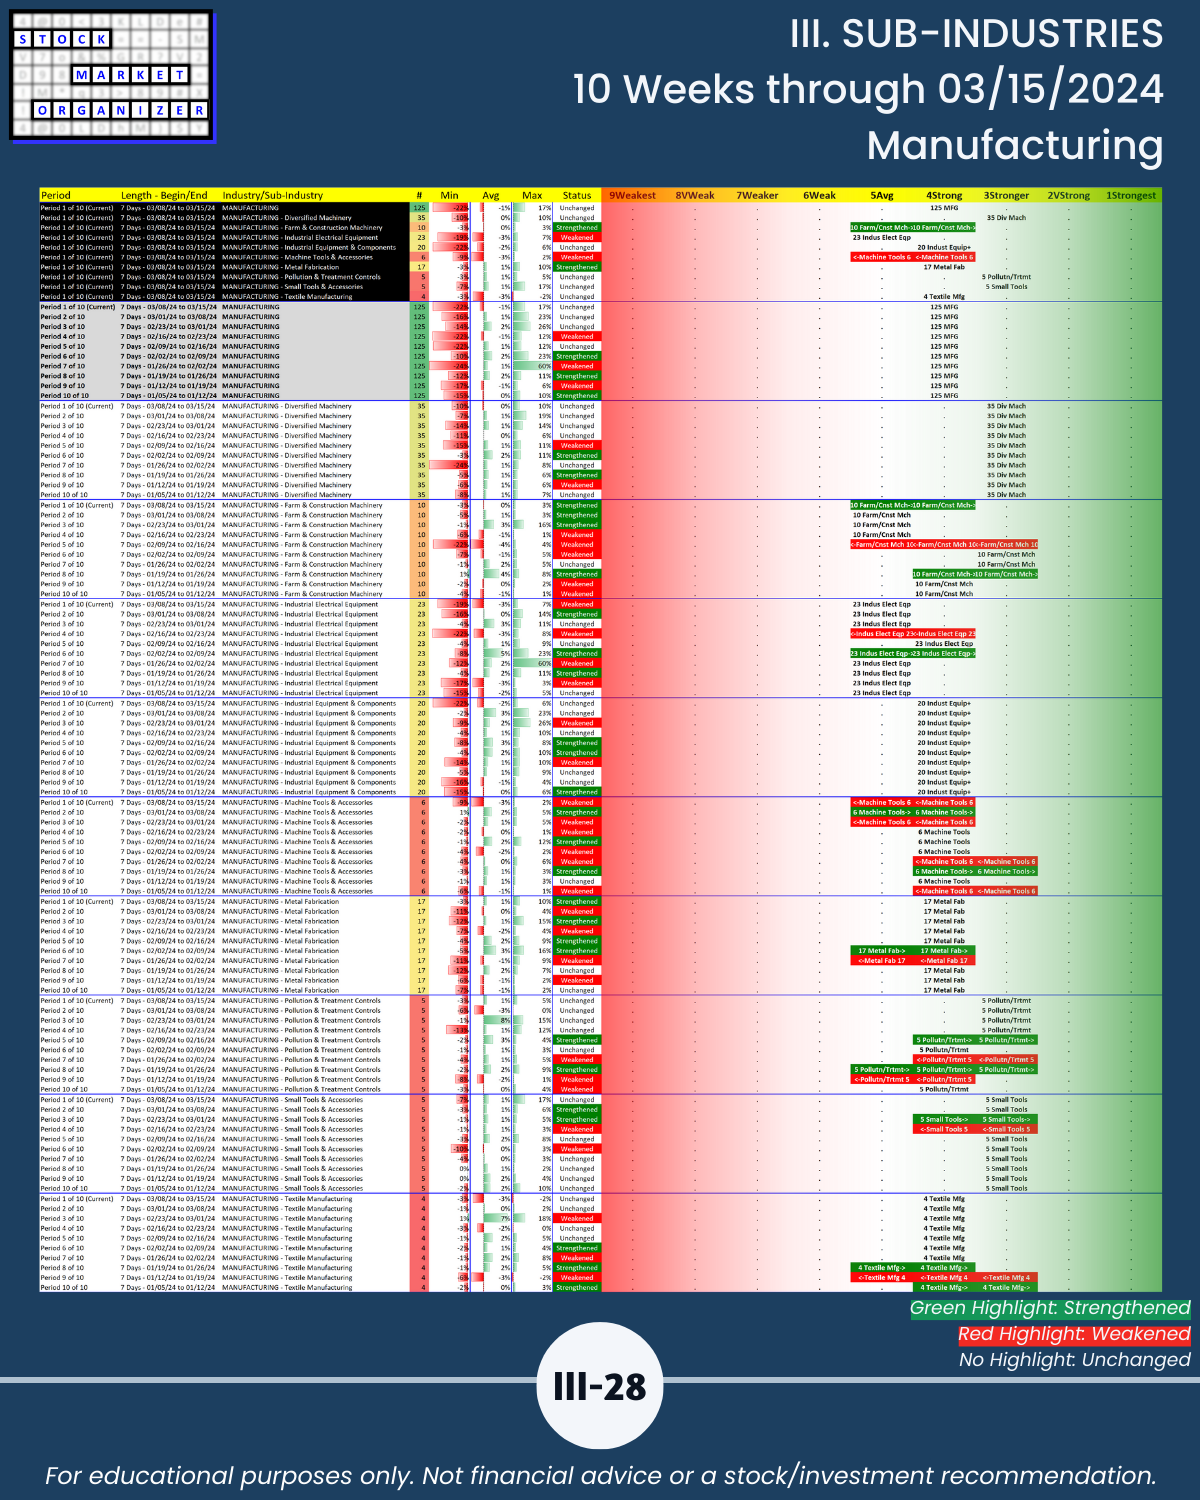
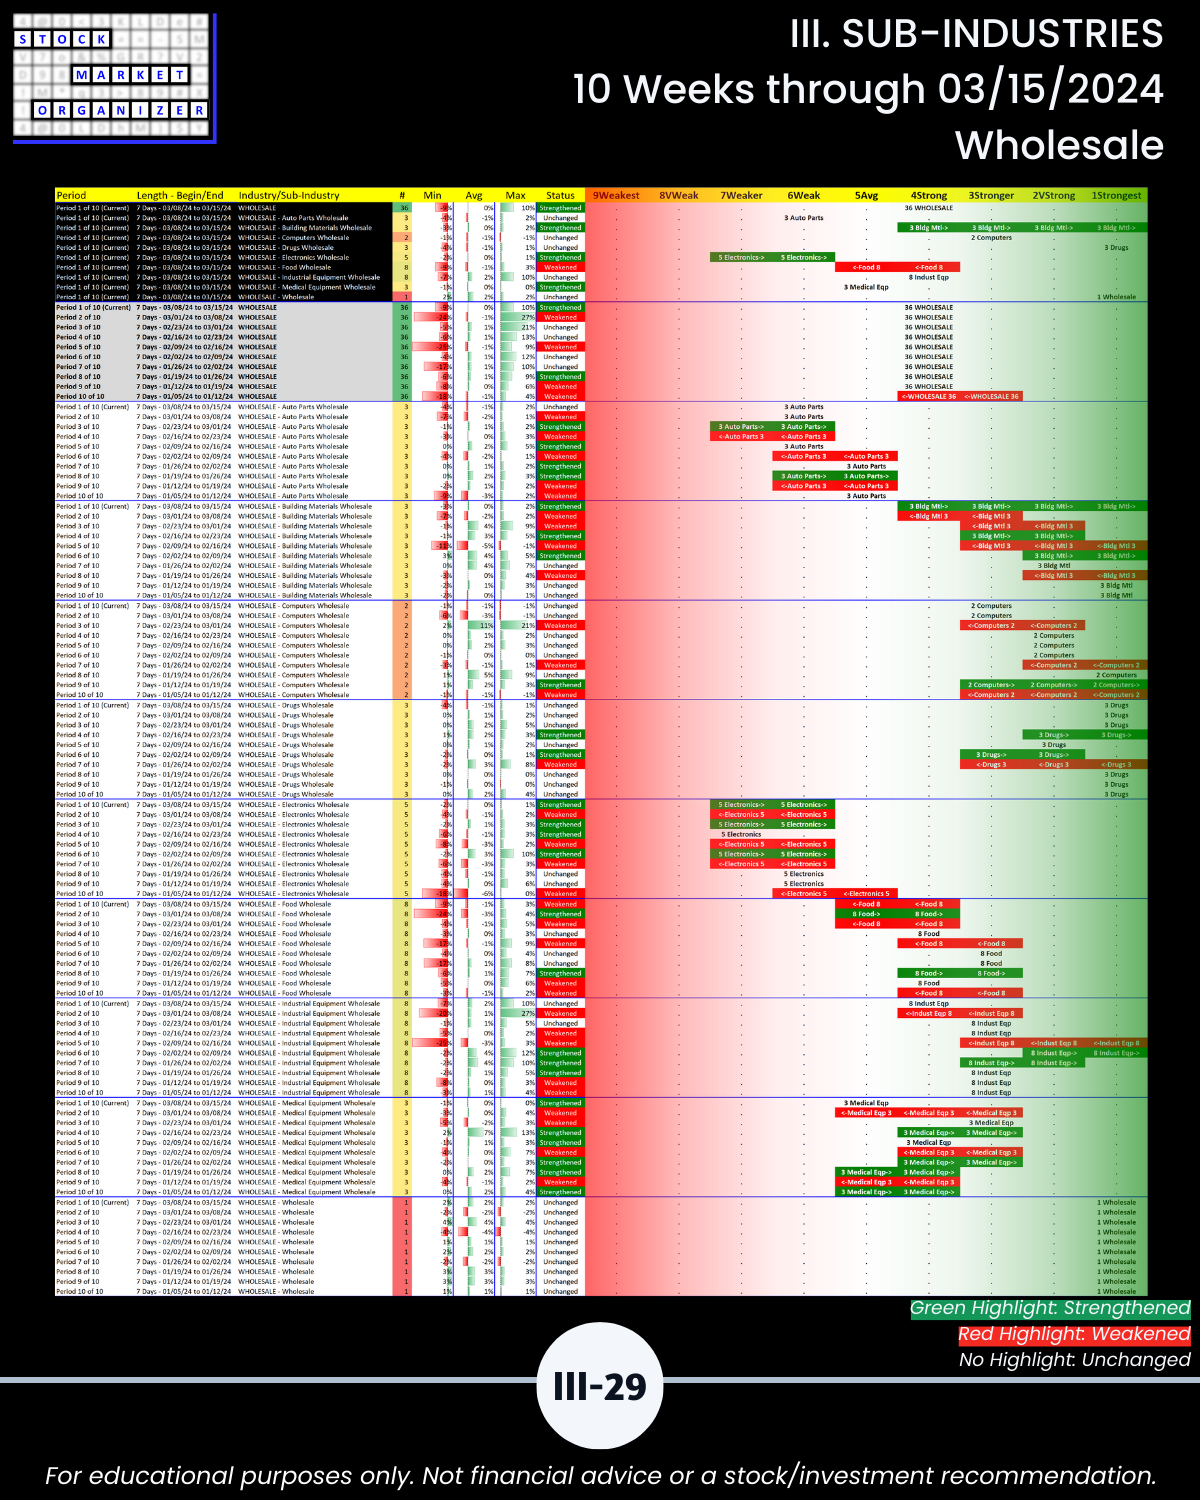
SECTION III Sub-industries level:
Directly compare relative and absolute strength for 198 sub-industries going back 10 weeks.
🔹 Sub-industry currently rated Strongest: Diversified Services, 1-year average return 41%, range 11% to 81%
🔹 Weakest: Water Utilities, average -13%, range 0% to -33%
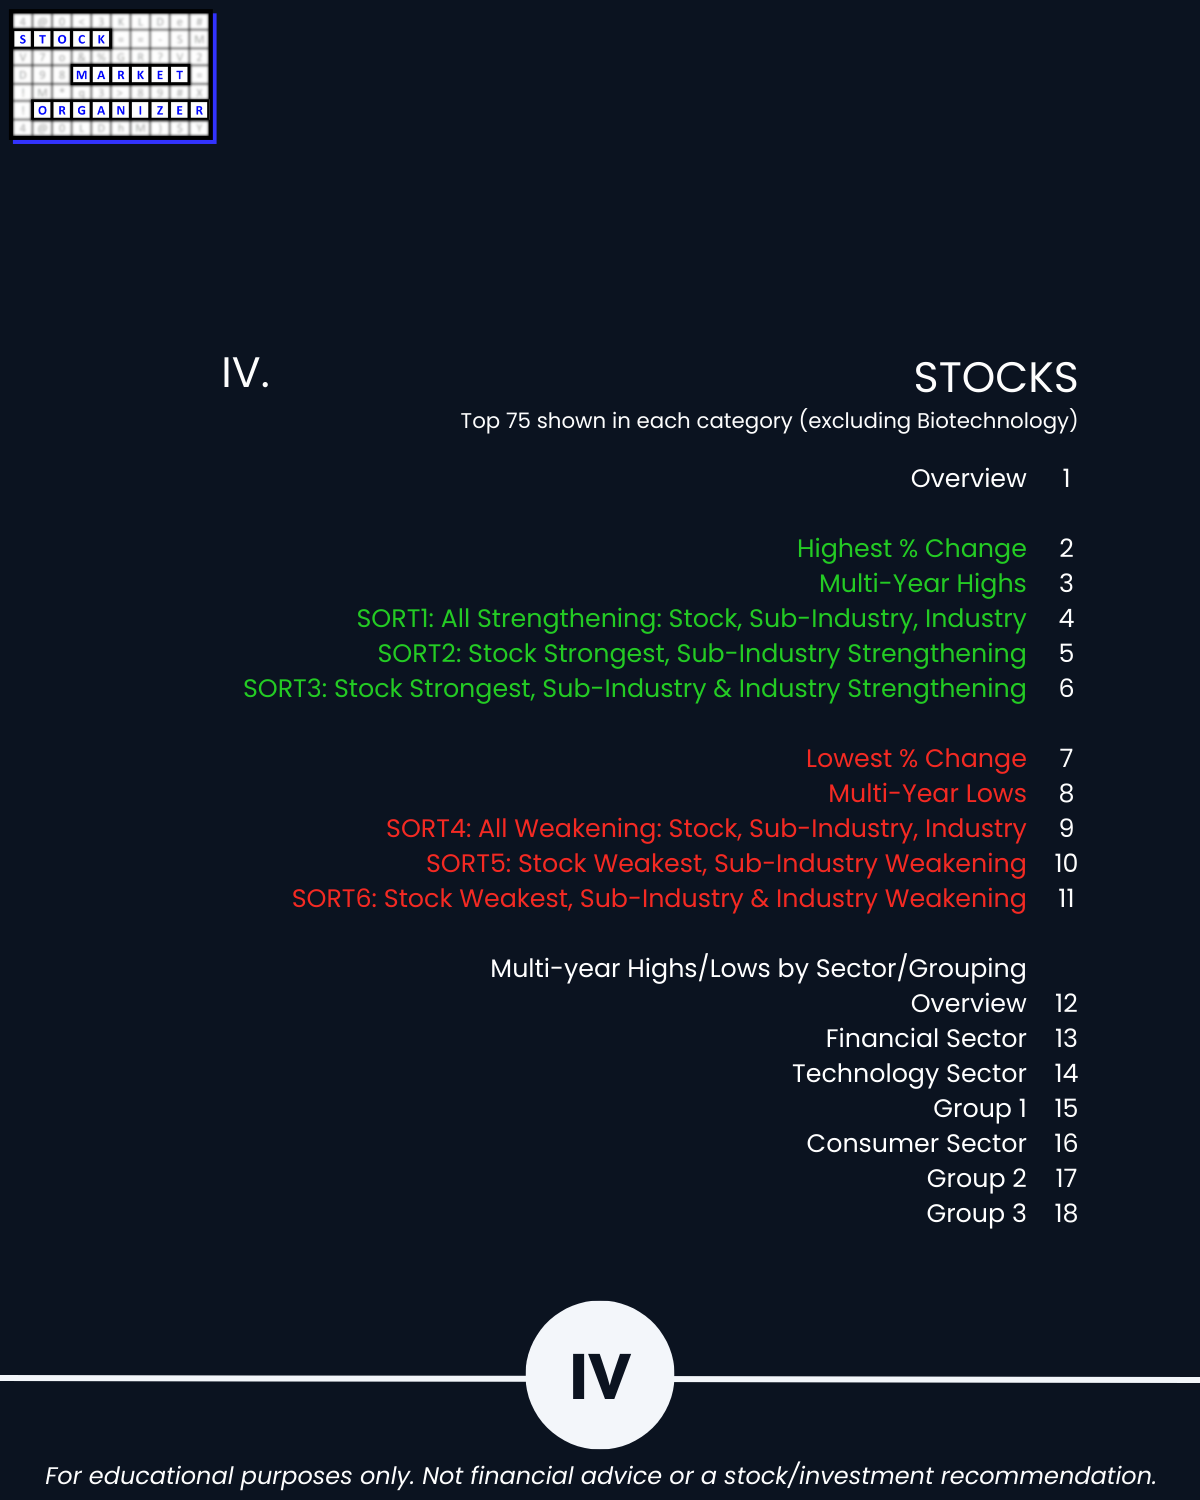
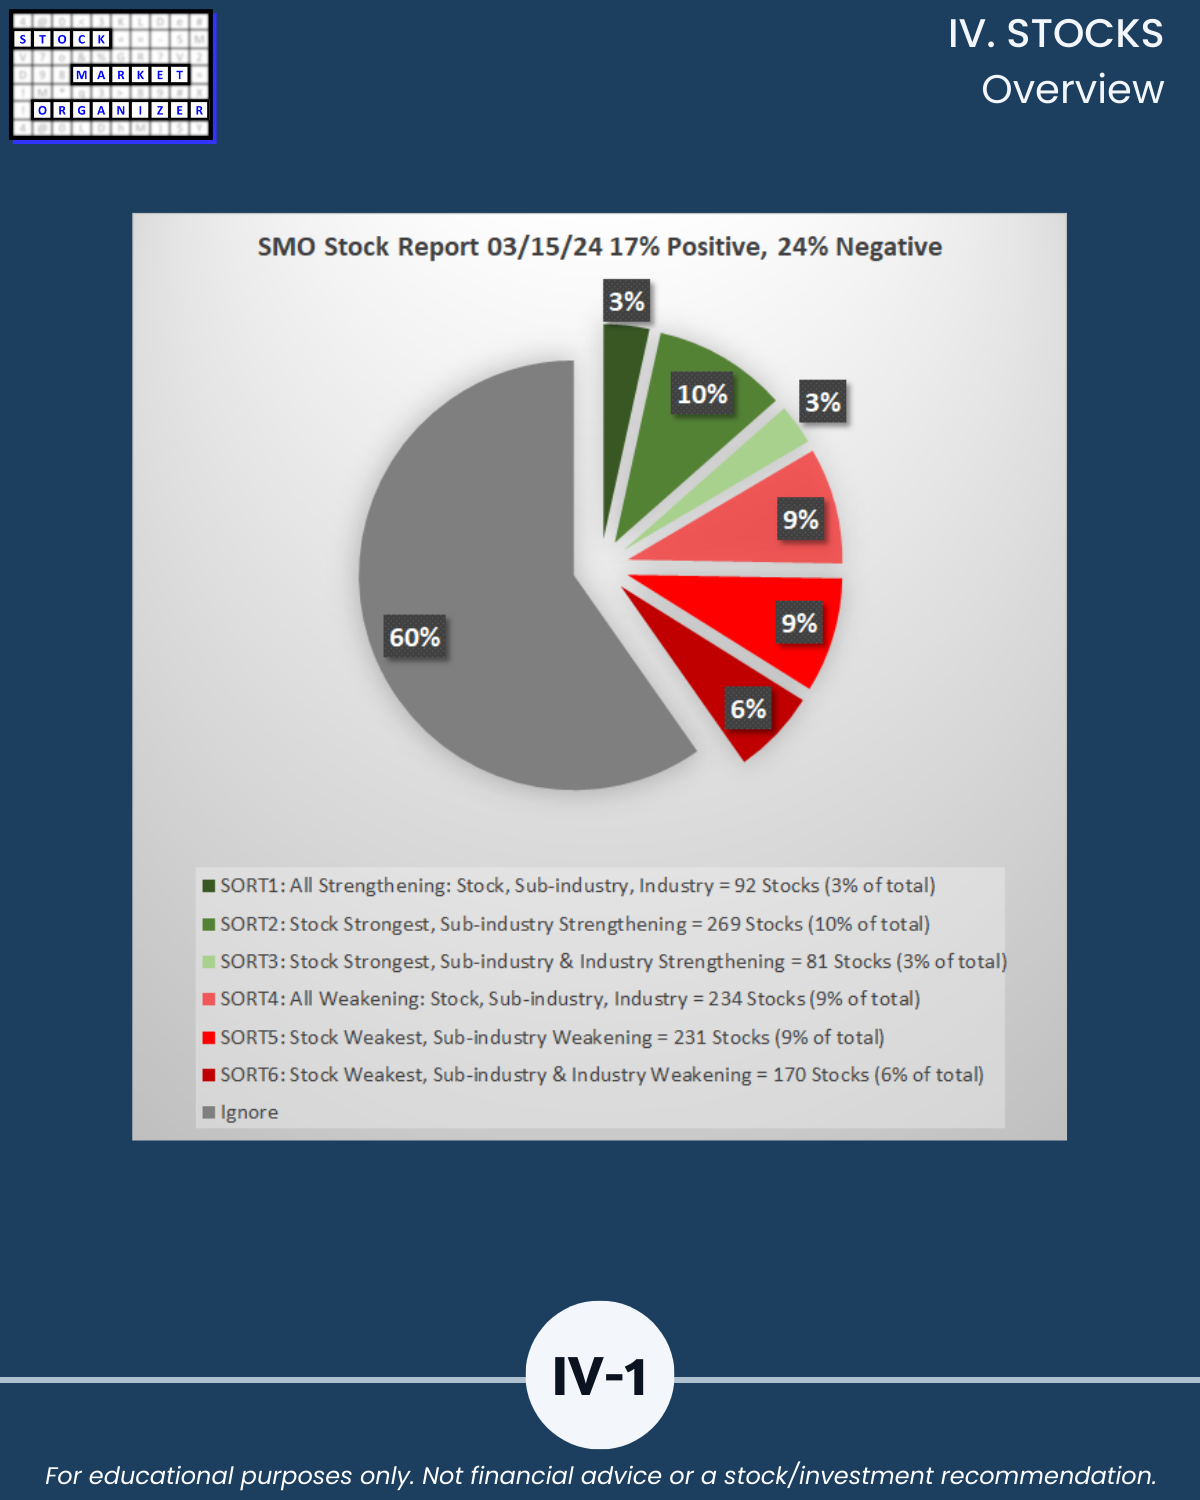
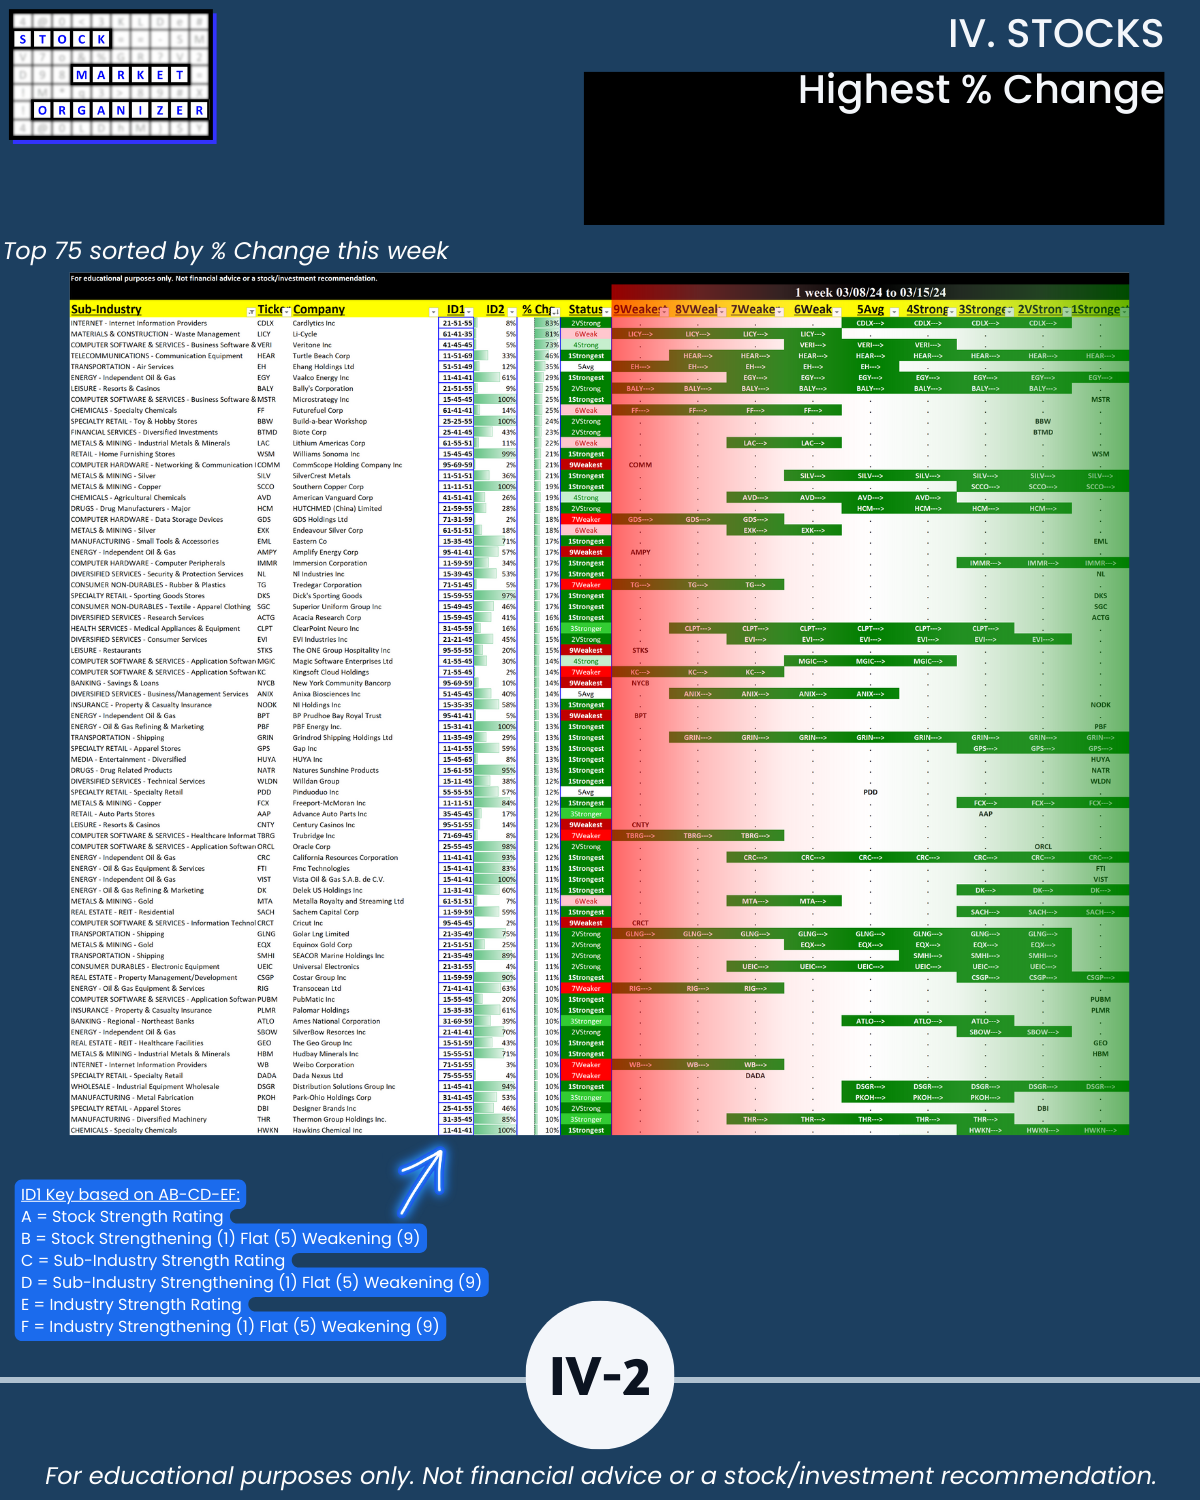
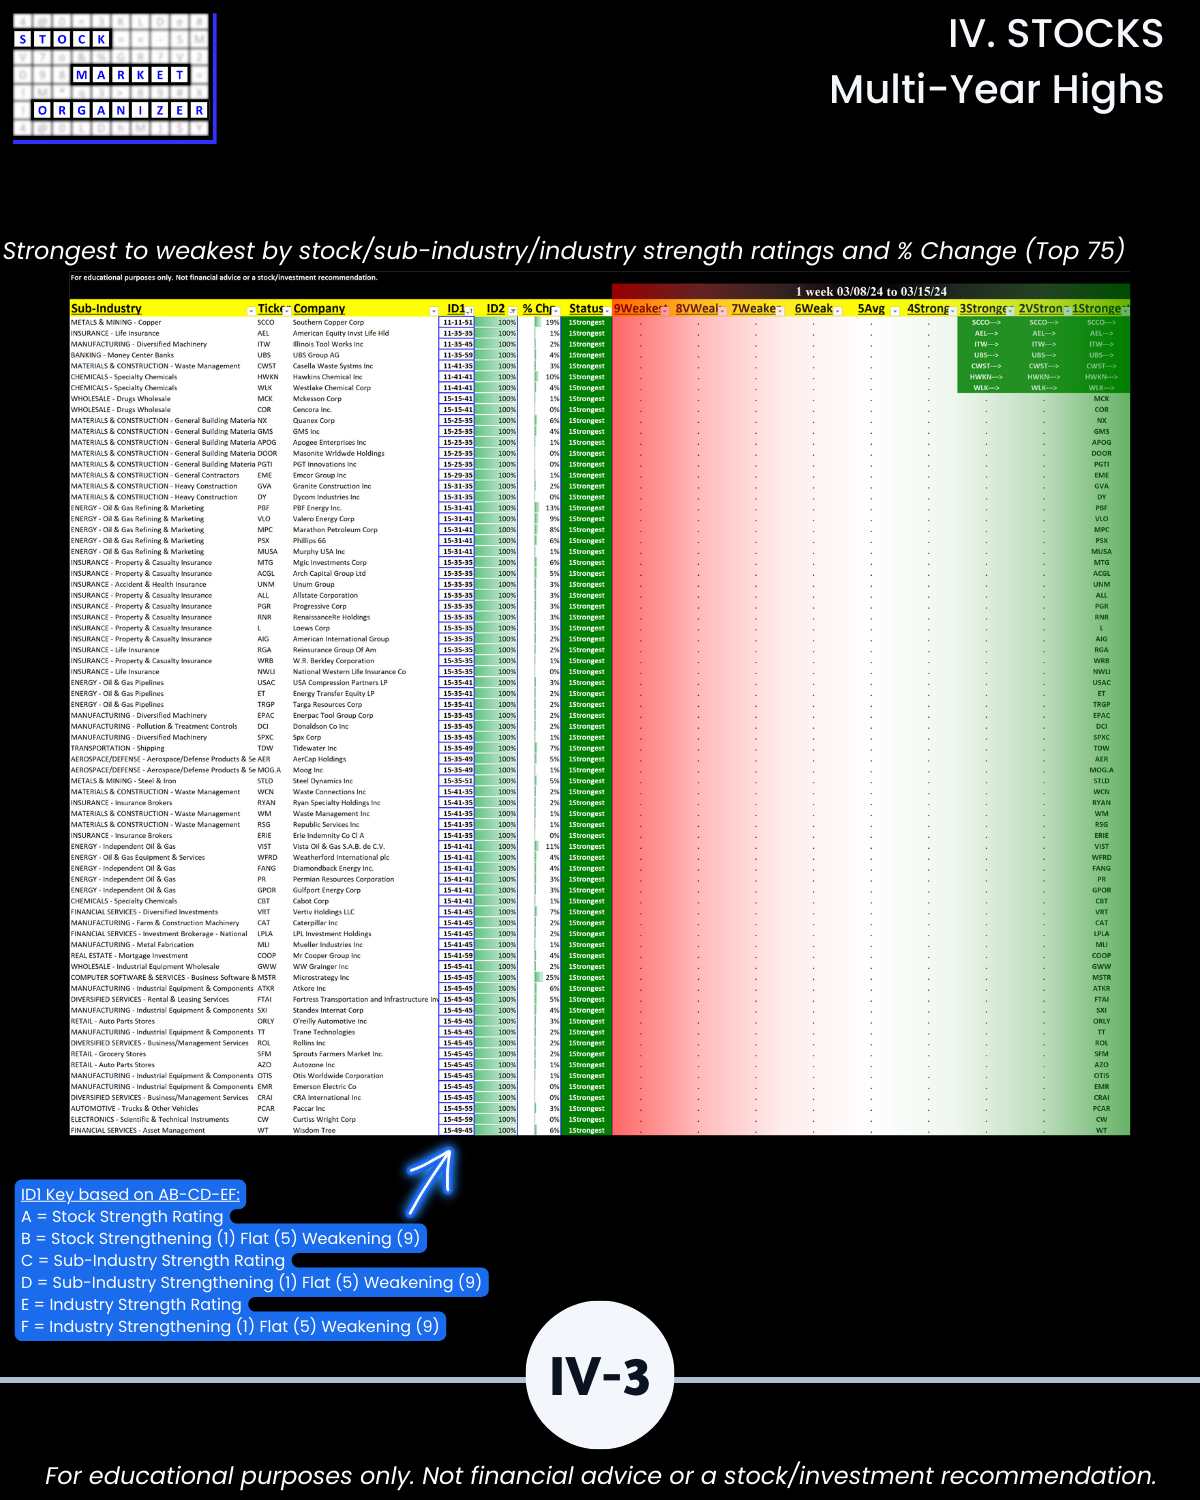
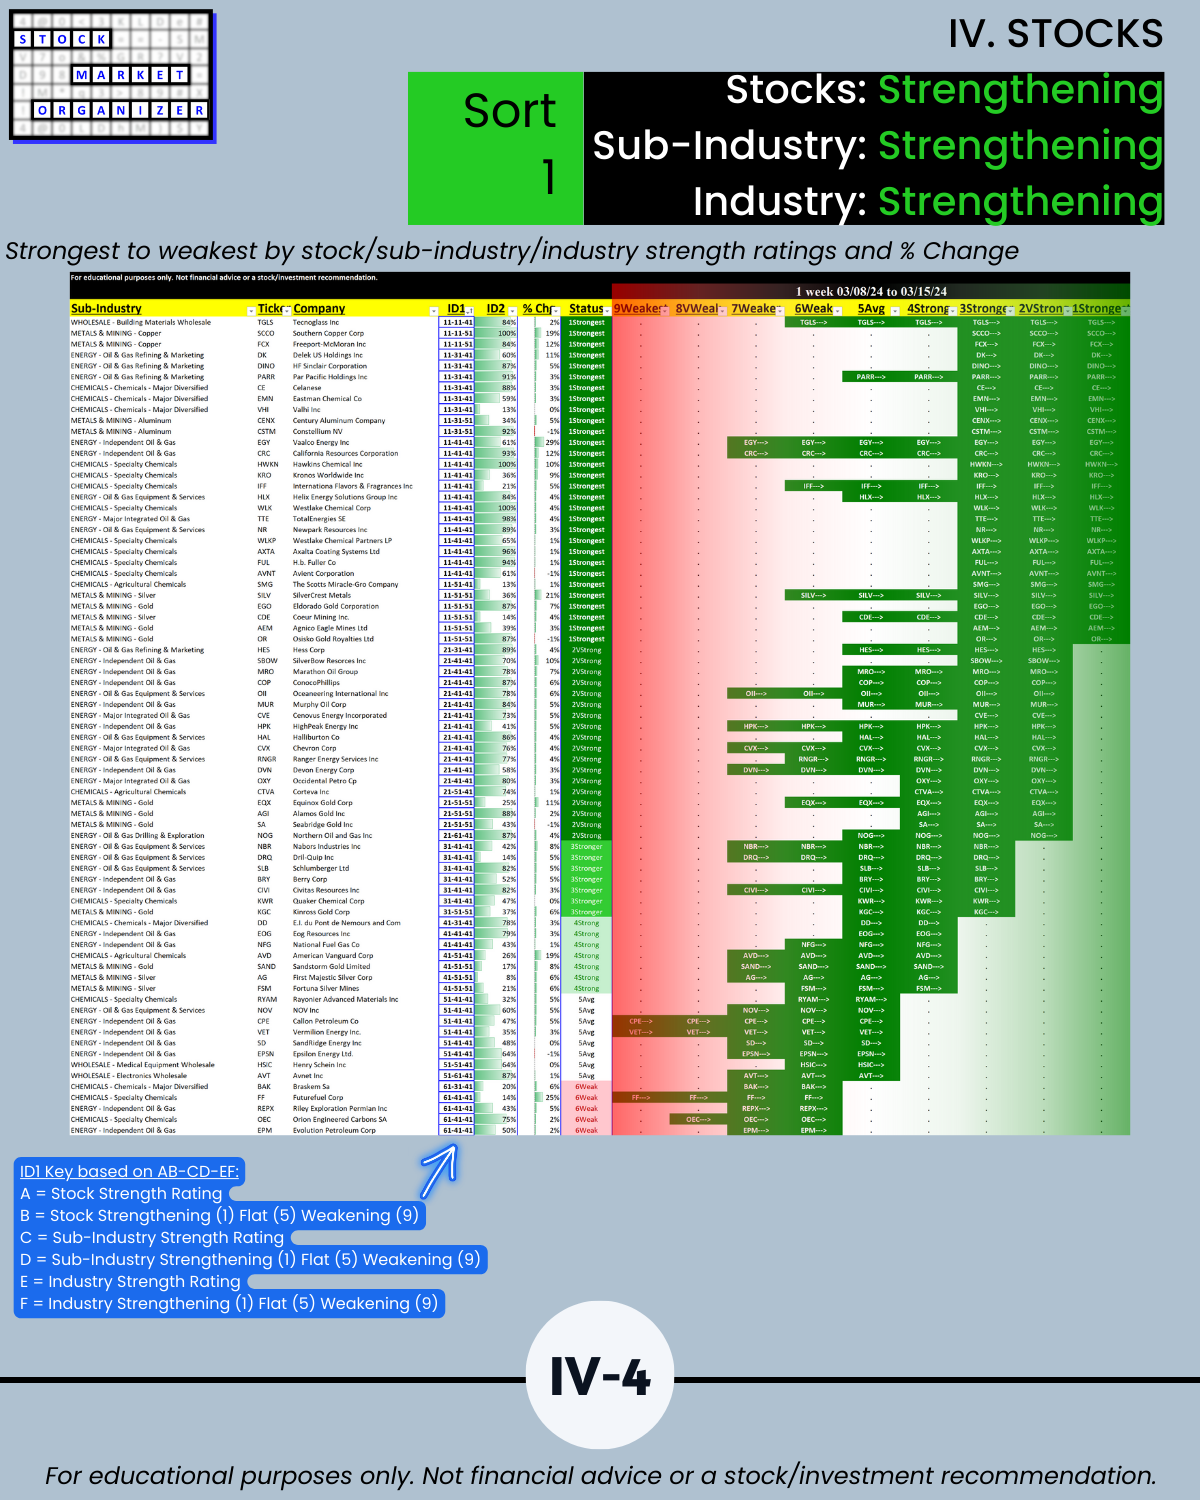
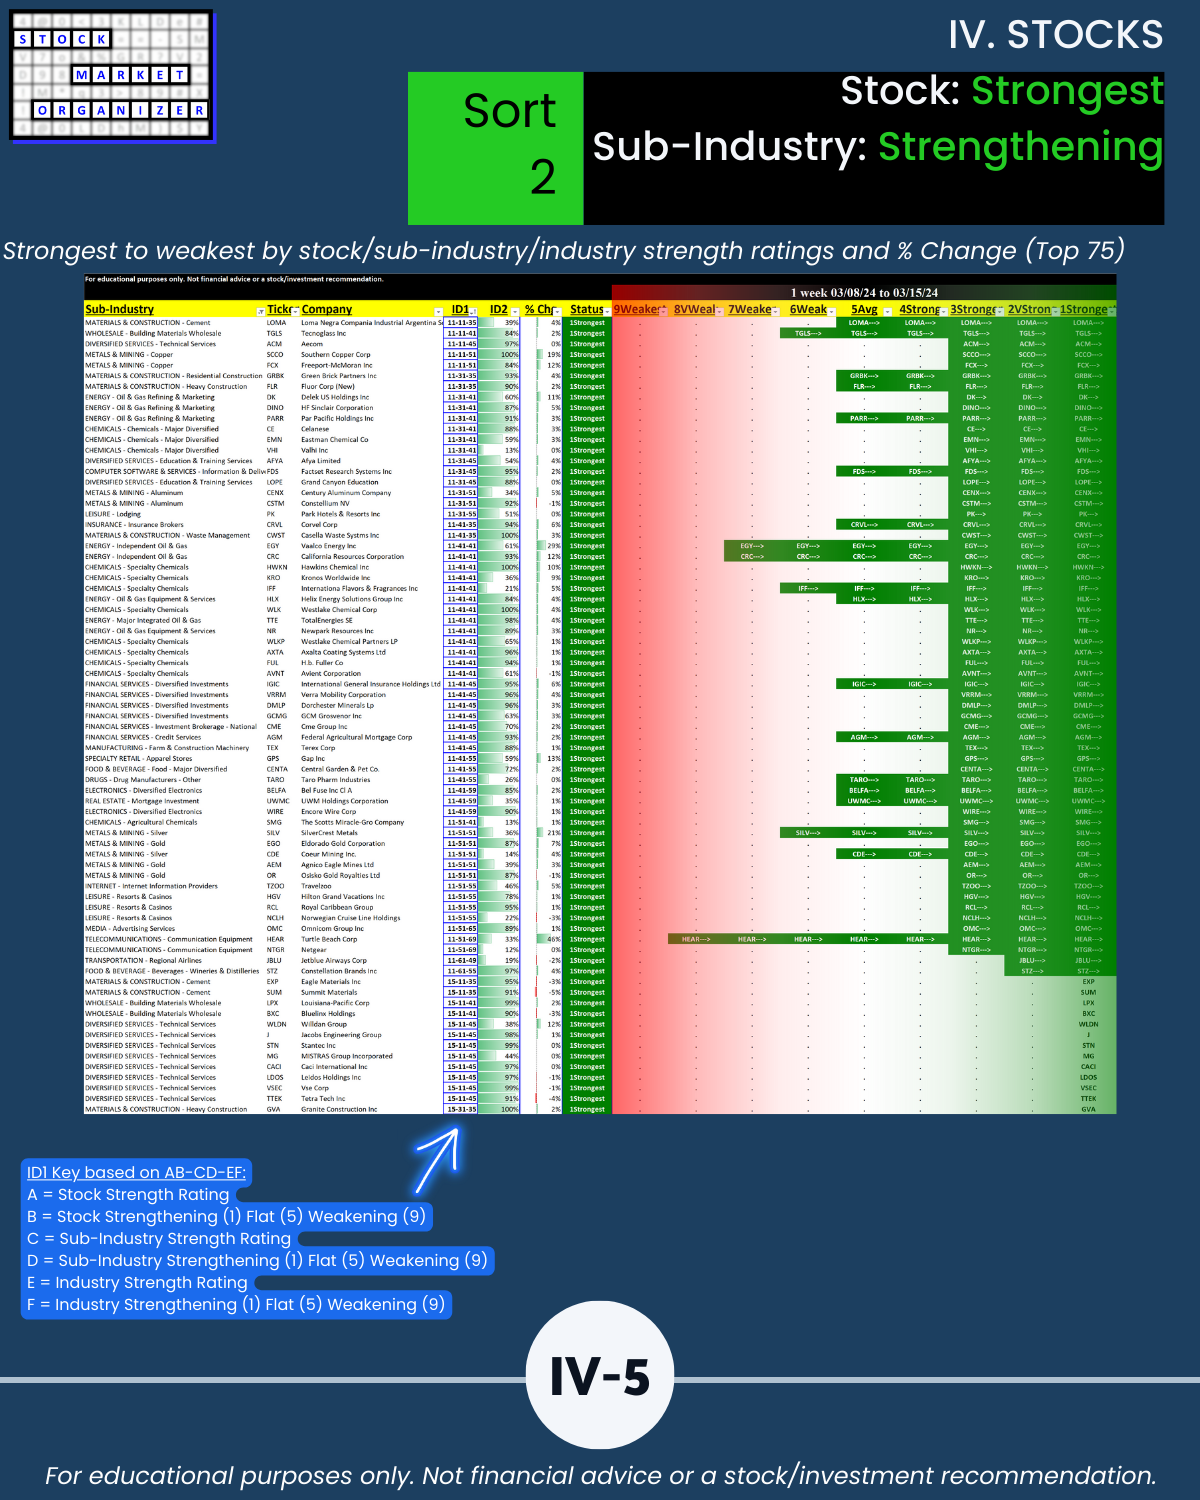
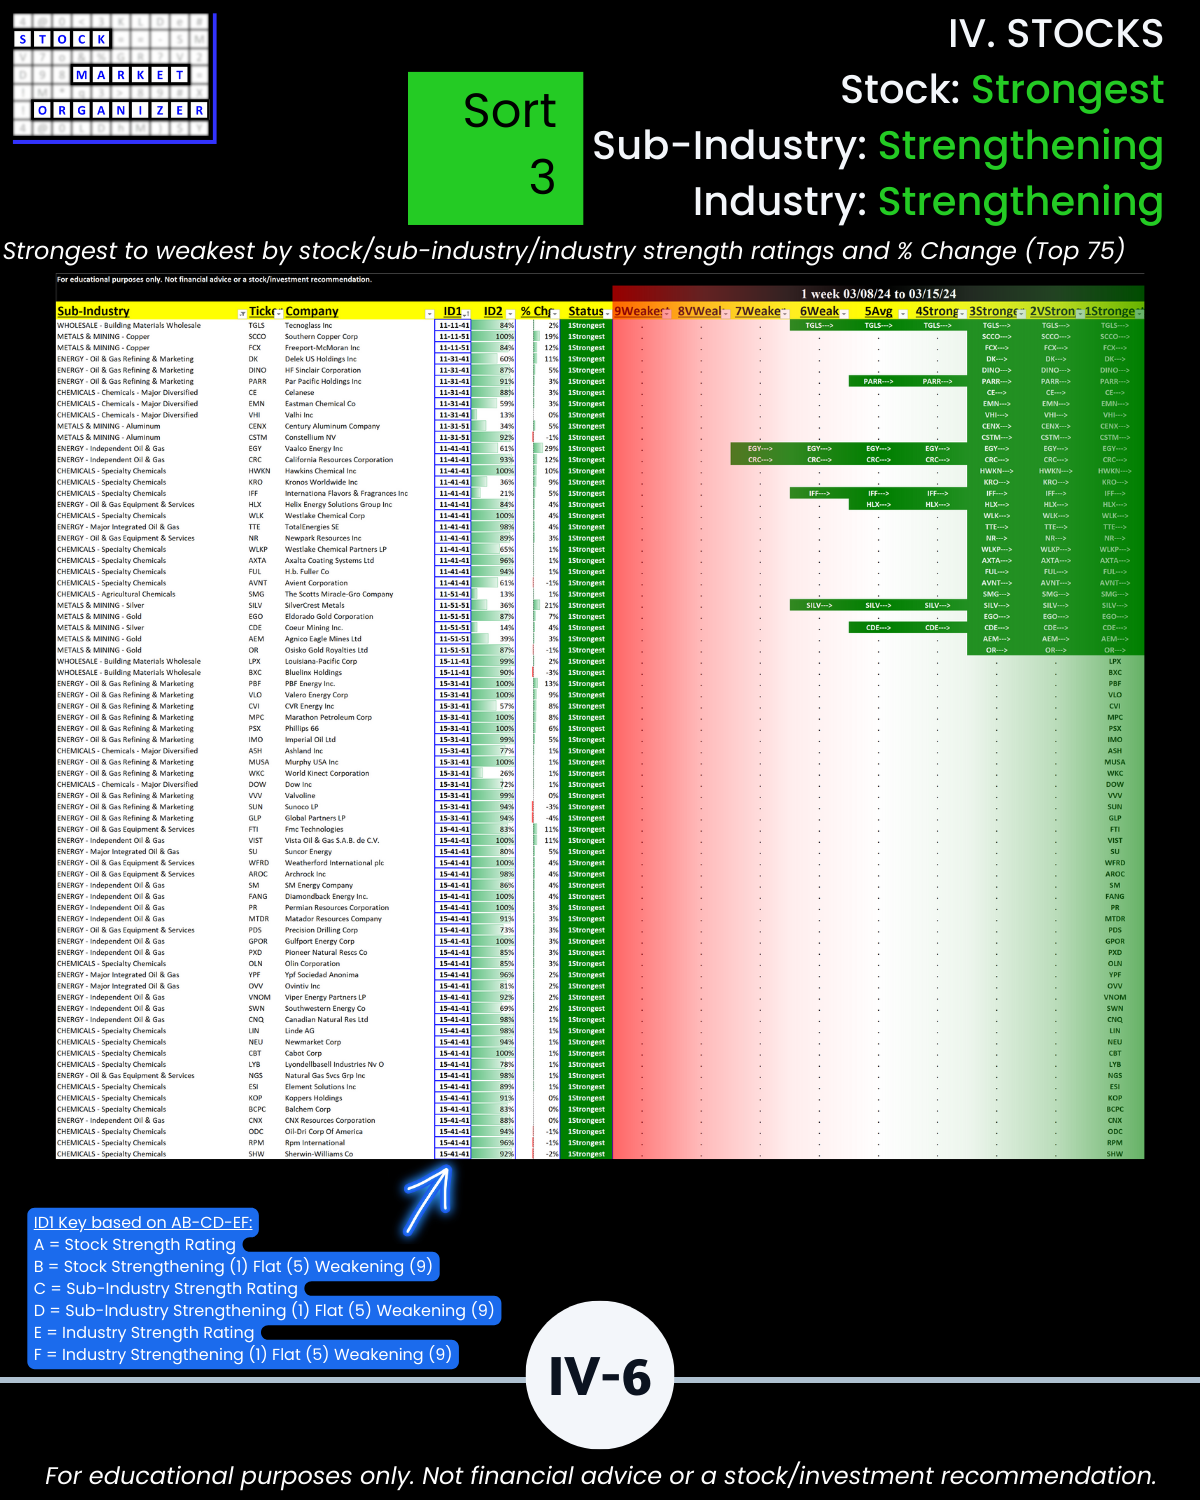
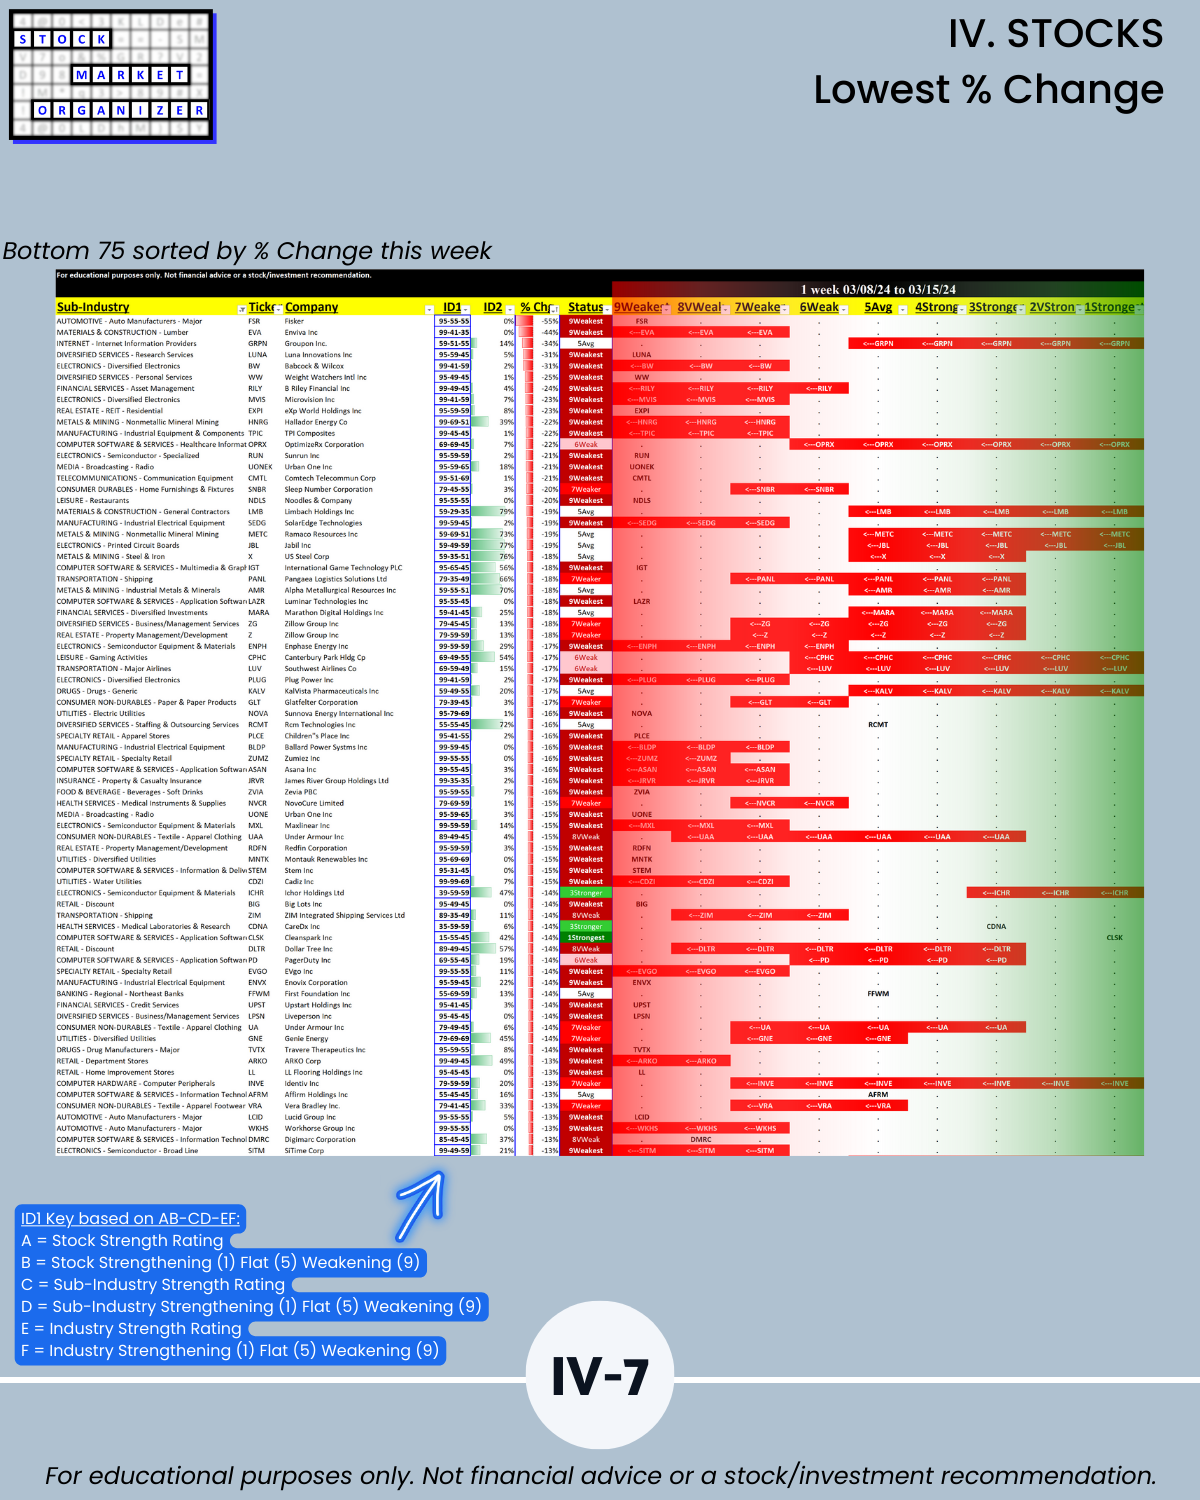
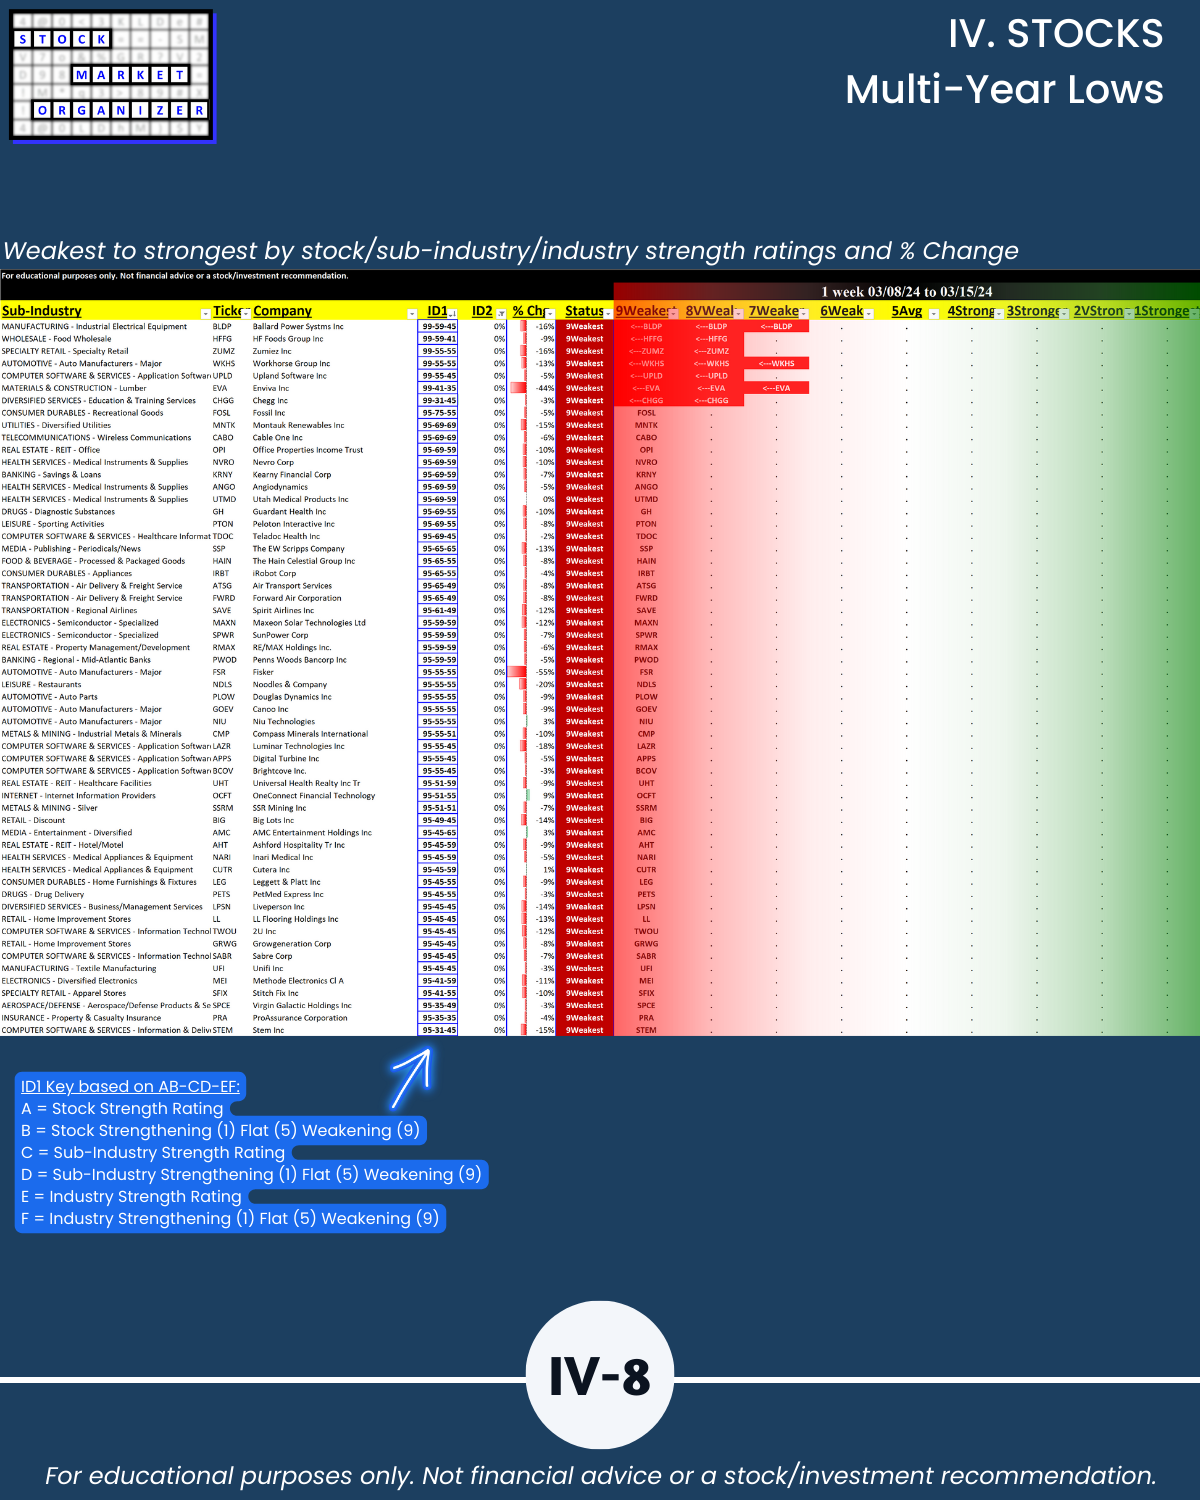
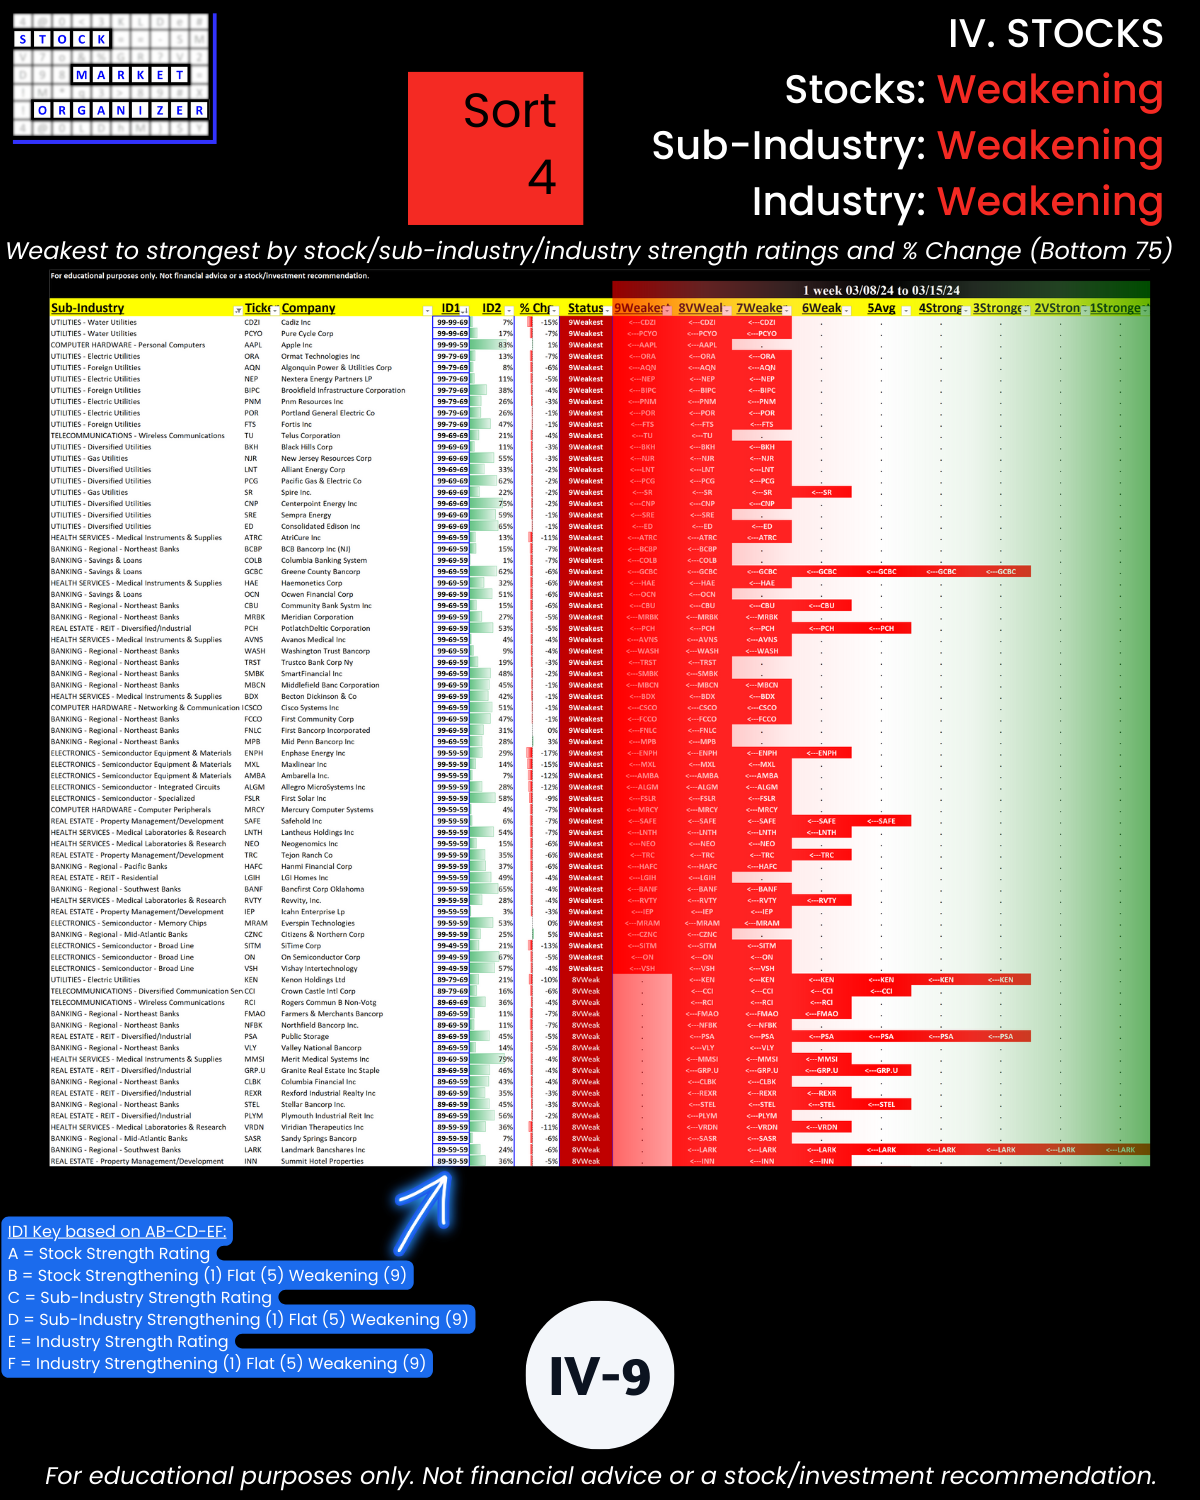
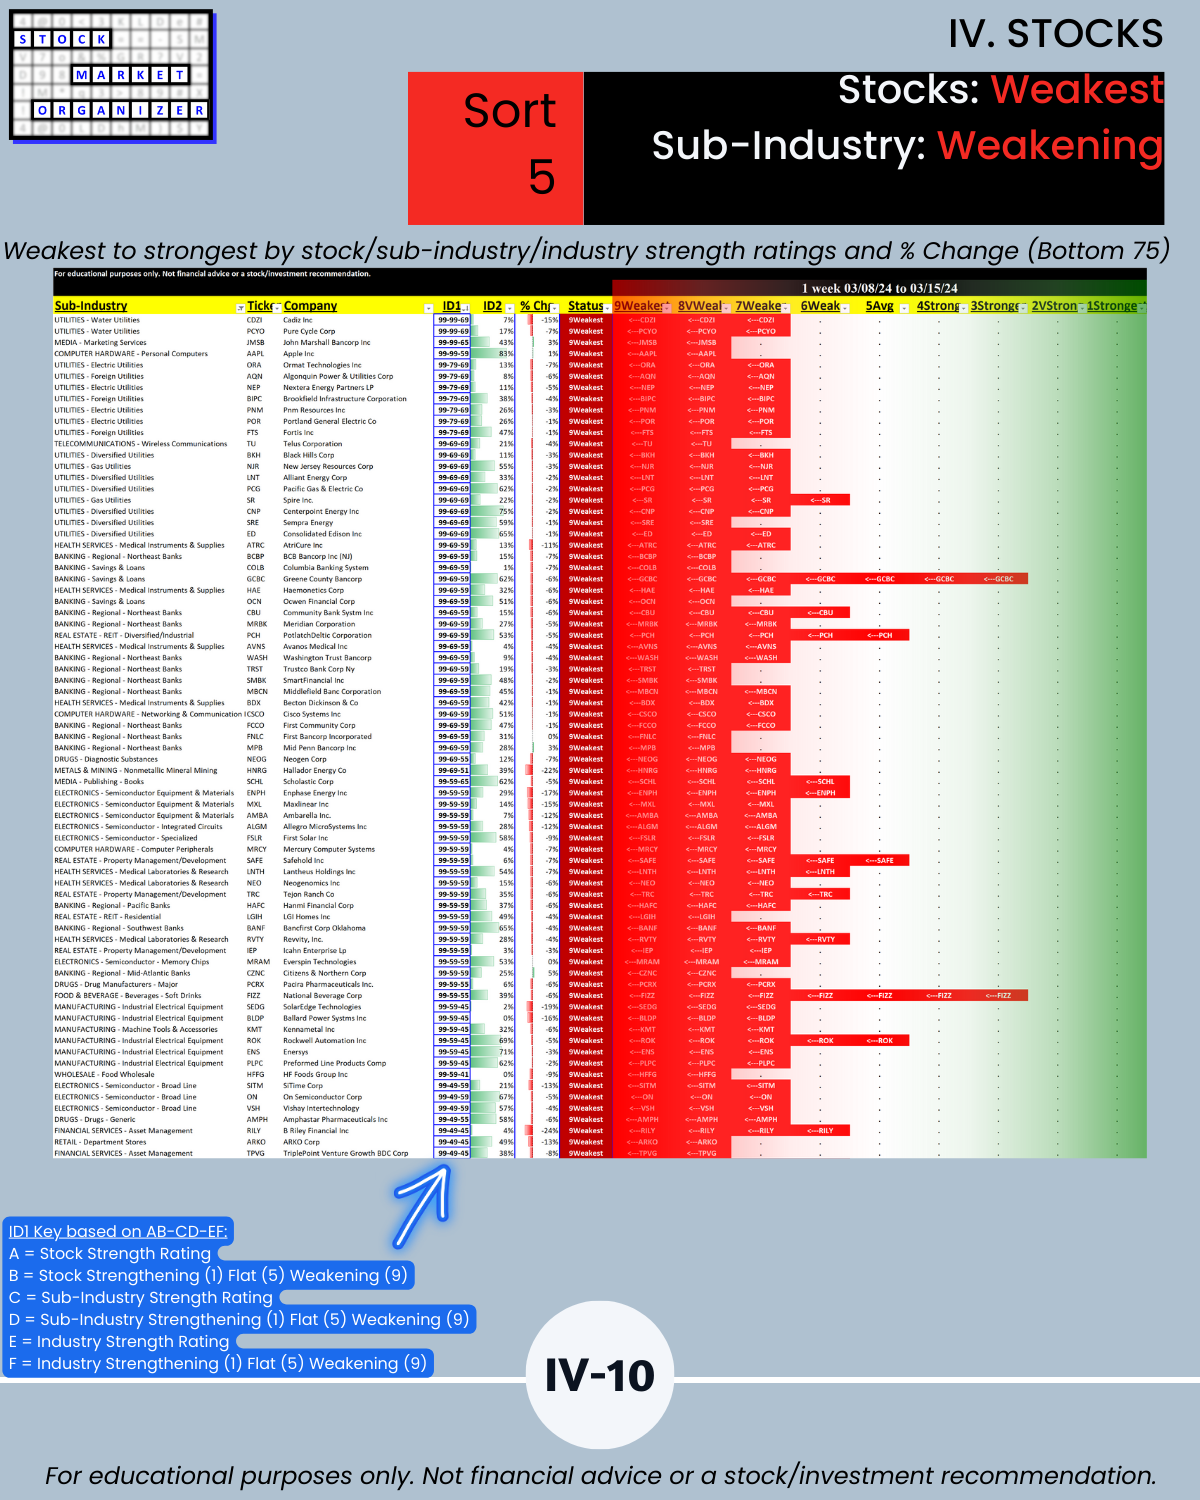
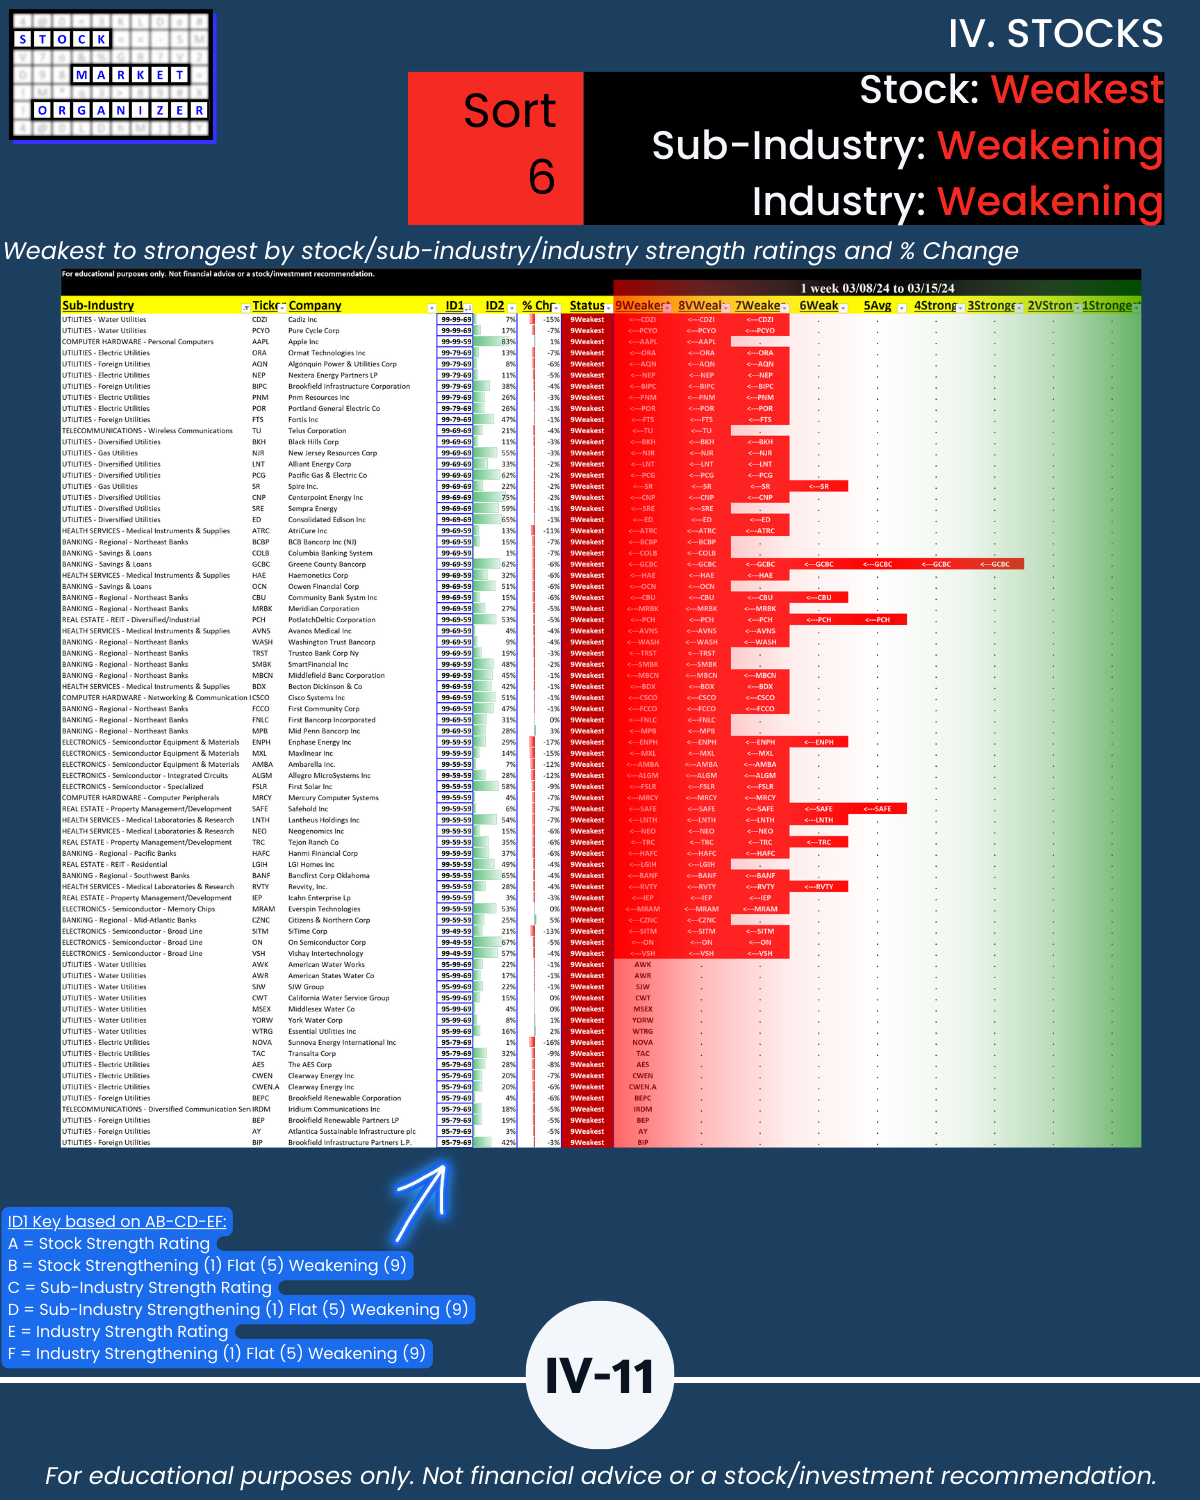
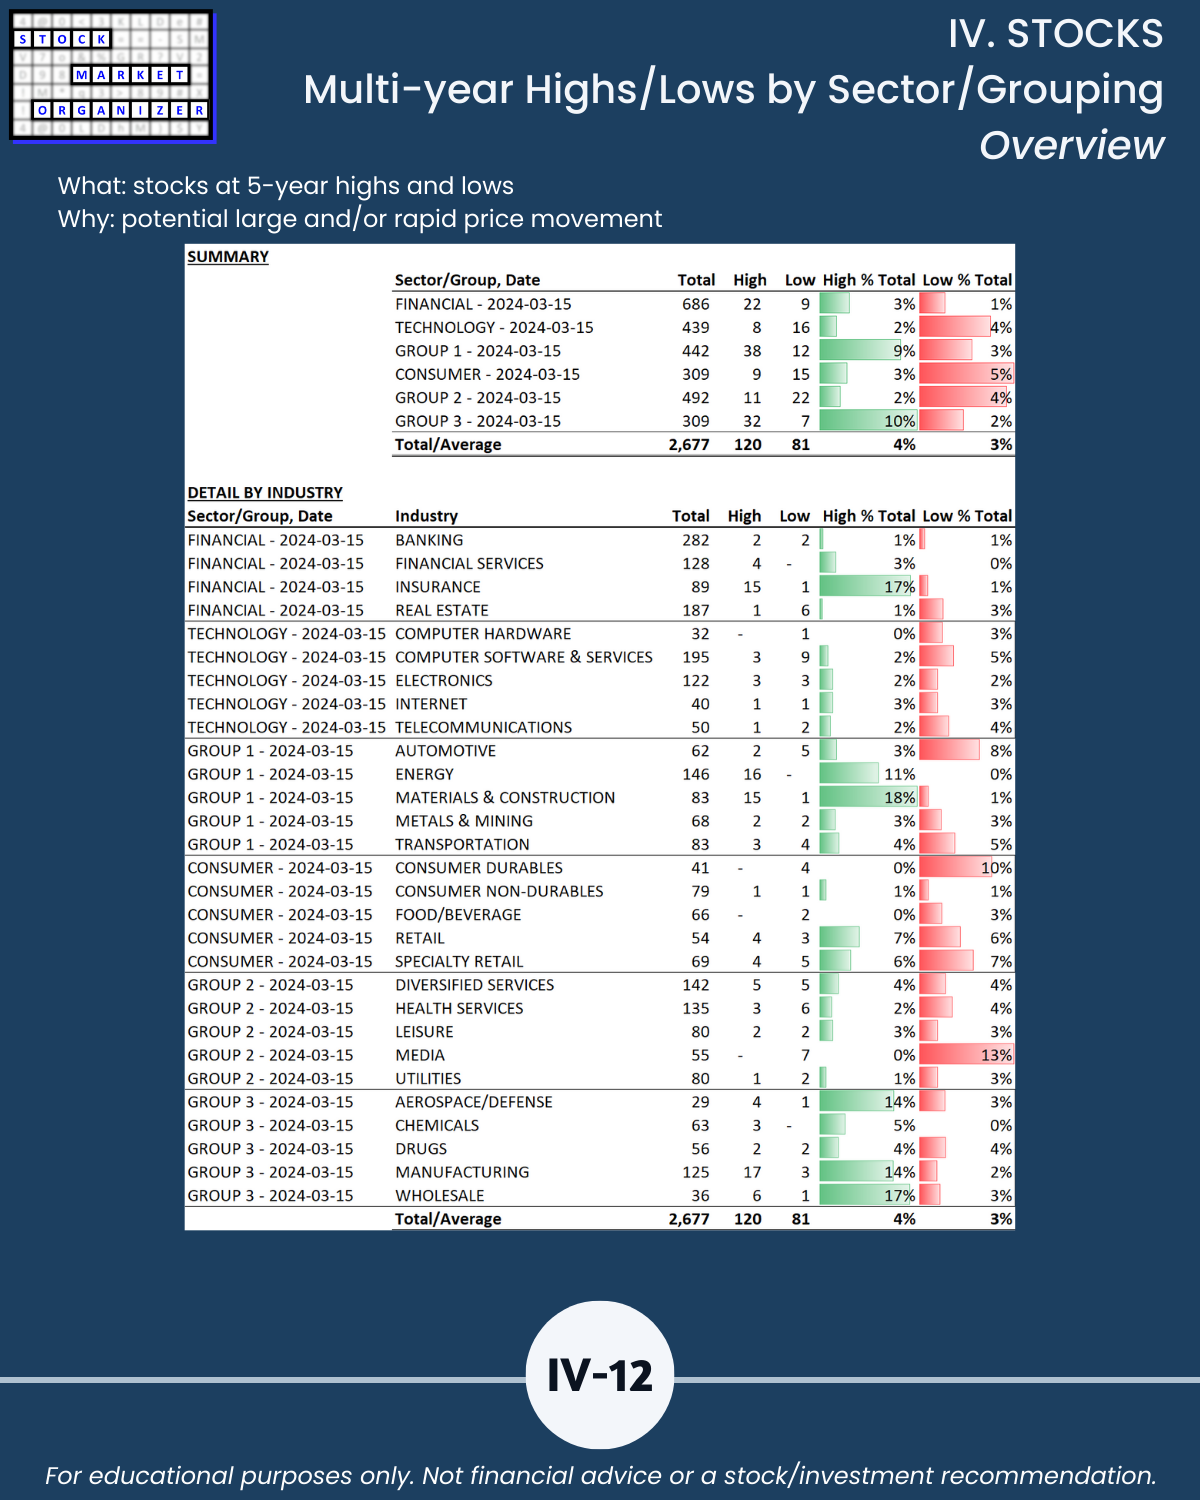
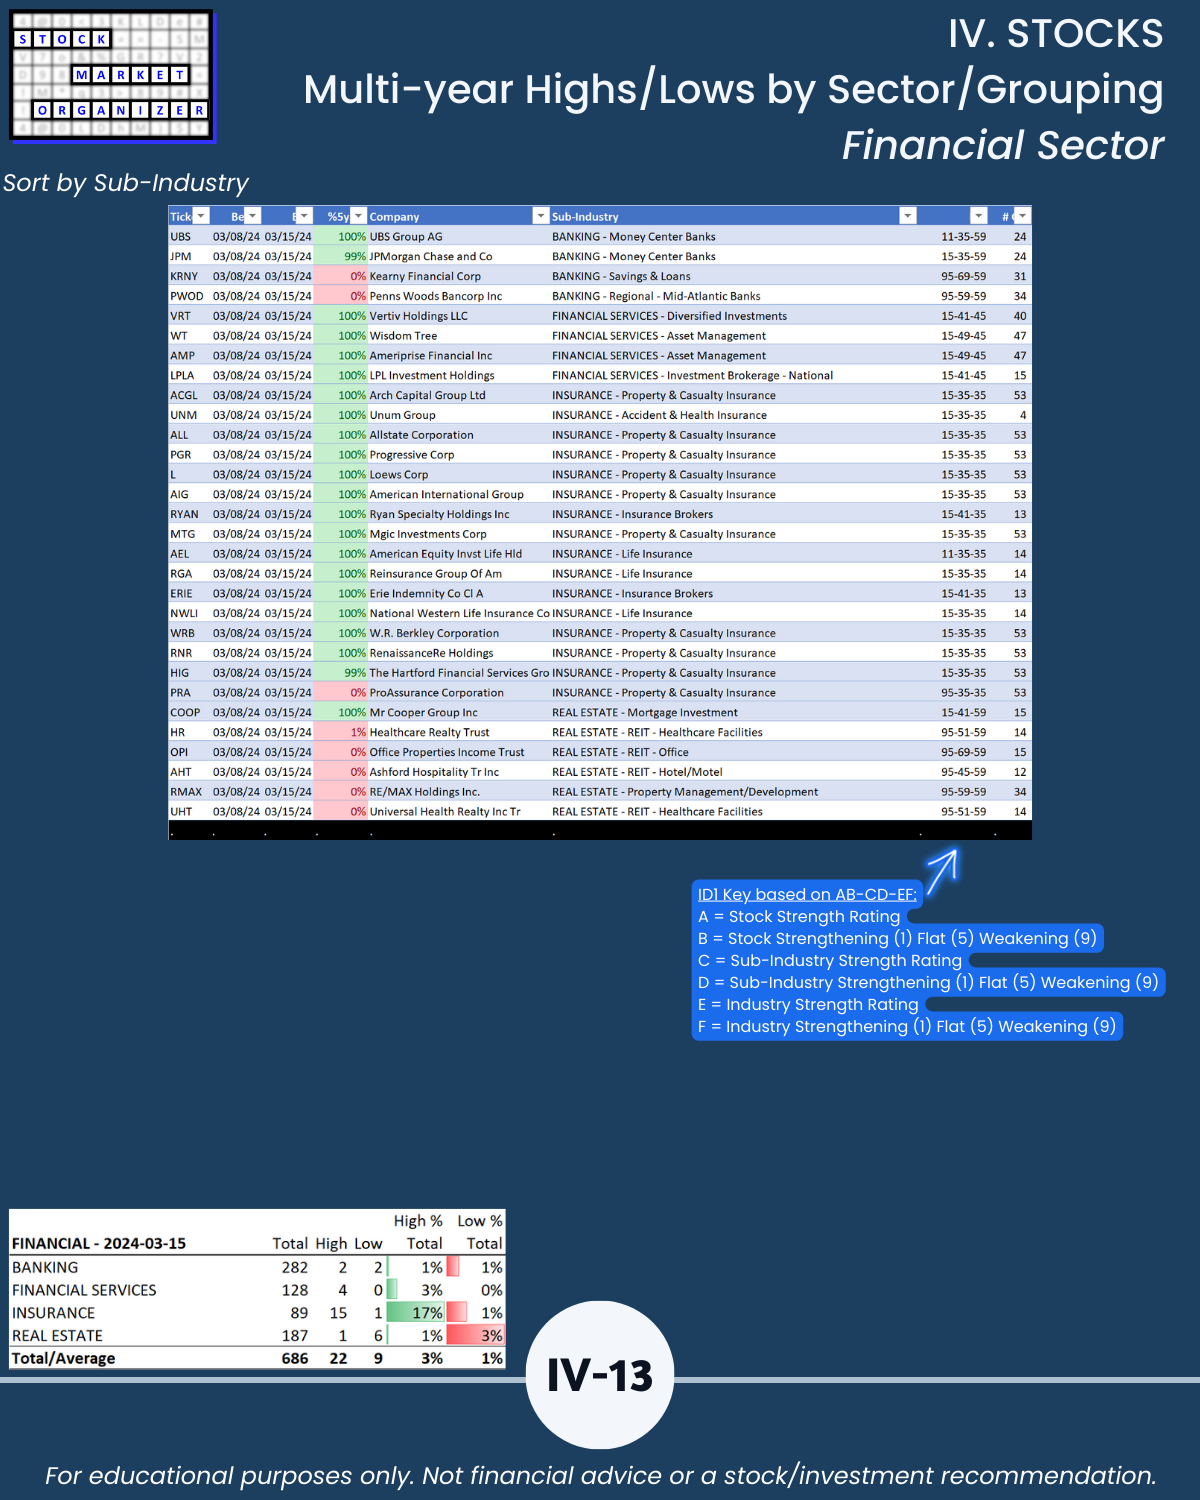
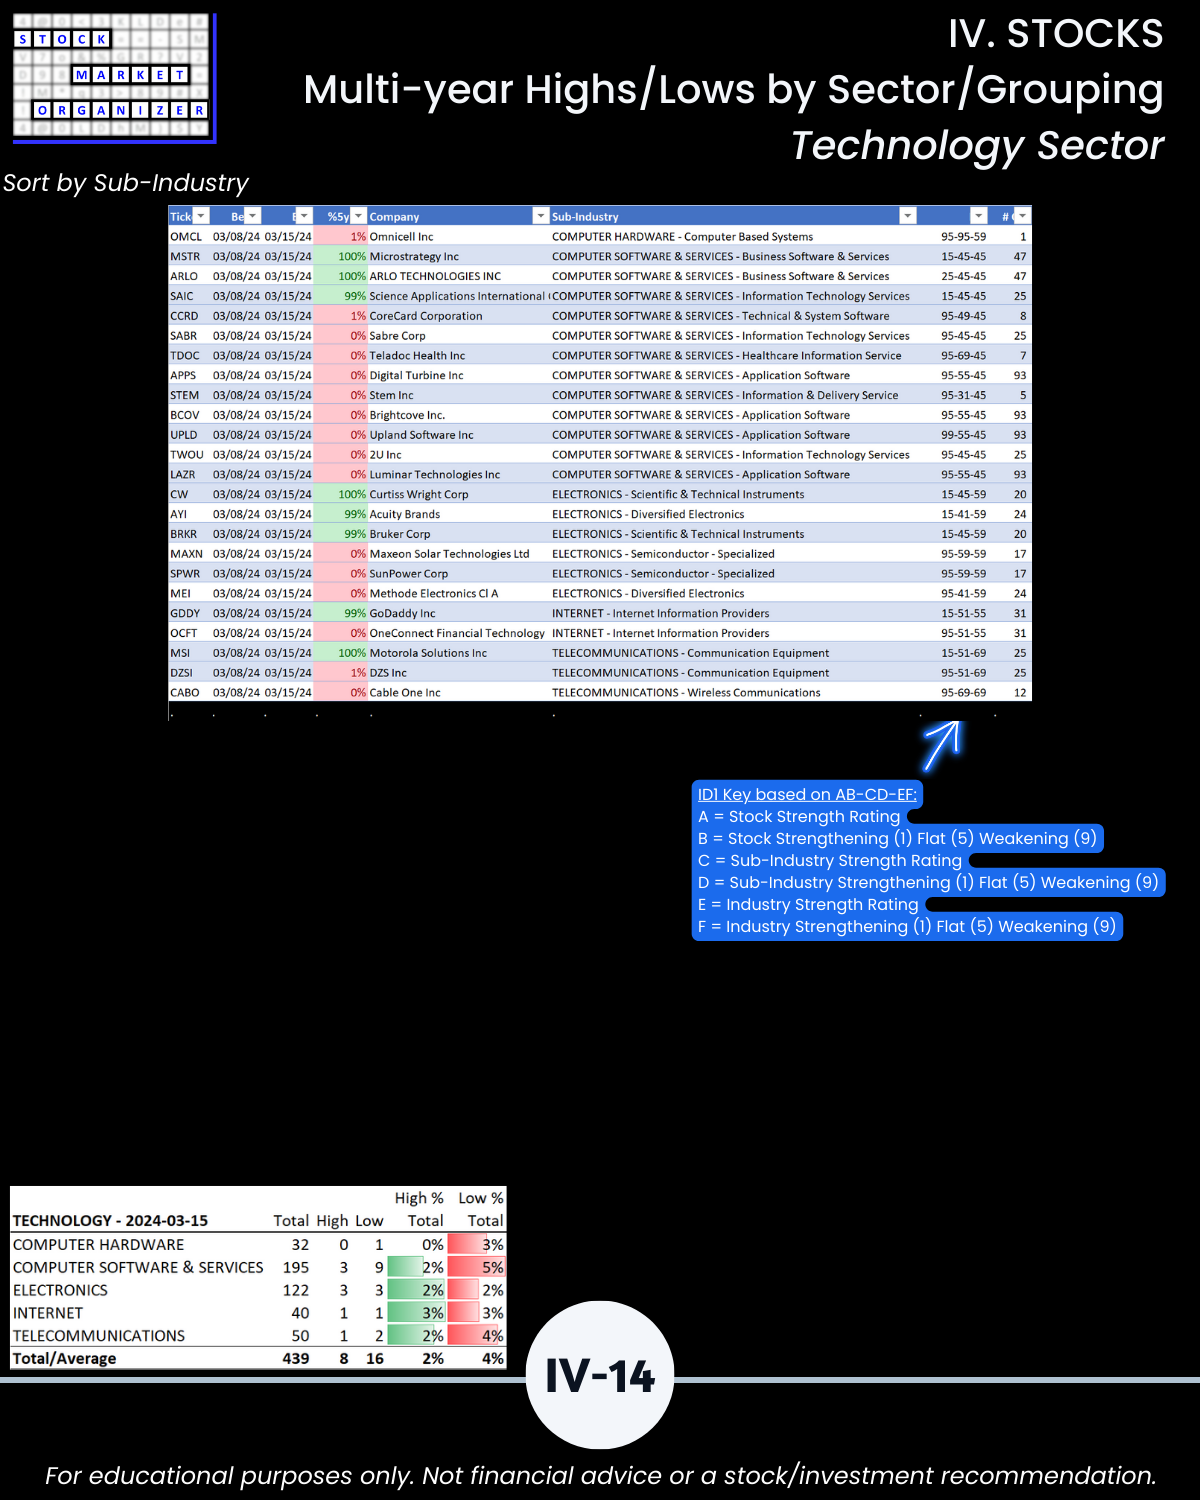
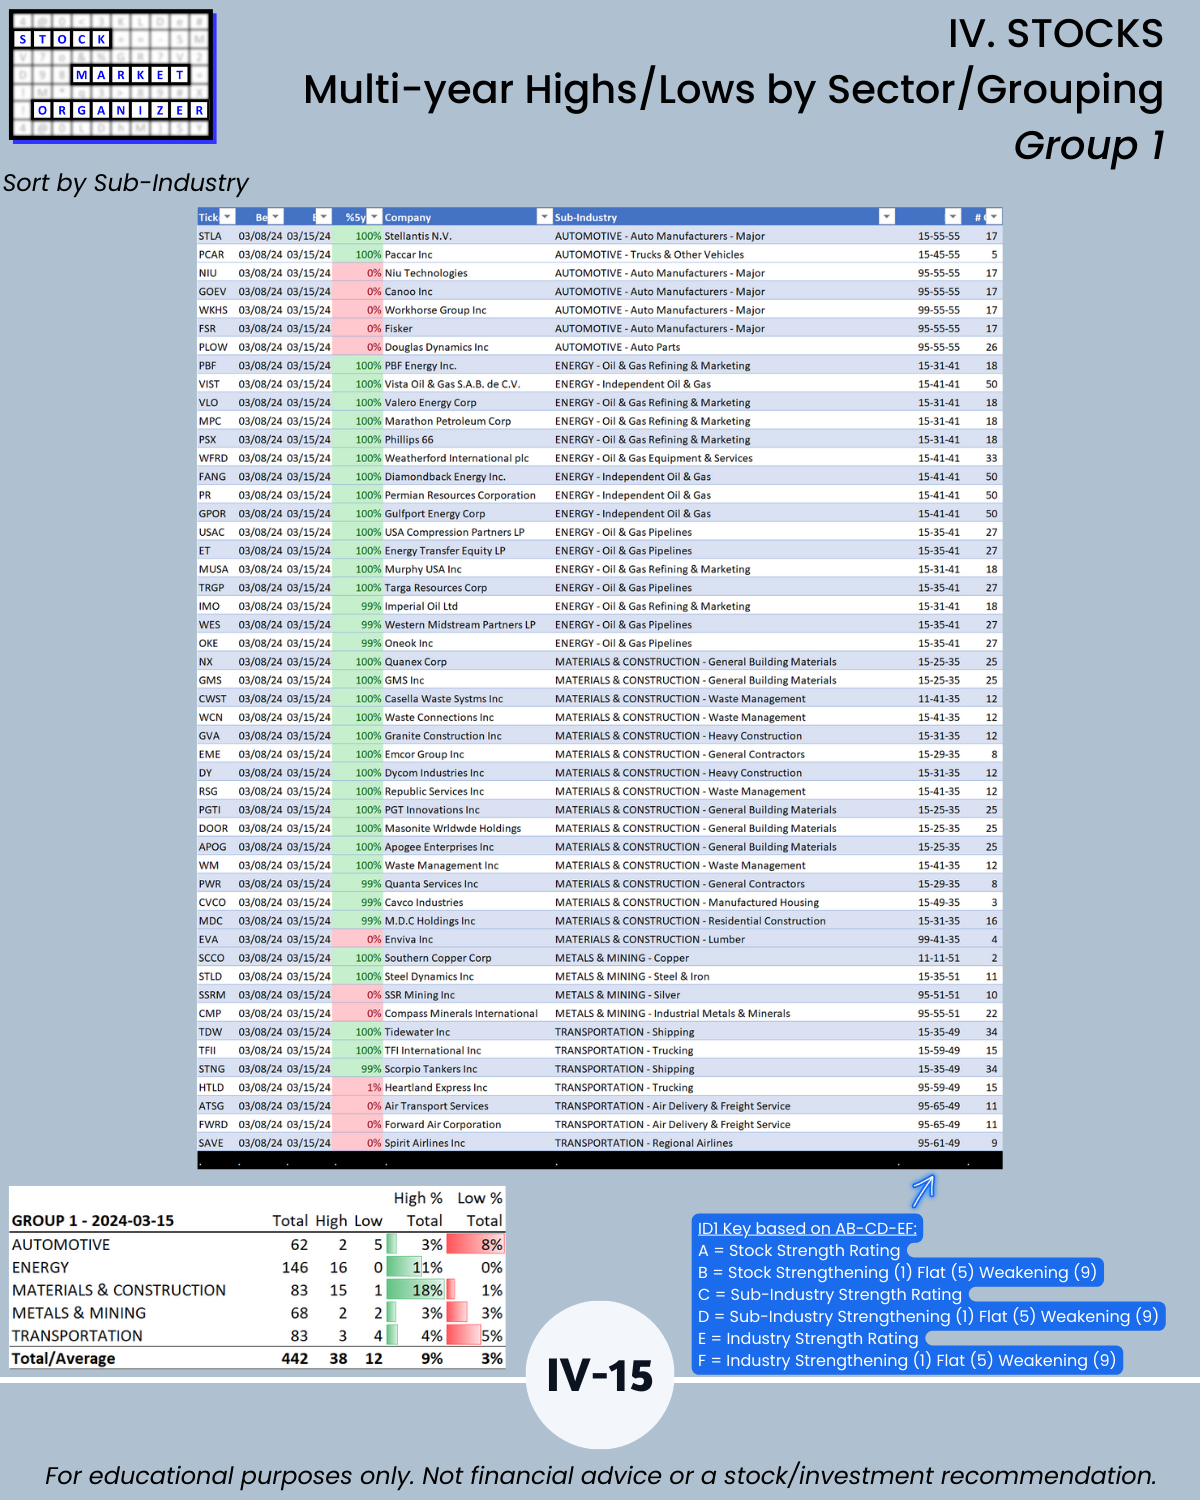
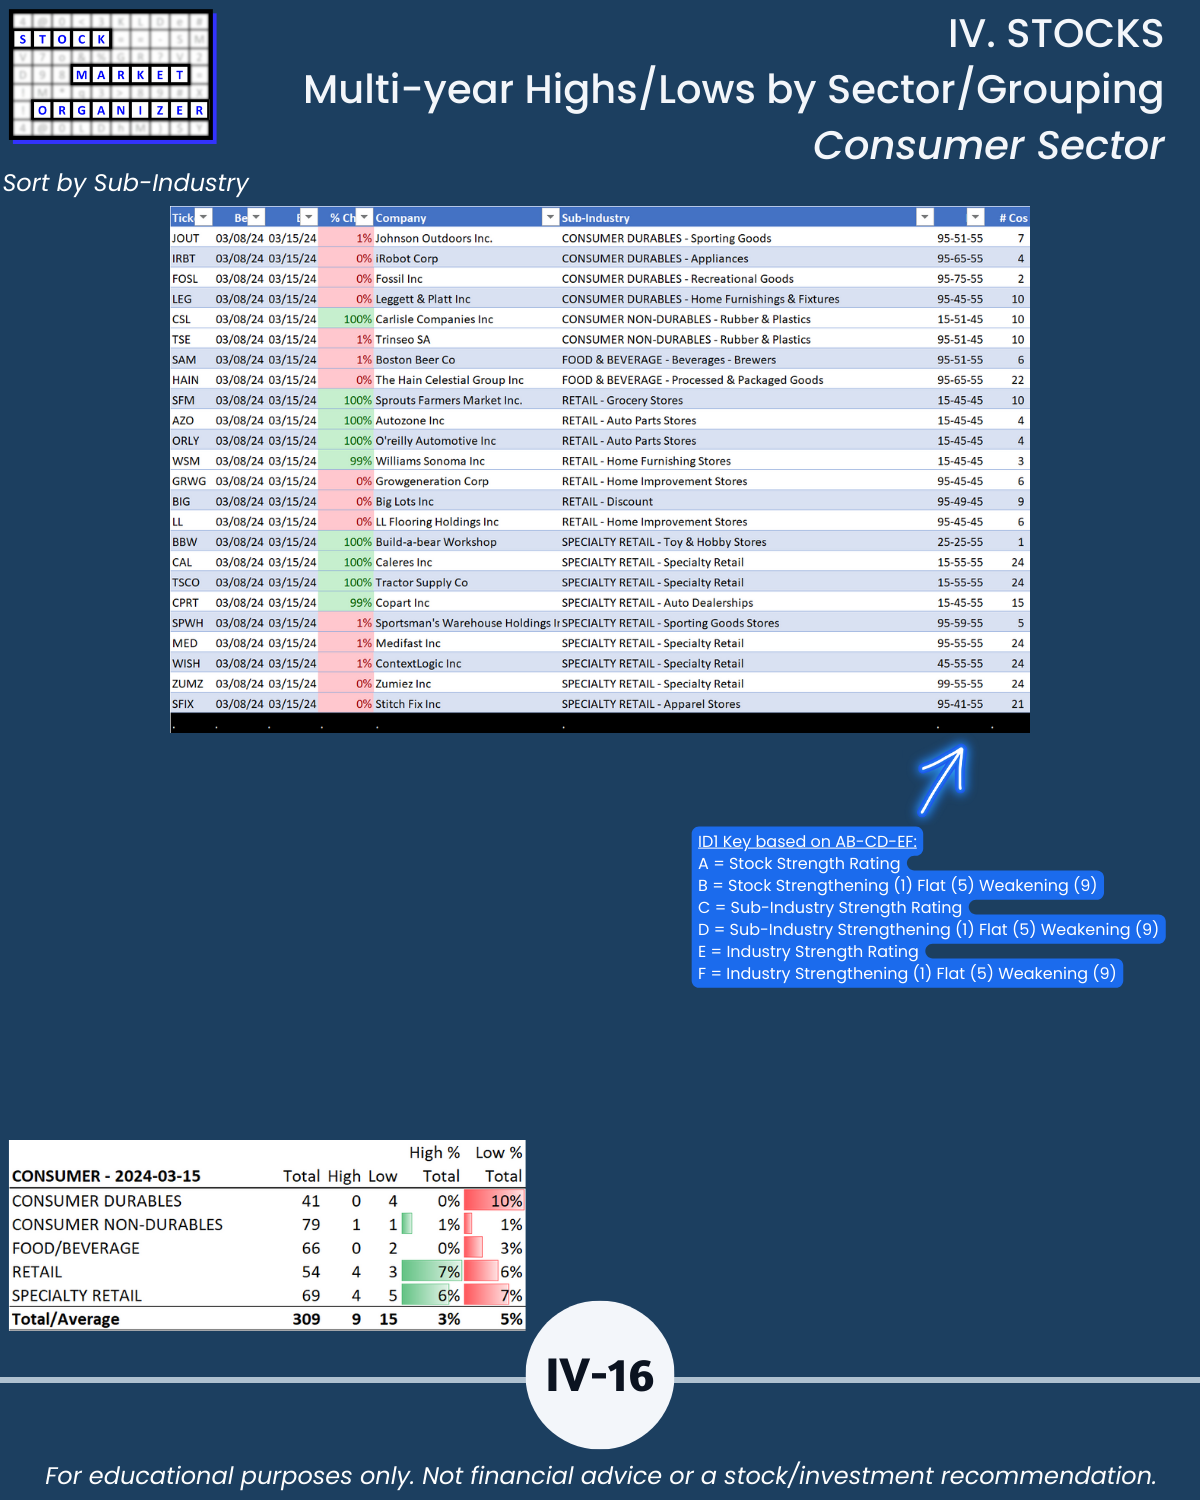
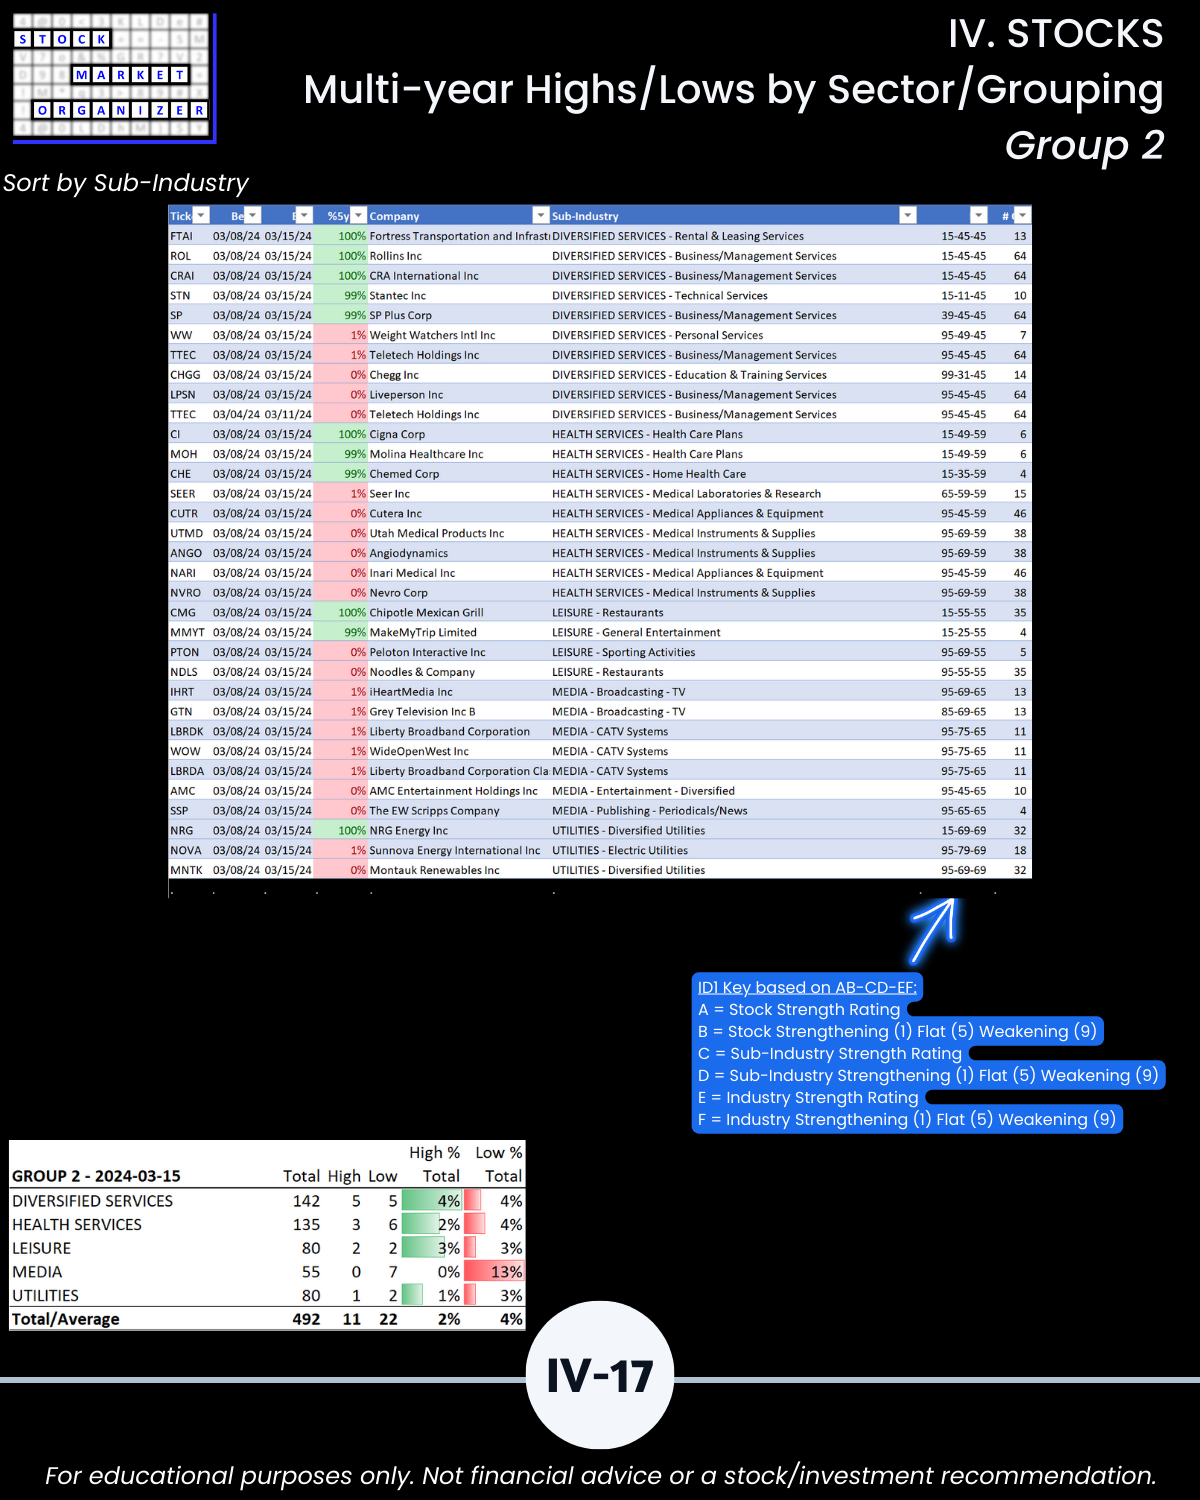
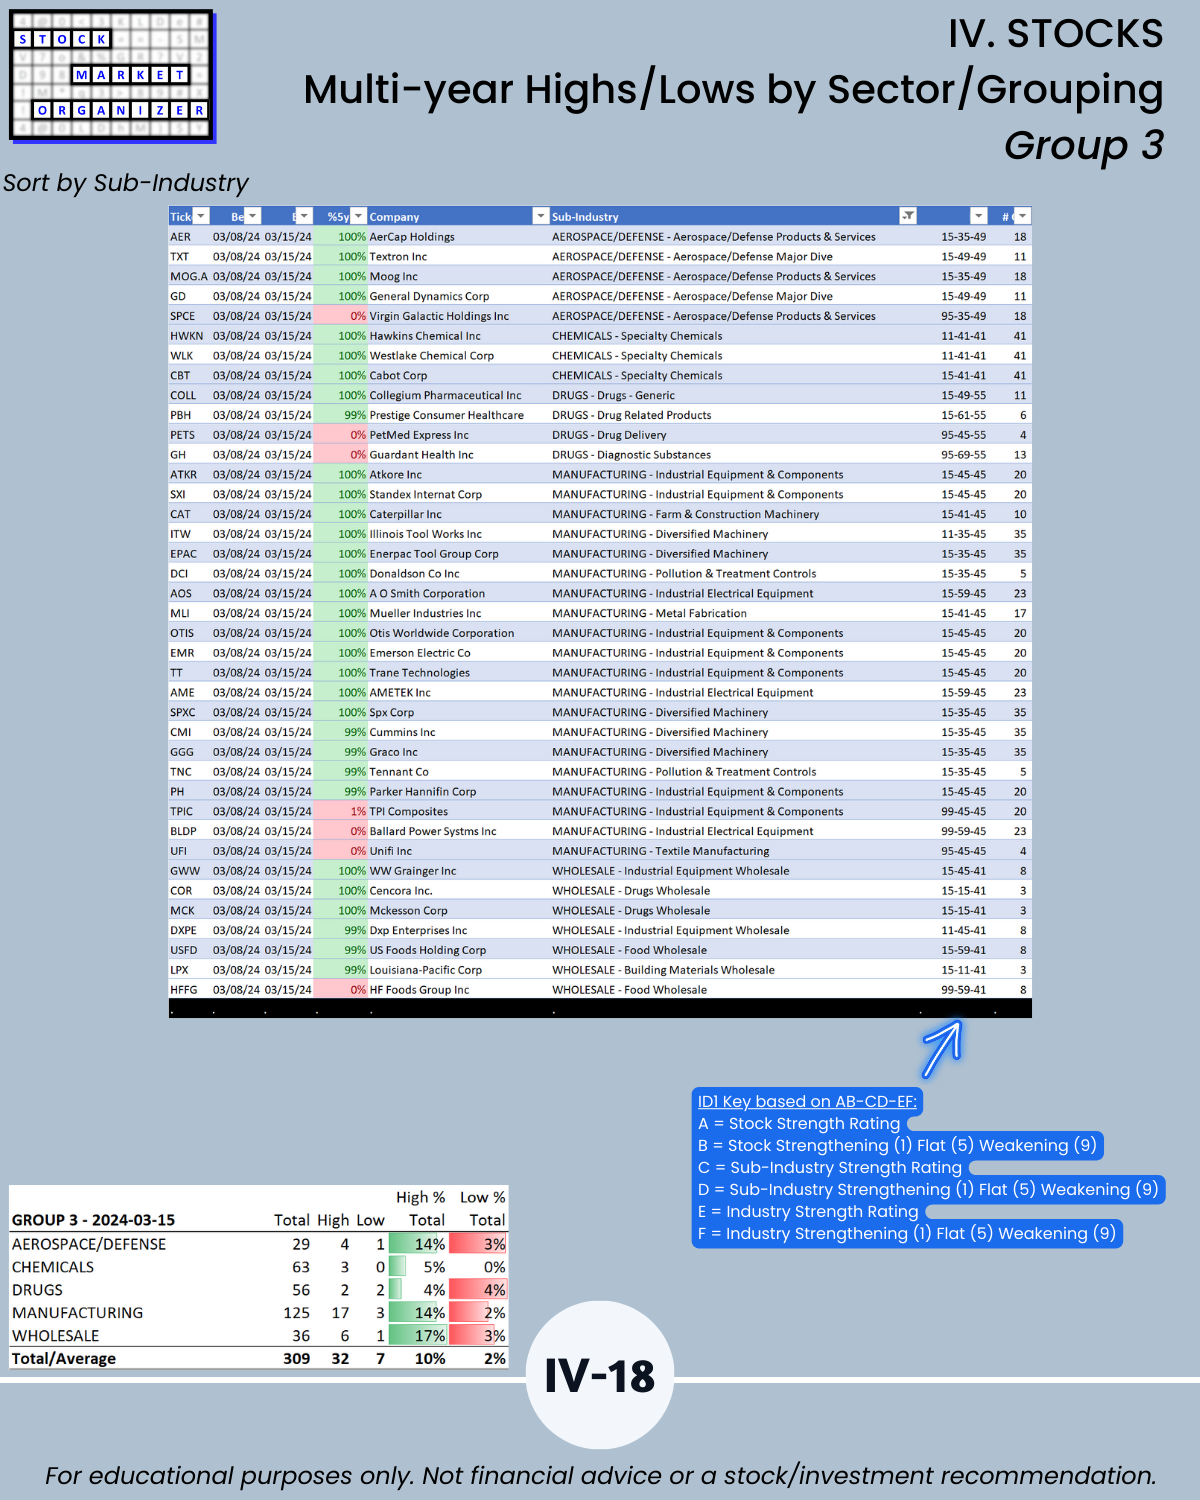
SECTION IV Stocks level:
See what outlier stocks are worth exploring – long and short – based on their strength and that of their sub-industries and industries.
Following are galleries with page-by-page views of this report.
I. MARKET/Critical System Concepts/Market Strength Score
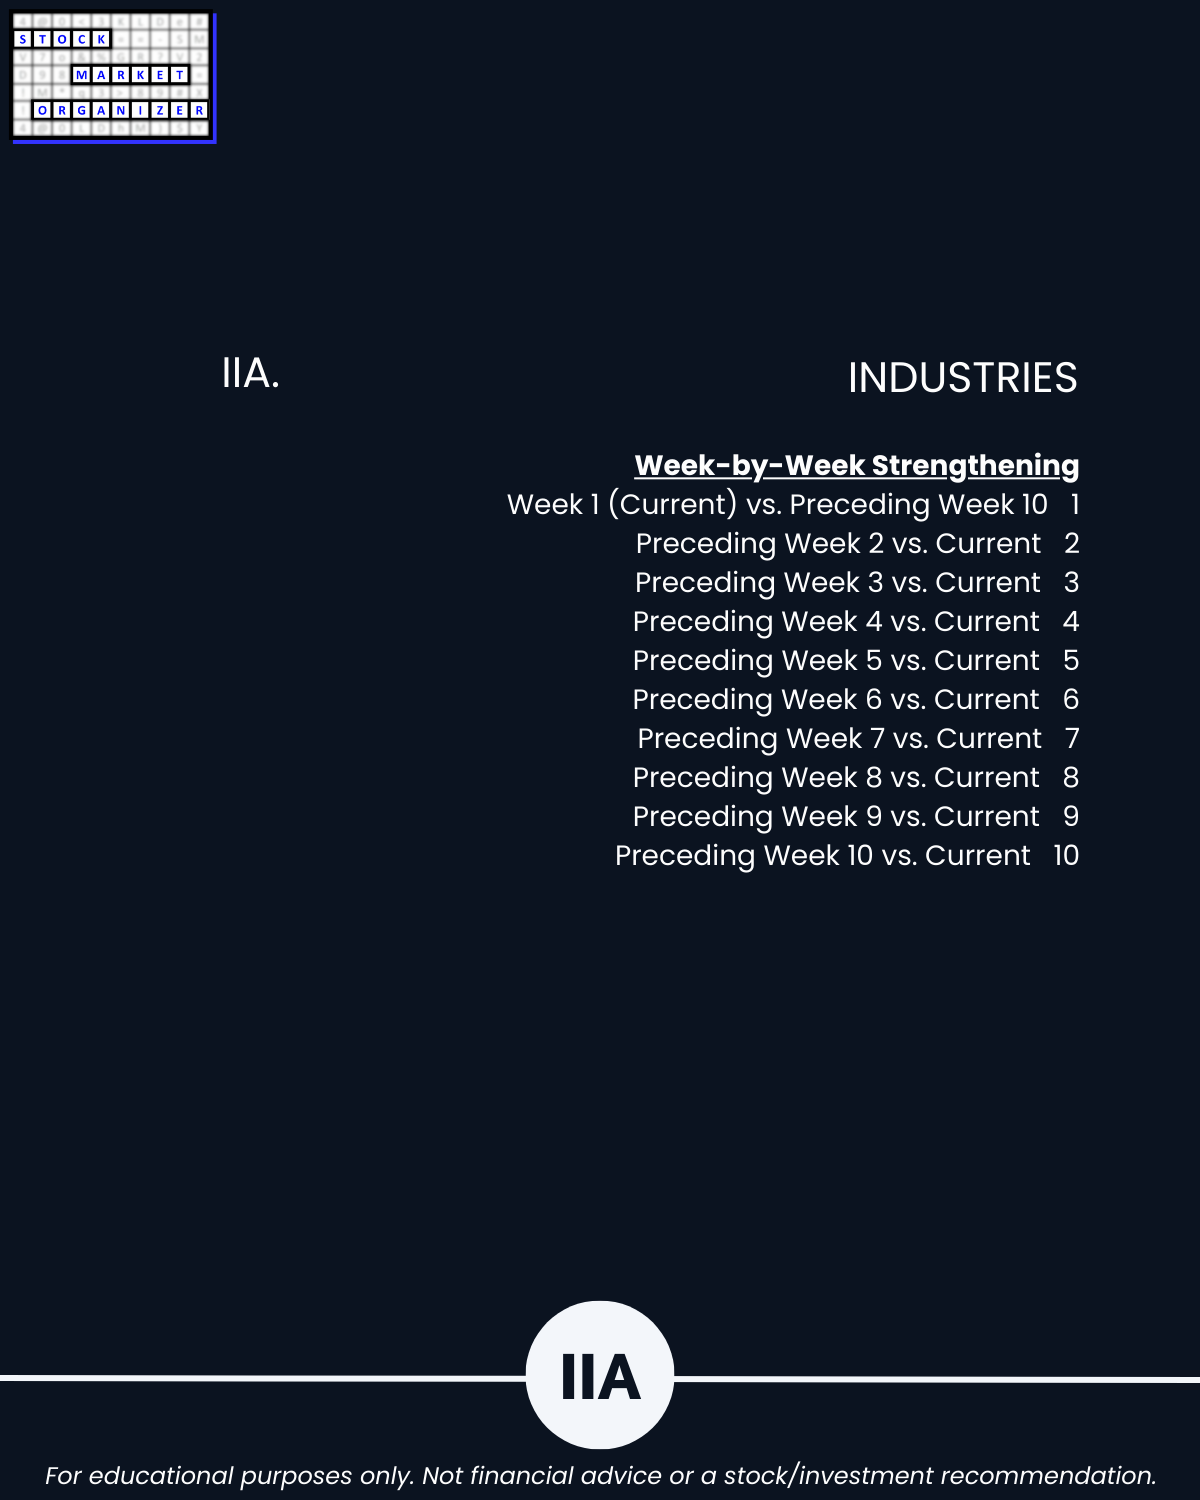
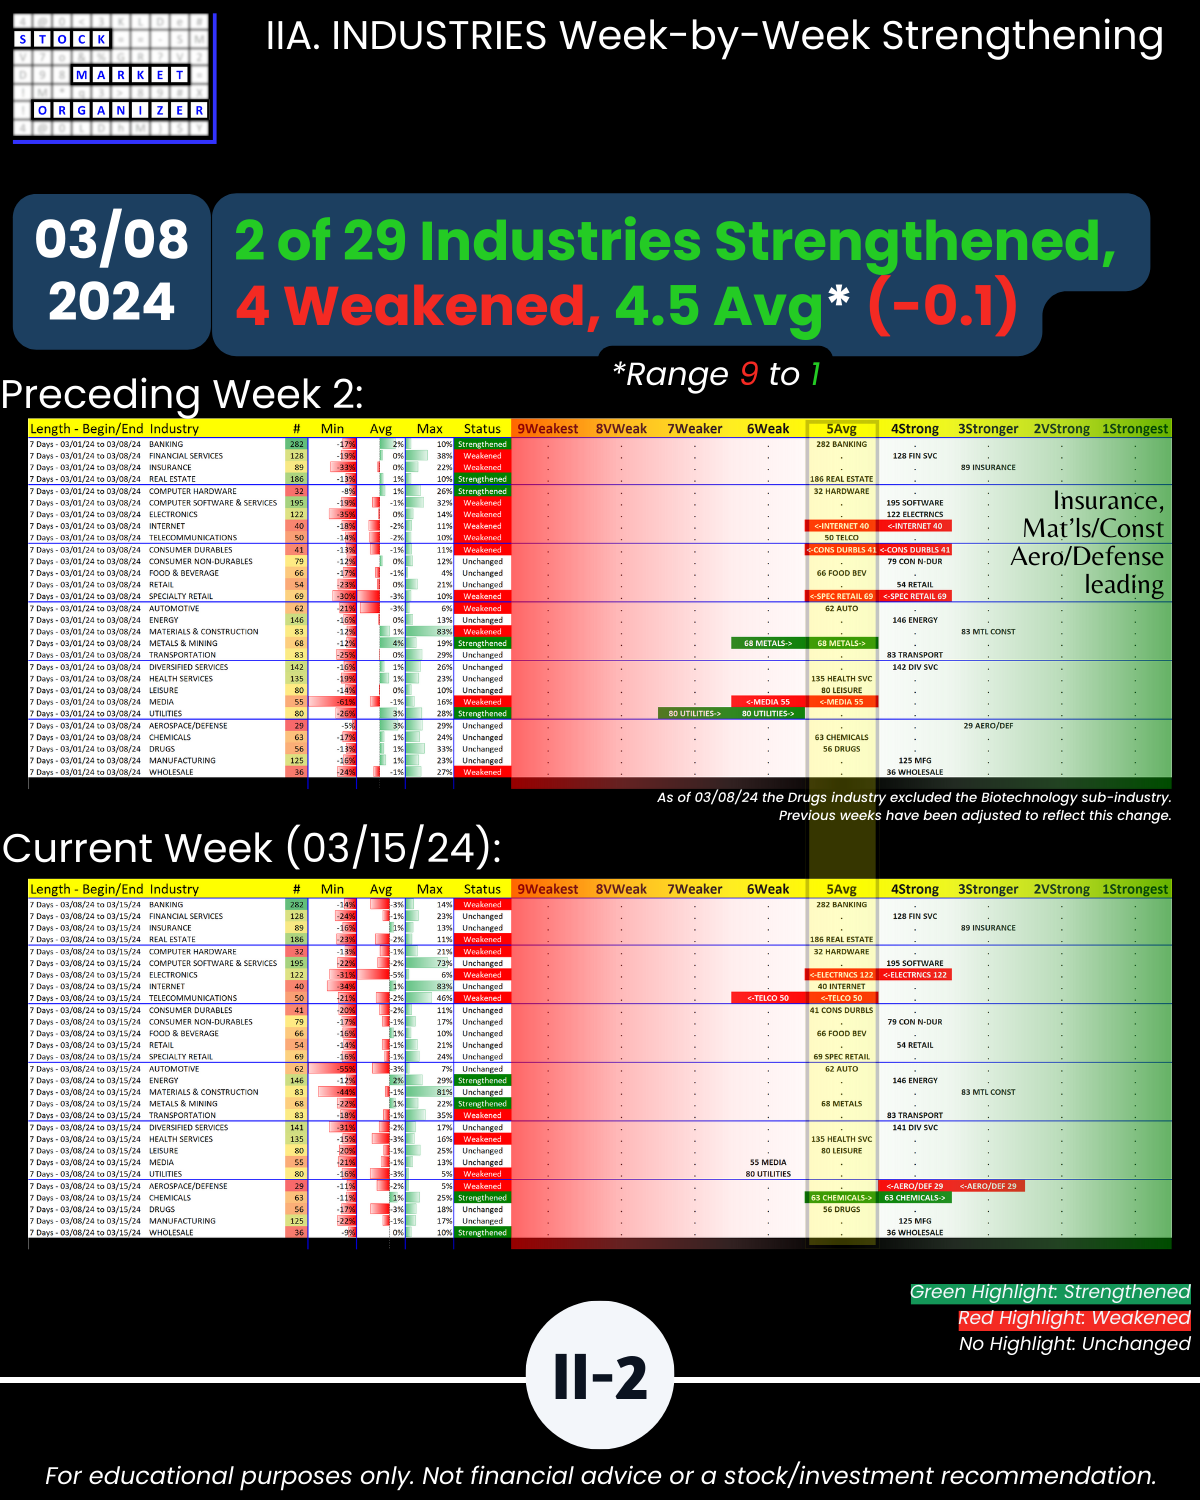
IIA. INDUSTRIES/10-Week Week-by-Week Industry Strength
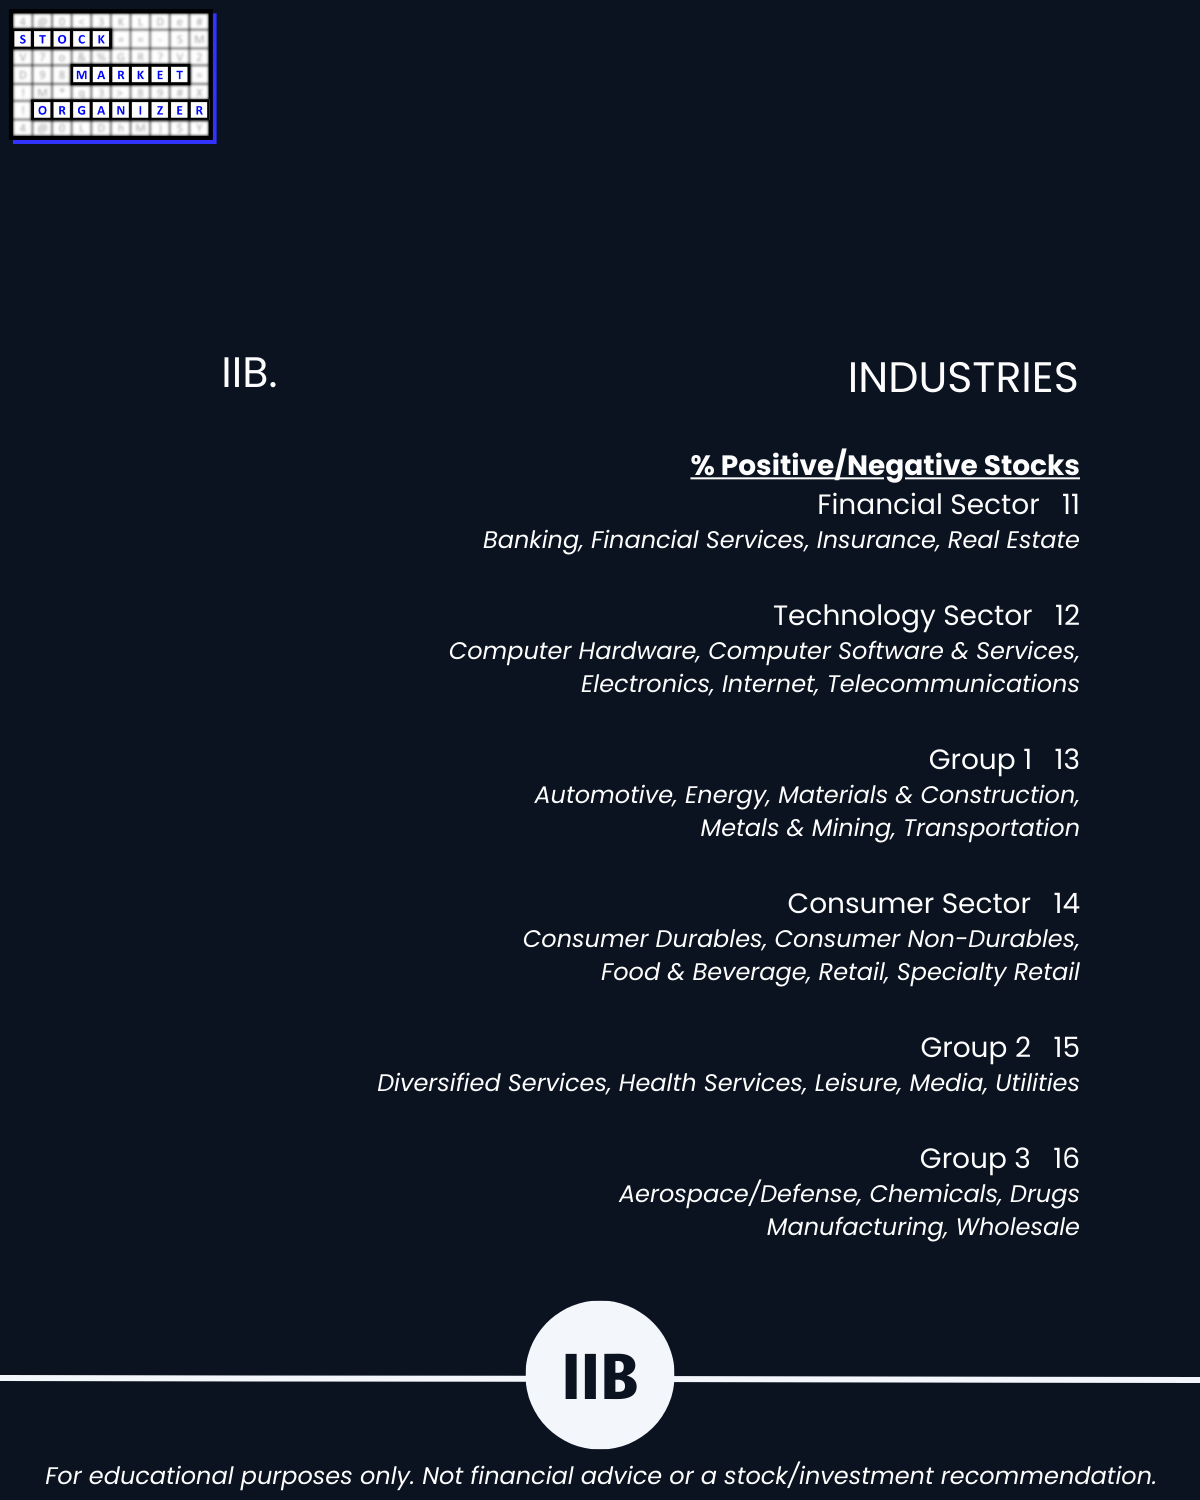
IIB. INDUSTRIES/% Positive/Negative Stocks
III. SUB-INDUSTRIES/10-Week Individual Sub-Industry Strength Reports
IV. STOCKS/Stock Sorts, Multi-Year Highs/Lows by Sector/Grouping
IV. Exhibits - System Foundations