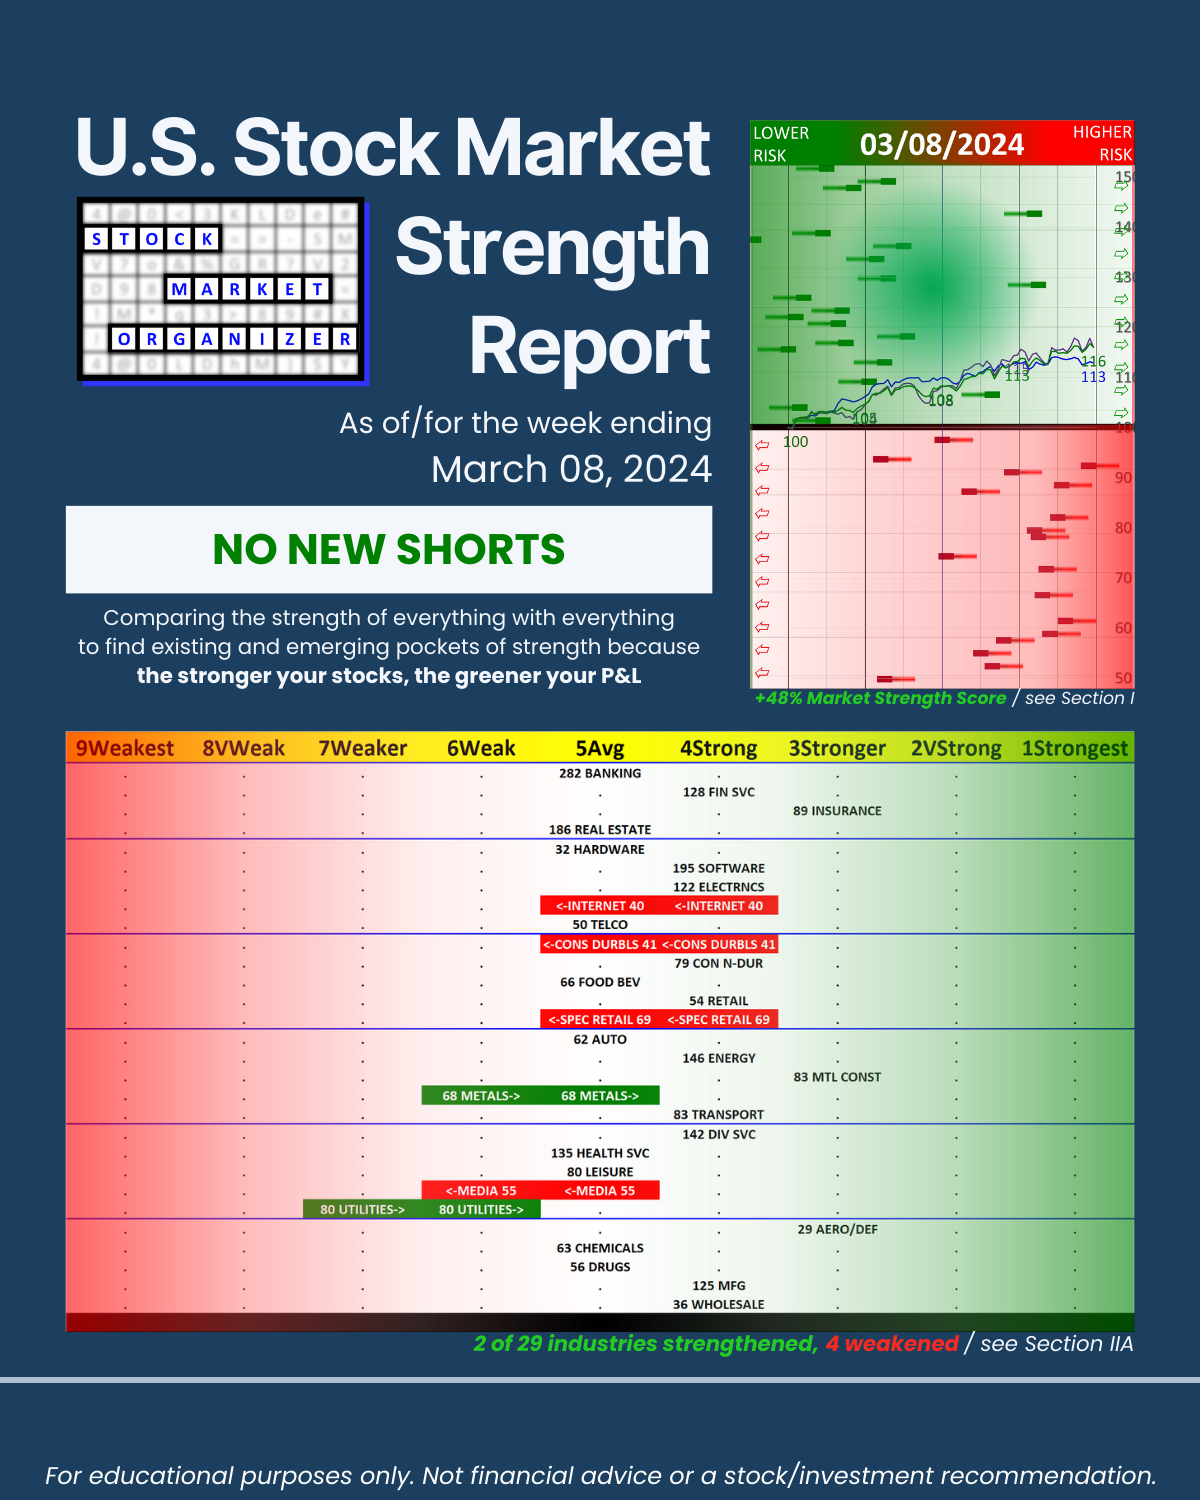
SMO Exclusive: U.S. Stock Market Strength Report 2024-03-08 (no new Shorts)

3/8/24 comprehensive U.S. Stock Market Strength Report attached. NVDA has a 36 P/S (FY24 revenues), a $260B mid-day market cap drop, and a bearish engulfing candle to show for its Friday efforts. If you are like me you don’t care about these details, you care about the implications and conduct original analysis addressing the following:
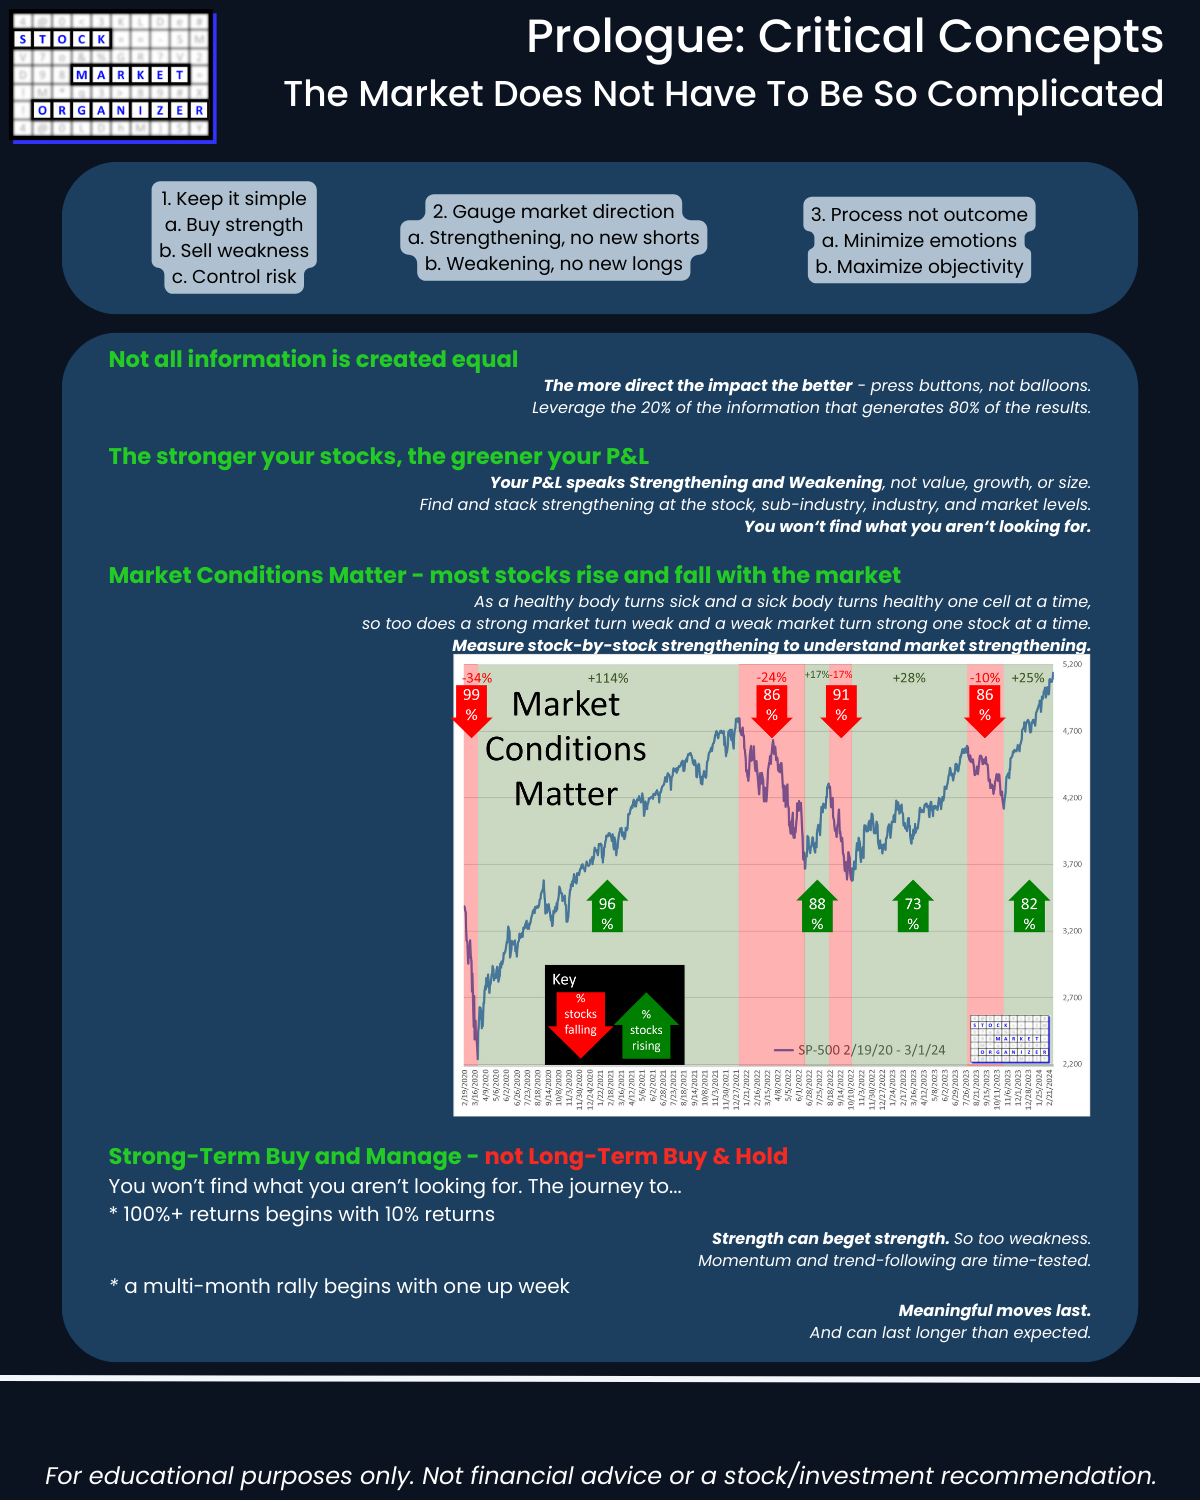
🔹 Prices uncoupled from fundamentals = opportunity.
🔹 The stronger your stocks the greener your P&L.
🔹 Market conditions matter.
🔹 Multi-month+ rallies begin with one up week.
🔹 100%+ returns start as 10% returns.
🔹 You won’t find what you aren’t looking for.
BACKGROUND/GOAL
What NVDA has been:
A rising outlier stock in a rising industry grouping (AI) in a rising market.
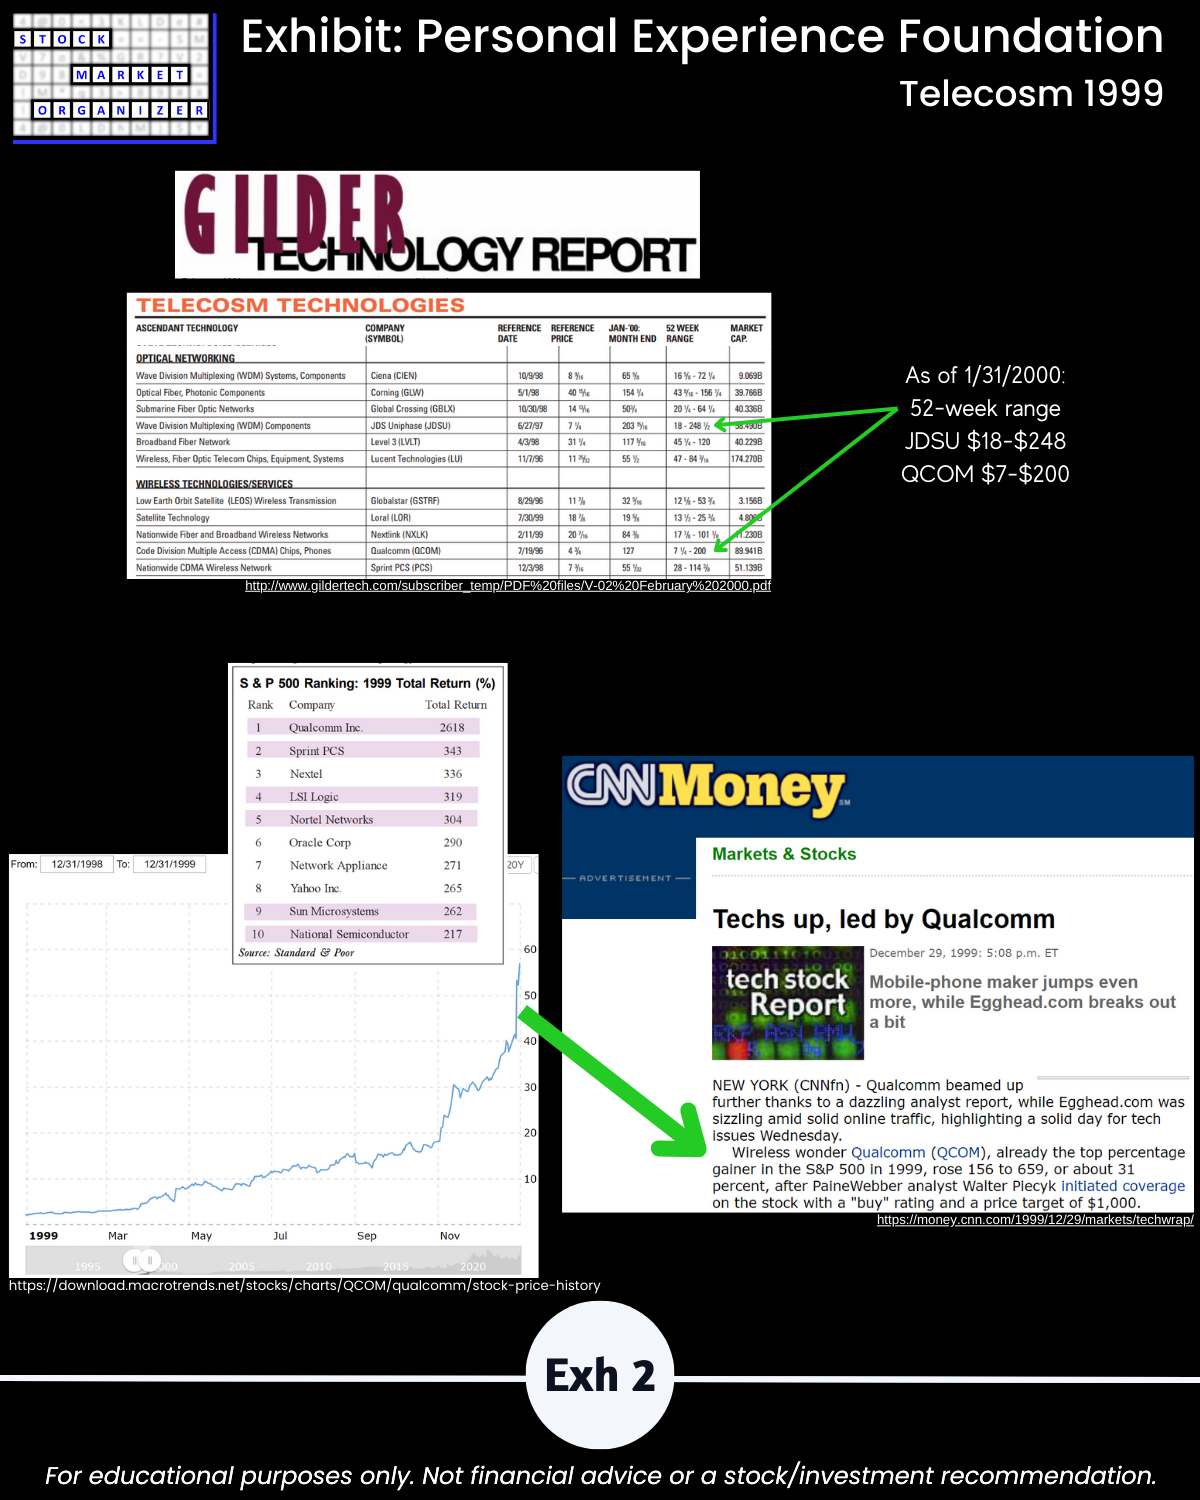
What CSCO was in 1999:
A rising outlier stock in a rising industry grouping (internet buildout) in a rising market.
MY GOAL: to stack strength in the direction of outlier stocks.
The market does not have to be so complicated.
ADDRESSING THE ABOVE, THIS REPORT:
🔹 Looks at every nook and cranny at every market level to find existing and emerging strength.
🔹 Covers
- 1 stock market divided into
- 6 sectors/logical industry groupings covering
- 29 industries comprised of
- 198 sub-industries and
- 2,677 stocks.
WHAT’S INSIDE
A logically-arranged top-down analysis with streamlined detail from the
- SECTION I Market level,
- SECTION II Sectors/Industries level,
- SECTION III Sub-industries level, and
- SECTION IV Stocks level.
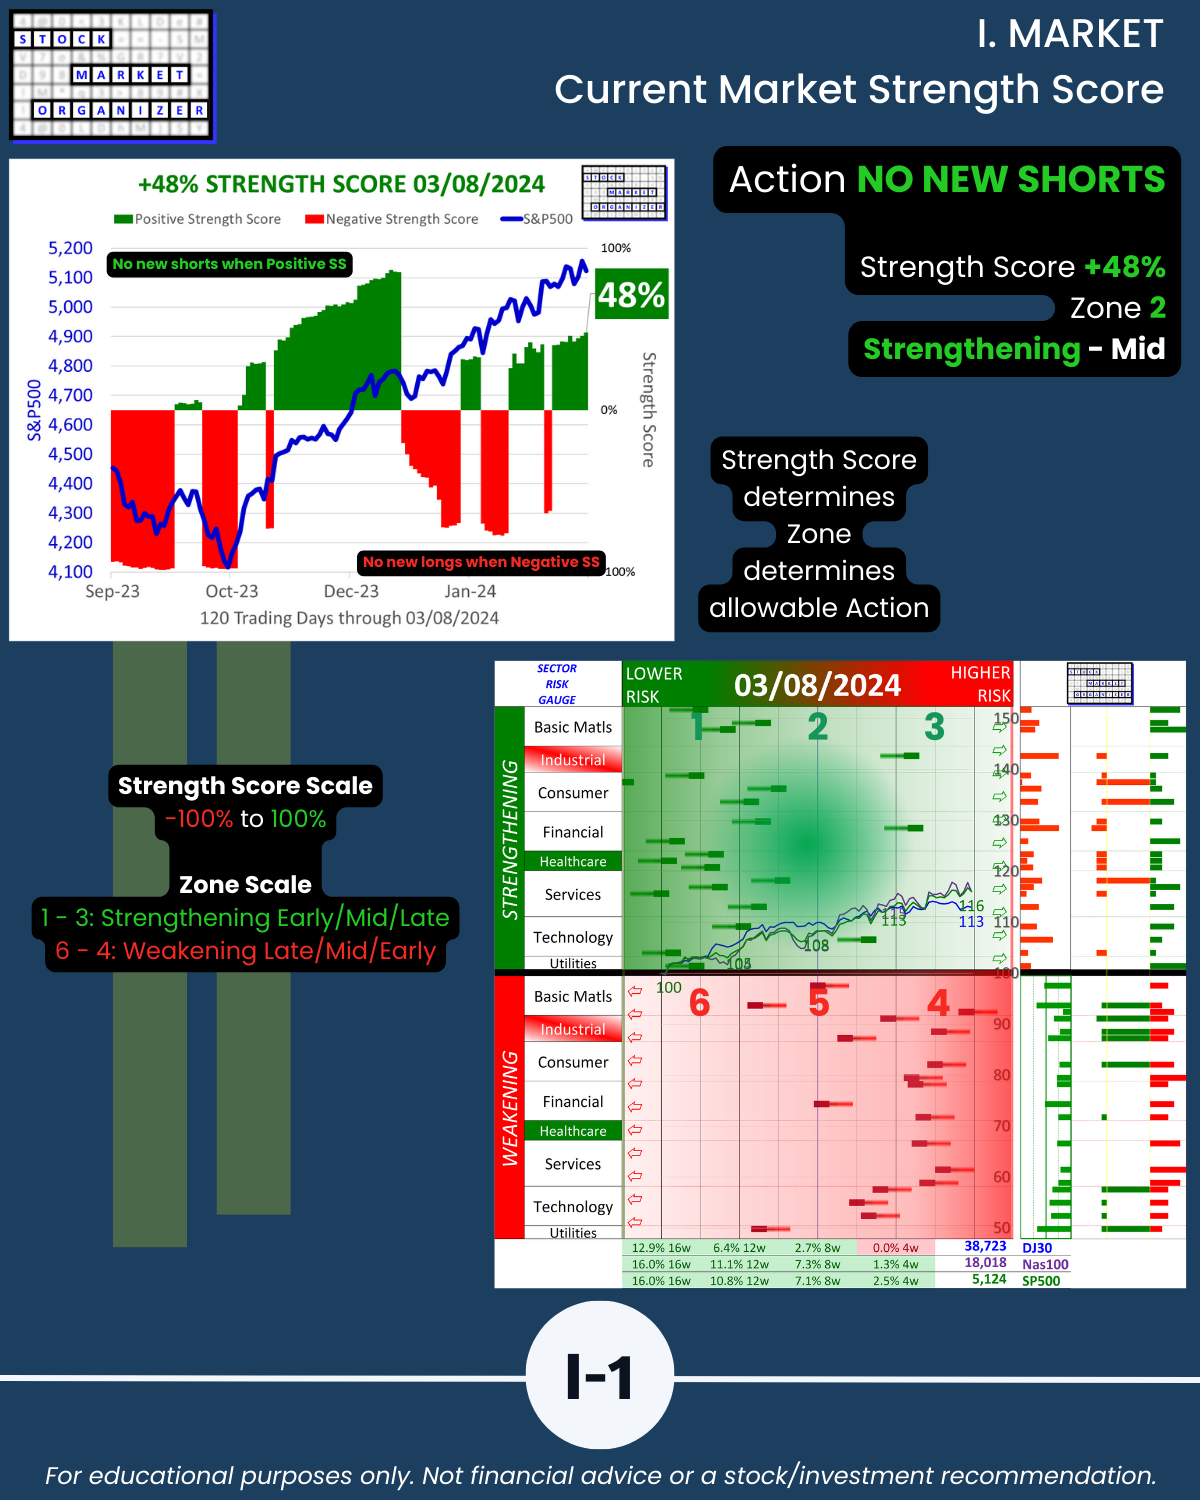
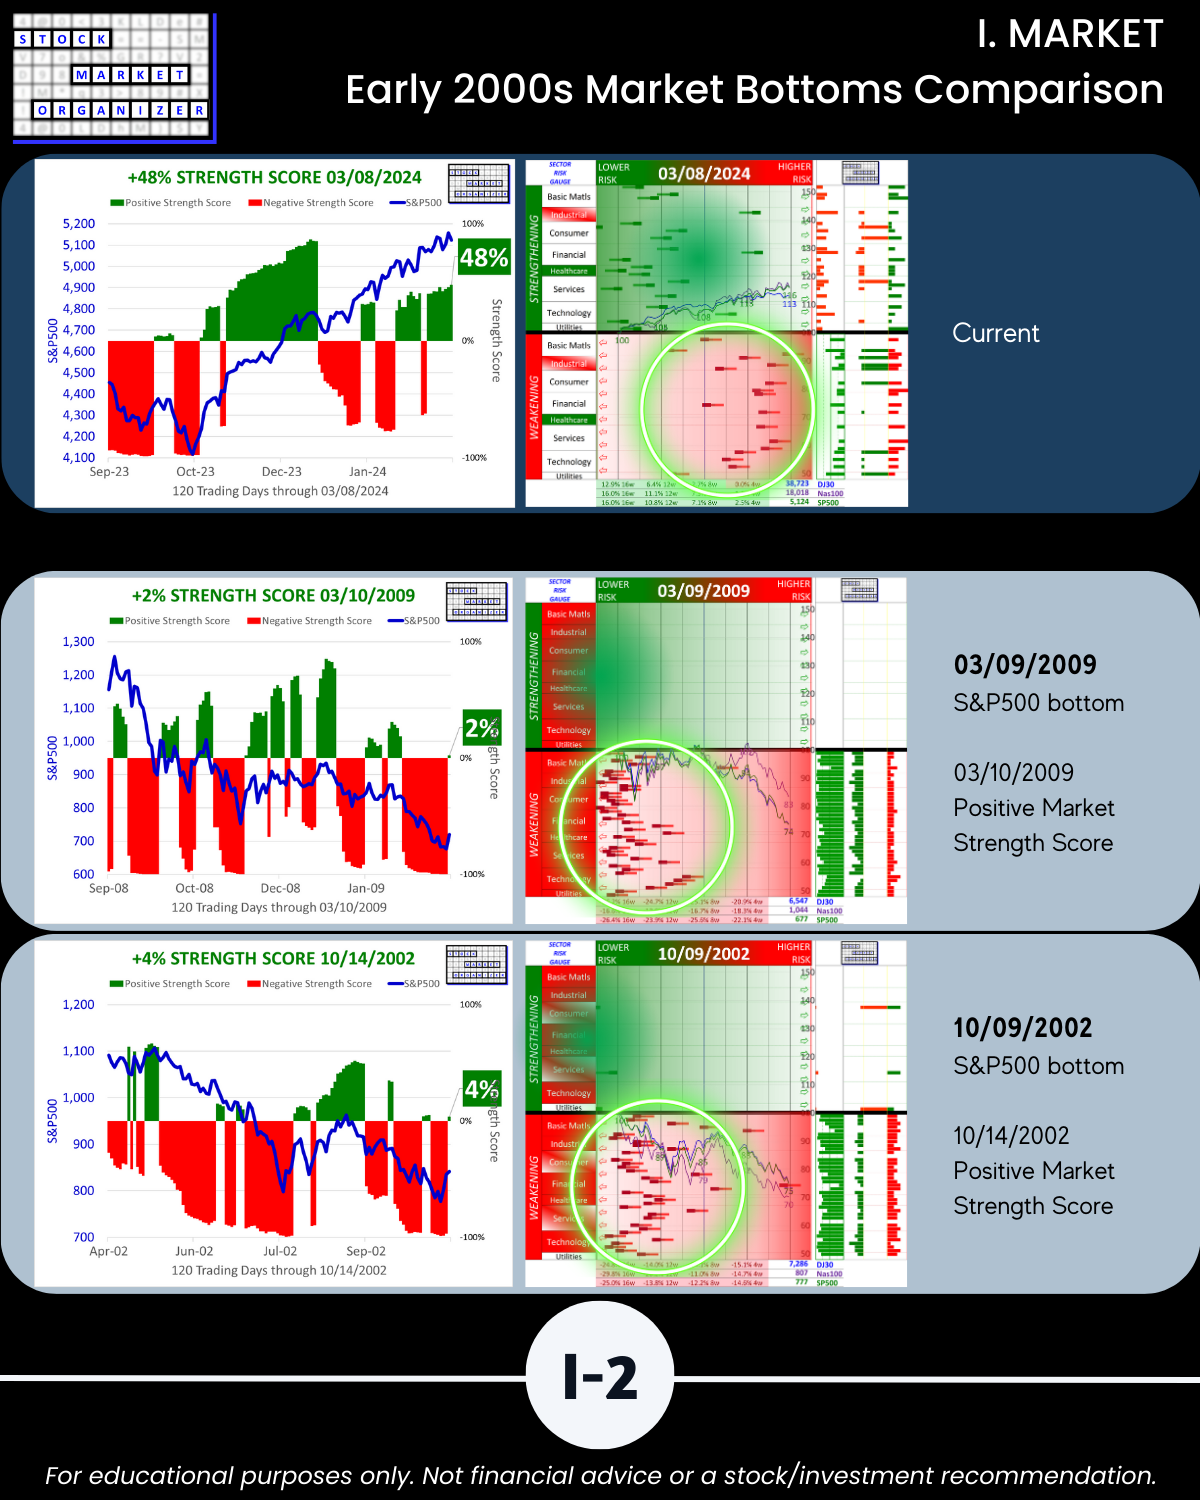
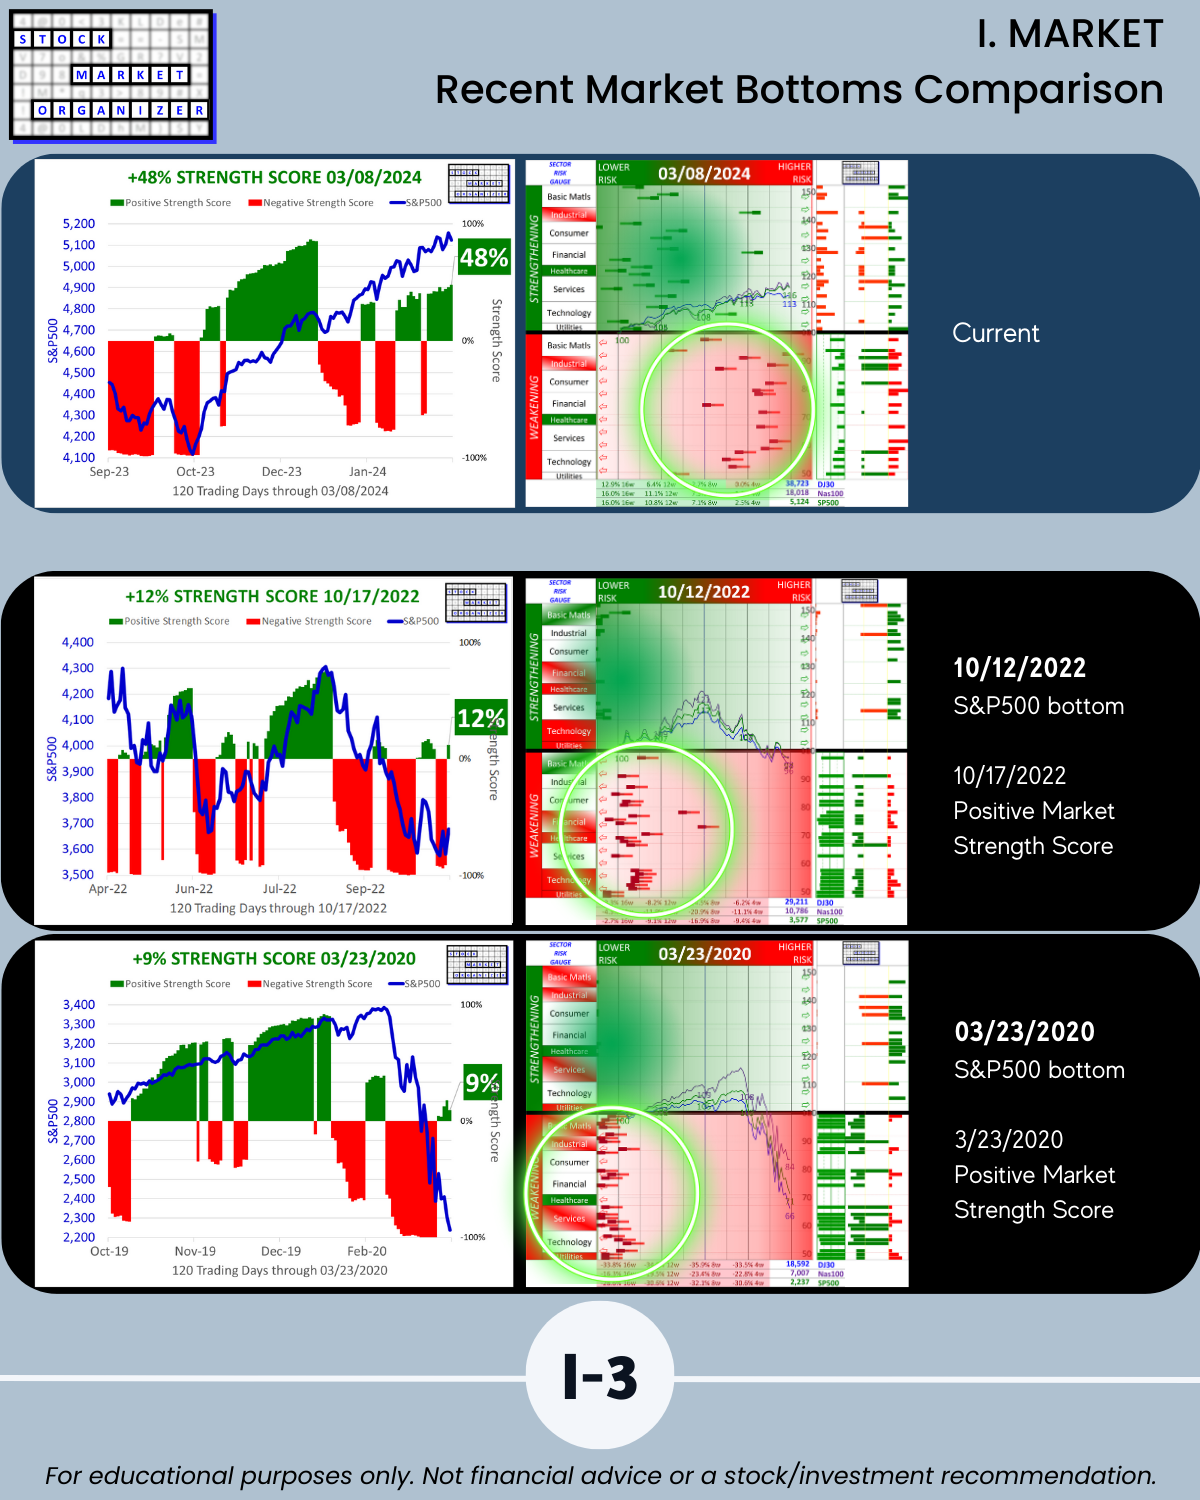
SECTION I
Market Strength Score with examples of previous market bottoms for context. At those bottoms it is clear the market is extended. (Still, many insist it’s not possible to time the market. Okay, Jan. Let’s agree there are times to be aggressive and times to be conservative, and those with the right tools and an open mind can tell the difference enough to make a difference.)
Rising tides lift all boats, and Market Conditions Matter. I created and use the Market Strength Score to answer this most basic and most important question:
Are we are in No New Shorts or No New Longs territory?
CURRENT READING: NO NEW SHORTS
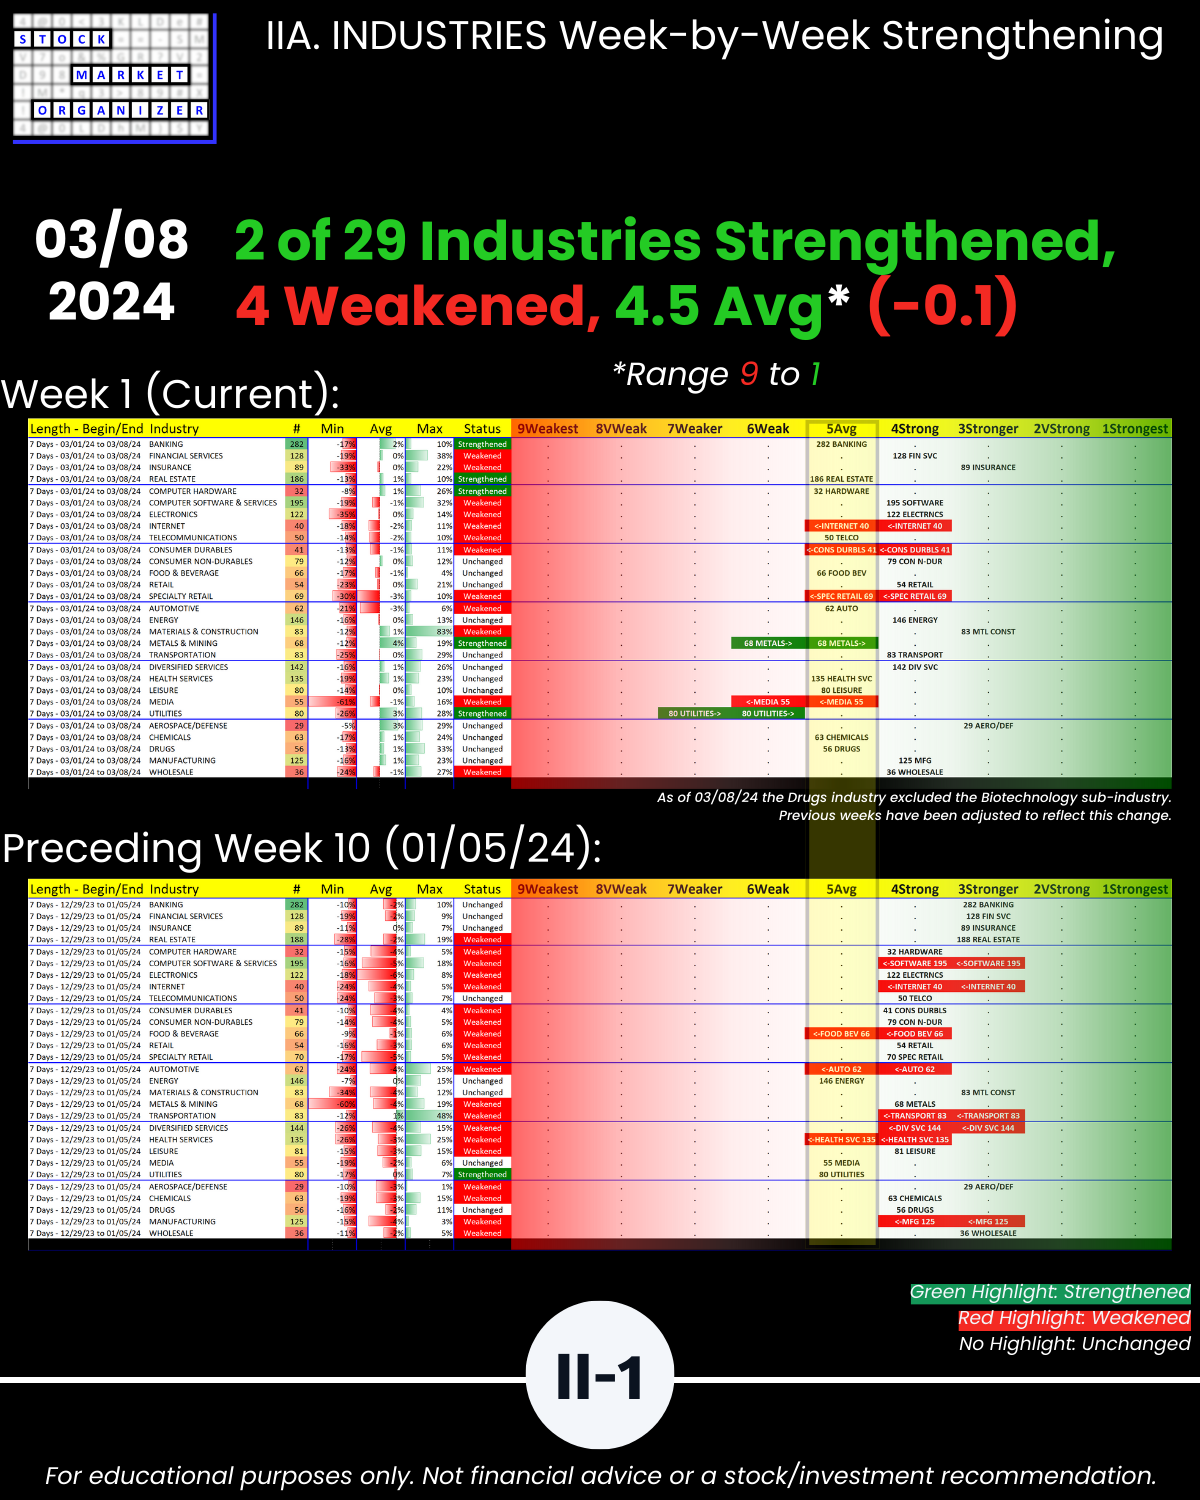
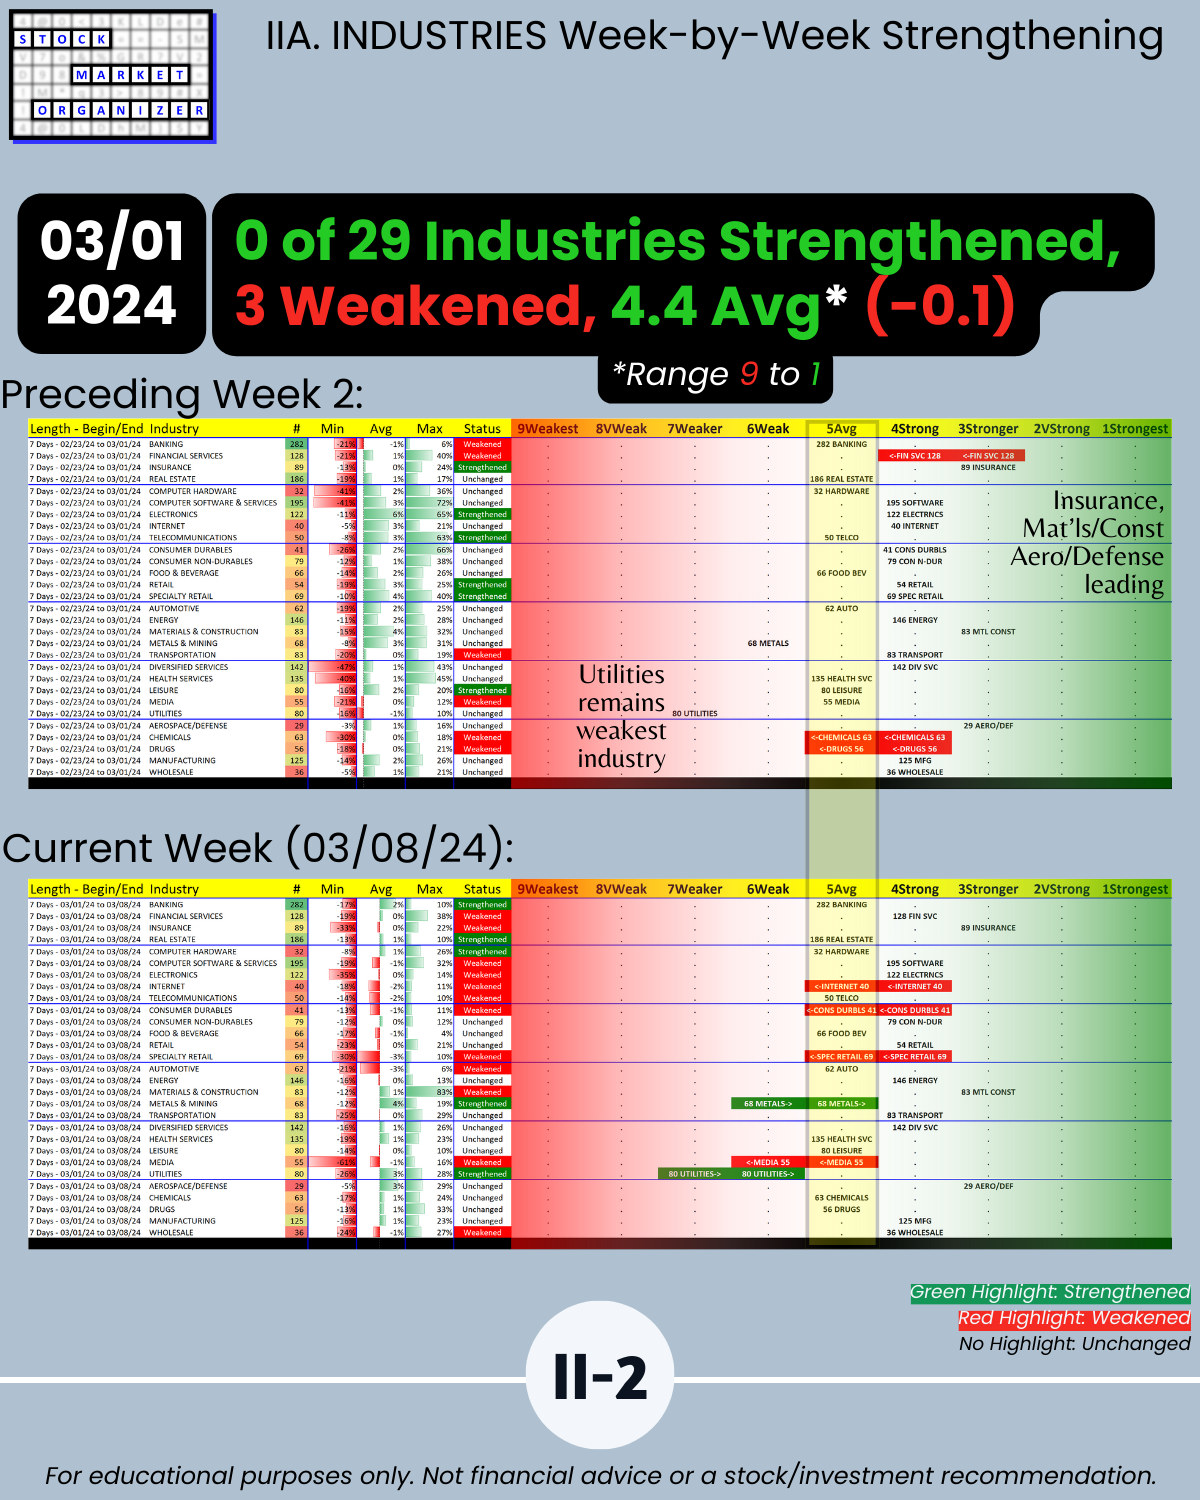
SECTION II
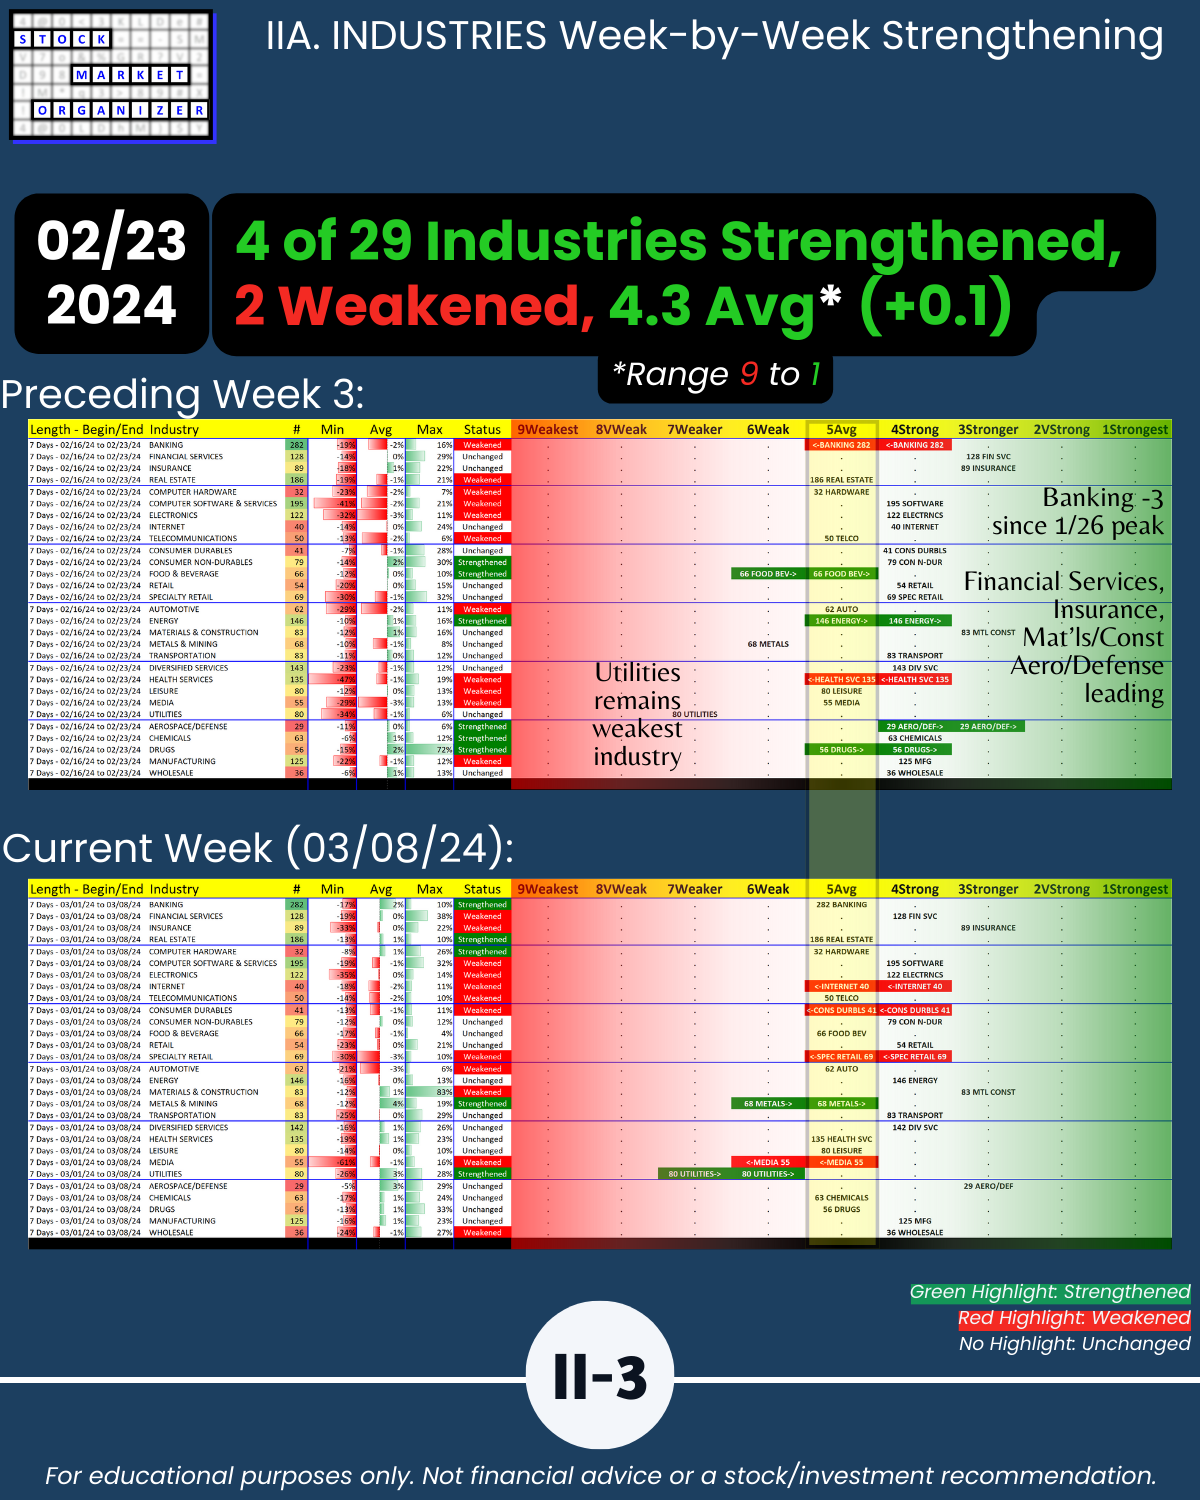
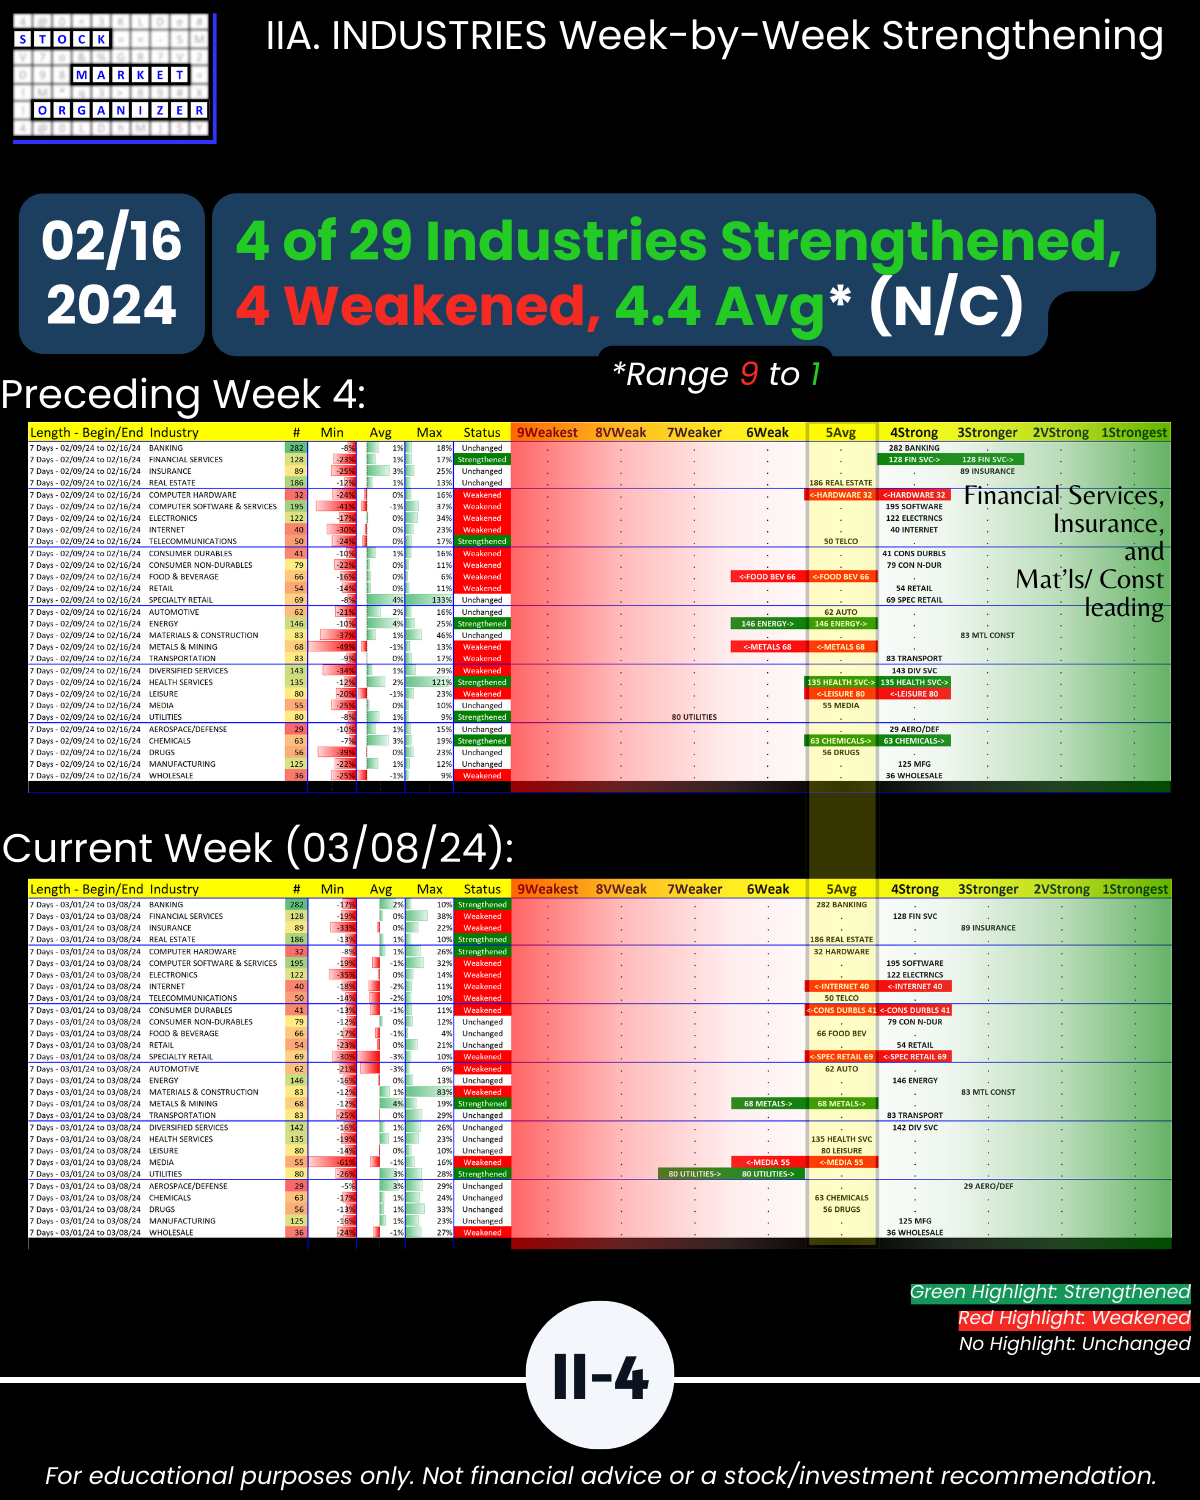
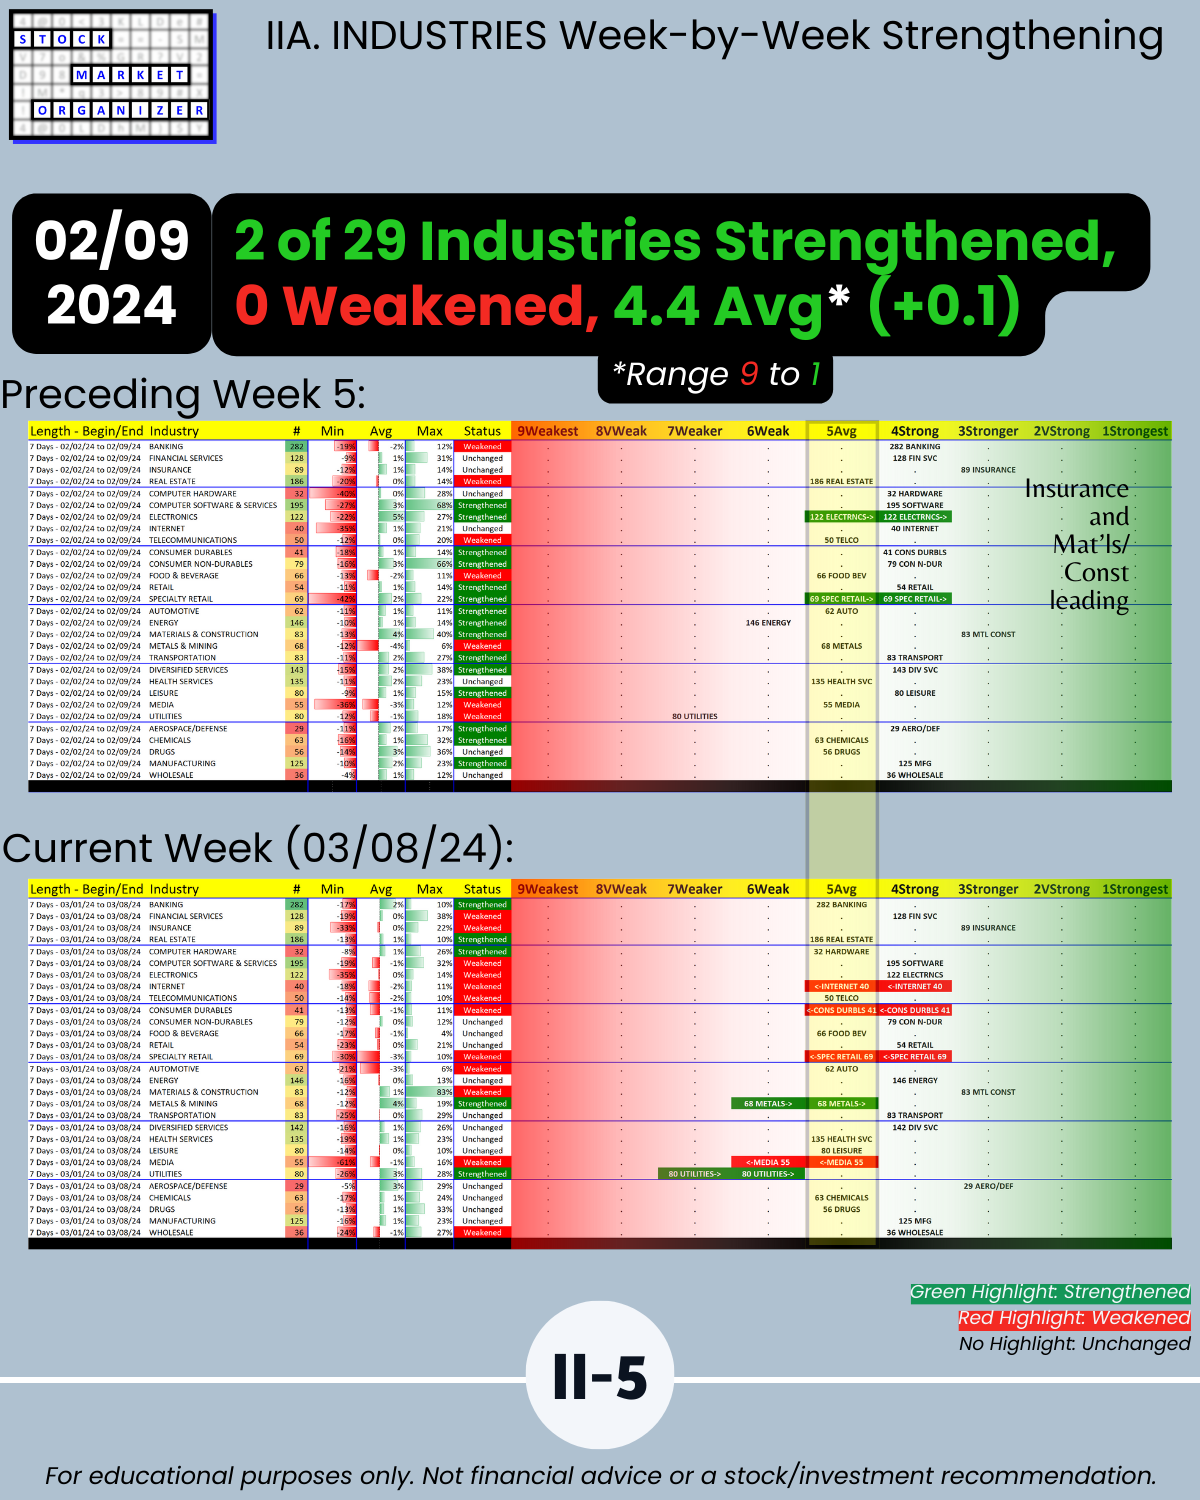
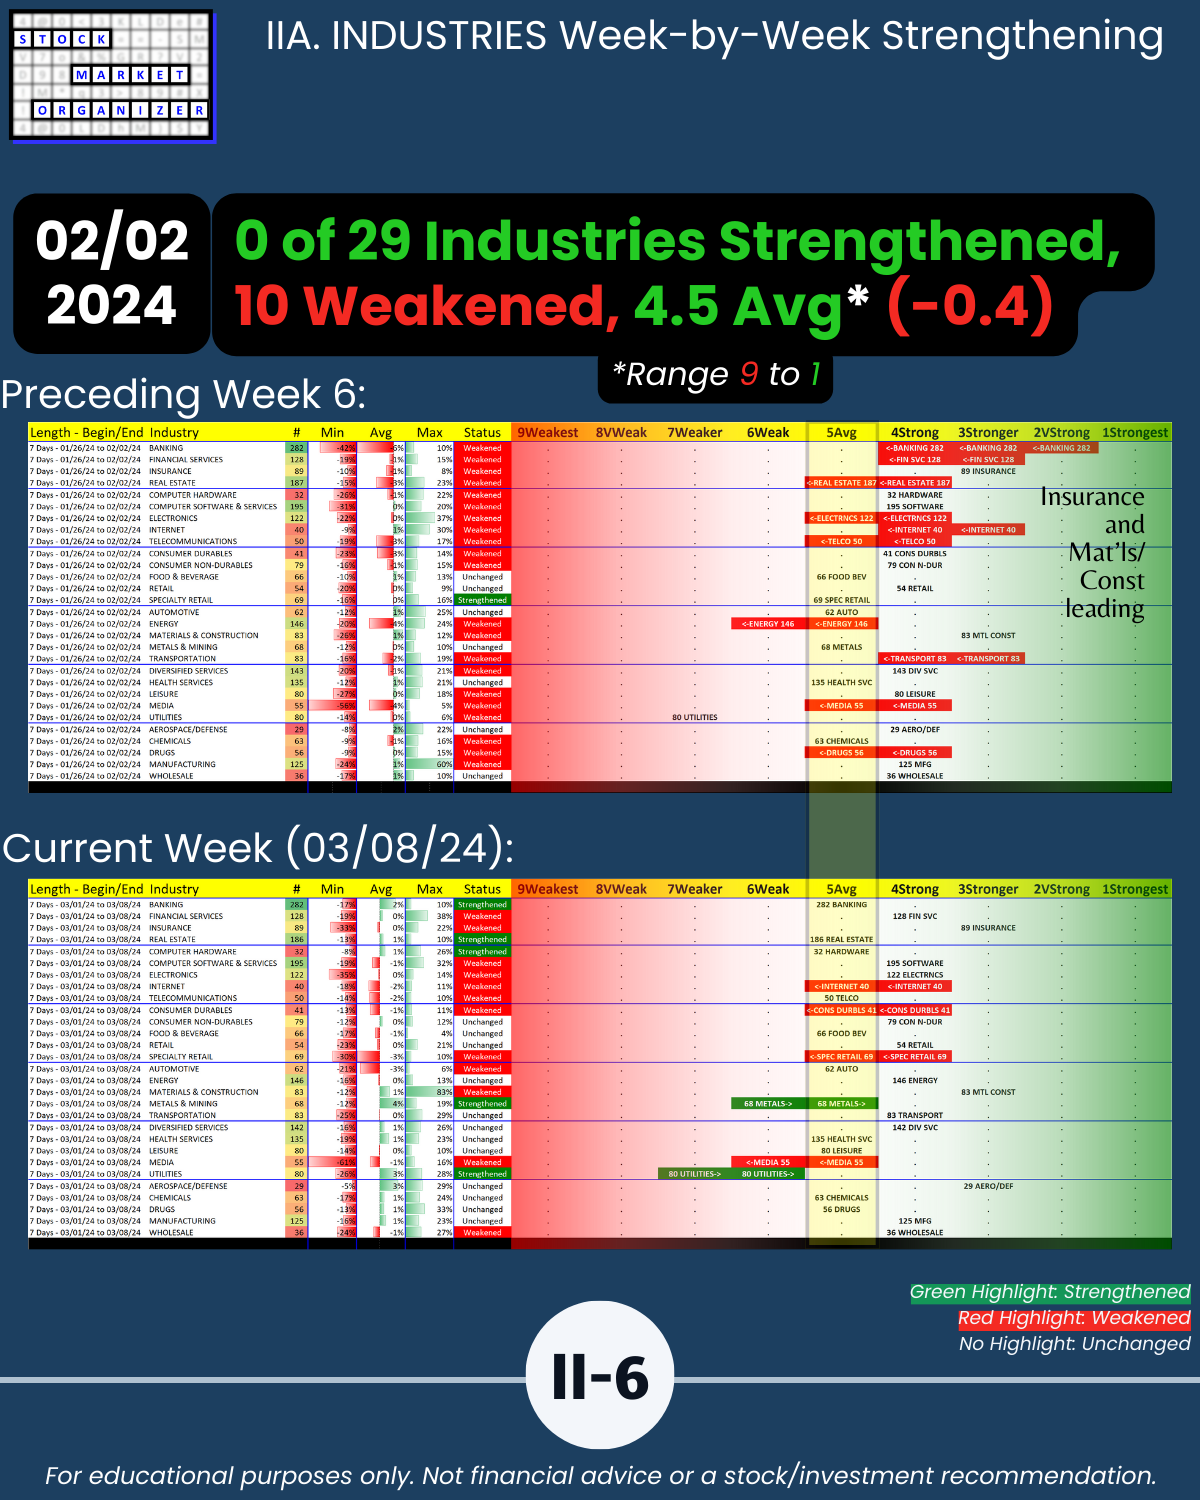
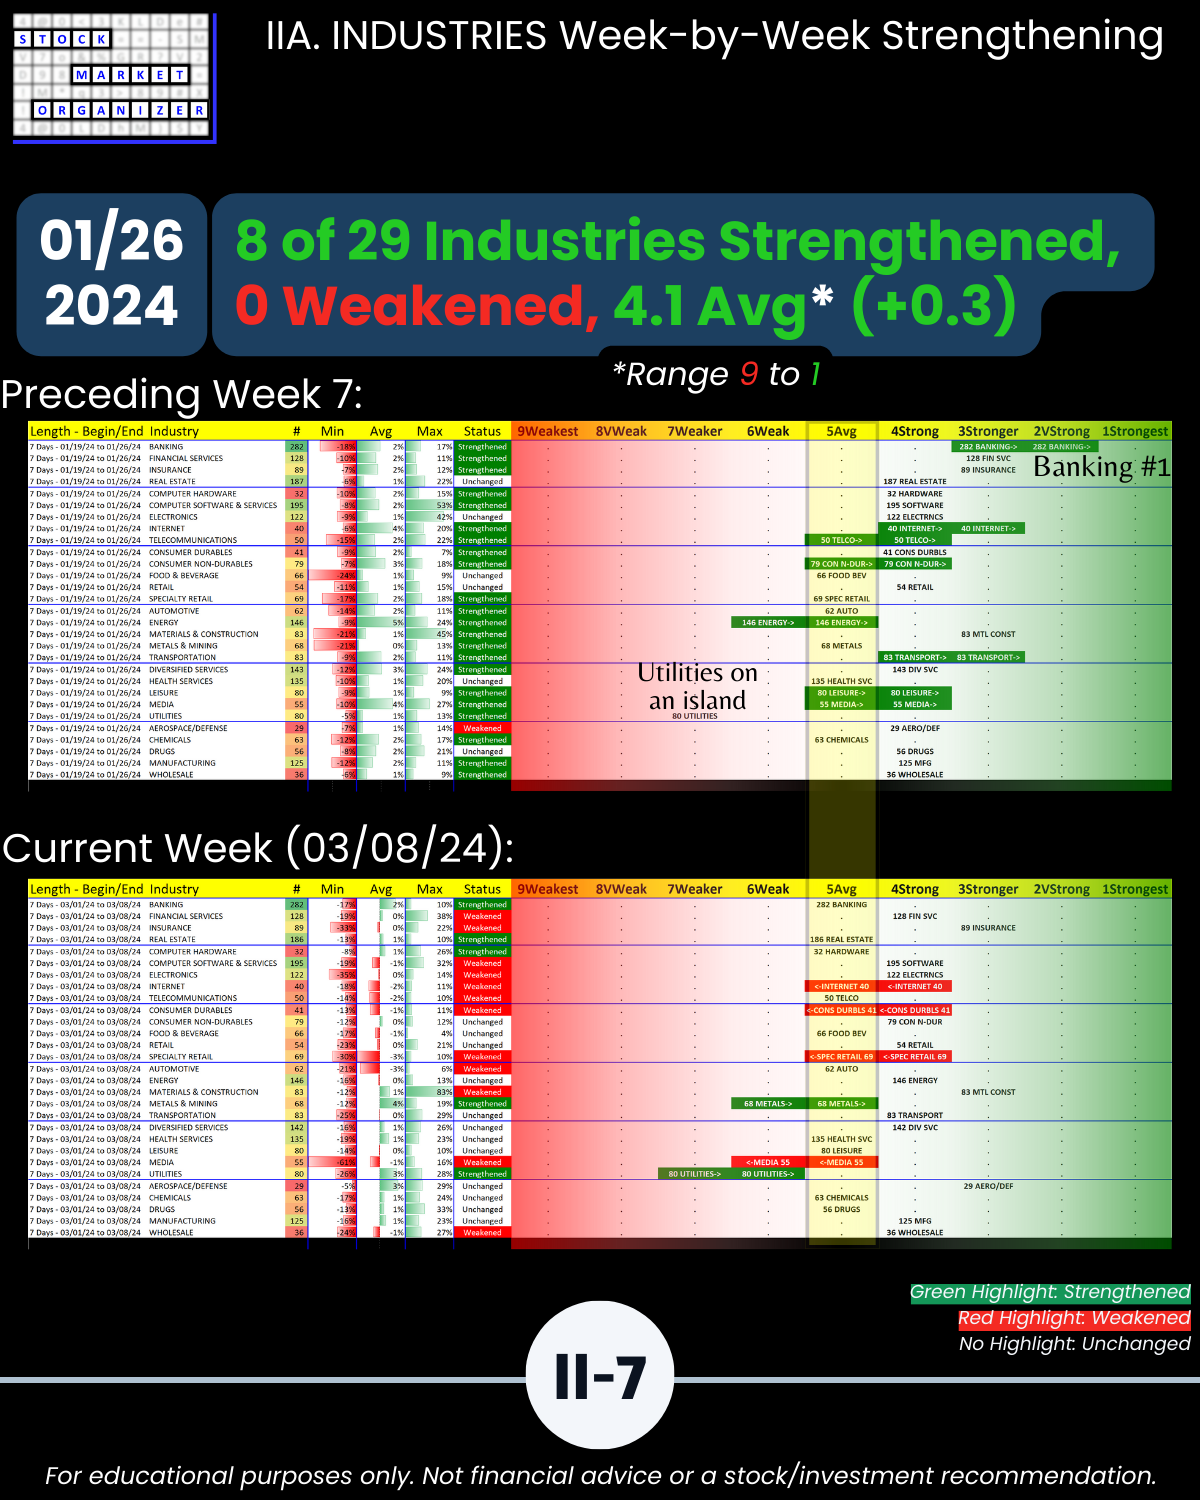
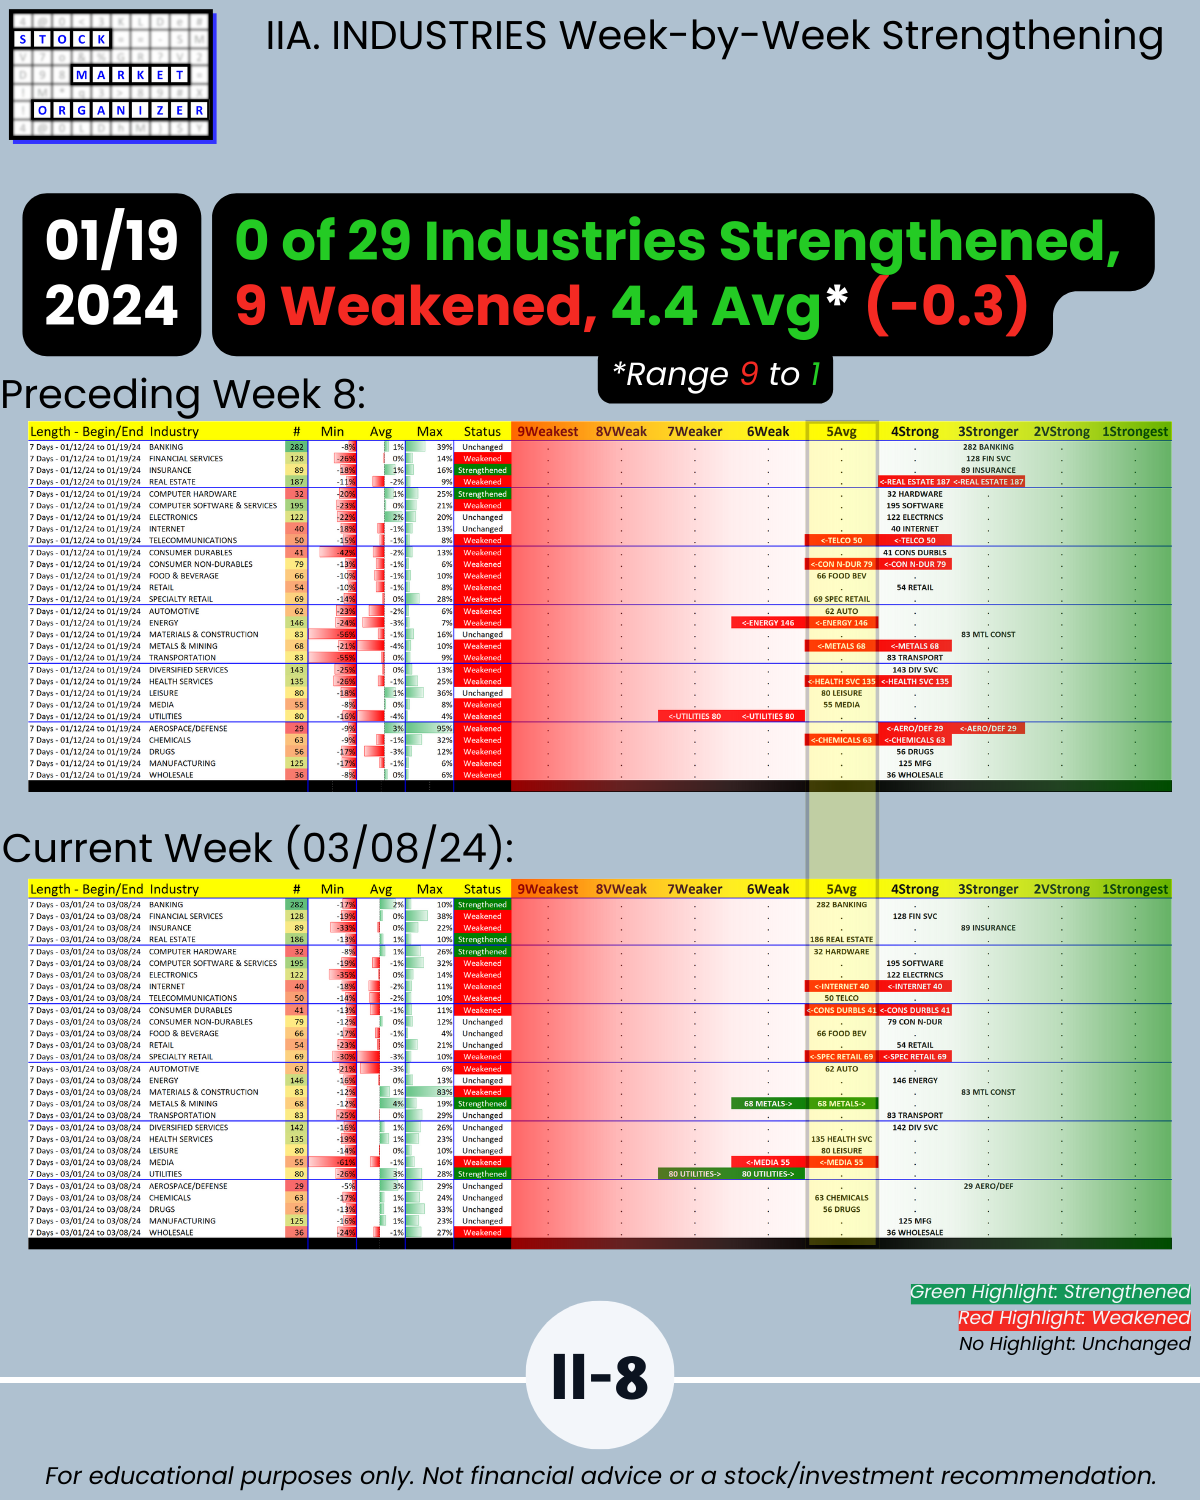
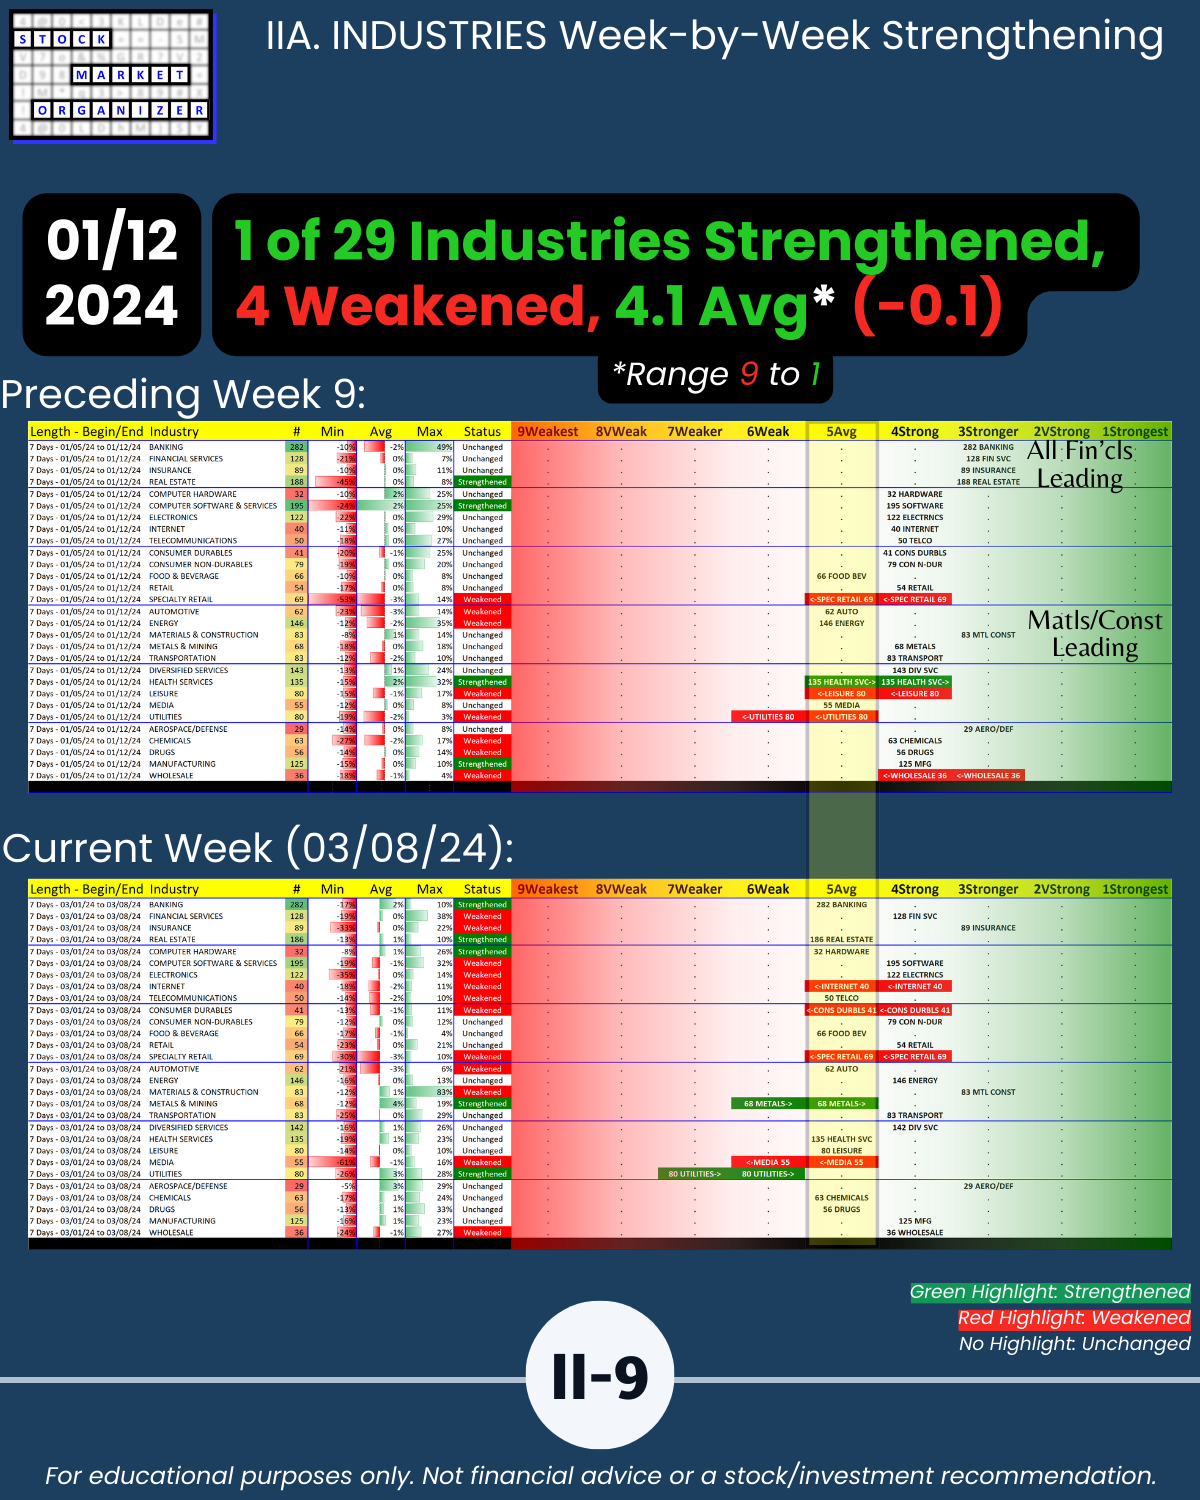
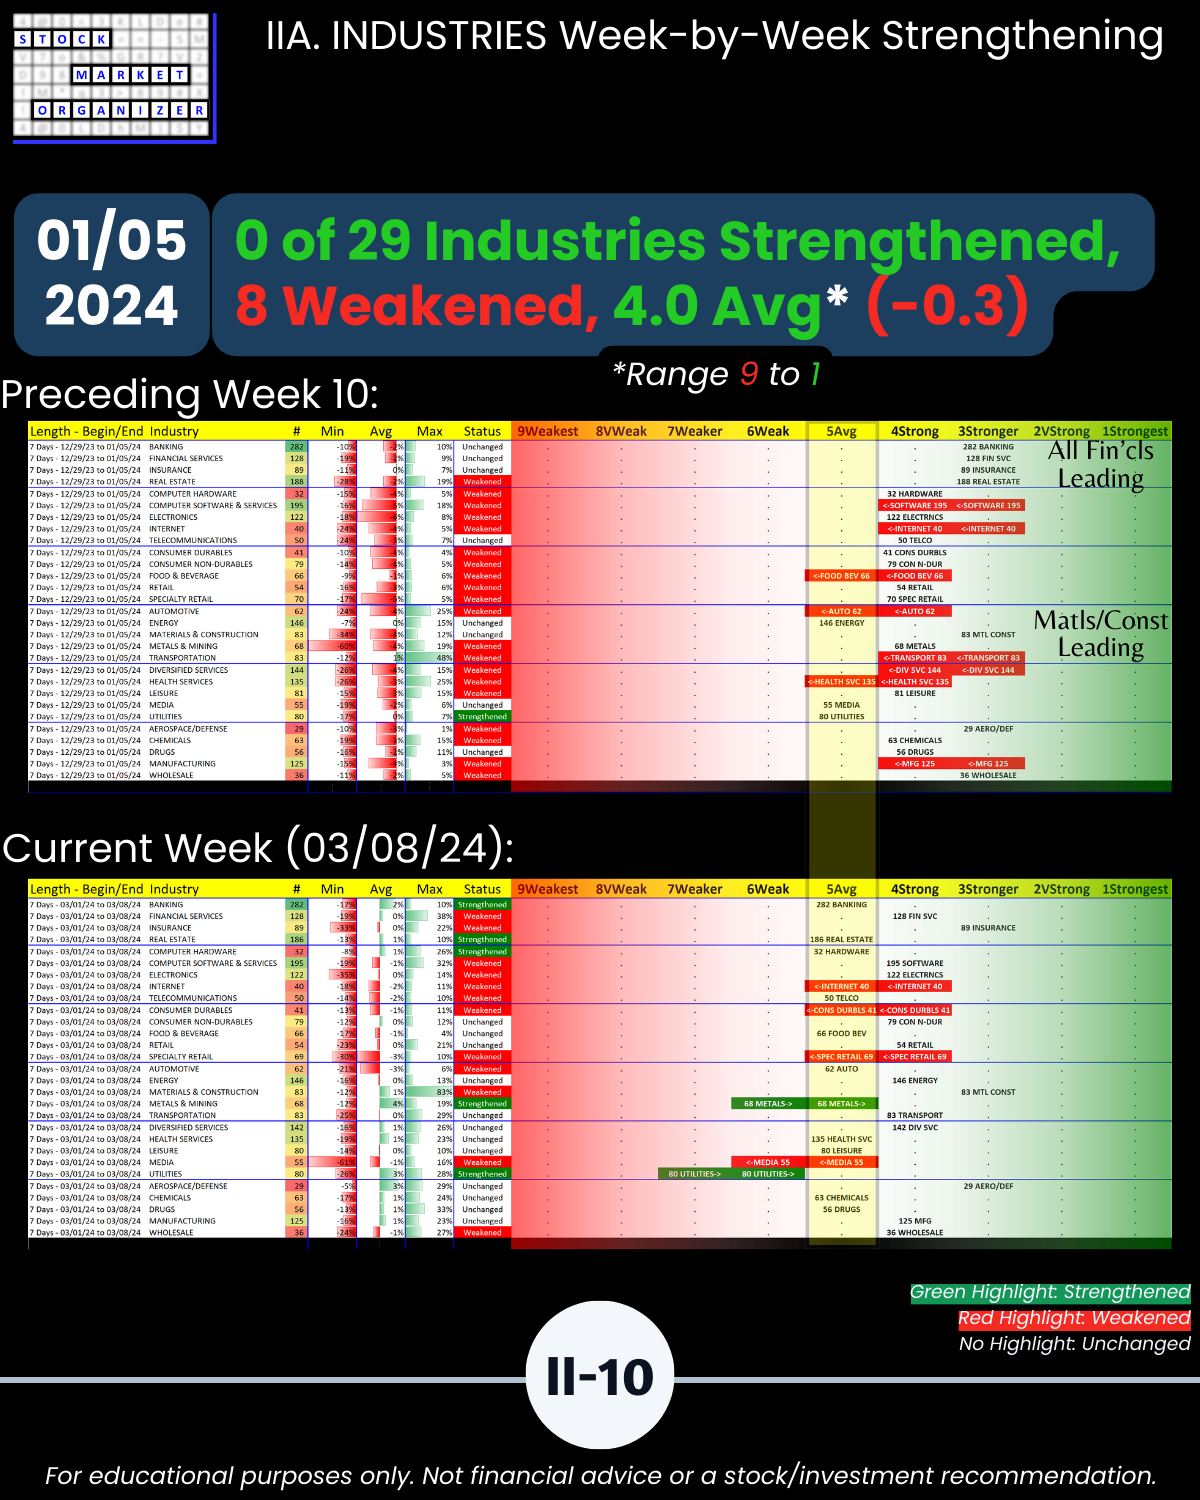
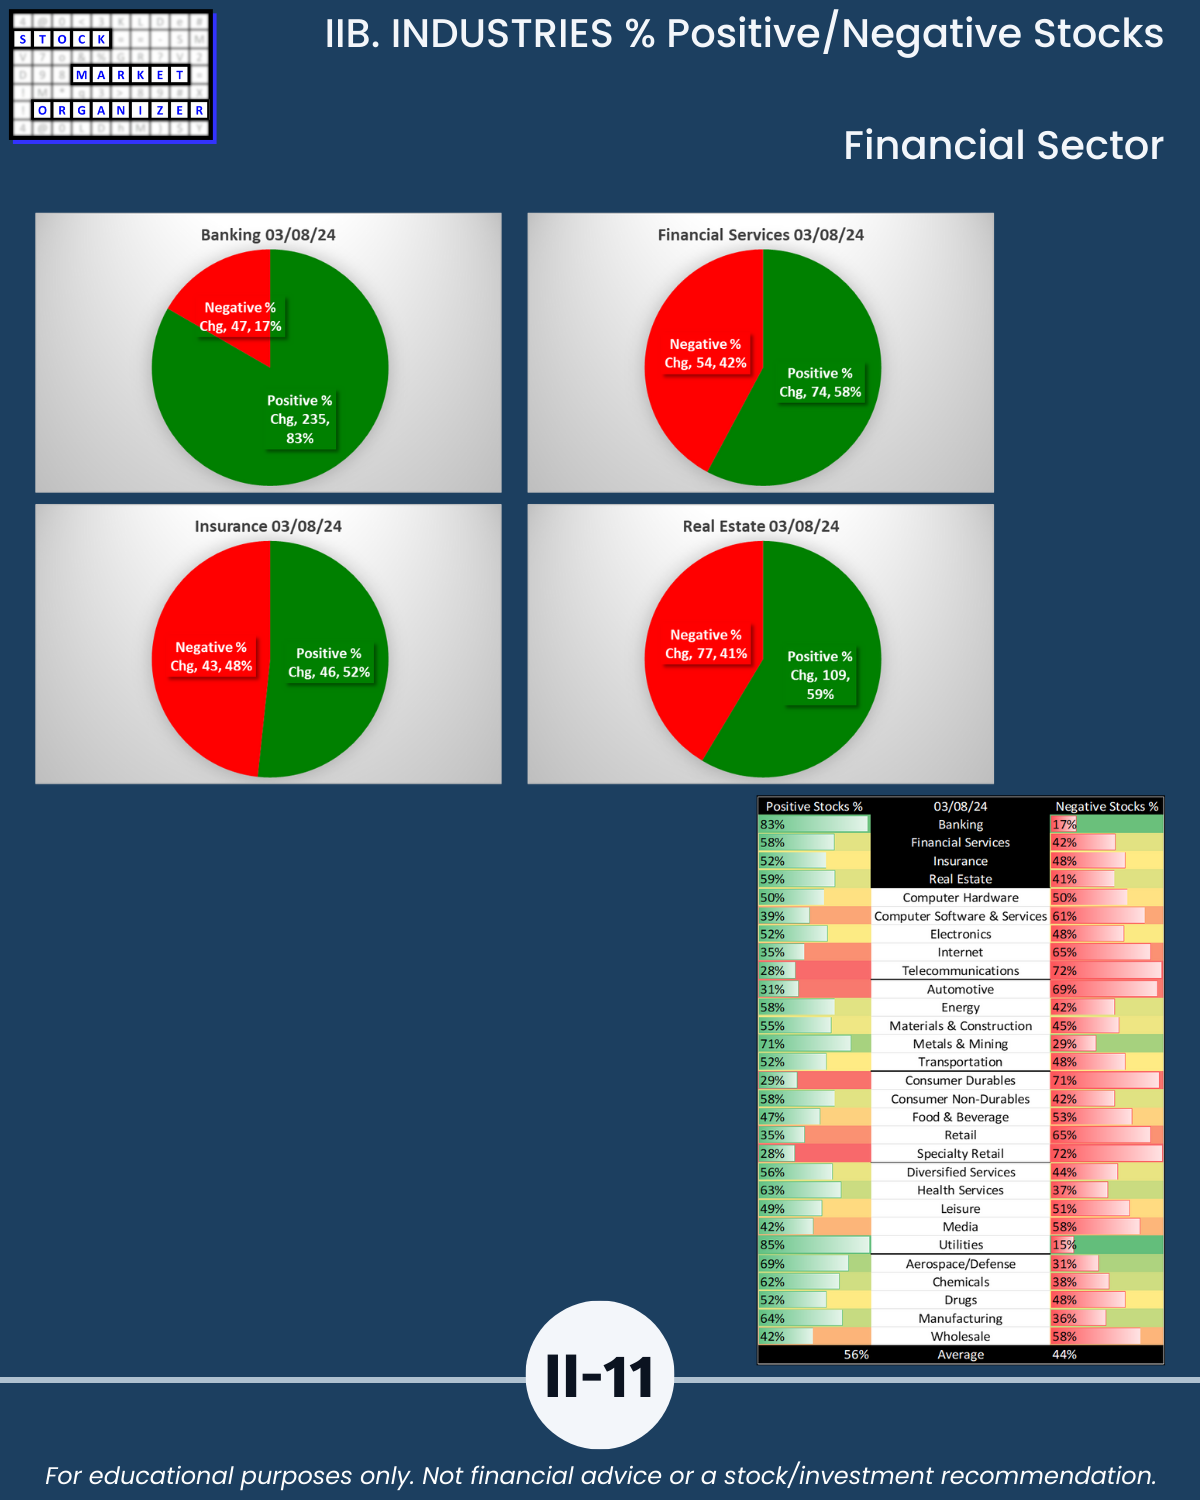
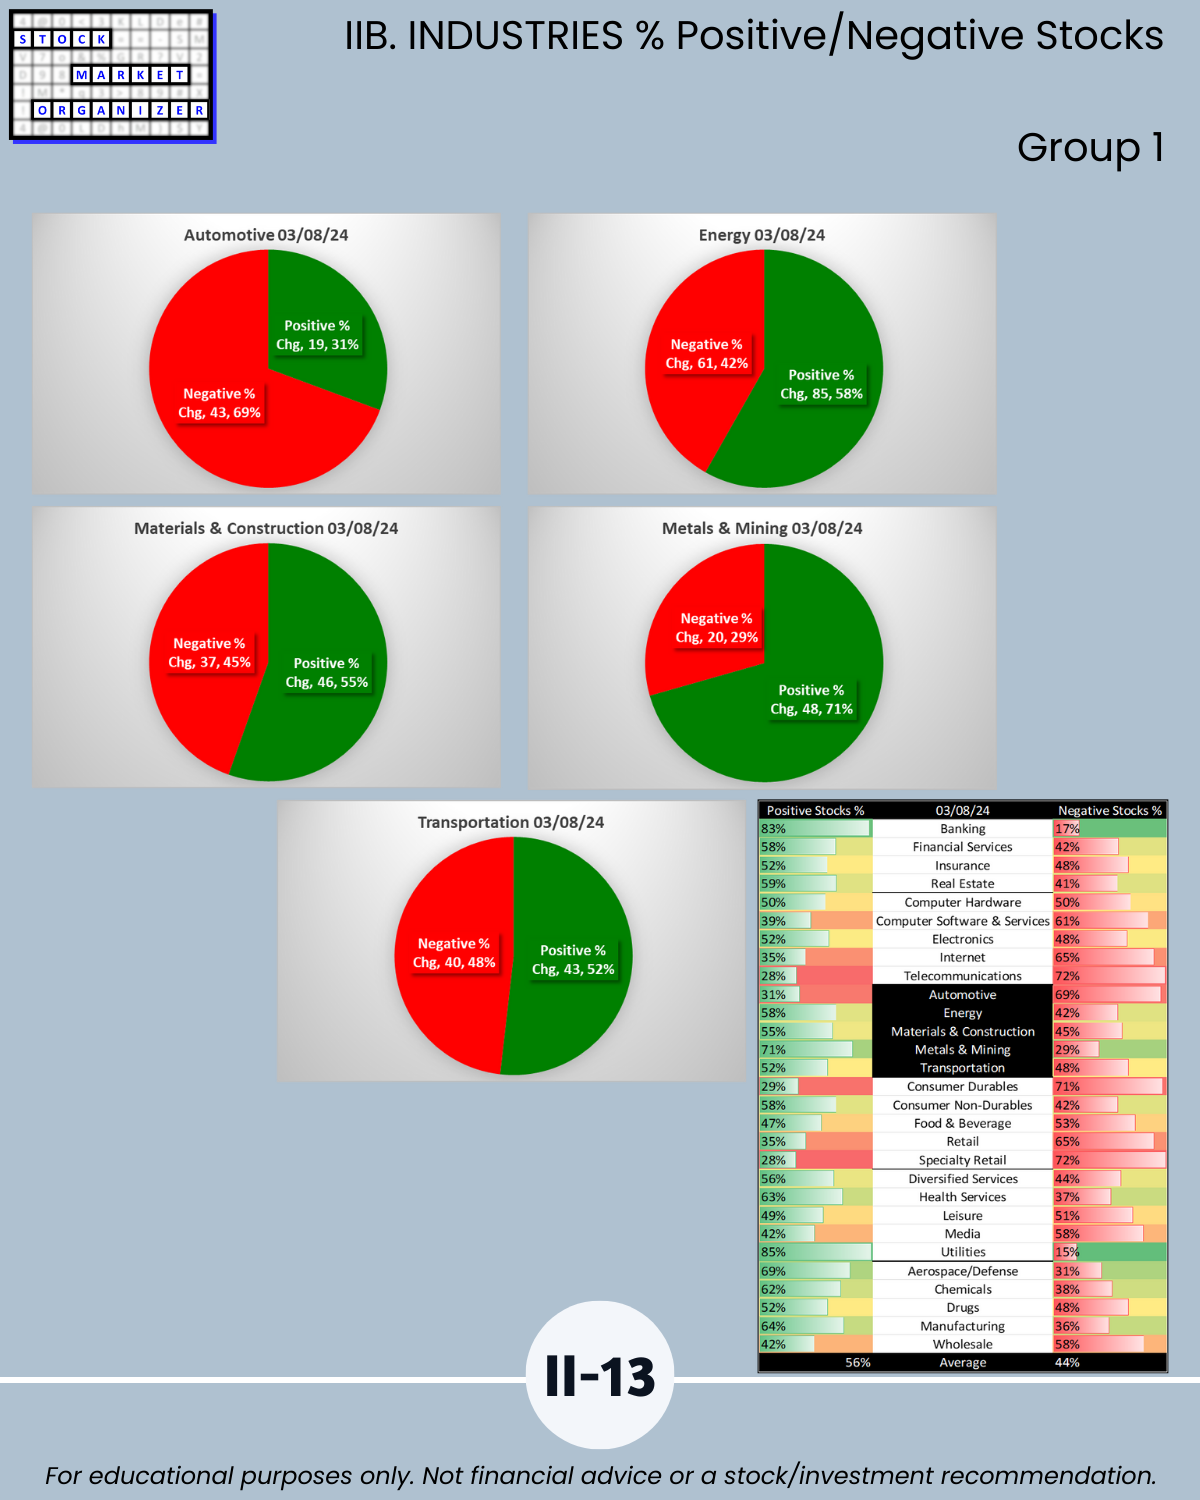
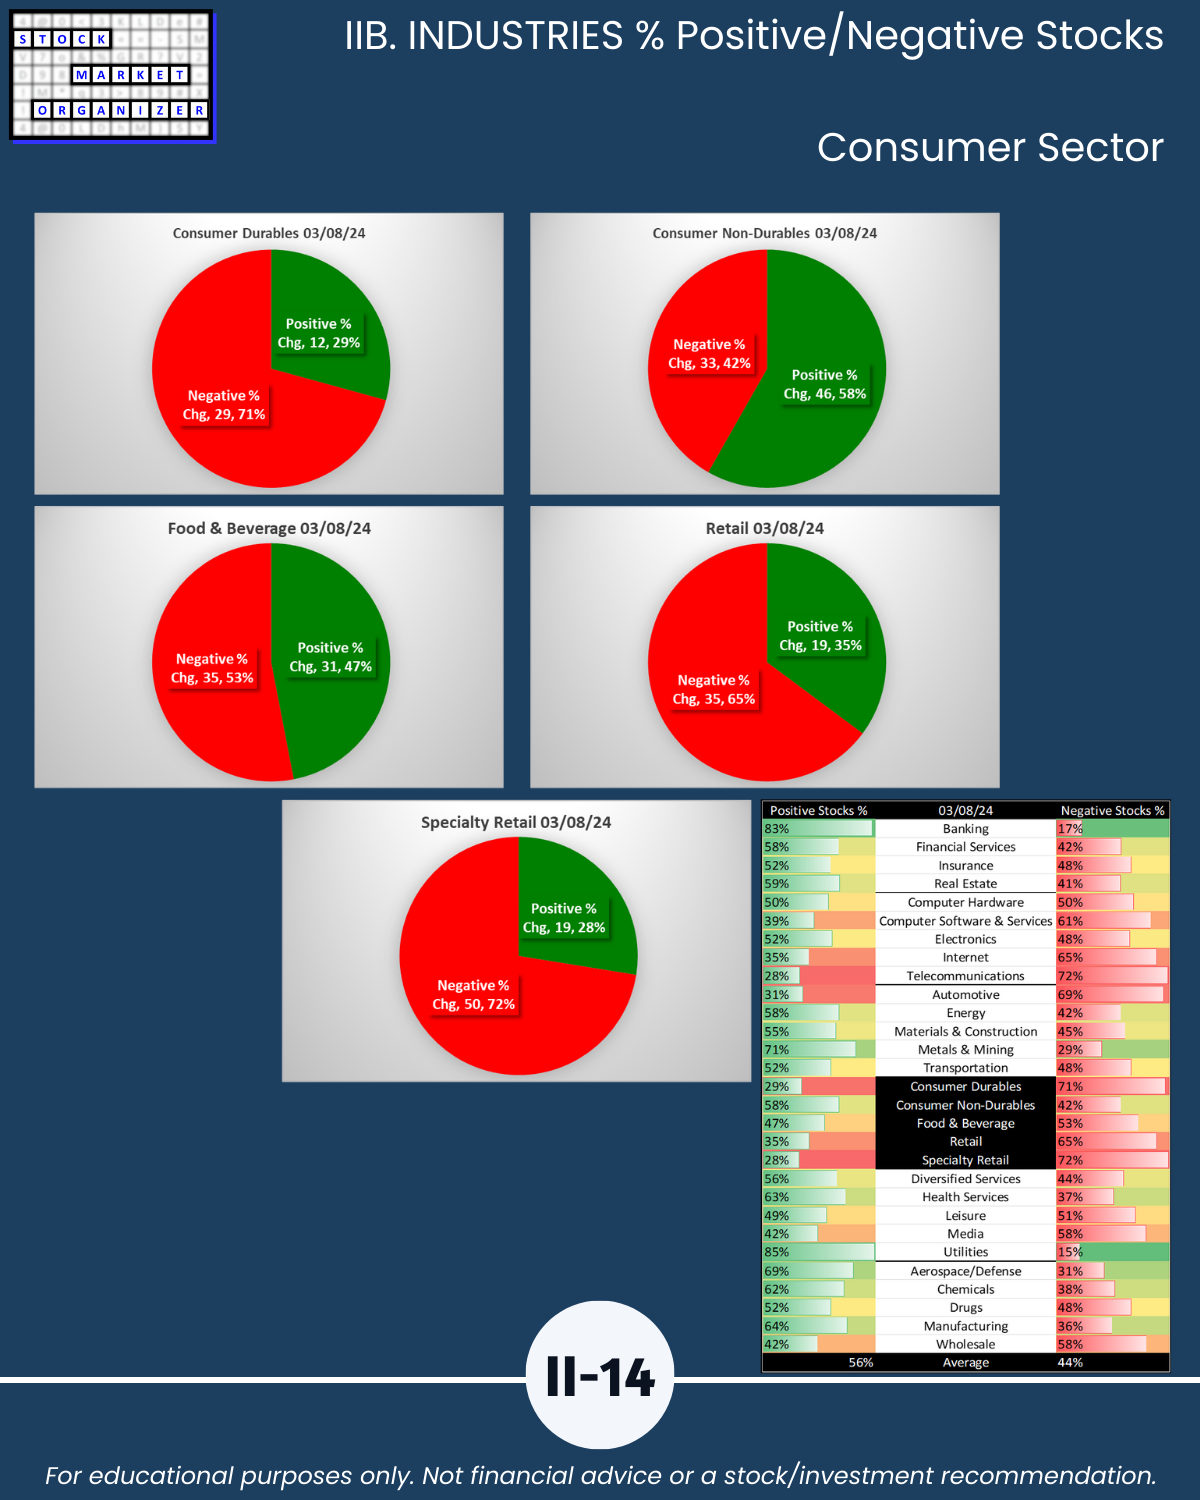
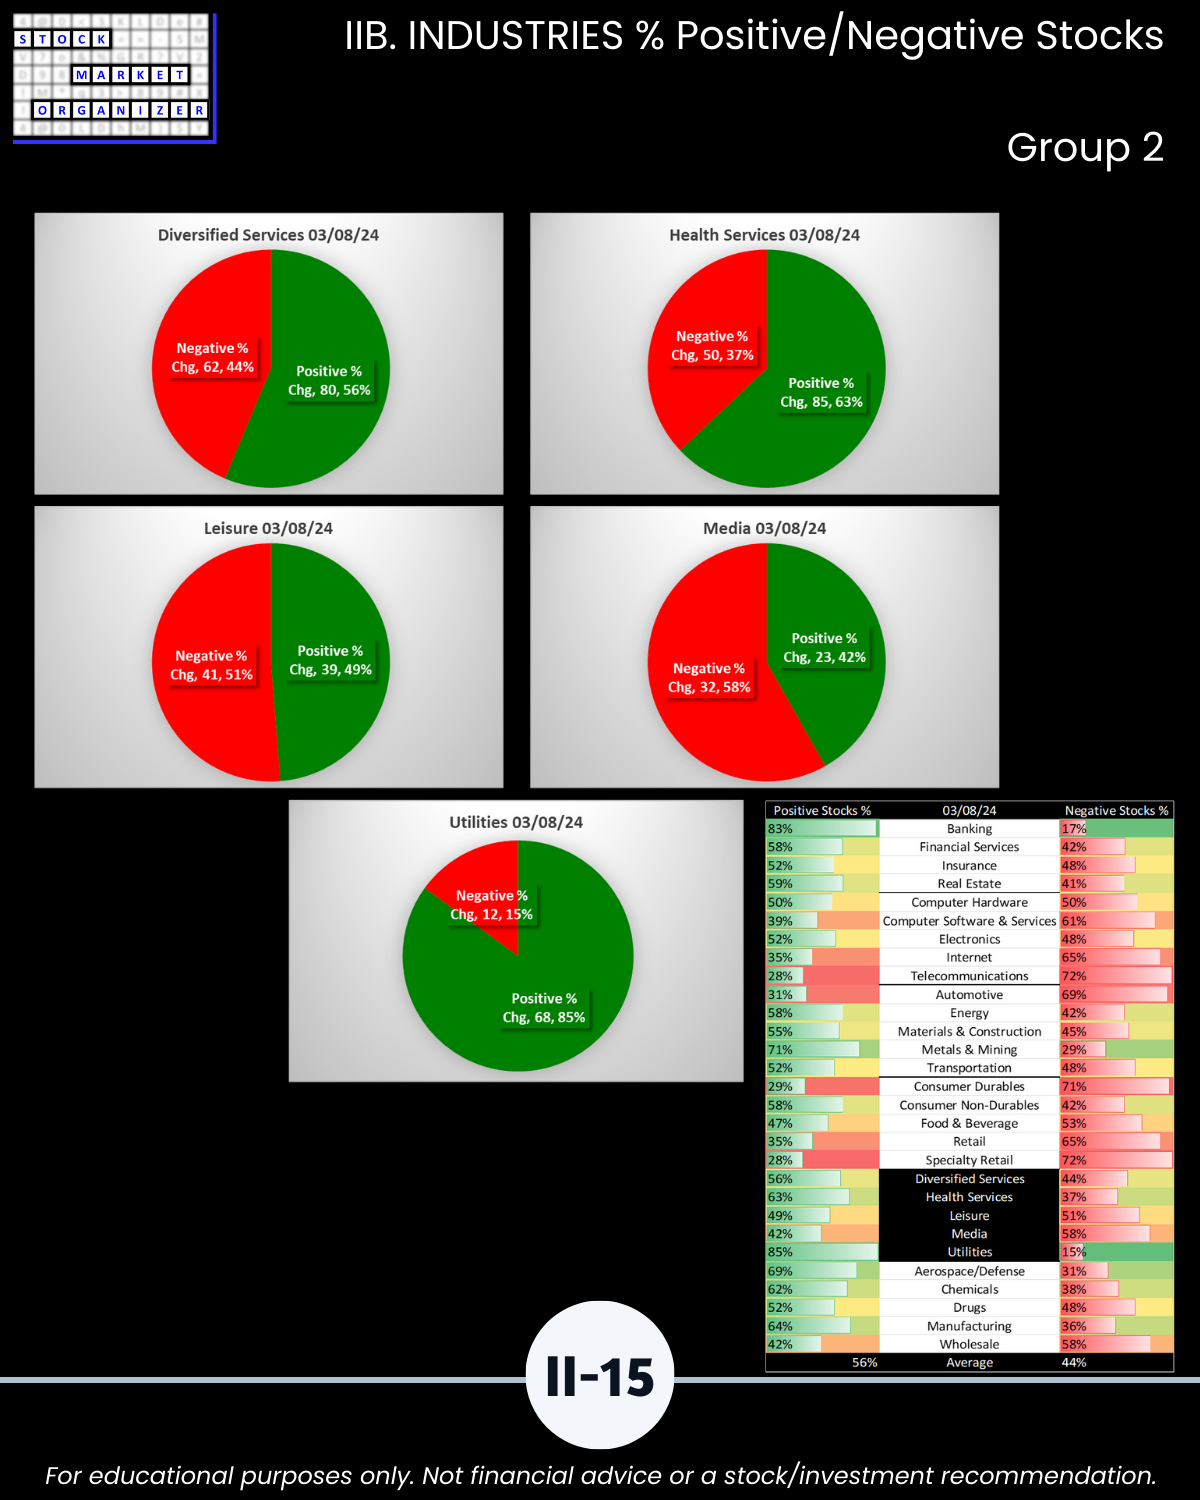
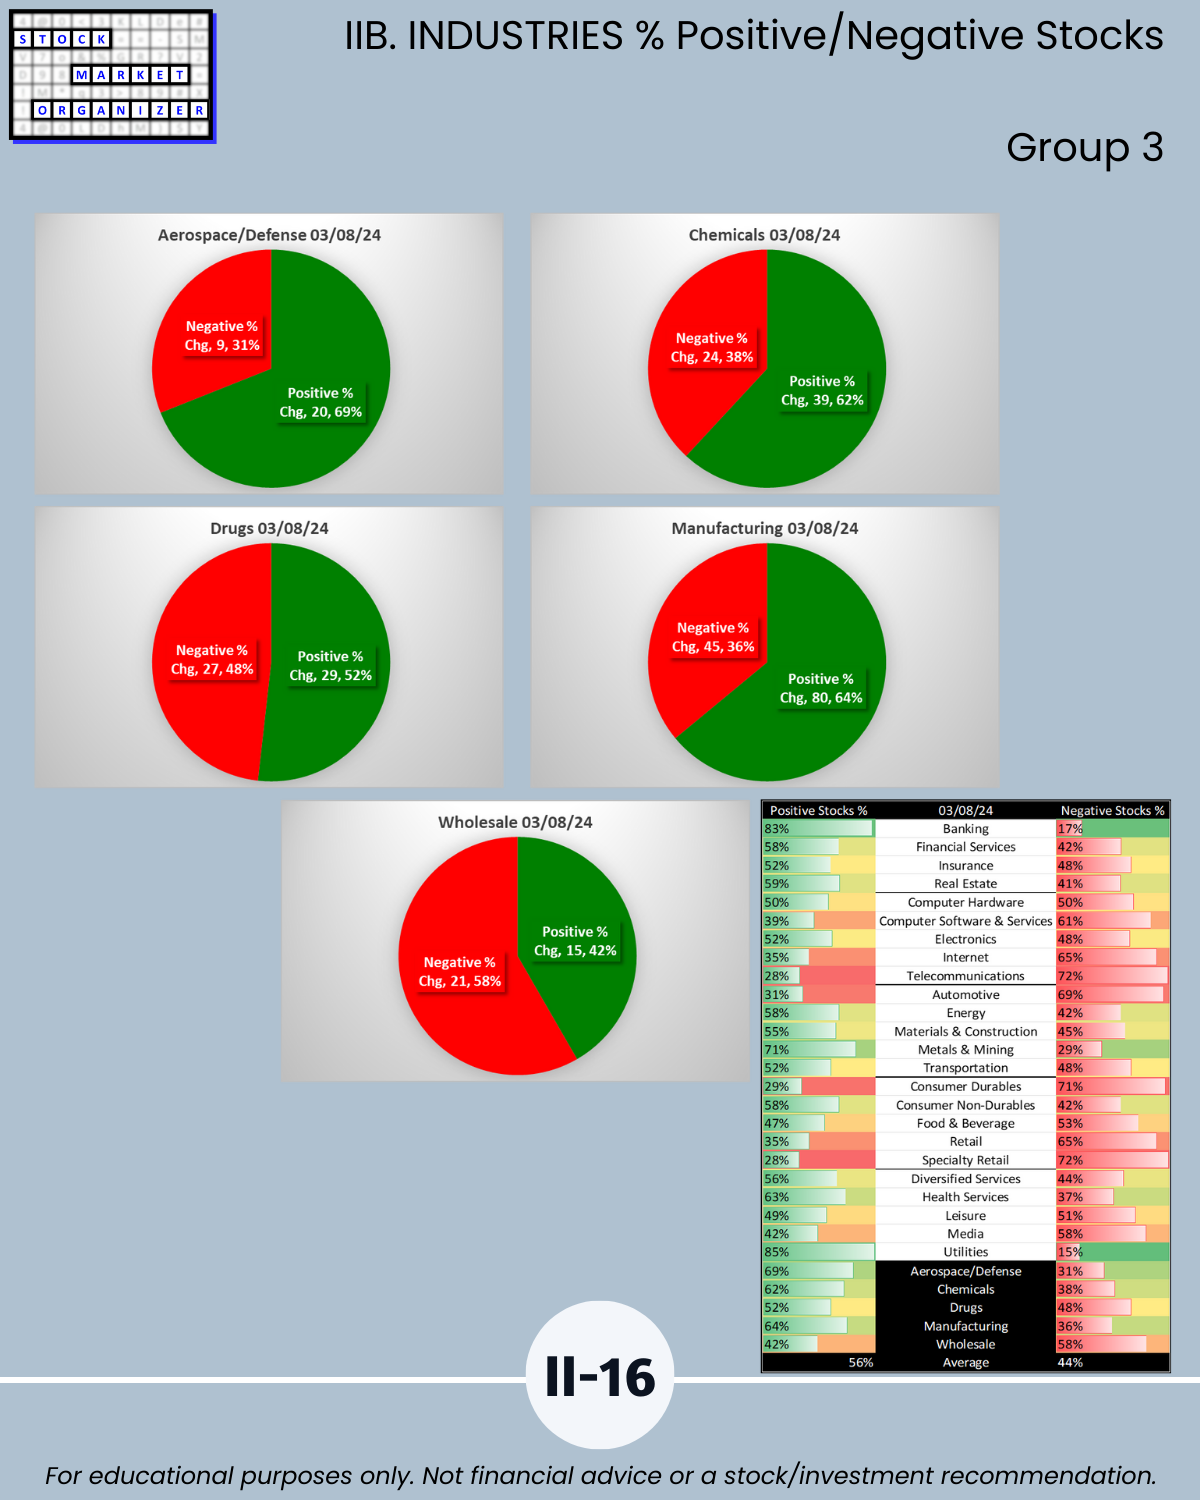
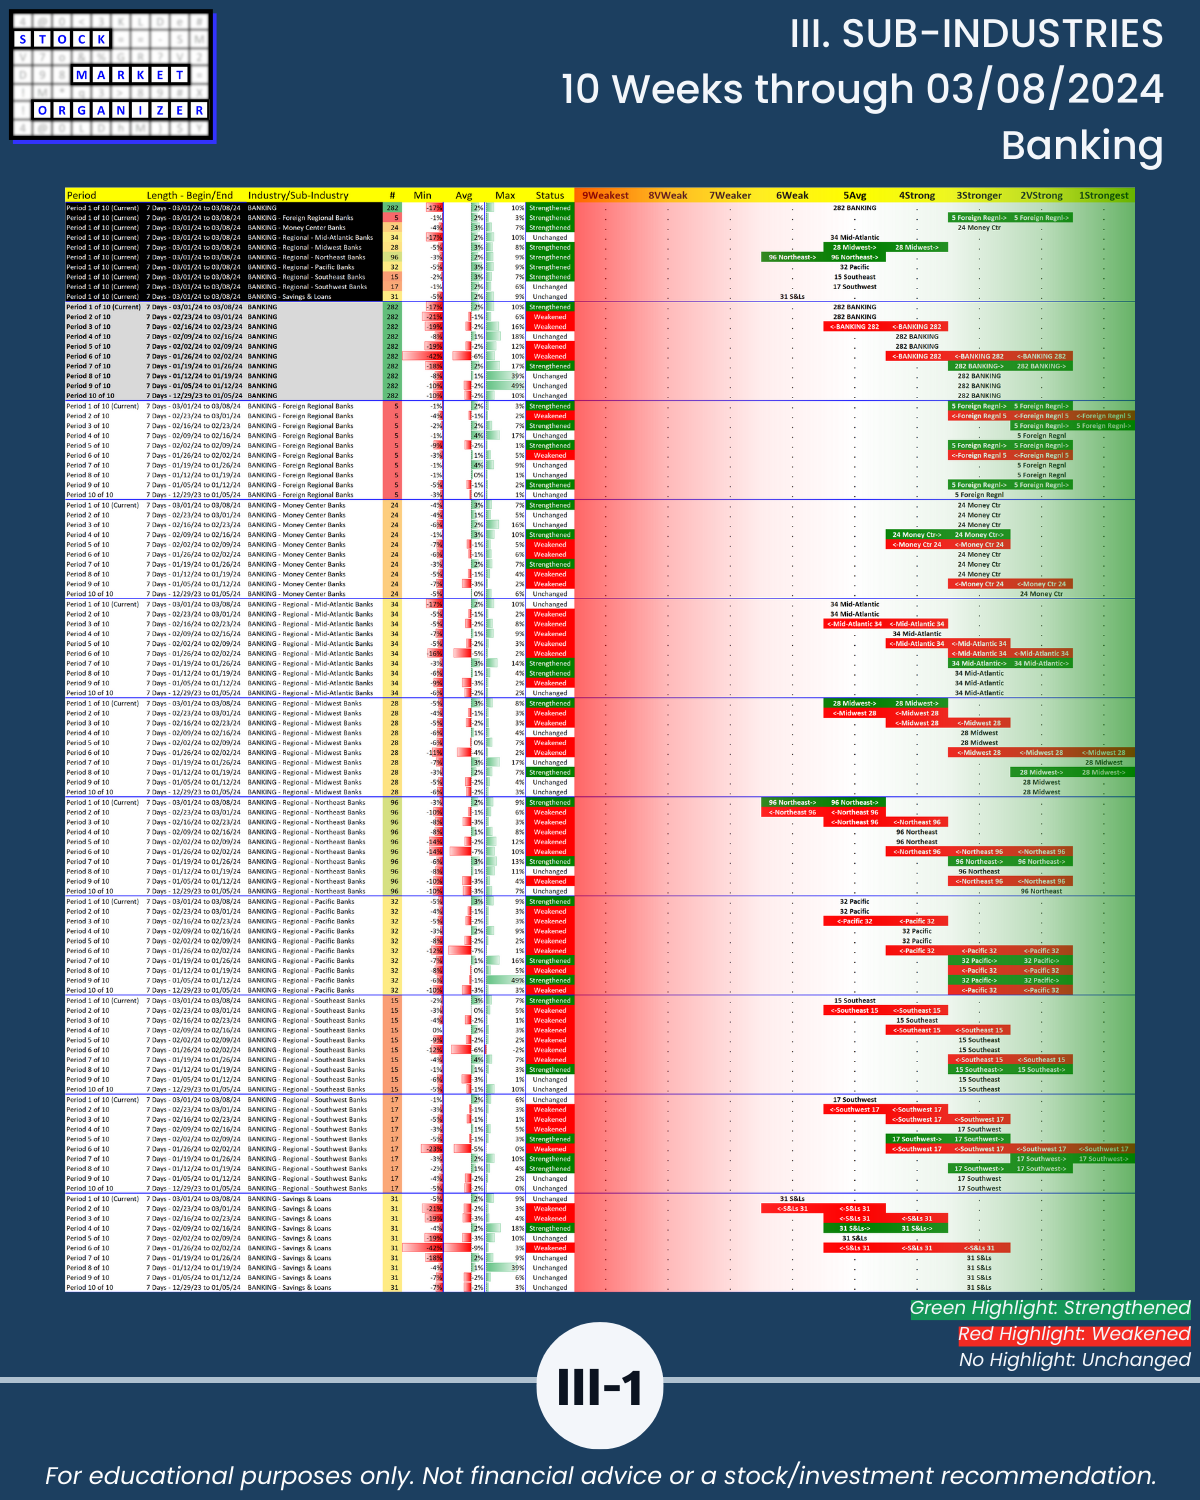
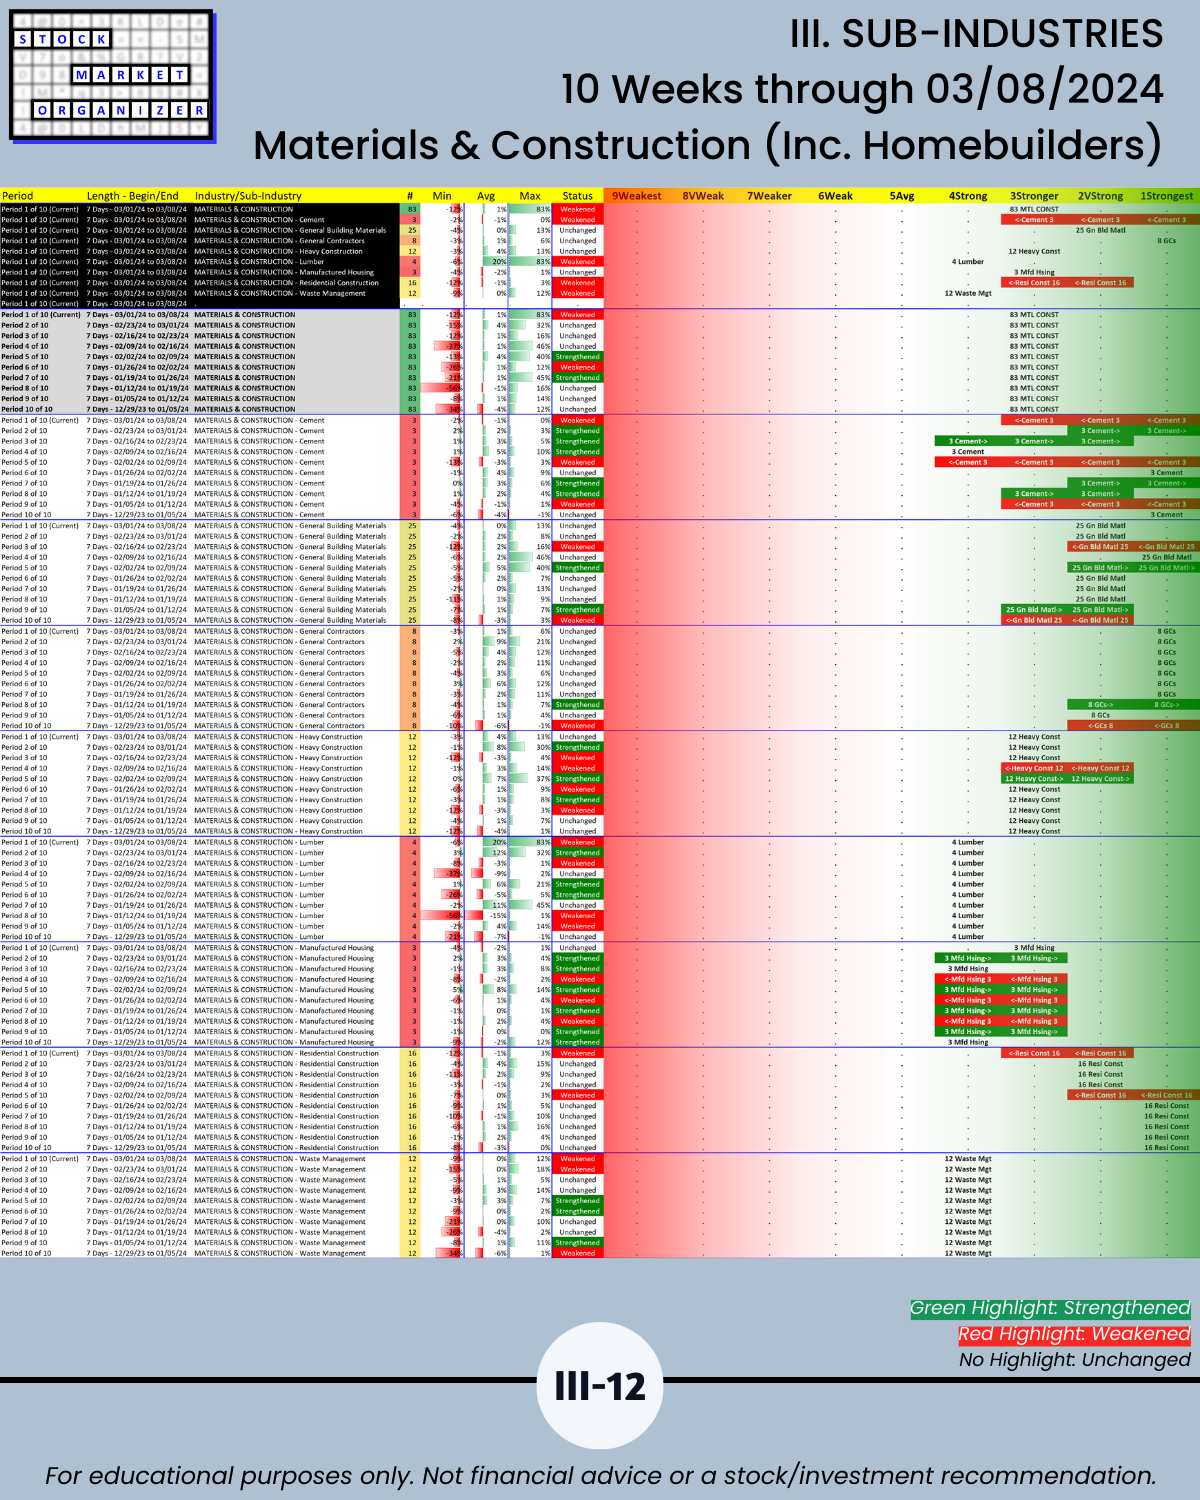
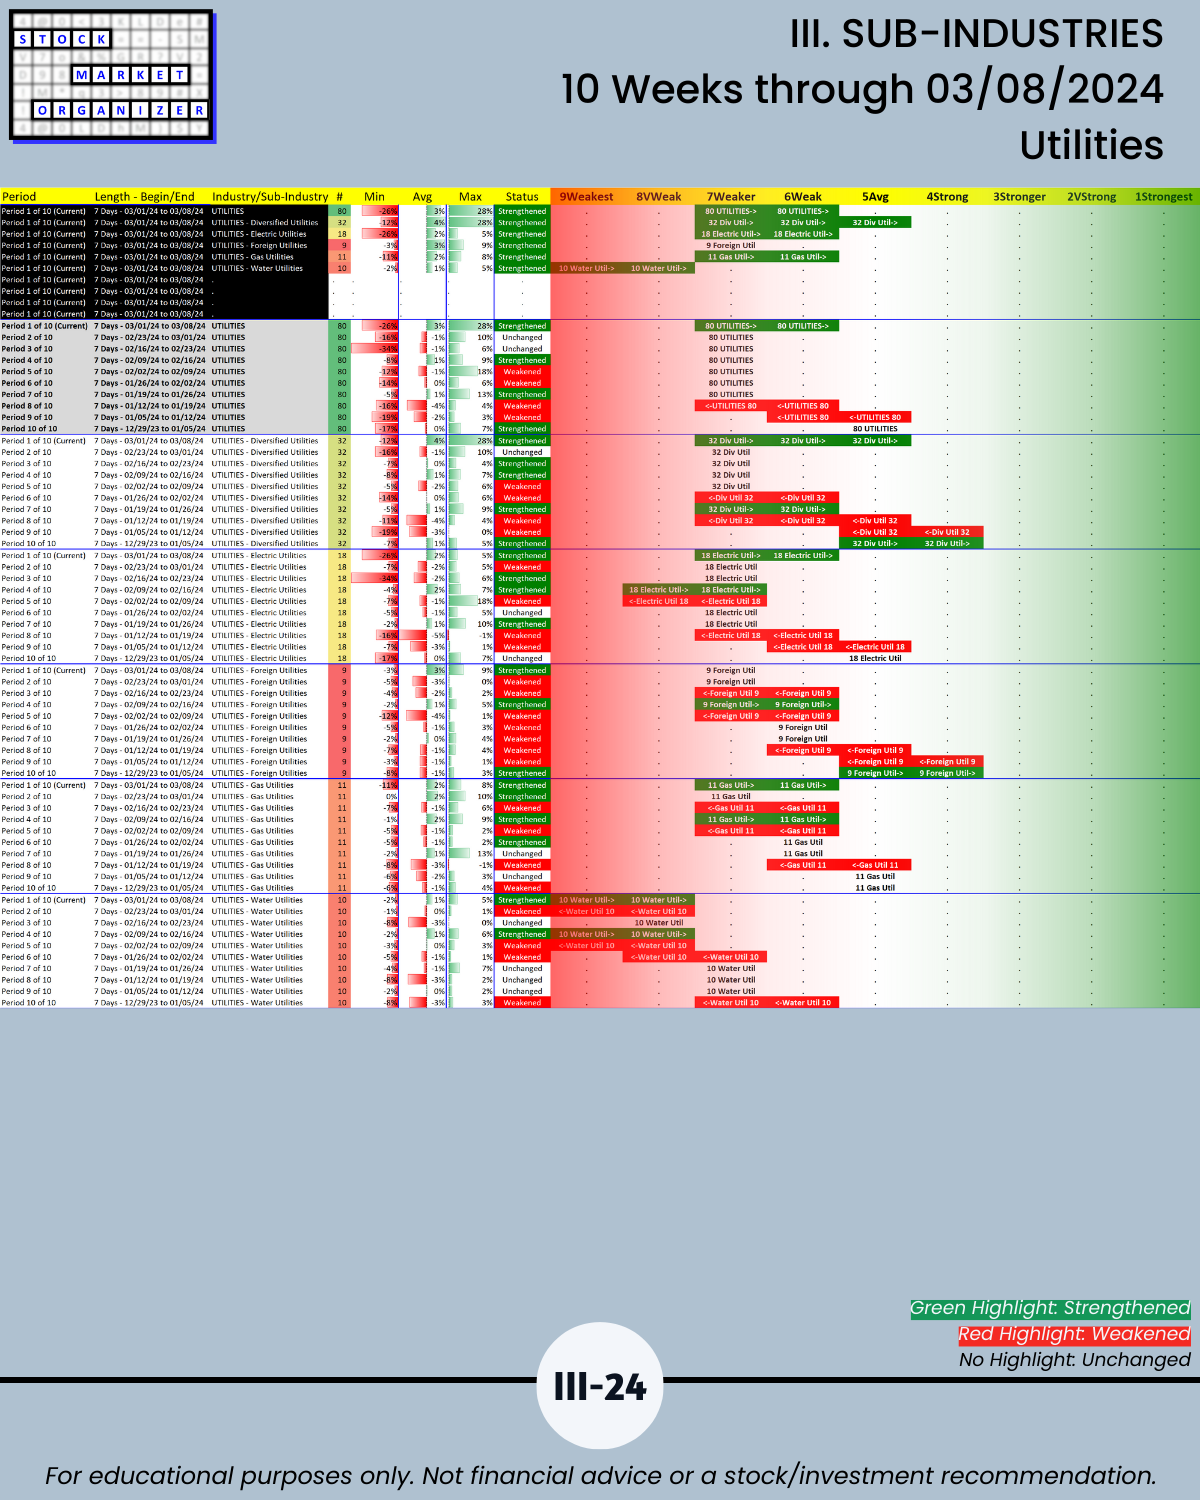
Past 10 weeks strength comparison for the 29 industries in 6 sectors/logical groupings. Utilities has lagged but strengthened this past week. Materials/Construction and Insurance have been leaders the whole time. Banking led the week ending 1/26/24 but has since weakened 3 levels to Average (5th strongest of 9 levels). Yet, 83% of its stocks were positive this last week.
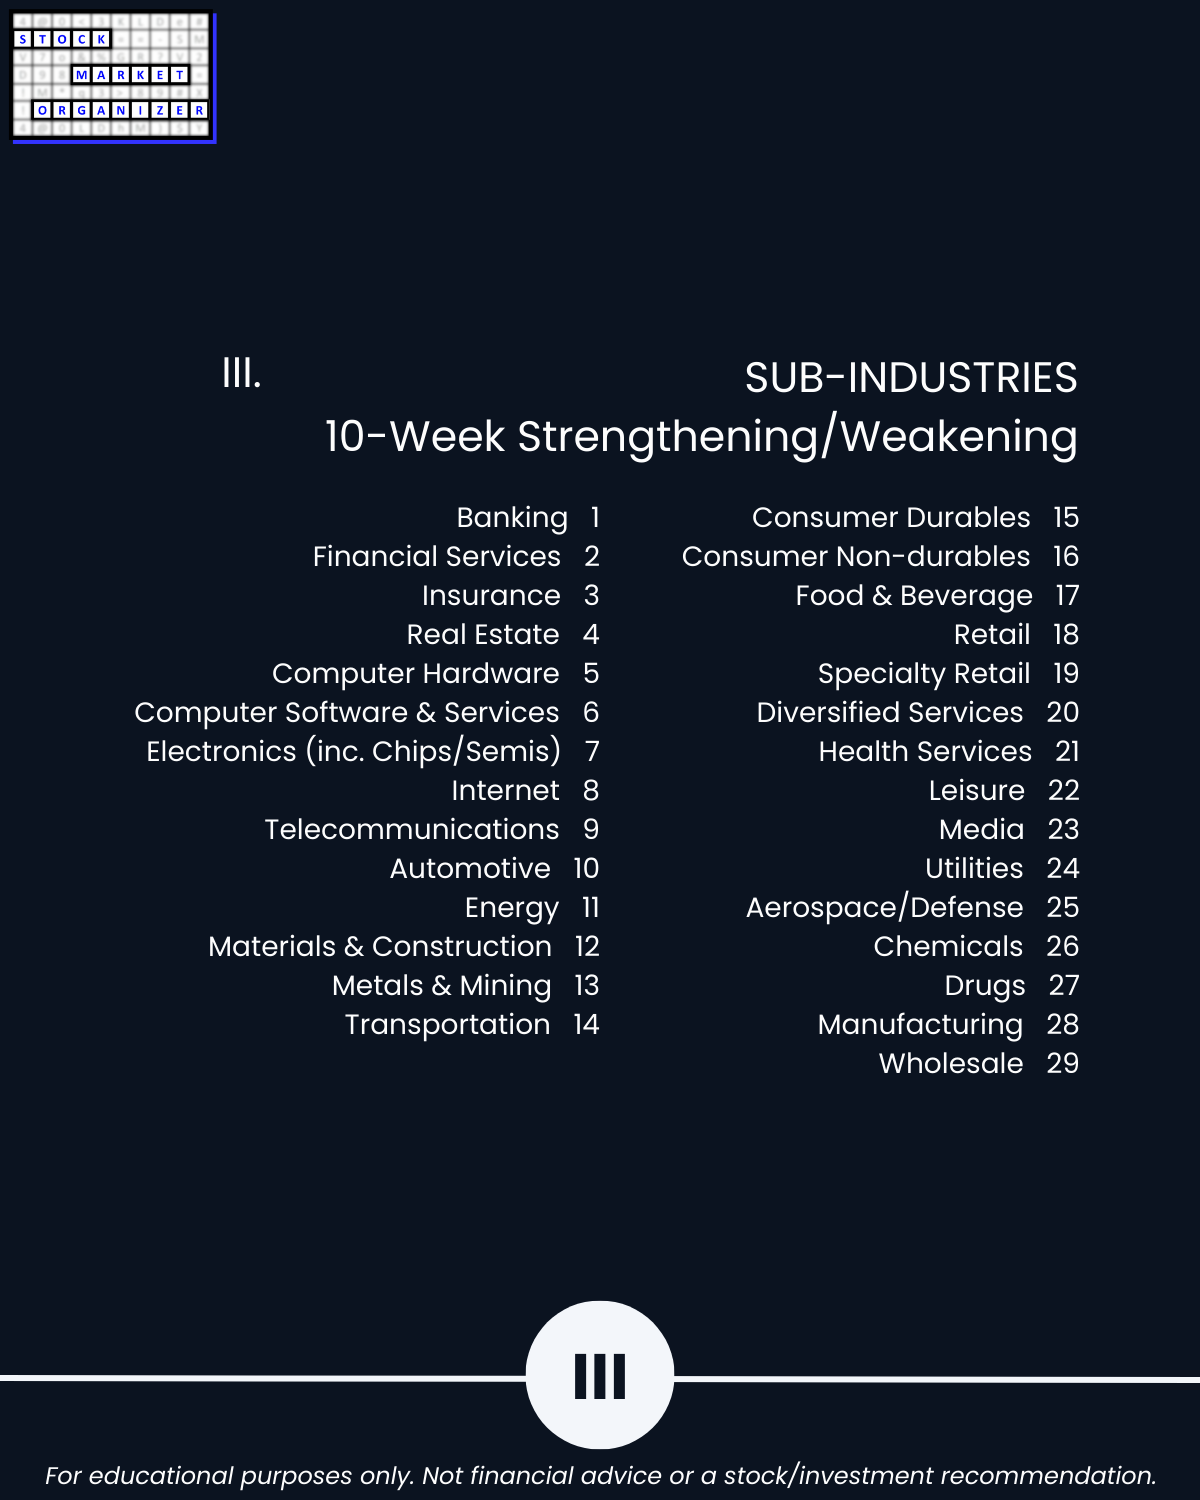
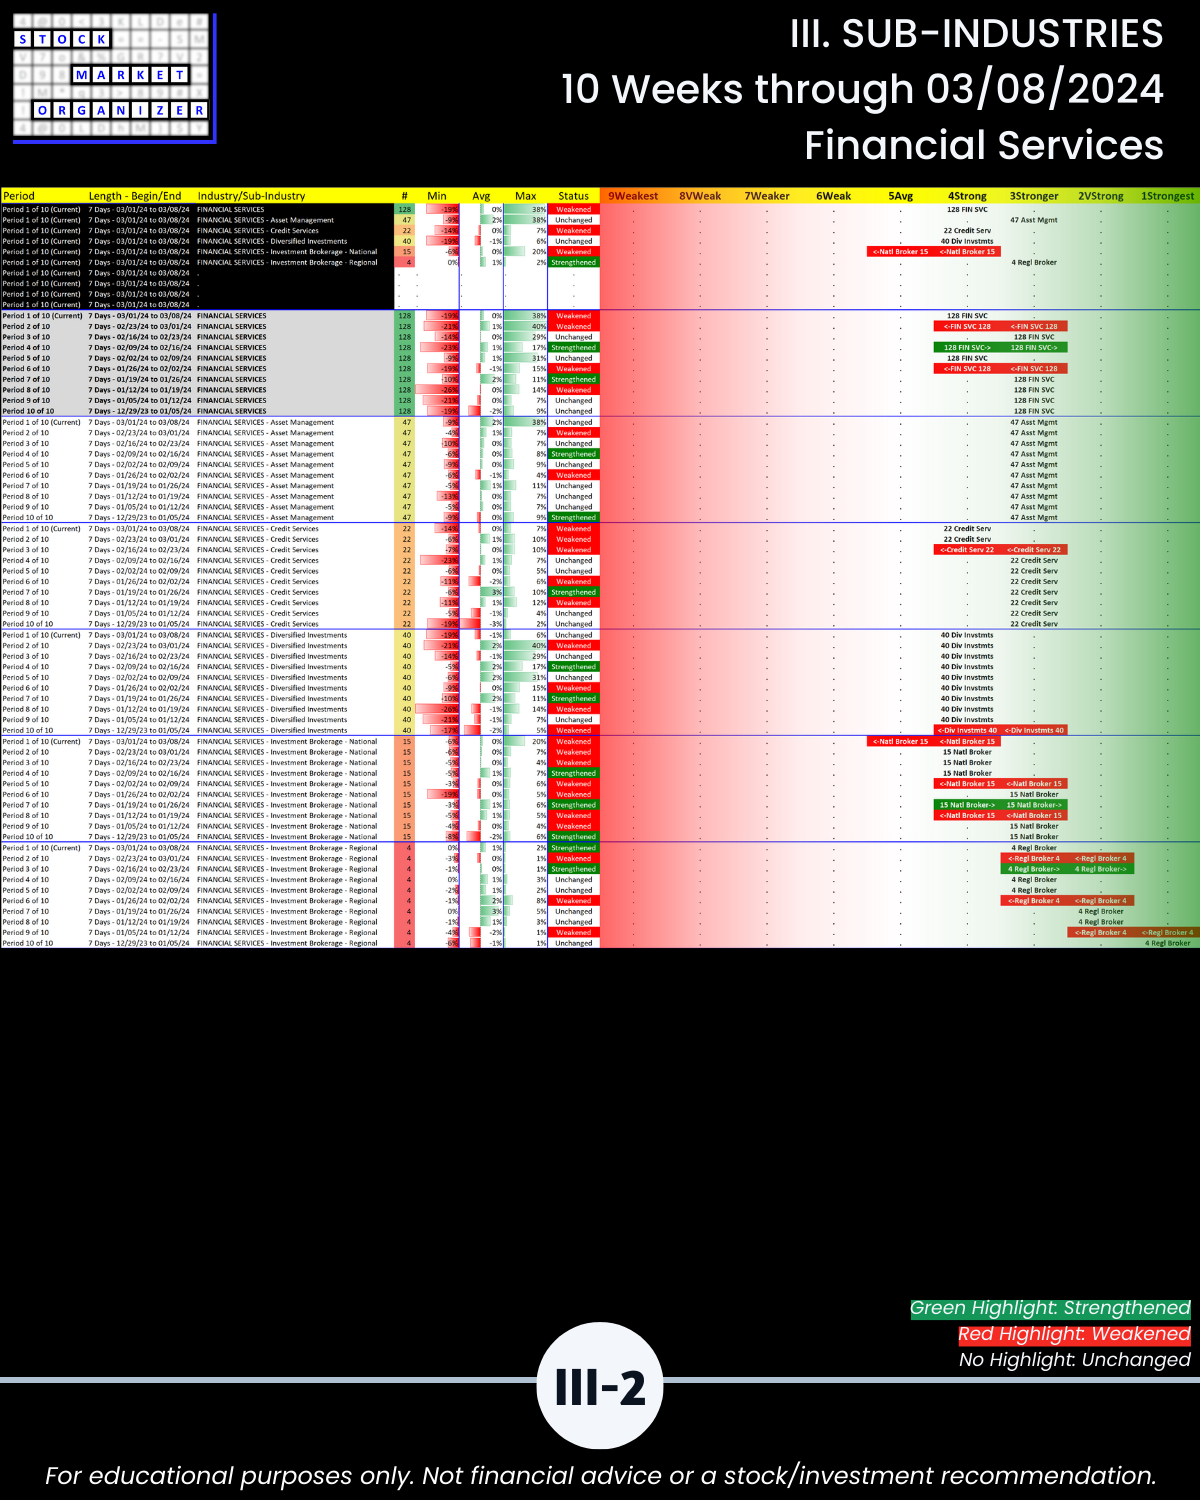
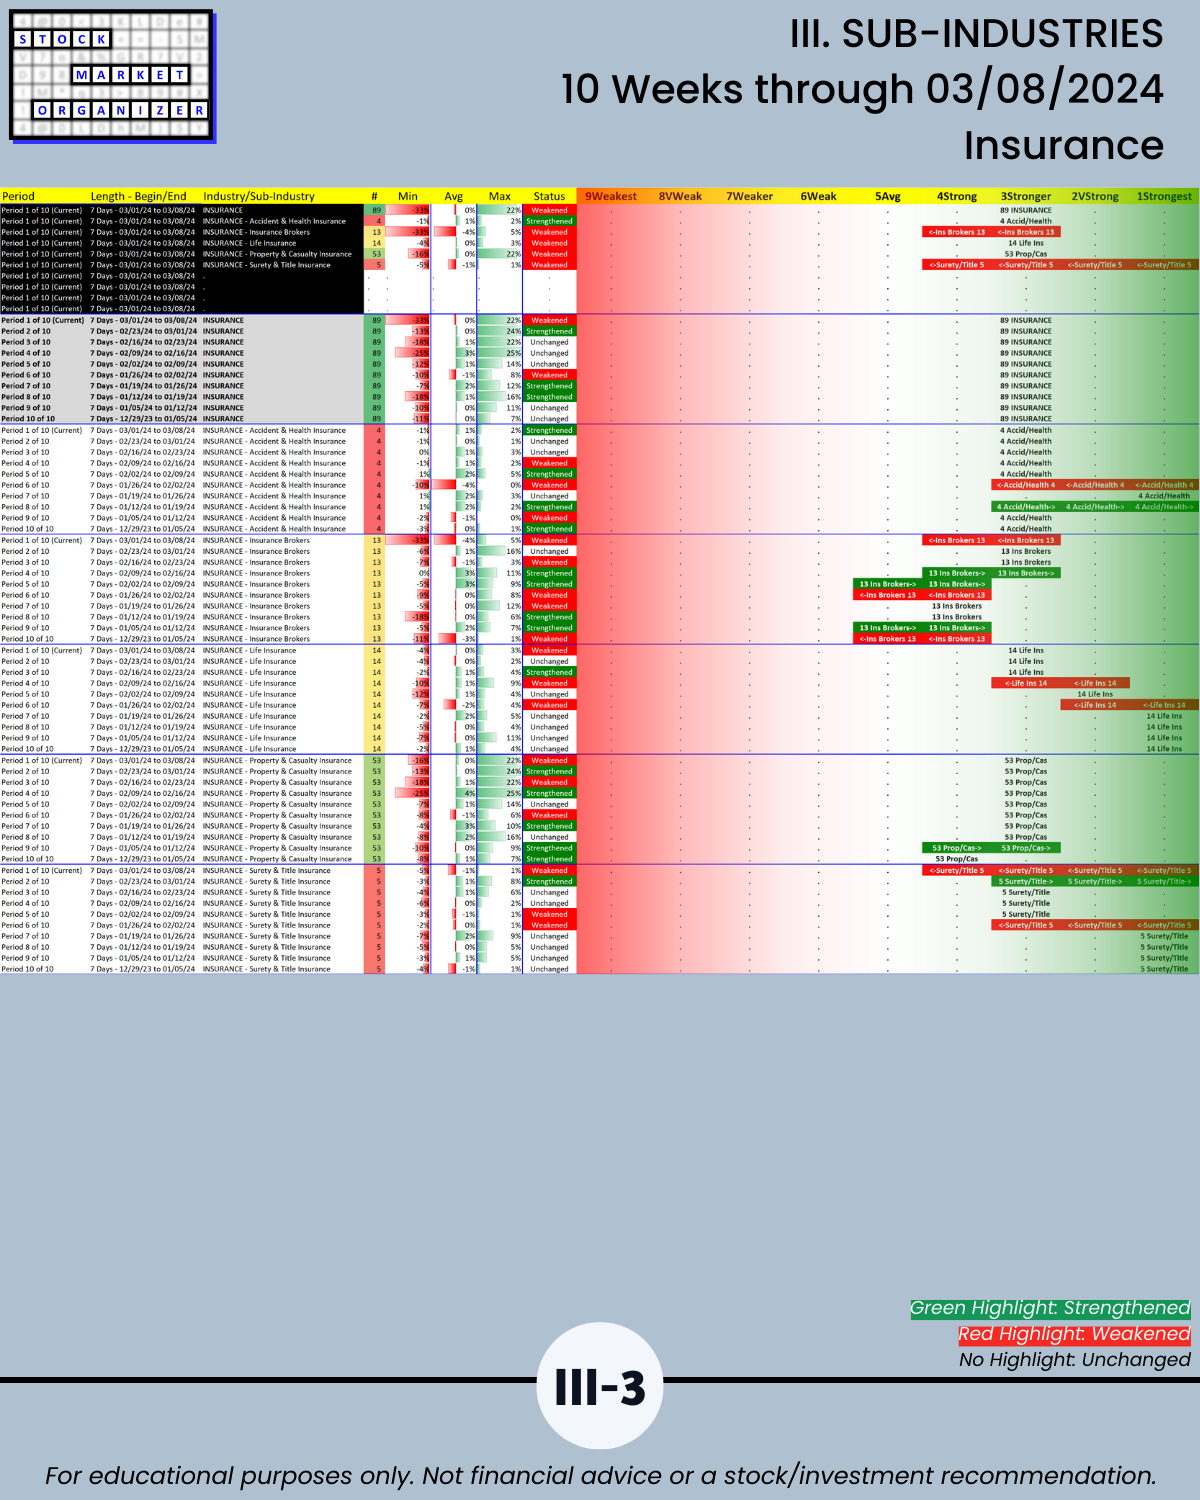
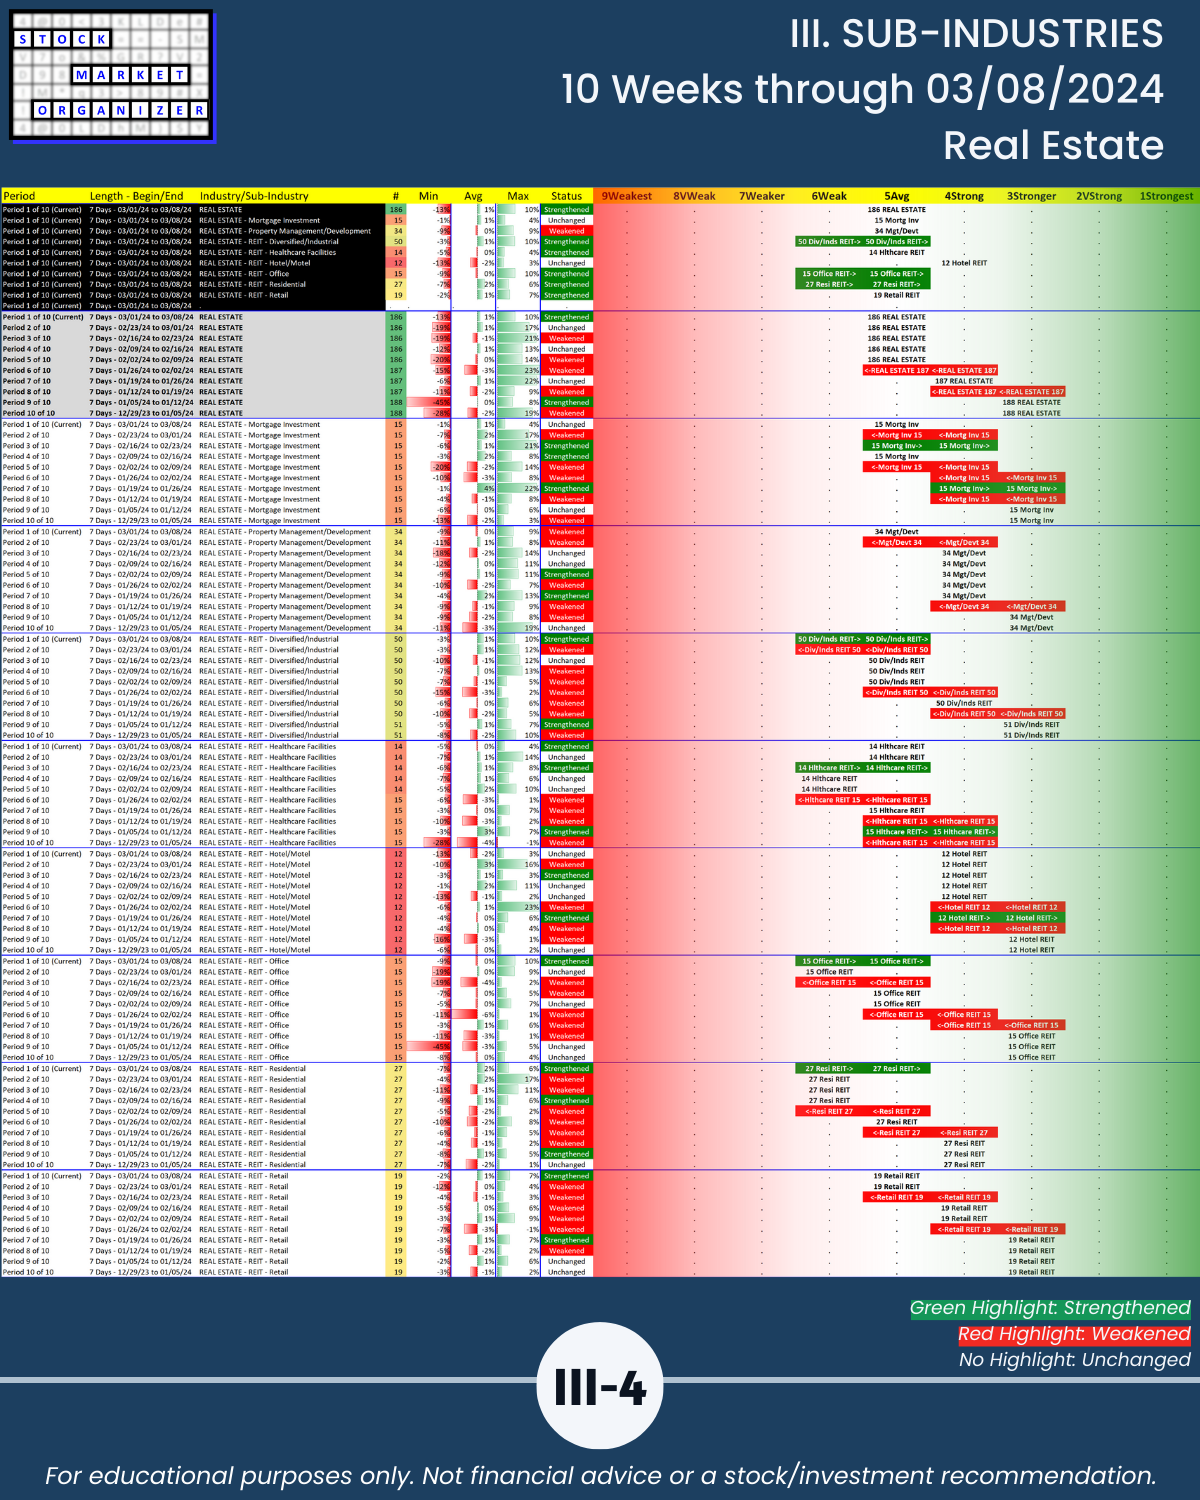
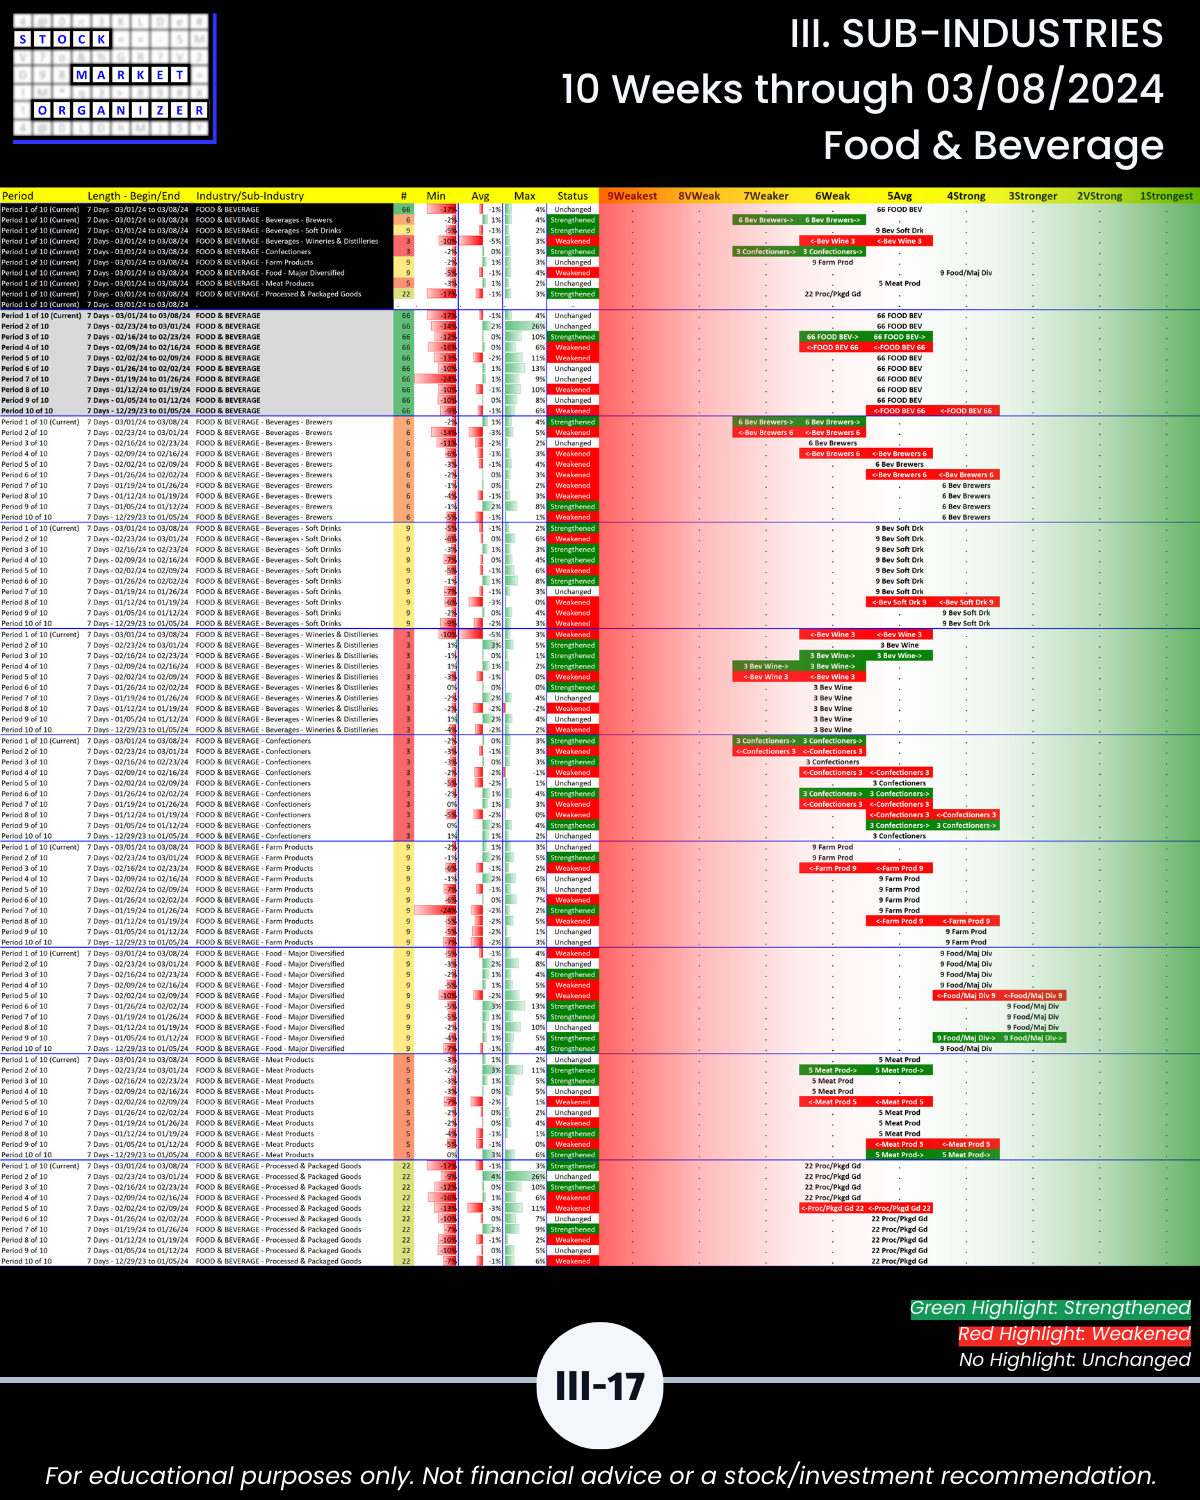
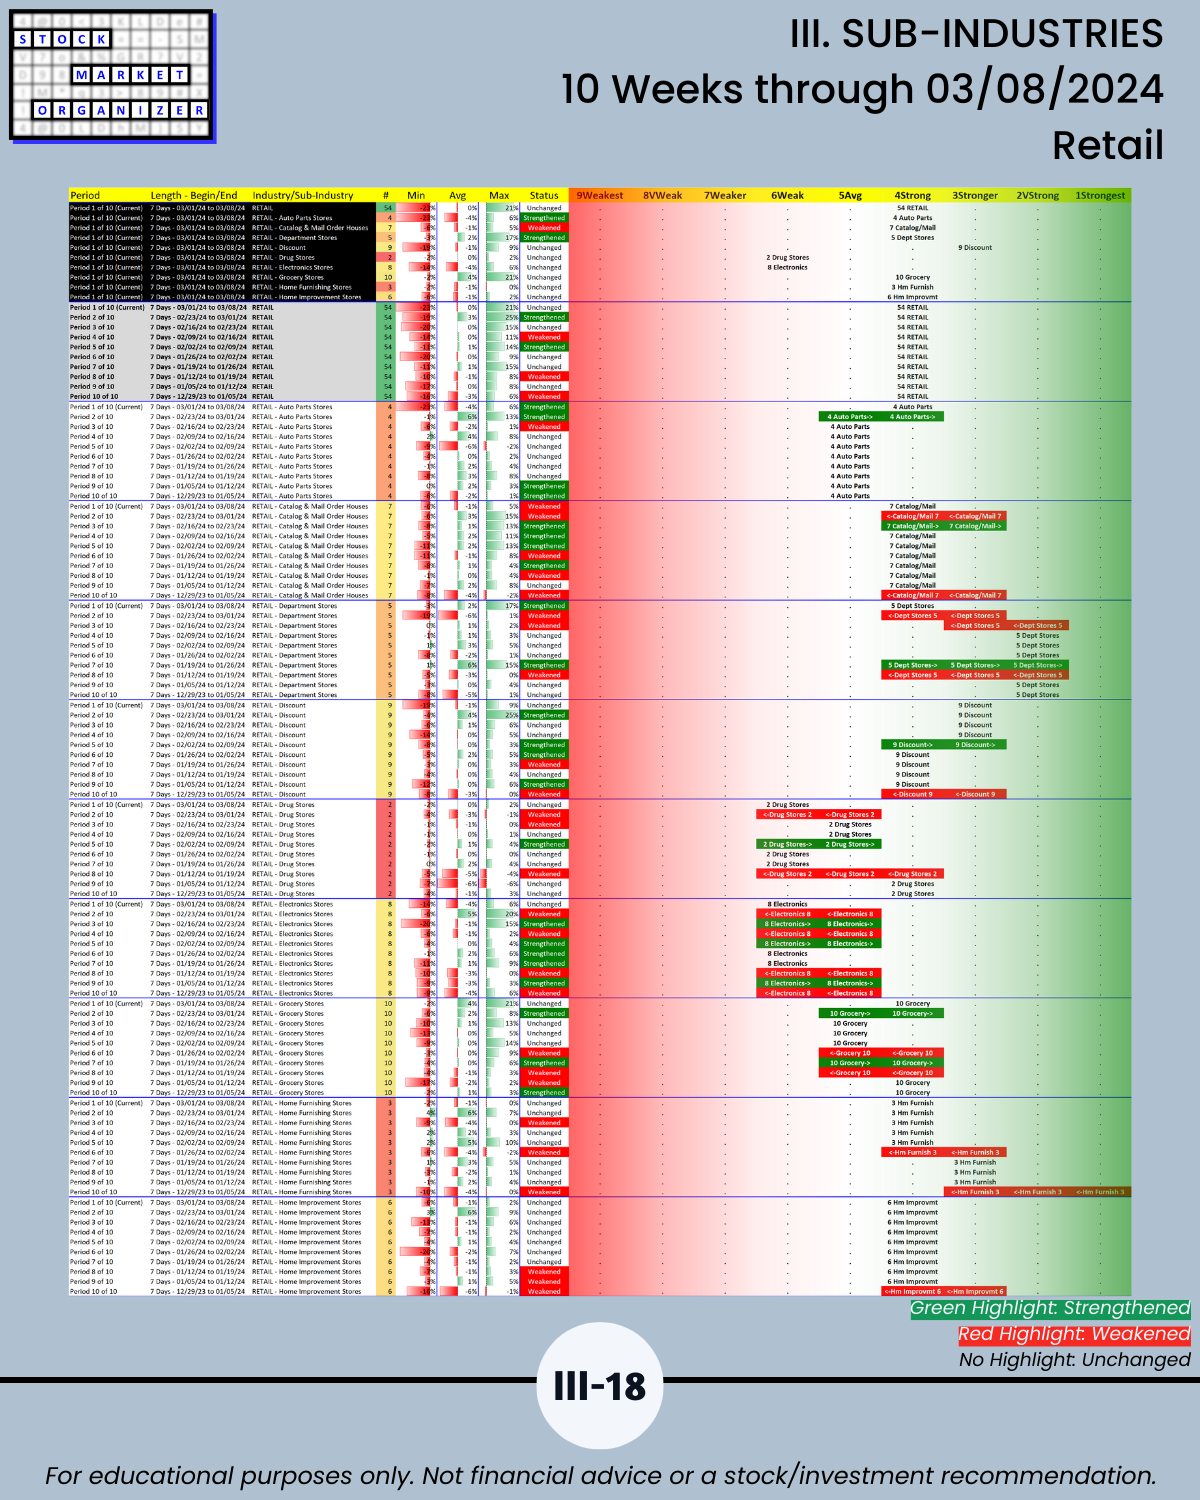
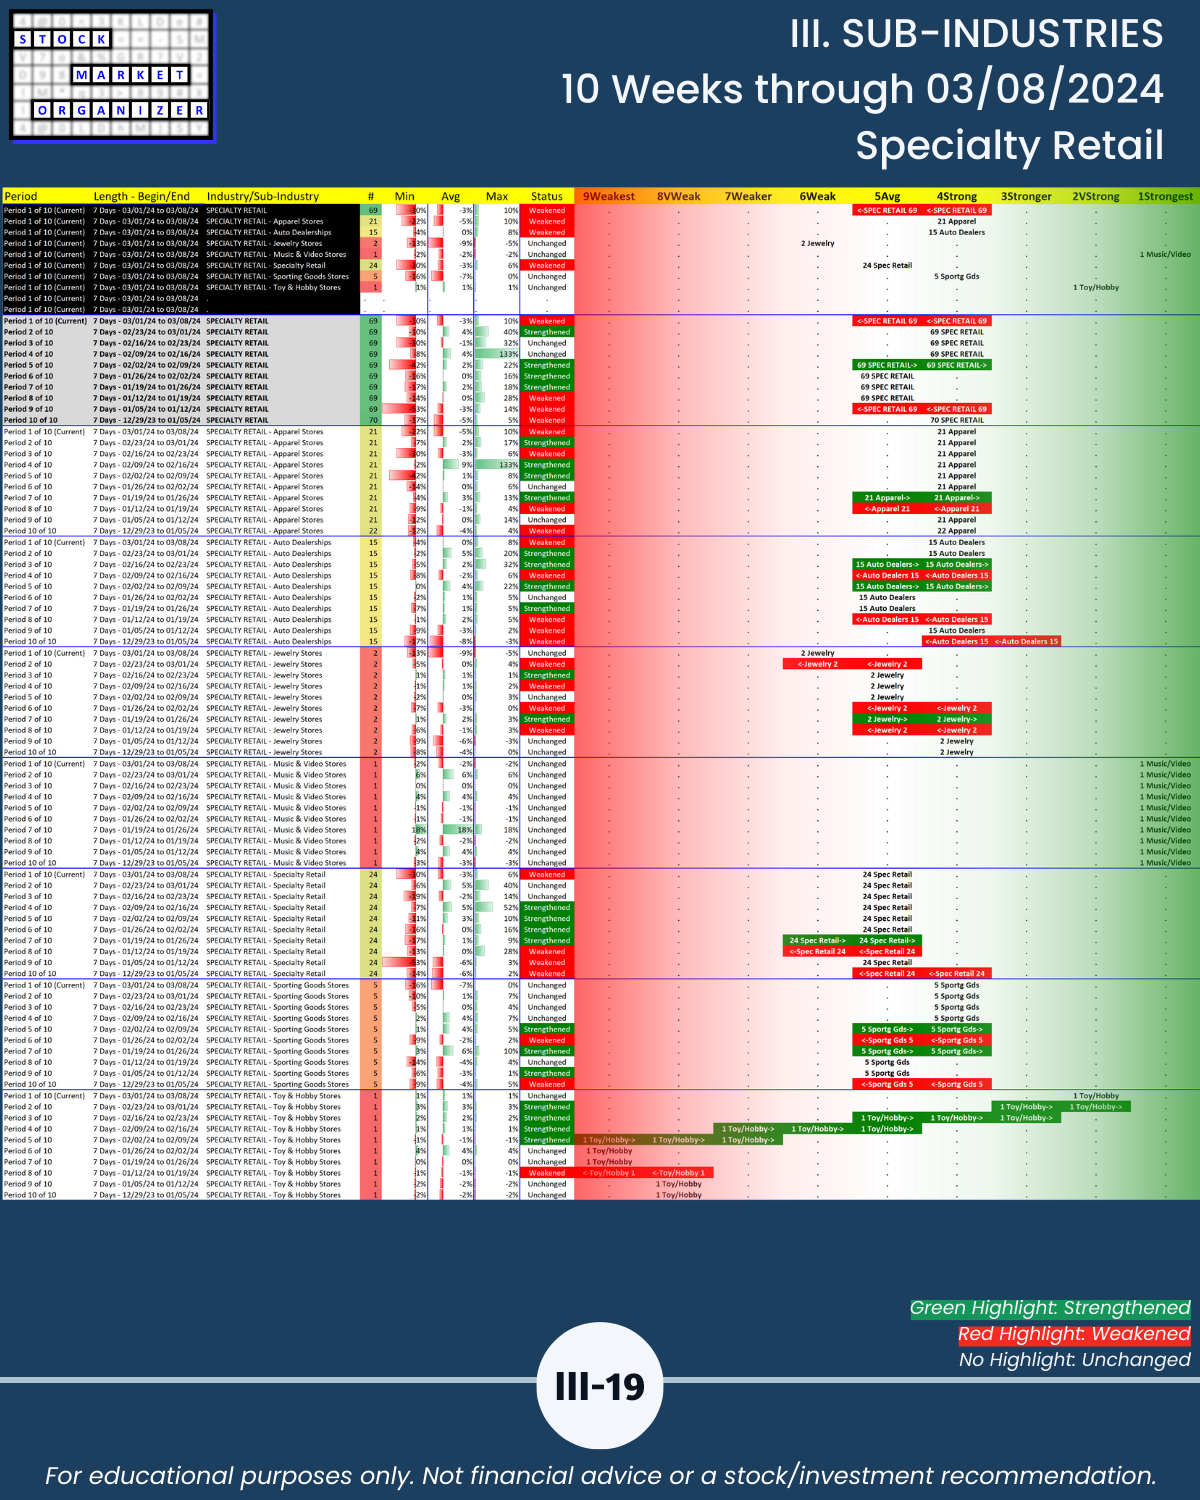
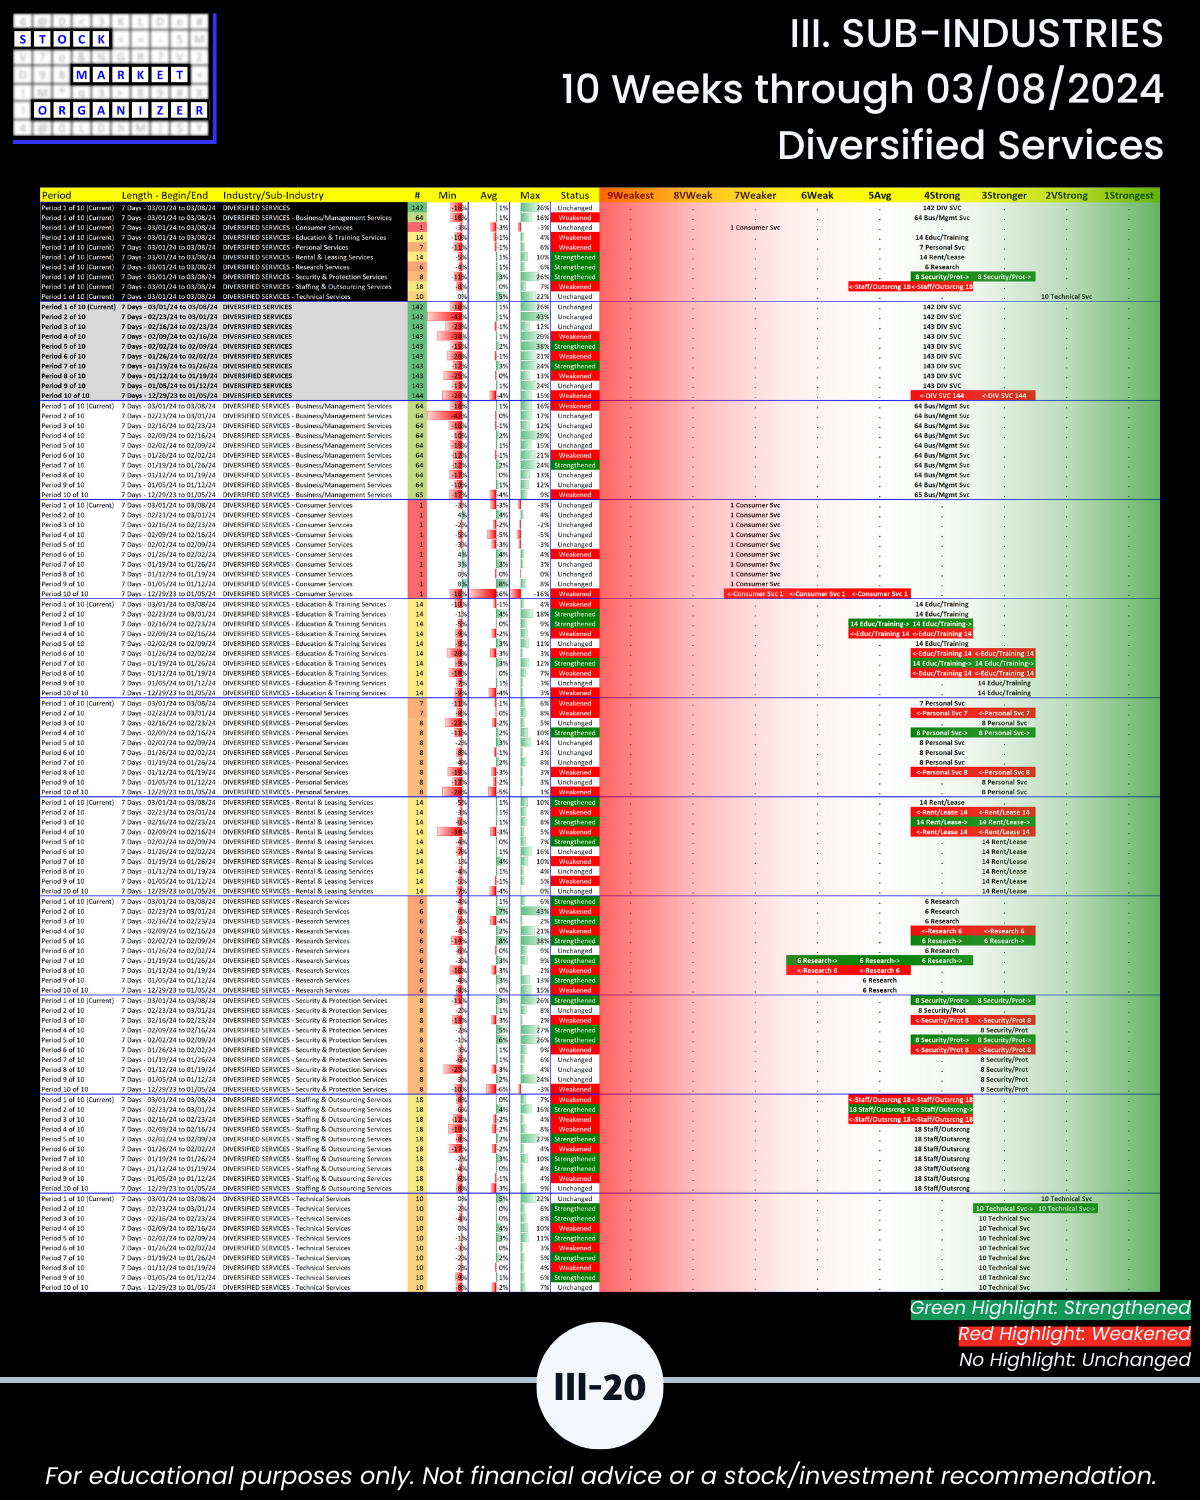
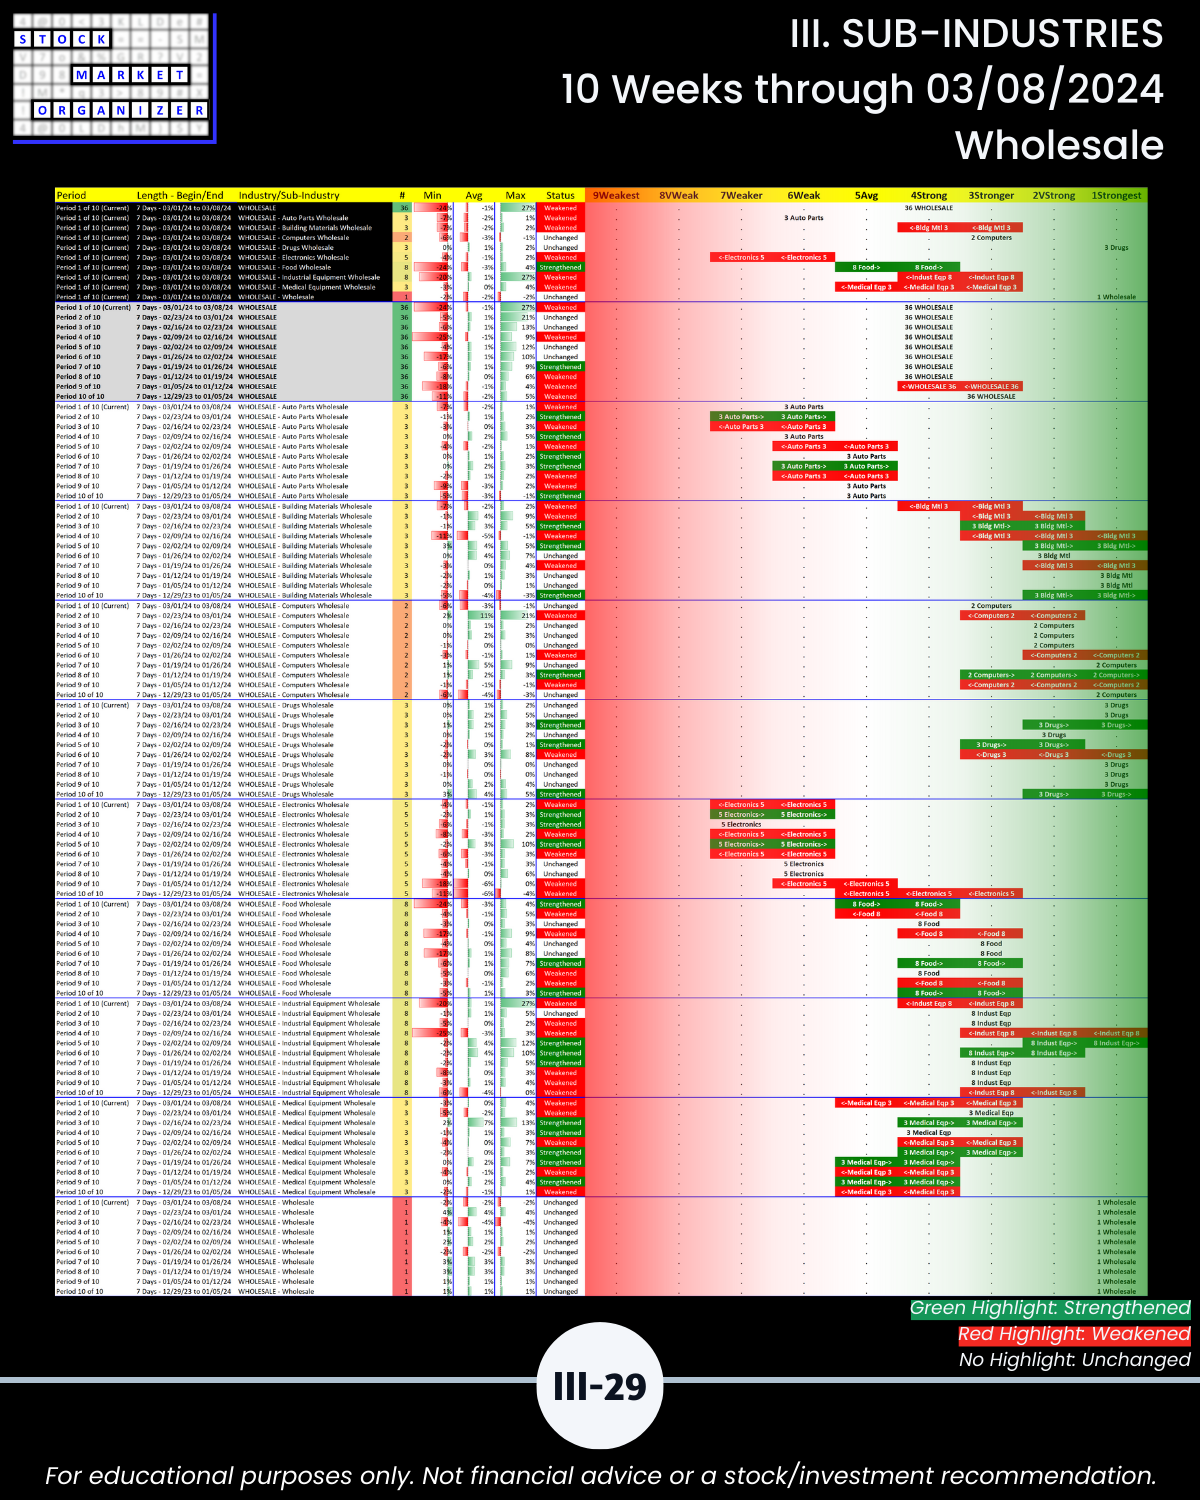
SECTION III
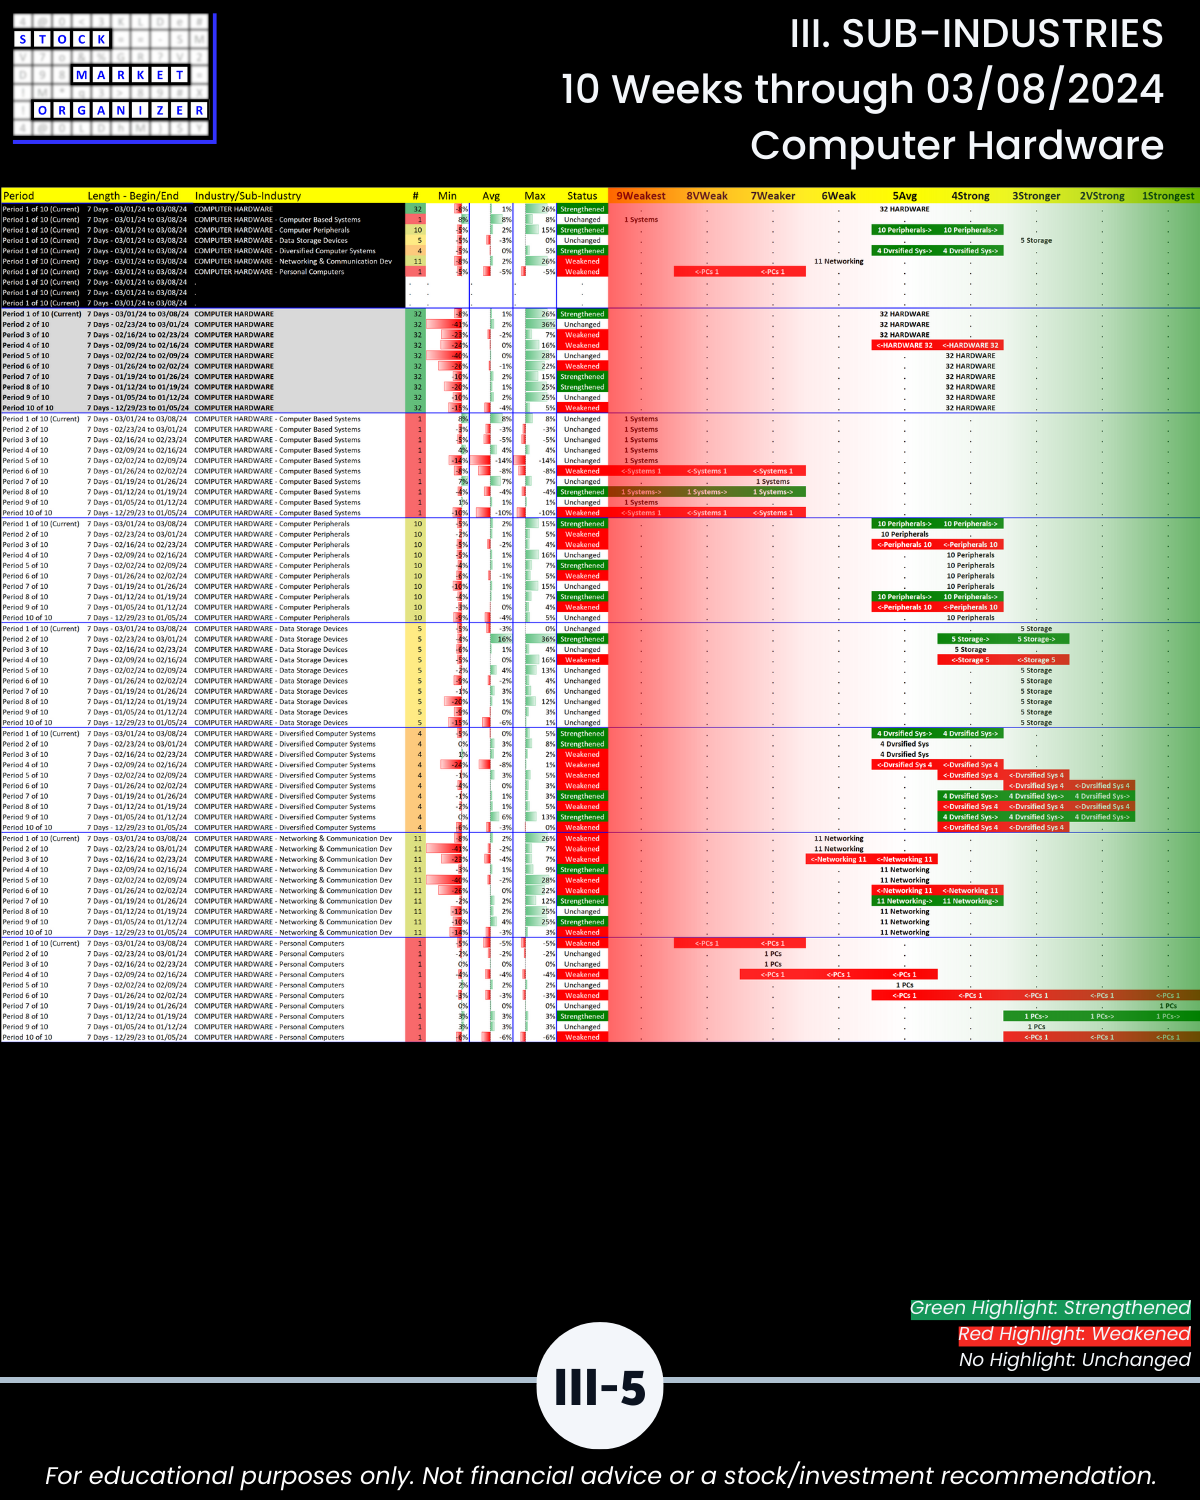
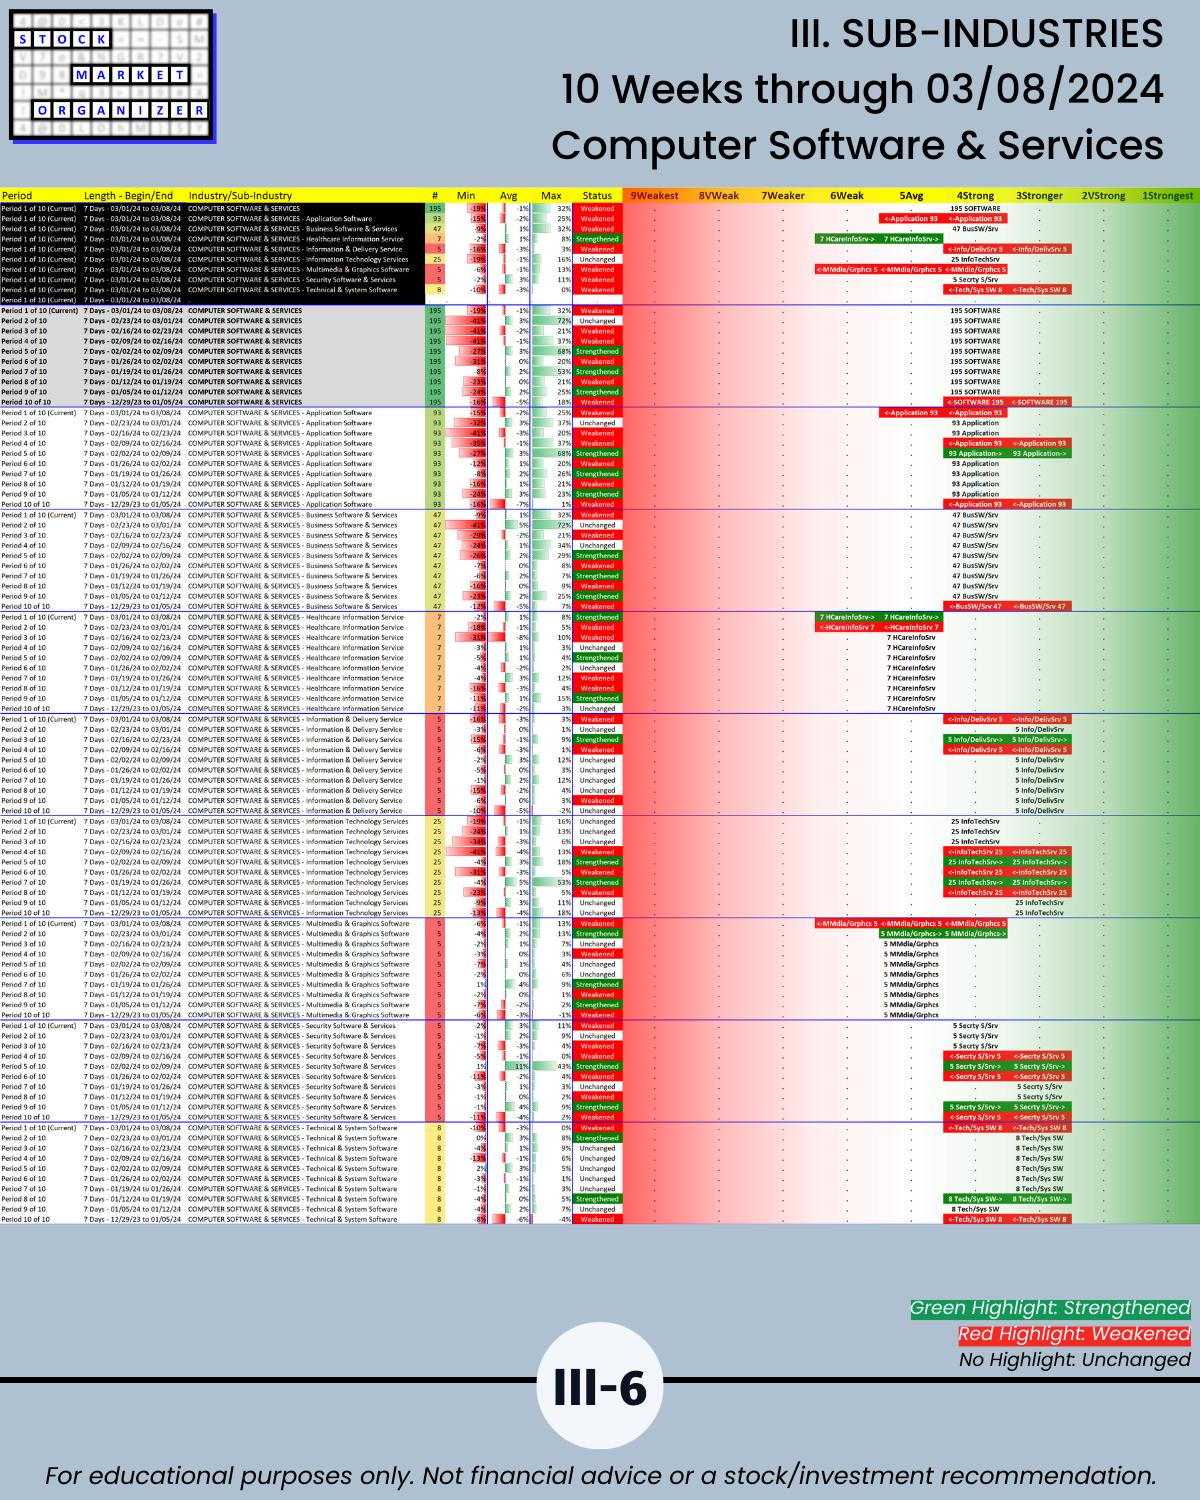
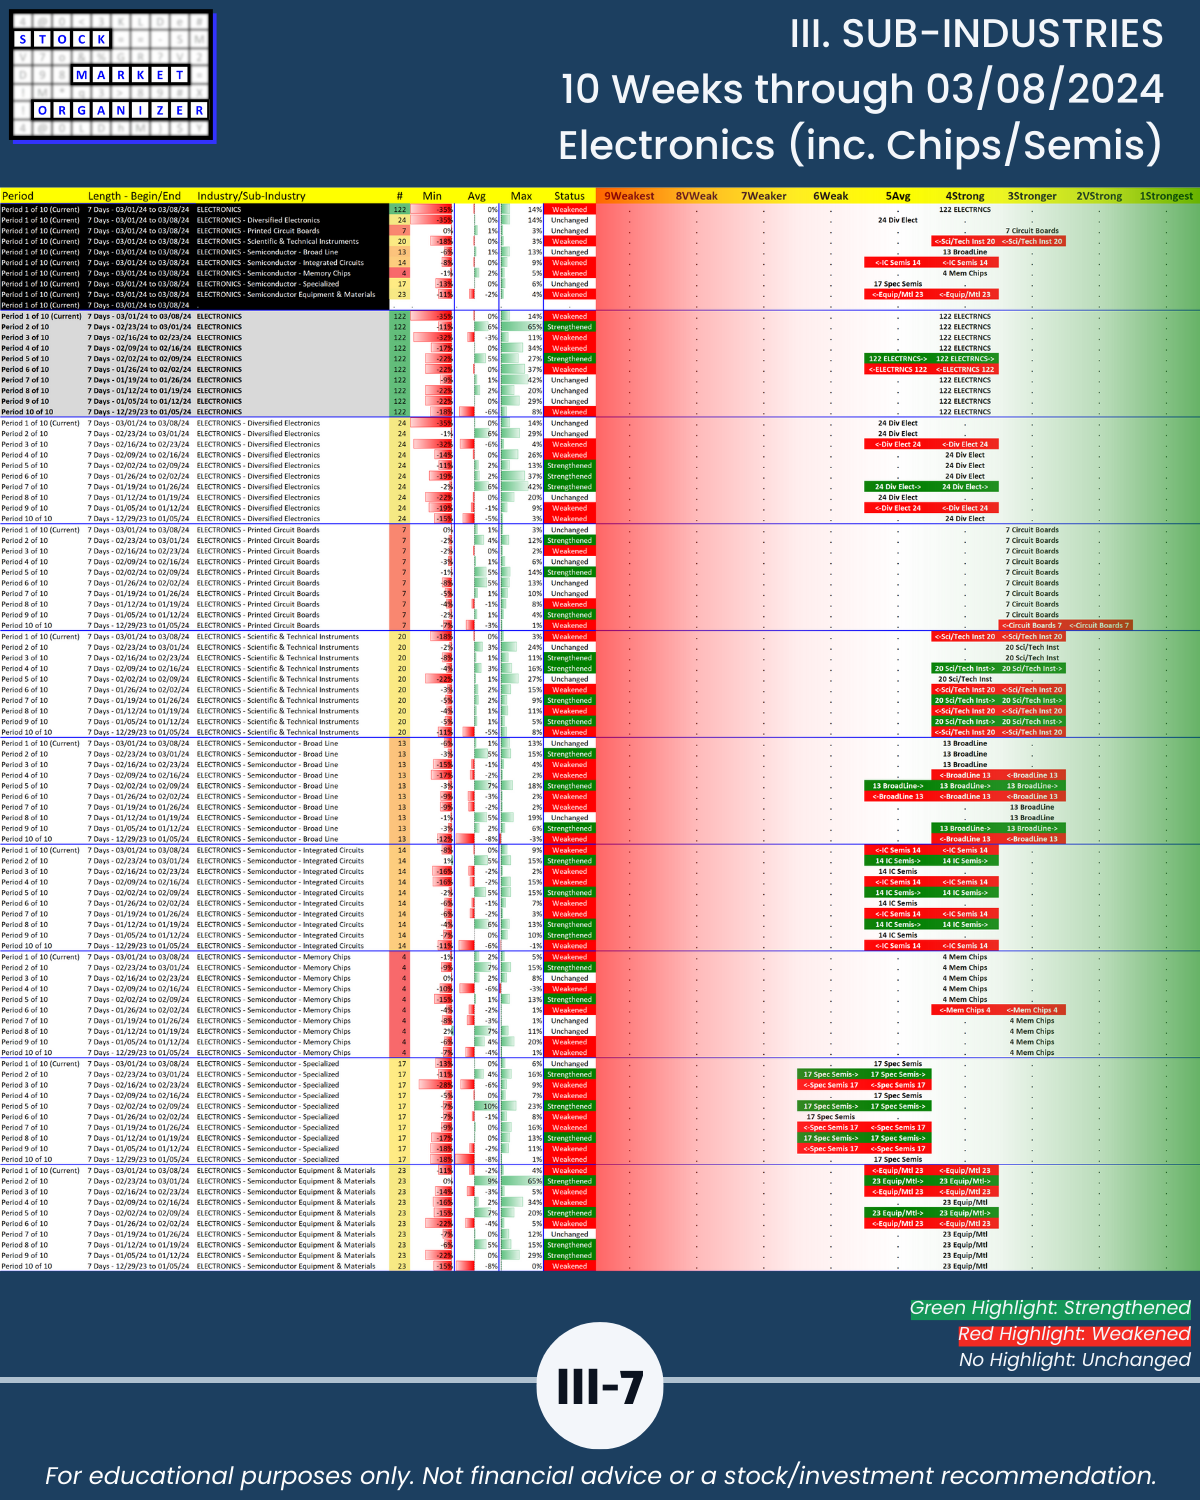
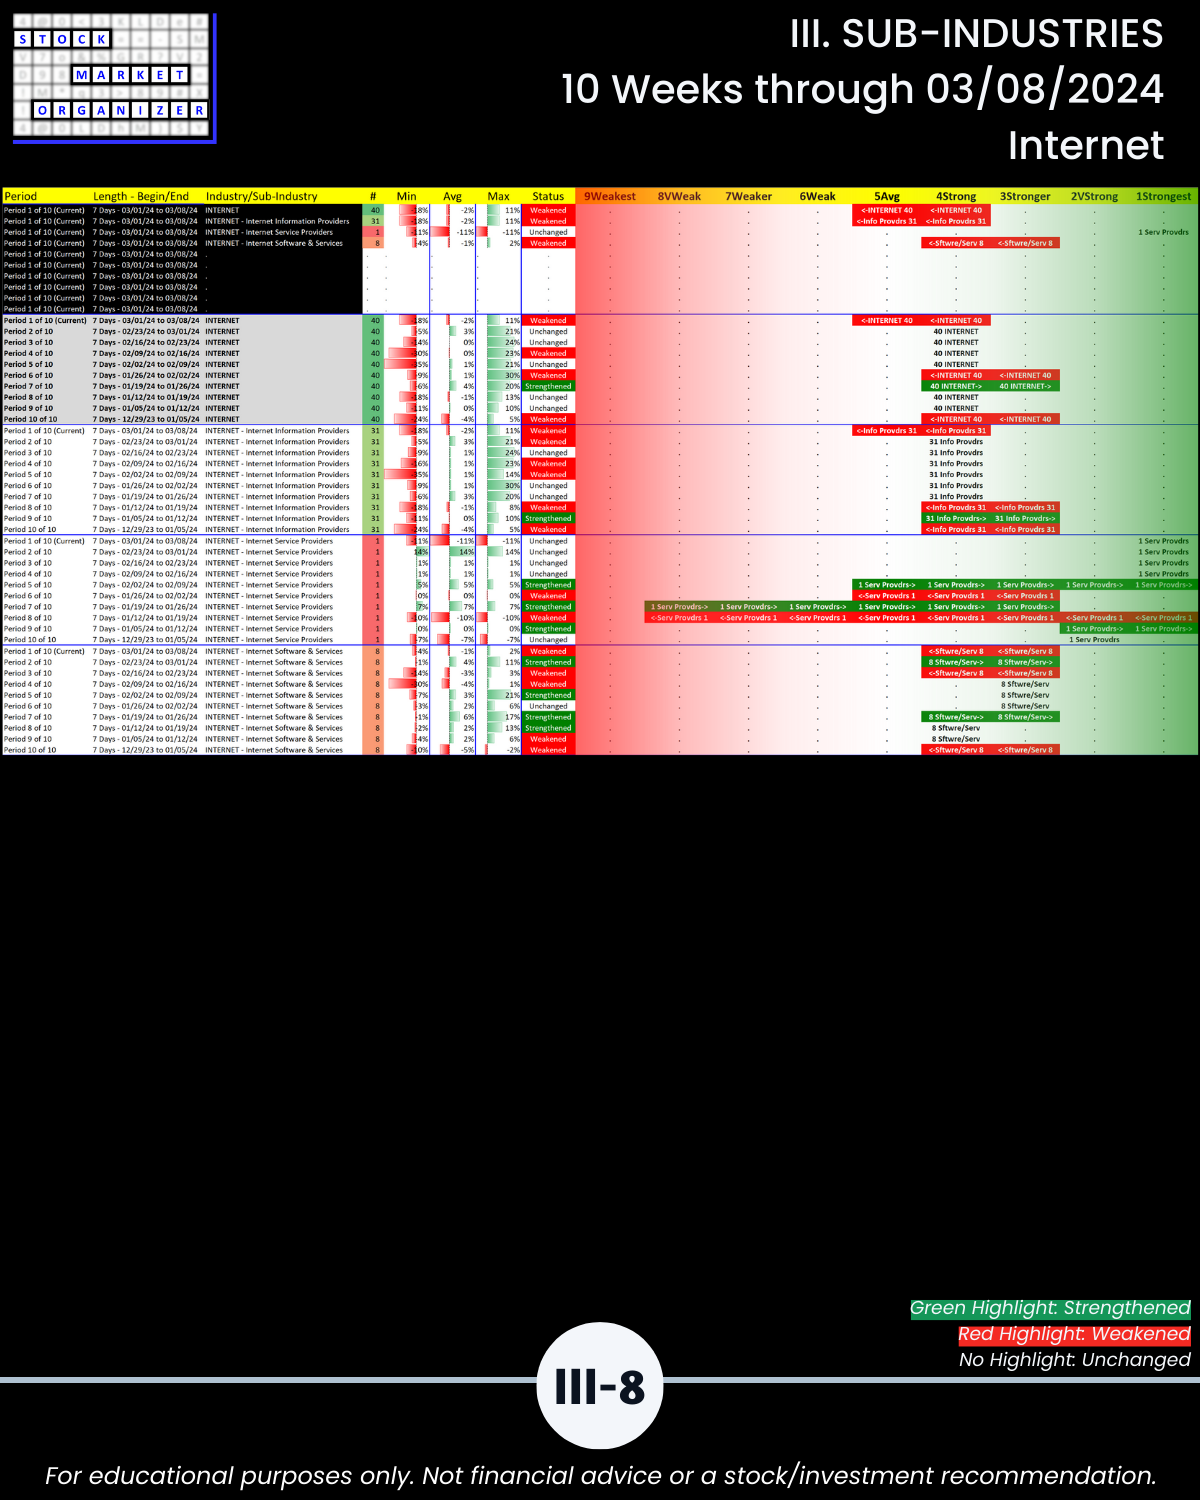
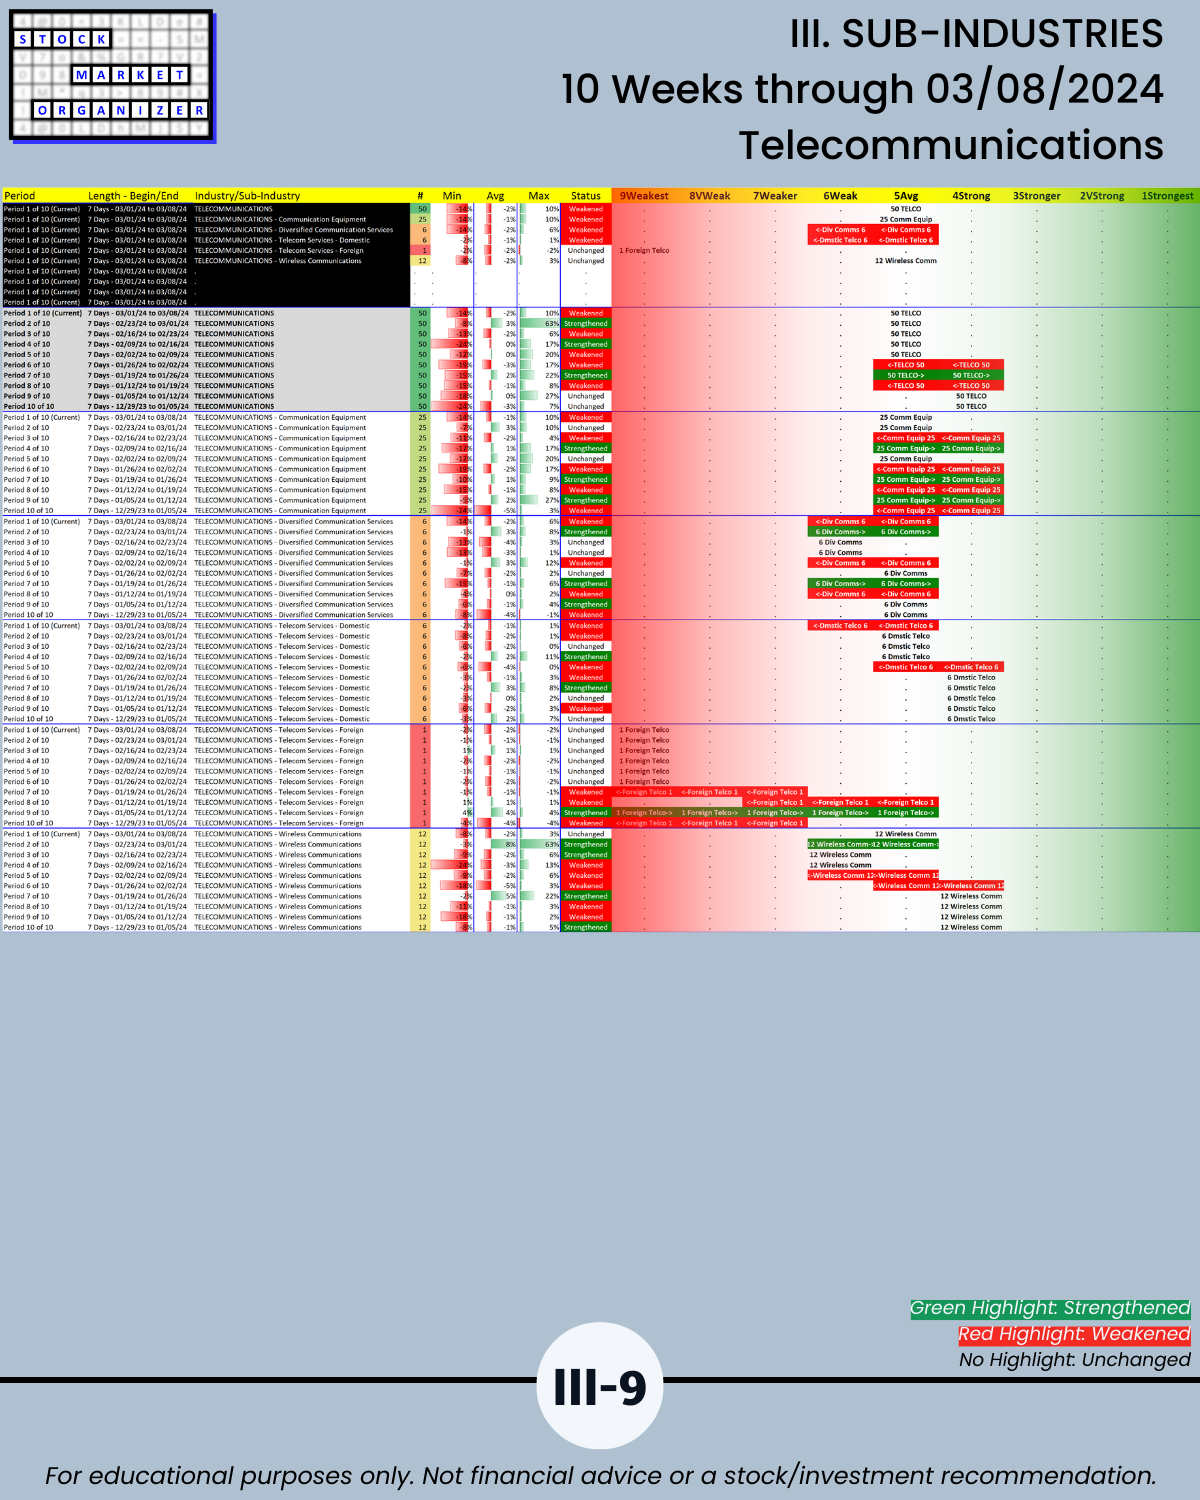
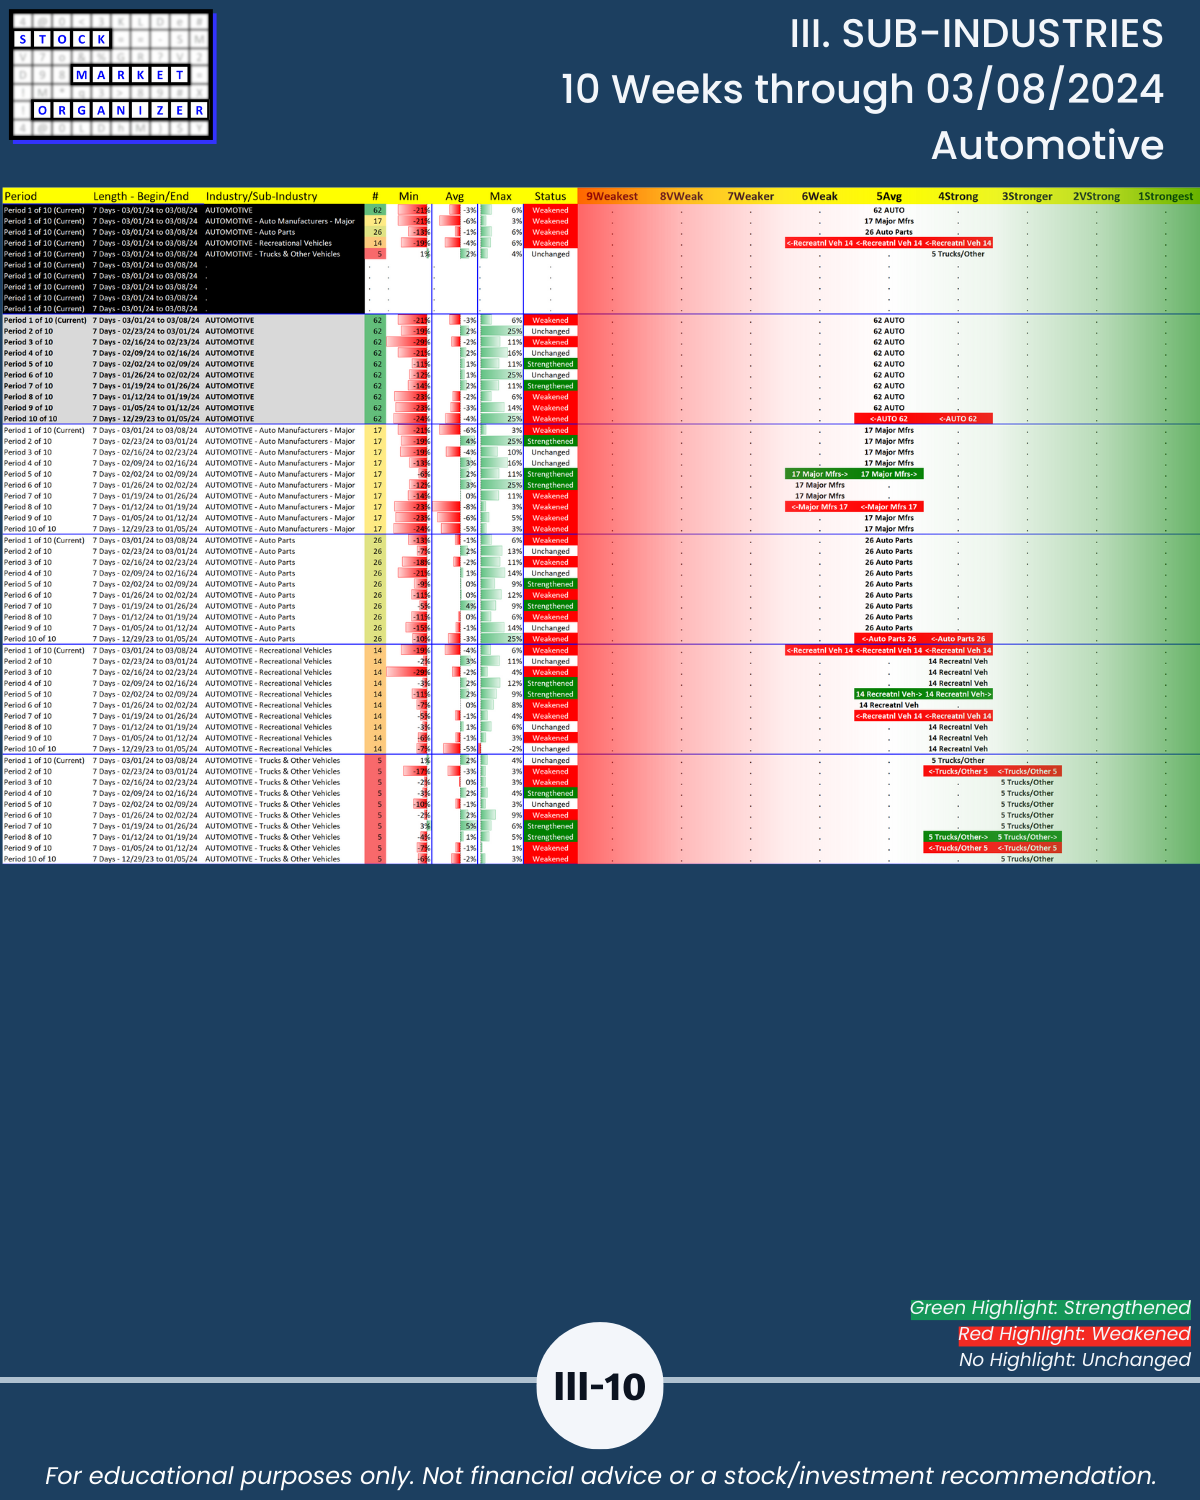
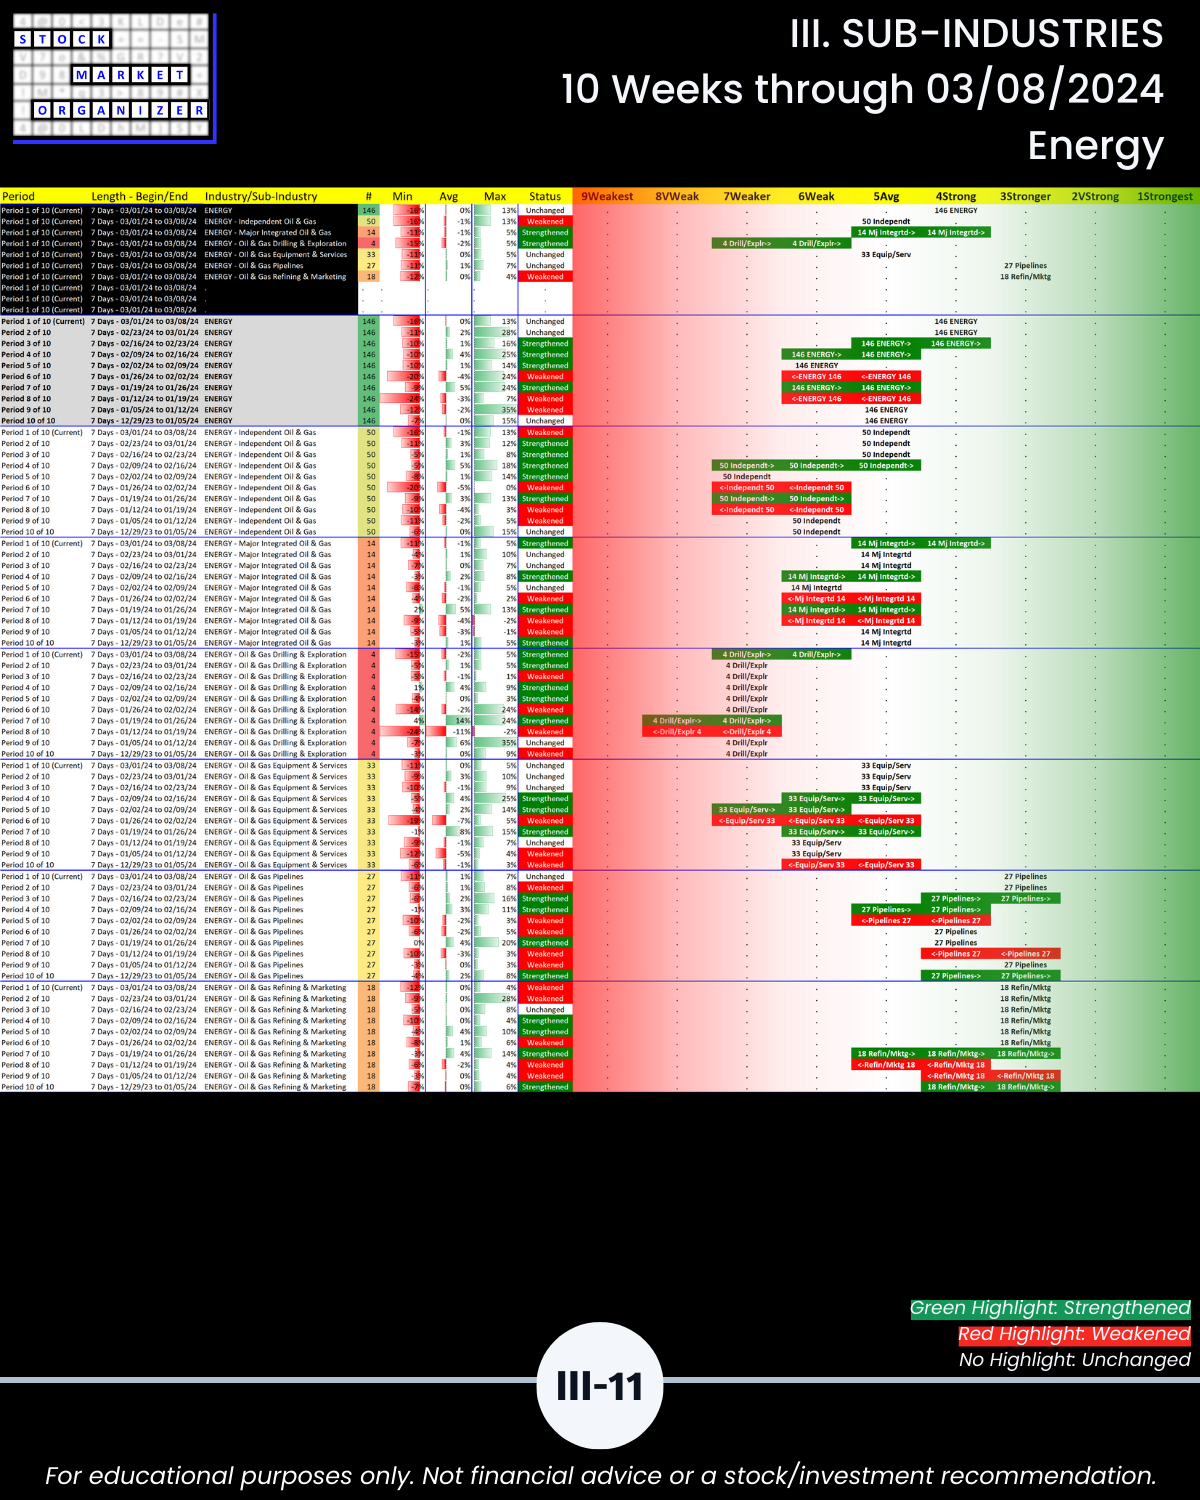
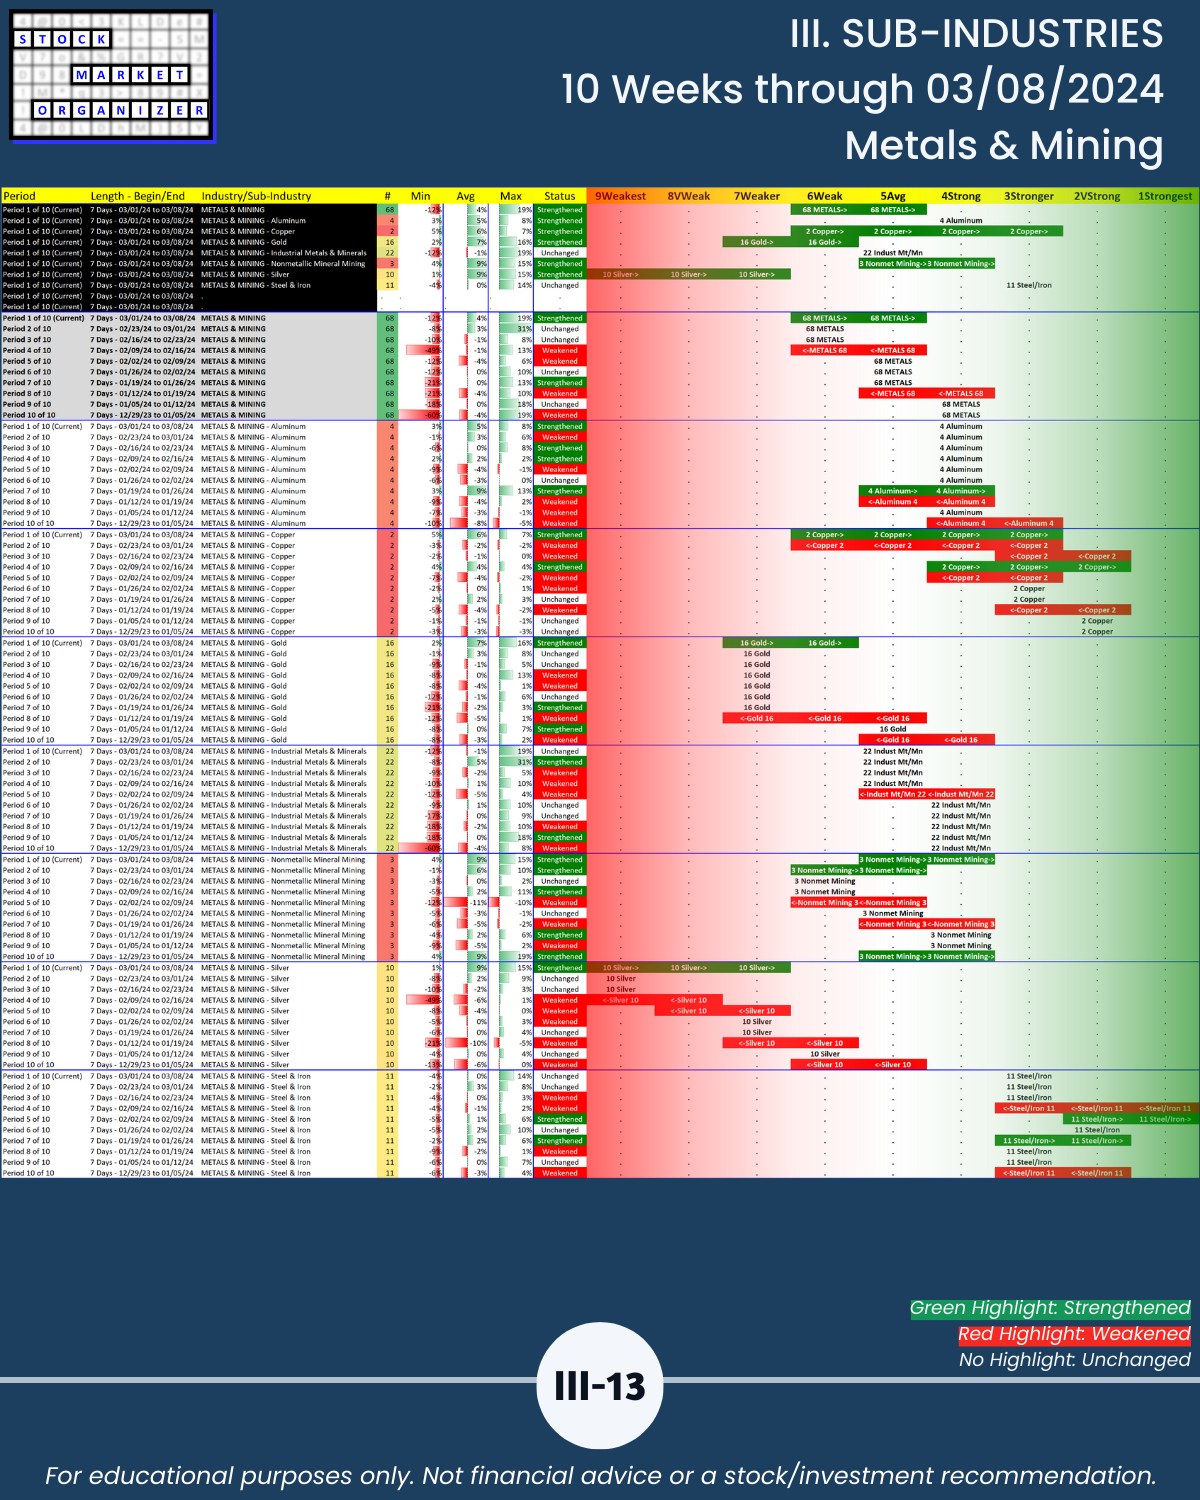
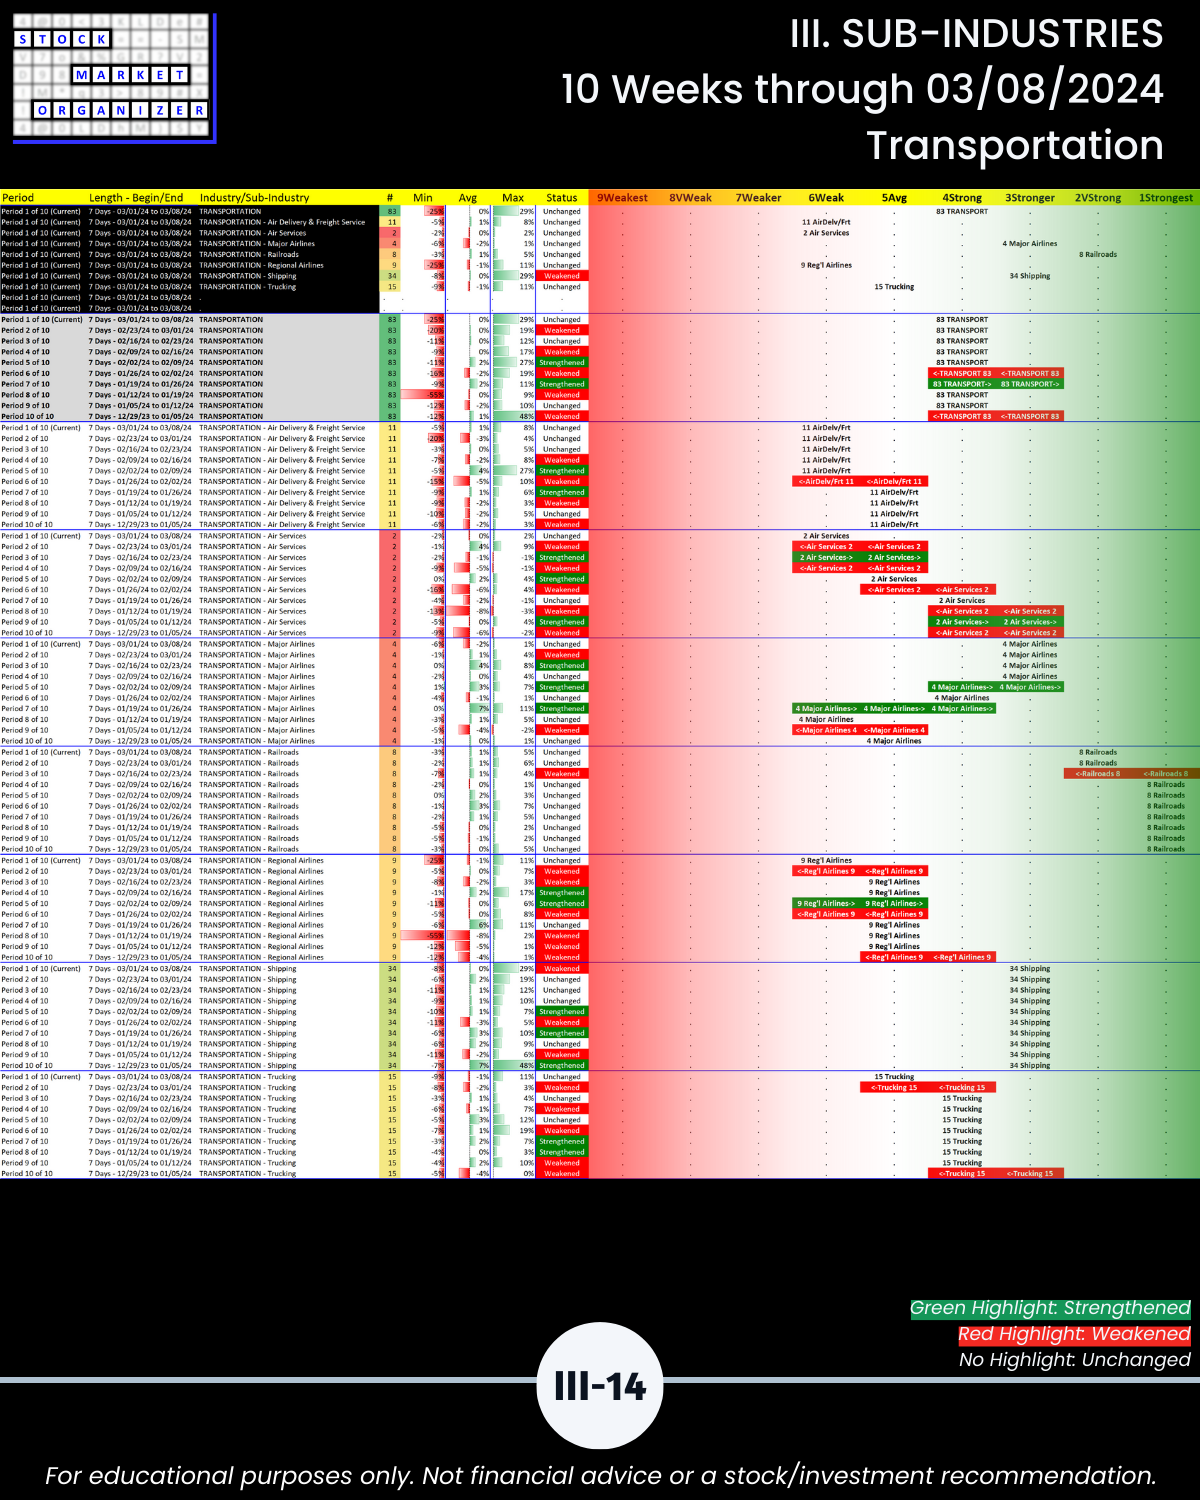
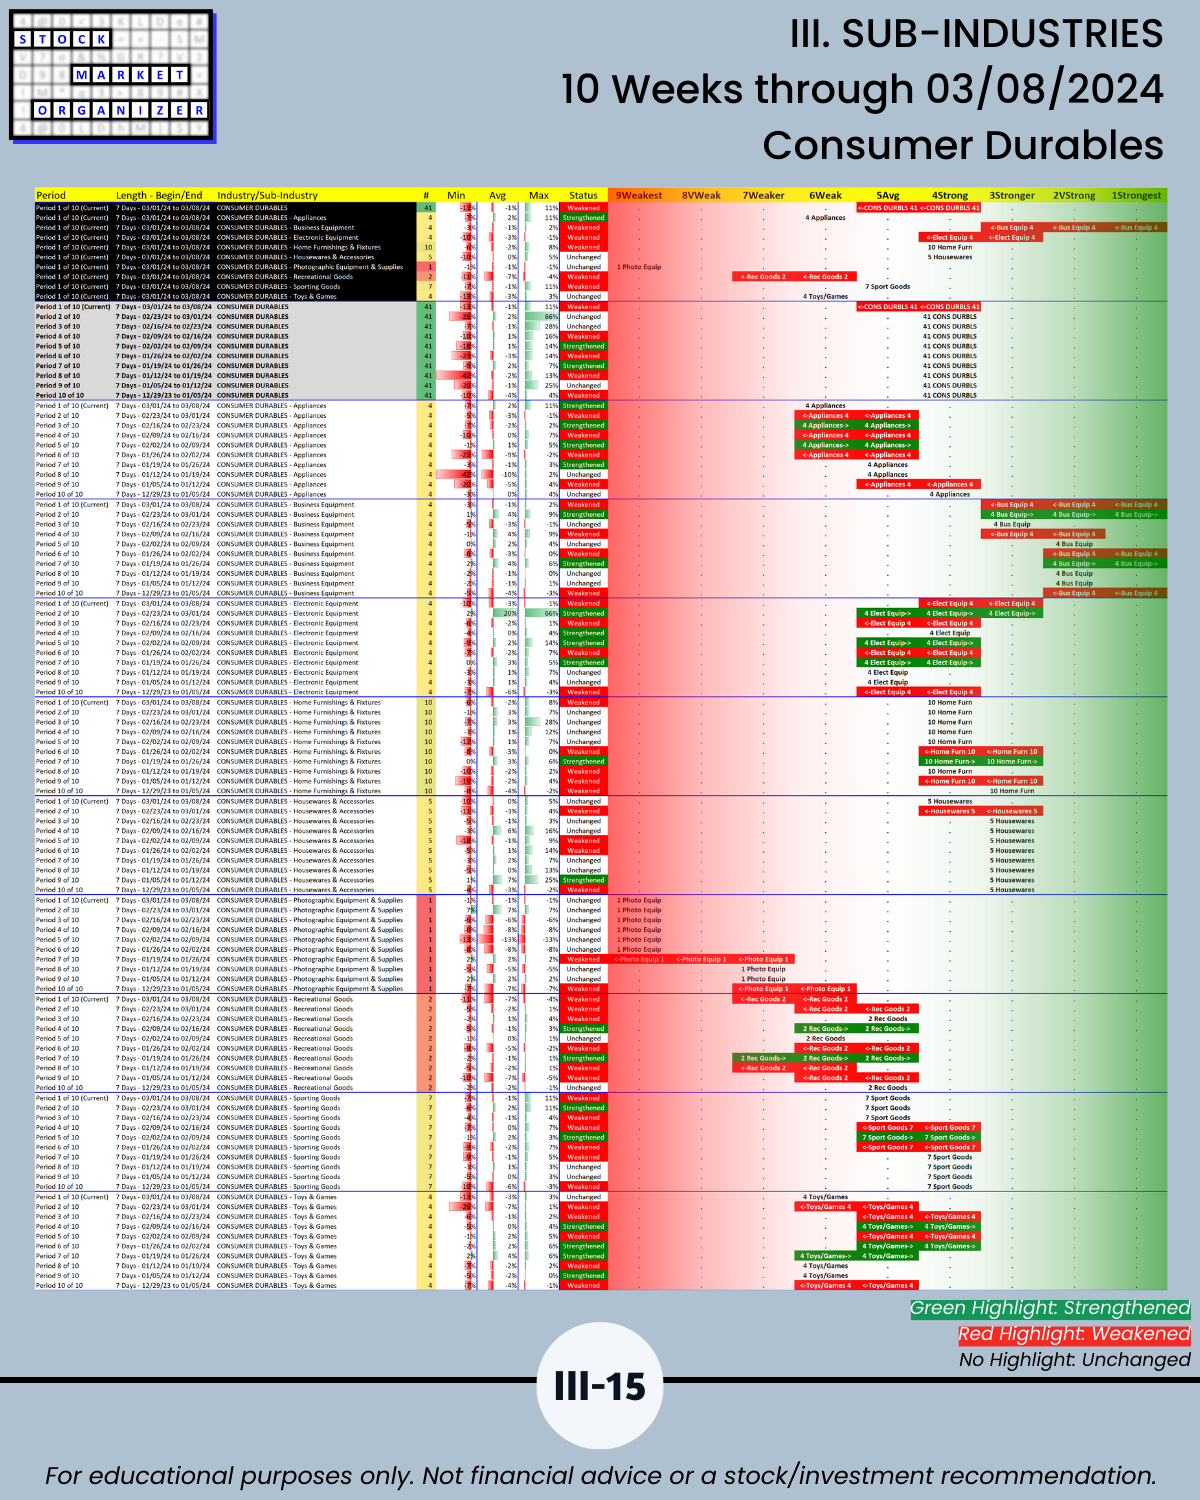
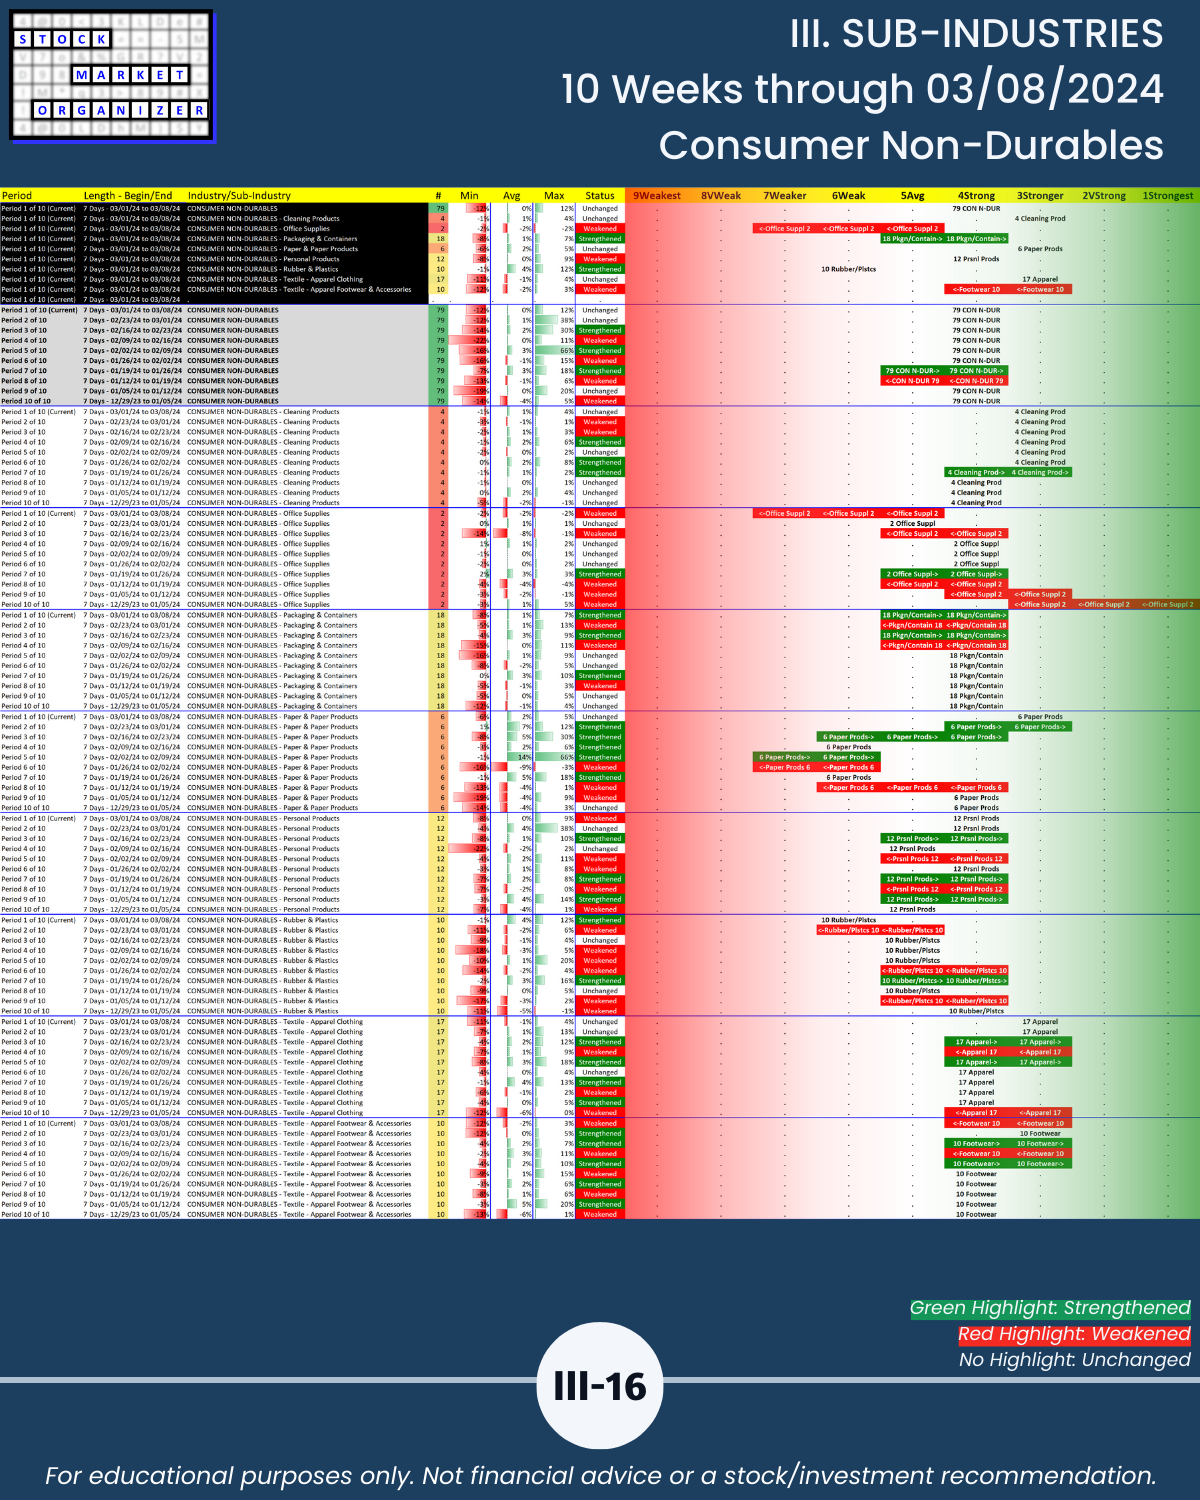
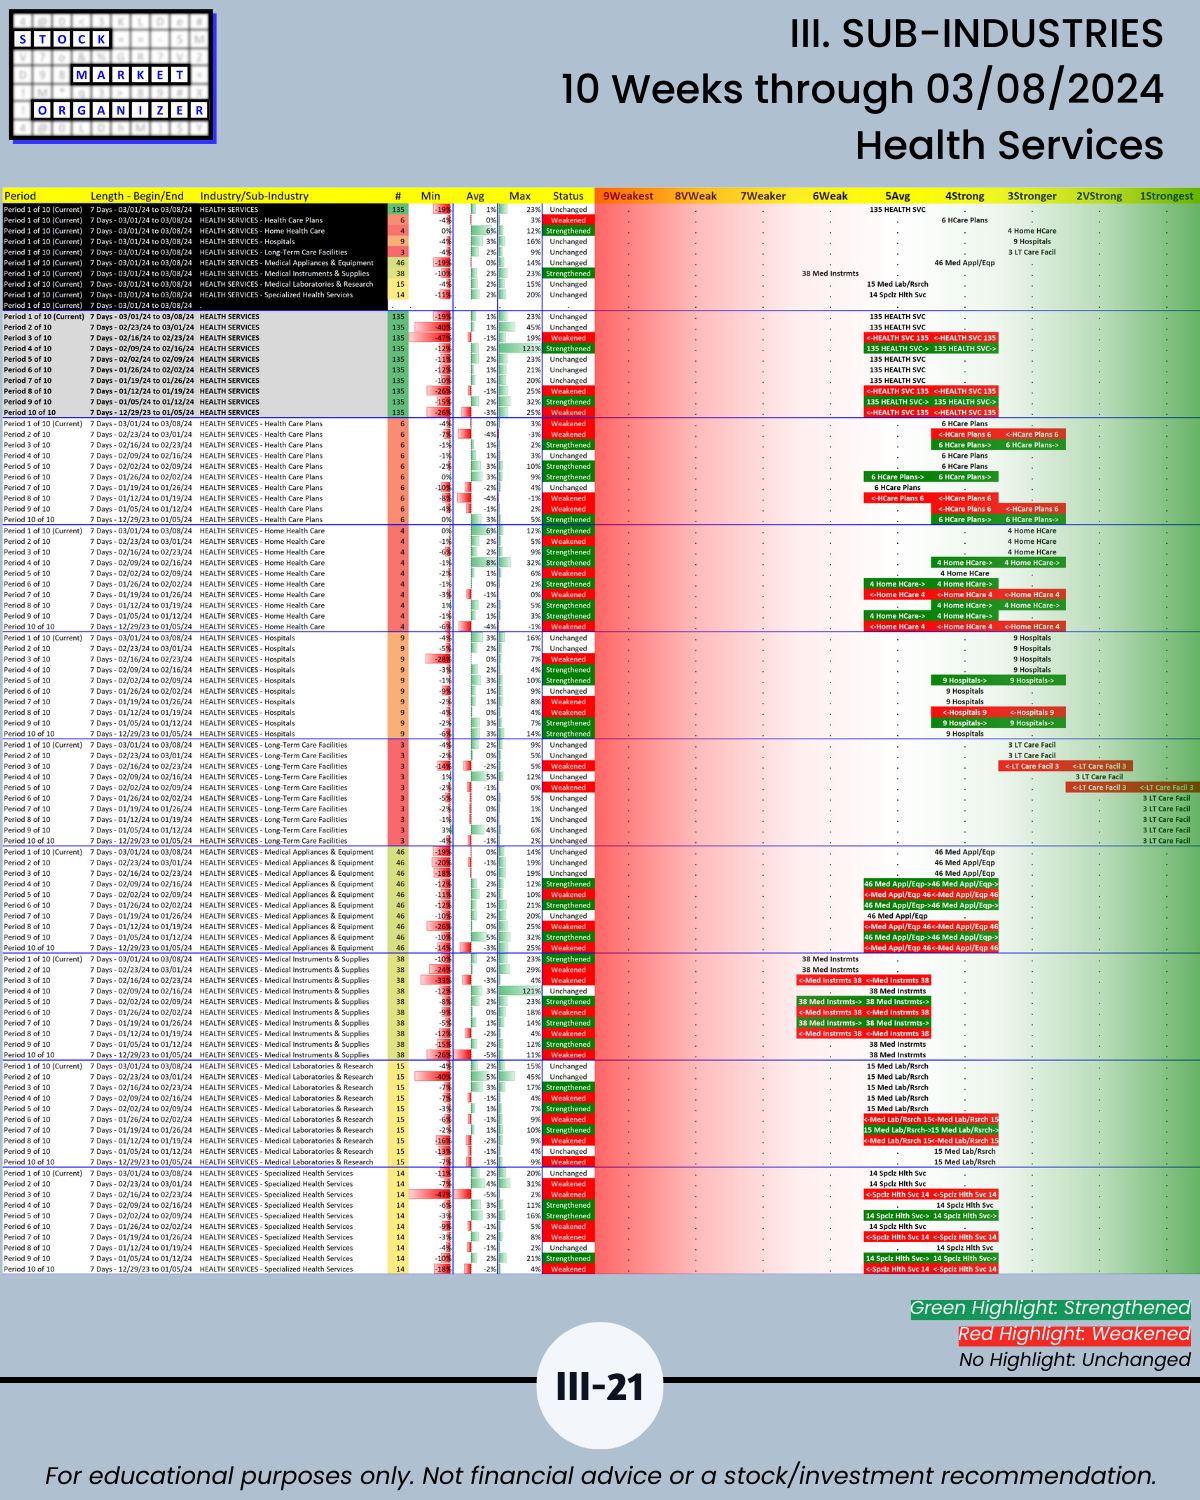
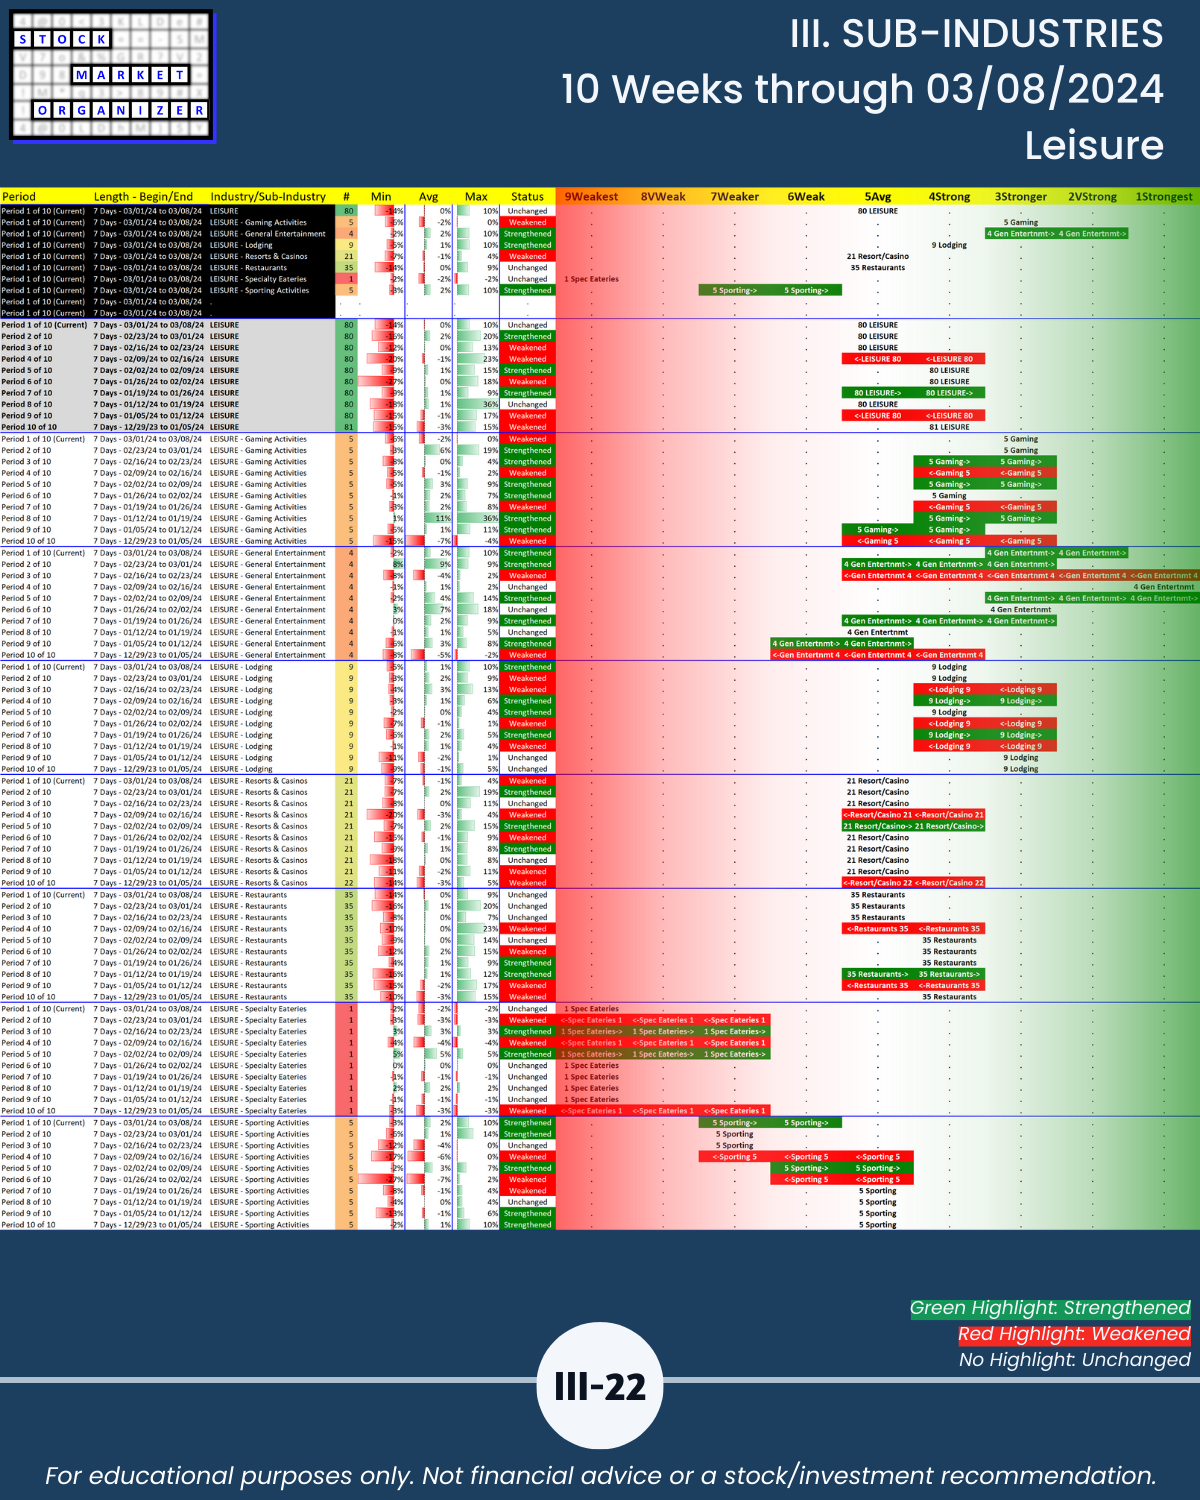
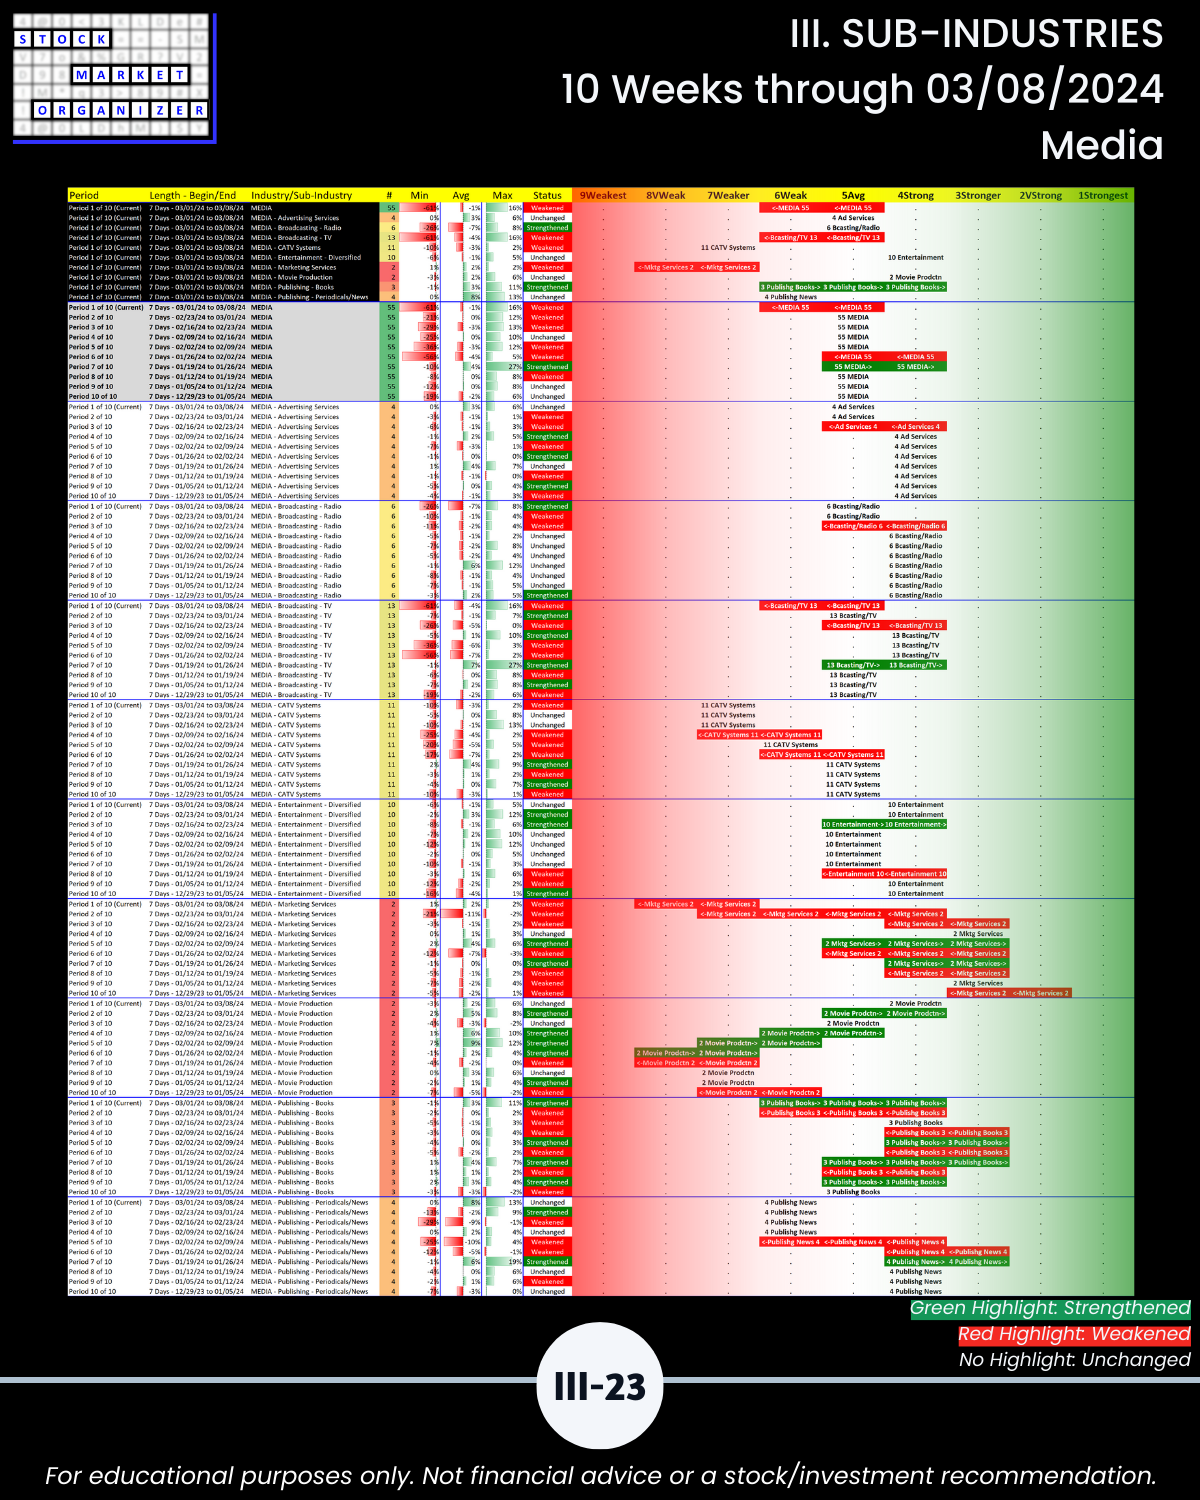
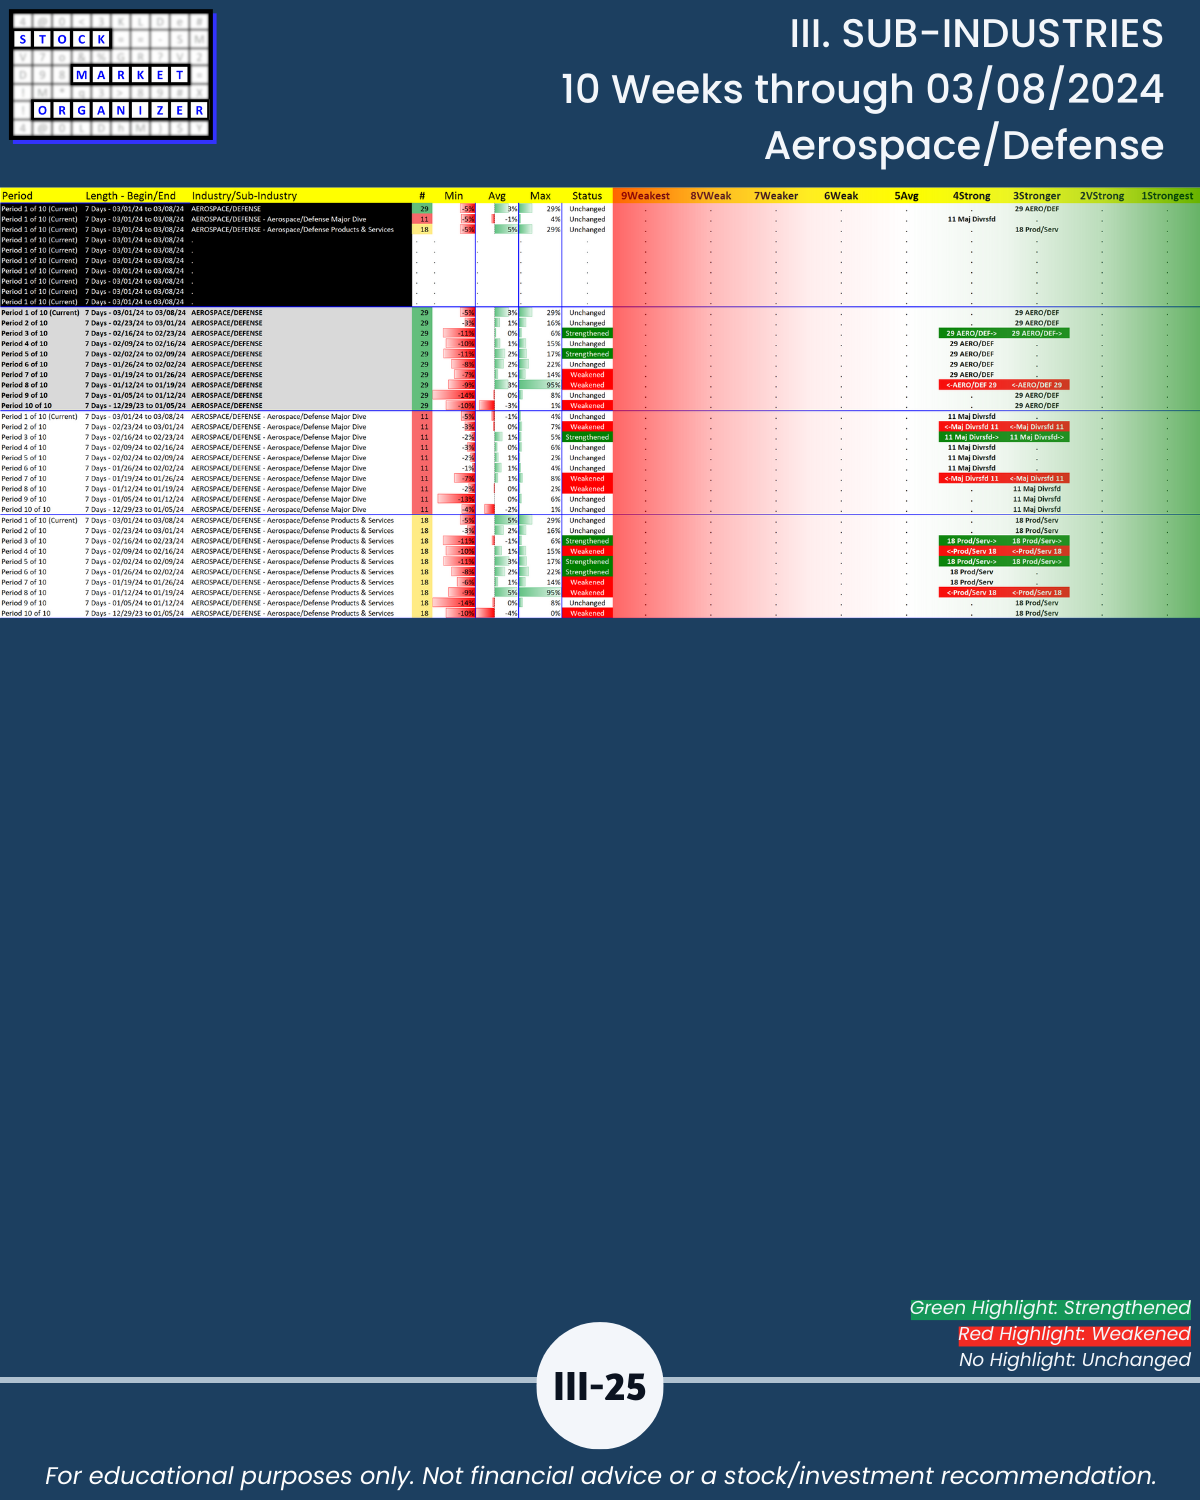
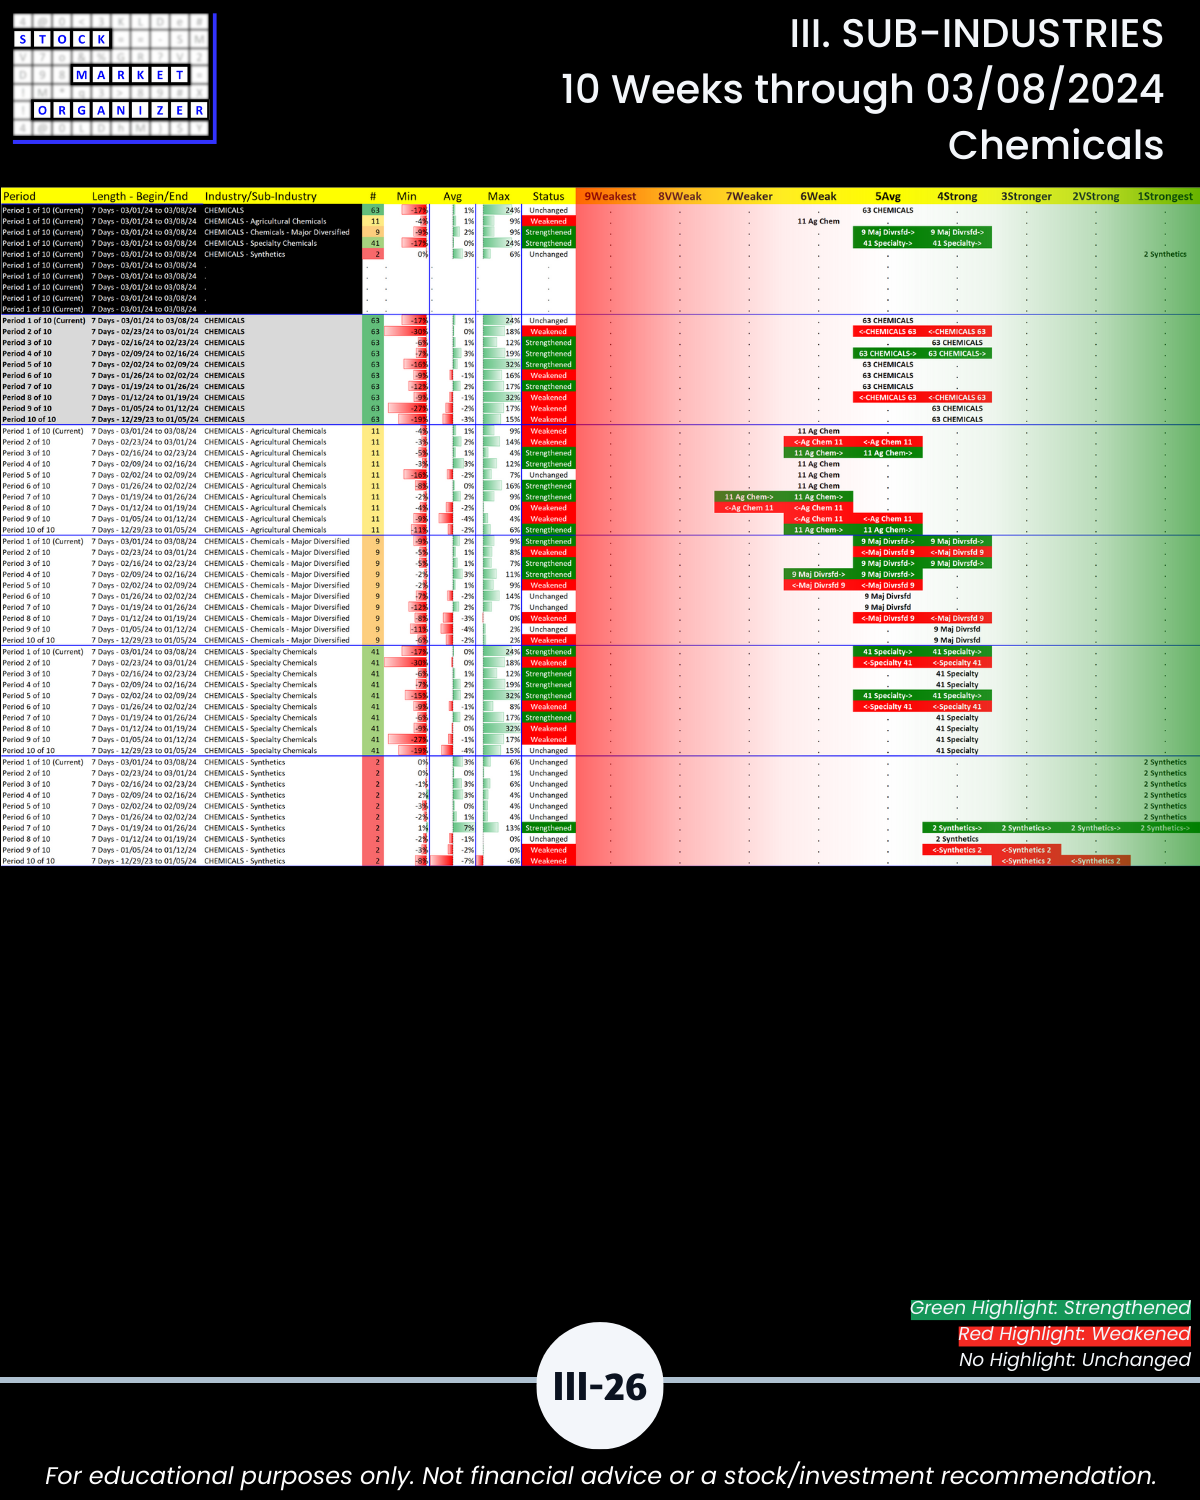
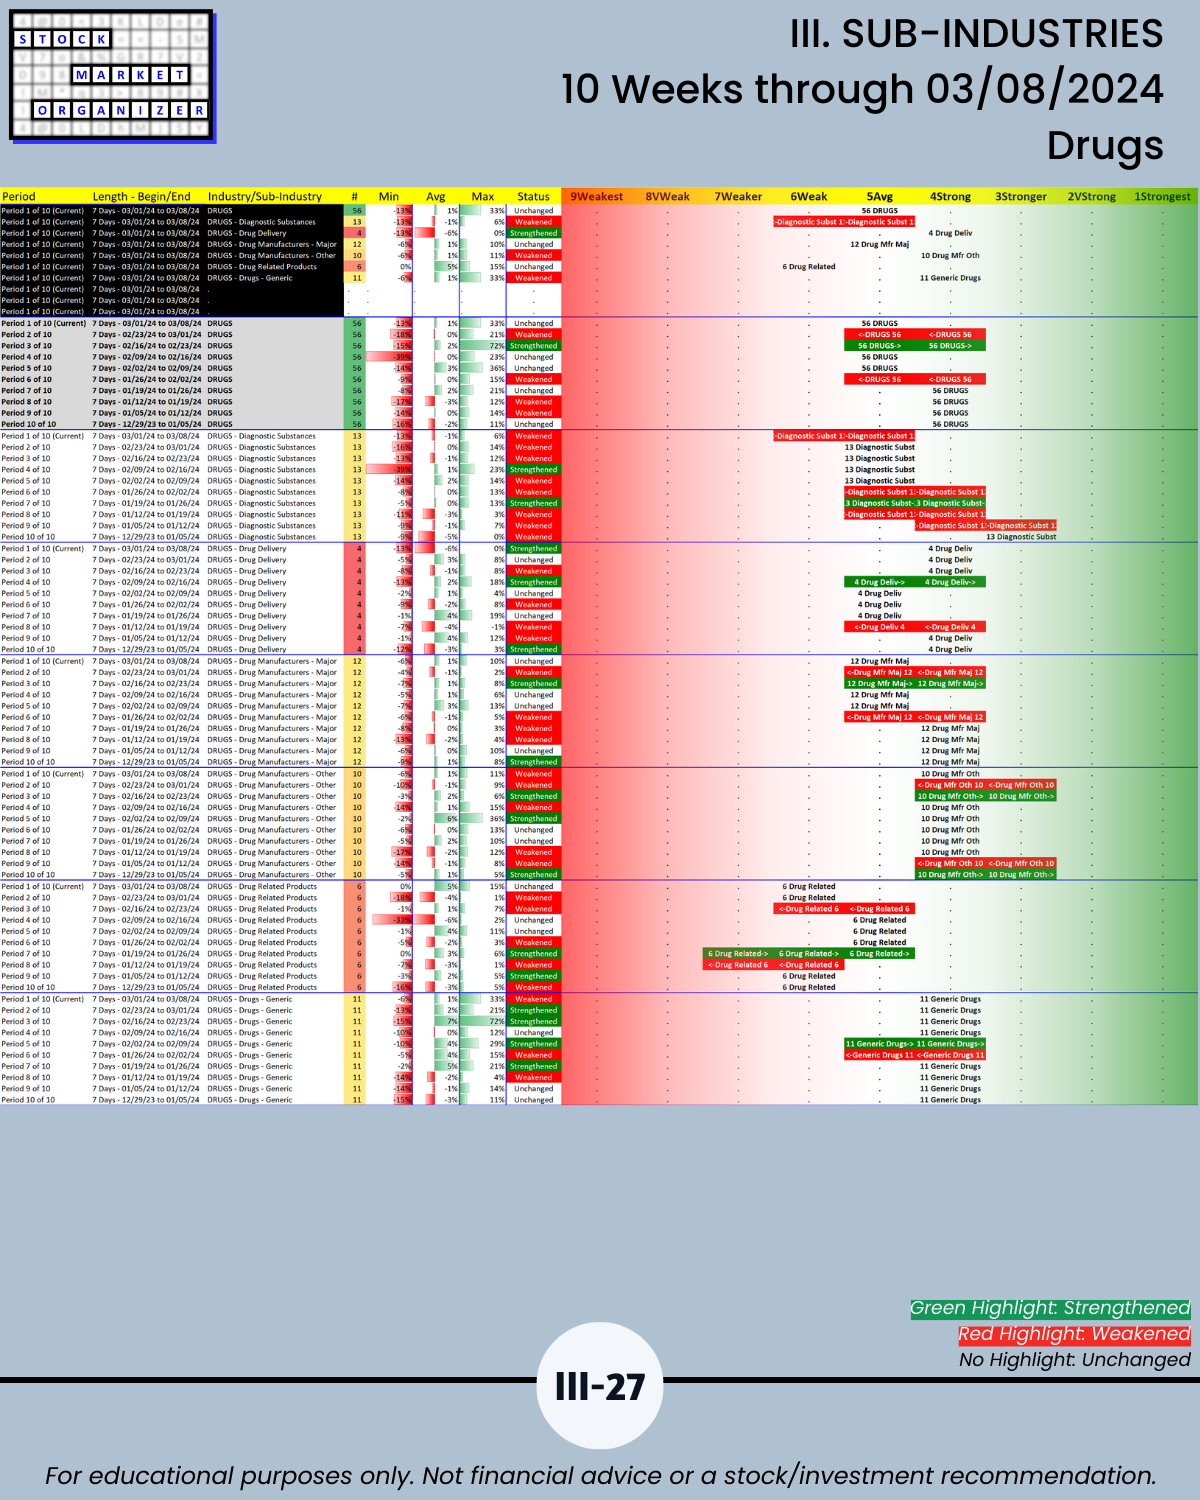
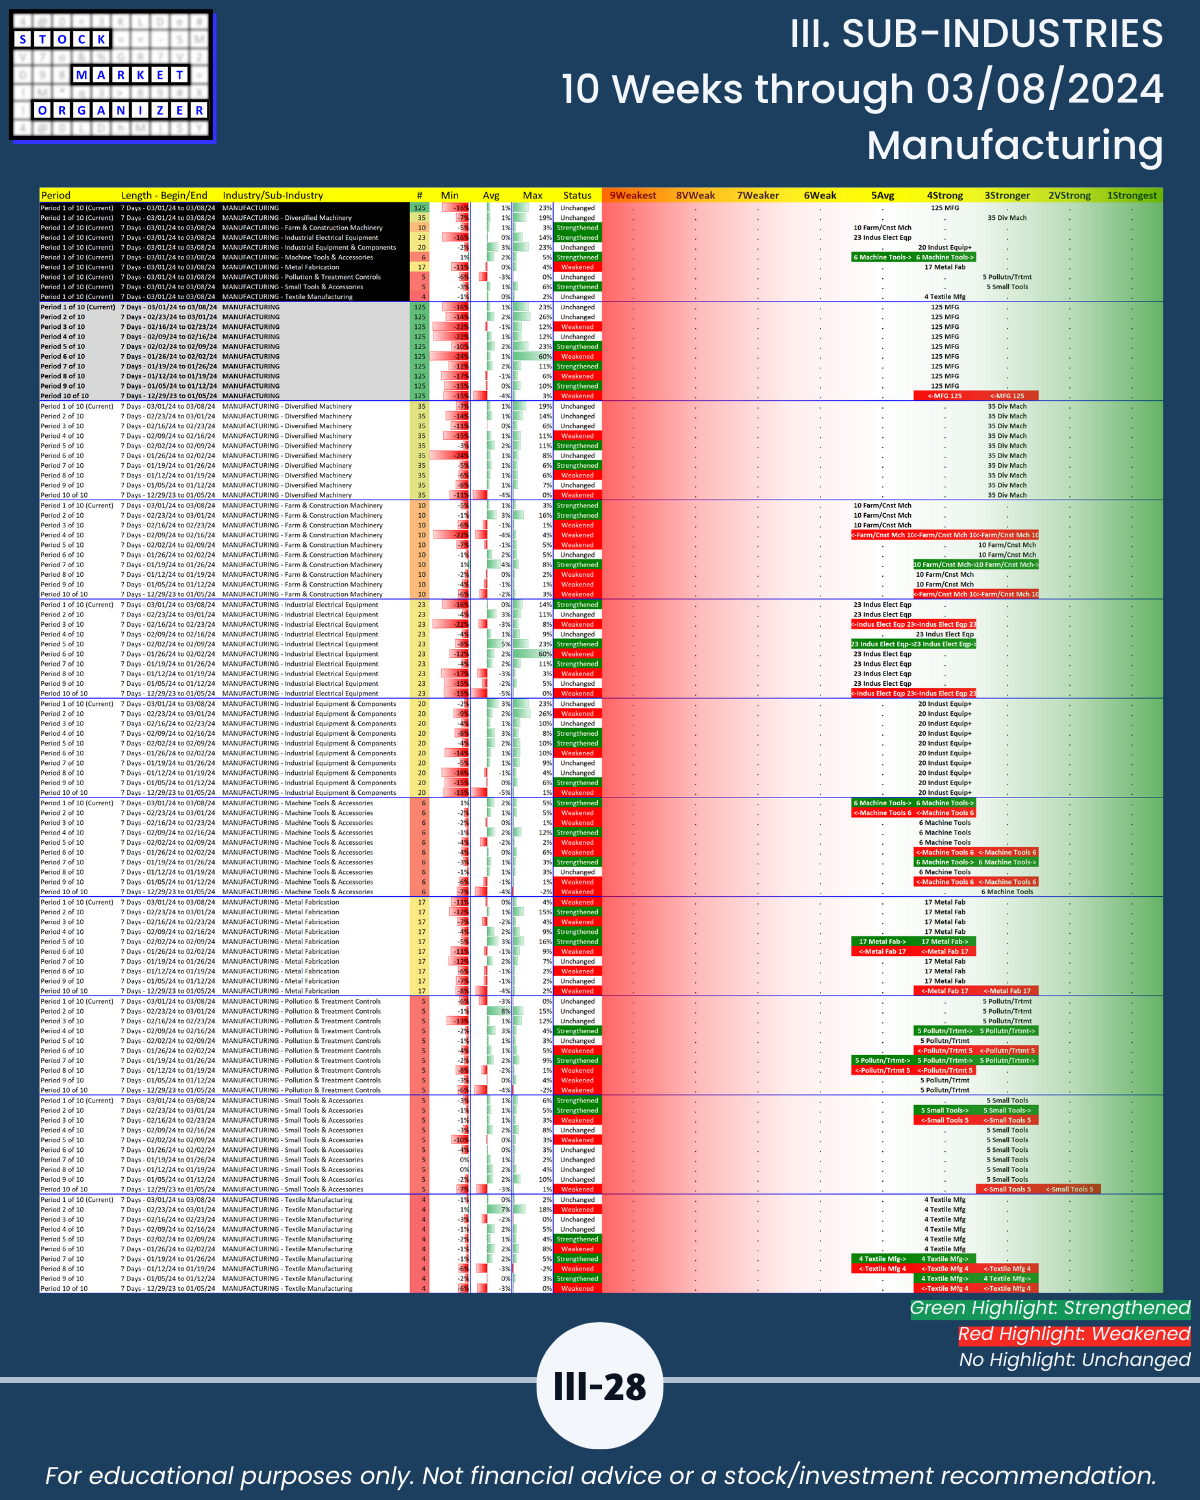
The detail underlying Section II. Meaningfully compare relative and absolute strength amongst/between all the 198 sub-industries, and clearly see how this comparative strength is changing. Know where to look, why, and when, depending on if you are looking for strengthening or weakening.
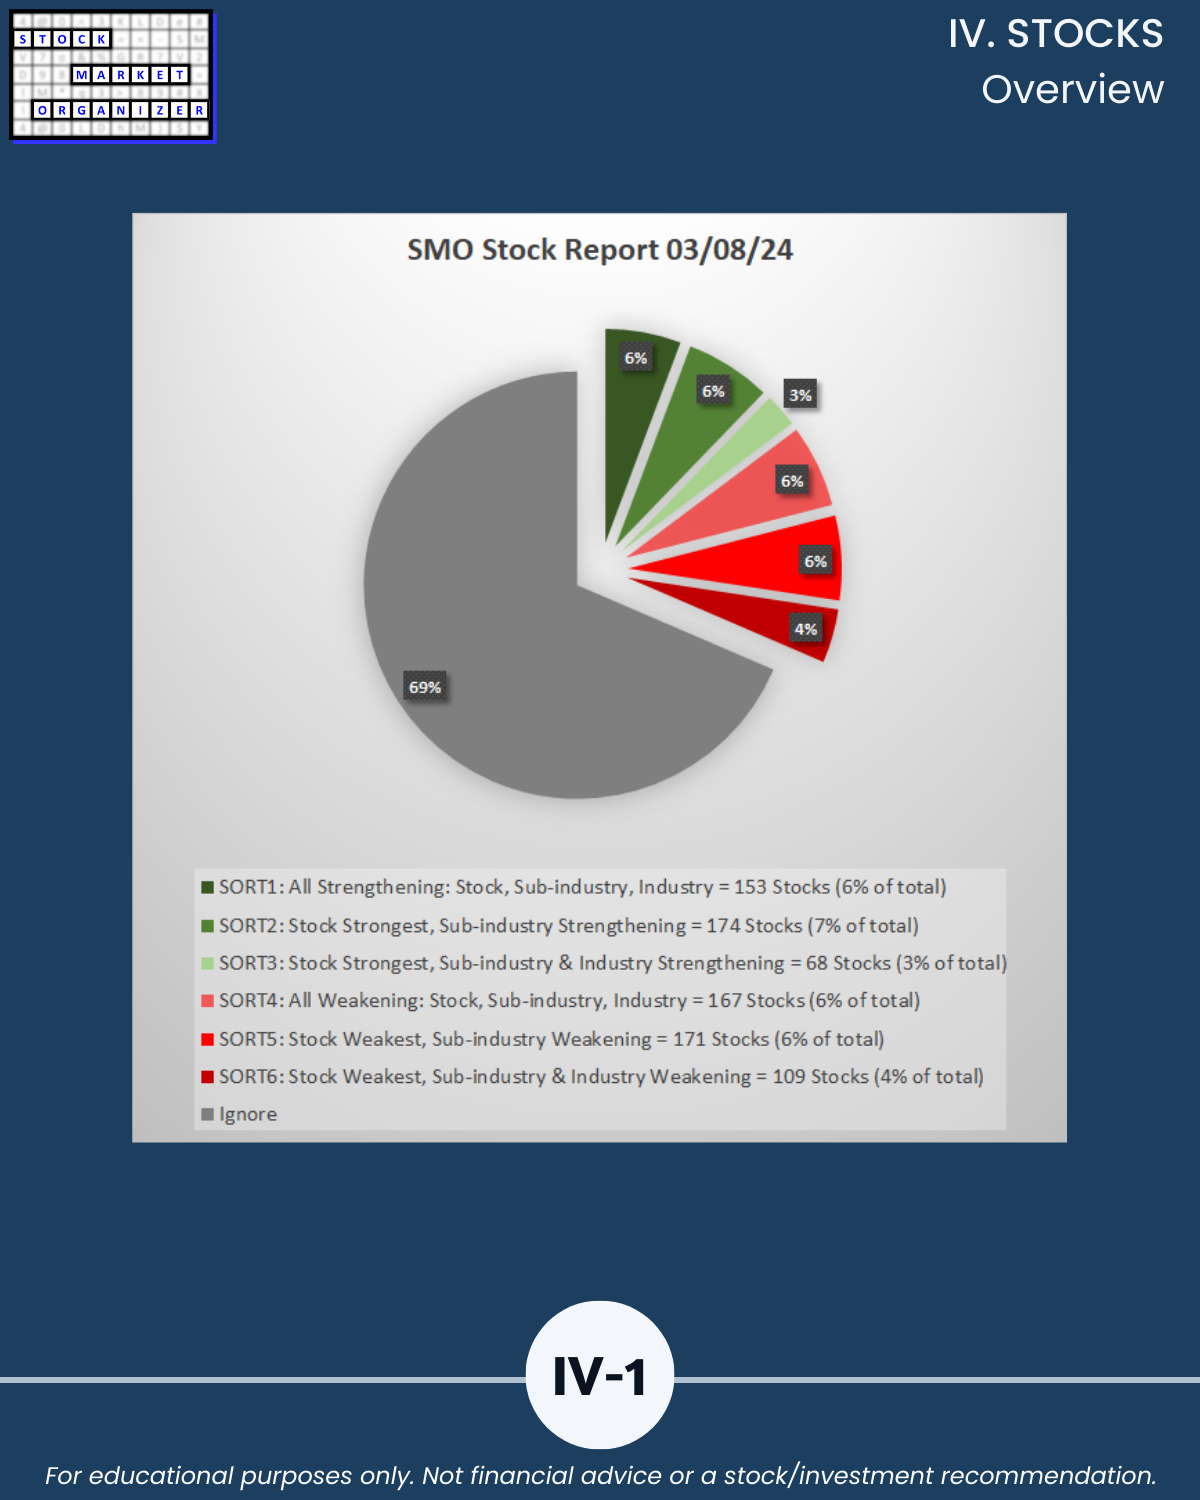
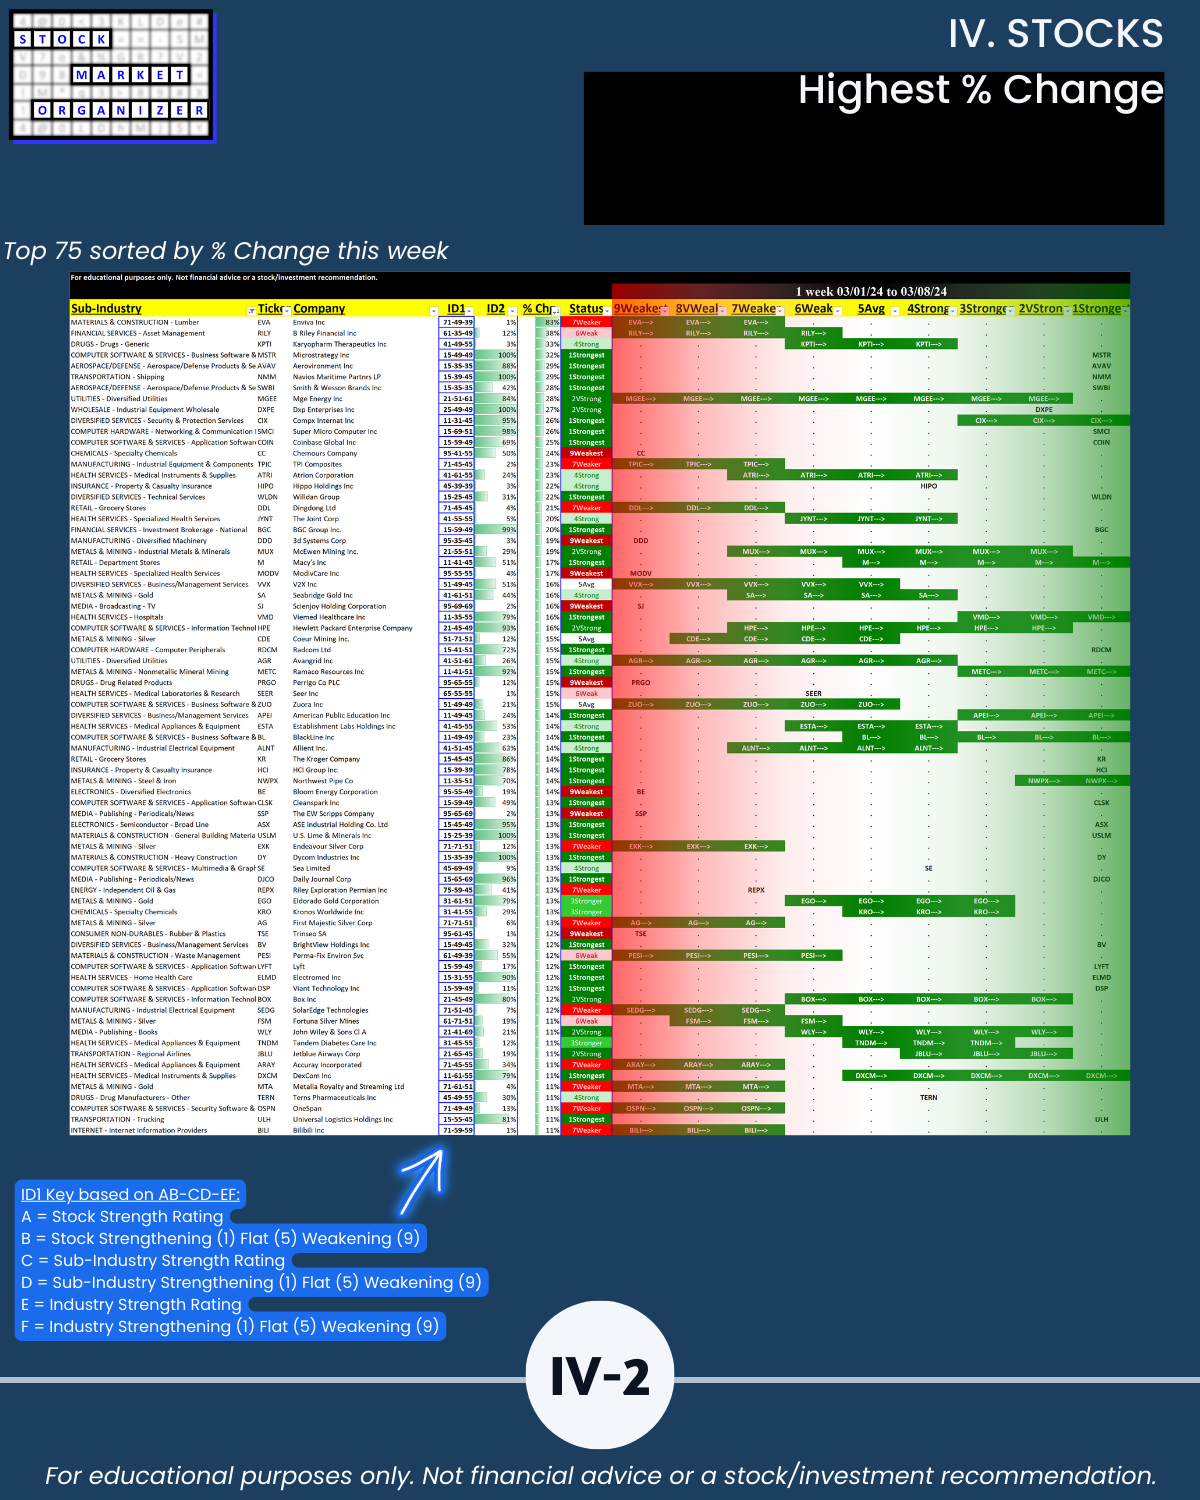
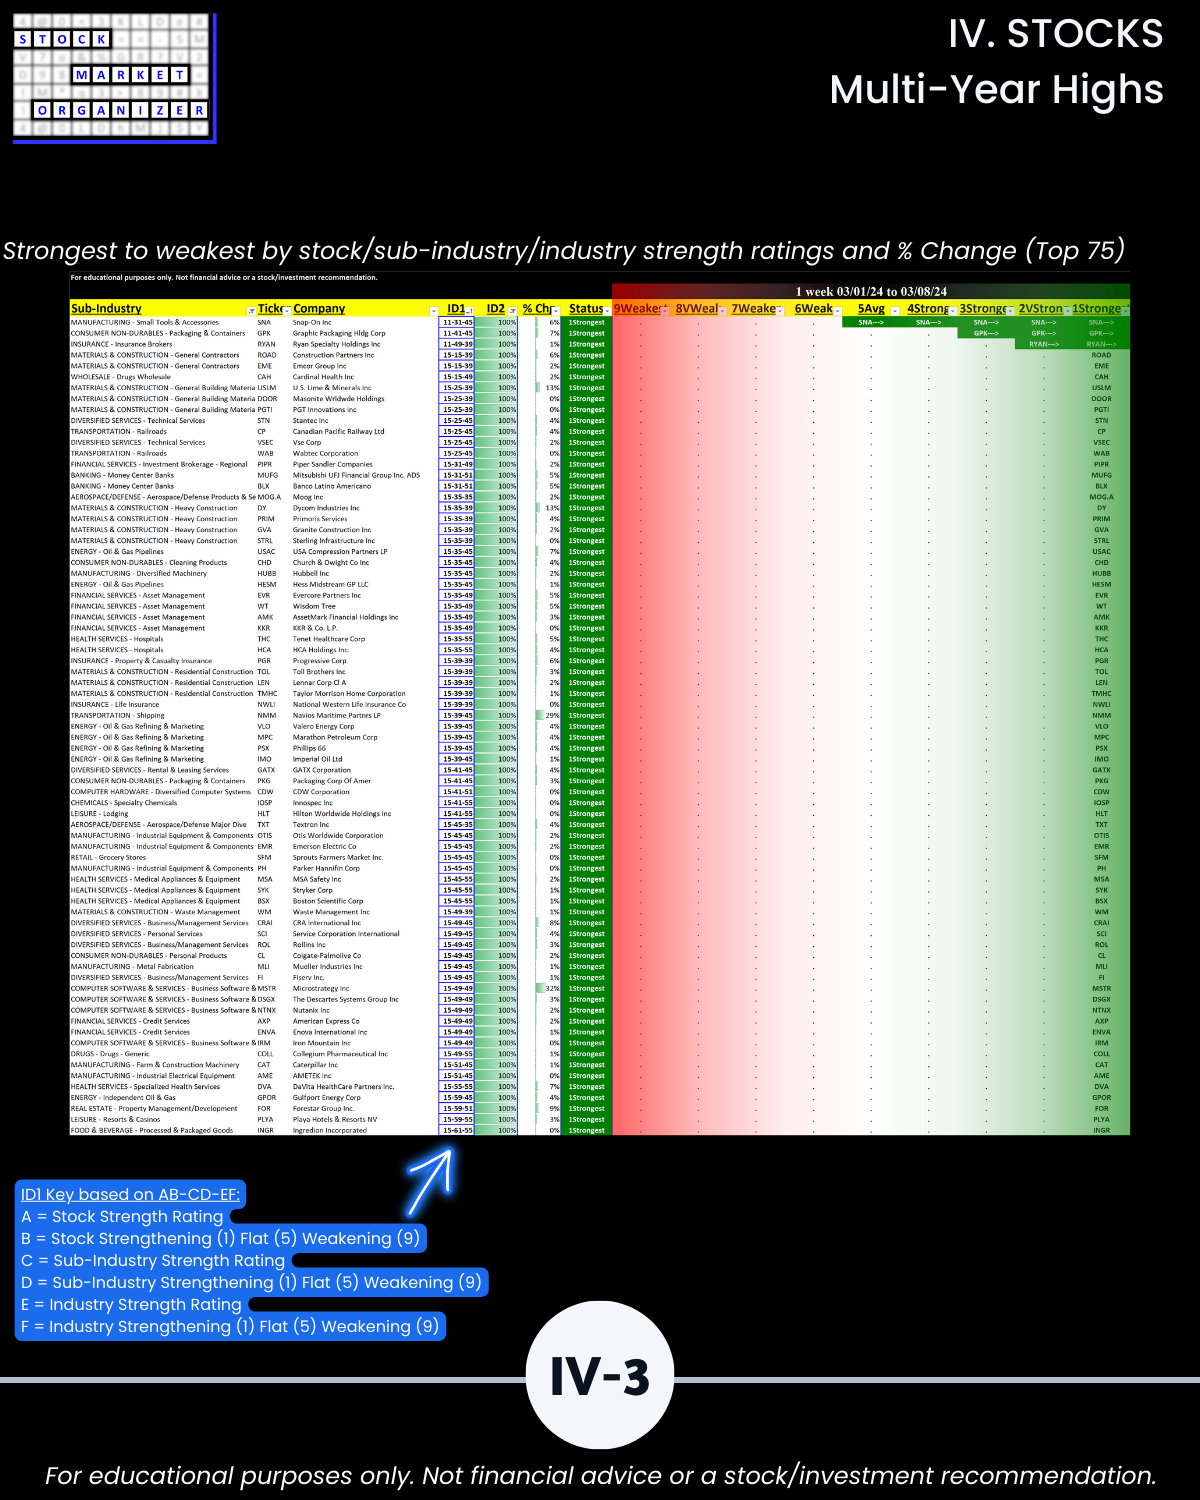
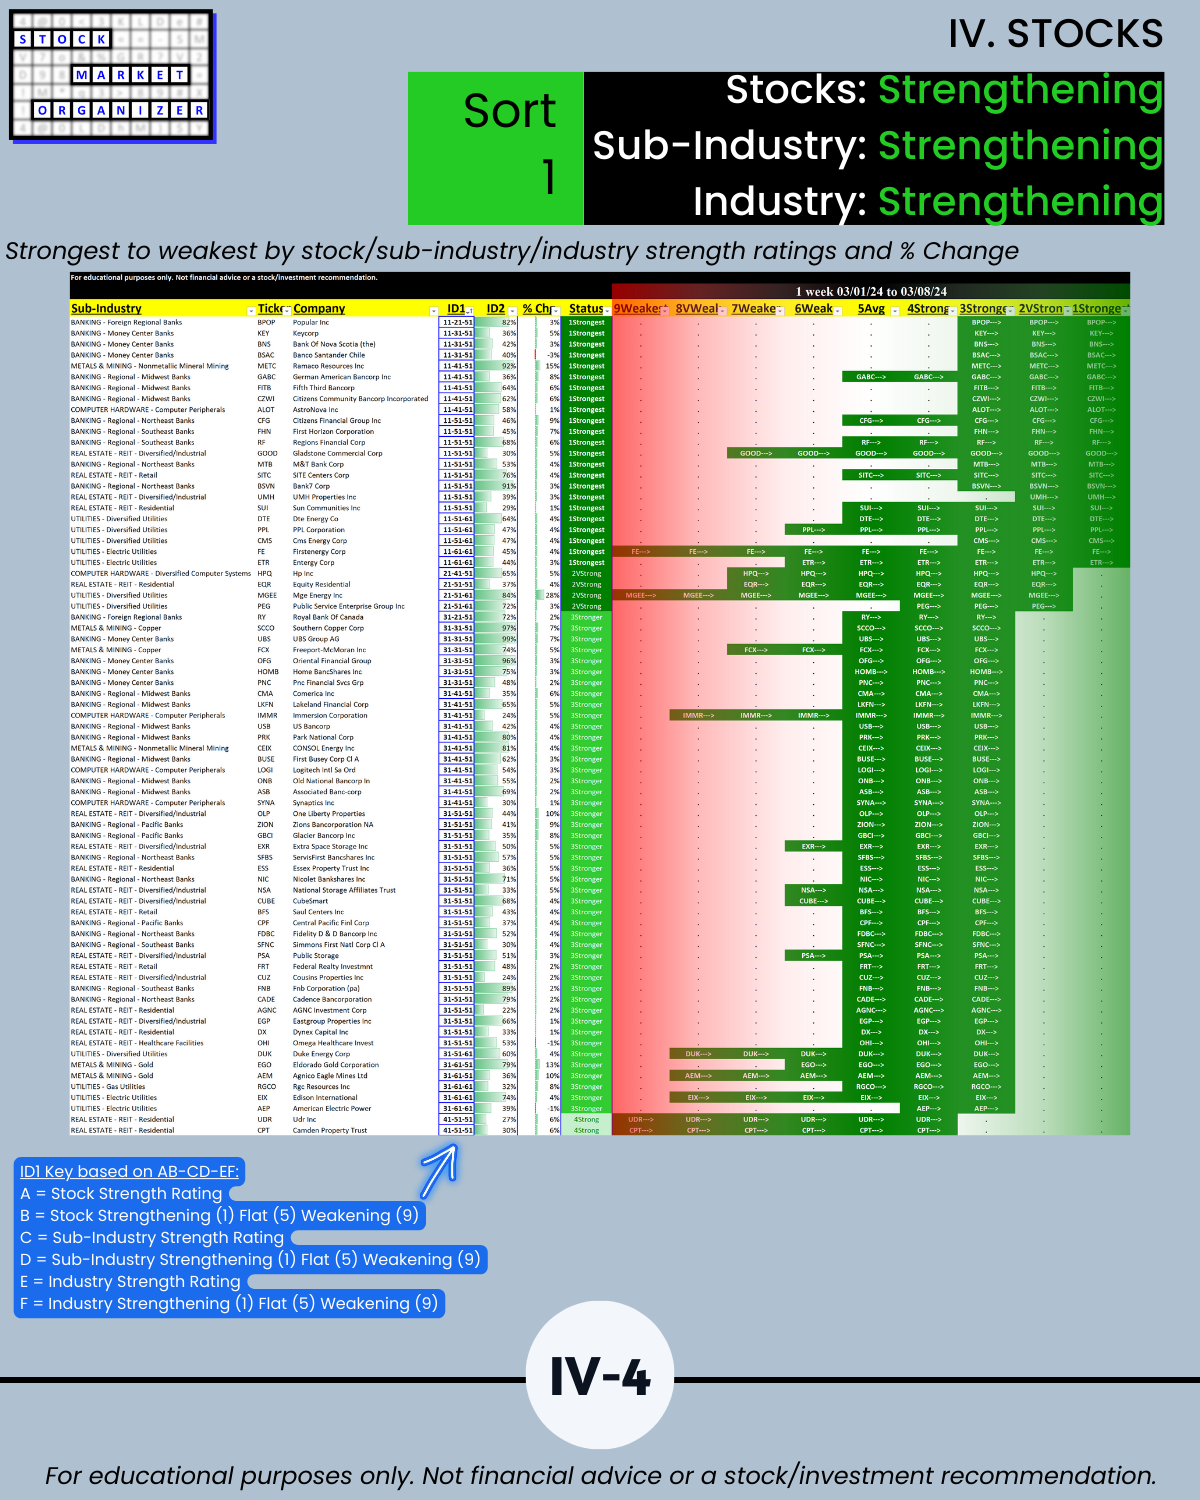
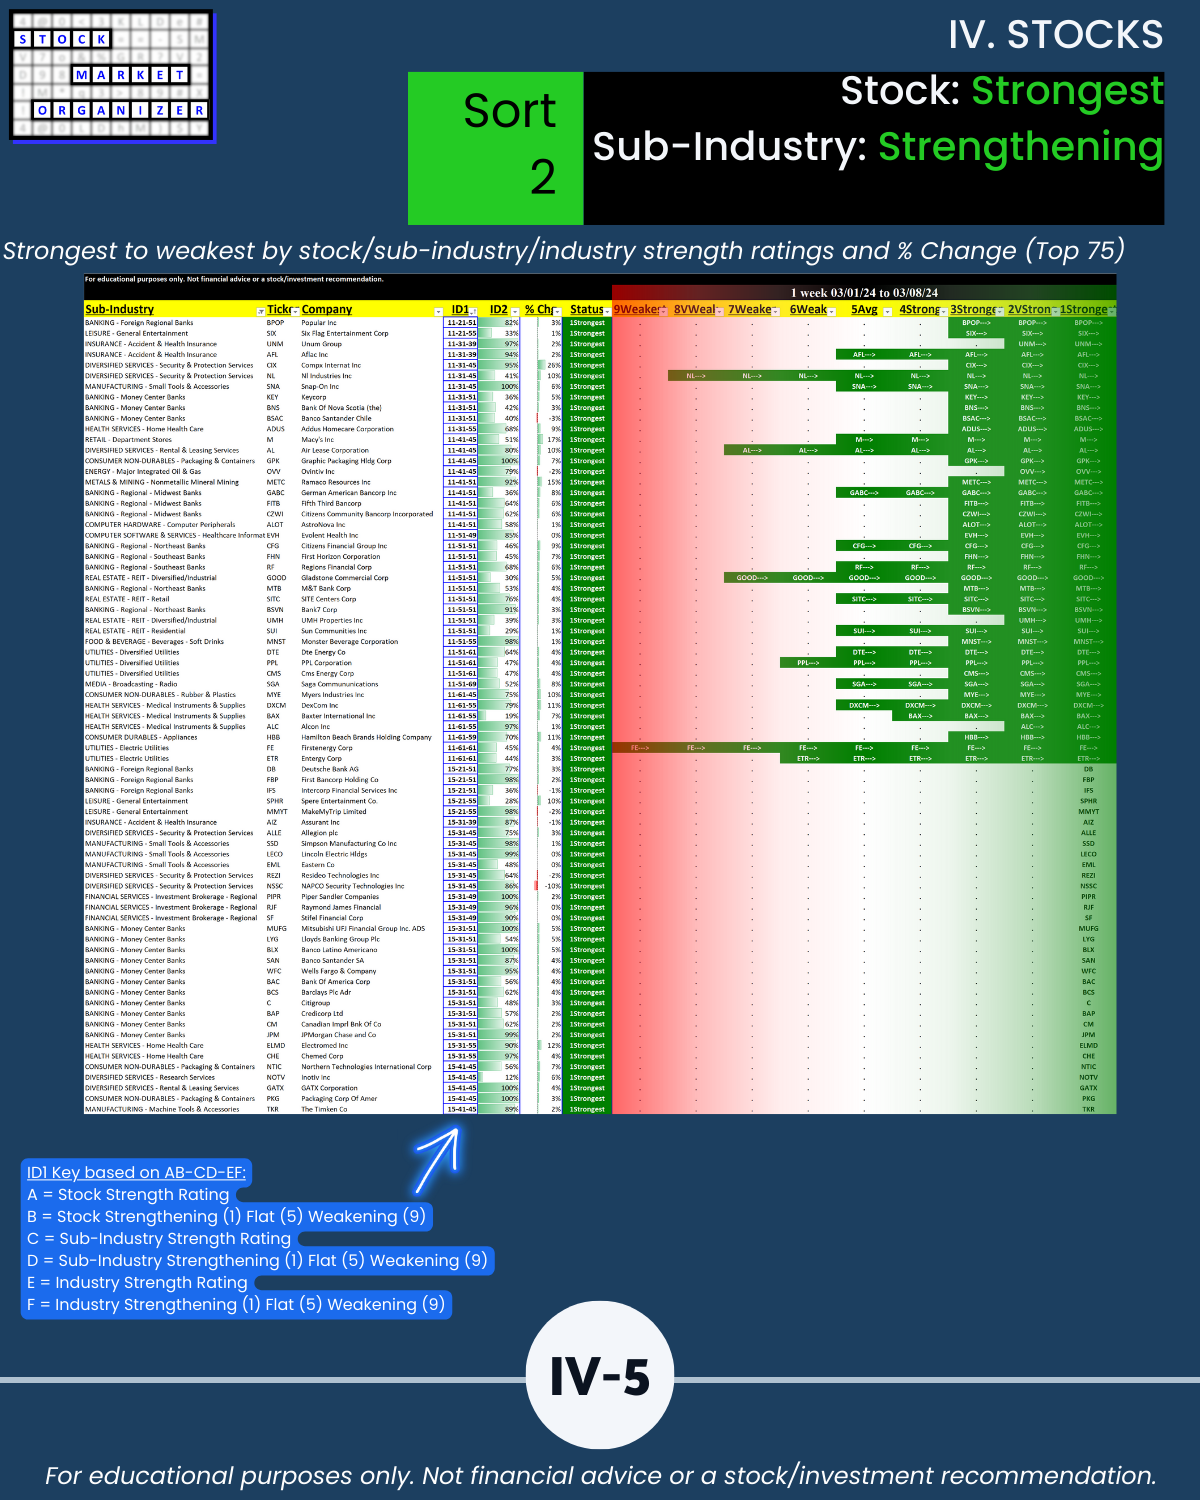
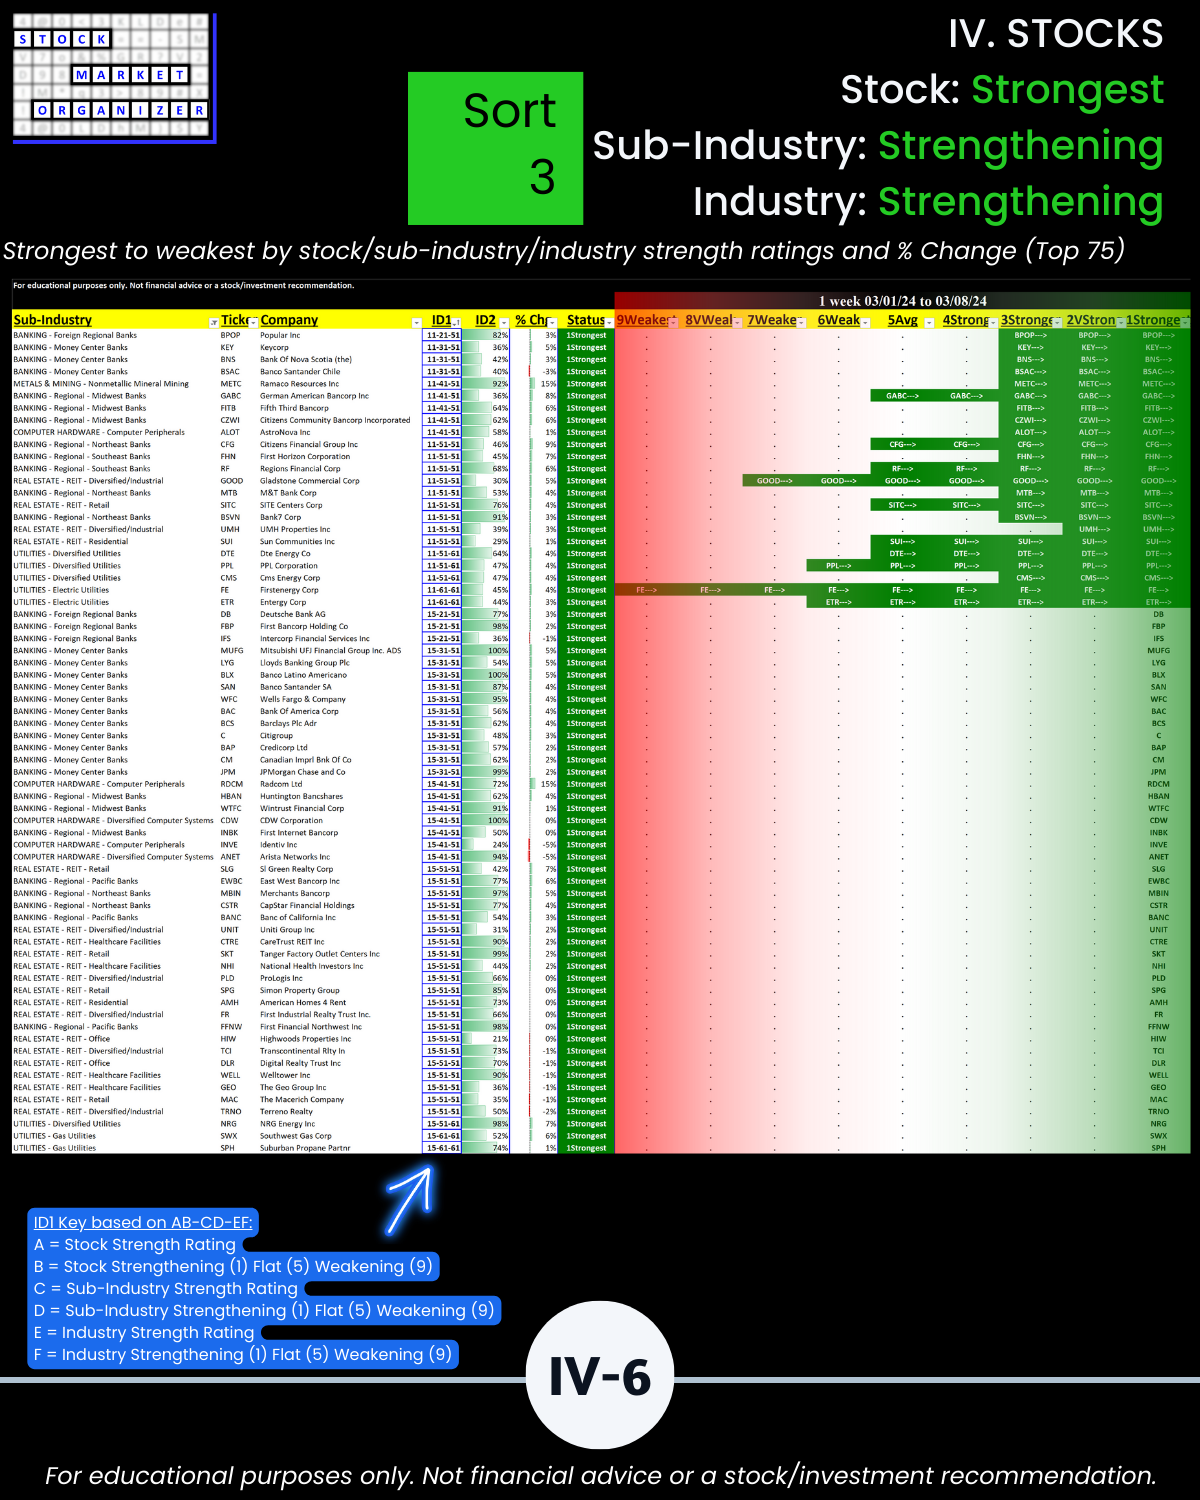
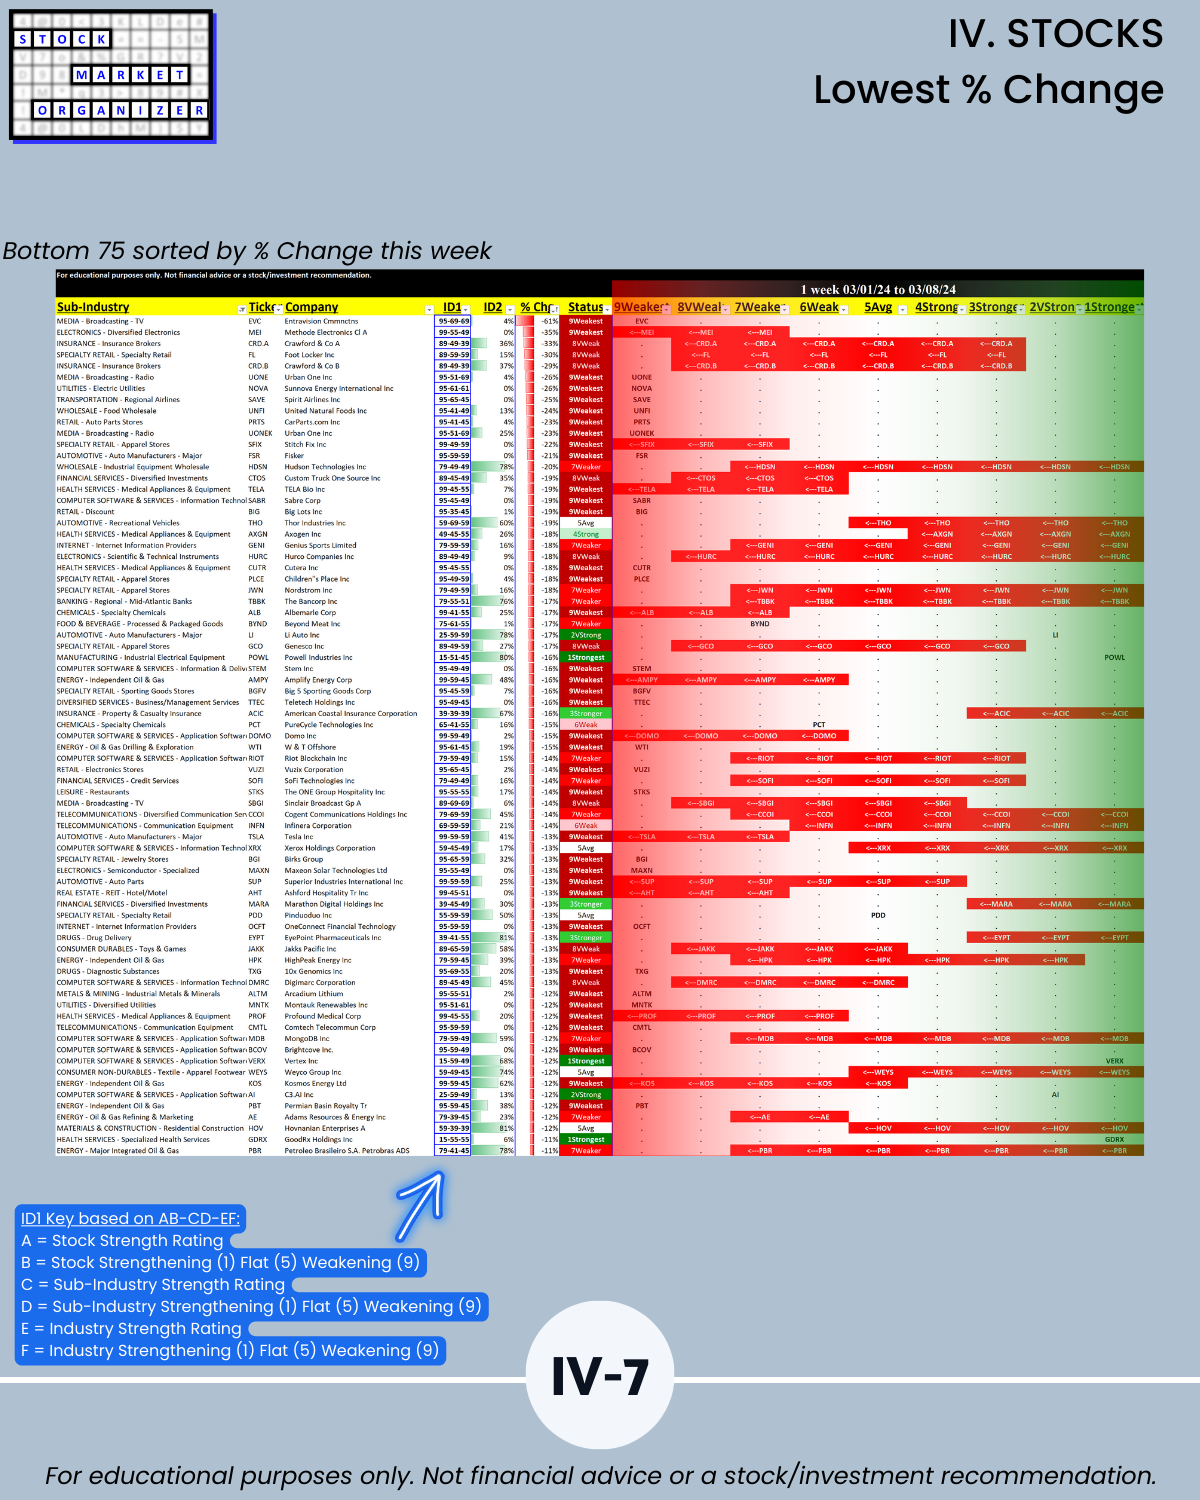
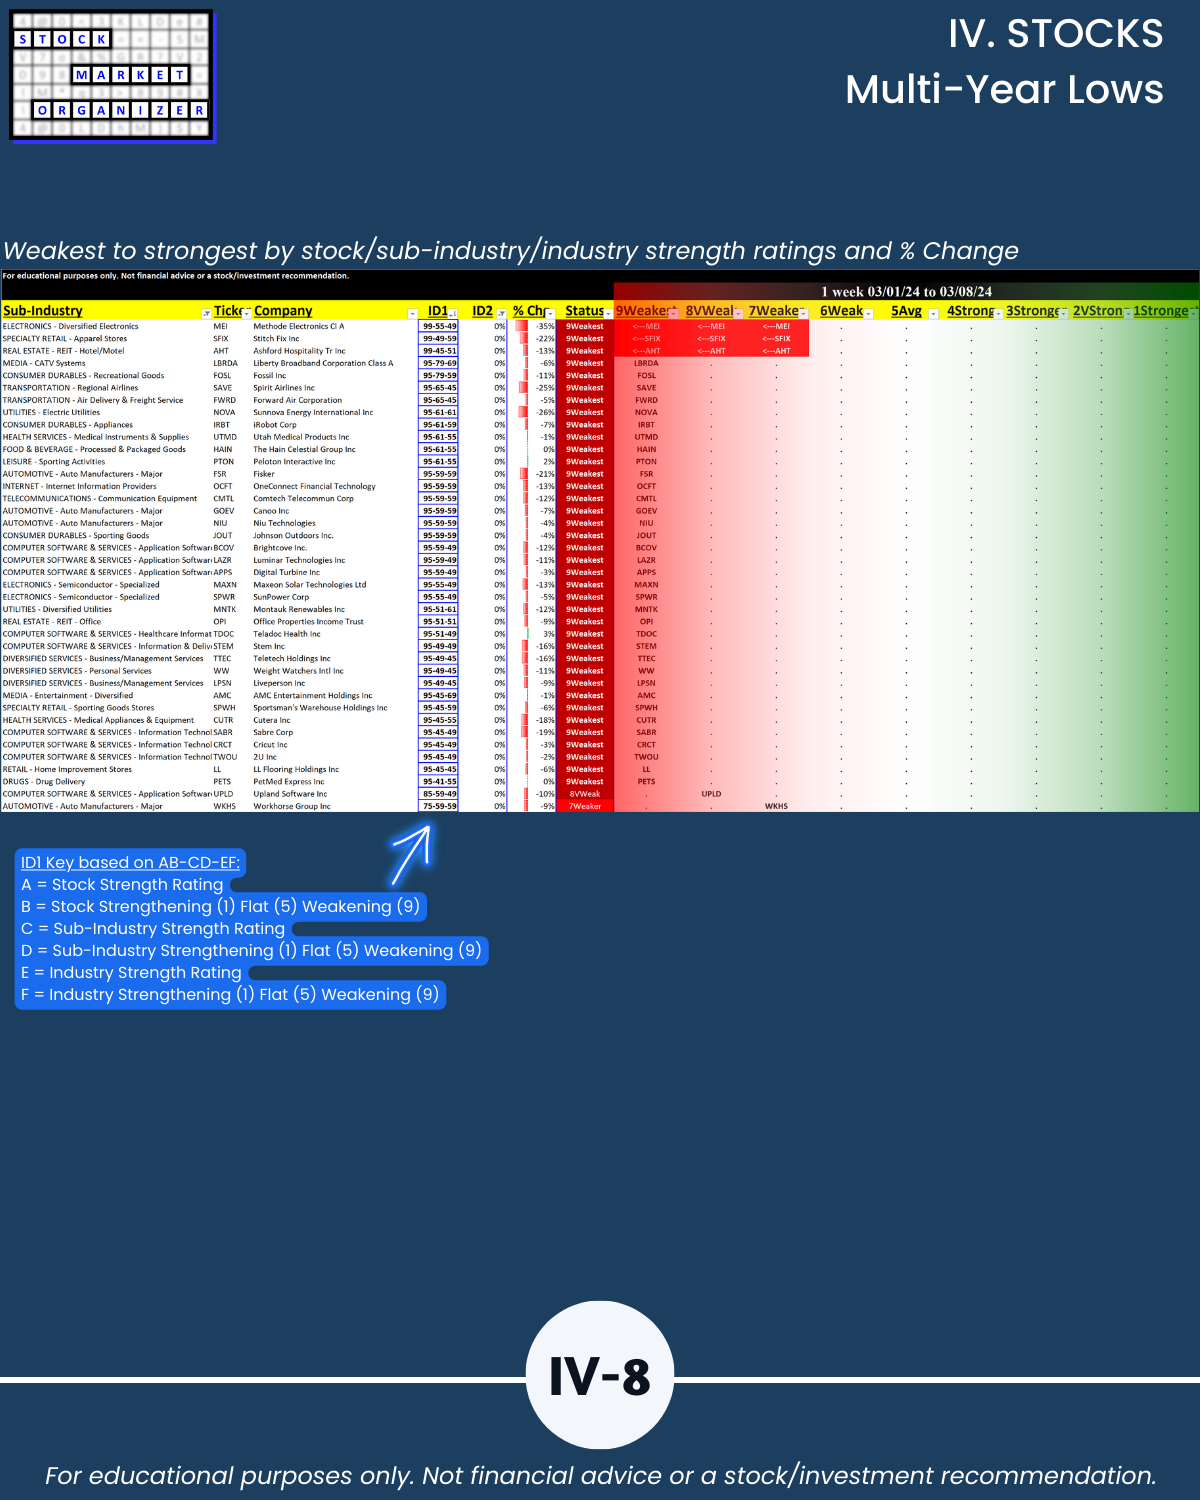
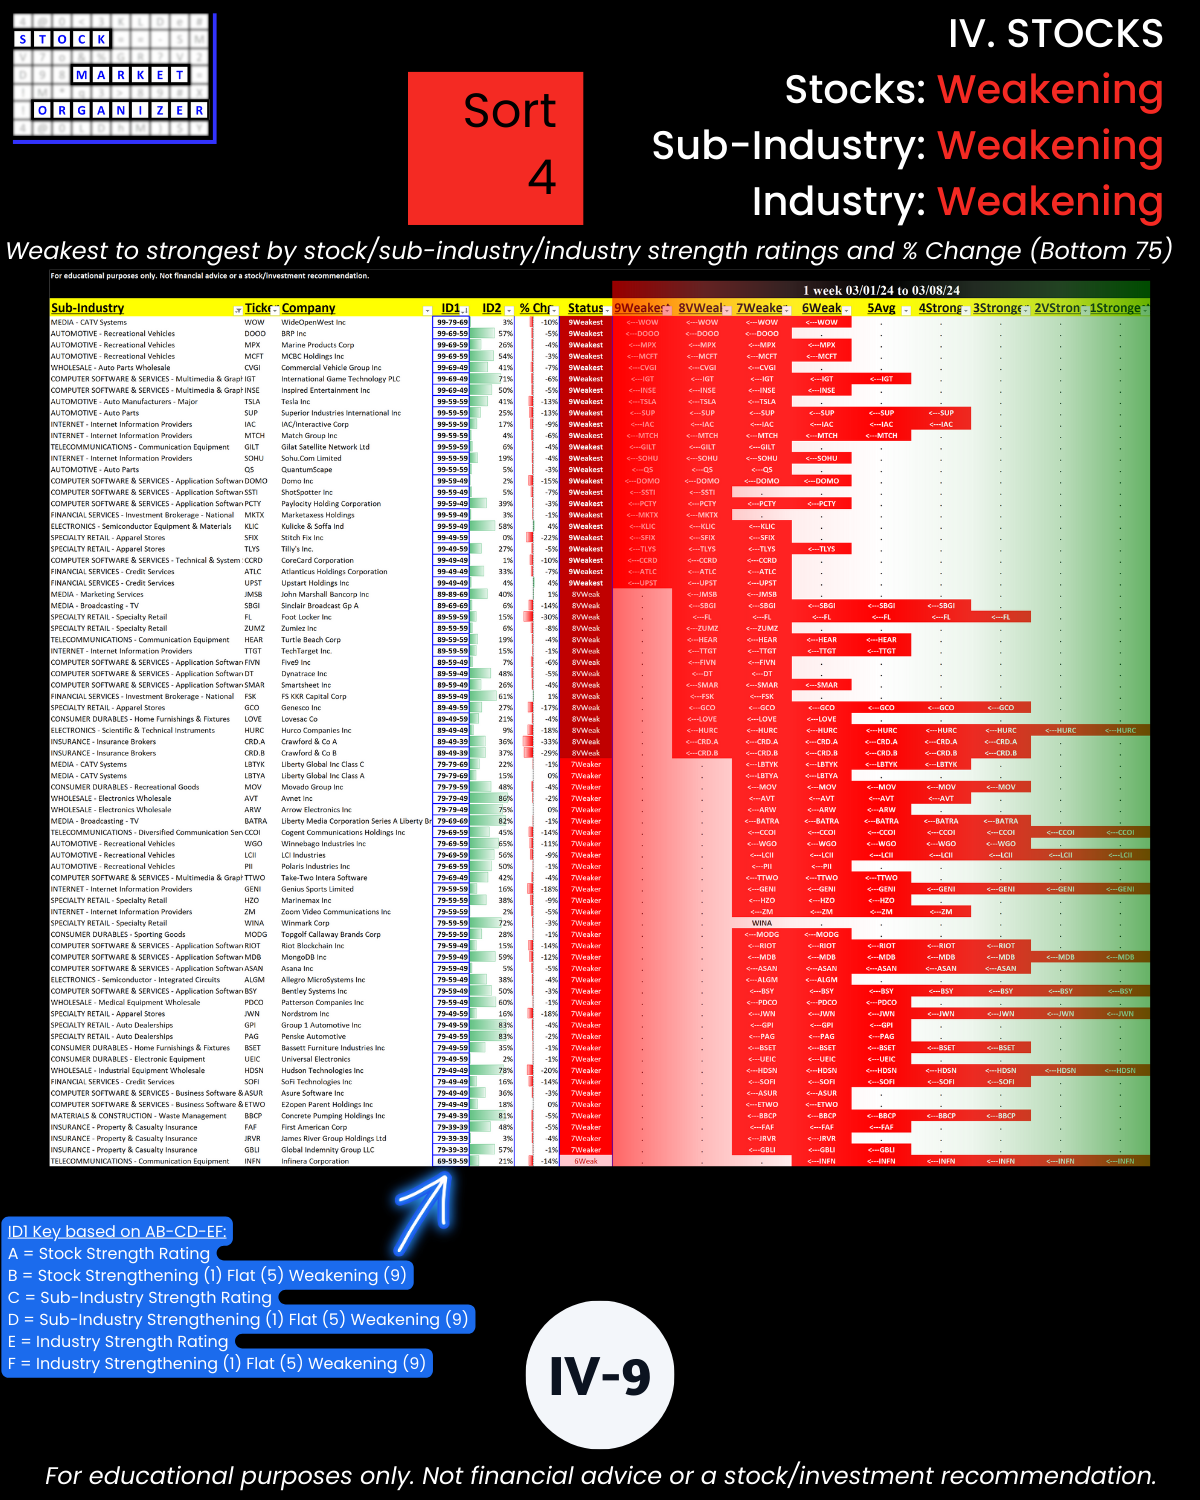
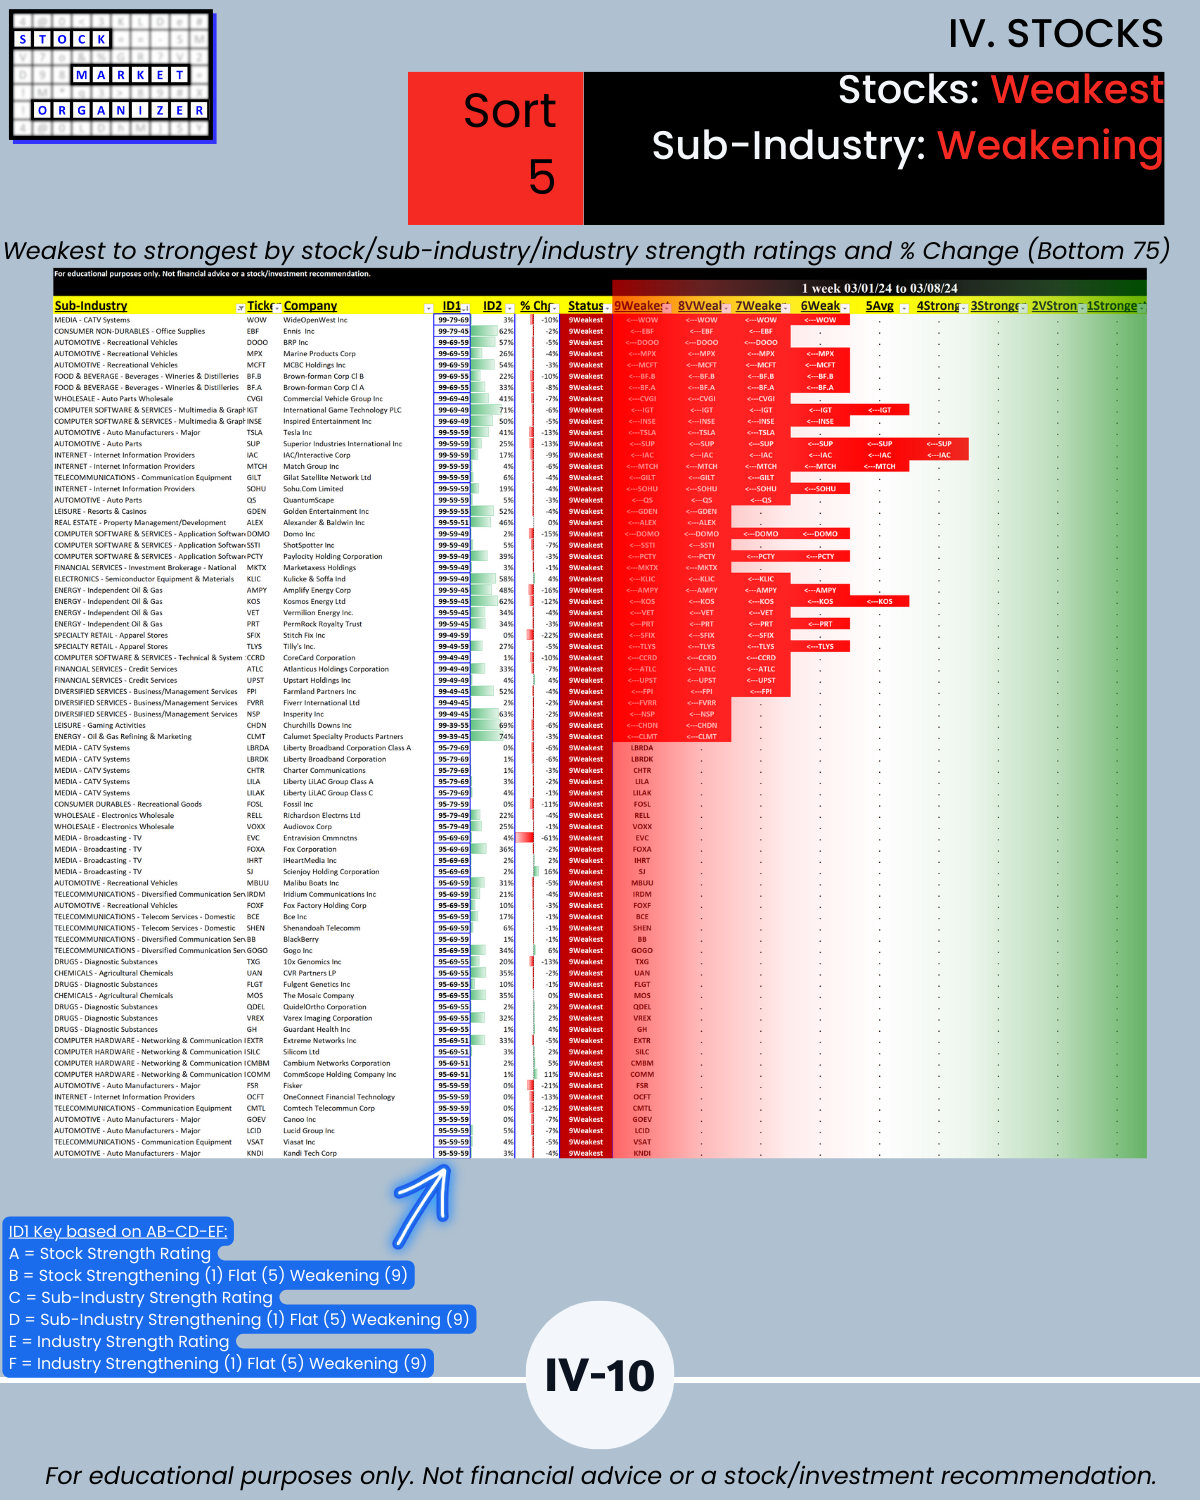
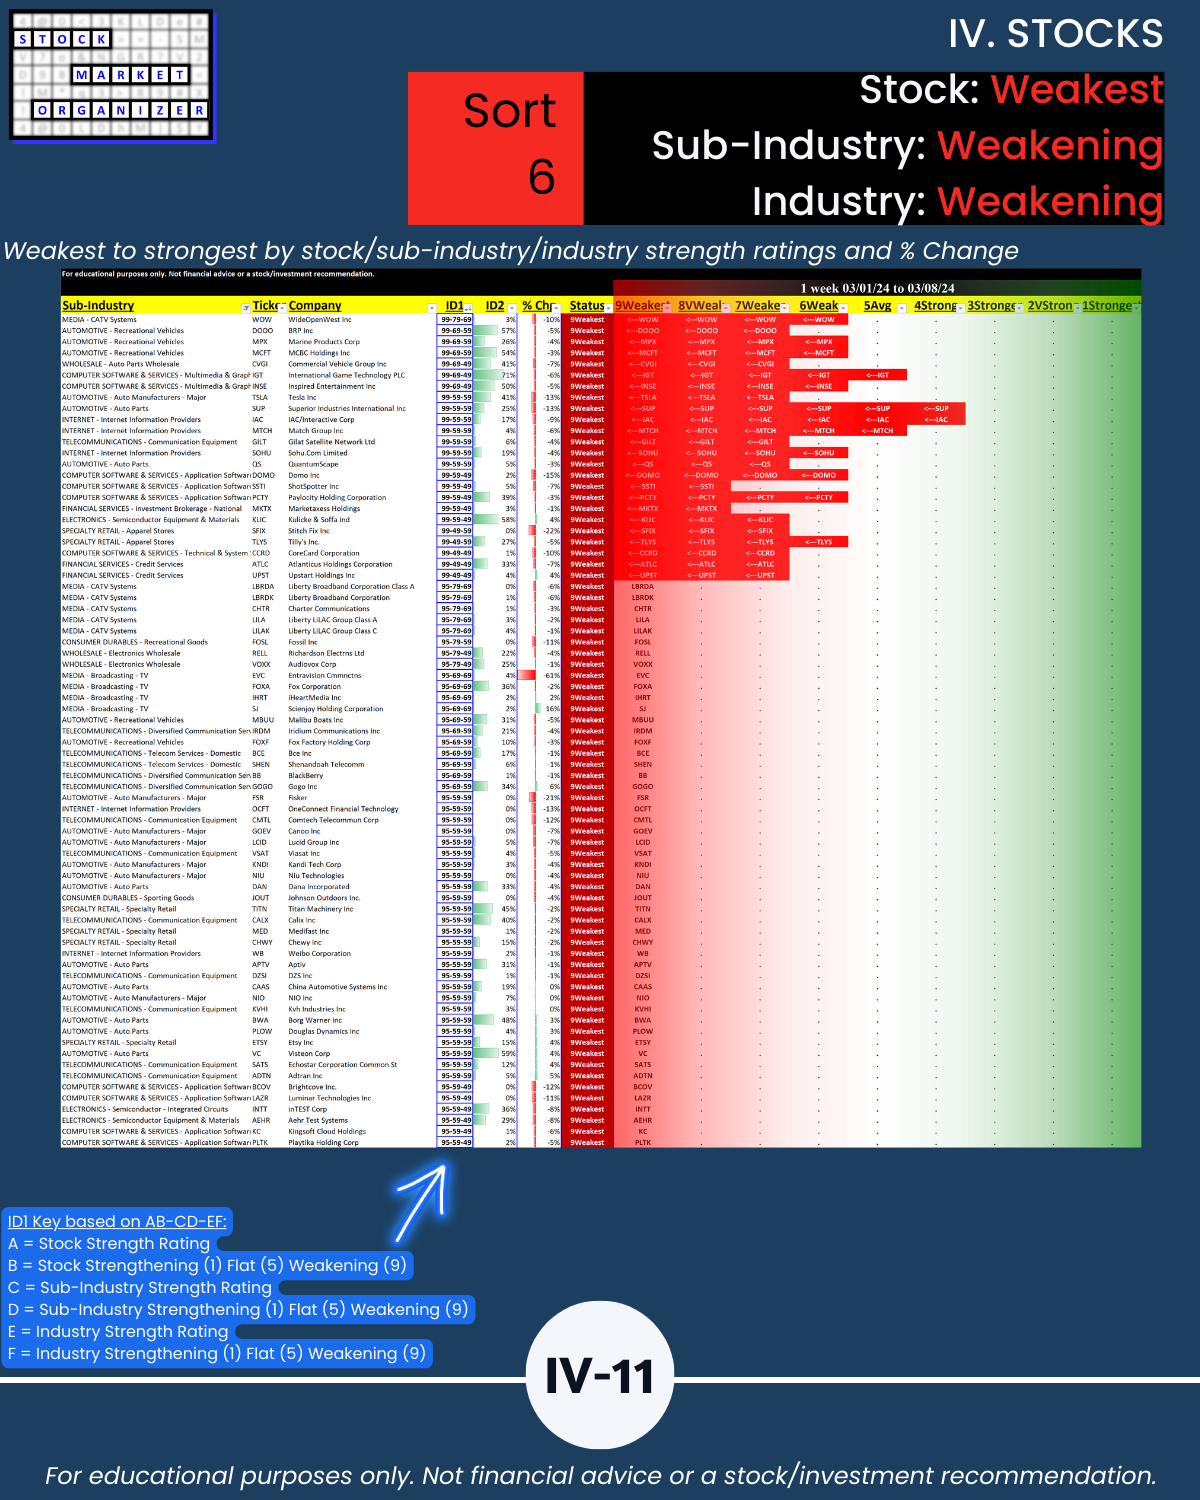
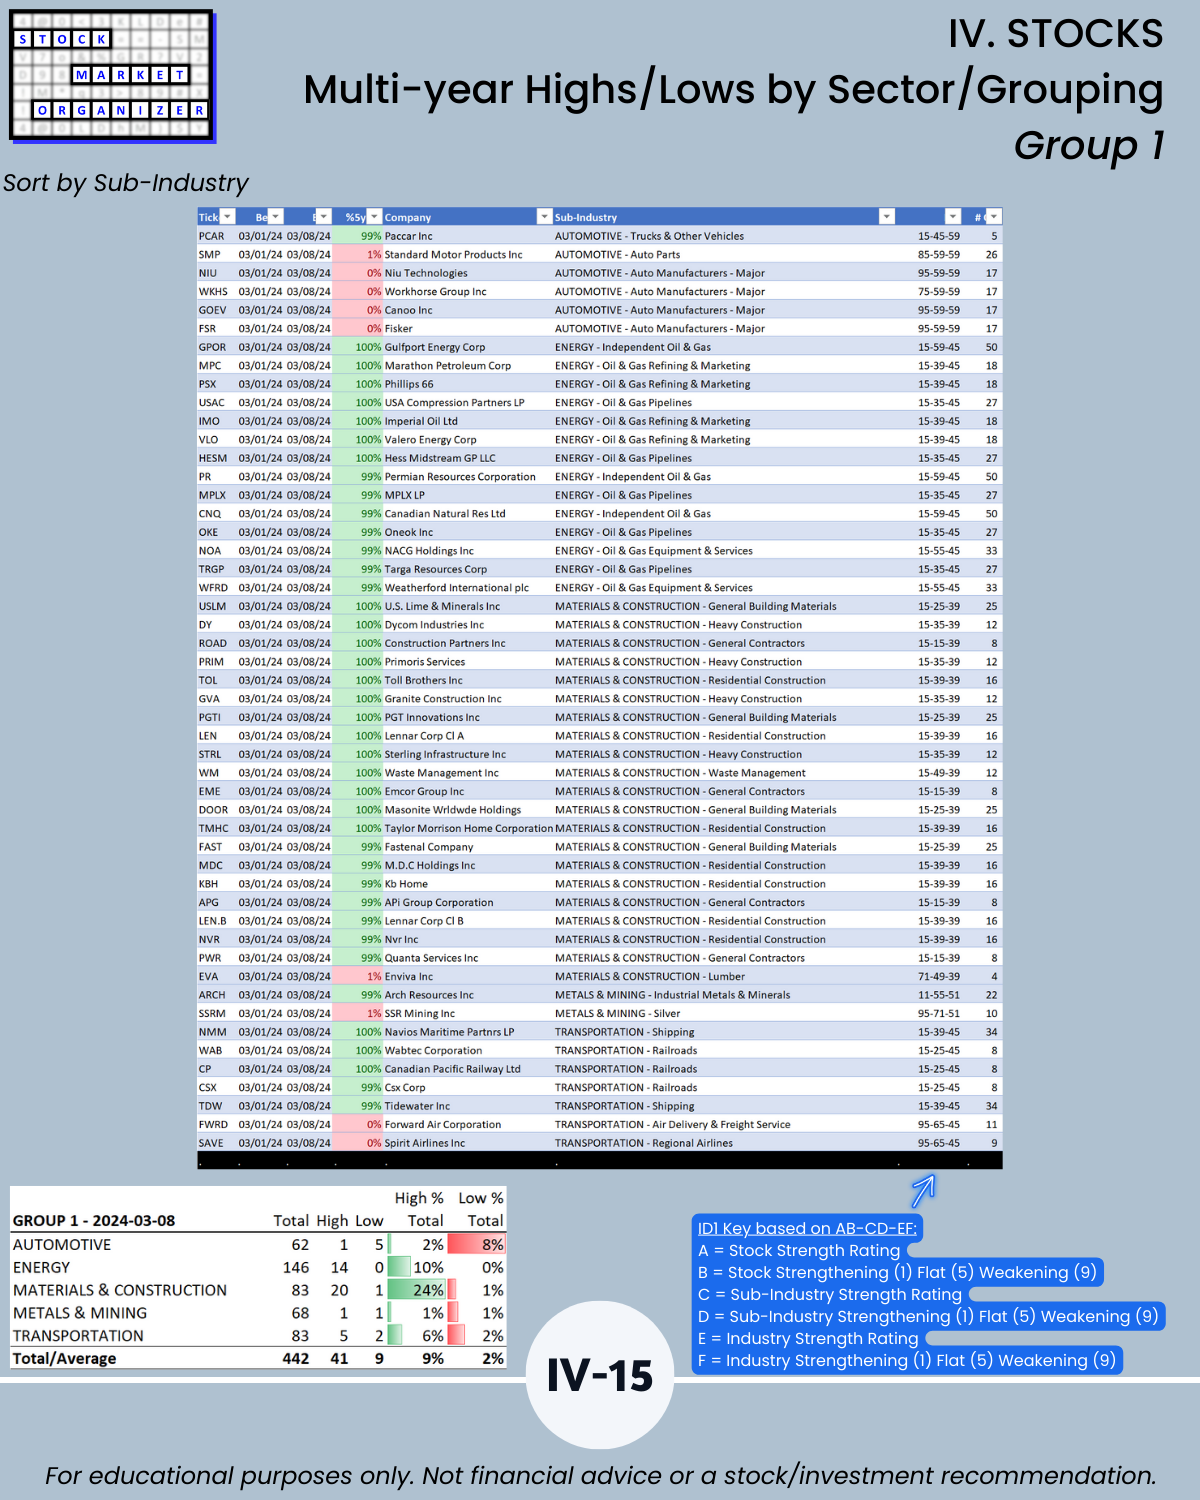
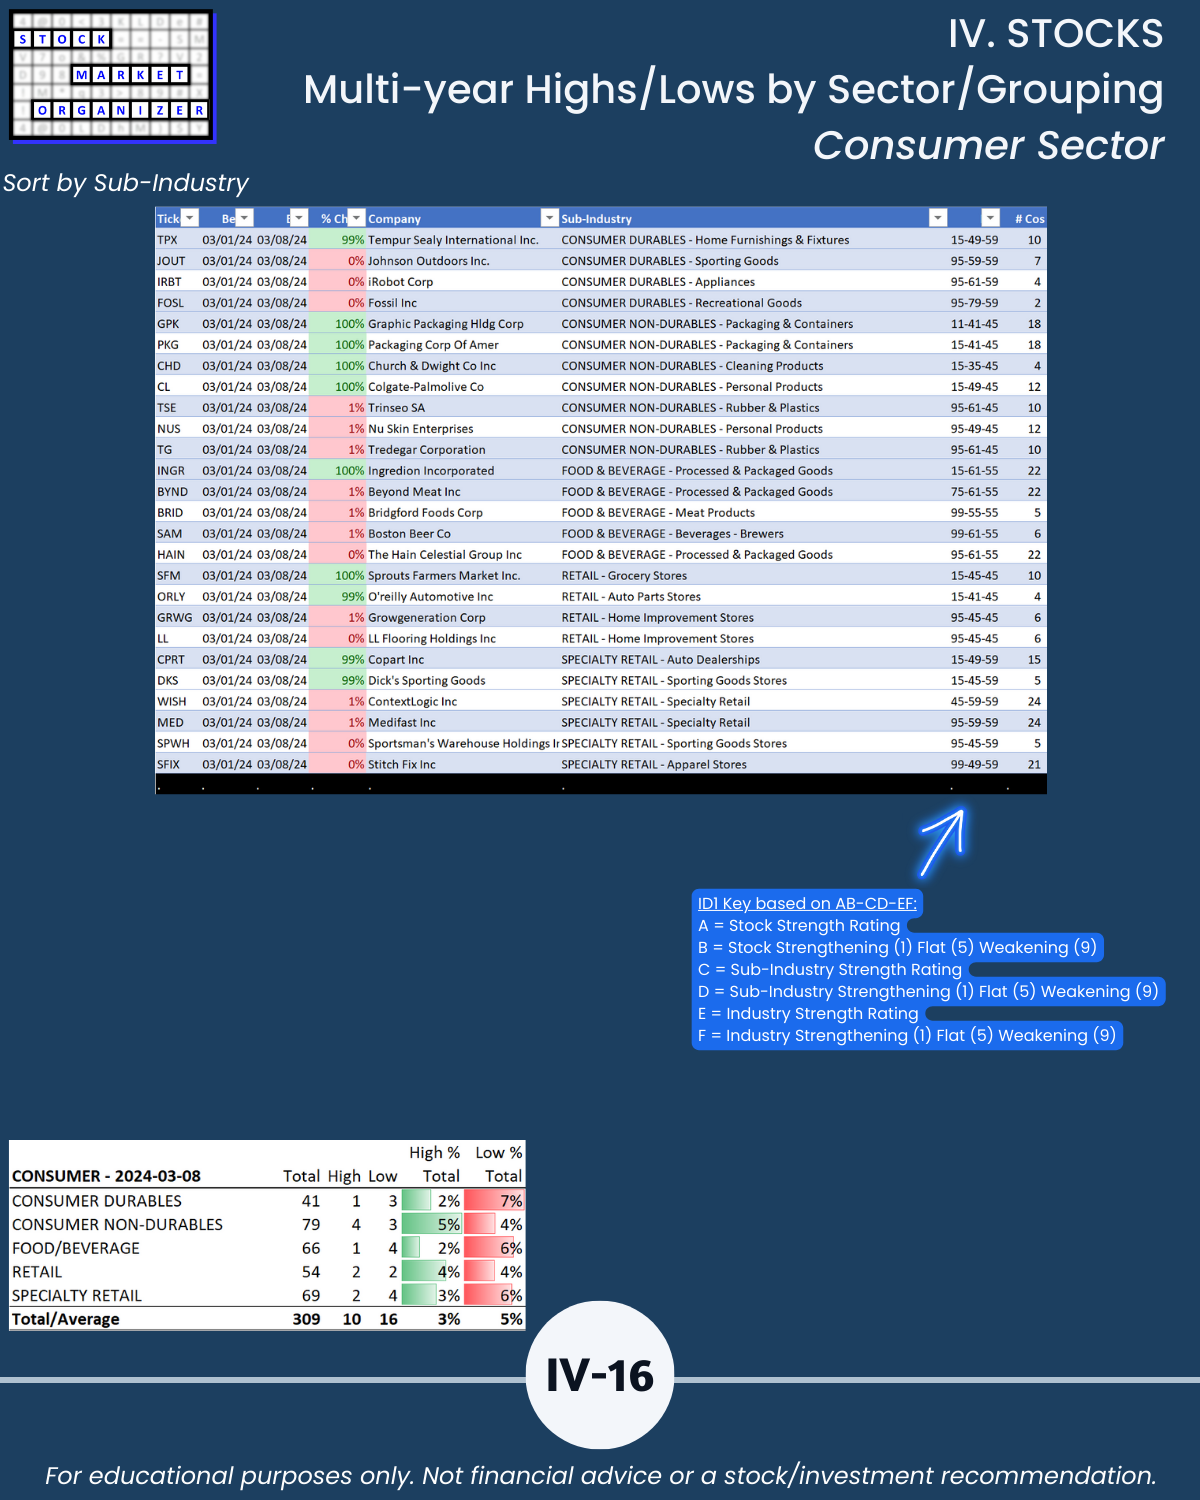
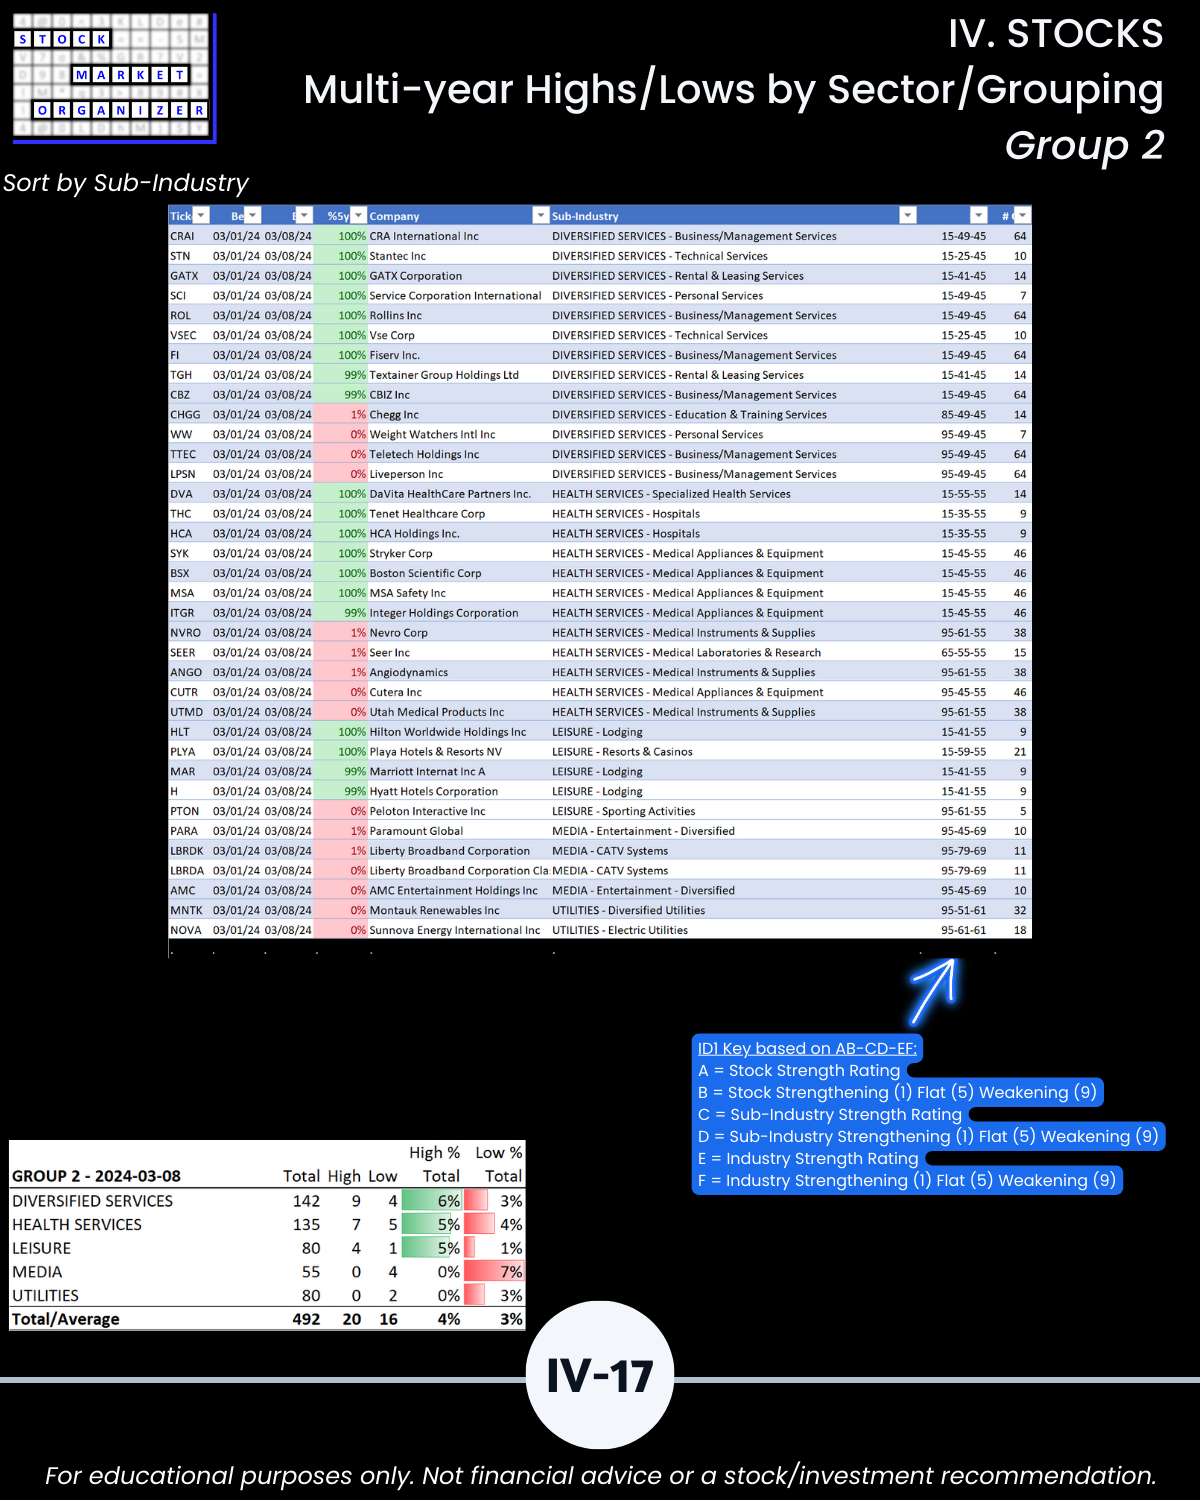
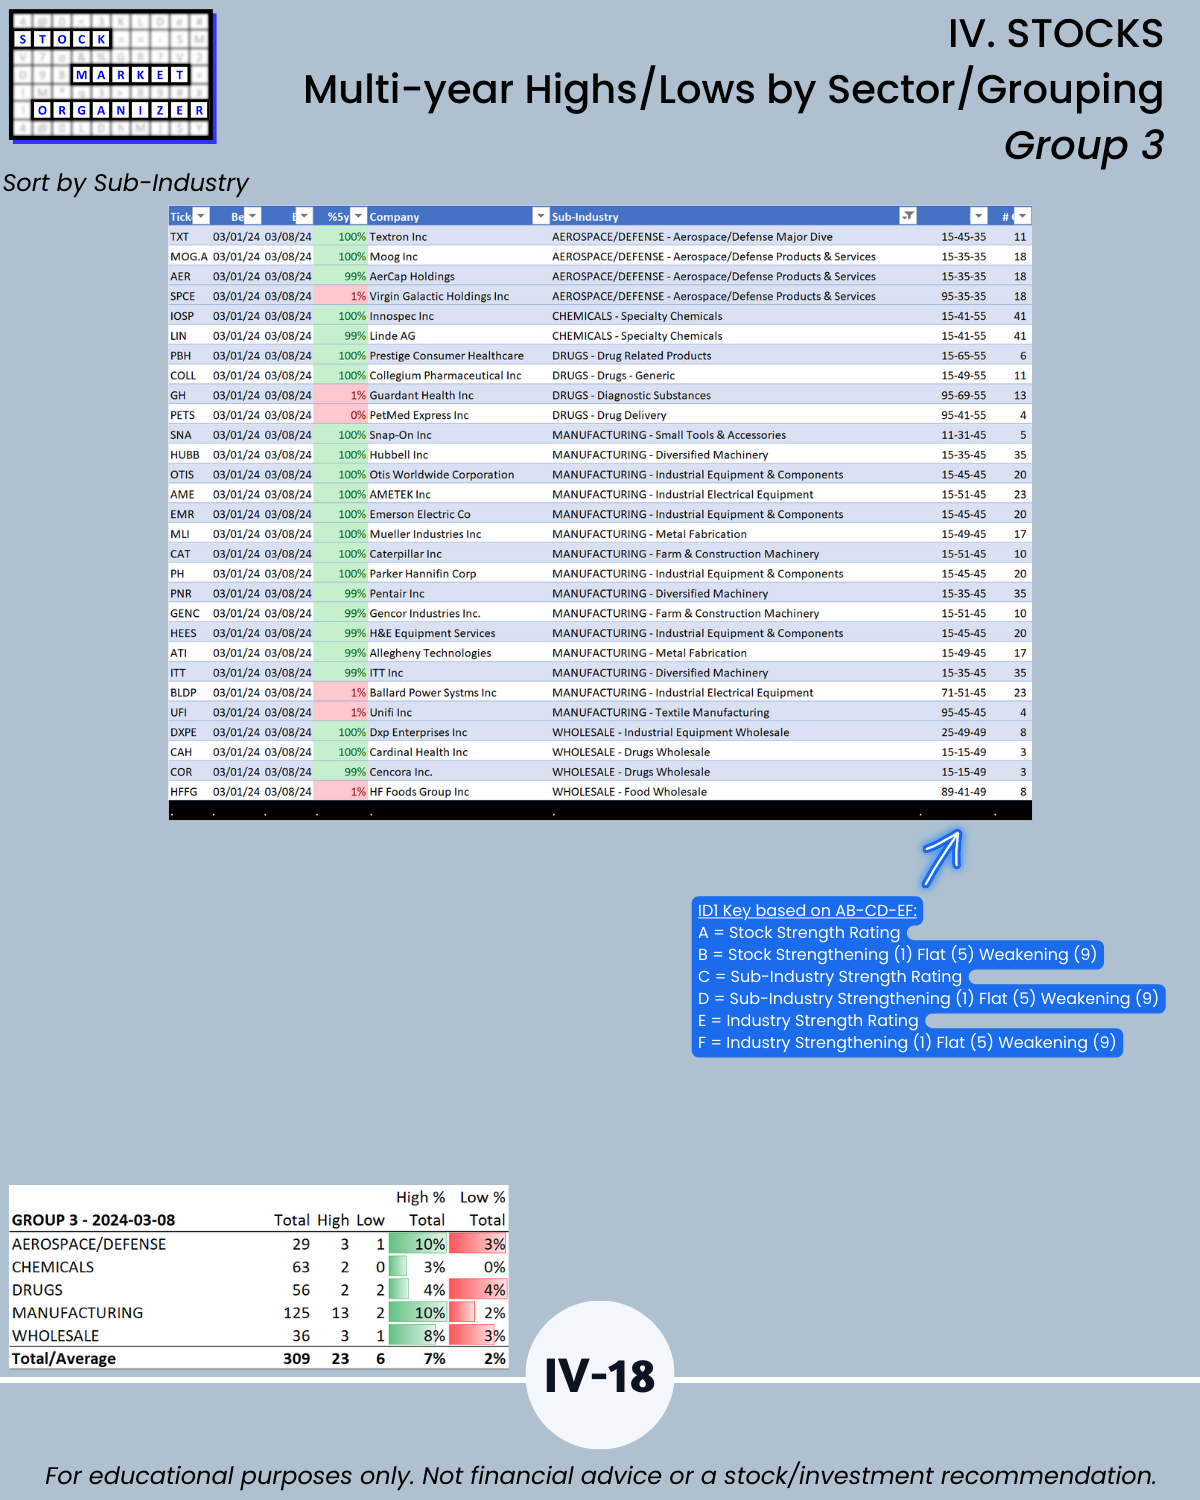
SECTION IV
Stocks detail to find outliers behind which to stack strength (or weakness, whichever you desire).
You might be surprised at what you find when you don’t look at things the same way everyone else does.
I don’t draw on charts, I don’t stress over candlestick patterns or Fibonacci retracements and extensions, I ignore P/E ratios and growth rates and DCF analyses and Fed rate cut conjecture.
I simply measure what the market is saying and am passing that along in this analysis, unencumbered by bias, feelings, emotions, interpretations, judgments, and opinions.
Following are galleries with page-by-page views of this report.
I. MARKET/Critical System Concepts/Market Strength Score
IIA. INDUSTRIES/10-Week Week-by-Week Industry Strength
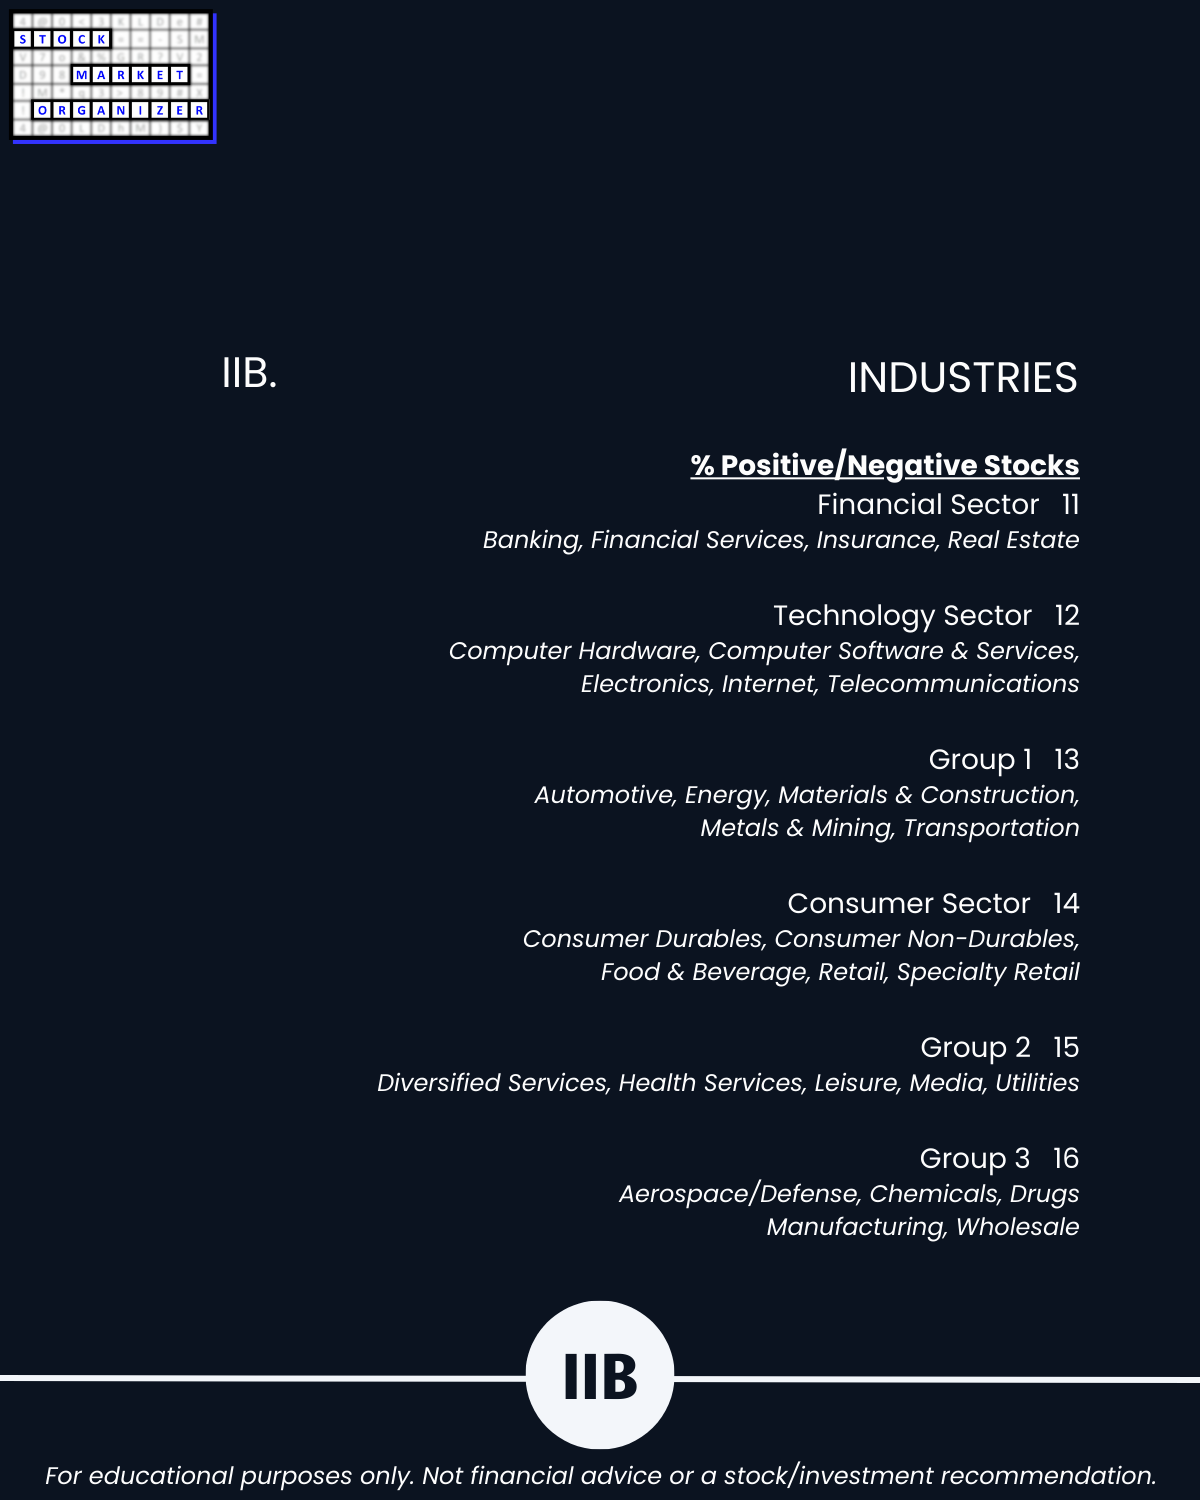
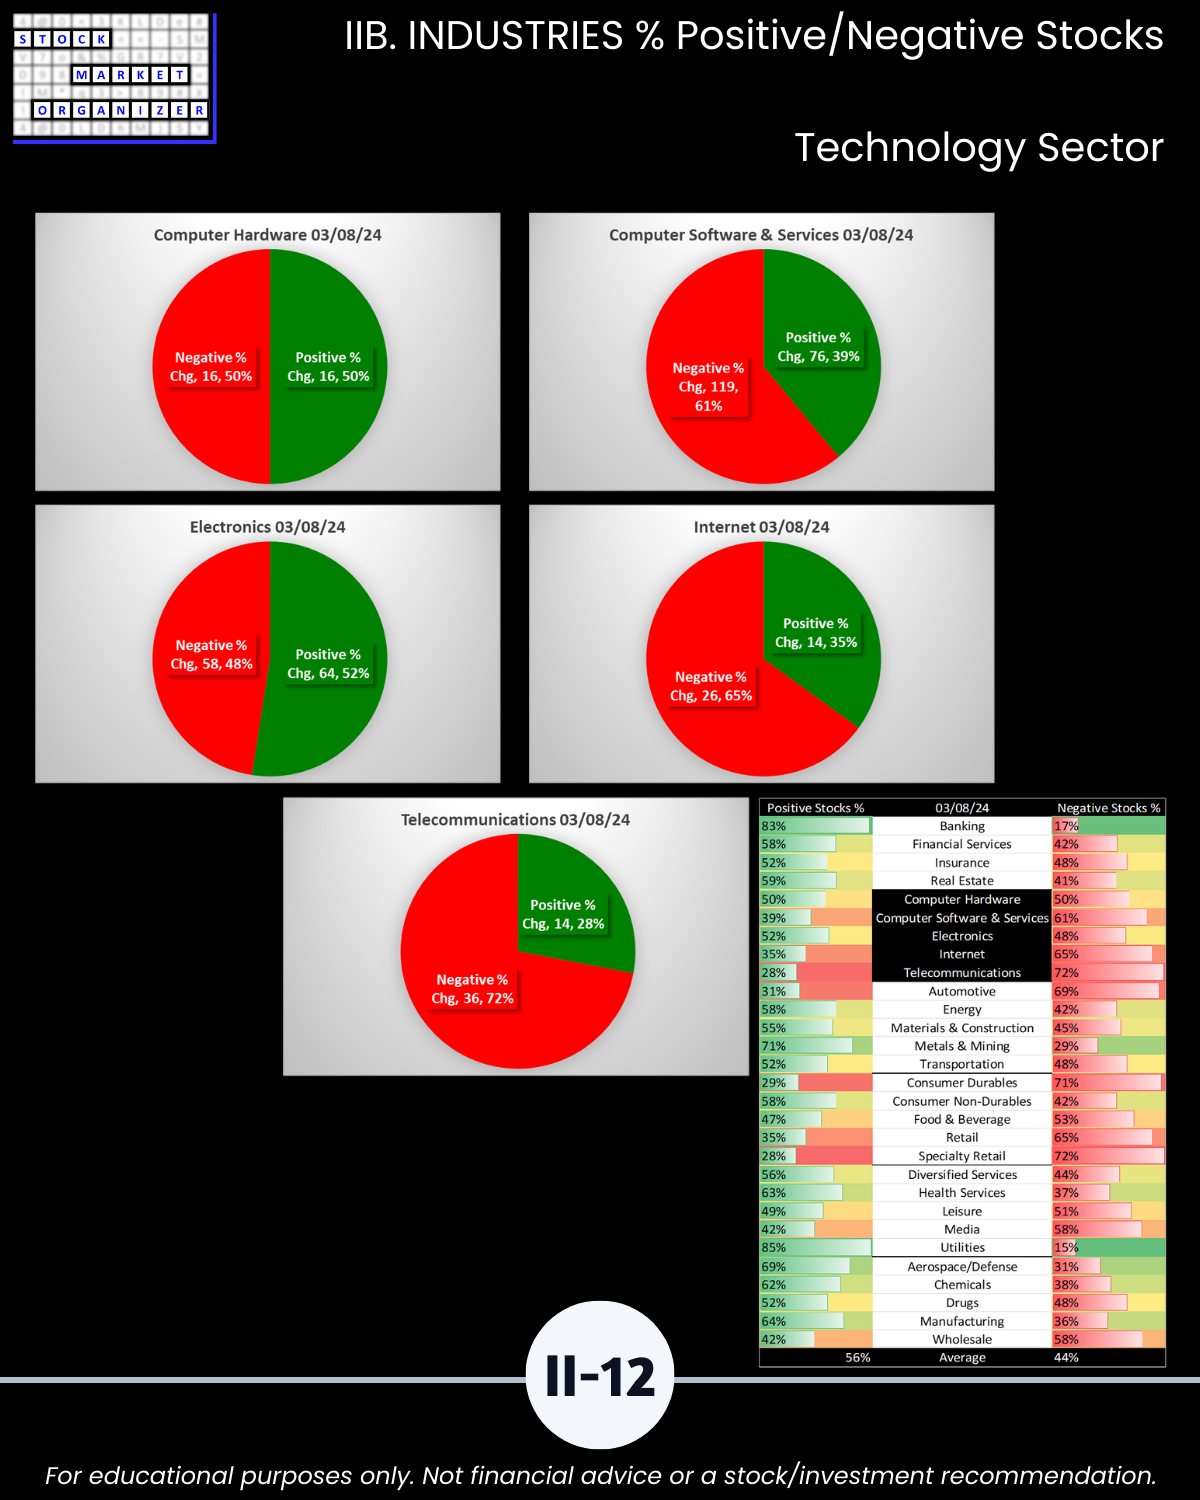
IIB. INDUSTRIES/% Positive/Negative Stocks
III. SUB-INDUSTRIES/10-Week Individual Sub-Industry Strength Reports
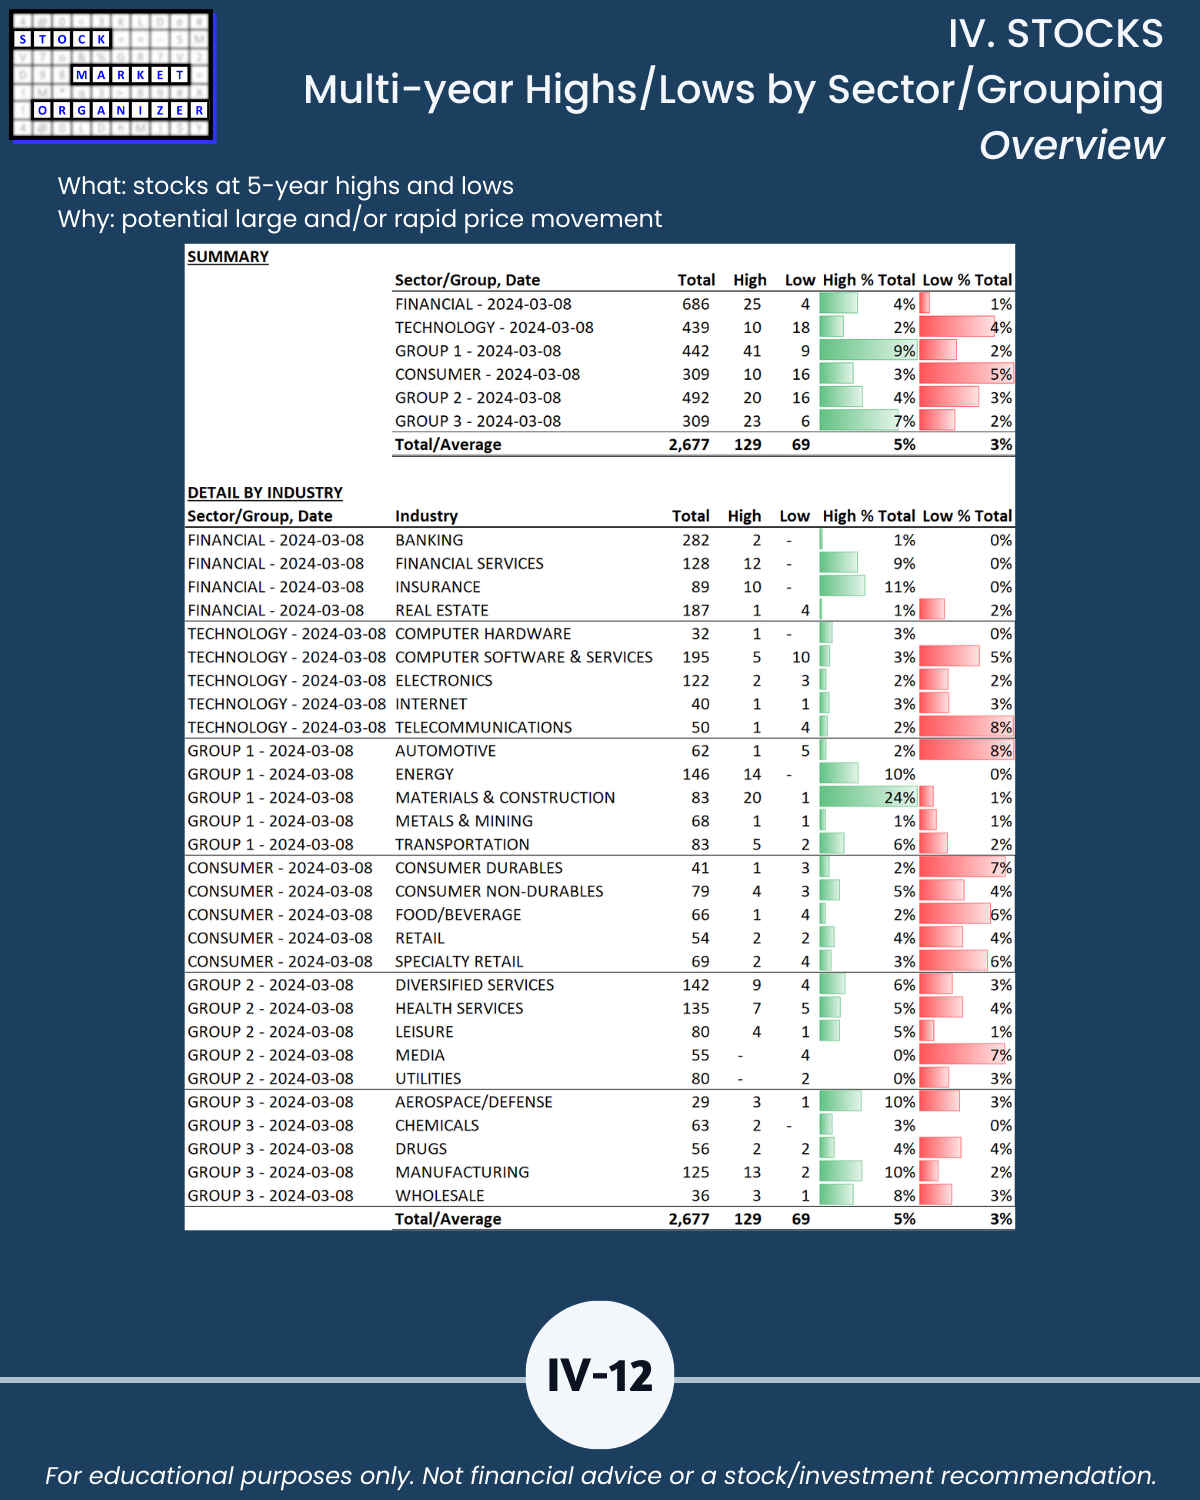
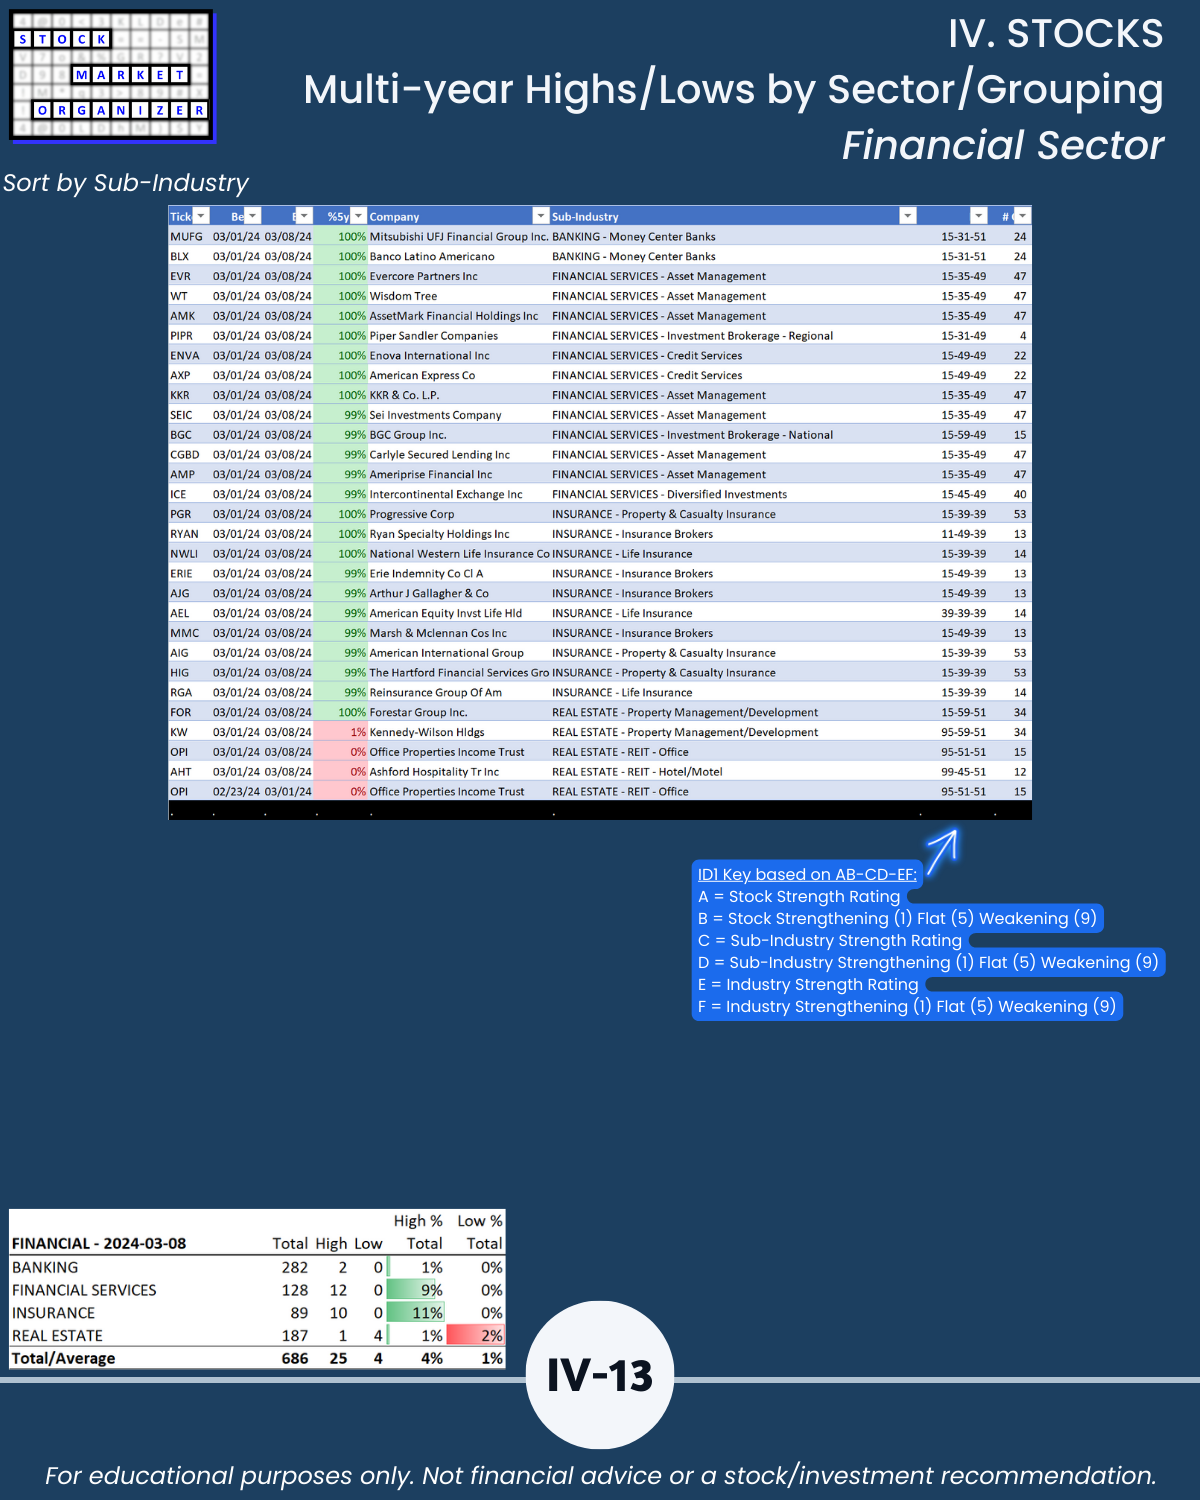
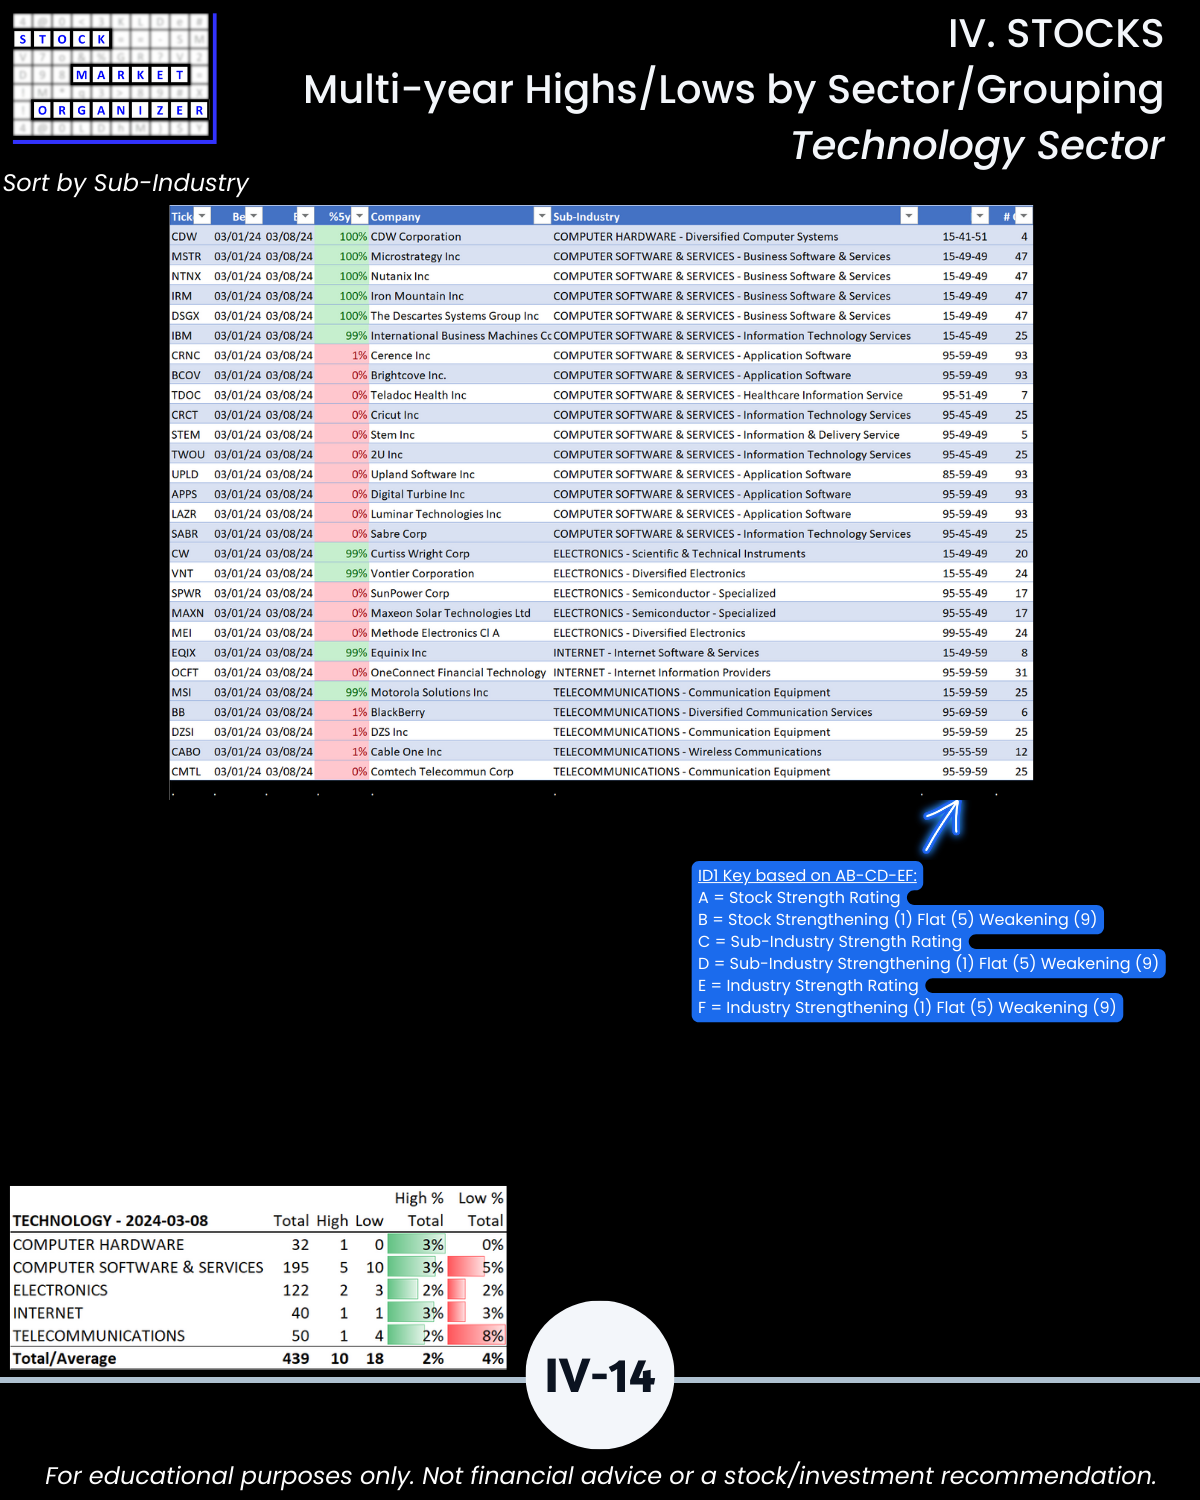
IV. STOCKS/Stock Sorts, Multi-Year Highs/Lows by Sector/Grouping
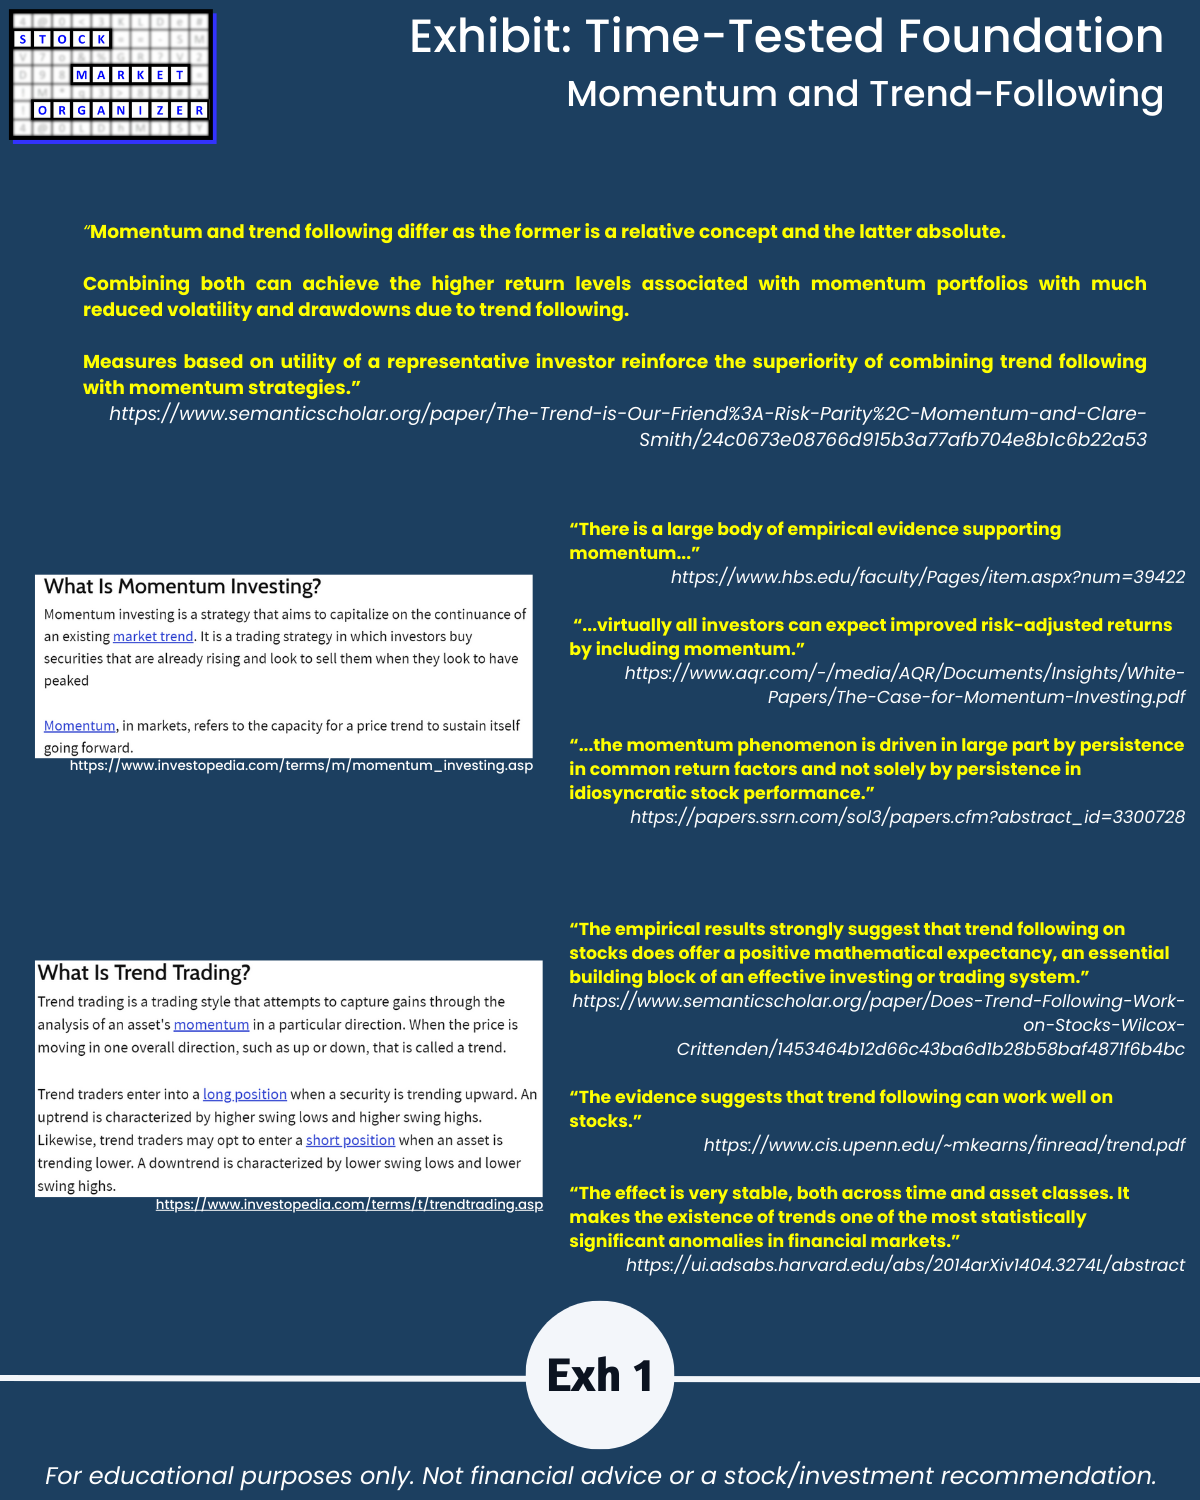
IV. Exhibits - System Foundations