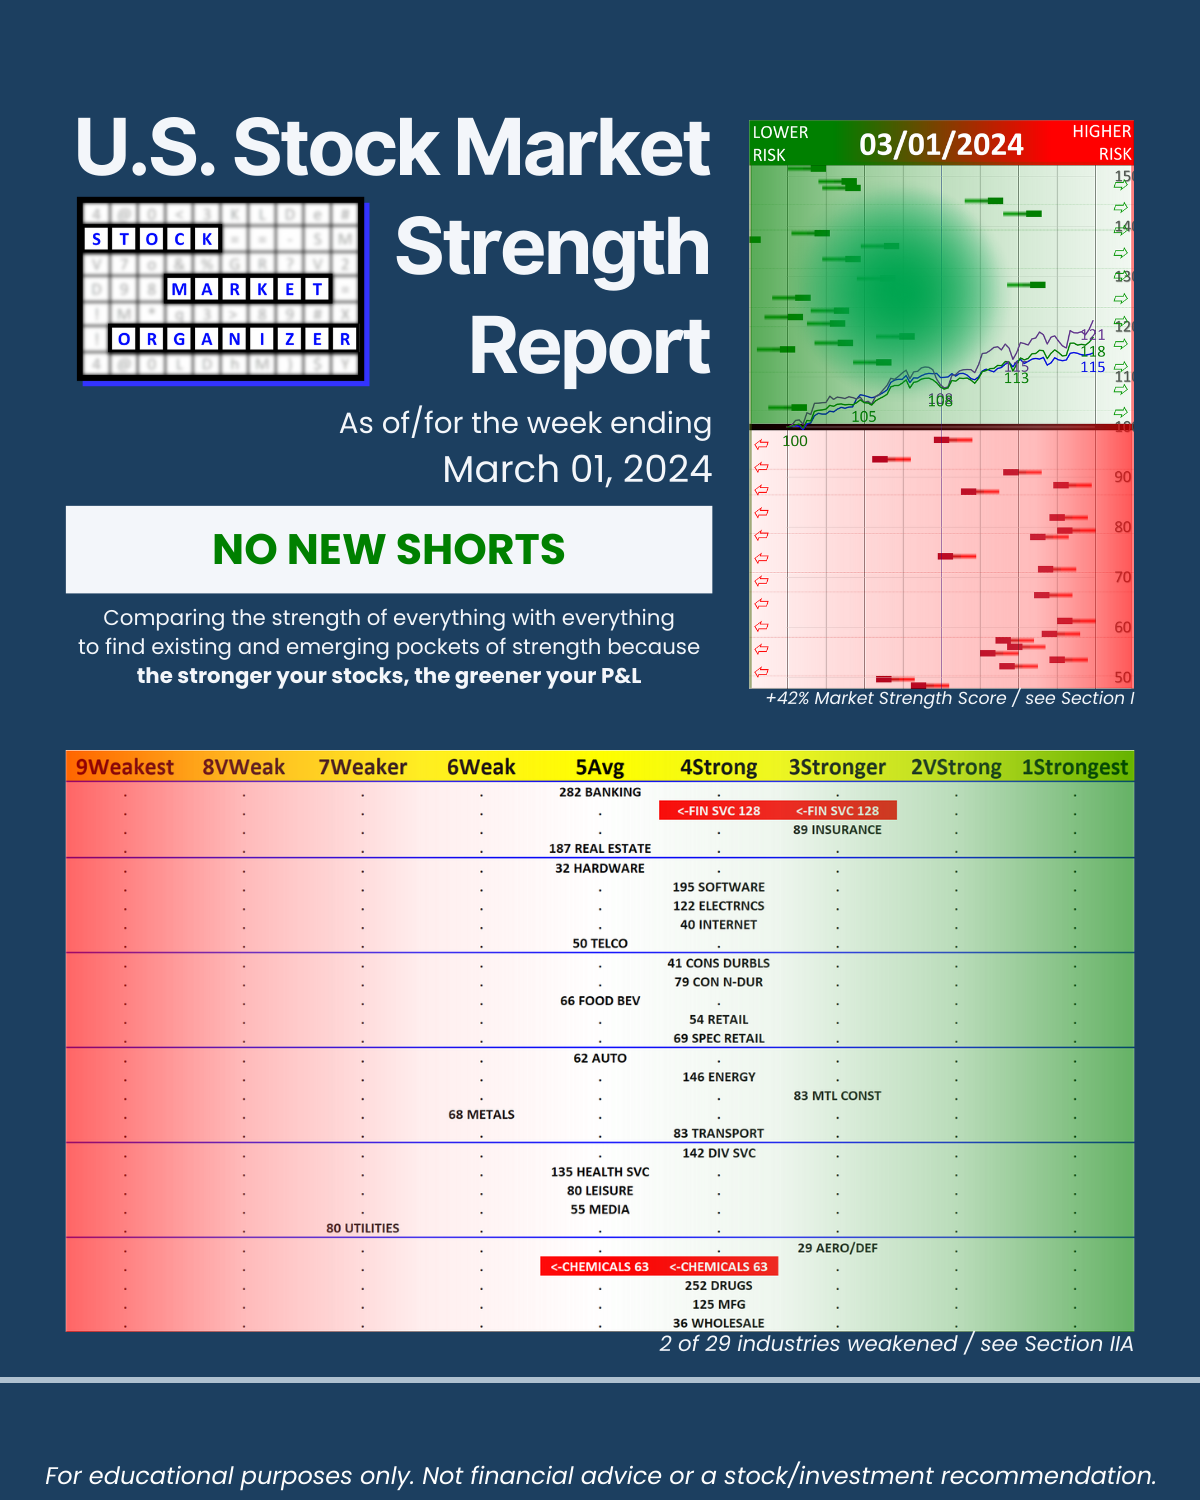
SMO Exclusive: U.S. Stock Market Strength Report 2024-03-01 (+42%, no new Shorts)

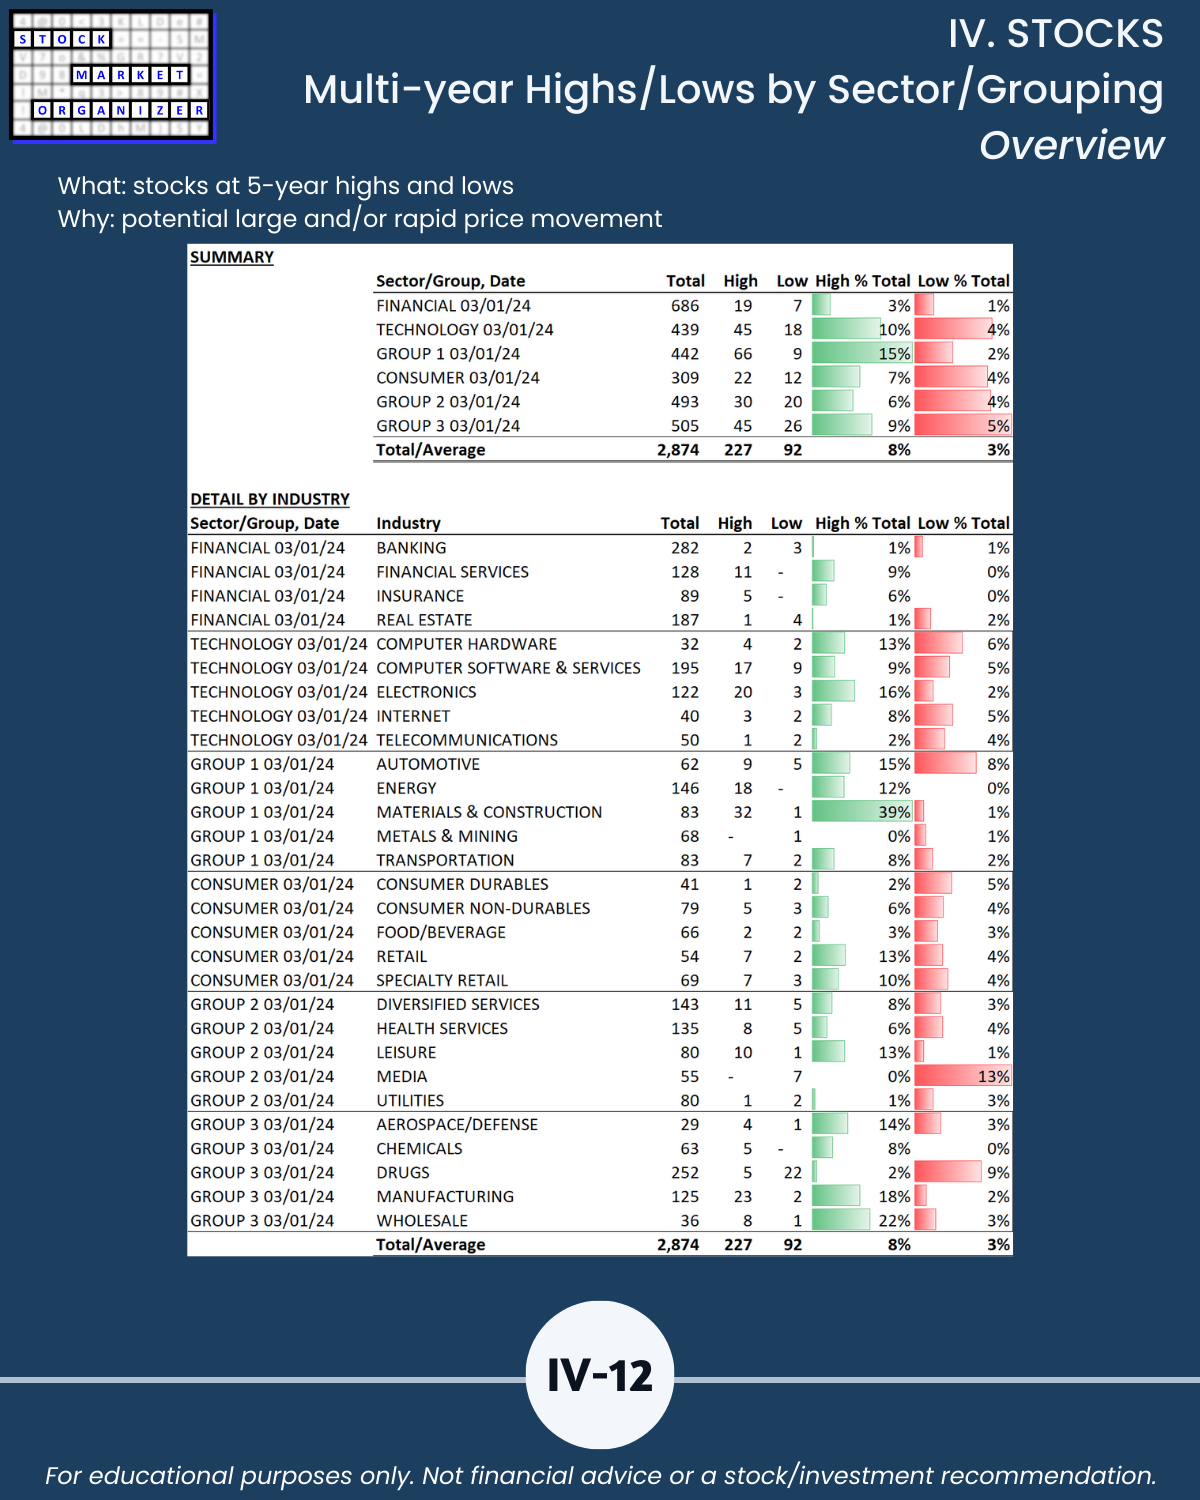
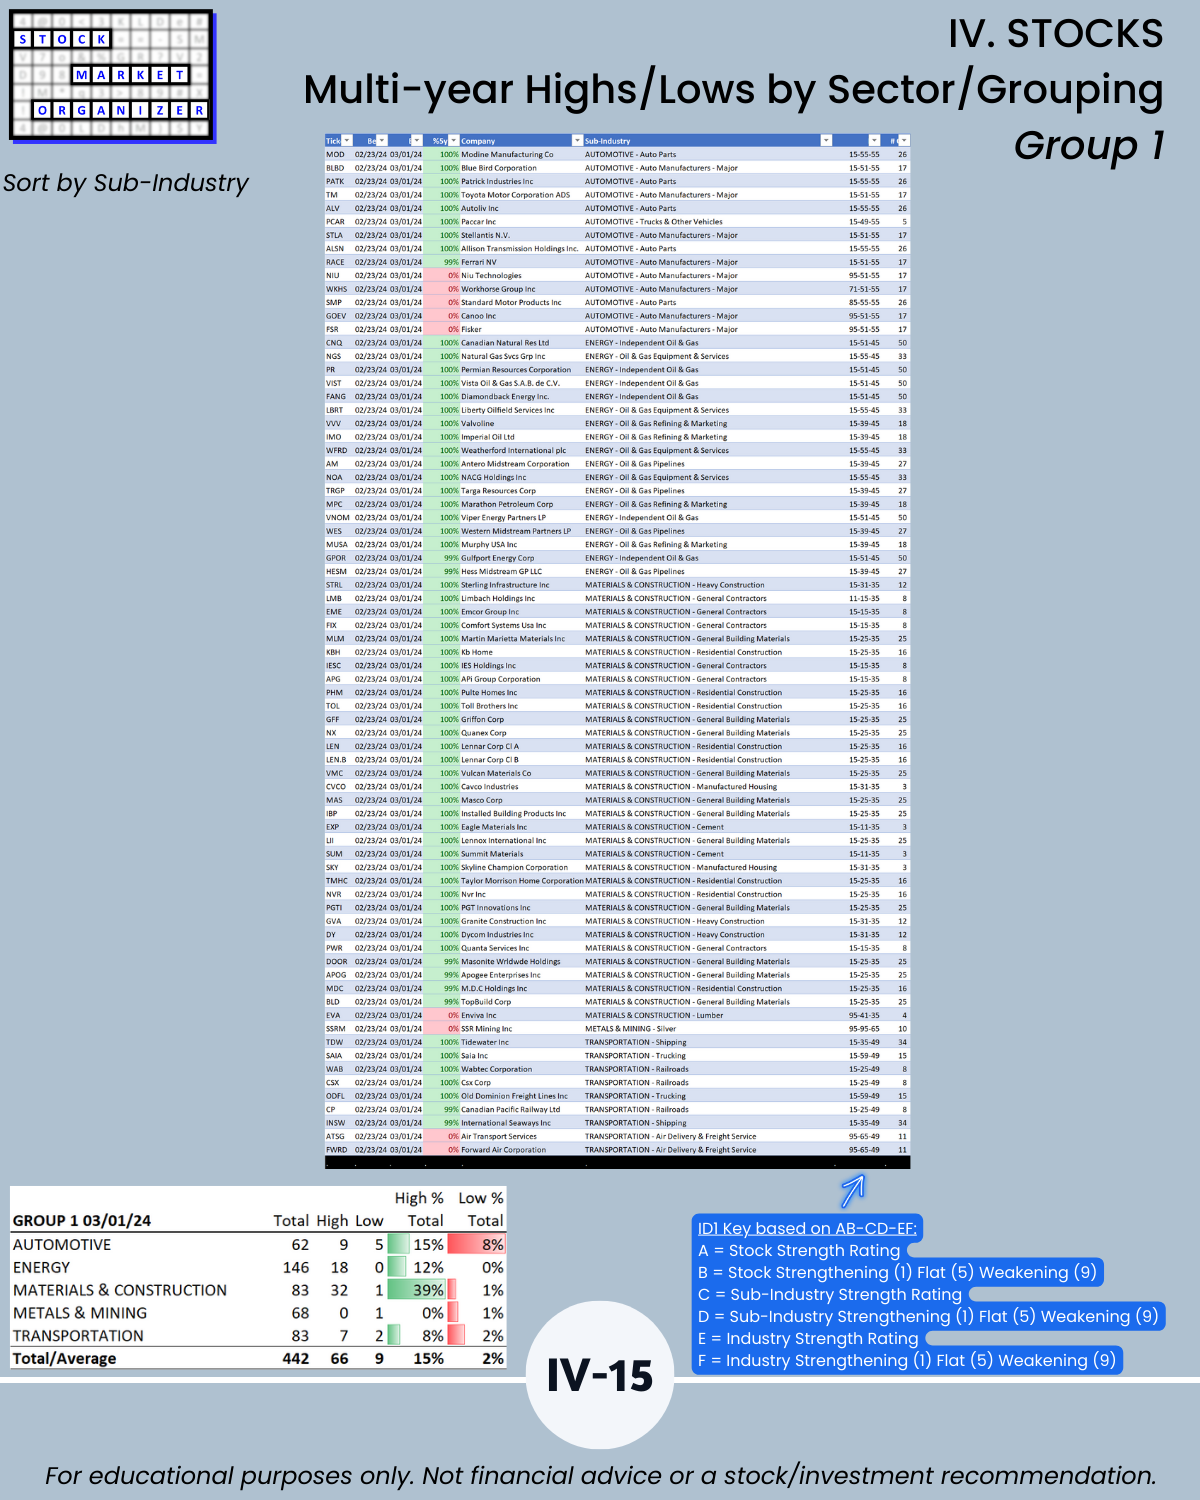
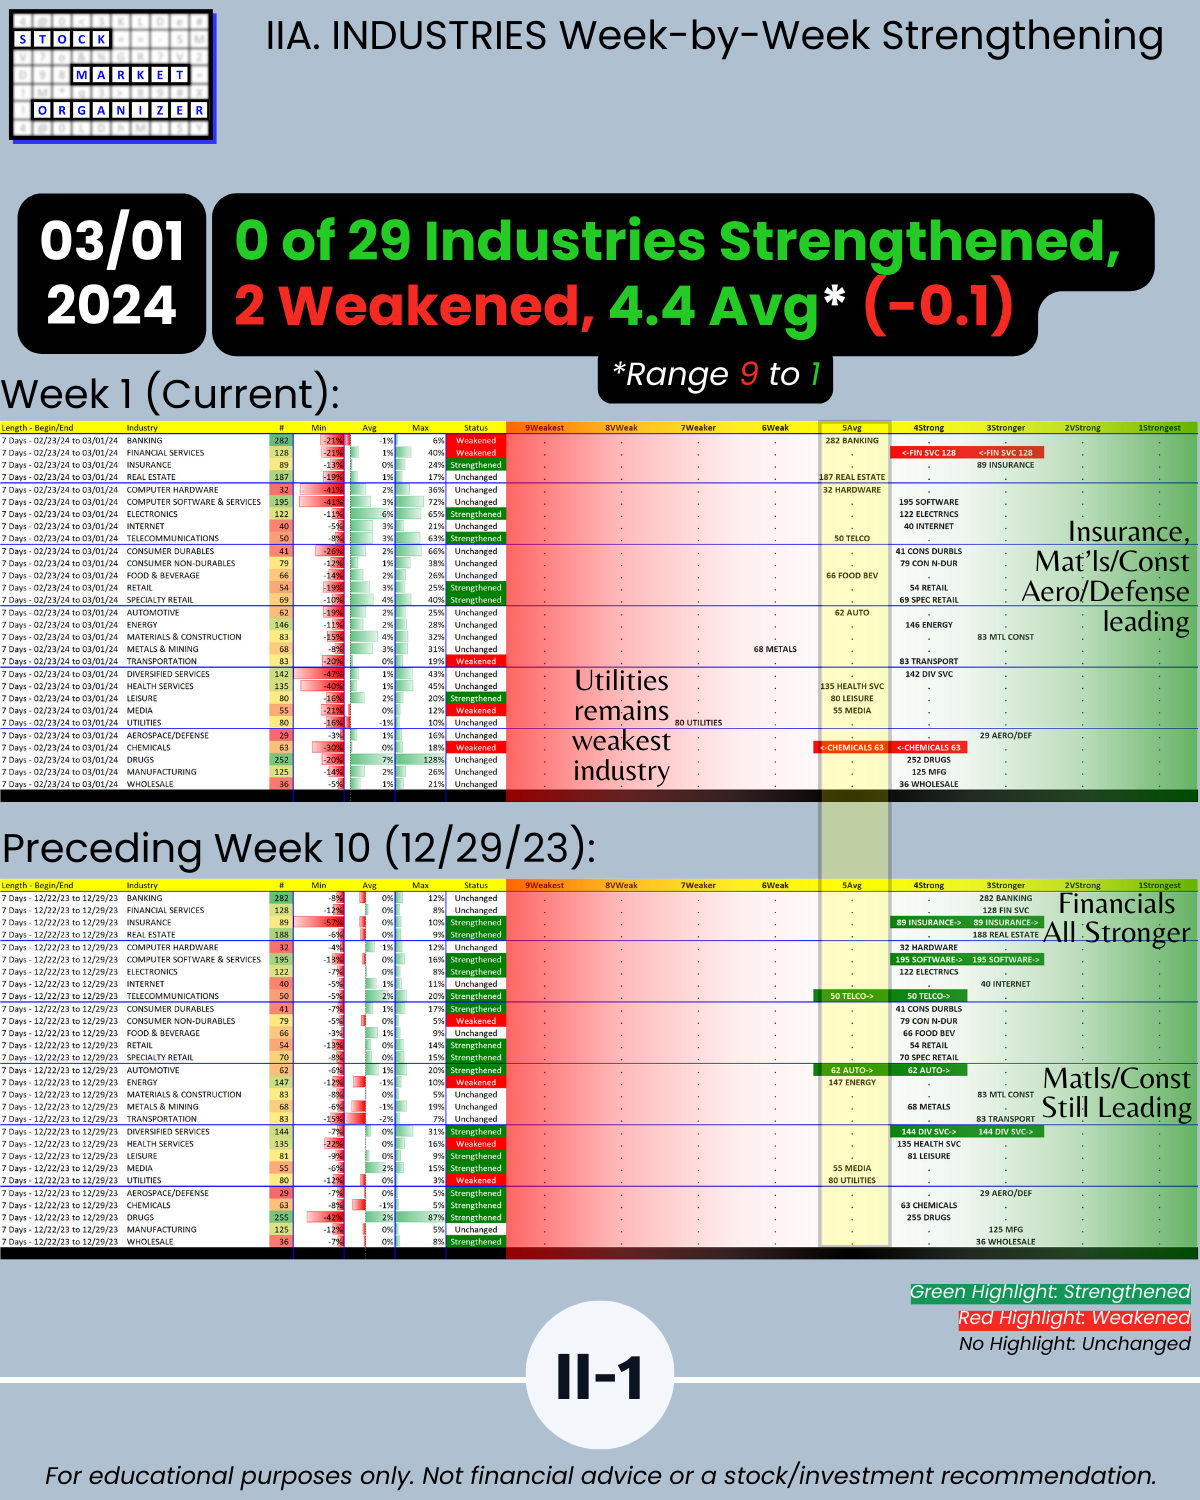
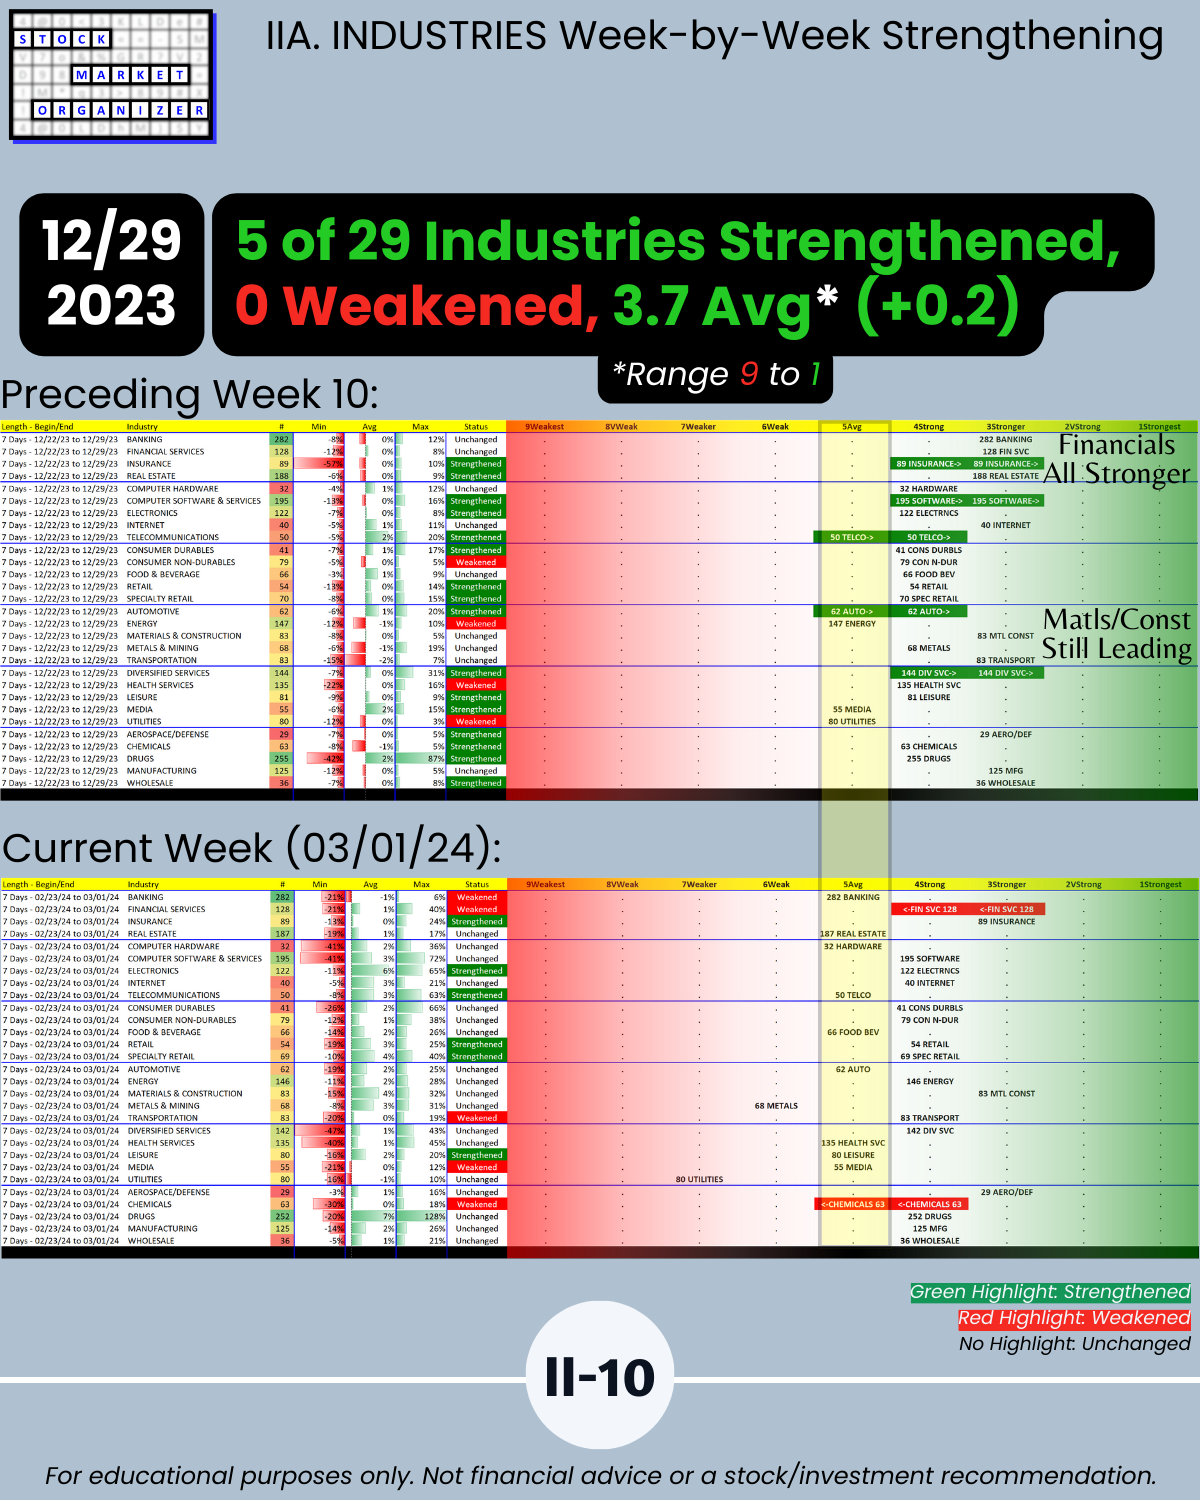
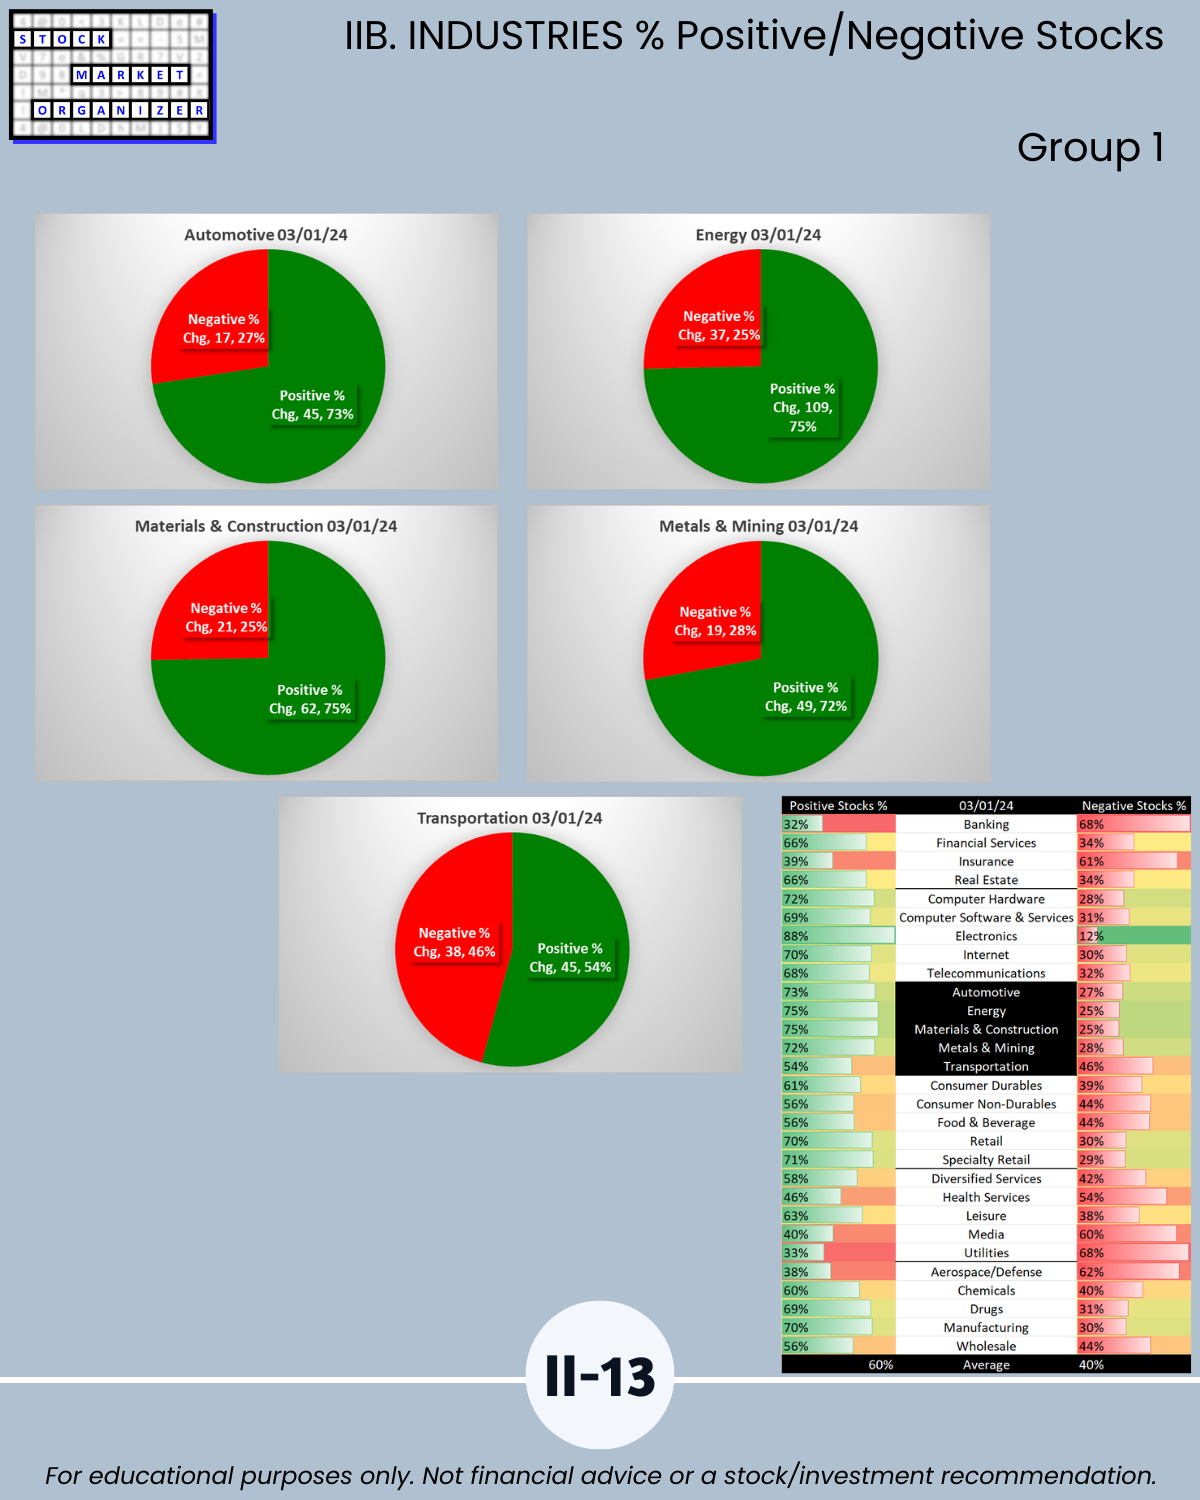
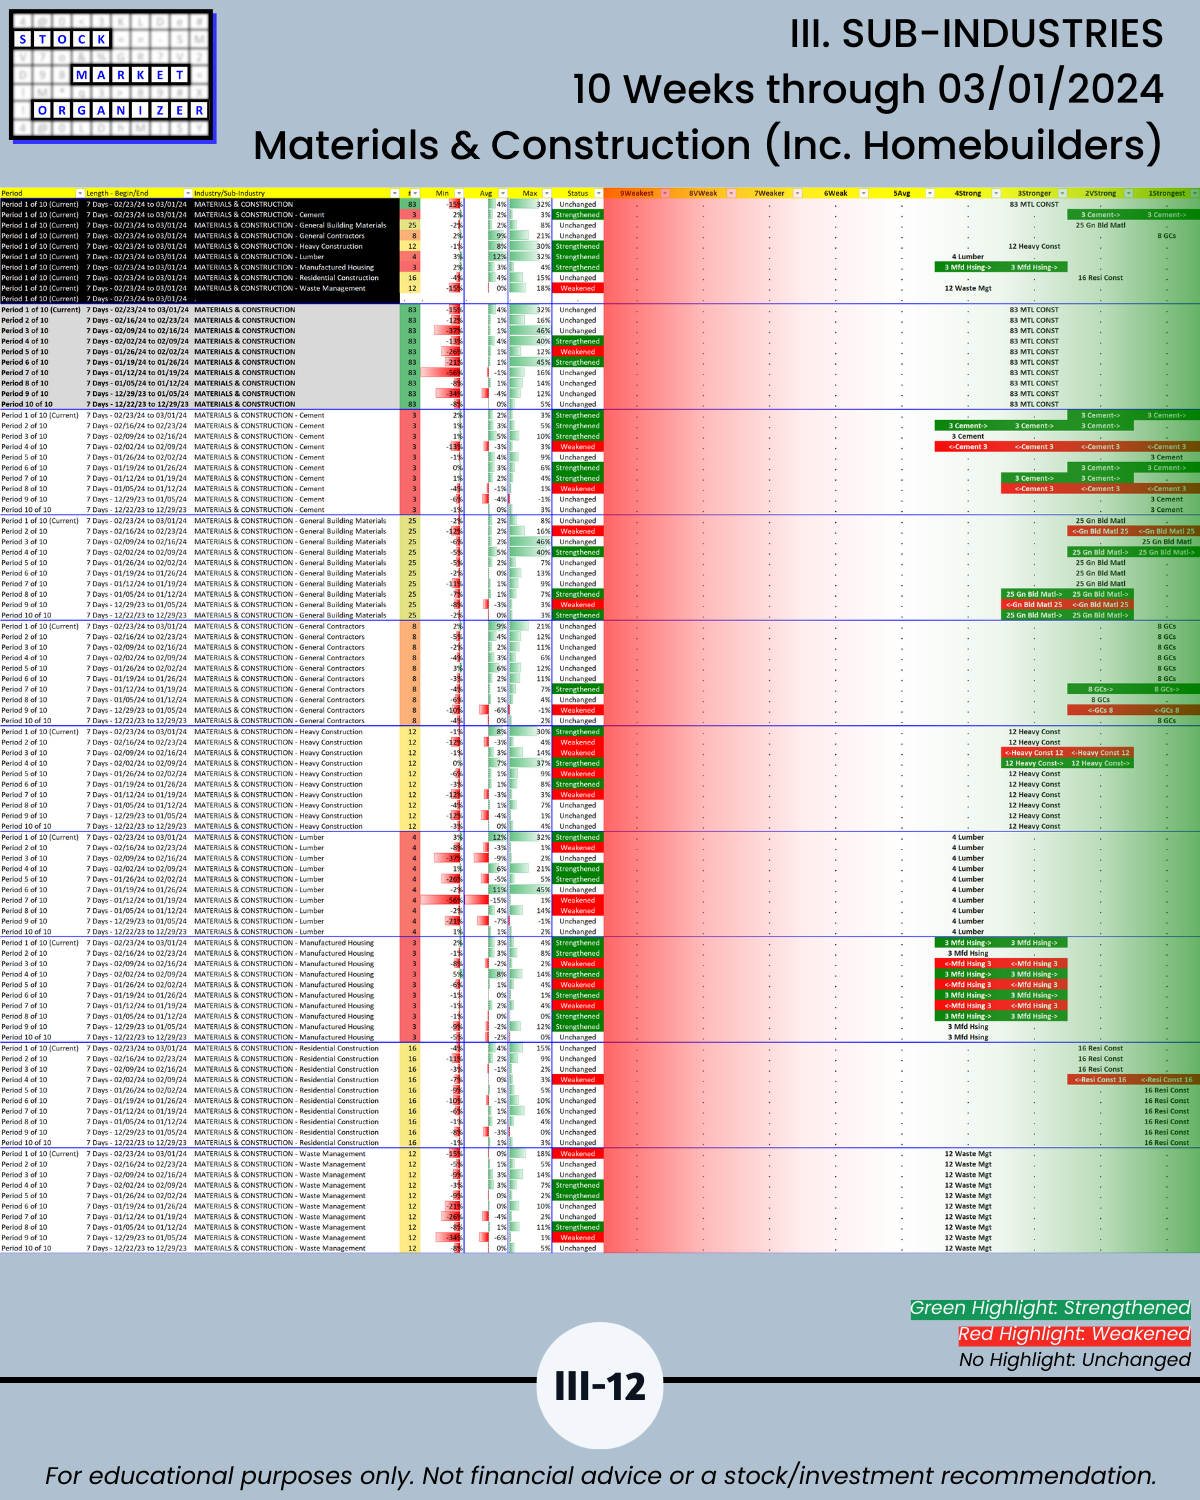
Do you ever wonder “what is happening in the market NOW?” 3/1/24 answer attached. Market environment = NO NEW SHORTS. You know about AI. But did you know 32 of 83 (39%) Materials & Construction stocks (including homebuilders) are at 5+ year highs and it has been the strongest of 29 industries for 9 of the past 10 weeks? (See Section II and pages III-12 and IV-15.)
Mr. Dalio says on LinkedIn the U.S market “…doesn’t look very bubbly.” Mr. Chanos disagrees per Zerohedge via X.
Who’s right? Will the Mag 7ish draft up the Little 493? Will other themes and pockets of strength emerge? How will you know?
One way to find out as it happens: explicitly track strengthening and weakening everywhere and at every level of the stock market. As this analysis does - unclouded by biases, feelings, emotions, interpretations, judgments, or opinions.
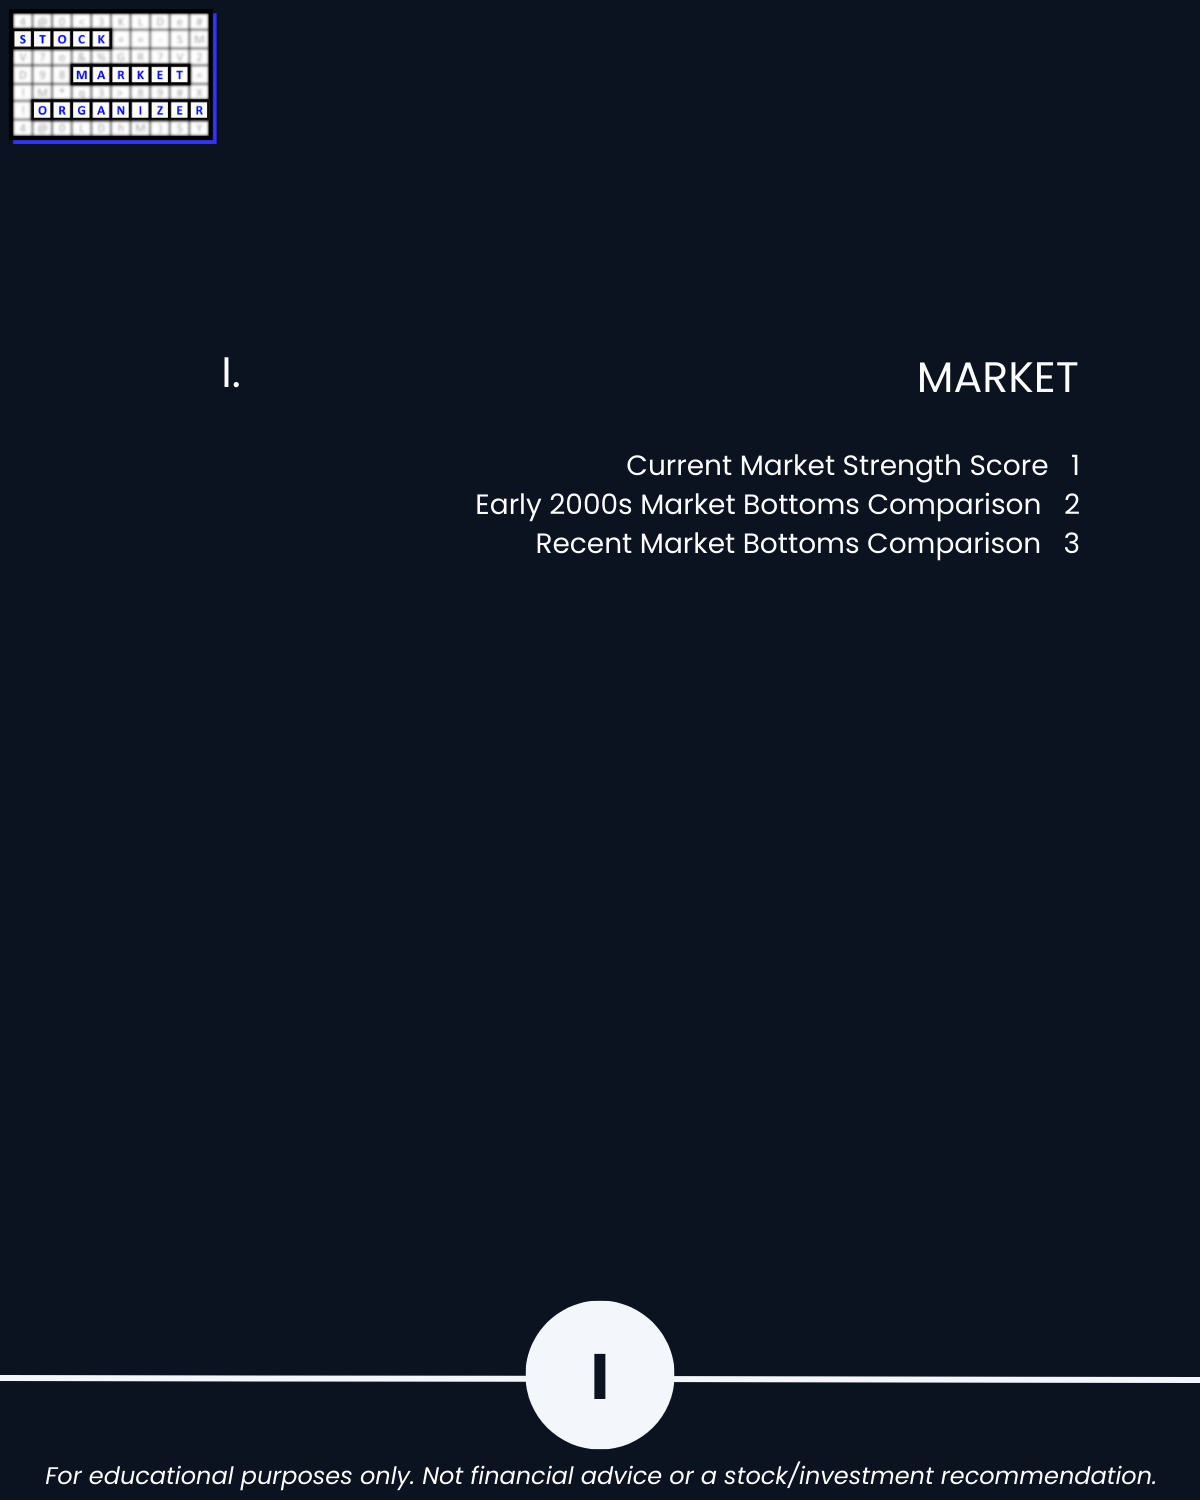
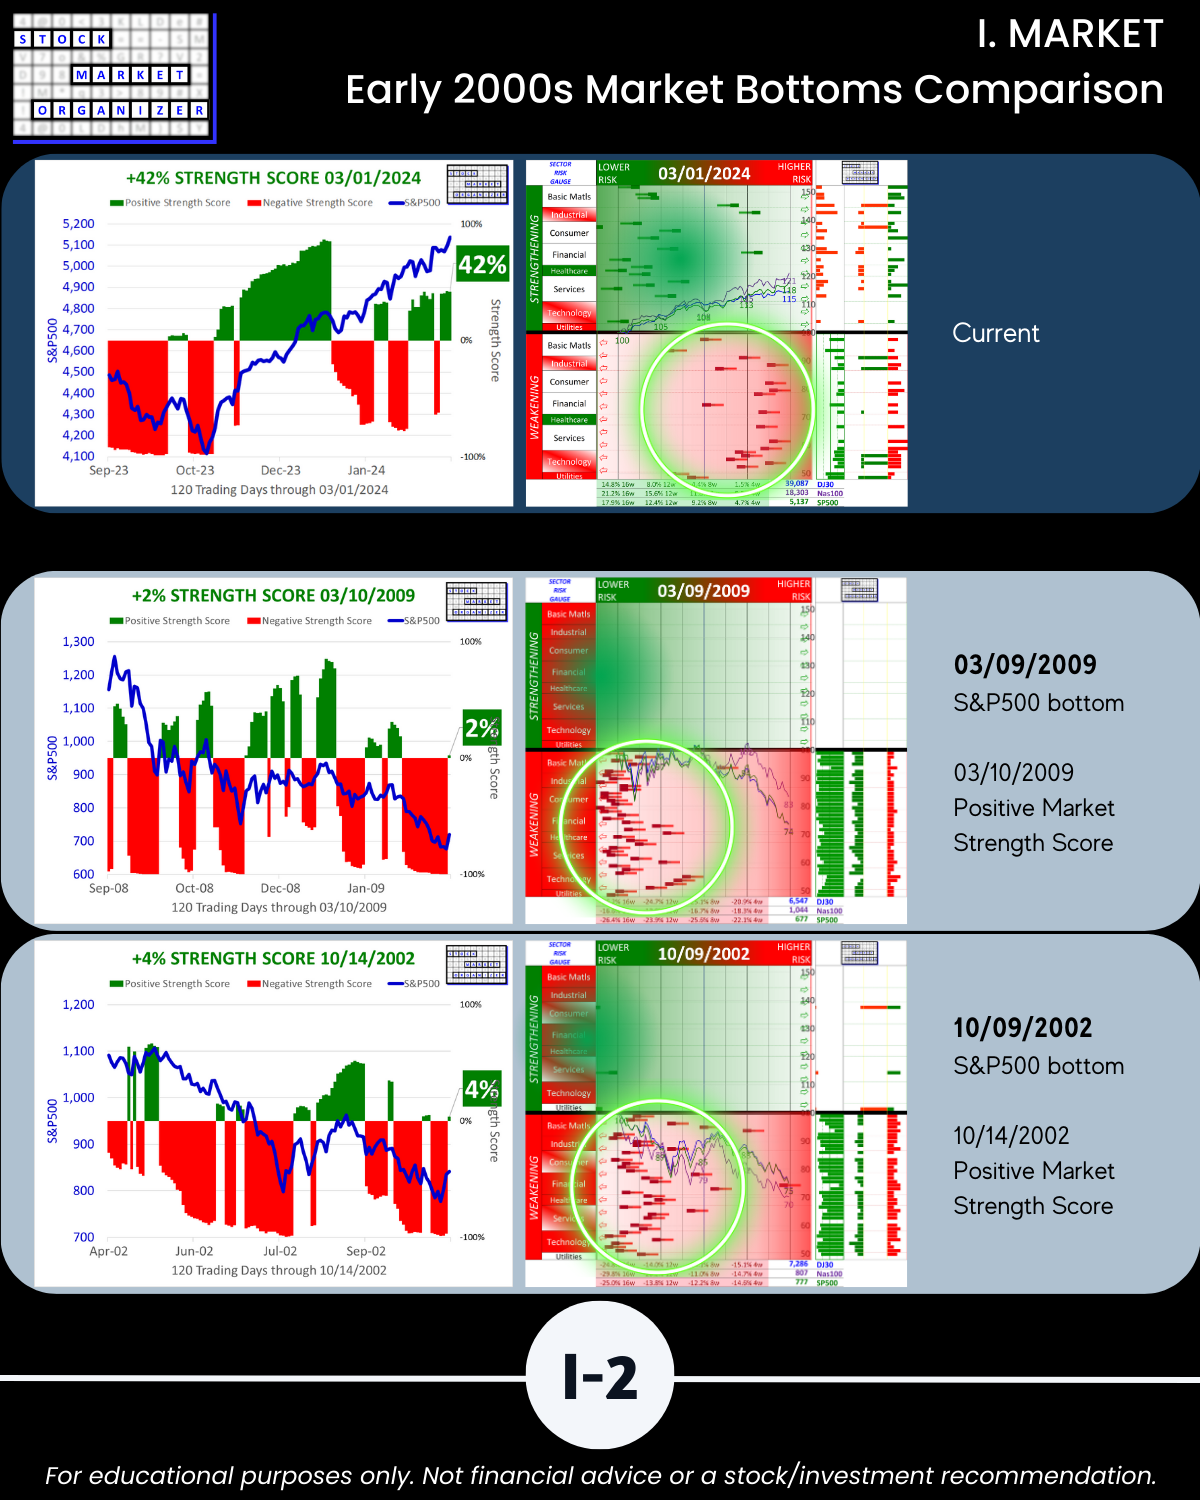
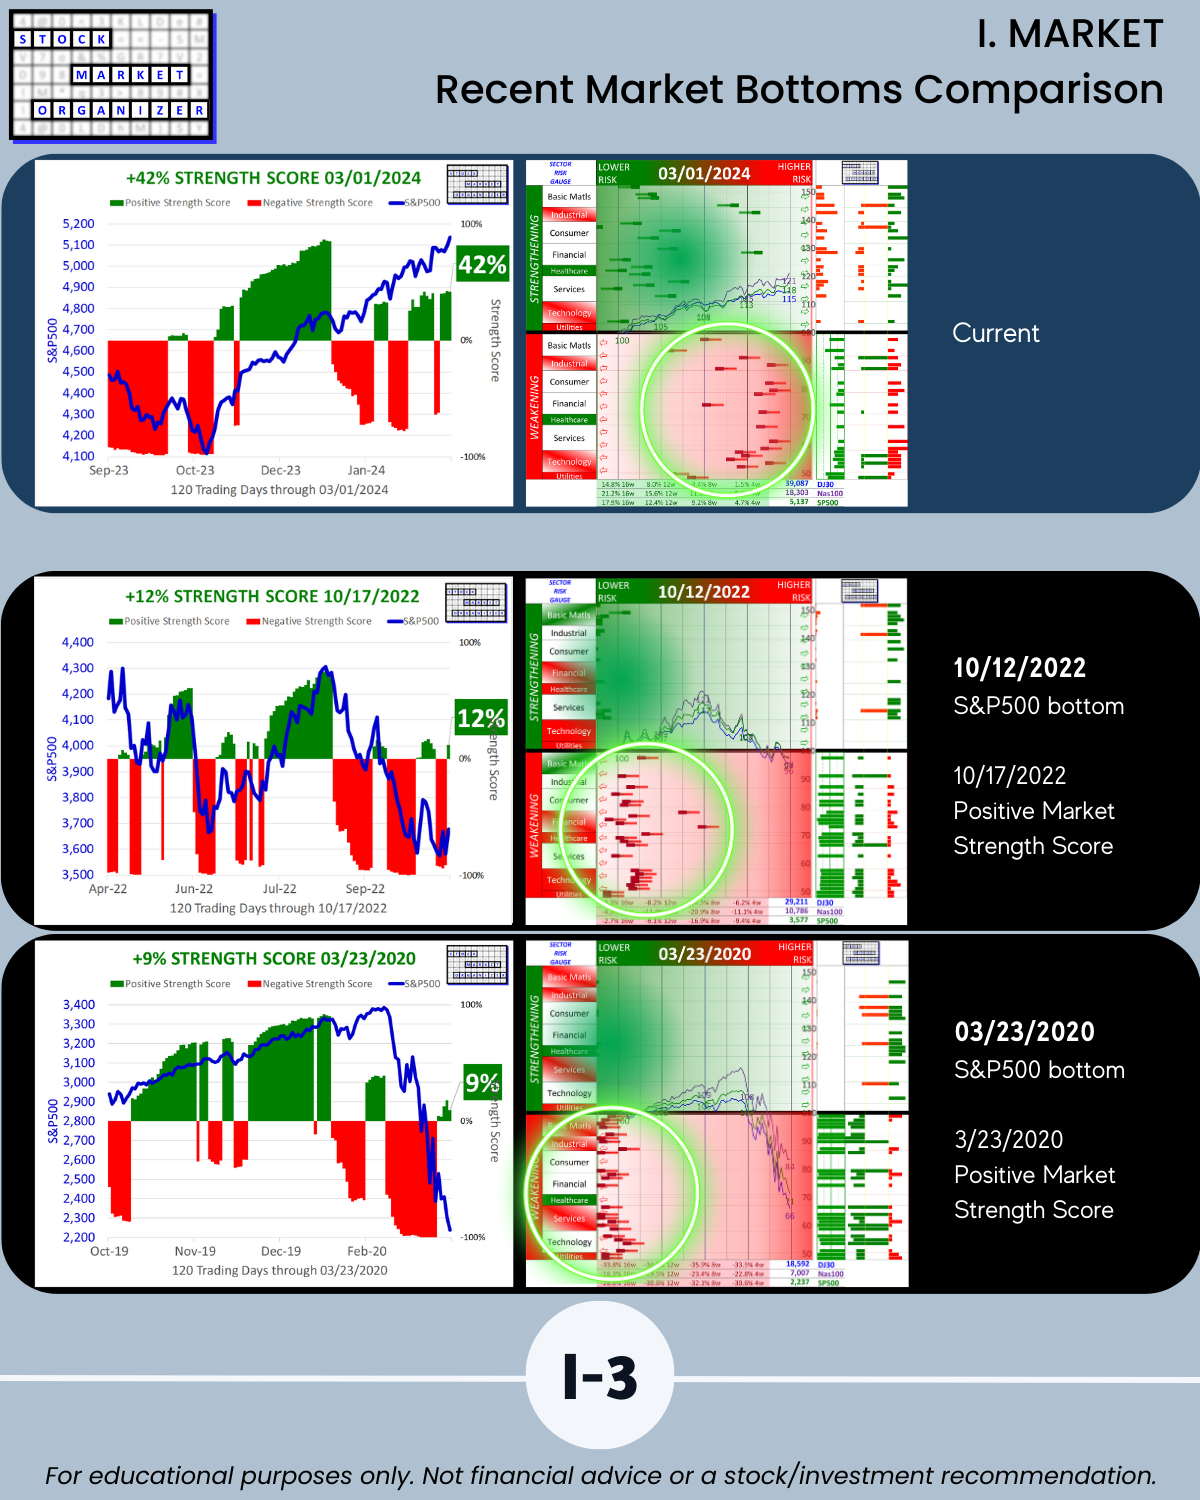
See Section I for the current Market Strength Score and model market bottoms.
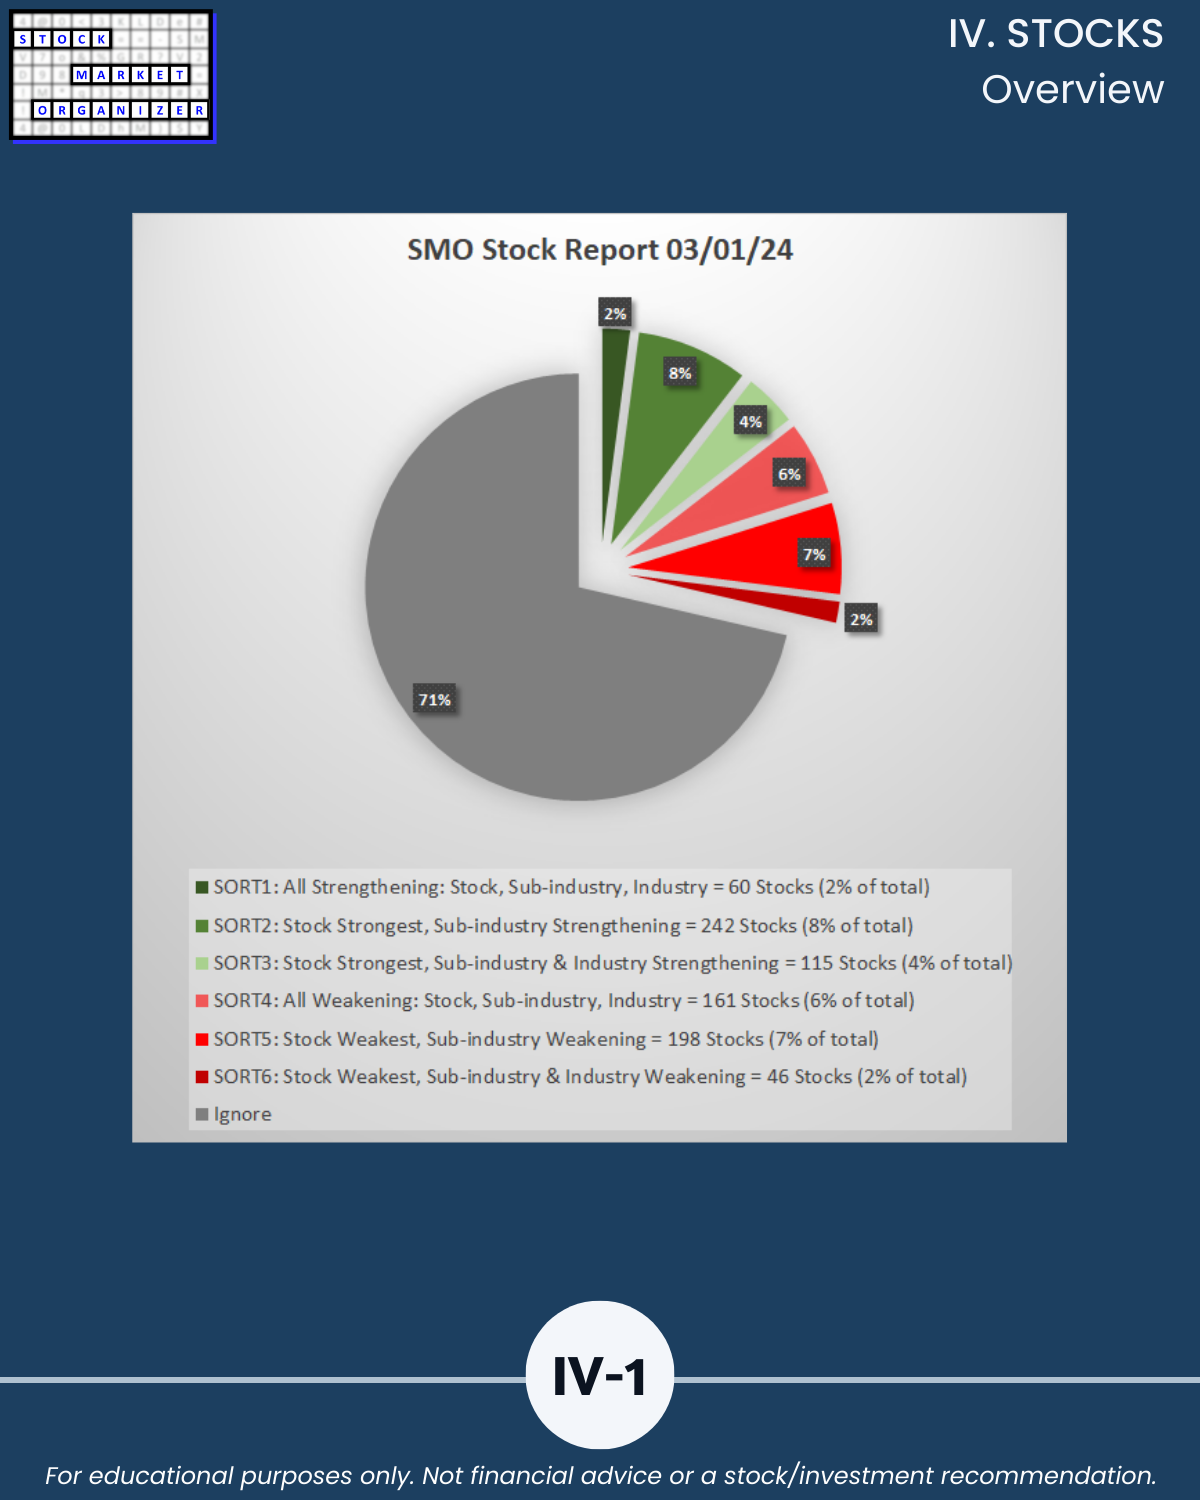
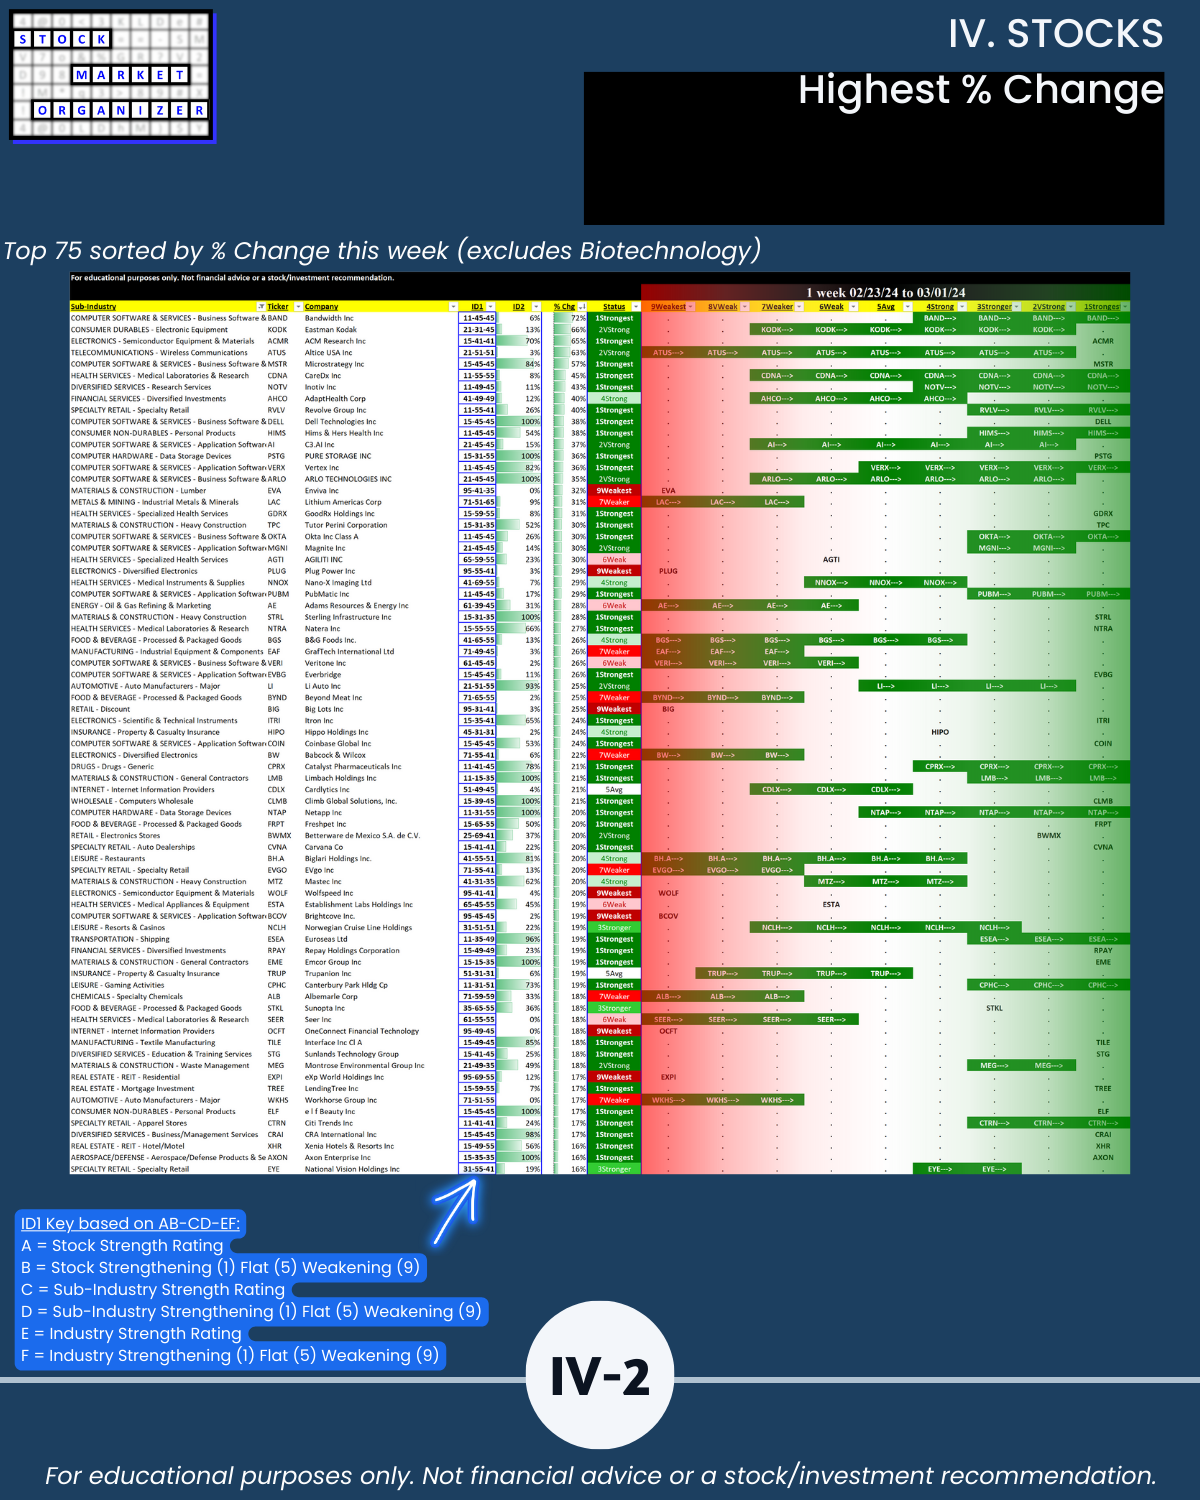
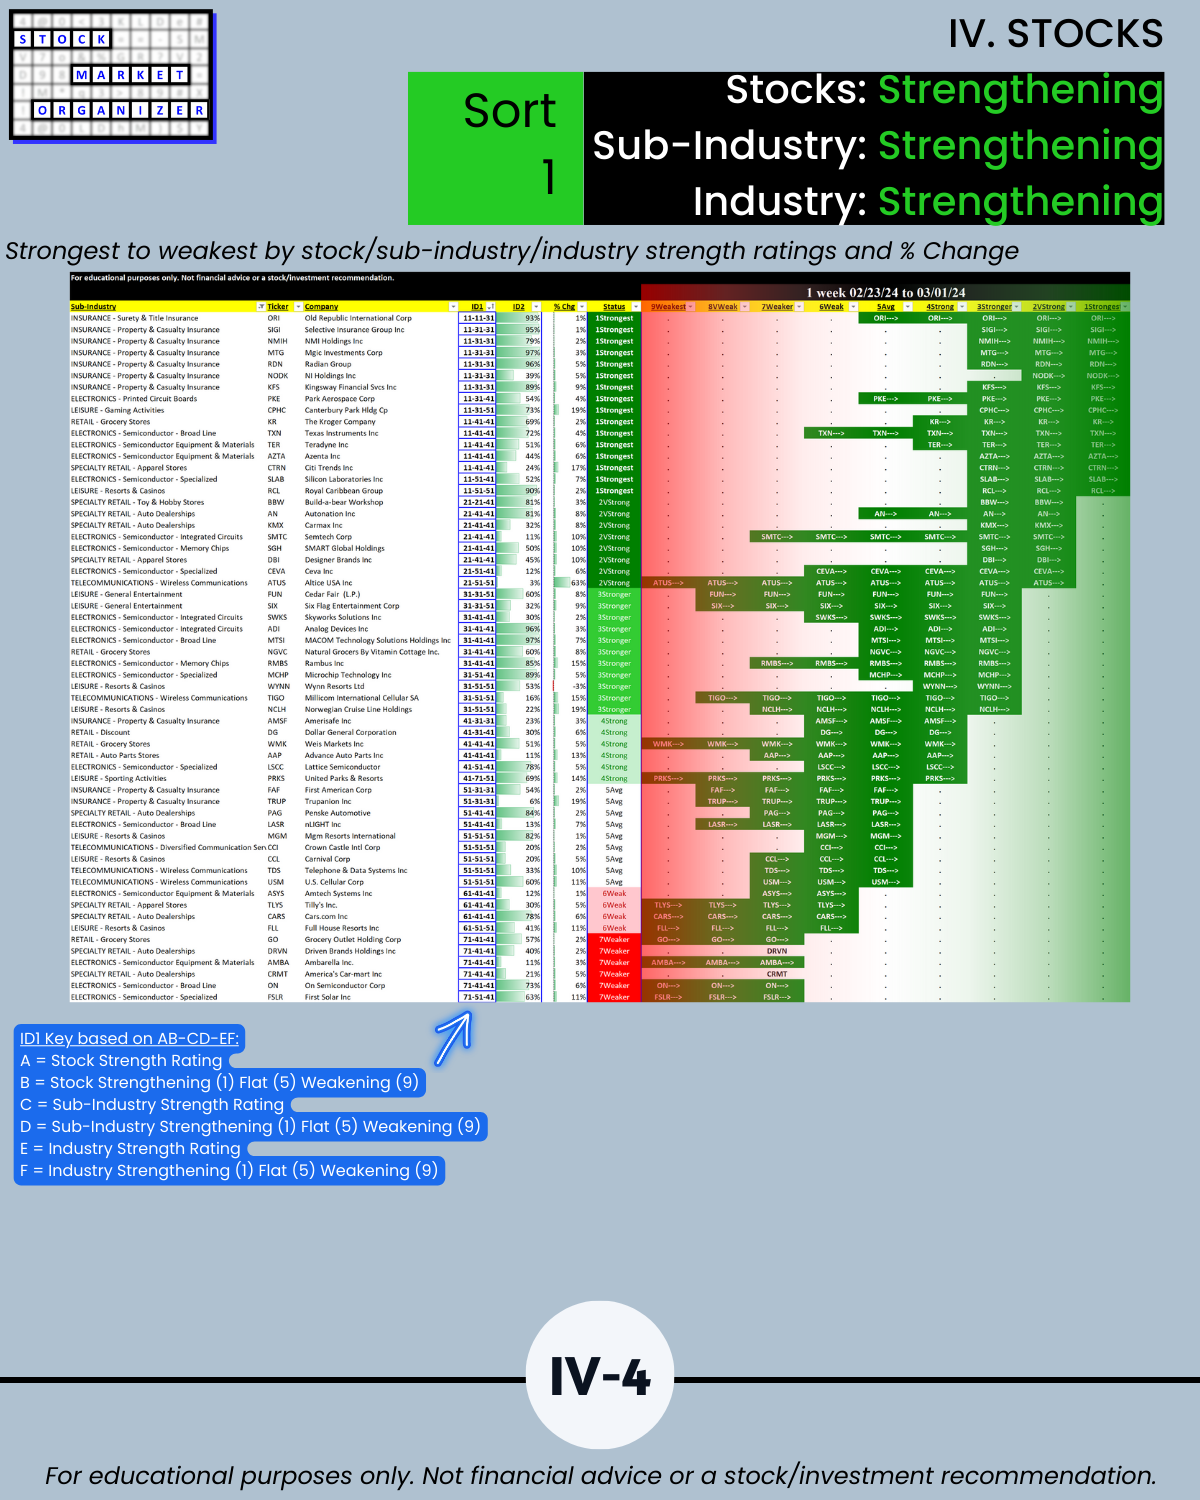
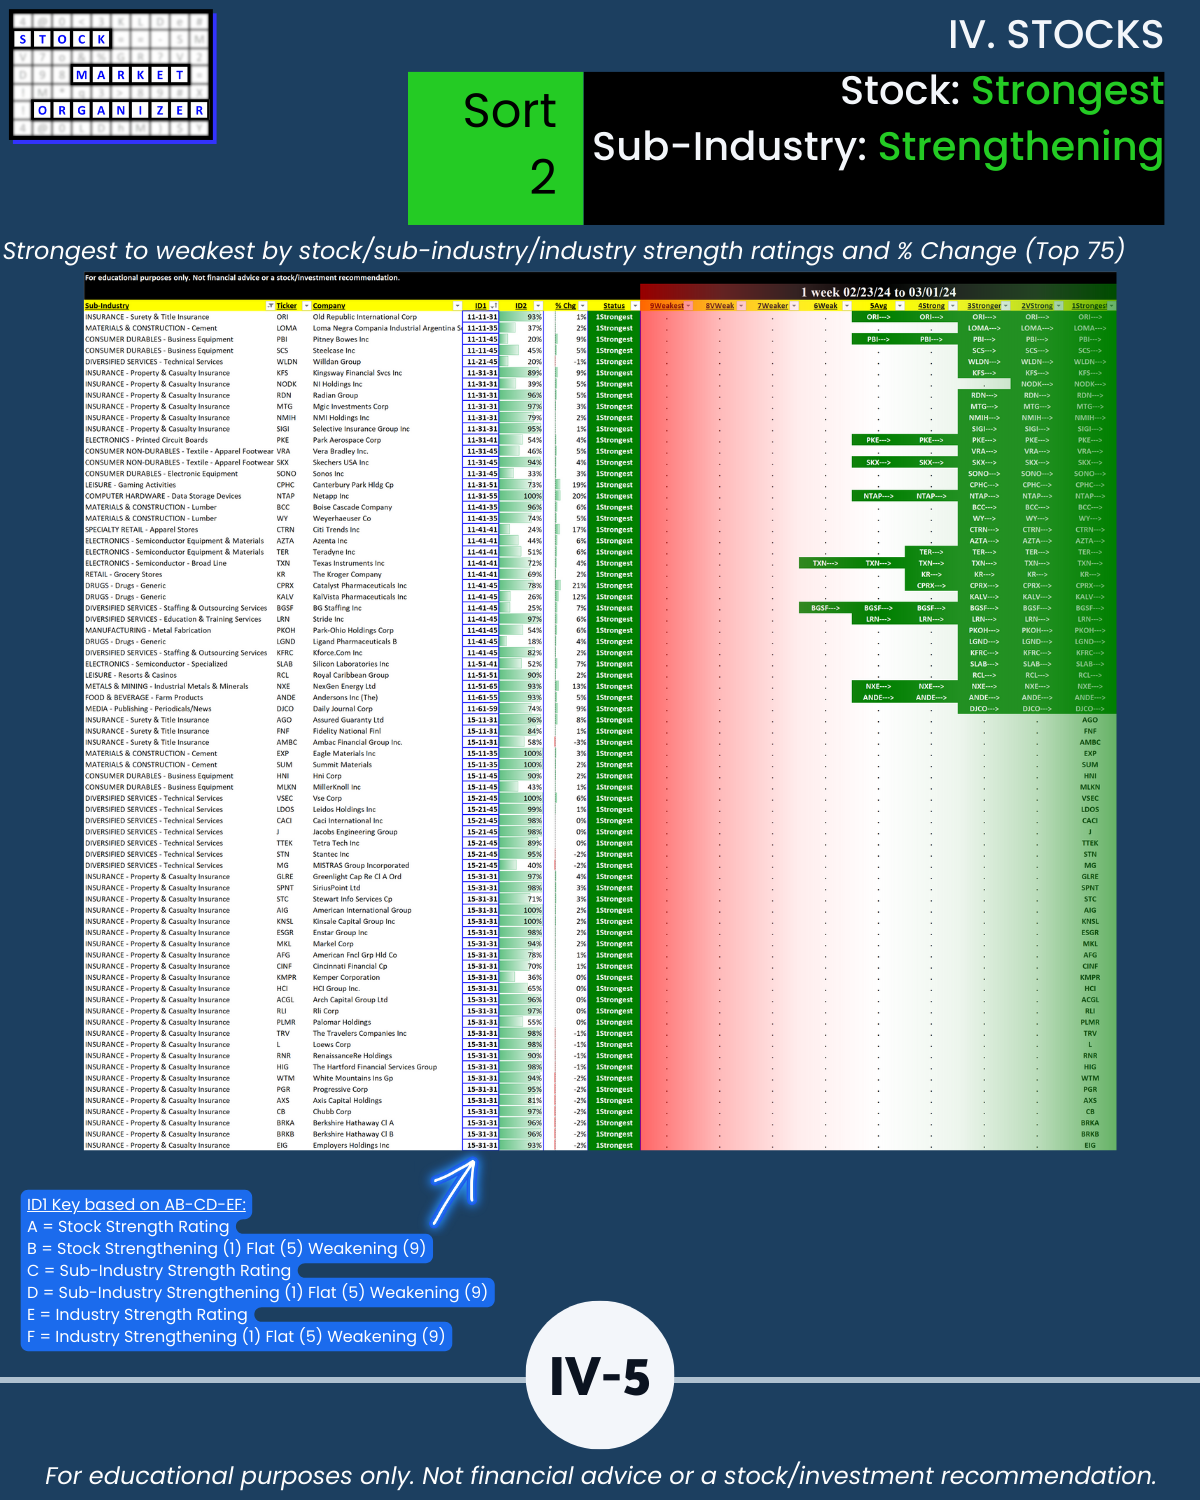
See Section IV for stock ideas (not recommendations) for both trend followers and mean reverters.
HIGHLIGHTS
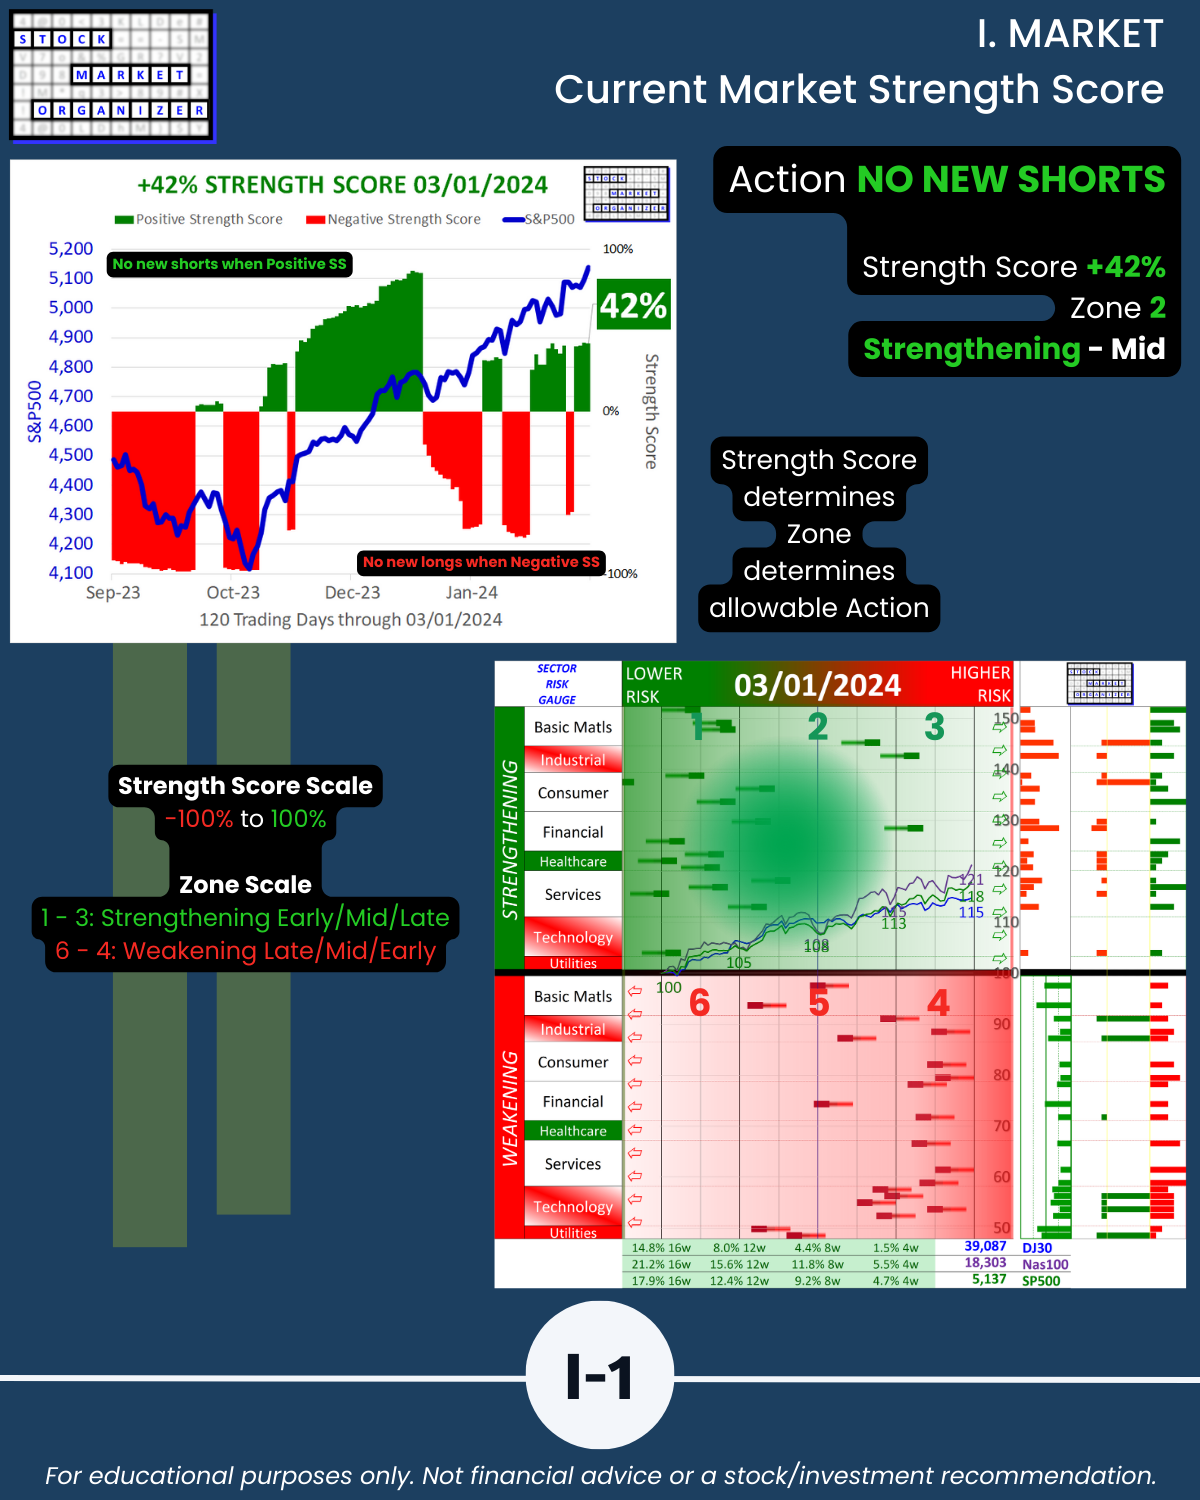
🔹 The +42% market strength score = mid-“No New Shorts” territory
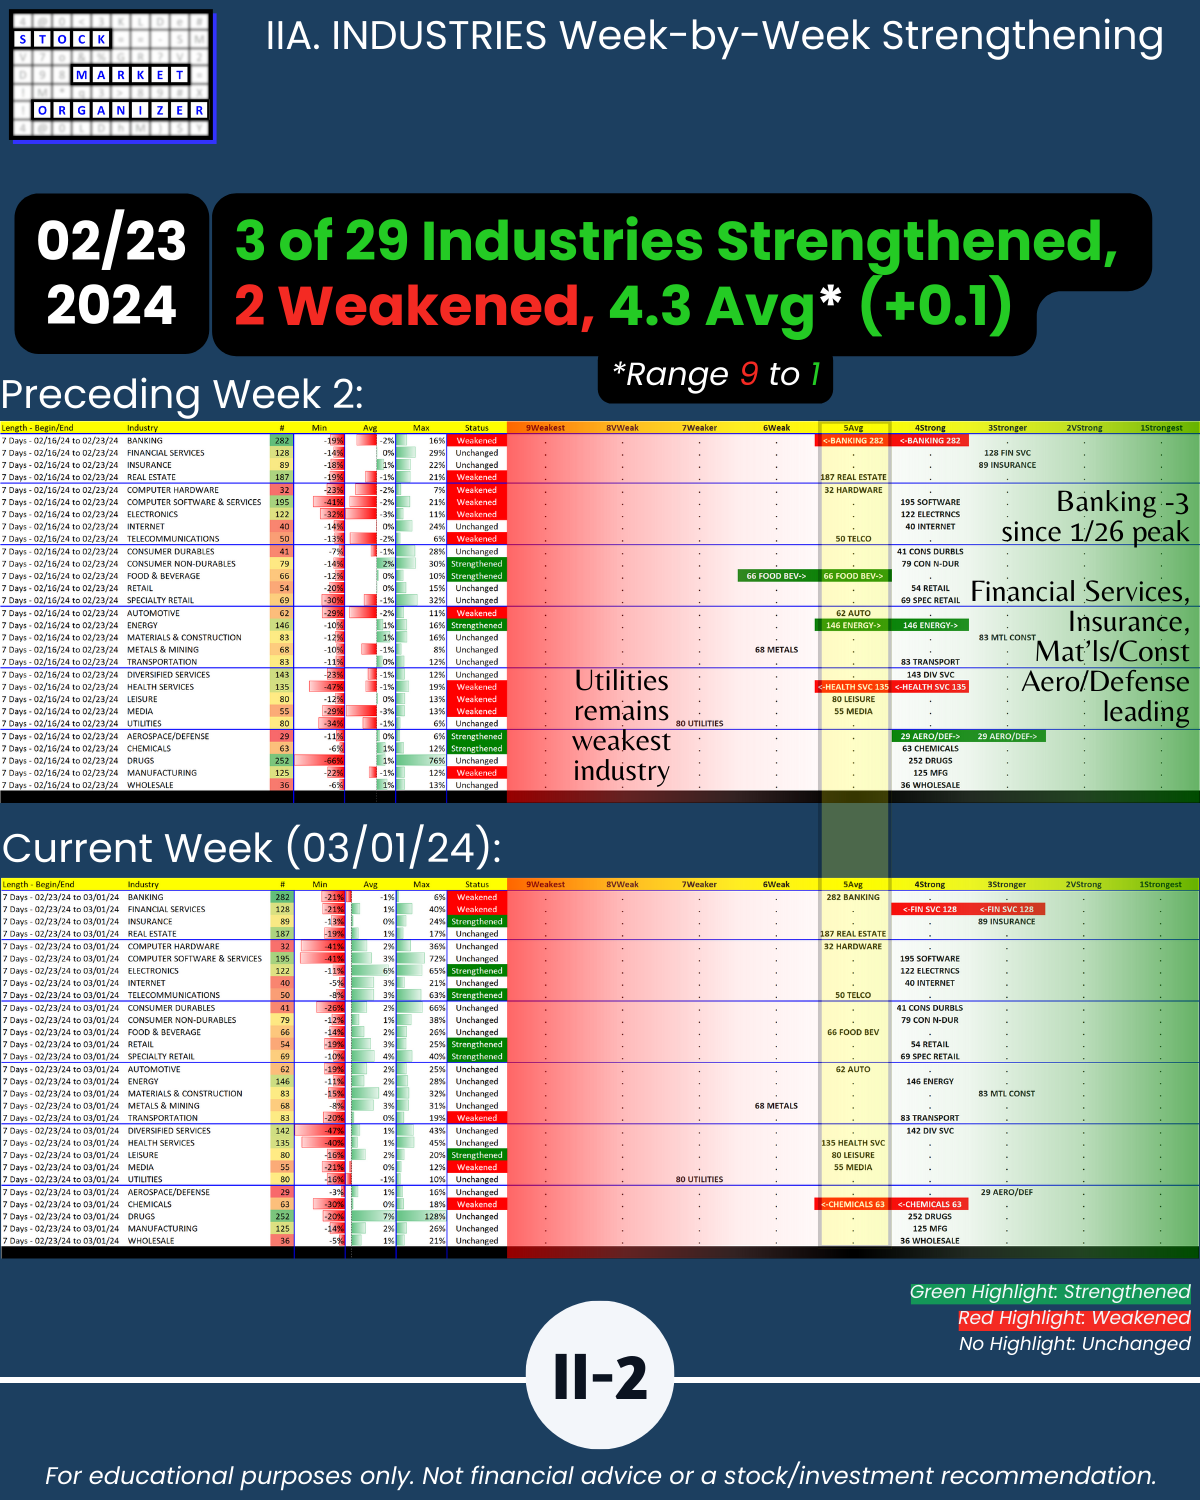
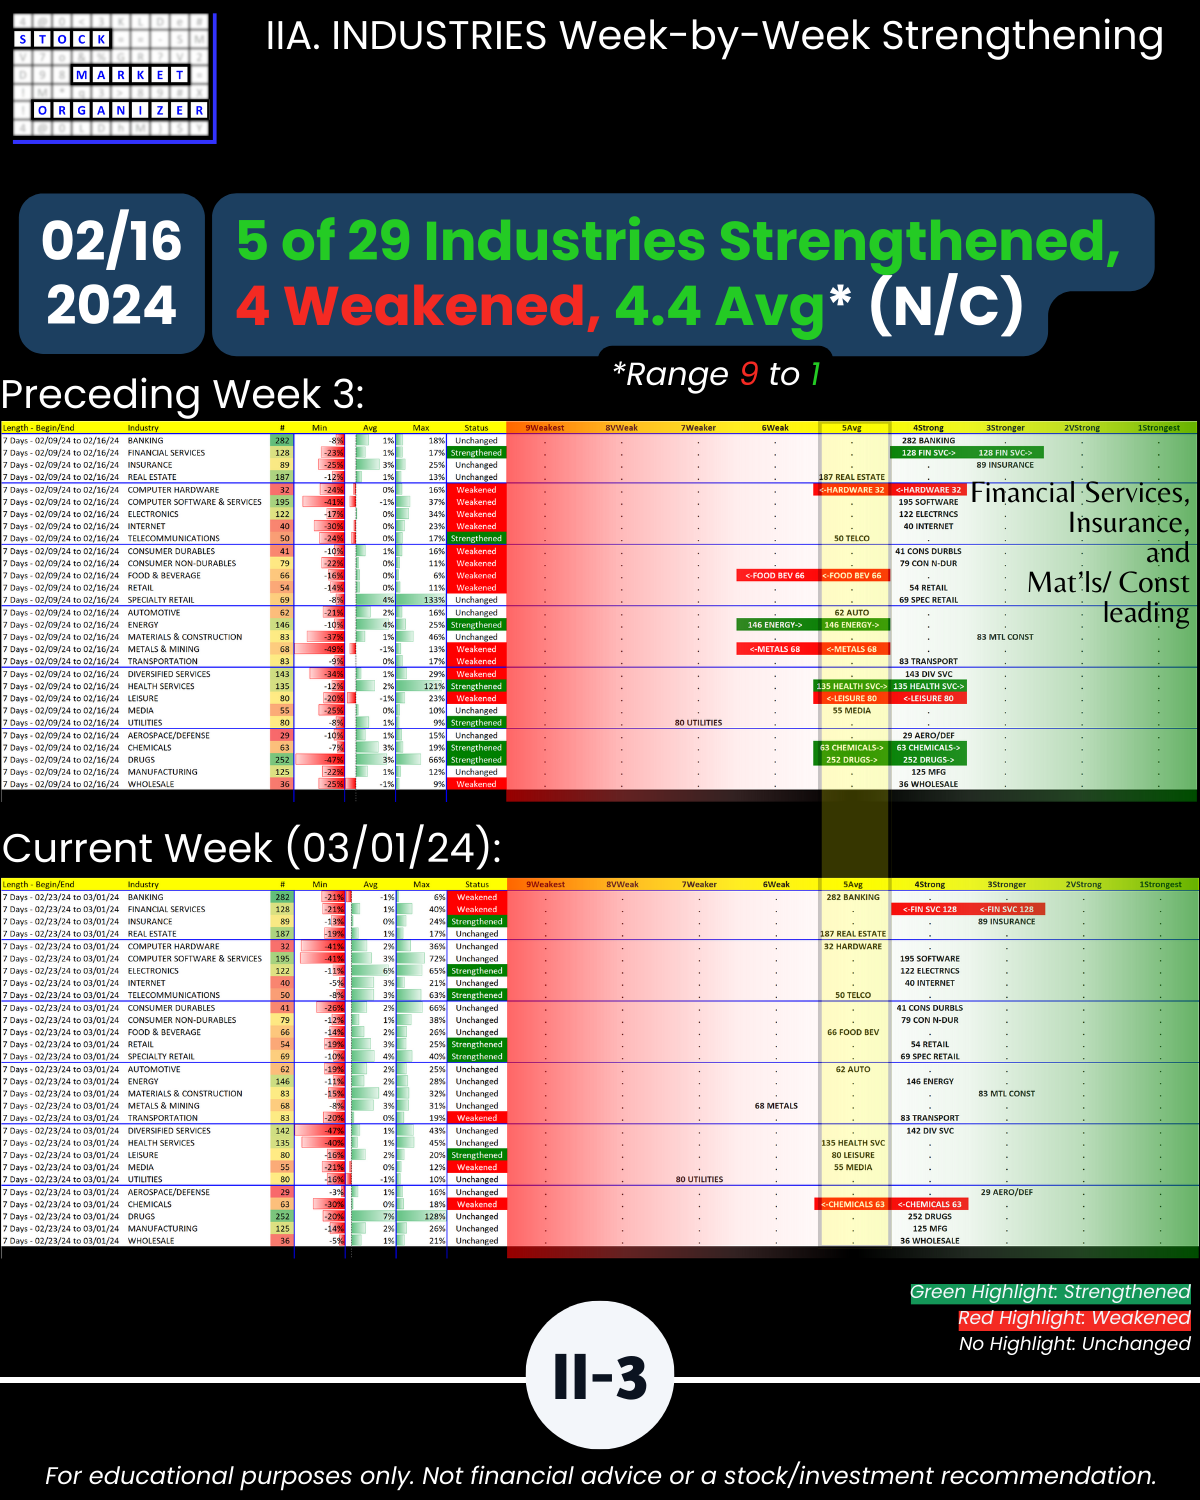
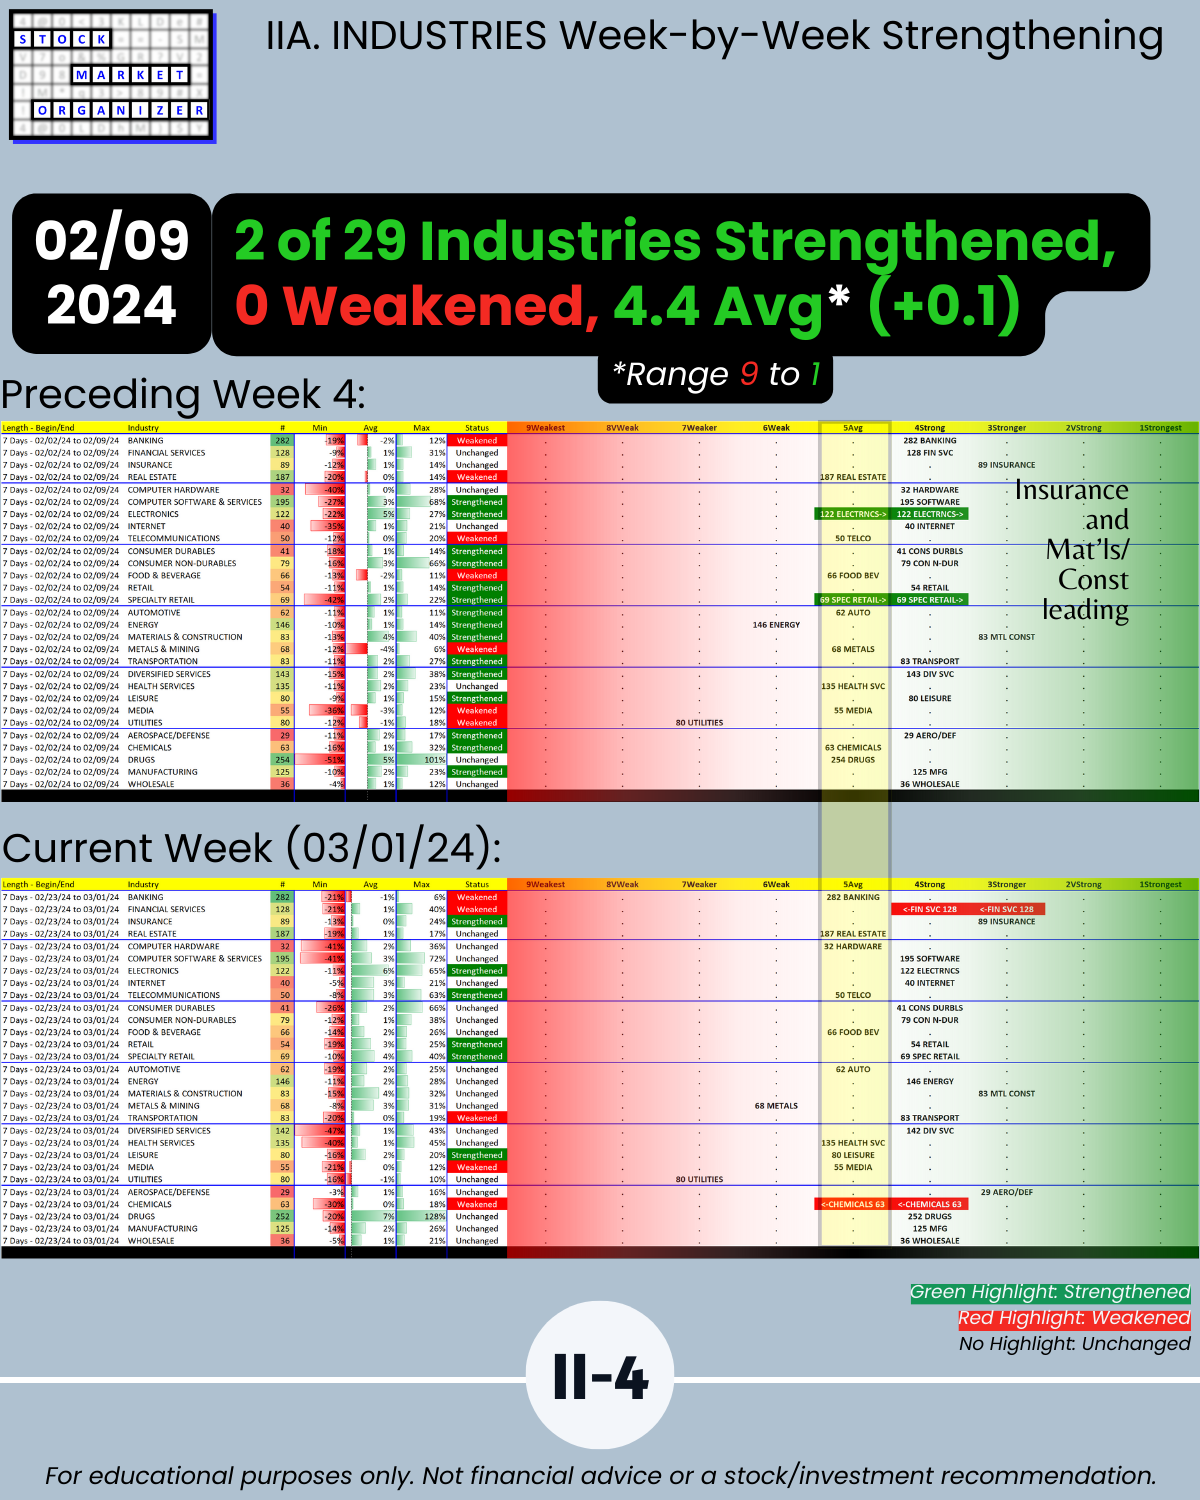
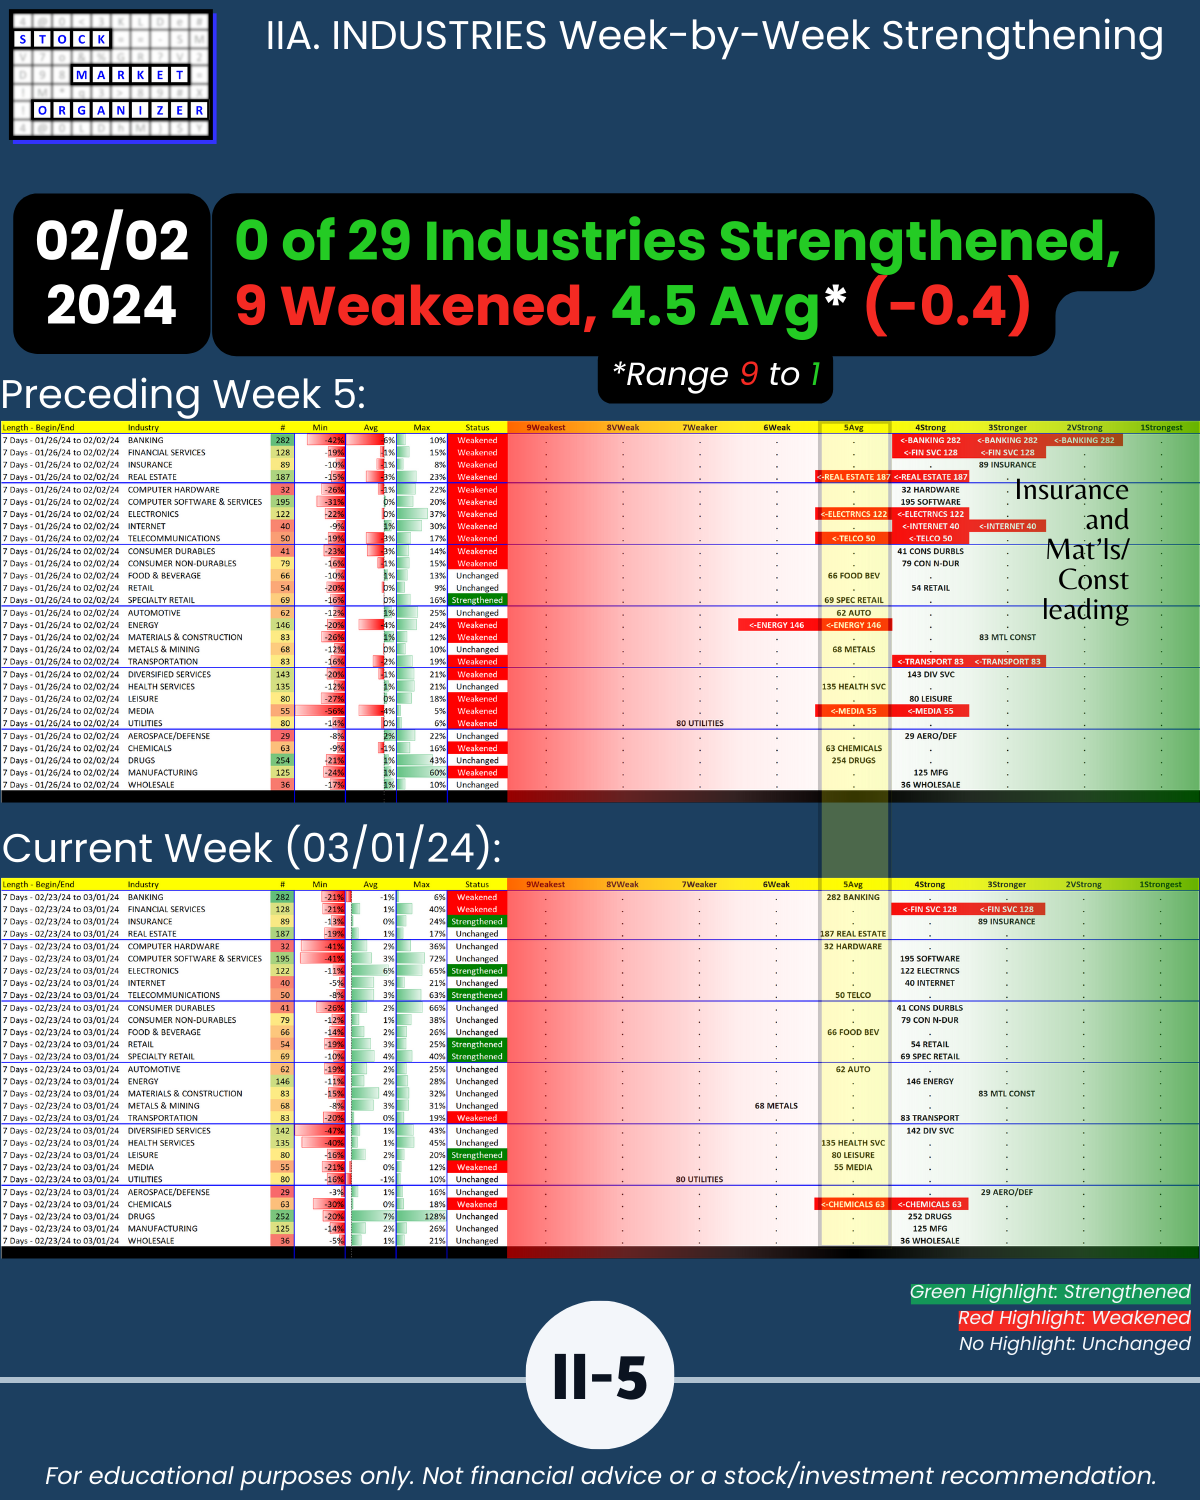
🔹 Average Industry Strength Score = 4.4 (1 = strongest 9 = weakest, -0.1 = weakened vs. previous week)
🔹 0 of 29 industries strengthened, 2 weakened (3/2 previous week)
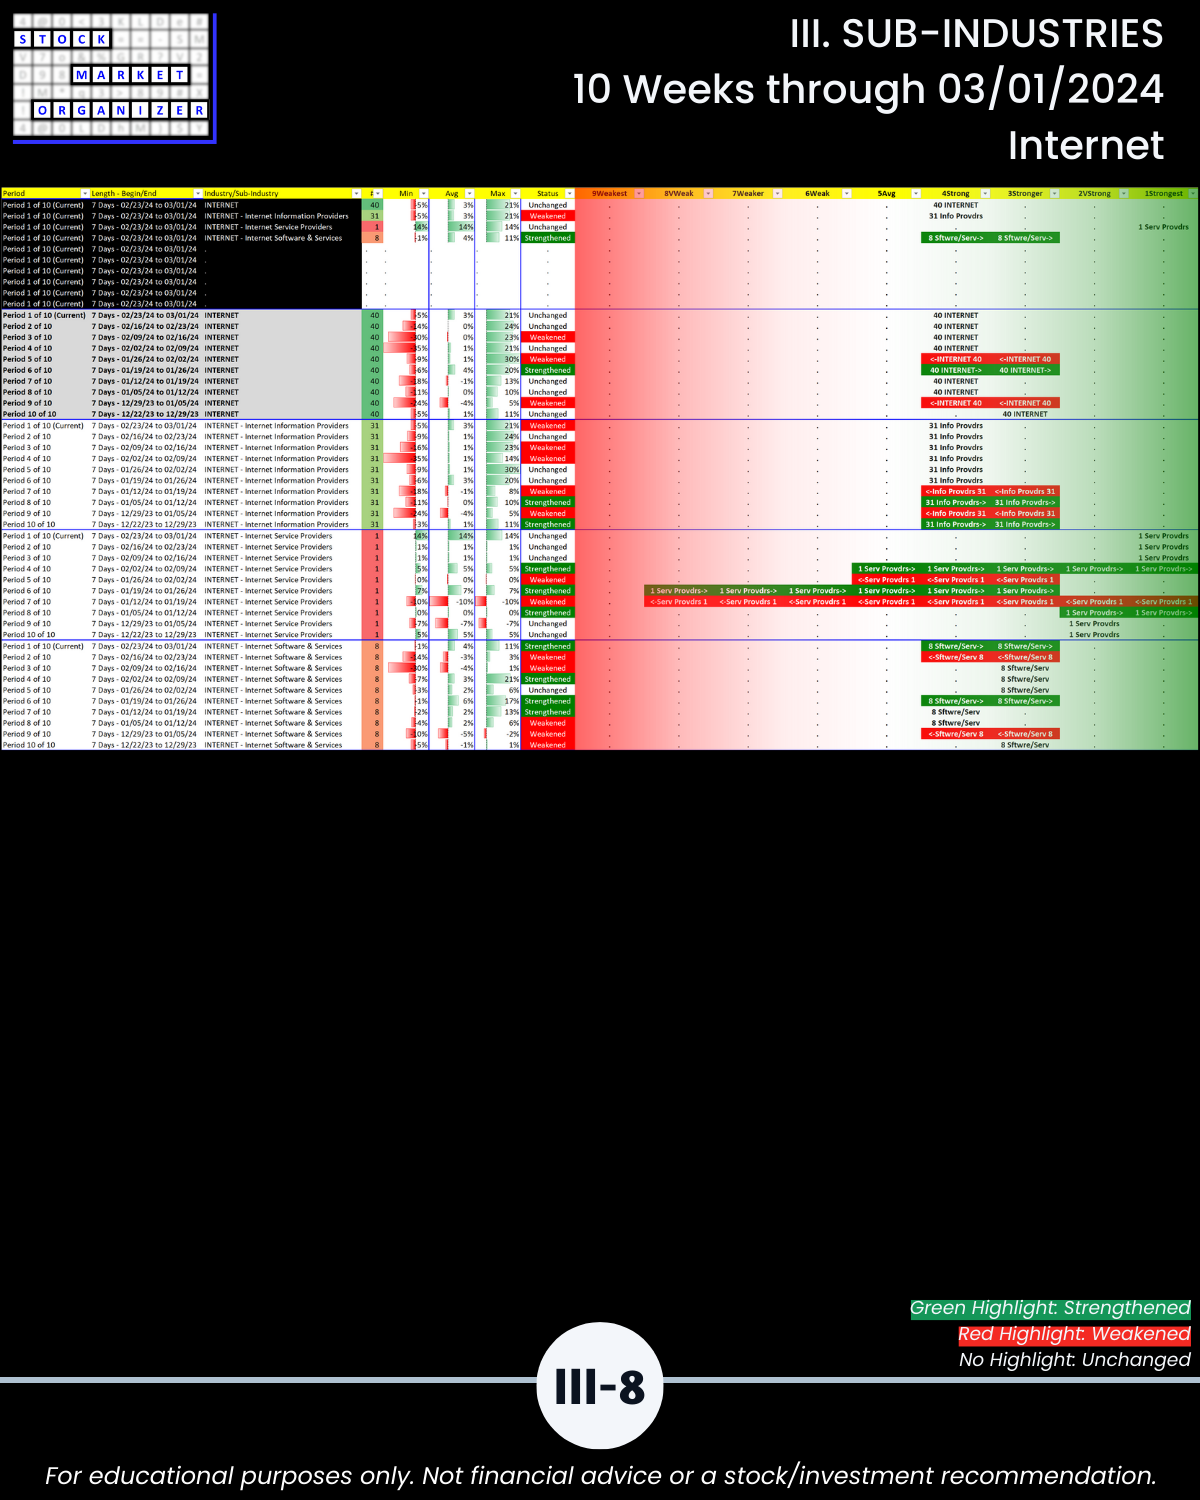
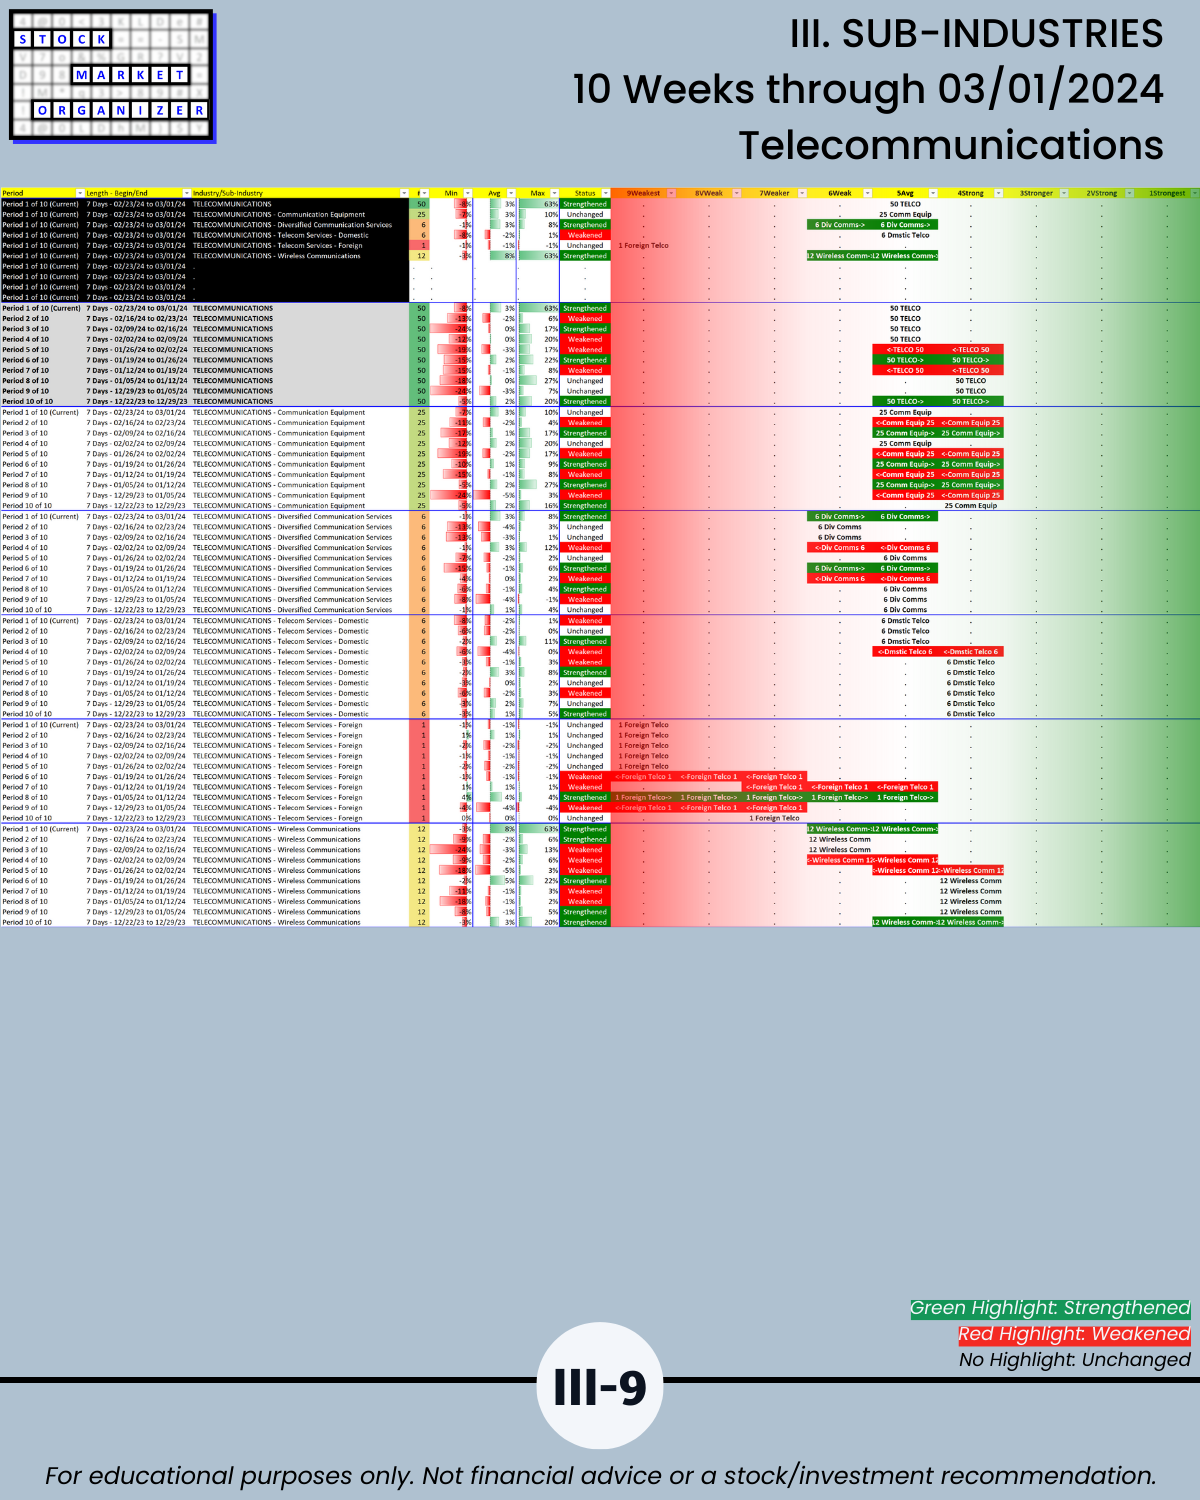
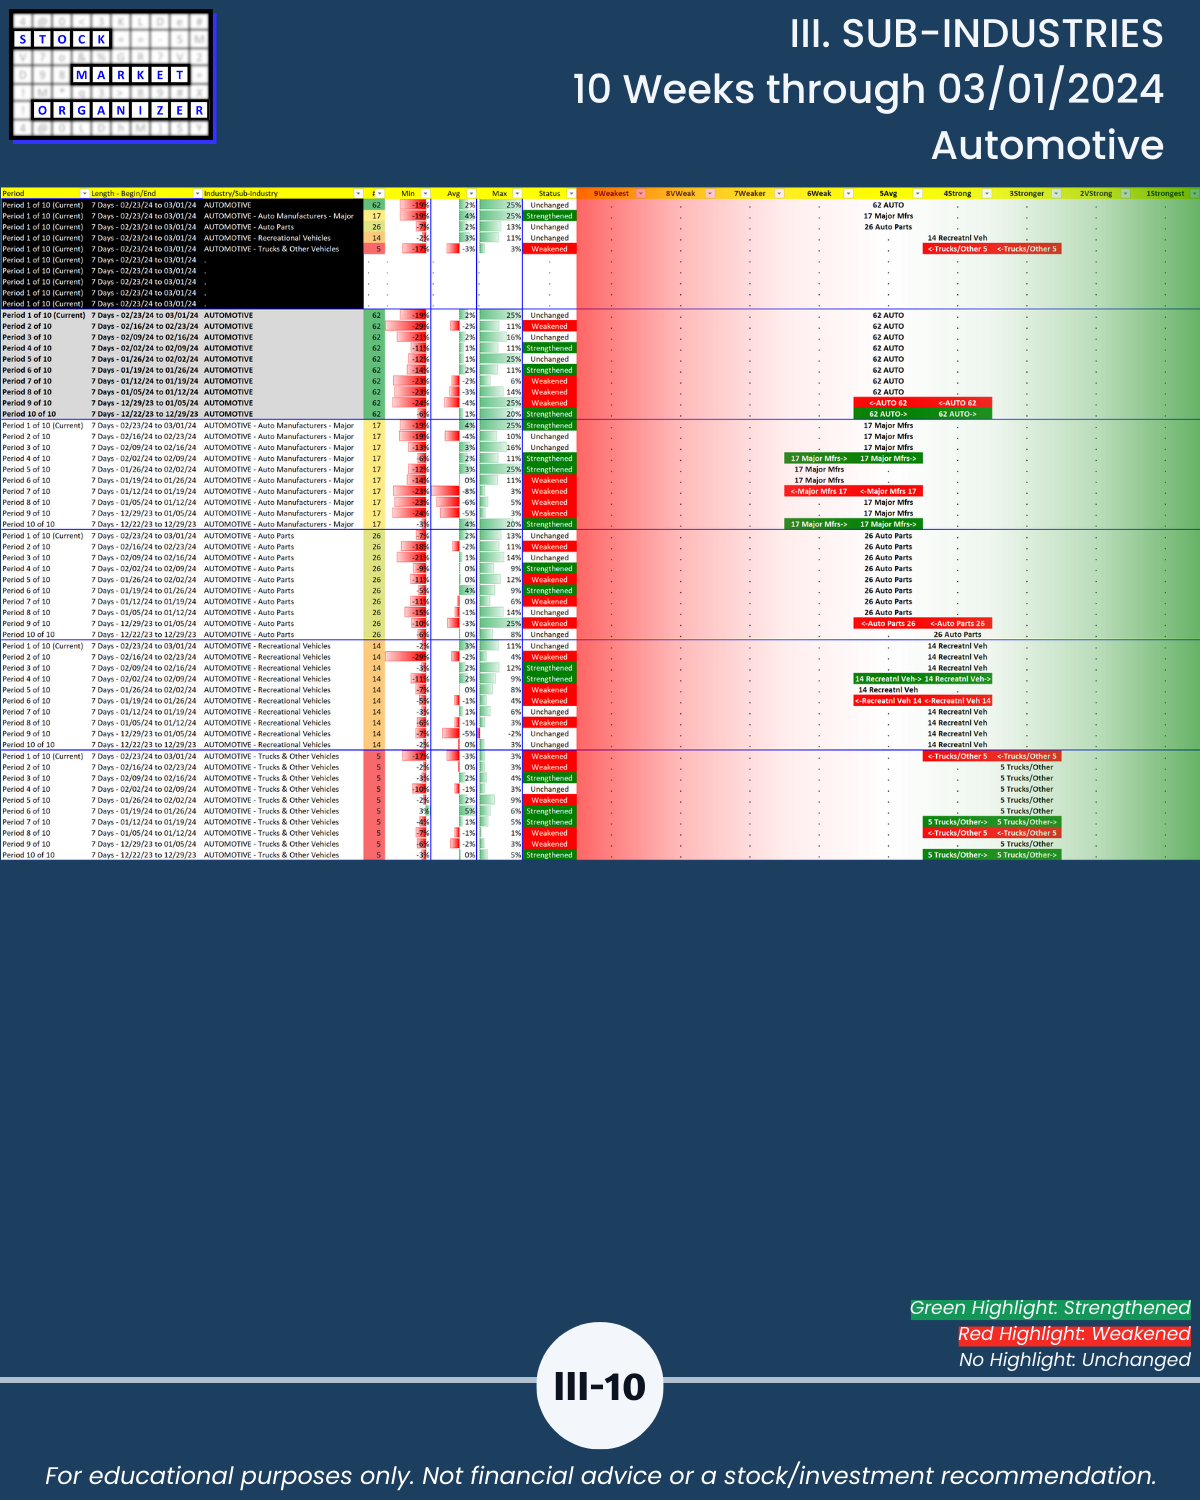
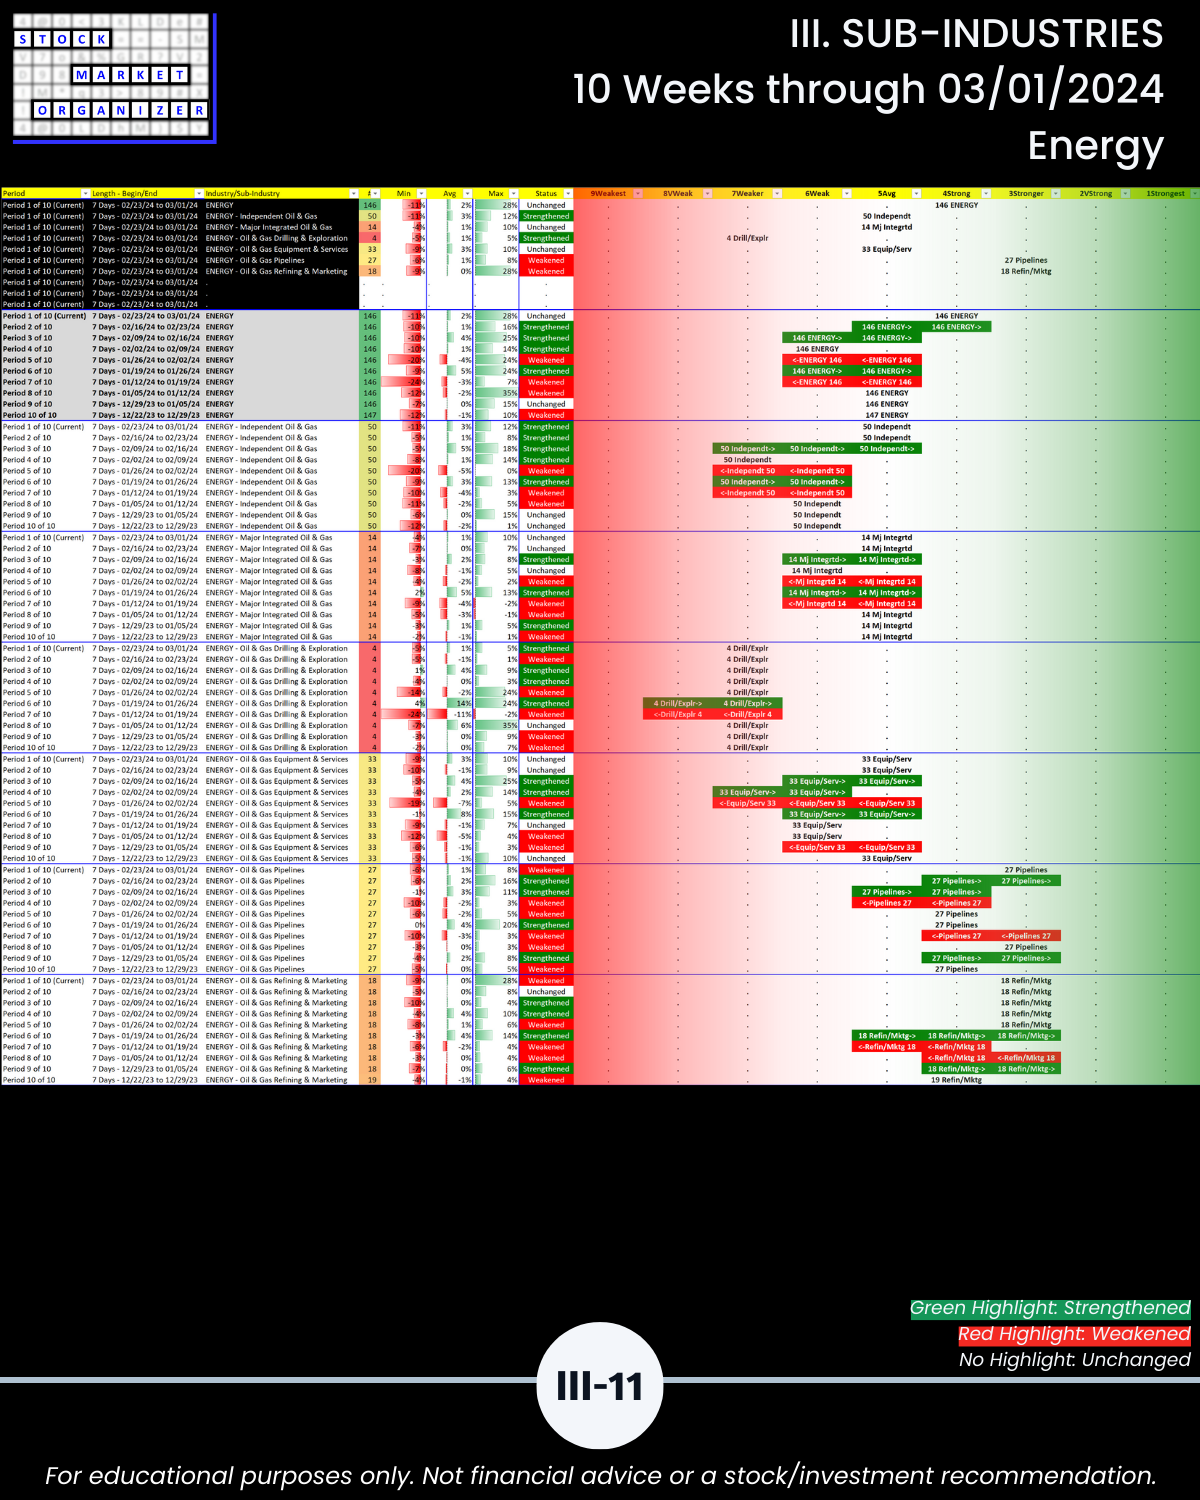
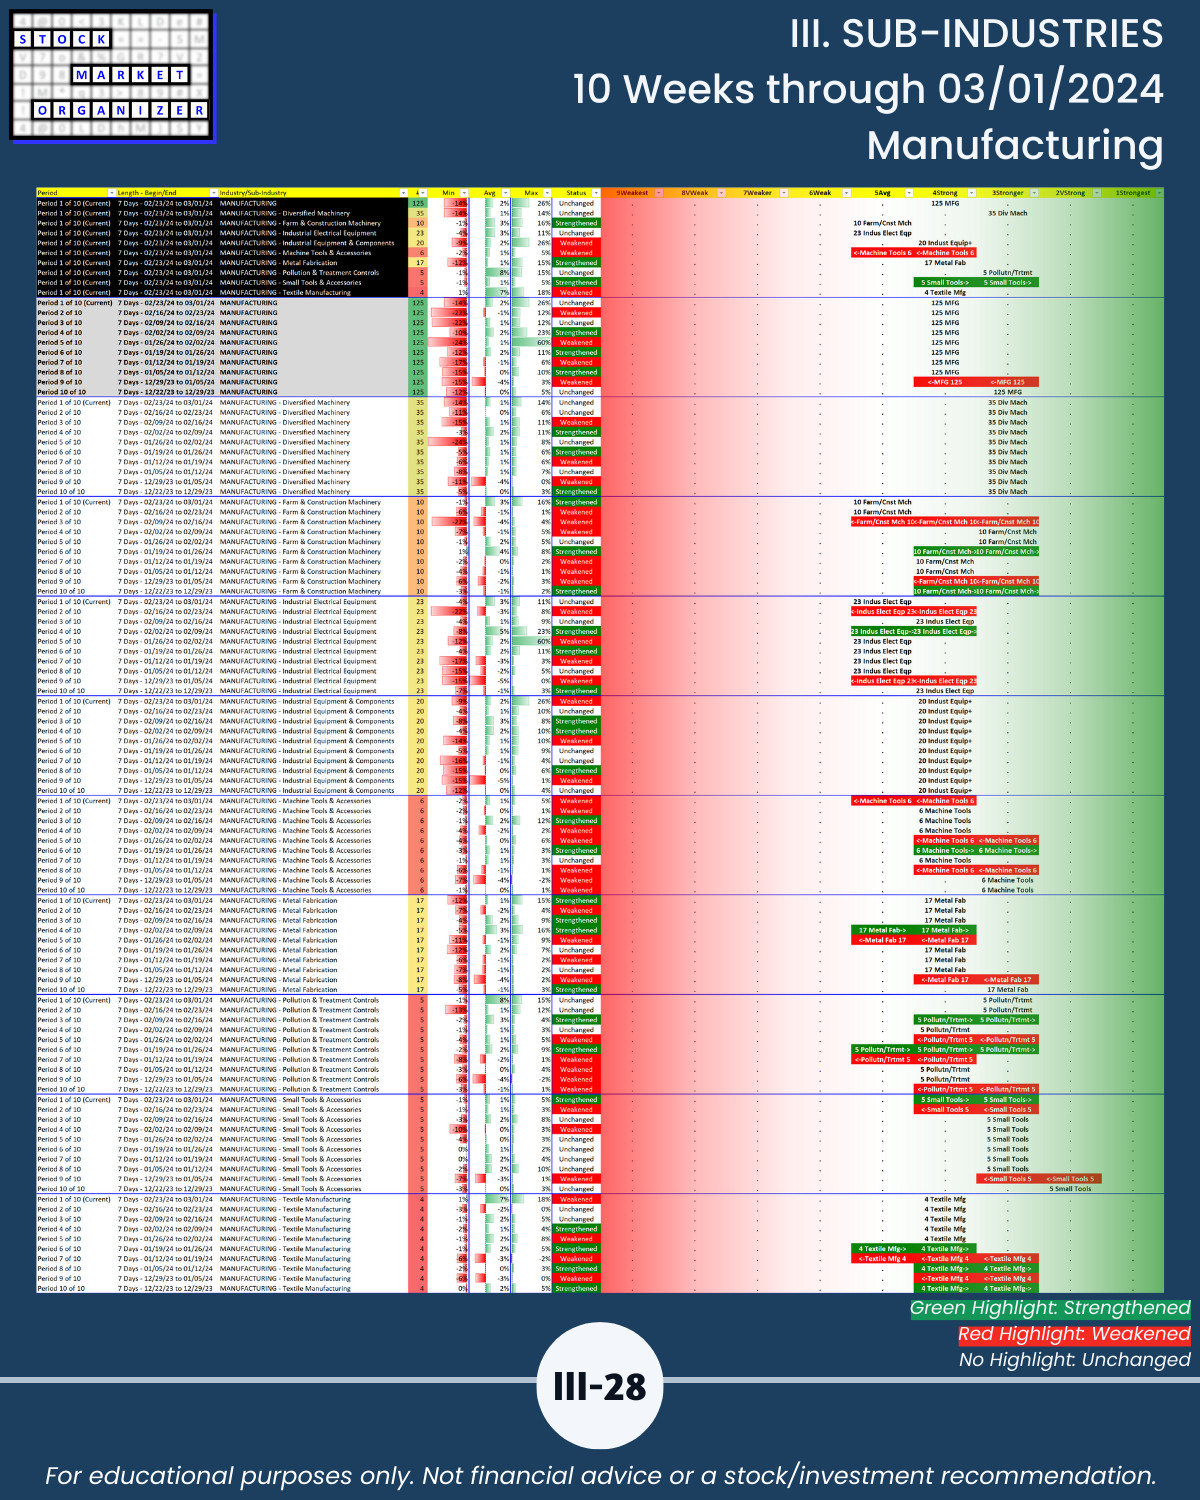
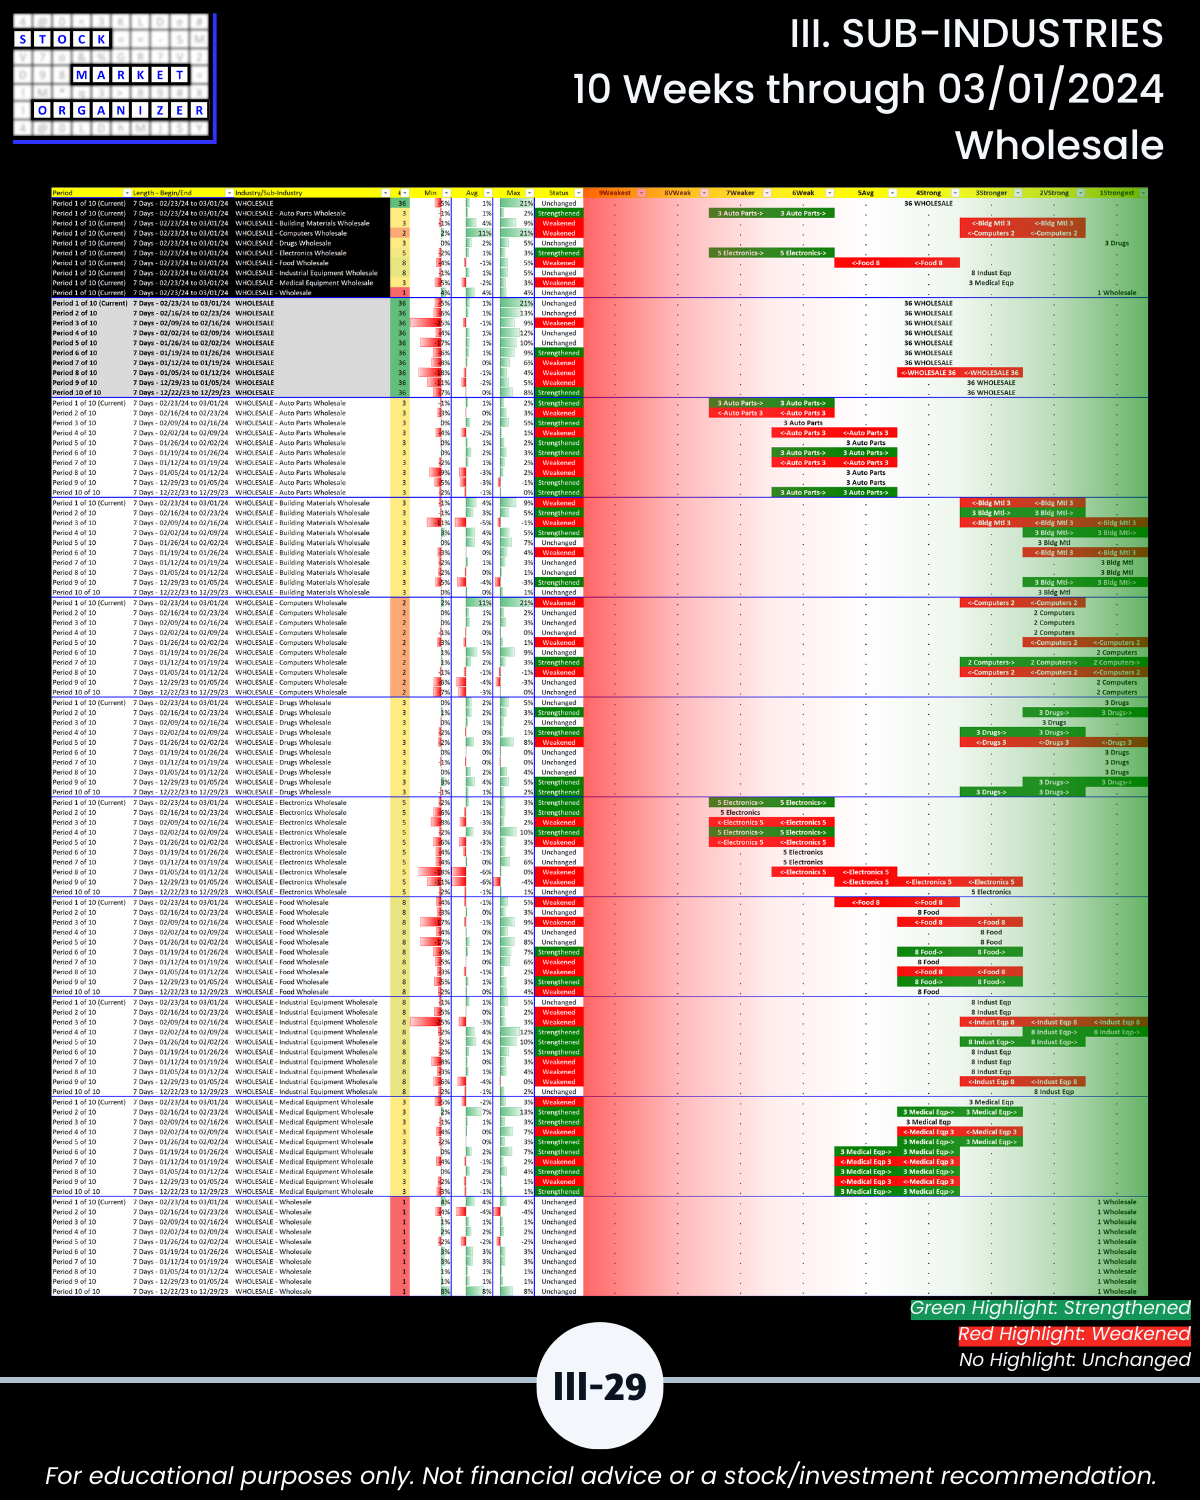
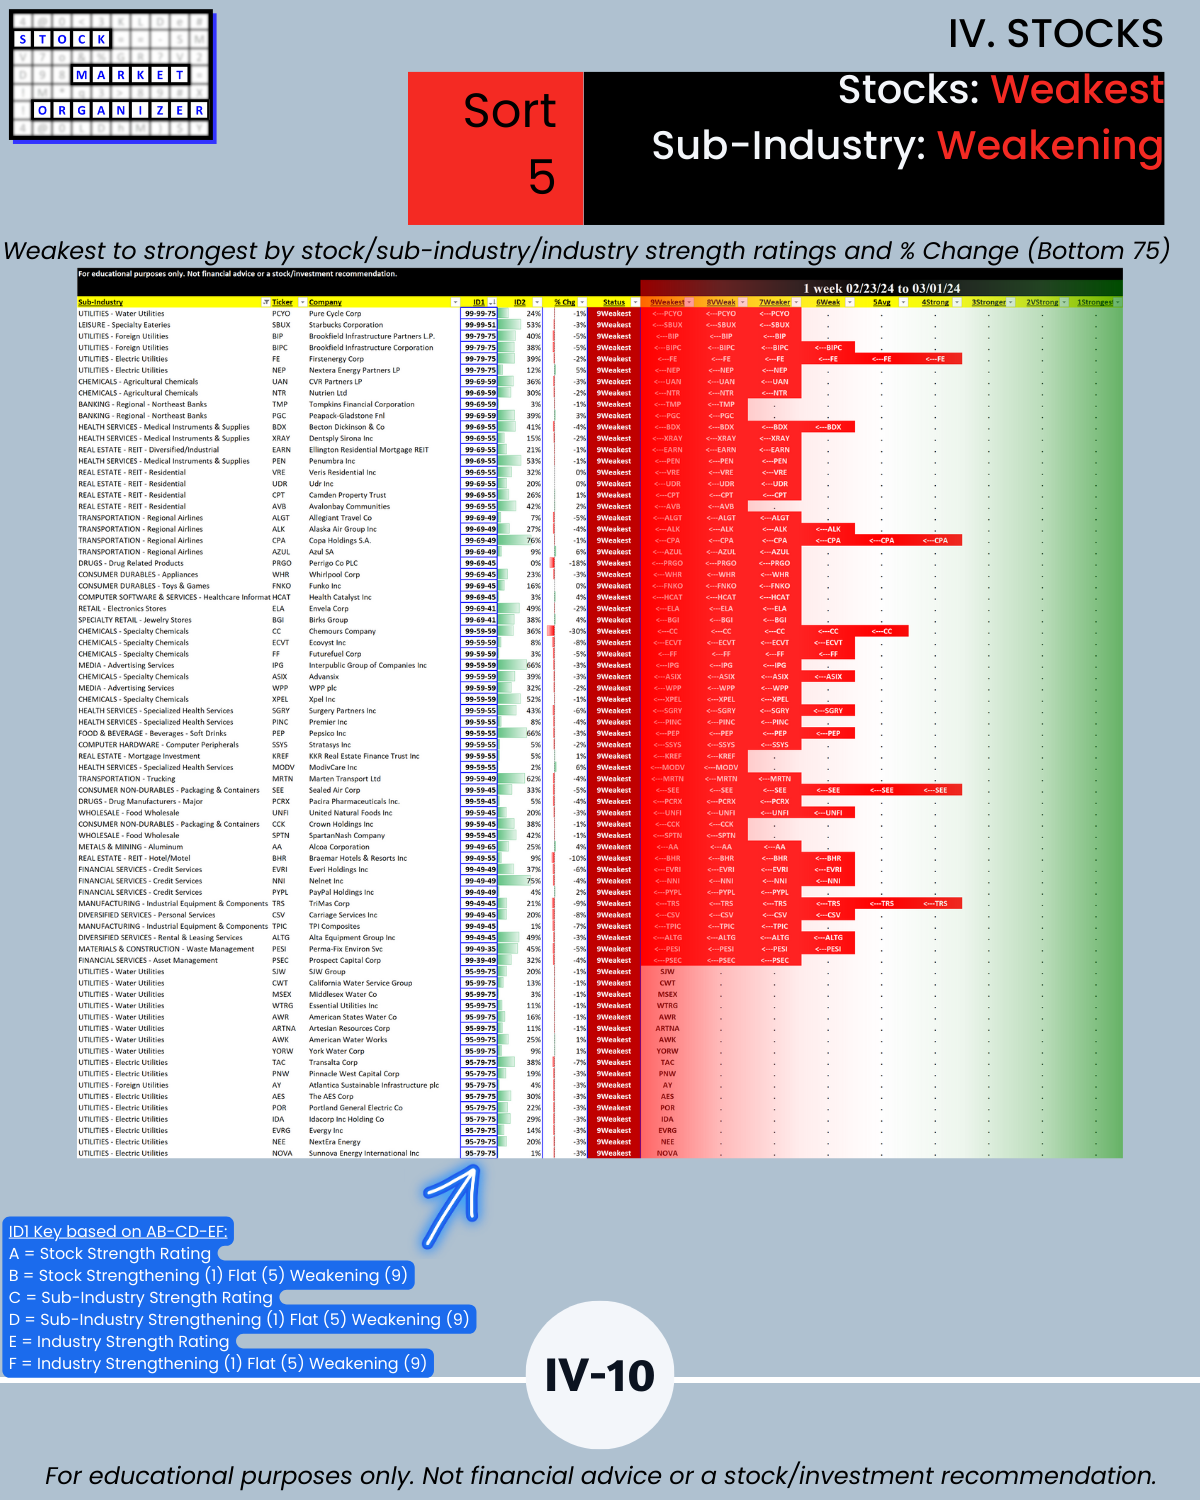
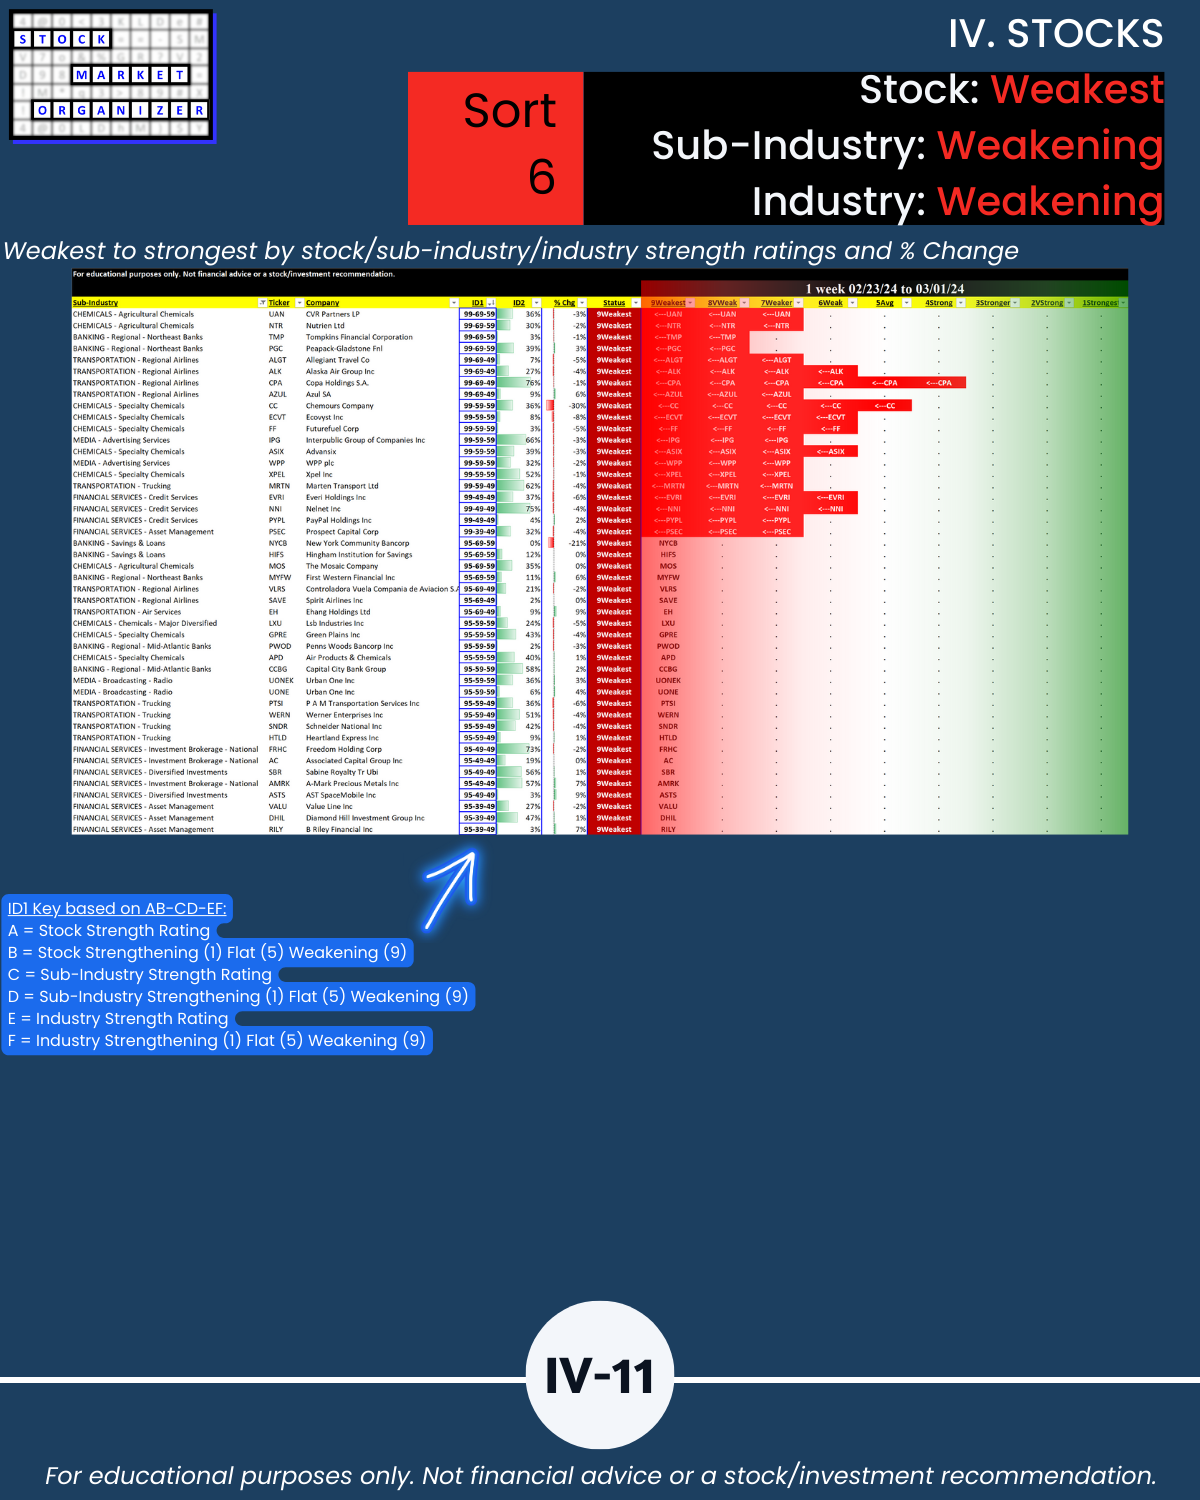
🔹 28% vs. 40% sub-industries Strengthening vs. Weakening (vs. 29%/40% previous week, 199 Sub-industries)
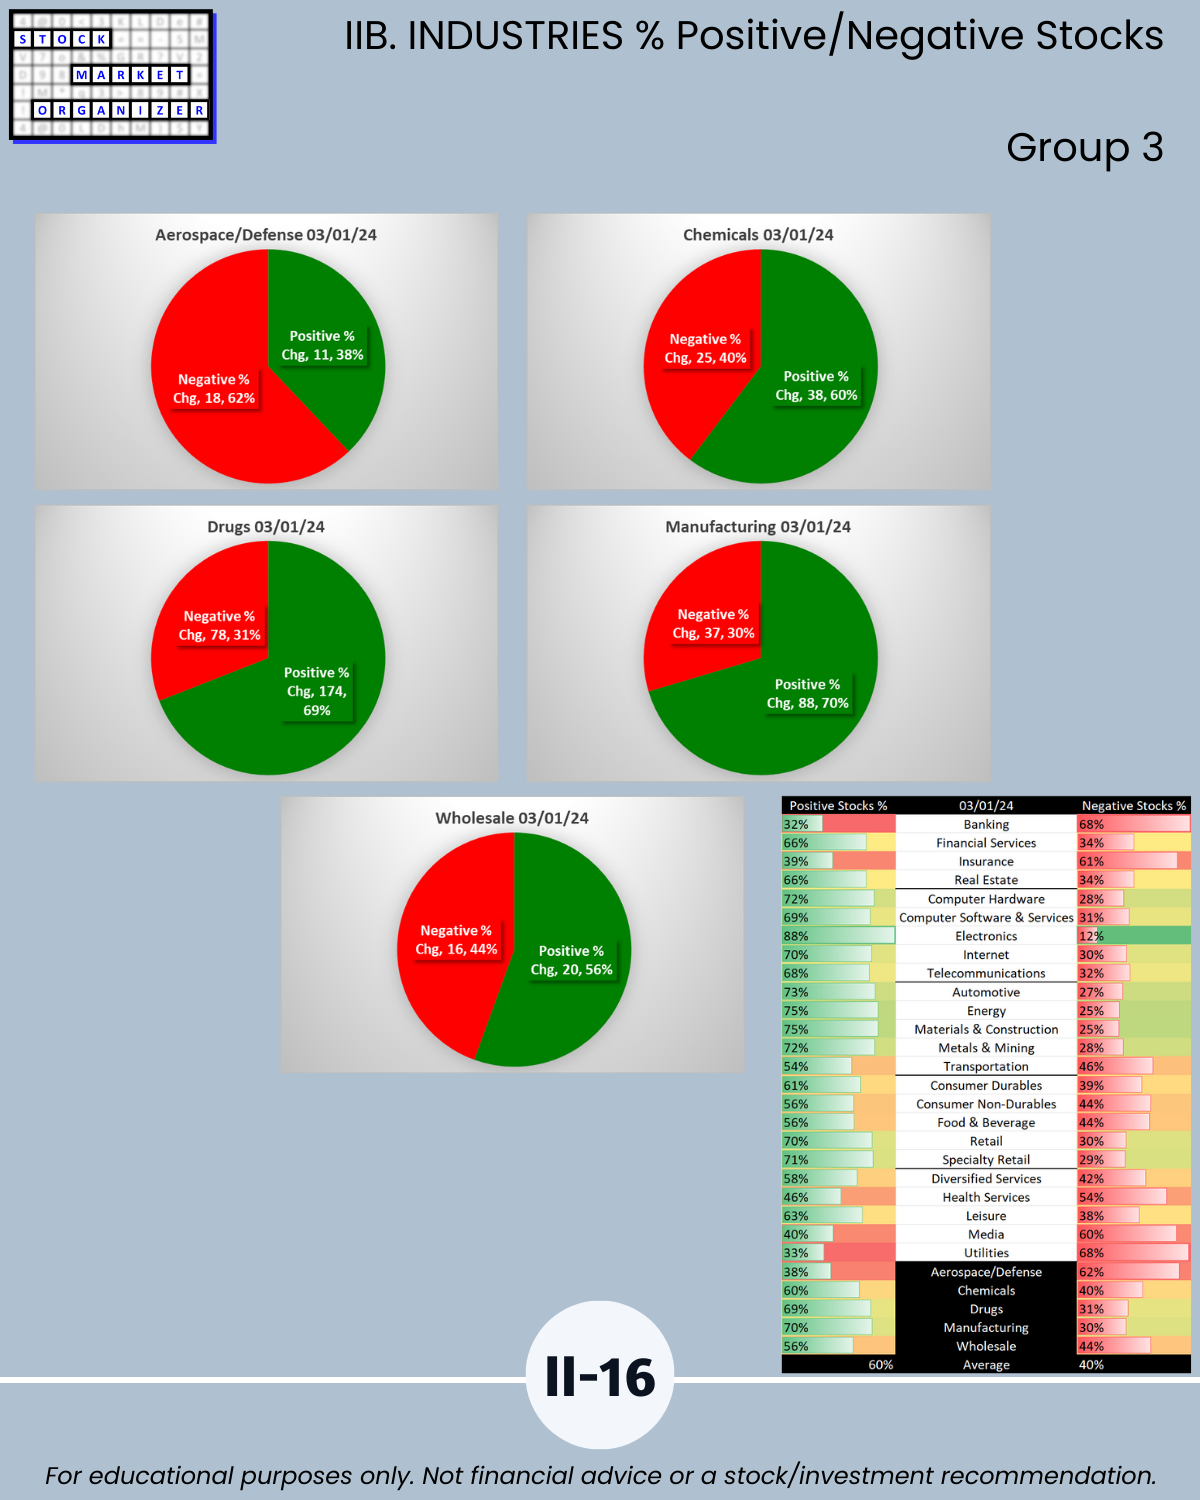
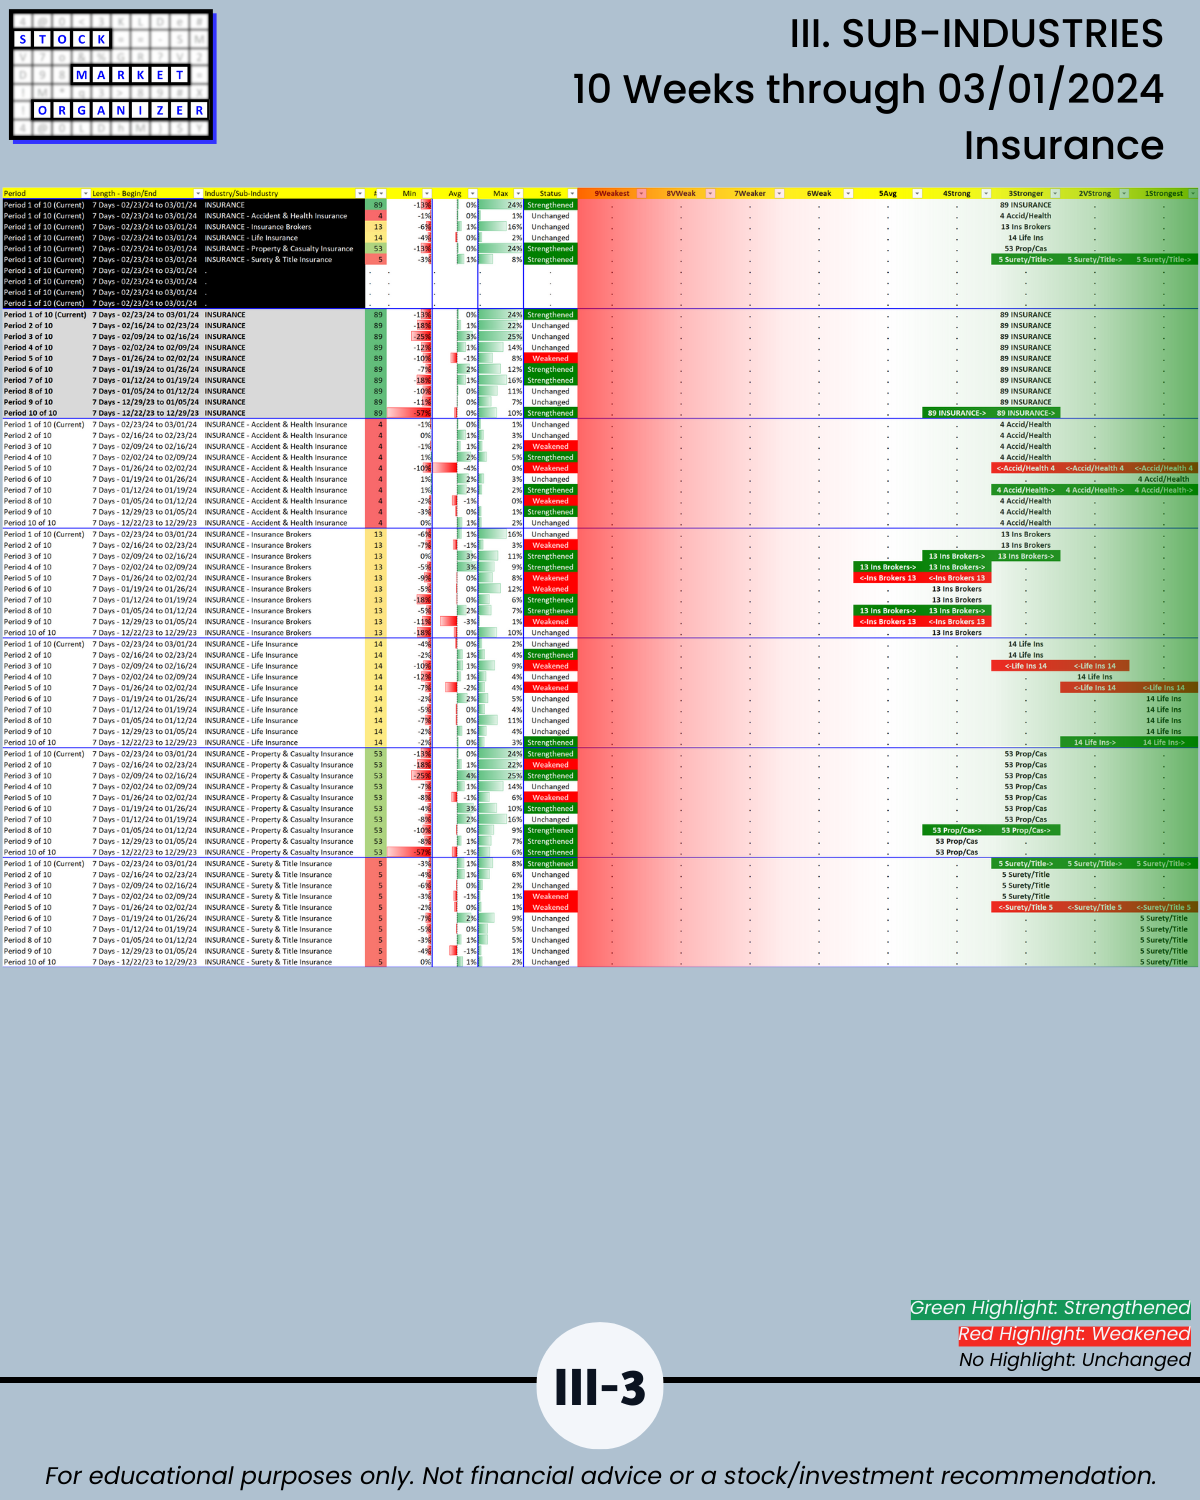
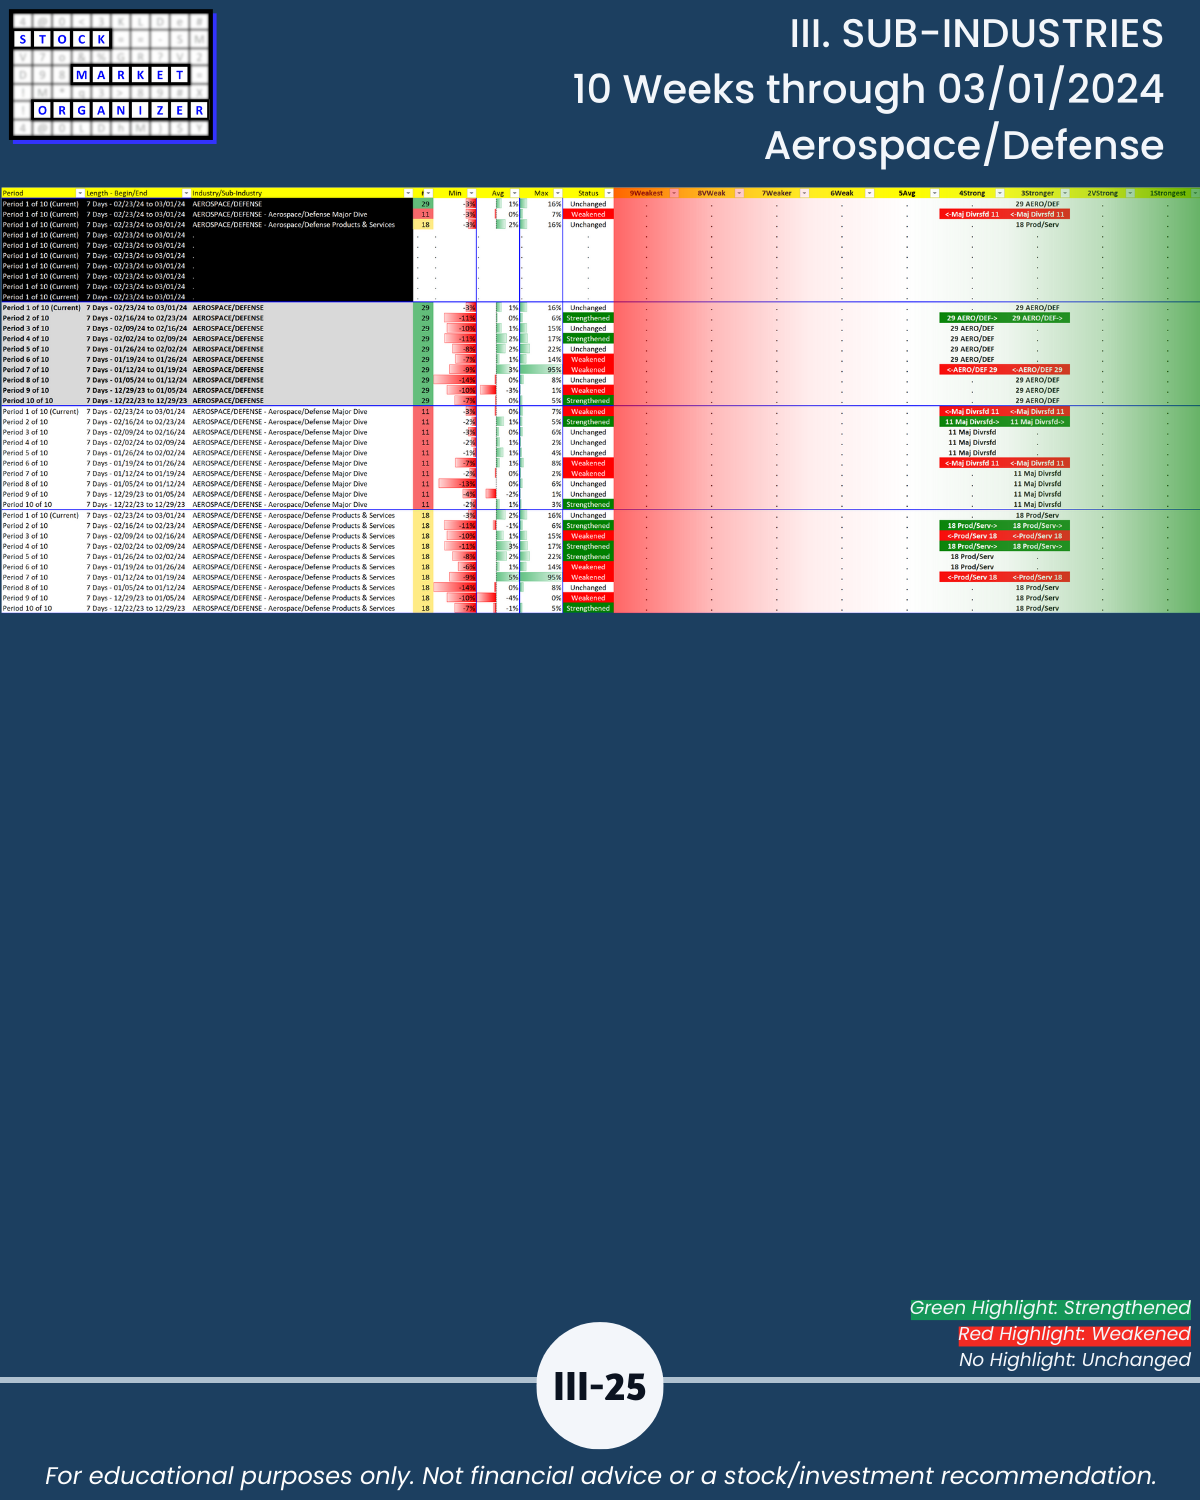
🔹 Insurance, Materials & Construction, and Aerospace Defense = strongest industries at Stronger (3rd strongest of 9 levels)
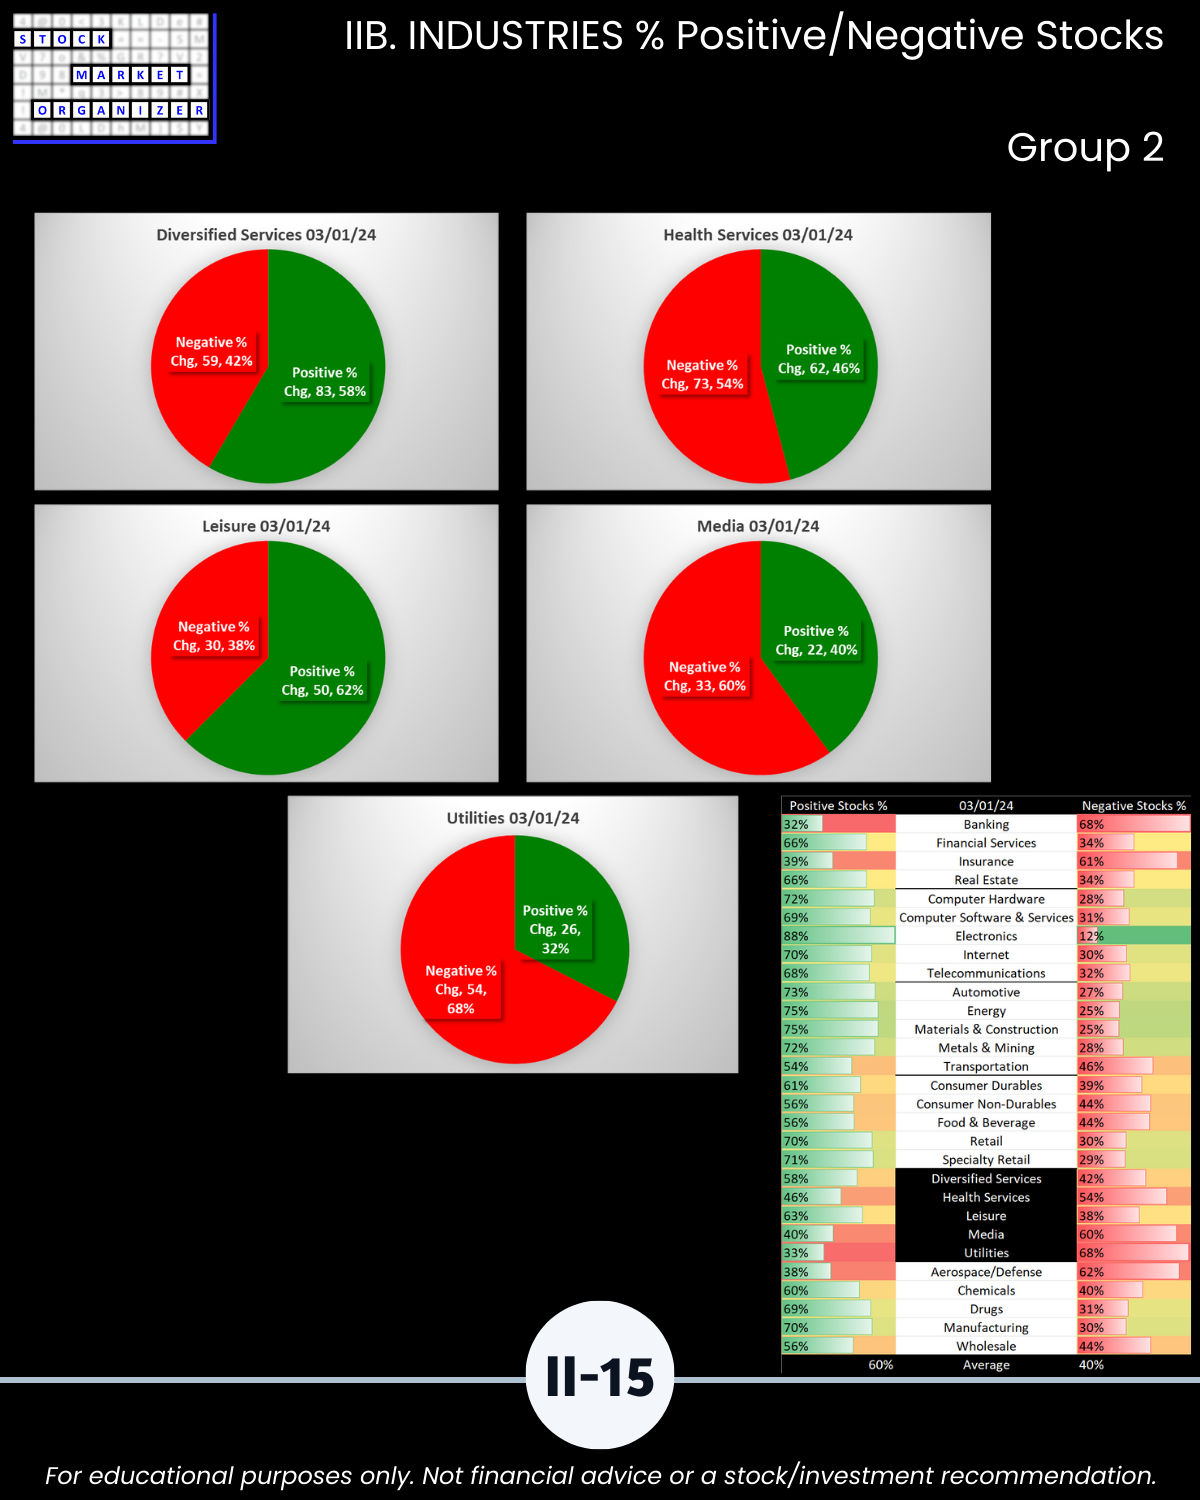
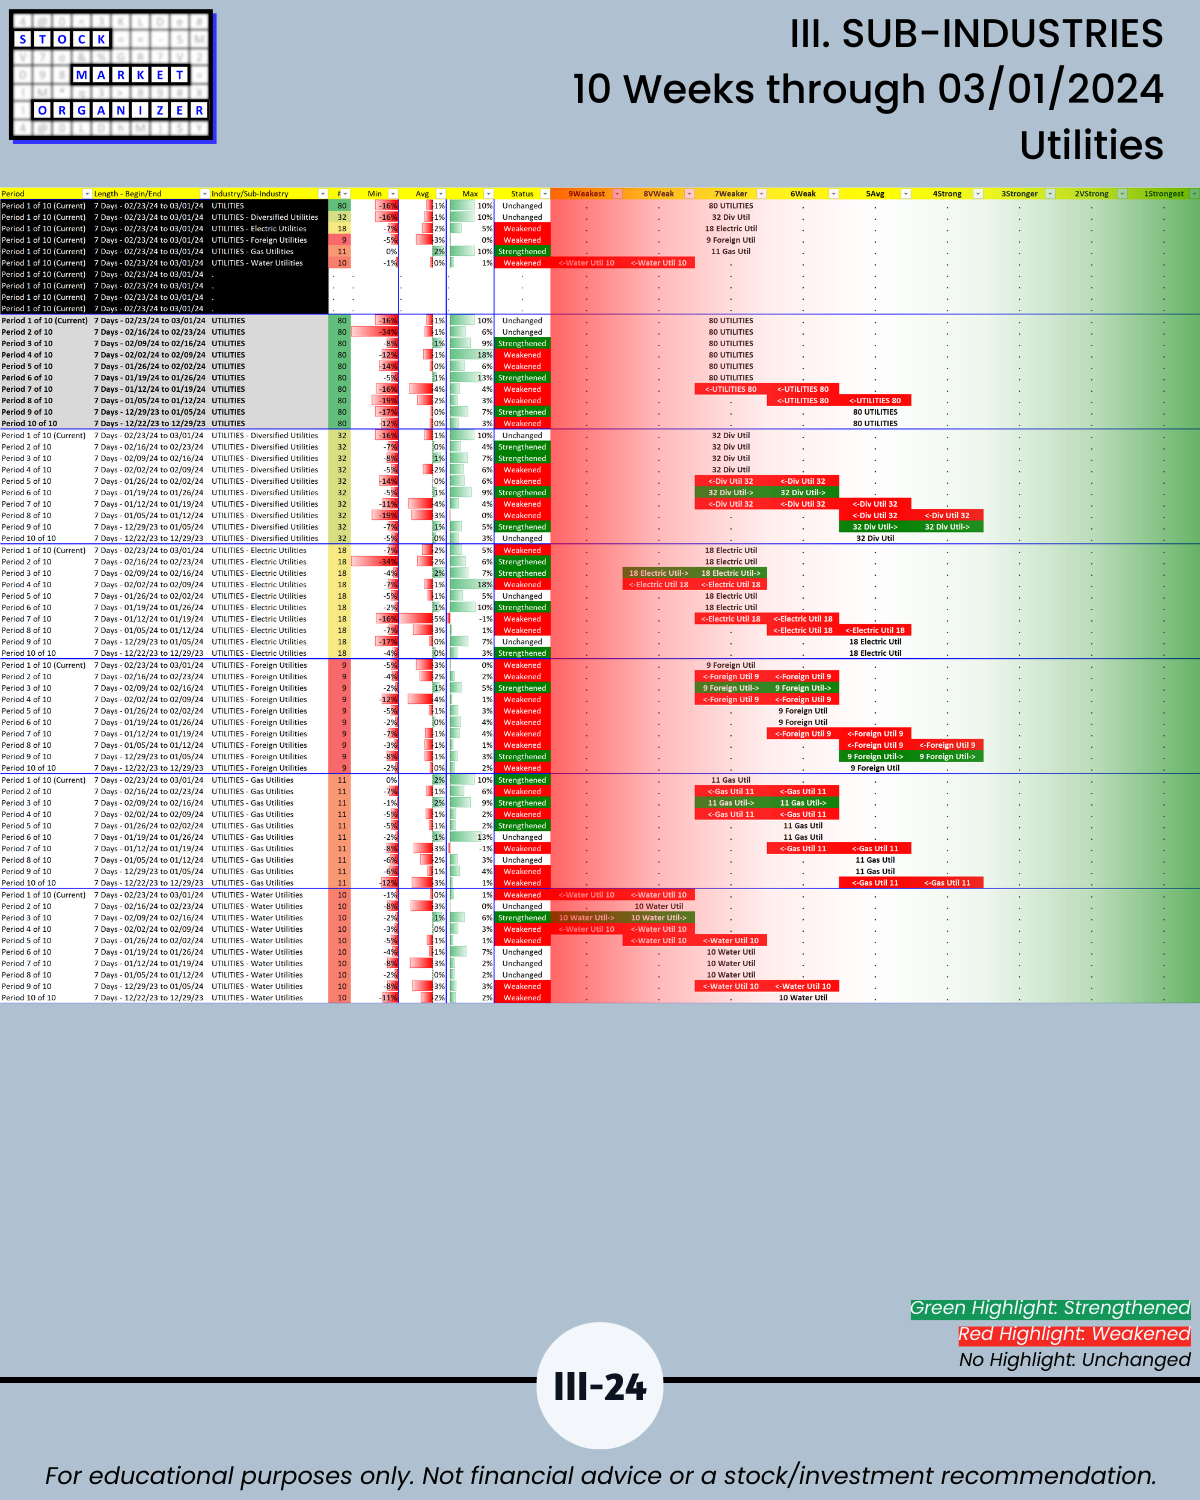
🔹 Utilities = weakest industry at Weaker (7th strongest)
WHY IS THIS WORTH YOUR TIME?
It is different than you’ll see elsewhere and thus complements every other market perspective.
Many analytically tear apart individual stocks. Others take a more top-down approach.
Common theme: each reviewing as many data points about as many topics as possible.
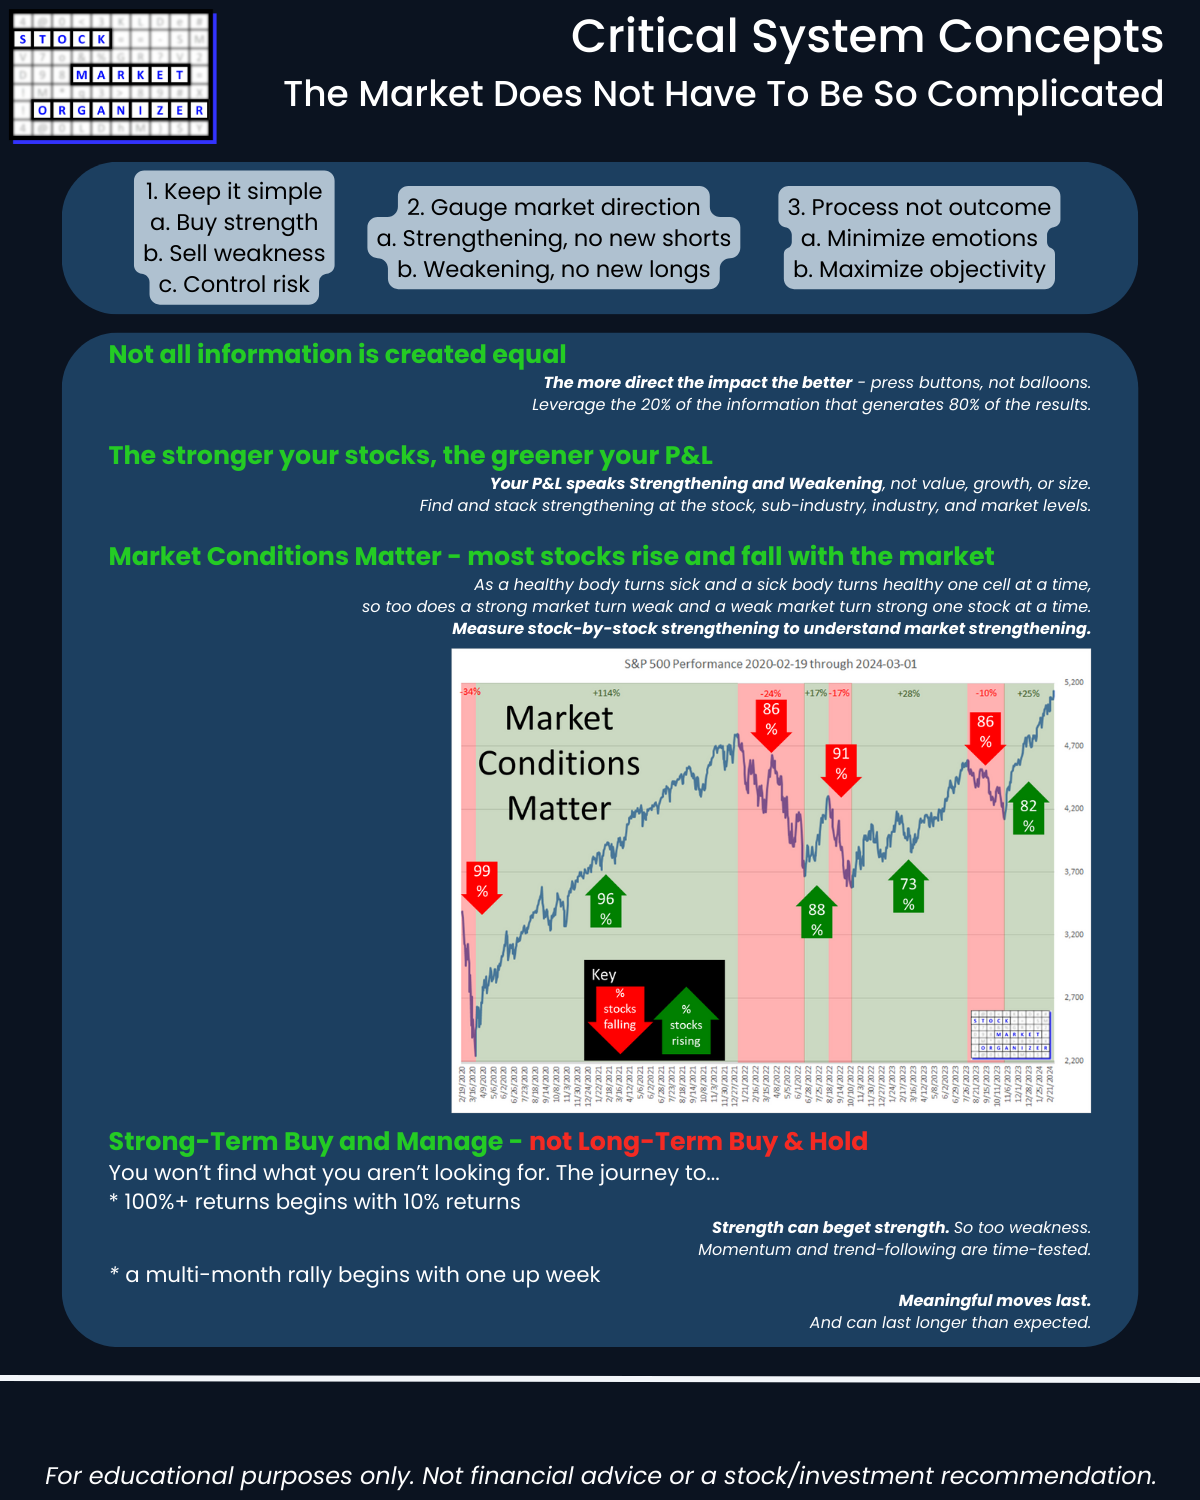
In contrast, I have one focal point for the market, sectors, industries, sub-industries, and stocks: STRENGTH.
Why? Because the stronger your stocks, the greener your P&L.
The market really does not have to be so complicated.
WHAT WON’T YOU FIND HERE?
Information you can find elsewhere such as annotated price charts, price targets, financials, and competition/management discussions. There are innumerable sources for this information.
WHAT WILL YOU FIND HERE?
U.S. stock market strengthening analyses found only here that provide valuable context to every methodology.
WHO CARES?
Anyone who wants a U.S. stock market advantage. Really helpful if you agree with the following:
- The stronger your stocks, the greener your P&L.
- The journey to 100%+ returns begins with 10% returns.
- The journey to a multi-month rally begins with one up week.
- Most stocks do what the market does. (While the market can only do what its underlying stocks, sub-industries, and industries do.)
- 80/20: not all information is created equal. (Press buttons, not balloons.)
Following are galleries with page-by-page views of this report.
I. MARKET/Critical System Concepts/Market Strength Score
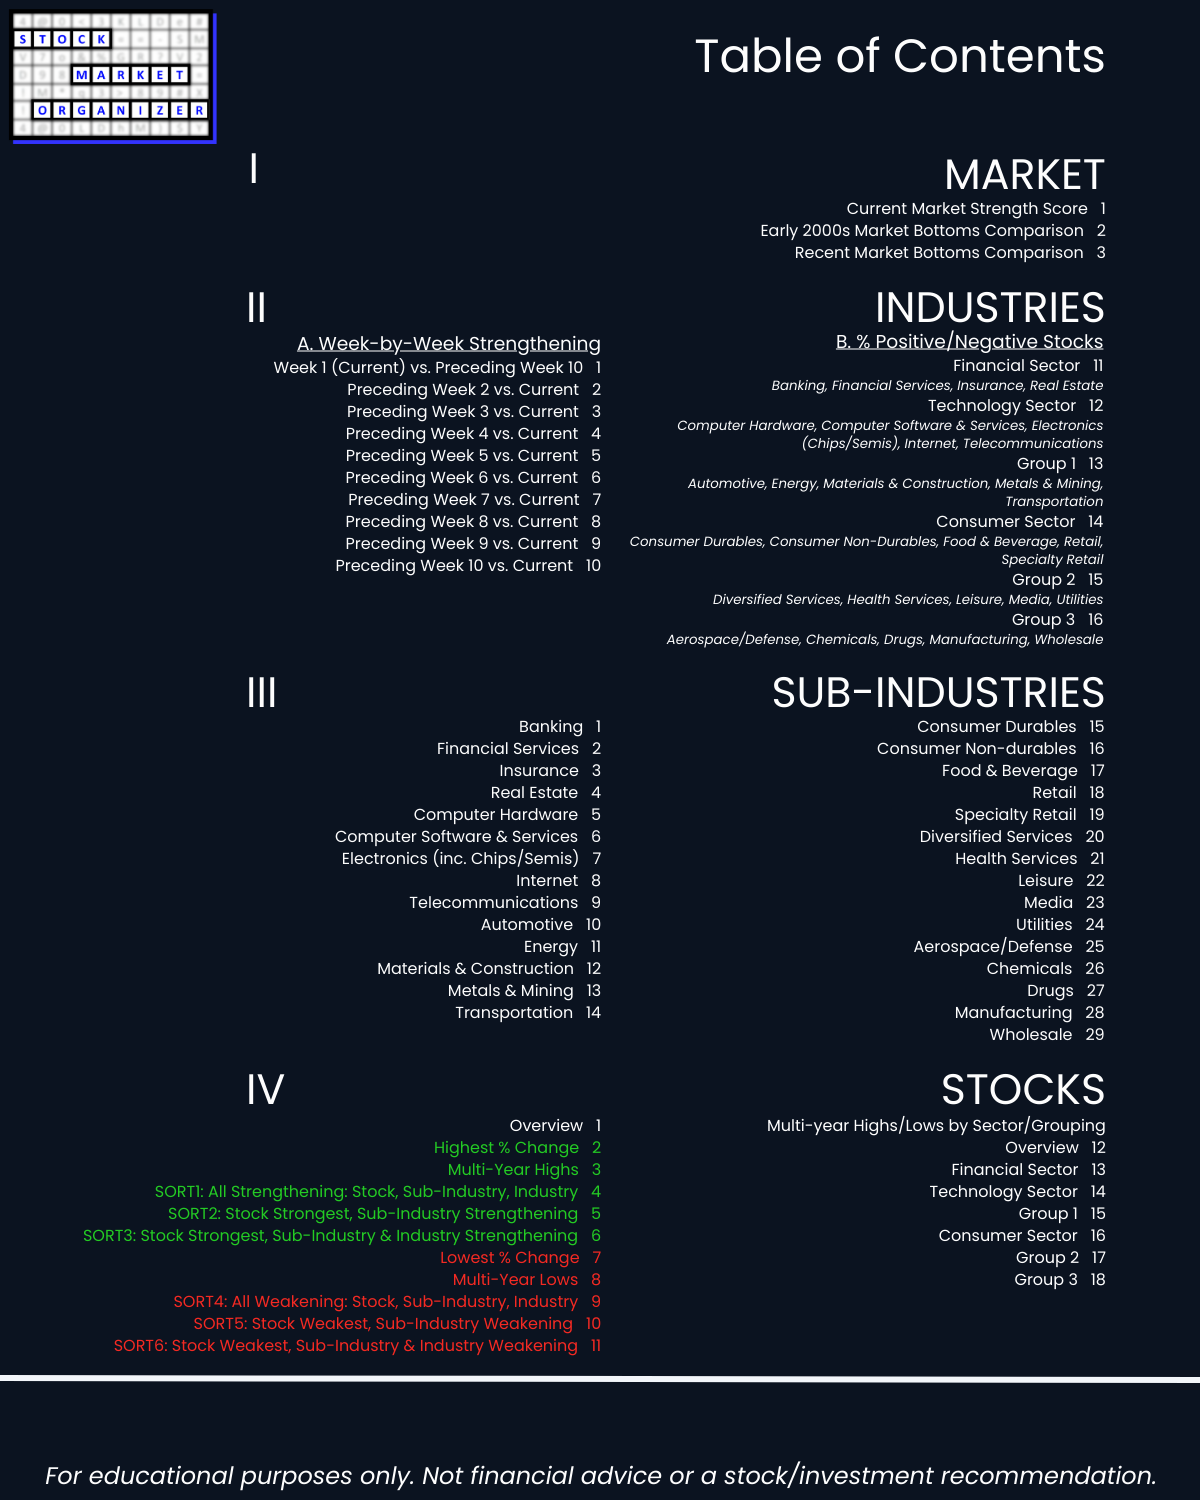
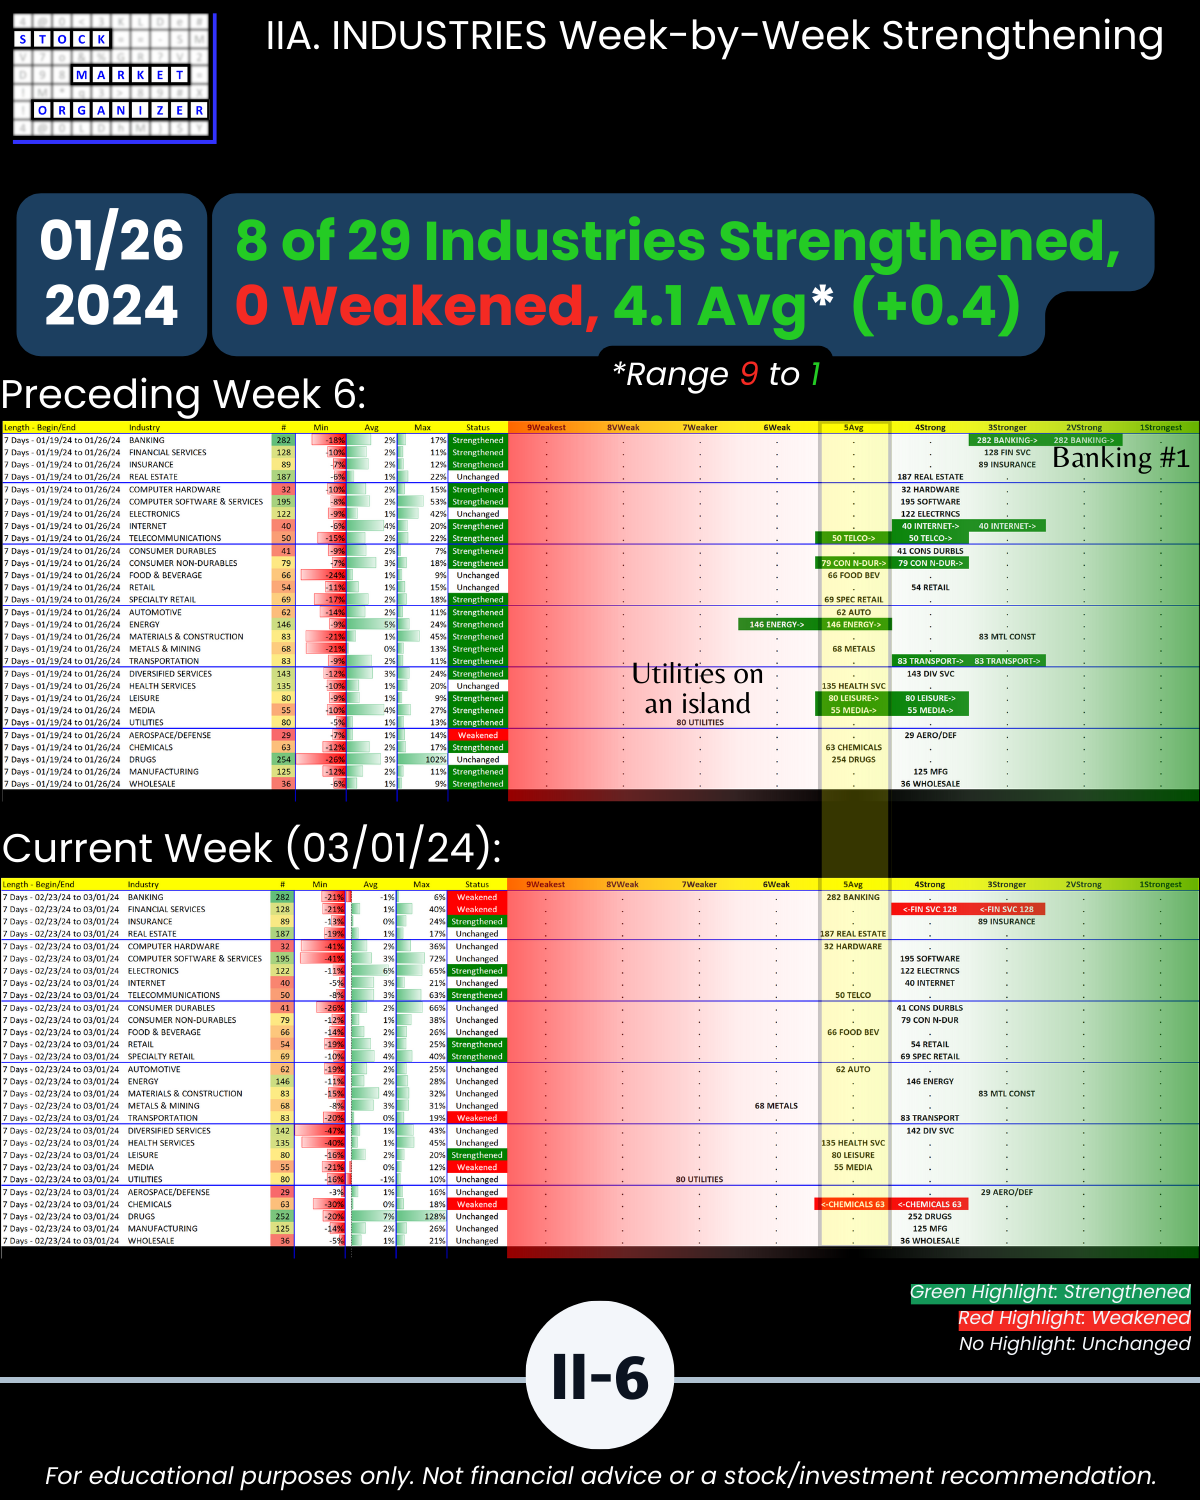
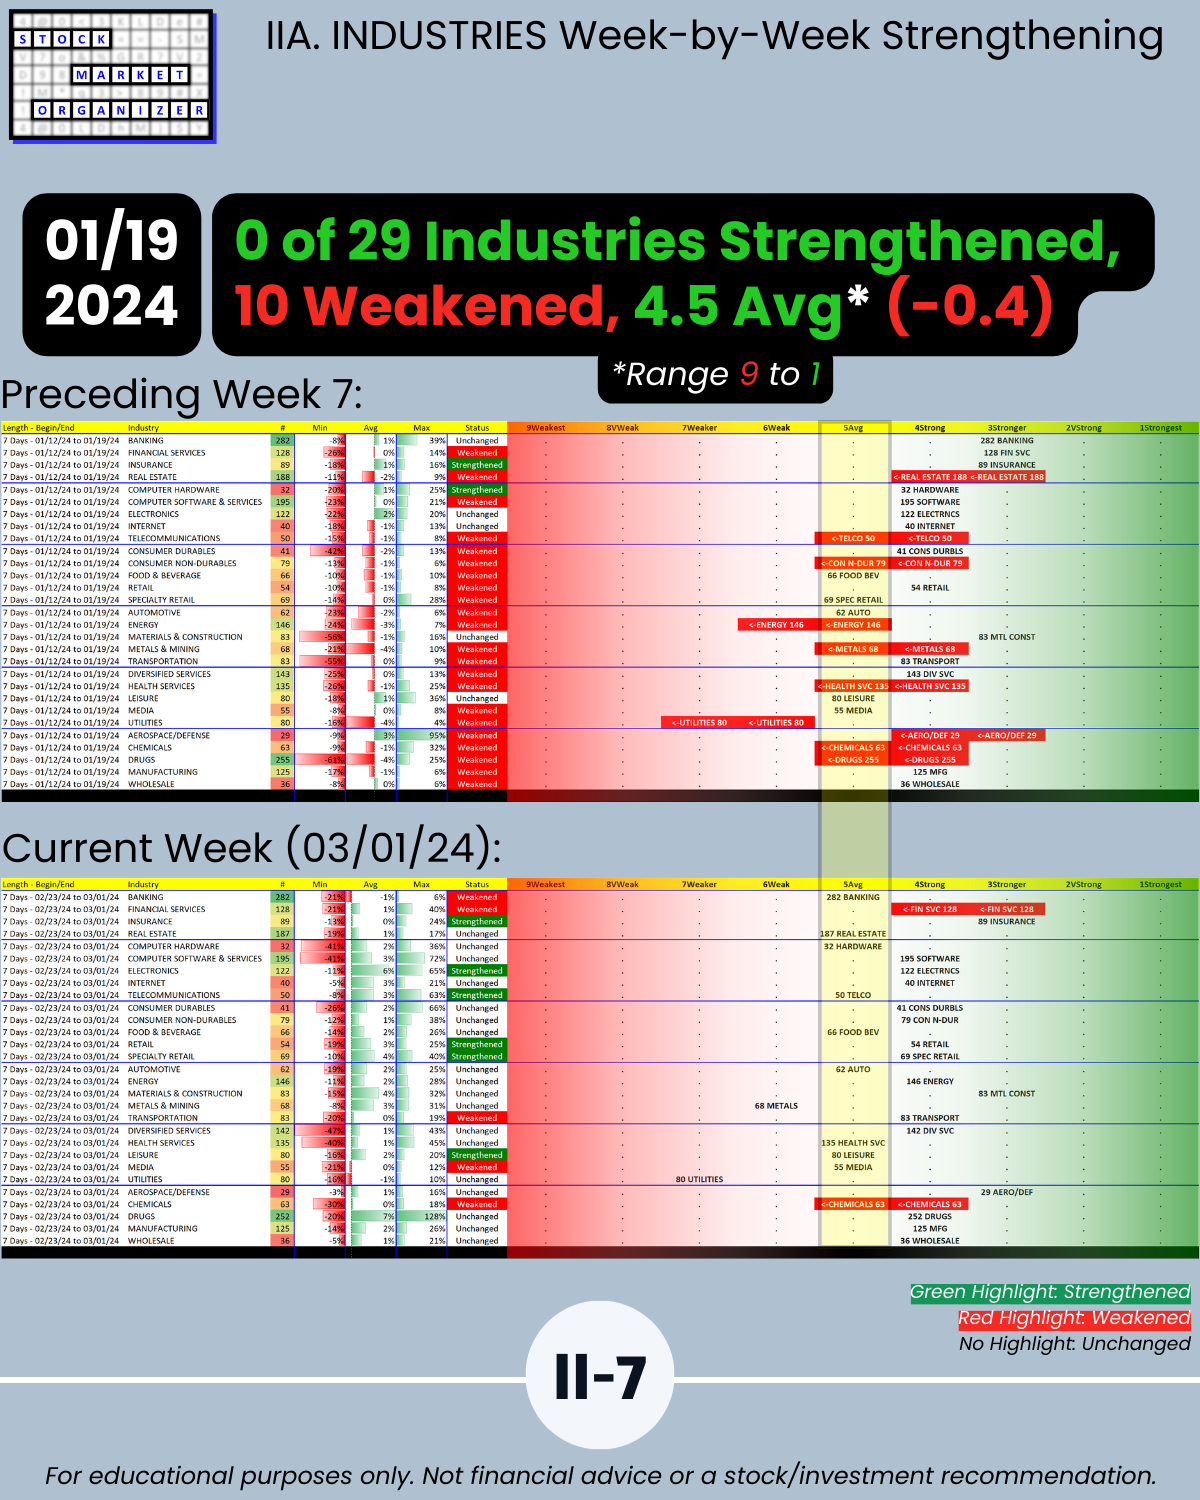
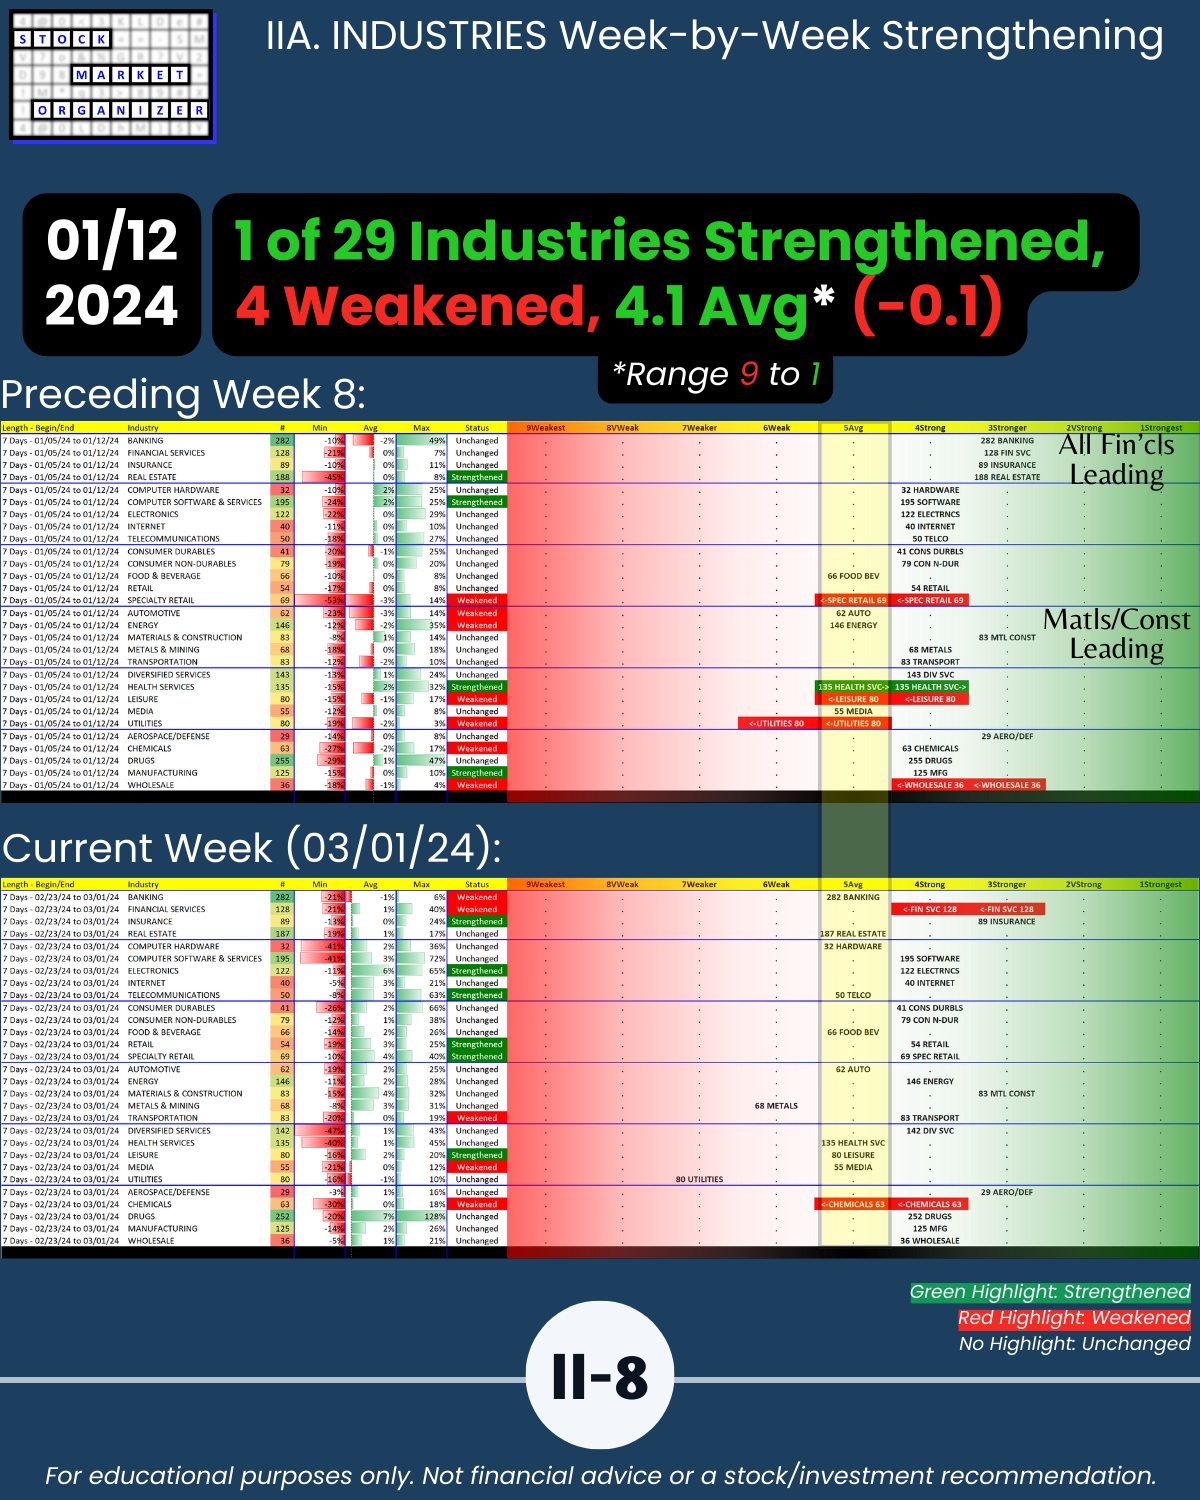
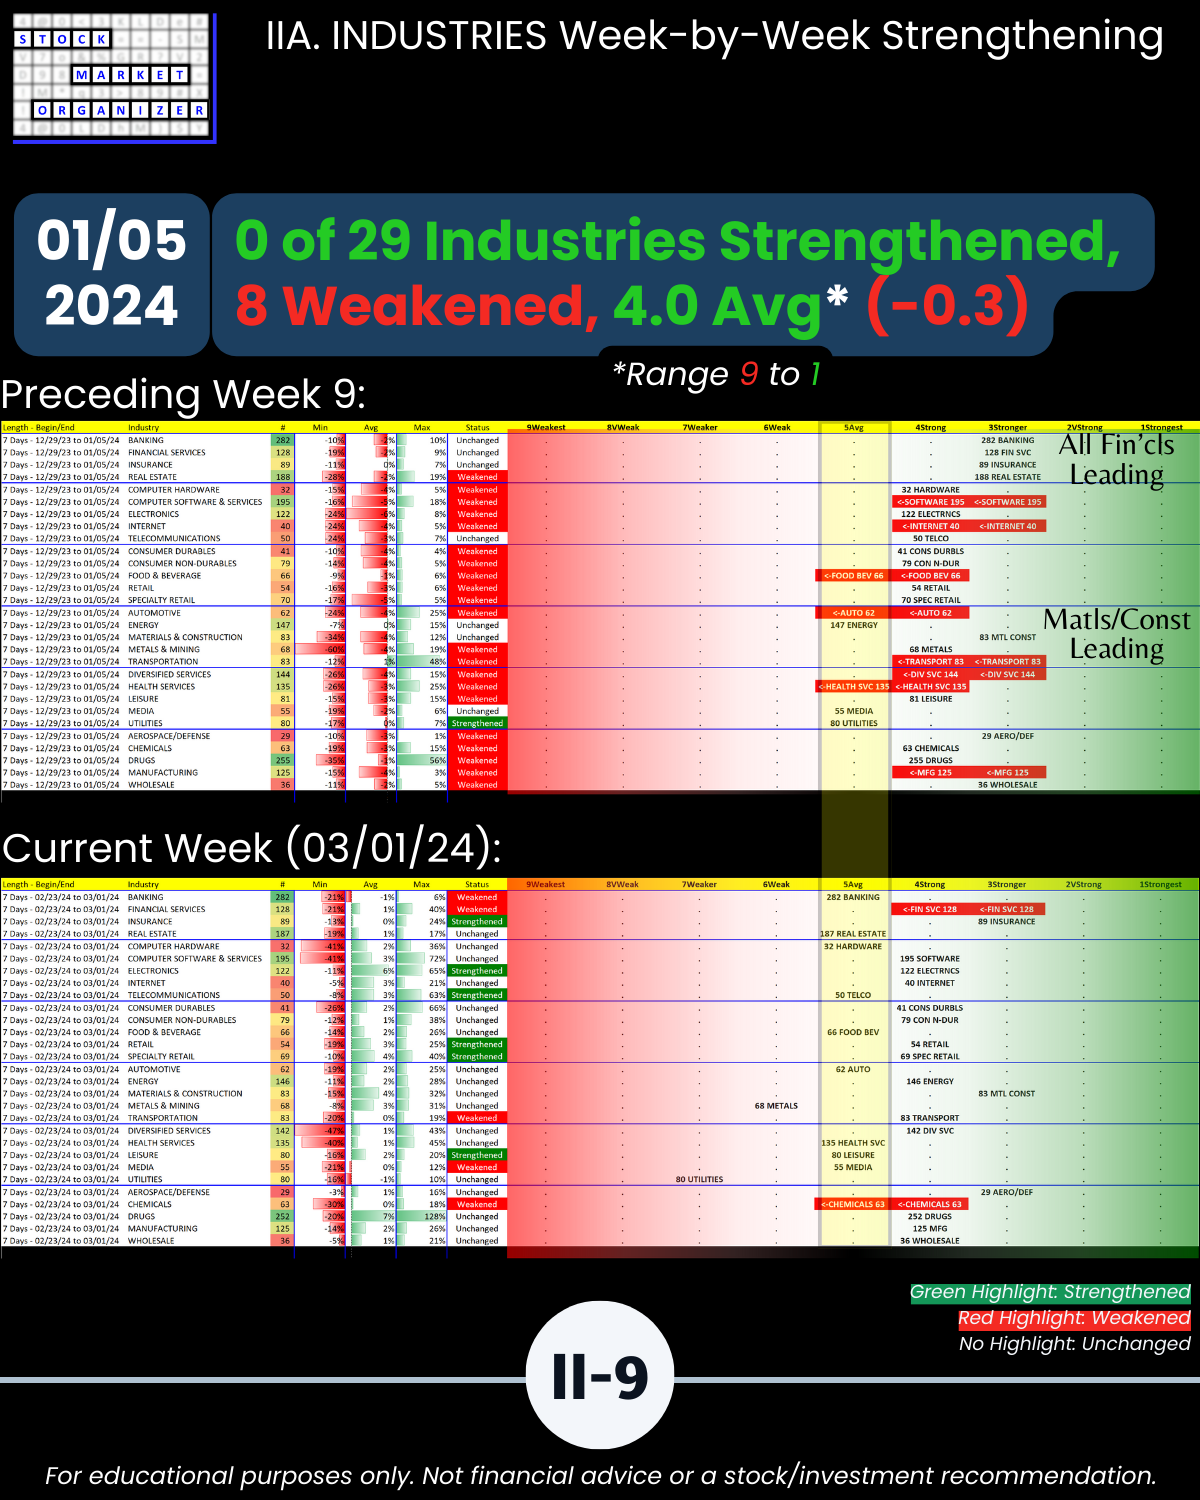
IIA. INDUSTRIES/10-Week Week-by-Week Industry Strength
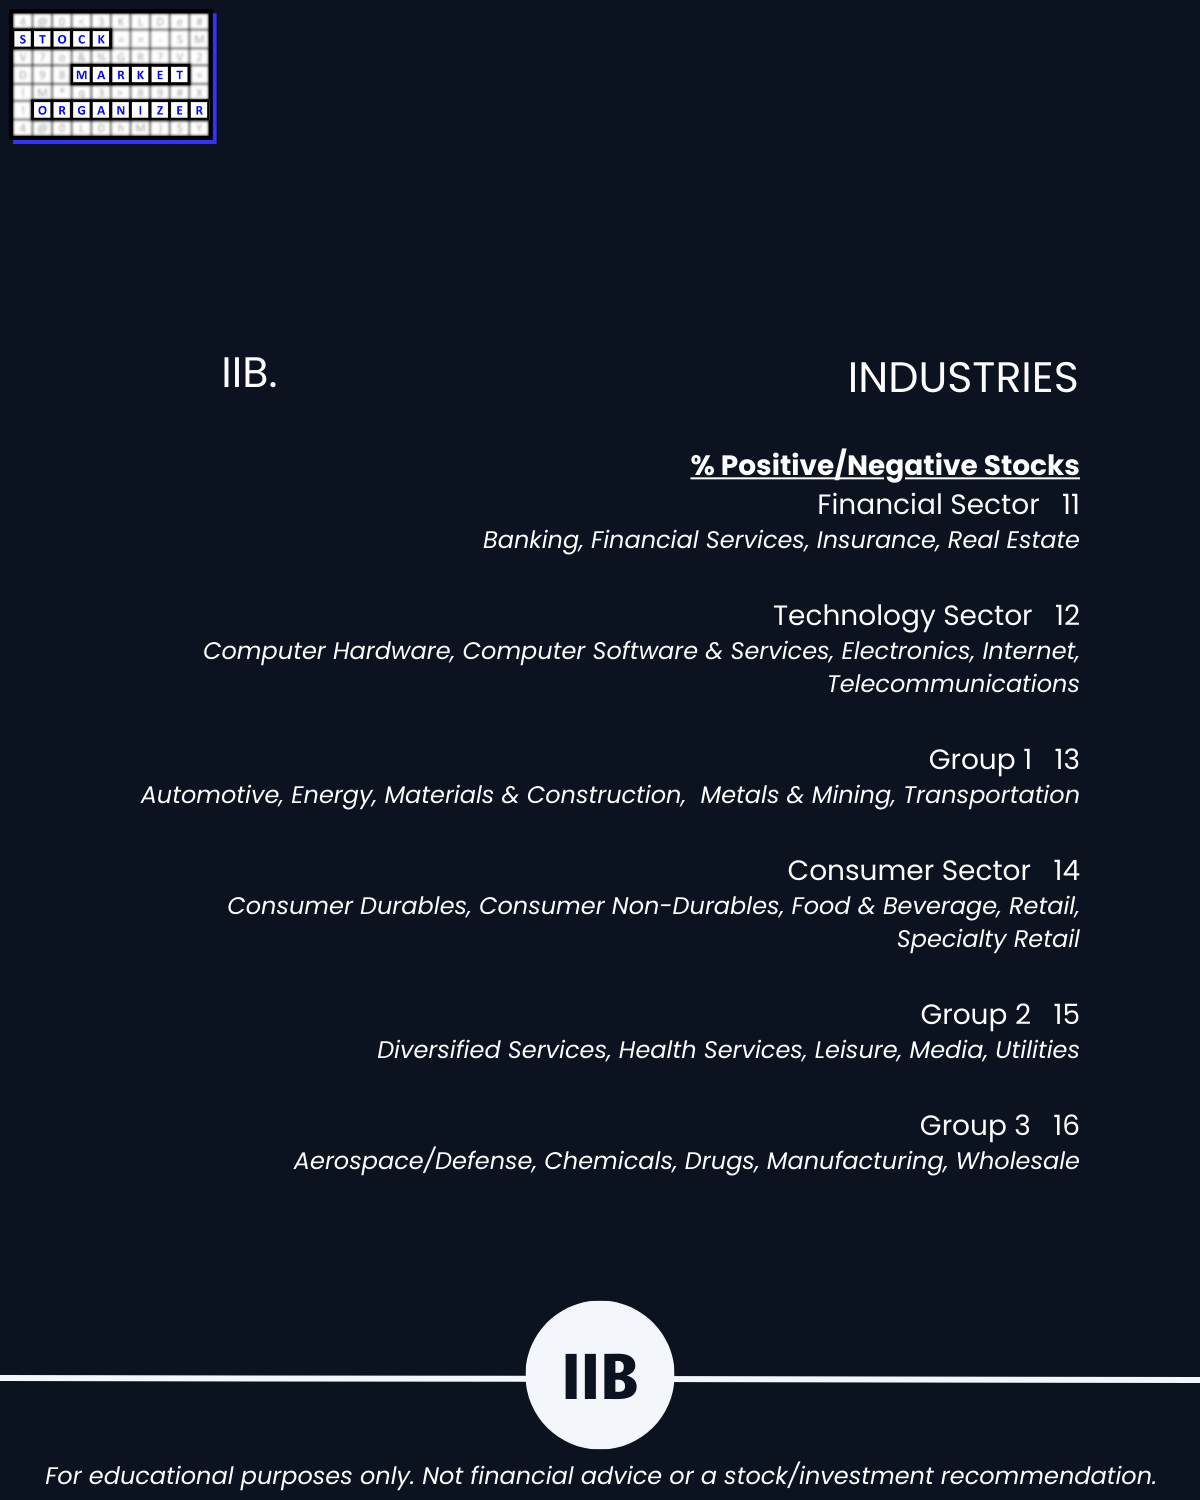
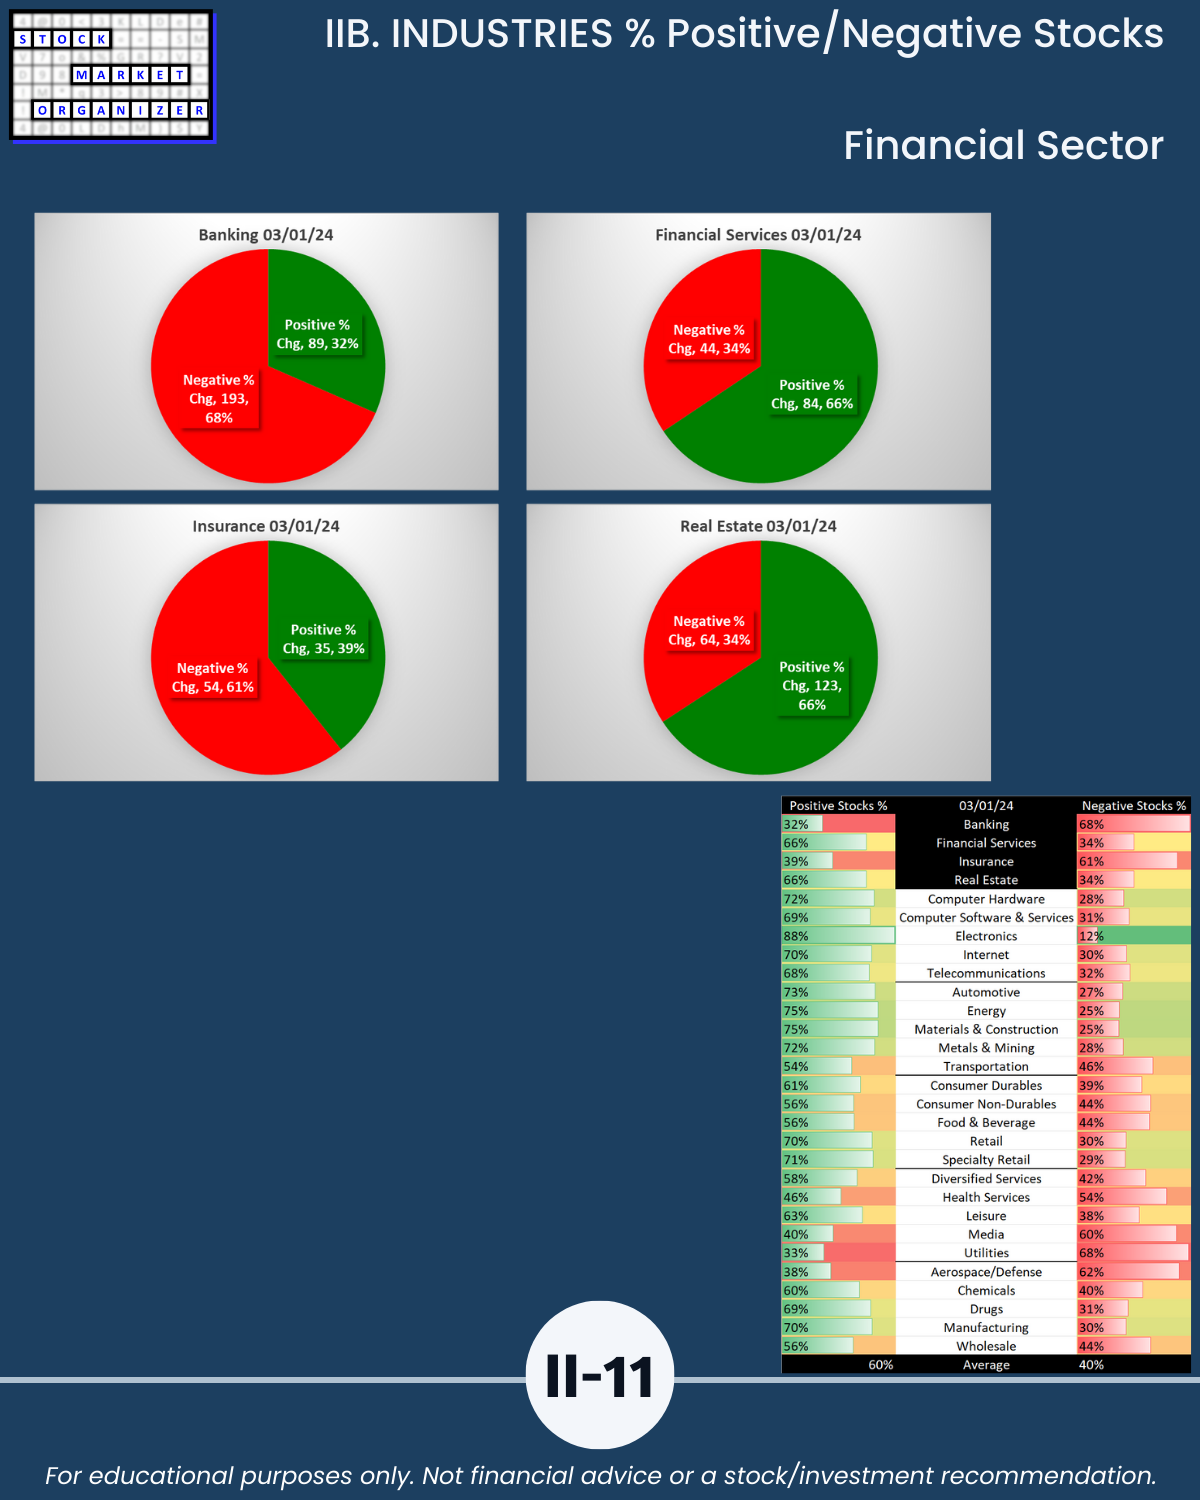
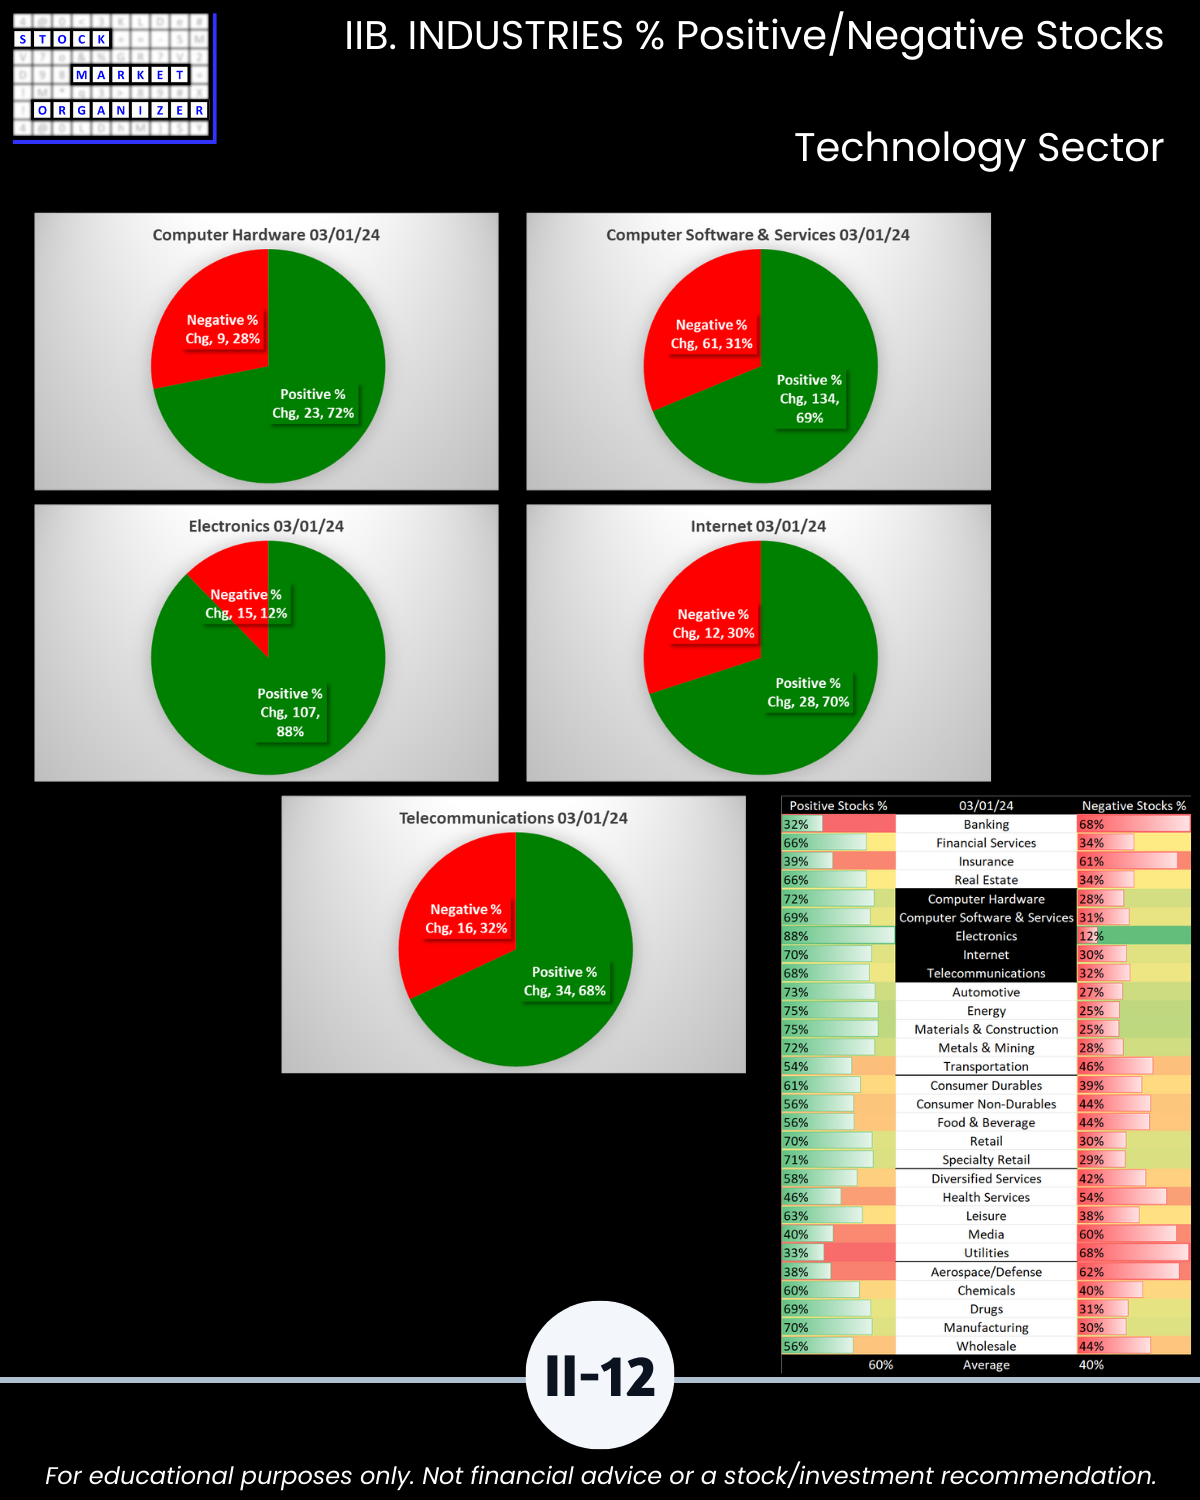
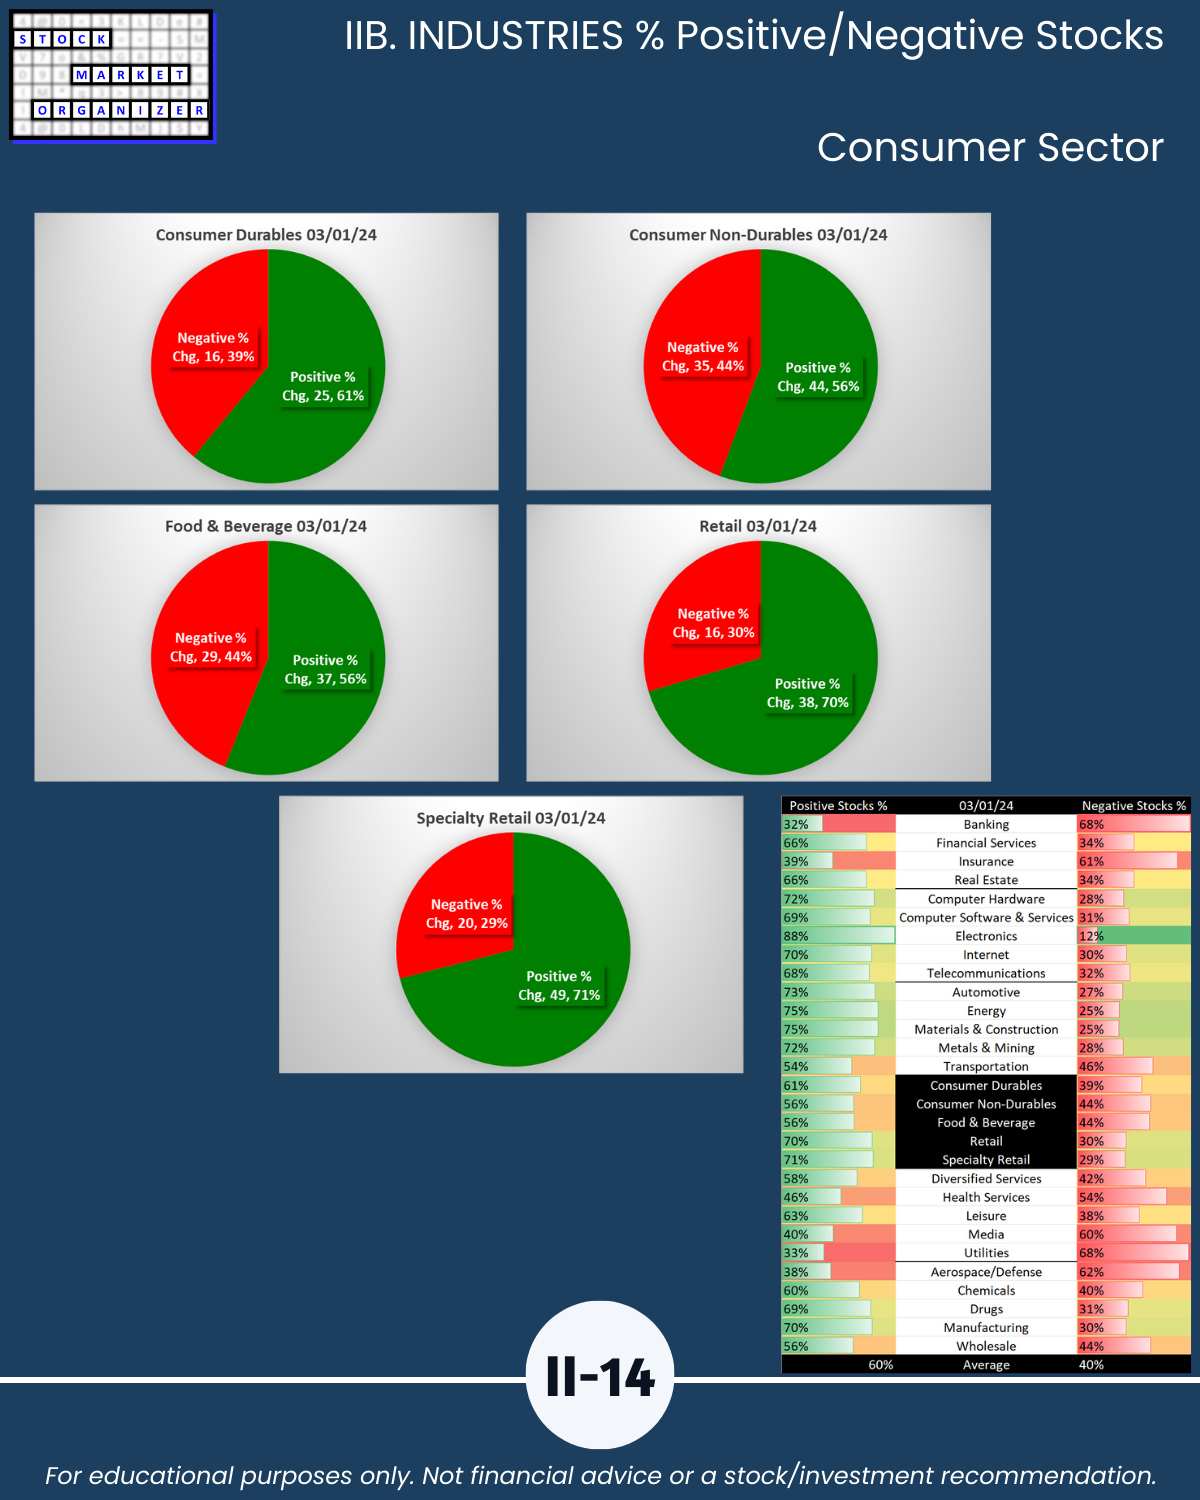
IIB. INDUSTRIES/% Positive/Negative Stocks
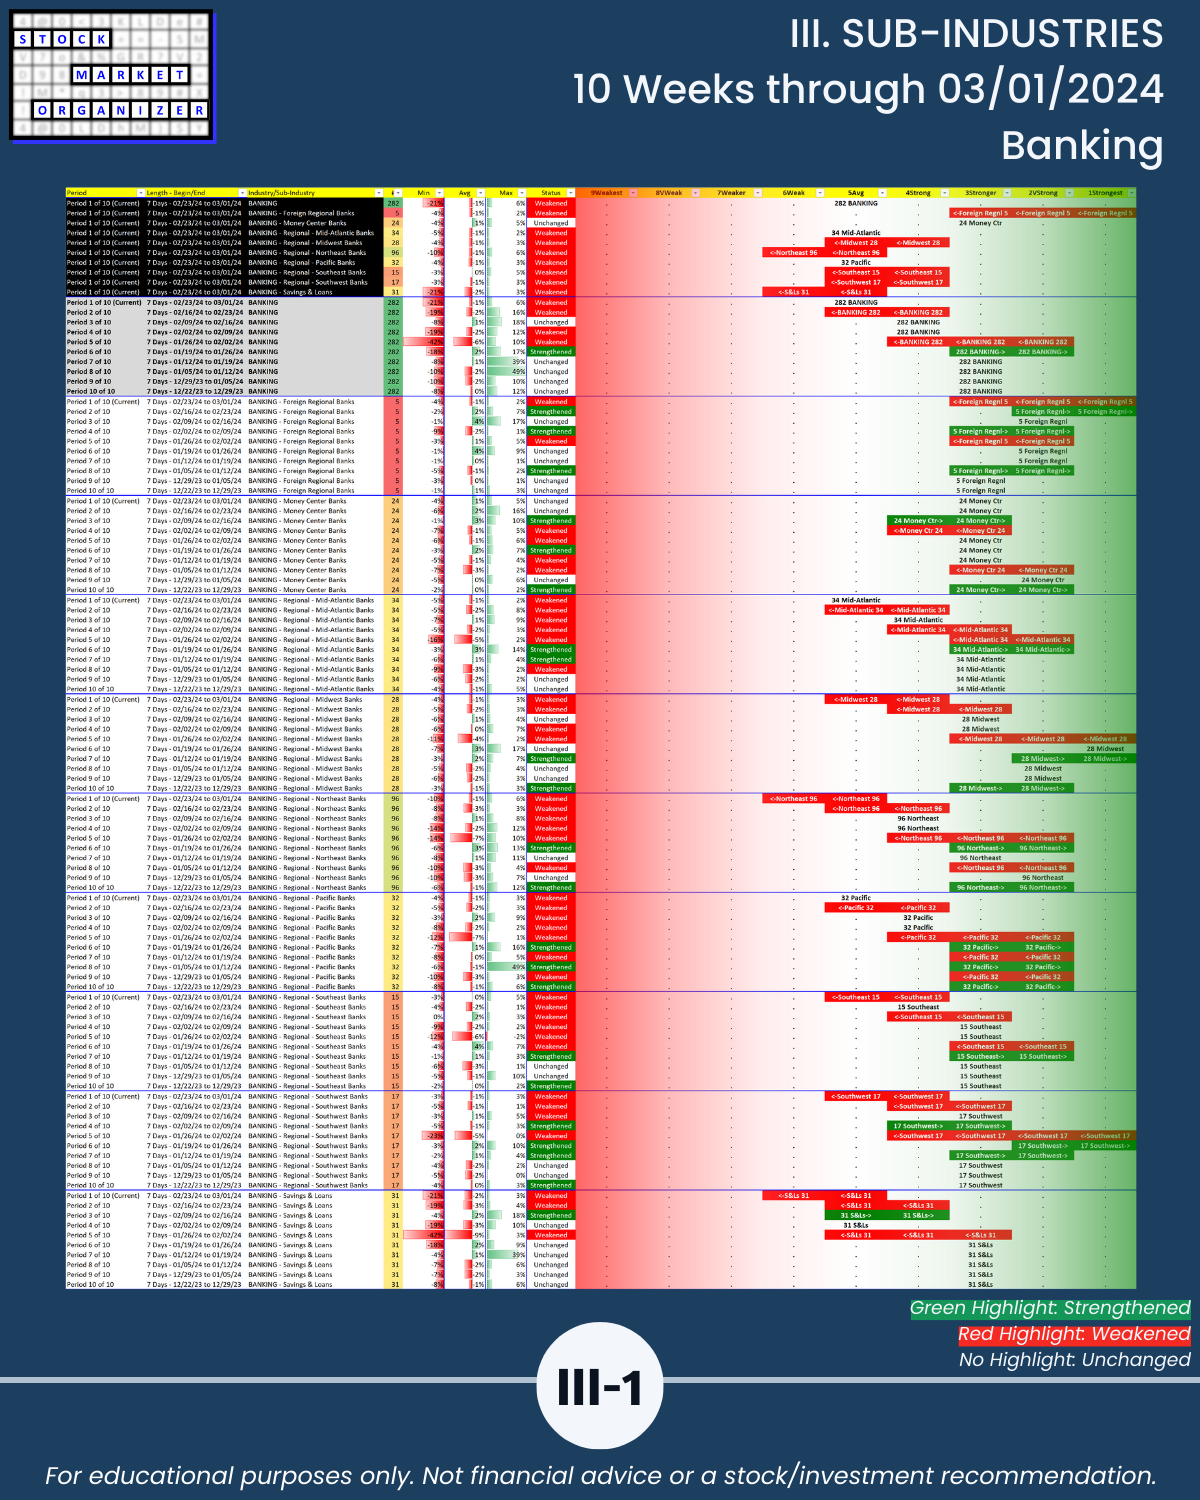
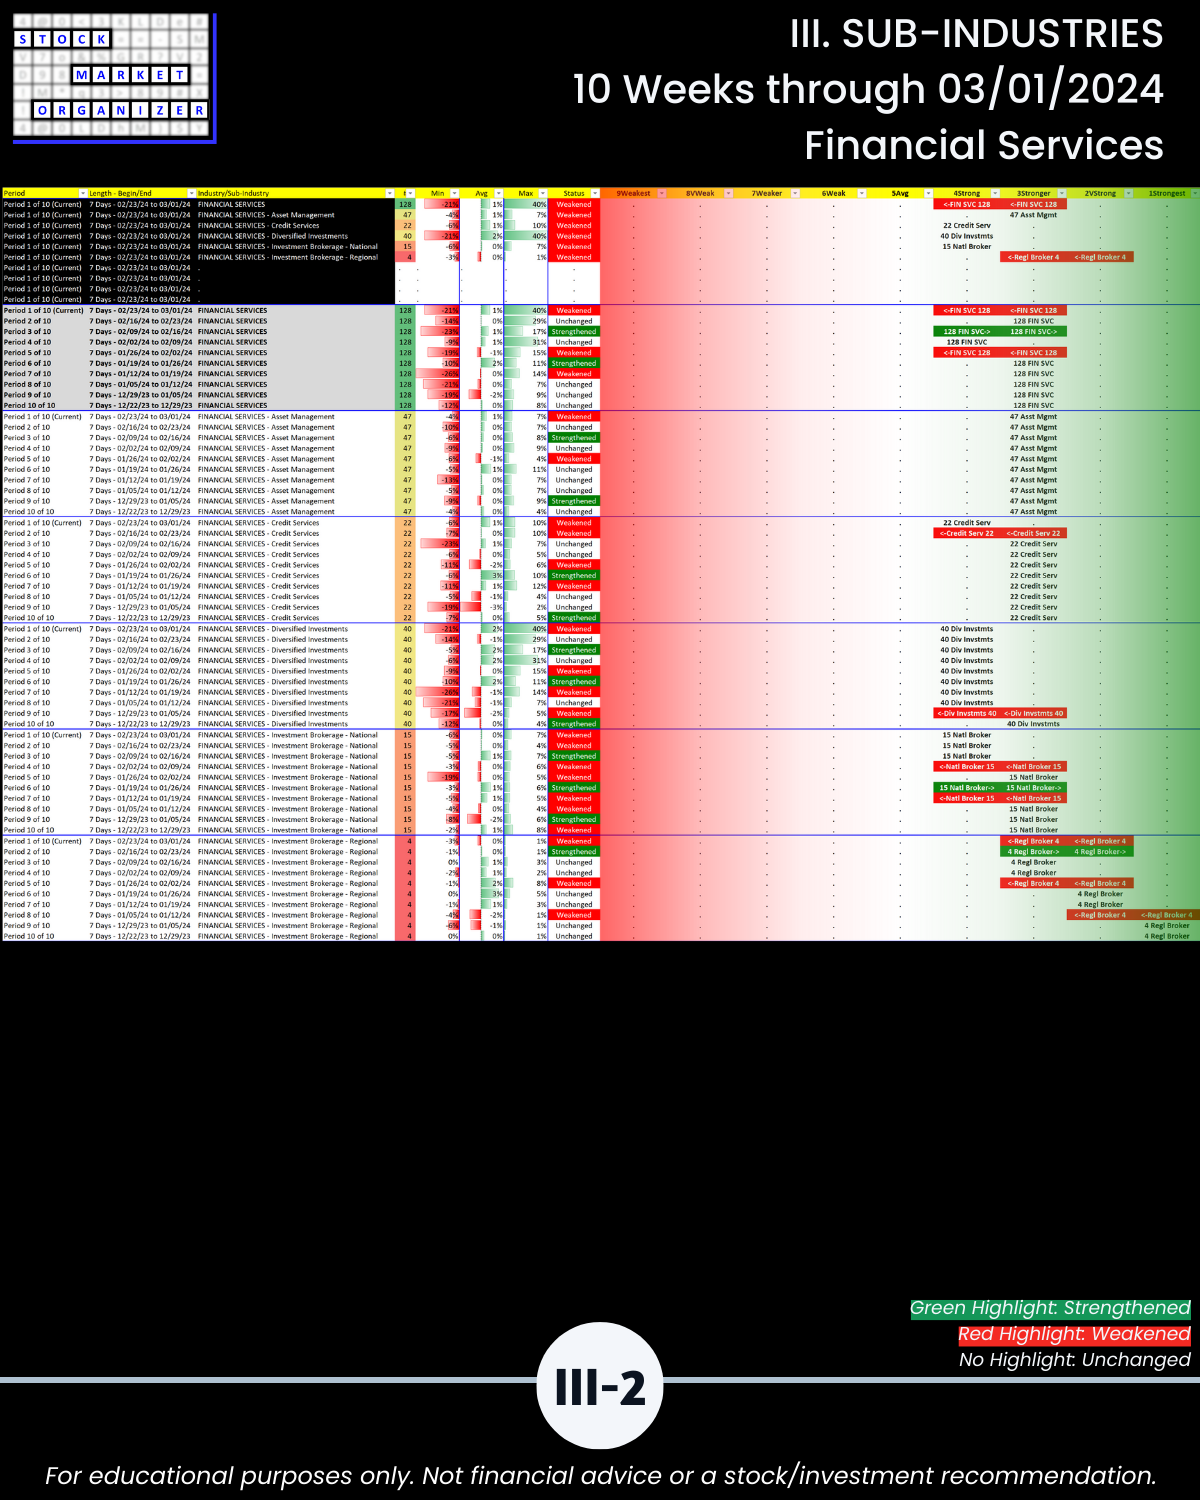
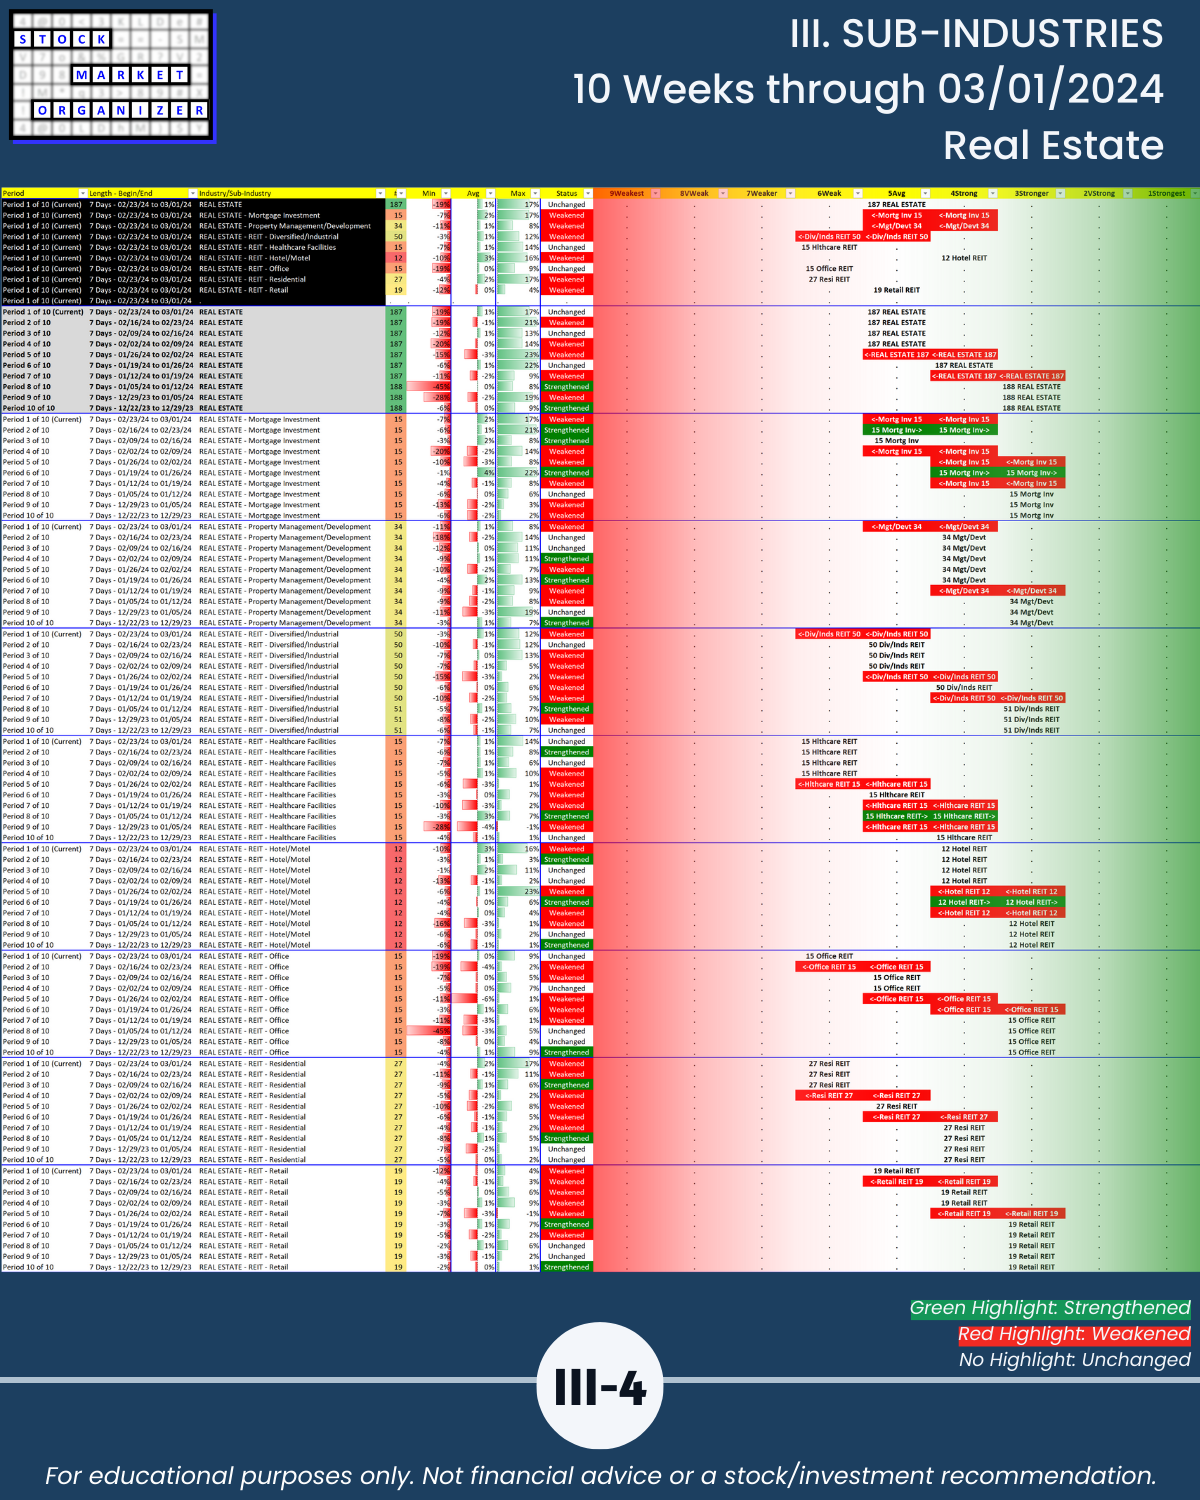
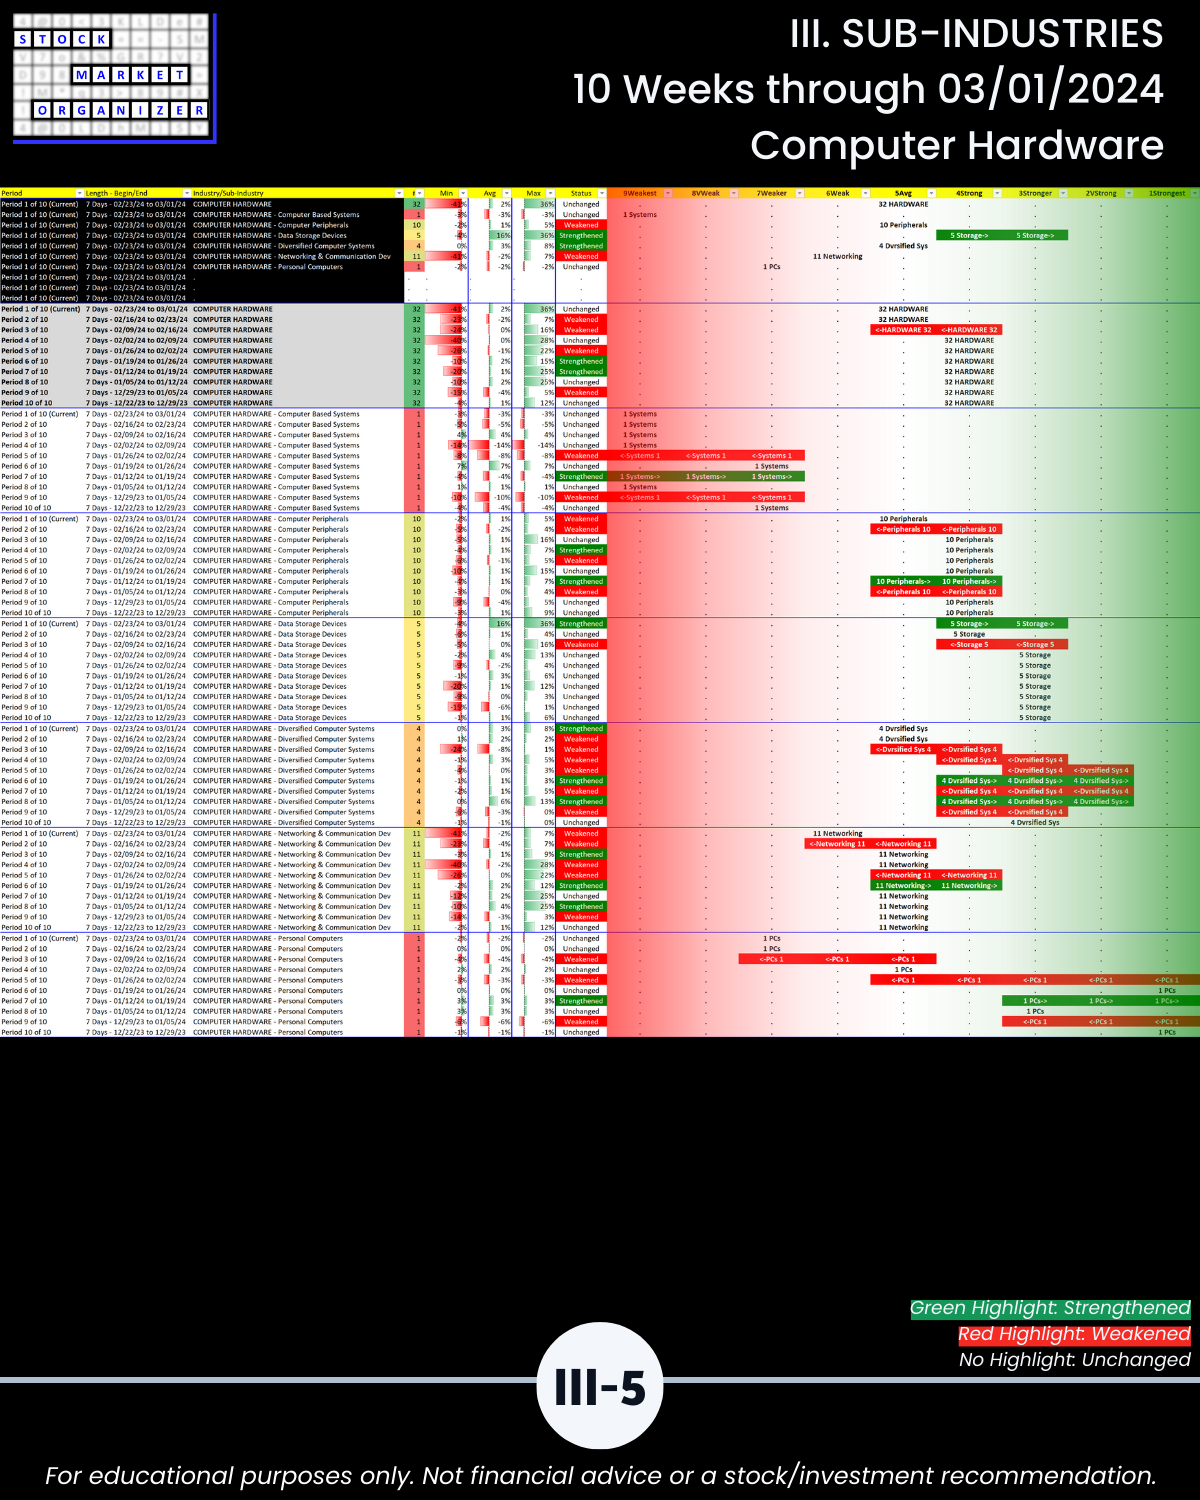
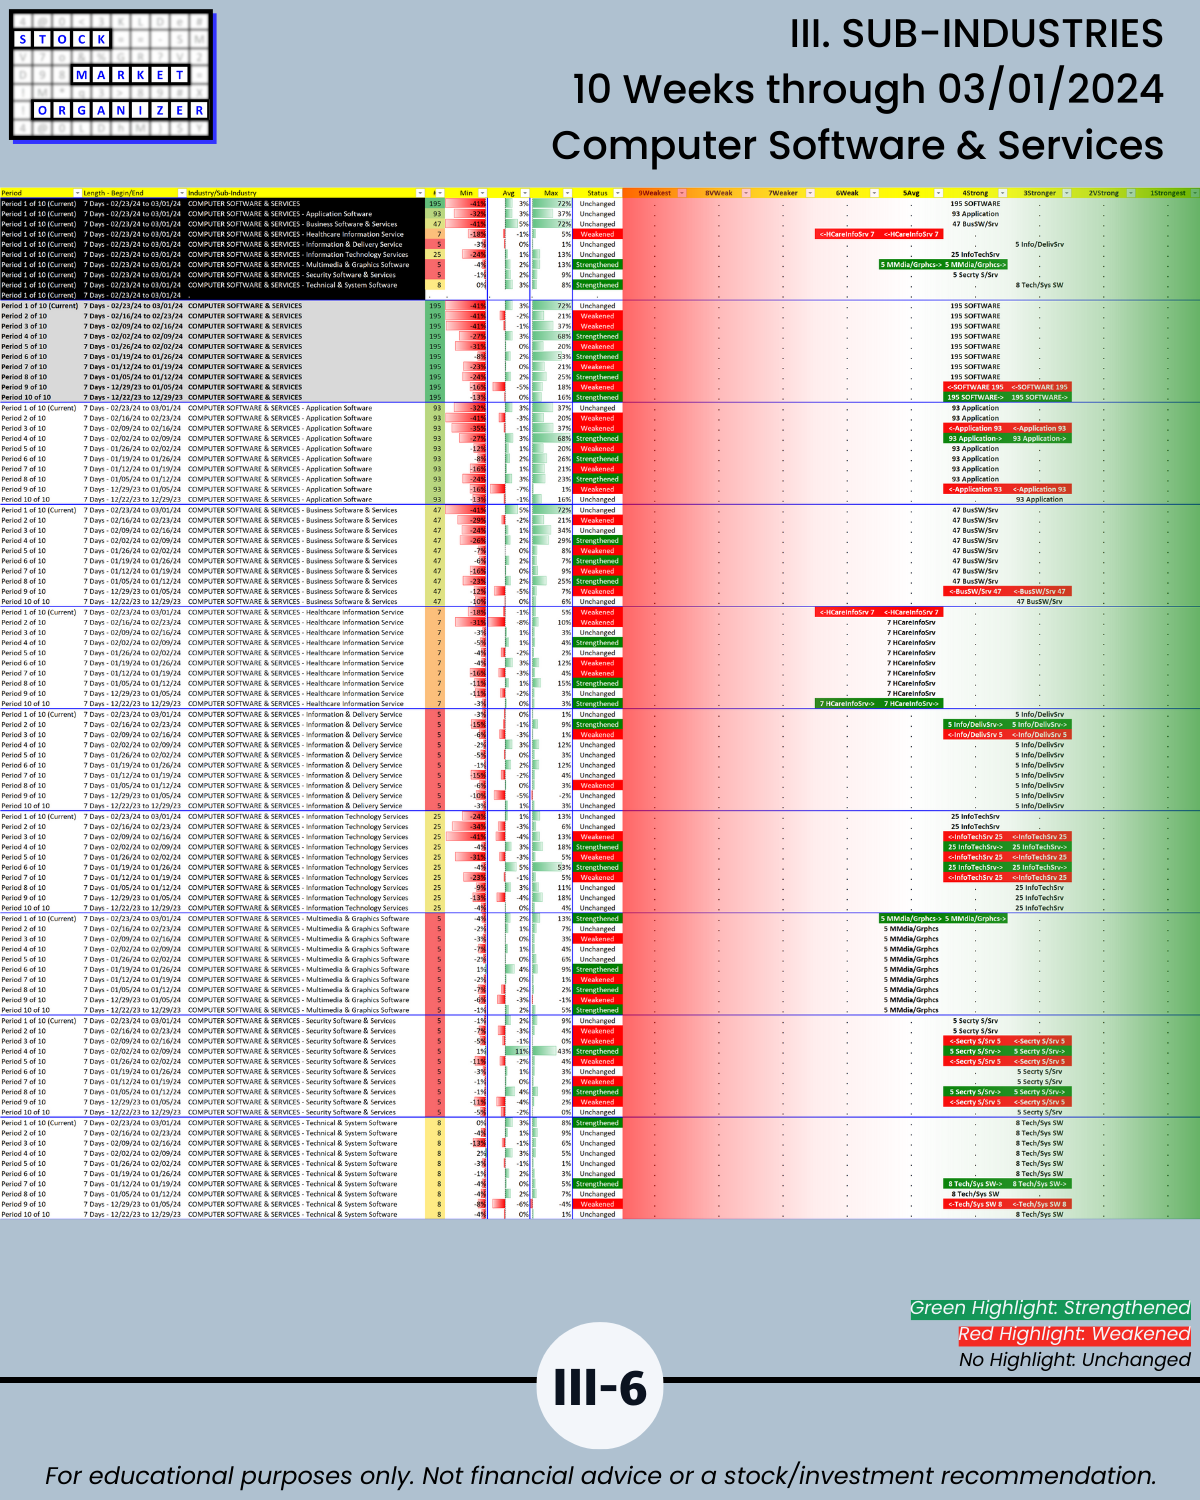
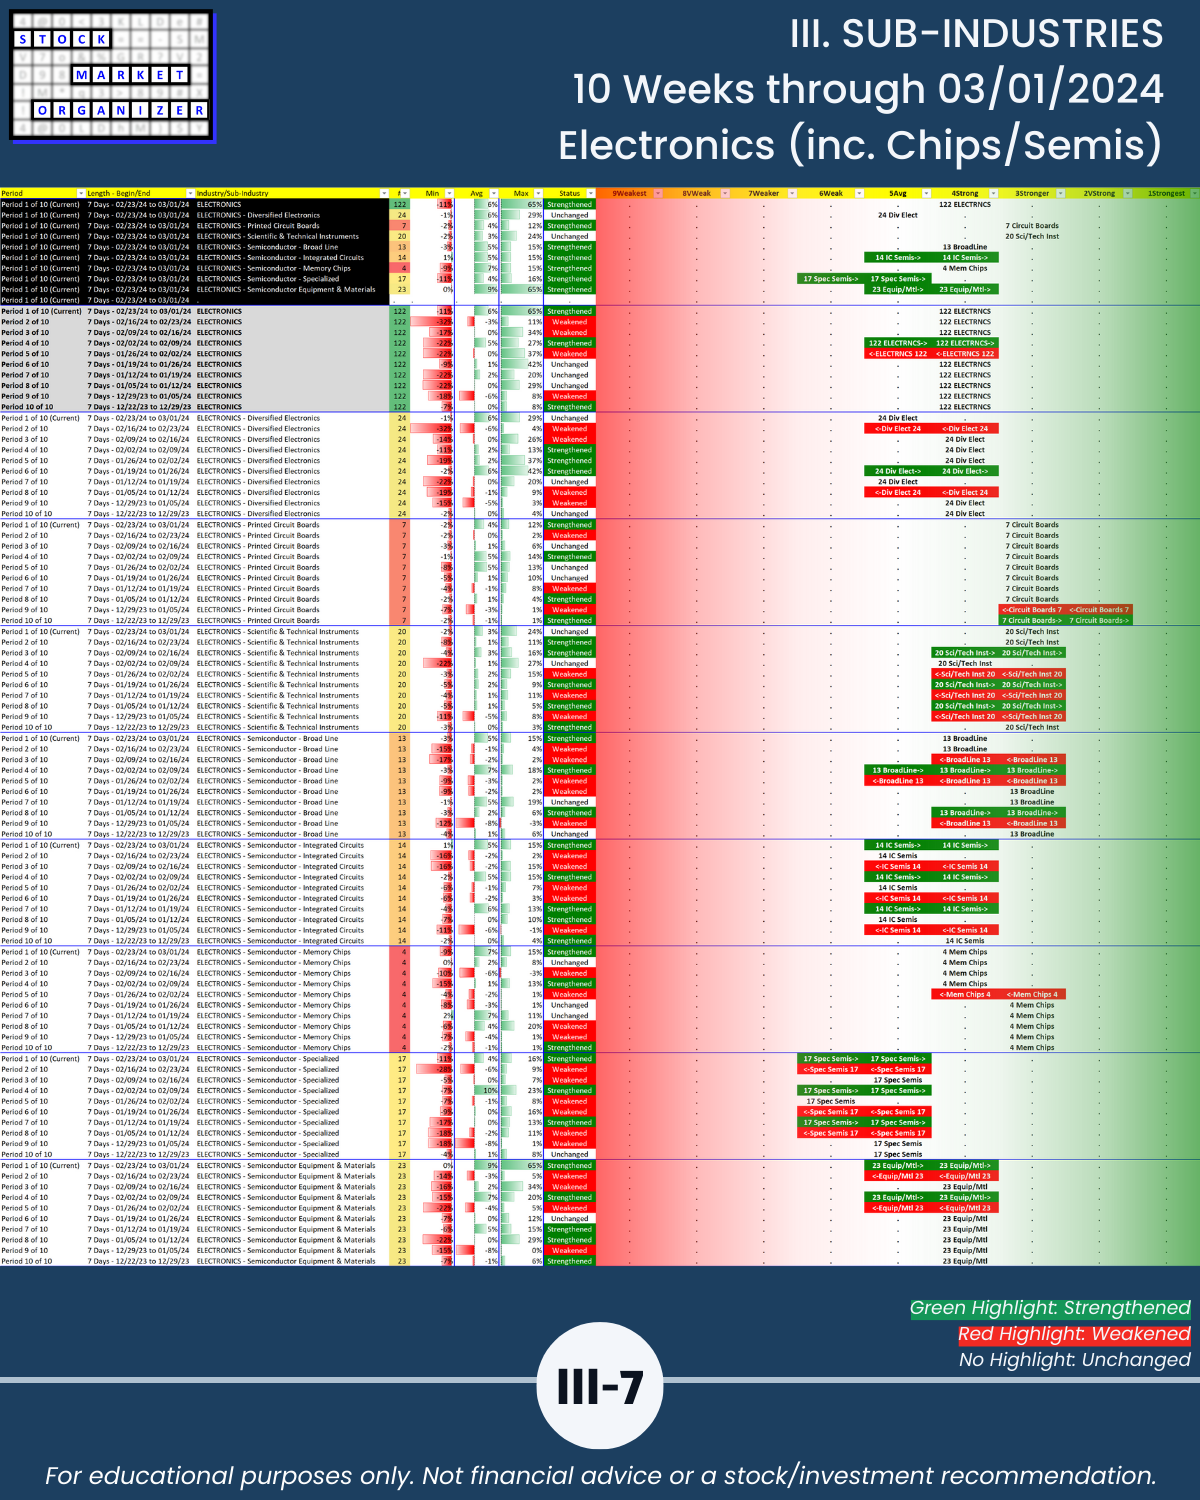
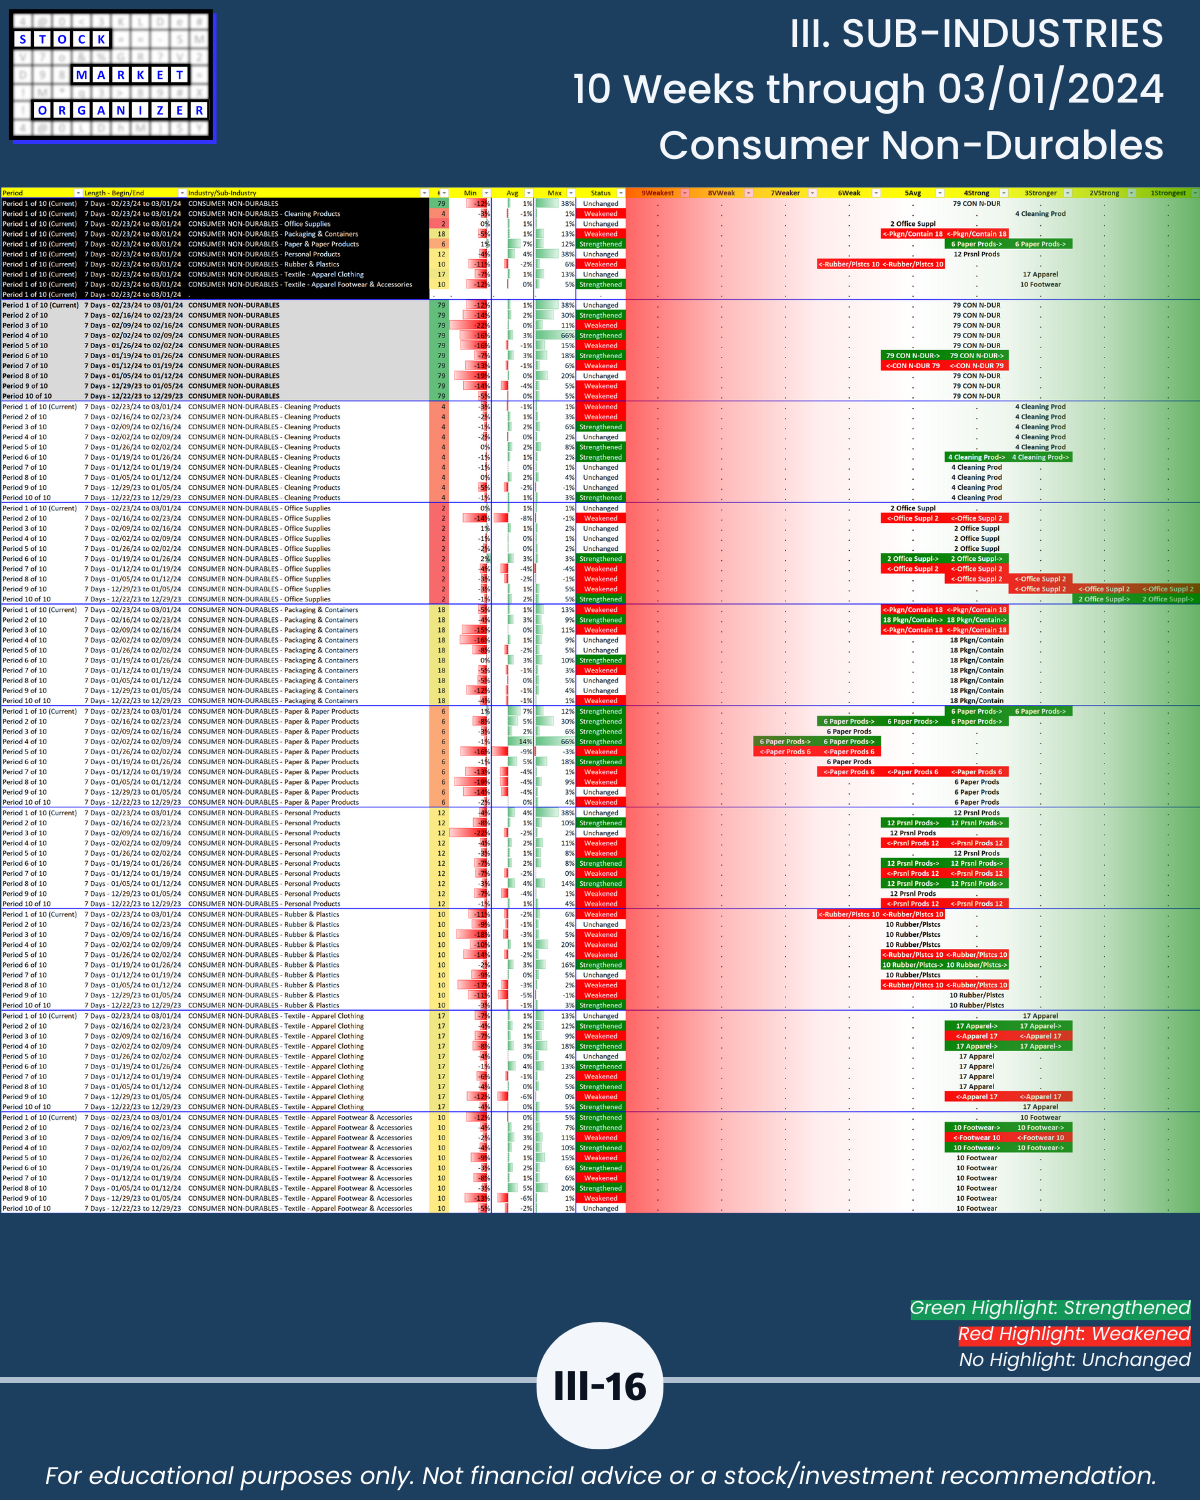
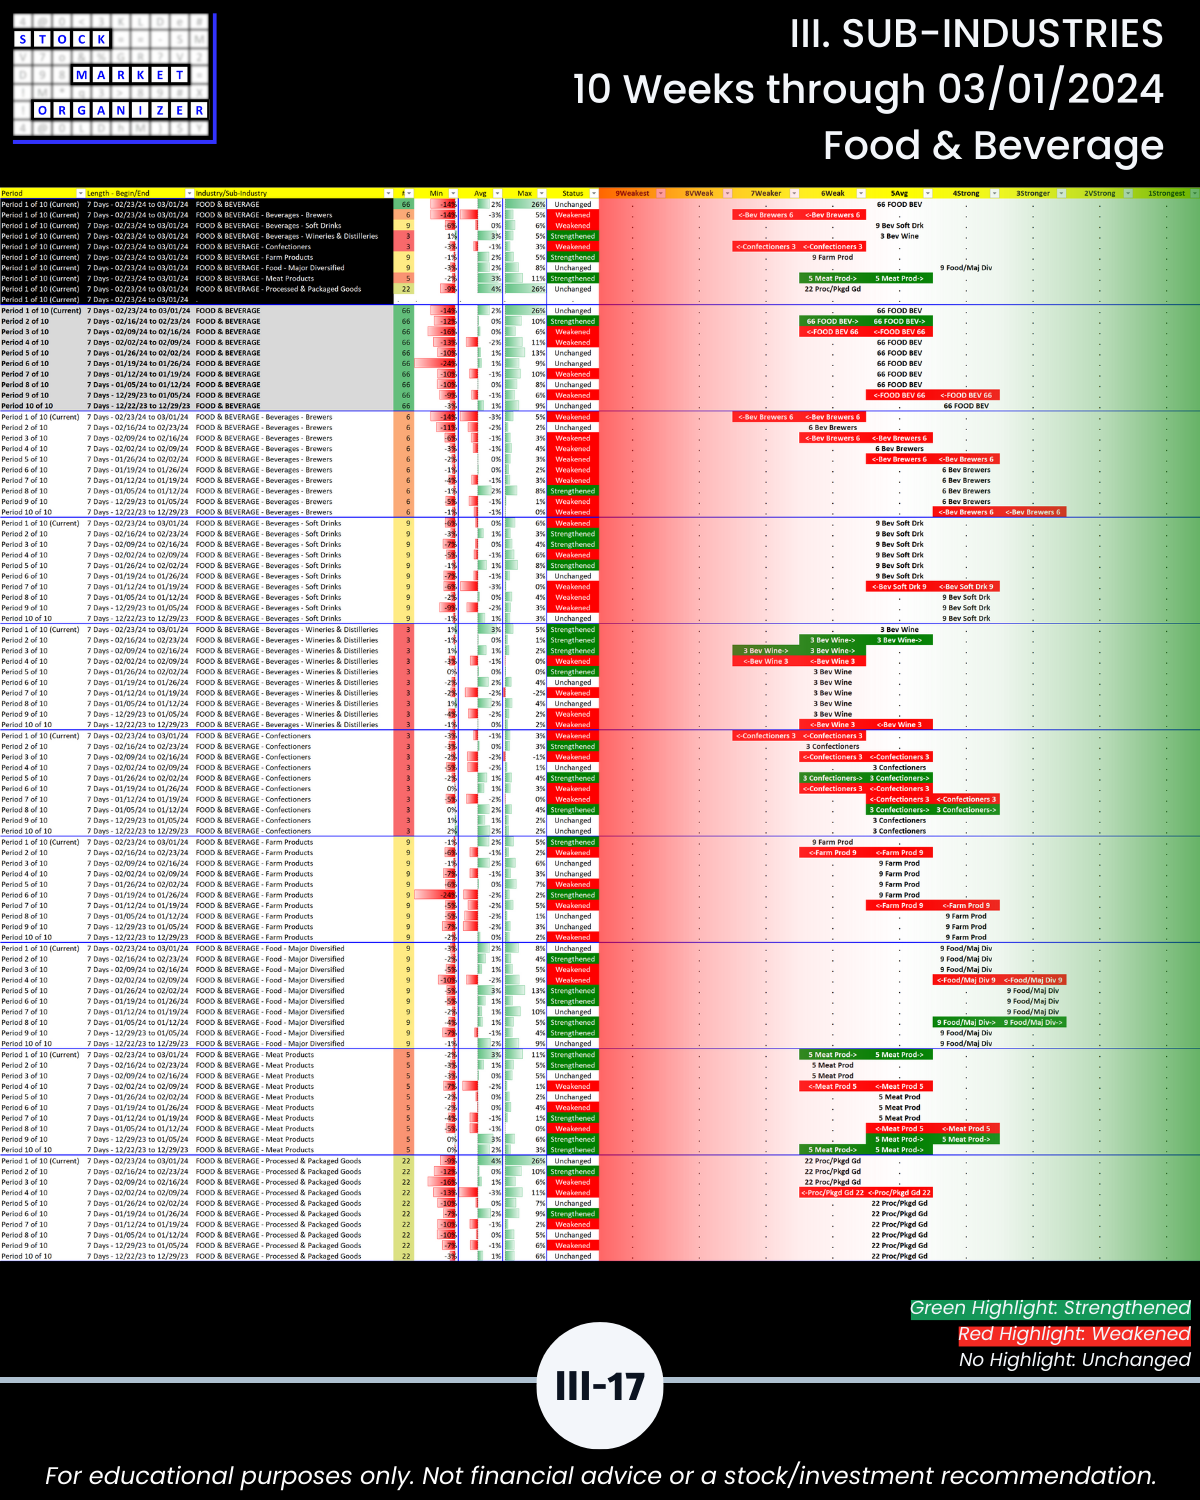
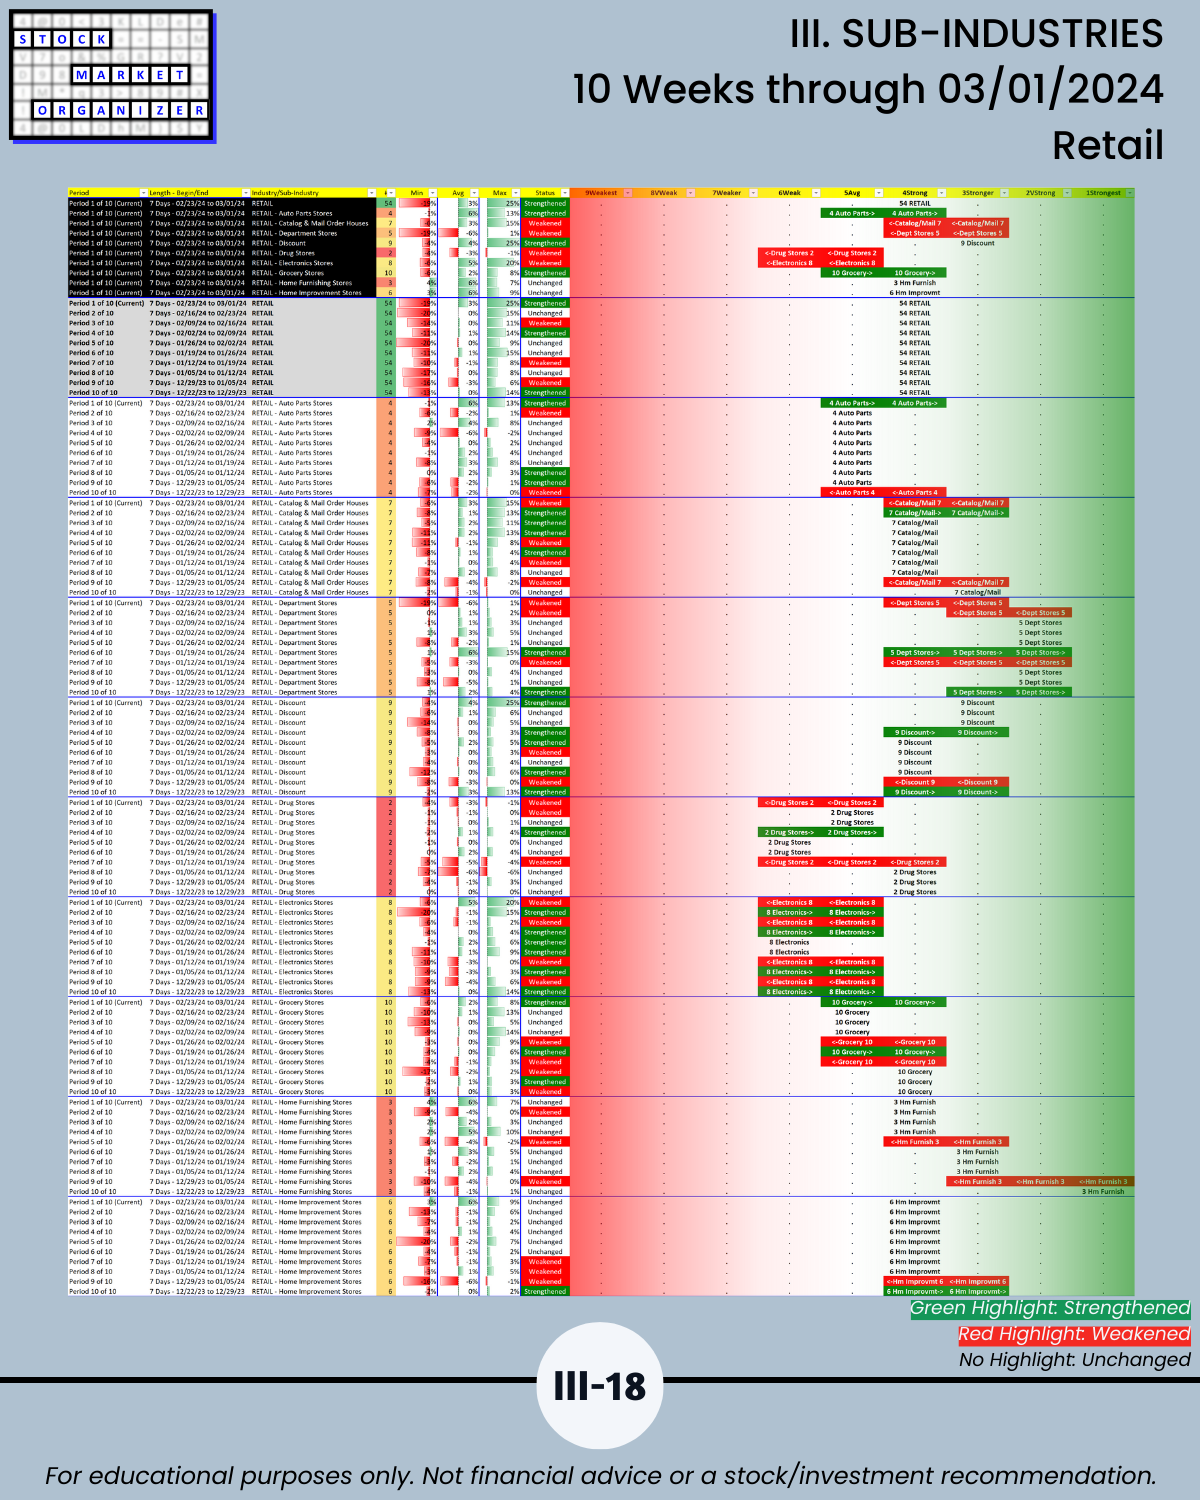
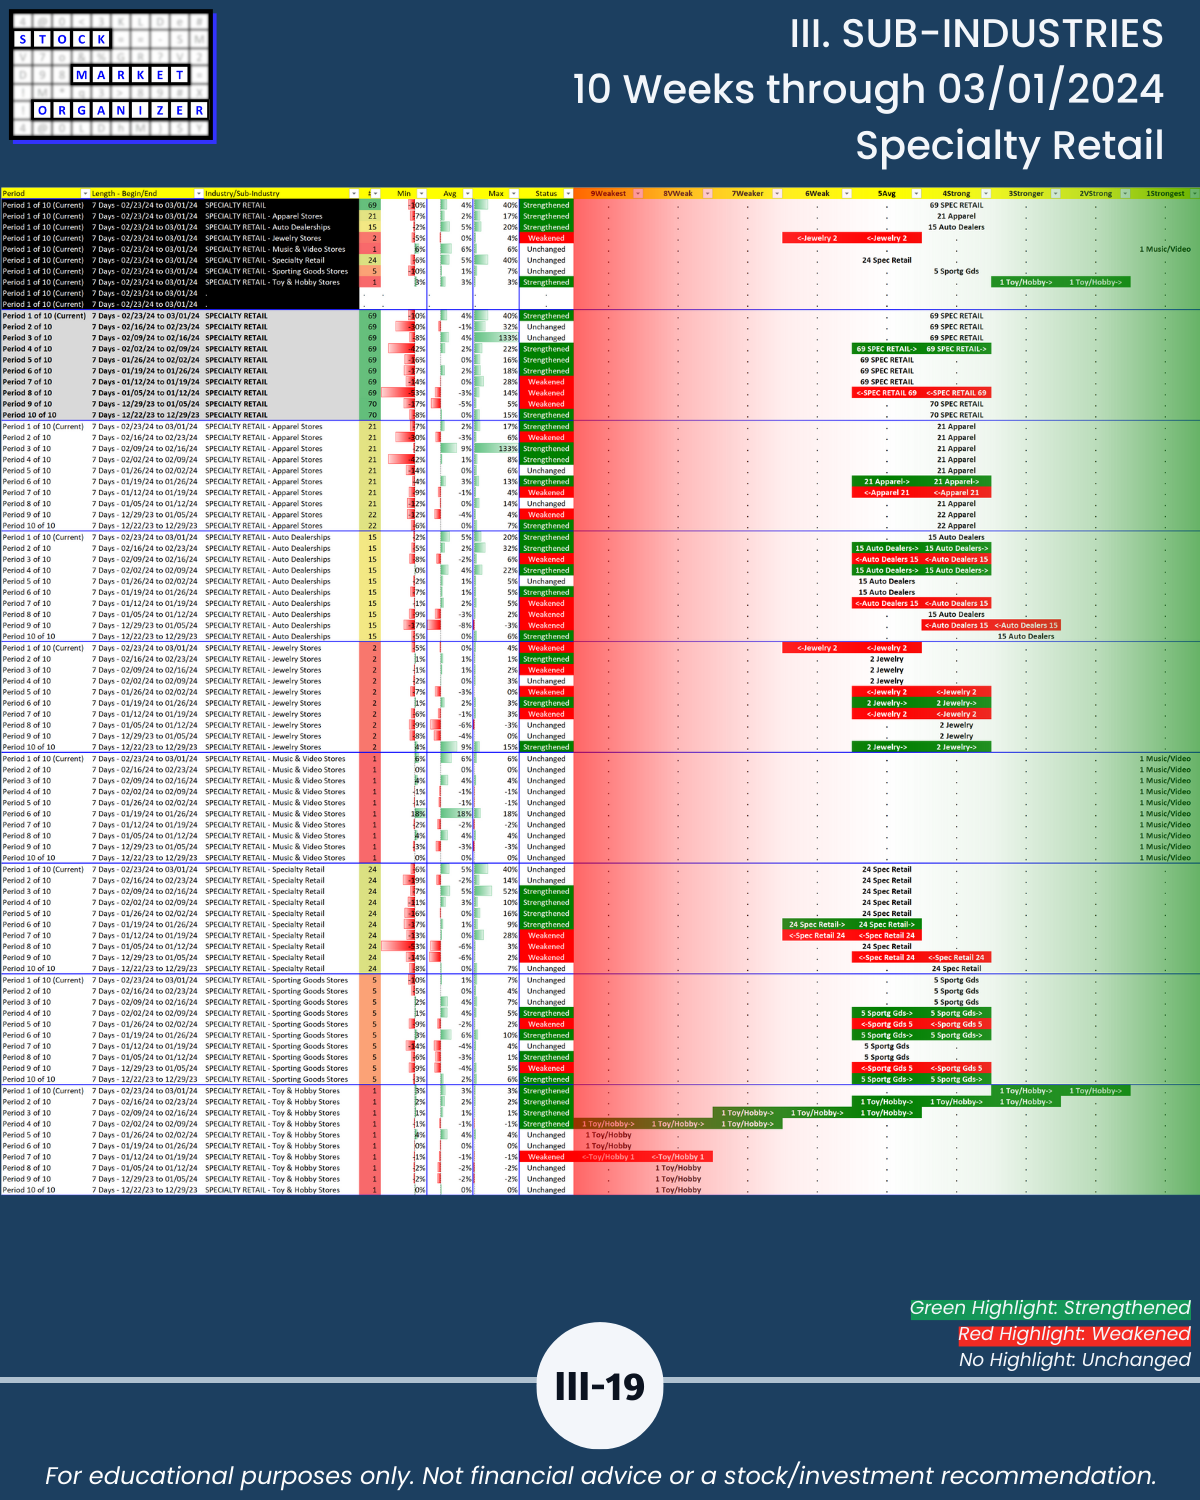
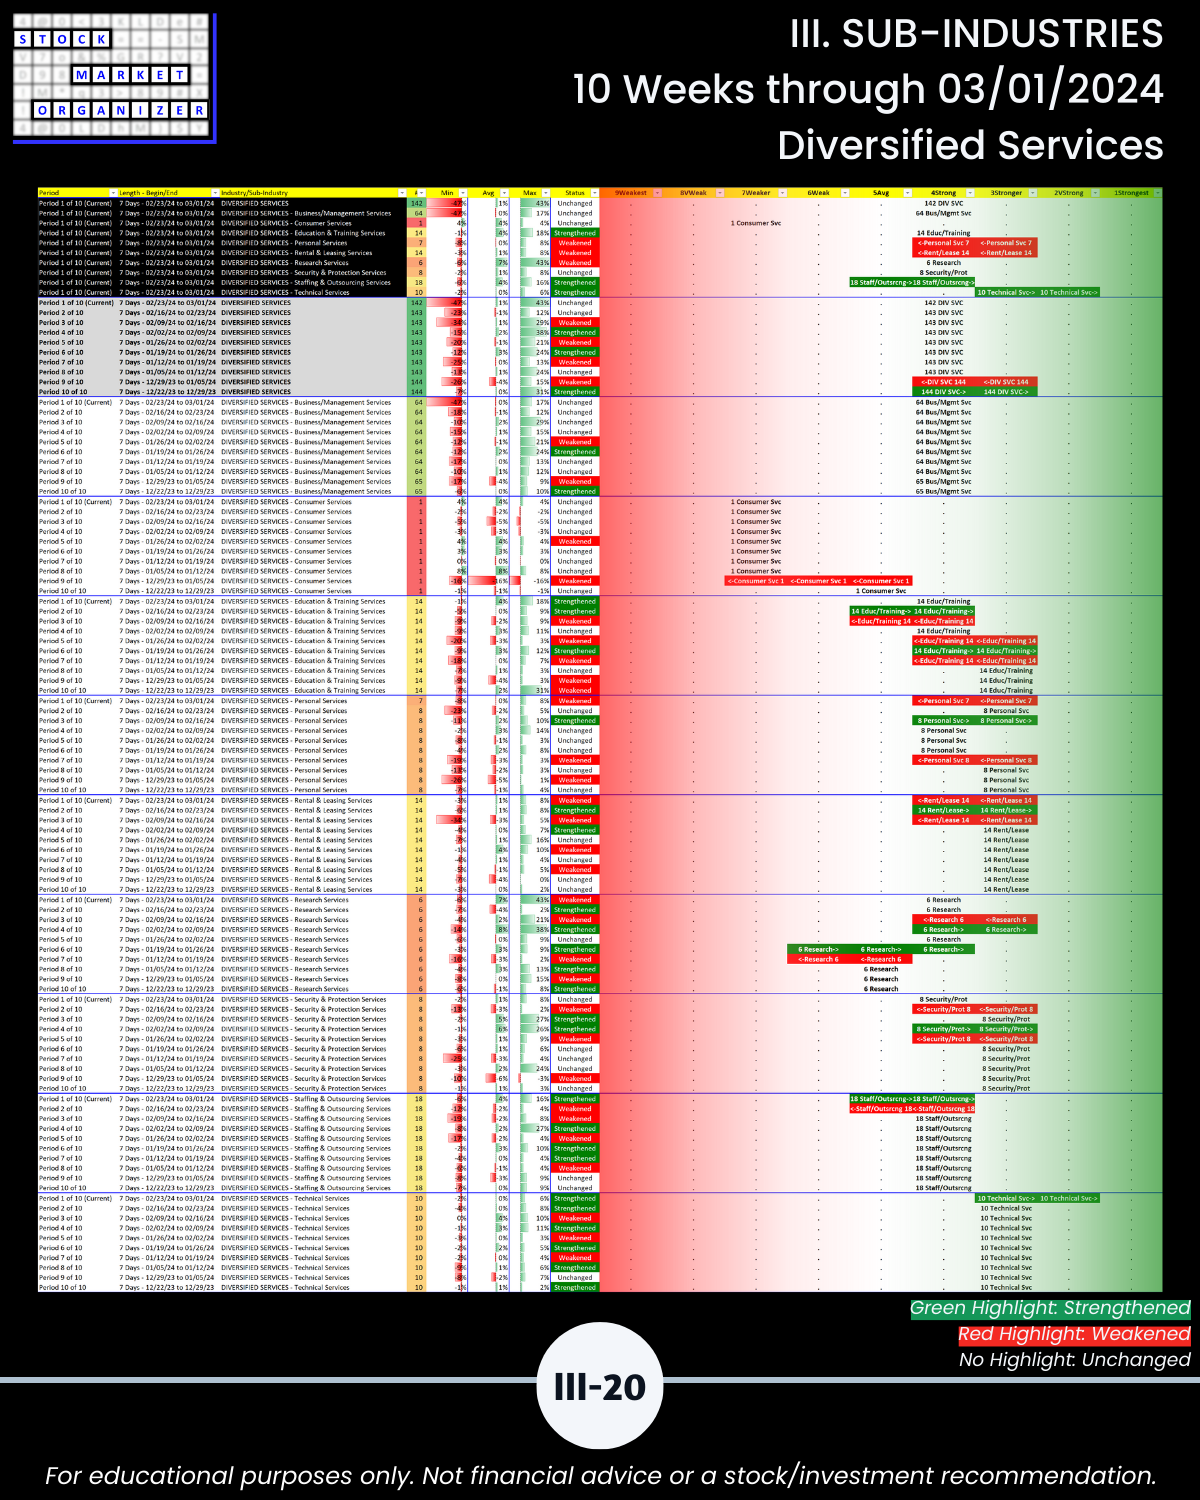
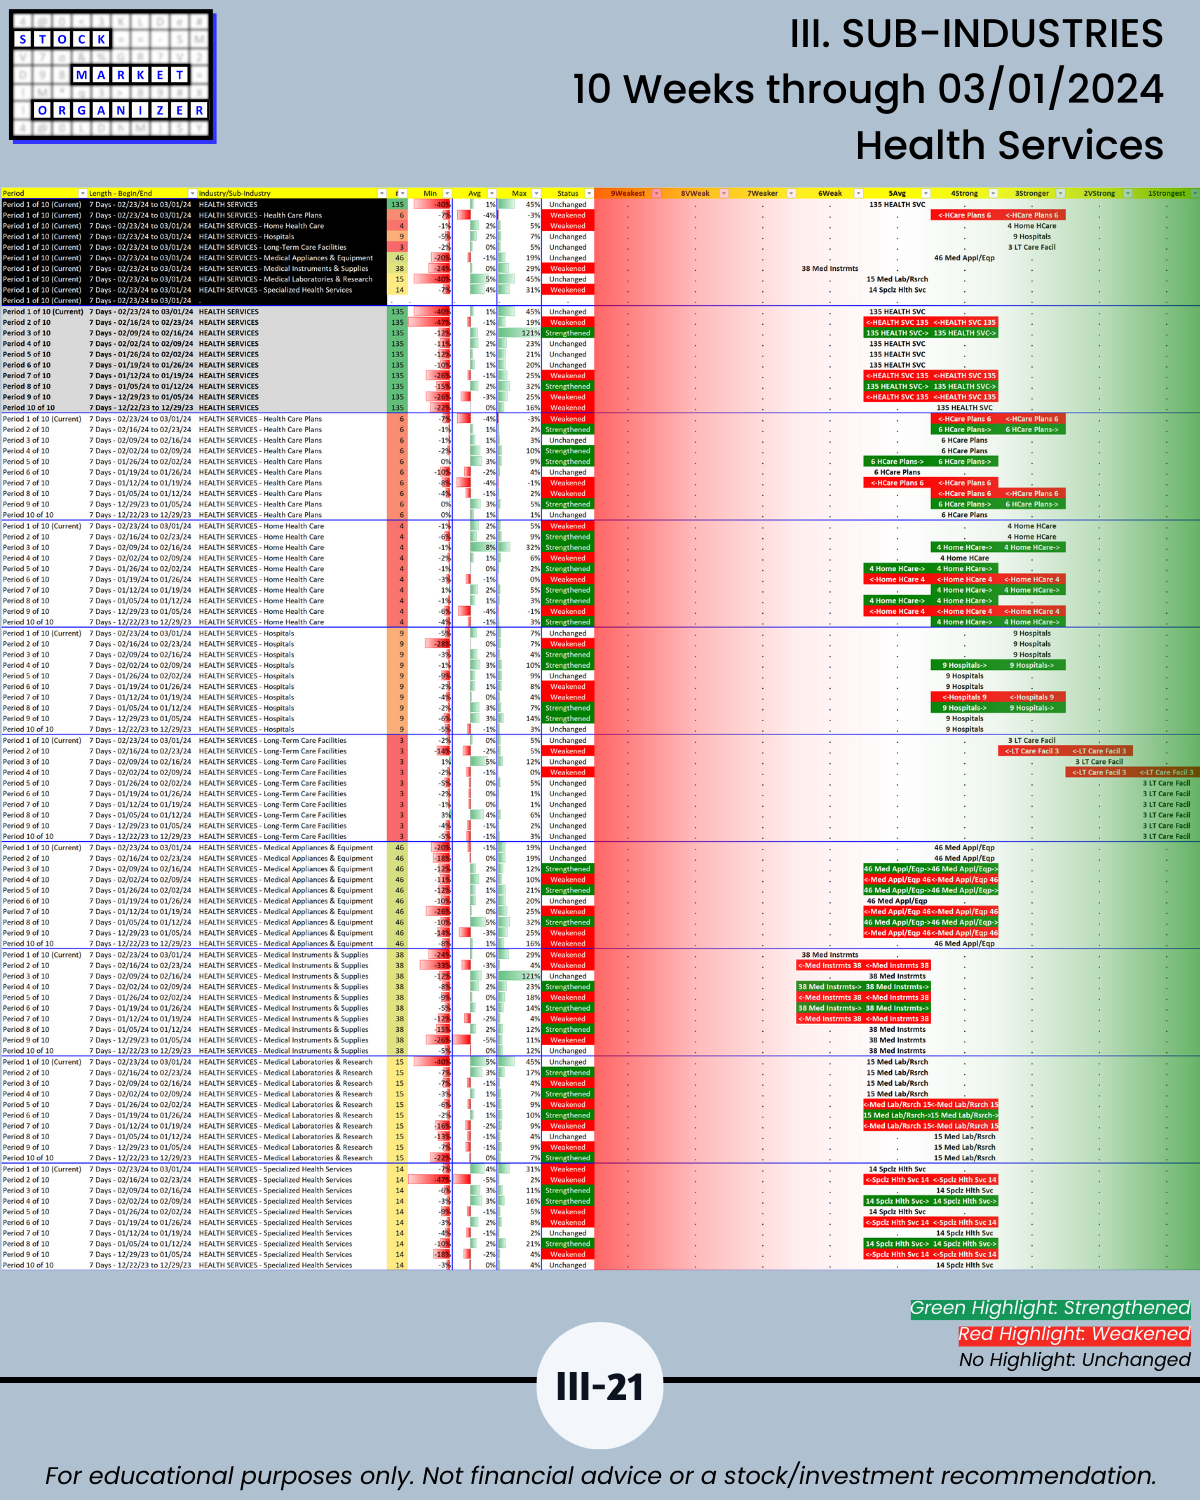
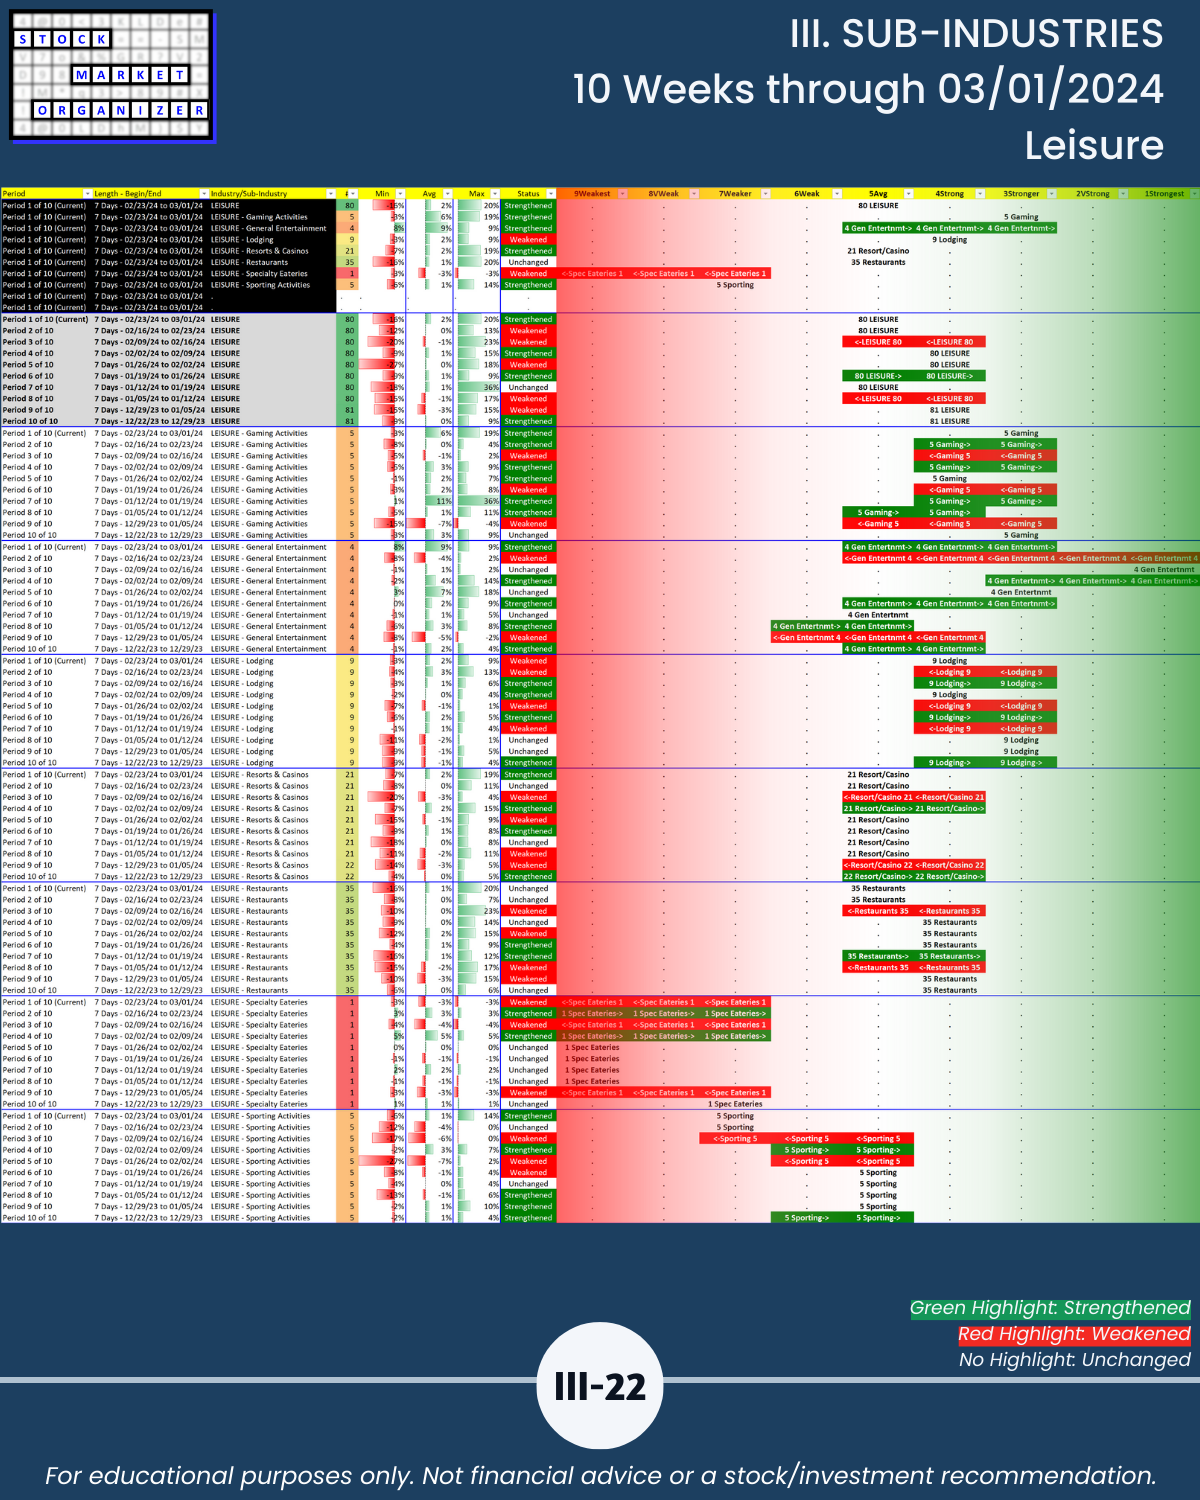
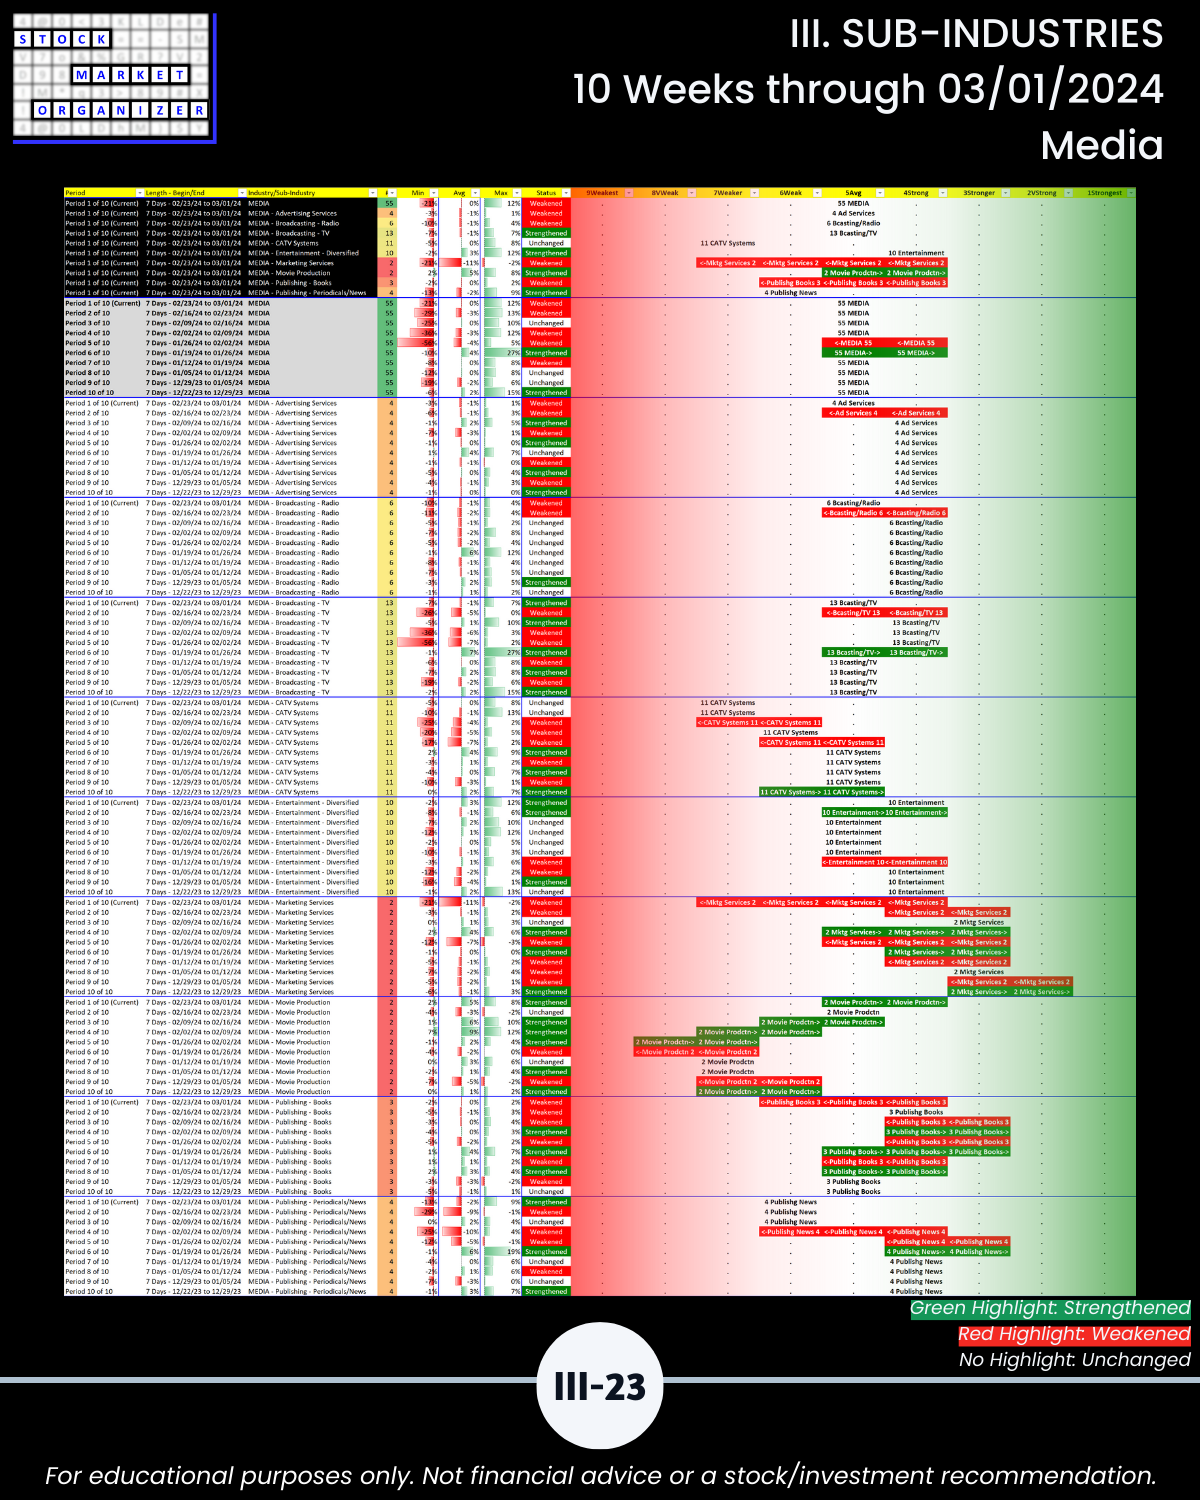
III. SUB-INDUSTRIES/10-Week Individual Sub-Industry Strength Reports
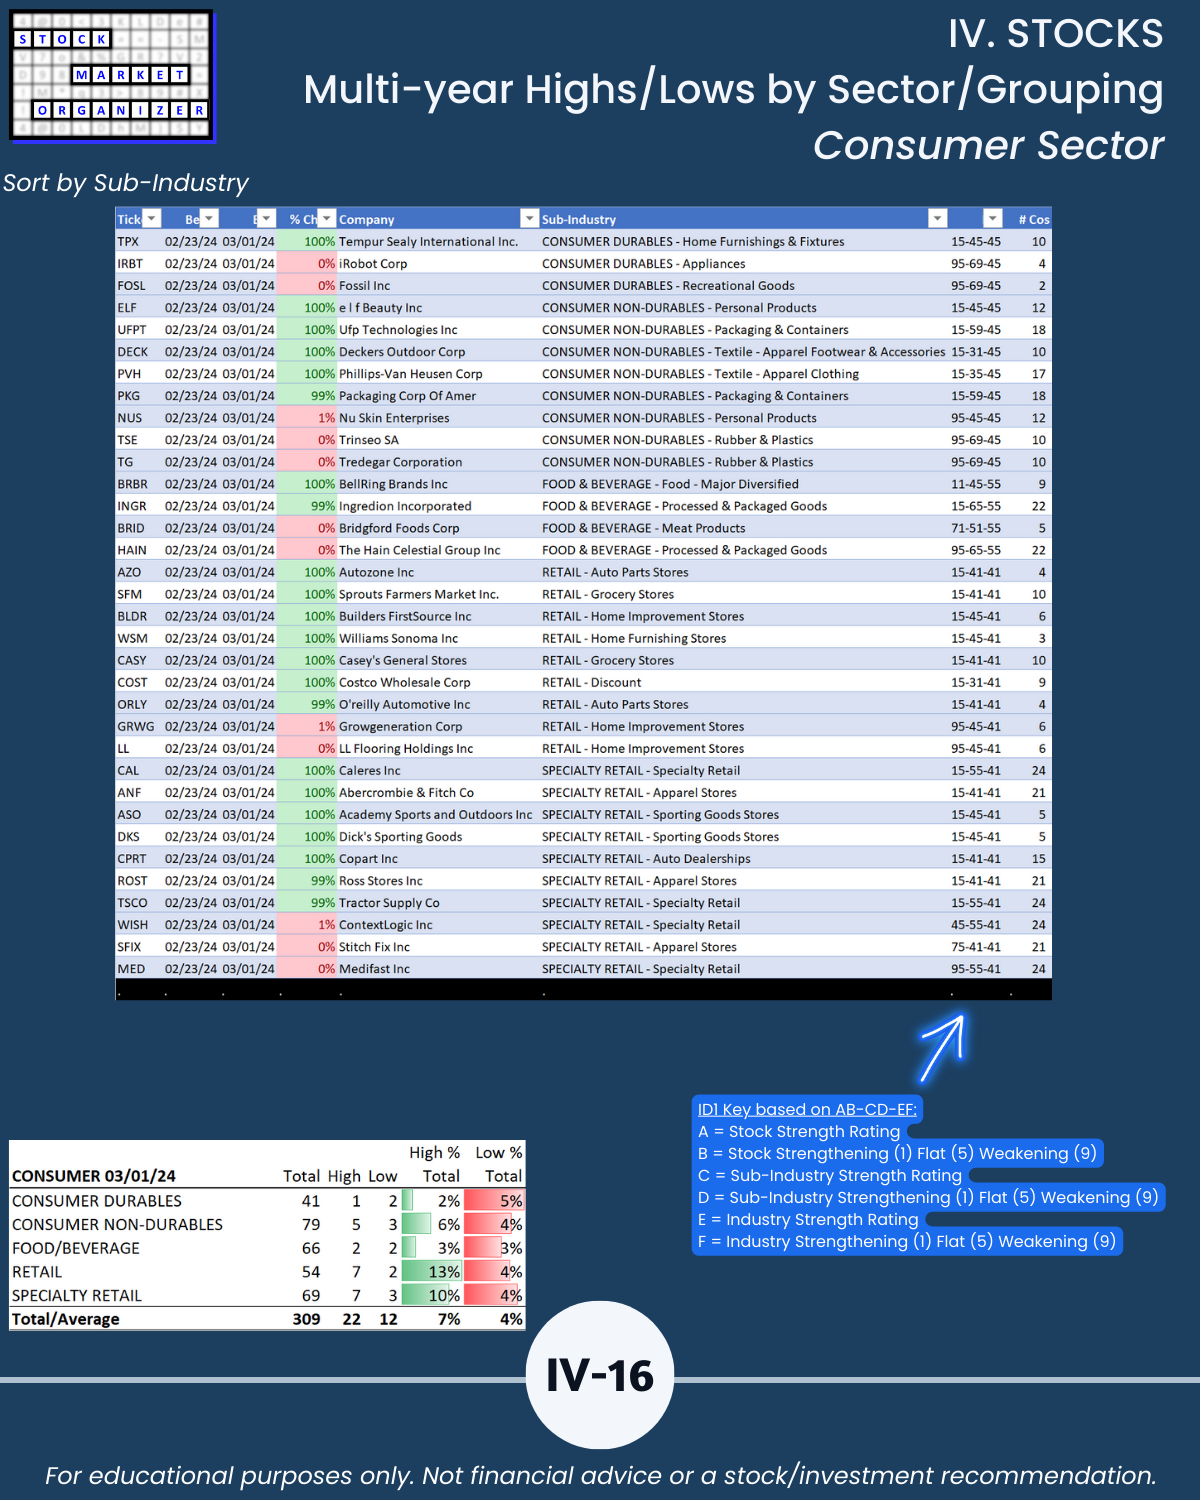
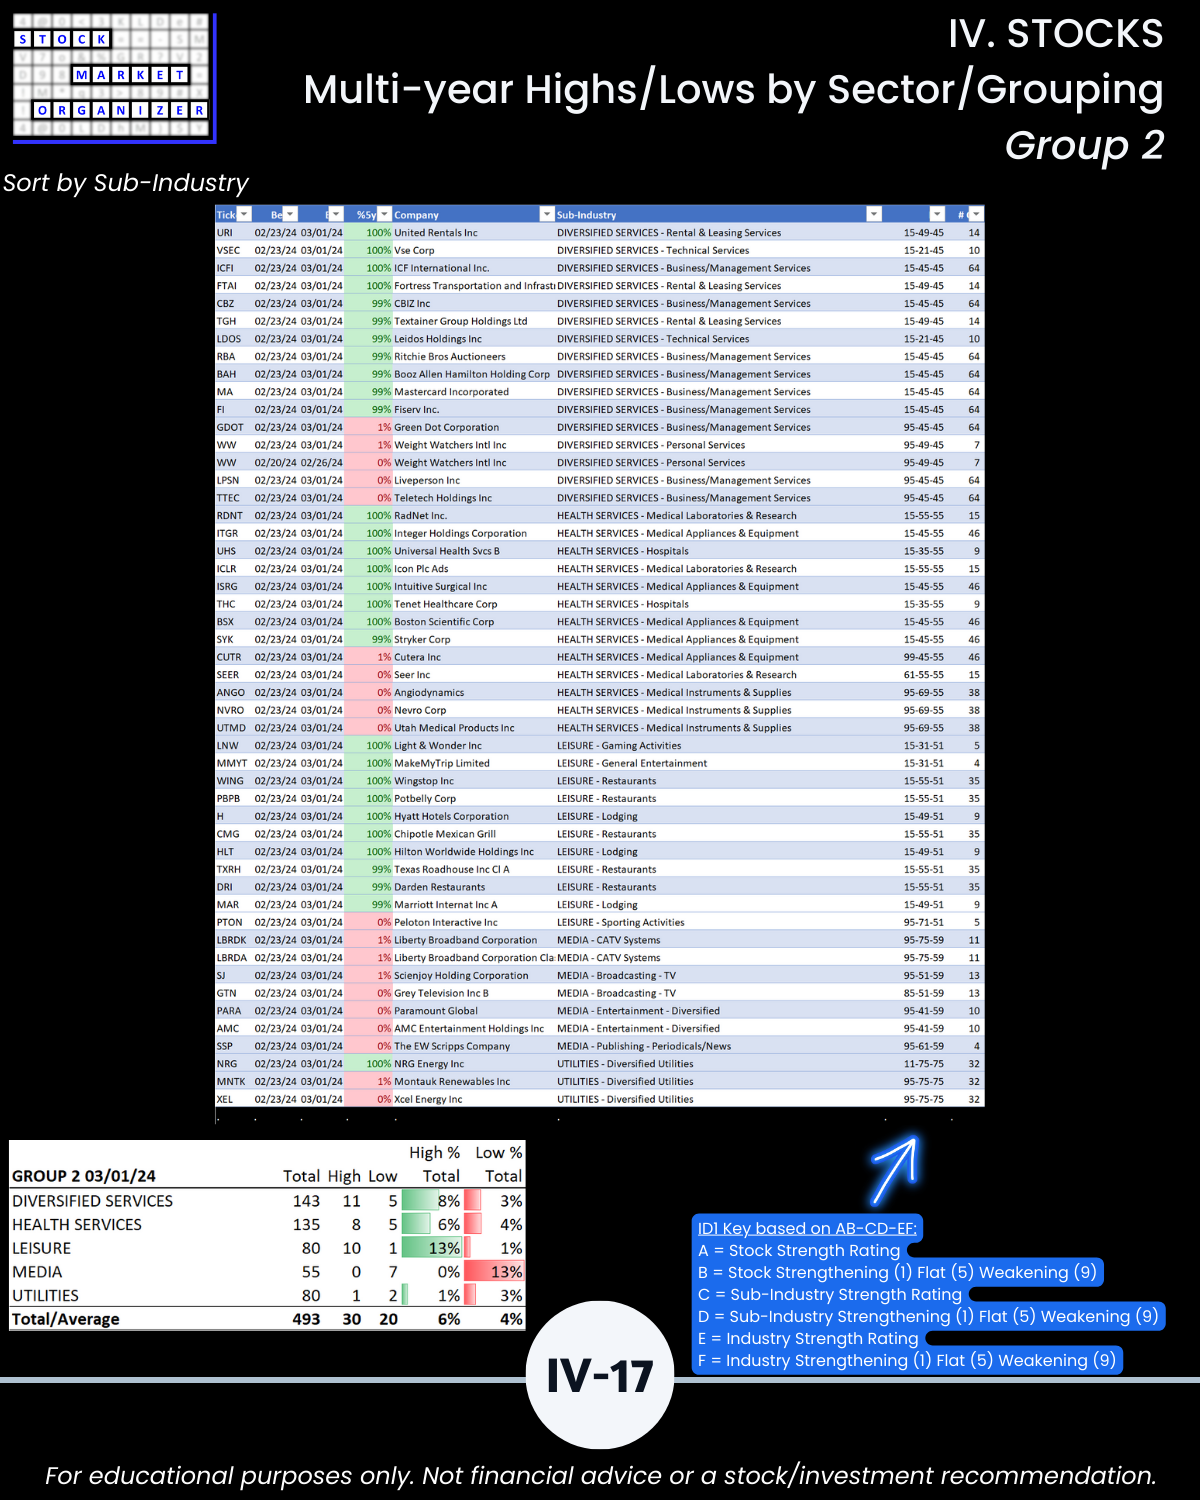
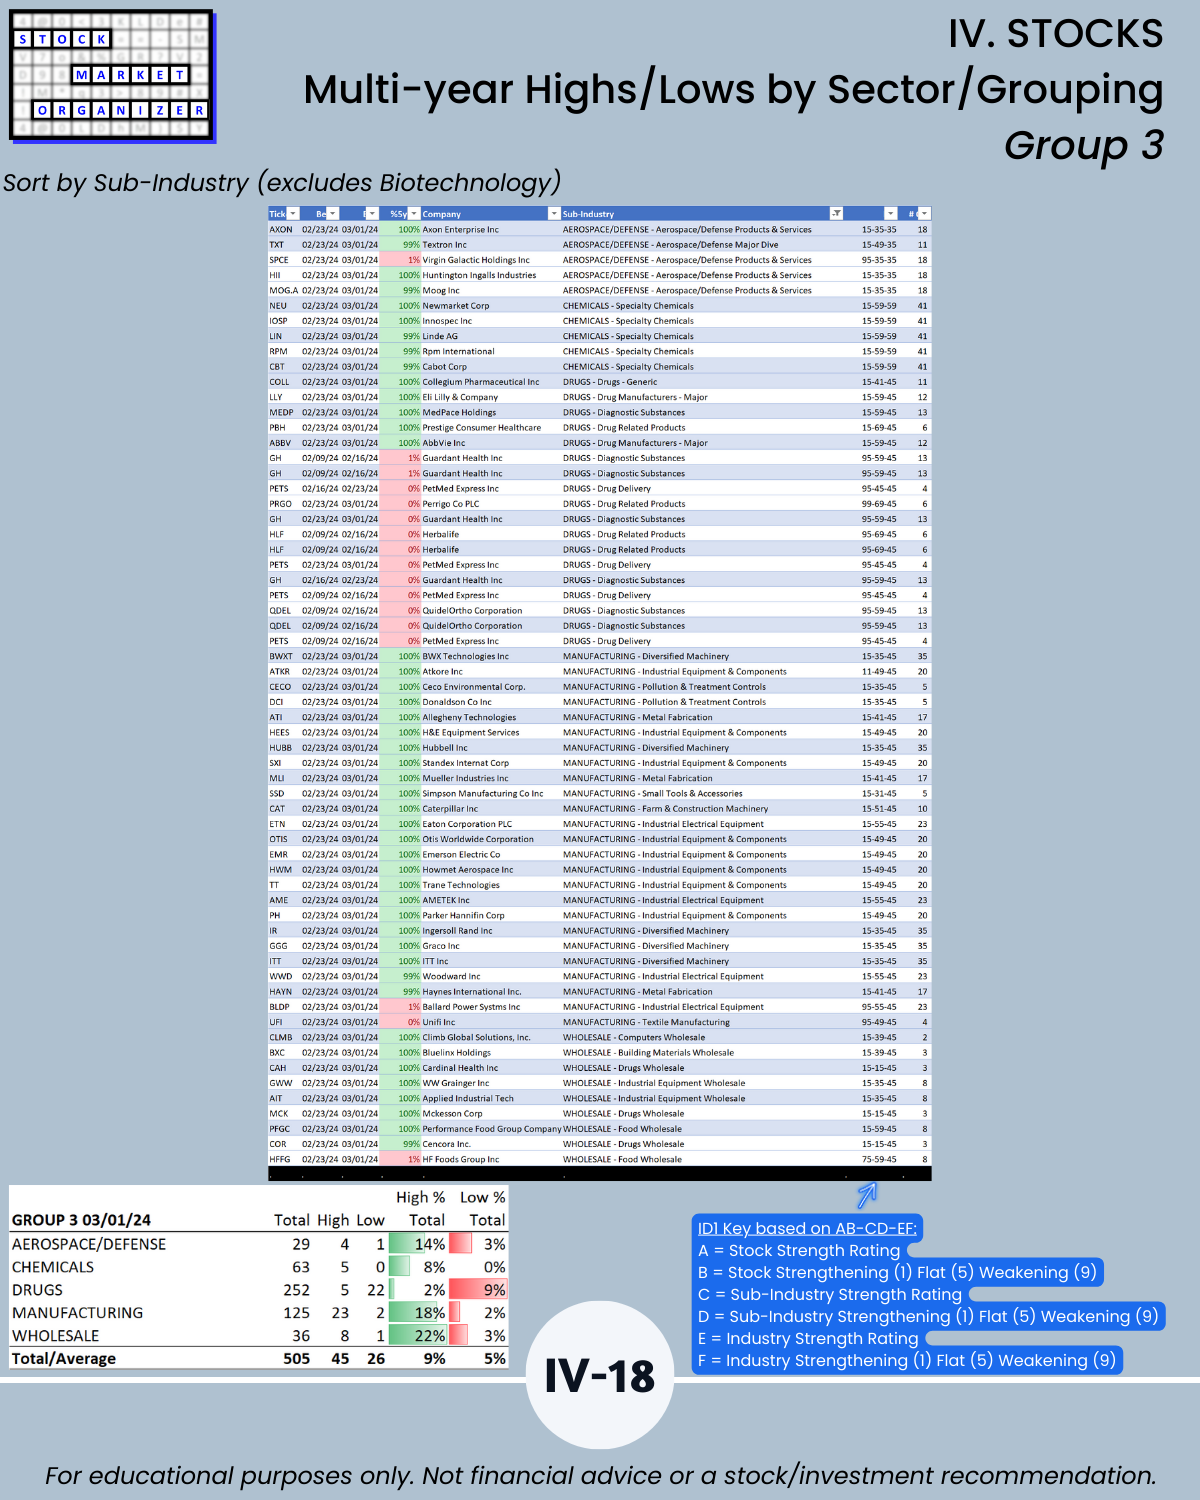
IV. STOCKS/Stock Sorts
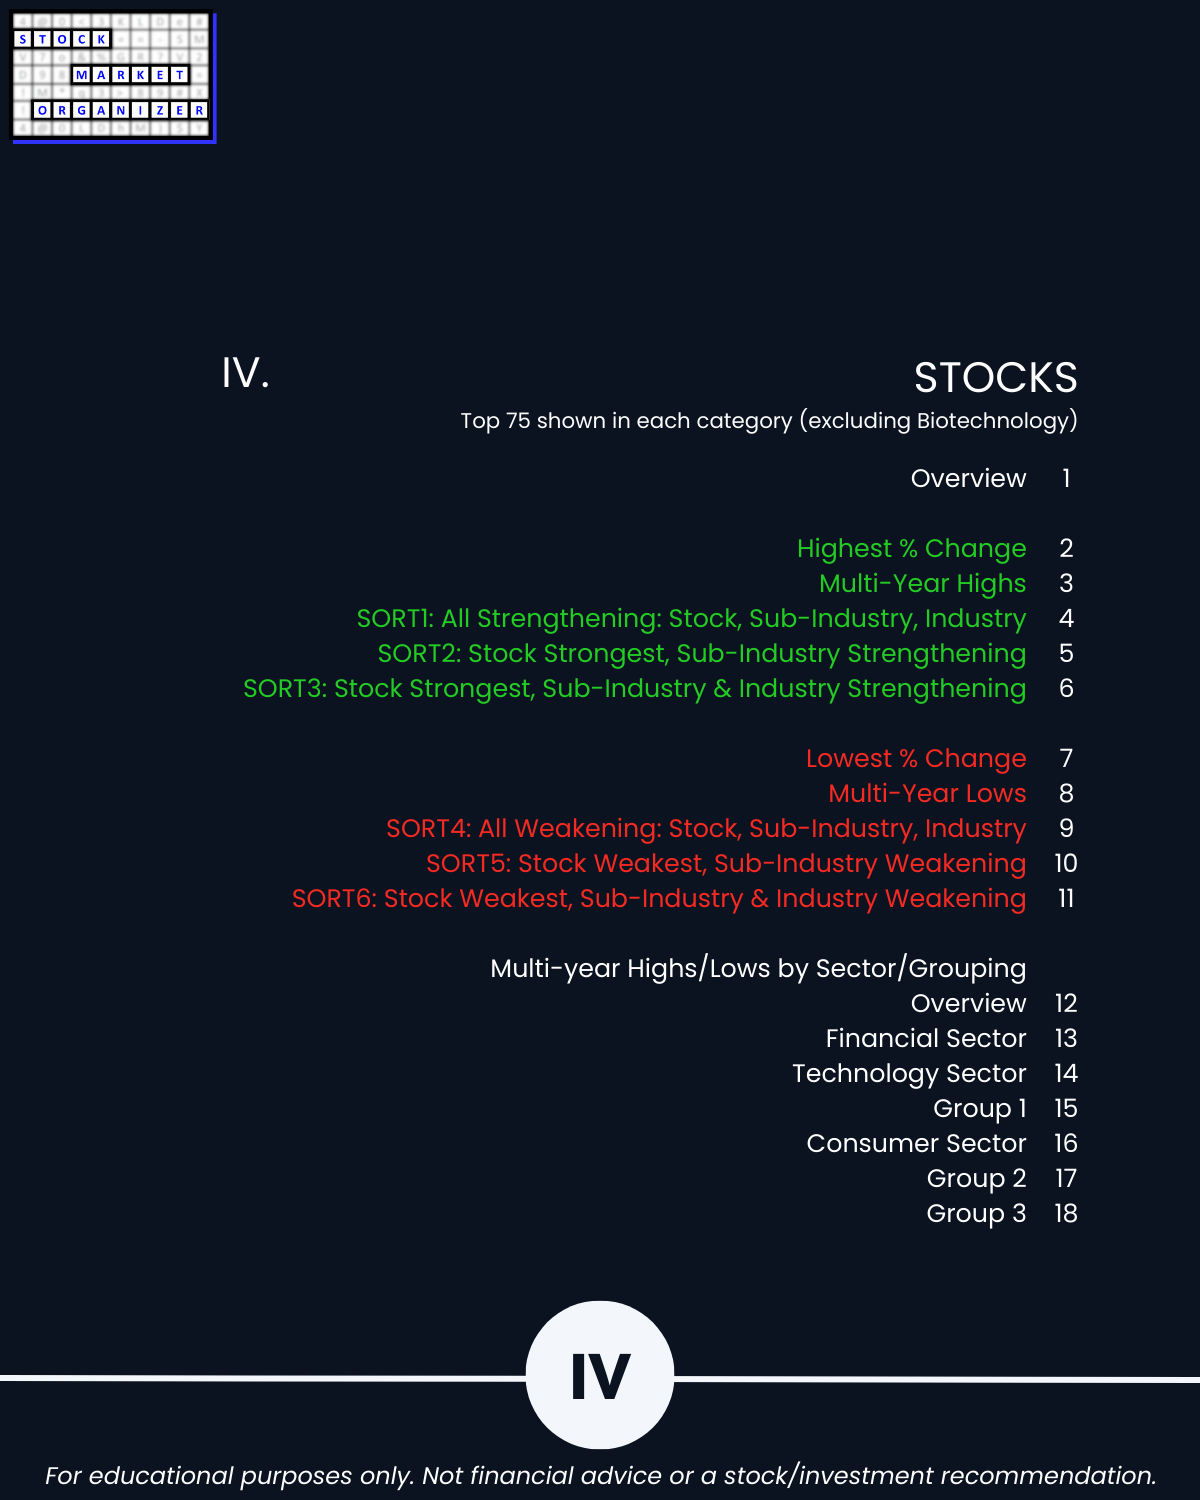
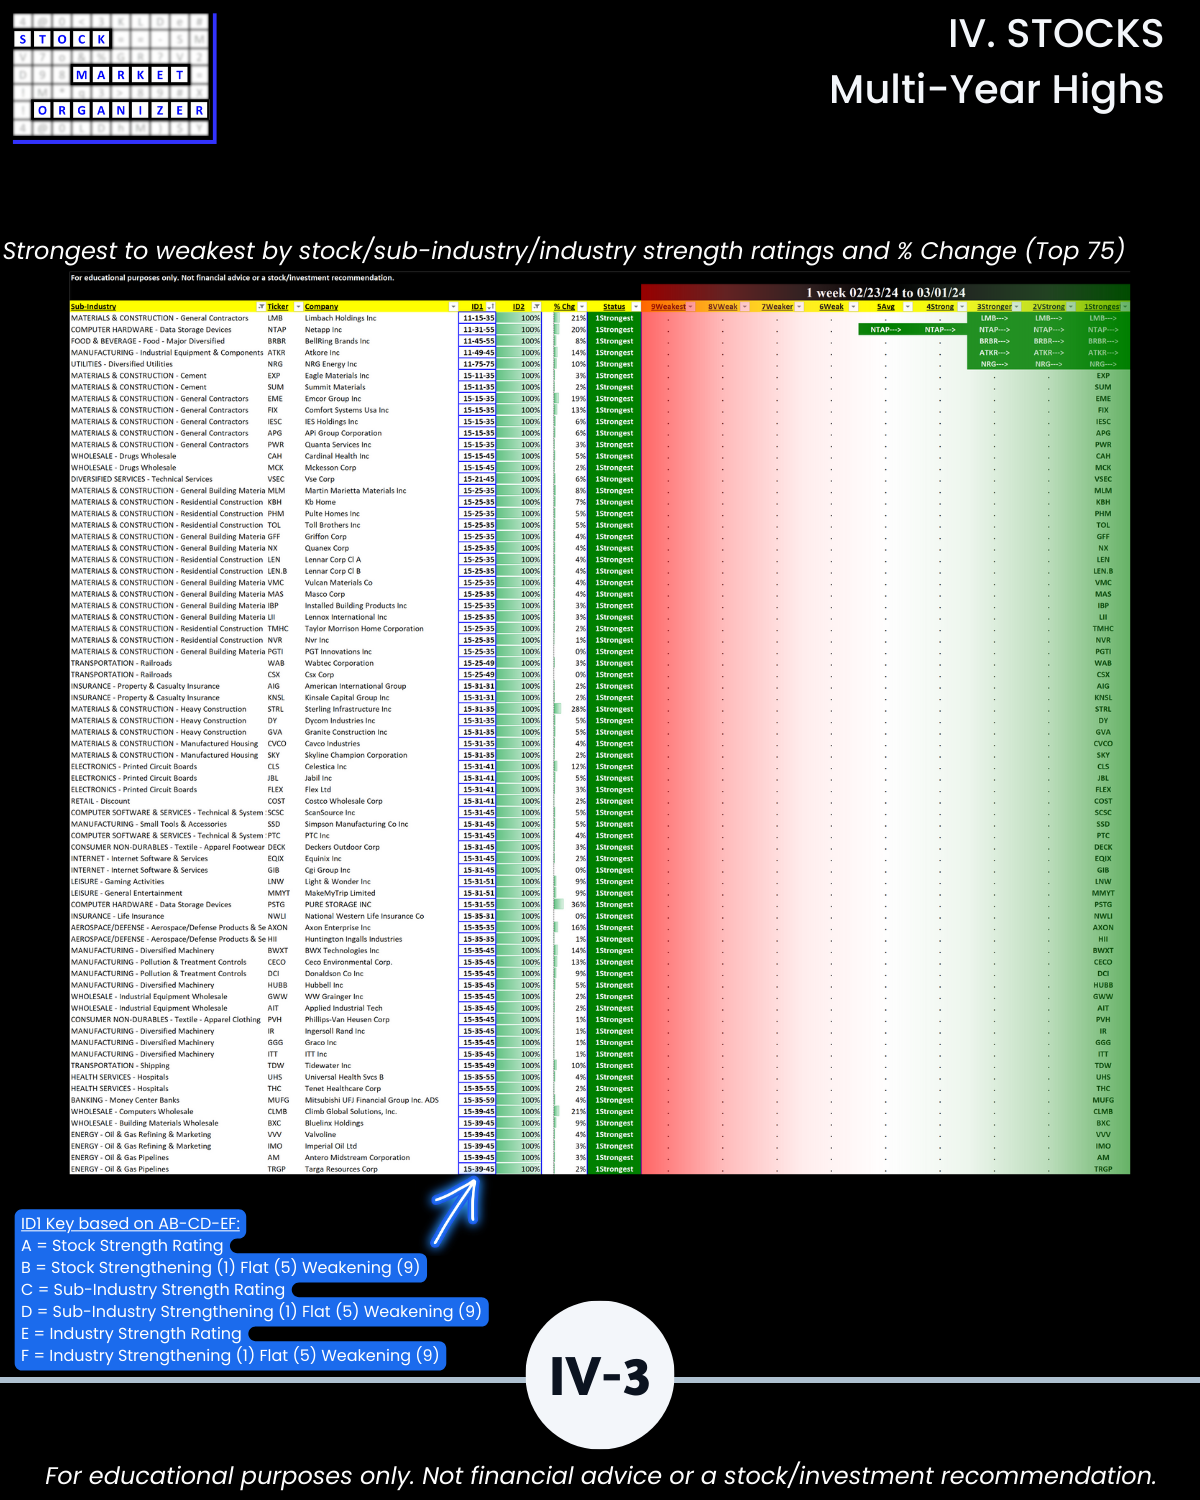
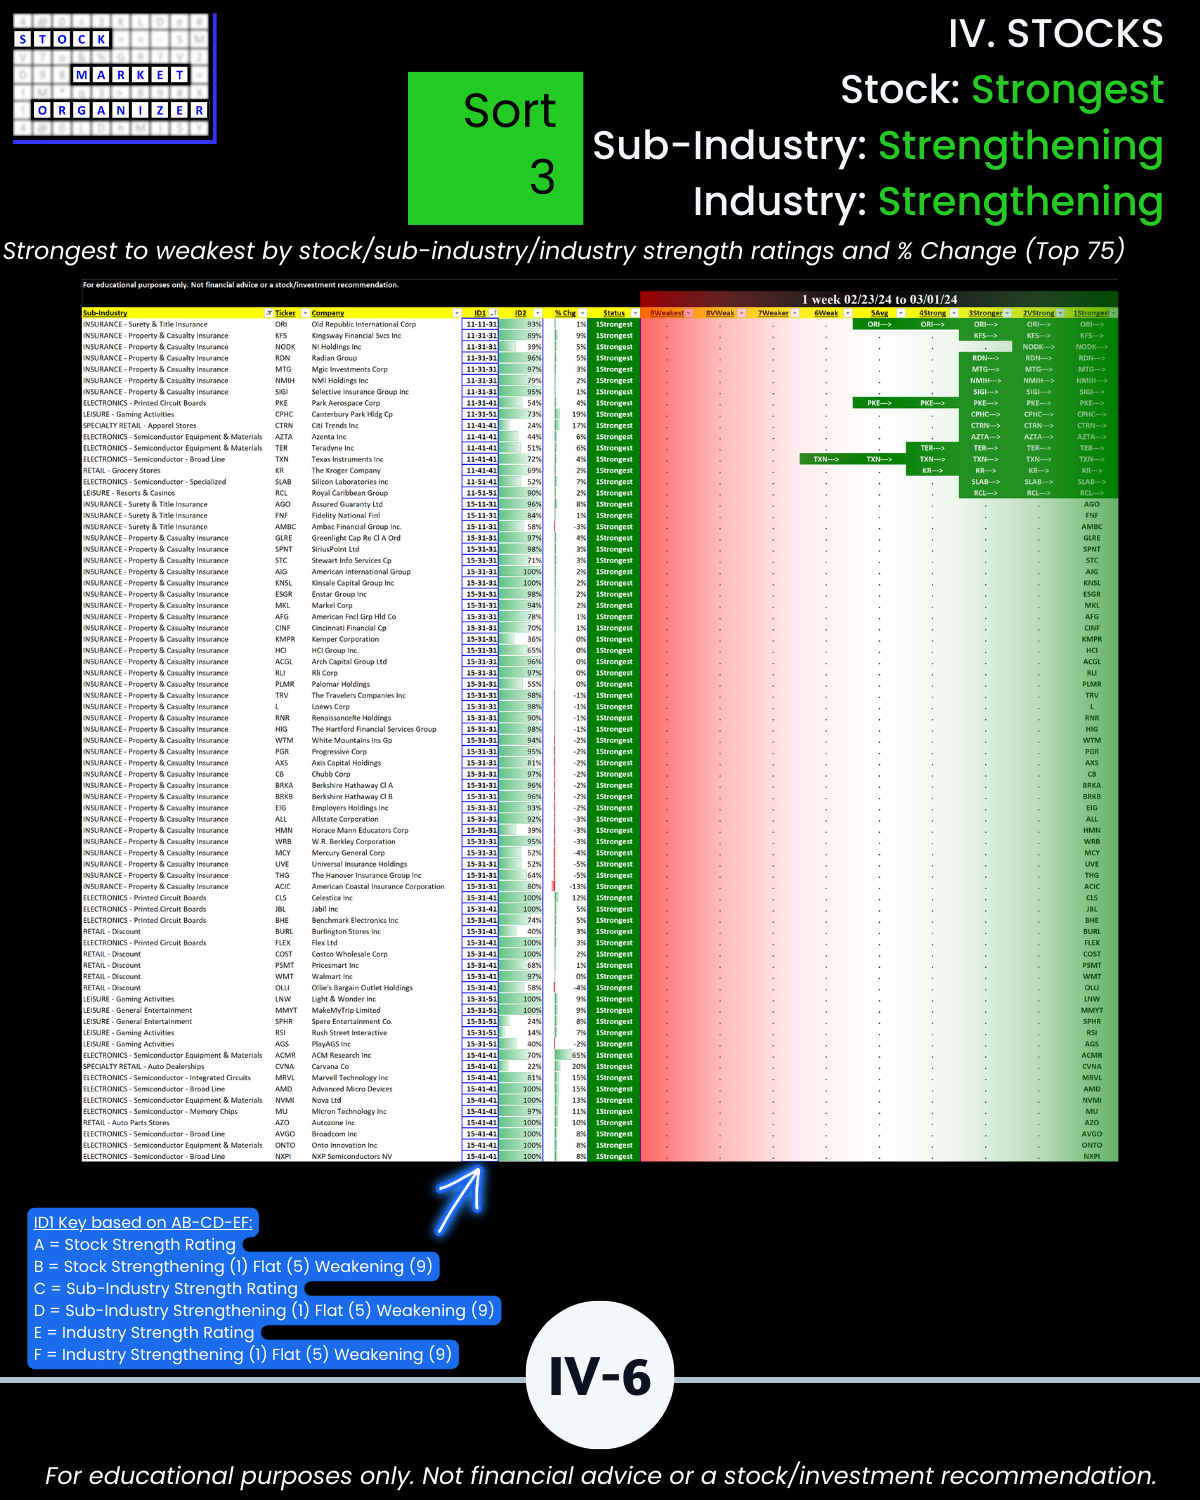
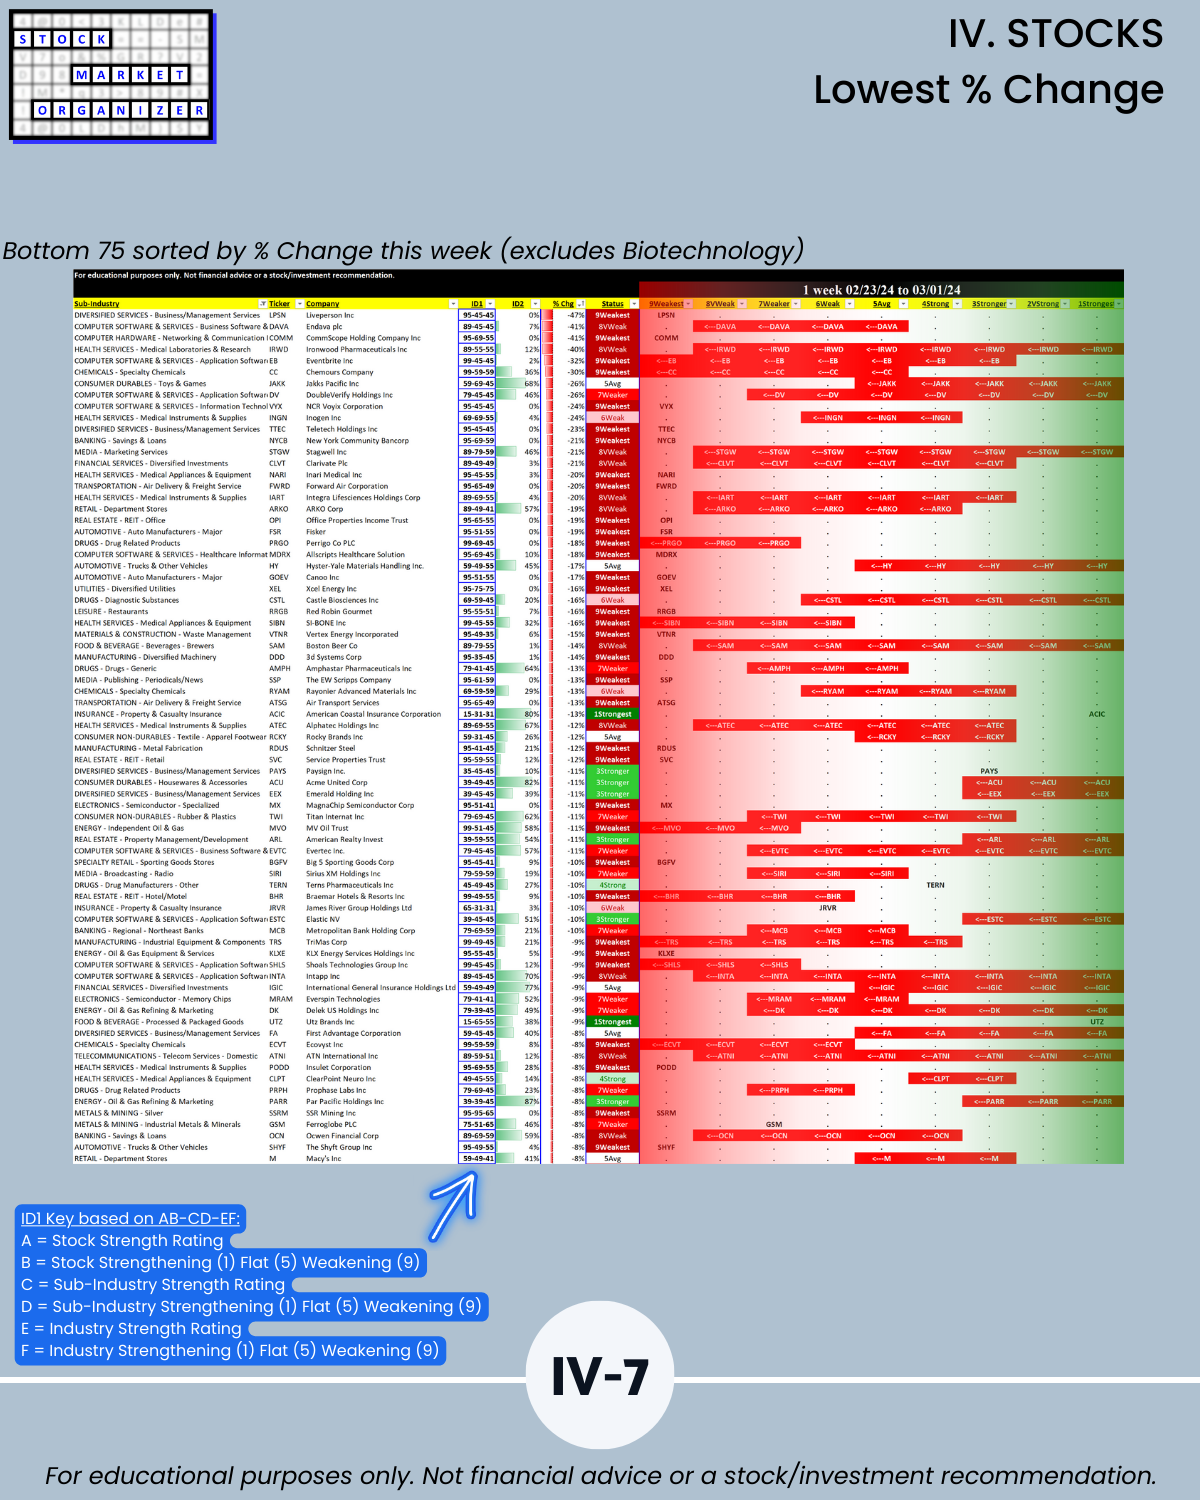
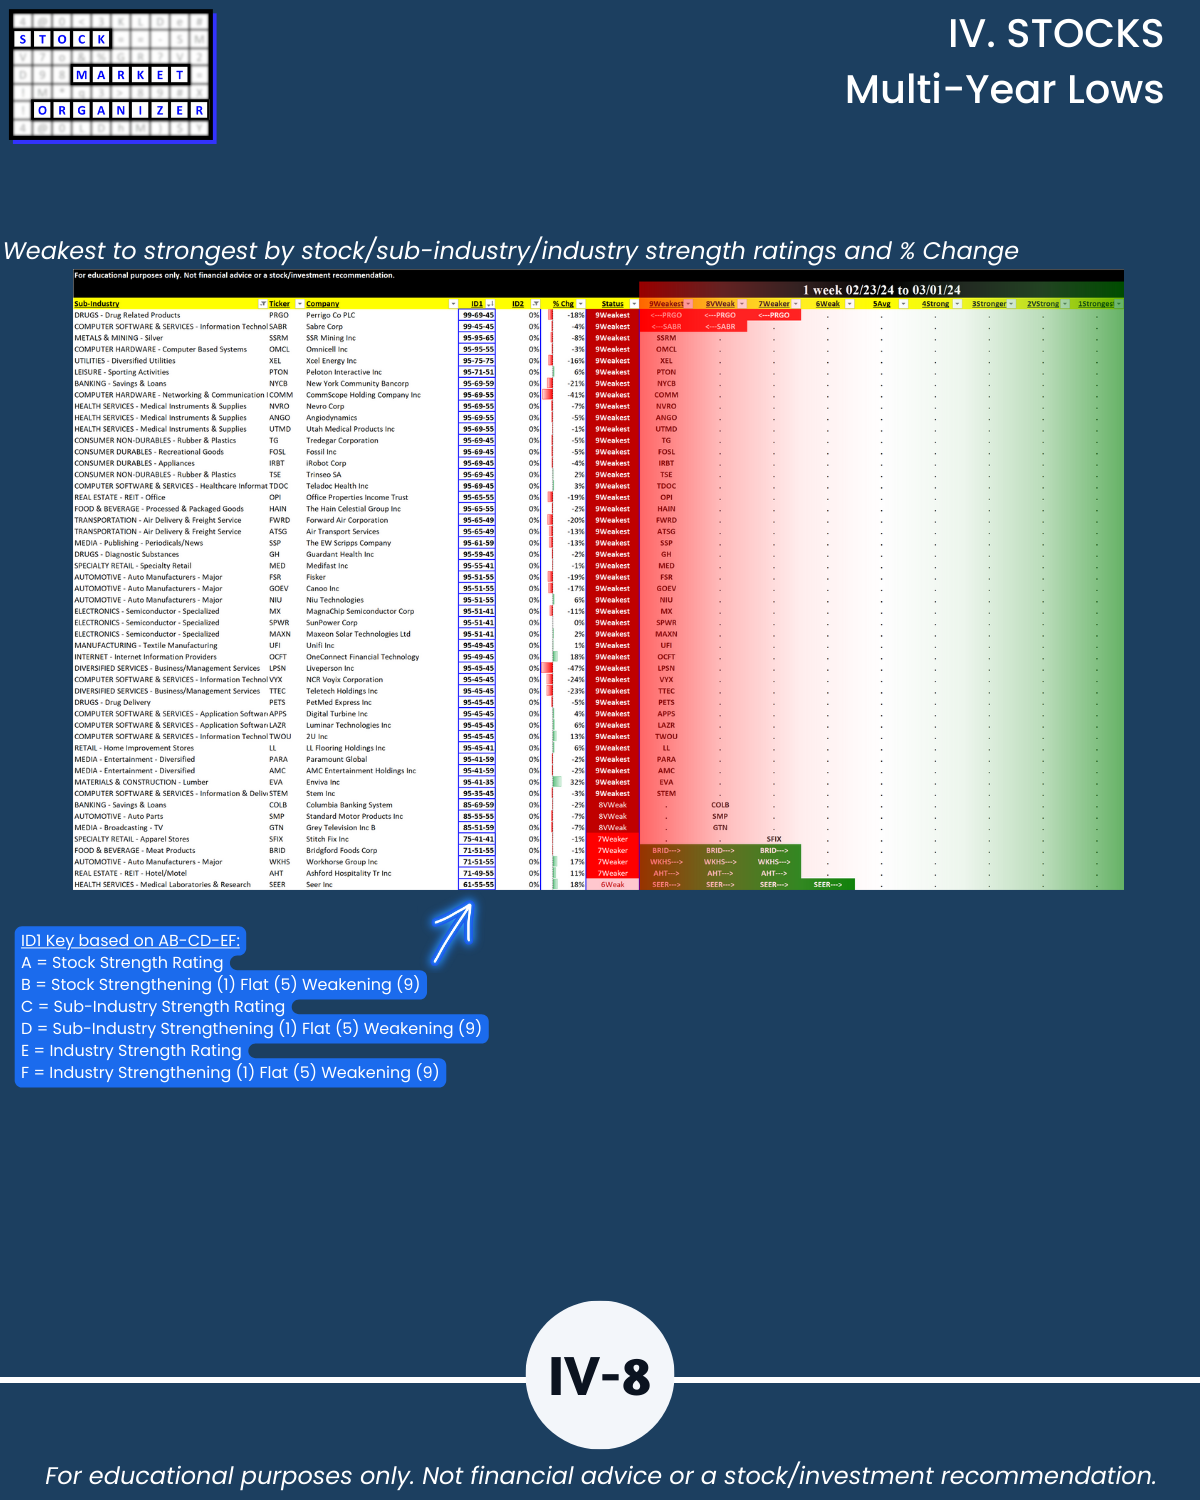
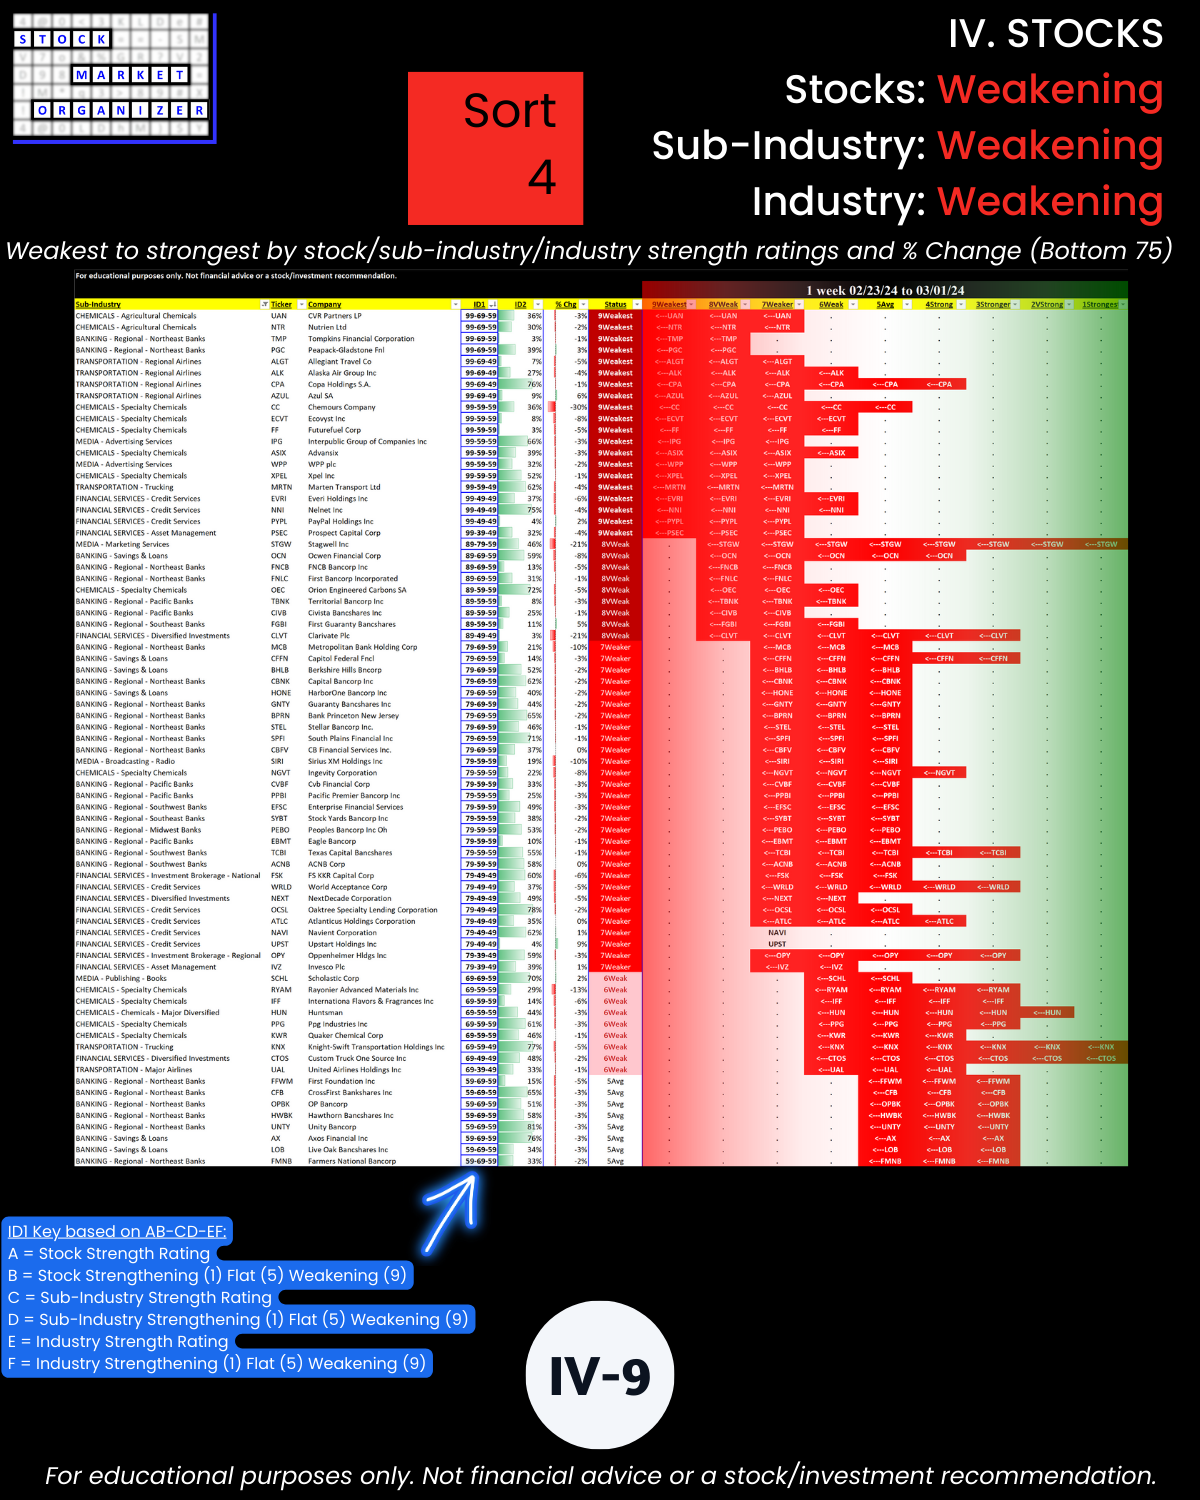
IV. STOCKS/Stock Sorts, Multi-Year Highs/Lows by Sector/Grouping