SMO Exclusive: U.S. Stock Market Strength Report 2024-02-09 (+26%, no new Shorts)

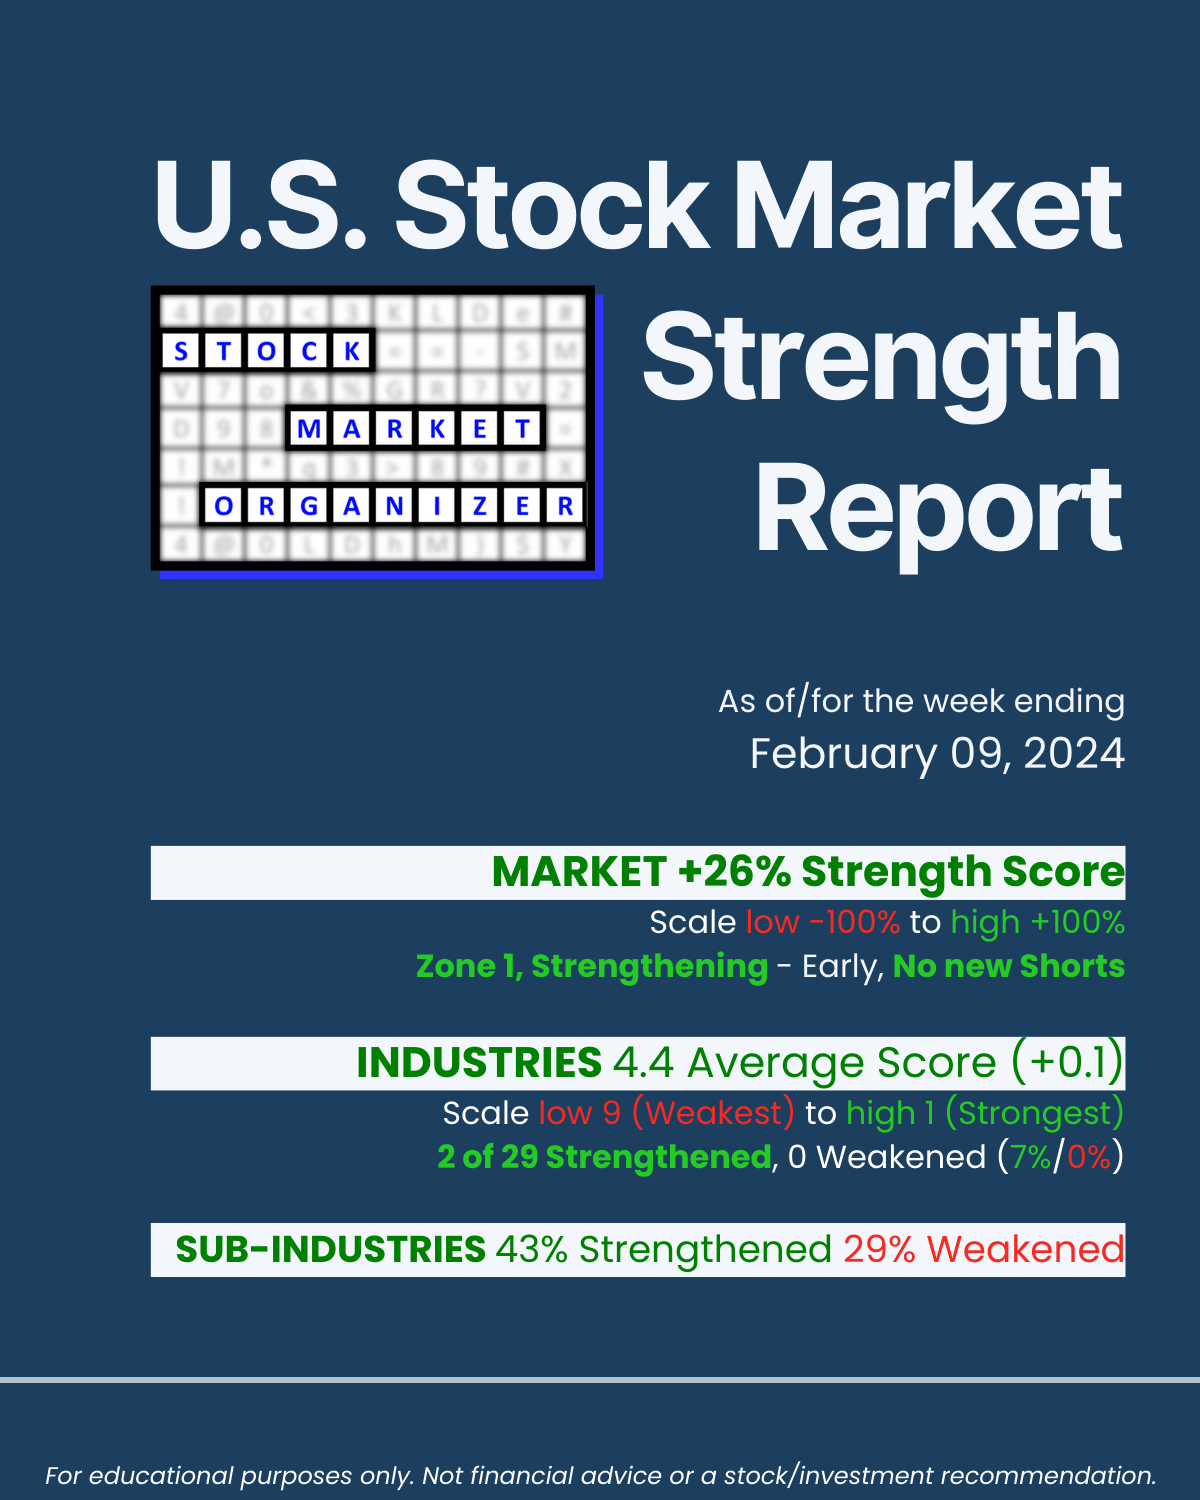
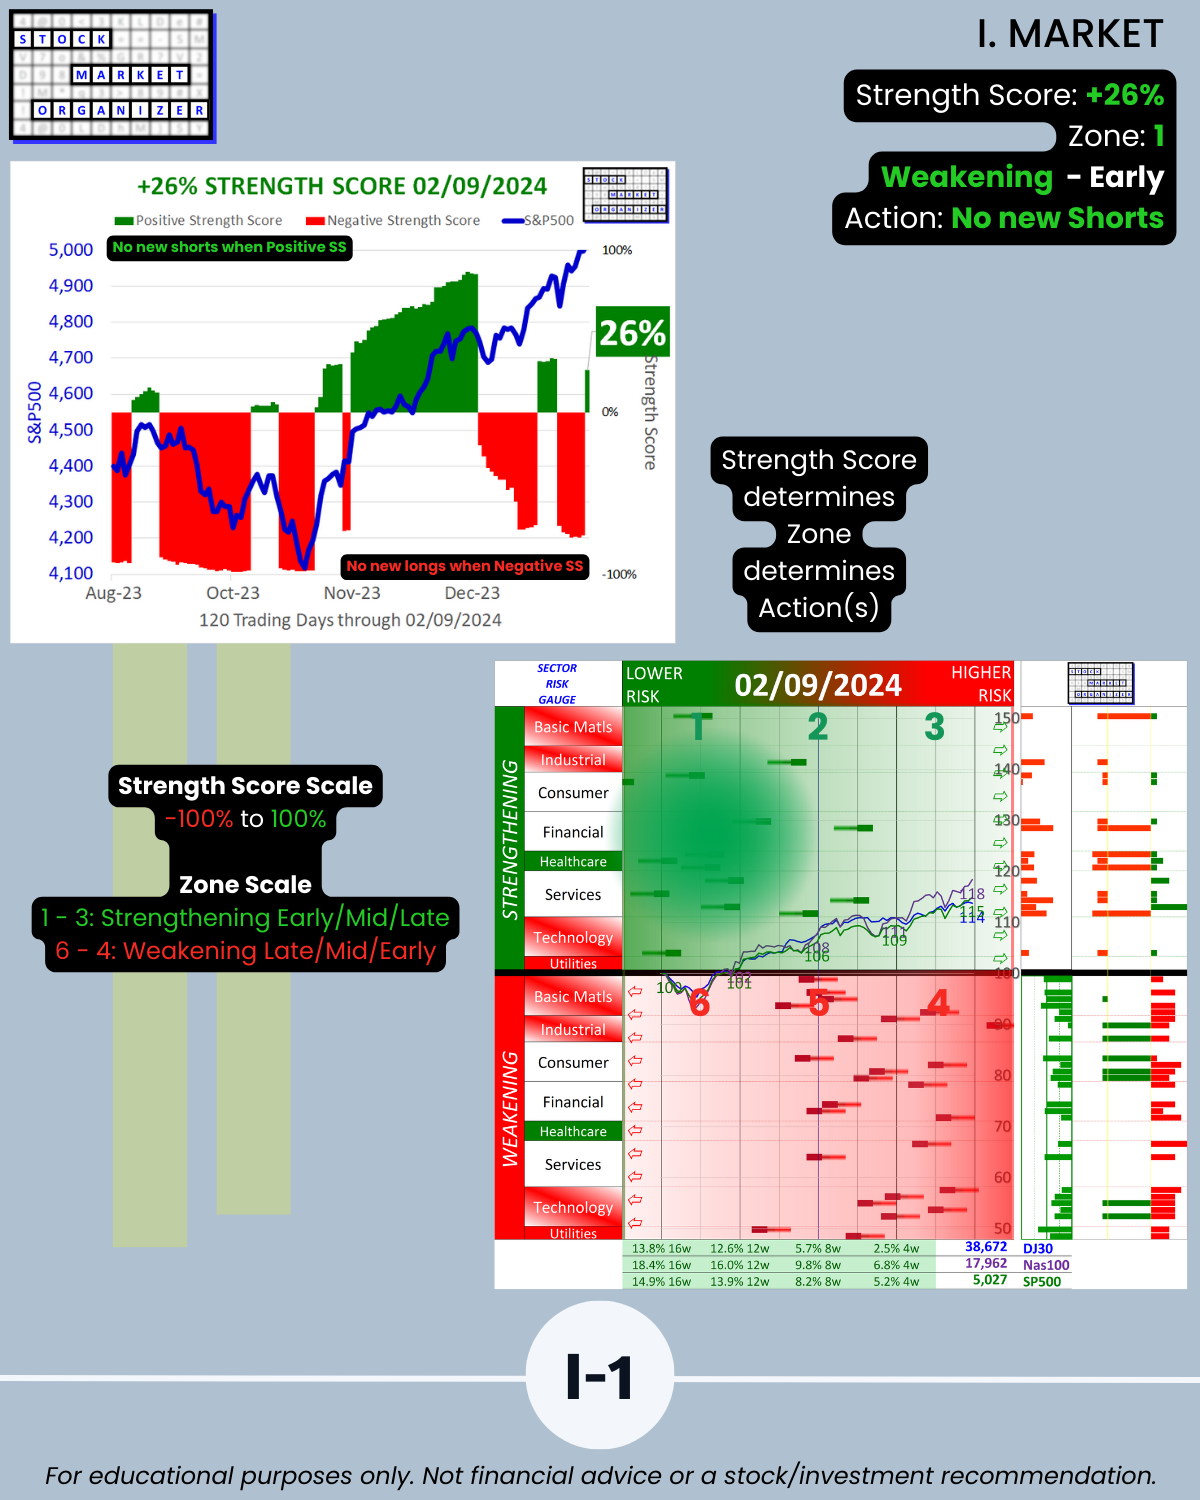
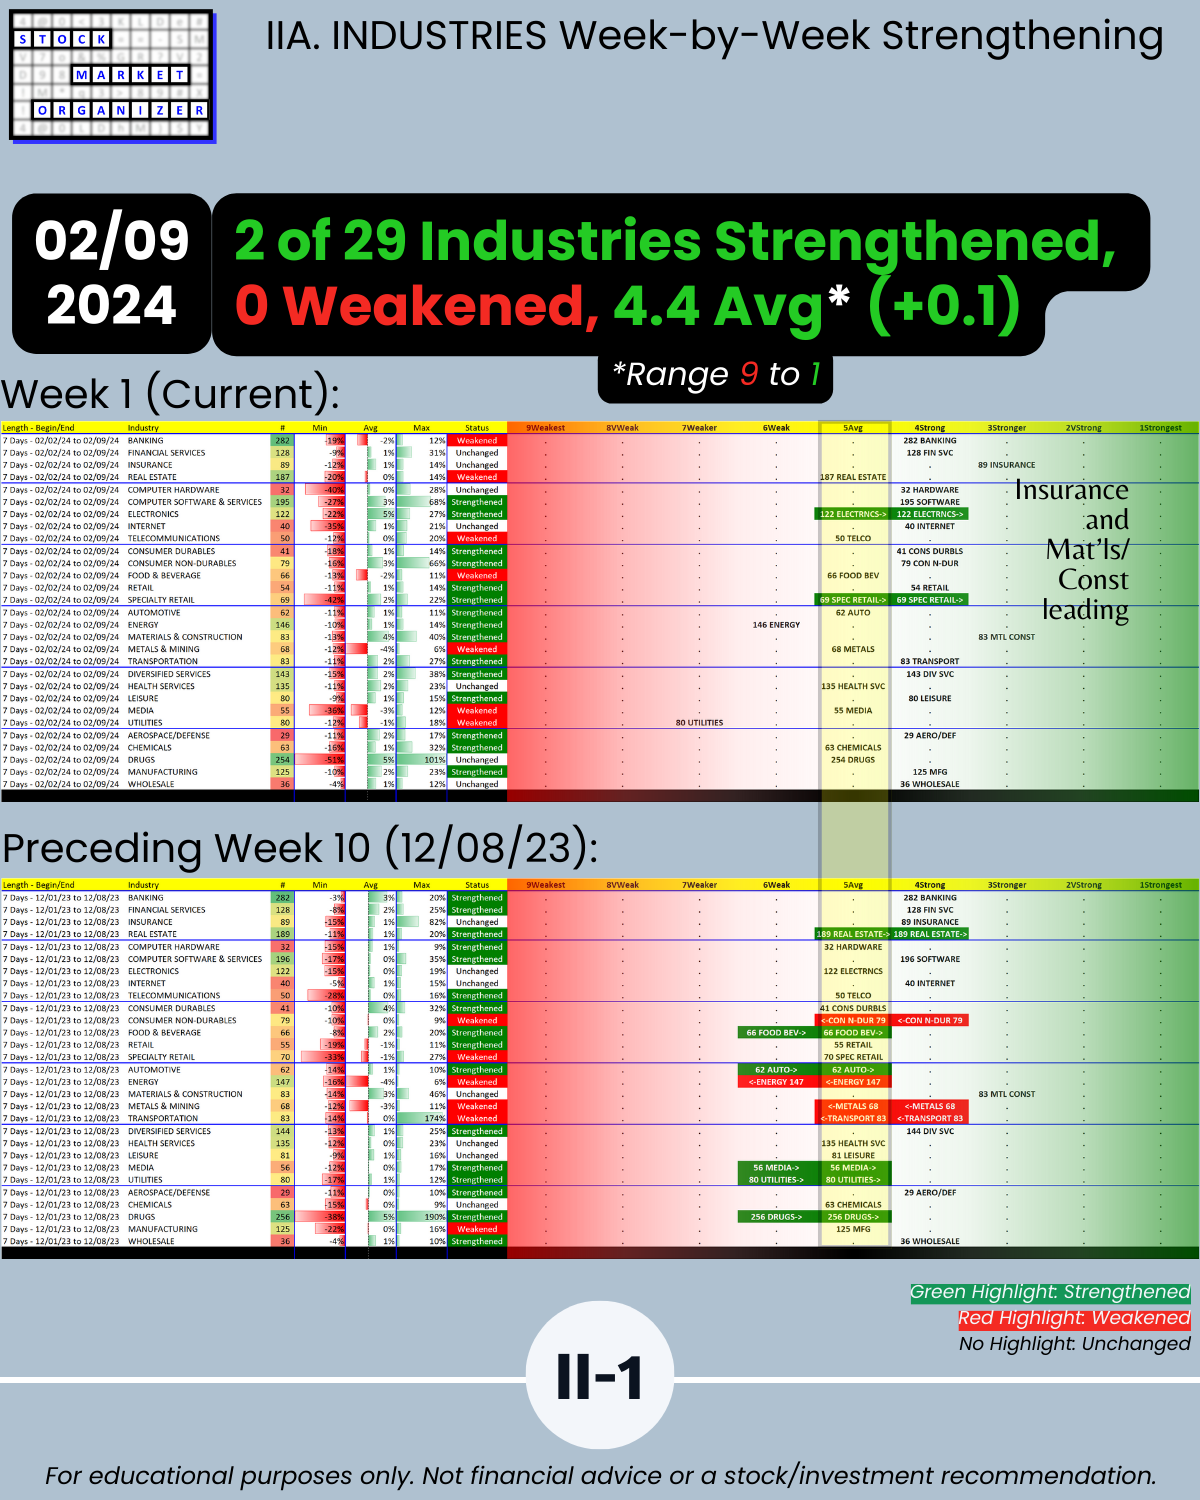
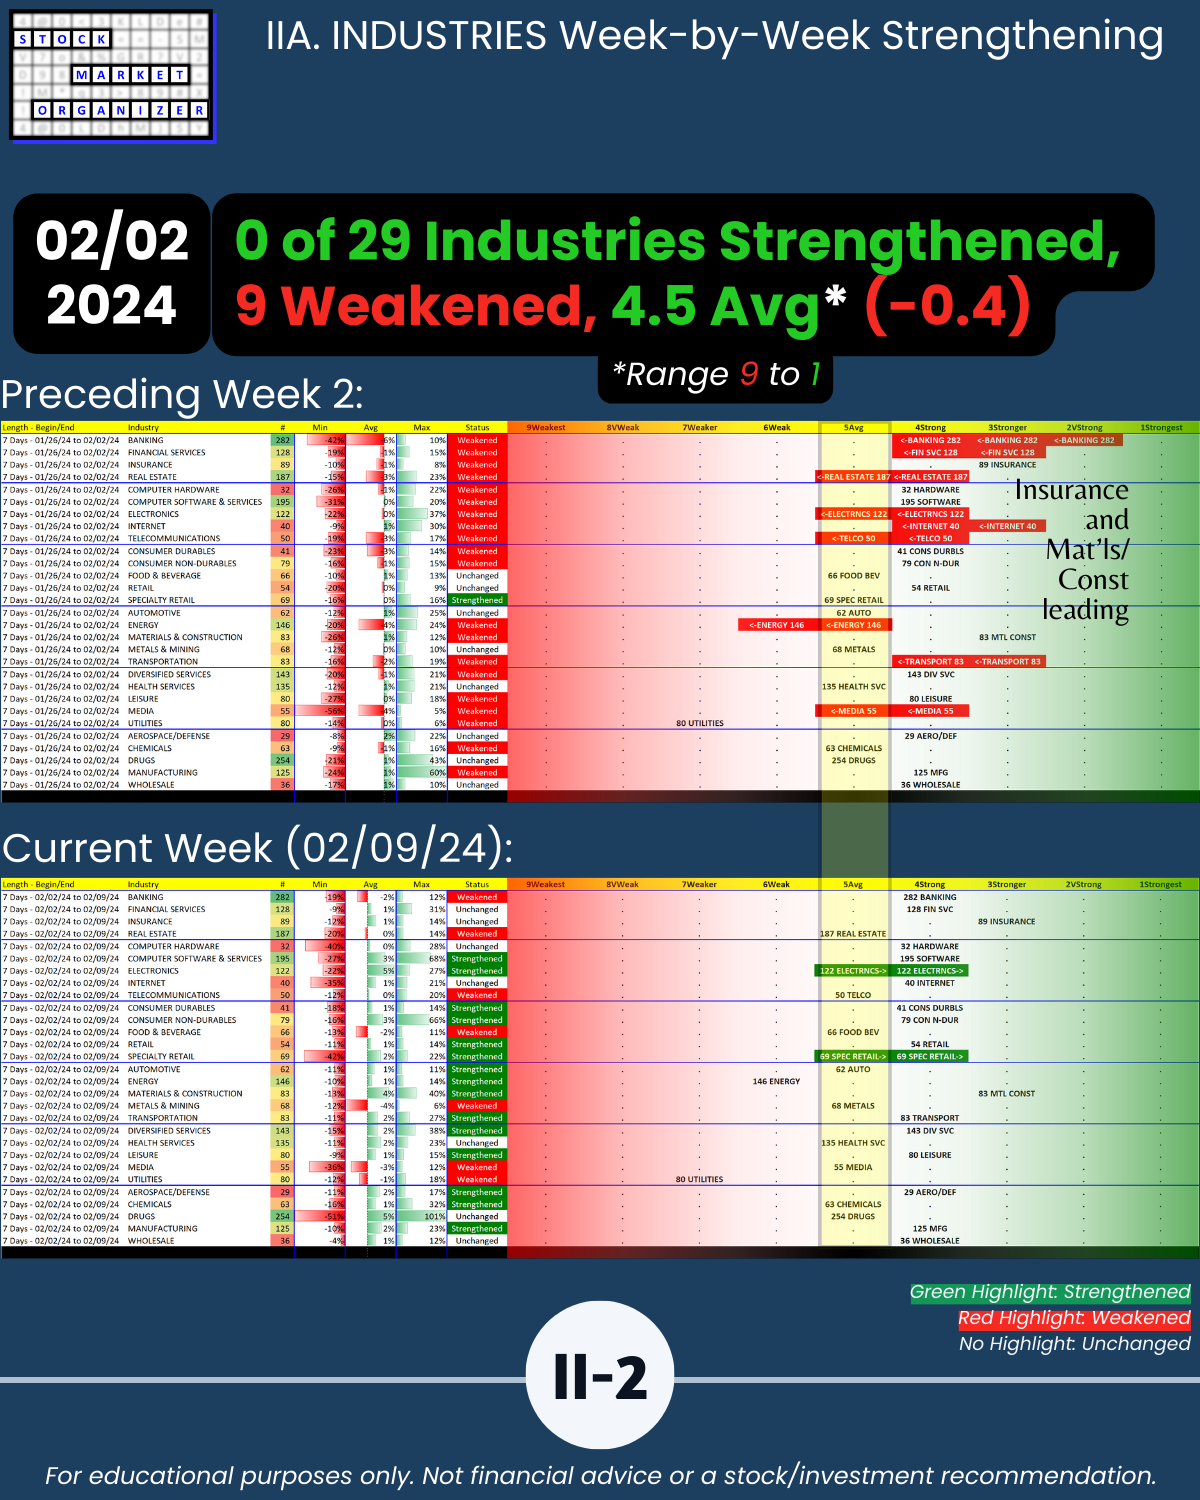
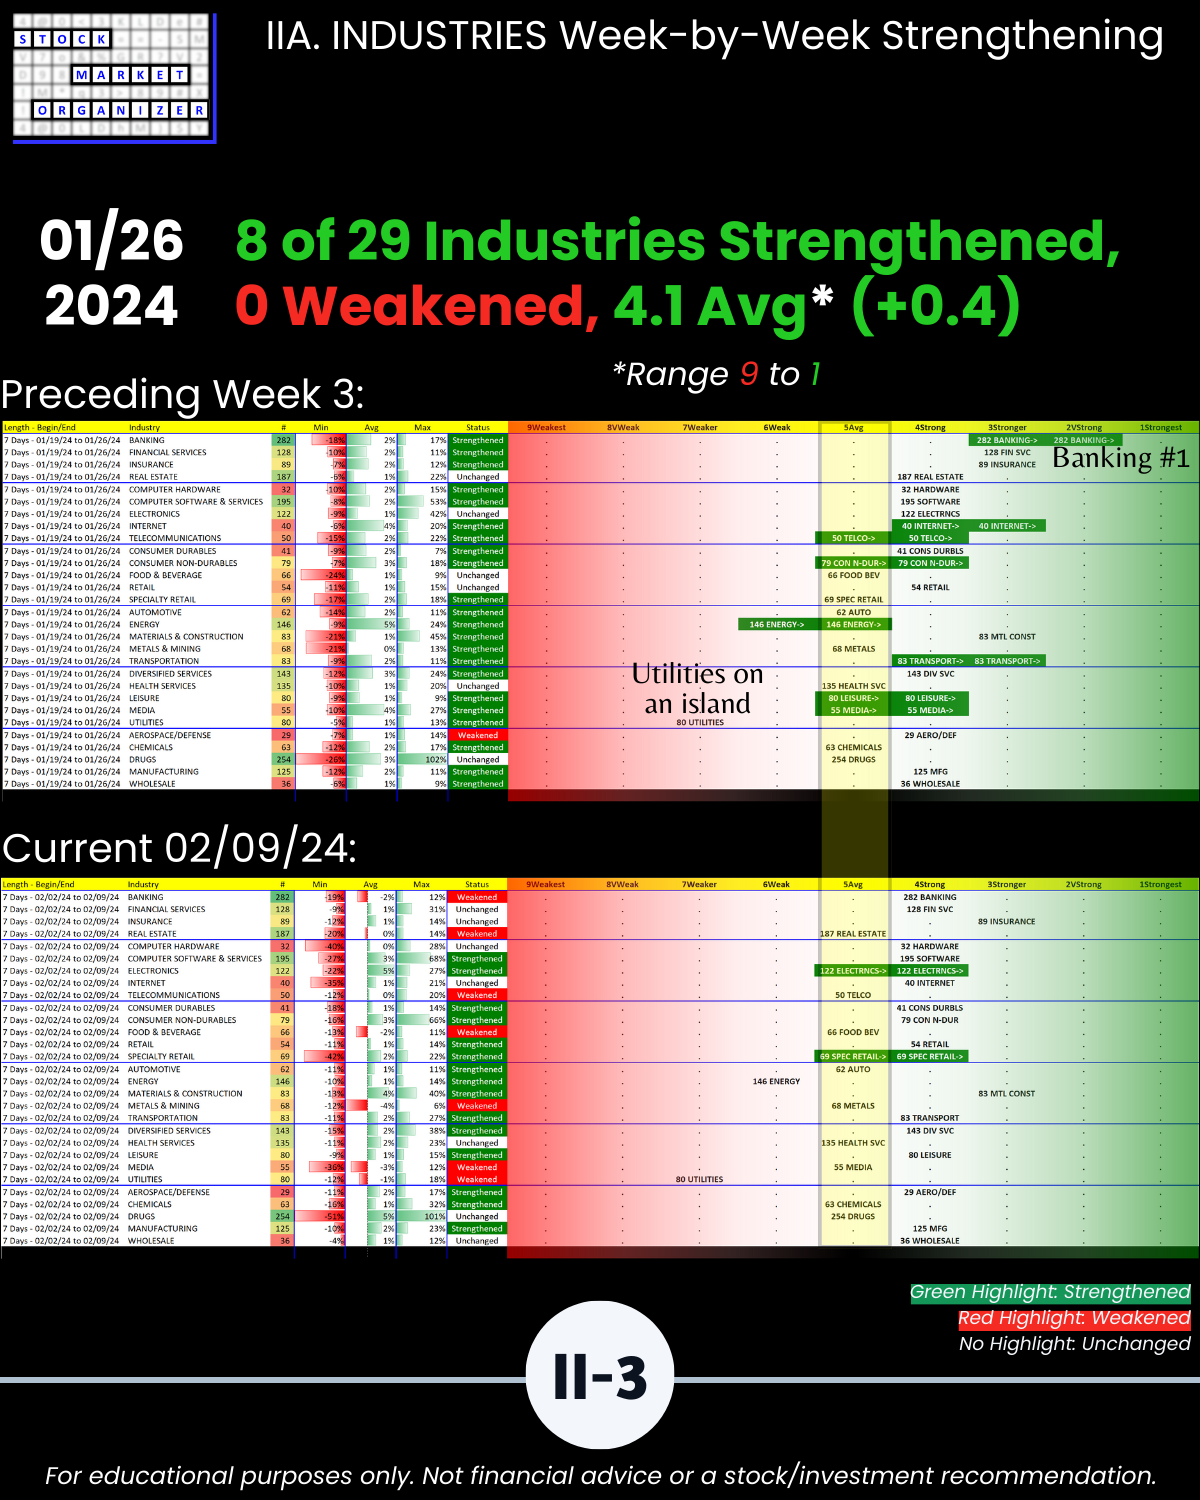
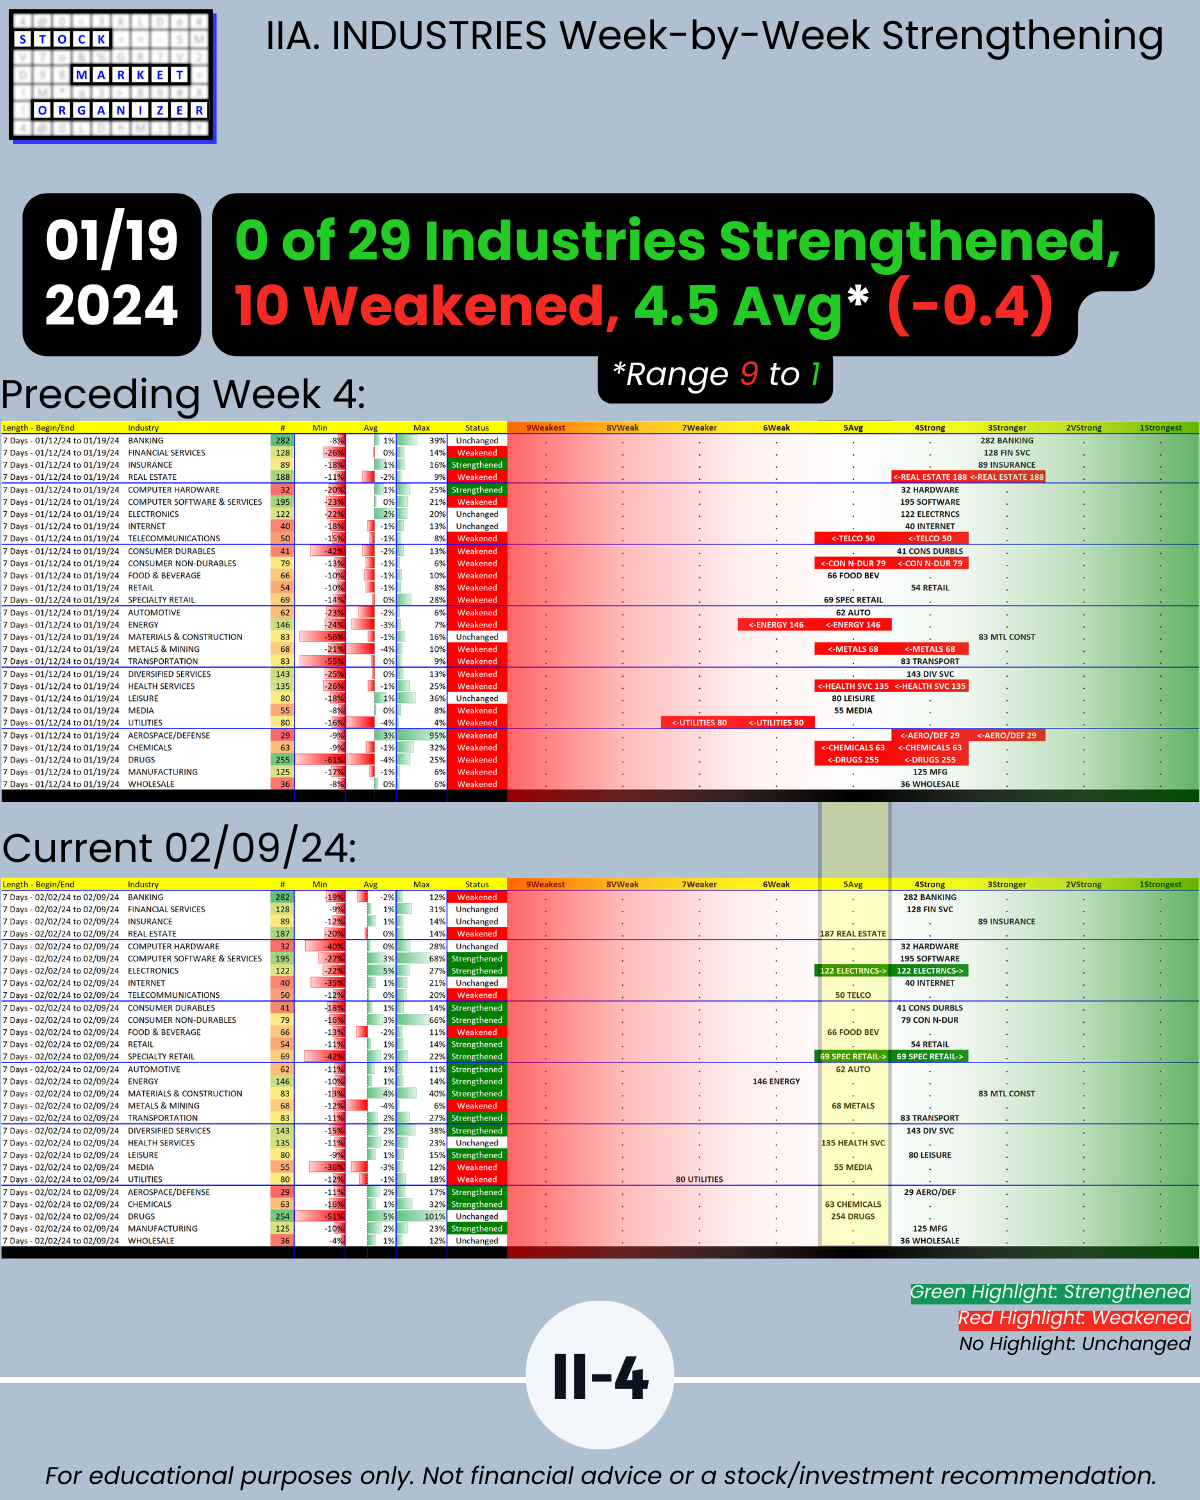
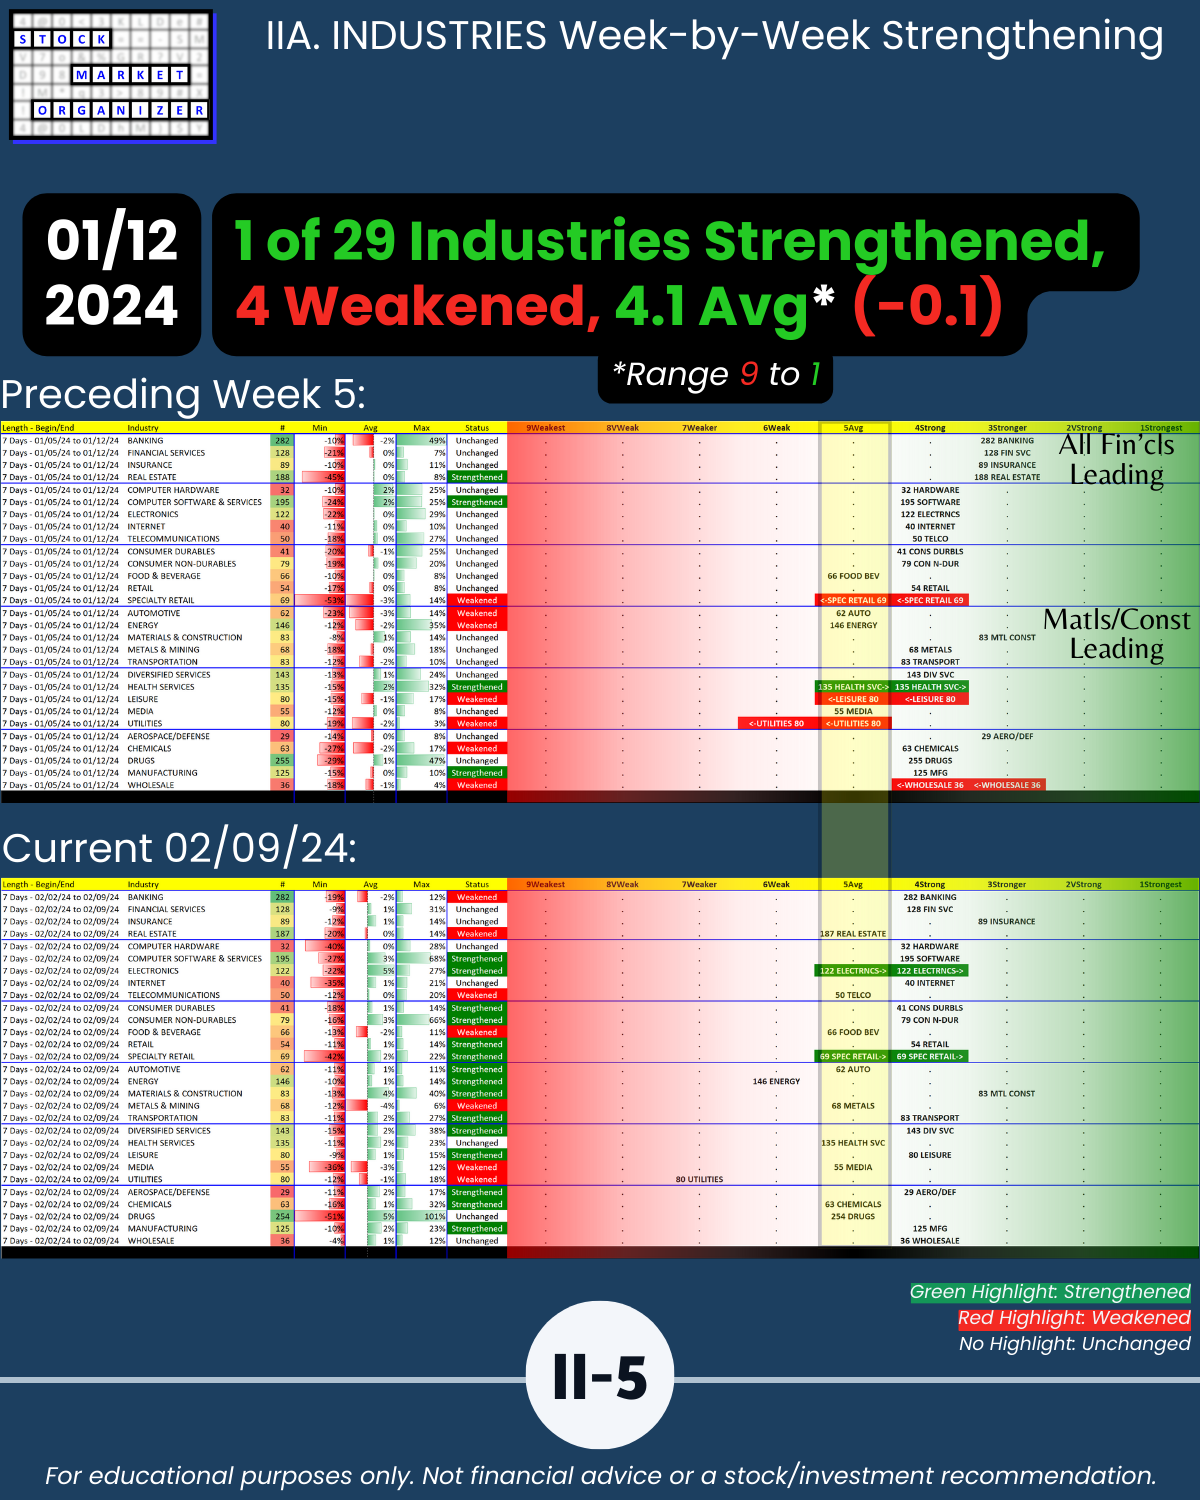
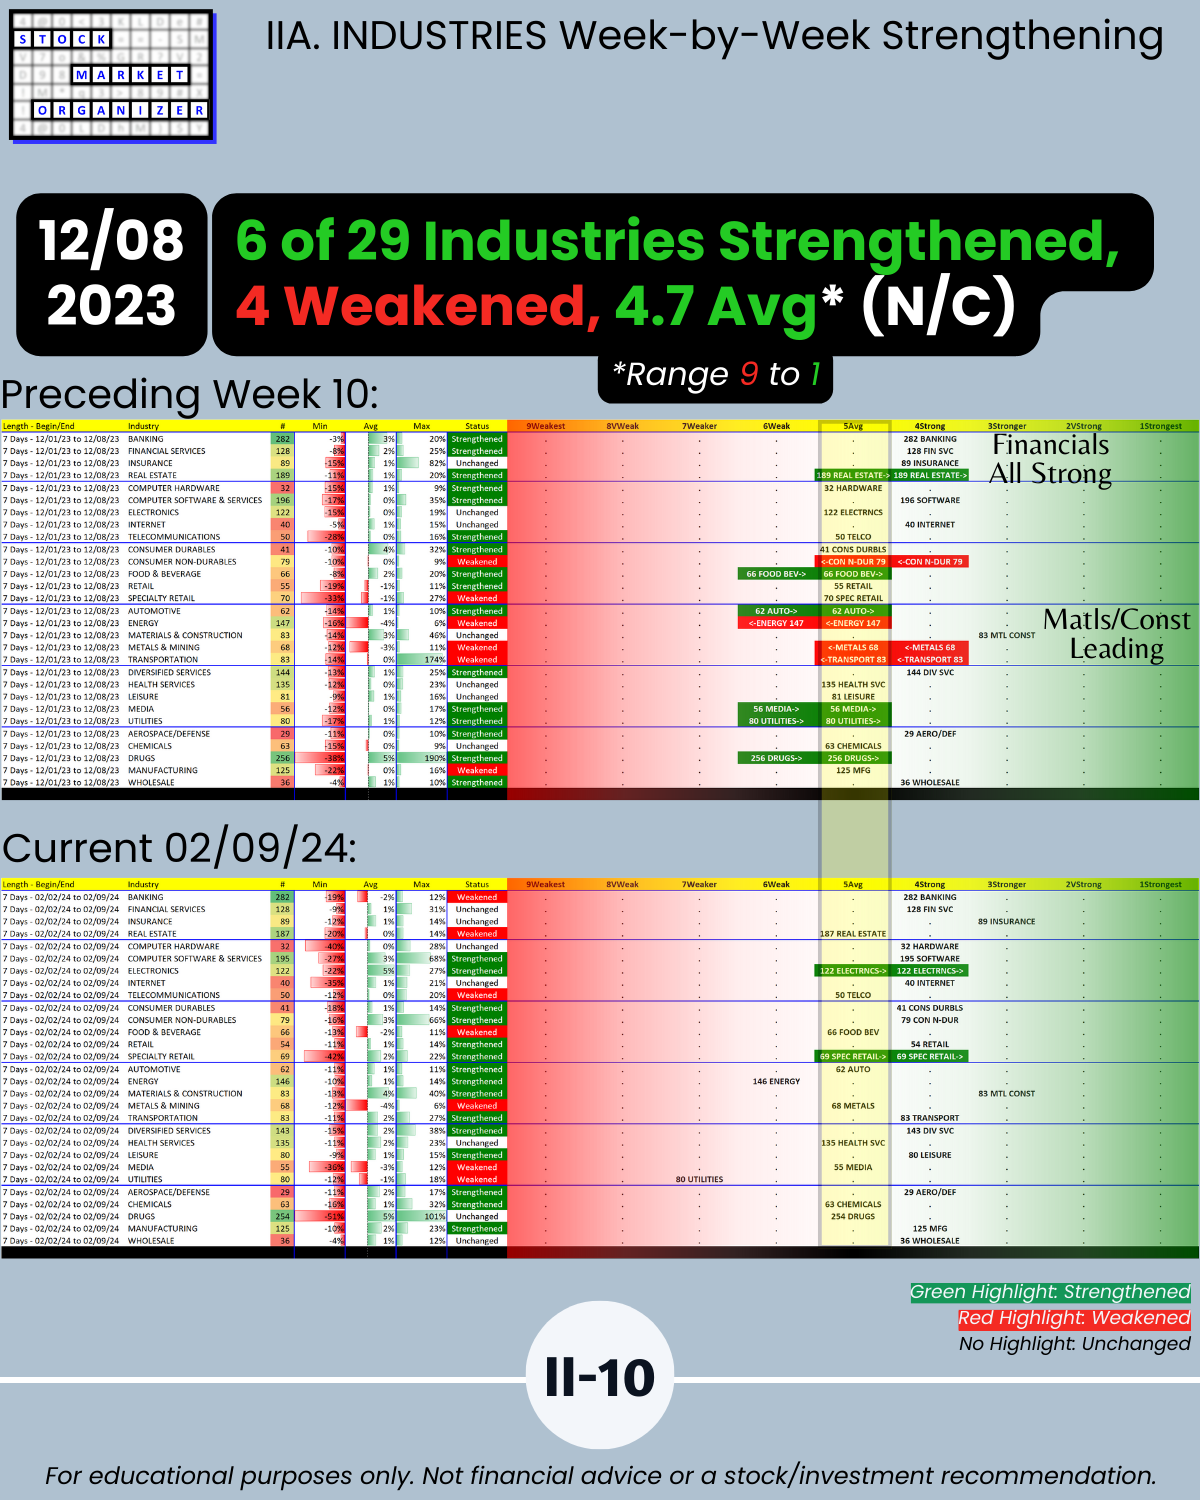
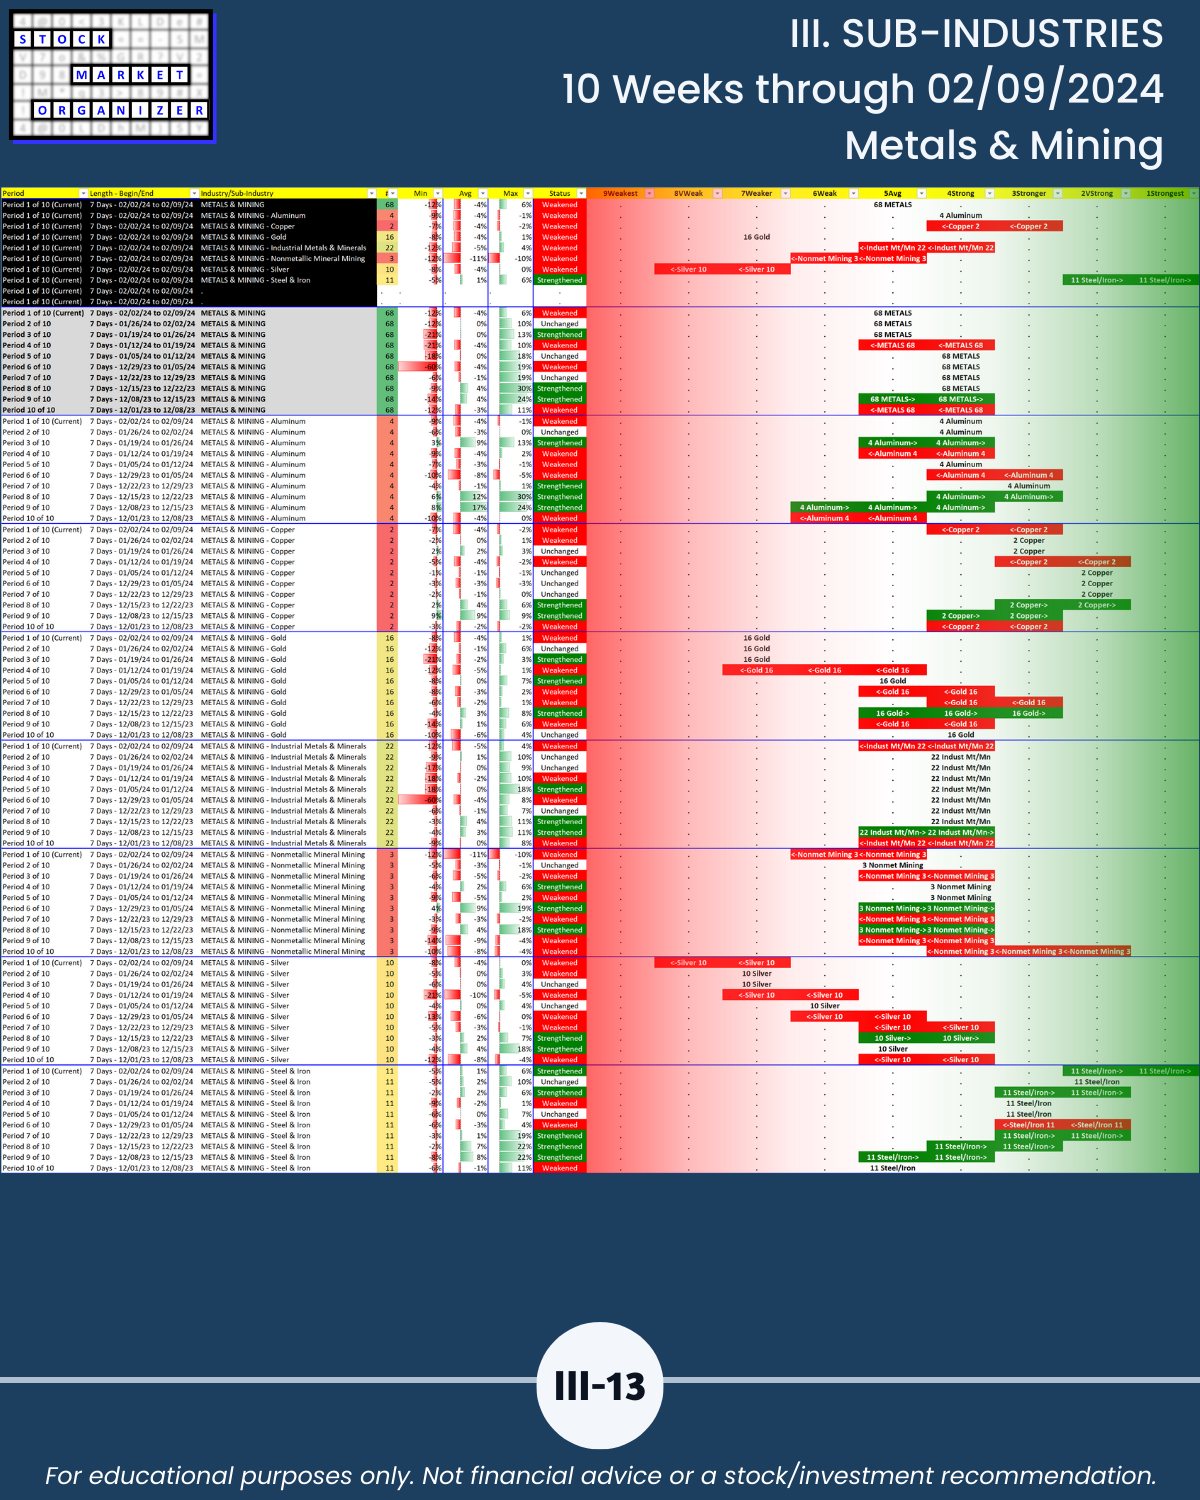
U.S. Market week ending 2/9/24 S&P500 5K – truly meaningful? Little strengthening movement (only 2 industries changed/strengthened) but enough so Market Strength Score changed 2/9/24 to +26% Strengthening = No New Shorts. Insurance and Materials & Construction remain the strongest, Utilities still weakest followed by Energy. Metals & Mining = Average as Silver stocks continue falling, Gold not much better.
Attached: an objective answer to “How is the overall market doing right now?”
Other interesting questions answered:
🔹 Are current market strengthening/weakening conditions more conducive to new longs or to new shorts?
🔹 Is market strengthening or weakening early or late in a meaningful cycle?
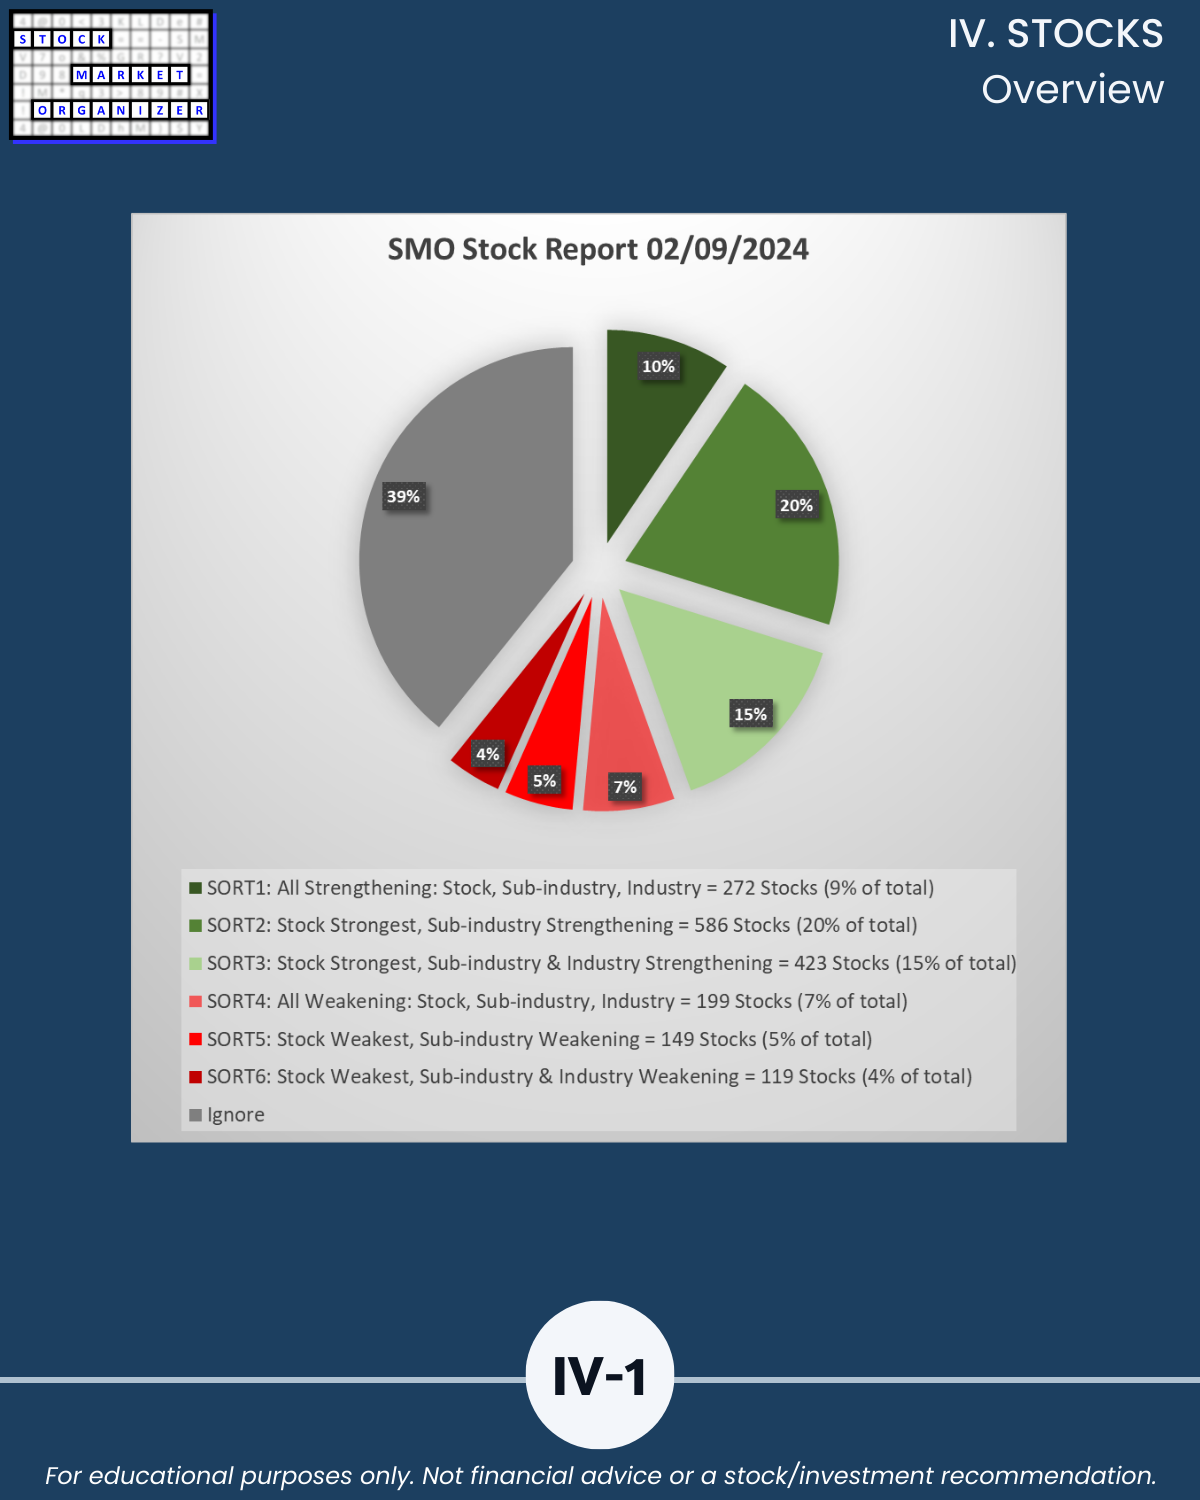
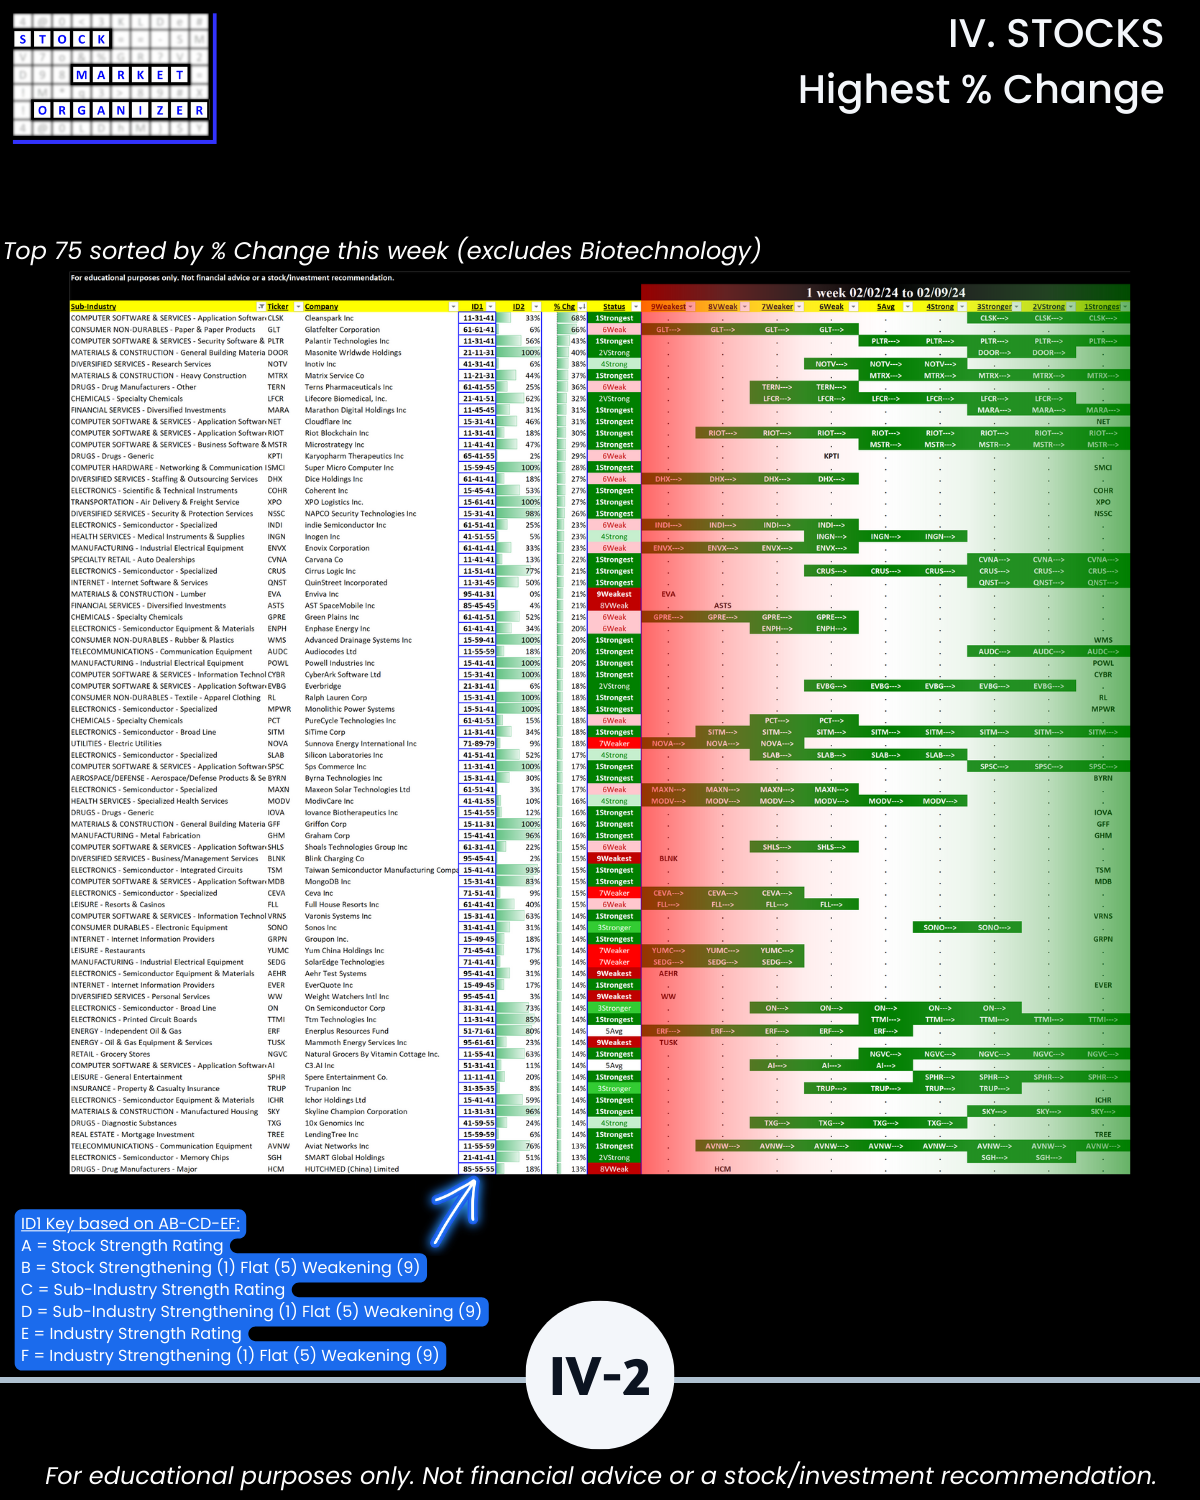
🔹 What are the strongest-rated stocks in strengthening sub-industries and industries?
🔹 What are the weakest-rated stocks in weakening sub-industries and industries?
(POWL/Powell Industries highlighted last week +20% on top of its previous +60% week. Good if not quite matching SMCI’s continued rally +28% more this week.
Is there really any controversy about strength begetting strength?)
DID YOU KNOW?
What IS:
The overall market is STRENGTHENING week of/ending 2/9/24.
🔹 The +26% market strength score = early “No New Shorts” territory
🔹 Average Industry Strength Score = 4.4 (1 = strongest 9 = weakest, +0.1 vs. 4.5 previous week)
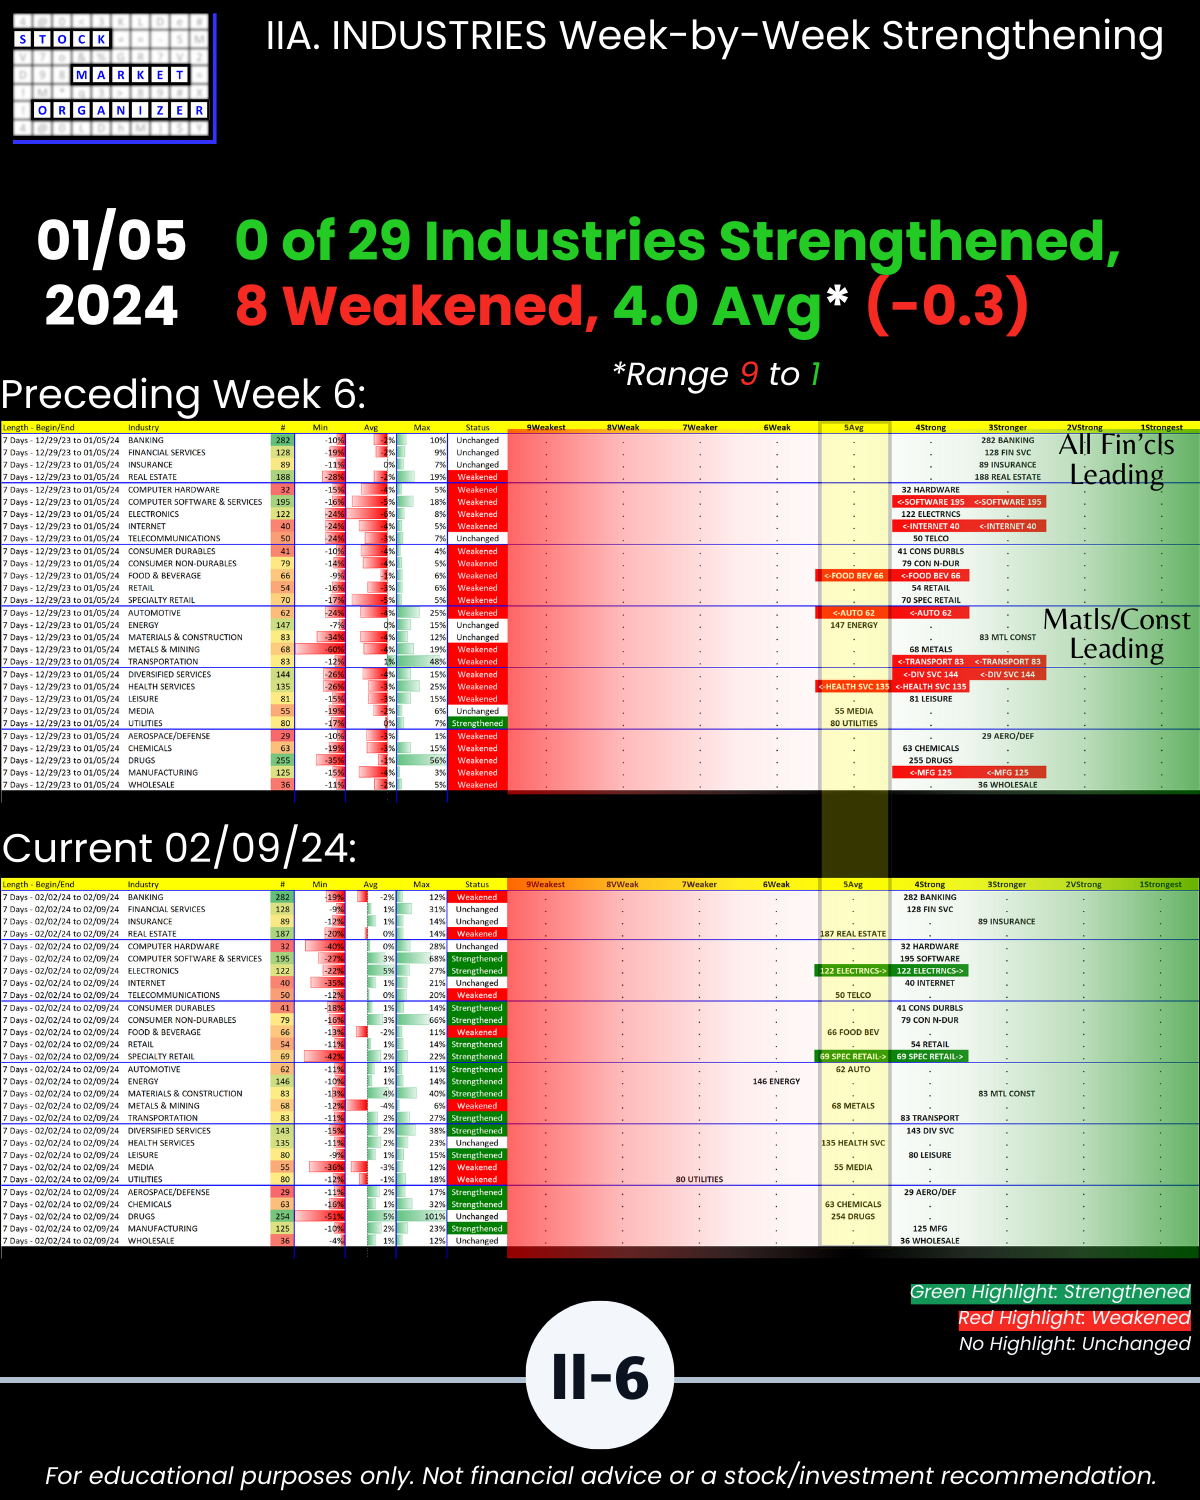
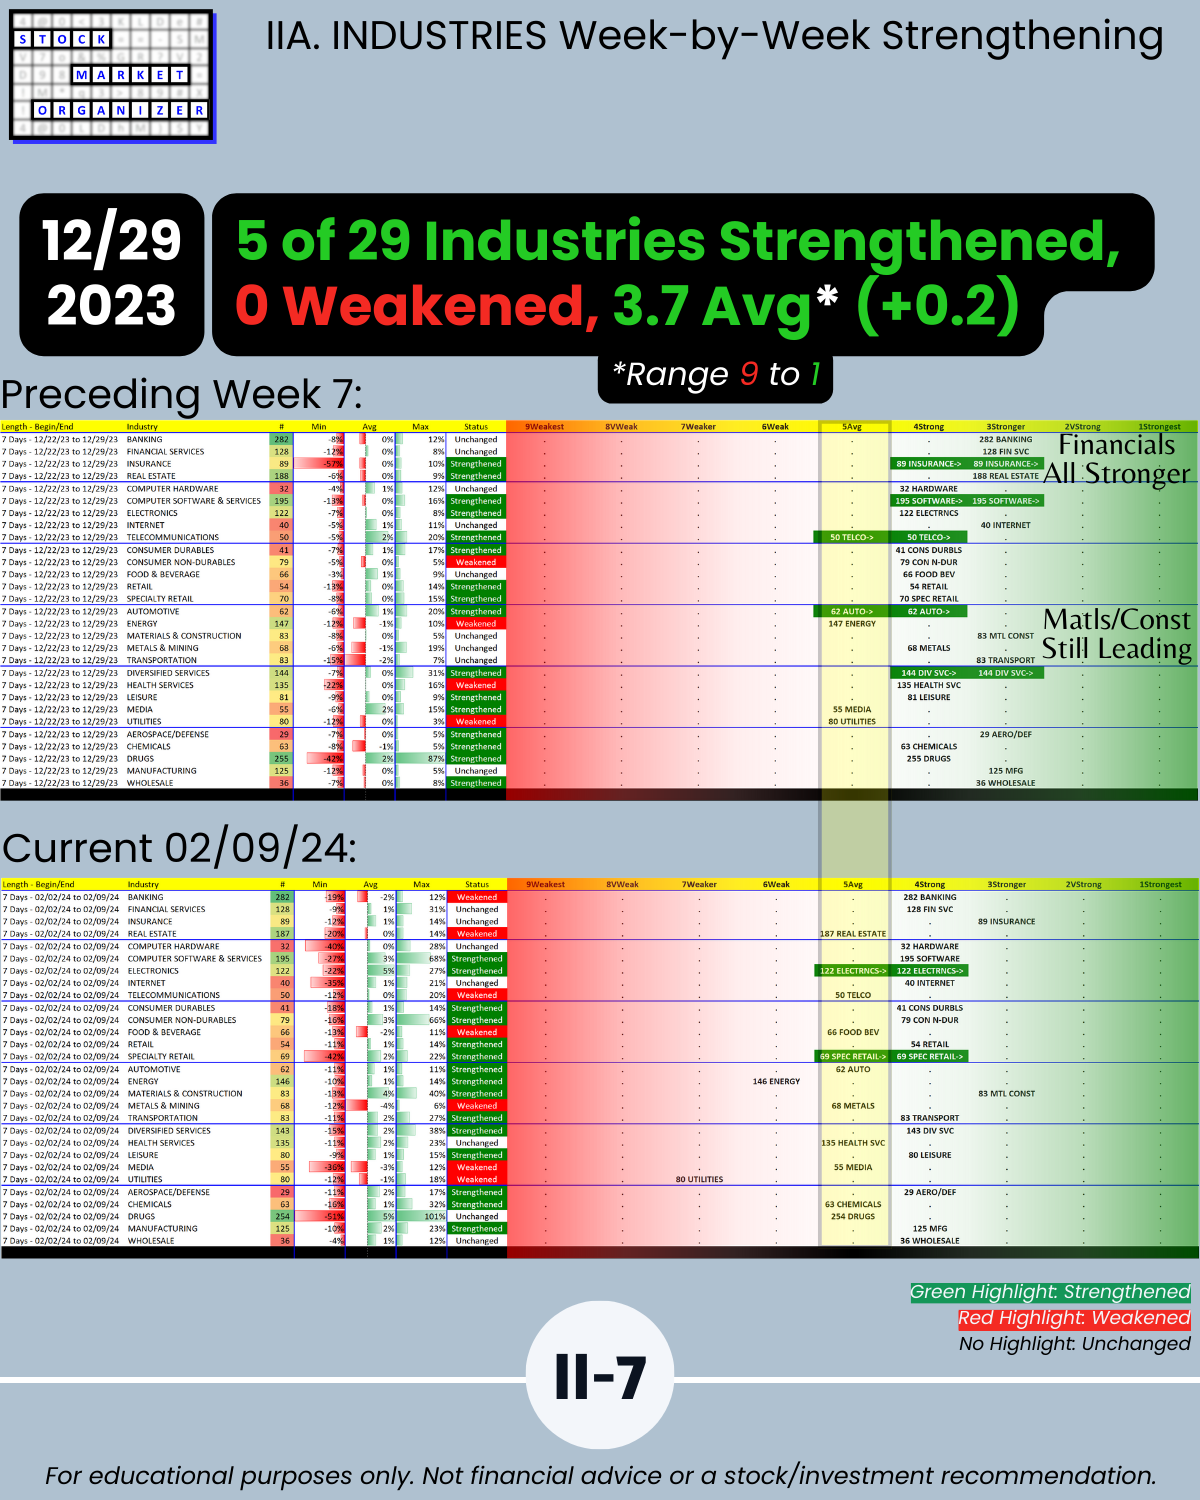
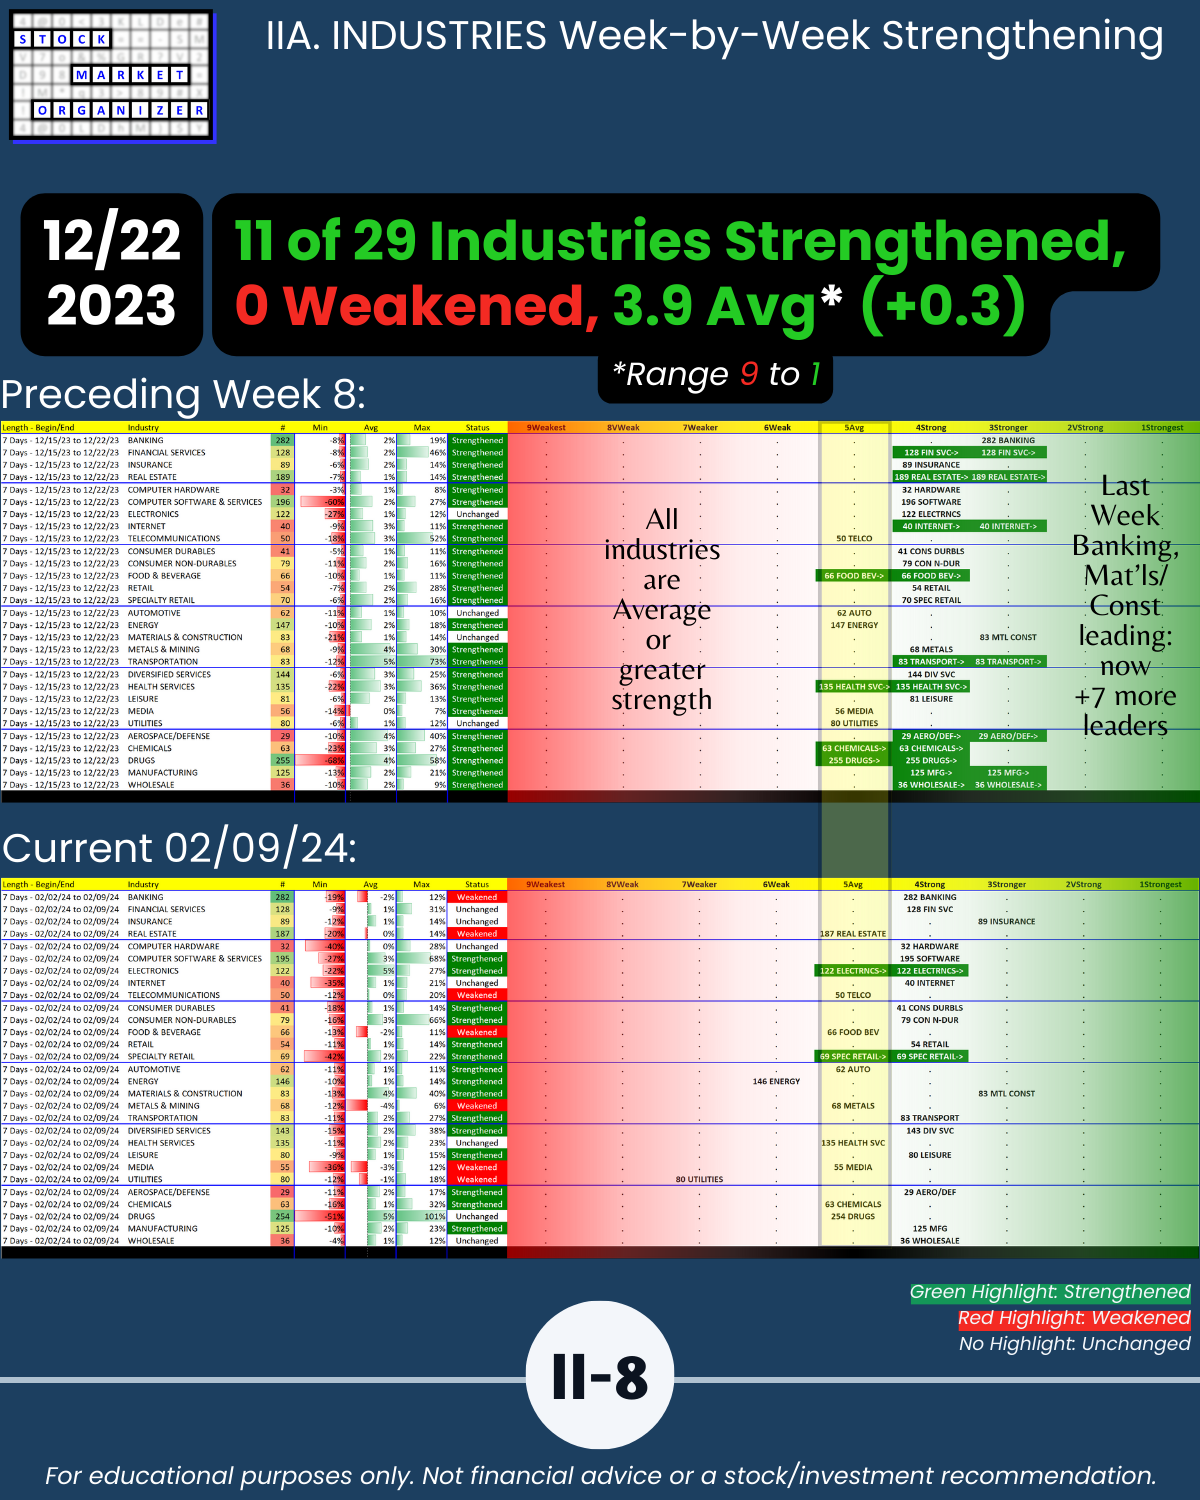
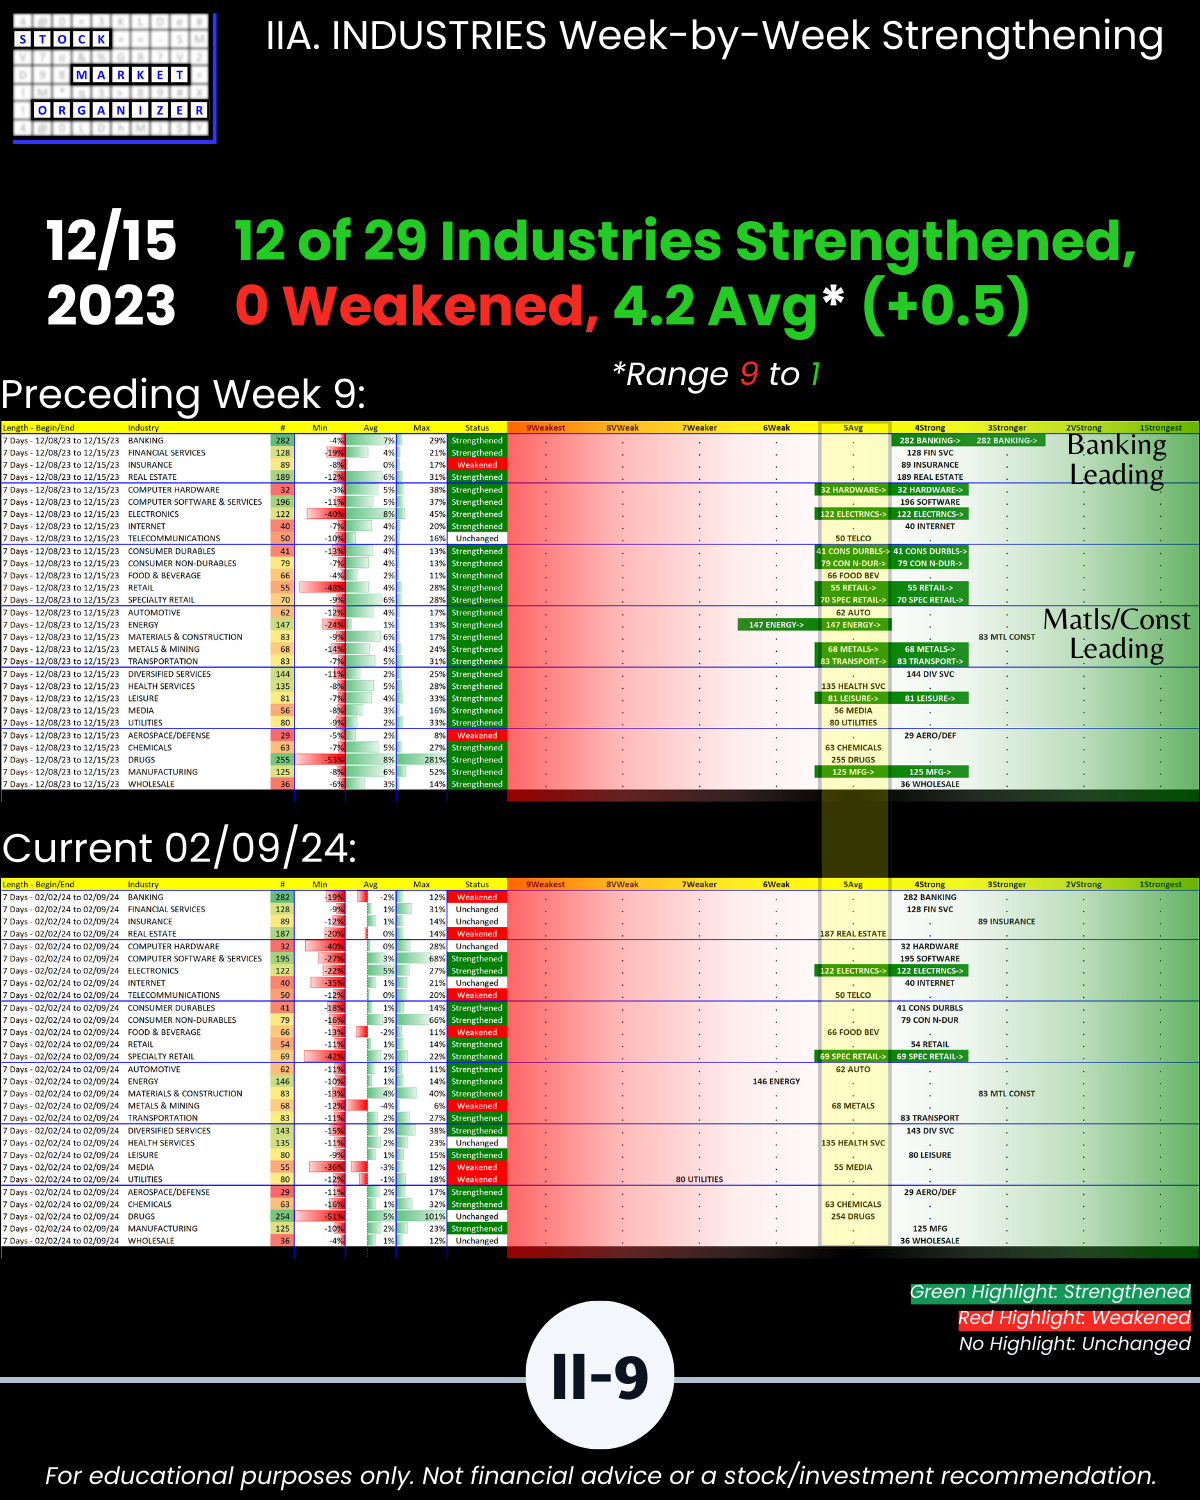
🔹 2 of 29 industries strengthened, 0 weakened (0/9 previous week)
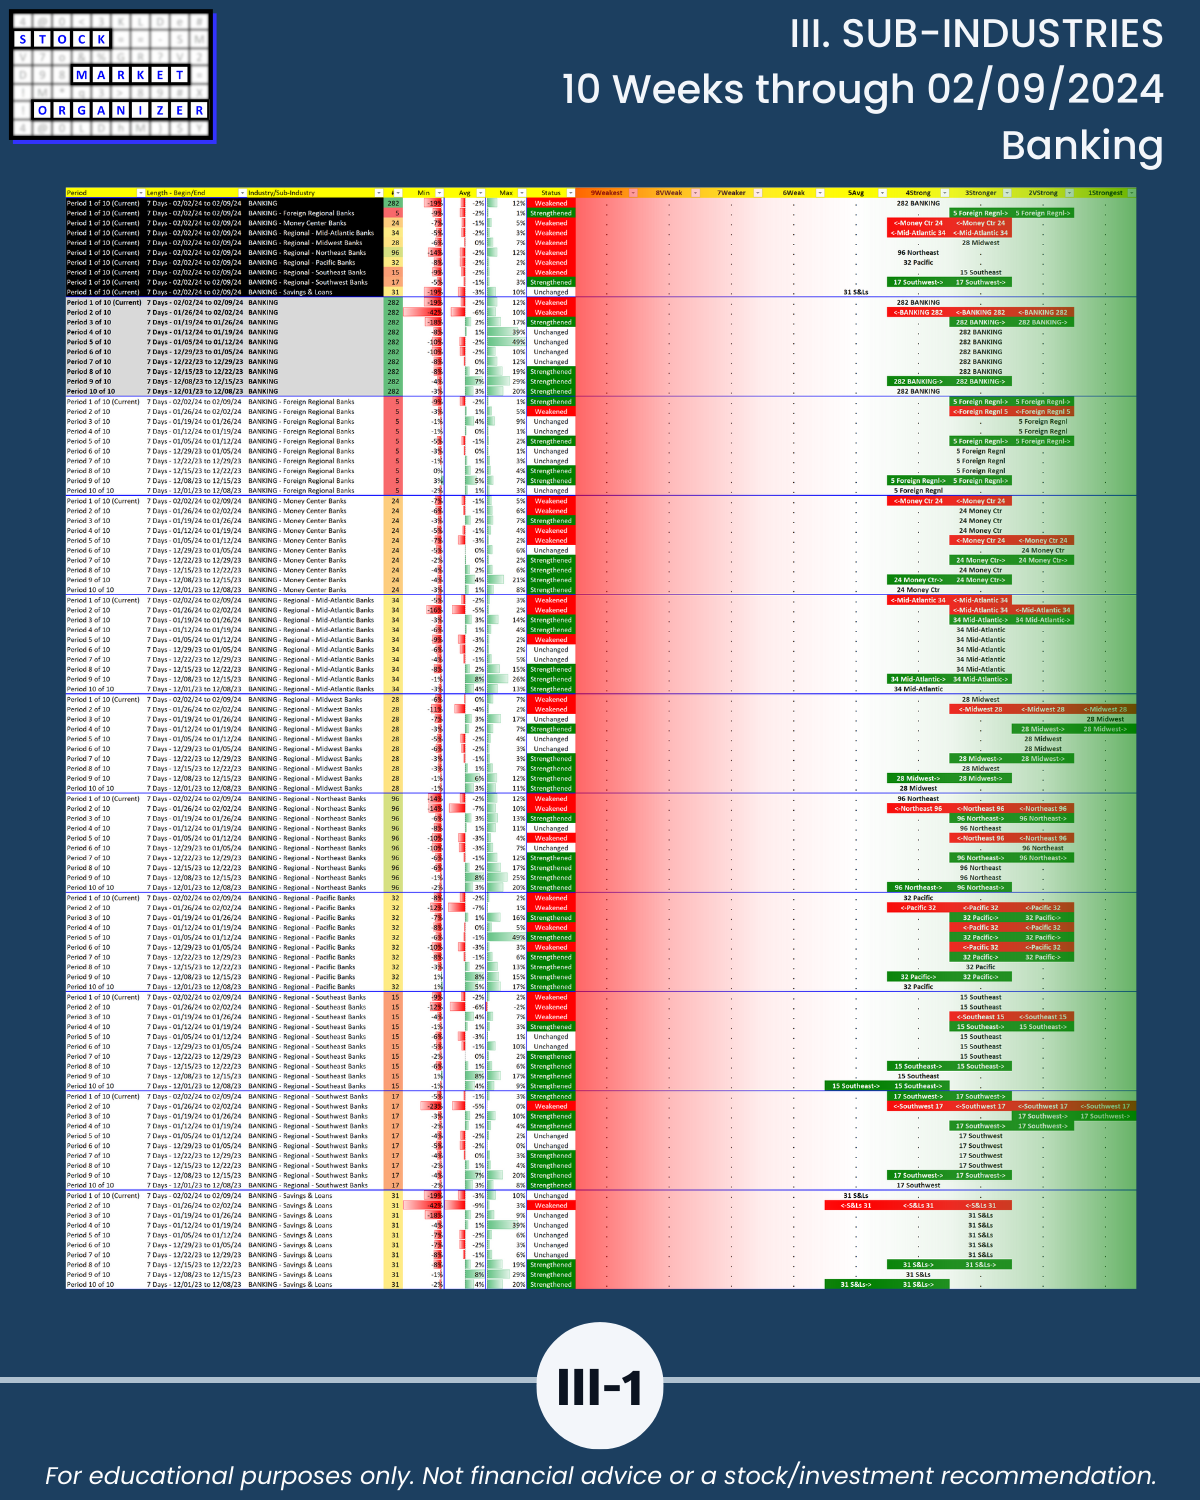
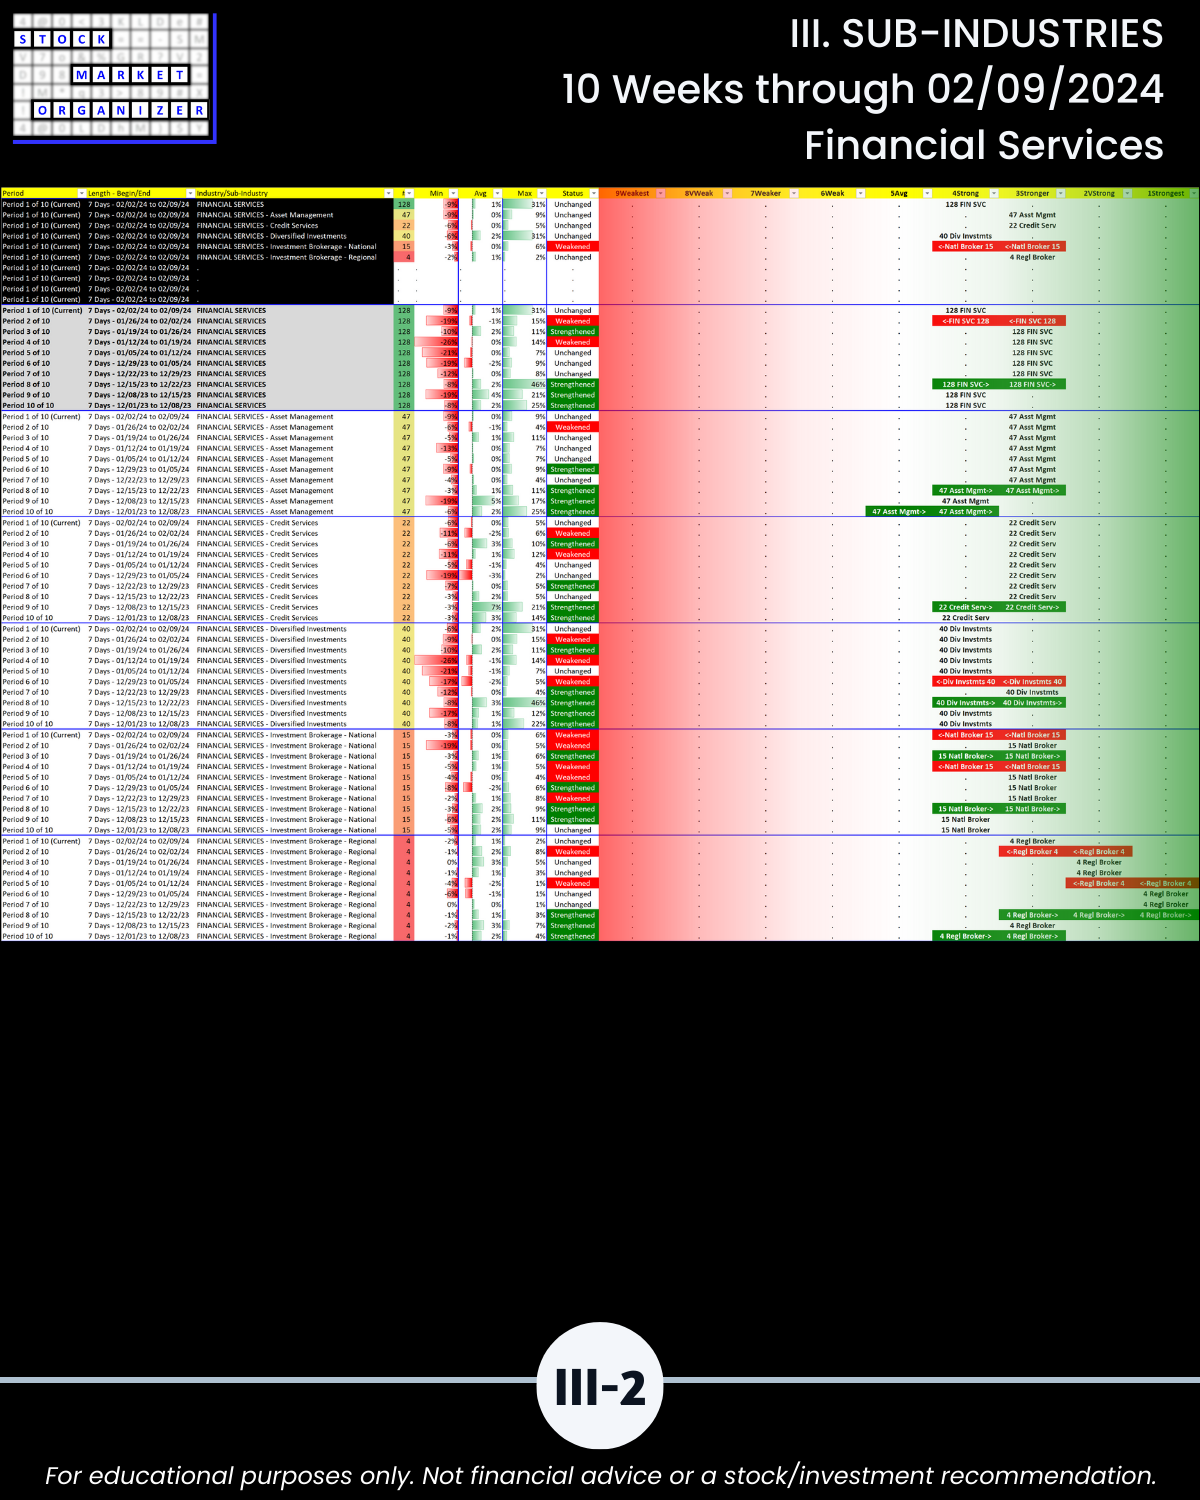
🔹 43% vs. 29% sub-industries Strengthening vs. Weakening (vs. 13%/60% previous week, 199 Sub-industries)
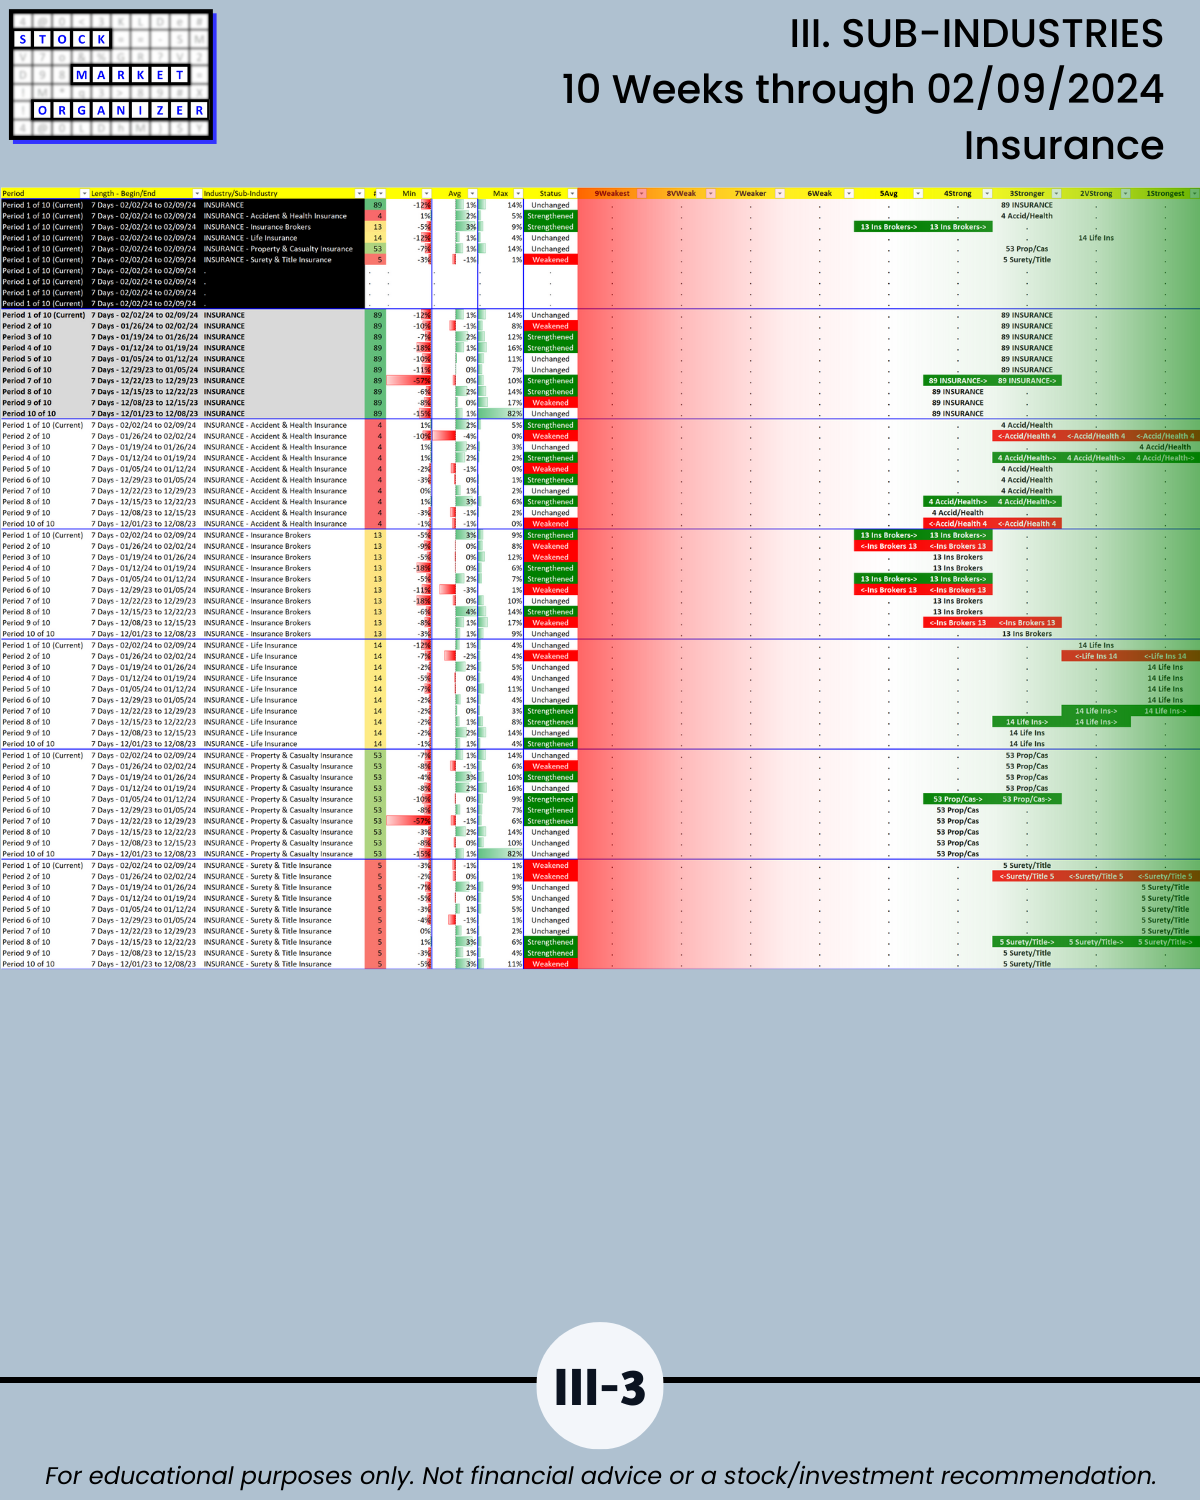
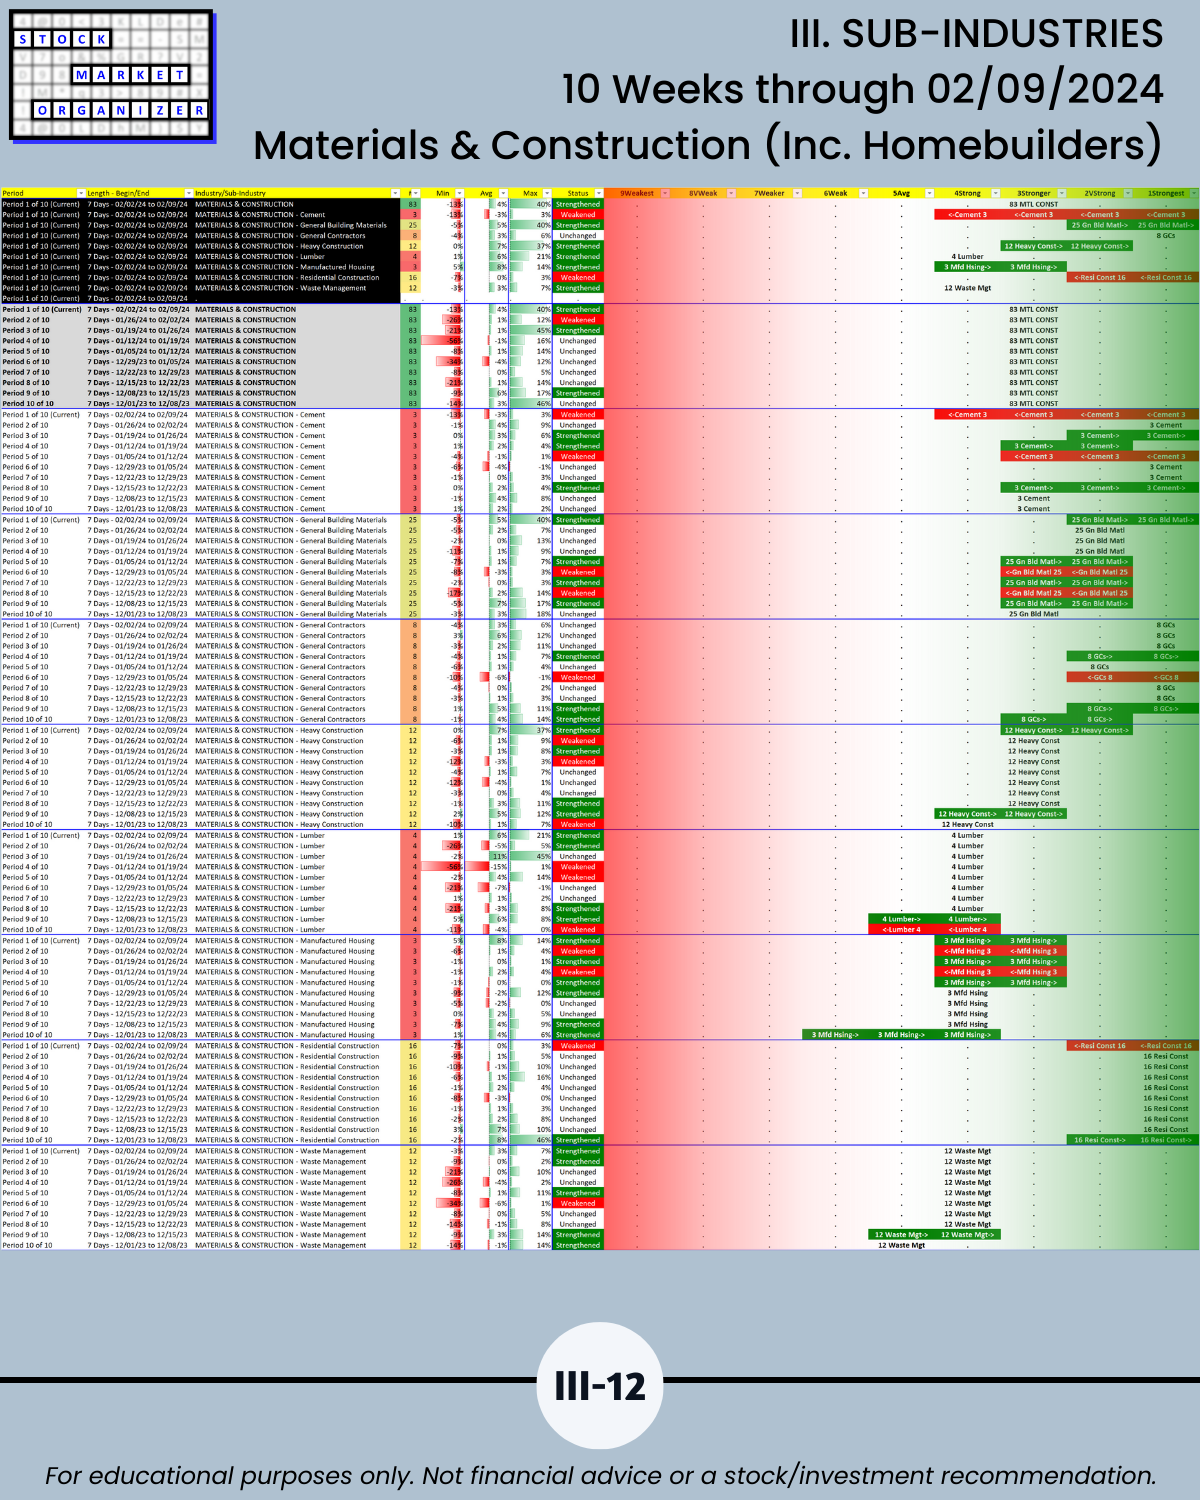
🔹 Insurance and Materials & Construction = strongest industries at Stronger (3rd strongest of 9 levels)
- Life Insurance = strongest of Insurance sub-industries at Very Strong (2nd strongest)
- General Building Materials, General Contractors = strongest of Materials & Construction sub-industries at Strongest (1st strongest)
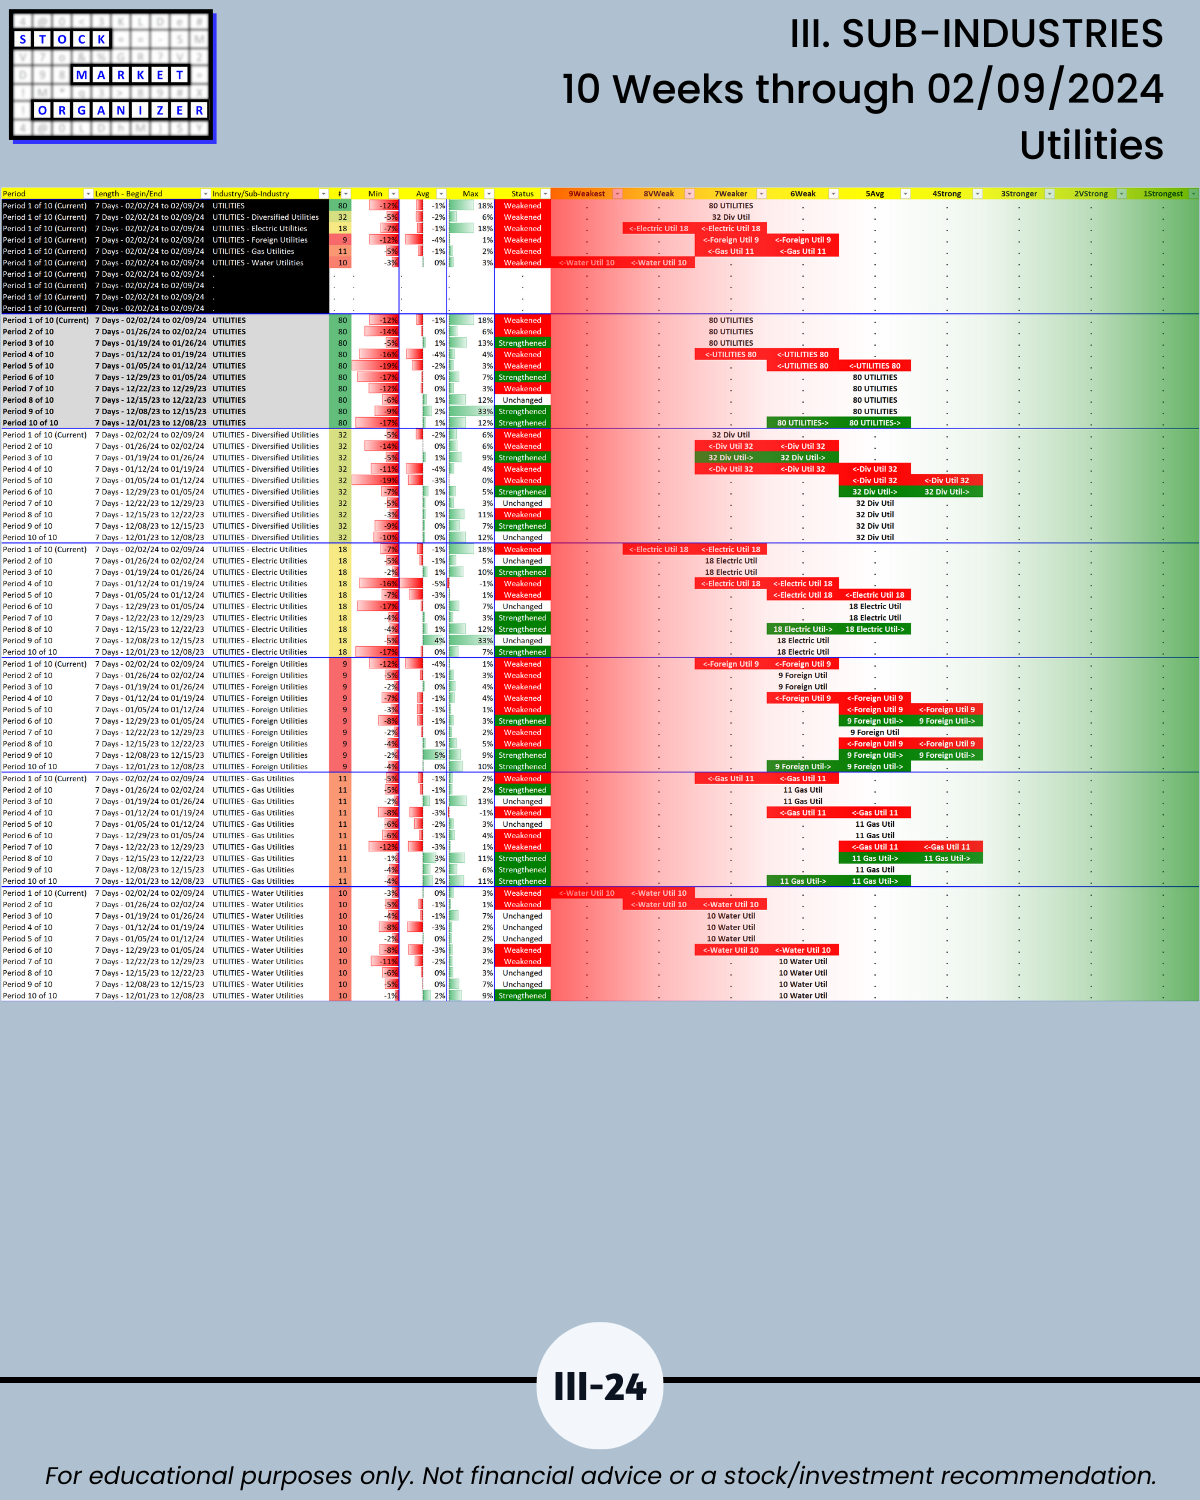
🔹 Utilities = weakest industry at Weaker (7th strongest), Water Utilities = weakest of its sub-industries at Weakest (9th strongest of 9 levels)
What WILL BE:
I have no idea. Neither does anyone else. Execute your plan and follow your rules based on what IS.
WHAT’S INSIDE?
Few stocks buck the market trend.
At the same time, the market can only do what its underlying stocks do.
“What’s inside” is a detailed look at what you can find out about the market, sectors, industries, sub-industries, and individual stocks when you analyze a factor common to all of these: their strengthening and weakening.
WHO CARES?
Anyone who wants a U.S. stock market advantage. Really helpful if you agree with the following:
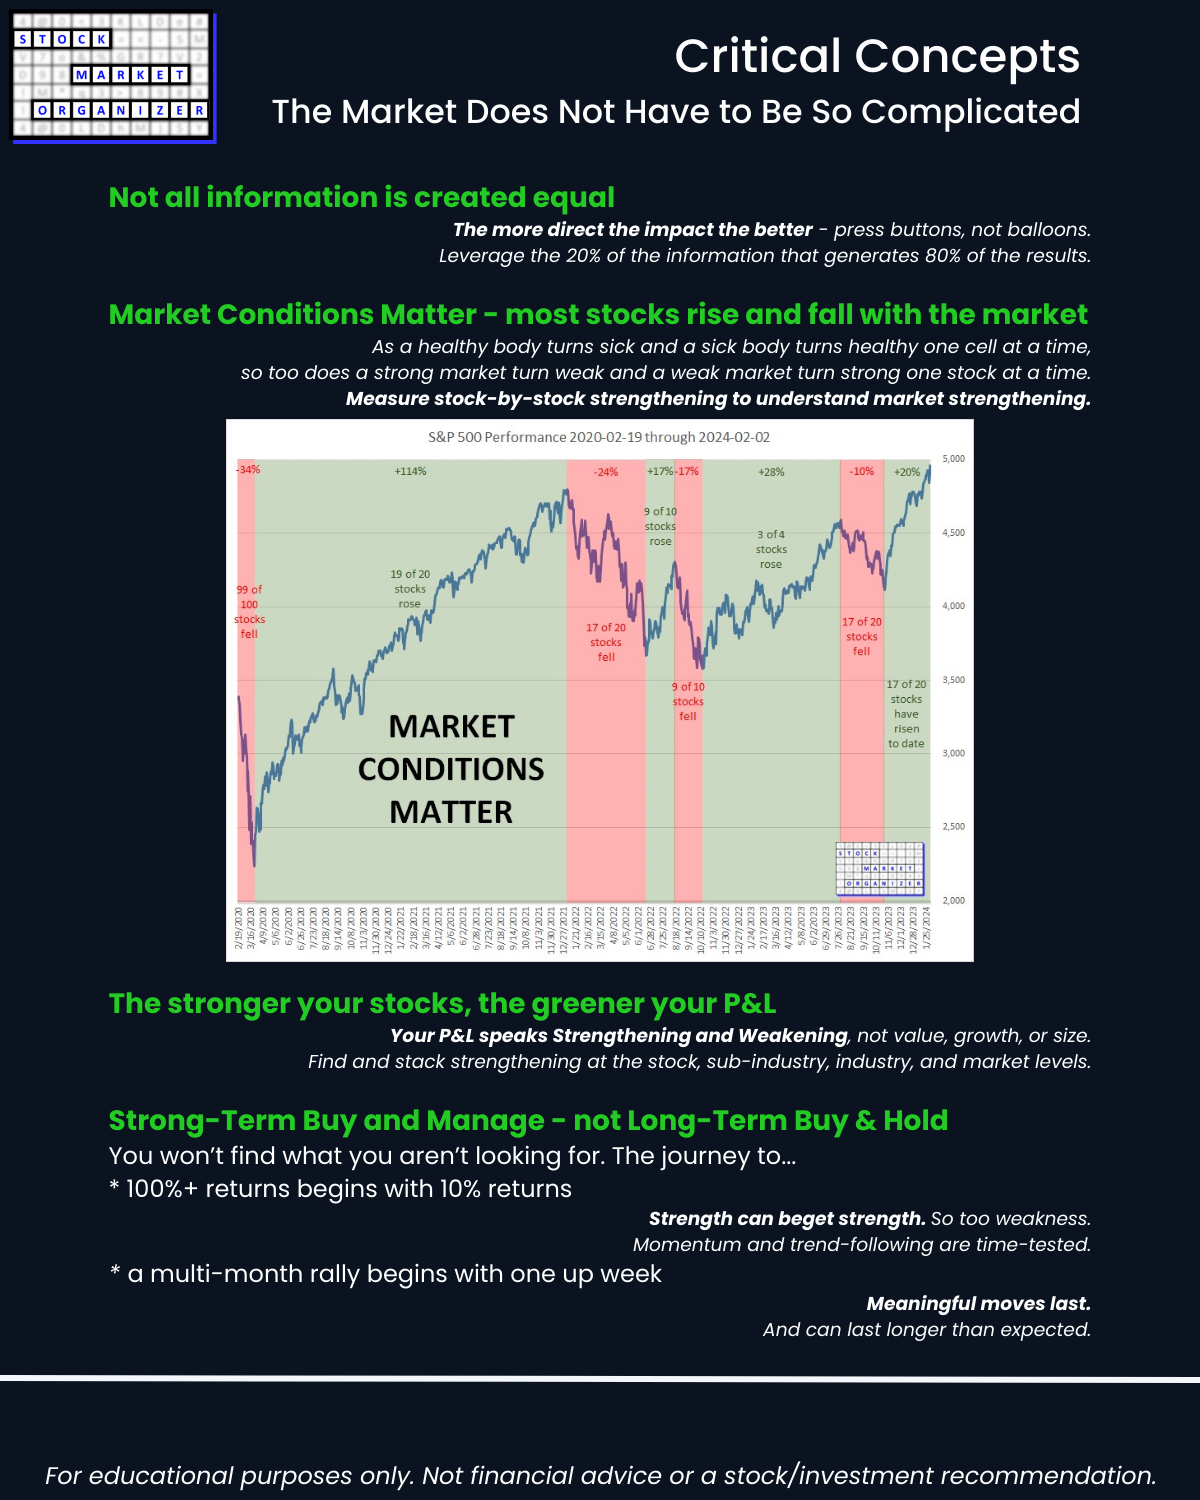
- The stronger your stocks, the greener your P&L.
- The journey to 100%+ returns begins with 10% returns.
- The journey to a multi-month rally begins with one up week.
- Most stocks do what the market does. (While the market can only do what its underlying stocks, sub-industries, and industries do.)
- 80/20: not all information is created equal. (Press buttons, not balloons.)
Following are galleries with page-by-page views of this report.
I. MARKET/Introduction/Market Strength Score

IIA. INDUSTRIES/10-Week Week-by-Week Industry Strength
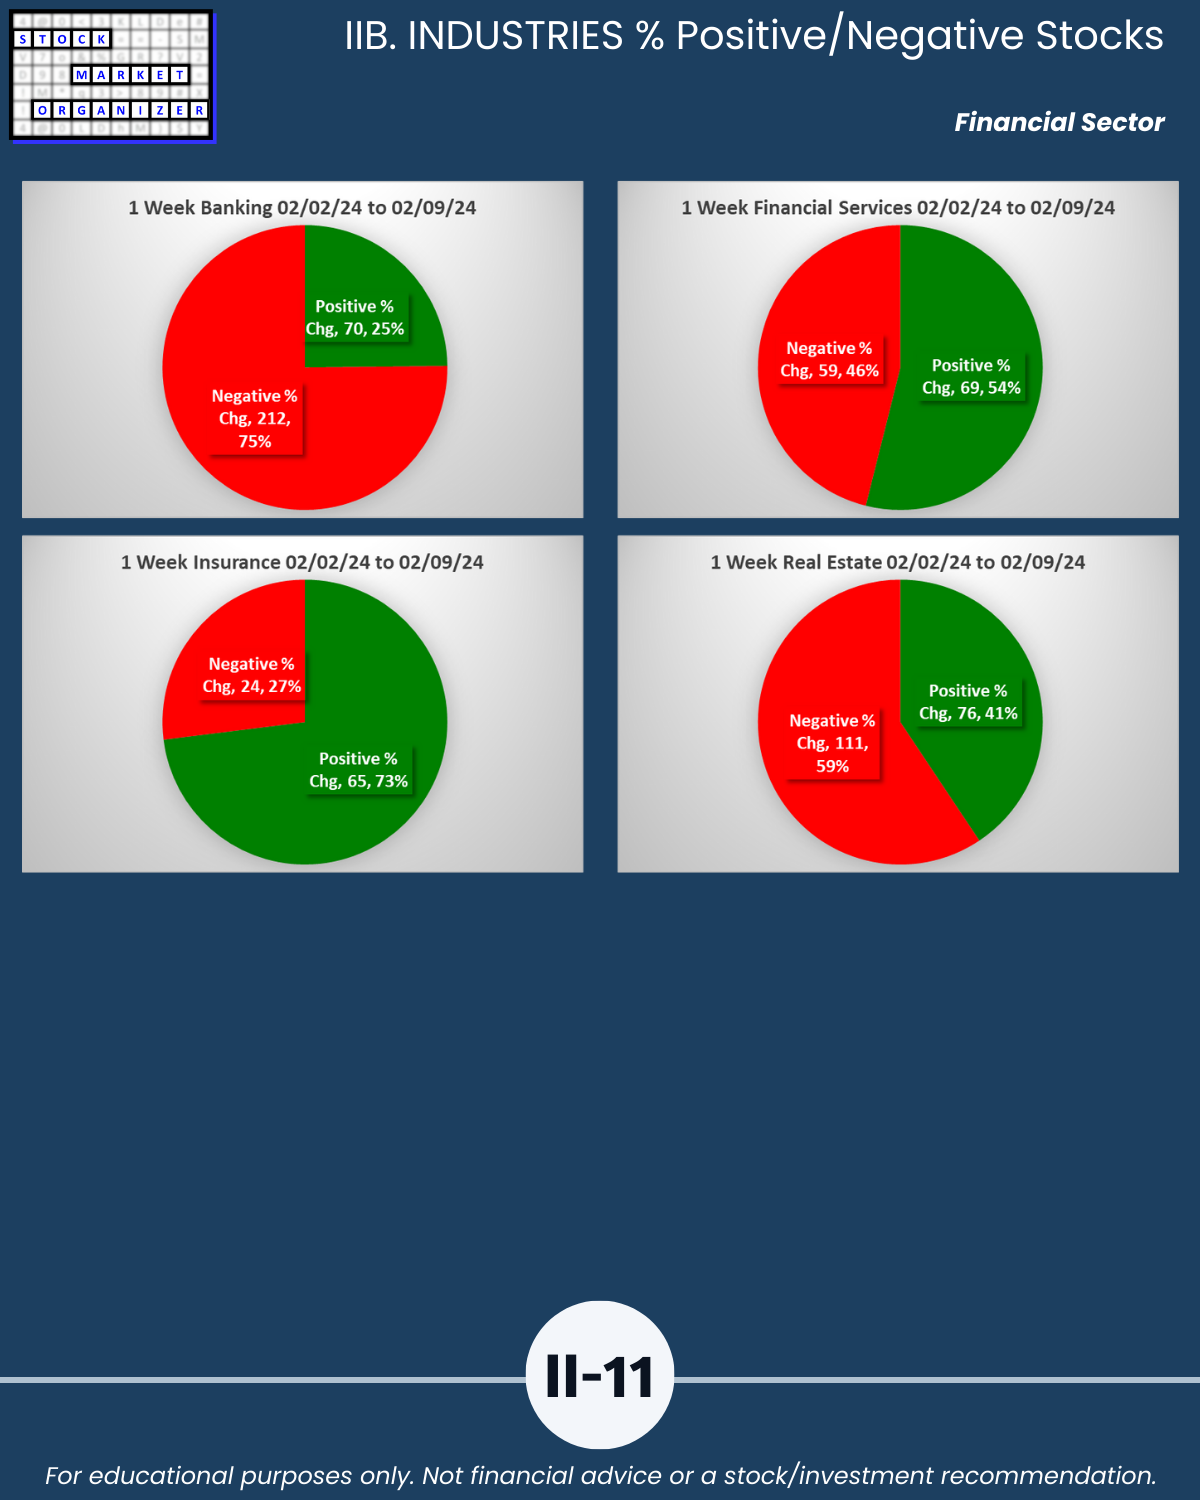
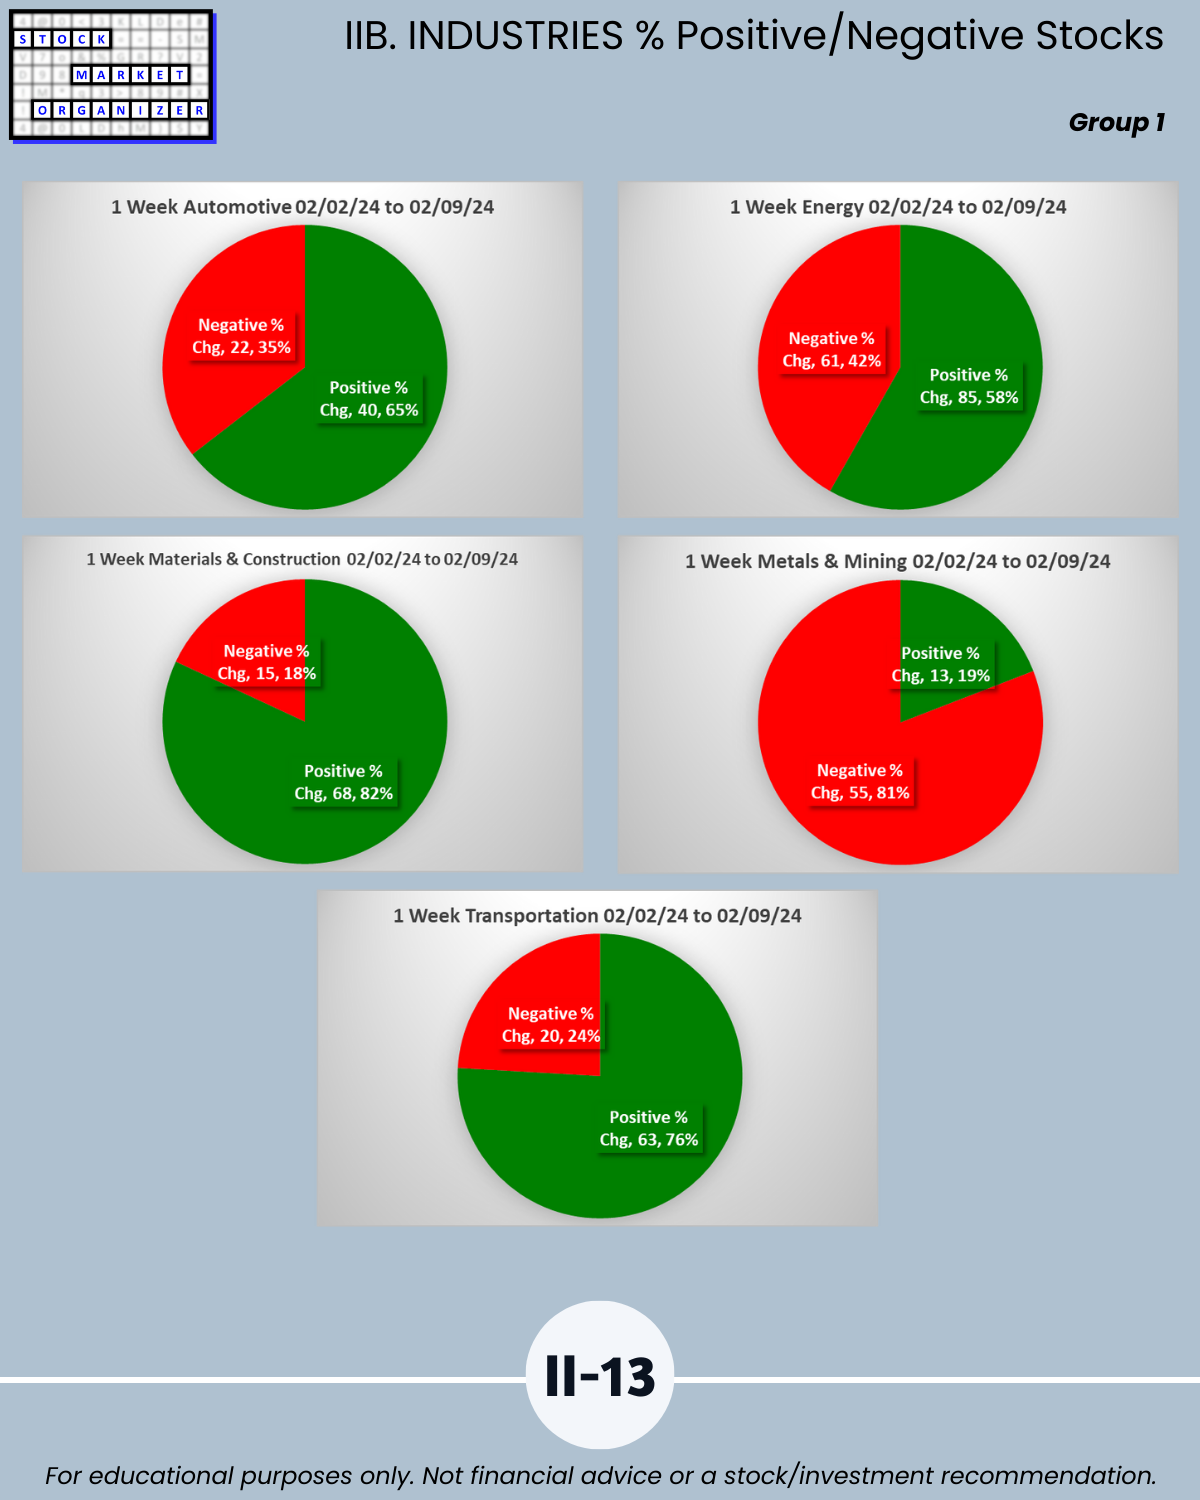
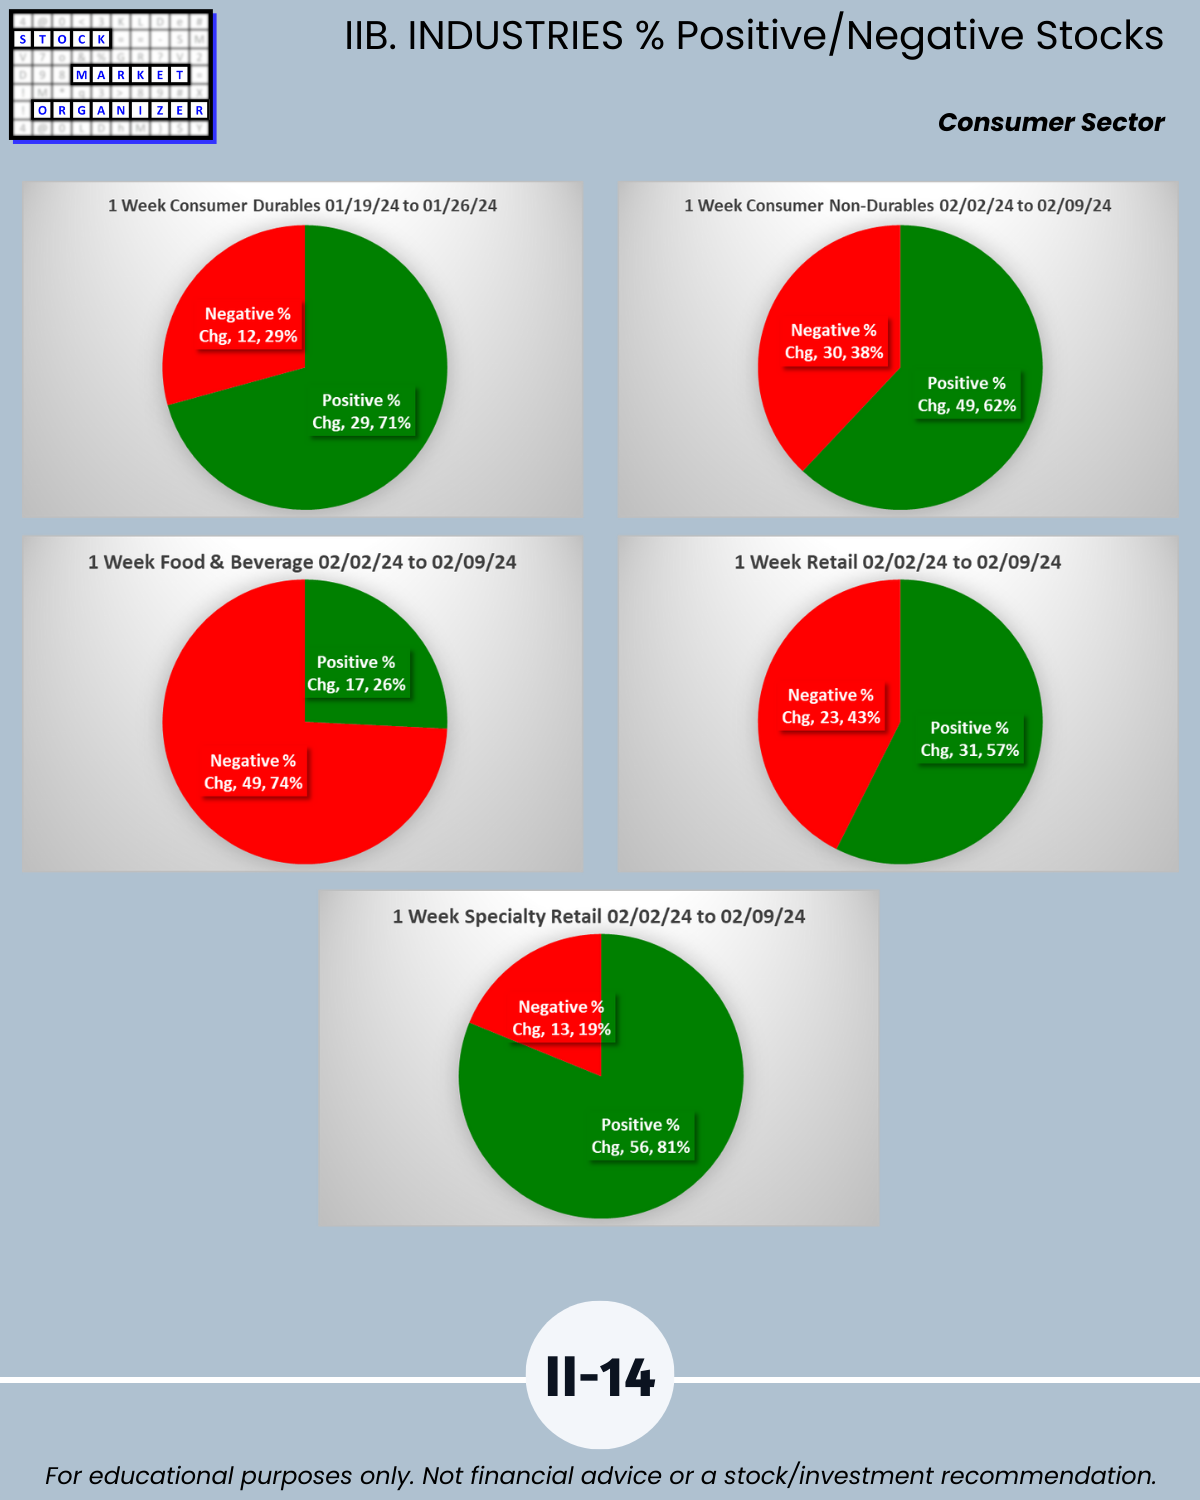
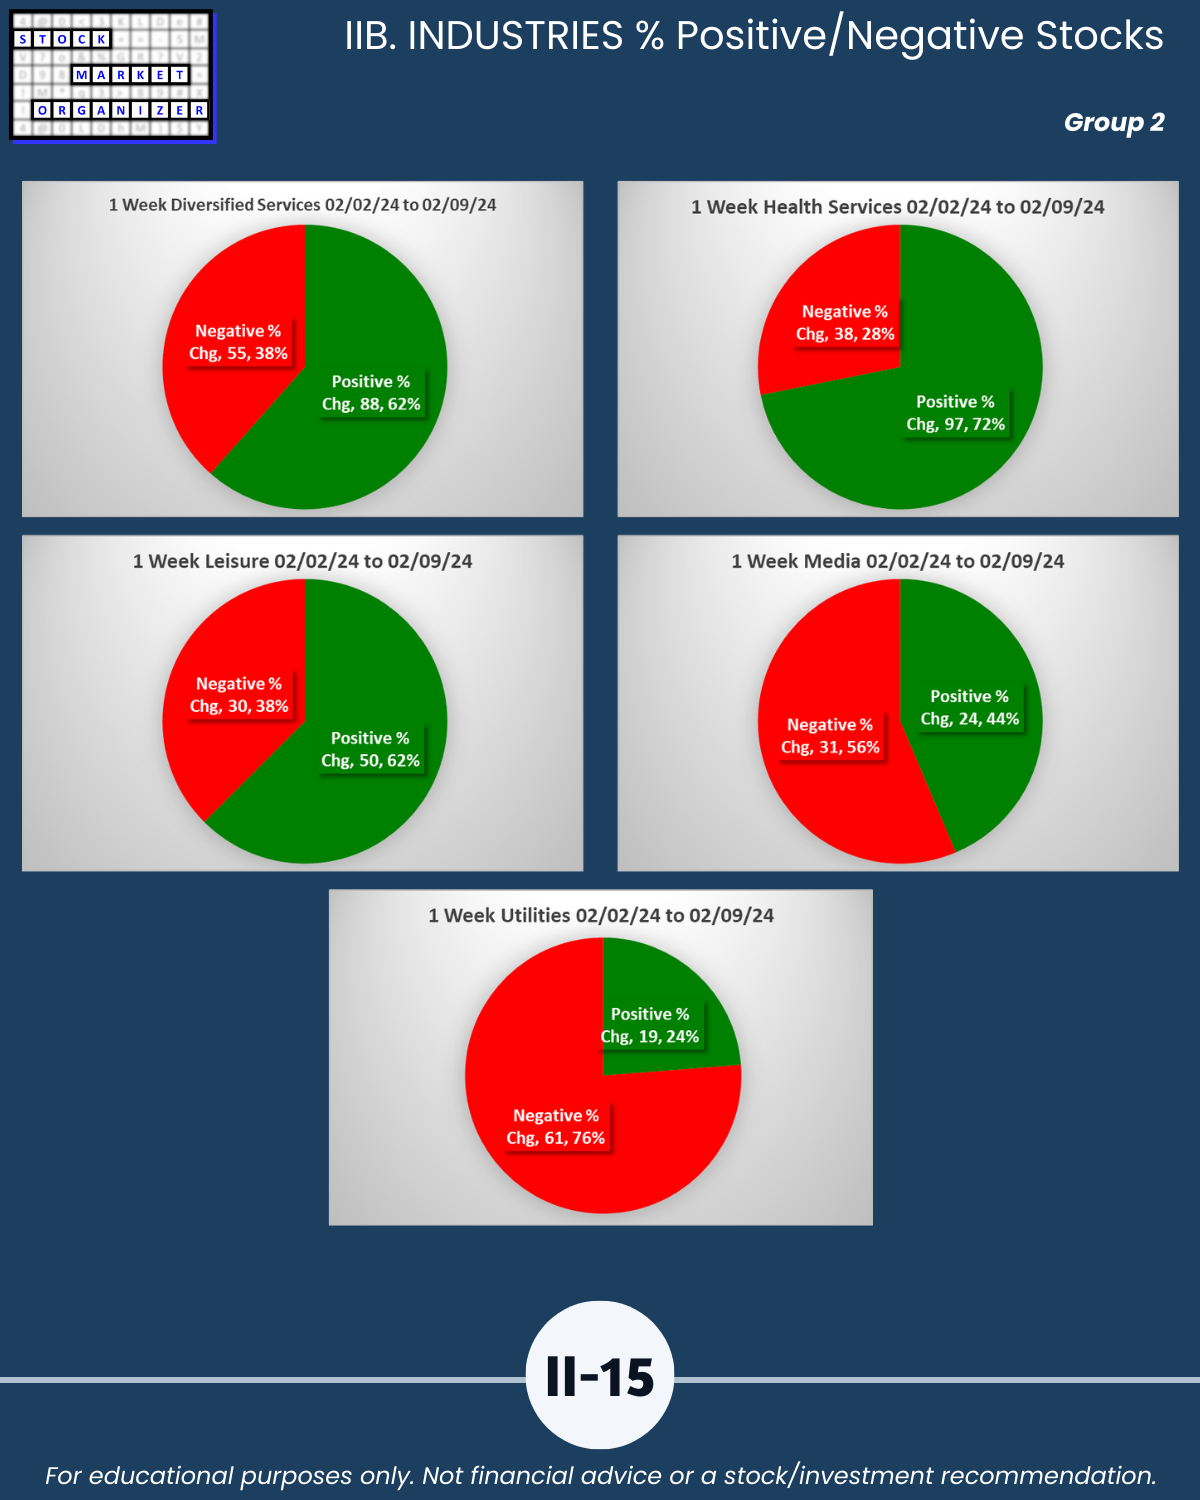
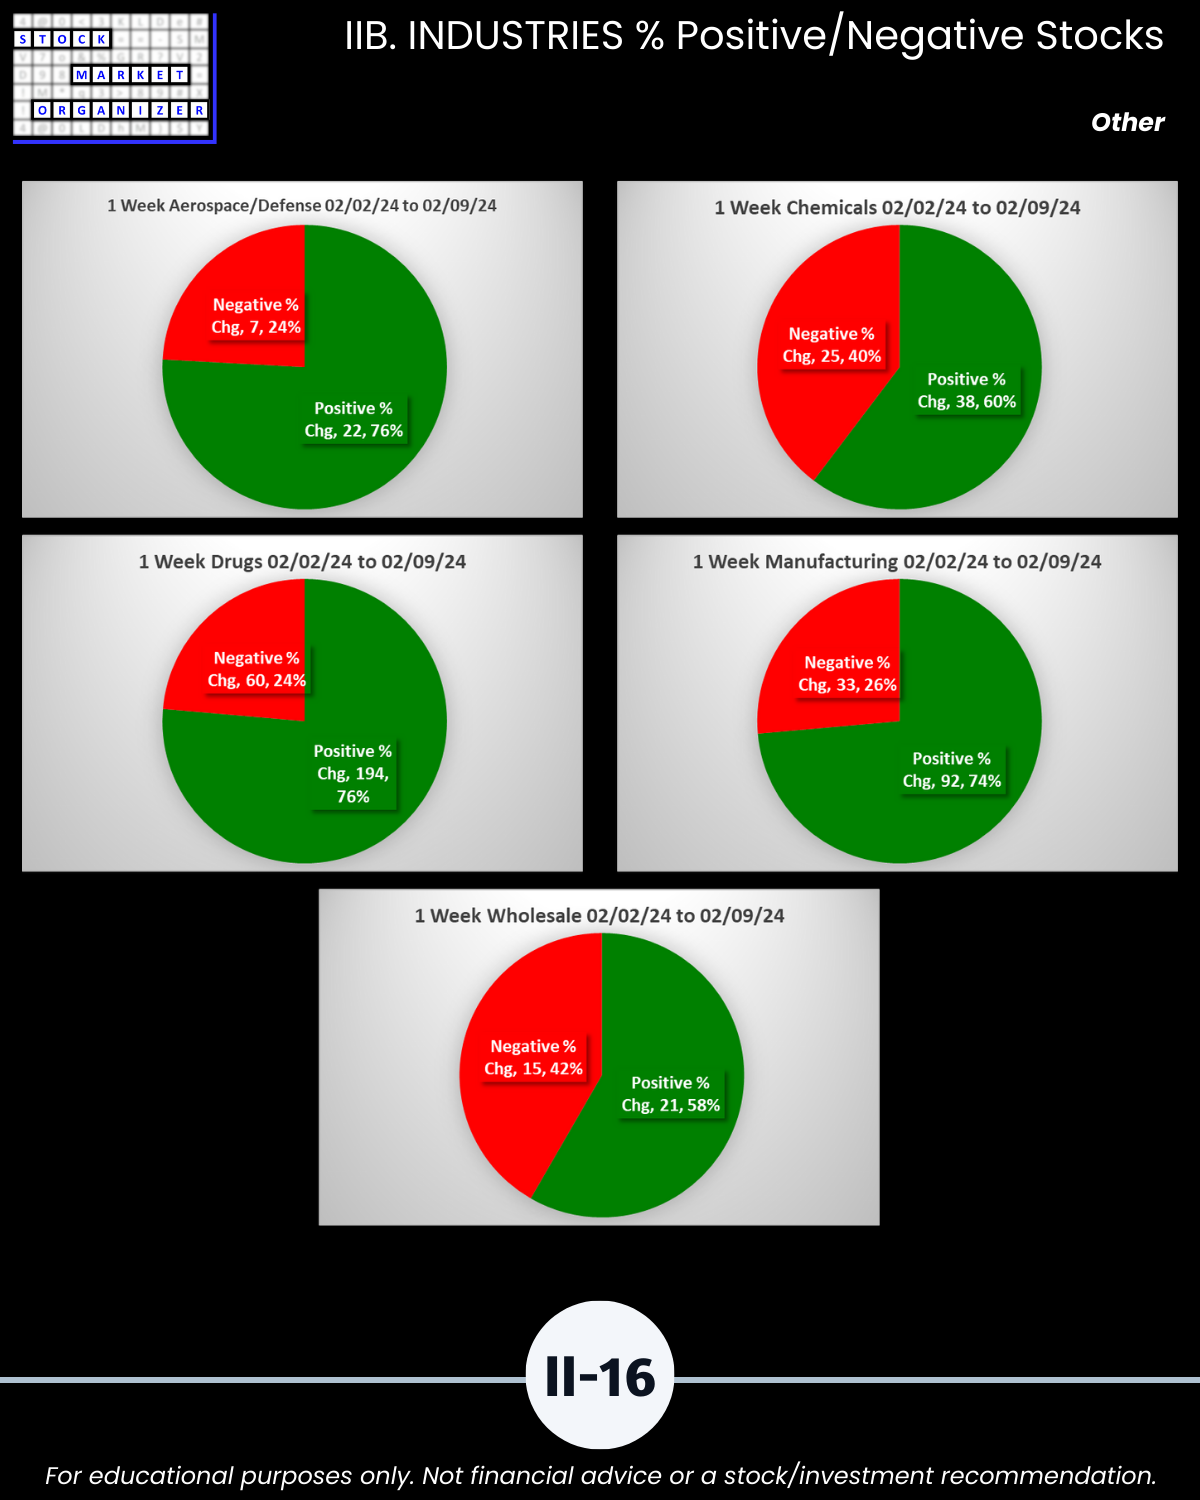
IIB. INDUSTRIES/% Positive/Negative Stocks
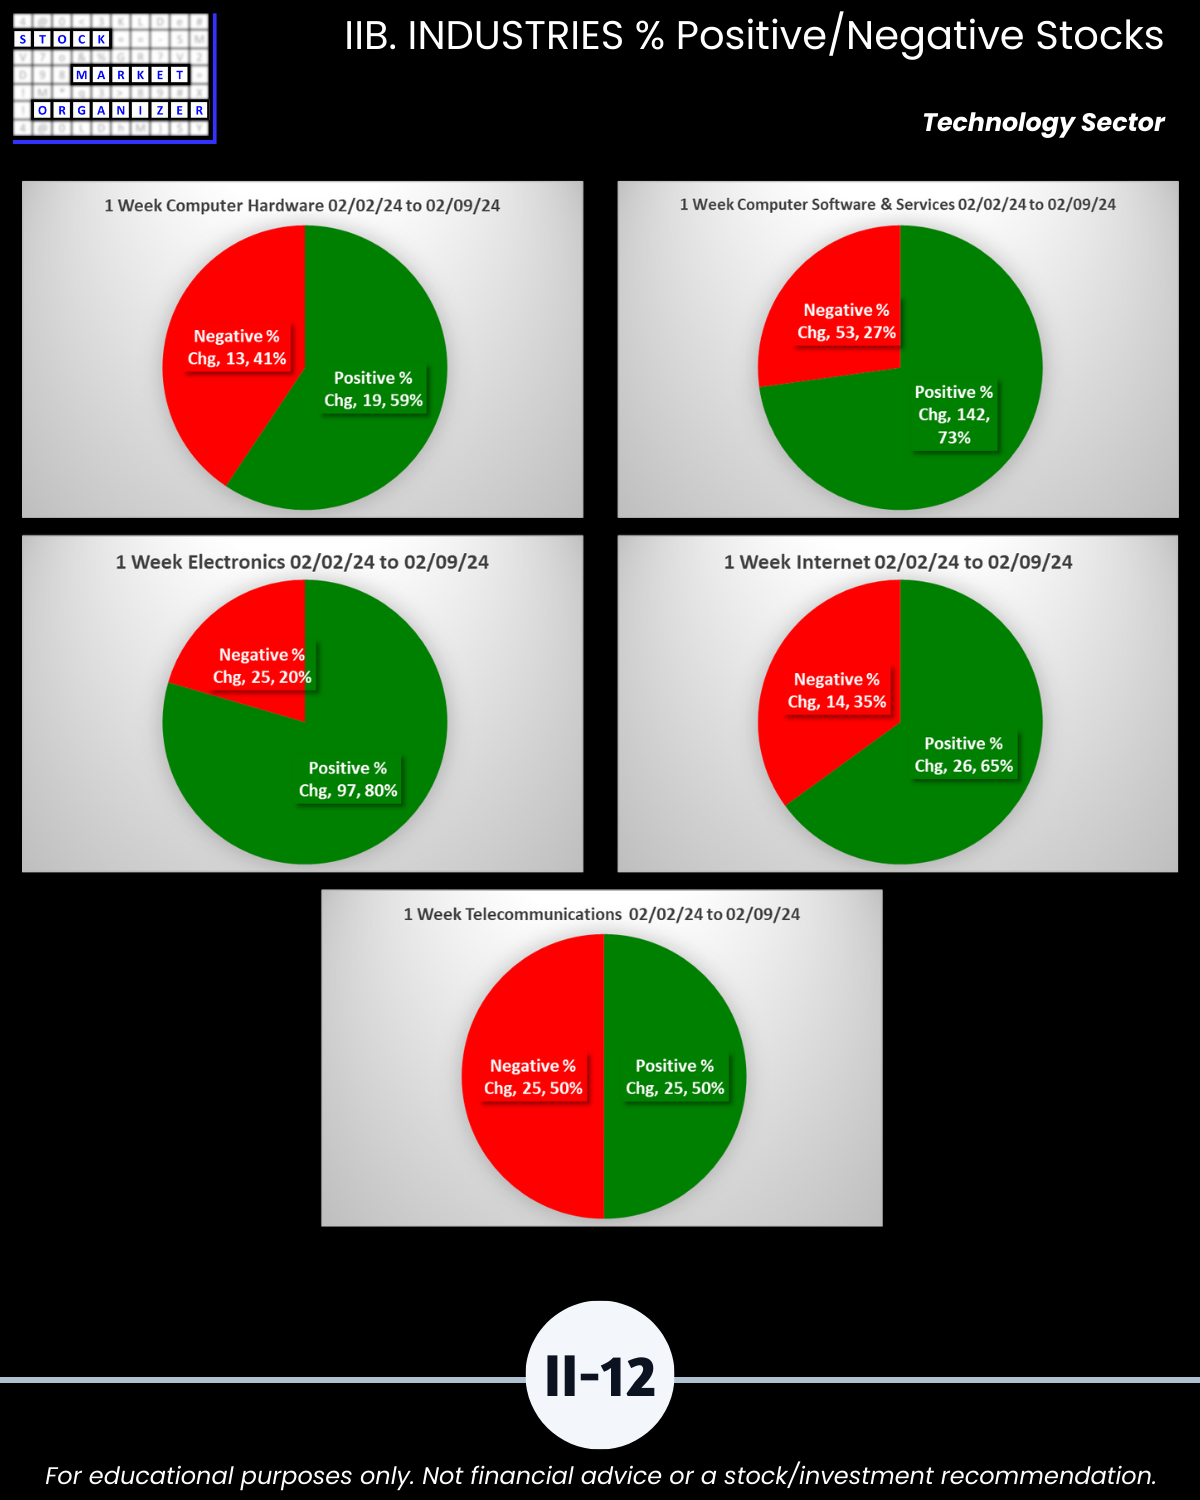
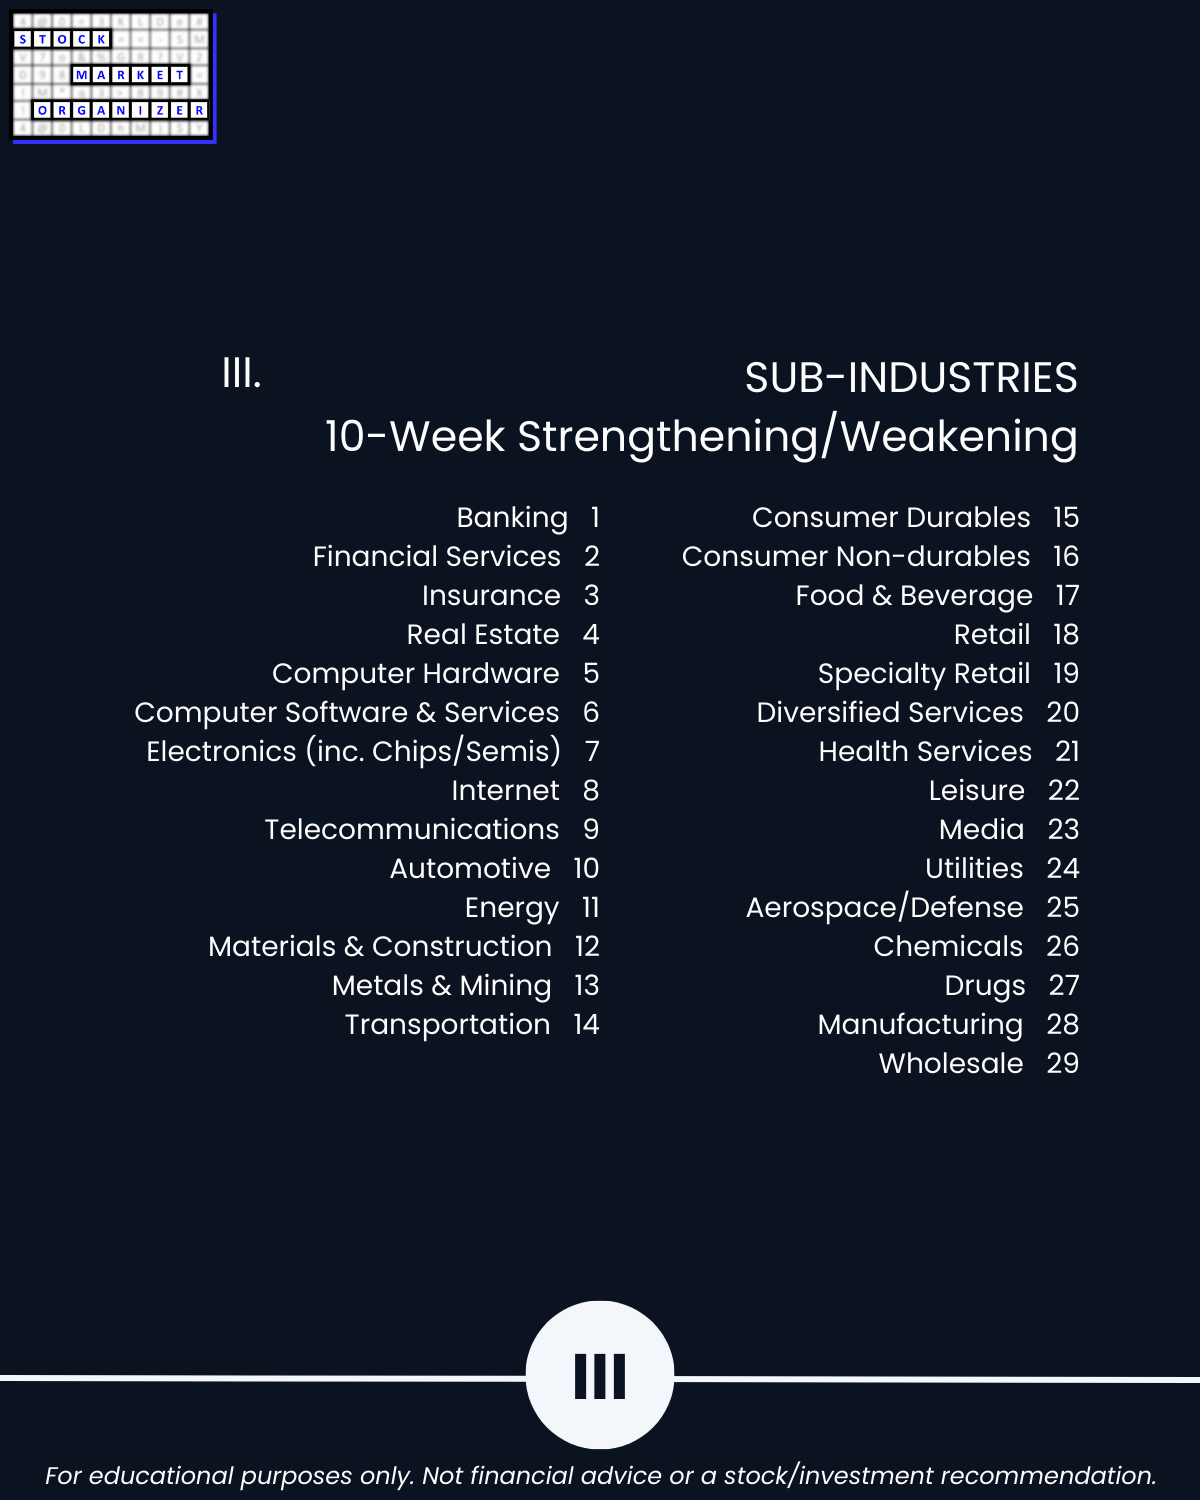
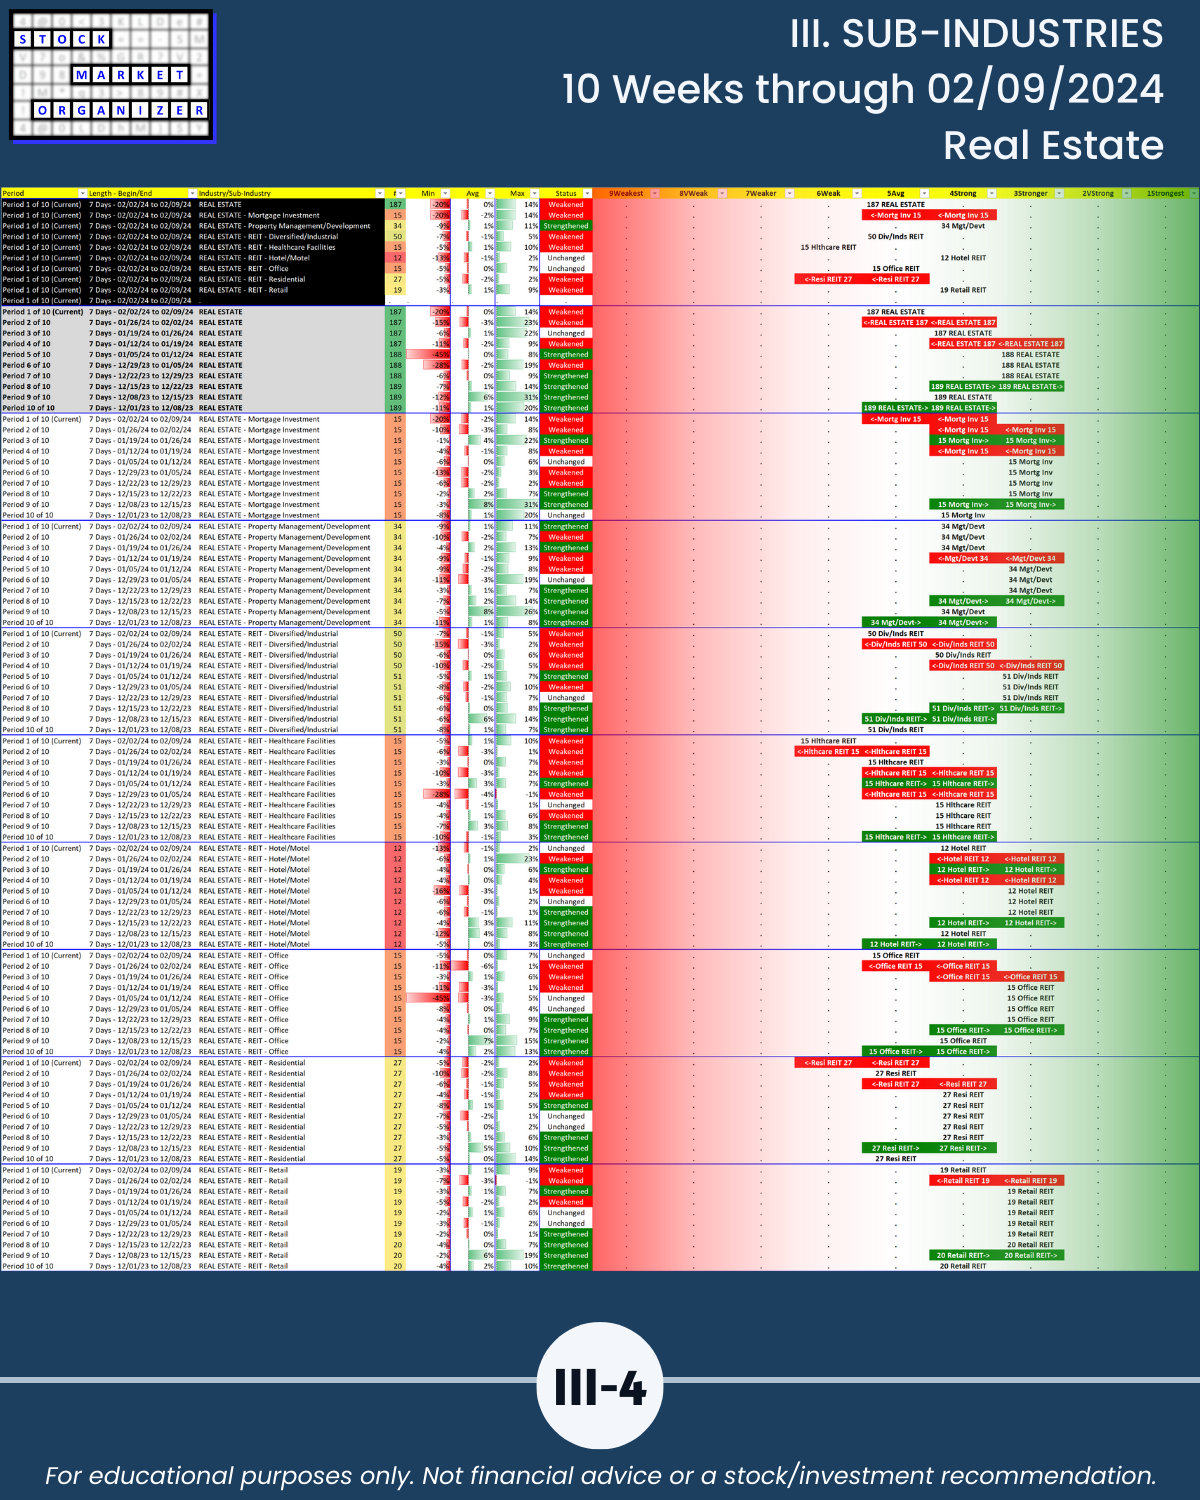
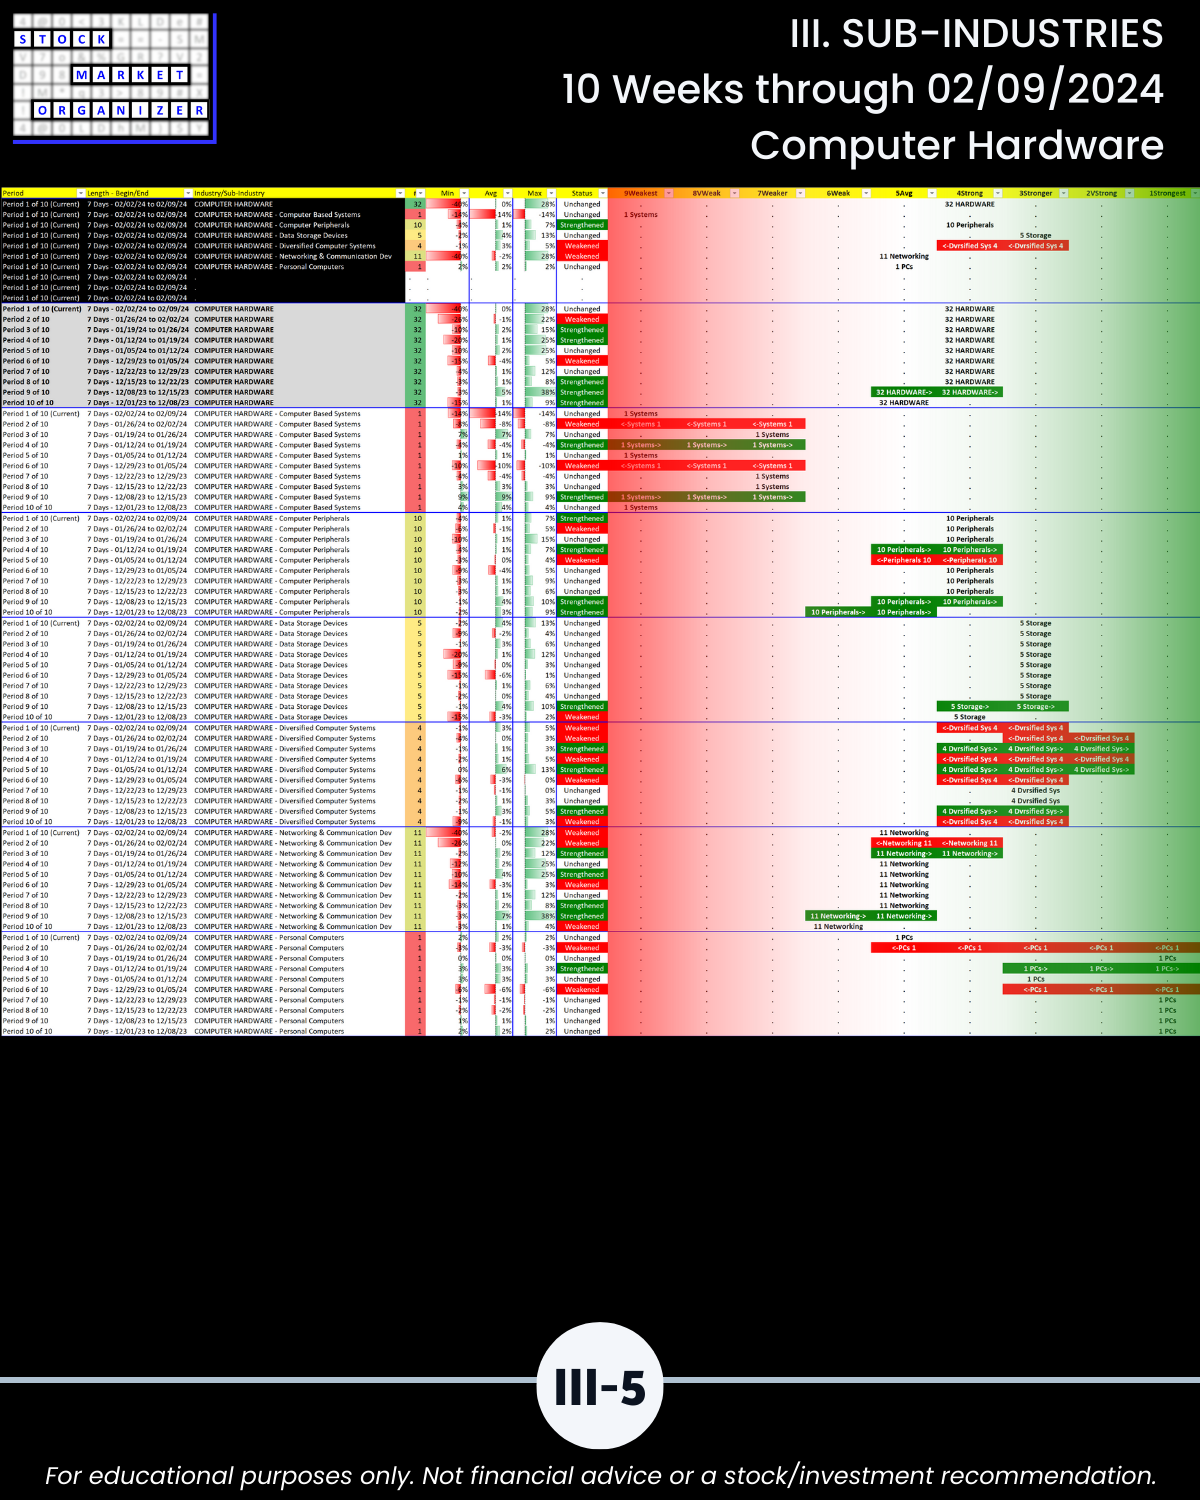
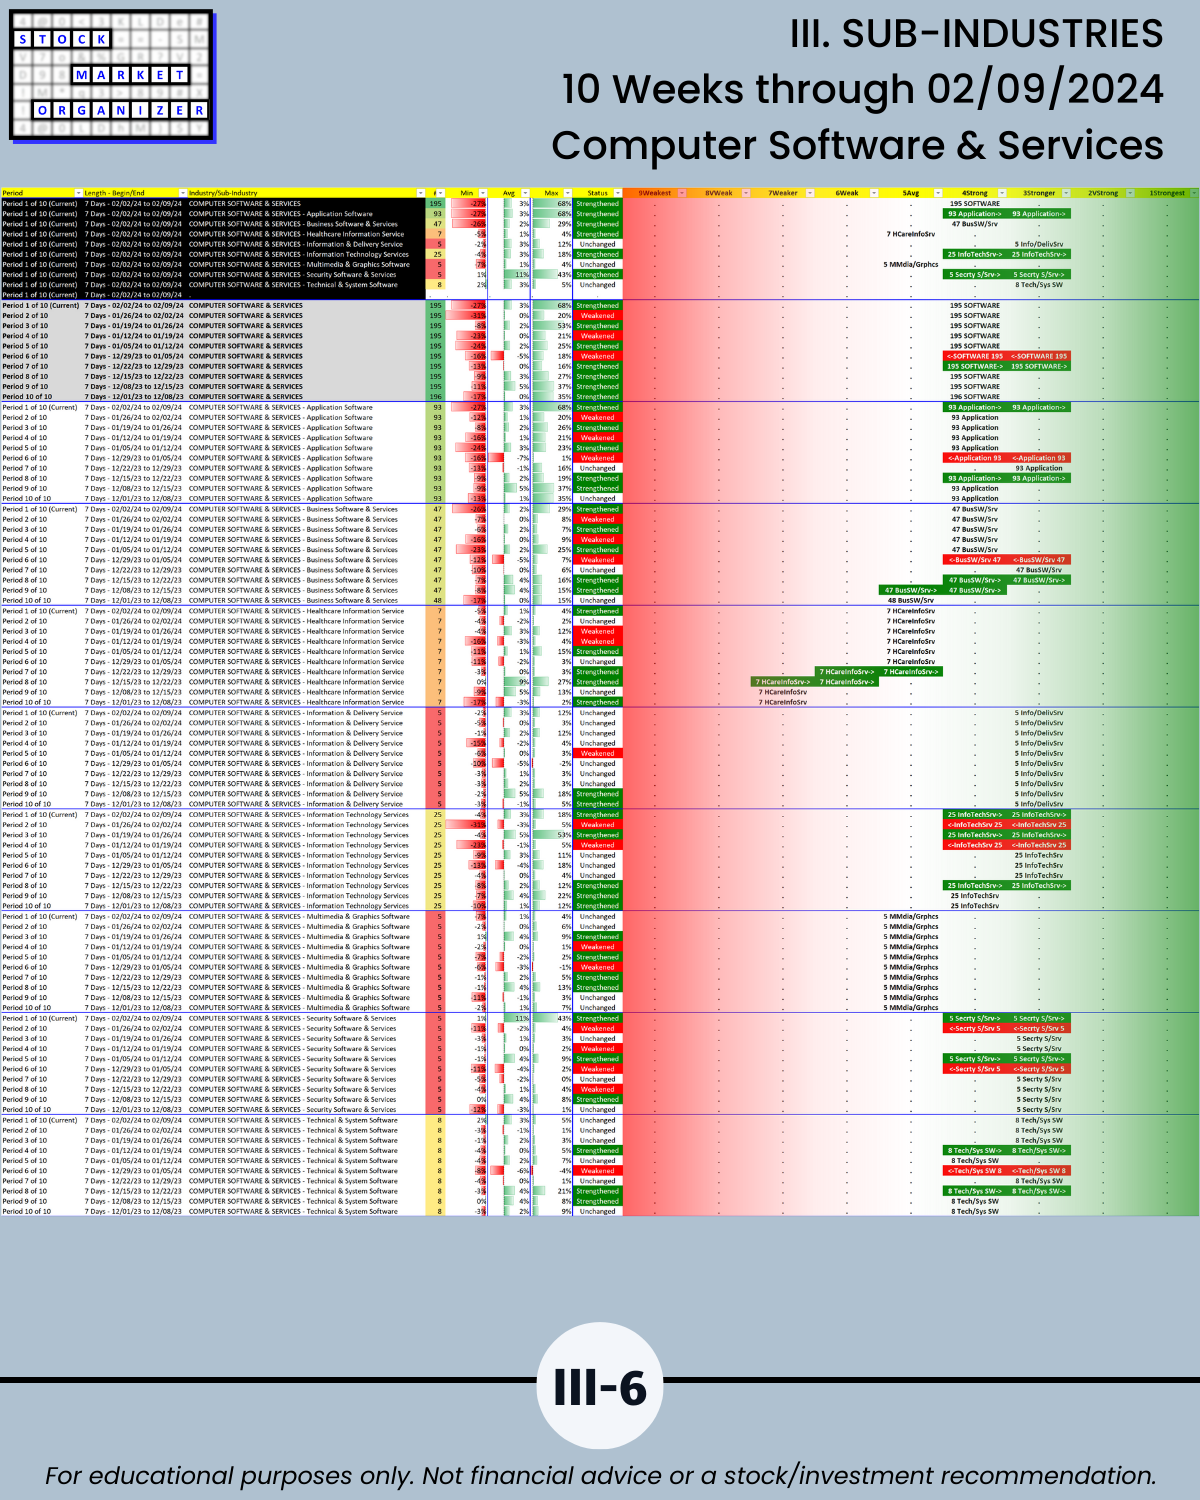
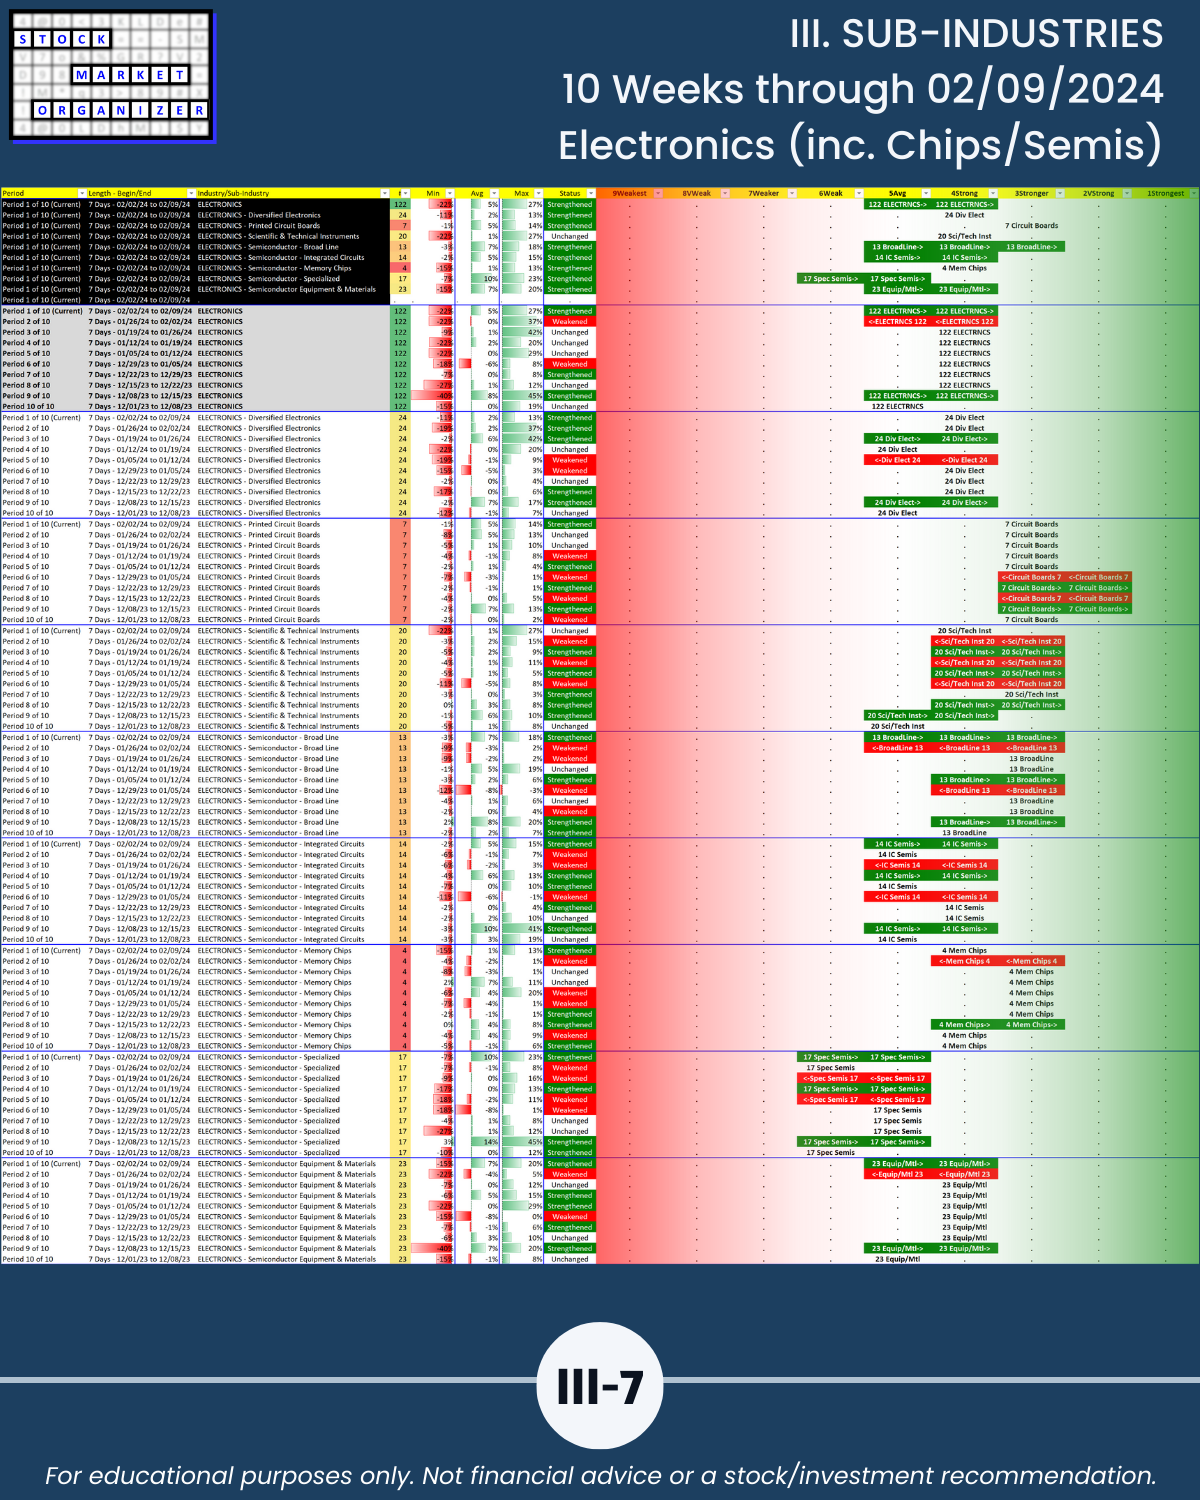
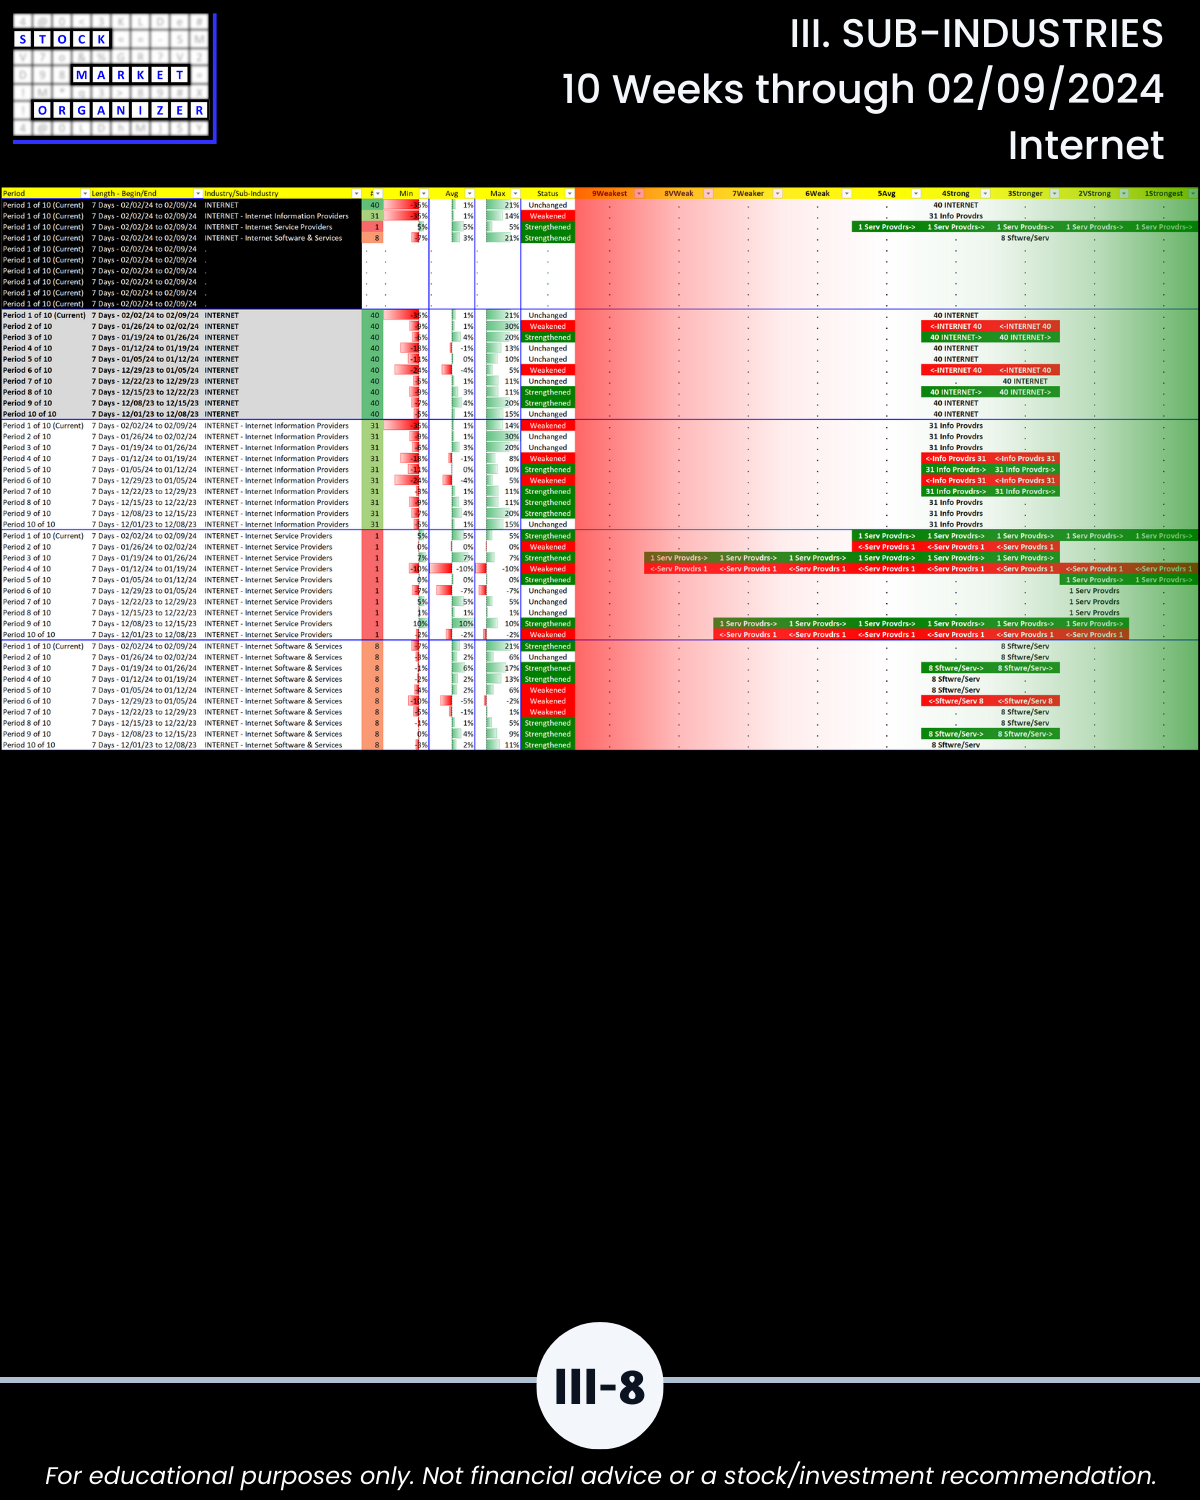
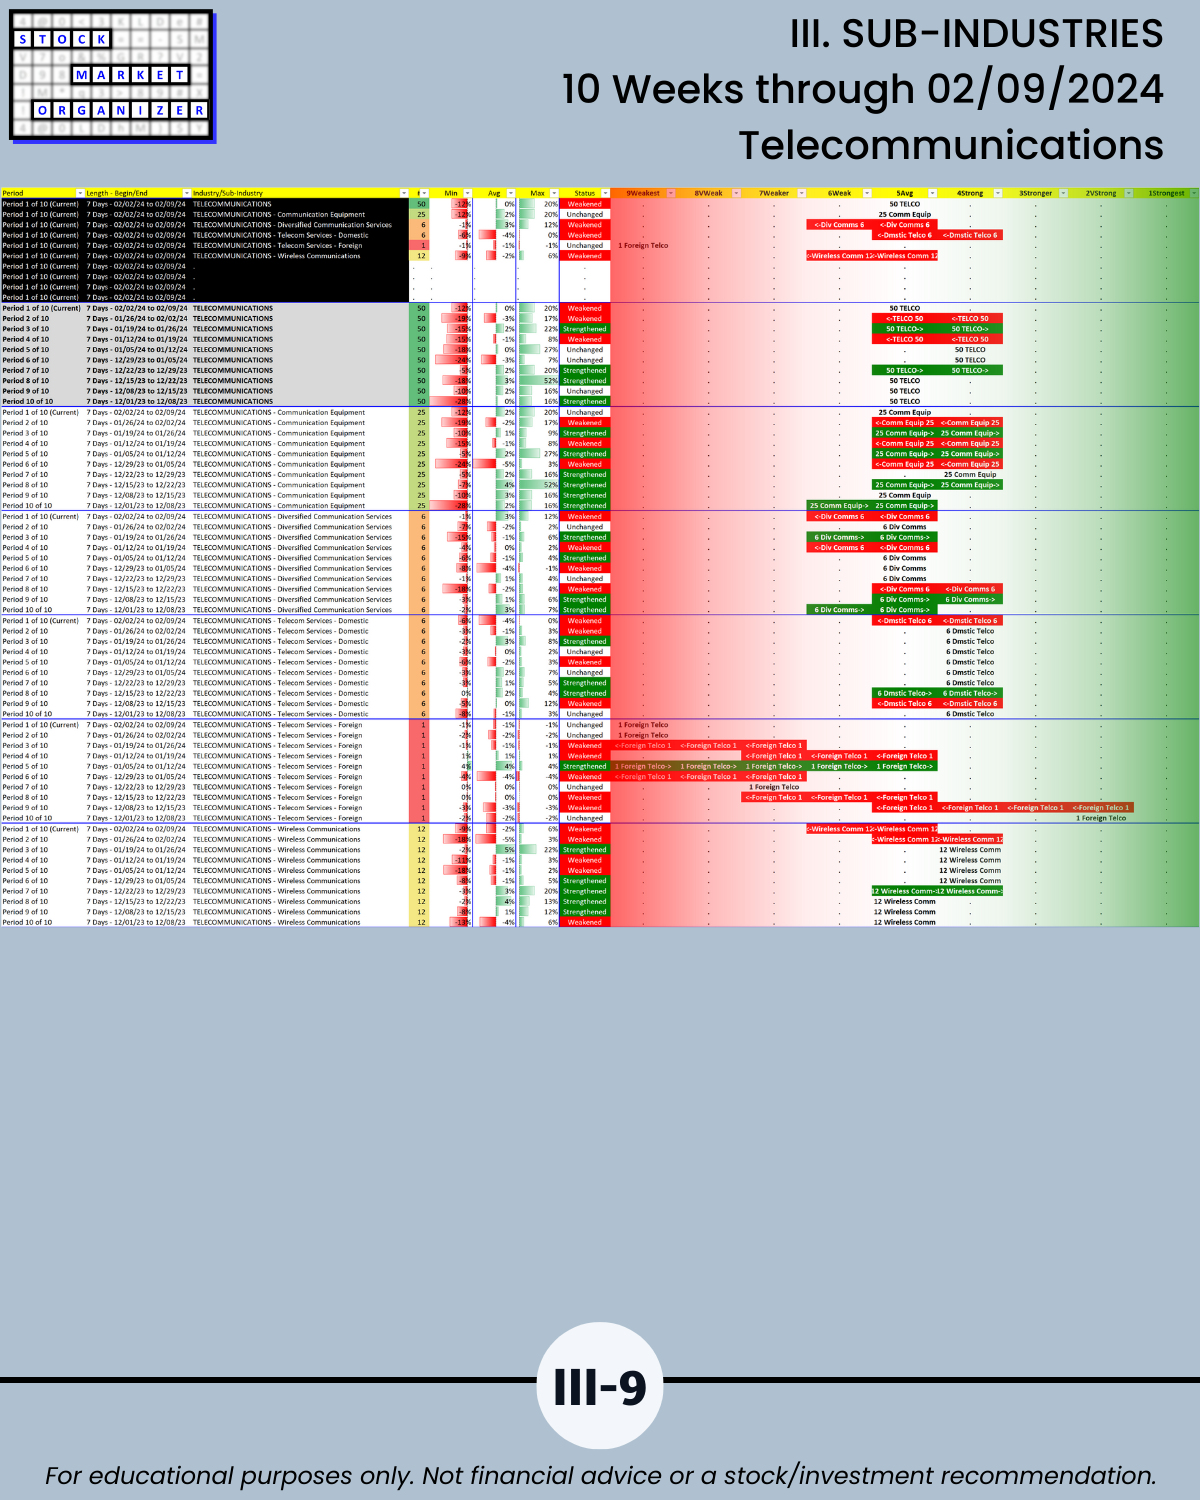
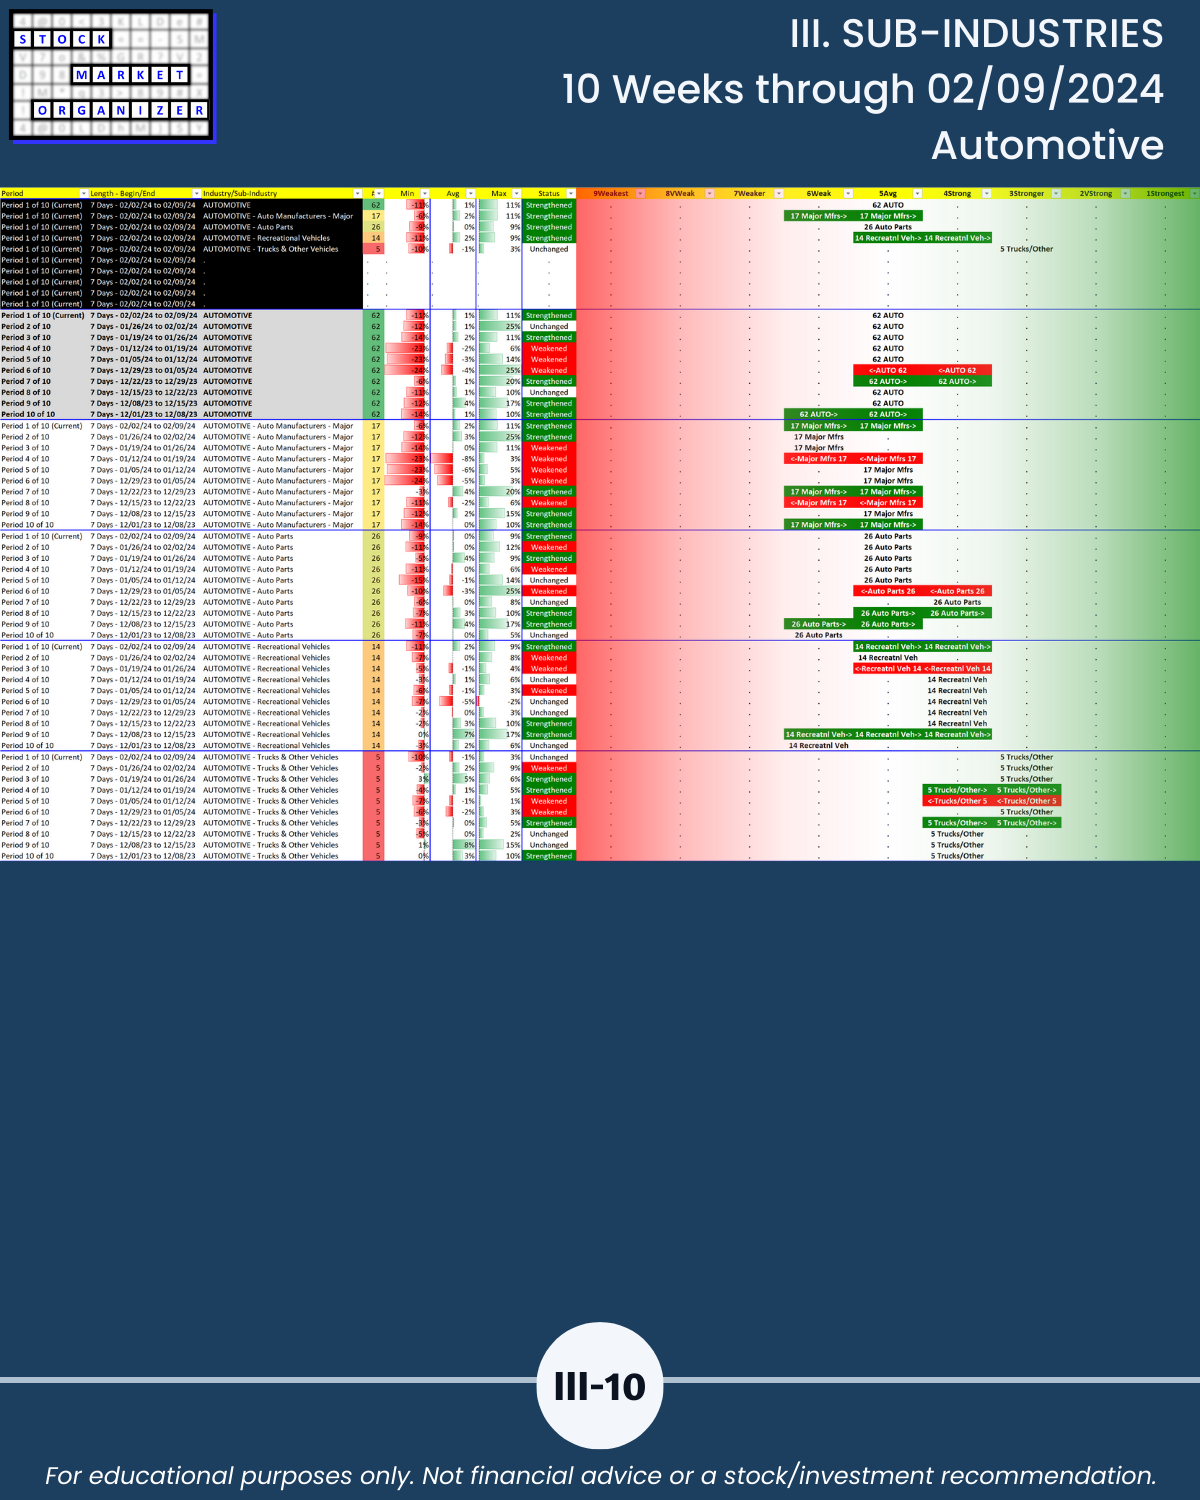
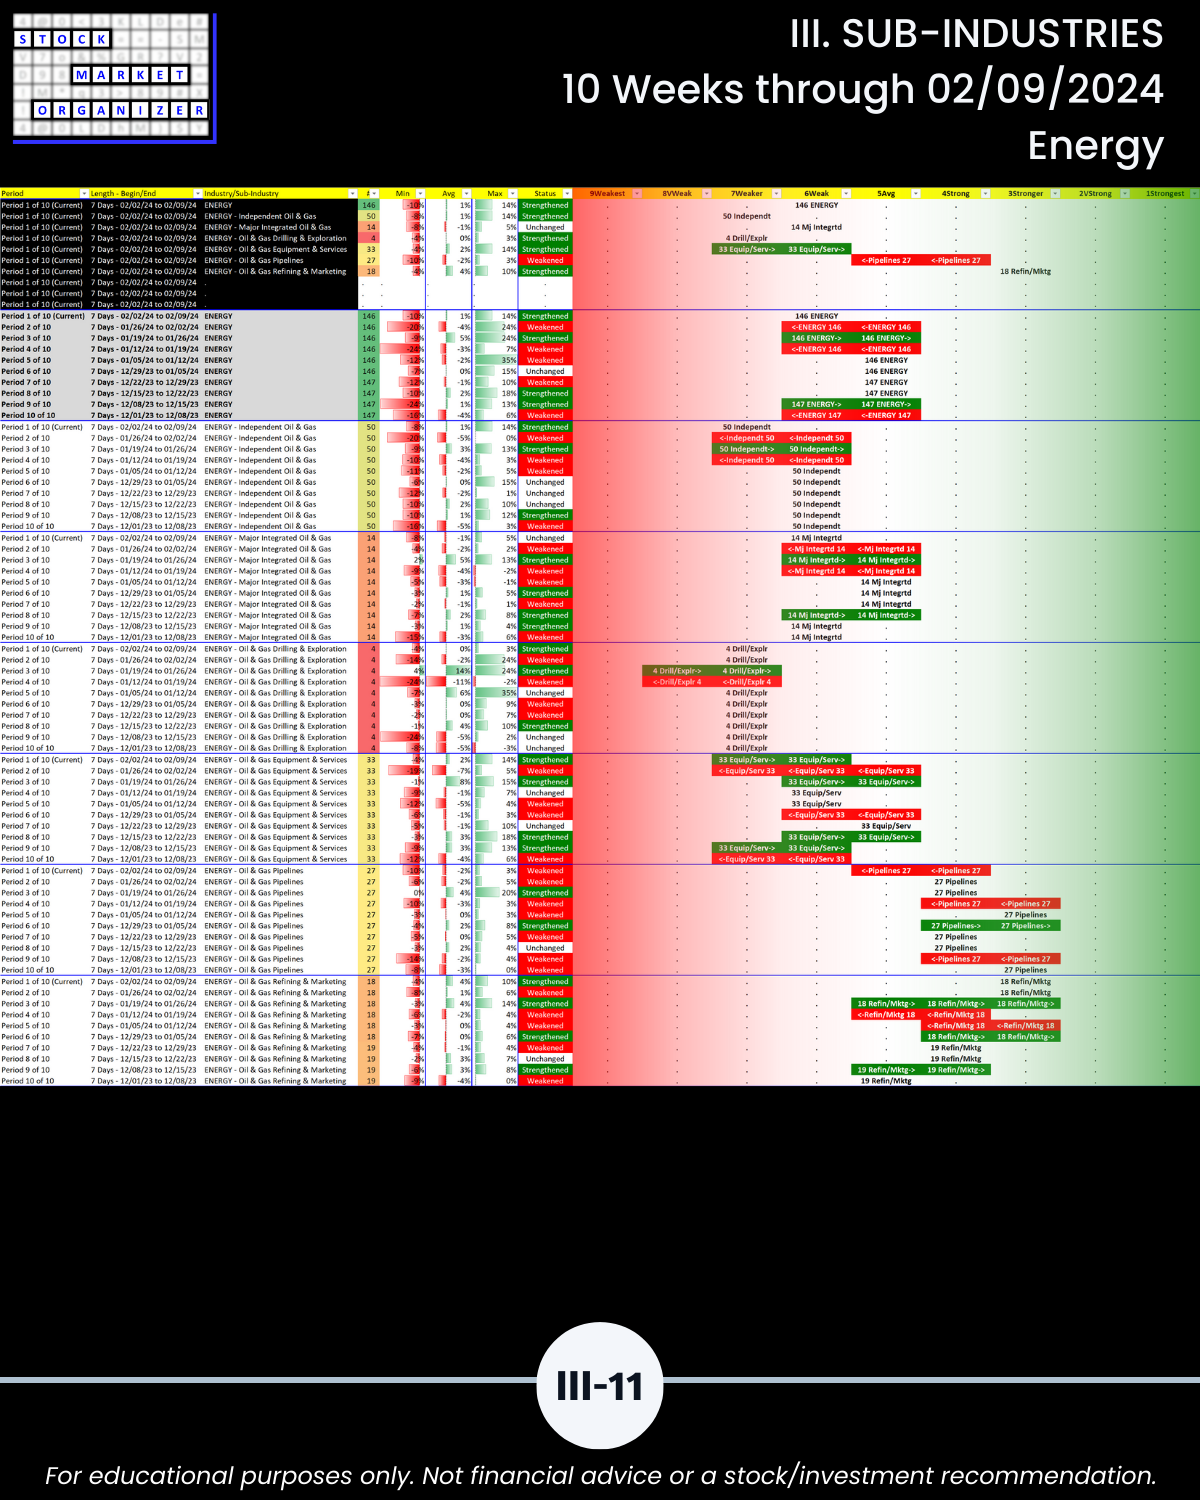
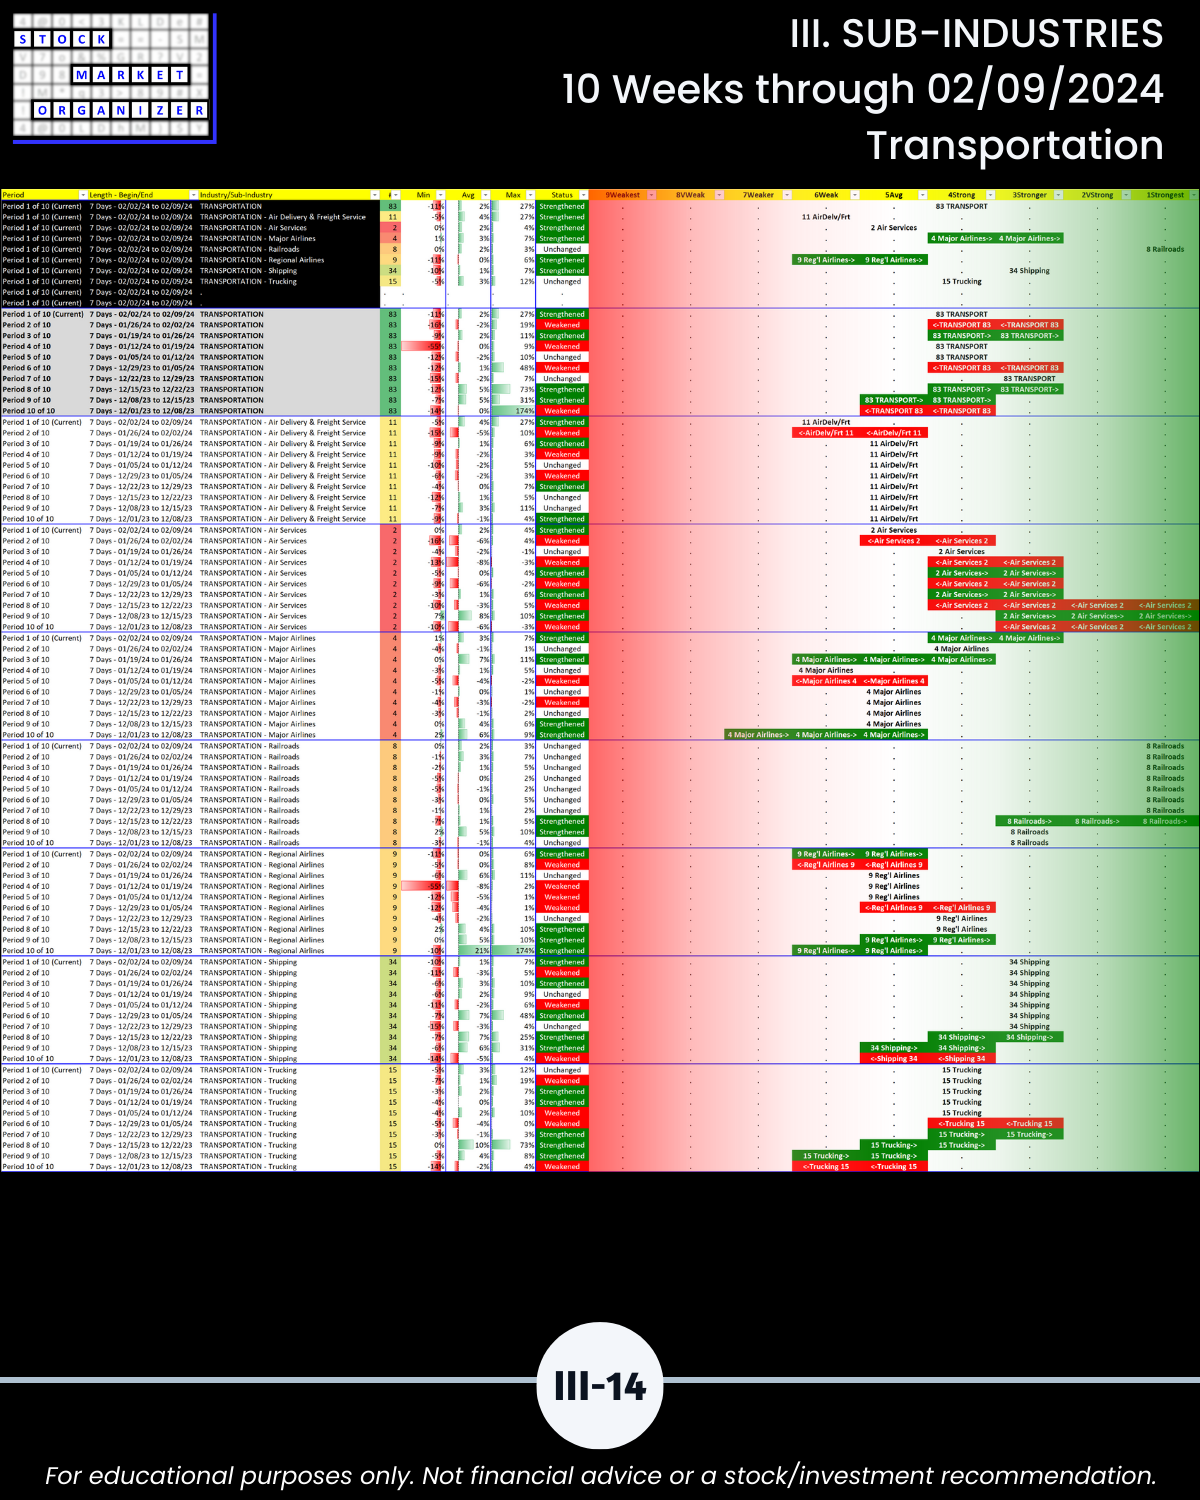
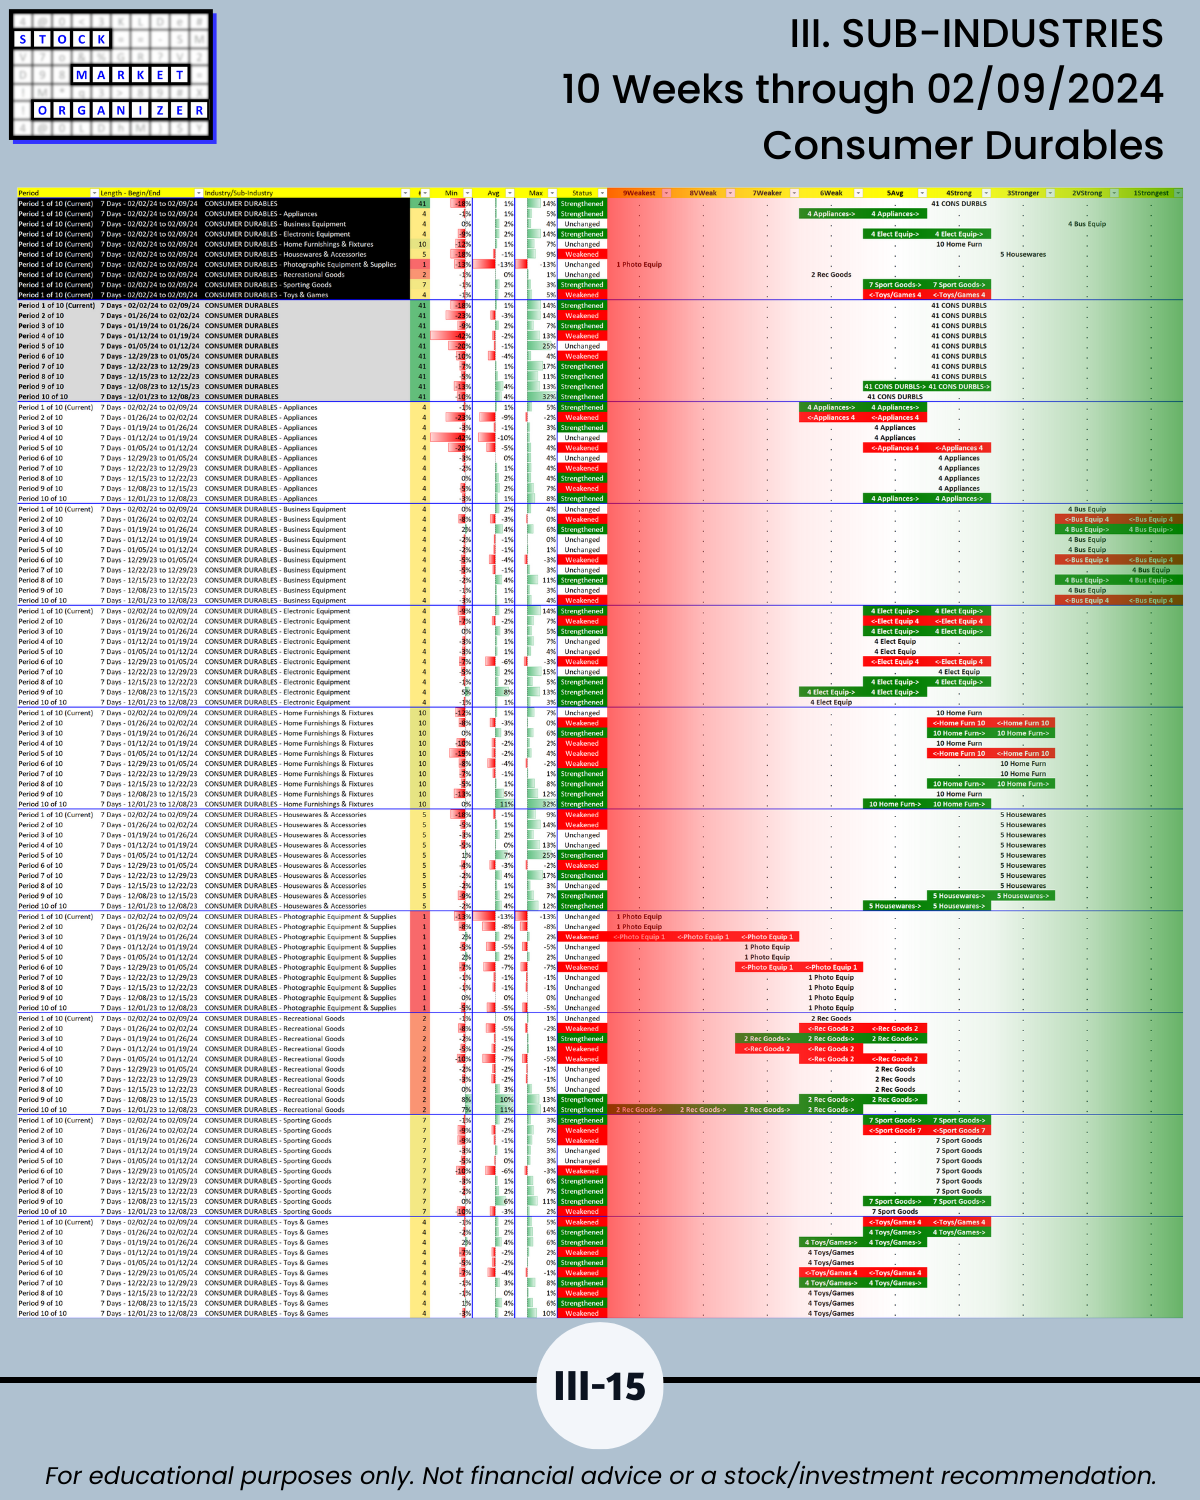
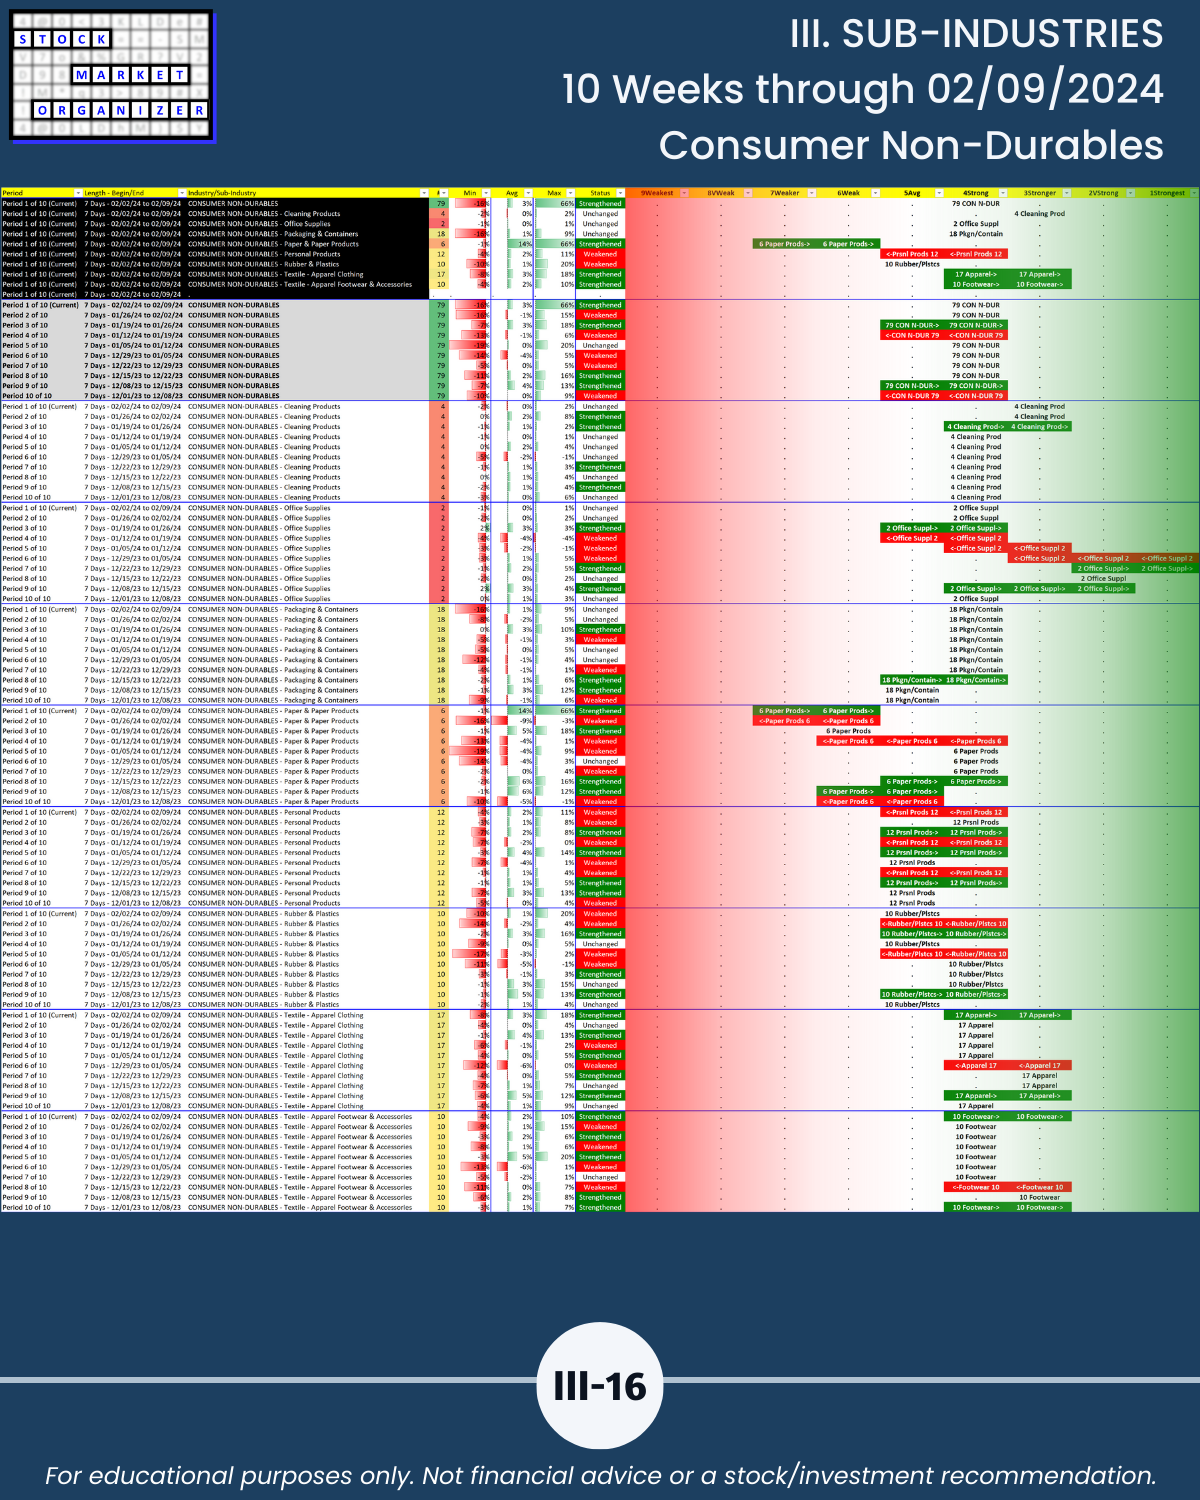
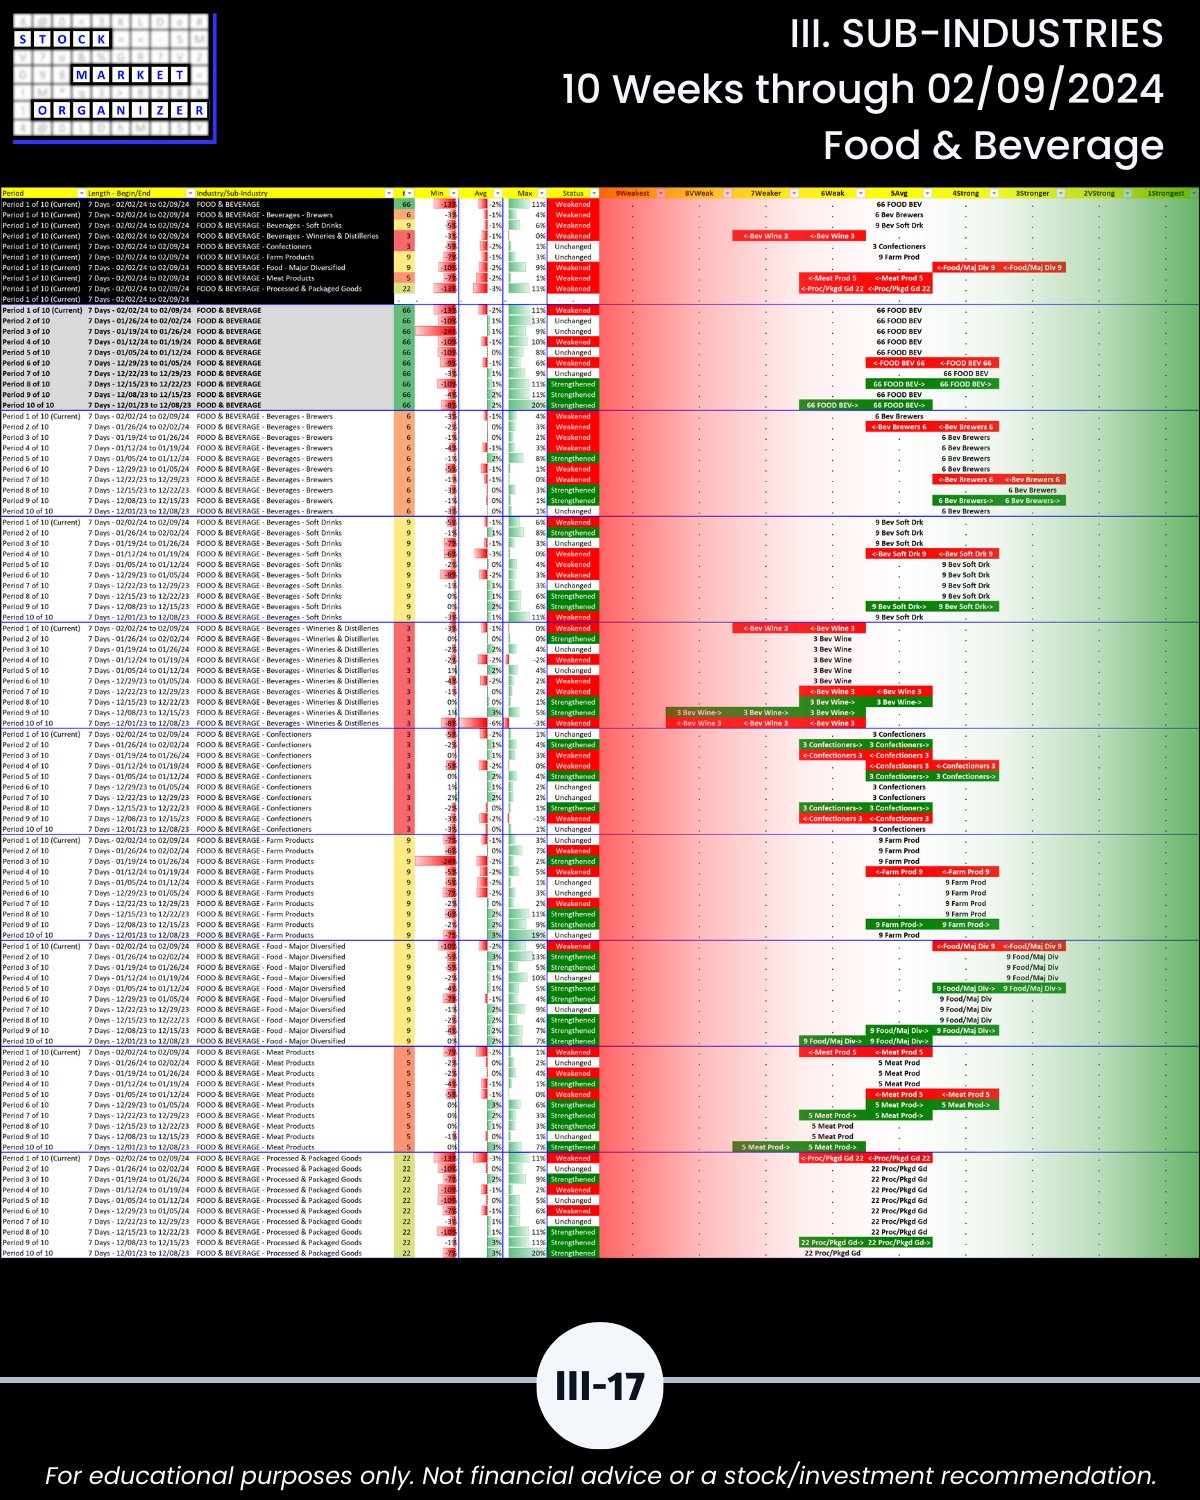
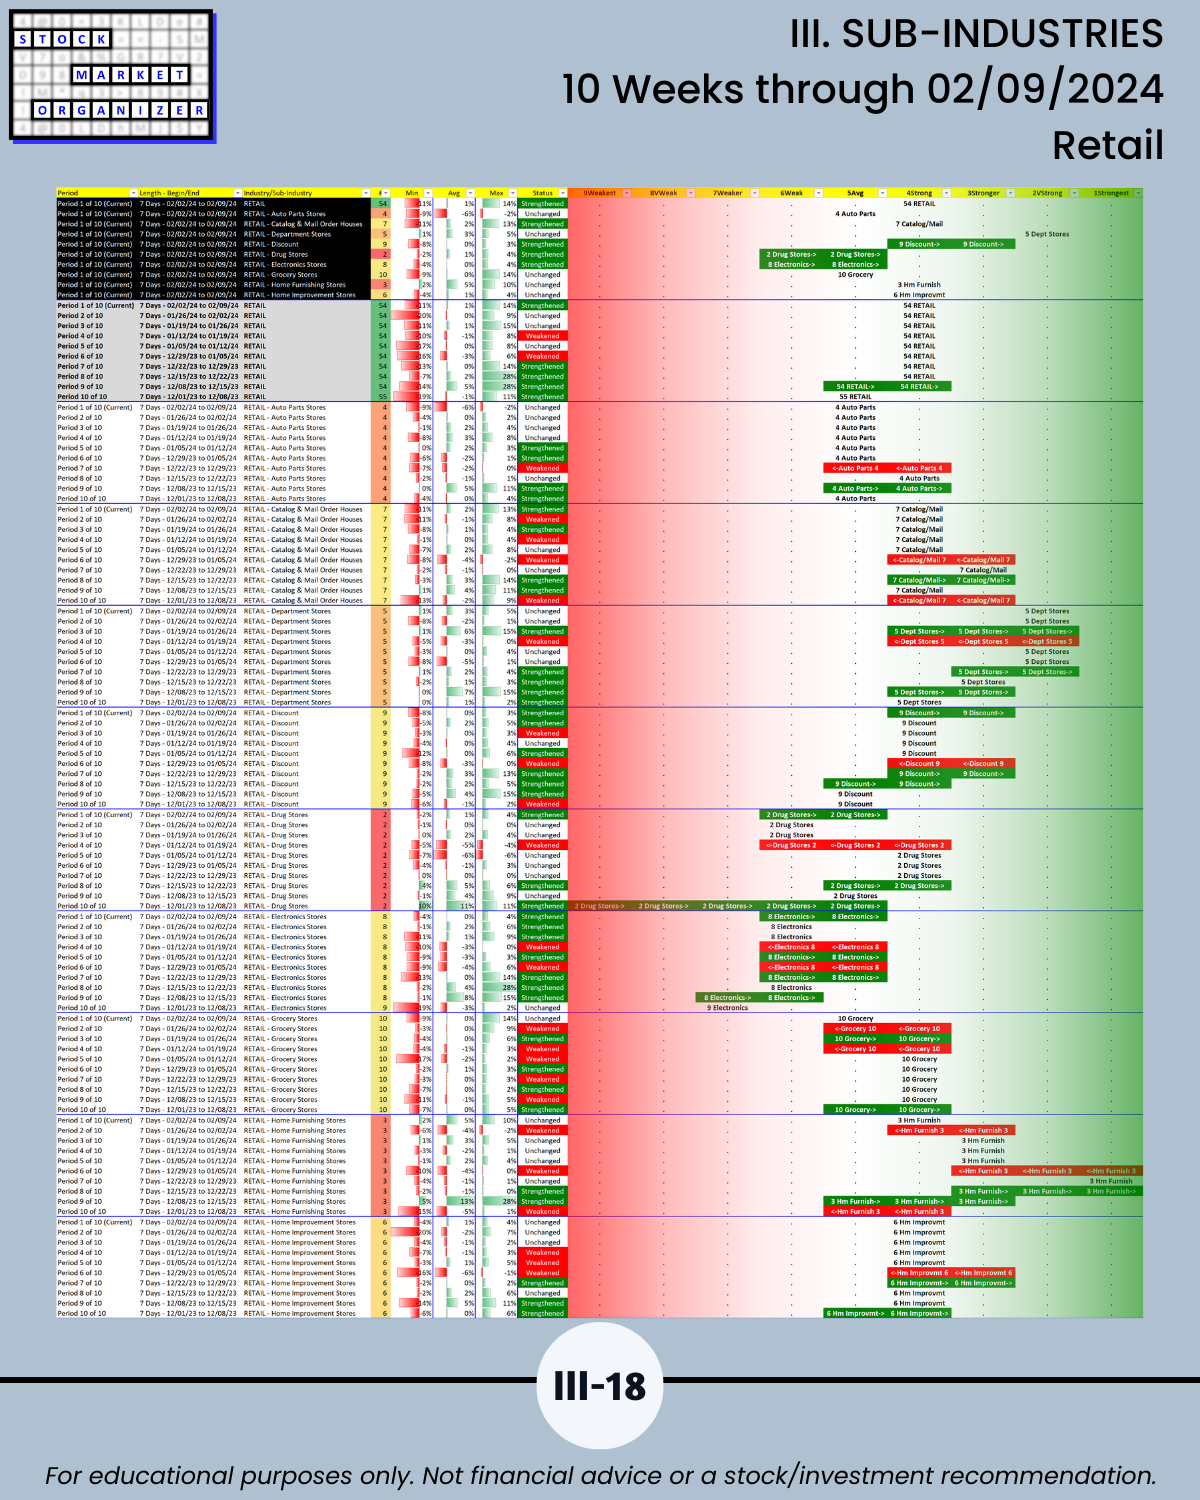
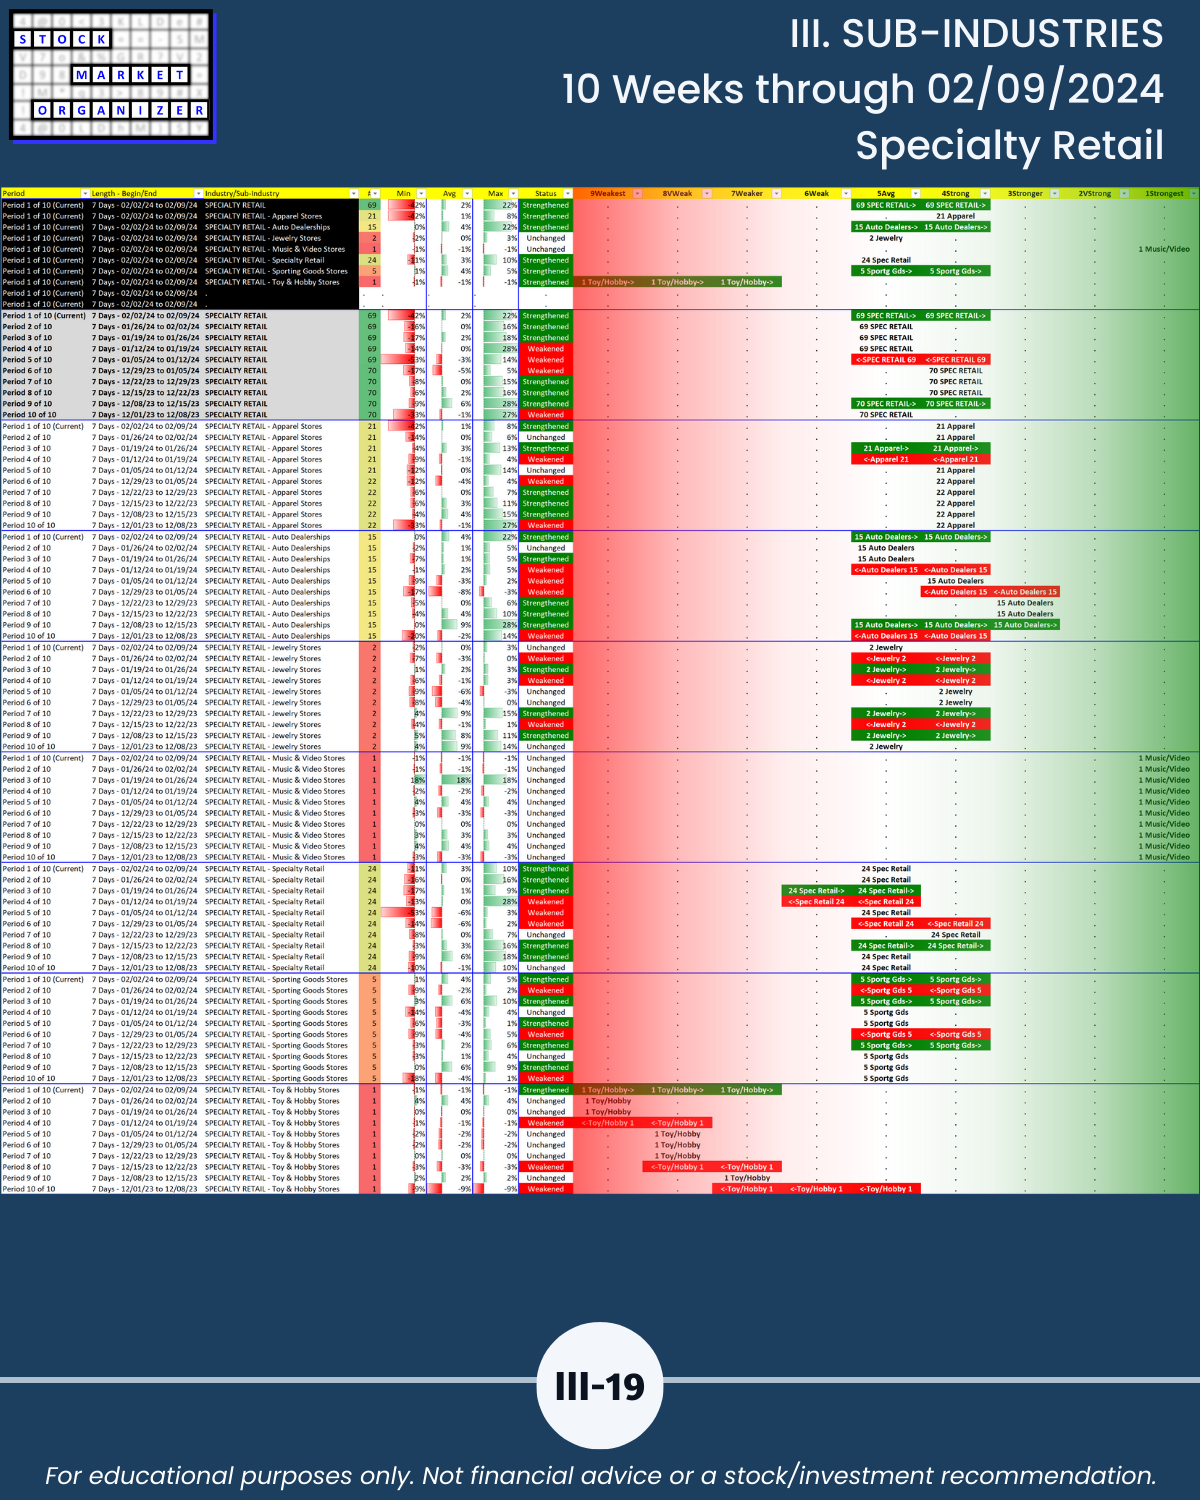
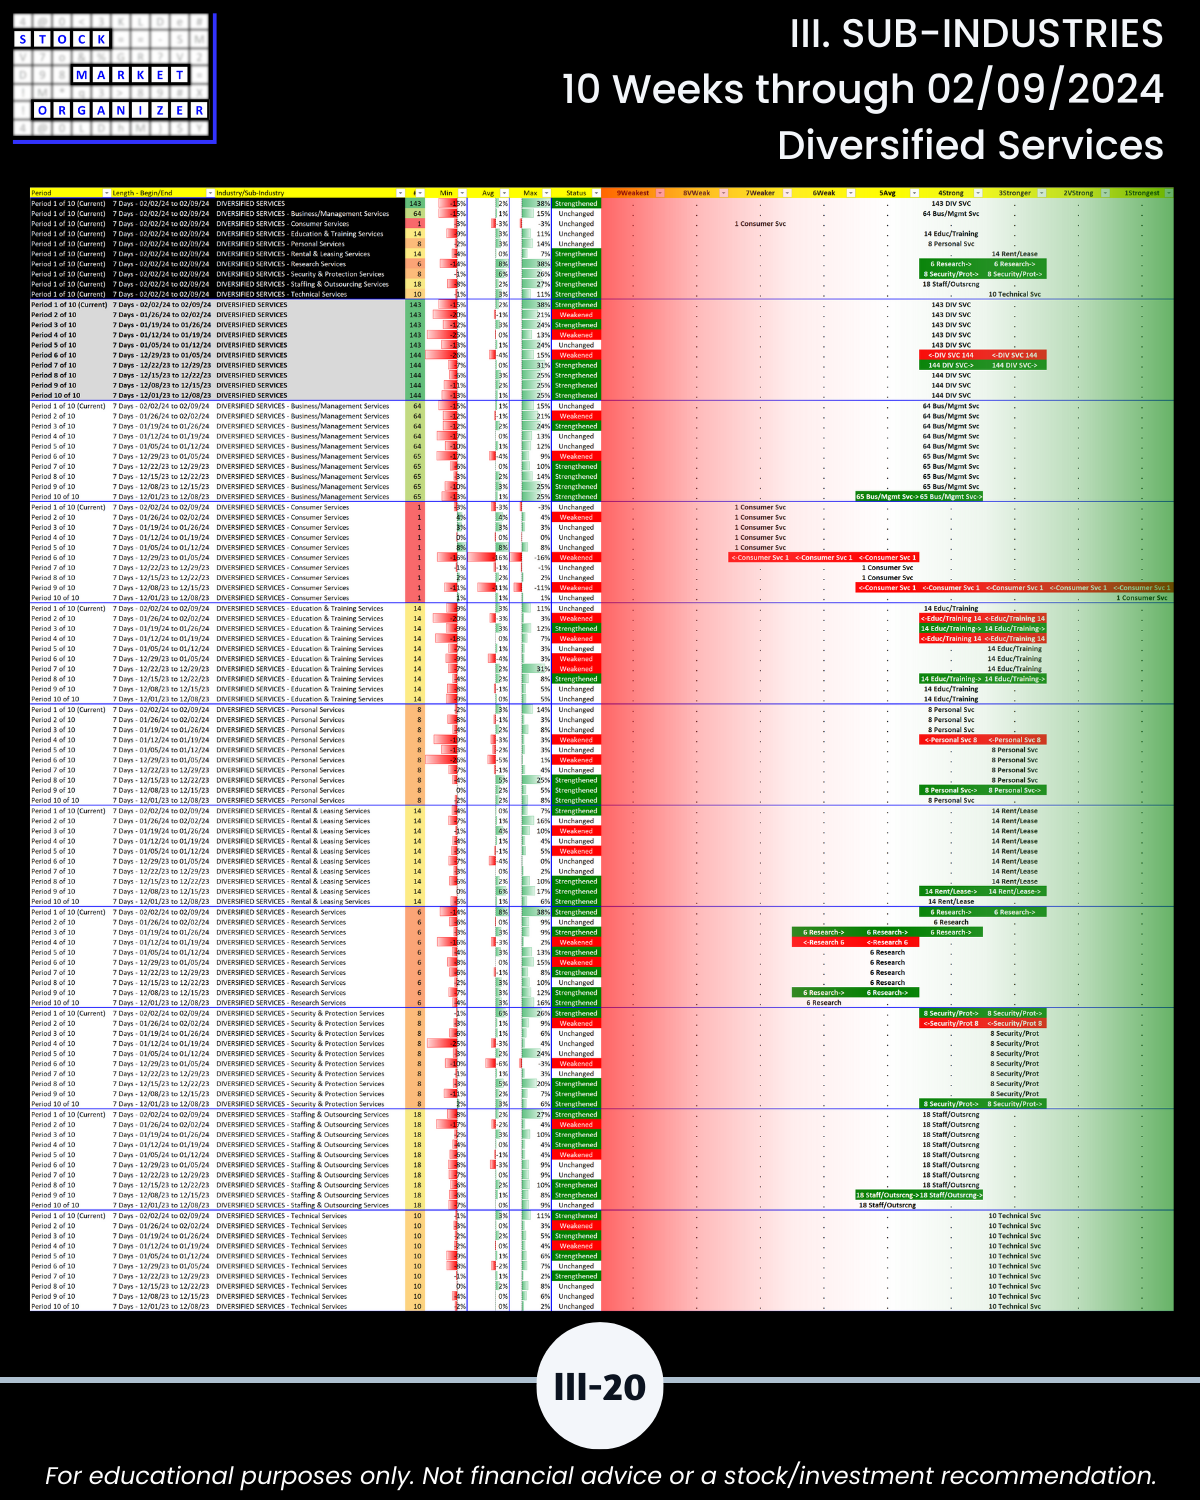
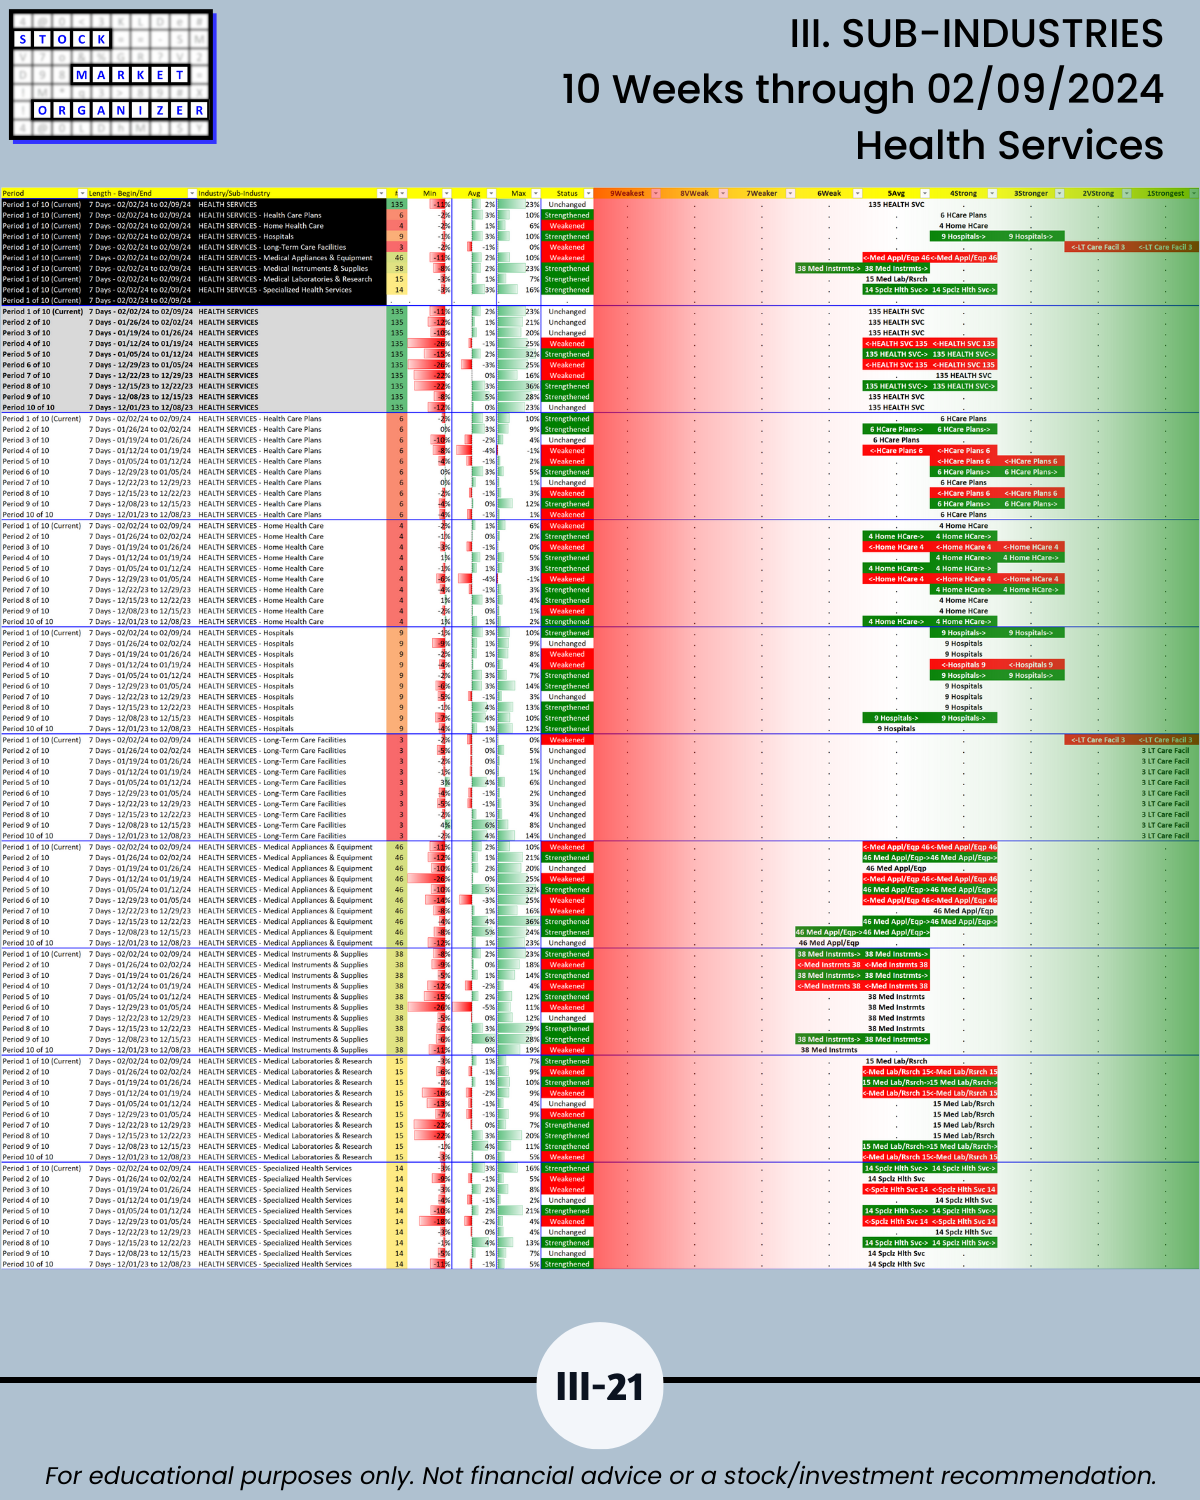
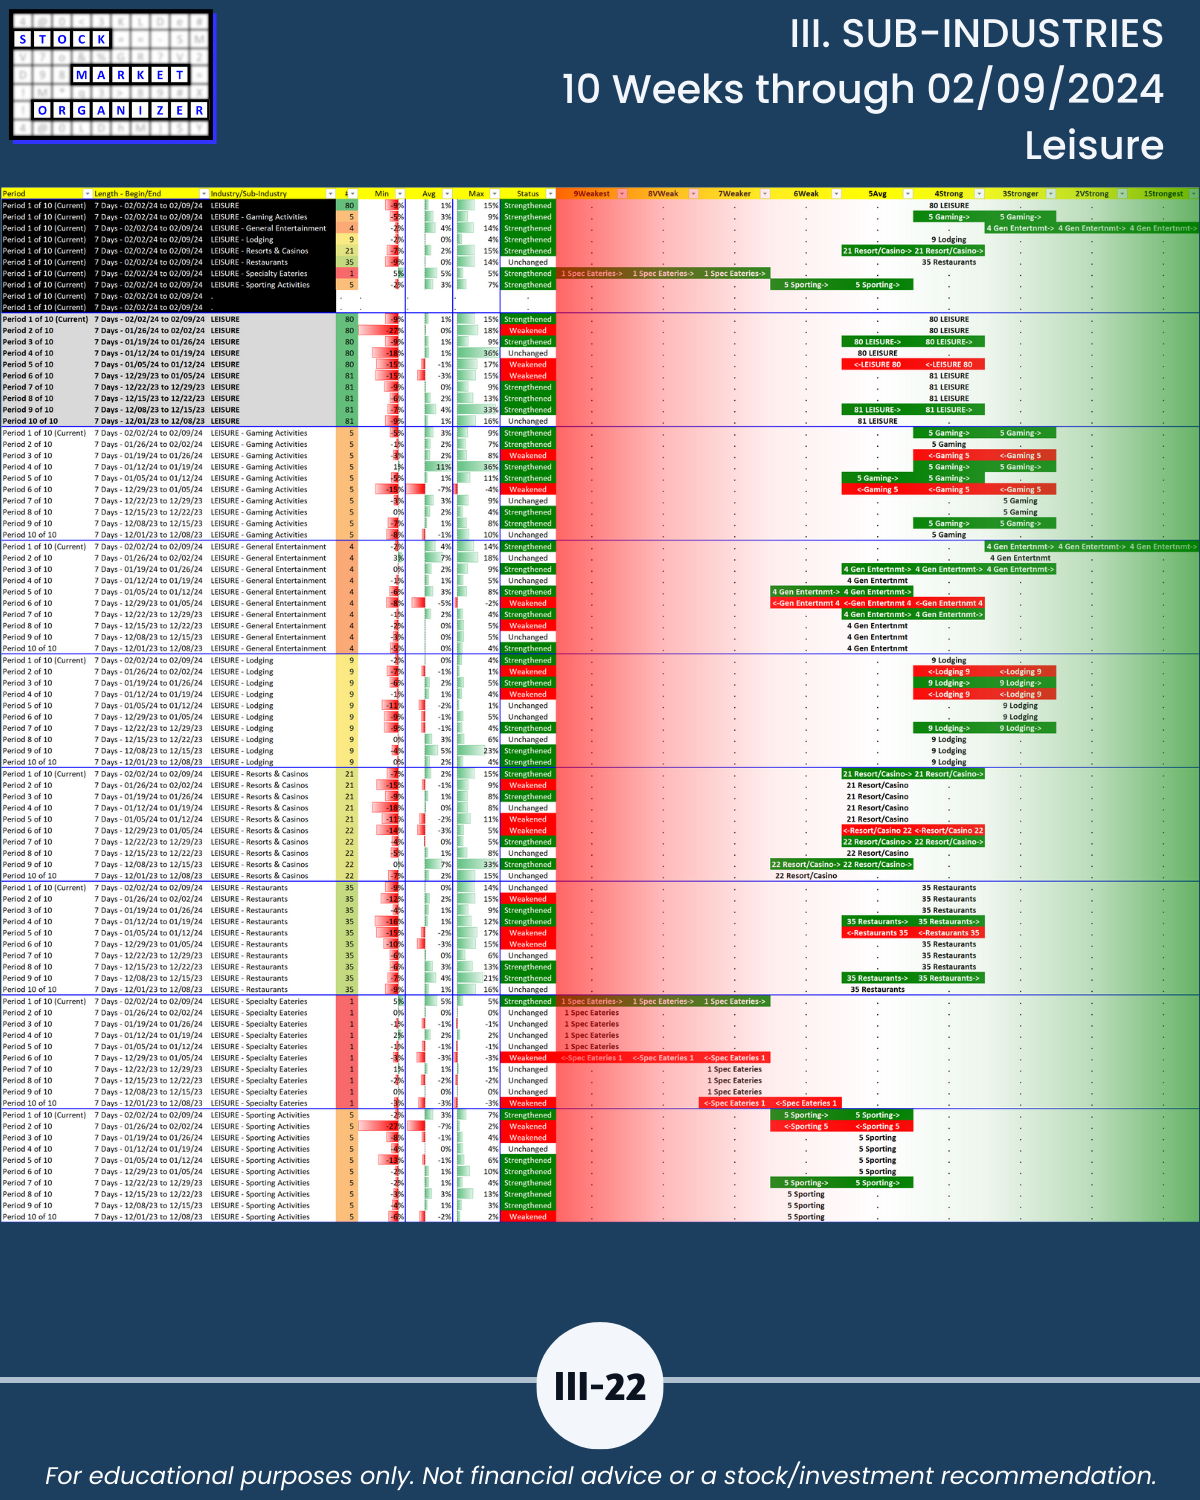
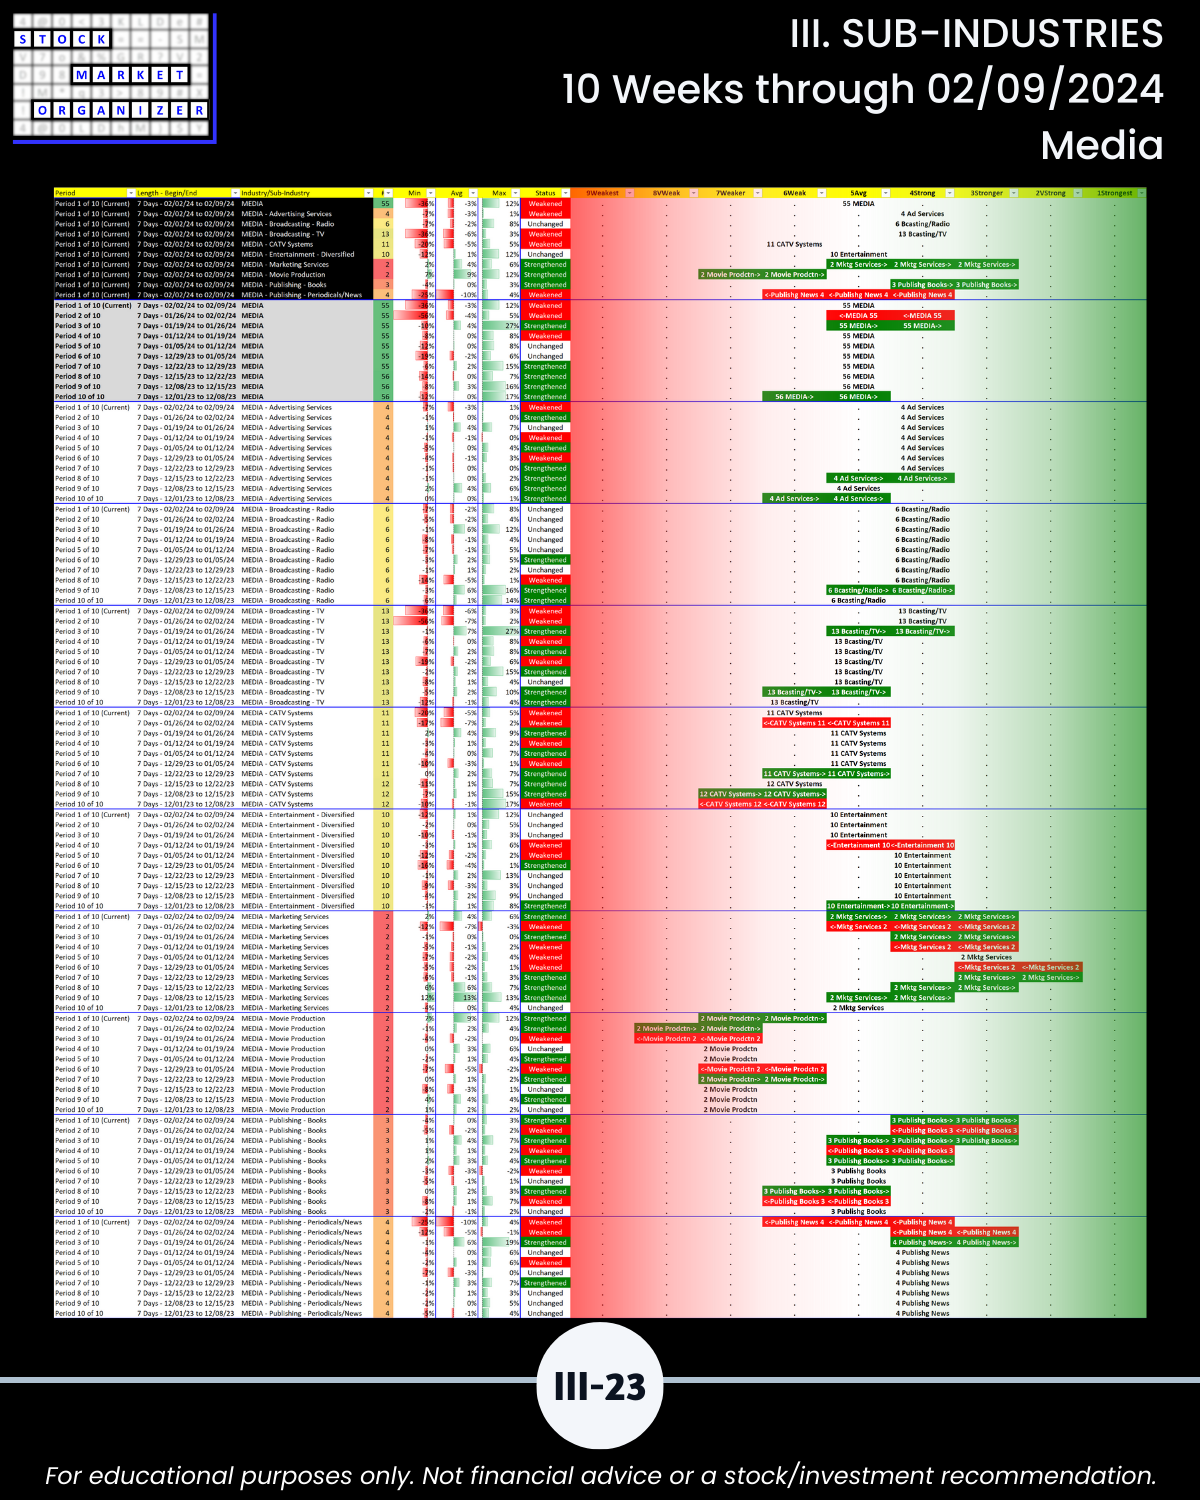
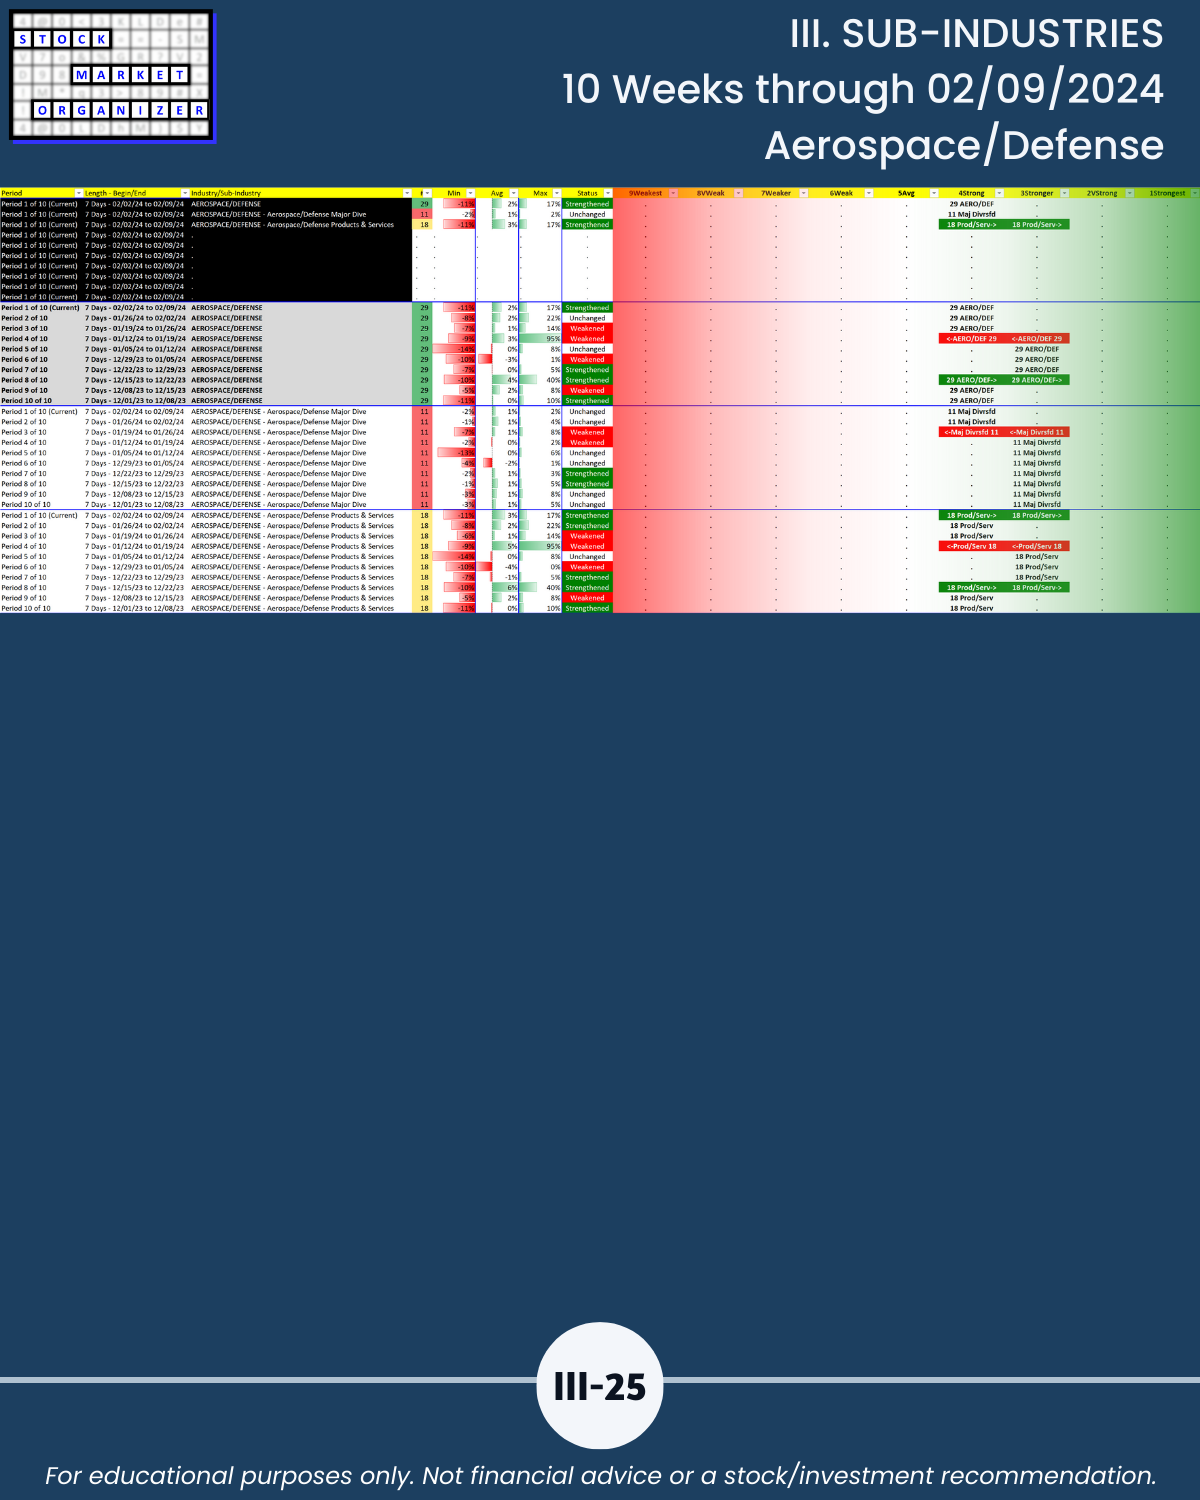
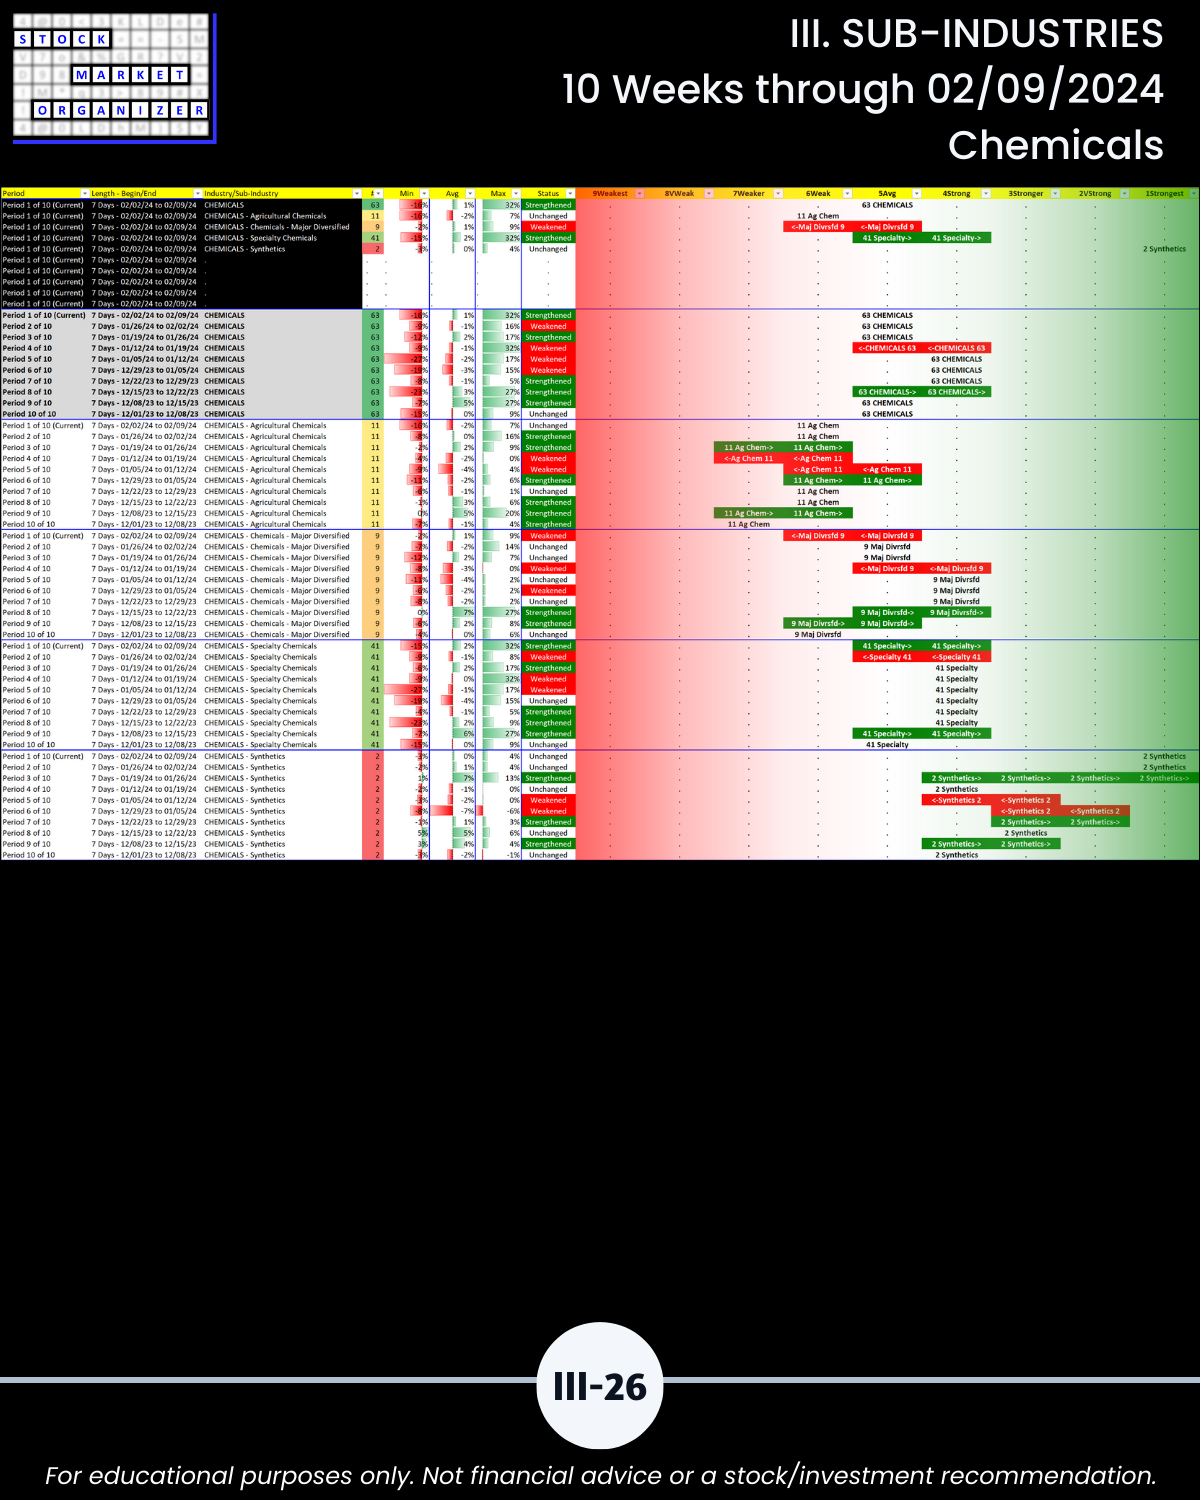
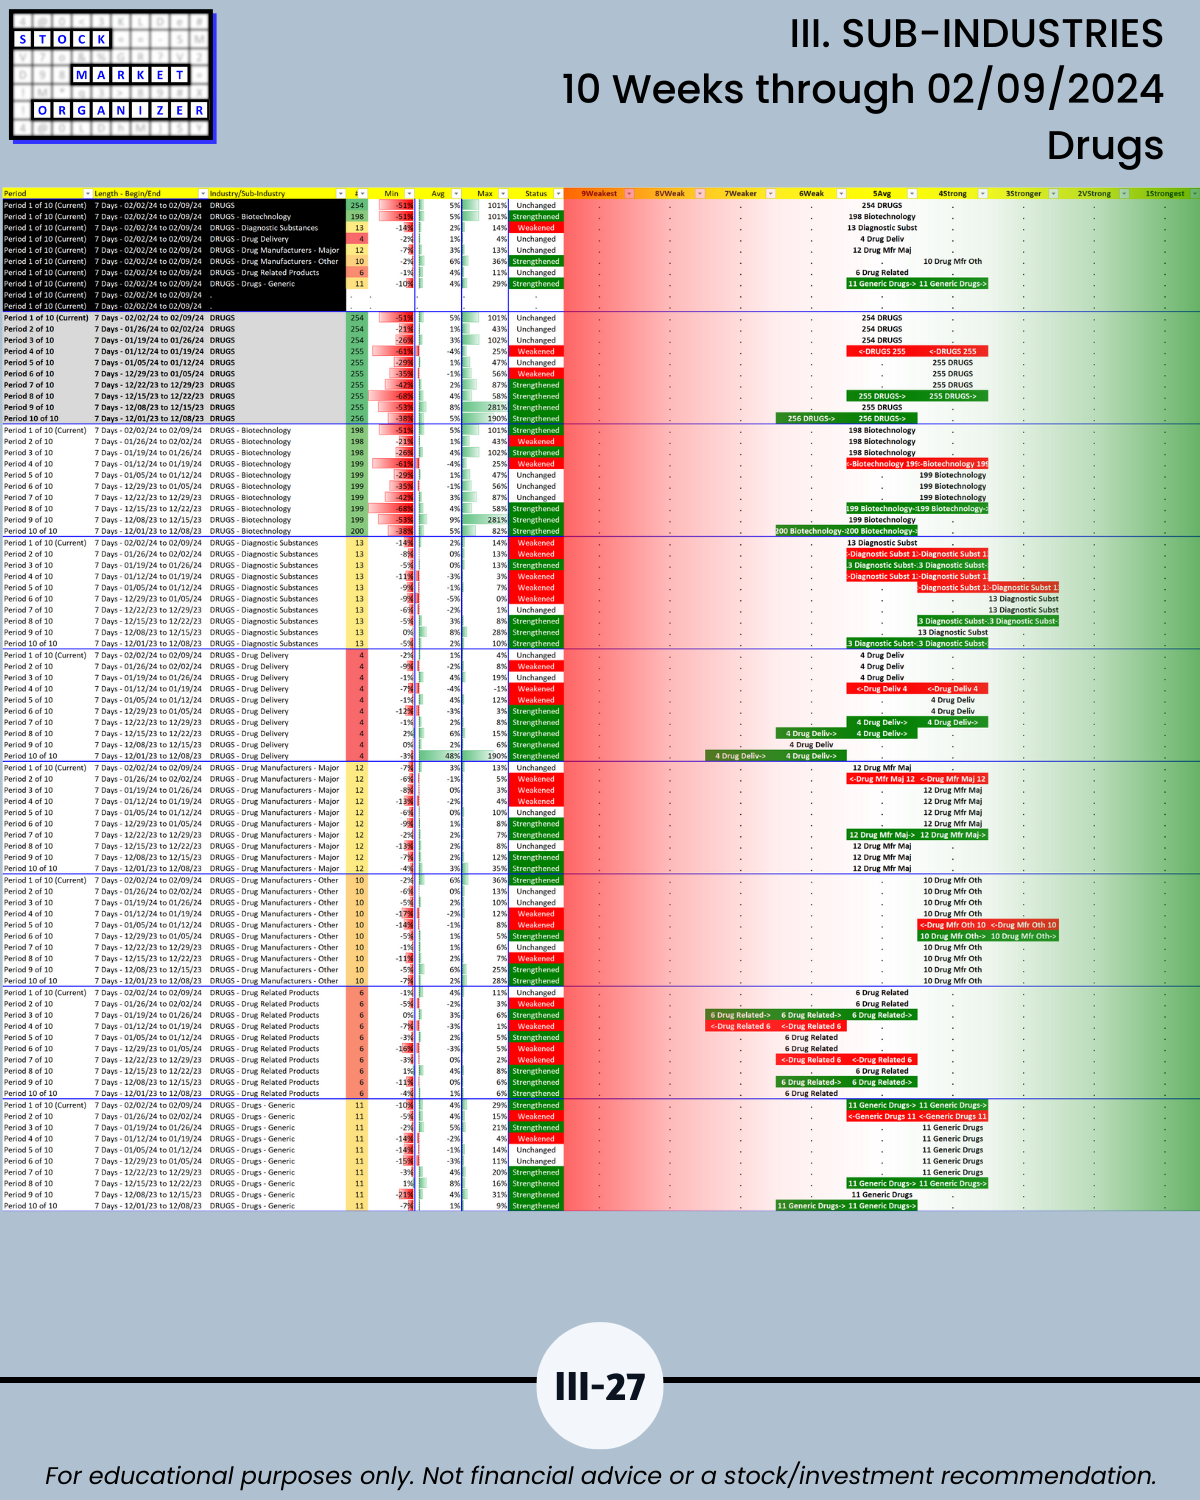
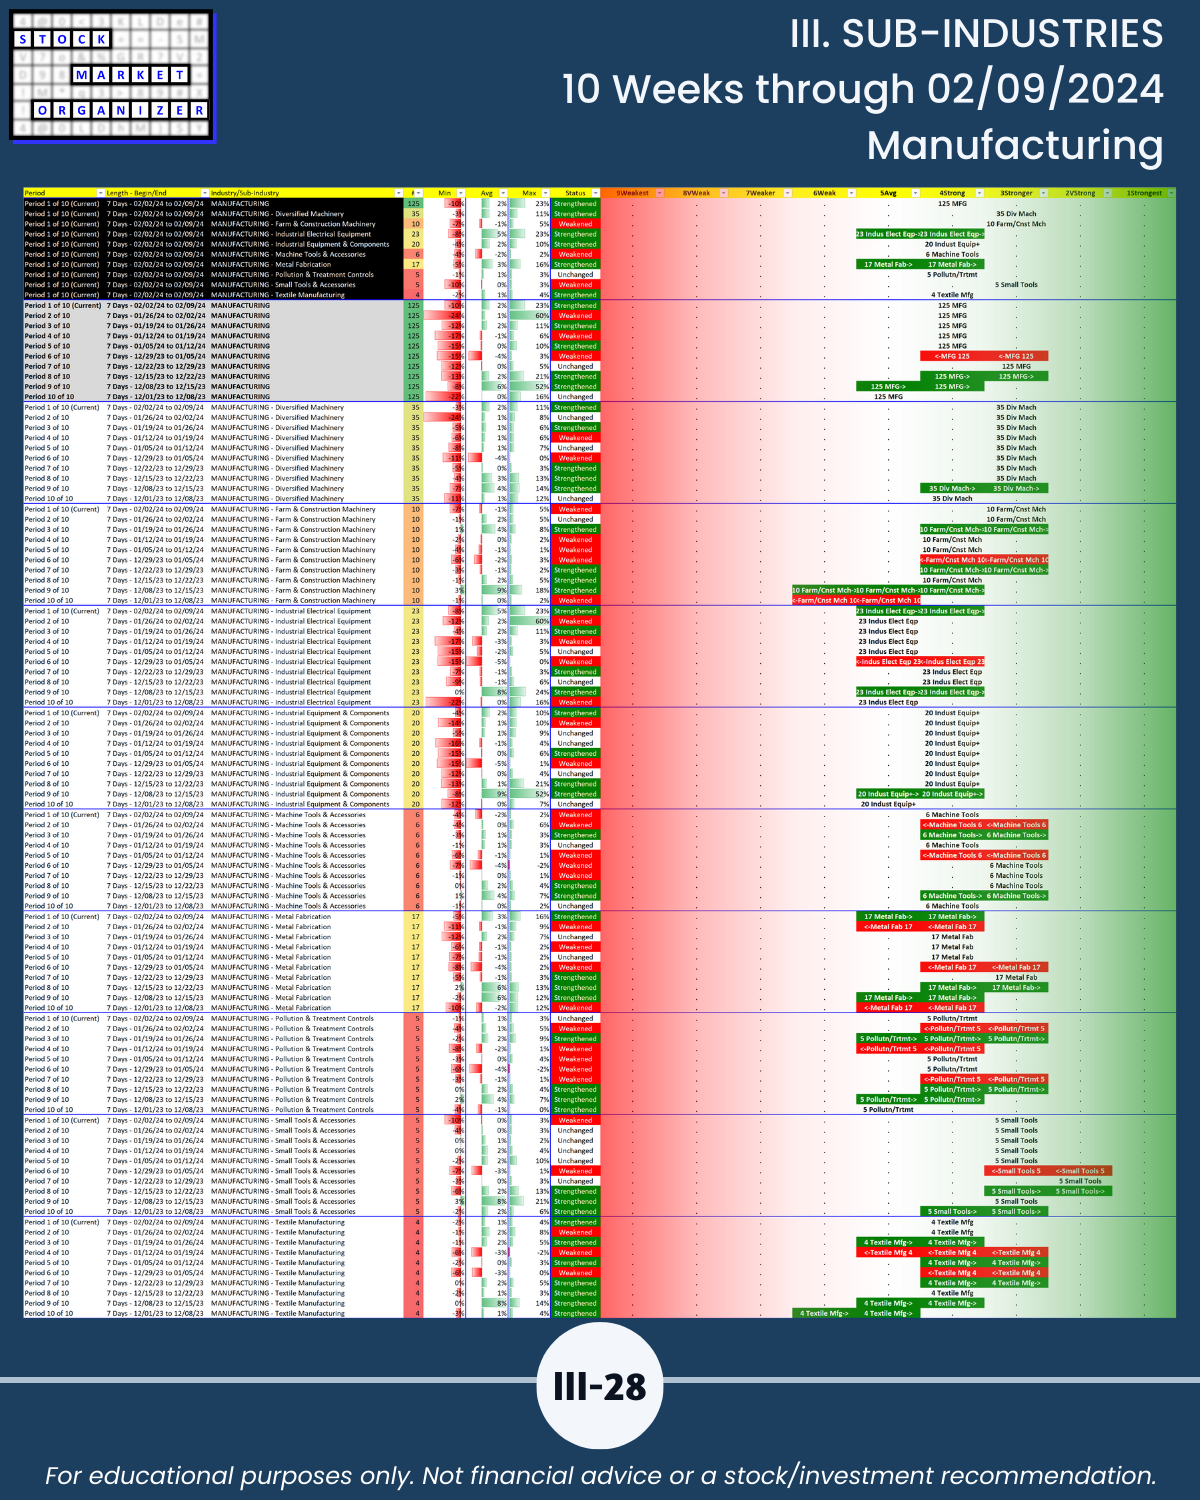
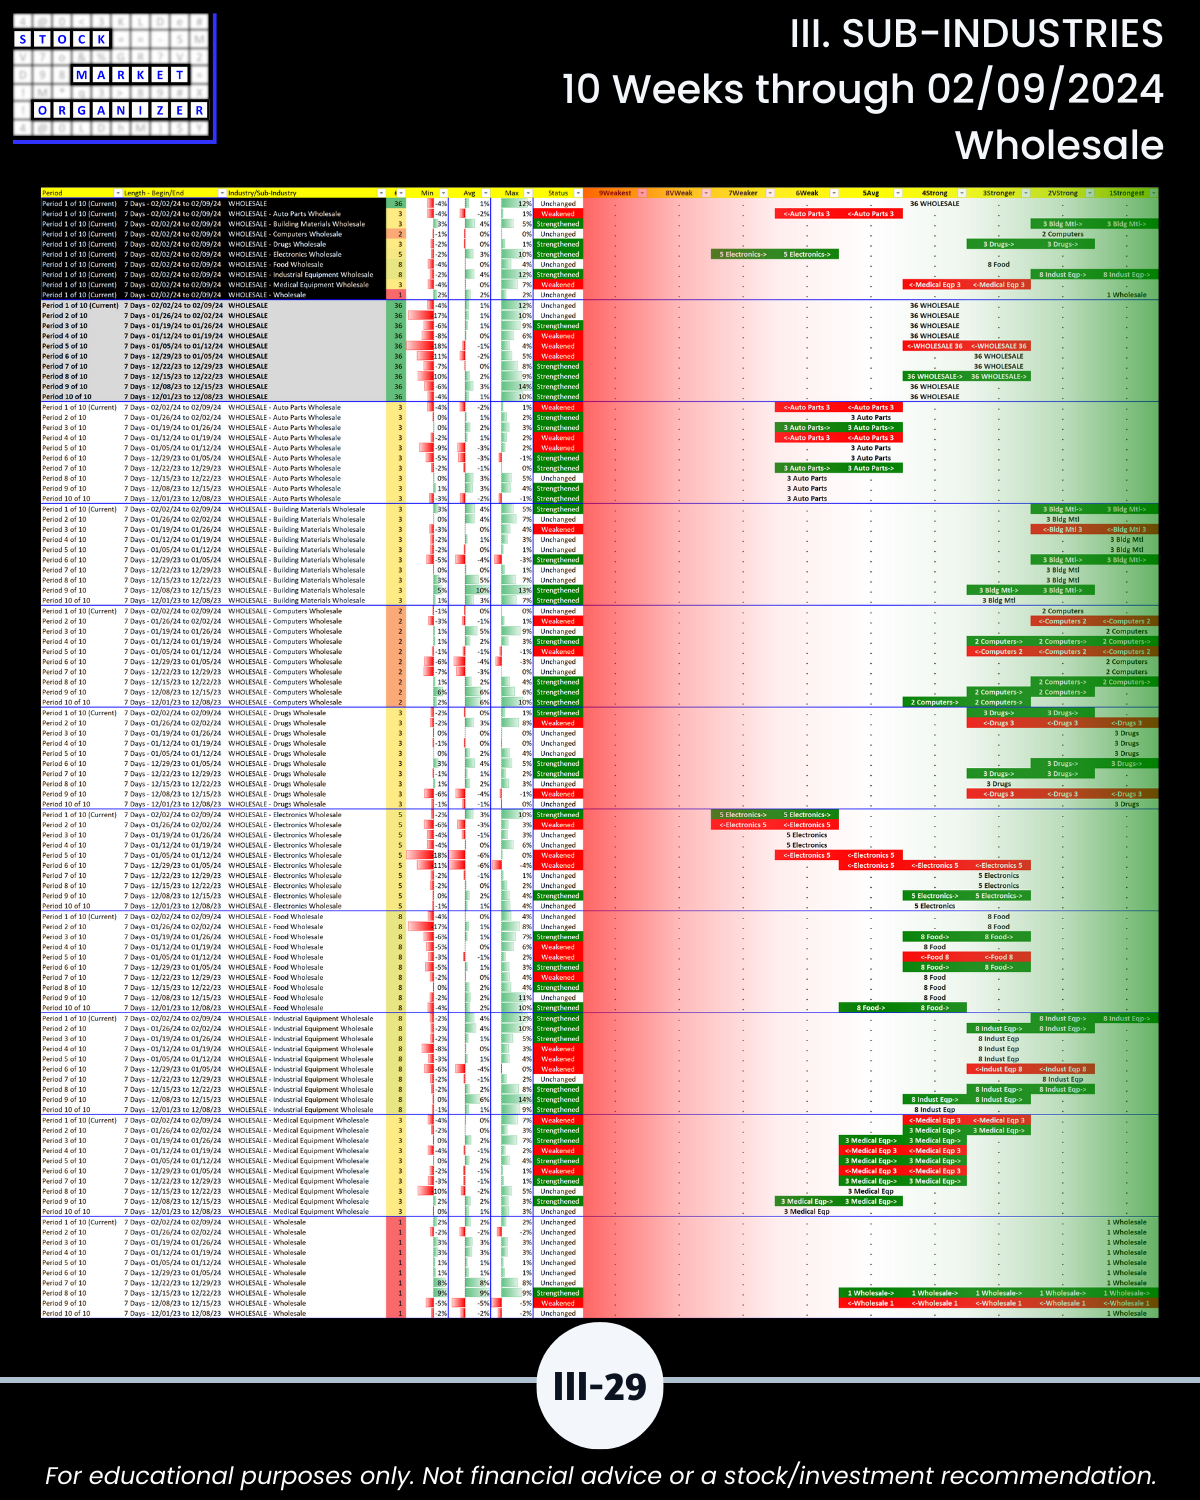
III. SUB-INDUSTRIES/10-Week Individual Sub-Industry Strength Reports
IV. STOCKS/Stock Sorts

