SMO Exclusive: Strength Score 2023-09-28 (comparison with GFC bottom 2009-03-09)

Introduction
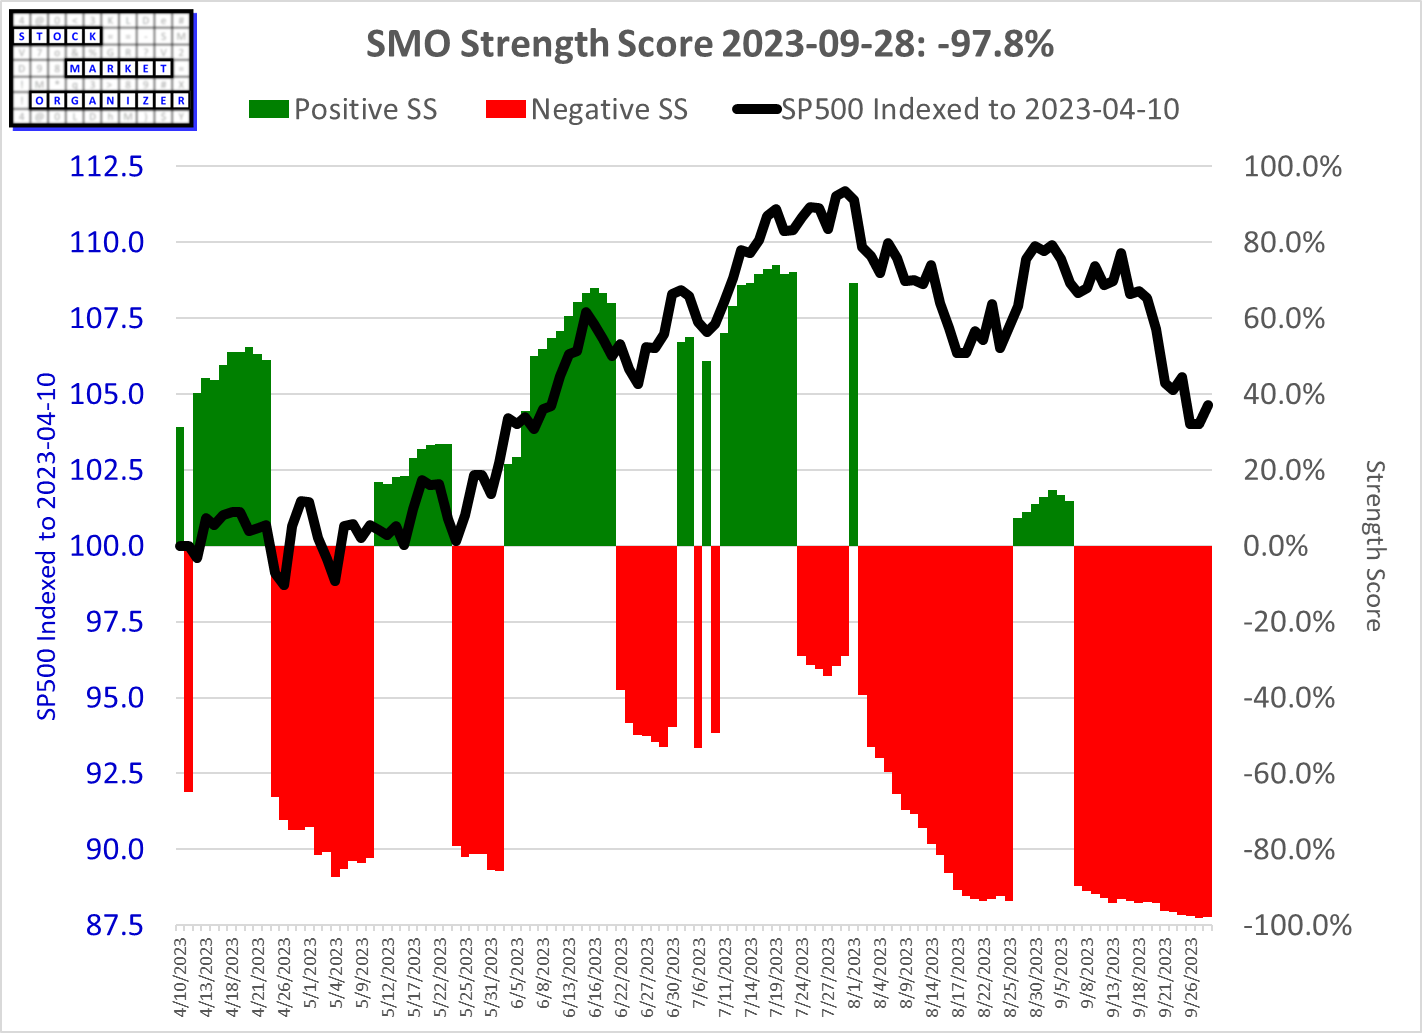
This post updates yesterday's SMO Strength Score discussion with today's strength score and a comparison to the Great Financial Crisis bottom in 2009.
Current Strength Score Reading: -97.8% (+0.3%)
What this reading means
-97.8% means today's market strength ranks below nearly 99% of all previous readings dating back 24 years. The possible scale is from a low of -100% to a high of +100%. The readings include those from the massive 2000-2002, GFC, and Covid shutdown-era declines.
Note: I'm not hung up on the 0.8% of the reading - false precision is simply a distraction. The point with this is to measure at a big picture level what is happening. A high -90s% reading and falling is clearly not a good sign, yet it enables me to objectively answer the question "how low is low?" Which is the intent of this tool.
Because... market conditions matter.
Context: March 2009 GFC decline
Objectively answering the question "How low is low?"
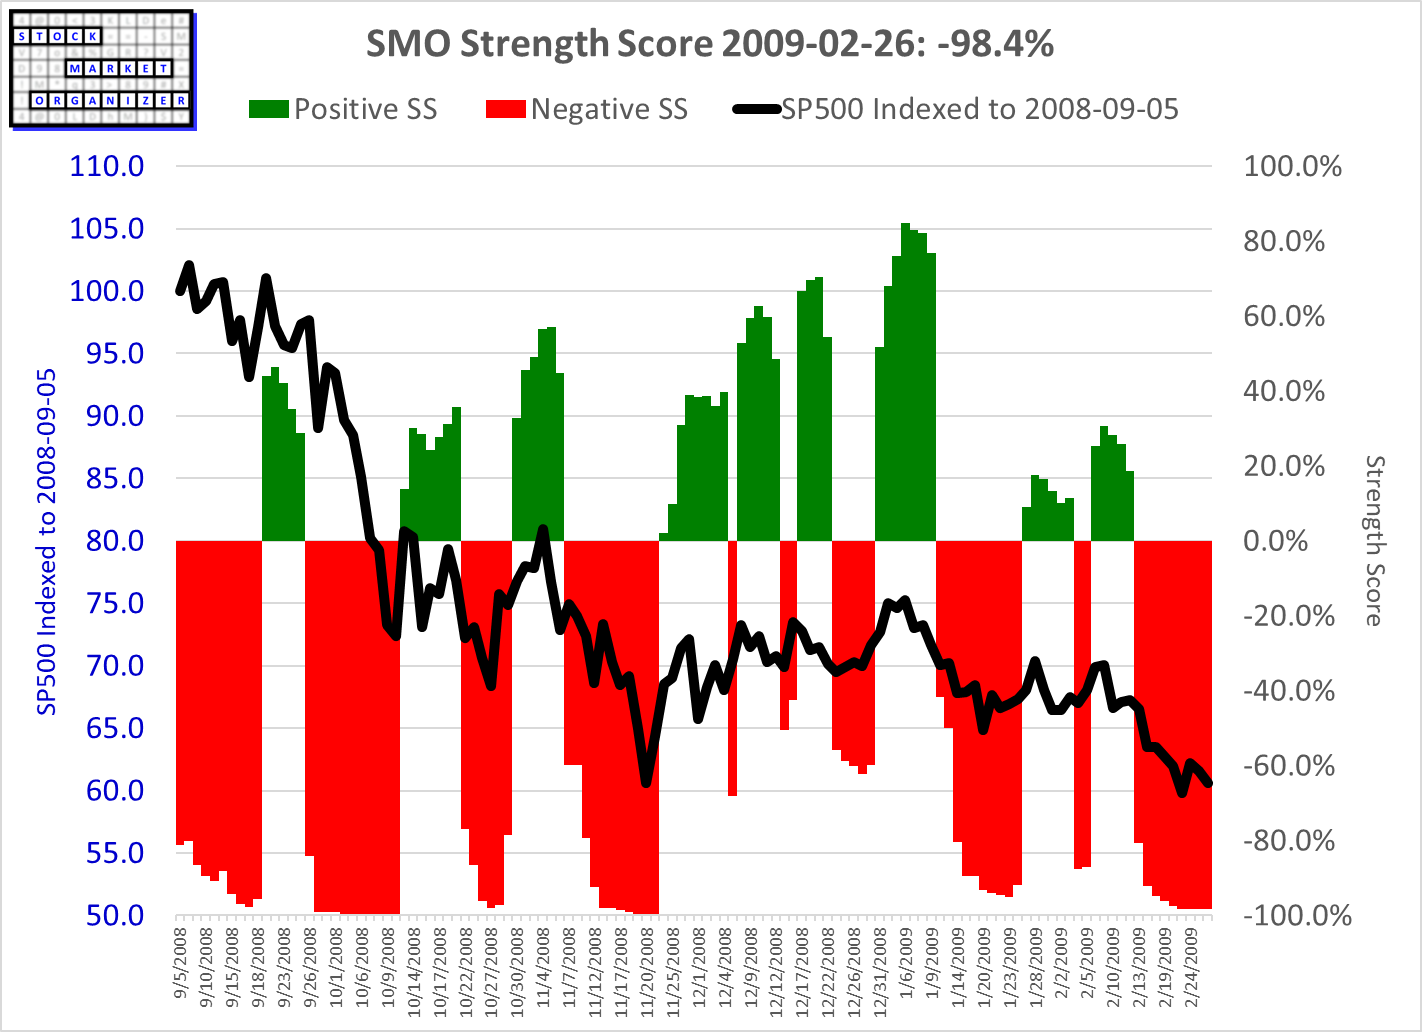
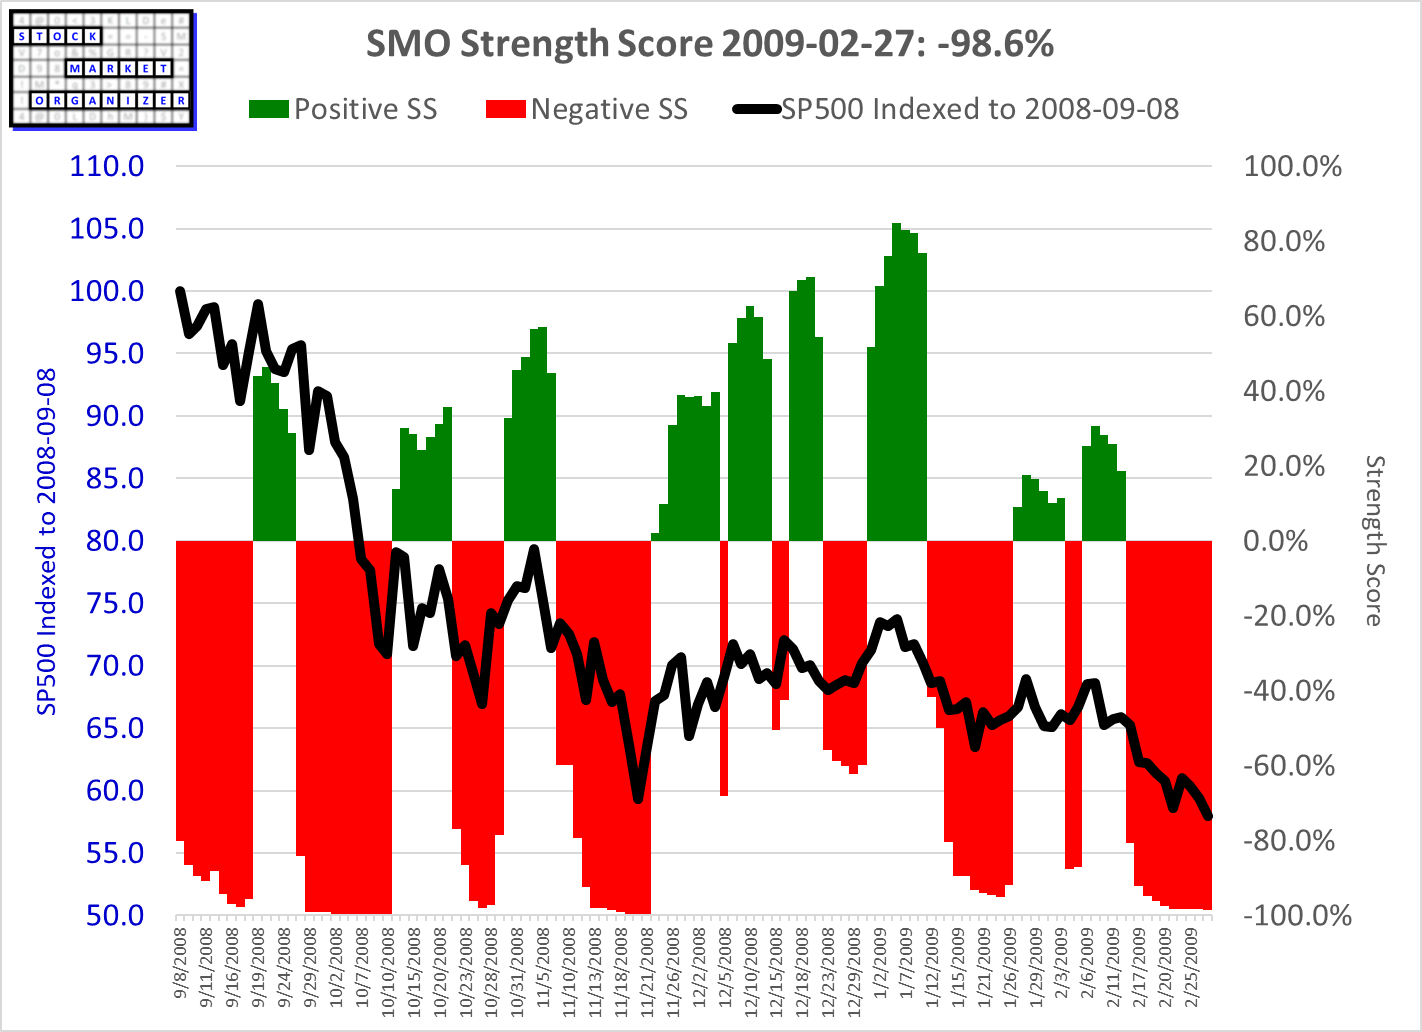
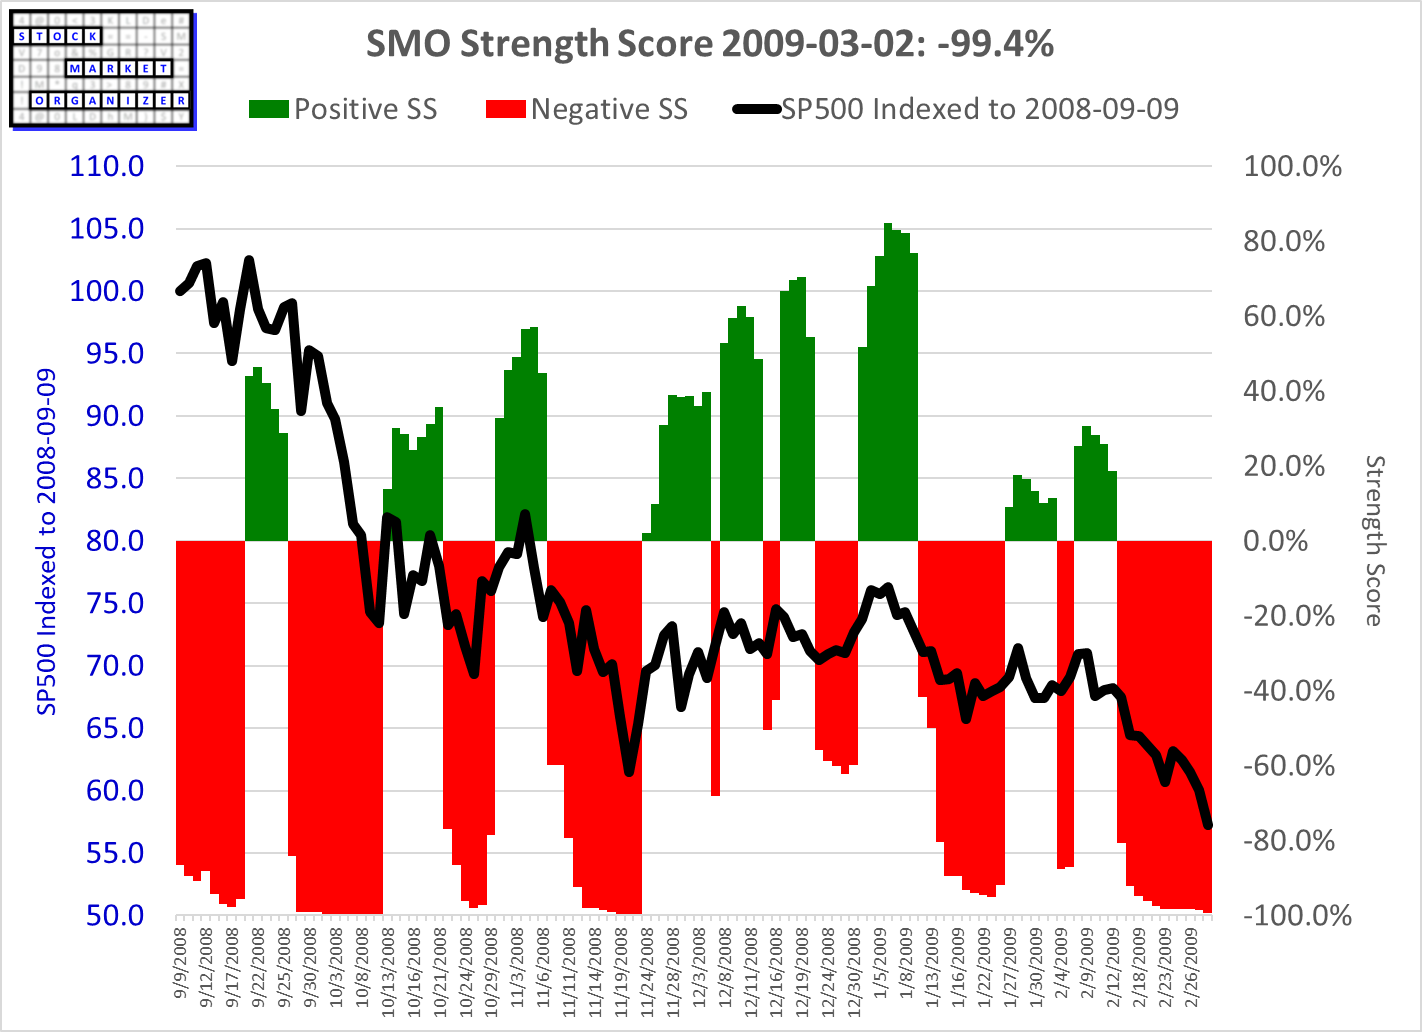
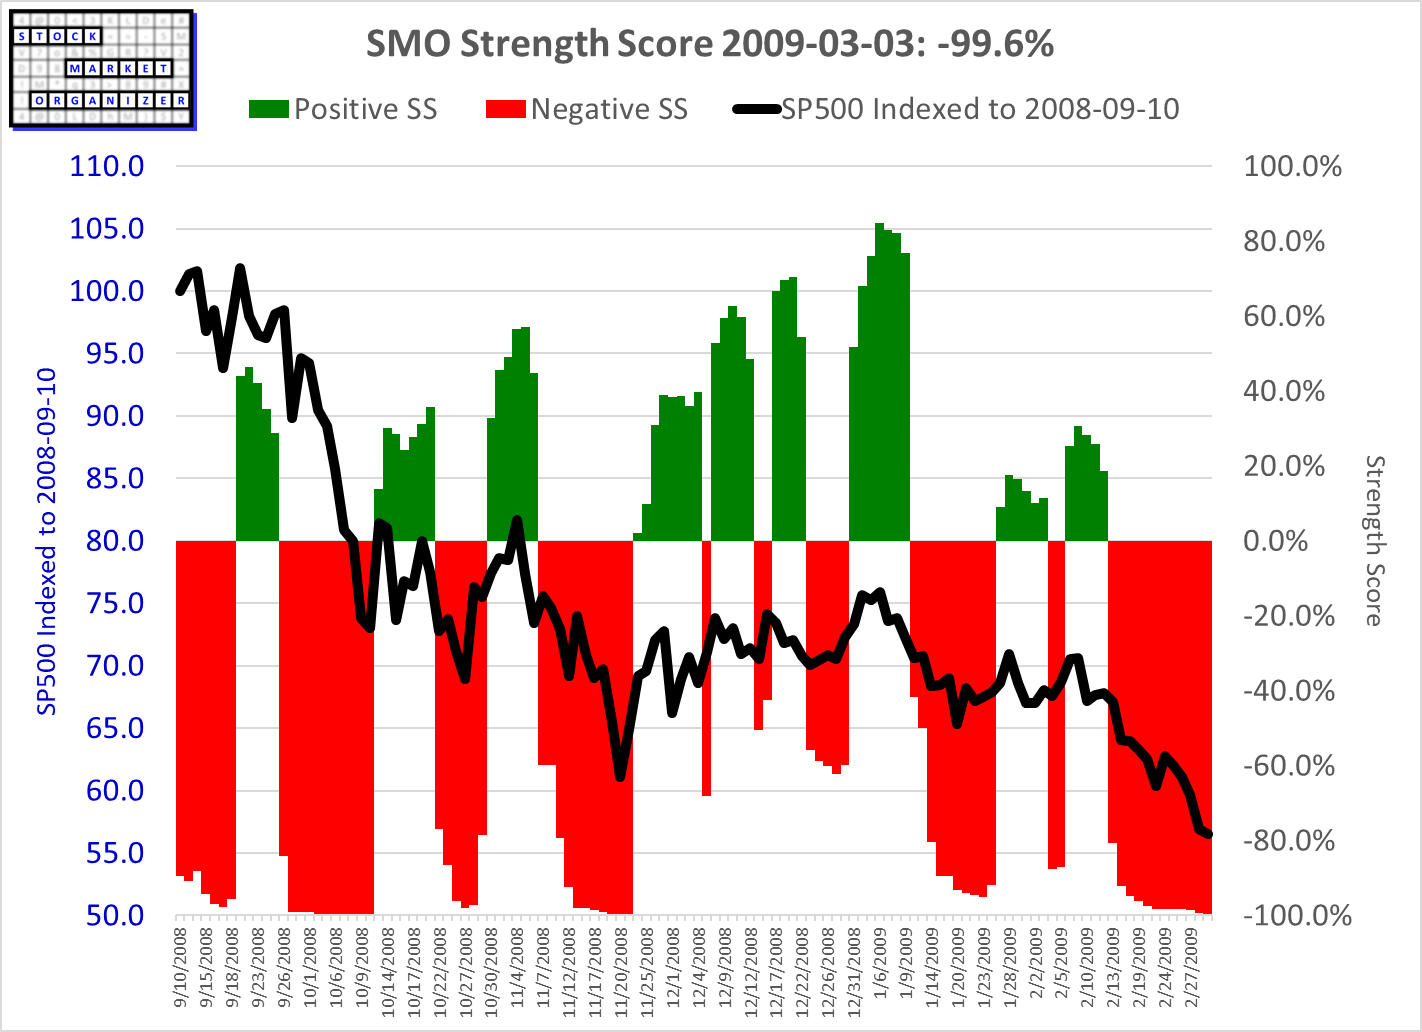
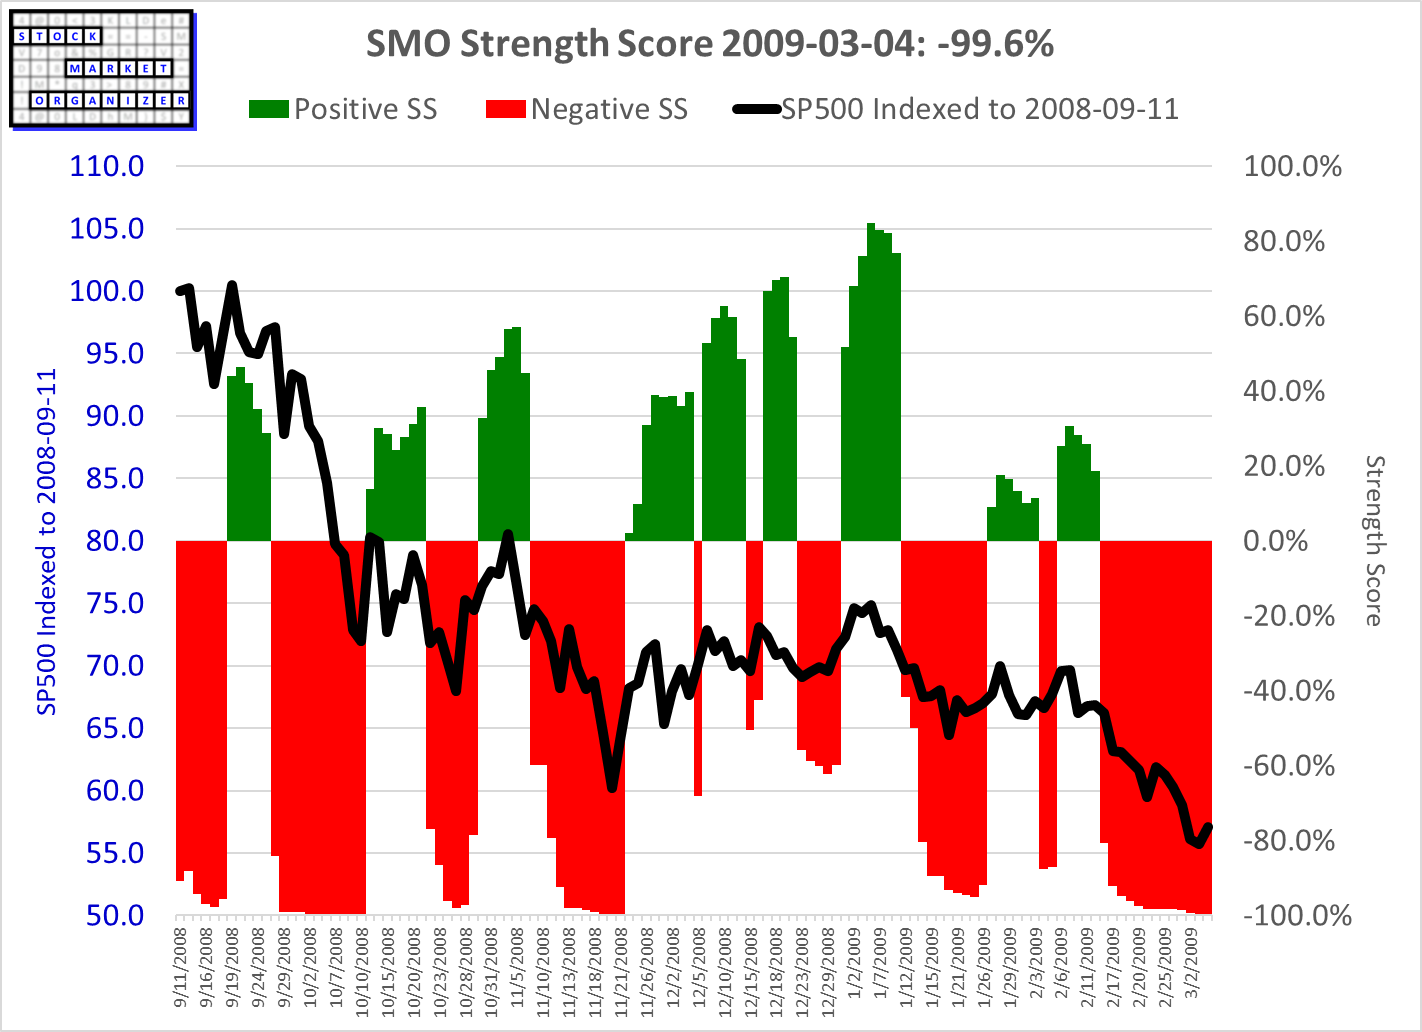
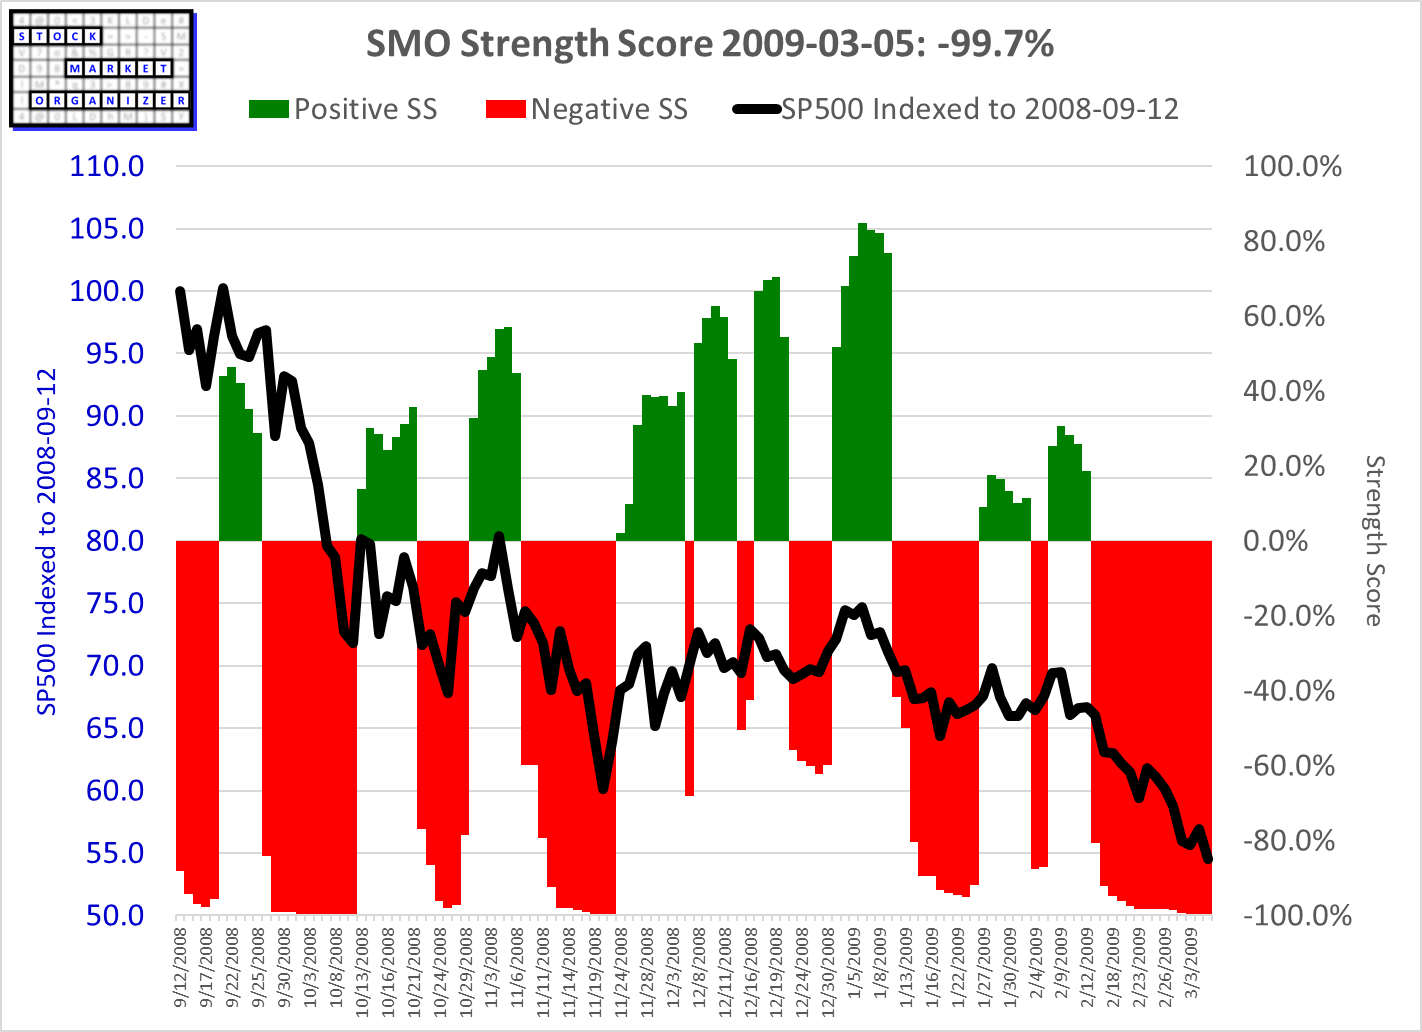
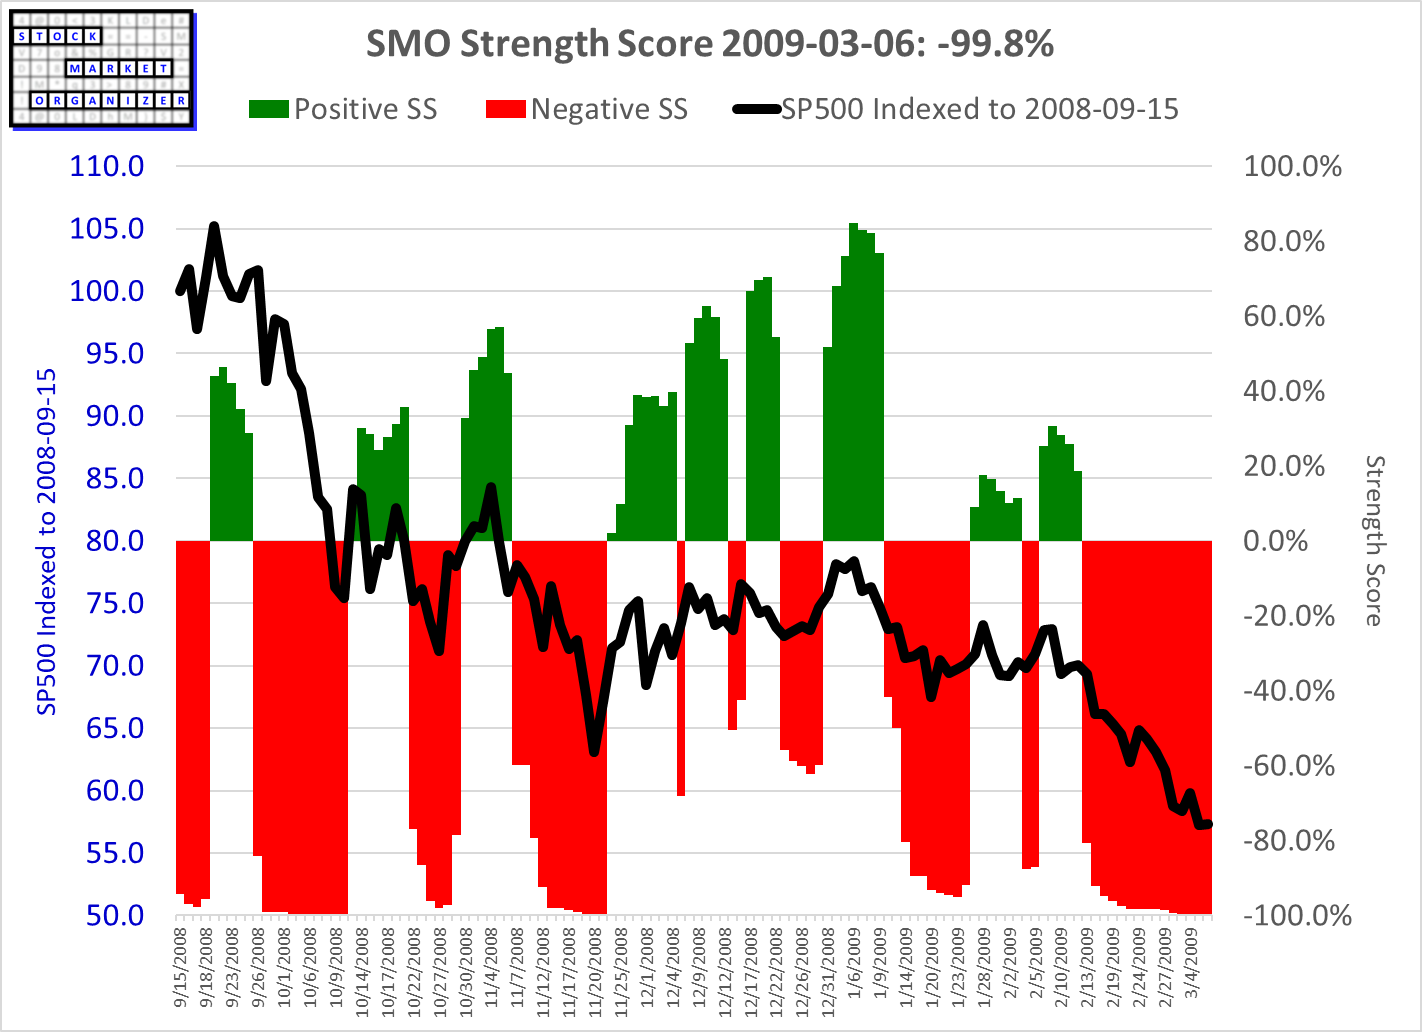
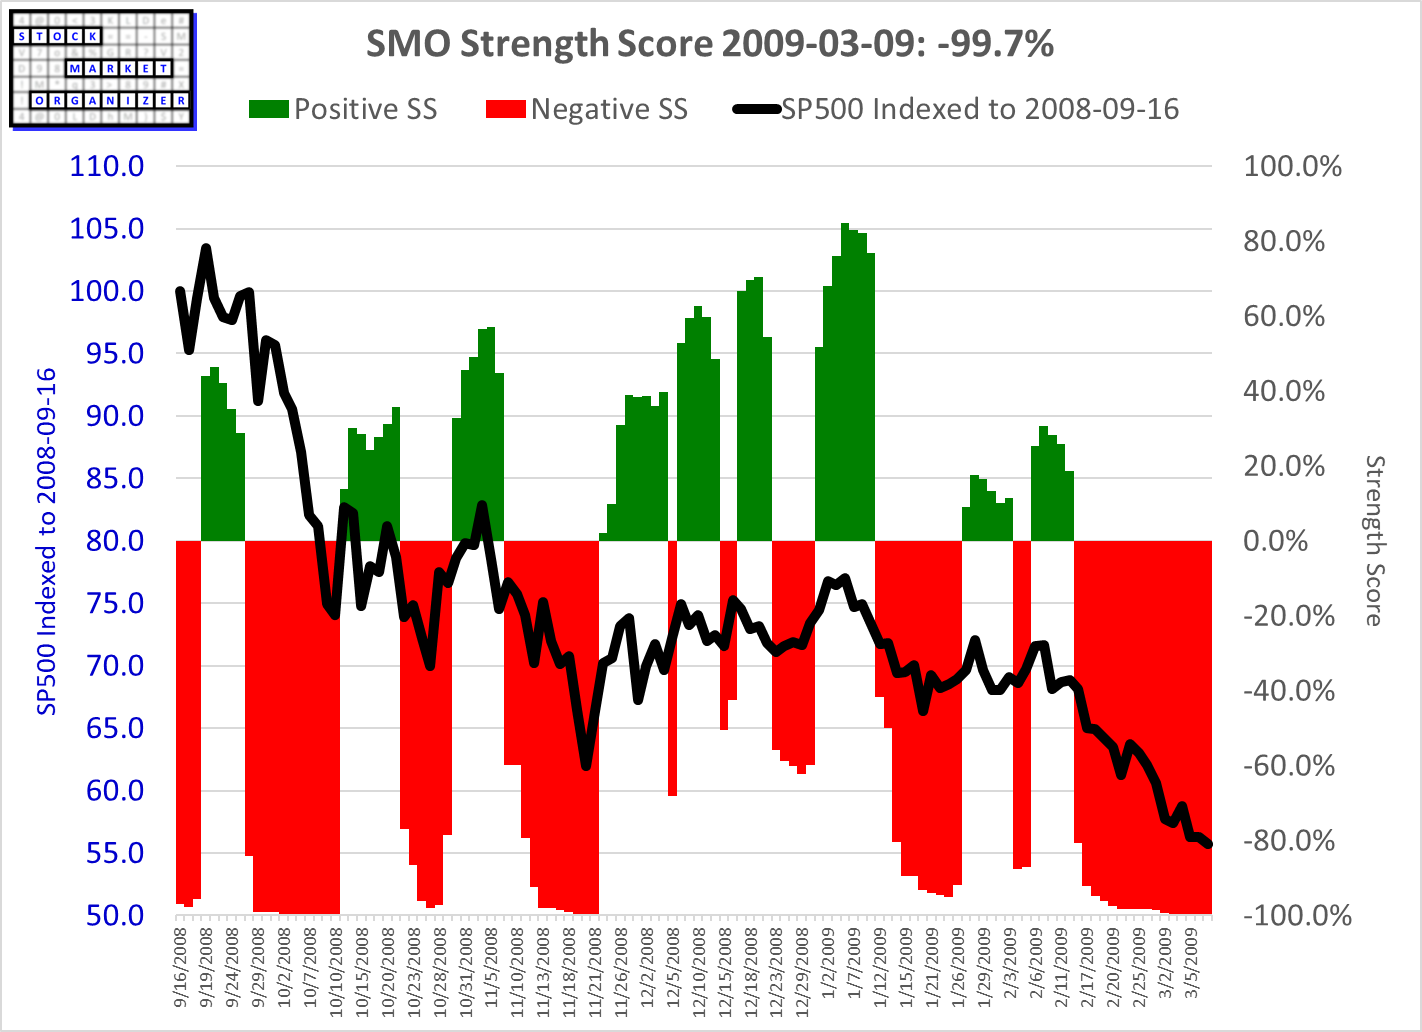
Below are selected readings from March 2009 to put into context today's reading.
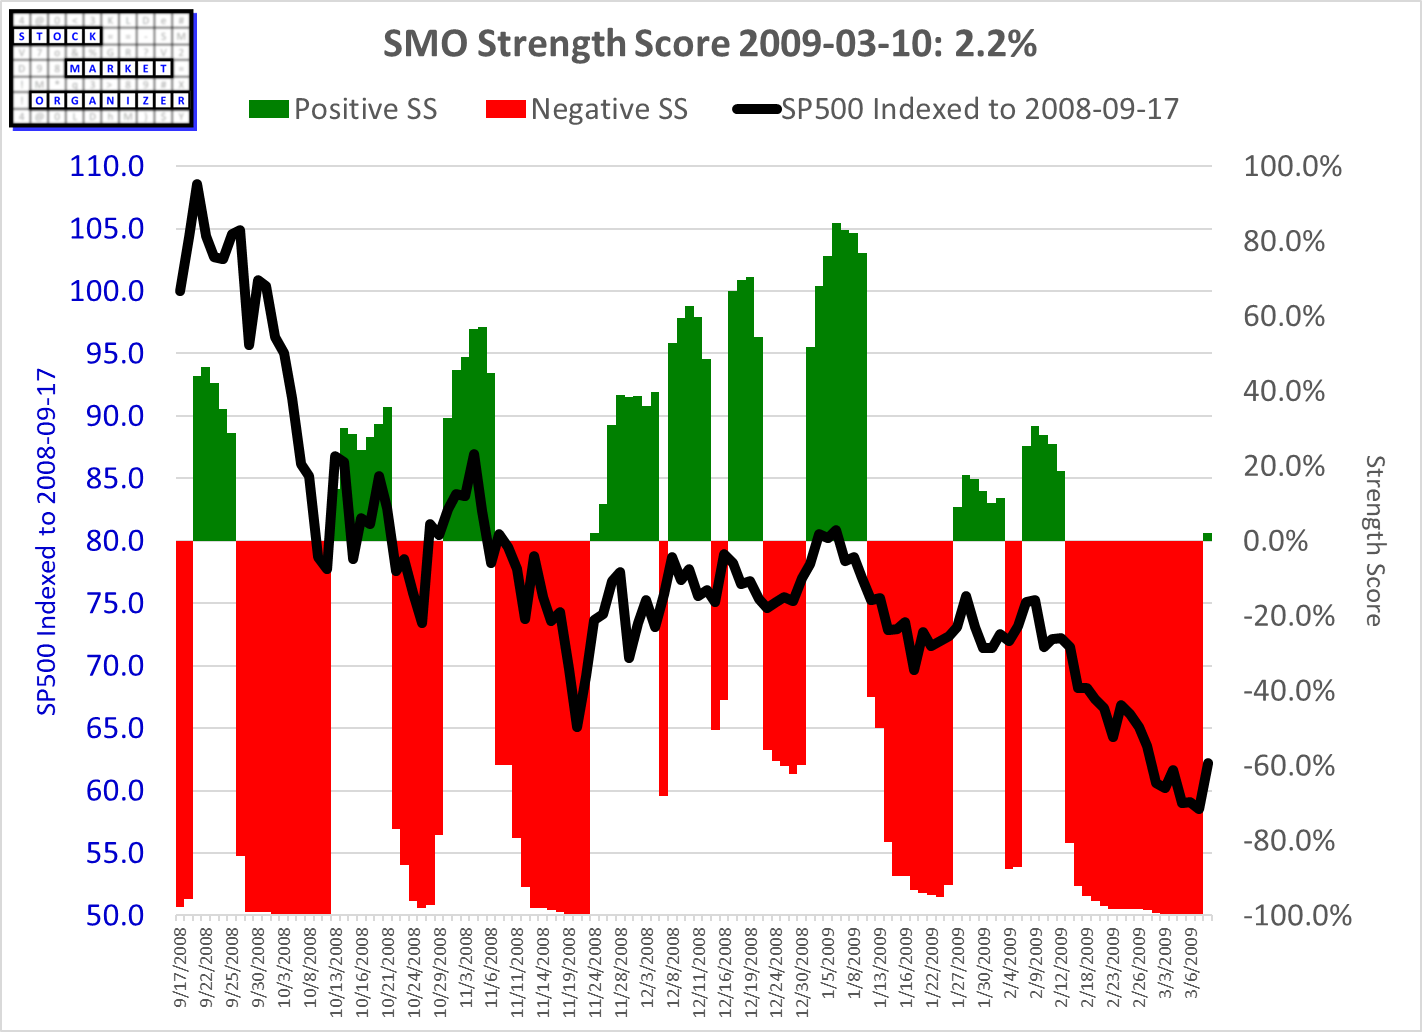
Punch line: today's reading is only slightly lower than these (which reached -99.8%). The 2009 readings ranged from -98.4% to -99.8% through the 2009-03-09 bottom before going positive 2009-03-10.
9 daily readings from 2009-02-26 to 2009-03-10
Highlight: note the extremely low readings from October and November 2008. These readings also provide context to illustrate possible Strength Score readings during an extended decline. They can become stretched to the downside (approaching/reaching -100%) with pressure released during subsequent rallies, only to resume downtrends and again reach extreme levels.
Highlight: note the difference in the S&P500 in 2009 (significant downtrend) vs. today (market off the highs, yet still above levels from 5 months ago). It is entirely possible that the index levels are materially distorted by the large market caps of the biggest of the S&P500 companies. The 5-member Trillion Dollar Market Cap club of Apple, Microsoft, Google, Amazon, and Nvidia alone accounts for $9 trillion of value, 25% of the S&P500 market cap. (In fact, slickcharts indicates the top 36 biggest market cap companies account for 50% of the index's returns, same as the bottom 464.)
Regardless, the character of the market today is not the same as it was in March 2009, yet the Strength Scores are similar. I won't claim to know what this means, and it does not change my process which doesn't involve bias, emotions, feelings, interpretations, or opinions anyway.