SMO Exclusive: Strength Report Technology Sector 2024-12-05 Unchanged at 3.8 Strength Score
Summary
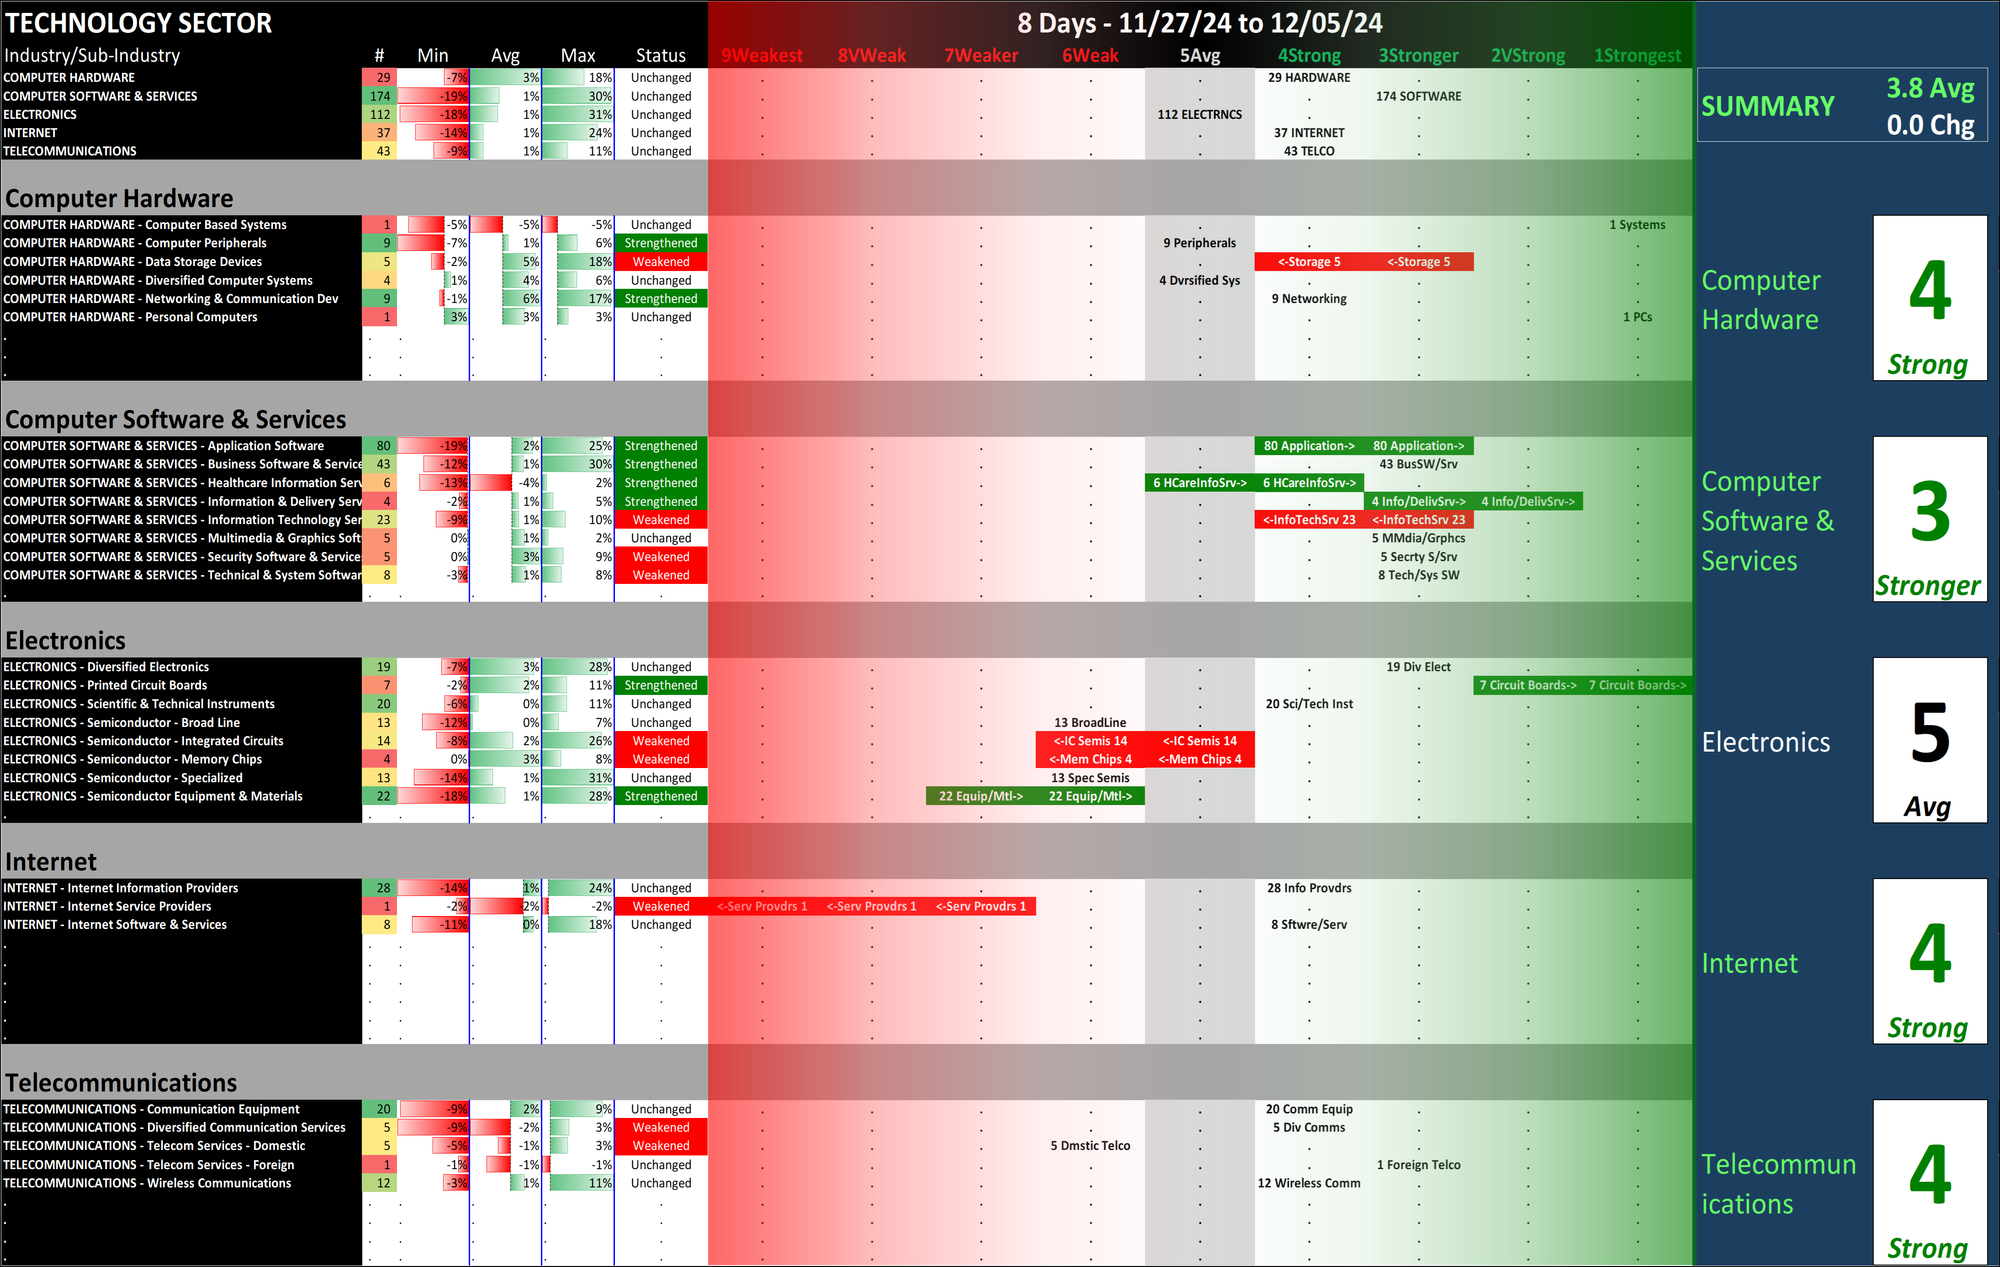
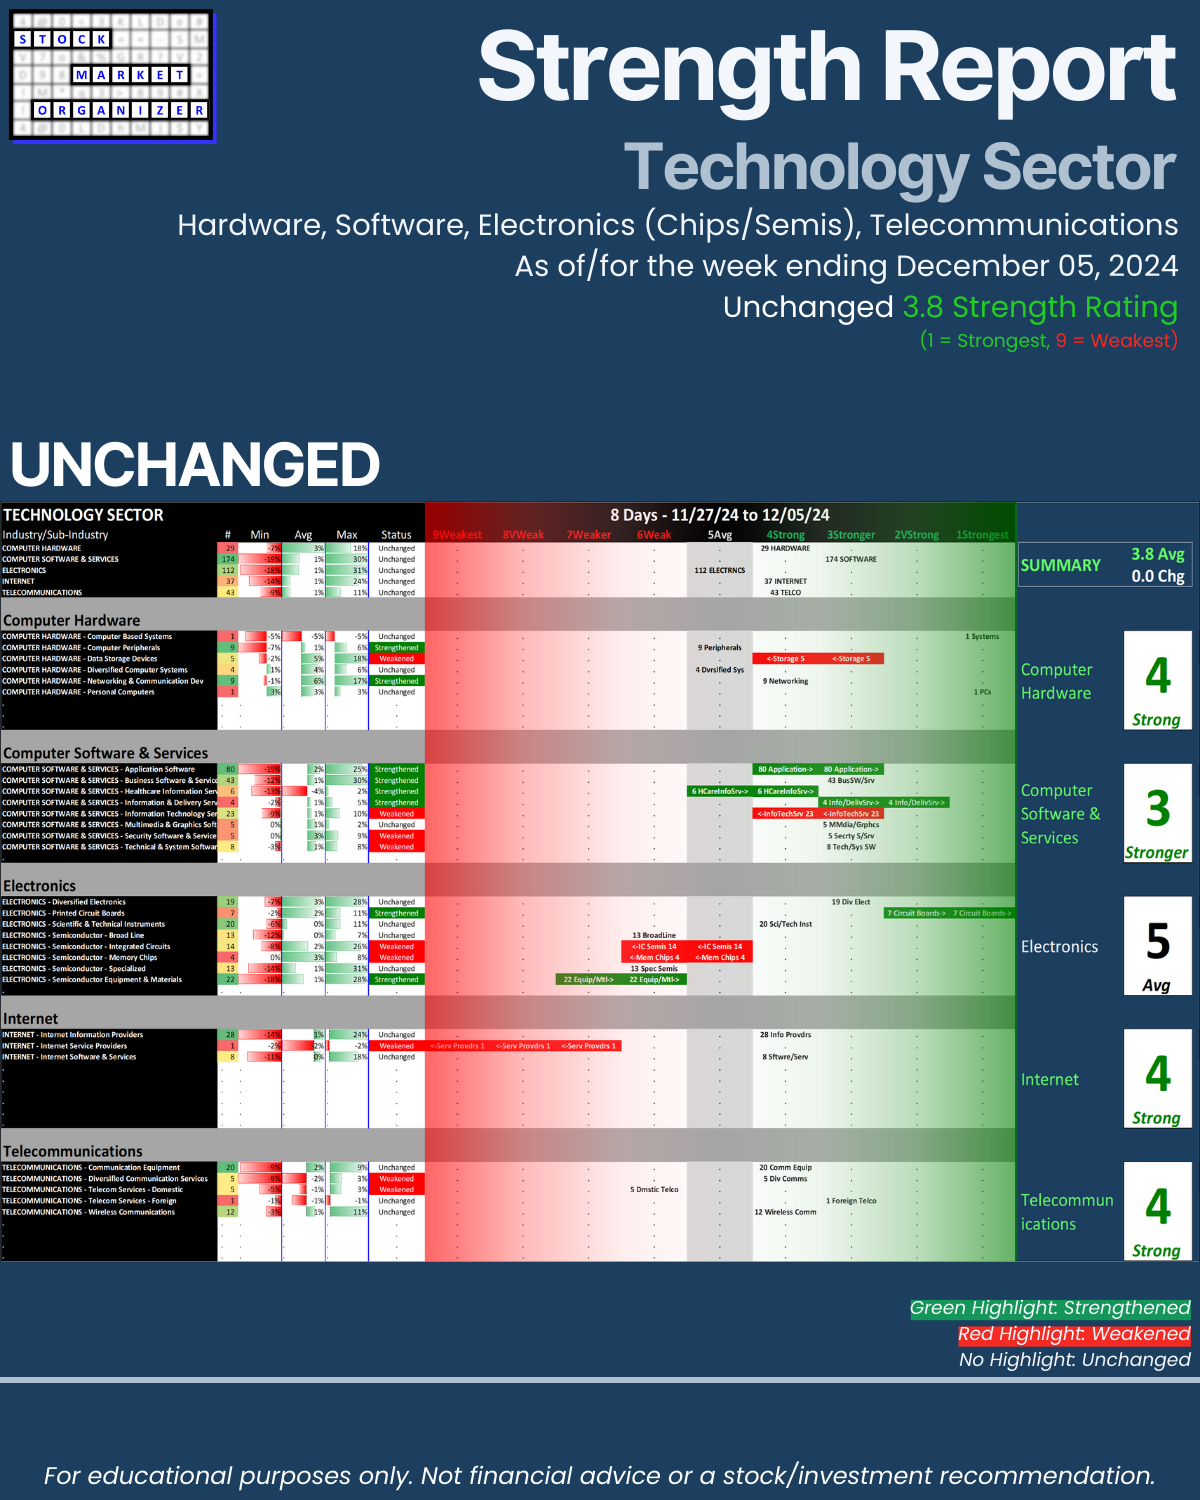
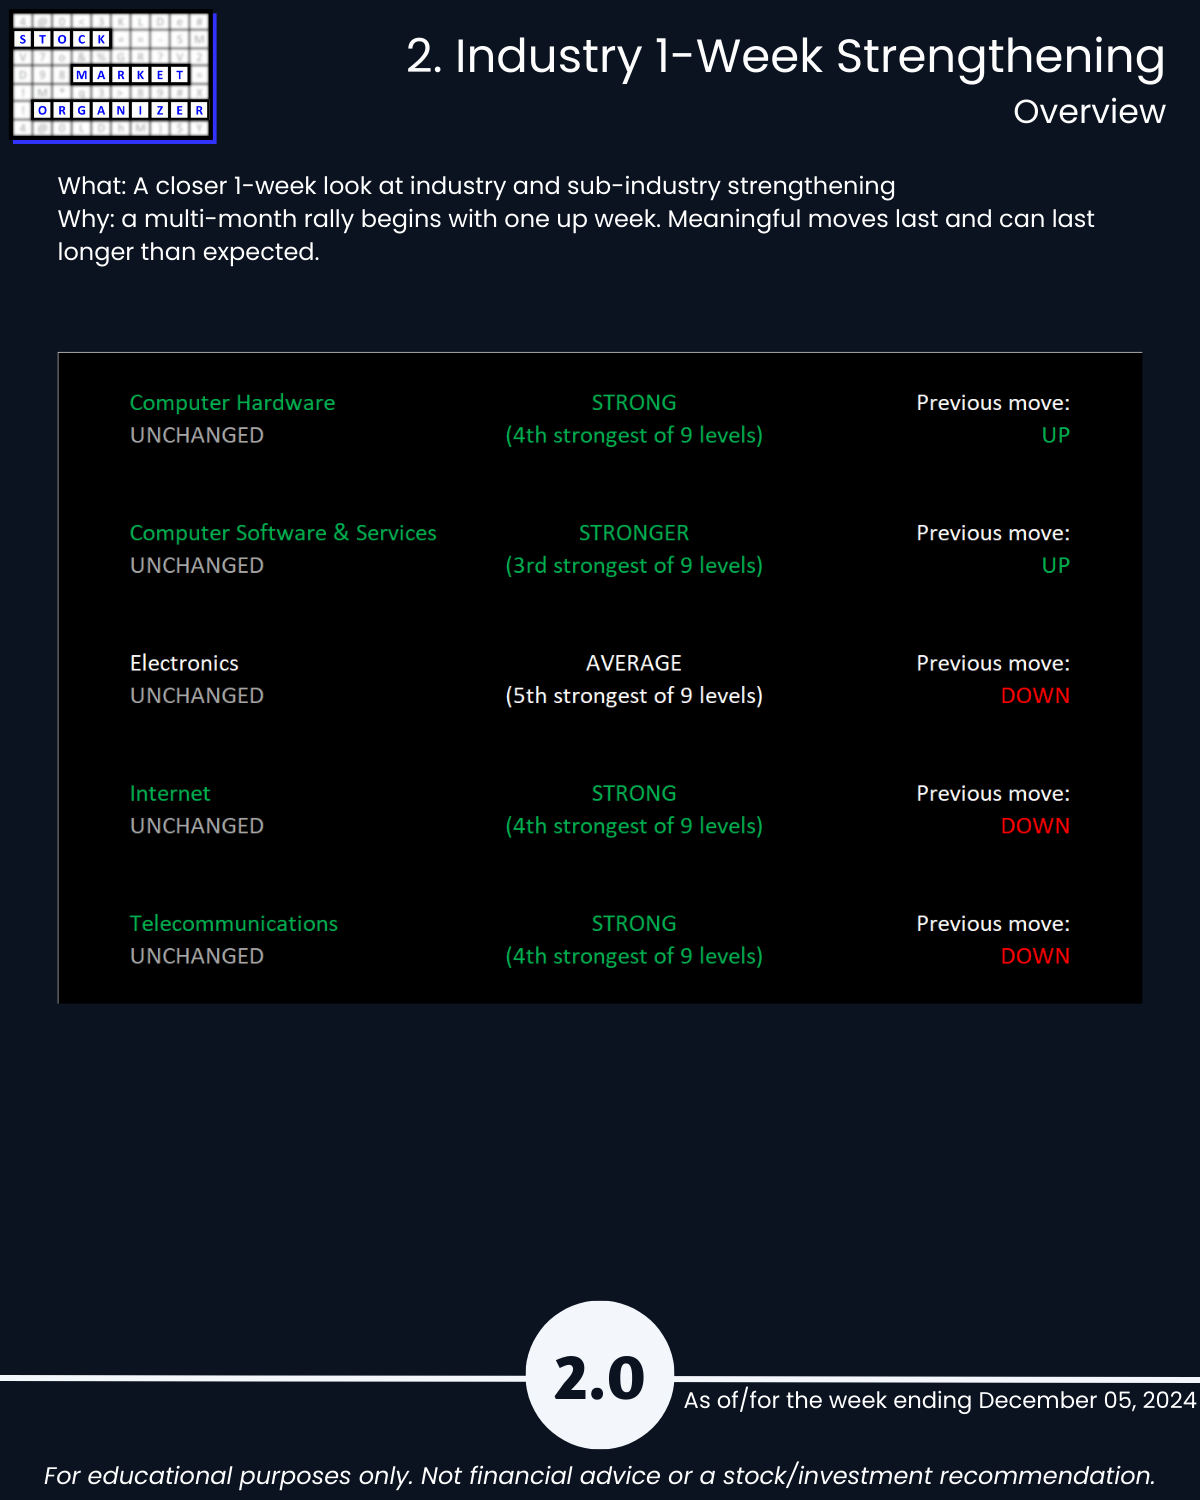
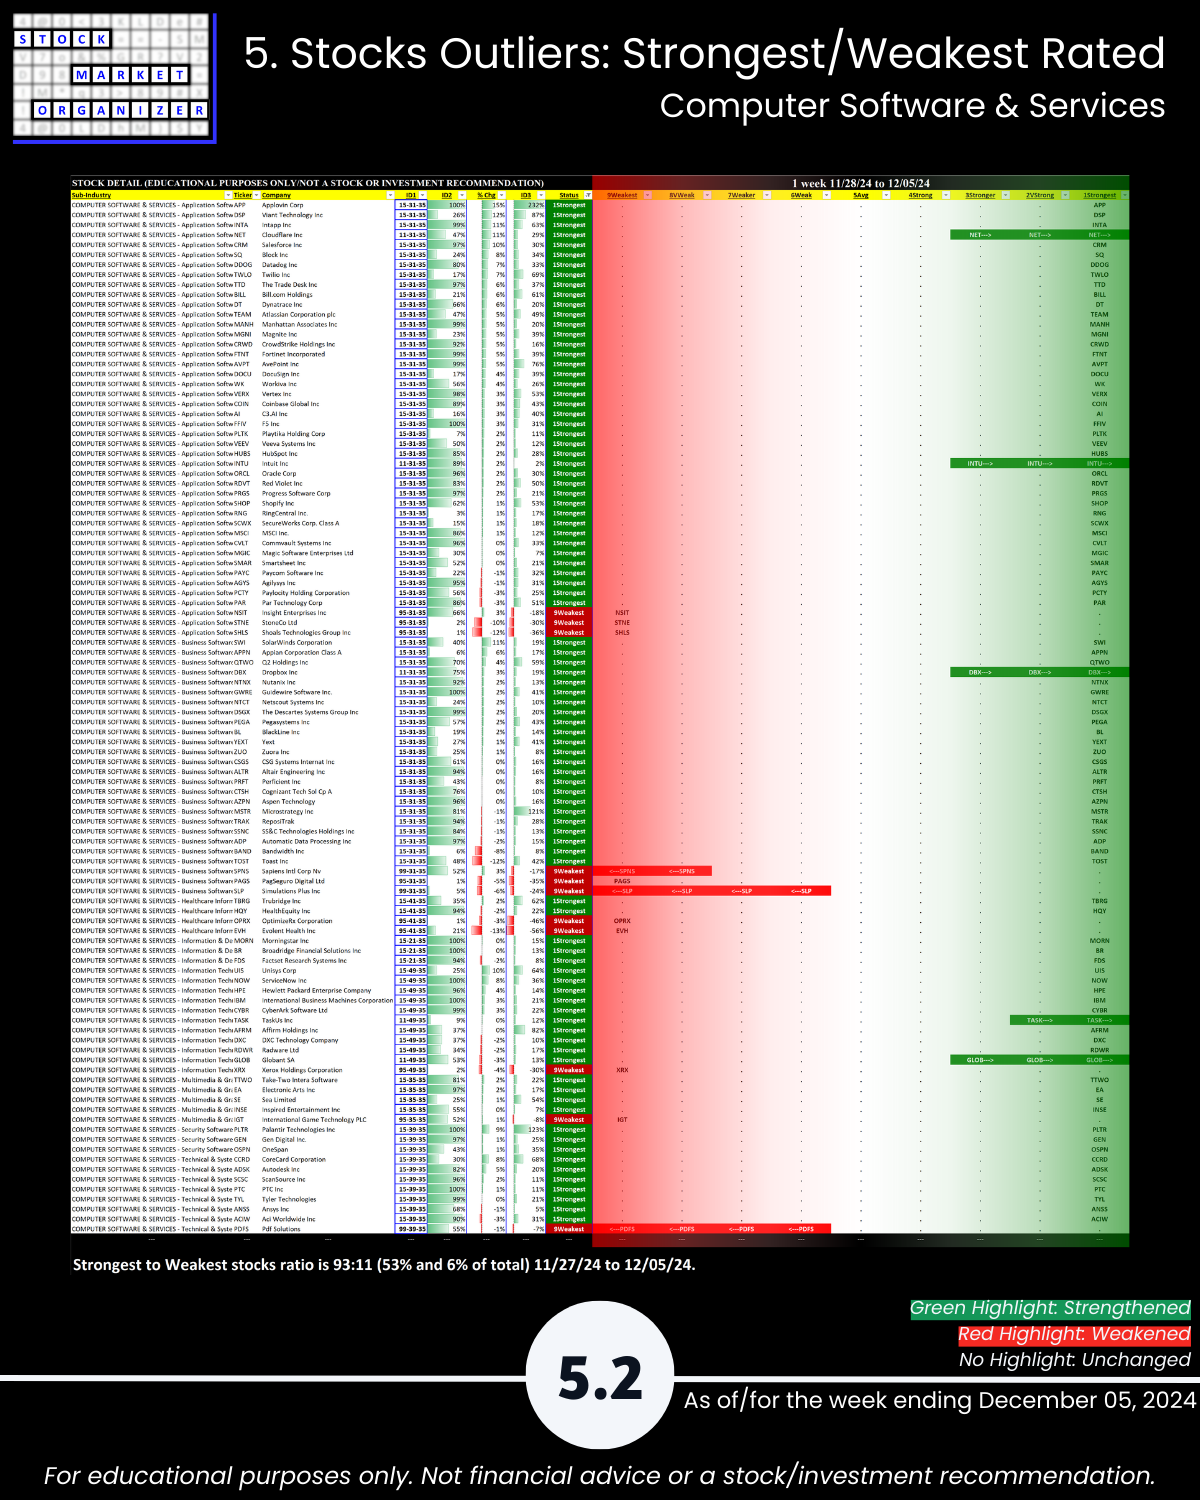
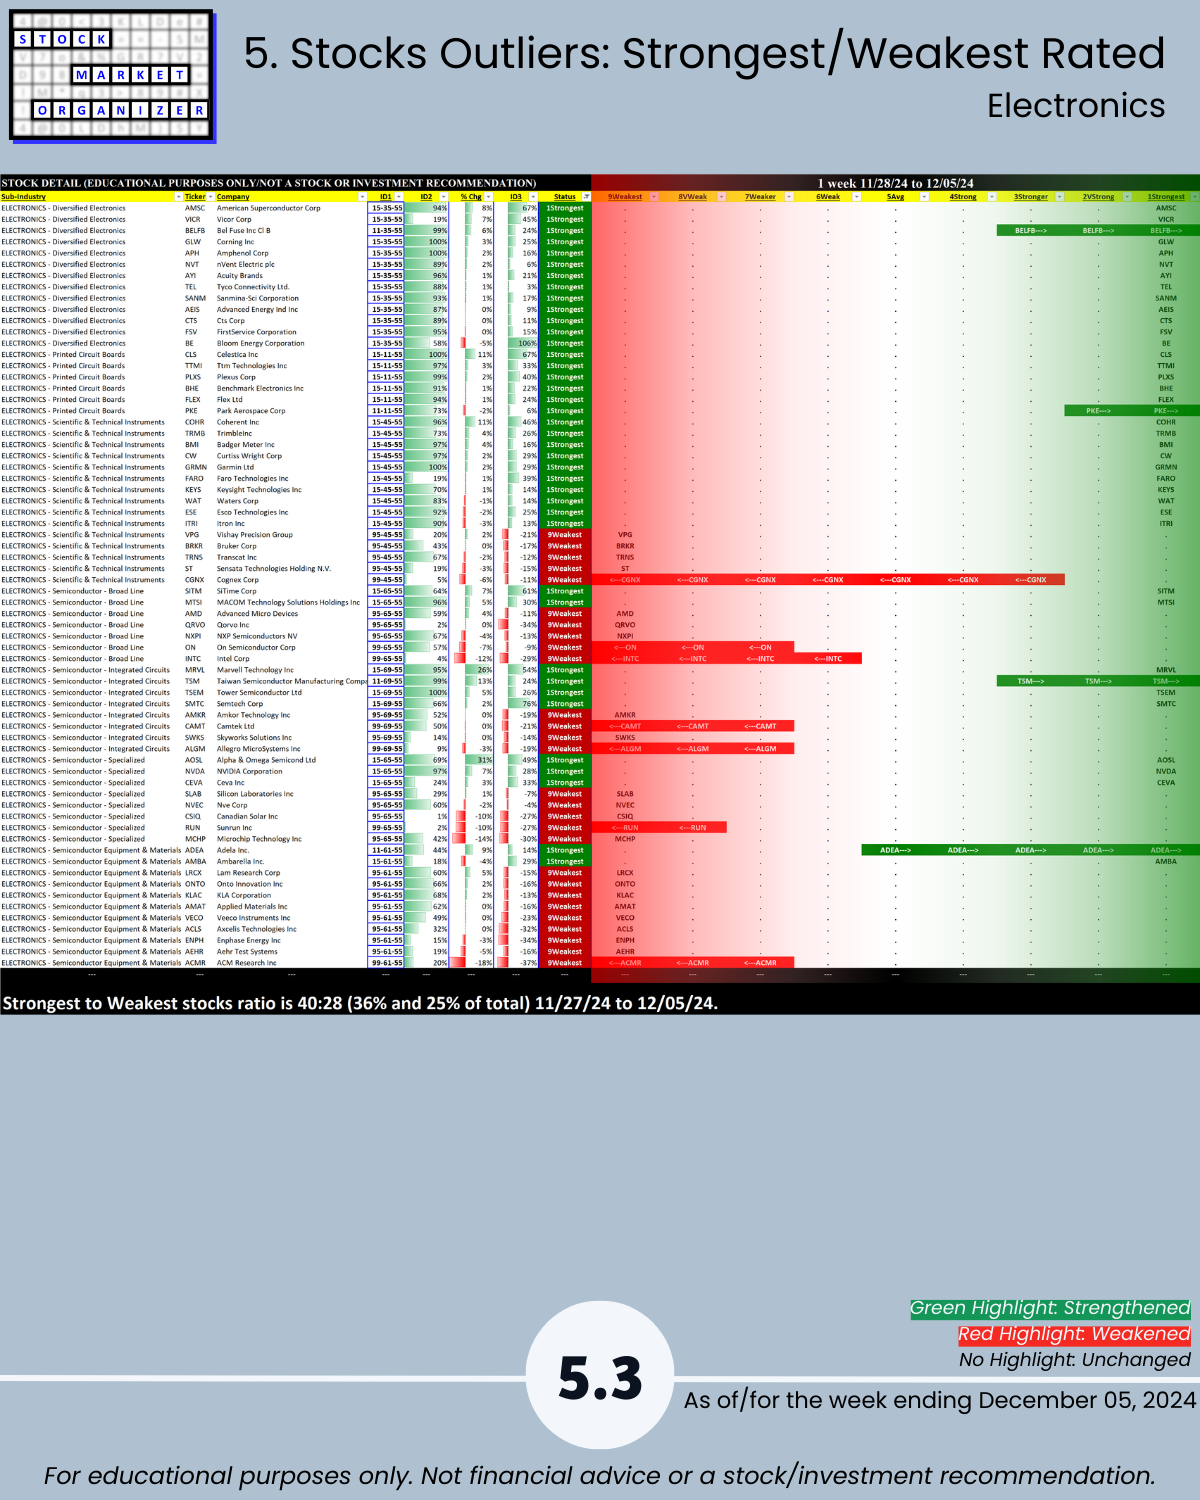
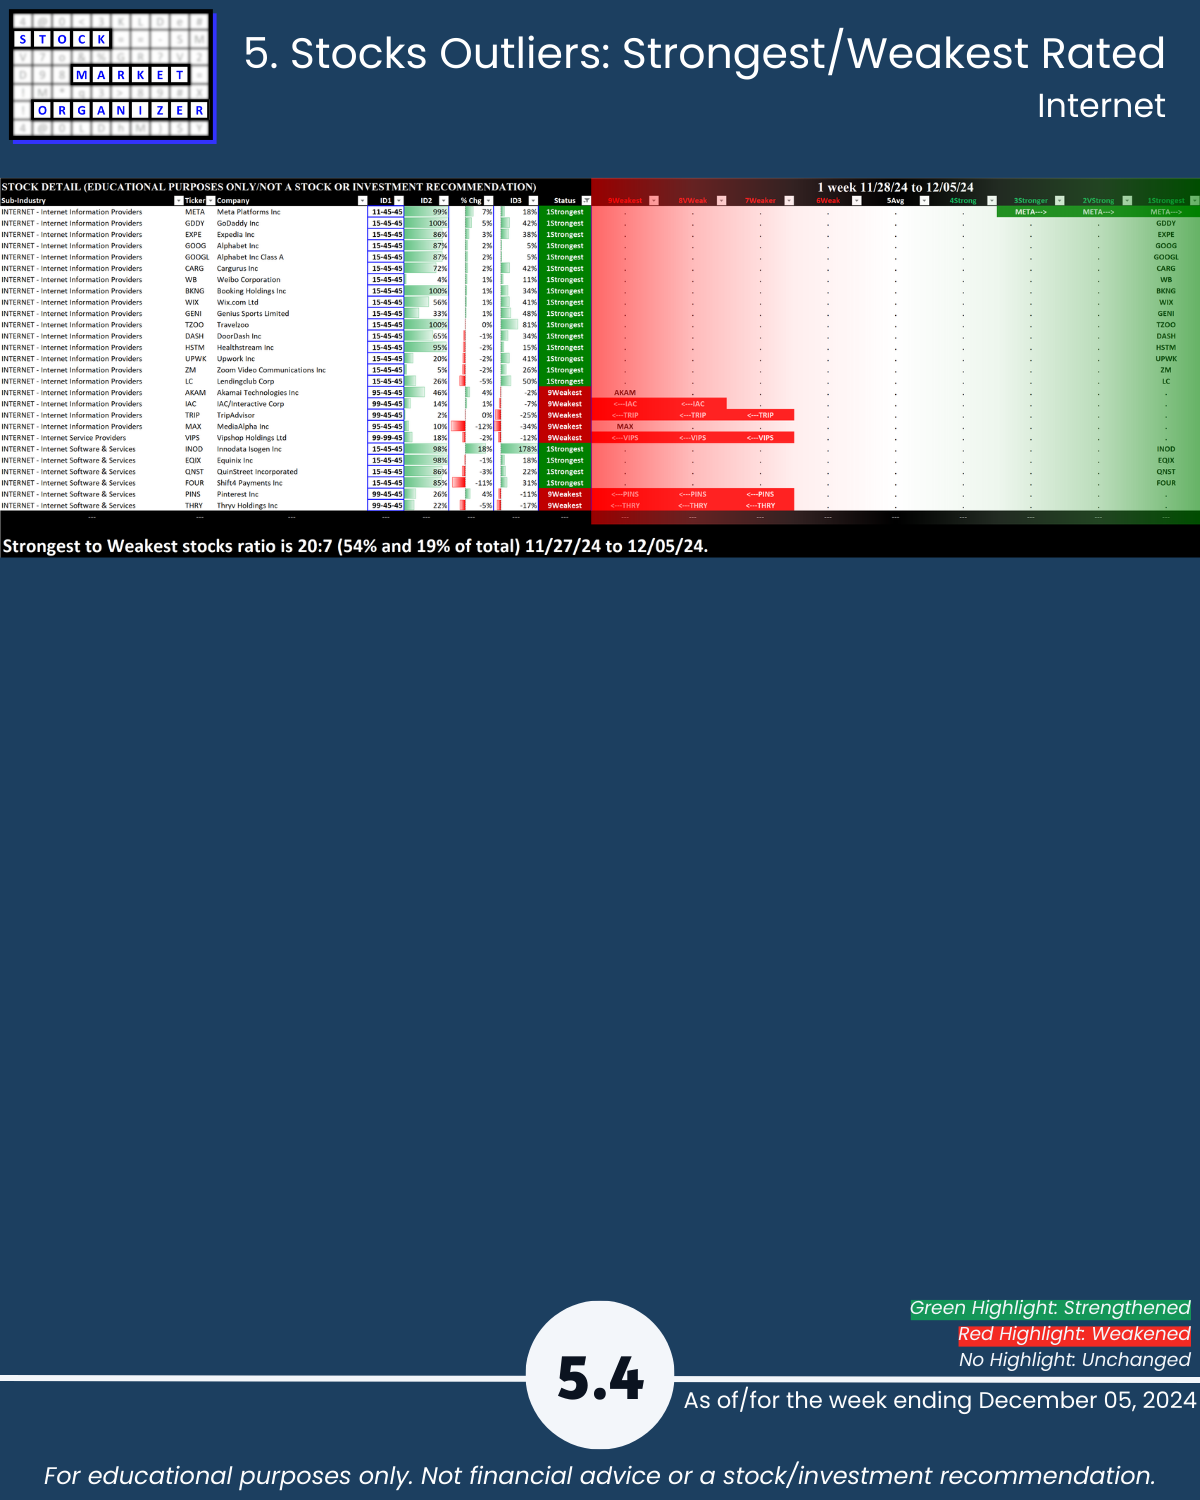
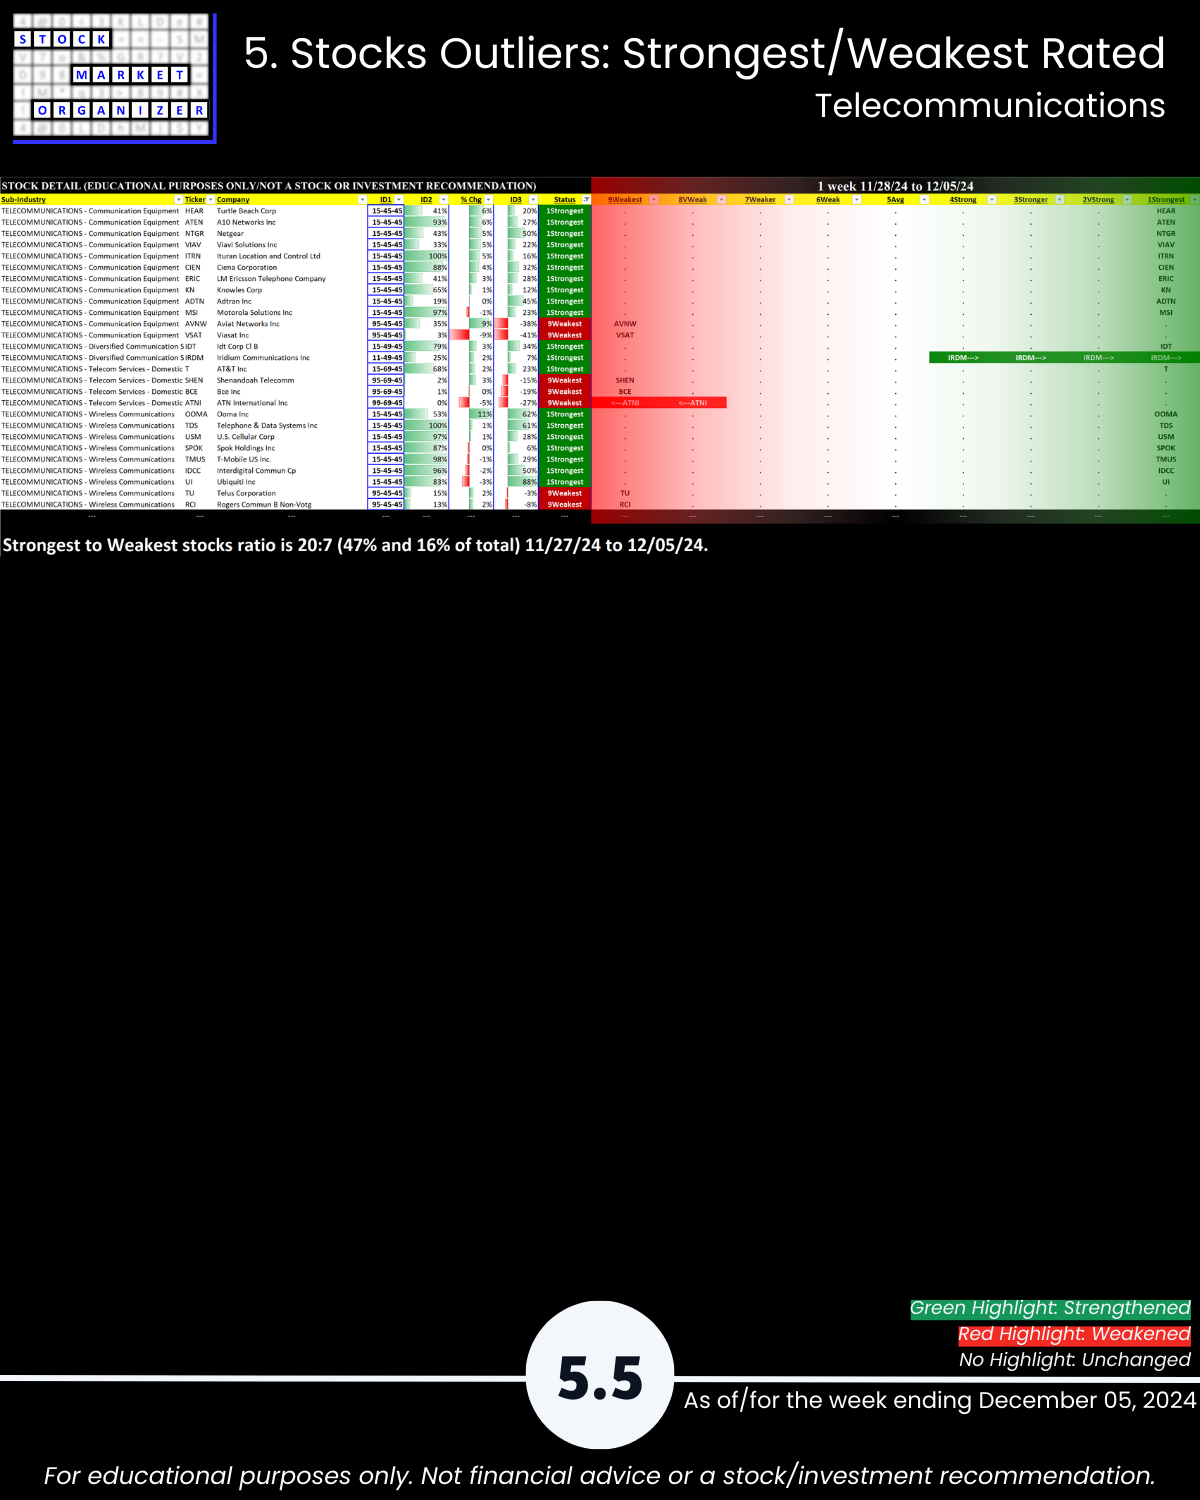
The Technology sector was unchanged at a 3.8 composite score this week - a healthy score, slightly better than 4Strong on the 1 through 9 scale of 1Strongest and 9Weakest with 5Average. Computer Software & Services leads at 3Stronger, followed by Computer Hardware, Internet, and Telecommunications tied at 4Strong. Electronics remains the sector's laggard with a 5Average rating.
Difference This vs. ETFs Analysis
Note this analysis is the same as that used for the SPDR ETFs but the two main differences are:
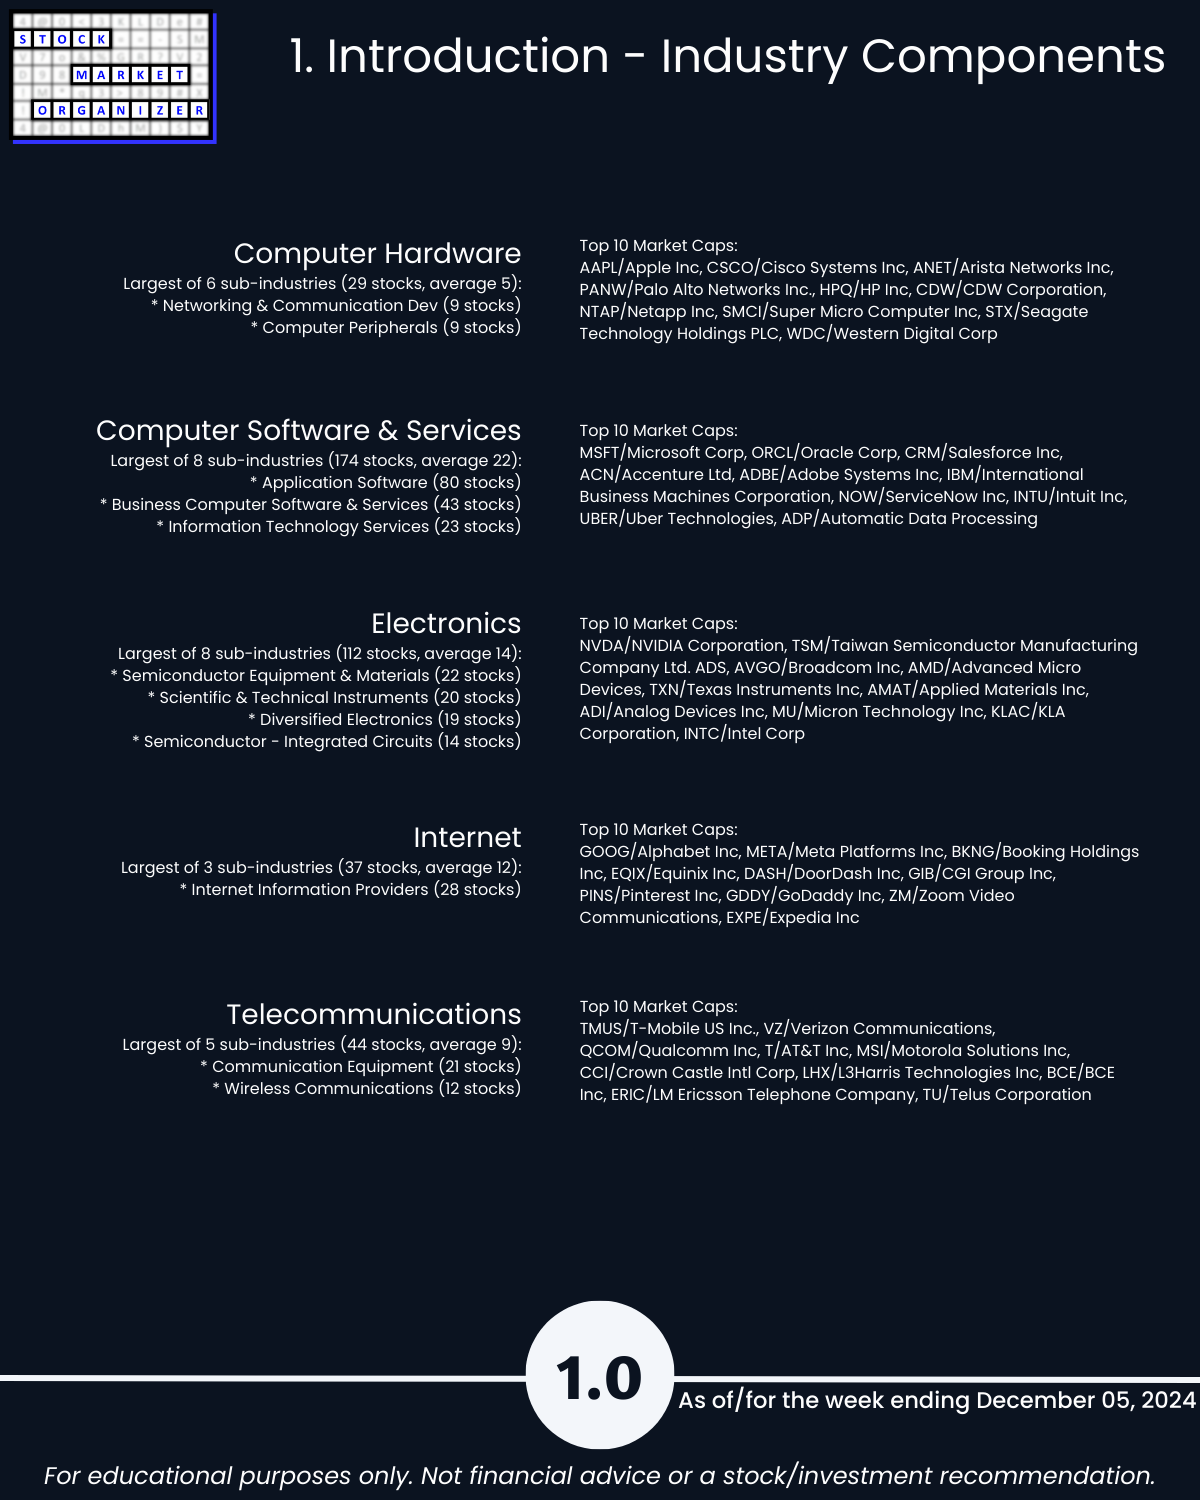
1. Universe of stocks. The ETFs are the largest capitalization stocks, 500 of them in the 11 sector ETFs. In this analysis, there are approximately 2,700 stocks.
2. Sub-categorization below the market level. The ETF analysis with 500 stocks is limited to sector strengthening and weakening. This analysis with +/-2,700 stocks can be and is segregated into 29 industry groups and in turn 189 sub-industry groups.
There is a Technology ETF (symbol XLK) which is separate from the Communications ETF (symbol XLC). The Technology sector in this analysis includes Telecommunications with Computer Hardware, Computer Software & Services, Electronics, and Internet.
Per Tuesday's ETF strength analysis, XLC/Communications is rated 3Stronger (unchanged, tied for best among the 11 ETFs) and XLK/Technology is rated 4Strong (weakened but not enough to change rating) . This is generally a match for the Technology sector's readings from today. This means the larger cap Technology stocks are aligned with the smaller caps.
How would I interpret and use this information?
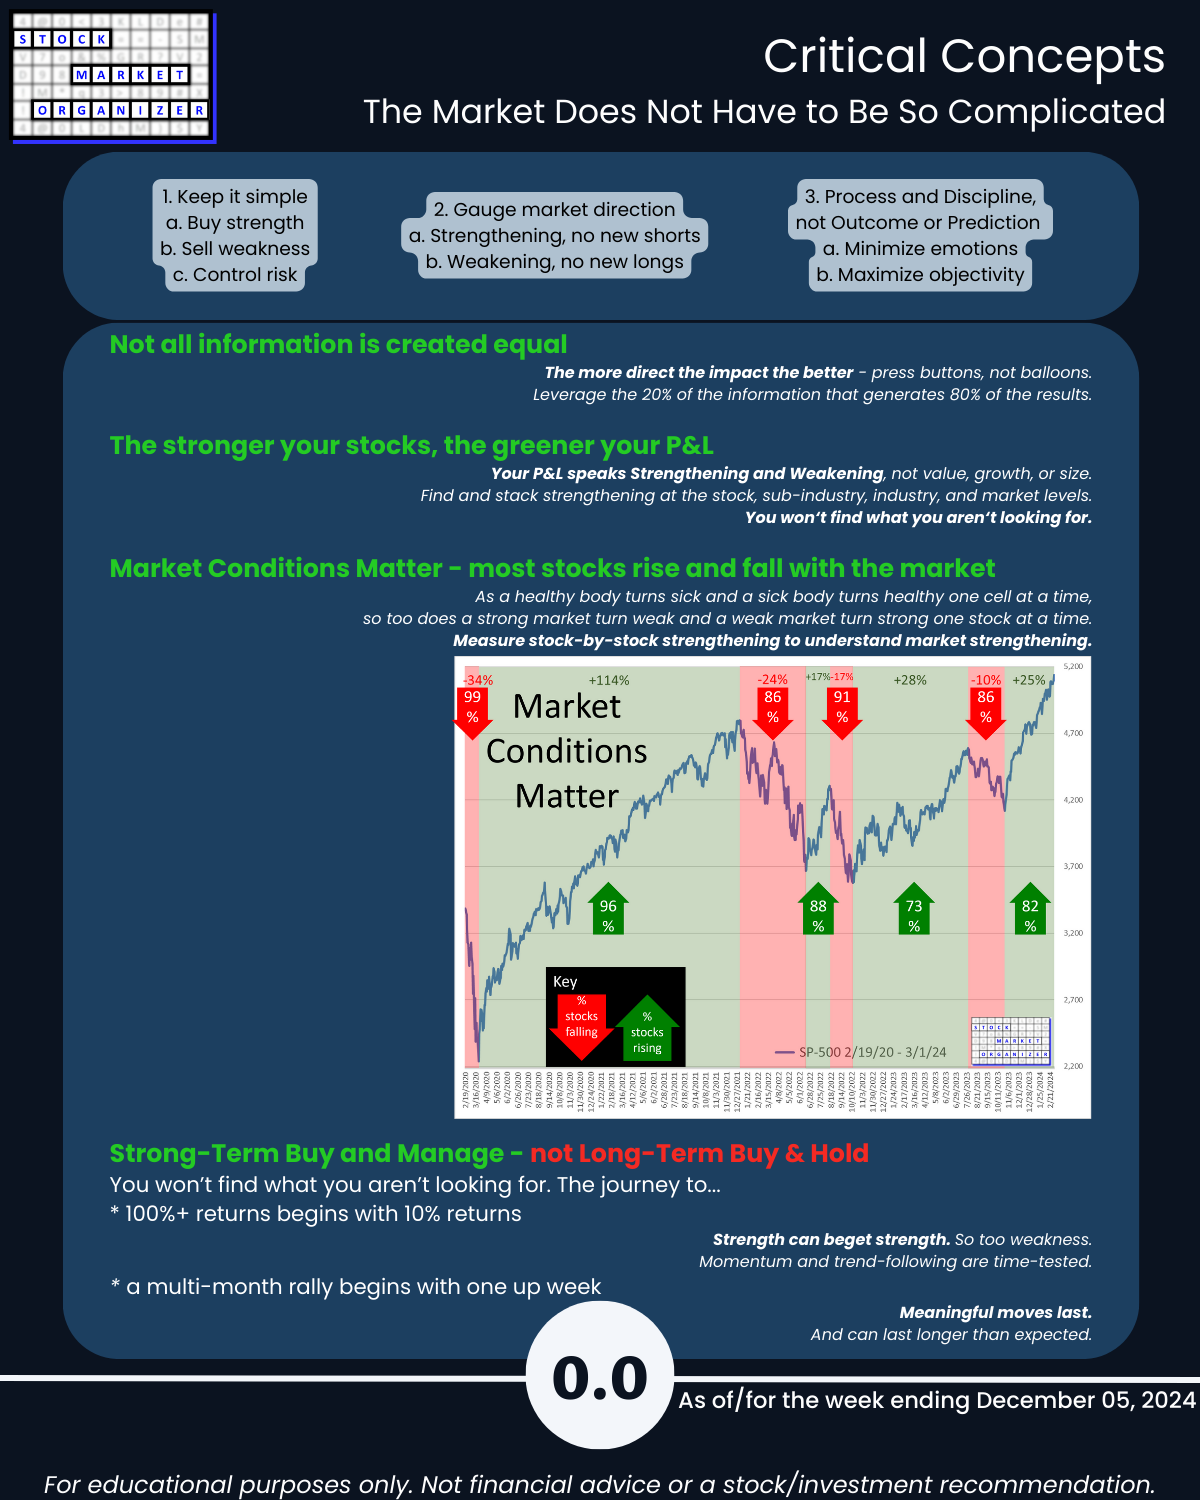
Recognizing that anything can happen at any time and I will never know the reason why until after the fact if ever, I am looking to give myself the best chances of an individual stock going my desired direction by stacking strength going long or stacking weakness going short, depending on strength/strengthening and weakness/weakening at the stock, sub-industry, industry, sector, and market levels.
Current Market and Sector Environment: TAILWIND/Neutral
- MARKET: The Market Strength Score is currently positive = TAILWIND
- SECTOR: The Technology sector was flat for the week but has a healthy 3.8 overall rating = Tailwind/Neutral
- If interested in positions in this sector, it is better to go where there is strength/strengthening - as reflected by price. This Stock Market Organizer methodology explicitly reveals this.
Current Industry/Sub-Industry Environment: Tailwind/Neutral
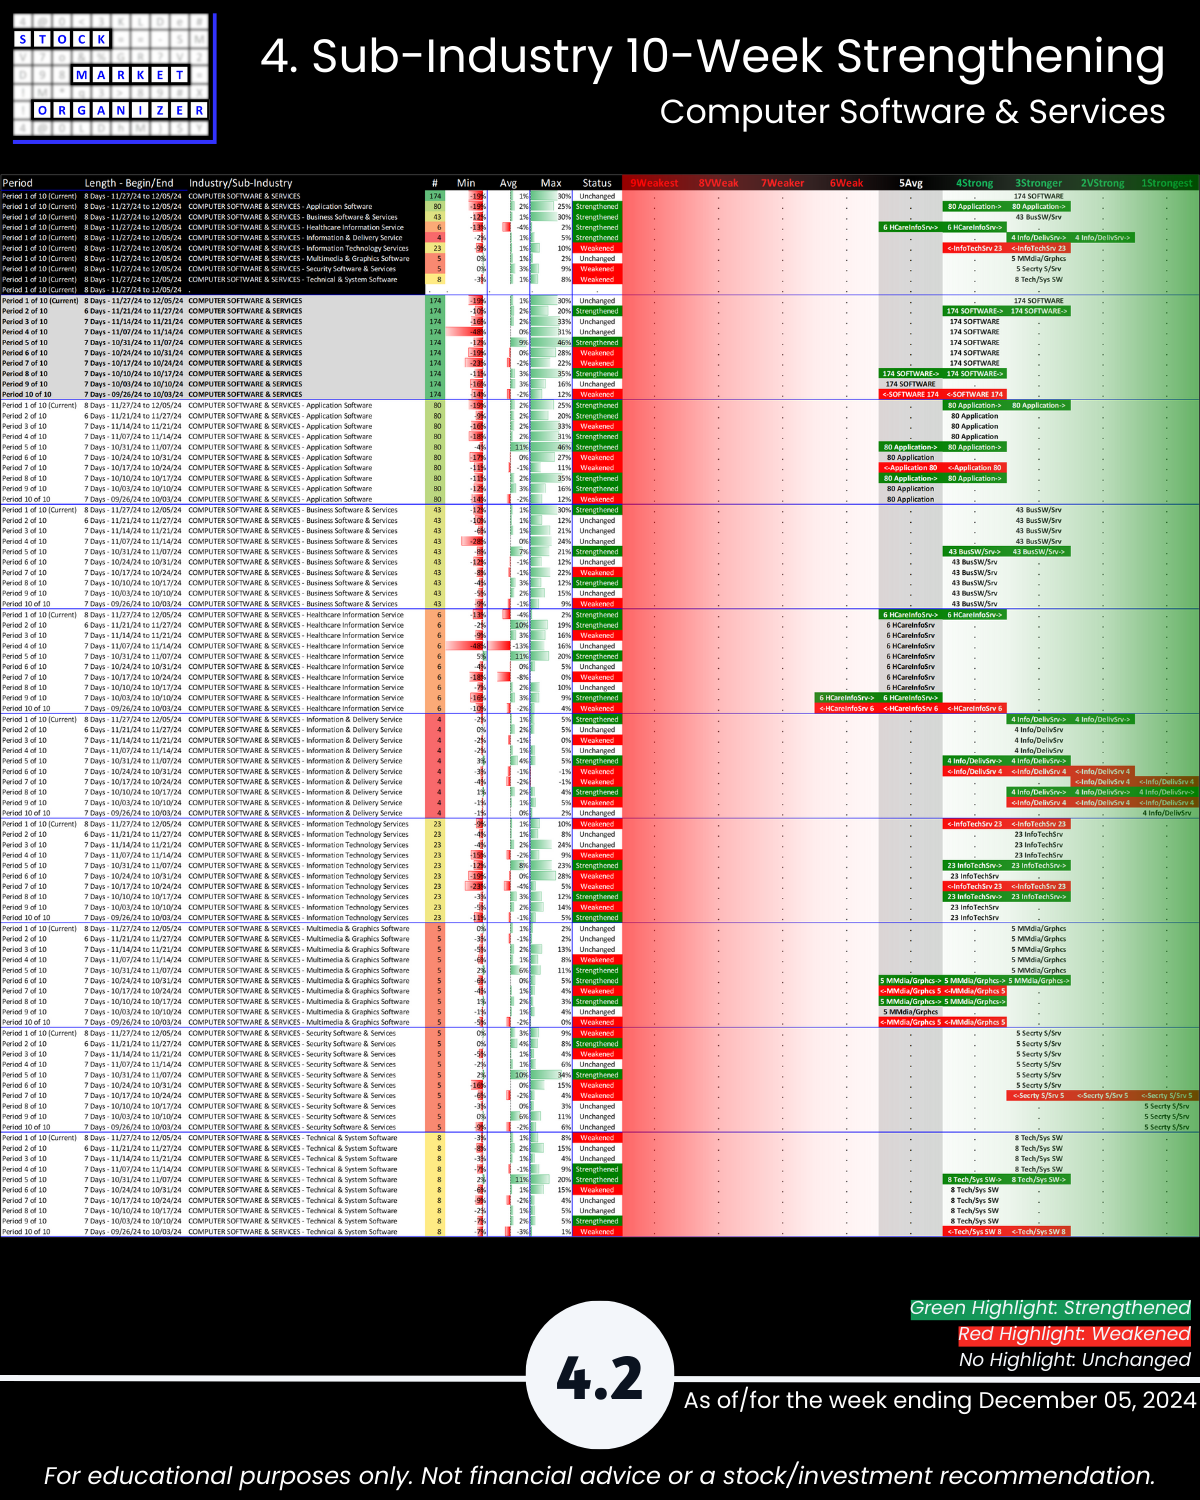
- Computer Software & Services was unchanged but has a 3Stronger rating = tailwind/neutral
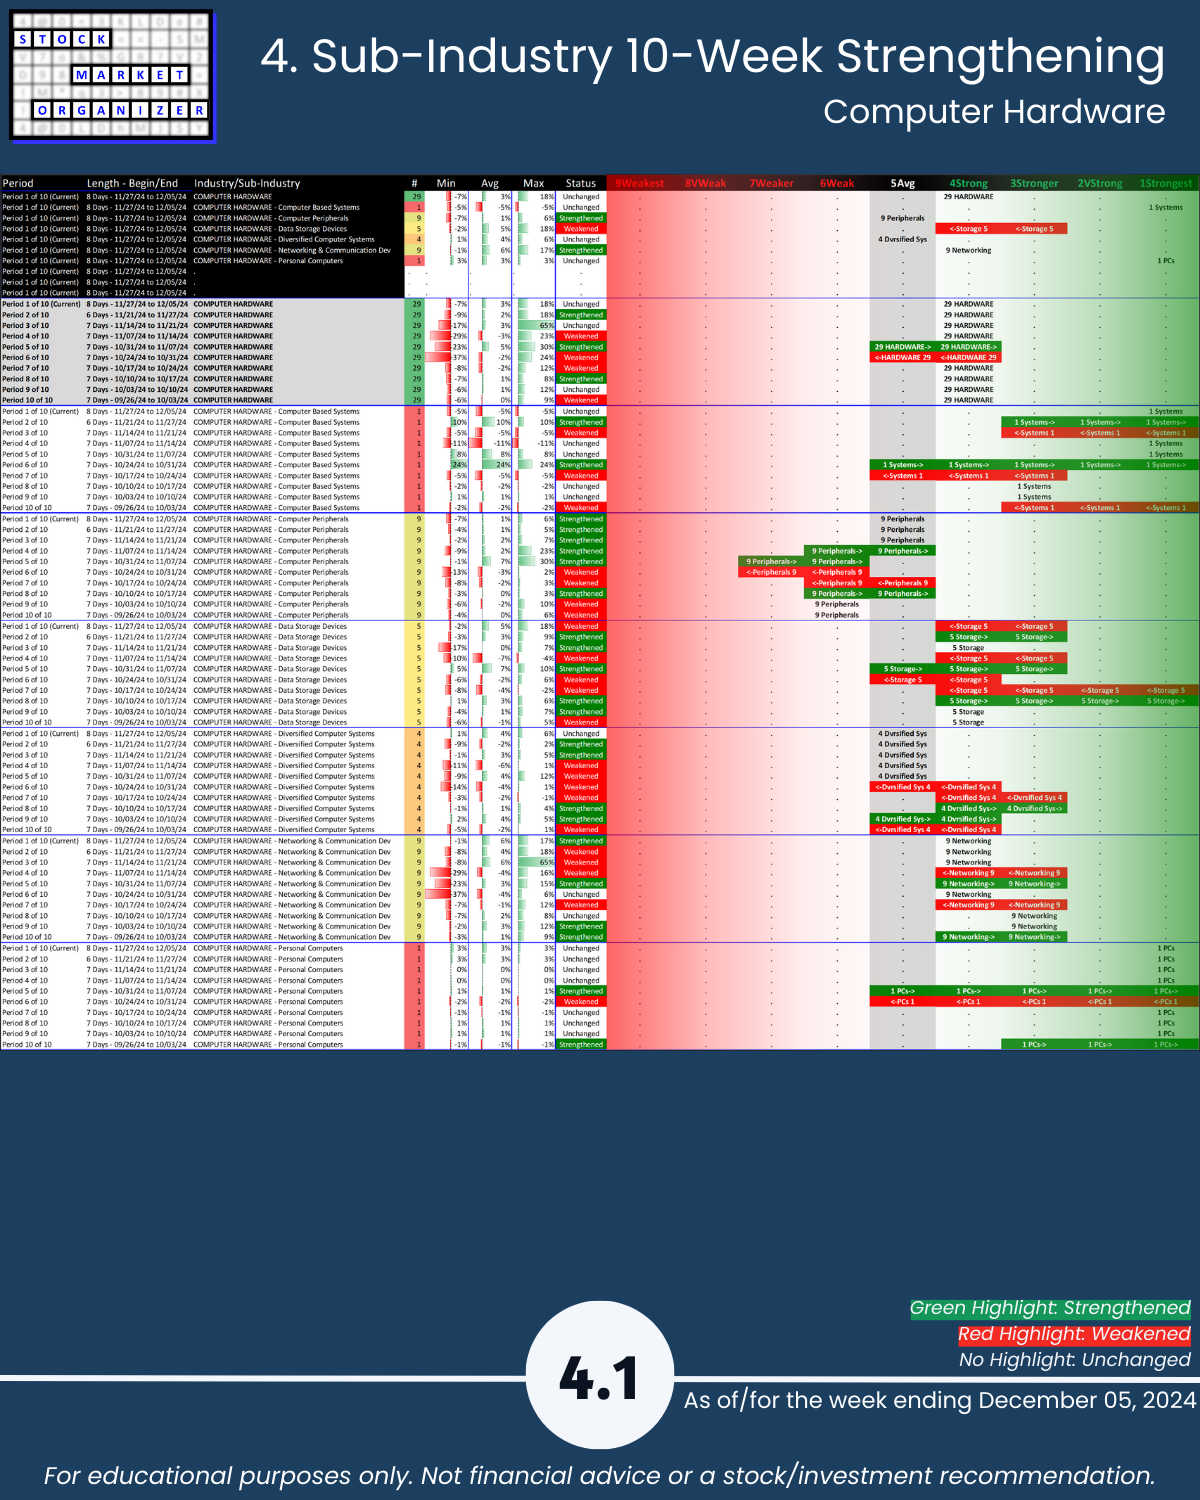
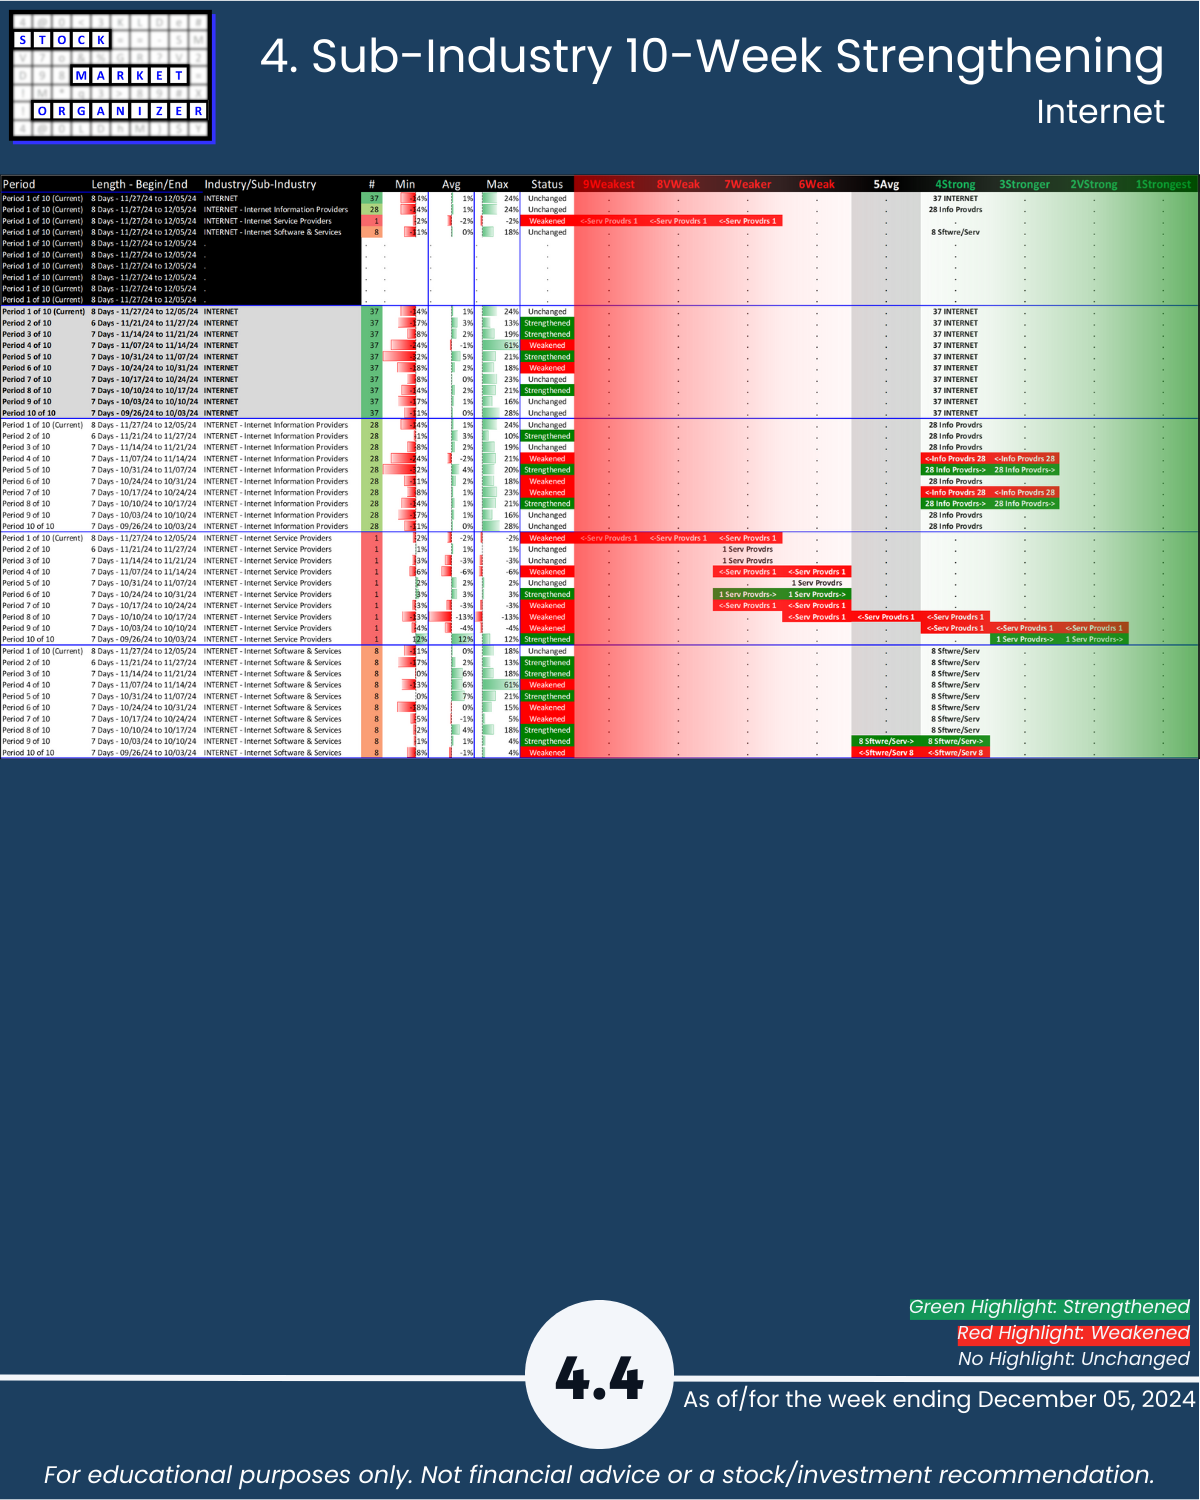
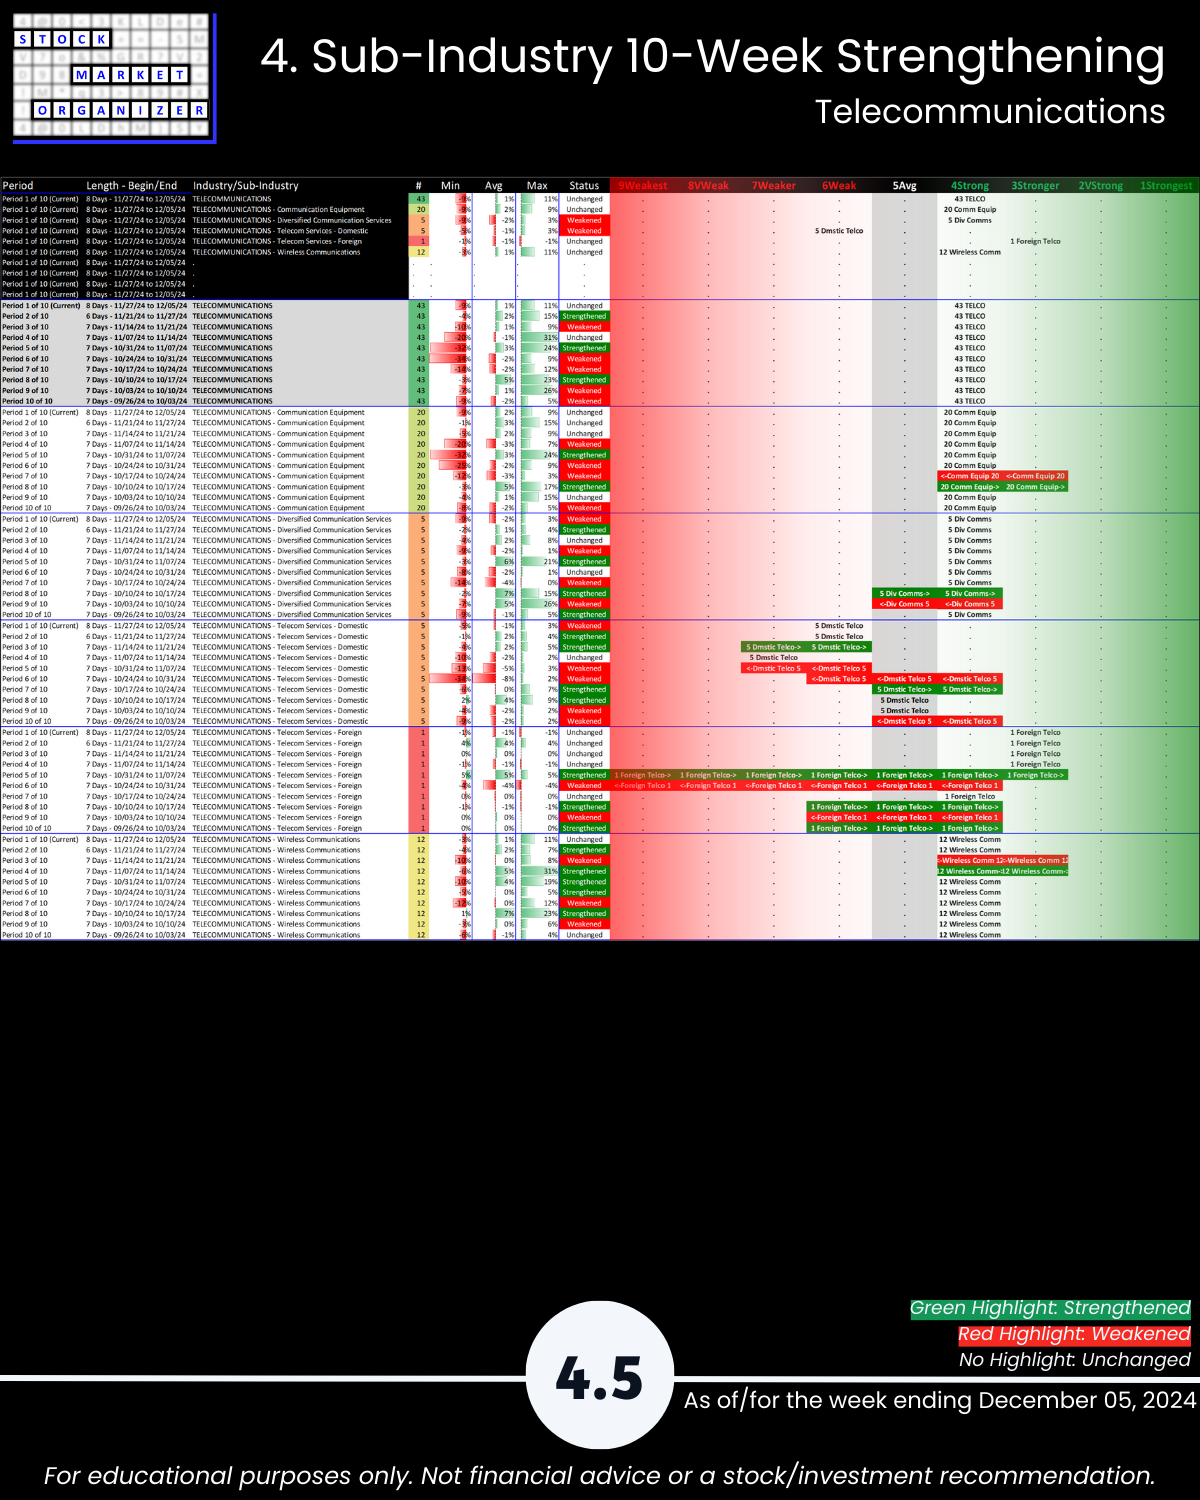
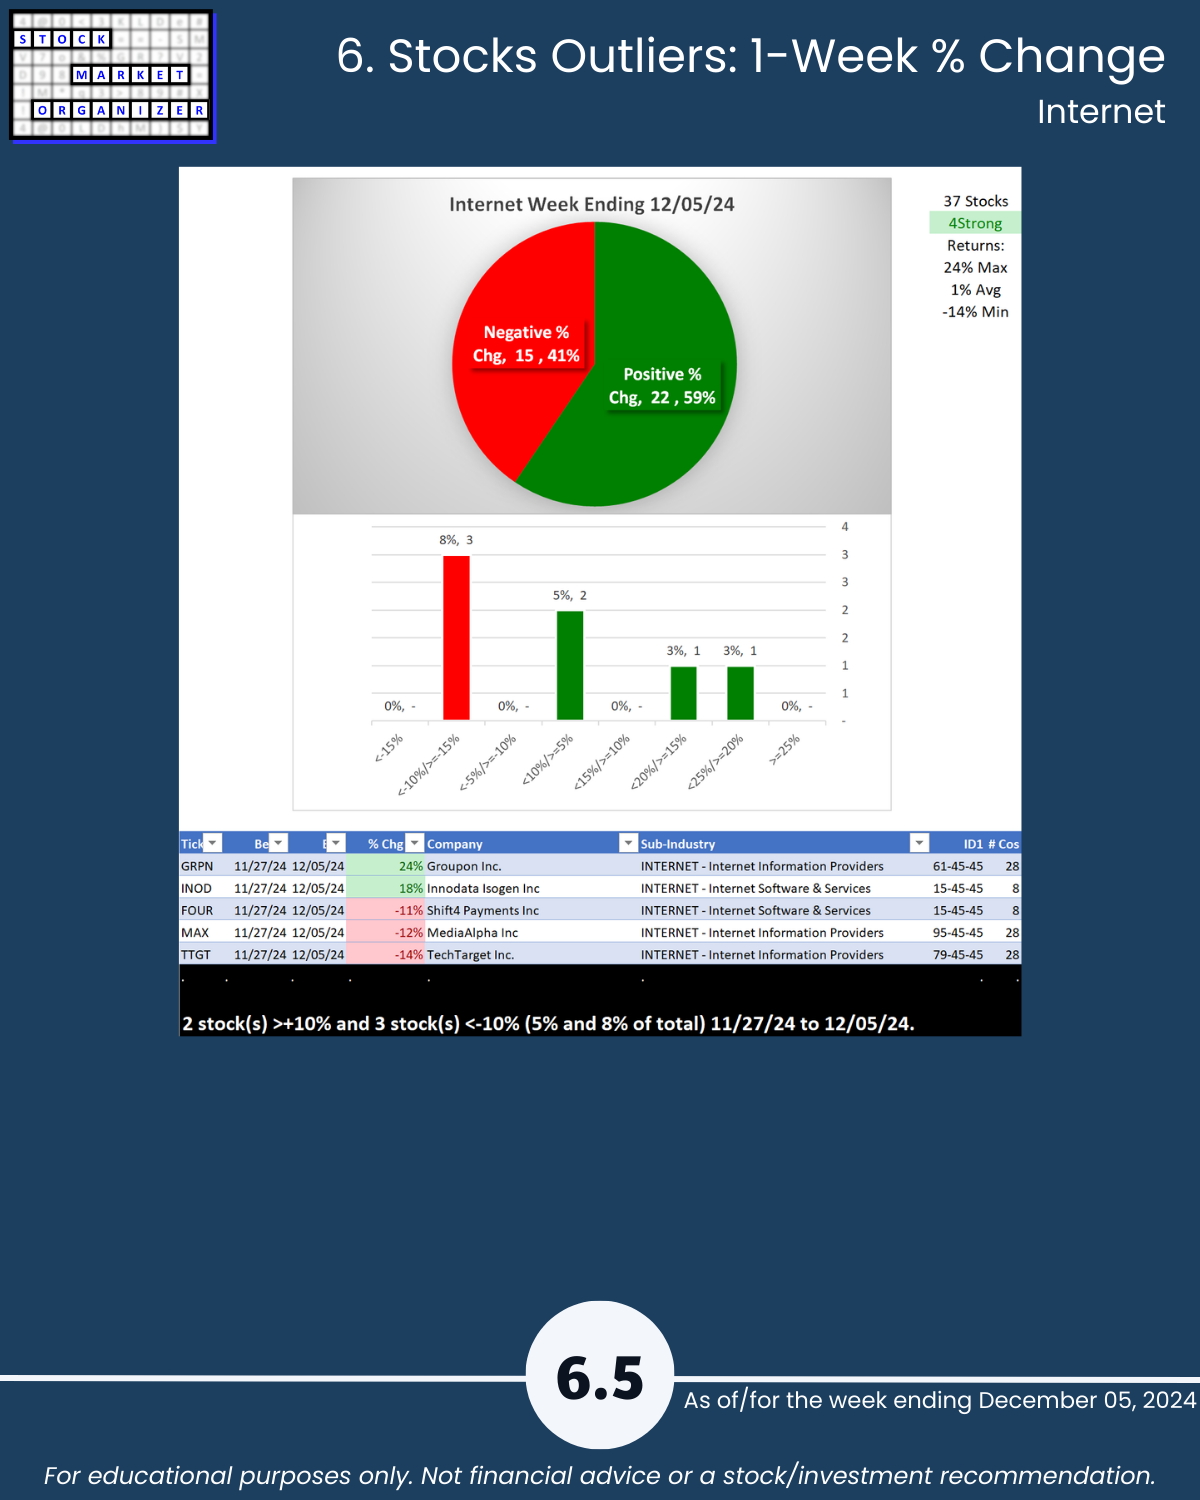
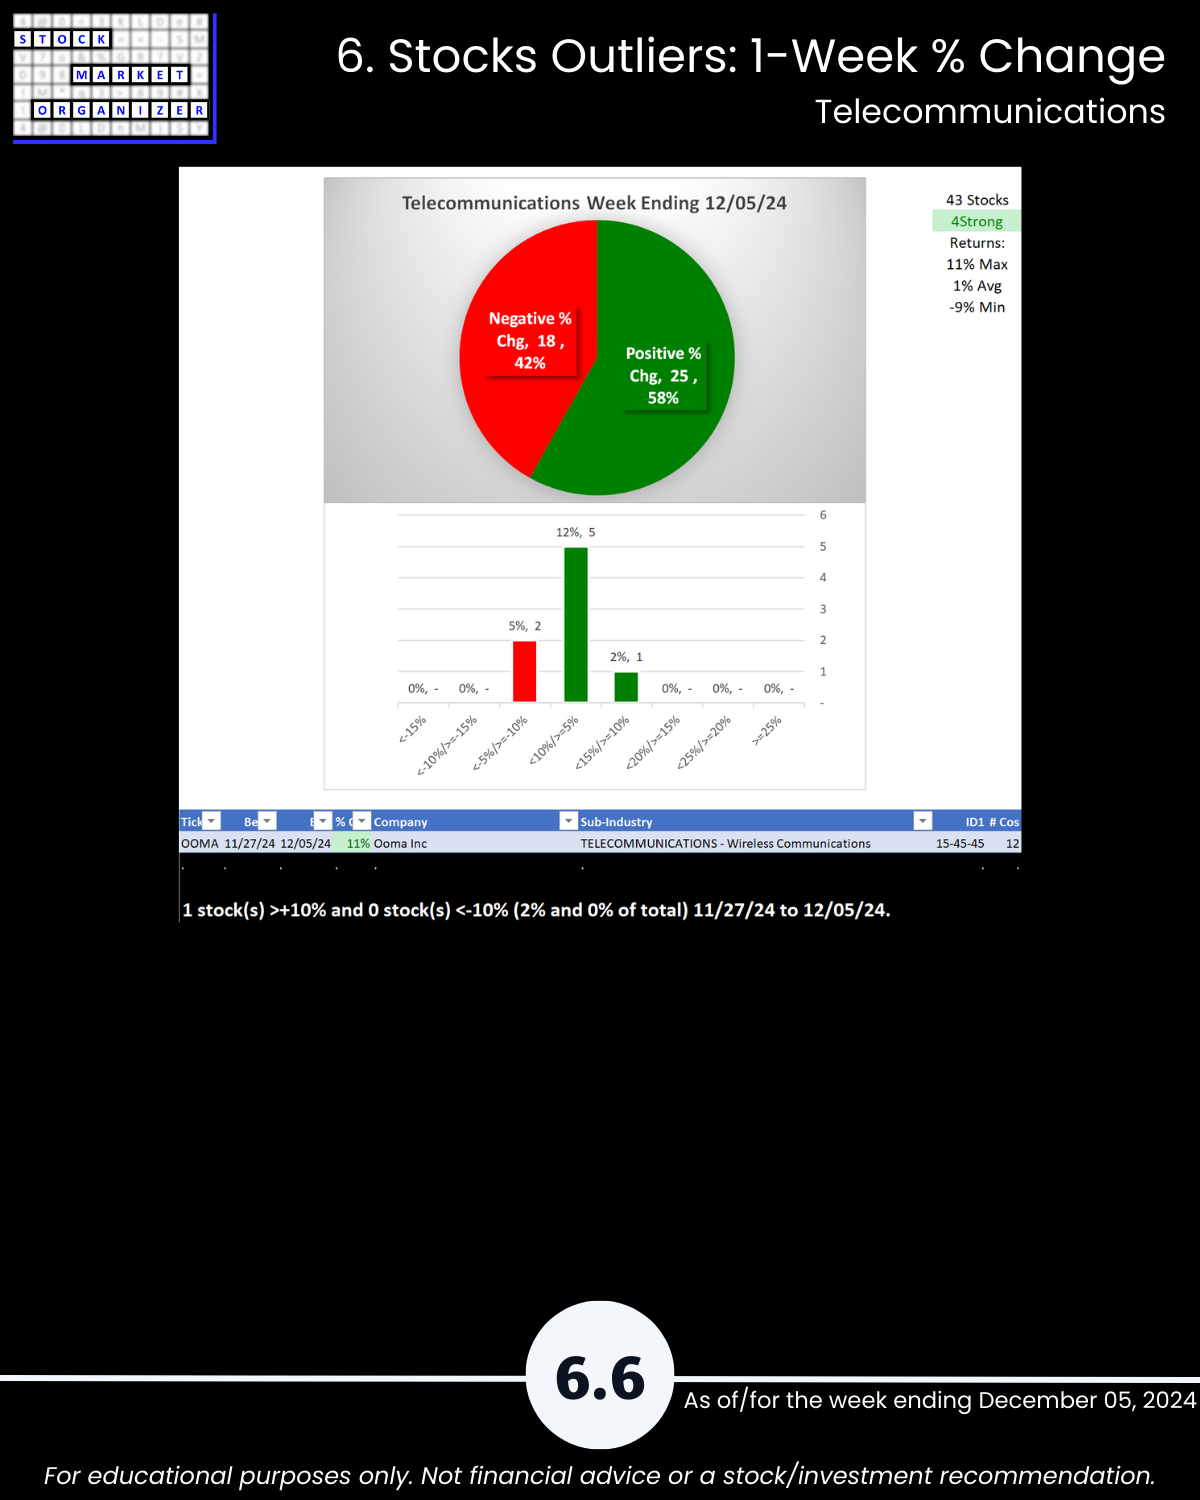
- Computer Hardware, Internet, and Telecommunications were unchanged but have 4Strong ratings = tailwind/neutral
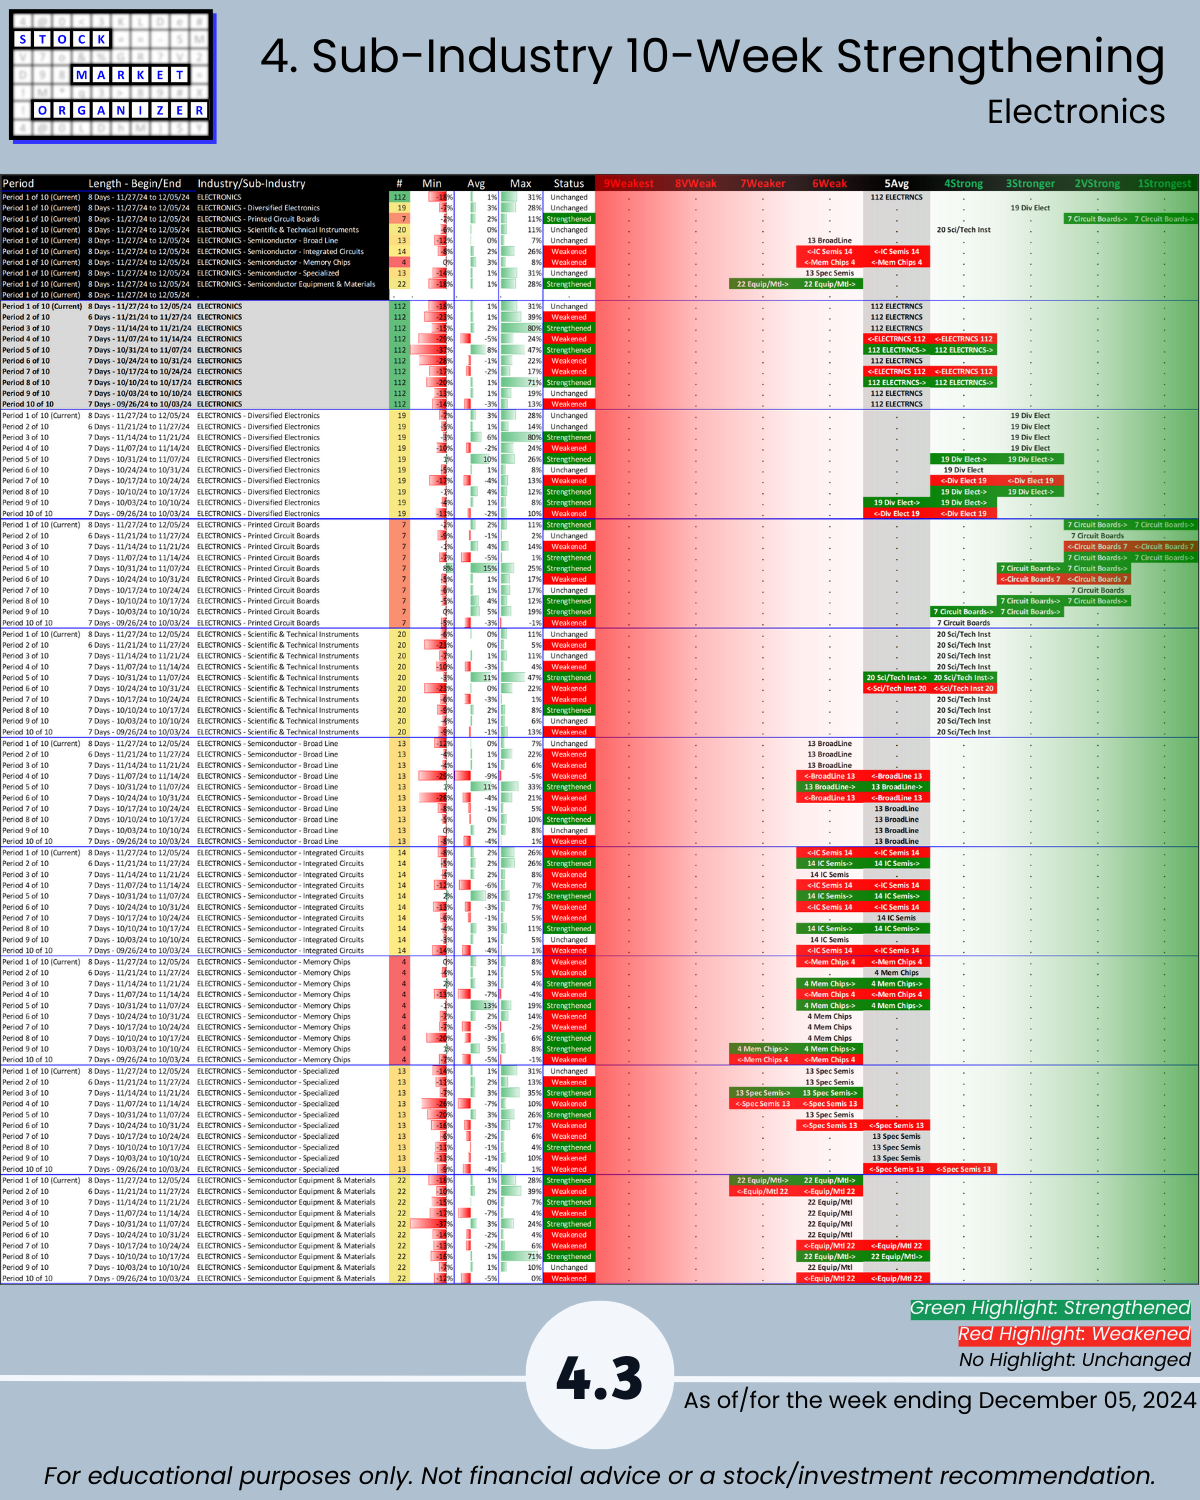
- Electronics (home of NVDA and semis/chips) was unchanged with a 5Average rating = neutral
Final Comments
It is impossible to determine how long this environment will last. All one can do objectively measure whether any given environment offers headwinds or tailwinds and then act accordingly based on these measurements.
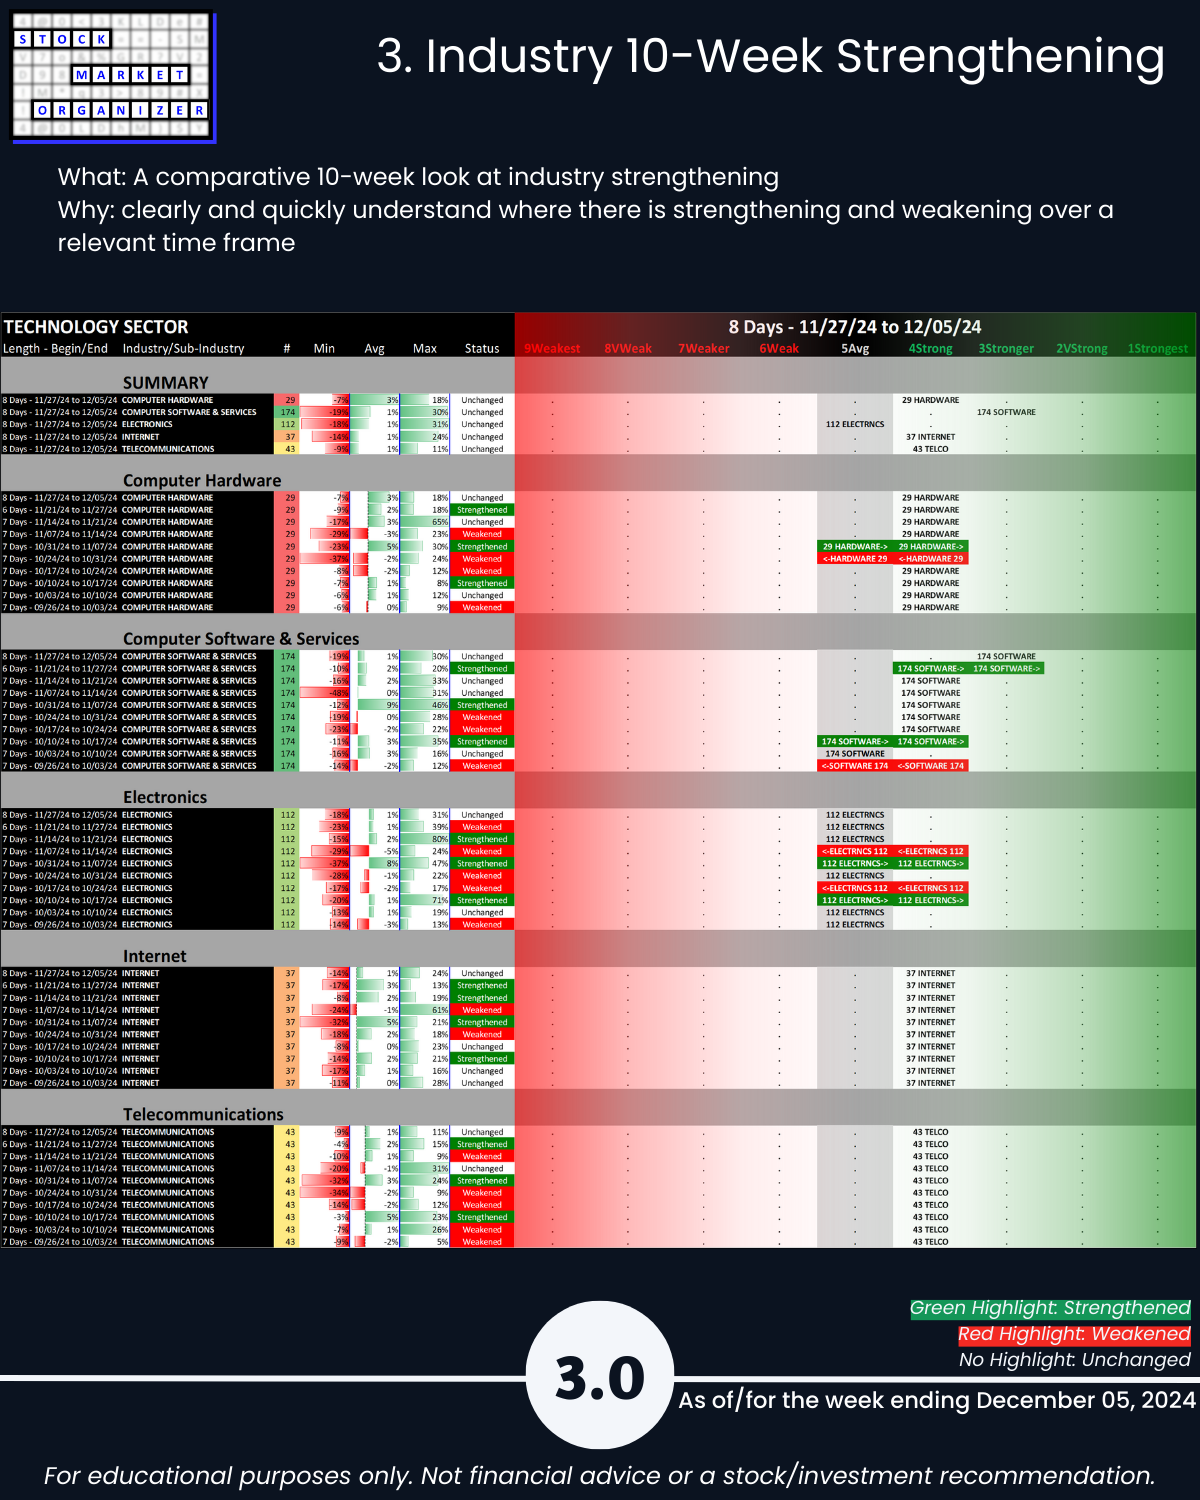
Details are below shown in a manner not available elsewhere because I created it from scratch to continually answer this question: “Where is there strengthening and weakening in the market at the stock, sub-industry, industry, and sector levels?” Combine this with the top-down Market Strength Score and Sector Risk Gauge to get a key competitive advantage of understanding strength at every level.
1. Introduction
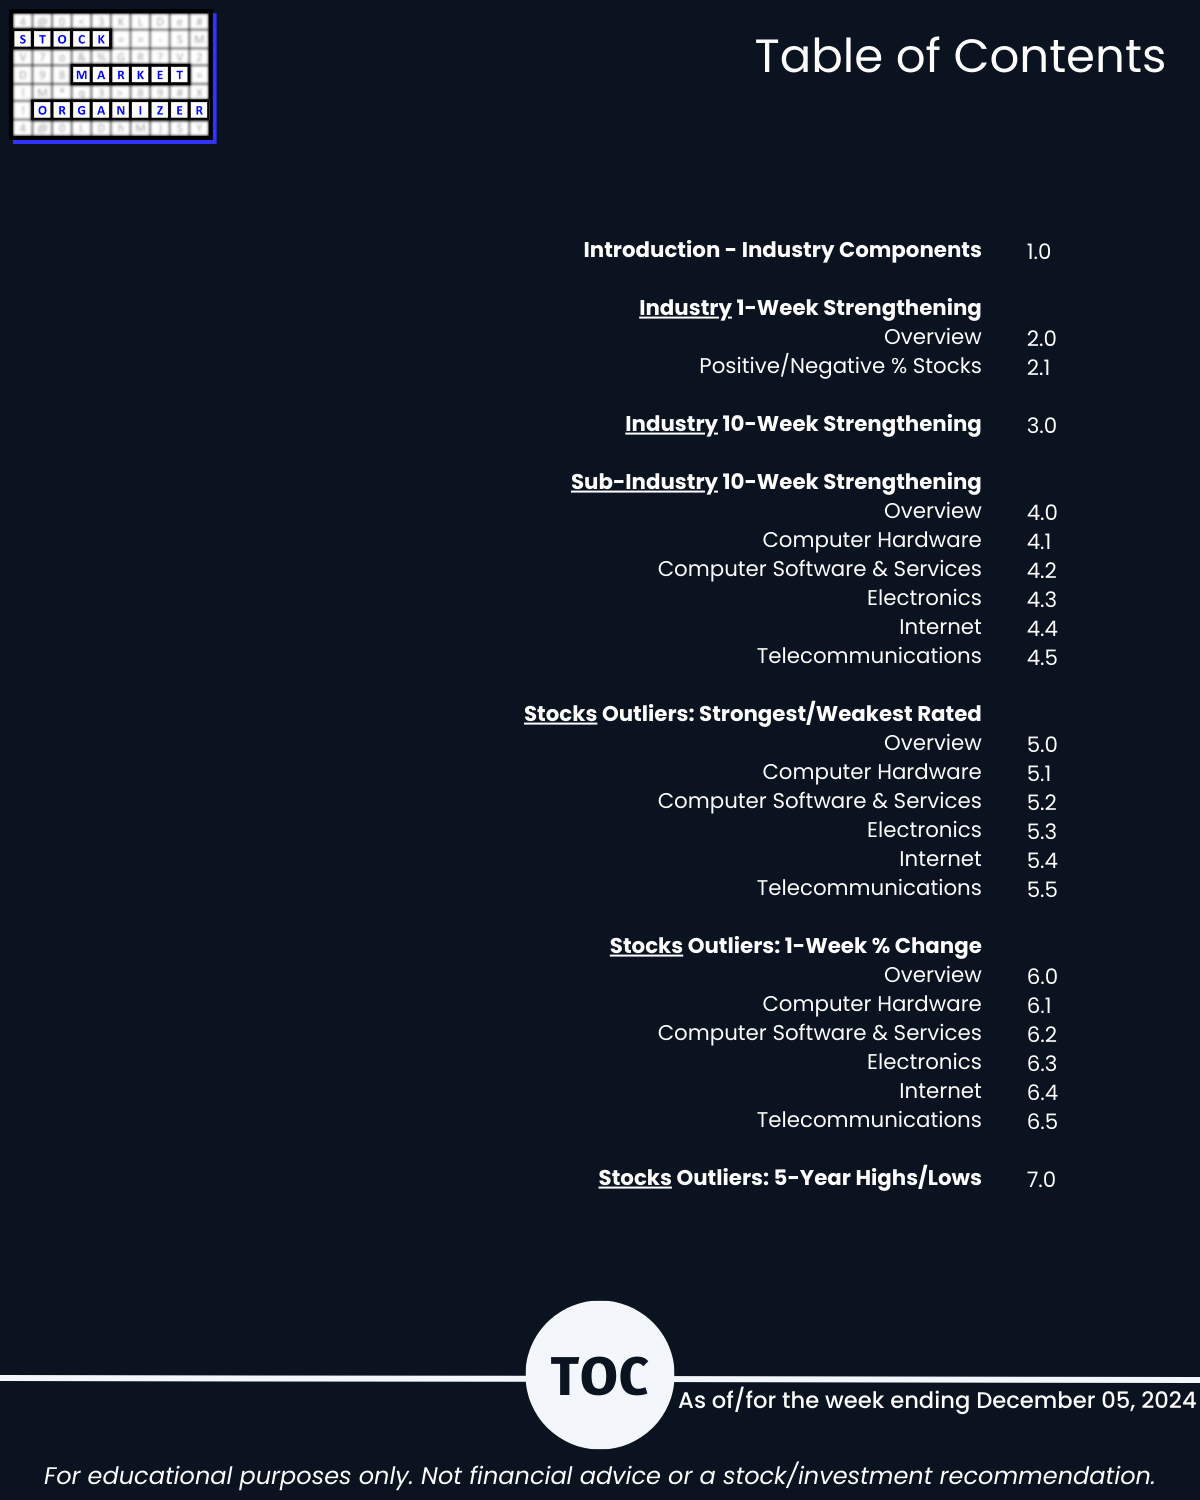
2. Industry 1-Week Strengthening
3. Industry 10-Week Strengthening
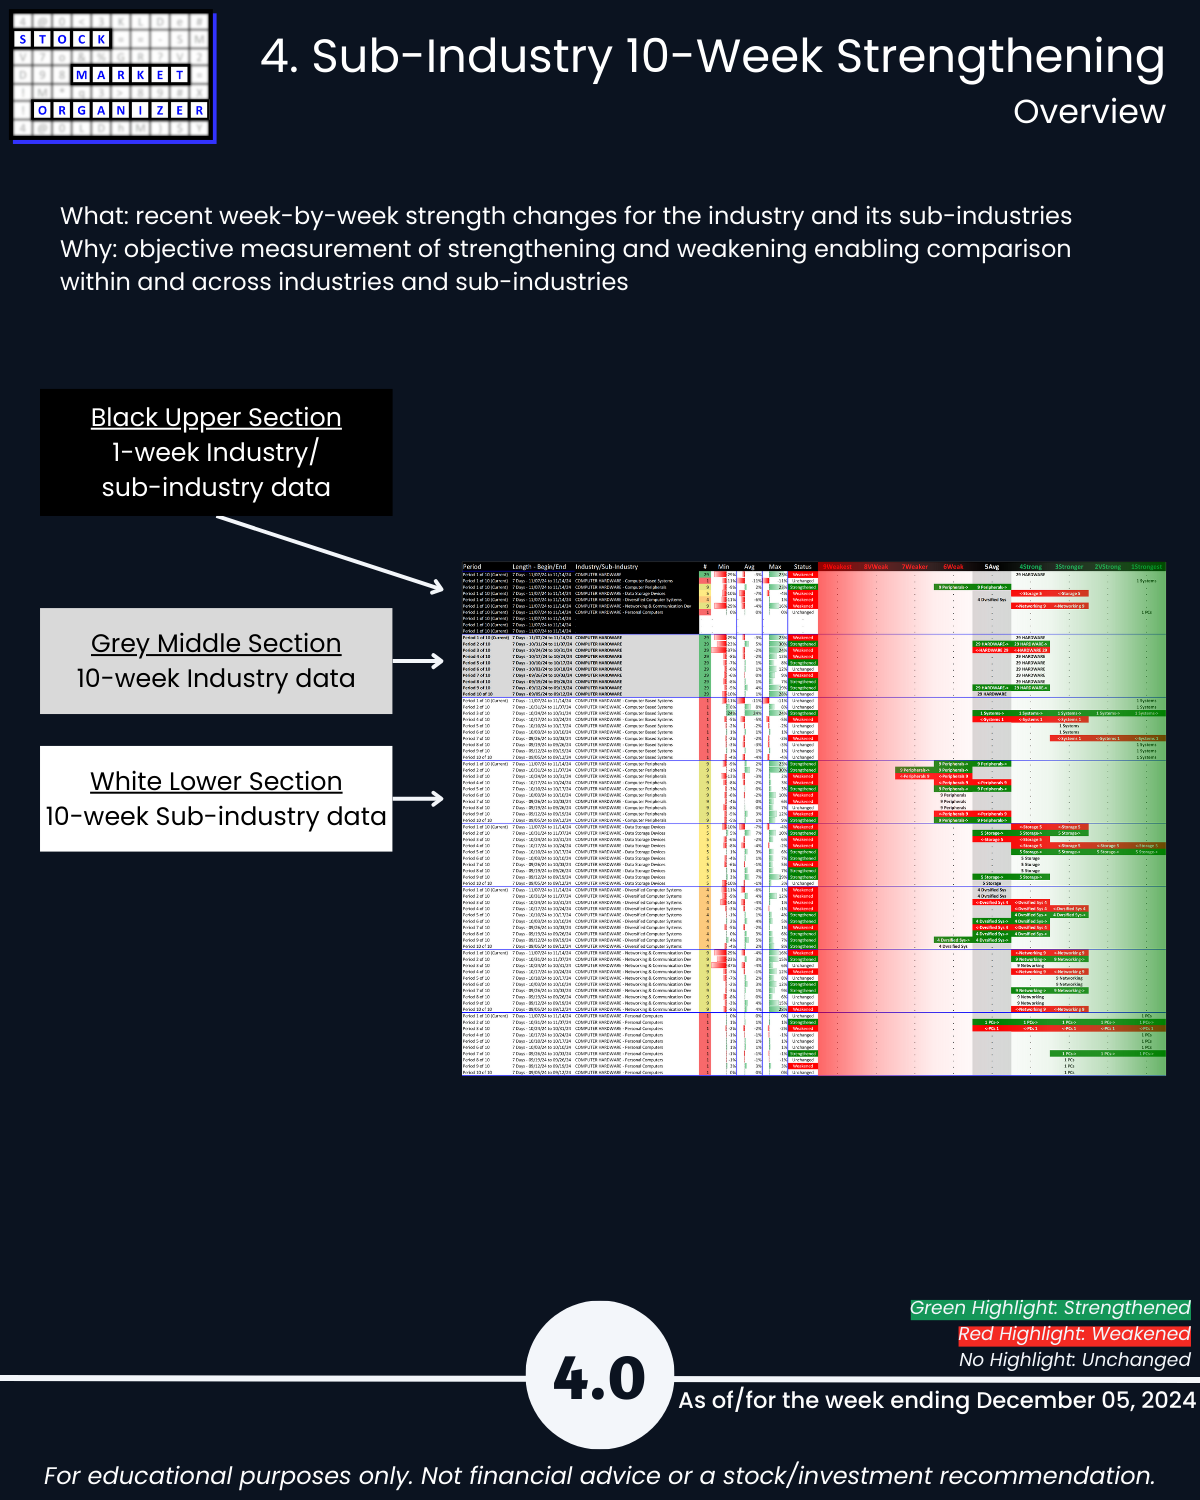
4. Sub-Industry 10-Week Strengthening
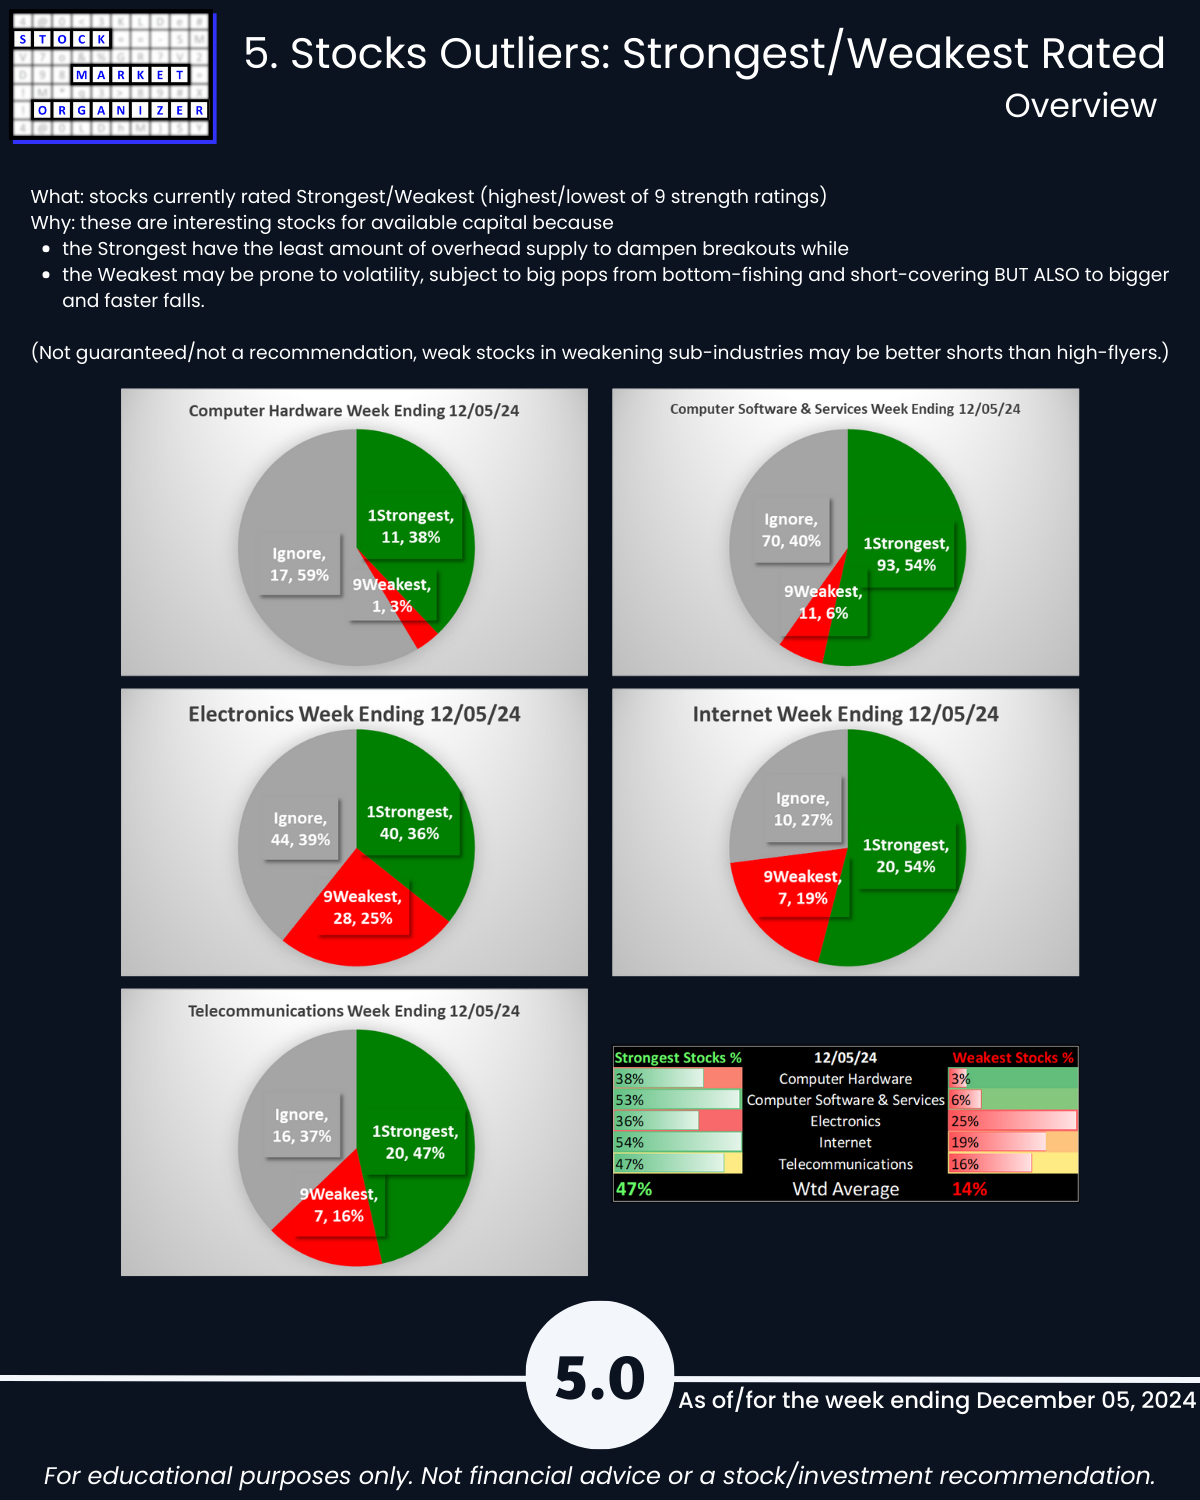
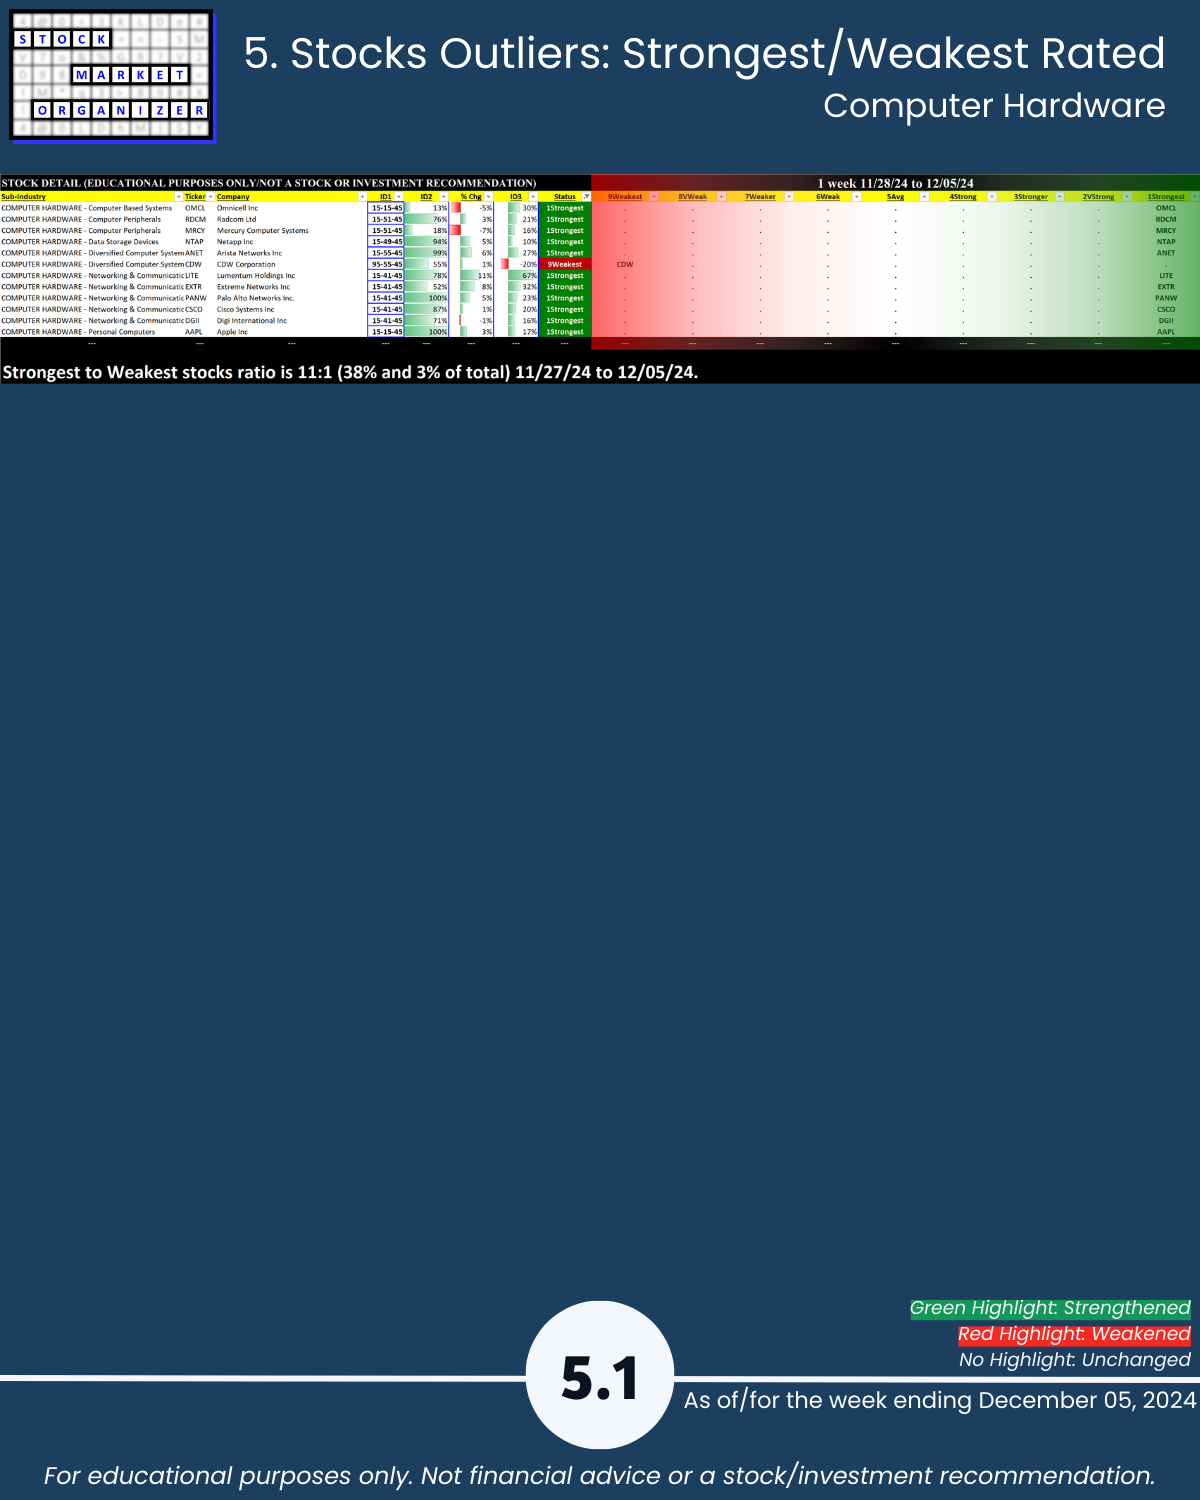
5. Stocks Outliers: Strongest/Weakest Rated
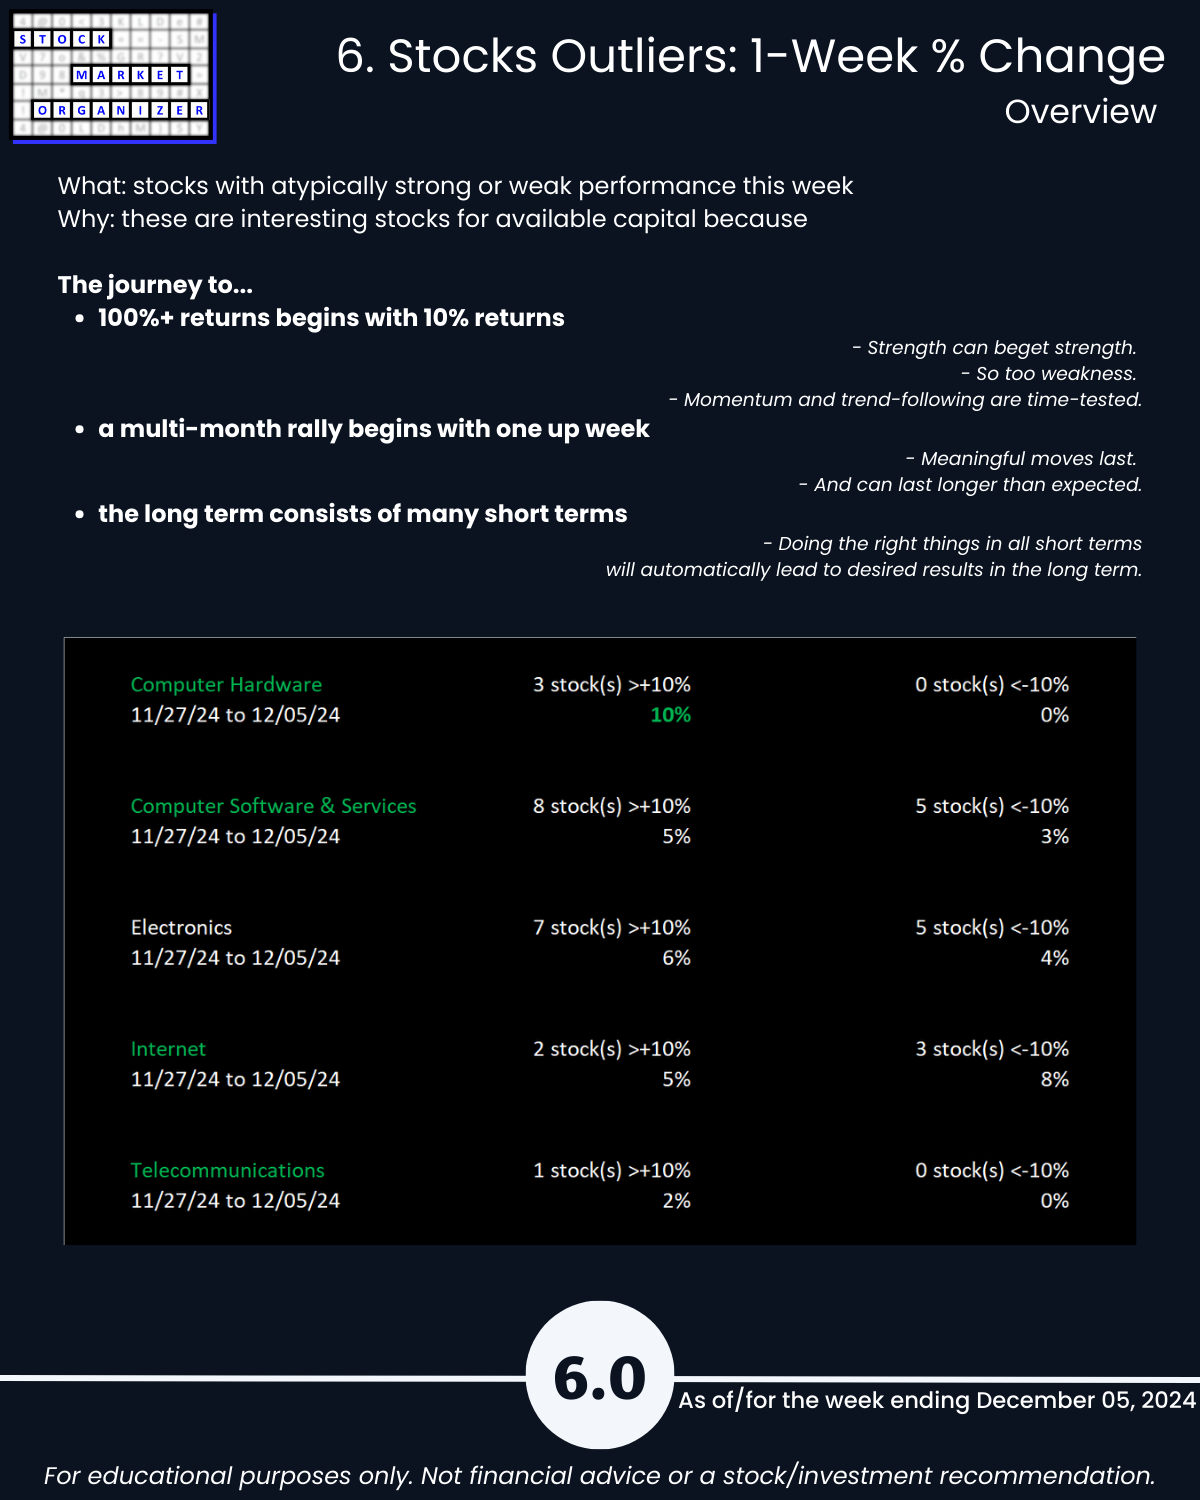
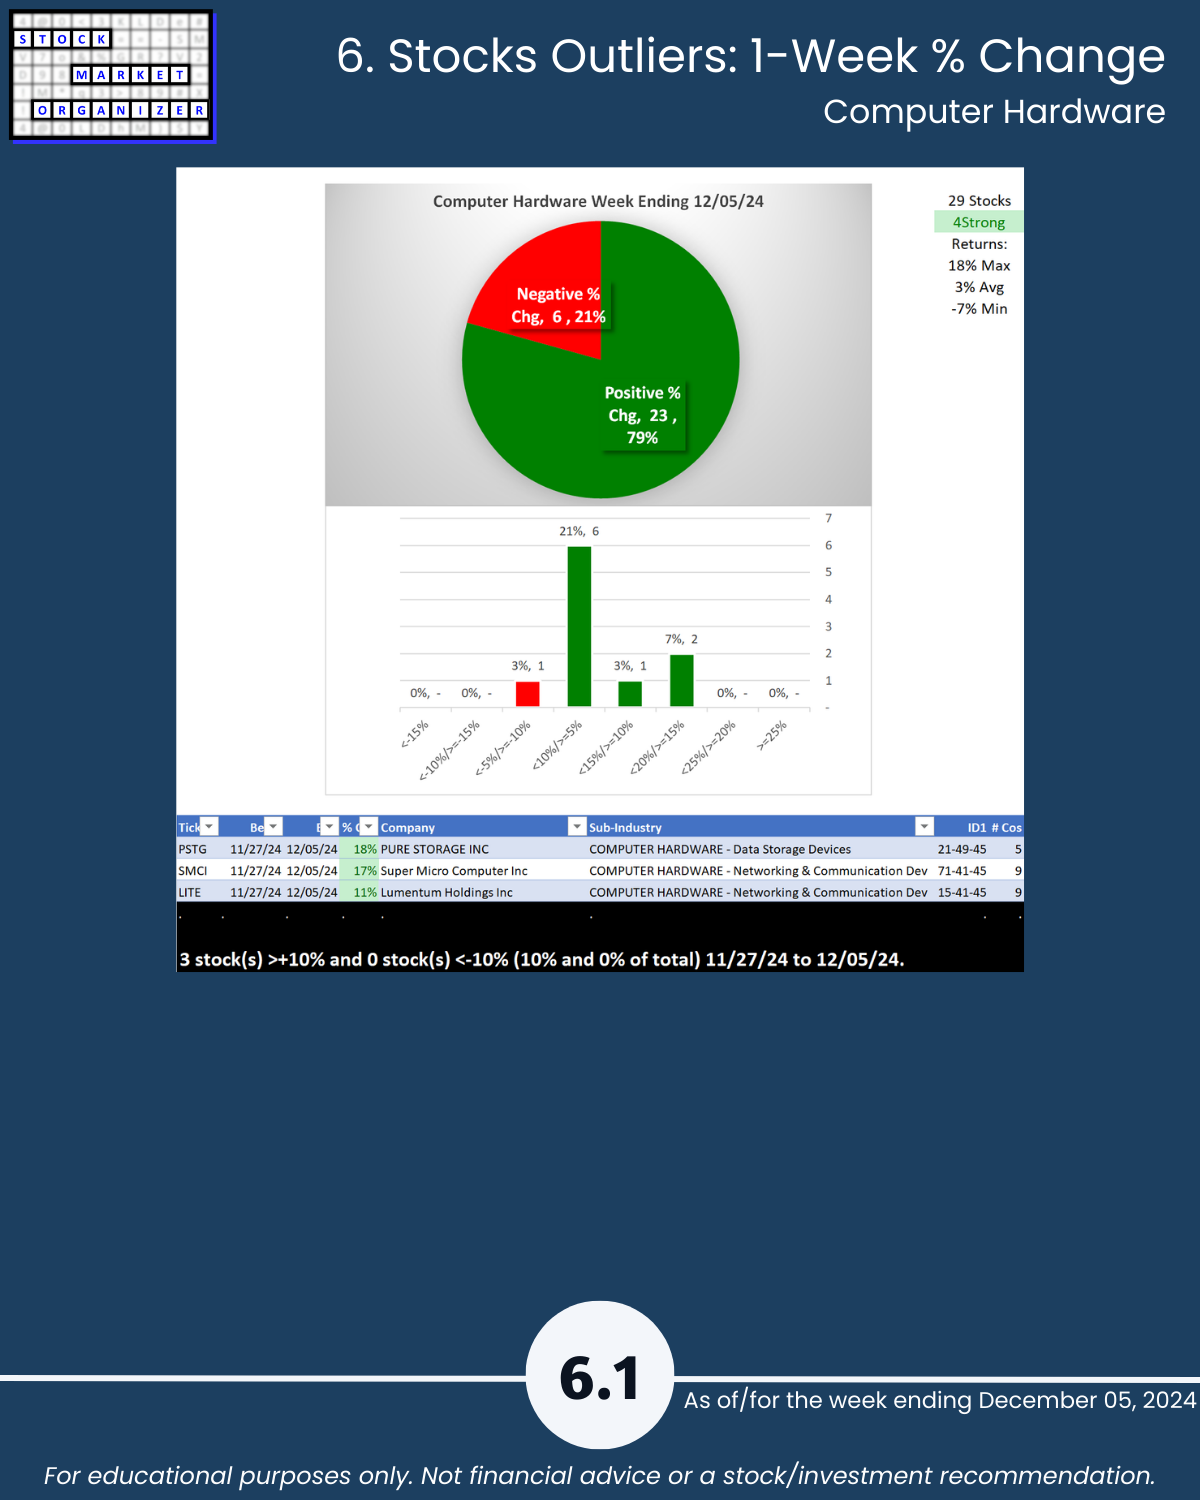
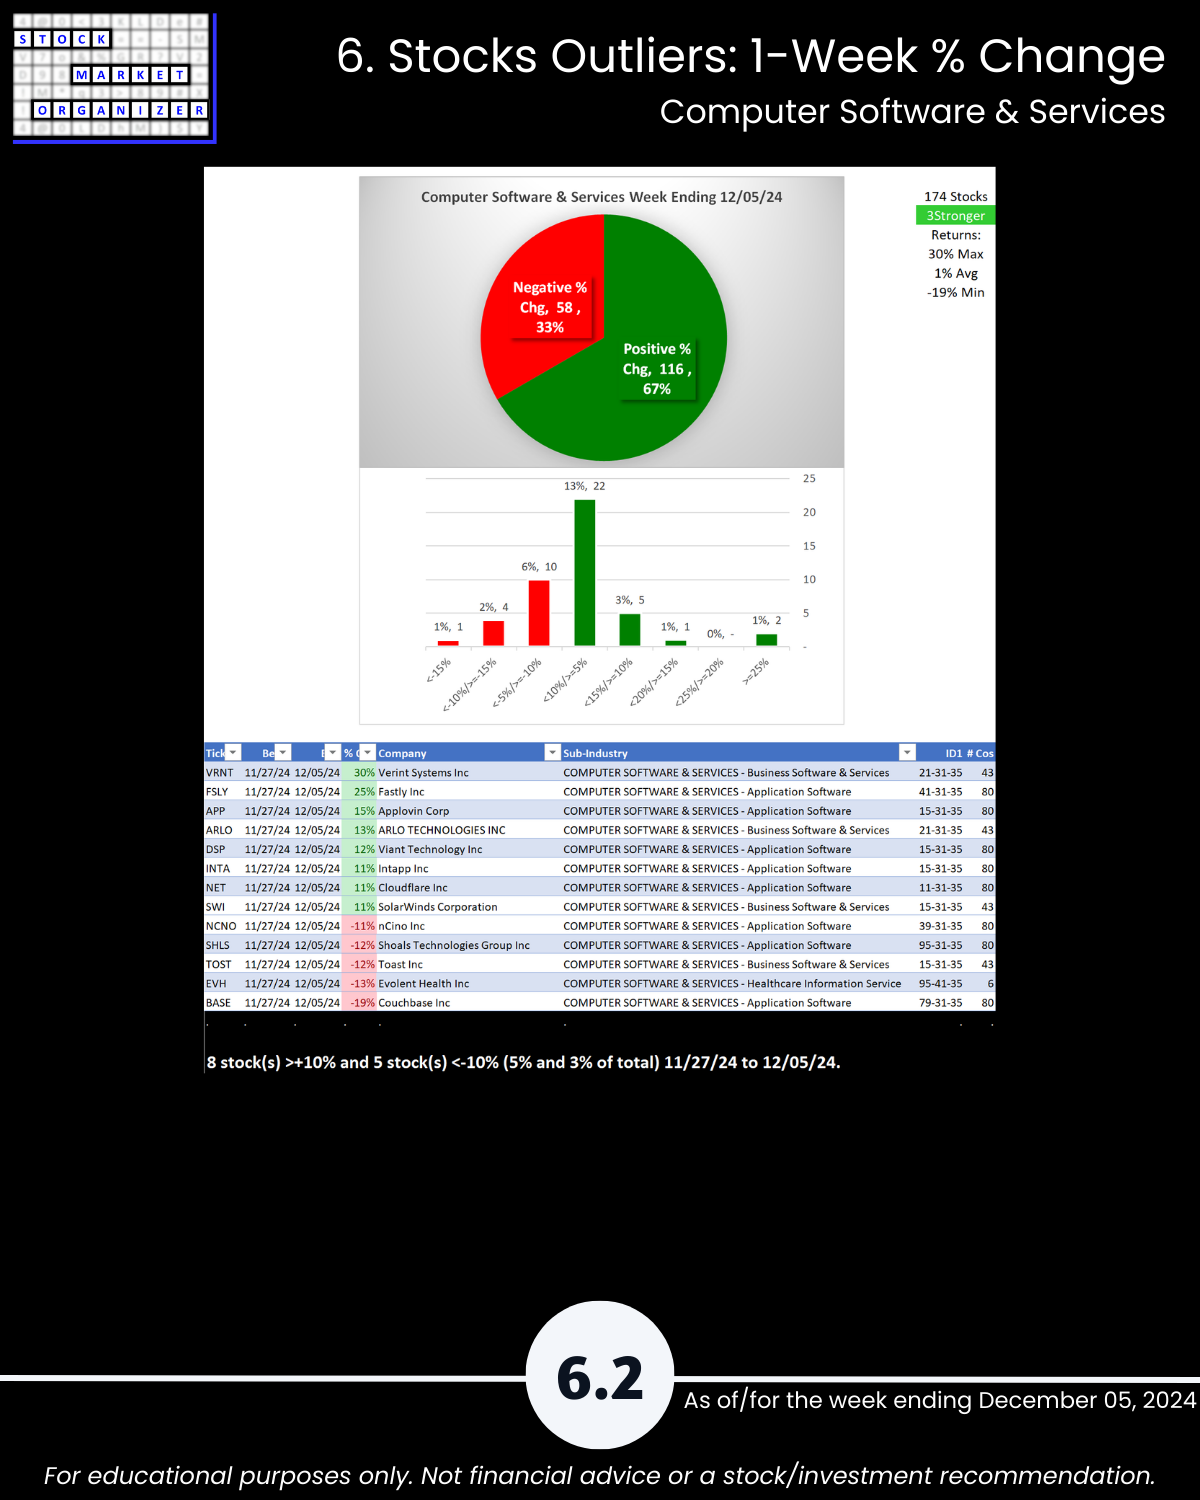
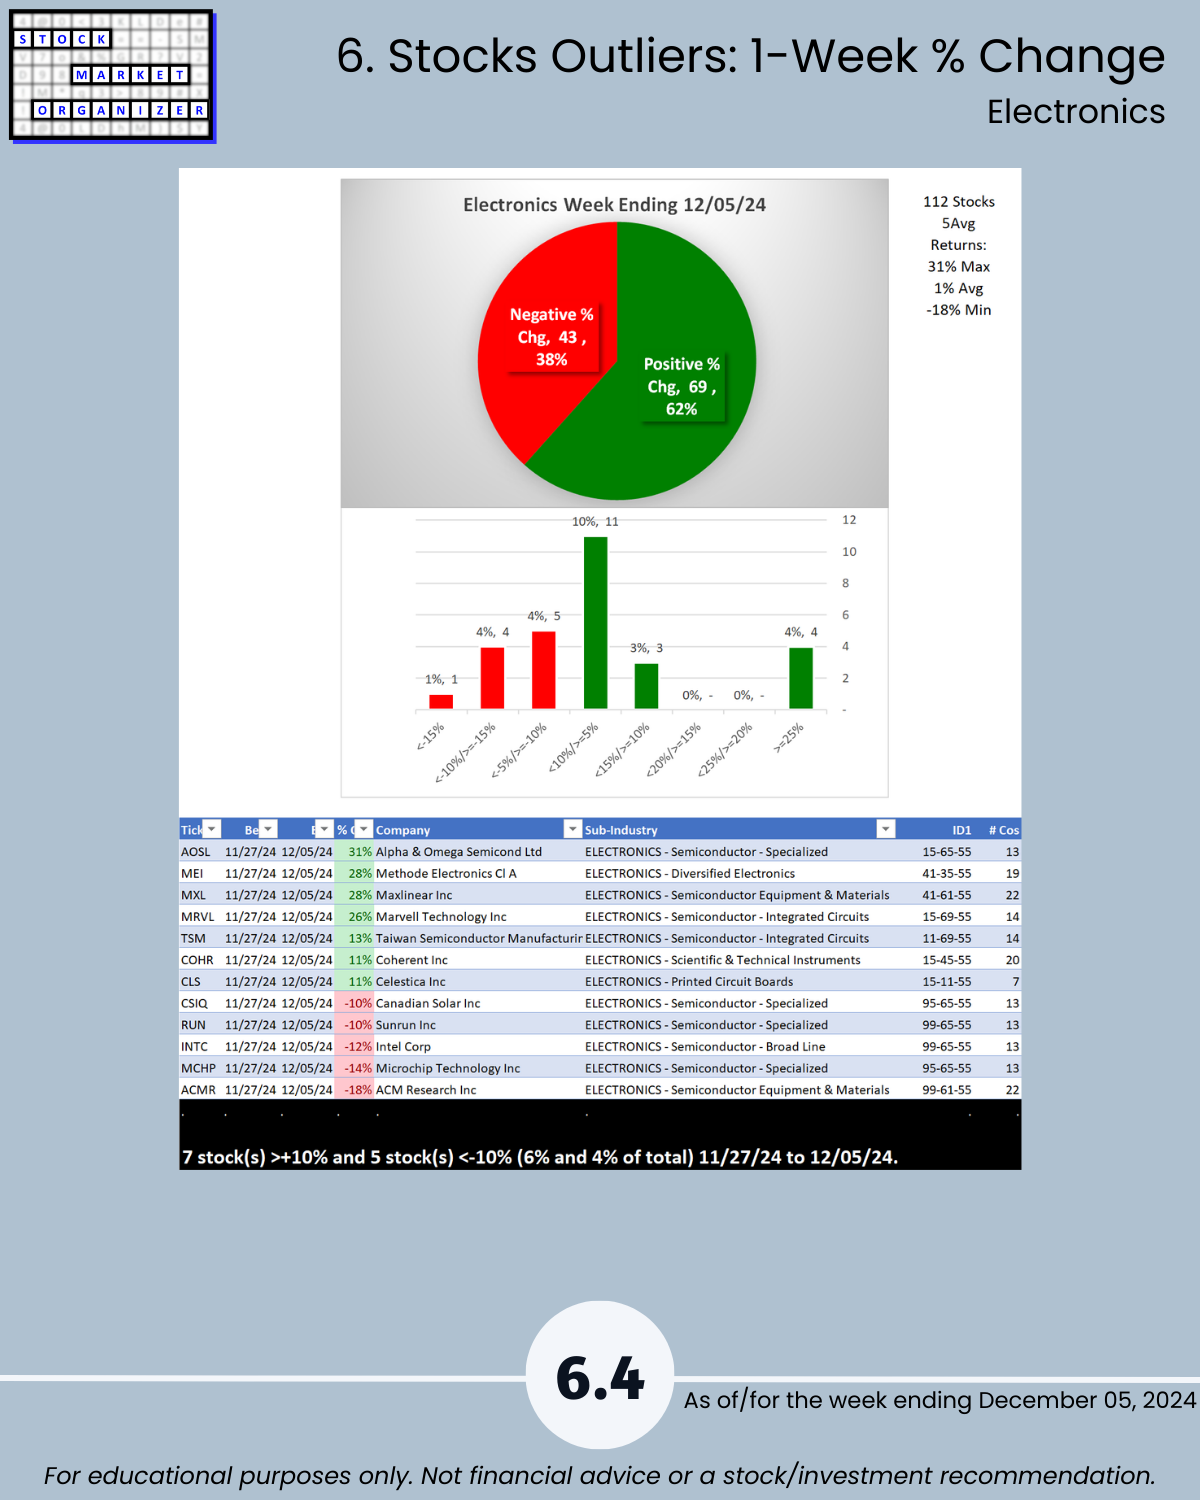
6. Stocks Outliers: 1-Week % Change
7. Stocks Outliers: 5-Year Highs/Lows
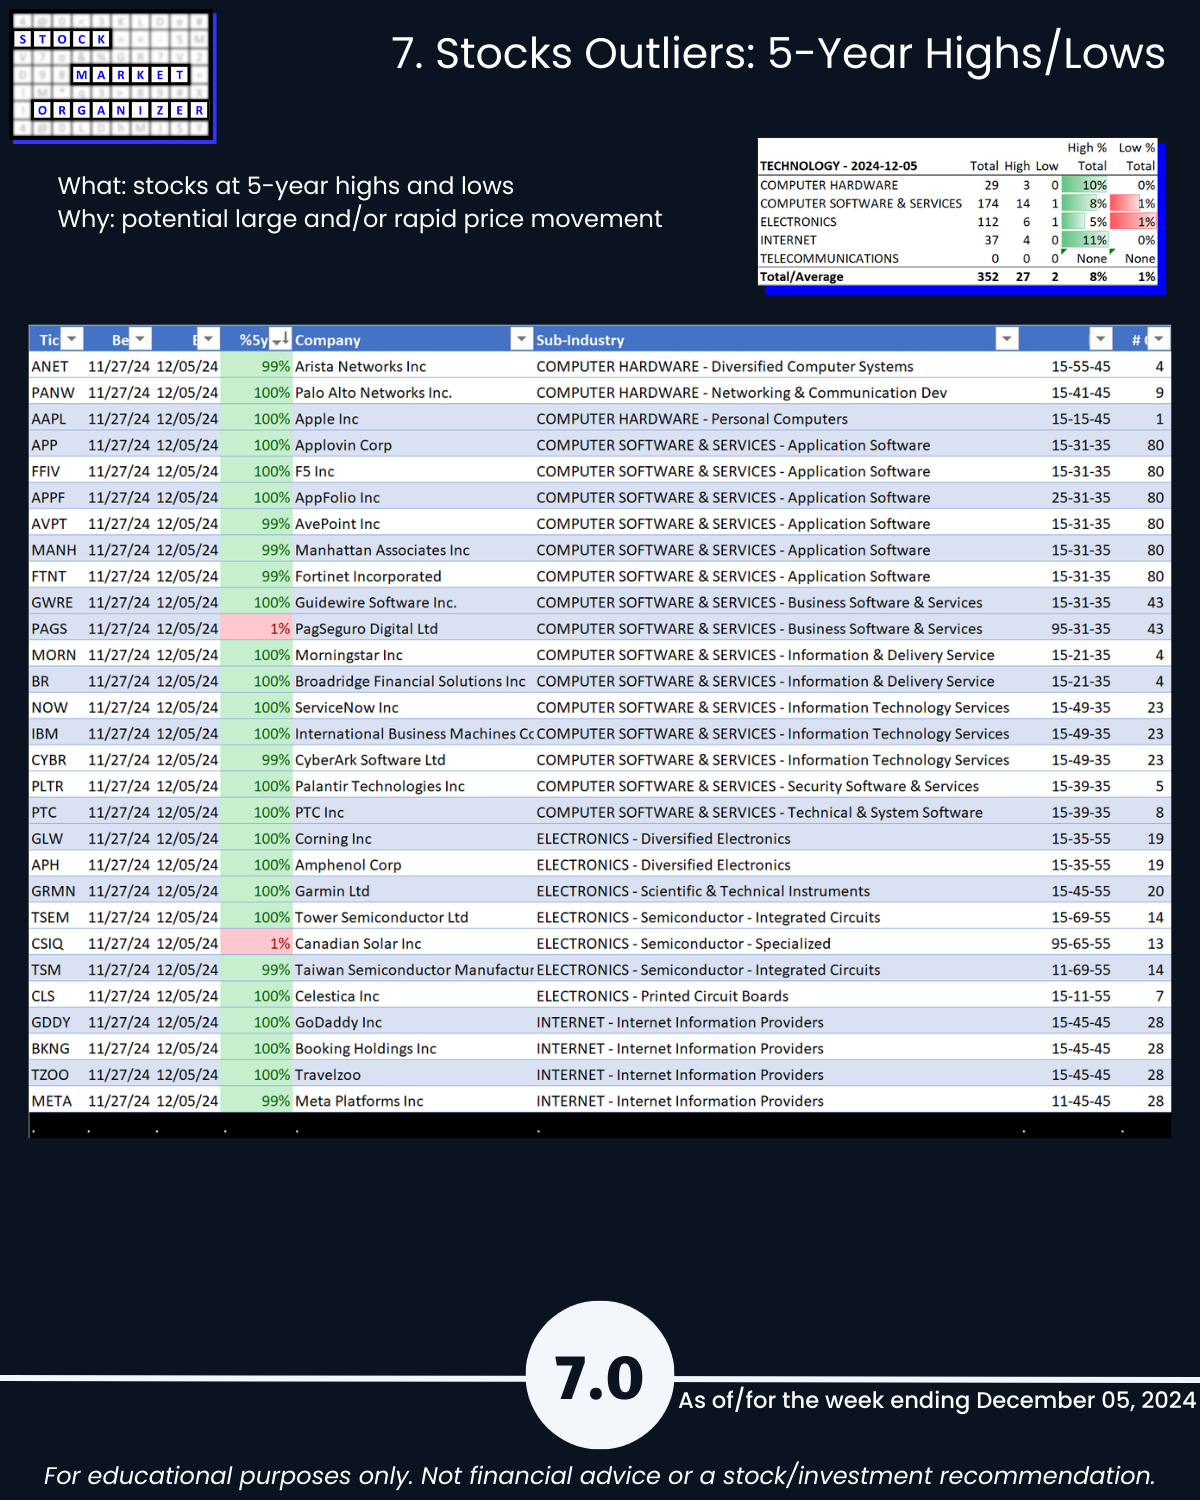
This section shows the strongest of the strong and the weakest of the weak, hitting 5-year highs and lows, respectively. The strongest are the leaders of the market that is hitting new highs. Meanwhile, there appears to be no rational reason to hold weak stocks that are at multi-year lows despite massive market tailwinds.