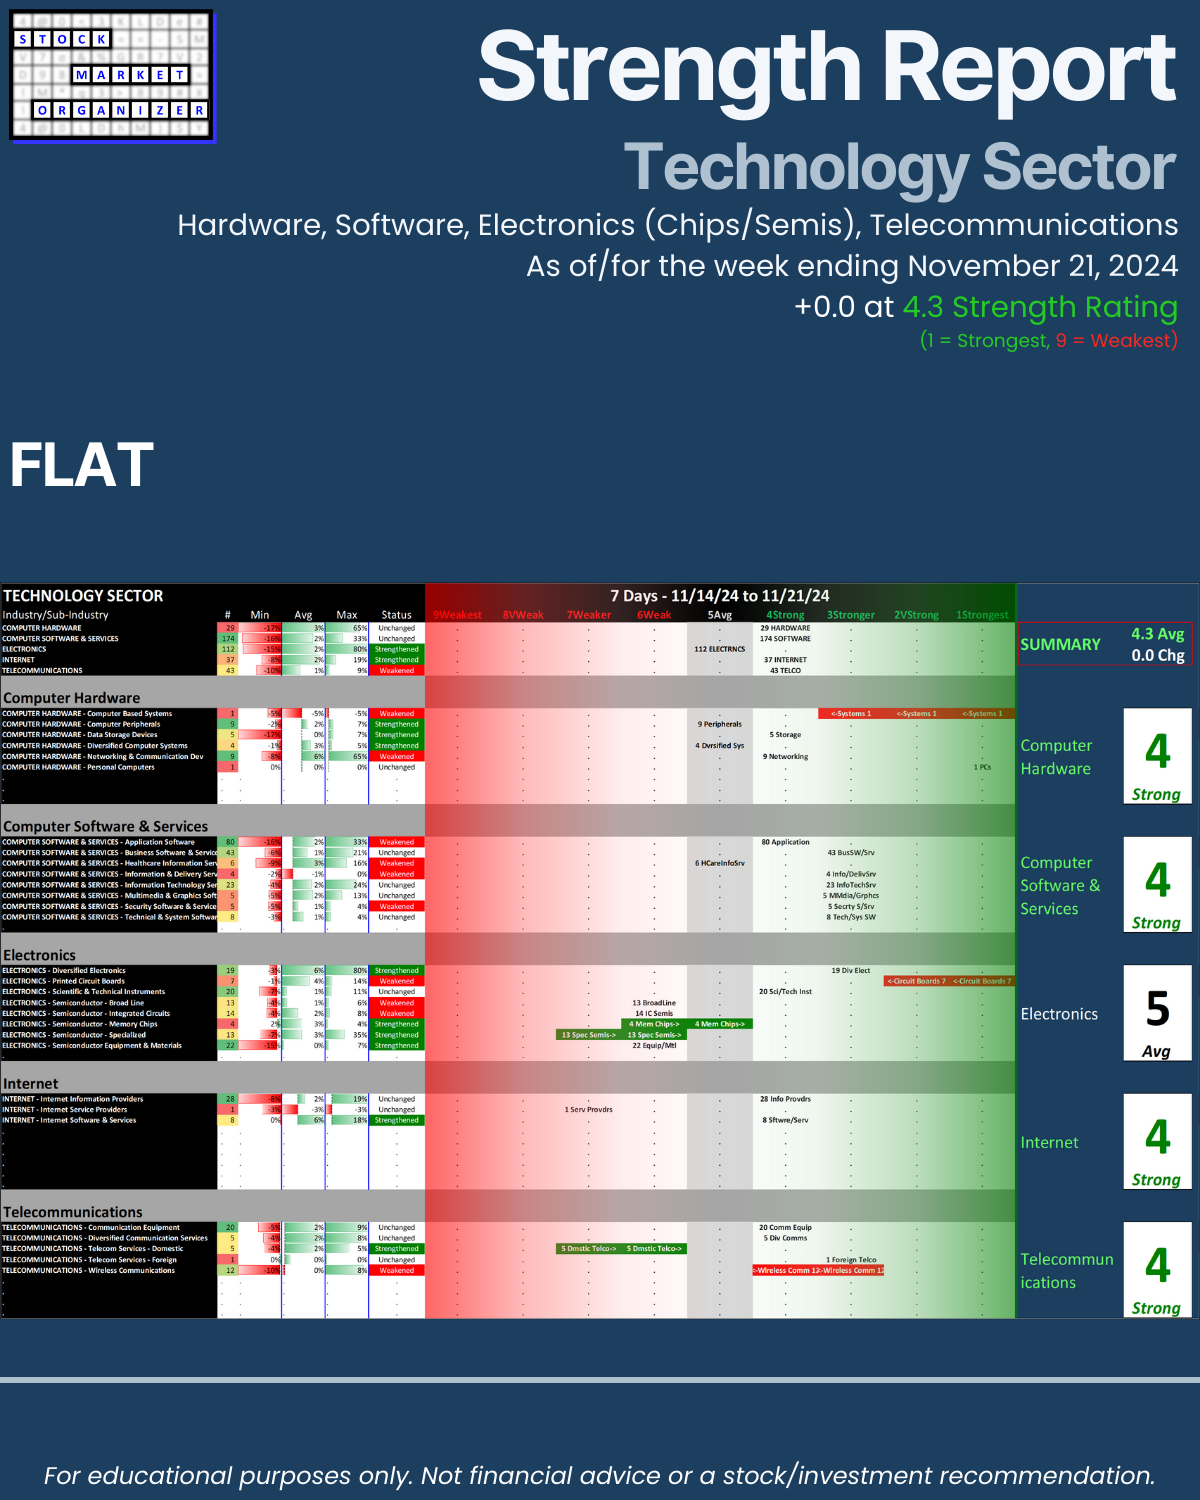
SMO Exclusive: Strength Report Technology Sector 2024-11-21 Unchanged at 4.3 Strength Score
Summary
Technology Sector unchanged with a 4.3 composite score this week.
Compare this to
- 3.1/unchanged for the Financial sector yesterday and
- 4.3/unchanged for Industry Group 1 (Automotive, Energy, Materials & Construction, Metals & Mining, and Transportation) Tuesday.
All three sector/industry groupings are unchanged, with the Financial sector more than one full strength rating ahead of the other two.
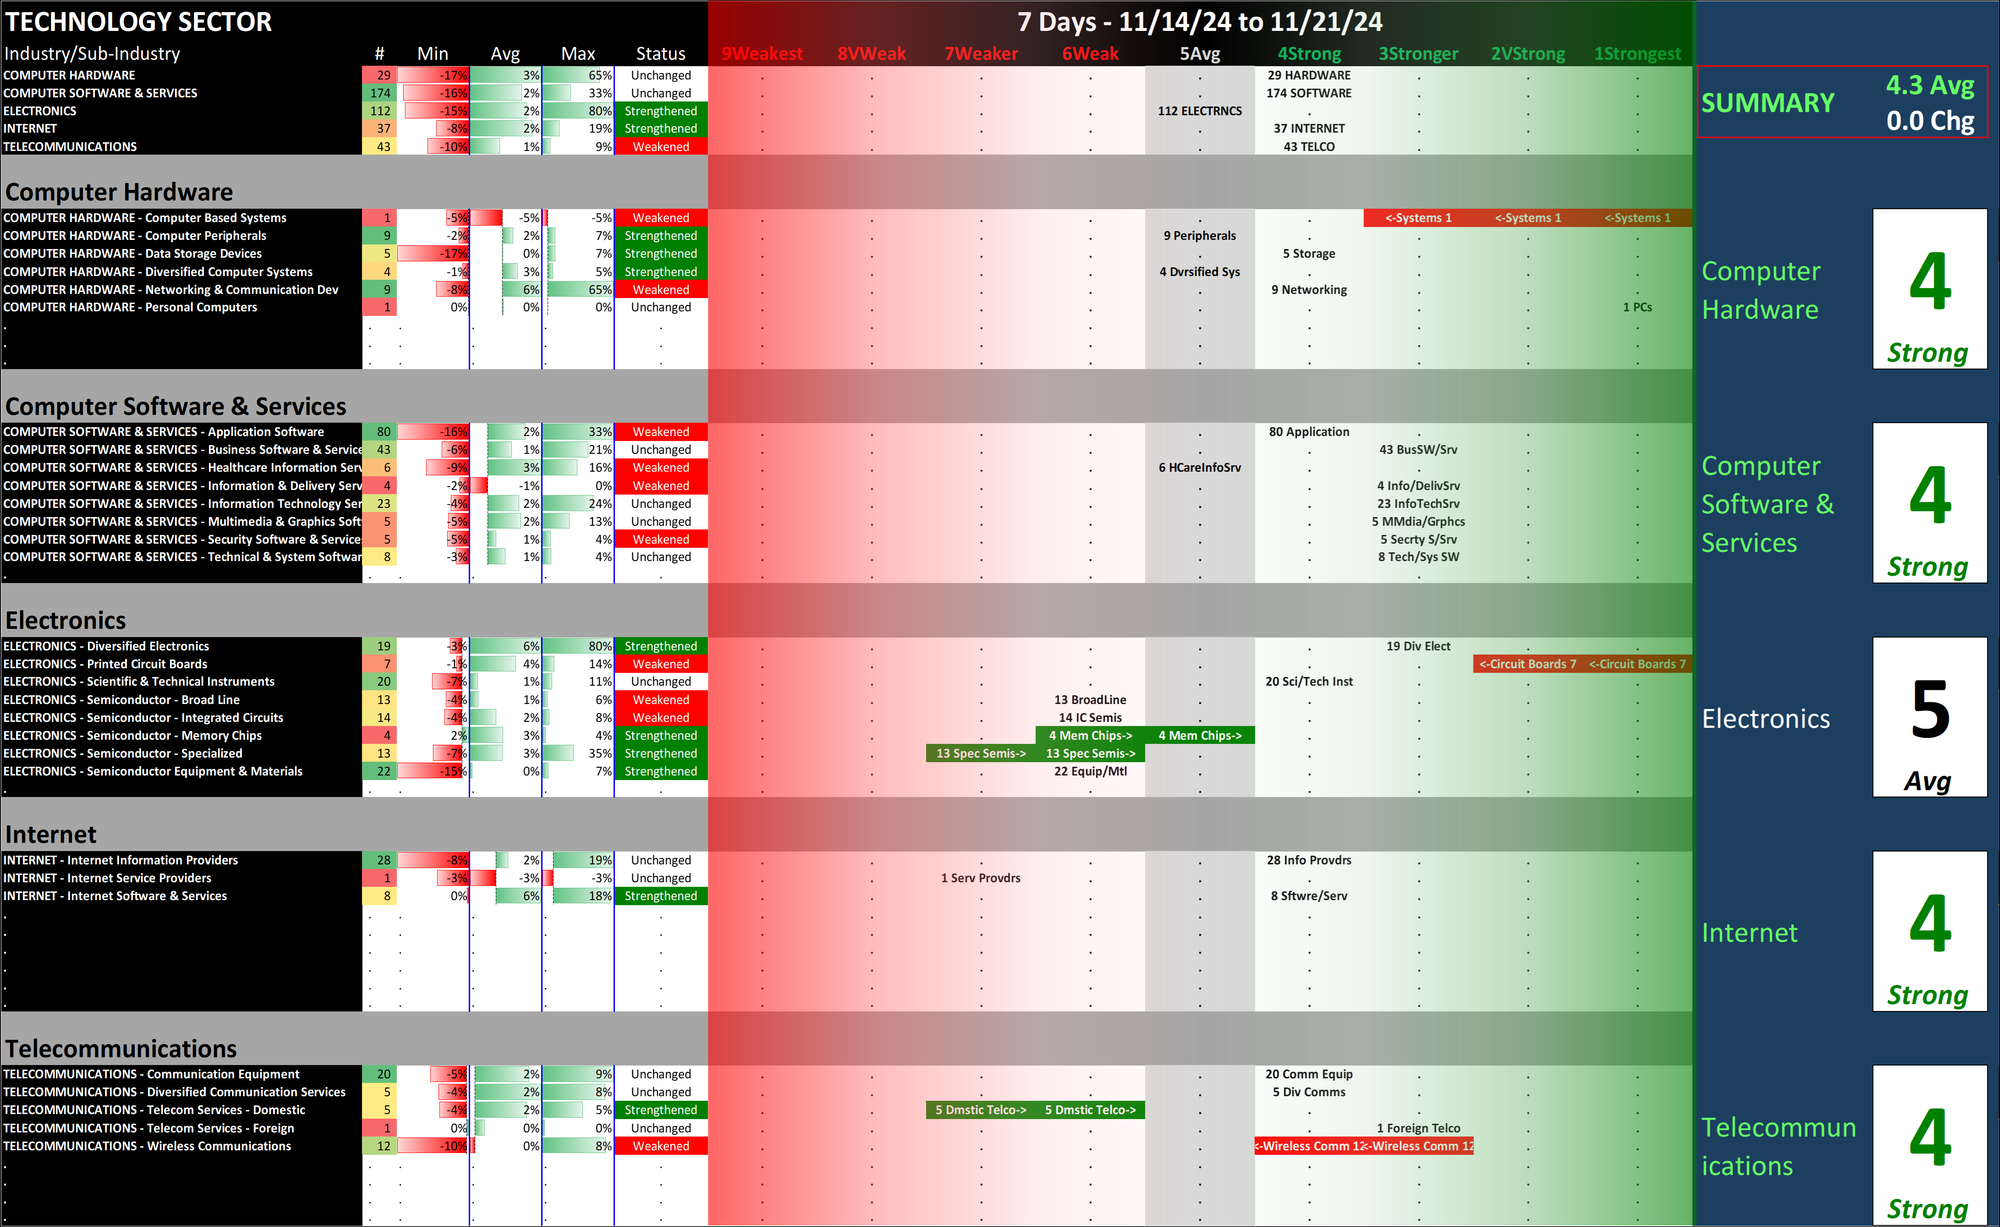
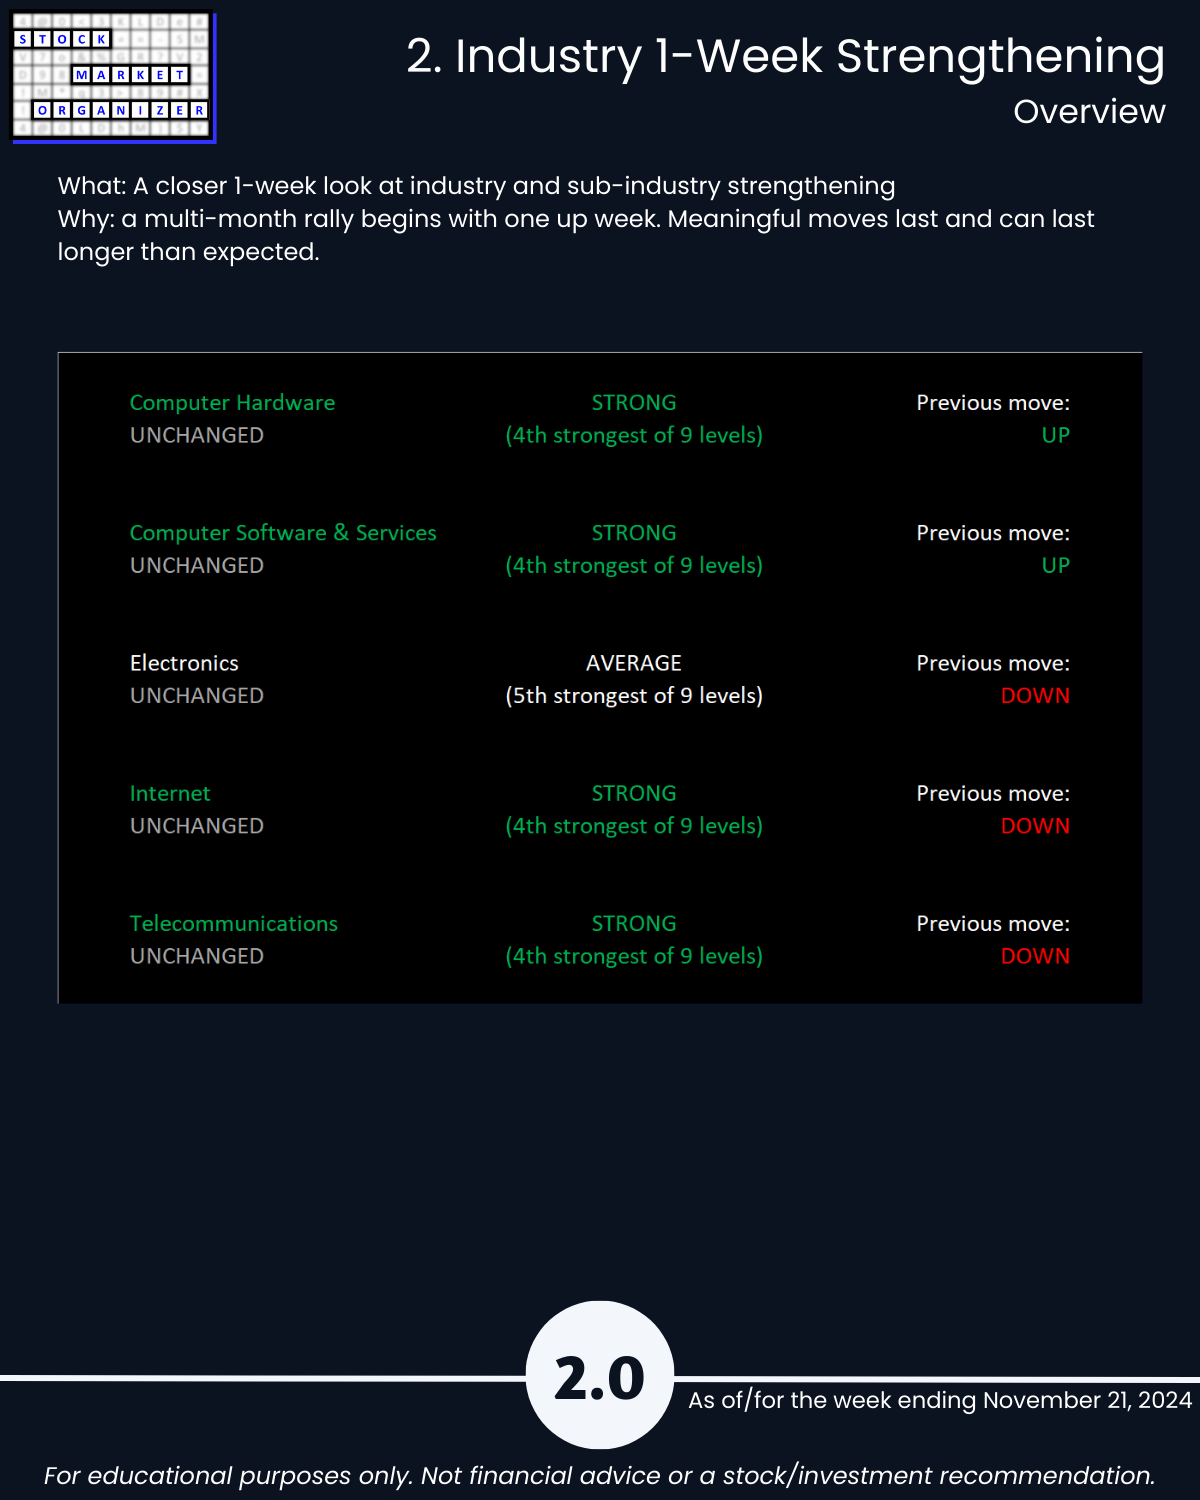
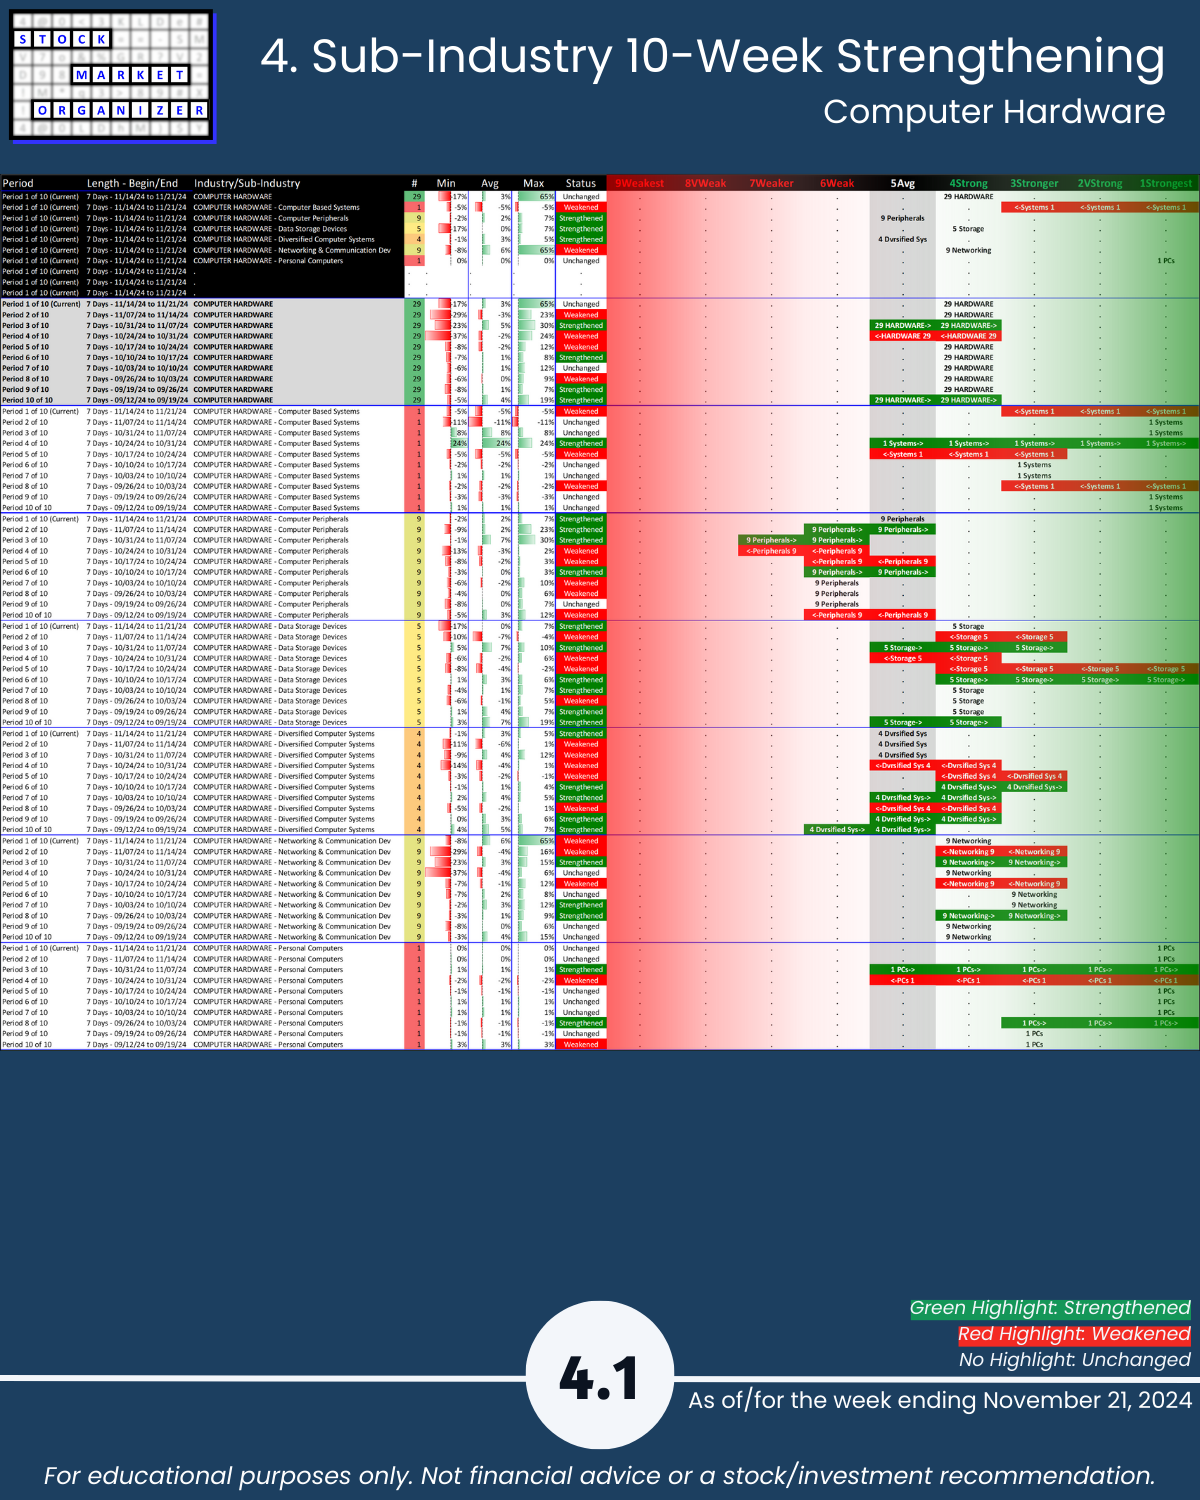
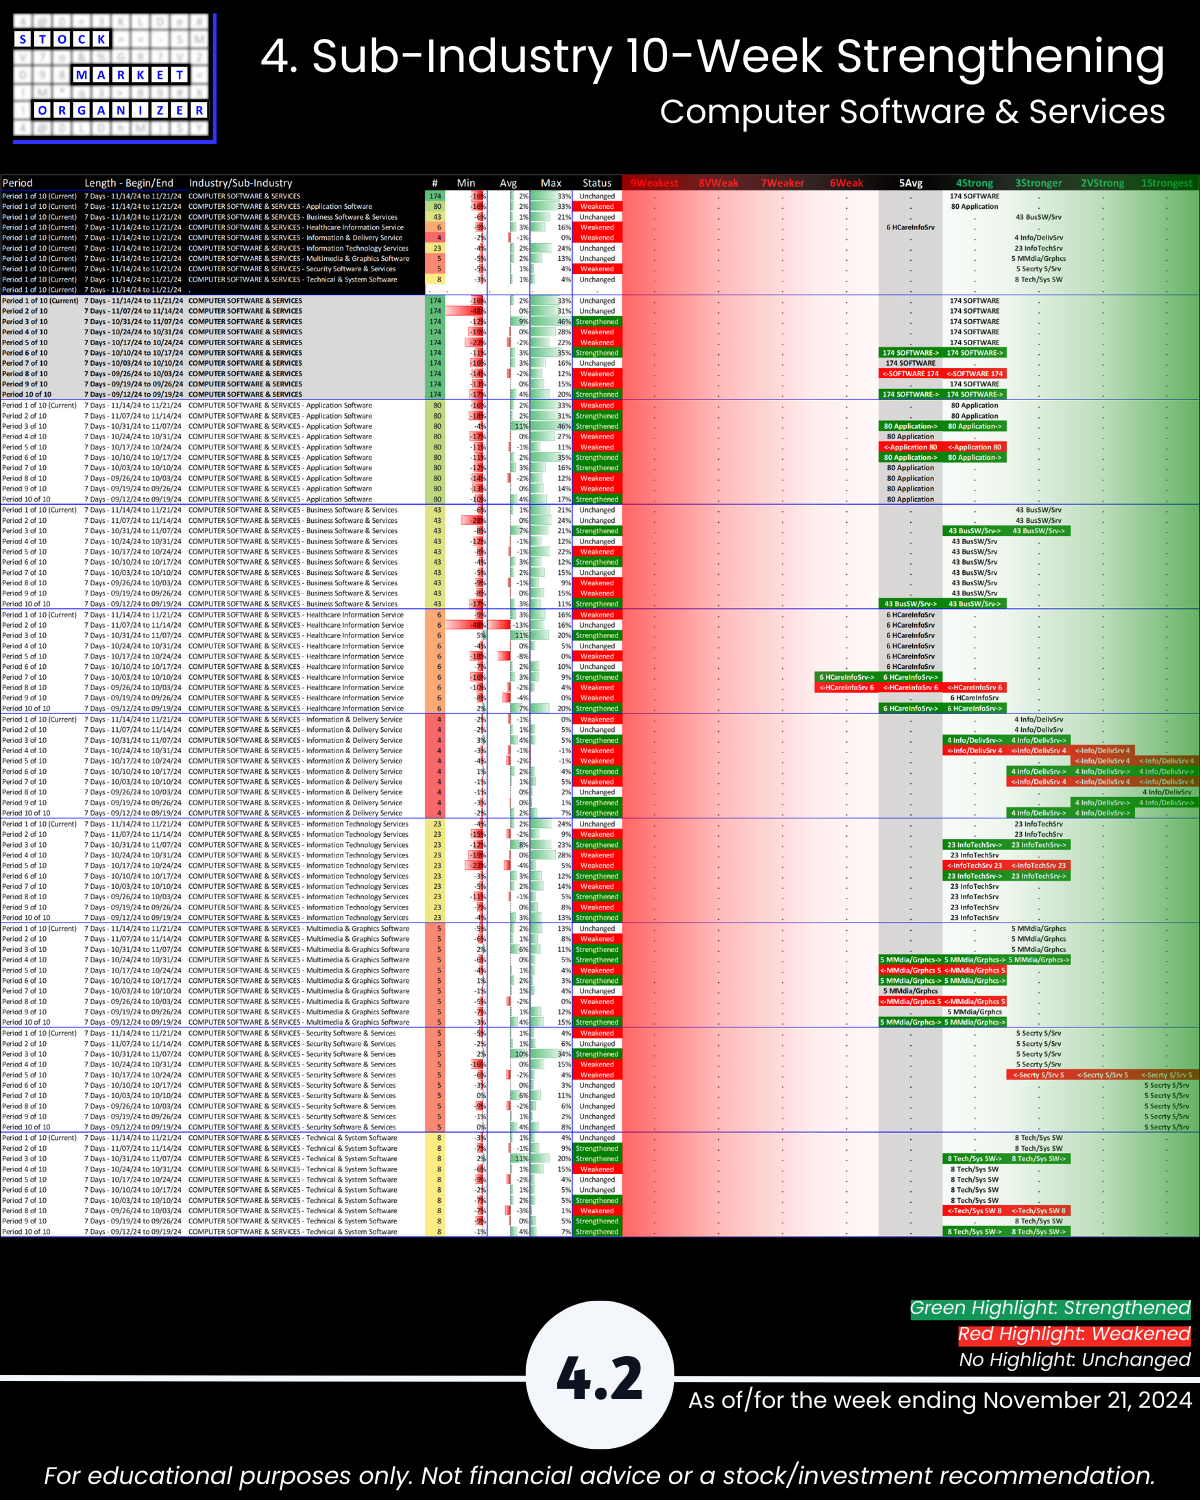
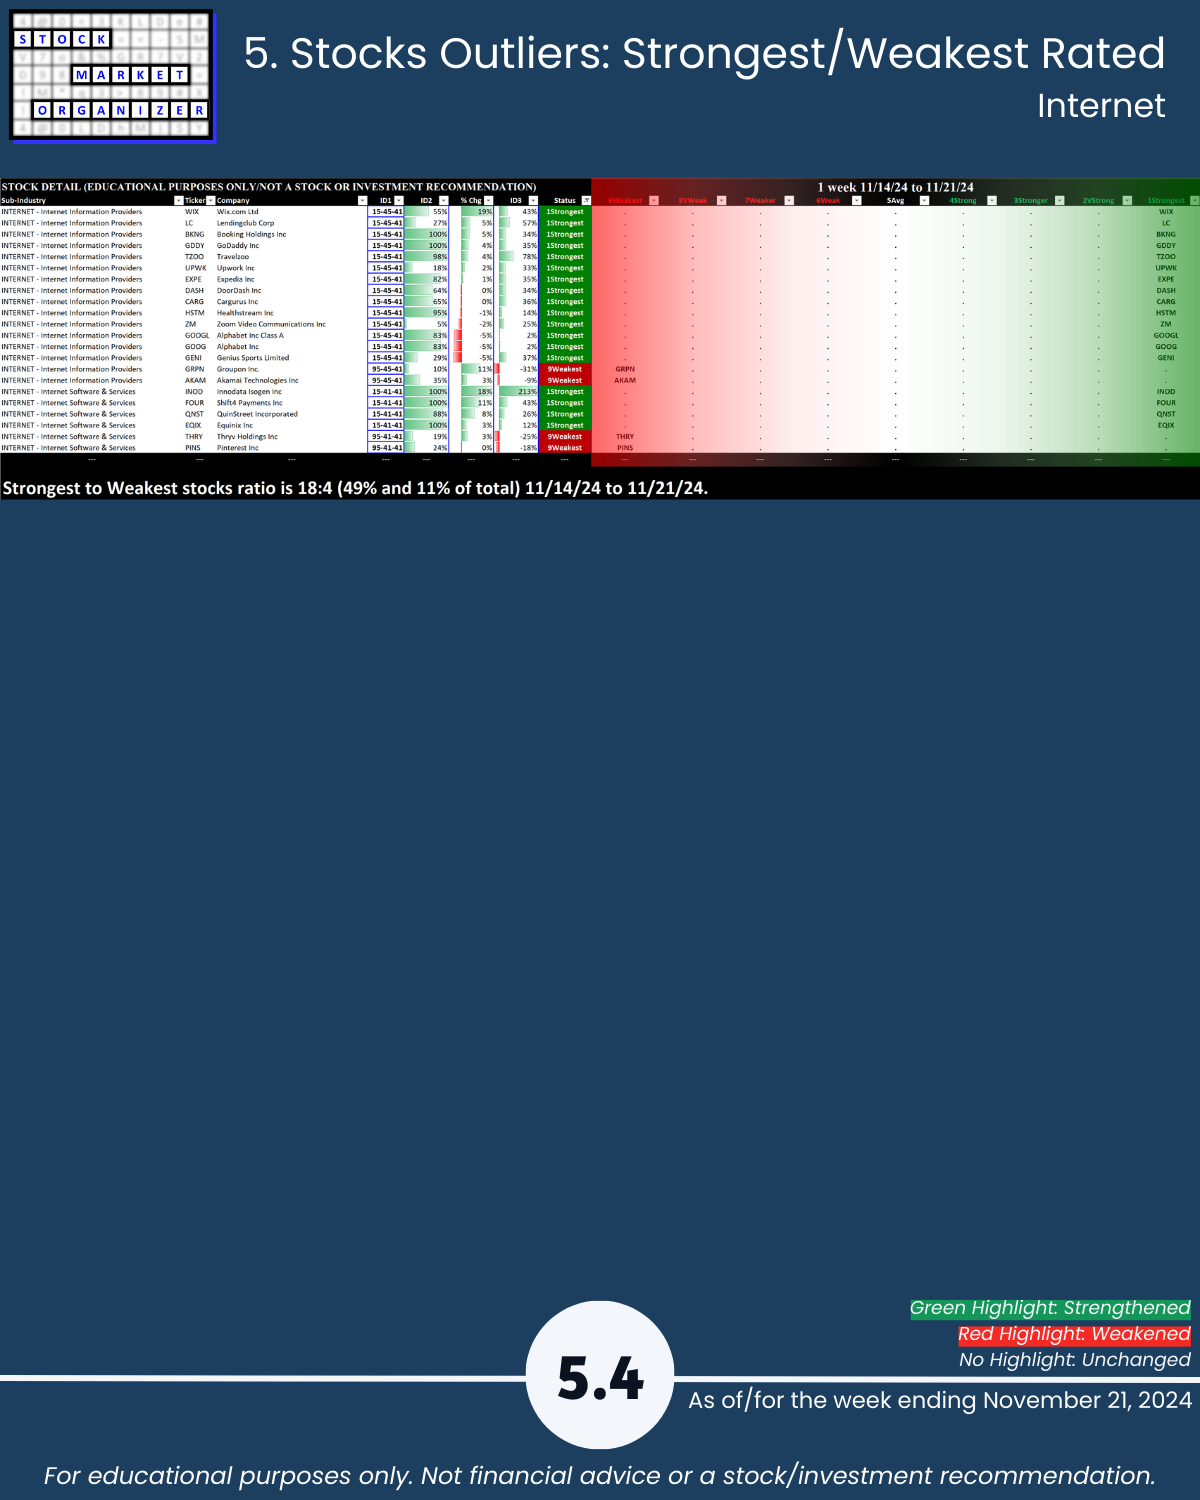
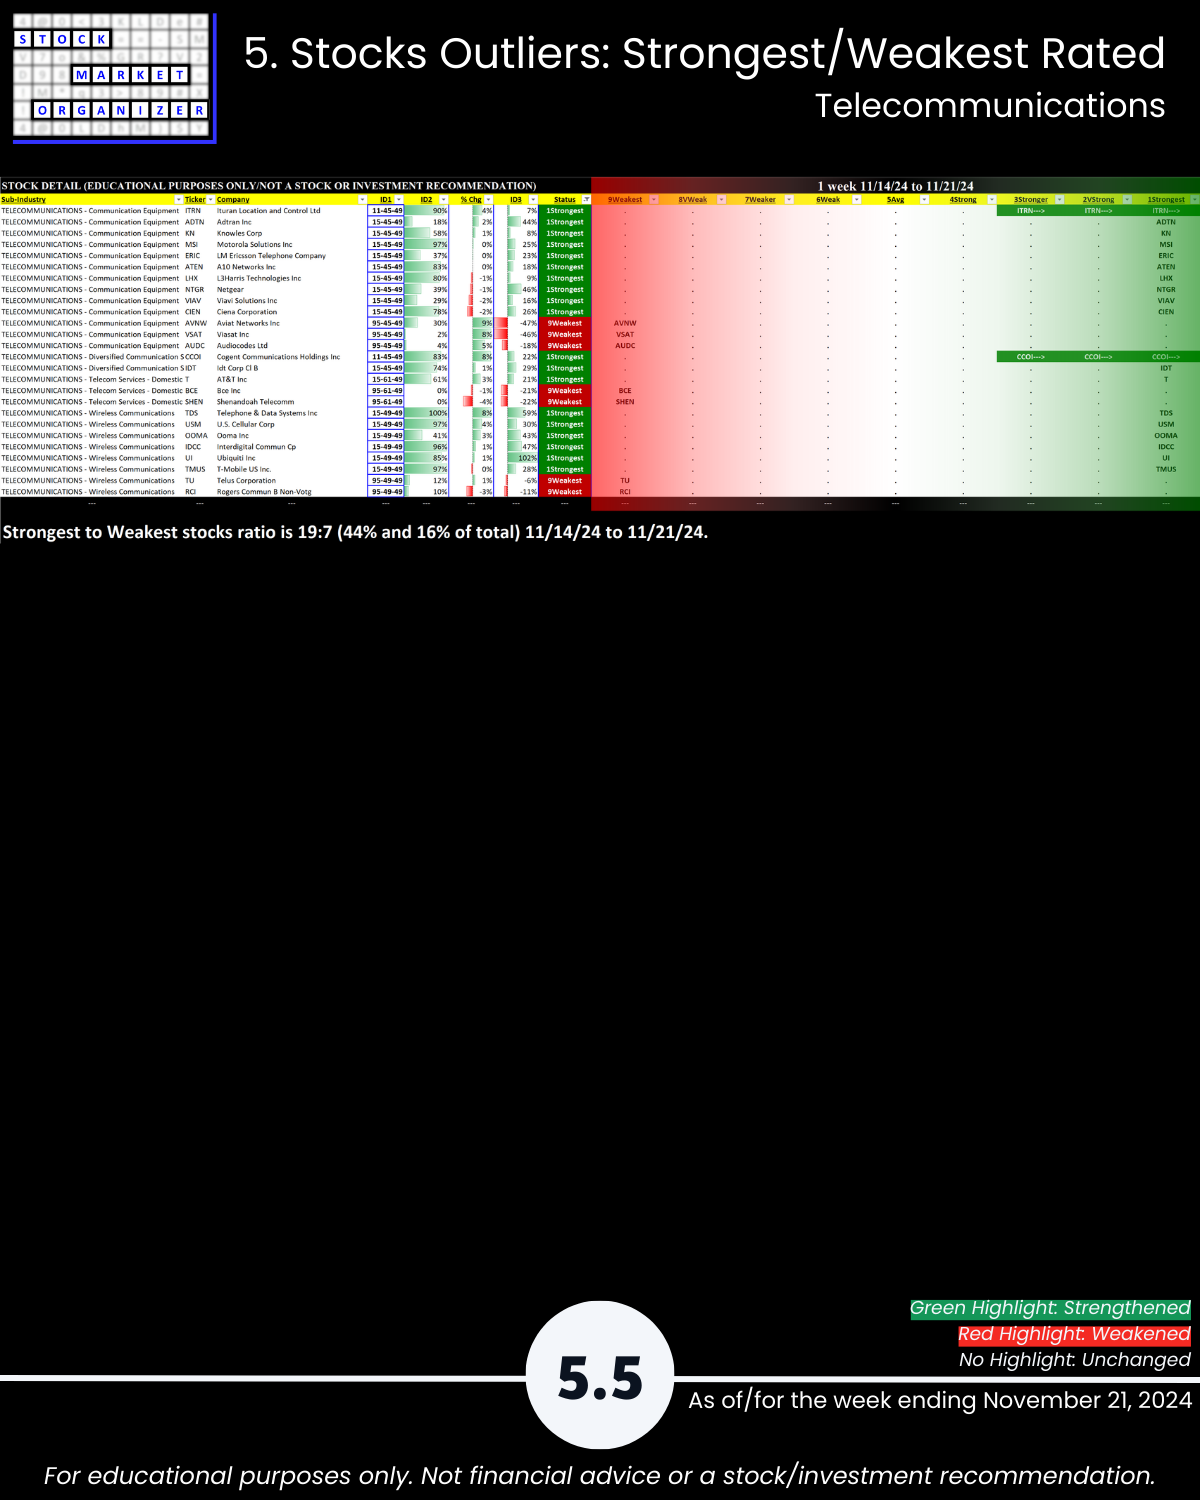
Within Technology, Electronics (Chips/Semis) remained the weakest industry at 5Average. The remaining four industries remained tied at 4Strong: Computer Hardware, Computer Software & Services, Internet, and Telecommunications.
Difference This vs. ETFs Analysis
Note this analysis is the same as that used for the SPDR ETFs but the two main differences are:
1. Universe of stocks. The ETFs are the largest capitalization stocks, 500 of them in the 11 sector ETFs. In this analysis, there are approximately 2,700 stocks.
2. Sub-categorization below the market level. The ETF analysis with 500 stocks is limited to sector strengthening and weakening. This analysis with +/-2,700 stocks can be and is segregated into 29 industry groups and in turn 189 sub-industry groups.
There is a Communications ETF (symbol XLC) which is separate from the Technology ETF (symbol XLK). The Technology sector in this analysis includes Telecommunications with Hardware, Software, Electronics, and Internet.
Per Tuesday's ETF strength analysis, XLC/Communications is rated 3Stronger and XLK/Technology is rated 4Strong. This is generally a match for today's broader analysis covering many more stocks.
How would I interpret and use this information?
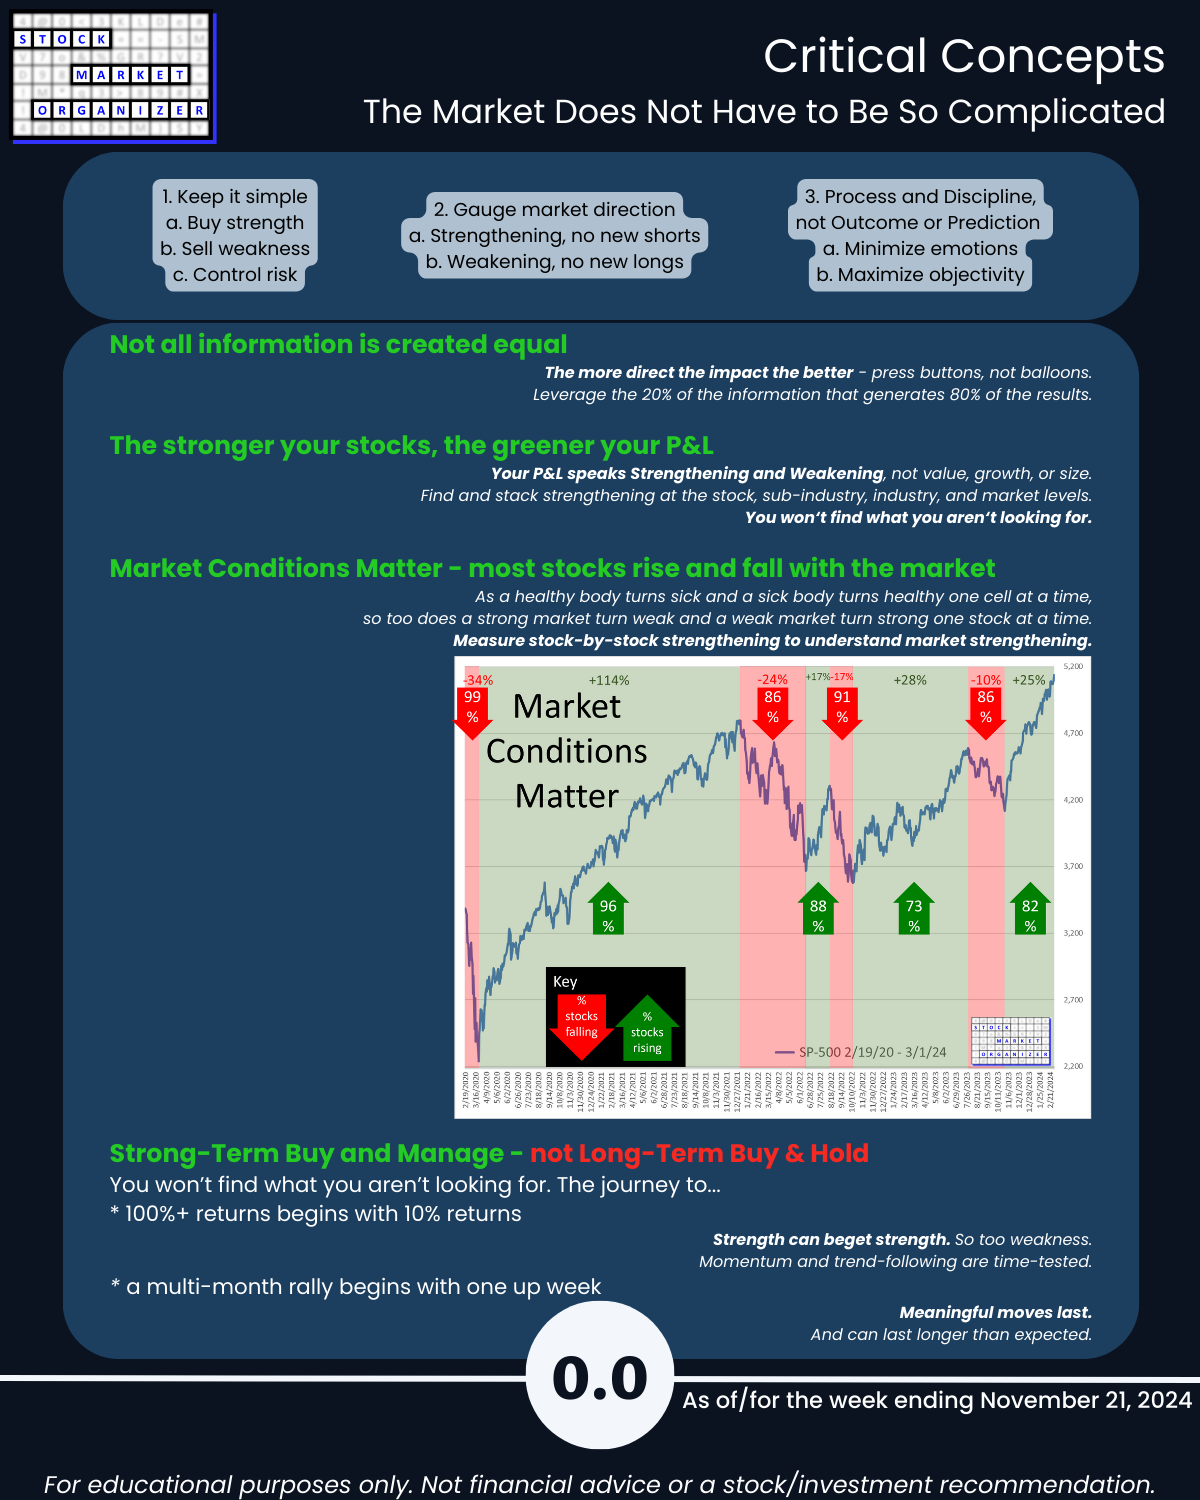
Recognizing that anything can happen at any time and I will never know the reason why until after the fact if ever, I am looking to give myself the best chances of an individual stock going my desired direction by stacking strength going long or stacking weakness going short, depending on strength/strengthening and weakness/weakening at the stock, sub-industry, industry, sector, and market levels.
Current Market and Sector Environment: HEADWIND/Neutral
- MARKET: The Market Strength Score is currently negative = HEADWIND
- By this measure it is not time to aggressively be putting on new long positions. Better entry points may lie ahead. While I am not a stickler for pennies, over many trades and many months these will add up.
- SECTOR: The Technology sector was flat for the week = Neutral
- If at all interested in positions in this sector, it is better to go where there is strength/strengthening - as reflected by price. This Stock Market Organizer methodology explicitly reveals this.
Current Industry/Sub-Industry Environment: mixed
- Electronics industry strengthened but not enough to change rating and stays at 5Average = headwind/neutral
- Memory Chips and Specialized Semis both strengthened rating by one level (this outweighs that they are only 5Average and 6Weak, respectively) = tailwind
- Circuit Boards weakened one level to 2VeryStrong = headwind
- Computer Hardware and Computer Software & Services were unchanged and remained at 4Strong = tailwind/neutral
- Internet strengthened but not enough to change ratings and remains at 4Strong = tailwind/neutral
- Telecommunications weakened but not enough to change ratings and remains at 4Strong = headwind/neutral
- Wireless Communications weakened one strength rating to 4Strong = headwind
Final Comments
There is absolutely no way of determining how long this environment will last. All one can do is find an objective way of measuring whether any given environment offers headwinds or tailwinds and then act accordingly based on these measurements.
Details are below shown in a manner not available elsewhere because I created it from scratch to continually answer this question: “Where is there strengthening and weakening in the market at the stock, sub-industry, industry, and sector levels?” Combine this with the top-down Market Strength Score and Sector Risk Gauge to get a key competitive advantage of understanding strength at every level.
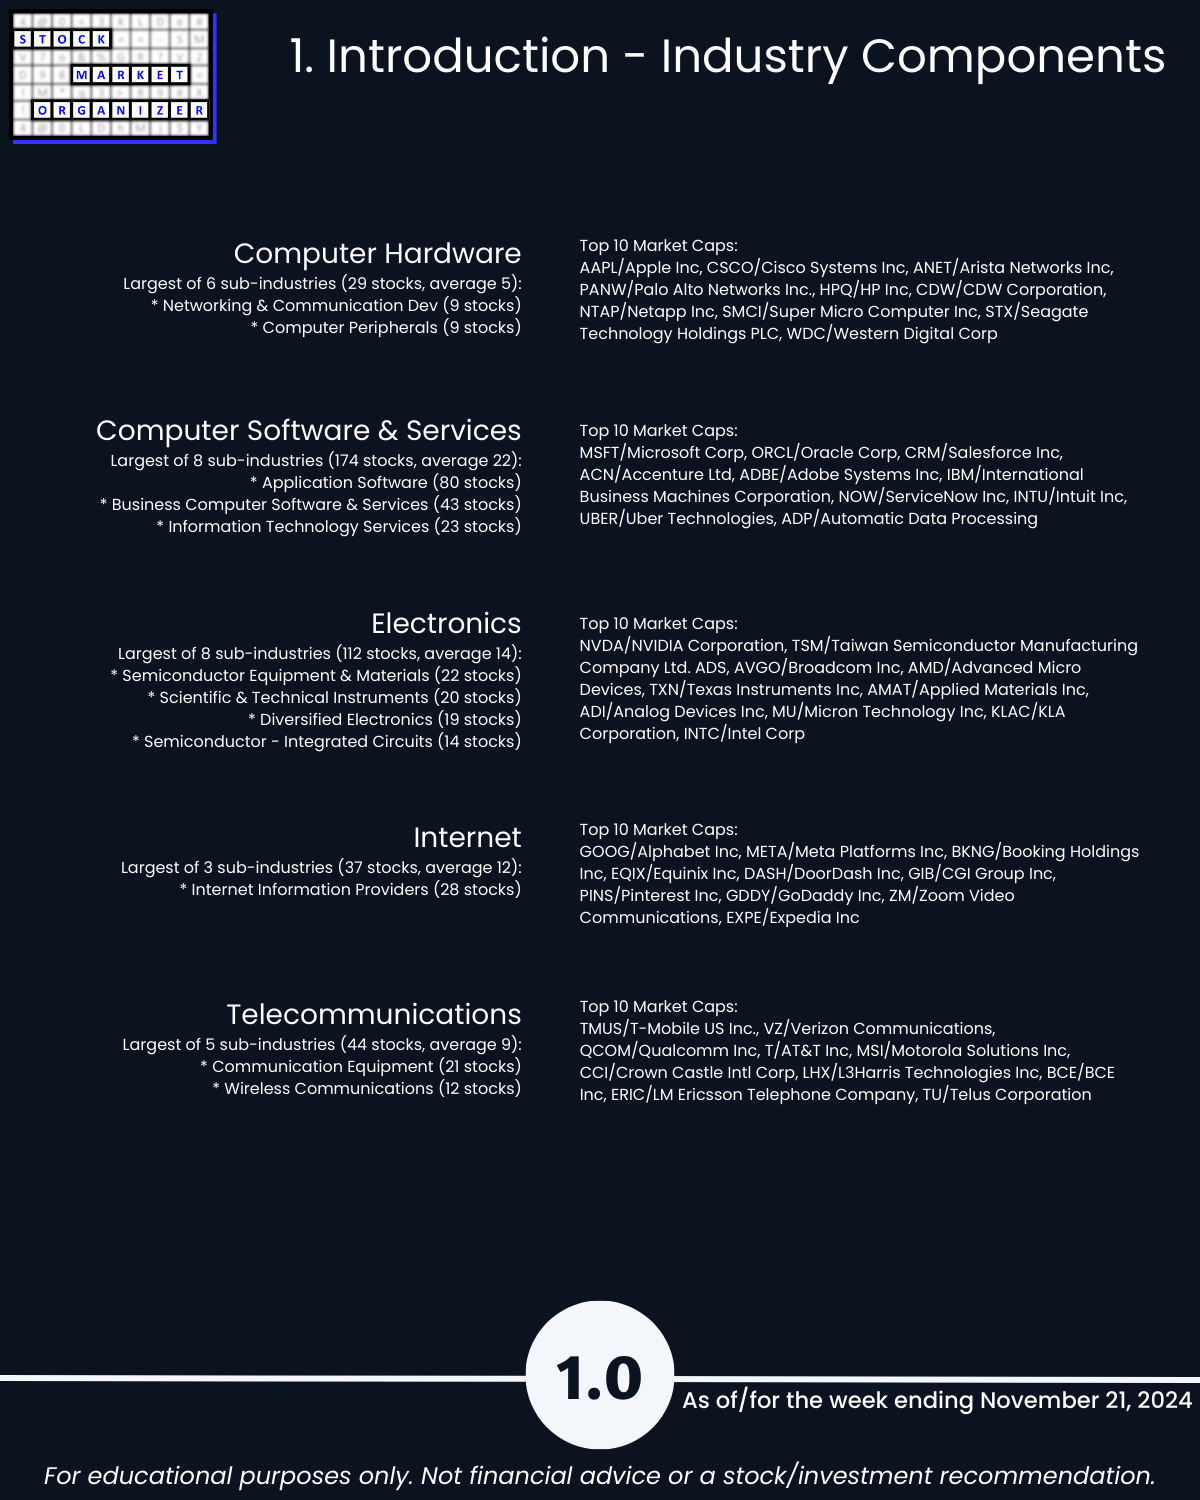
1. Introduction
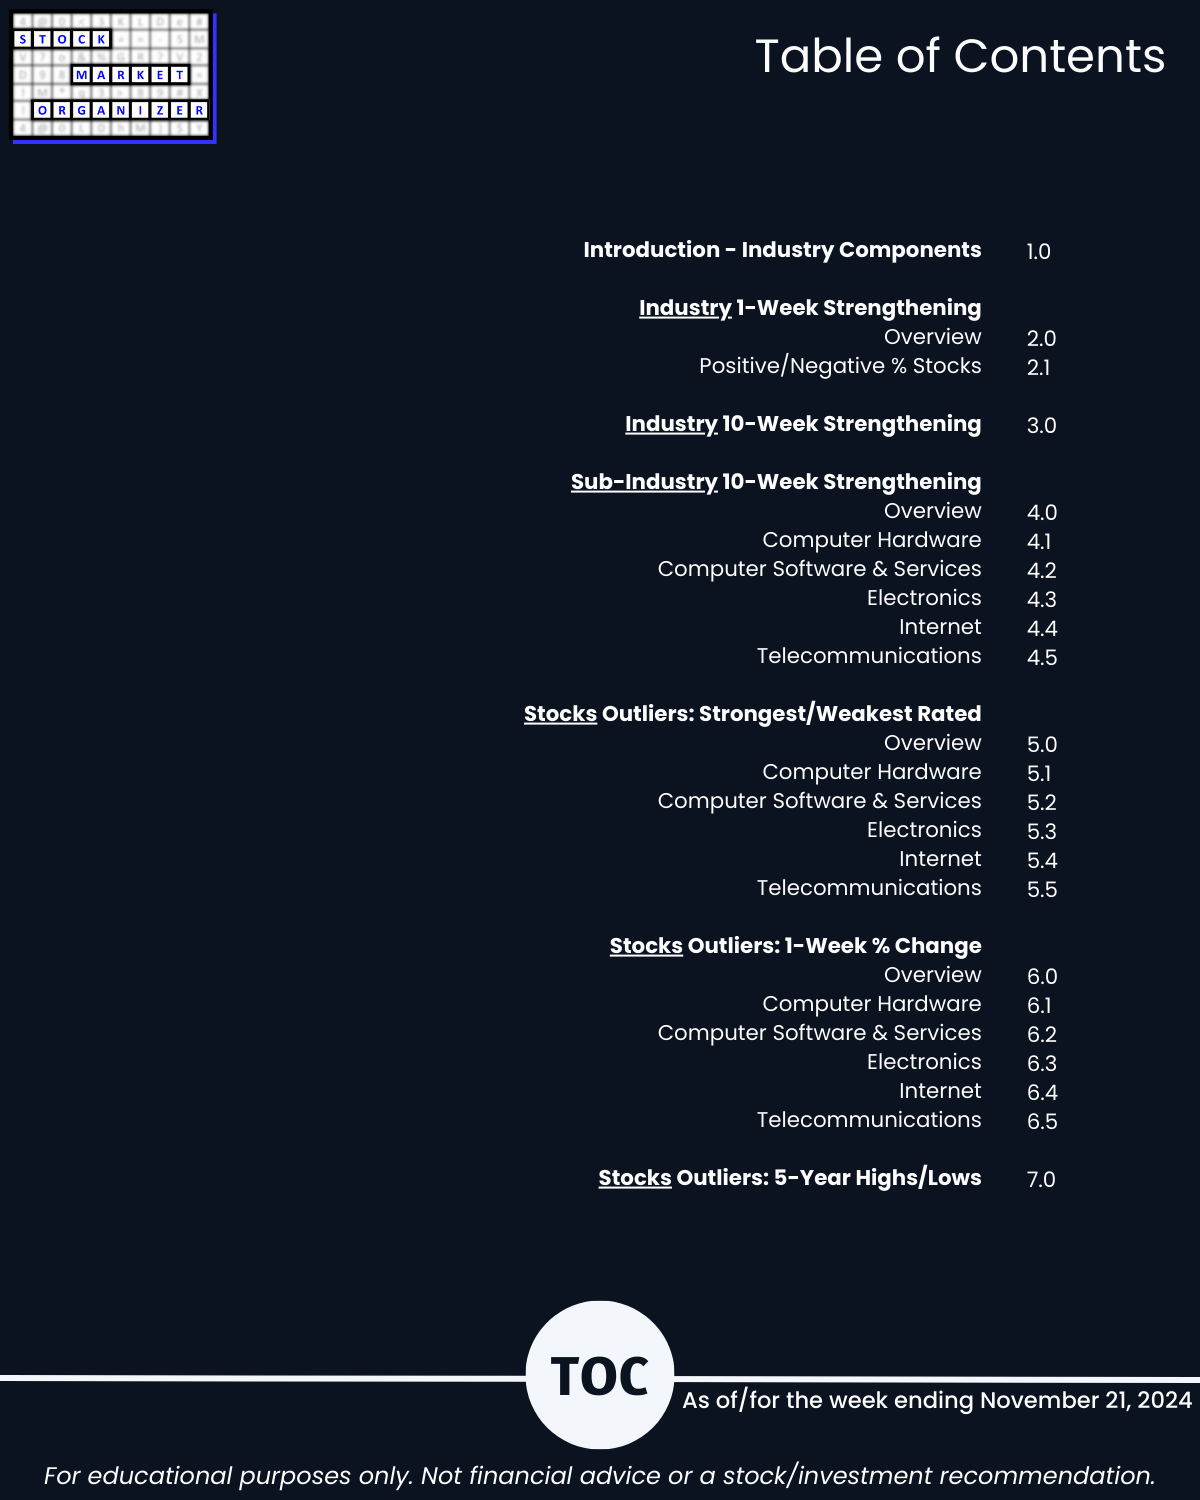
2. Industry 1-Week Strengthening
3. Industry 10-Week Strengthening
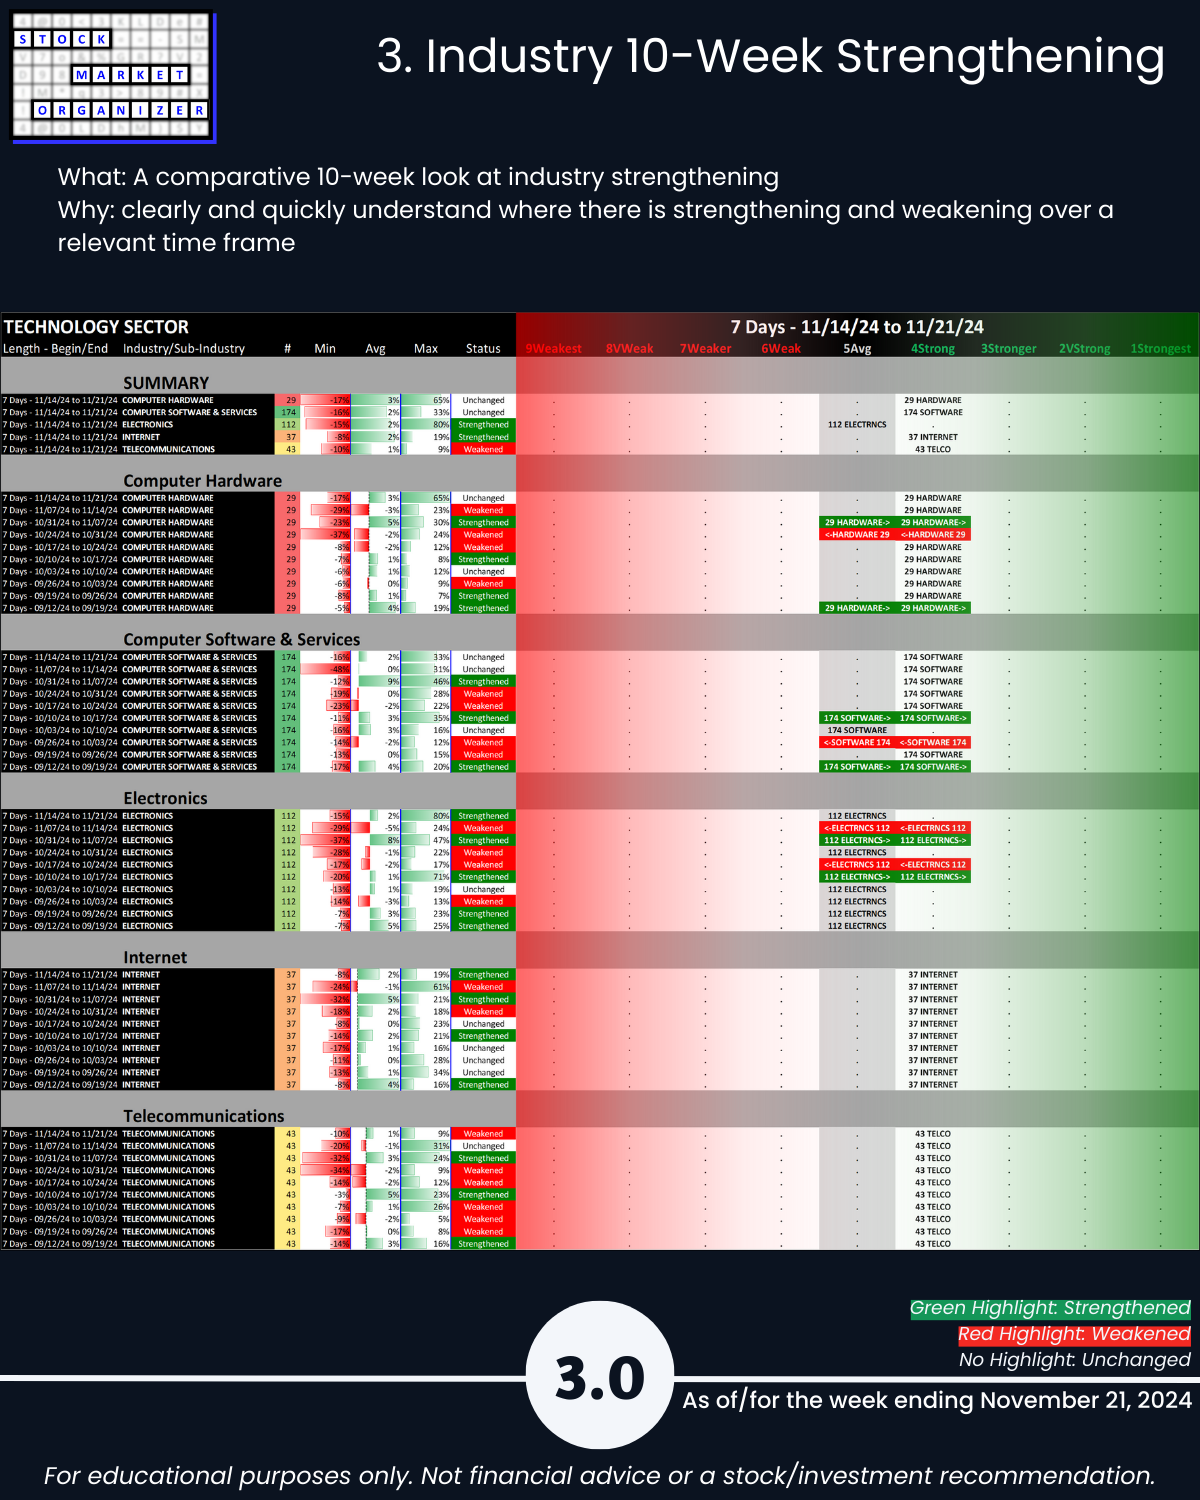
Internet and Telecommunications both have remained 4Strong for the past 10 weeks. The other three industries have swapped back and forth between 4Strong and 5Average during this period.
4. Sub-Industry 10-Week Strengthening
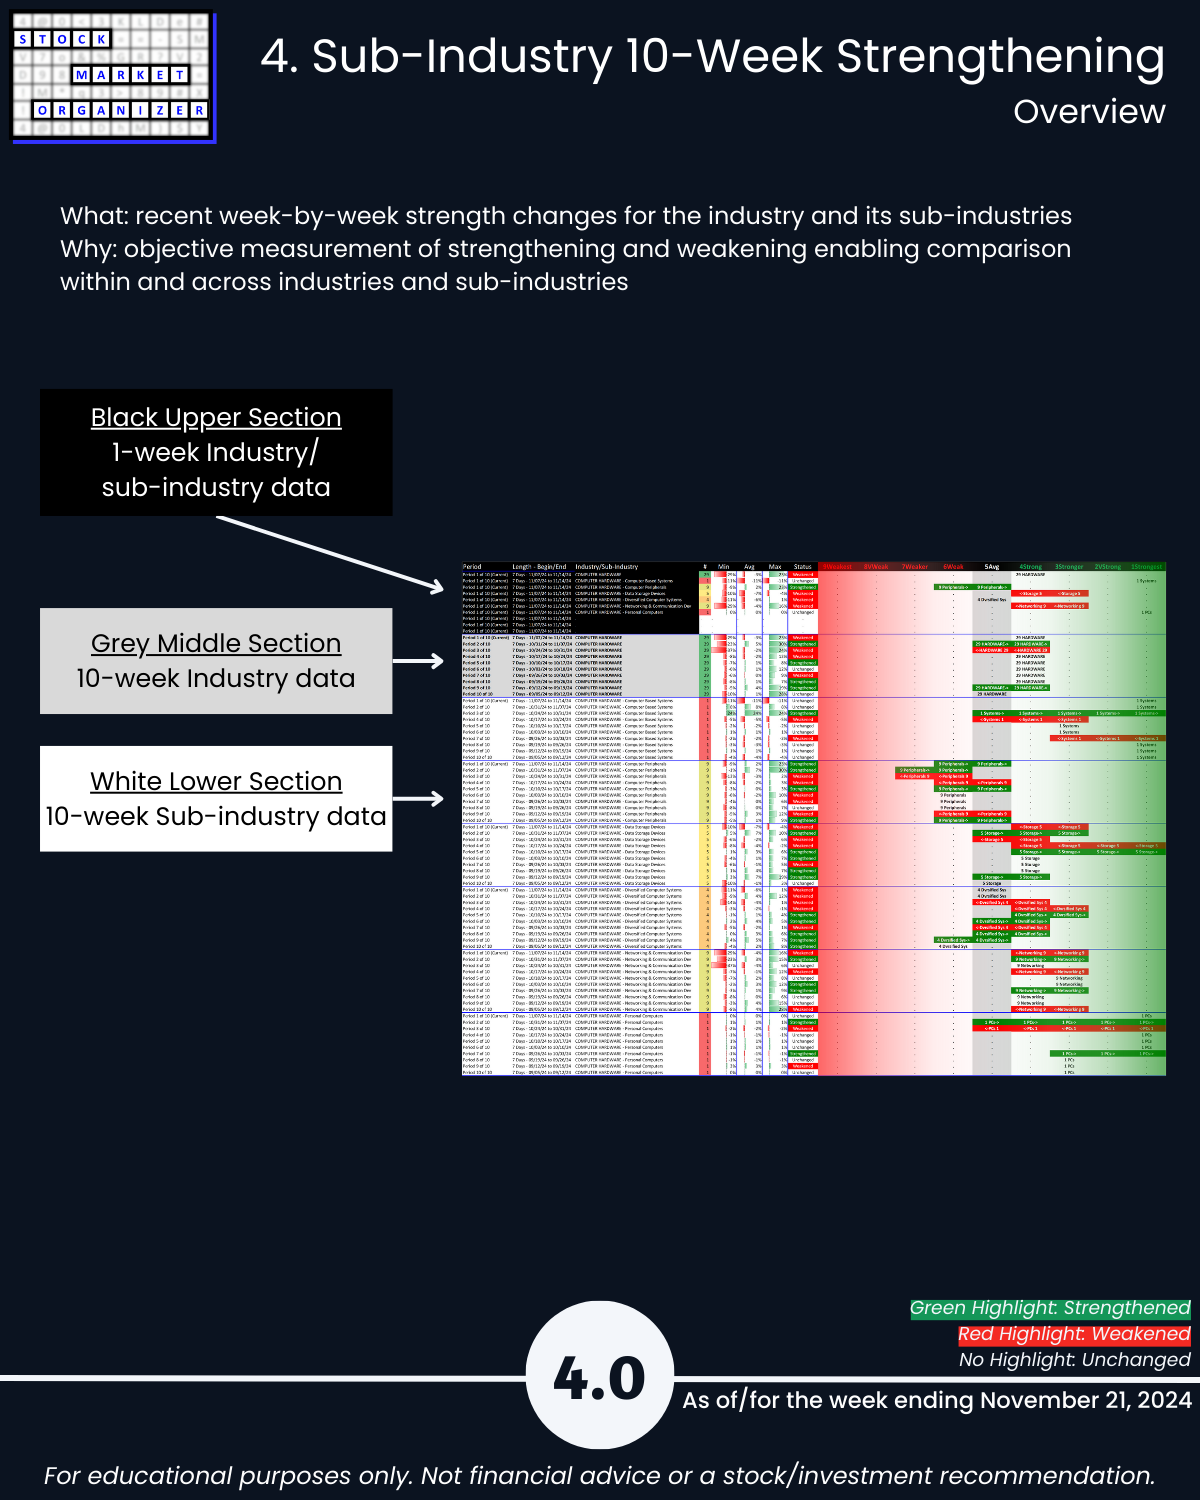
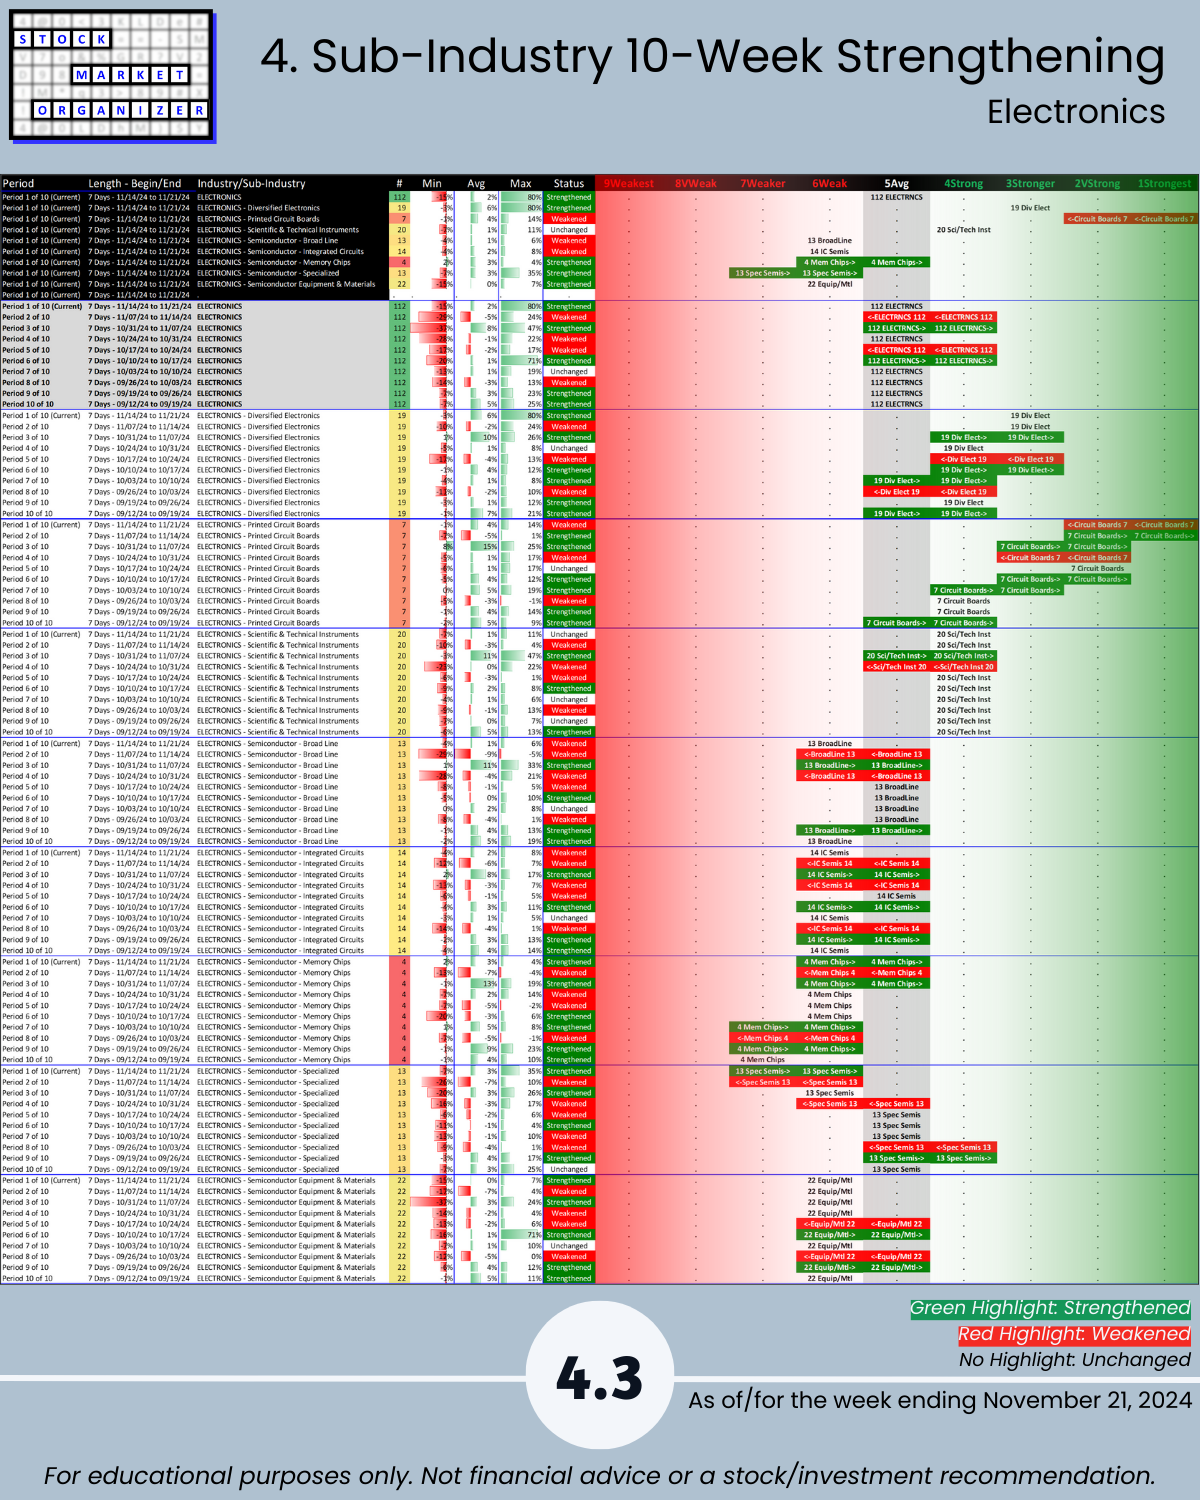
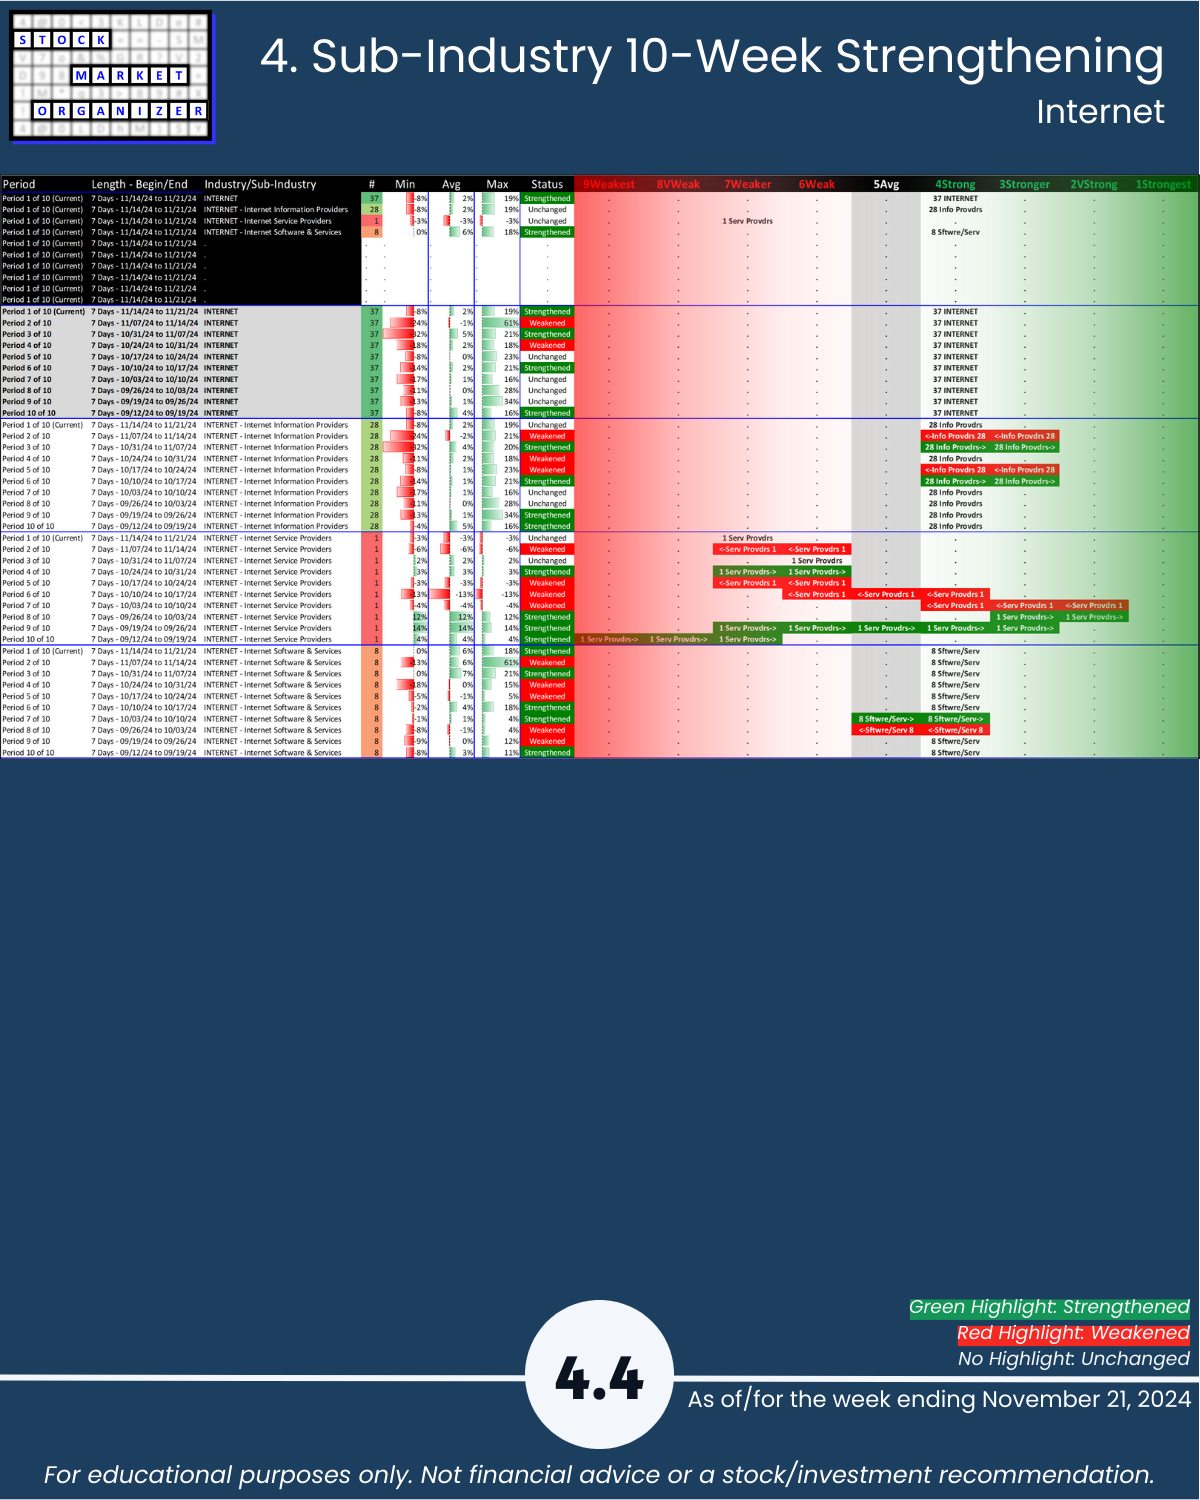
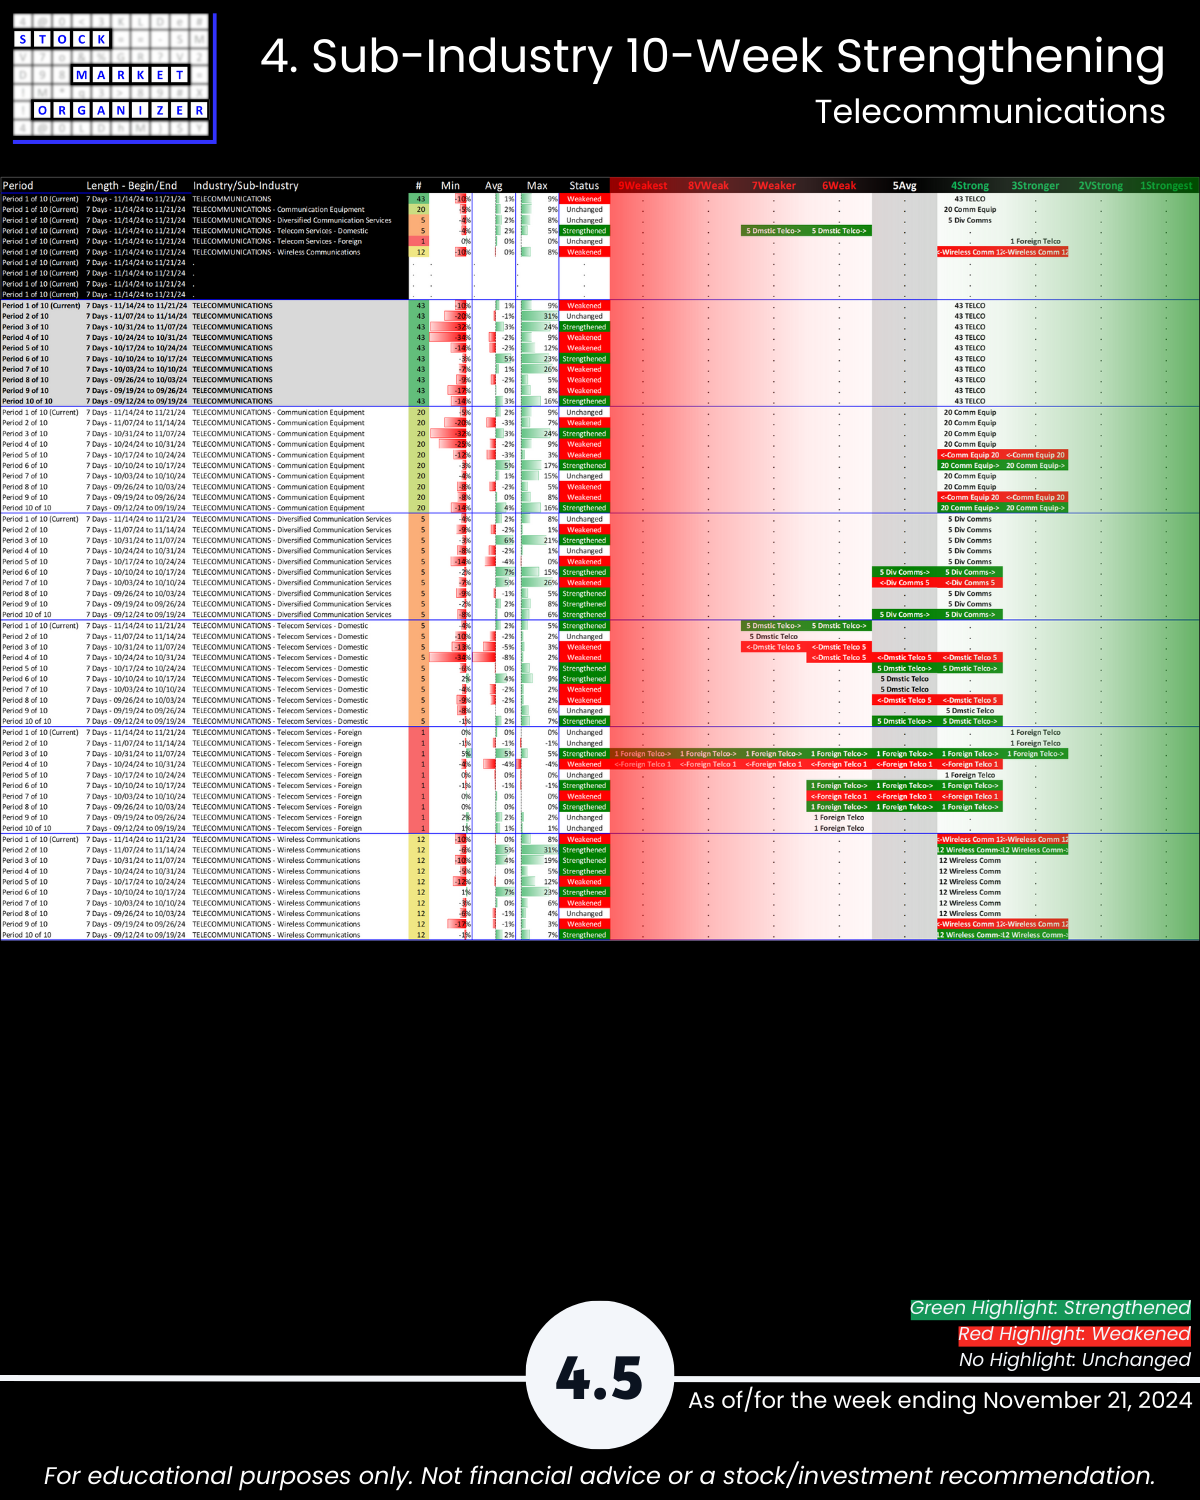
These graphics offer a convenient look at which have been the strongest and weakest sub-industries over the past 10 weeks. The lower half of Page 4.3 Electronics reflects the weakness in Semis during this period.
5. Stocks Outliers: Strongest/Weakest Rated
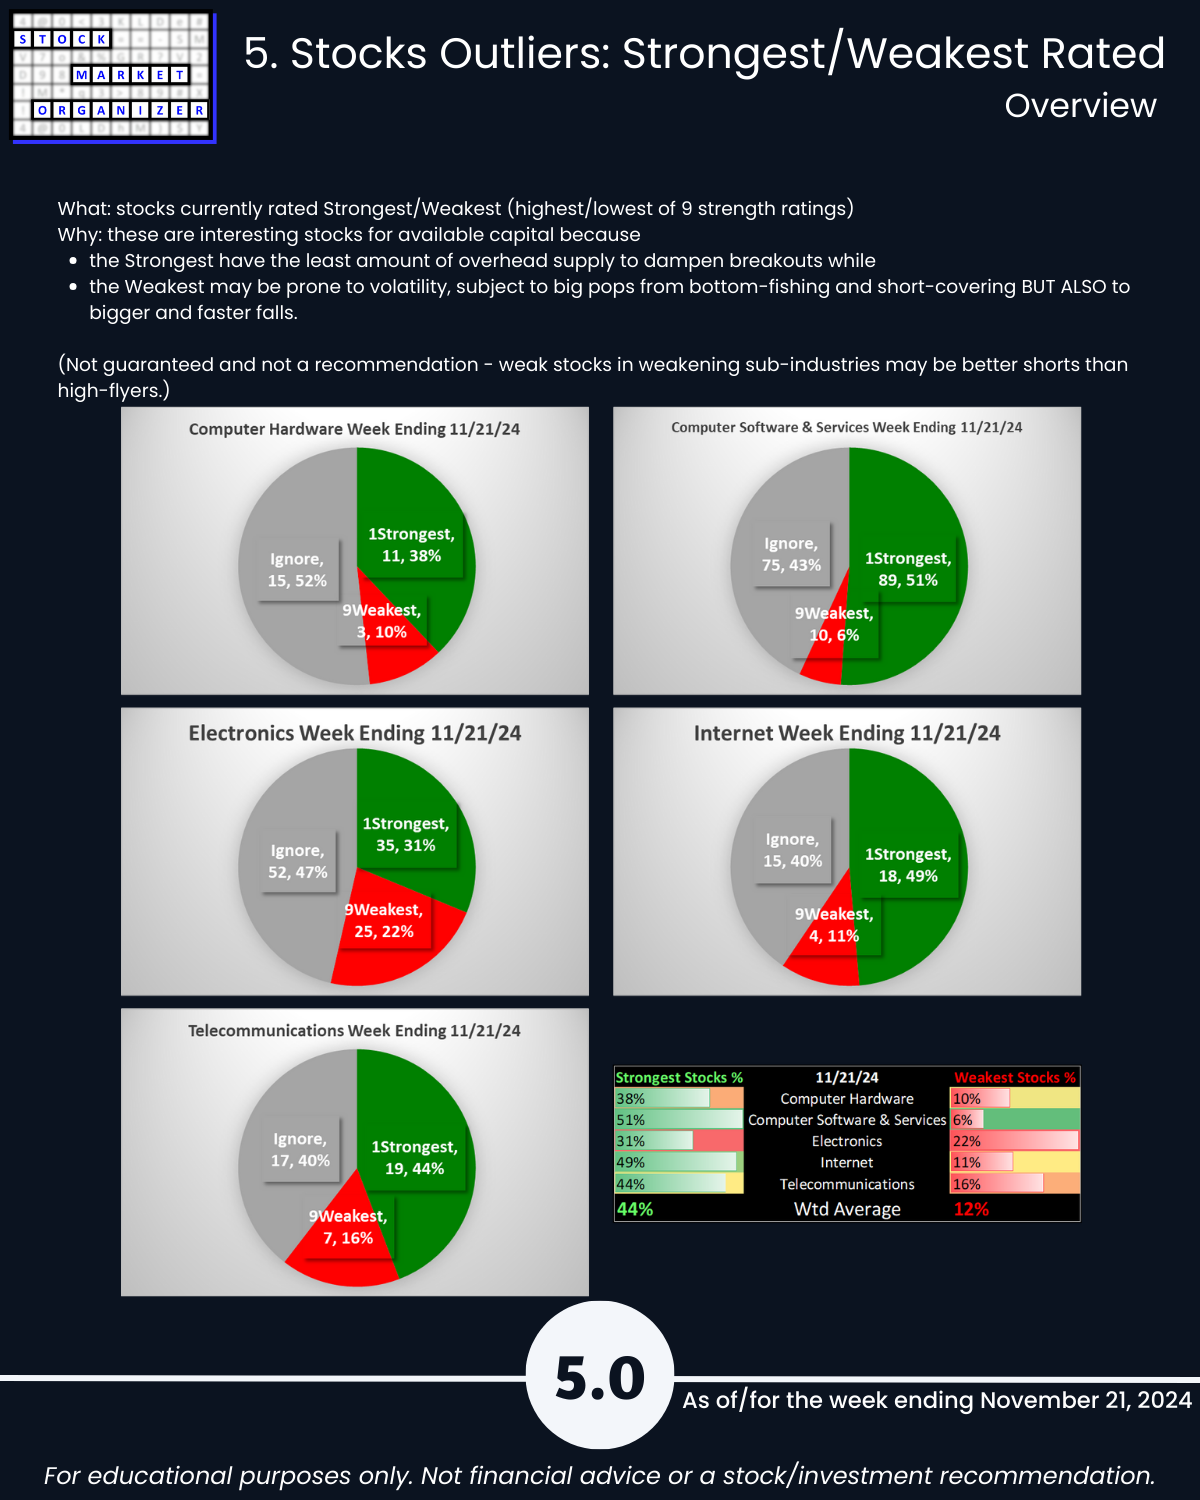
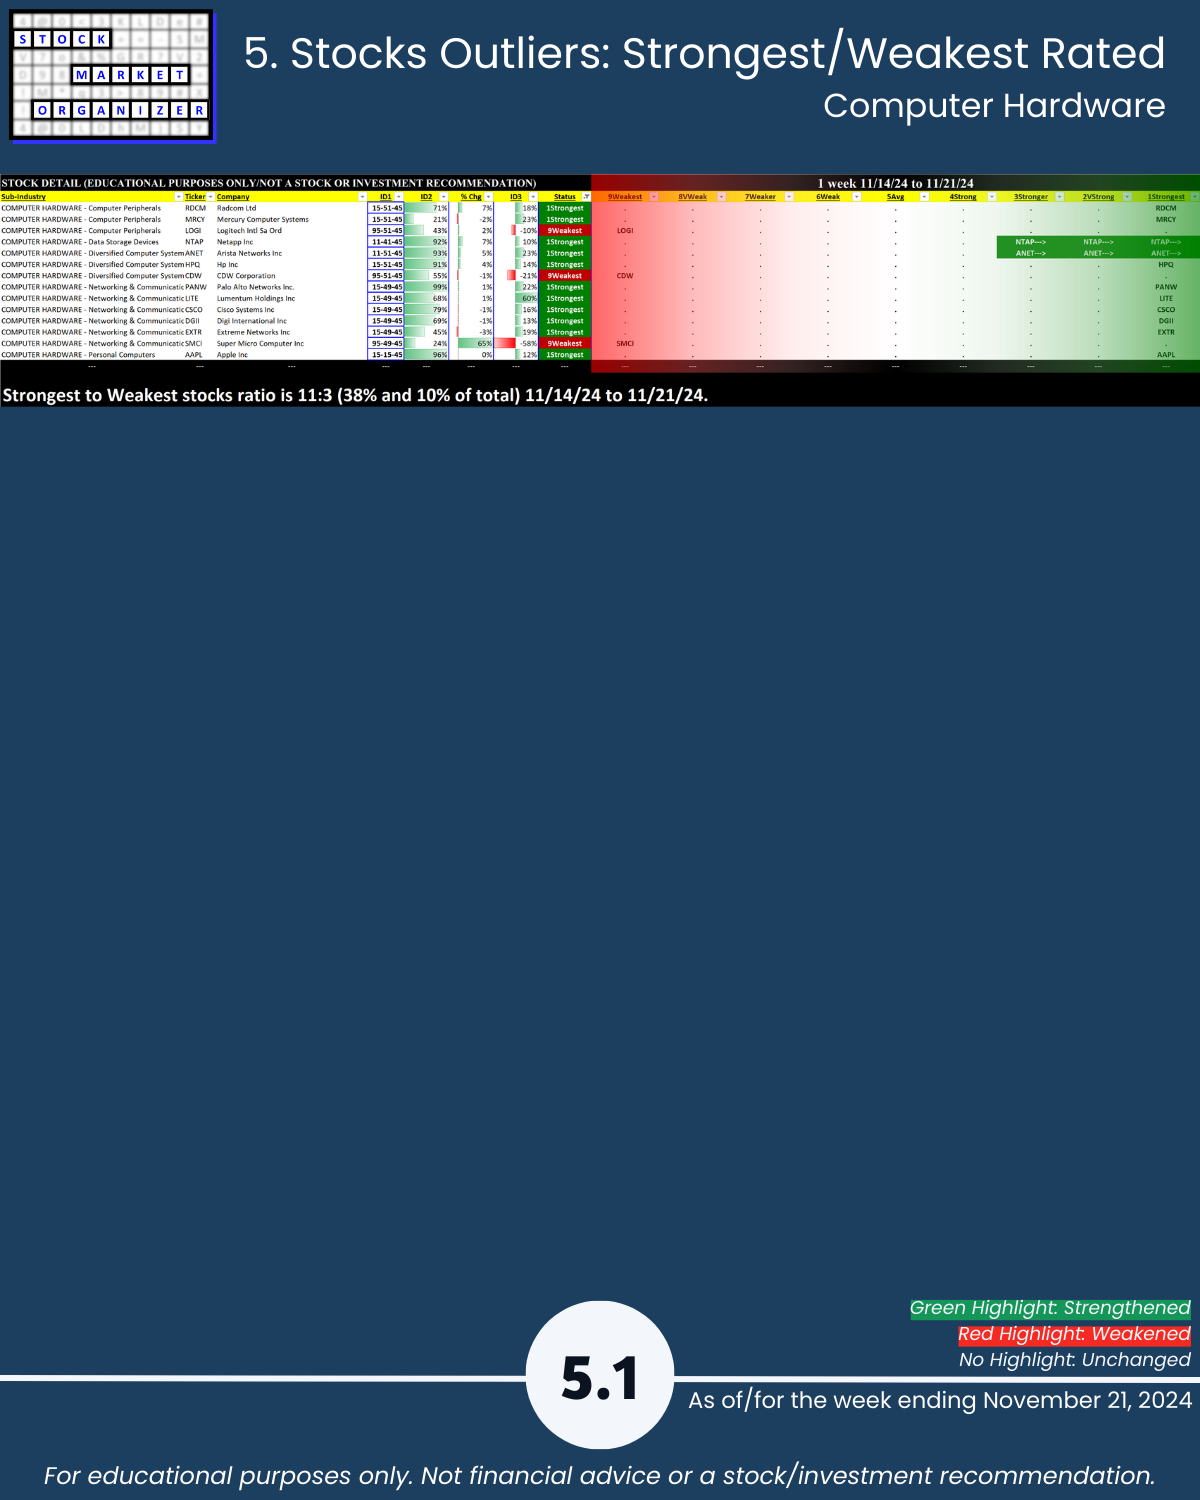
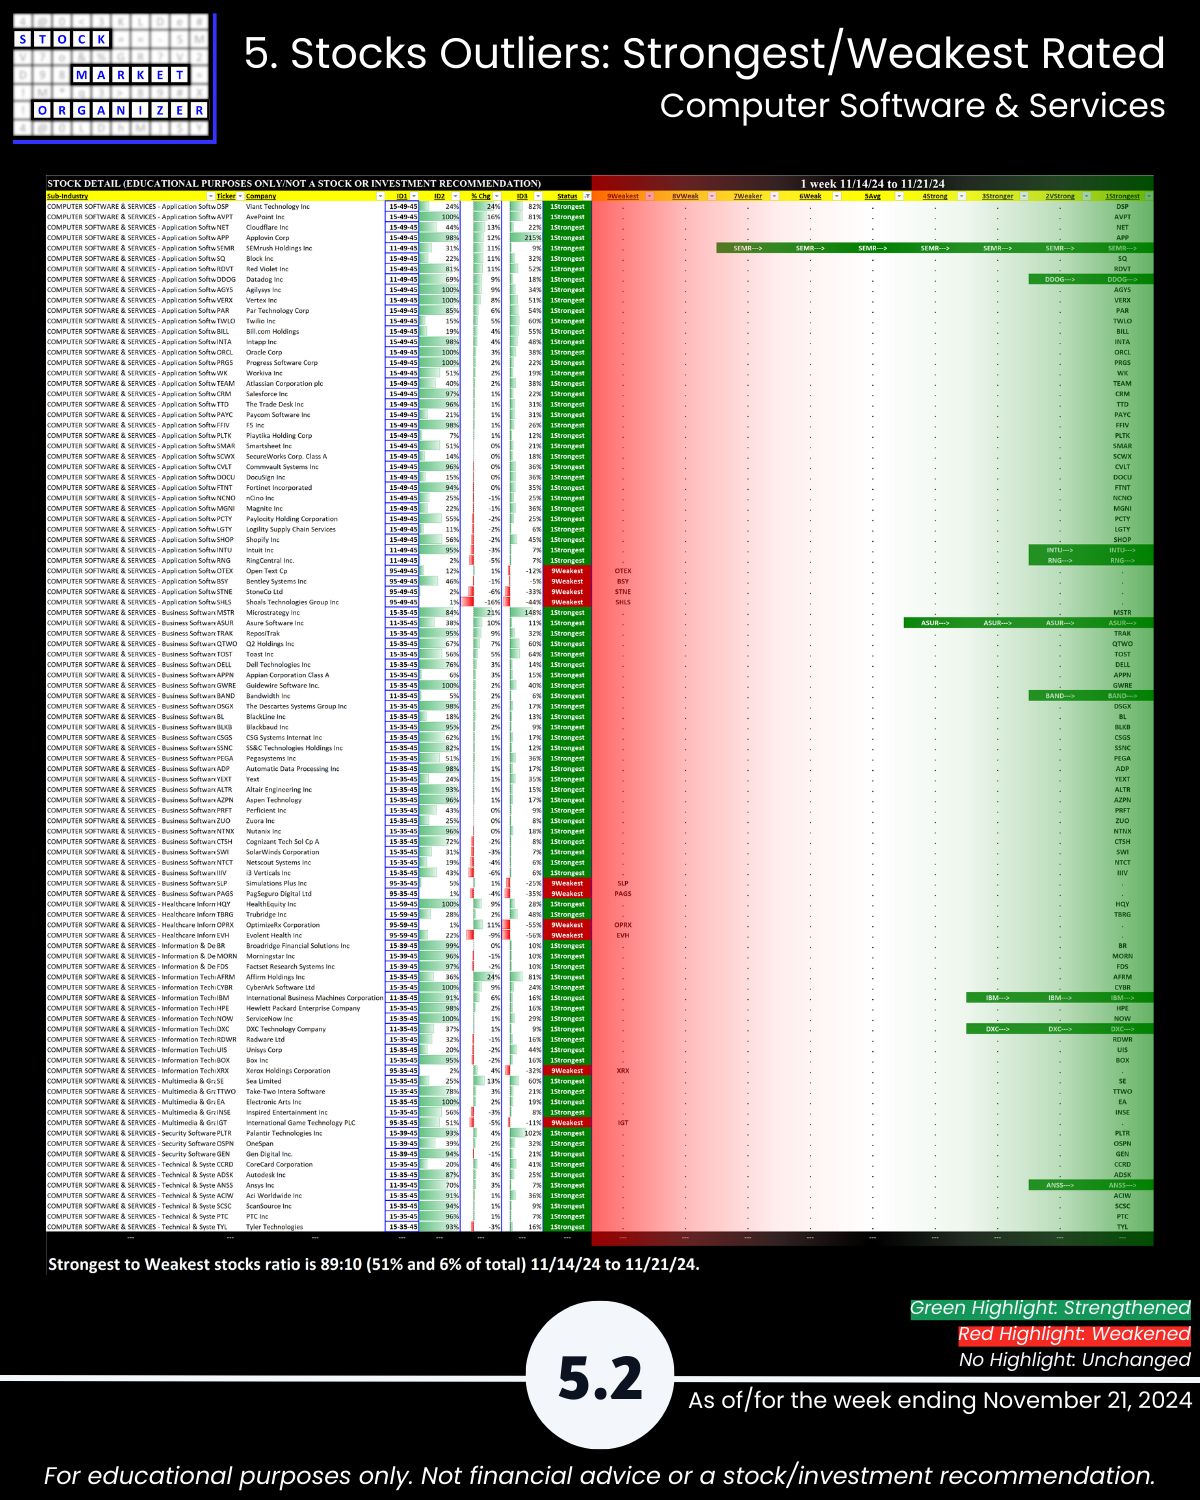
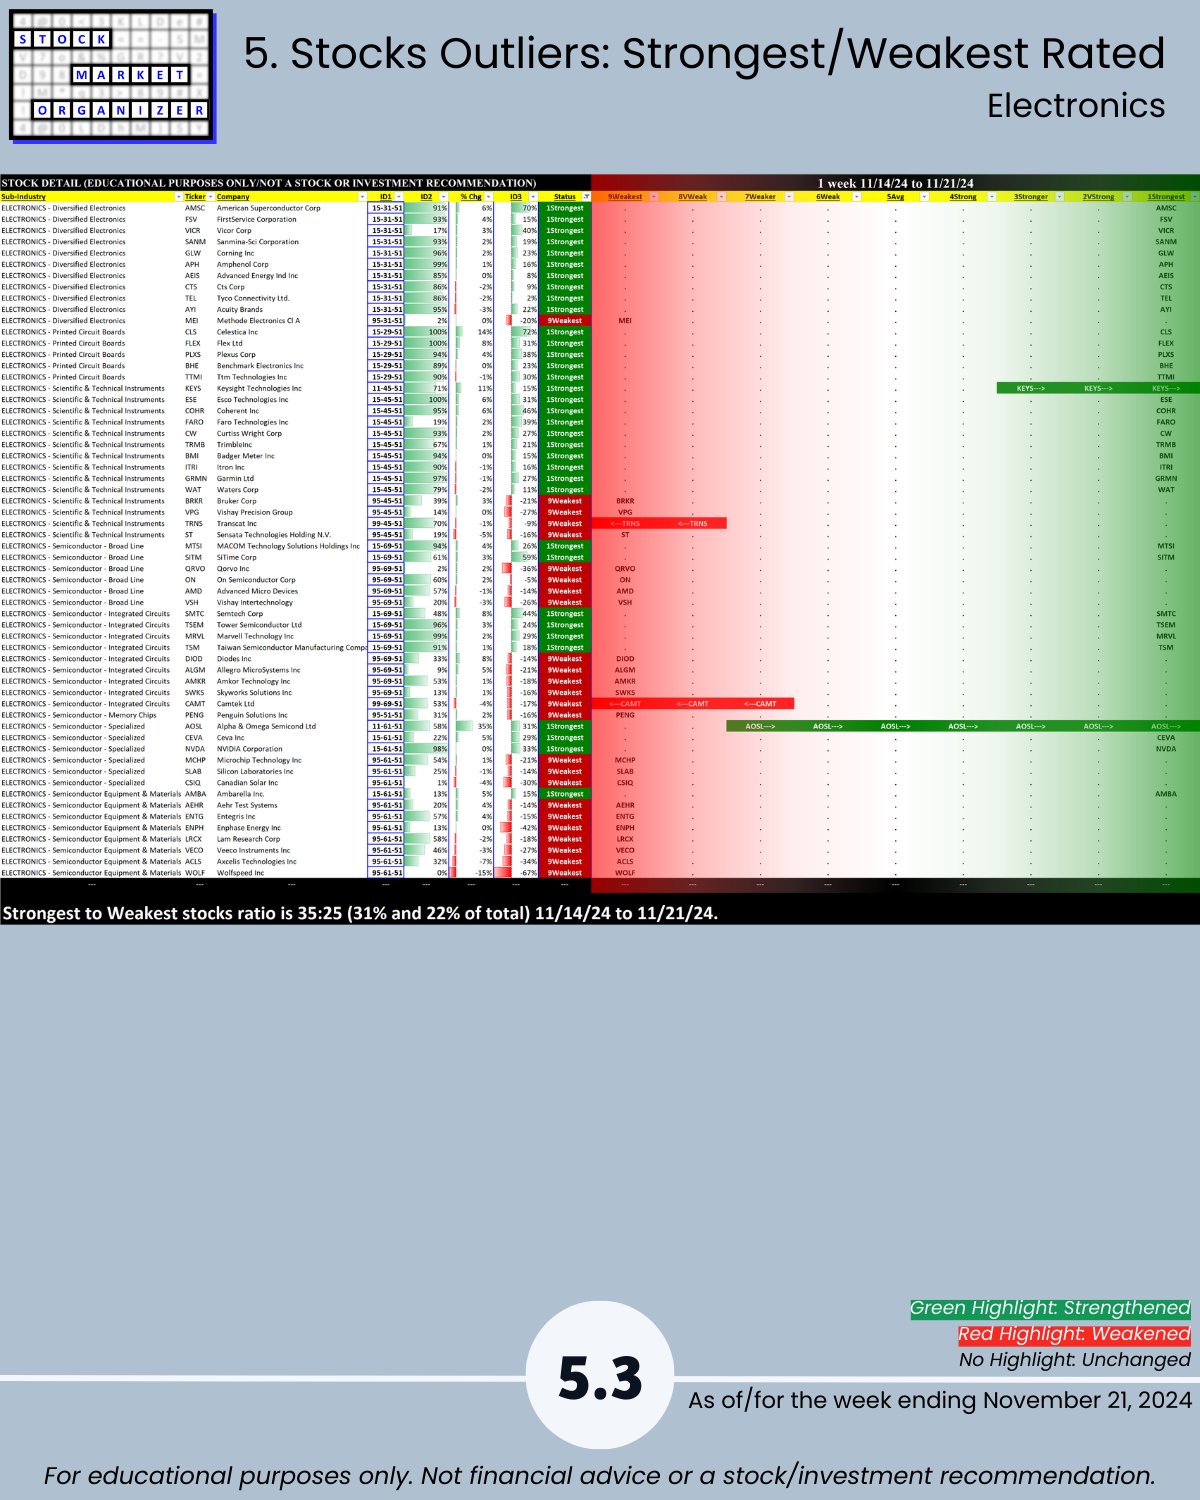
Note Computer Software & Services page 5.2 shows a good number of stocks strengthening to 1Strongest, while Electronics page 4.3 reveals the opposite with many stocks weakening to 9Weakest.
6. Stocks Outliers: 1-Week % Change
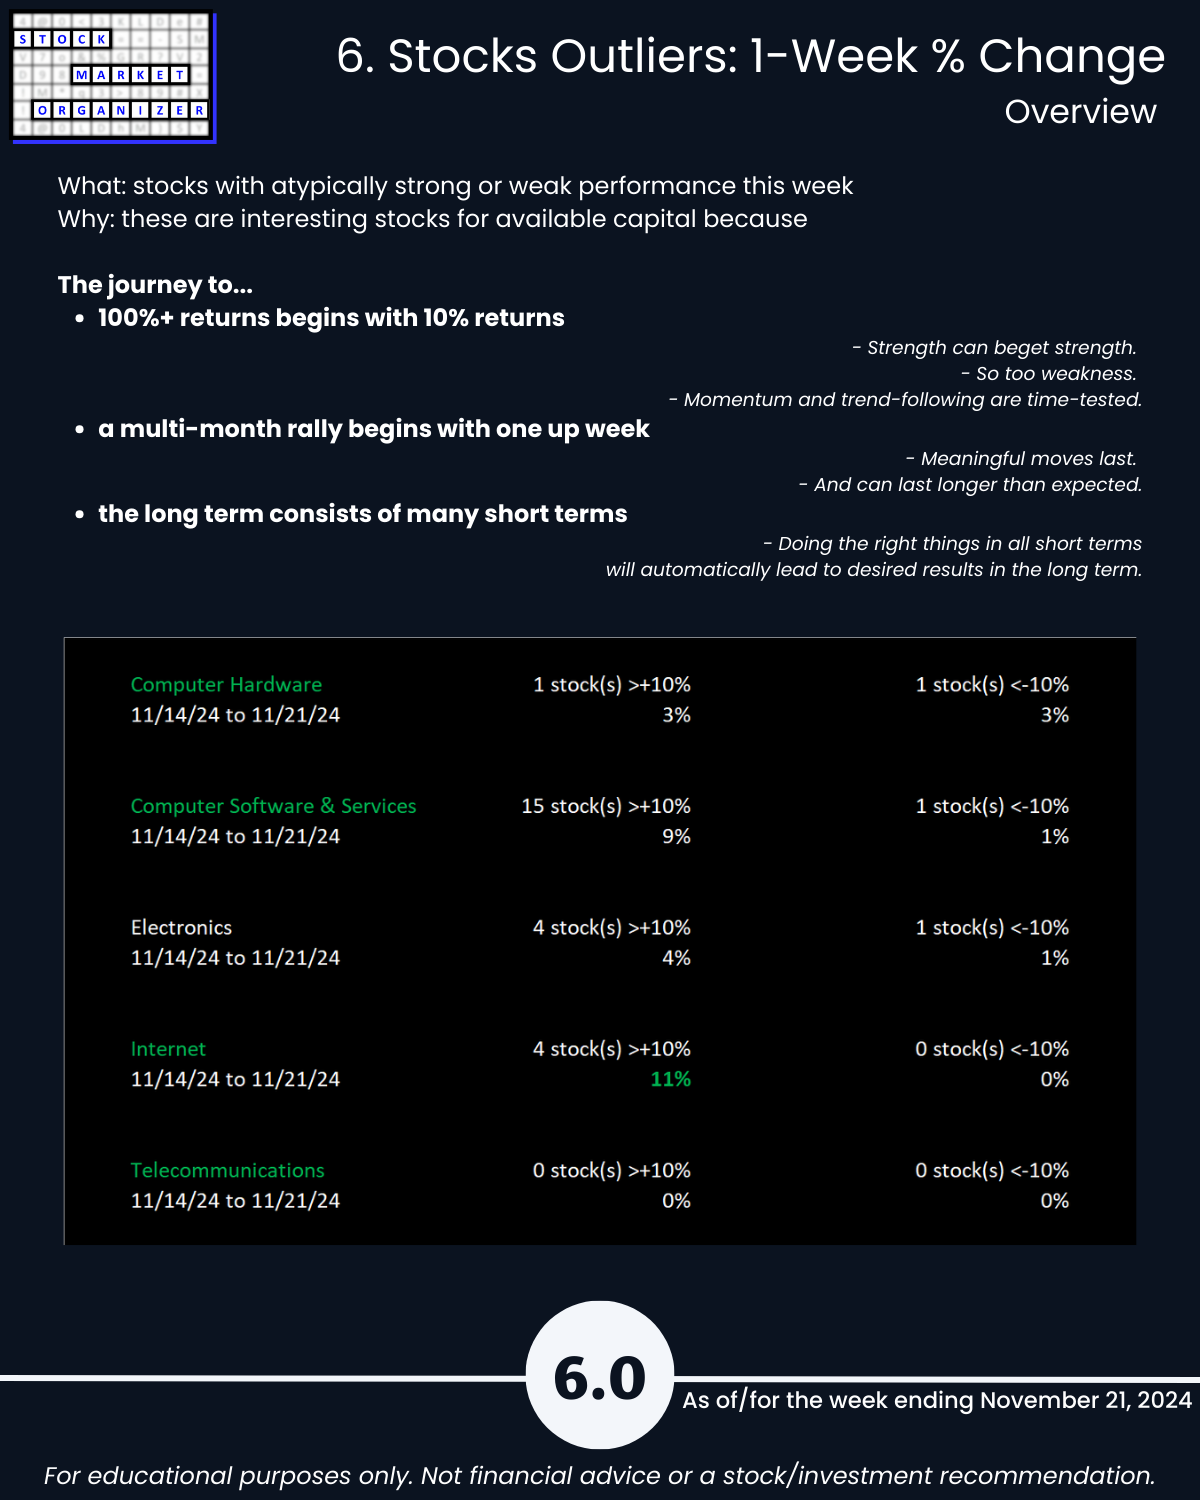
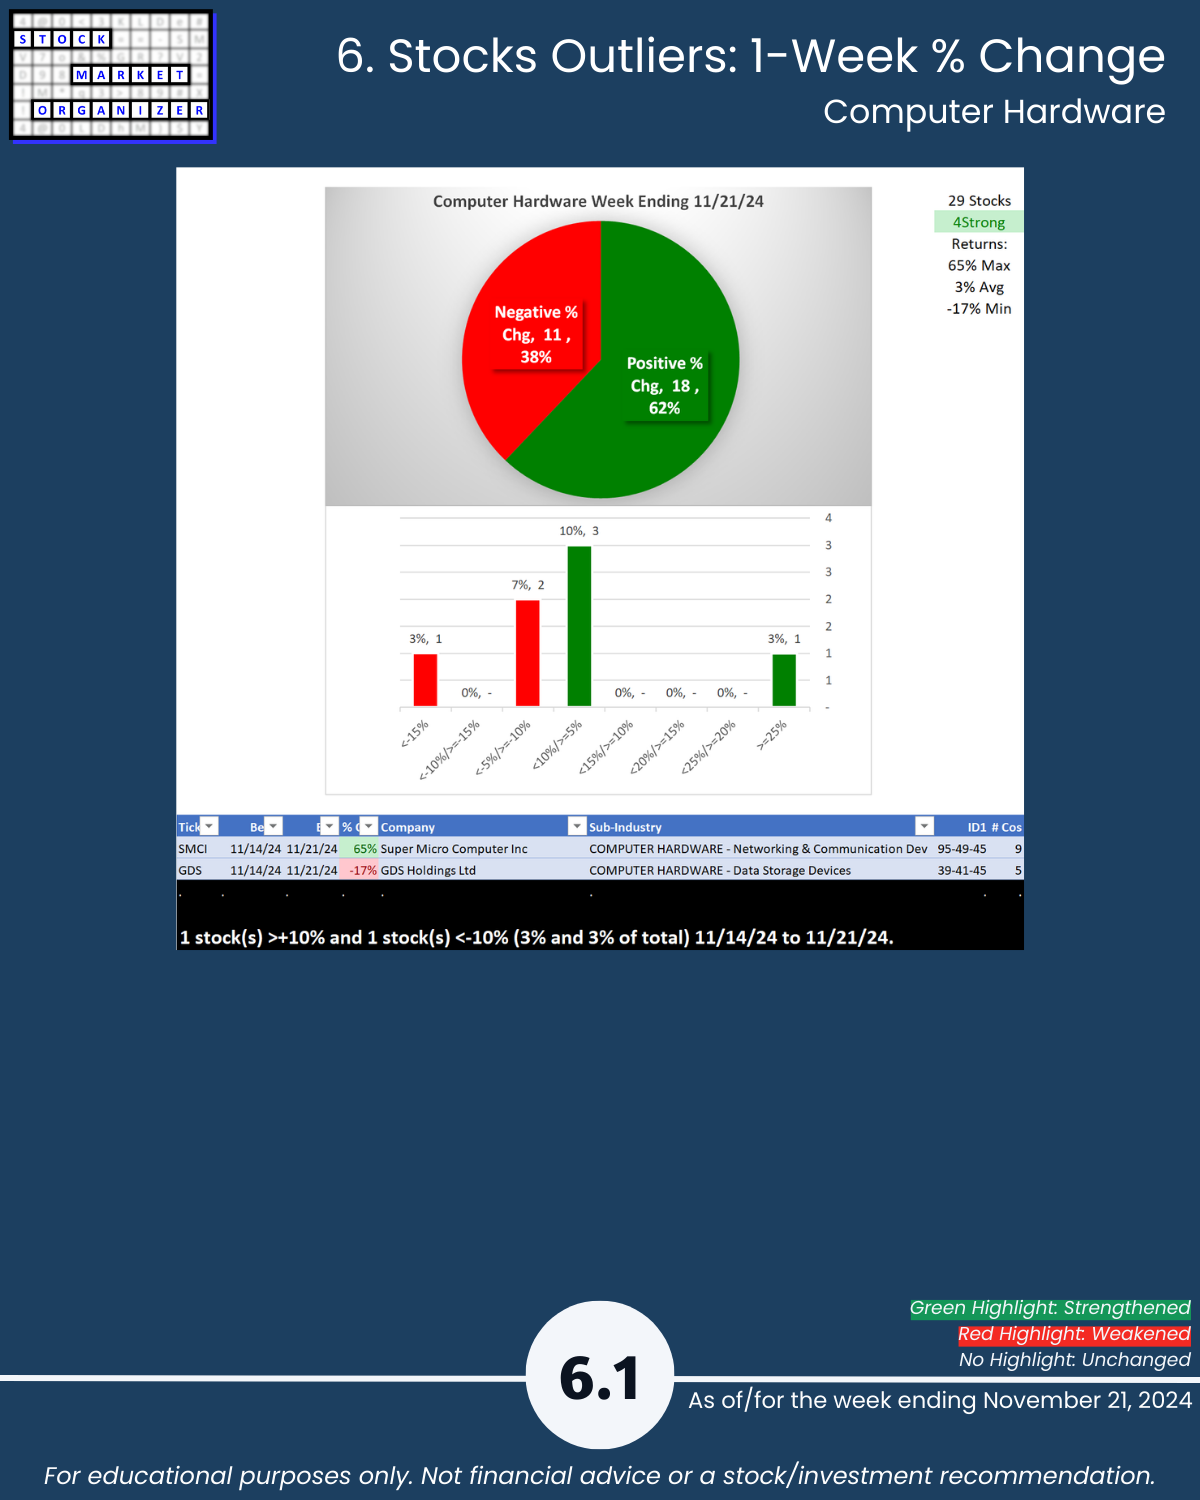
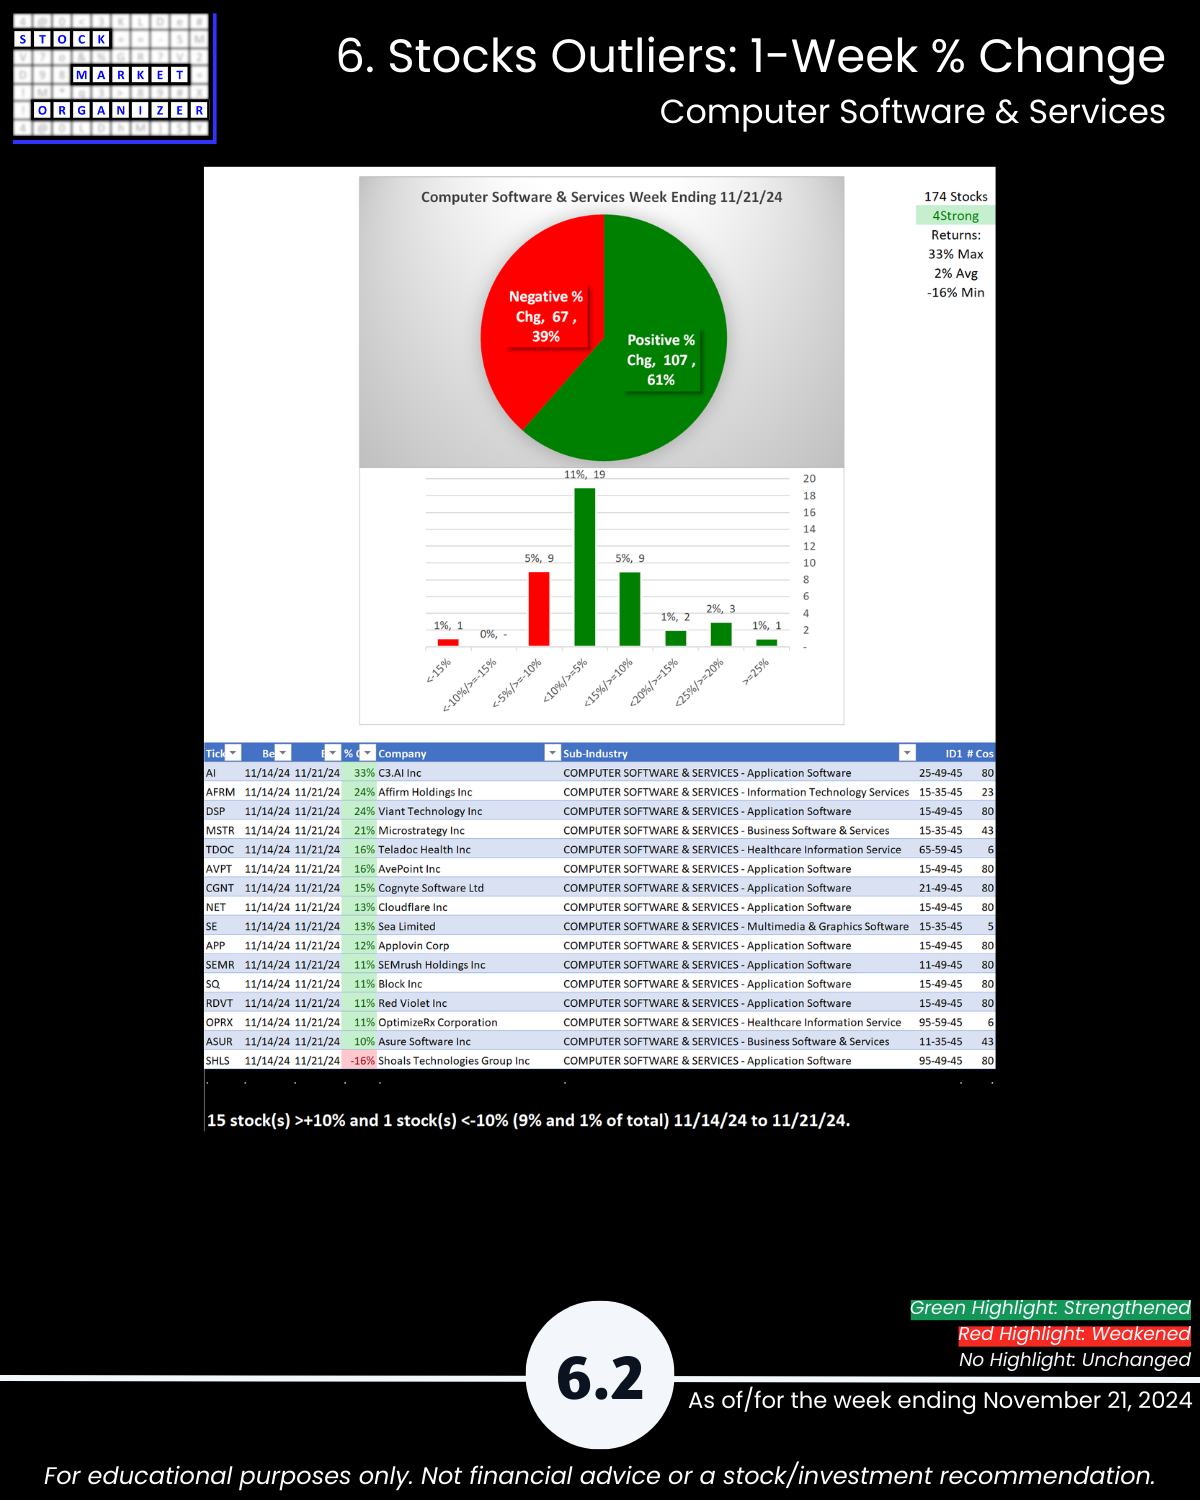
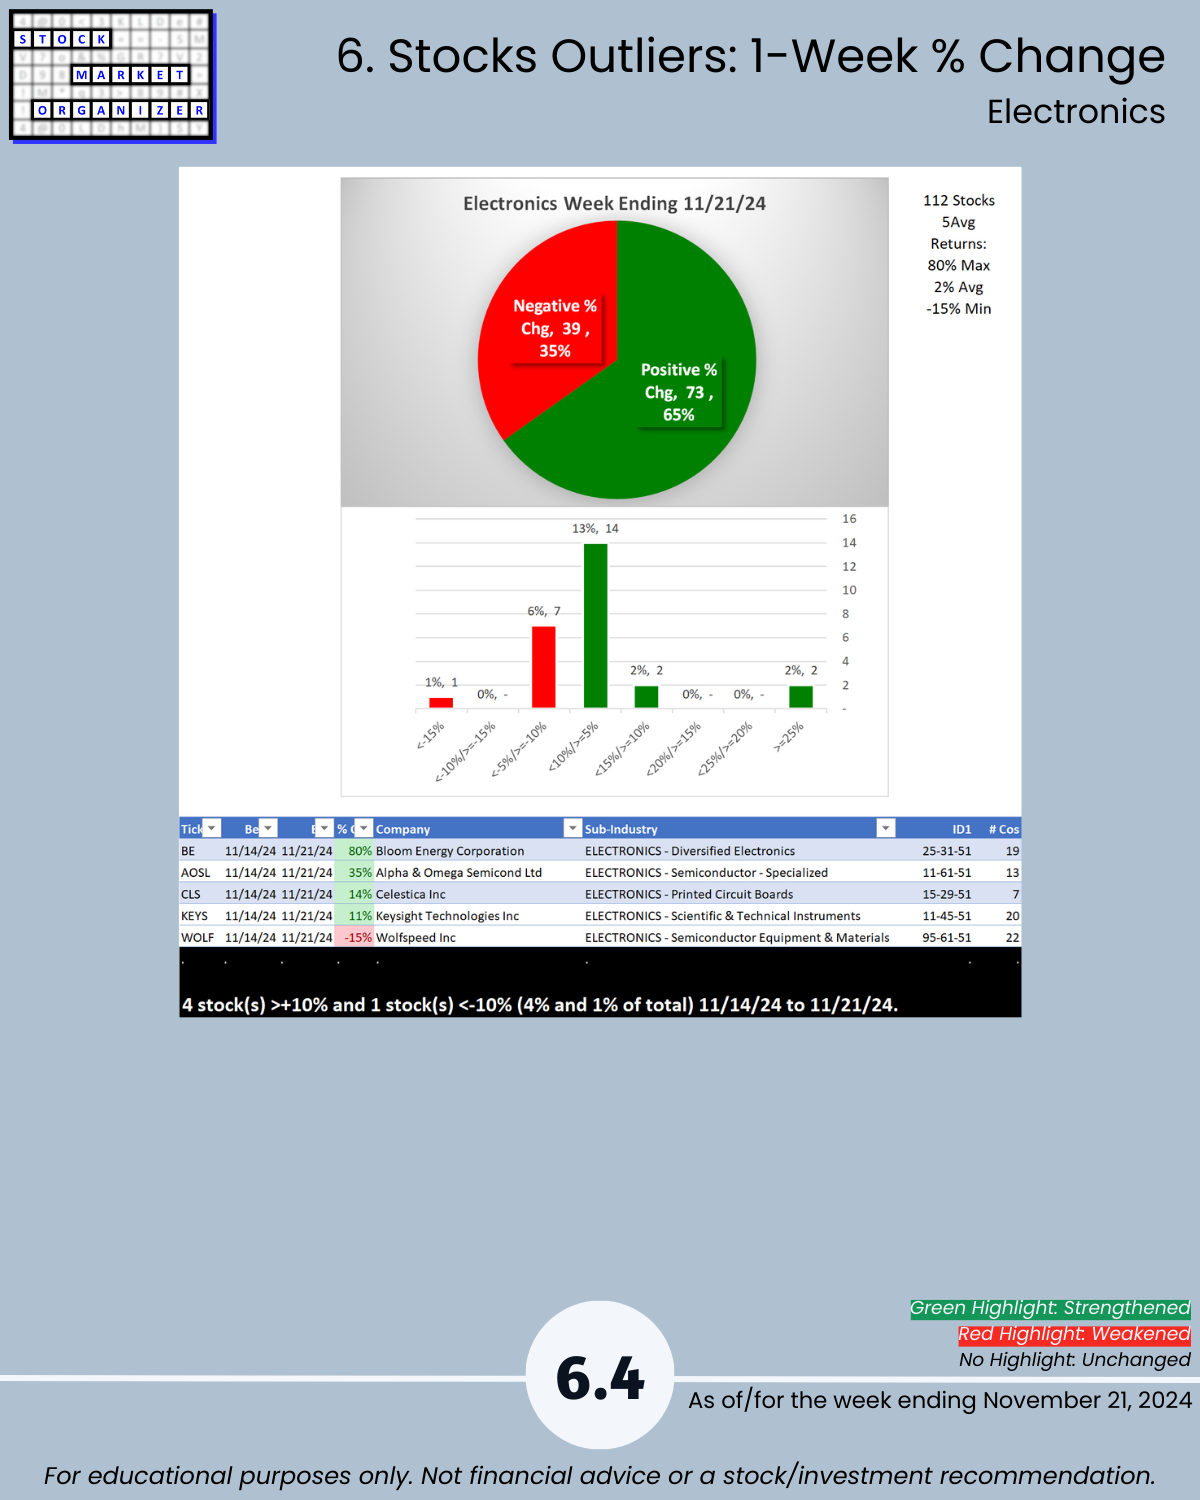
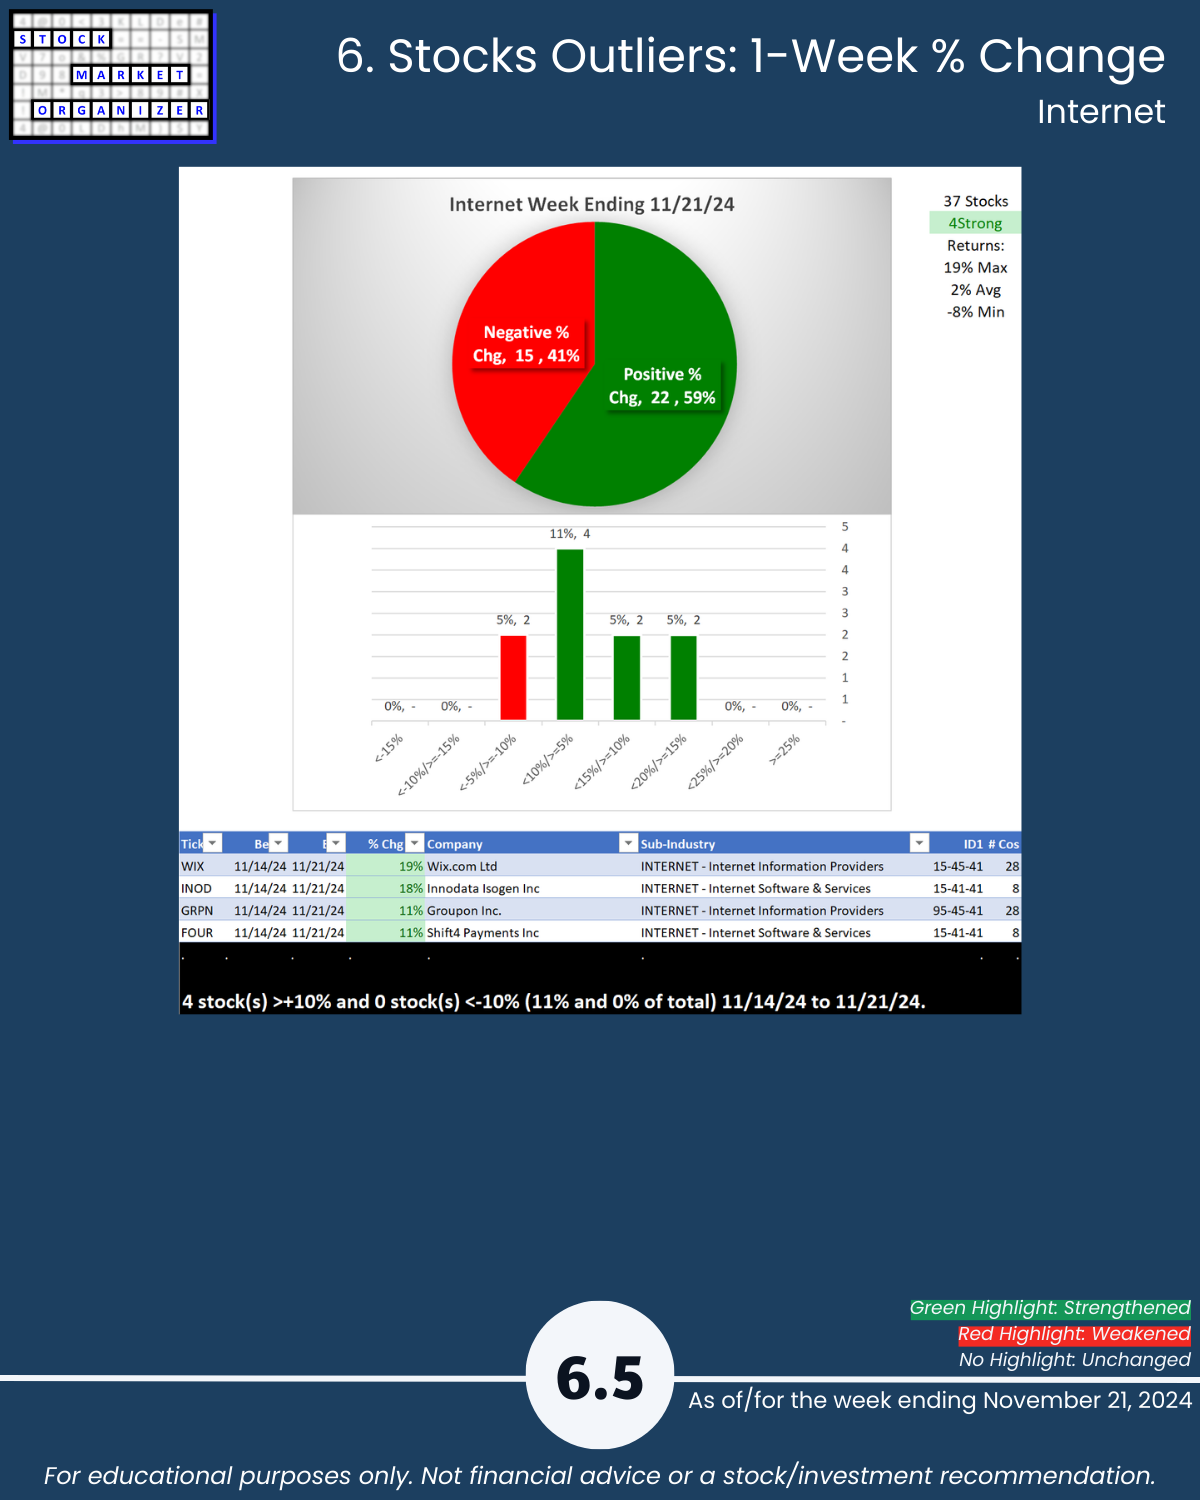
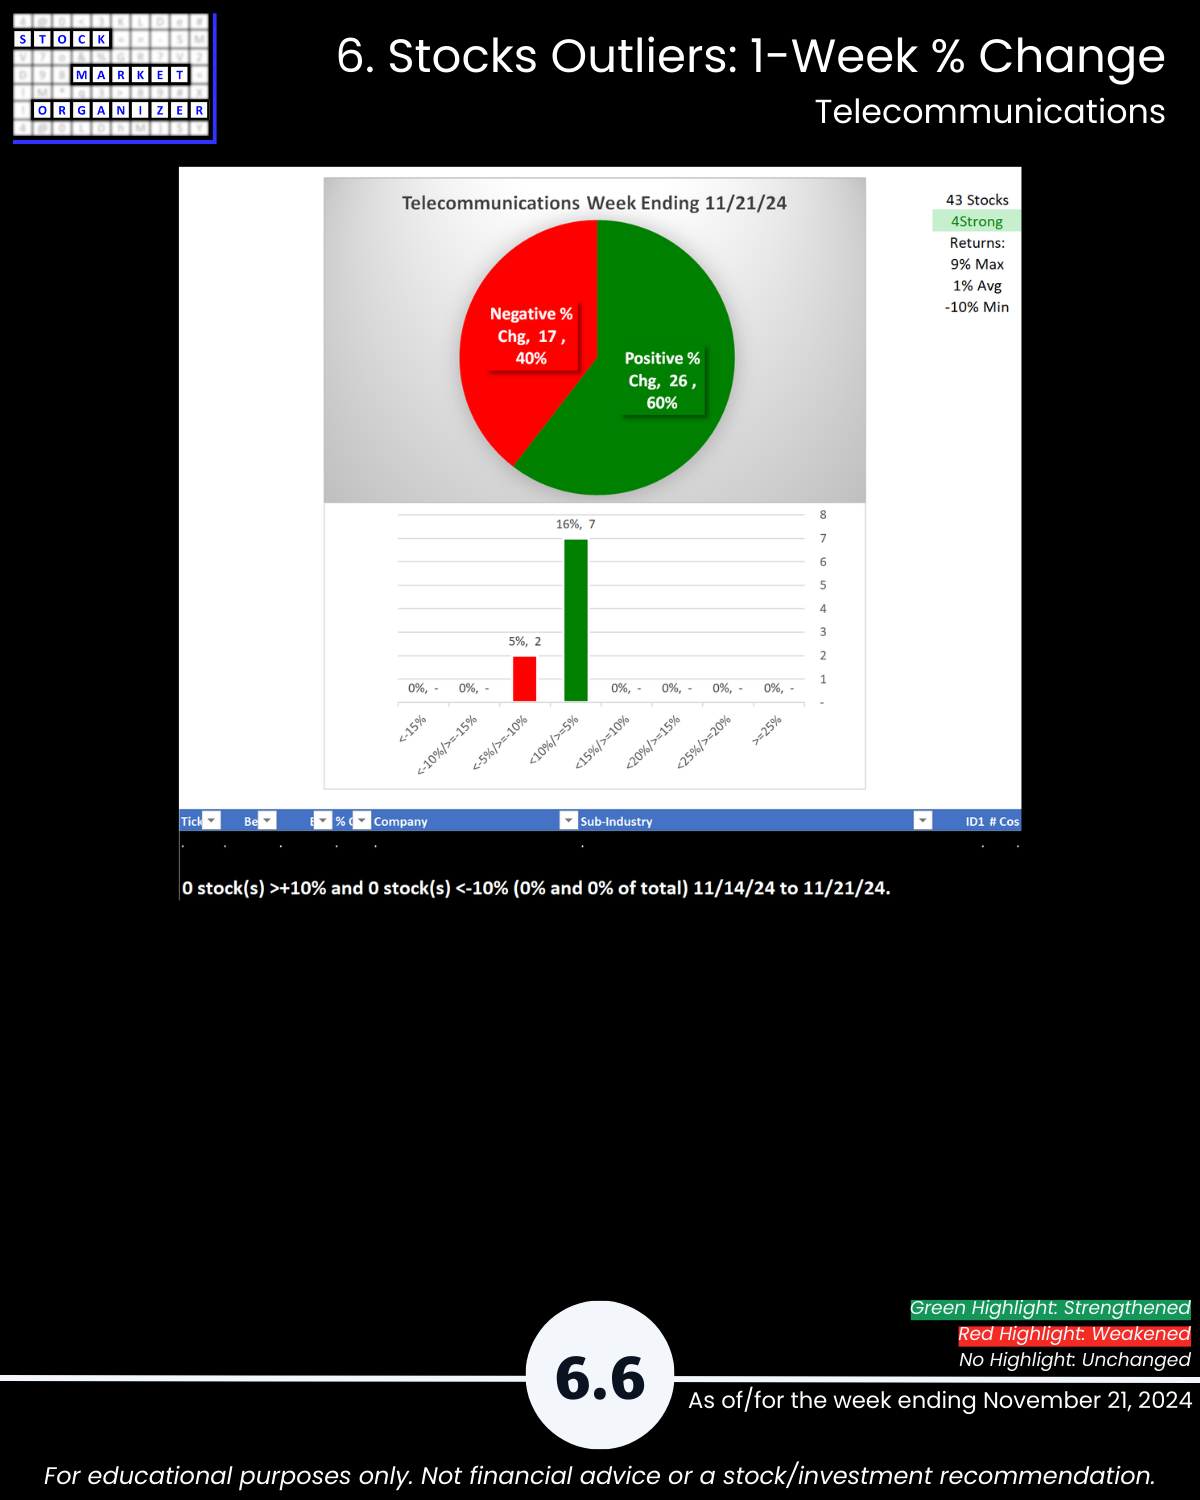
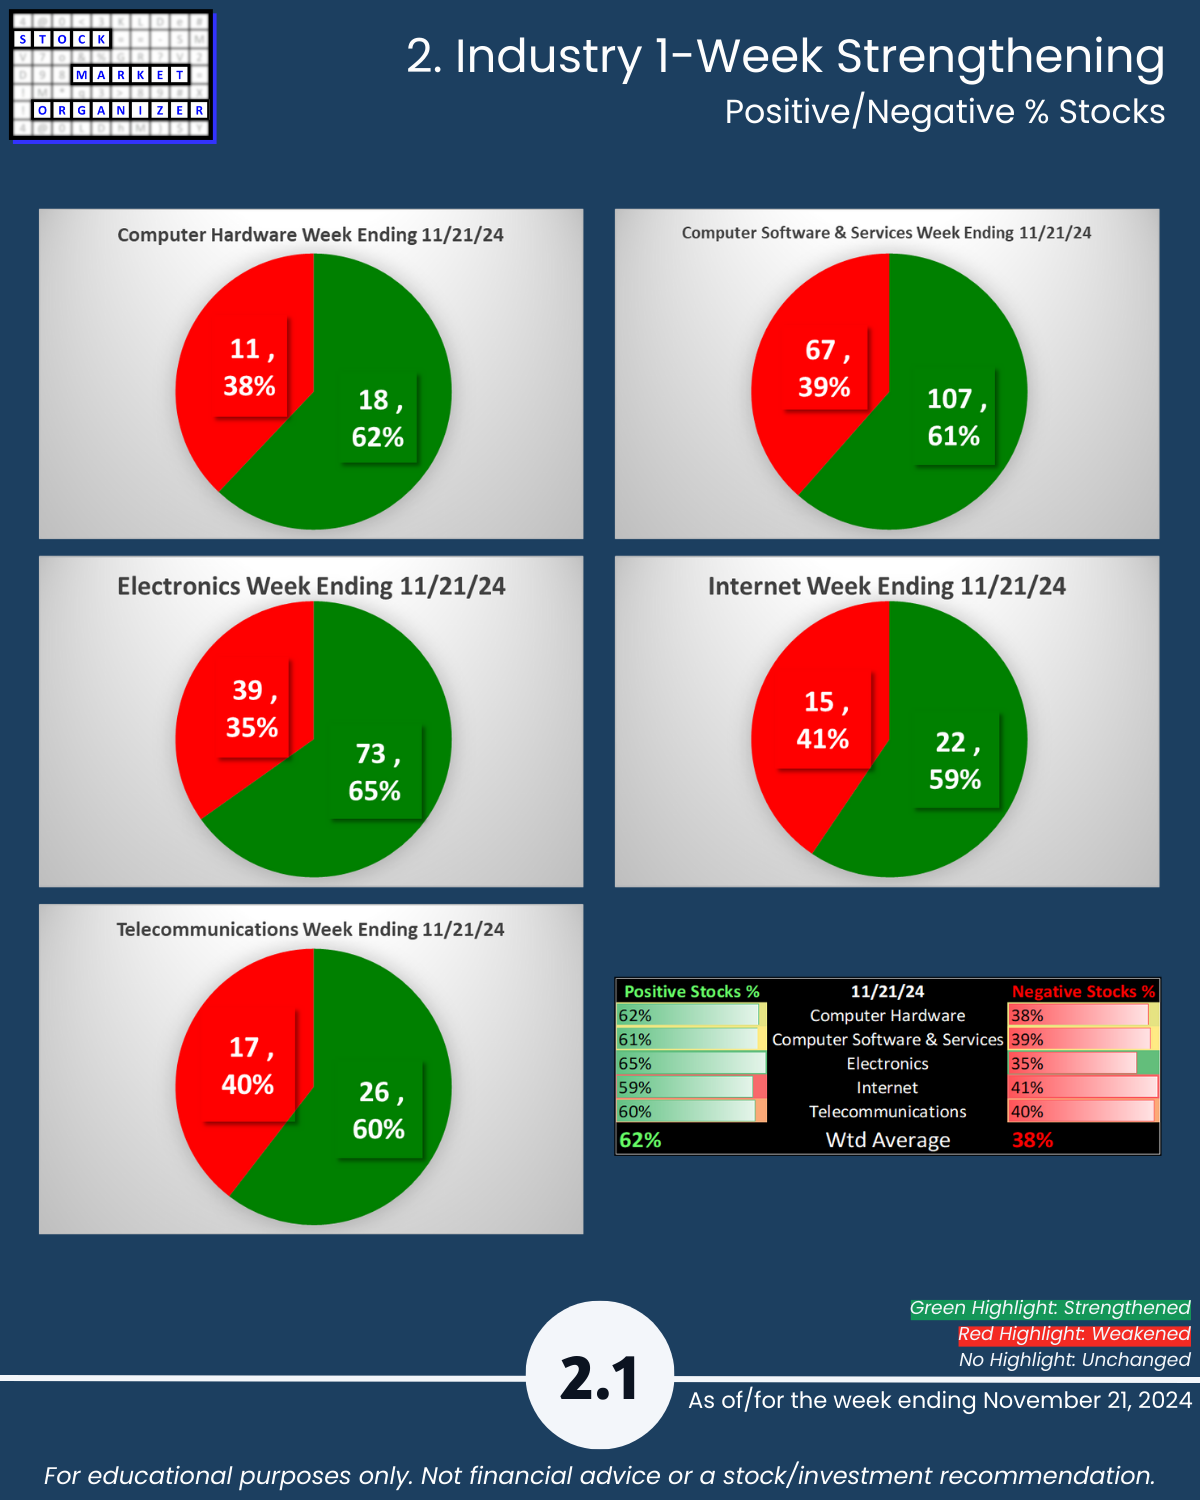
Electronics page 6.4 shows a huge imbalance of positive vs. negative stocks with Computer Hardware page 6.1 also suffering. The other three industries were all slightly more than 50% negative. Note the detail revealing large outliers on each industry page - these can flag newly "in-play" stocks.
7. Stocks Outliers: 5-Year Highs/Lows
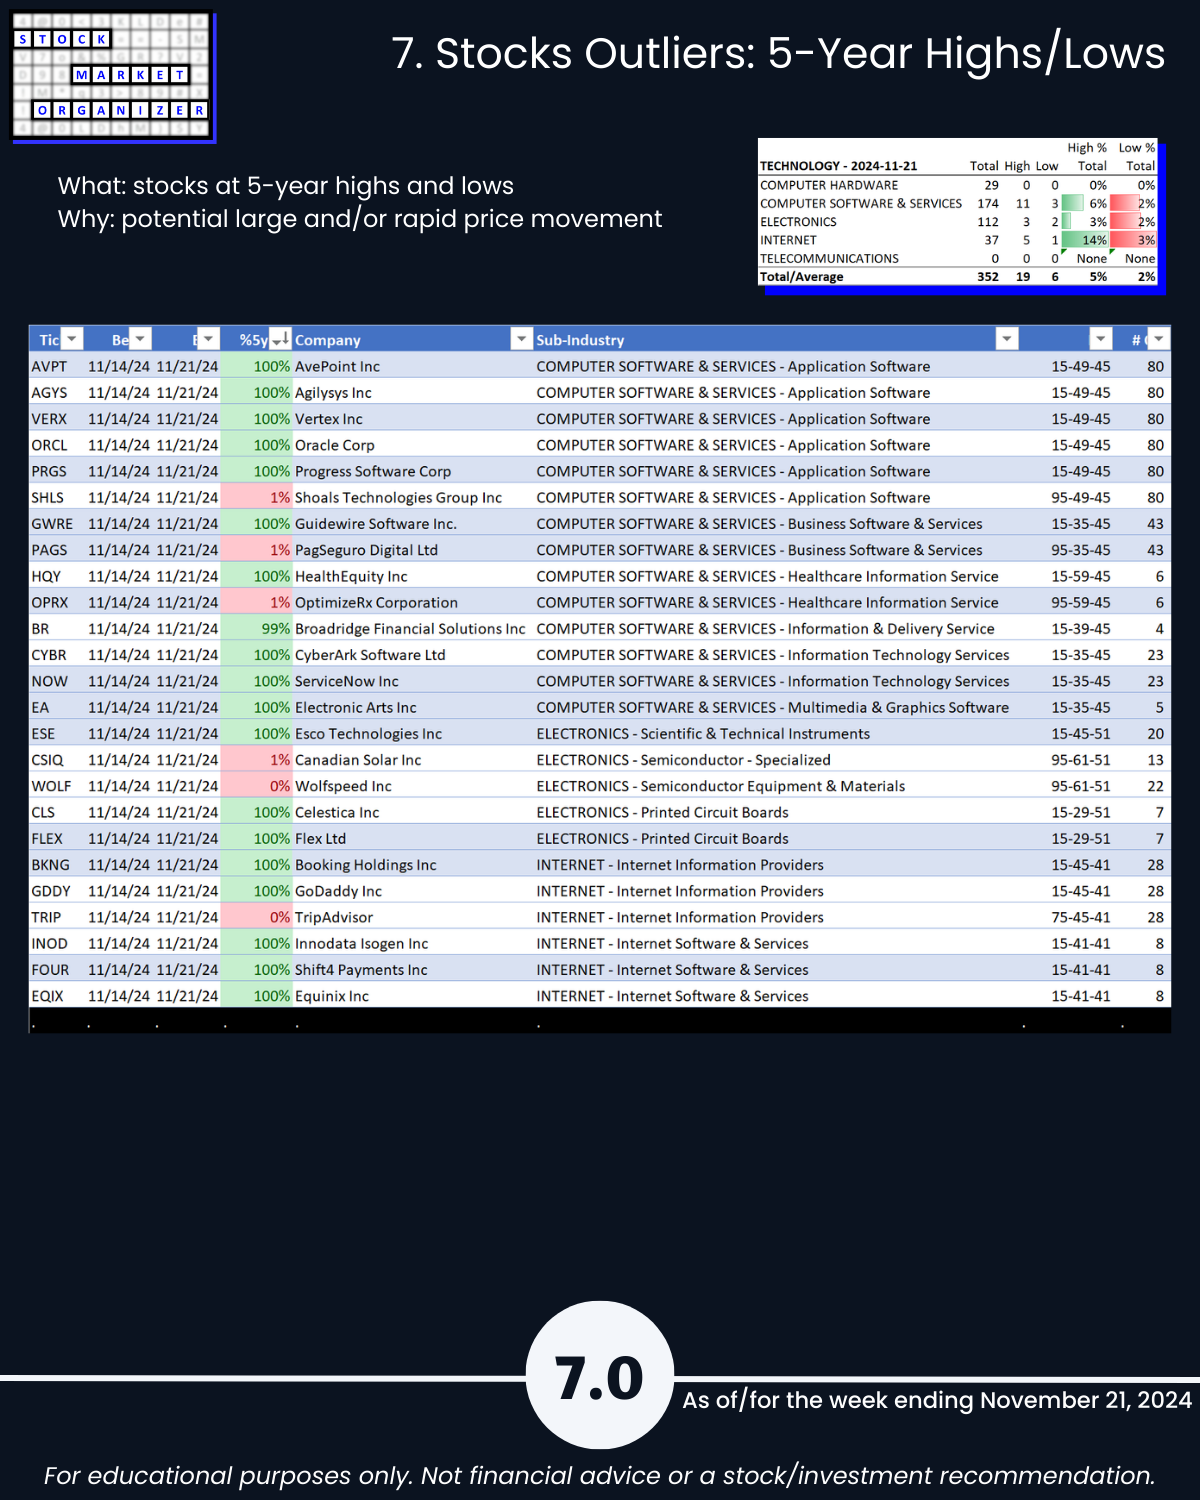
This section shows the strongest of the strong and the weakest of the weak, hitting 5-year highs and lows, respectively. The strongest are the leaders of the market that is hitting new highs. Meanwhile, there appears to be no rational reason to hold weak stocks that are at multi-year lows despite massive market tailwinds.