SMO Exclusive: Strength Report Technology Sector 2024-03-28

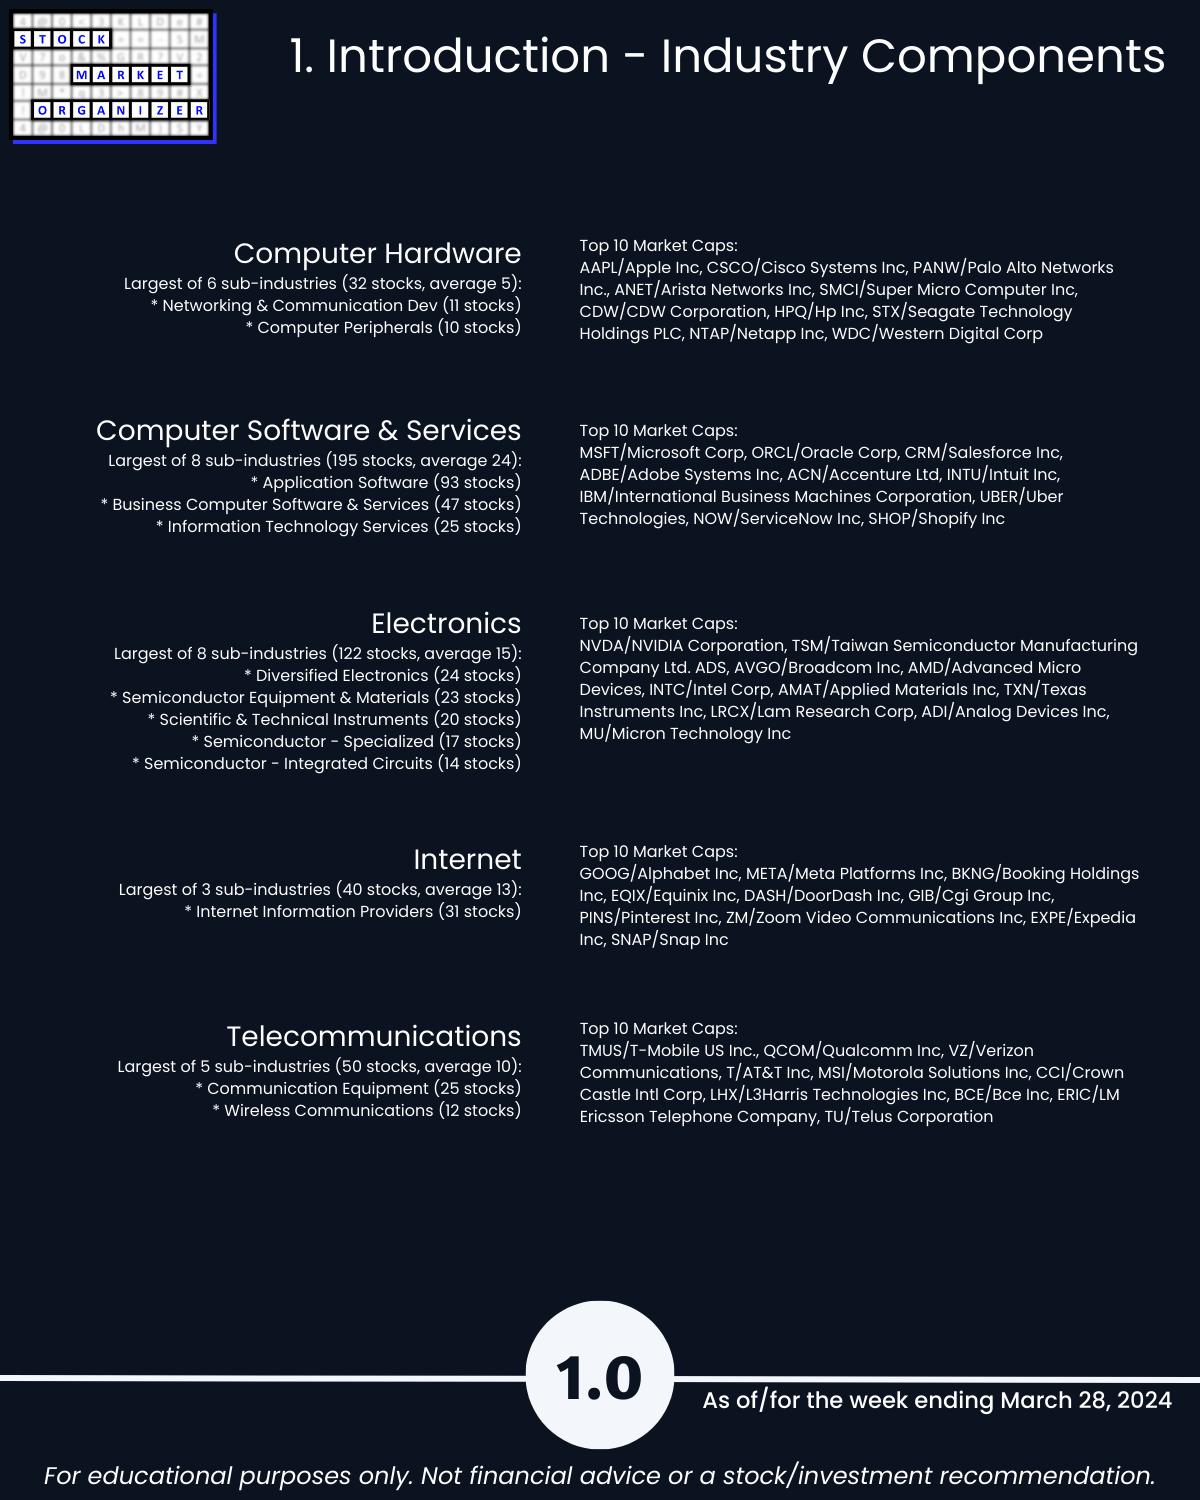
As posted yesterday Financial strengthened for the week. Not so Tech as of 3/28/24. For a unique U.S. stock market view based on strength, see the Technology sector report reflecting the past week’s sideways action of the Computer Hardware, Software/Services, Electronics (chips/semis), Internet, and Telecommunications industries.
WHY SHOULD YOU CARE ABOUT THIS?
This perspective is unique and can complement all others because I created it from scratch to answer the question I have that I couldn’t get answered satisfactorily anywhere else.
If you have the same question I do, this analysis may be of help to you.
The question: what is happening in the market now?
The answer had to be objective, repeatable, and actionable.
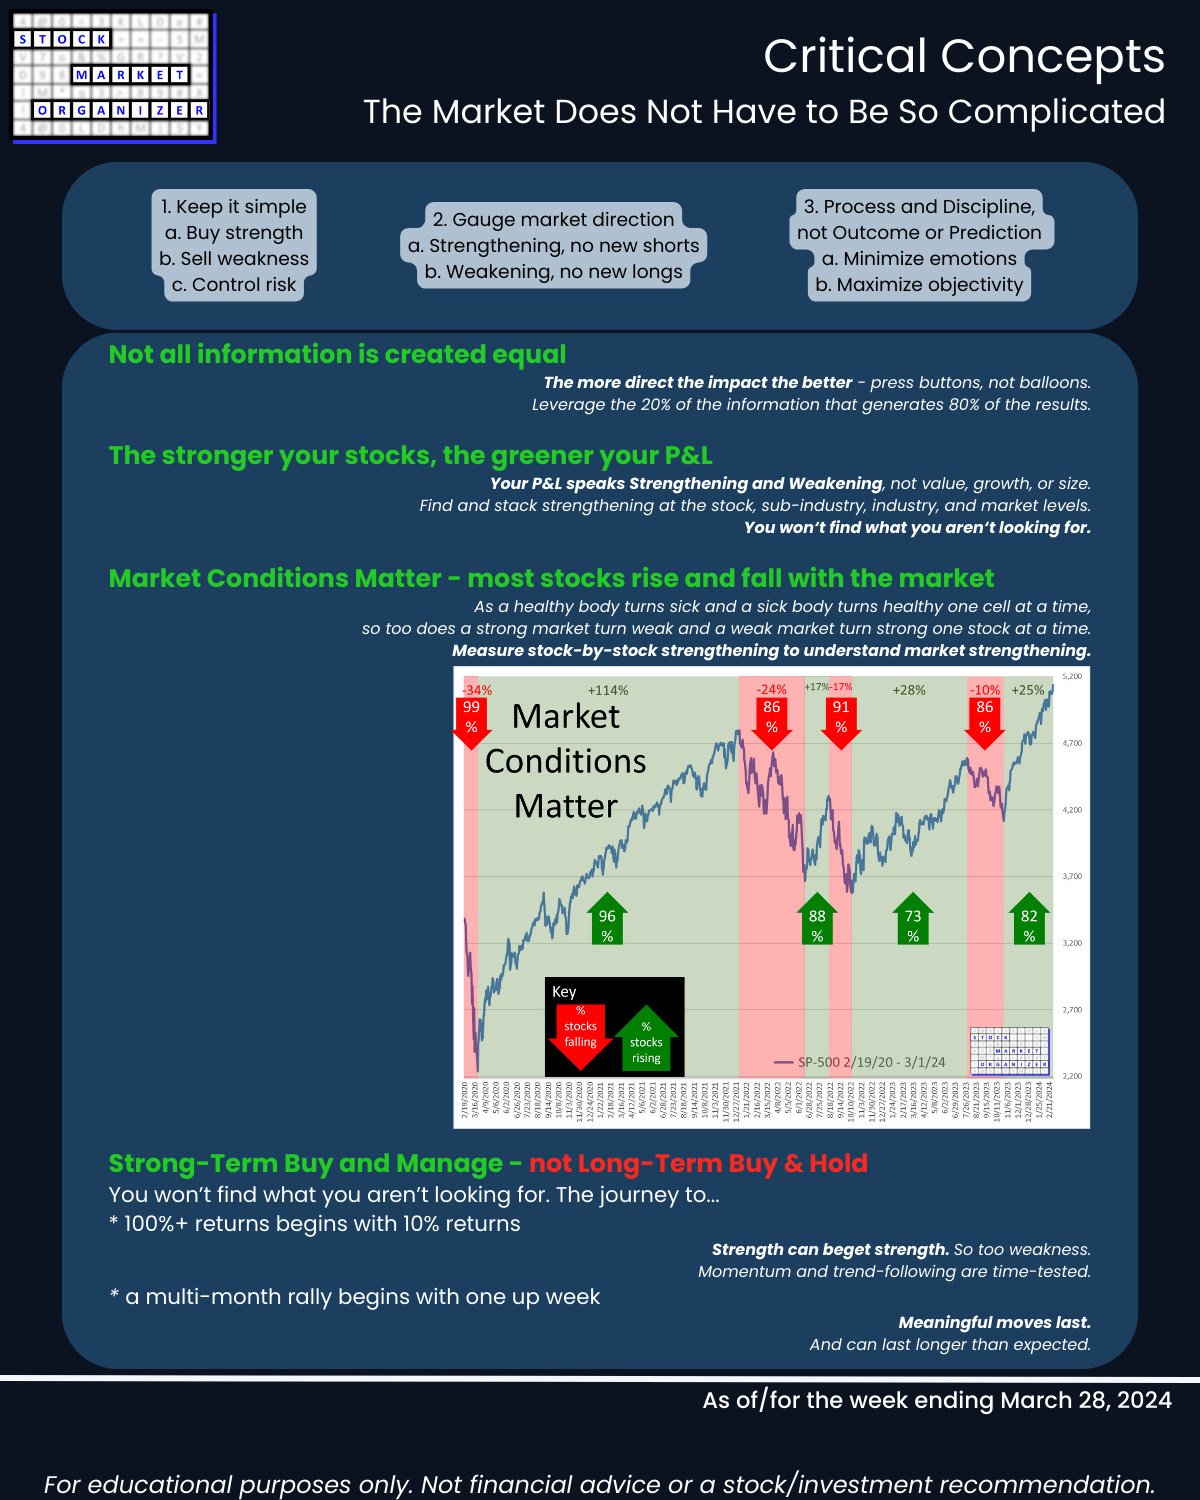
And the answer is important because Market Conditions Matter. Most stocks do what the market does so if you ignore this you are ignoring critical information.
WHO IS THIS FOR?
If you believe as do I that the market does not have to be so complicated, this analysis may resonate with you.
At its core, it asks the market what is happening. The result reflects zero bias, discretion, emotions, feelings, interpretations, judgments, and opinions.
This system cannot state what will happen. I could be wrong but I don’t think anything can. Since I personally cannot accurately predict with any consistency and without luck I have to settle for this system I have created.
If you also cannot predict, maybe the information contained within can help you as it helps me.
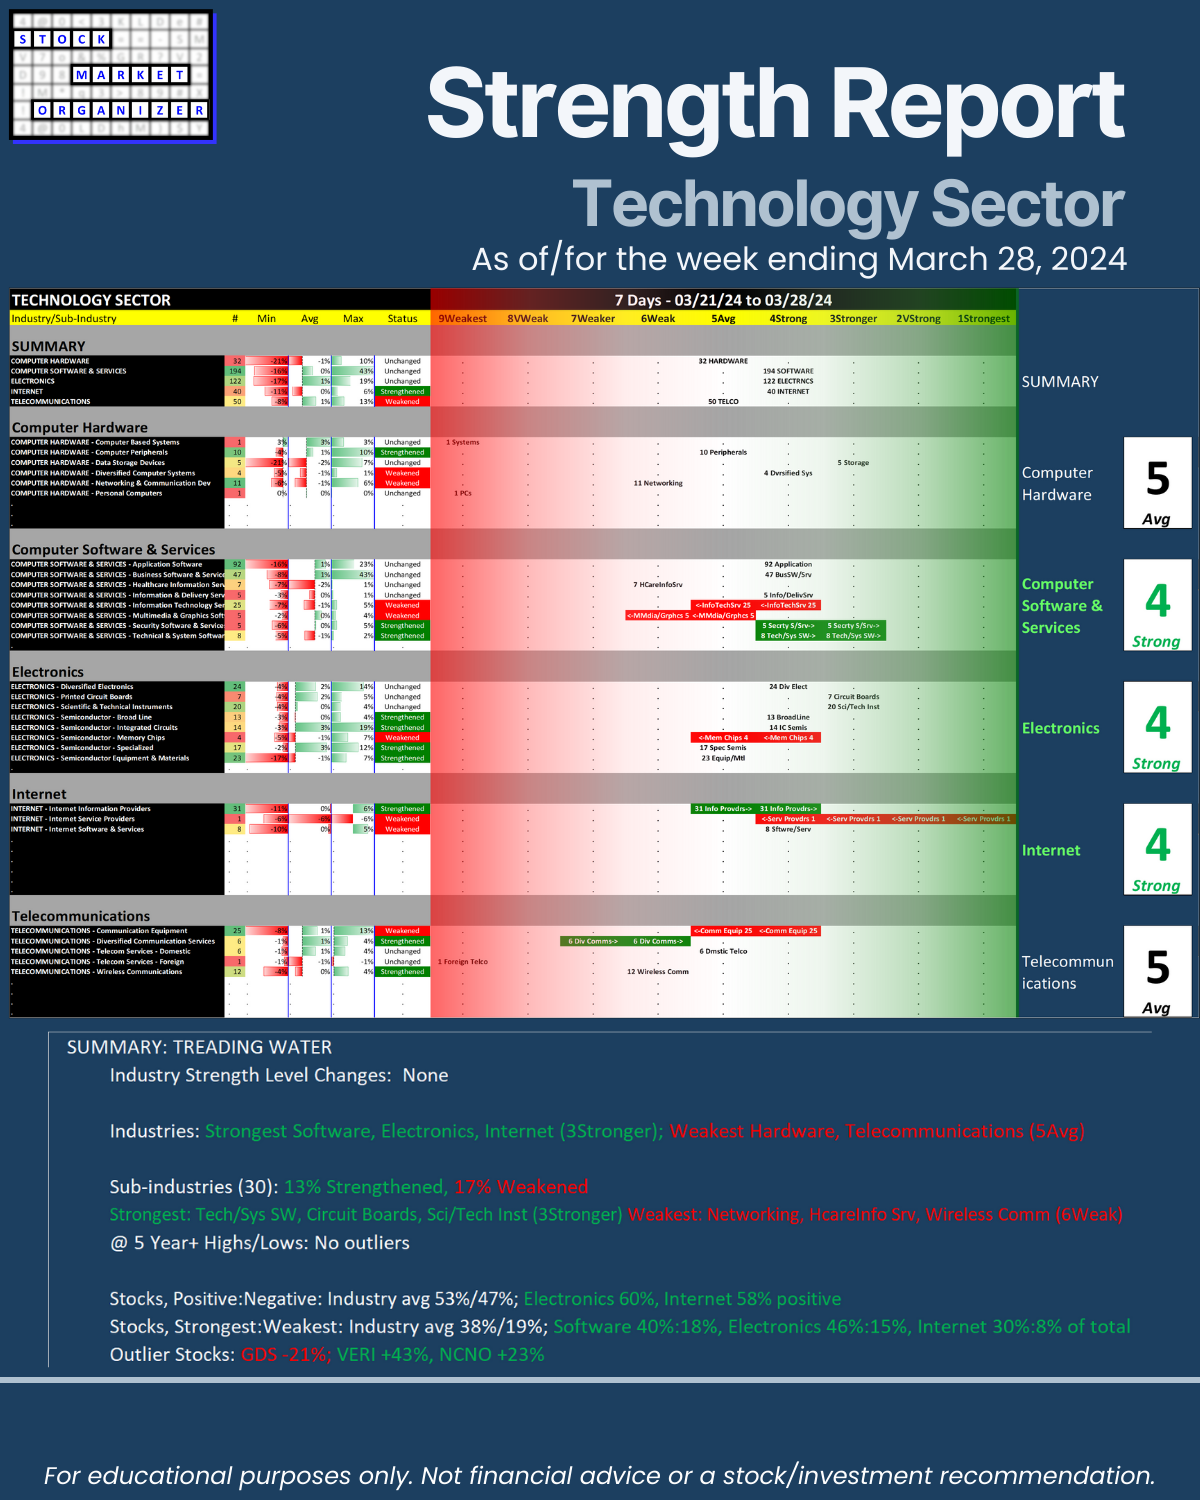
TECHNOLOGY SECTOR SUMMARY 3/28/24: TREADING WATER
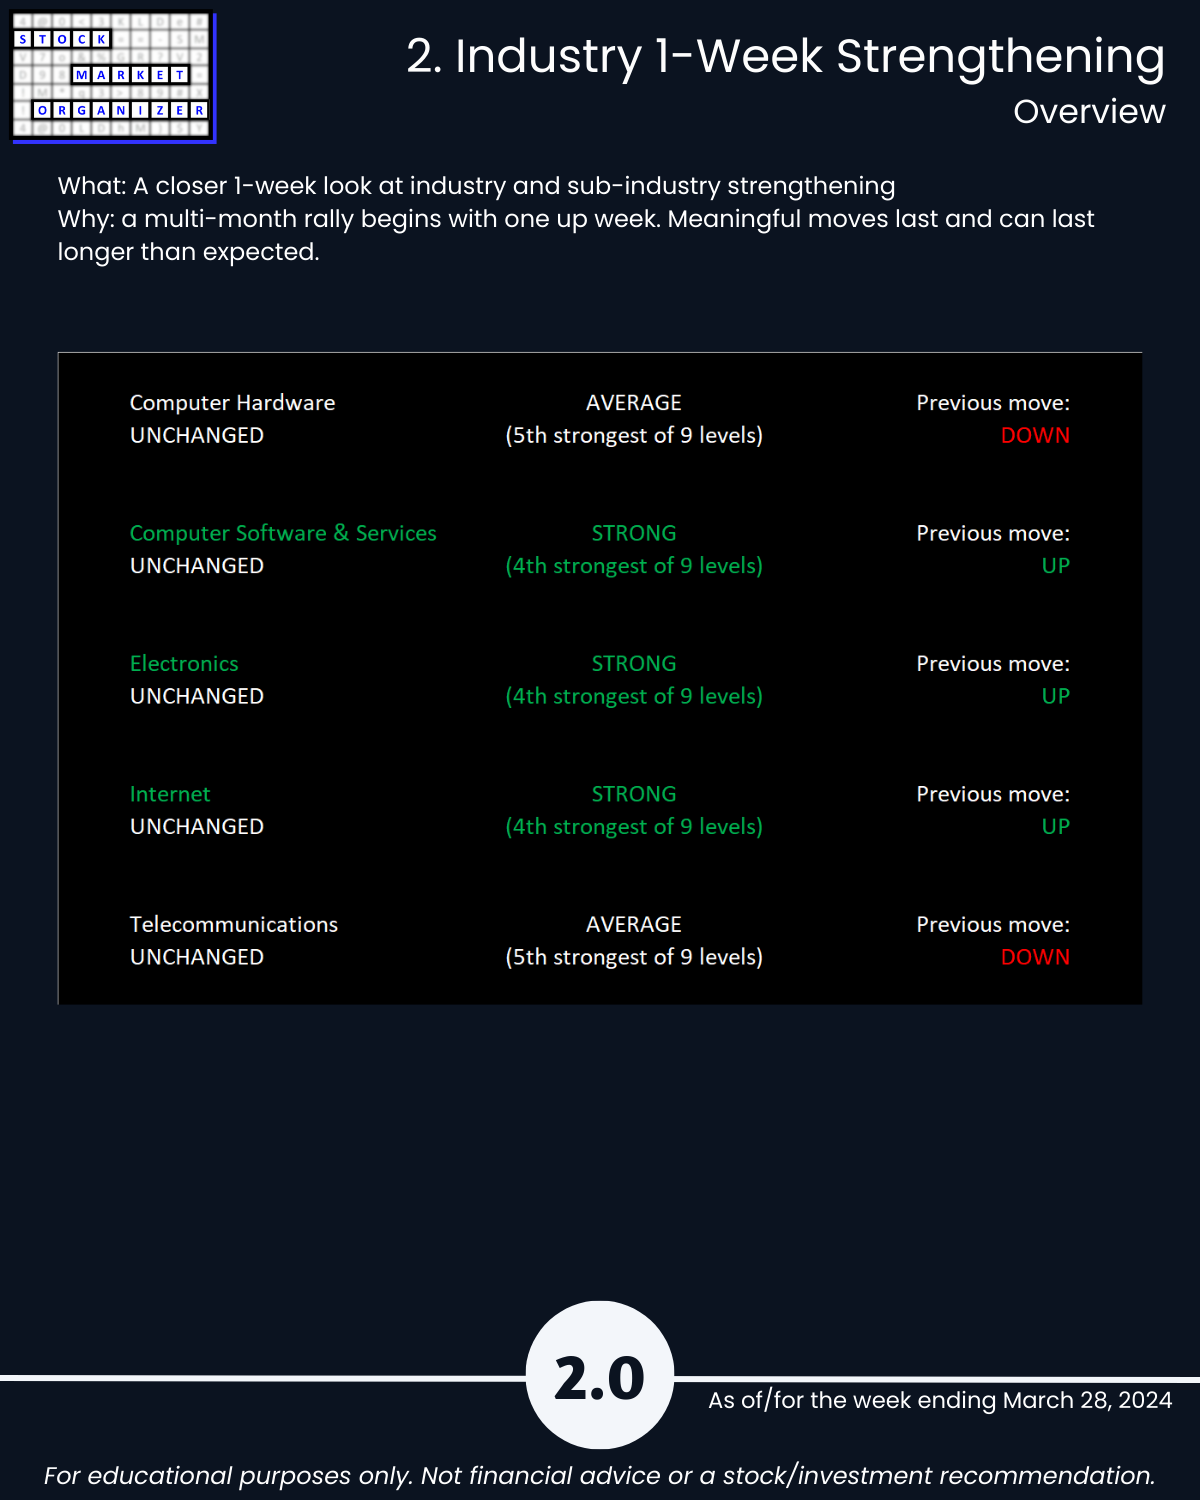
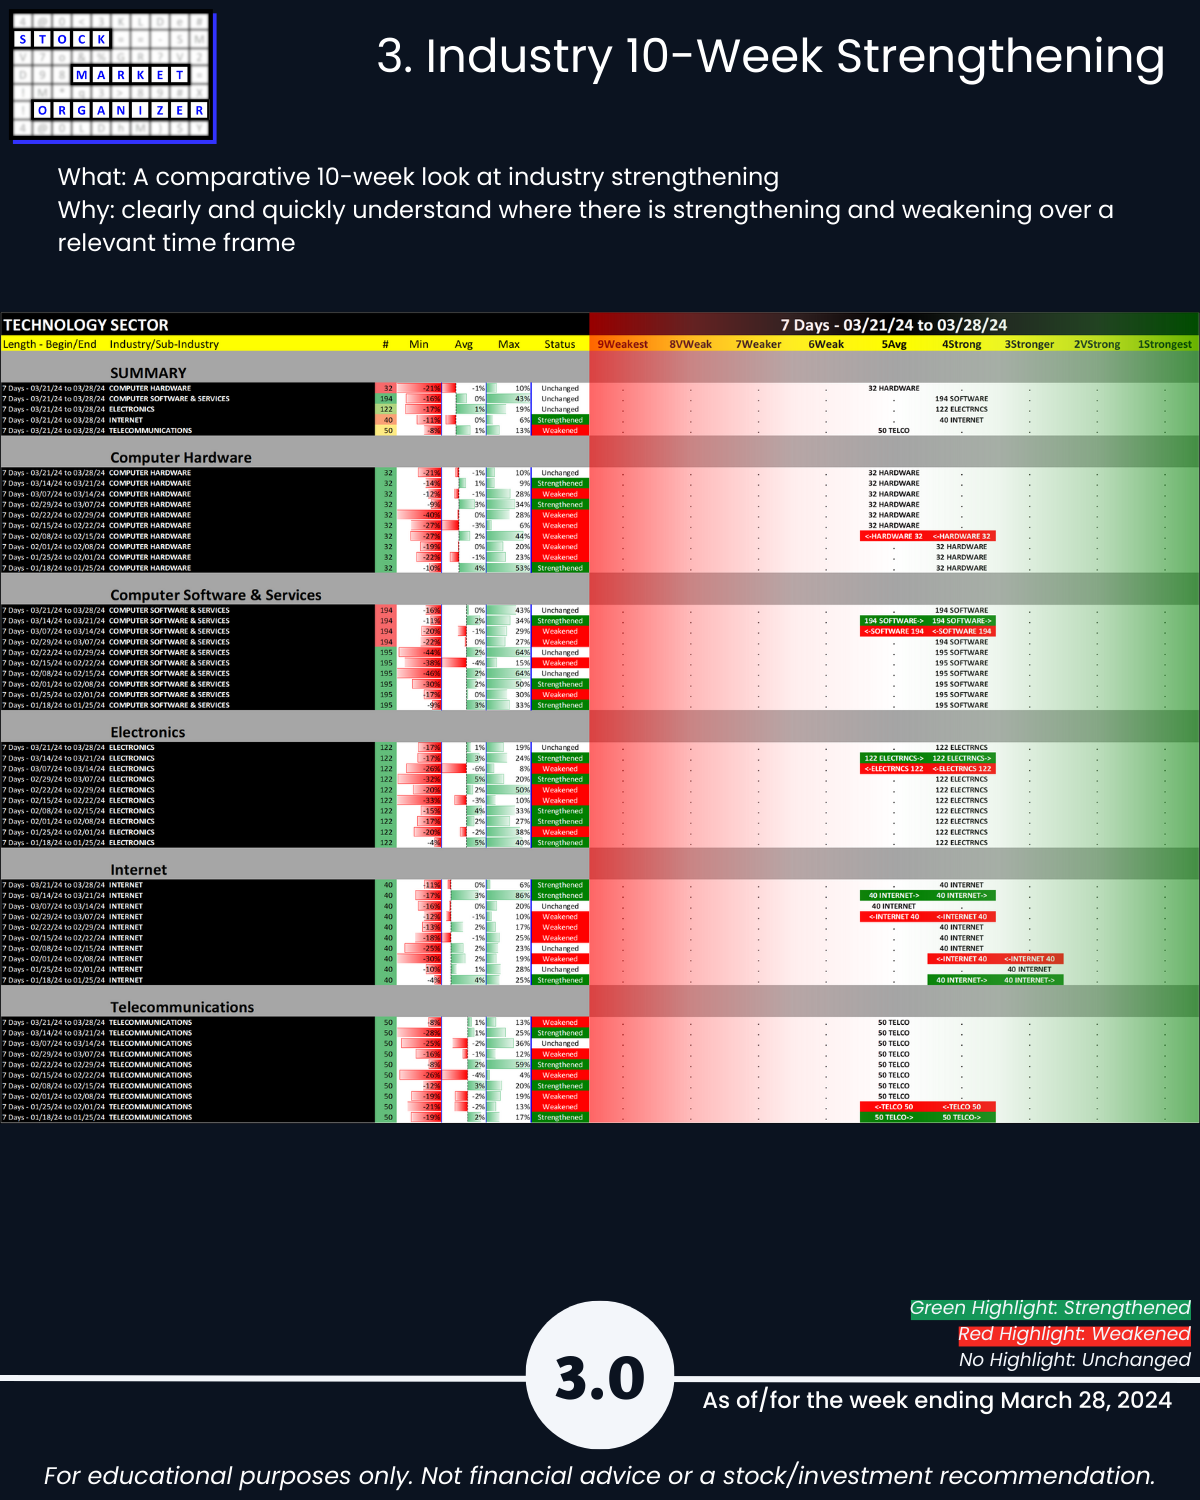
🔹 Industry Strength Level Changes: None
🔹 Industries: Strongest Software, Electronics, Internet (3Stronger); Weakest Hardware, Telecommunications (5Avg)
🔹 Sub-industries (30): 13% Strengthened, 17% Weakened
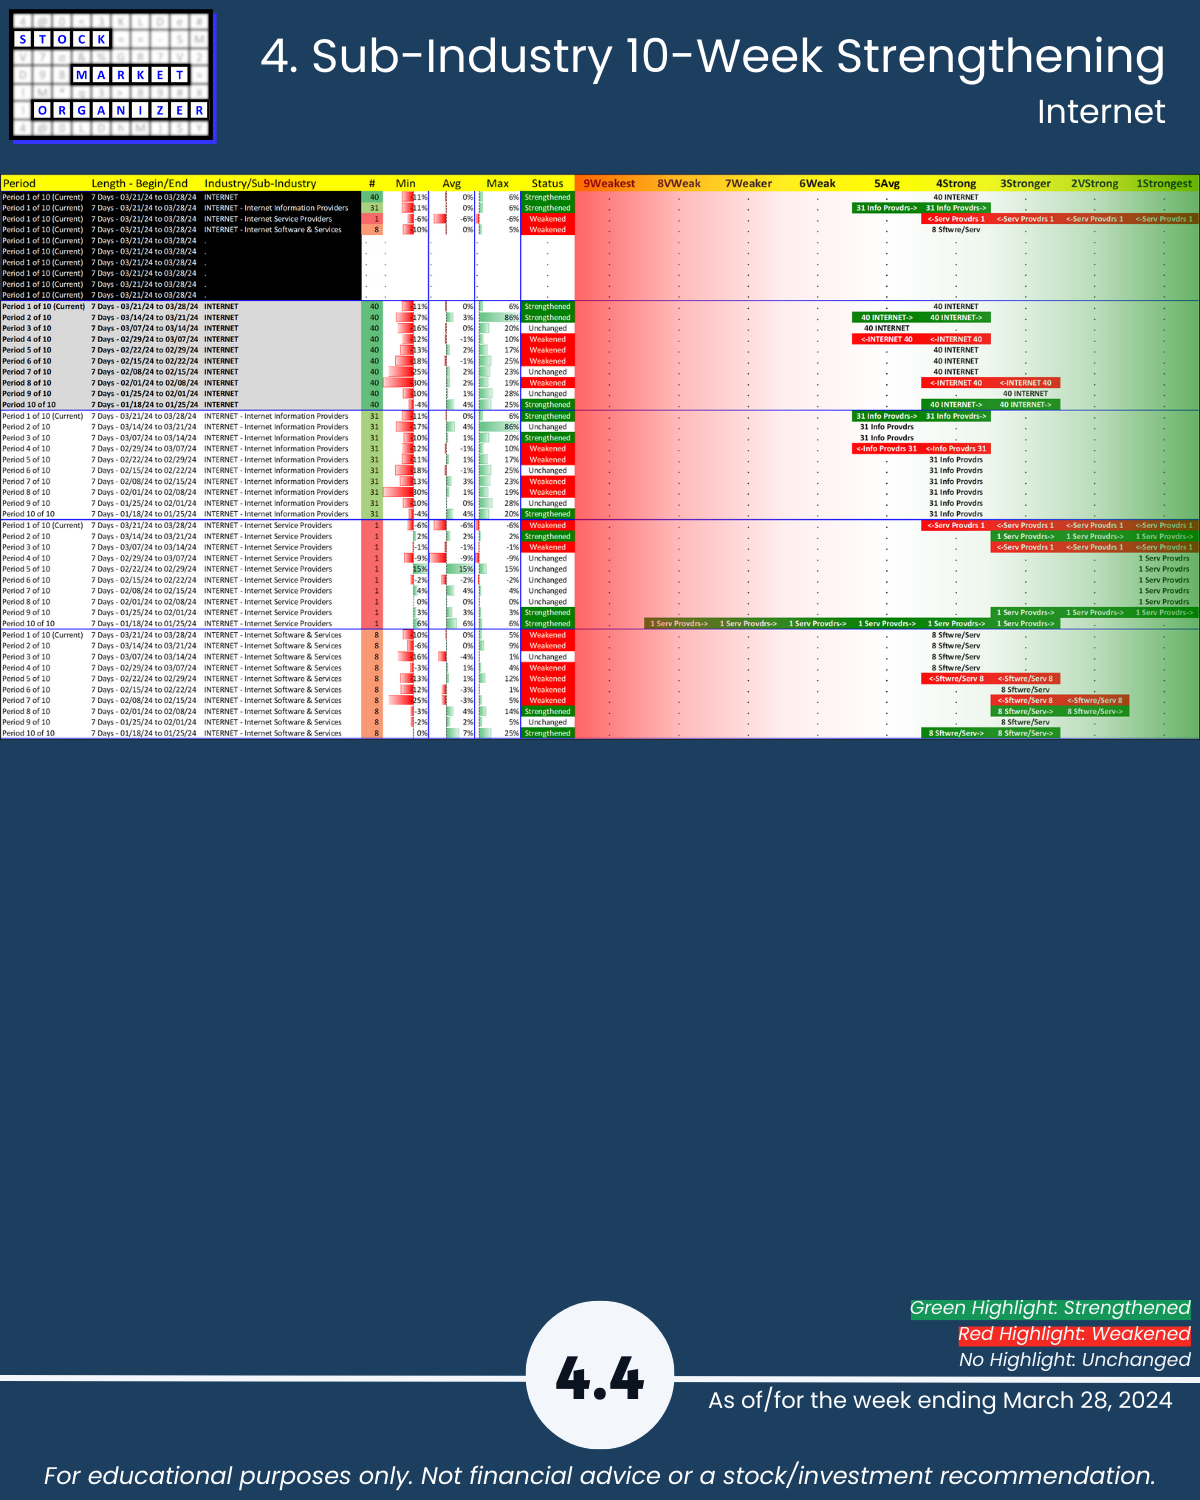
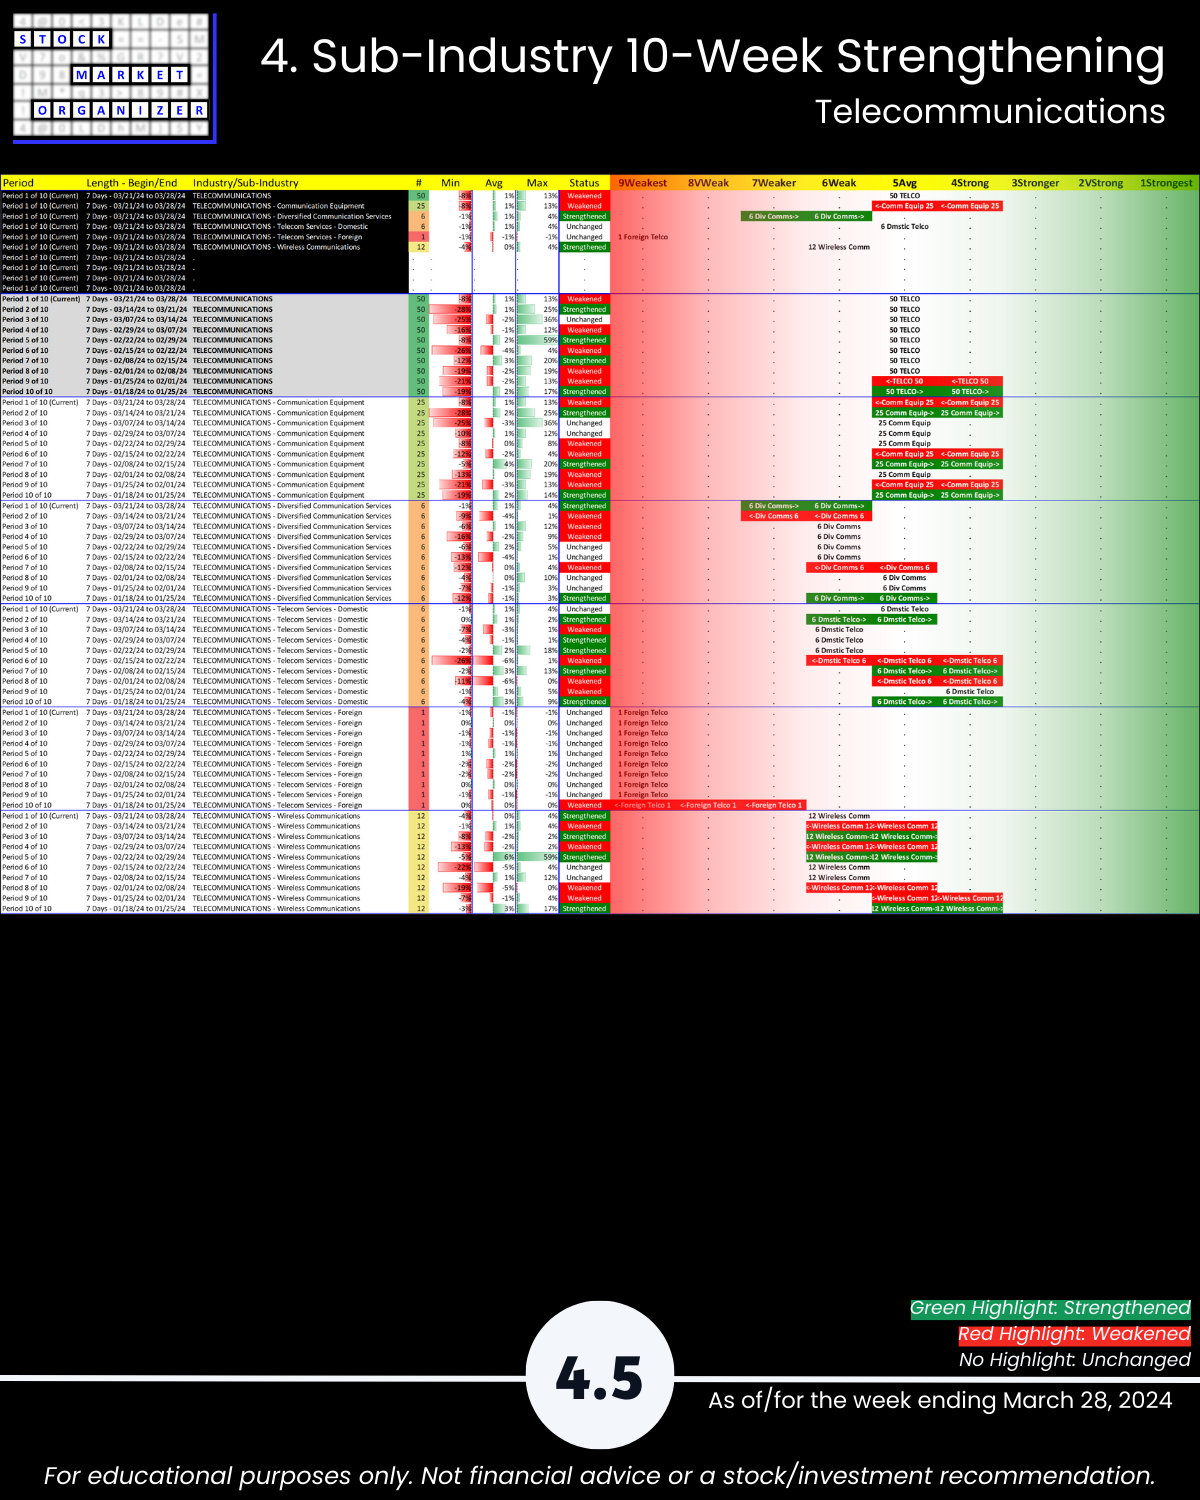
🔹 Strongest: Tech/Sys SW, Circuit Boards, Sci/Tech Inst (3Stronger) Weakest: Networking, HcareInfo Srv, Wireless Comm (6Weak)
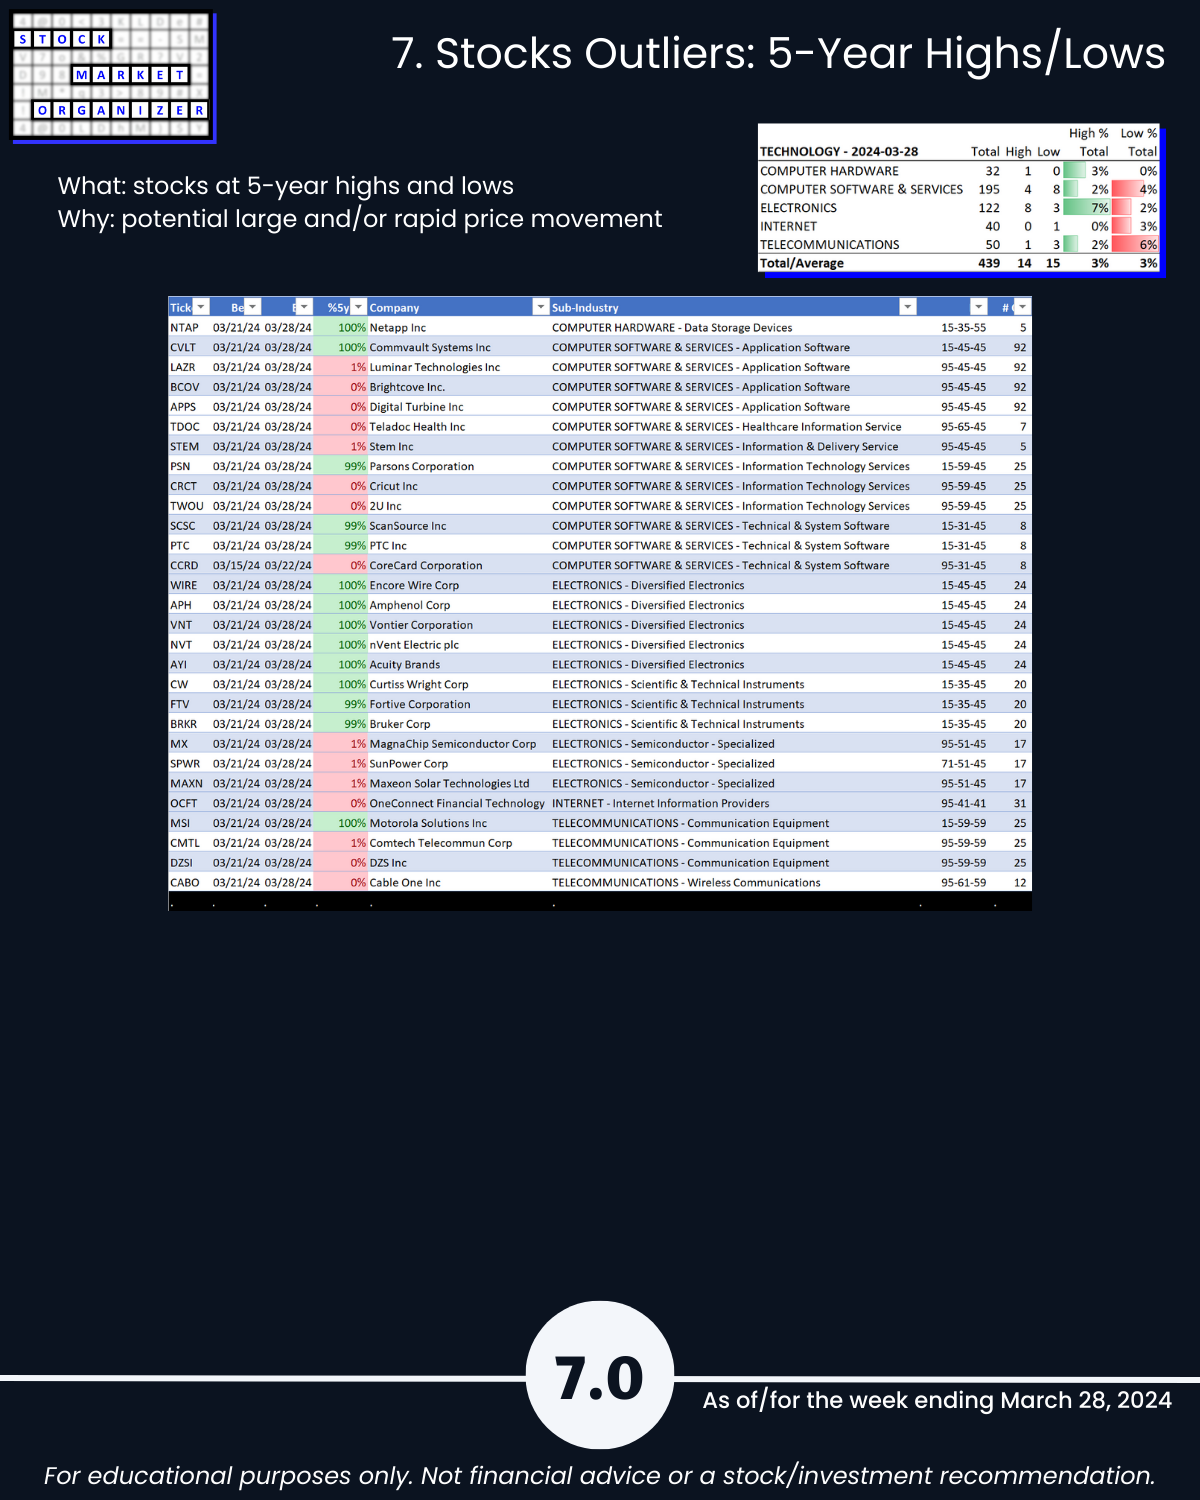
🔹 @ 5 Year+ Highs/Lows: No outliers
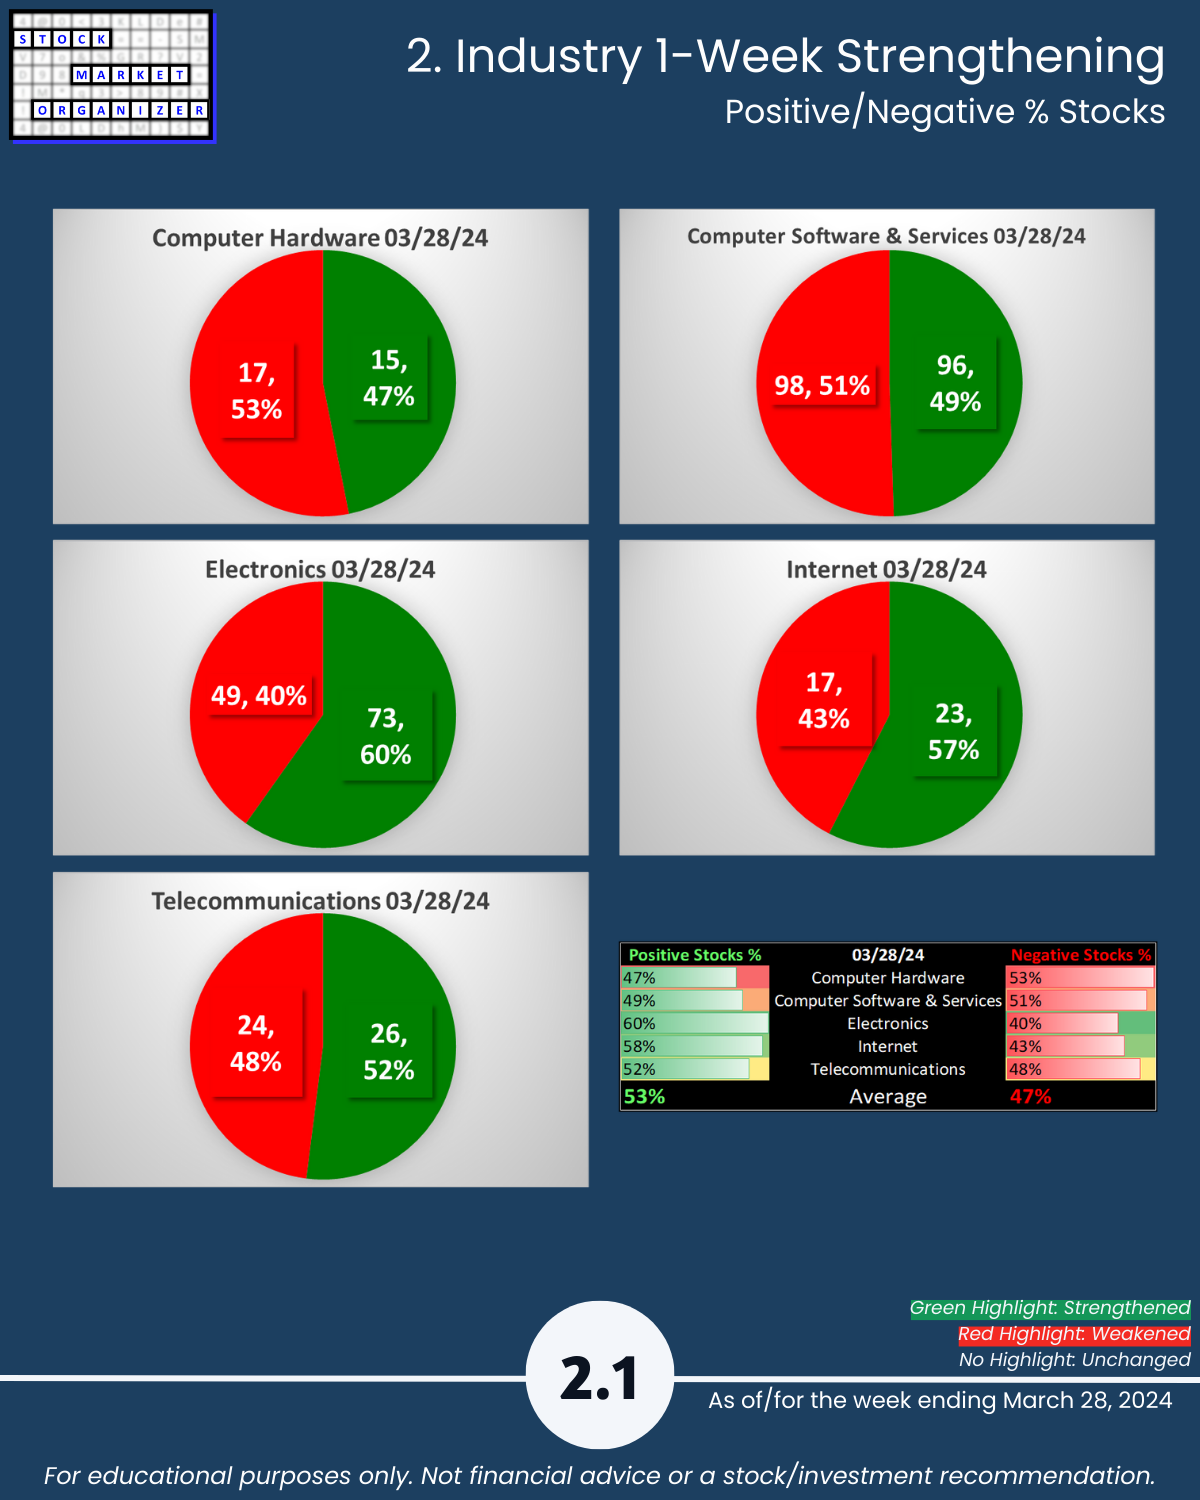
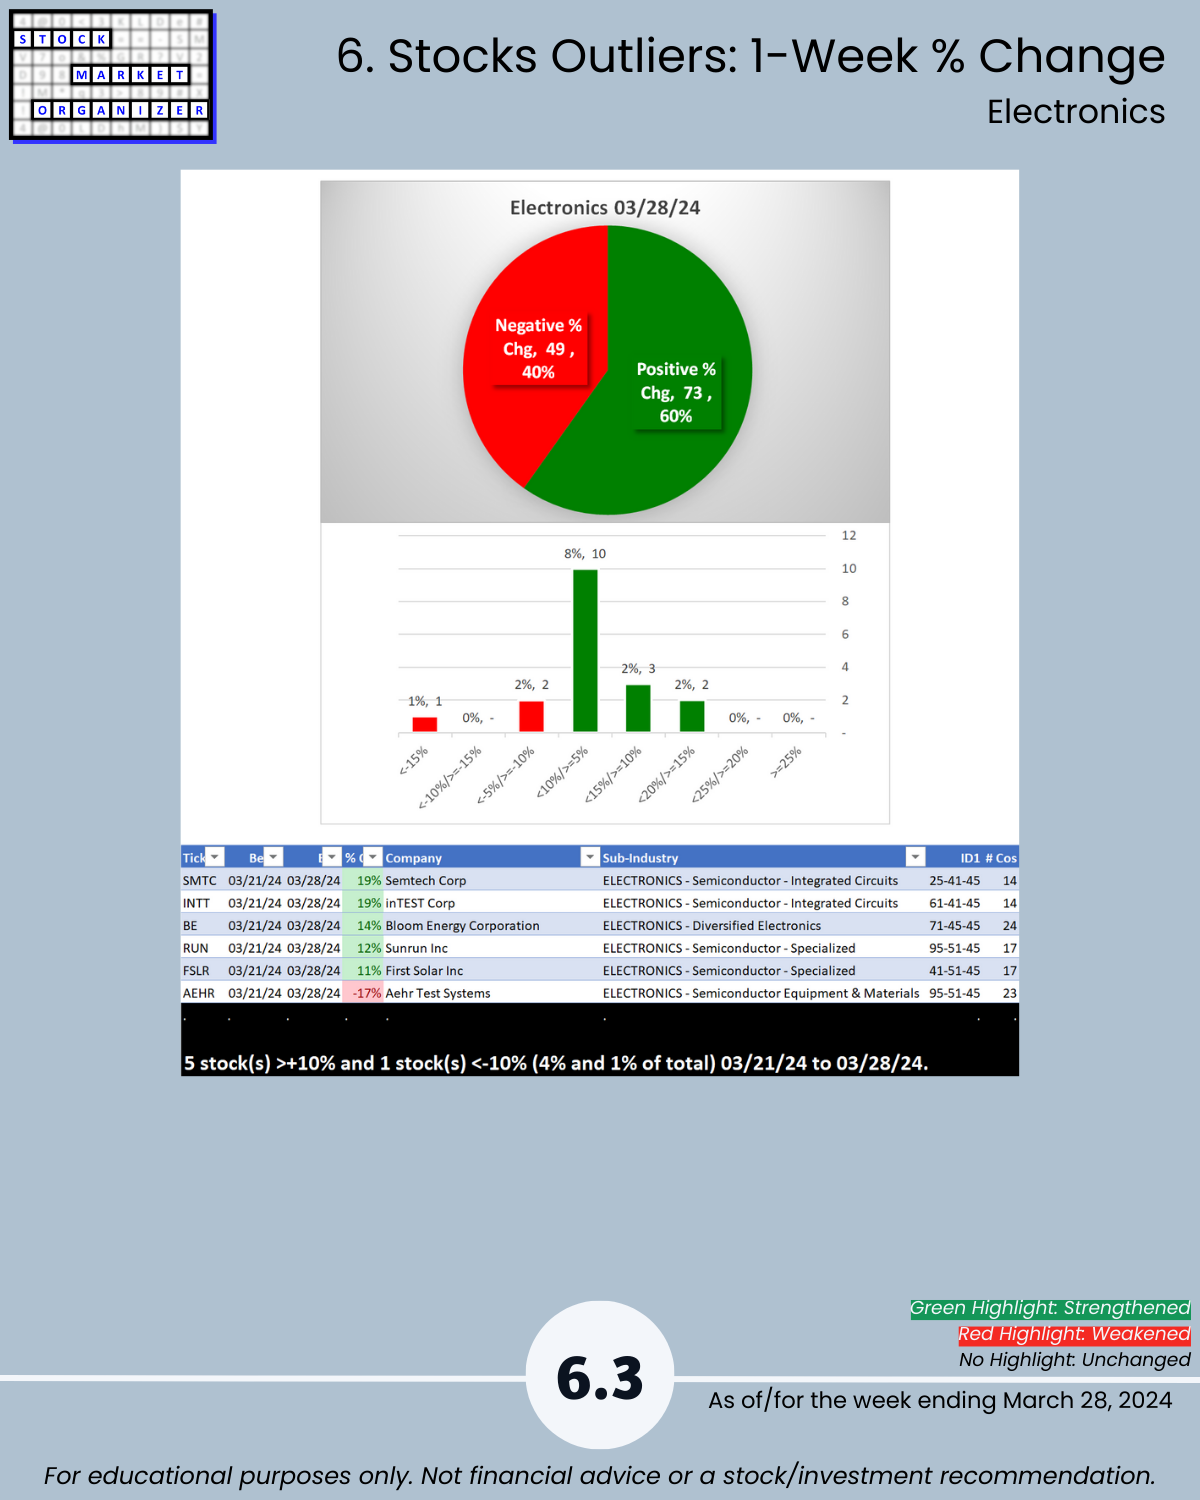
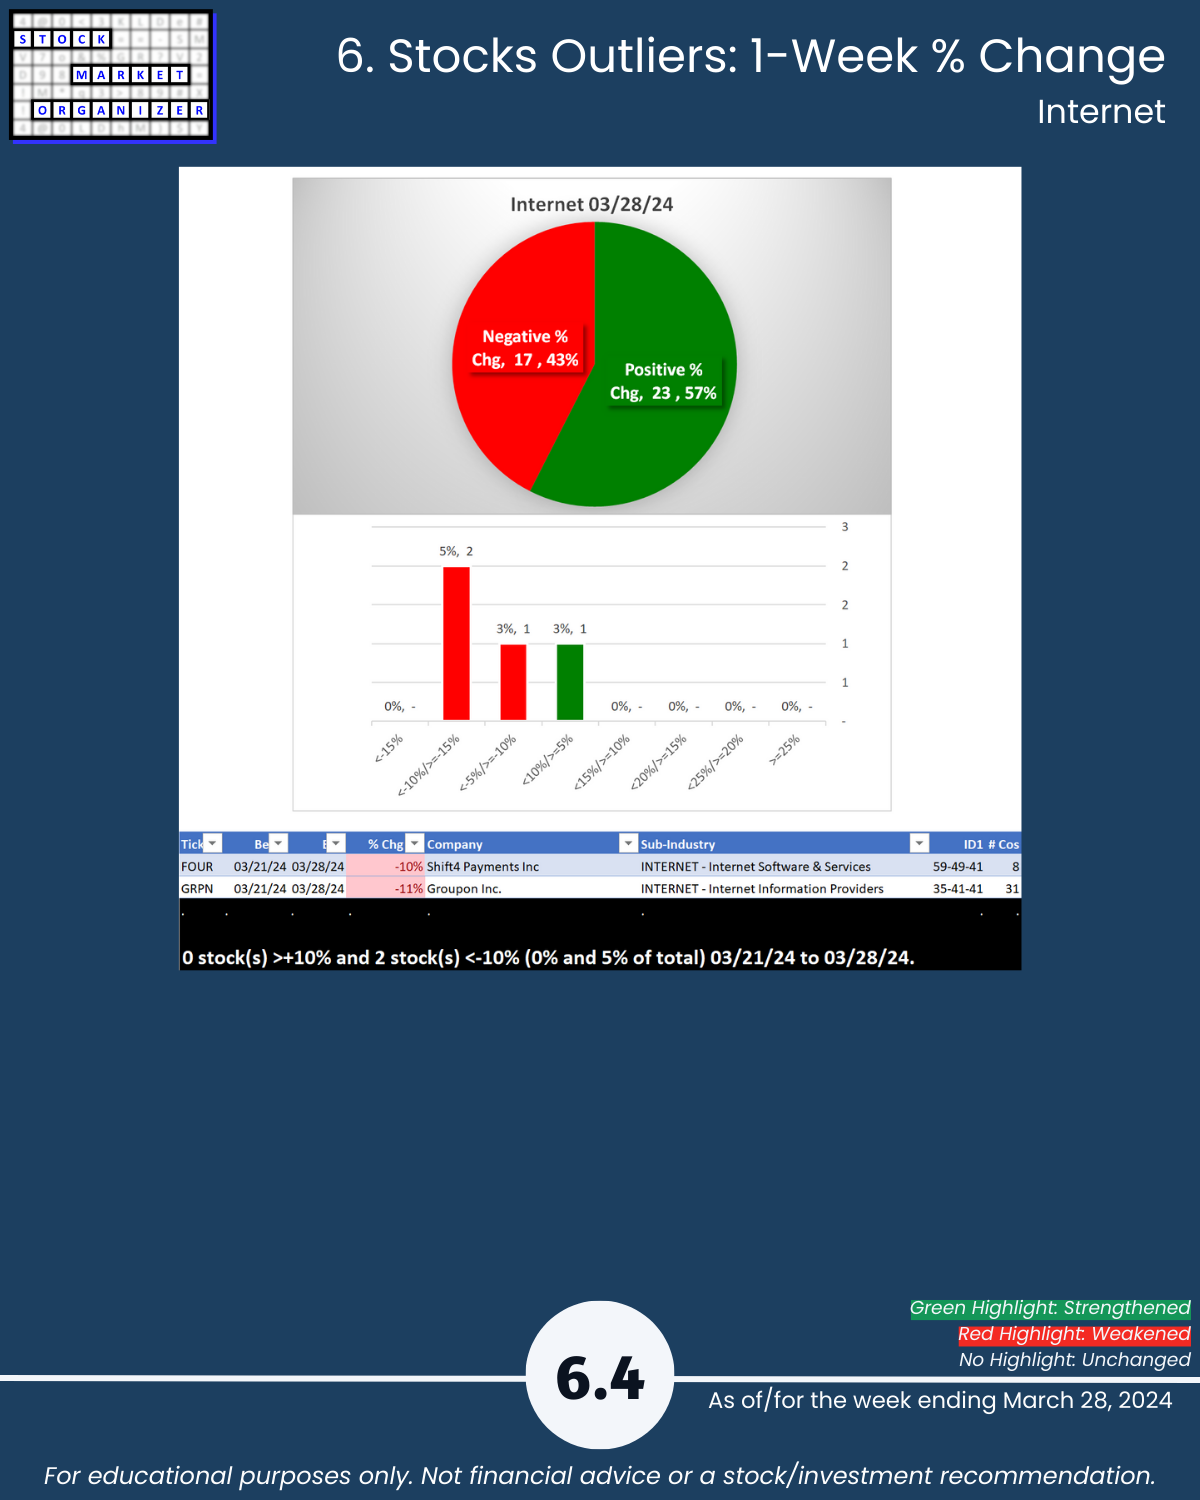
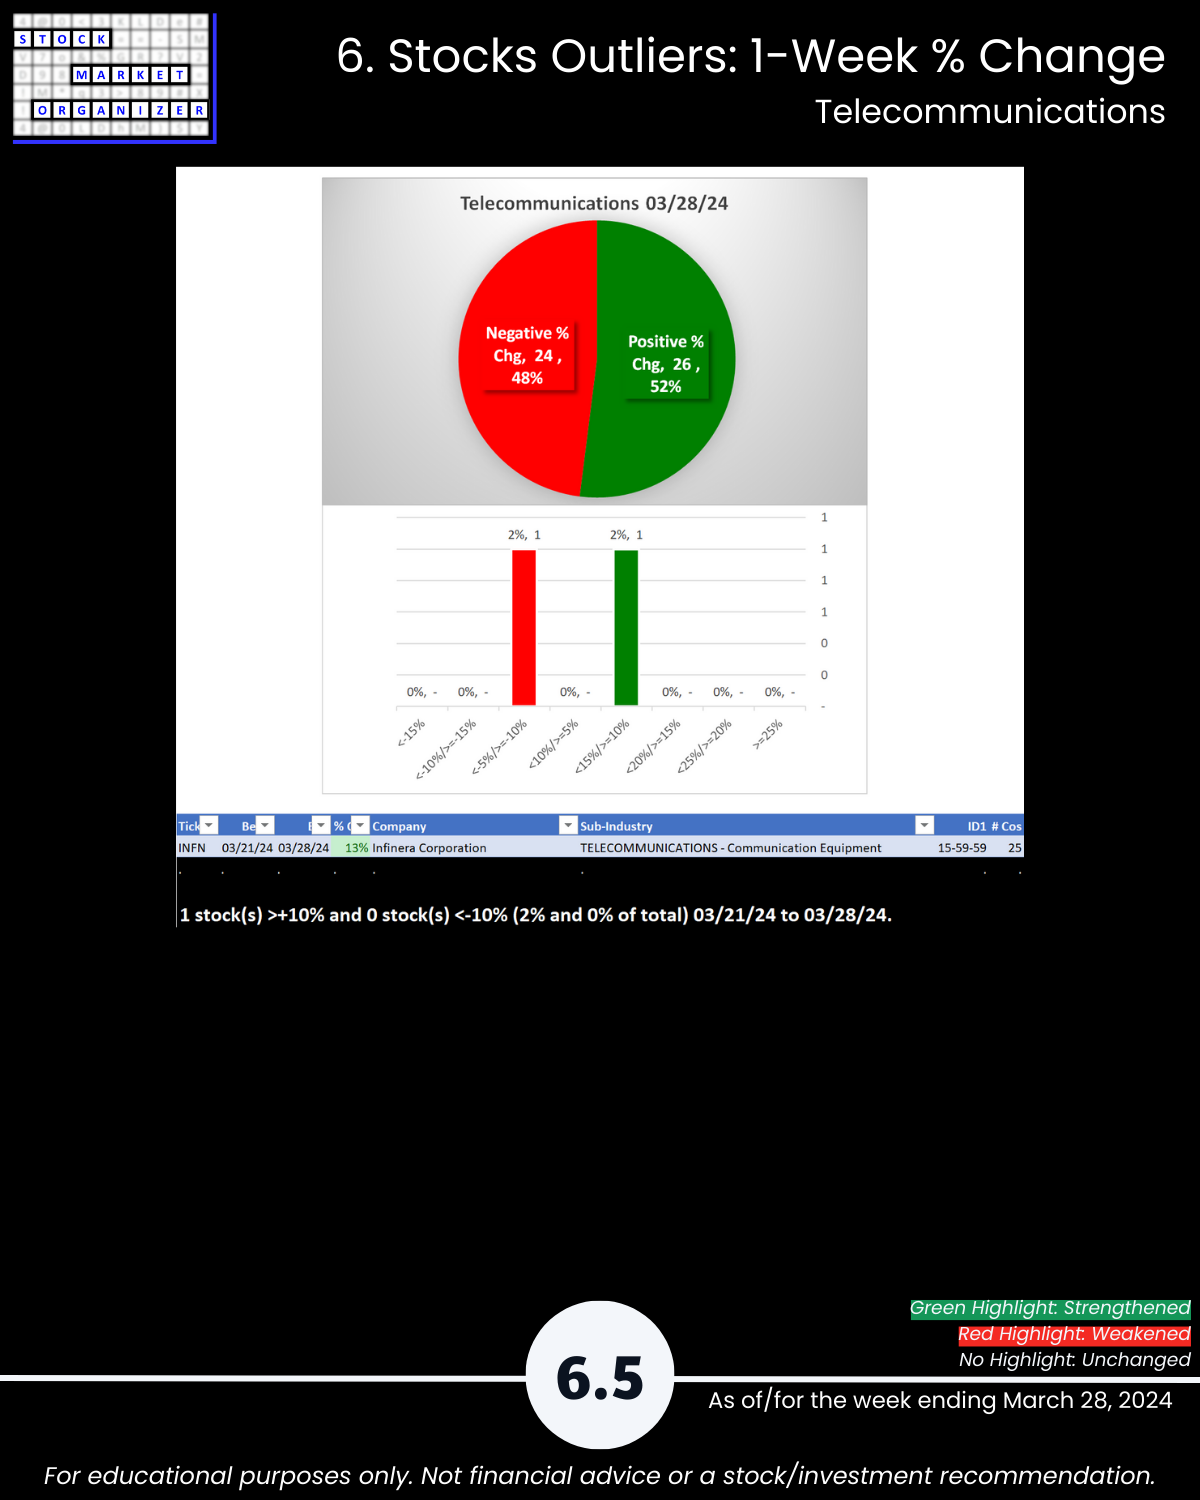
🔹 Stocks, Positive:Negative: Industry avg 53%/47%; Electronics 60%, Internet 58% positive
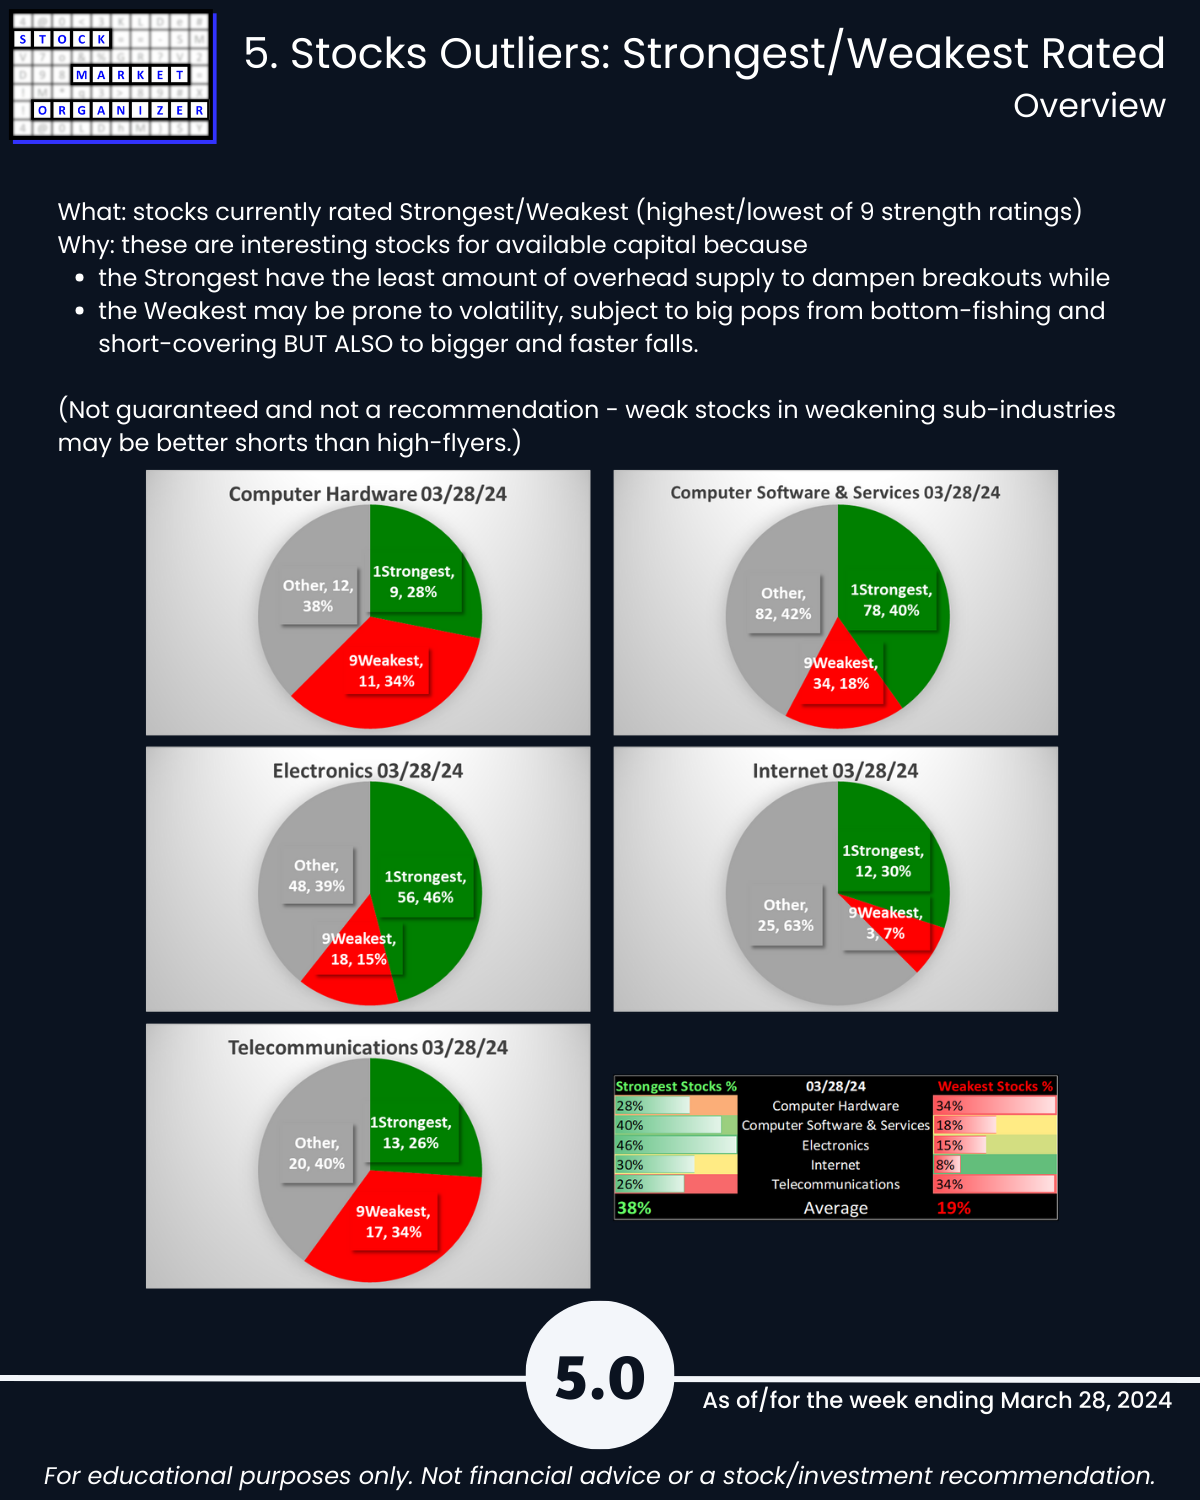
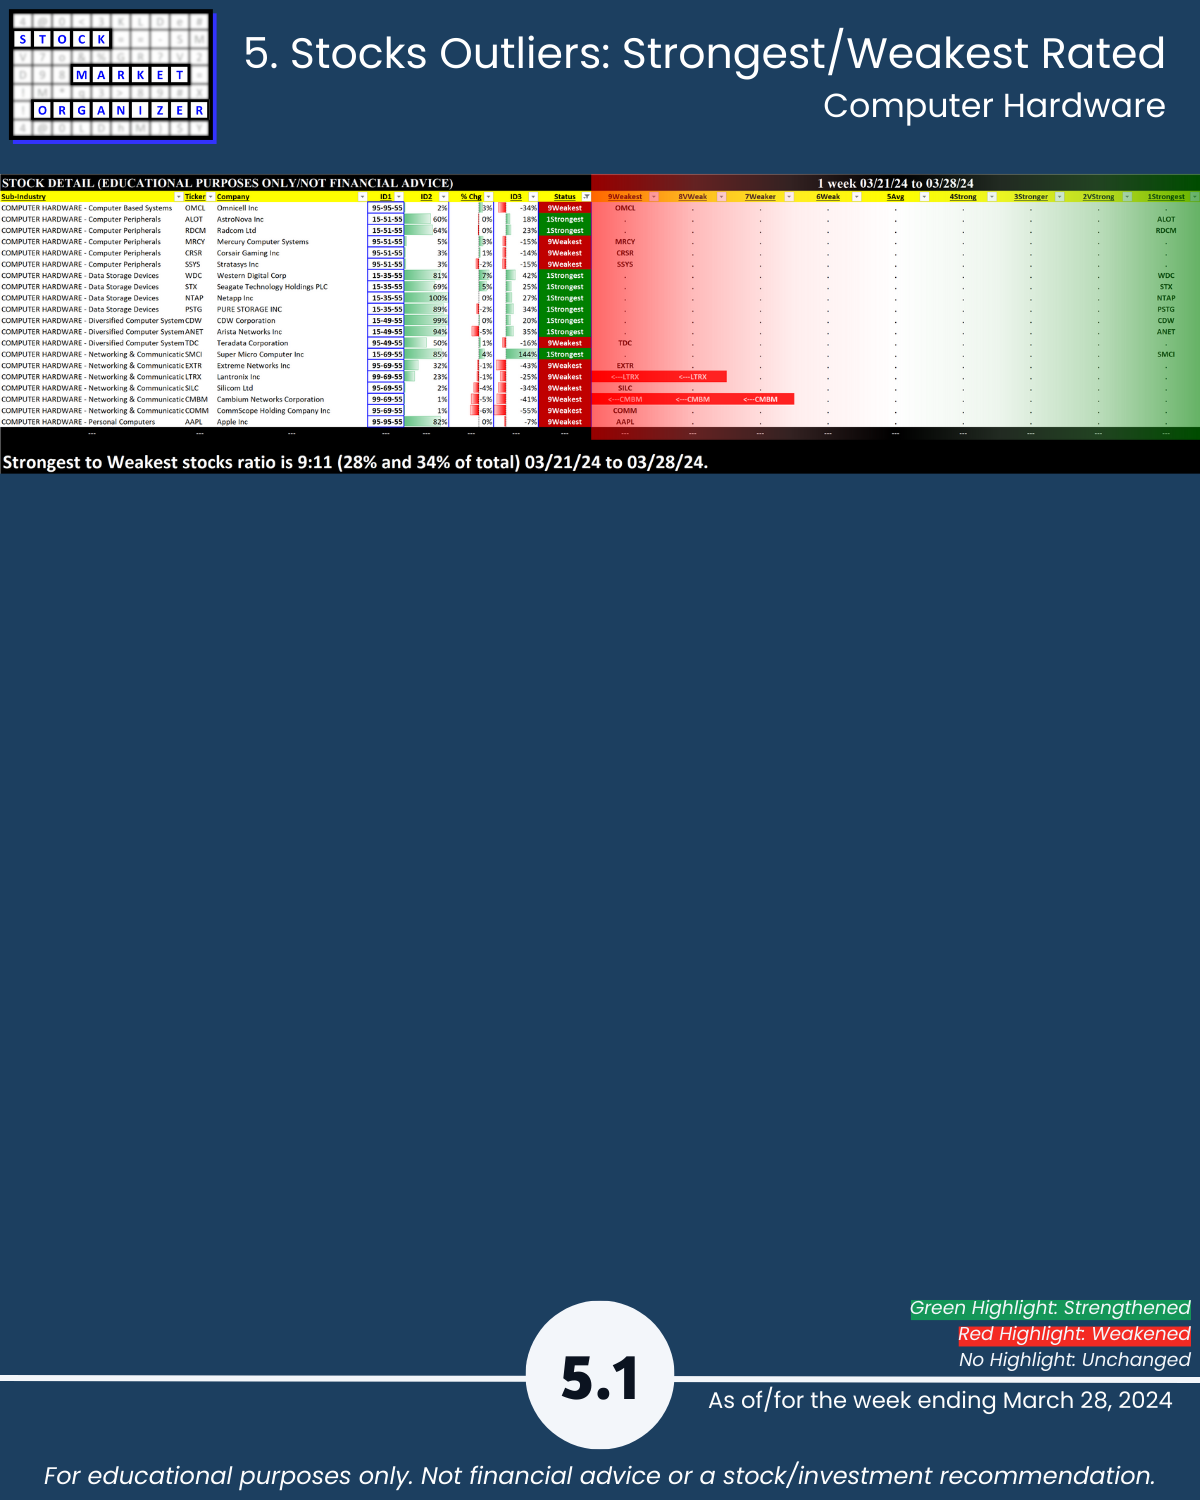
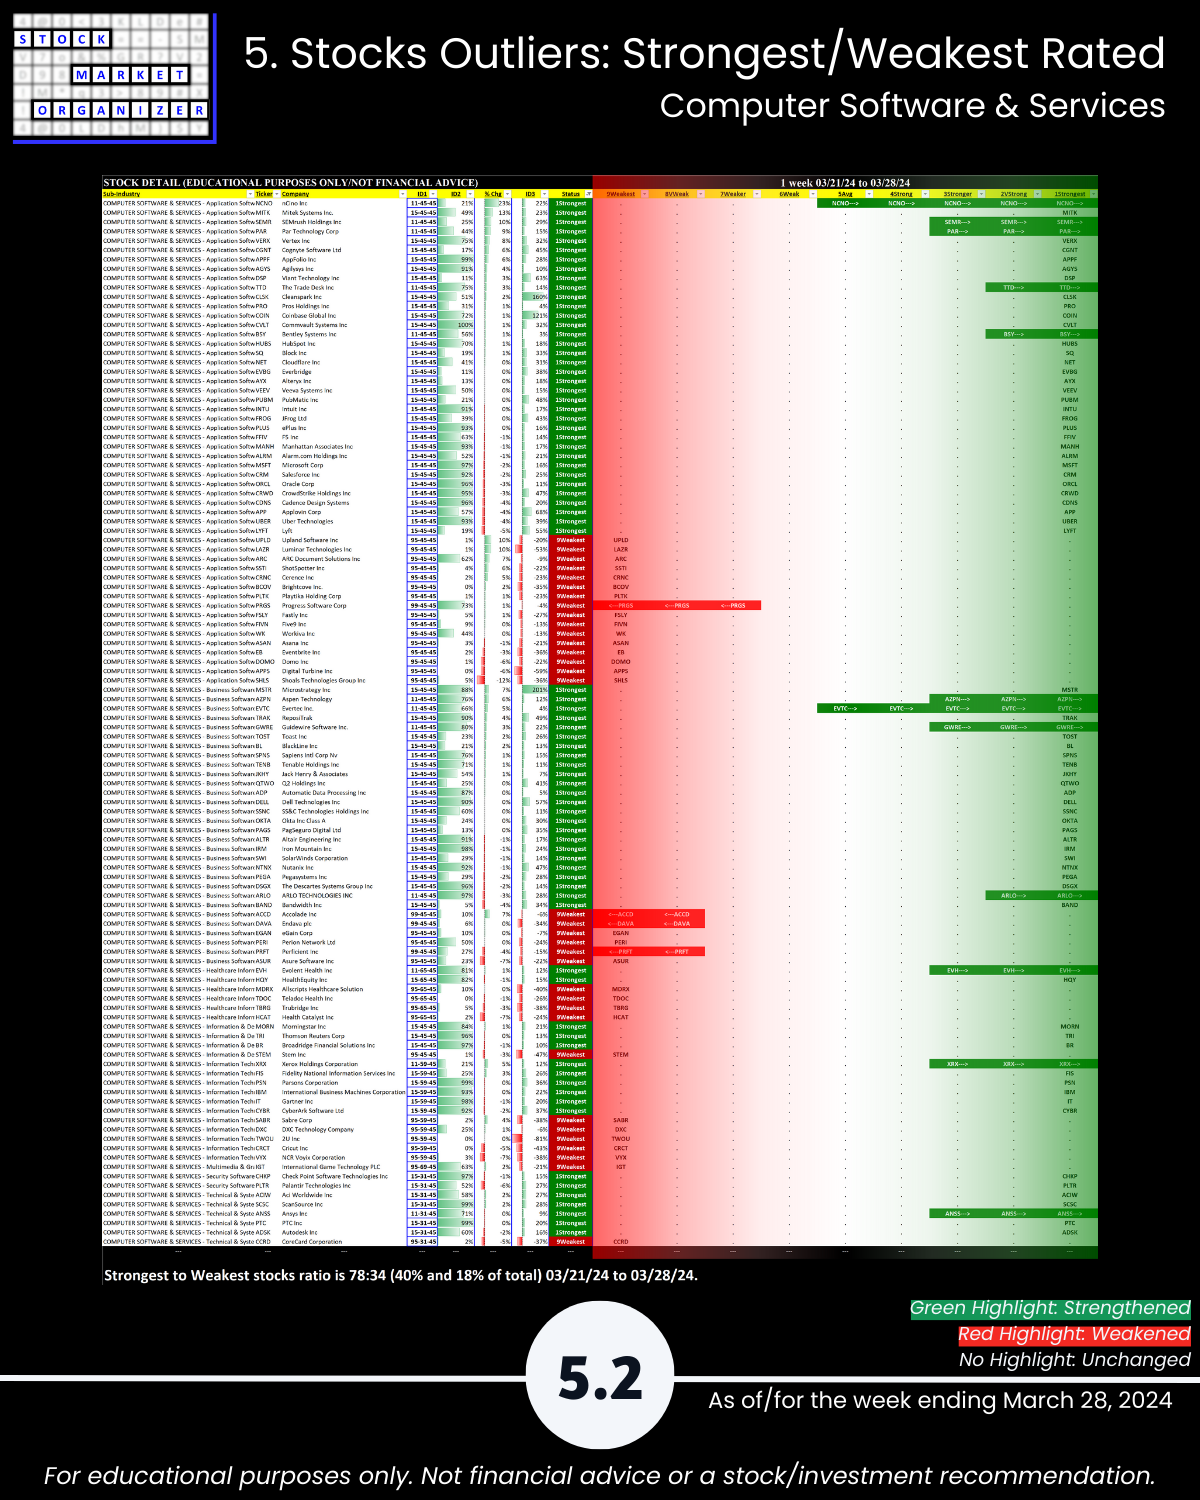
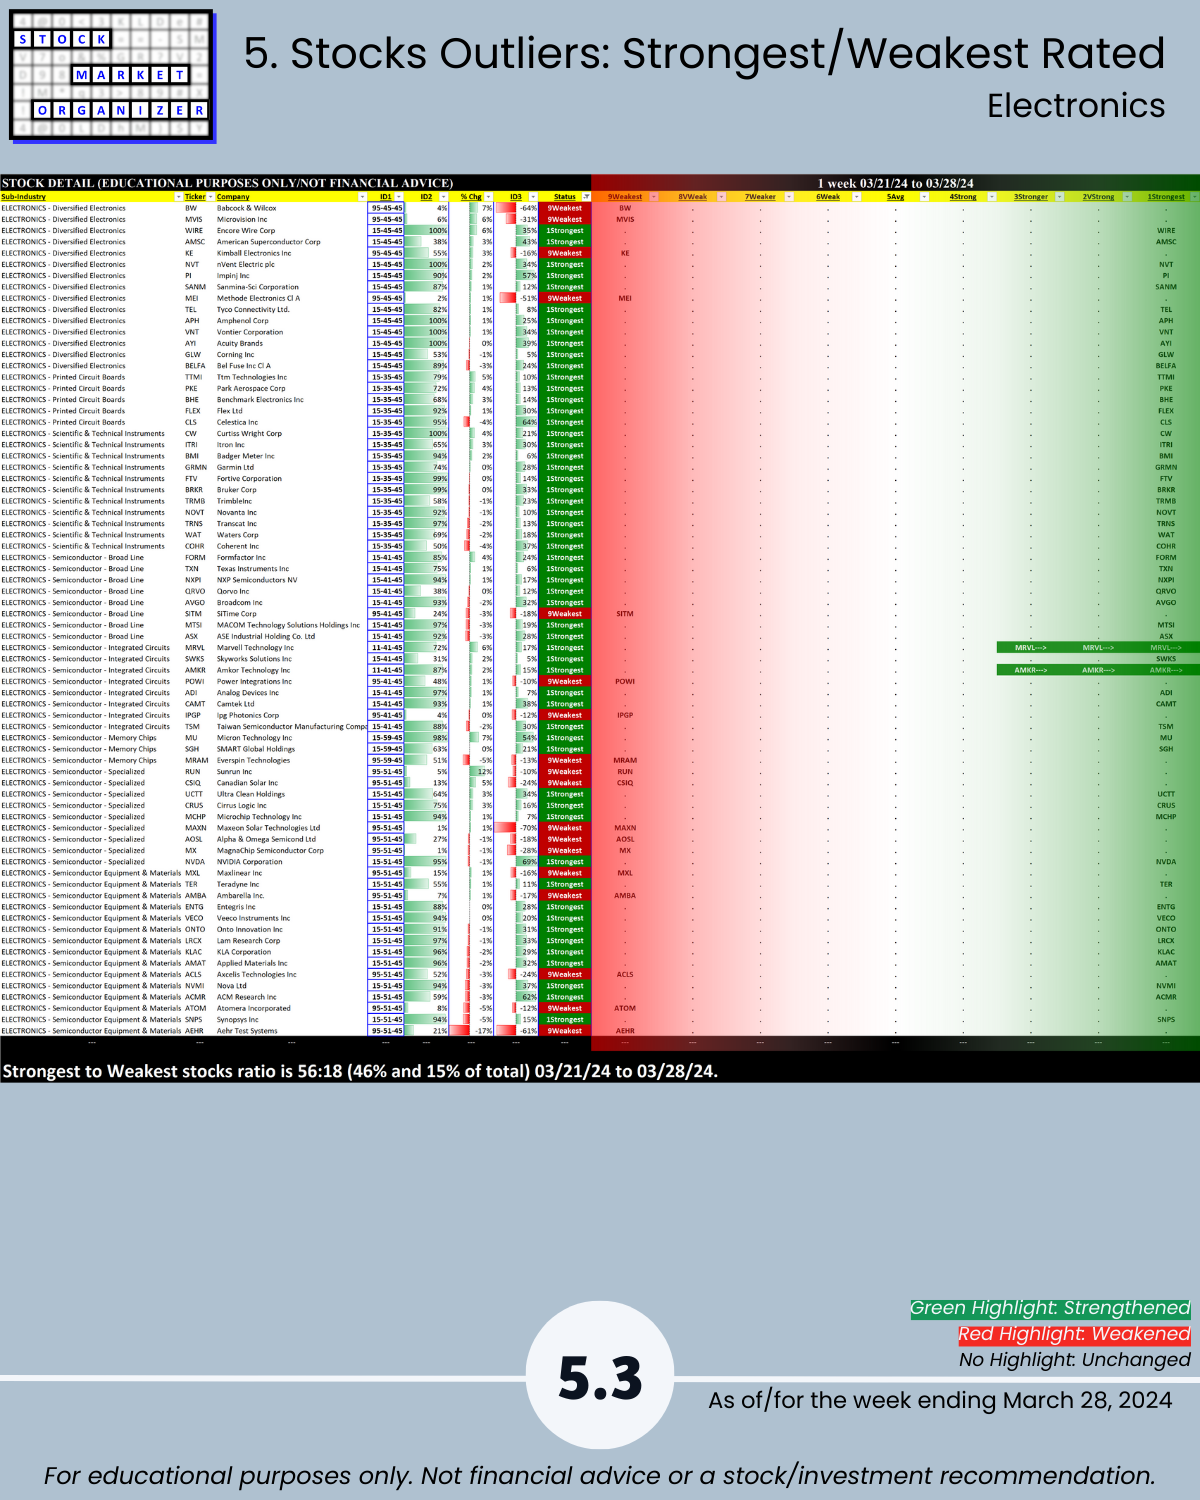
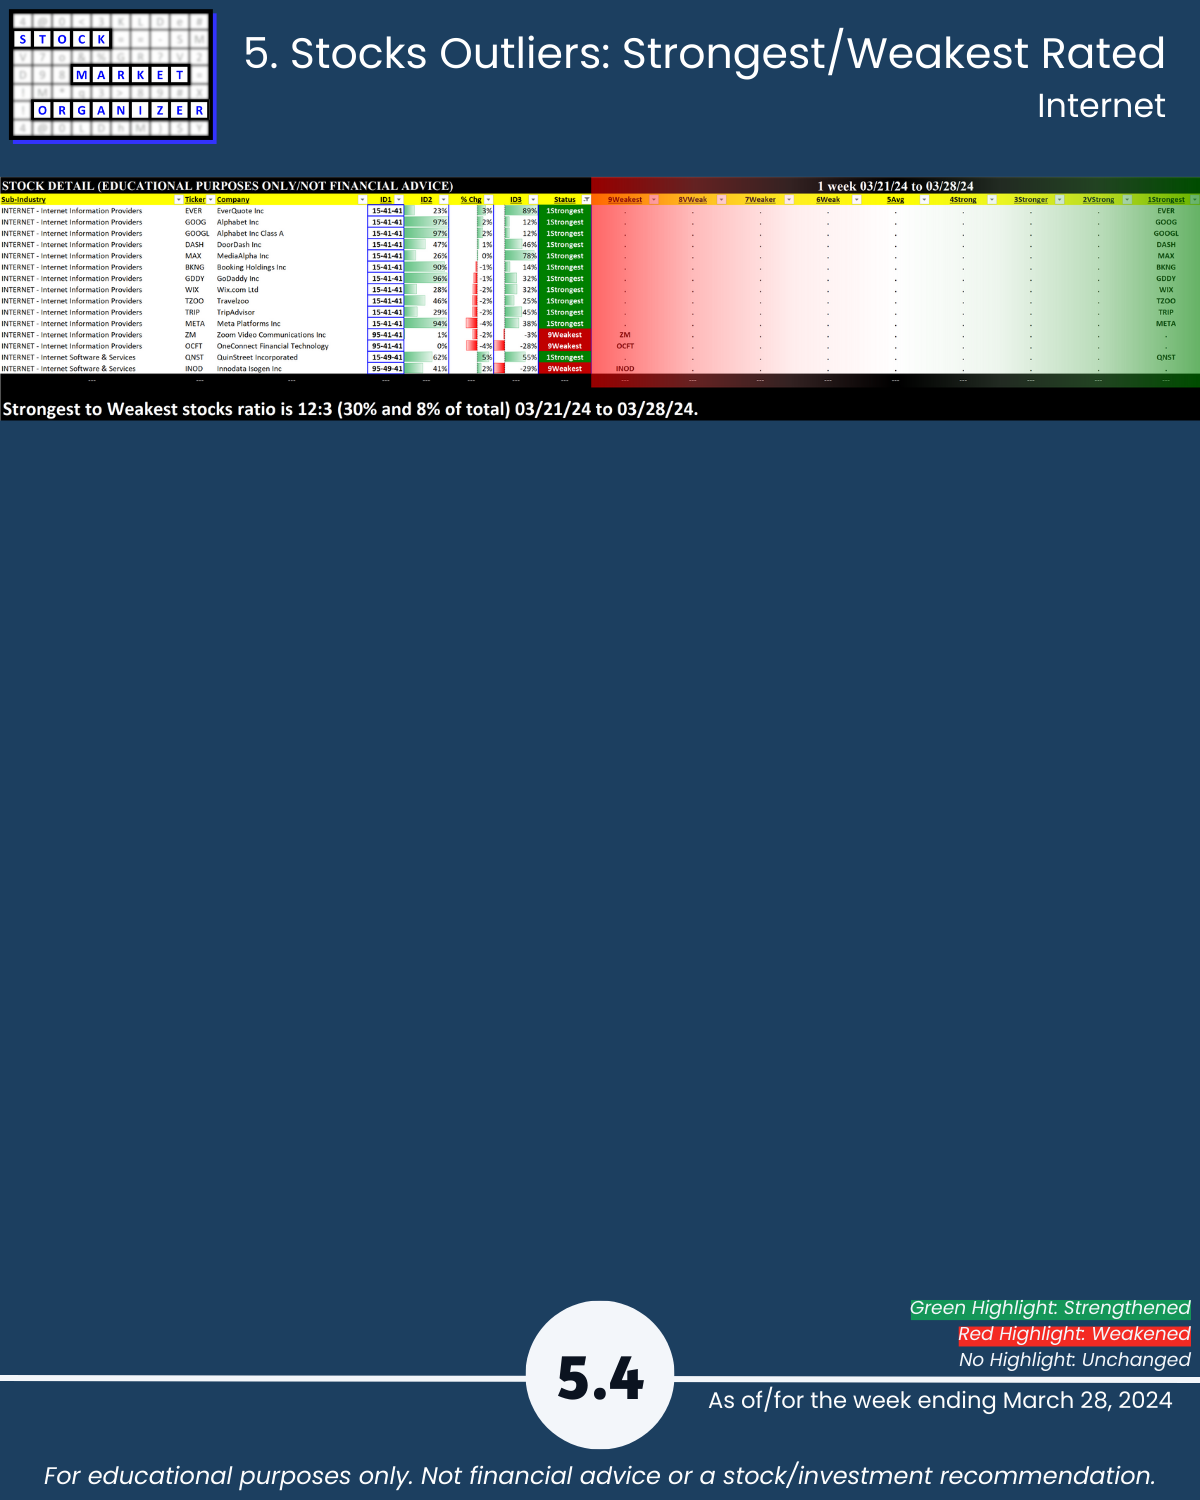
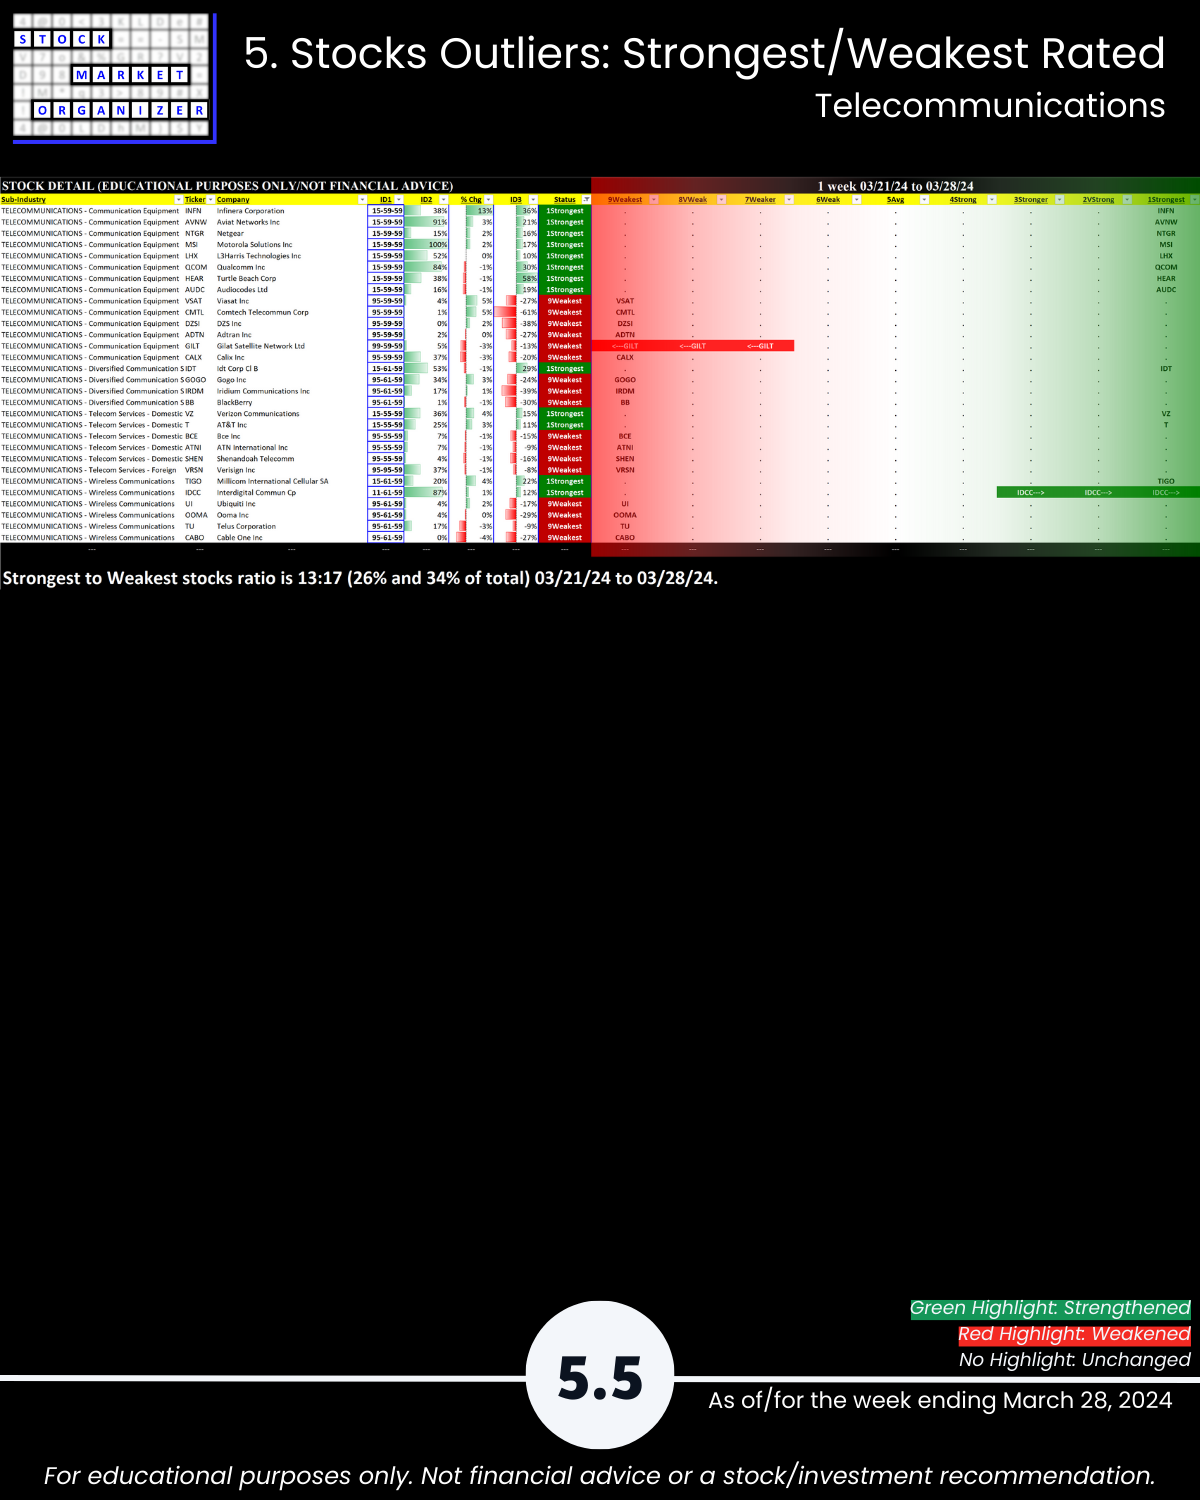
🔹 Stocks, Strongest:Weakest: Industry avg 38%/19%; Software 40%:18%, Electronics 46%:15%, Internet 30%:8% of total
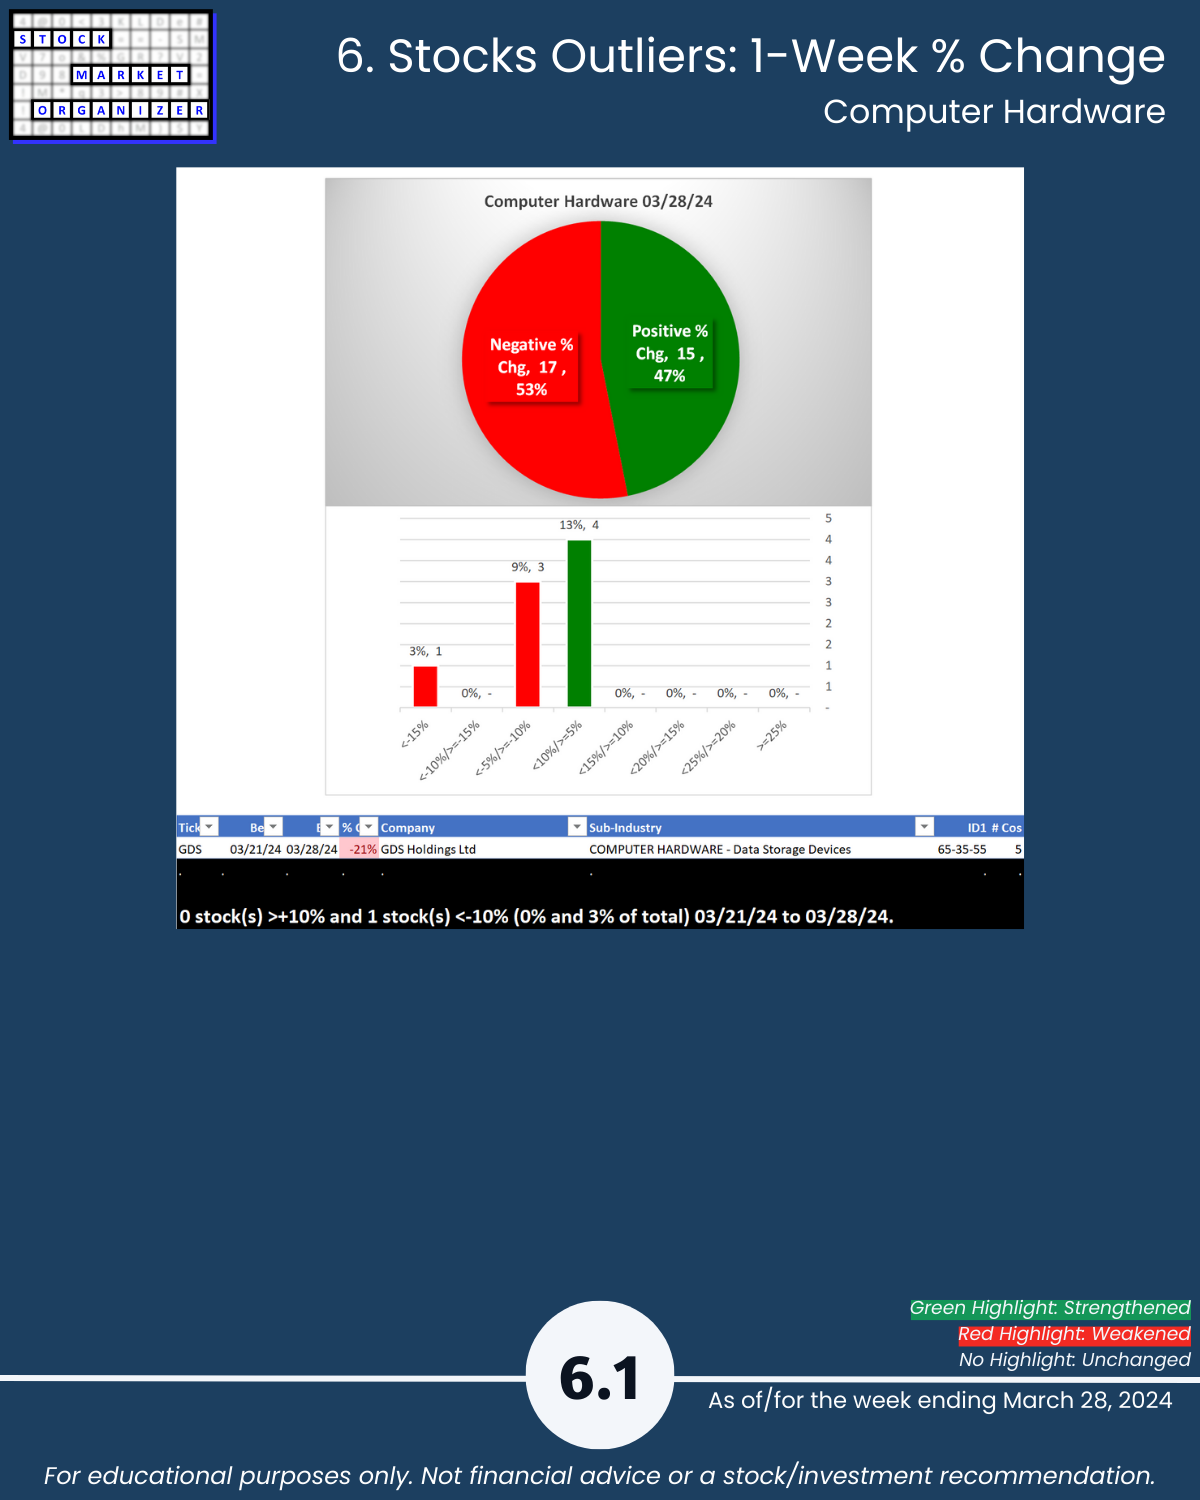
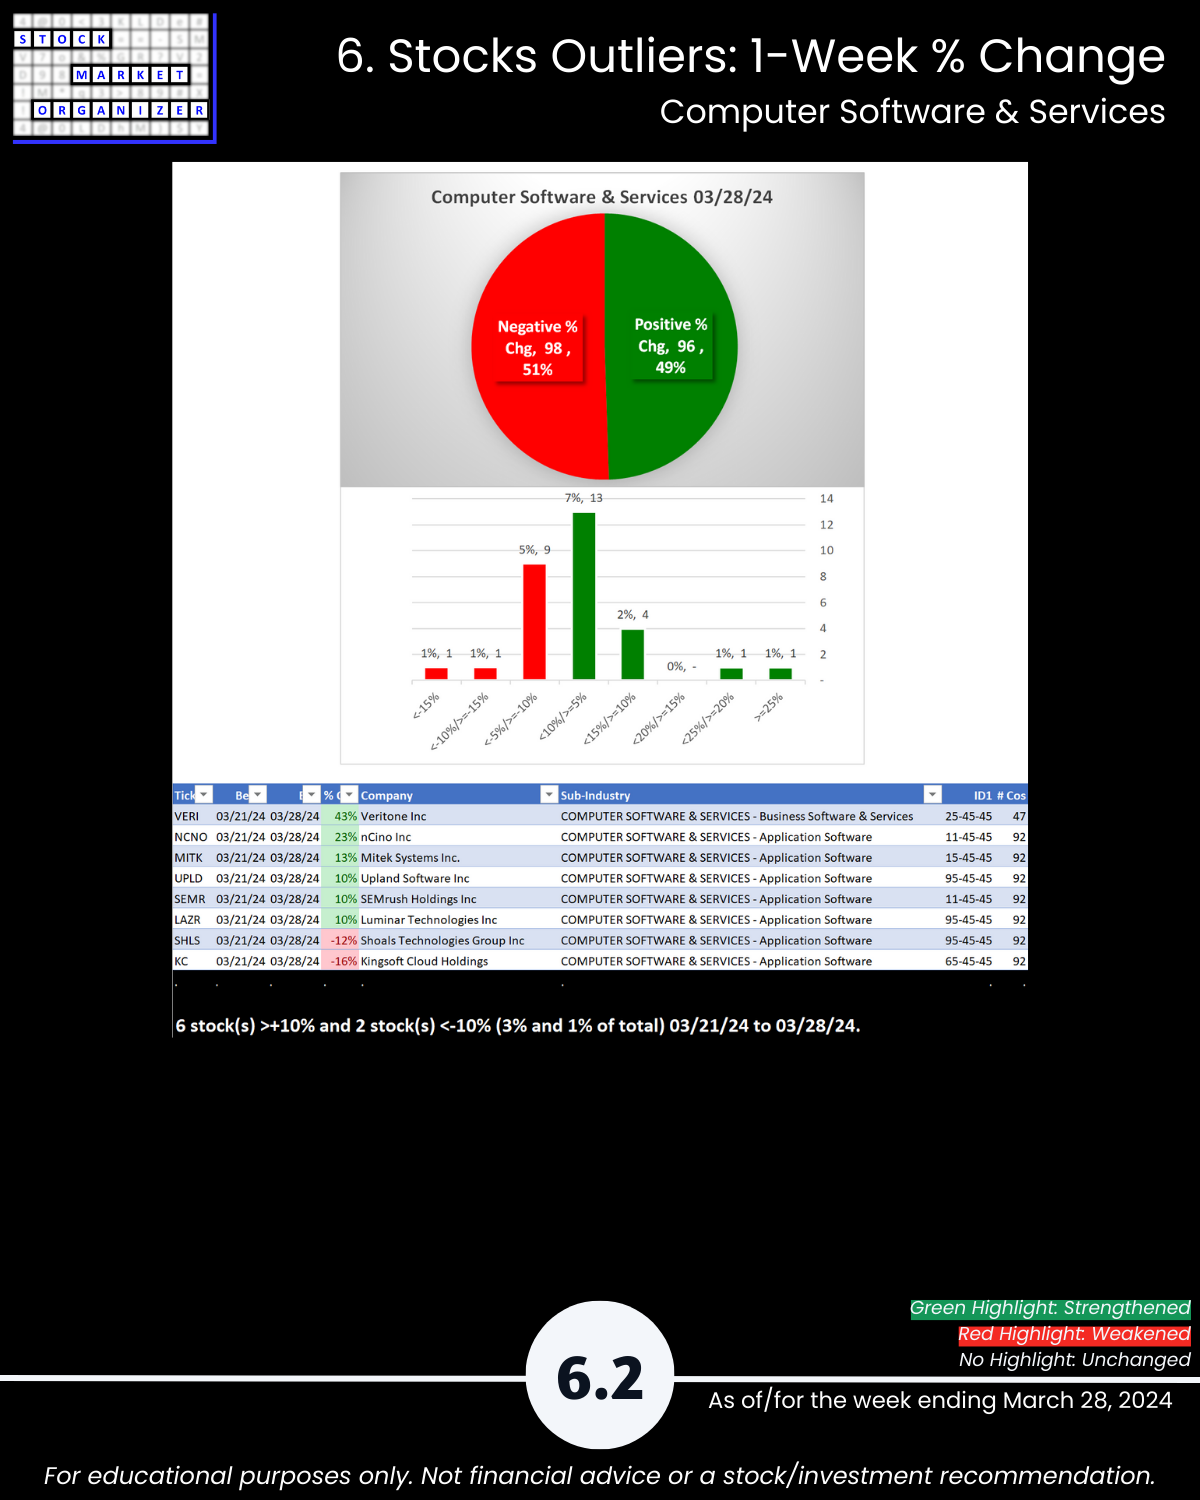
🔹 Outlier Stocks: GDS -21%; VERI +43%, NCNO +23%
This report may particularly be of interest if the following 5 concepts resonate with you:
- The stronger your stocks, the greener your P&L.
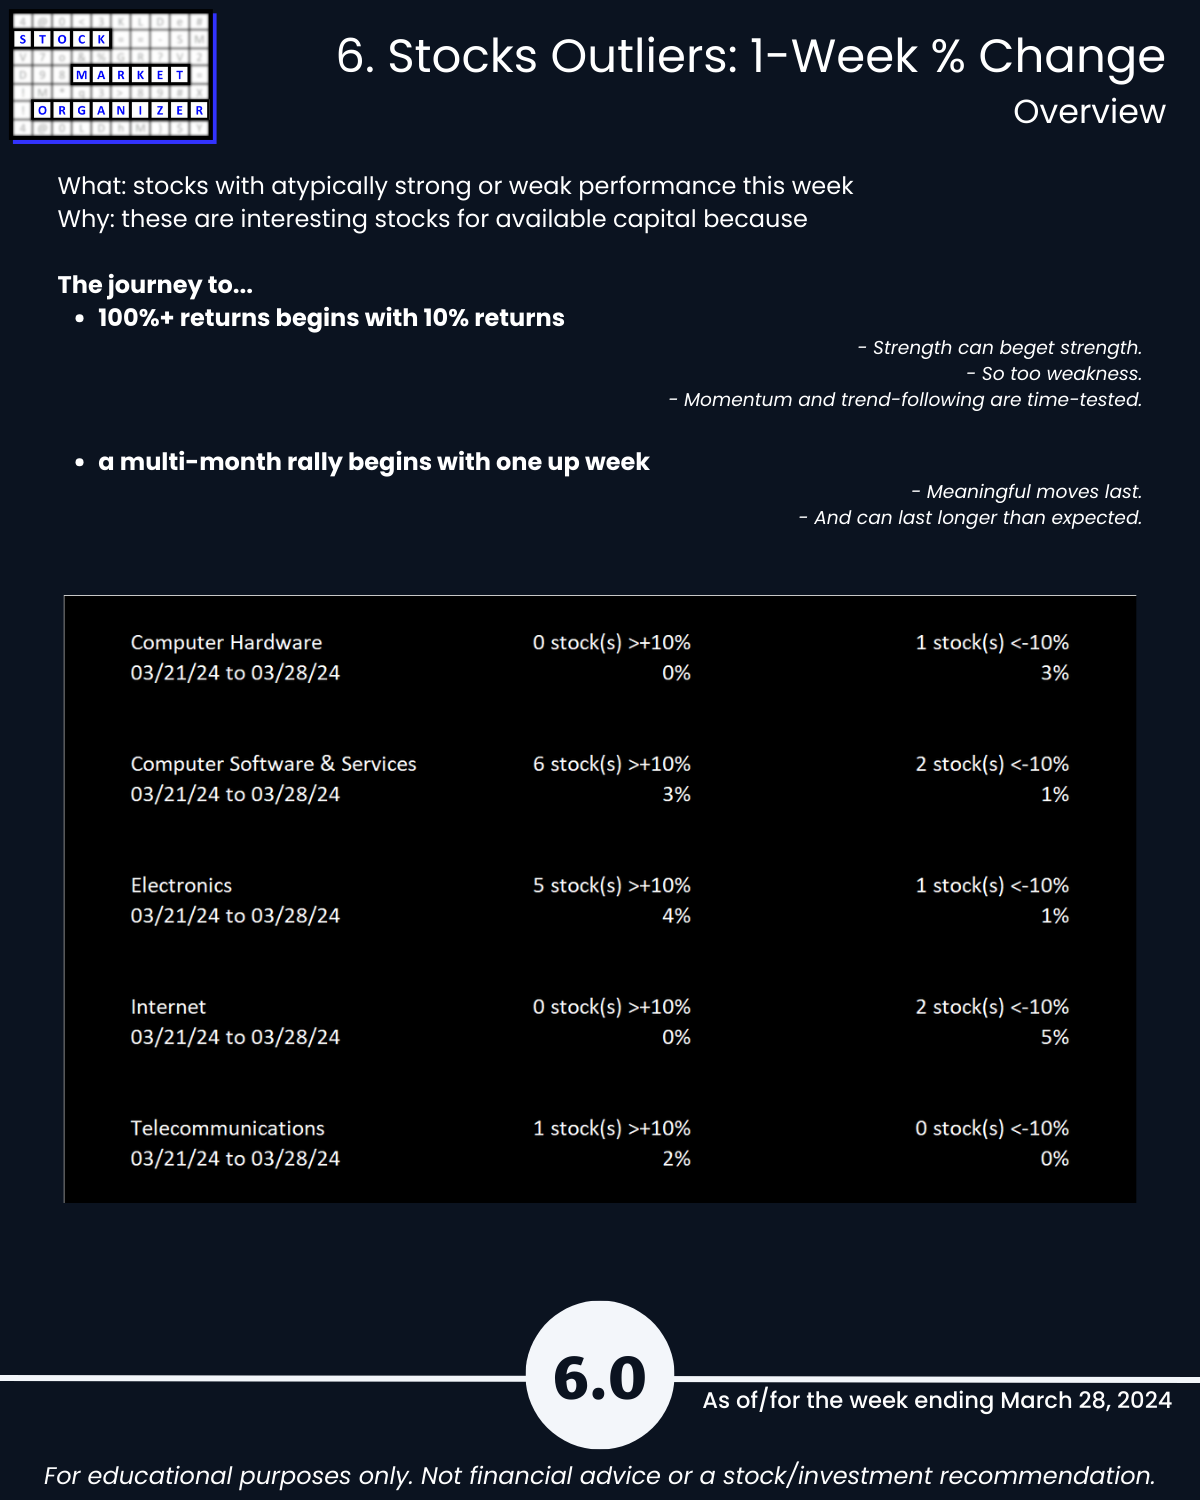
- The journey to 100%+ returns begins with 10% returns.
- The journey to a multi-month rally begins with one up week.
- Most stocks do what the market does. (While the market can only do what its underlying stocks, sub-industries, and industries do.)
- 80/20: not all information is created equal. (Press buttons, not balloons.)
Following are galleries with page-by-page views of this report.
1. Introduction
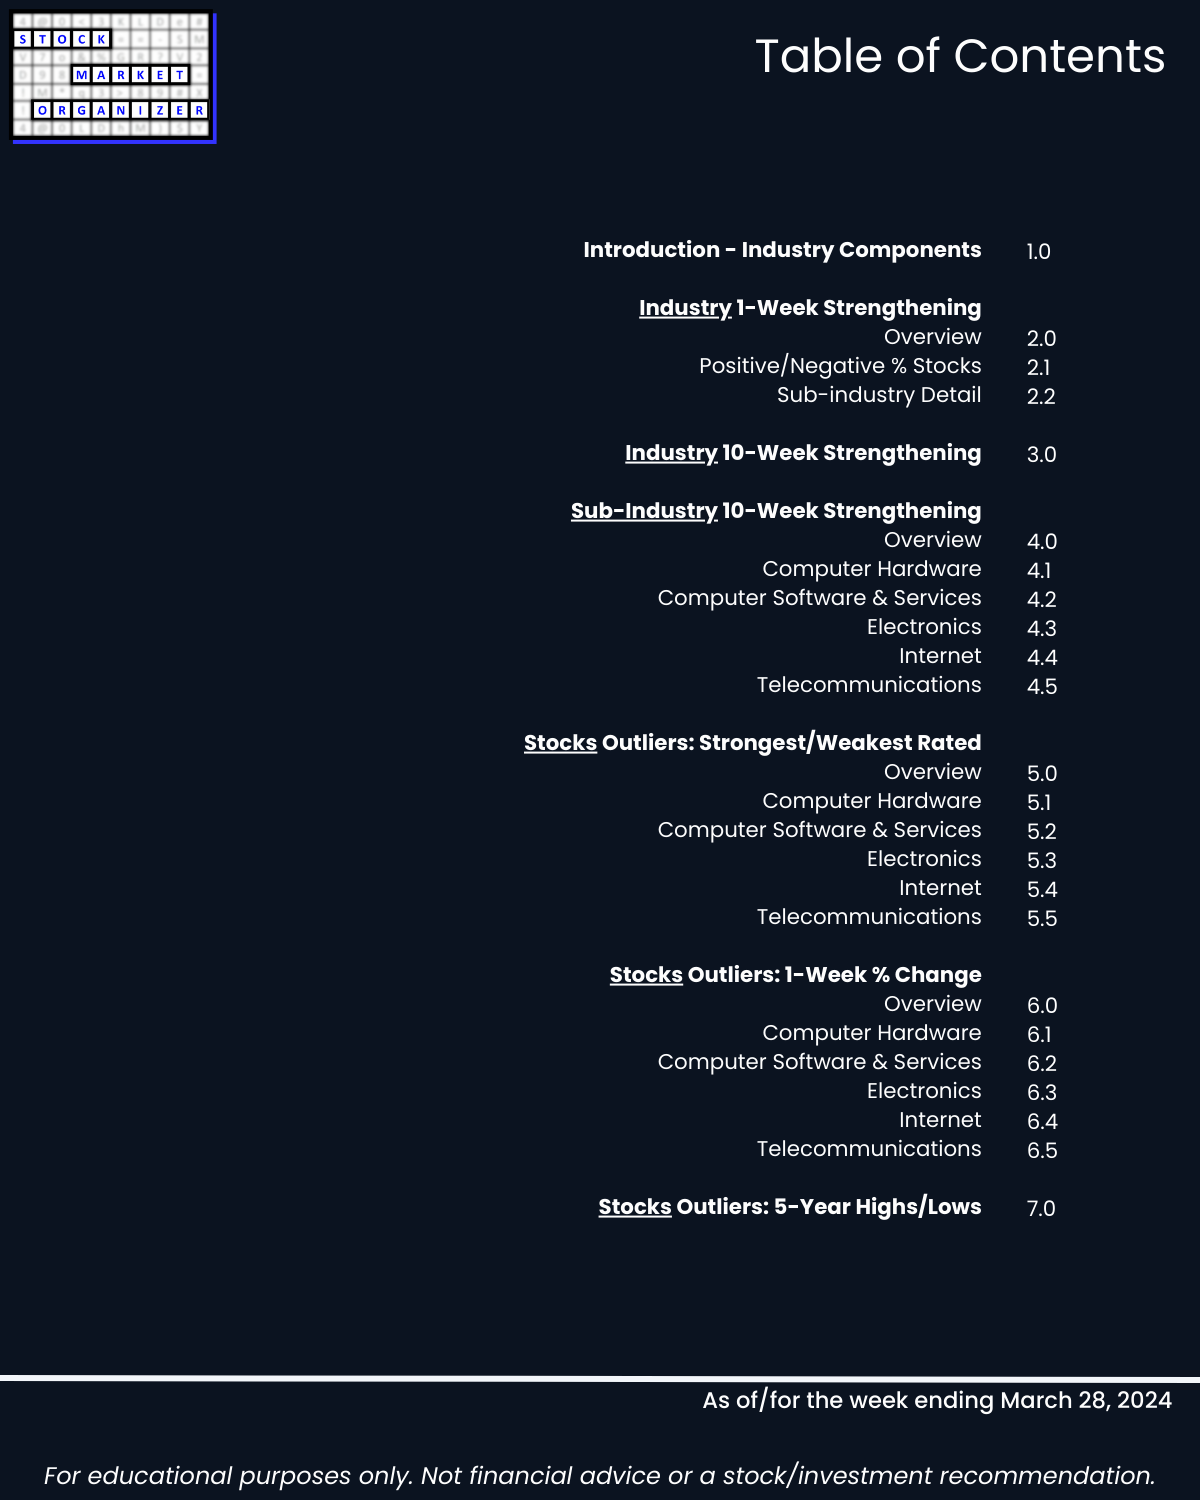
2. Industry 1-Week Strengthening
3. Industry 10-Week Strengthening
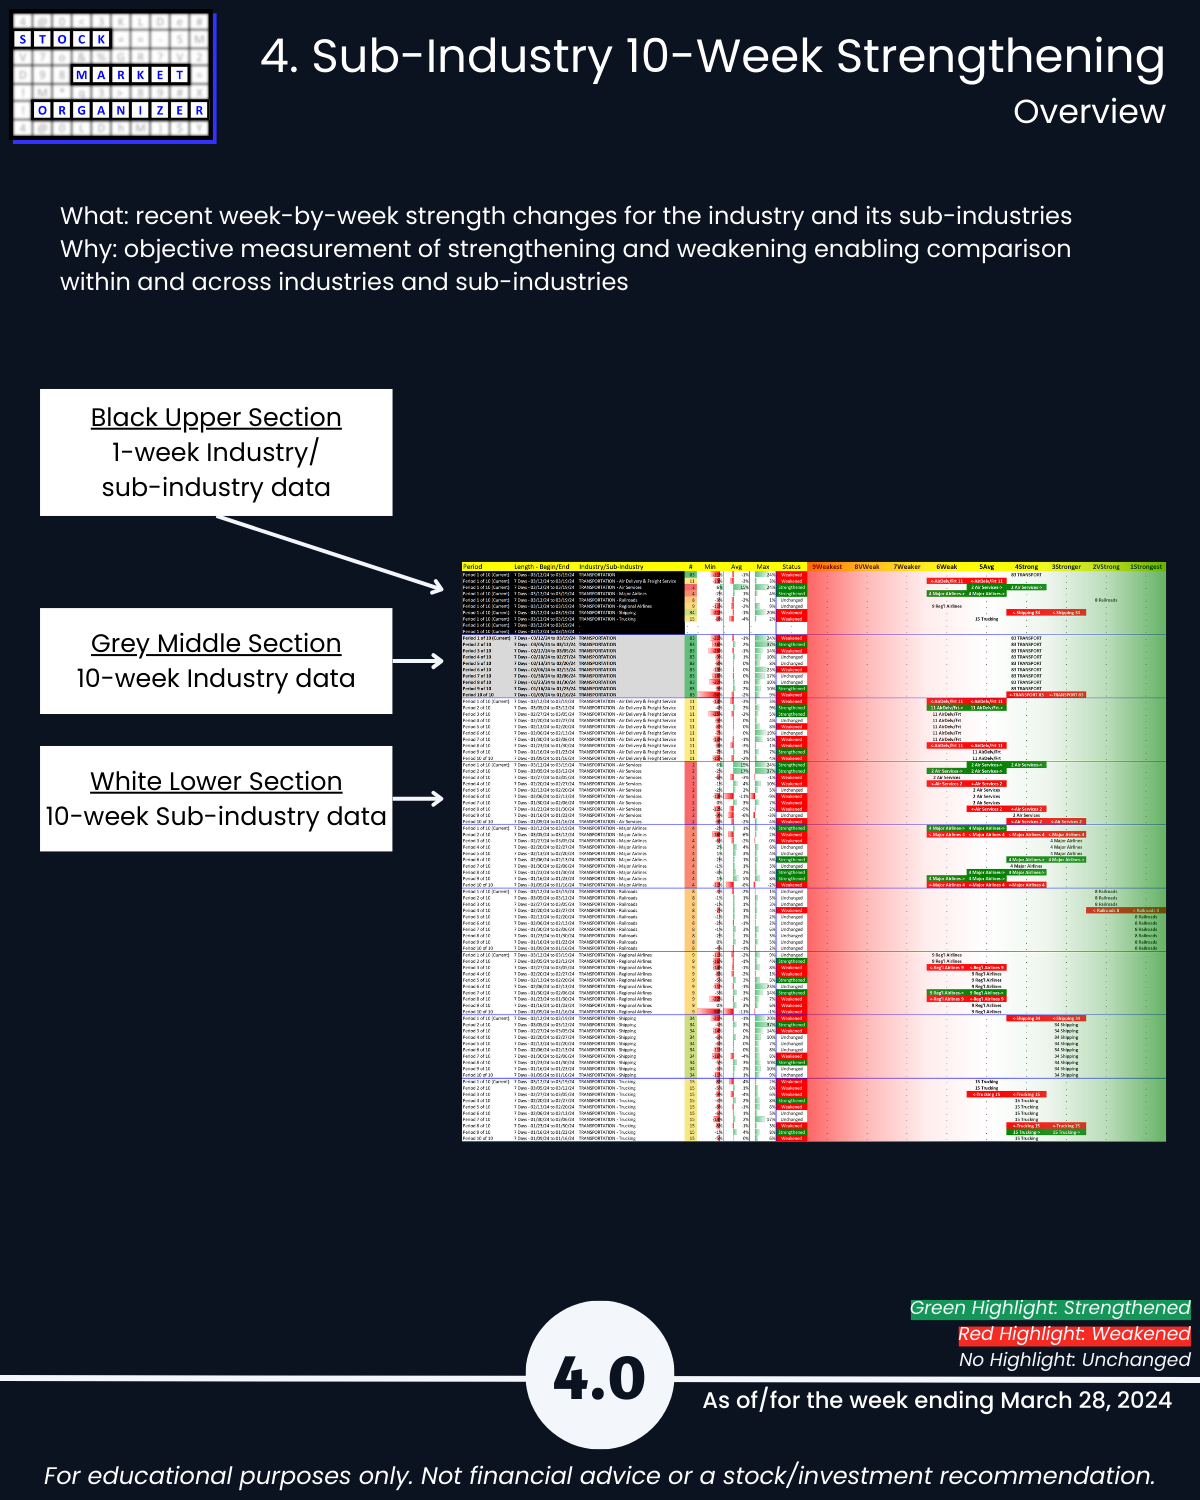
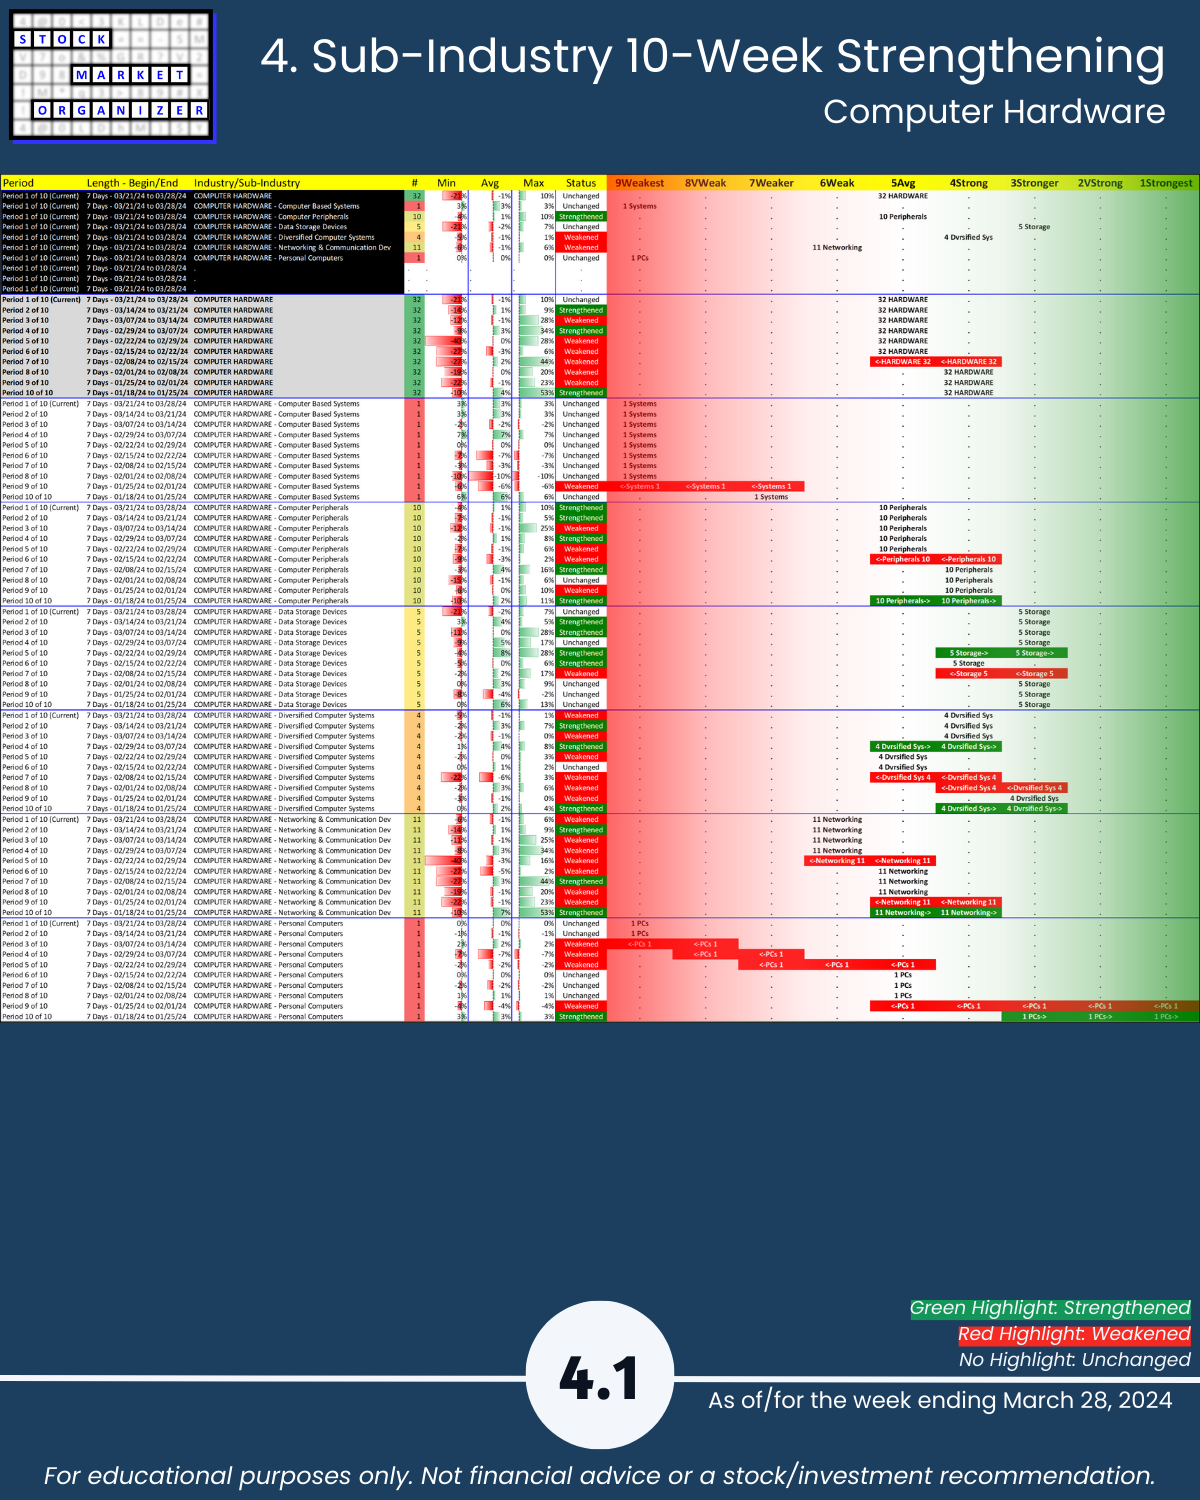
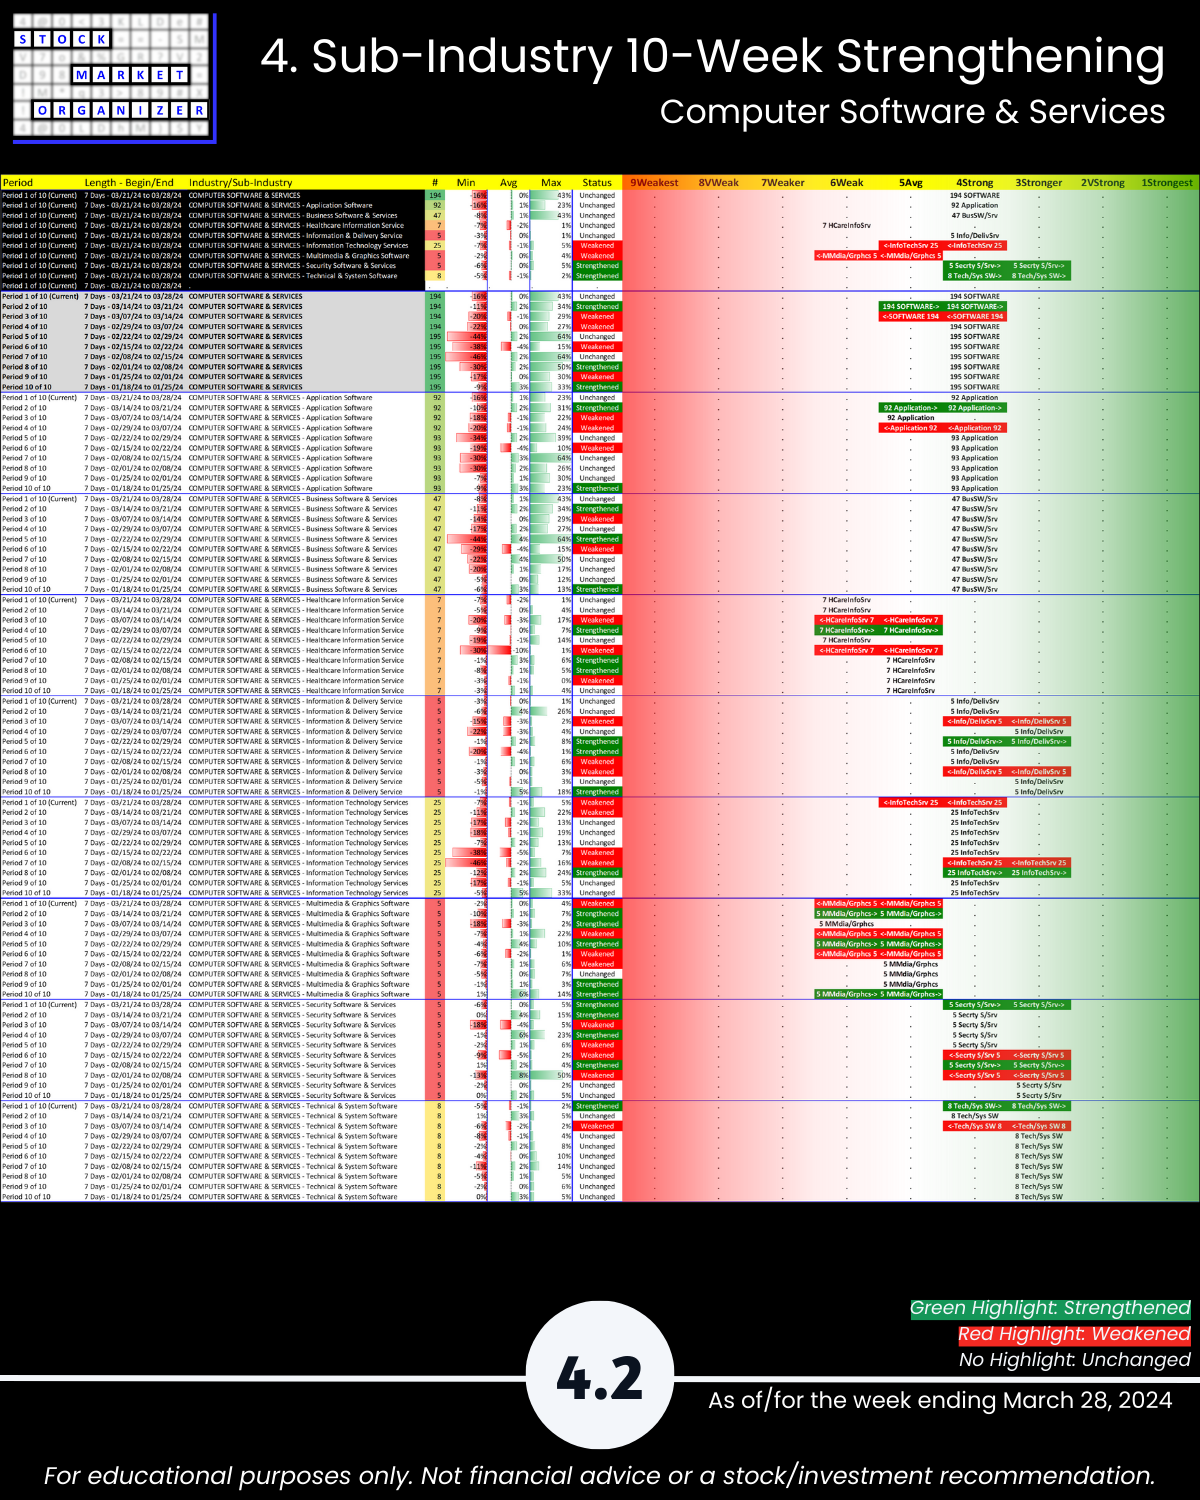
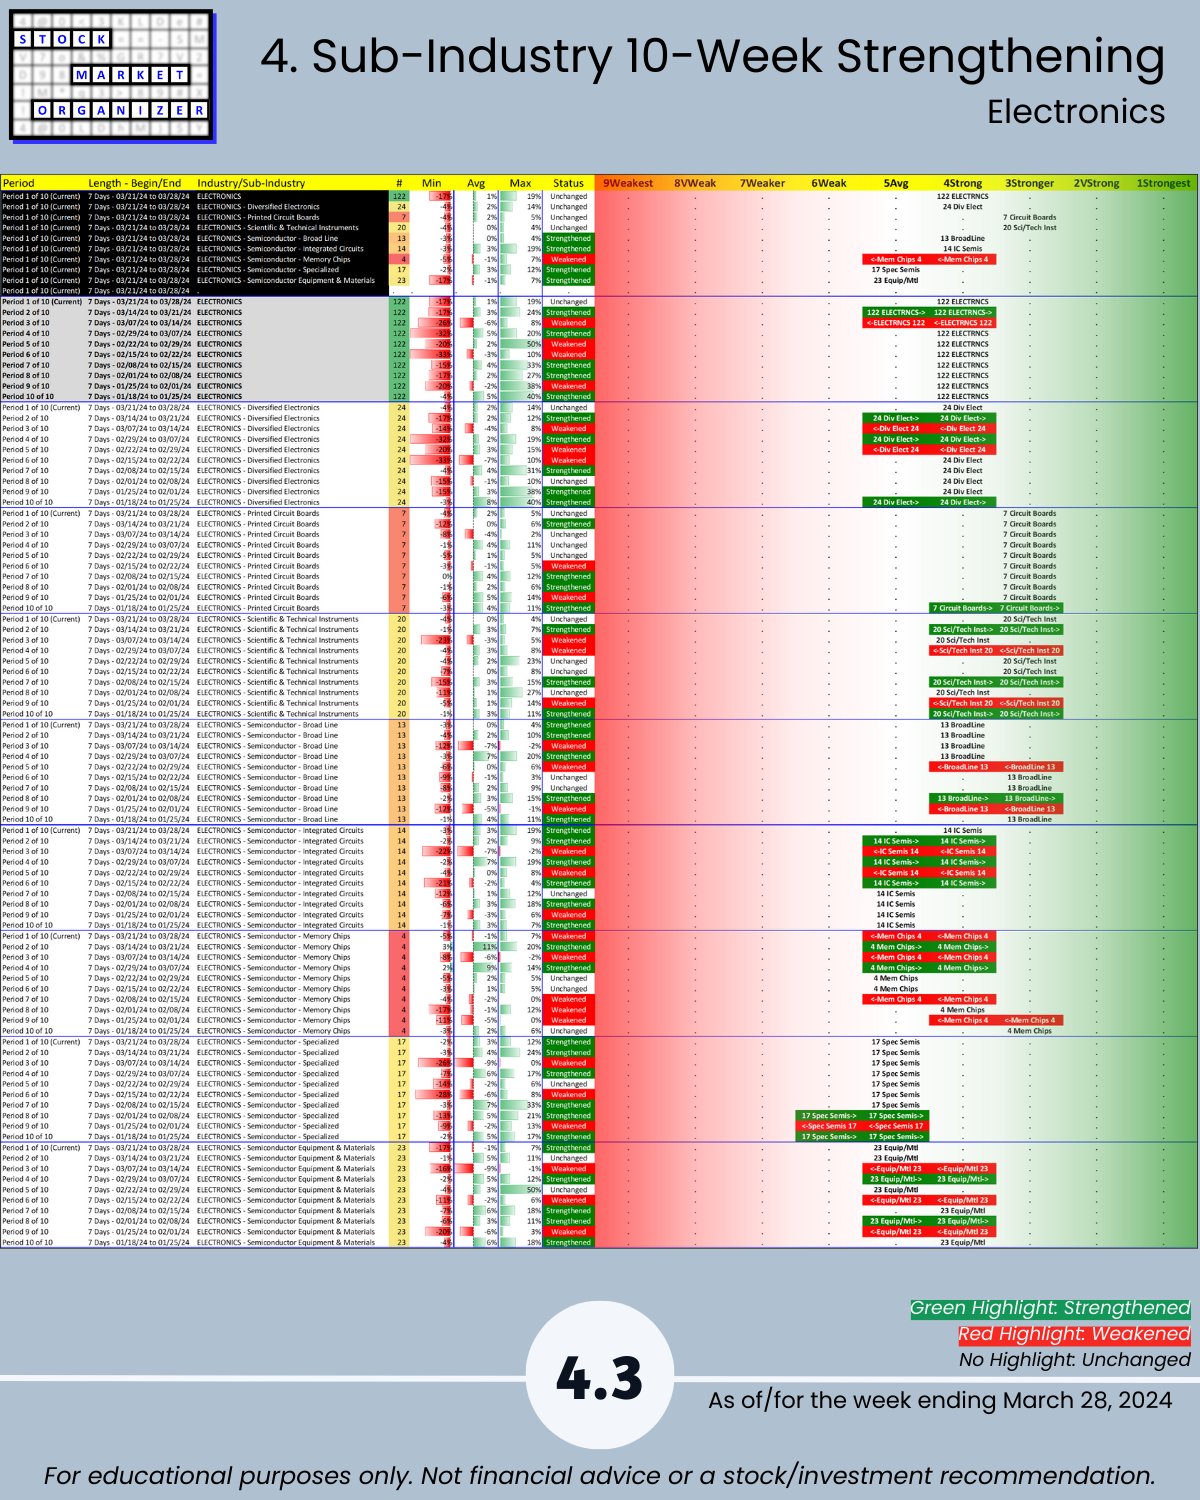
4. Sub-Industry 10-Week Strengthening
5. Stocks Outliers: Strongest/Weakest Rated
6. Stocks Outliers: 1-Week % Change
7. Stocks Outliers: 5-Year Highs/Lows