SMO Exclusive: Strength Report Technology Sector 2024-03-07

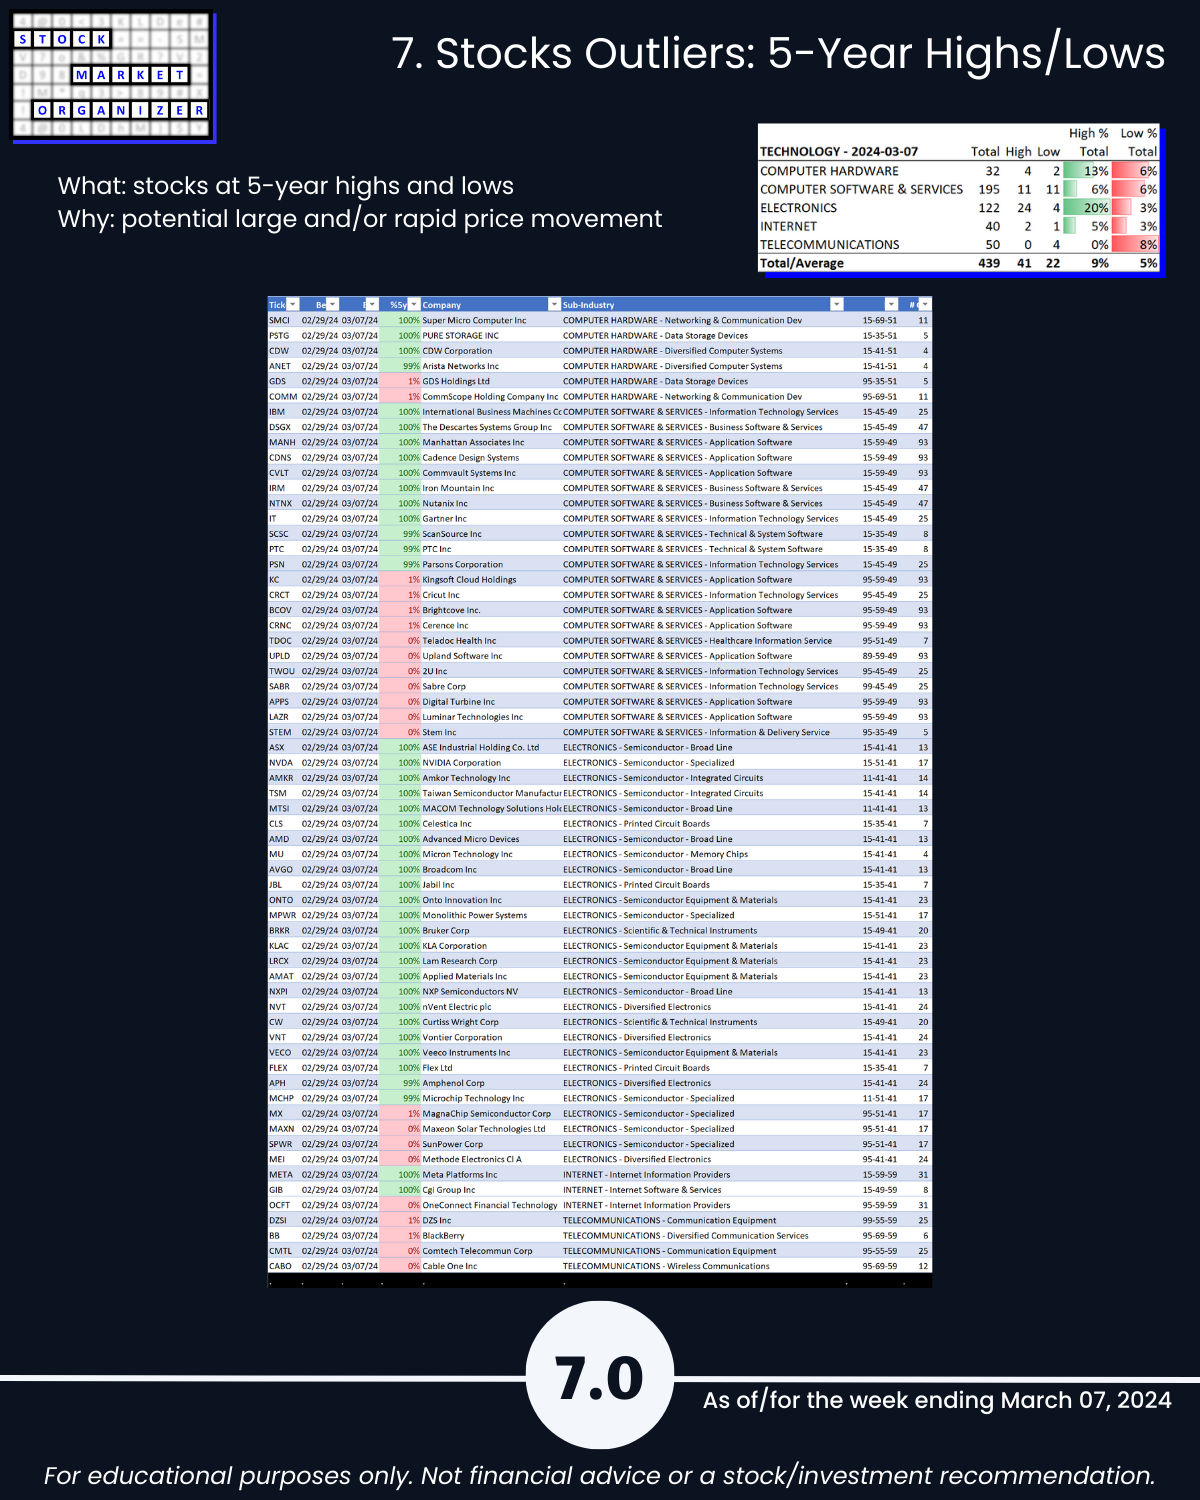
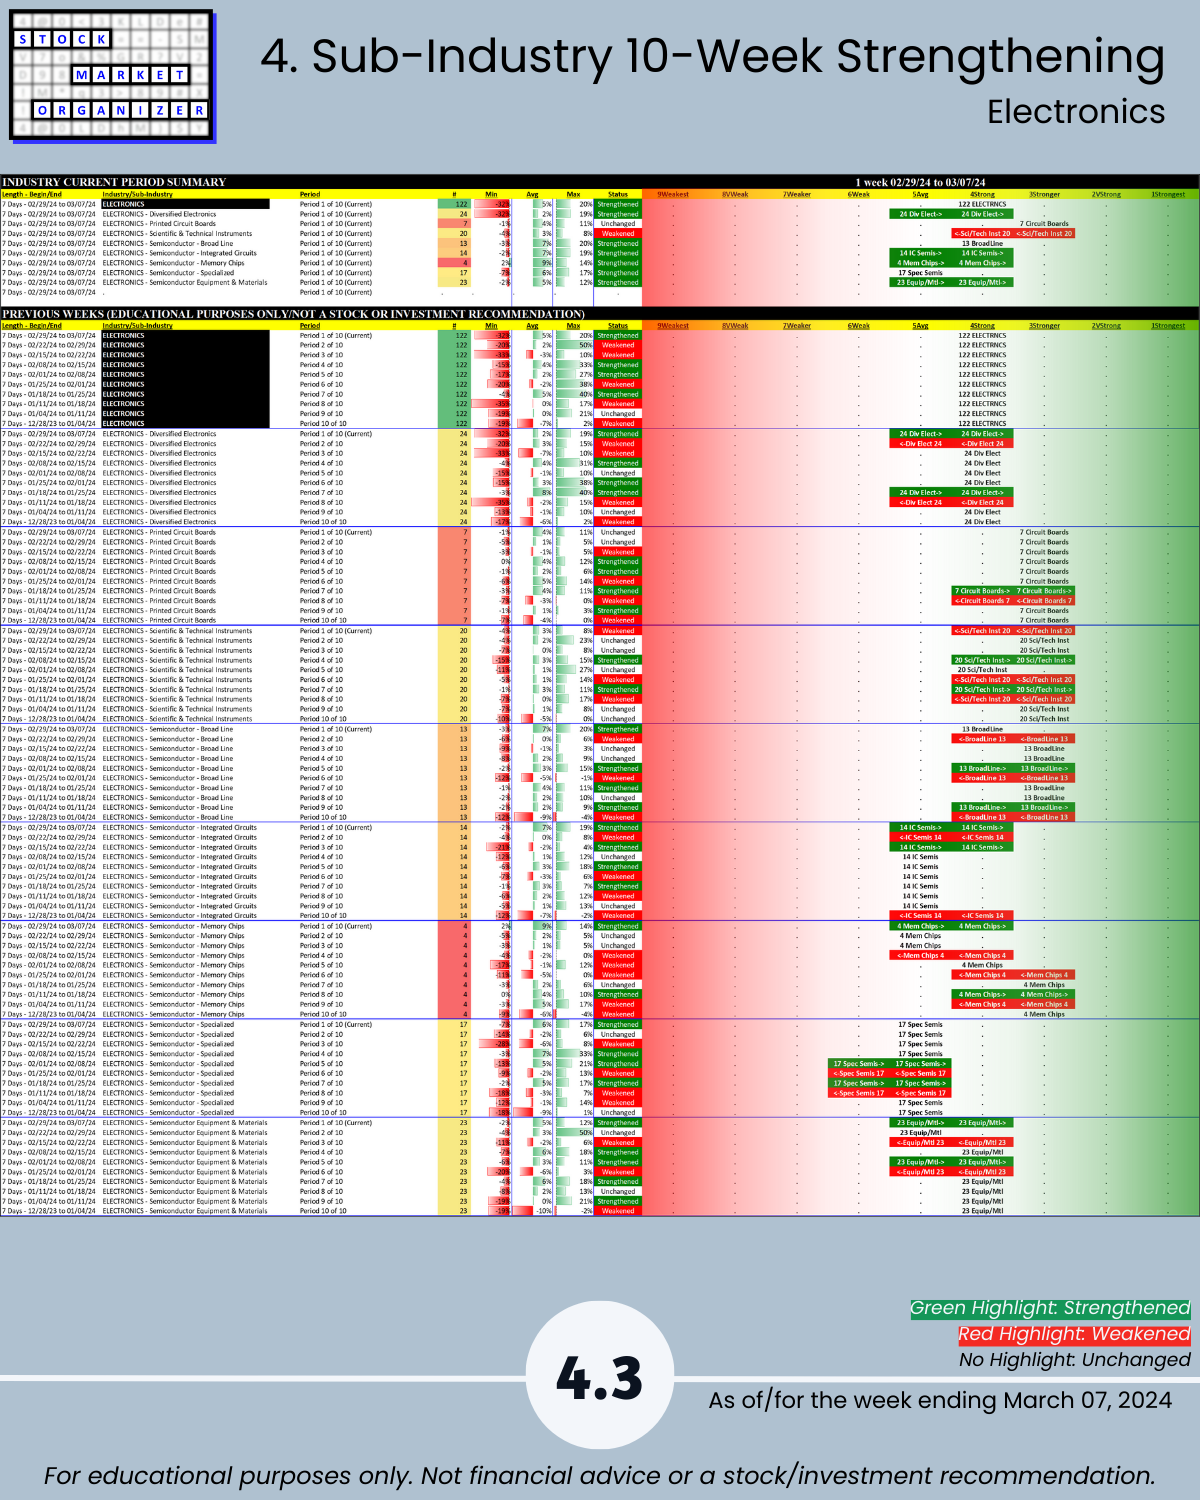
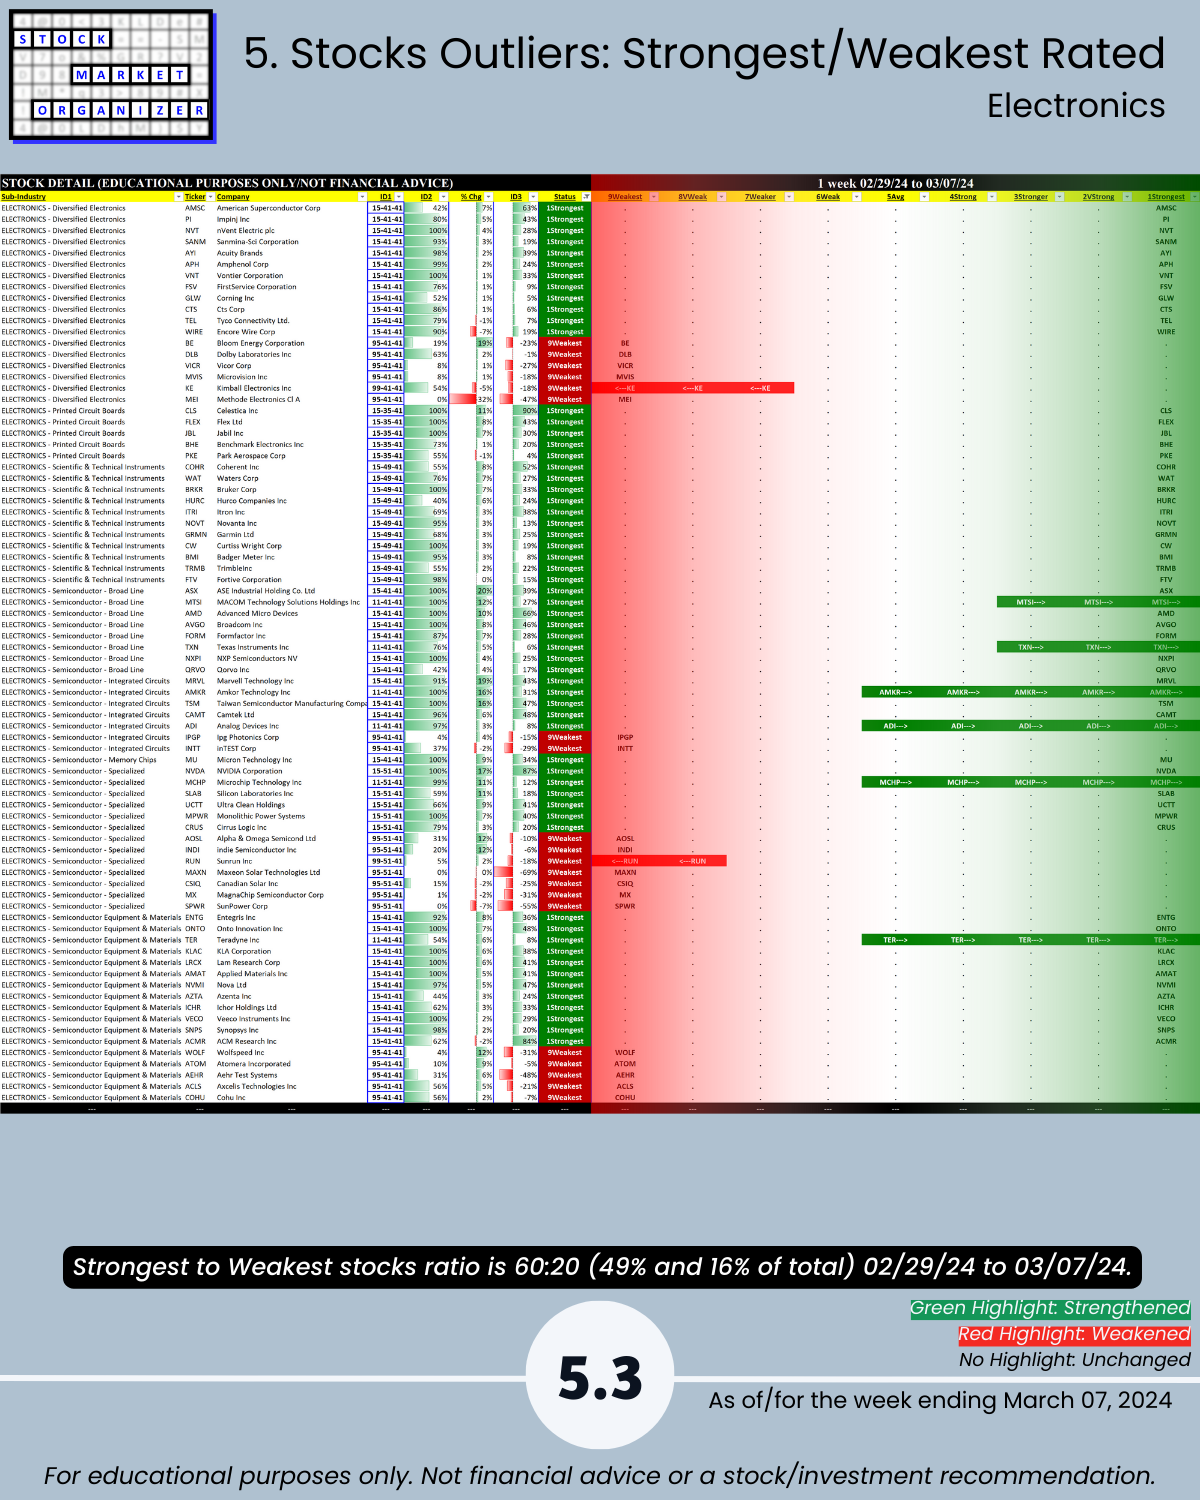
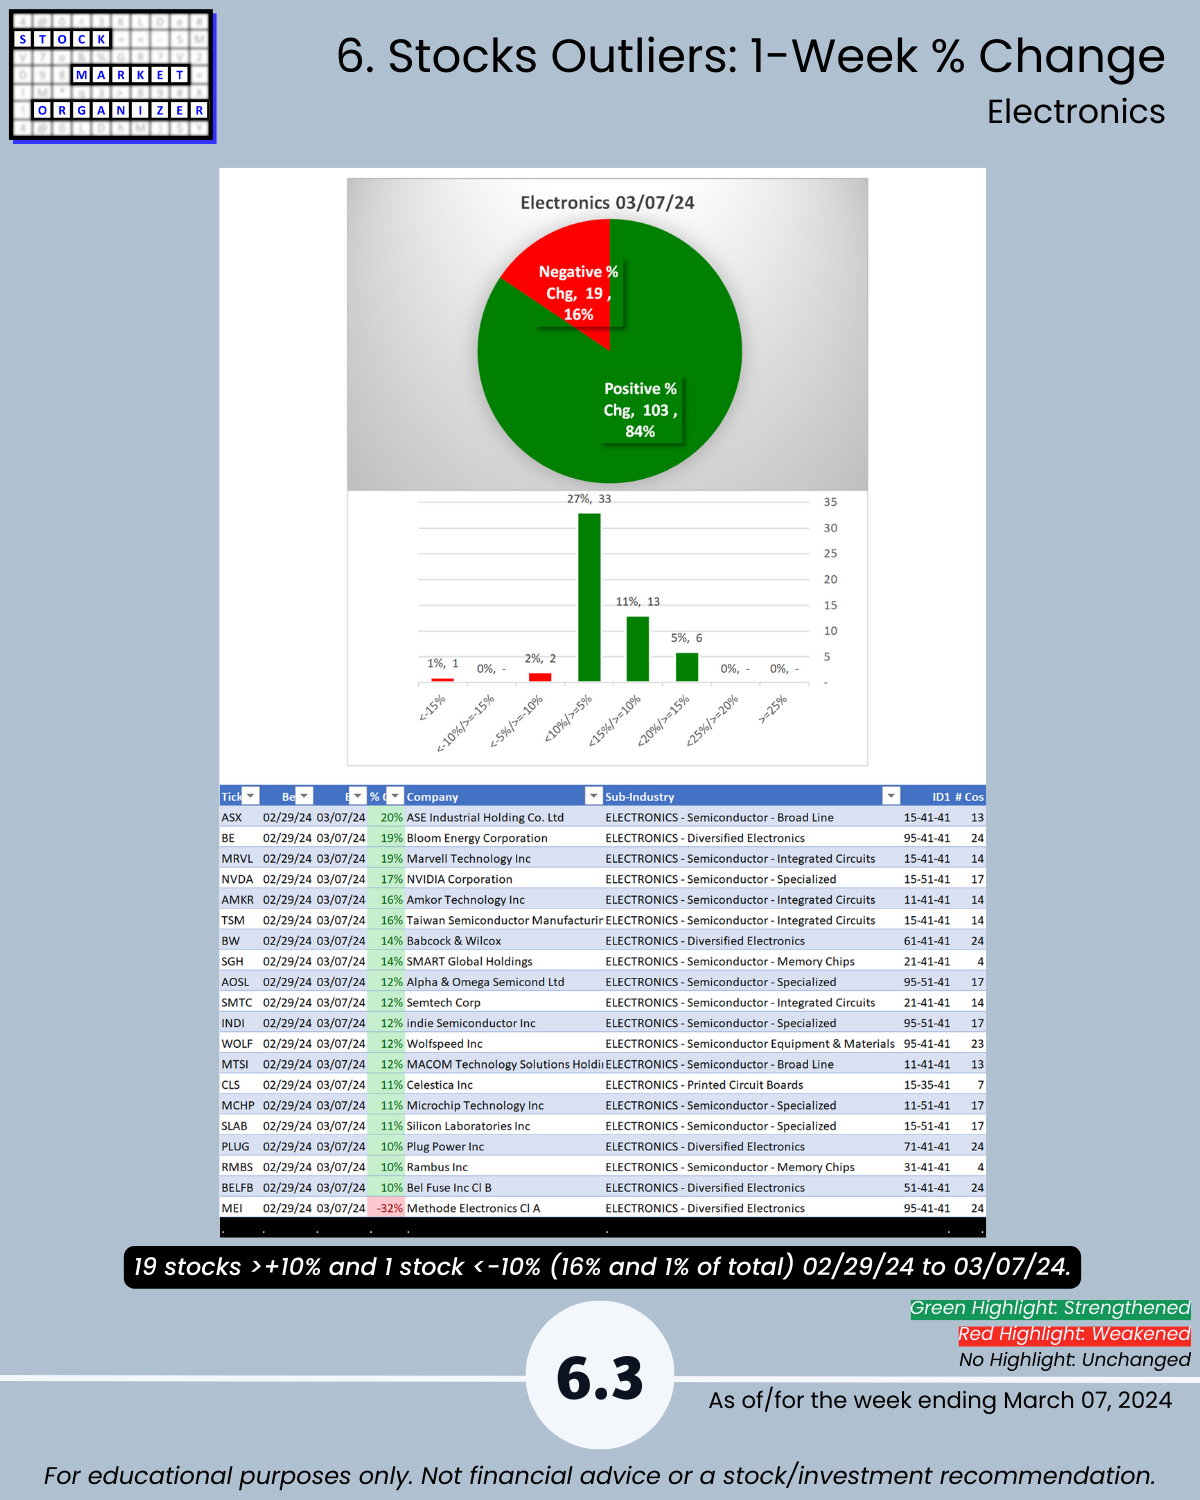
3/7/24 Tech Thursday – 20% of 122 Electronics (aka Chips/Semis) industry stocks are at 5+ year highs, vs. 12% last week. The strengthening continues even as NVDA $2.317 trillion market cap / $60.9 billion FY24 sales = 38 Price/Sales ratio. In one year with 0% share price growth and 100% sales growth this would be 19x P/S. At least somewhat closer to the Scott McNeely/SUNW 10x P/S from his 2002 “What were you thinking?” Bloomberg interview (referencing the $64/share price which ultimately fell to $5/share). A bargain at twice the price!
Further, Electronics had/has
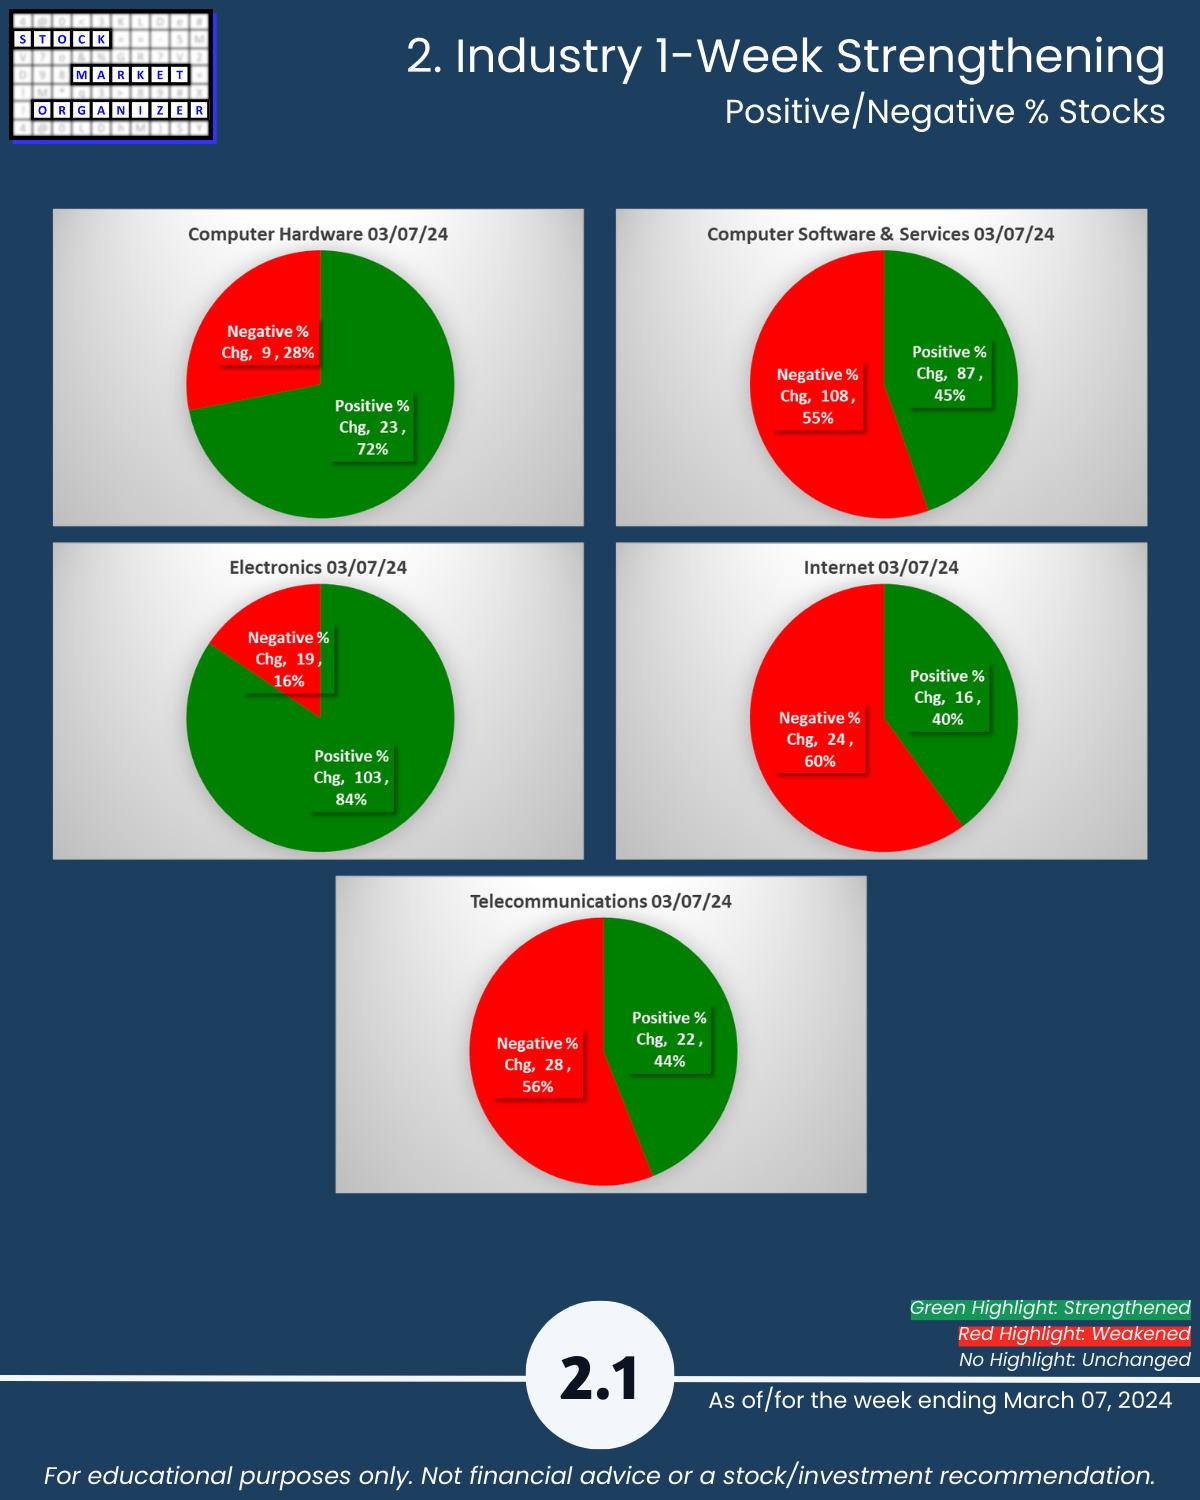
🔹 84% positive stocks for the week,
🔹 16% of its stocks >10% for the week, and
🔹 a 49:16 (3:1) ratio of stocks rated Strongest vs. those rated Weakest.
Ripe for mean reversion?
Do you feel lucky?
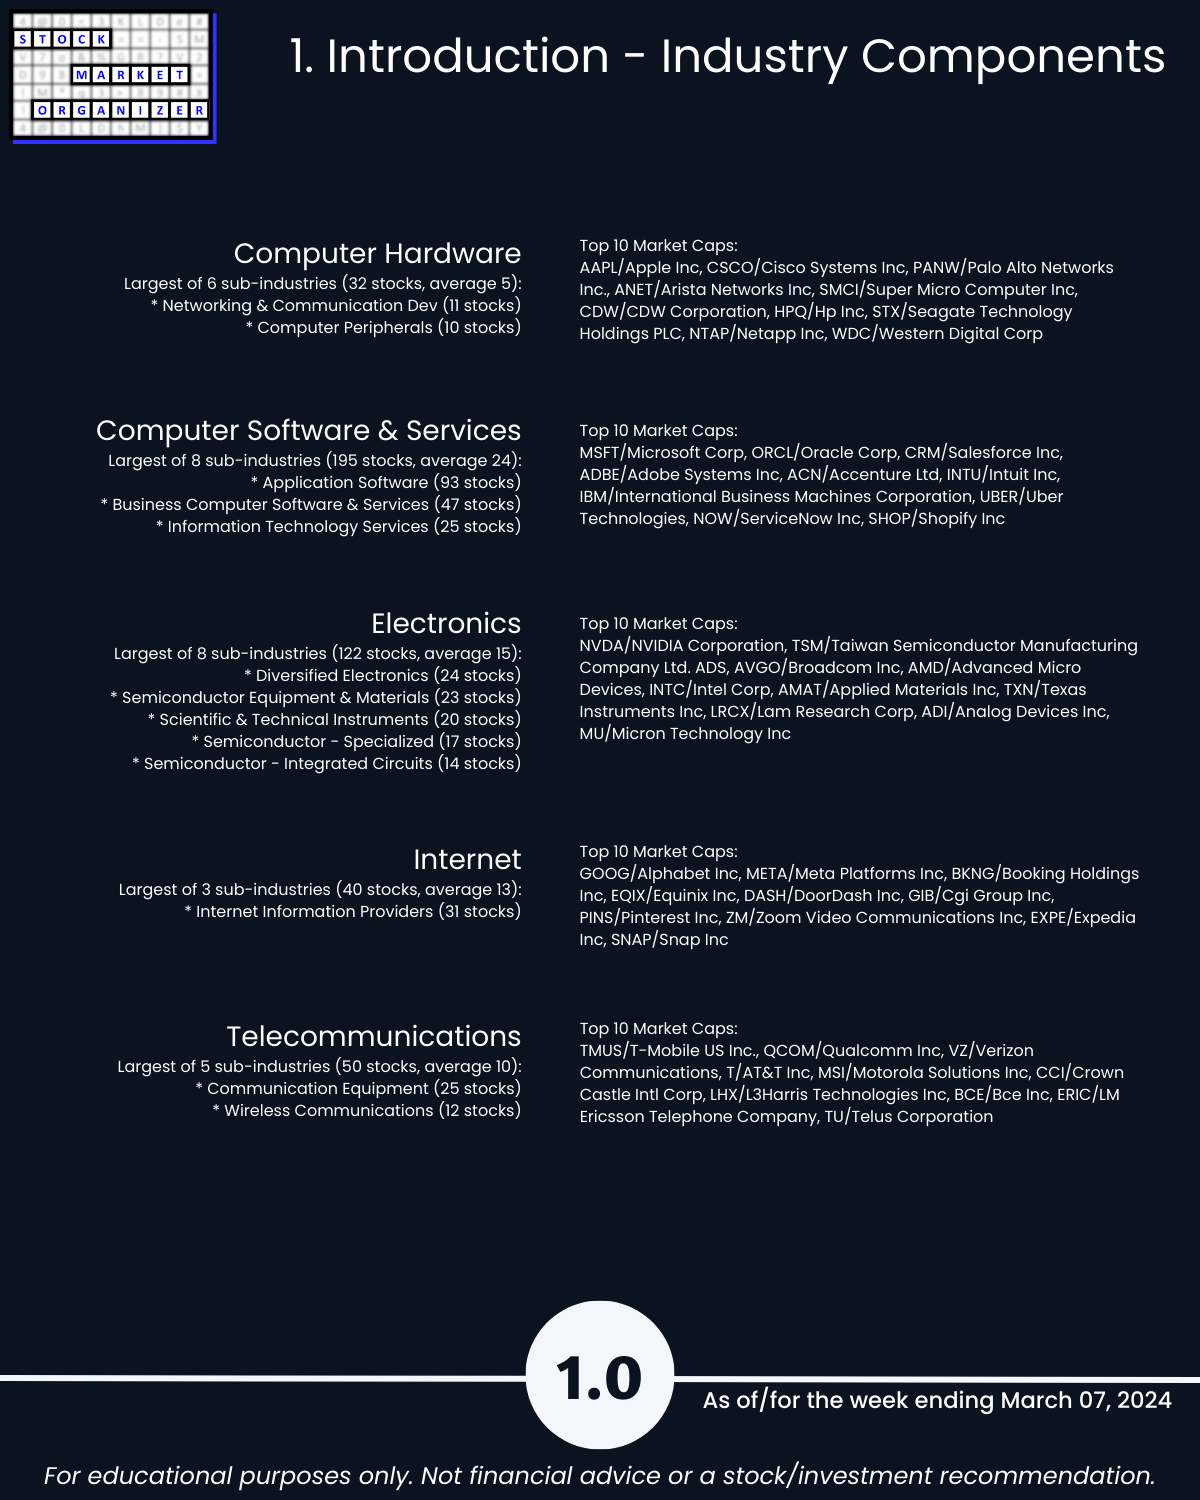
Today’s industries:
Computer Hardware, Software/Services, Electronics, Internet, Telecommunications
WHAT’S HAPPENING HERE?
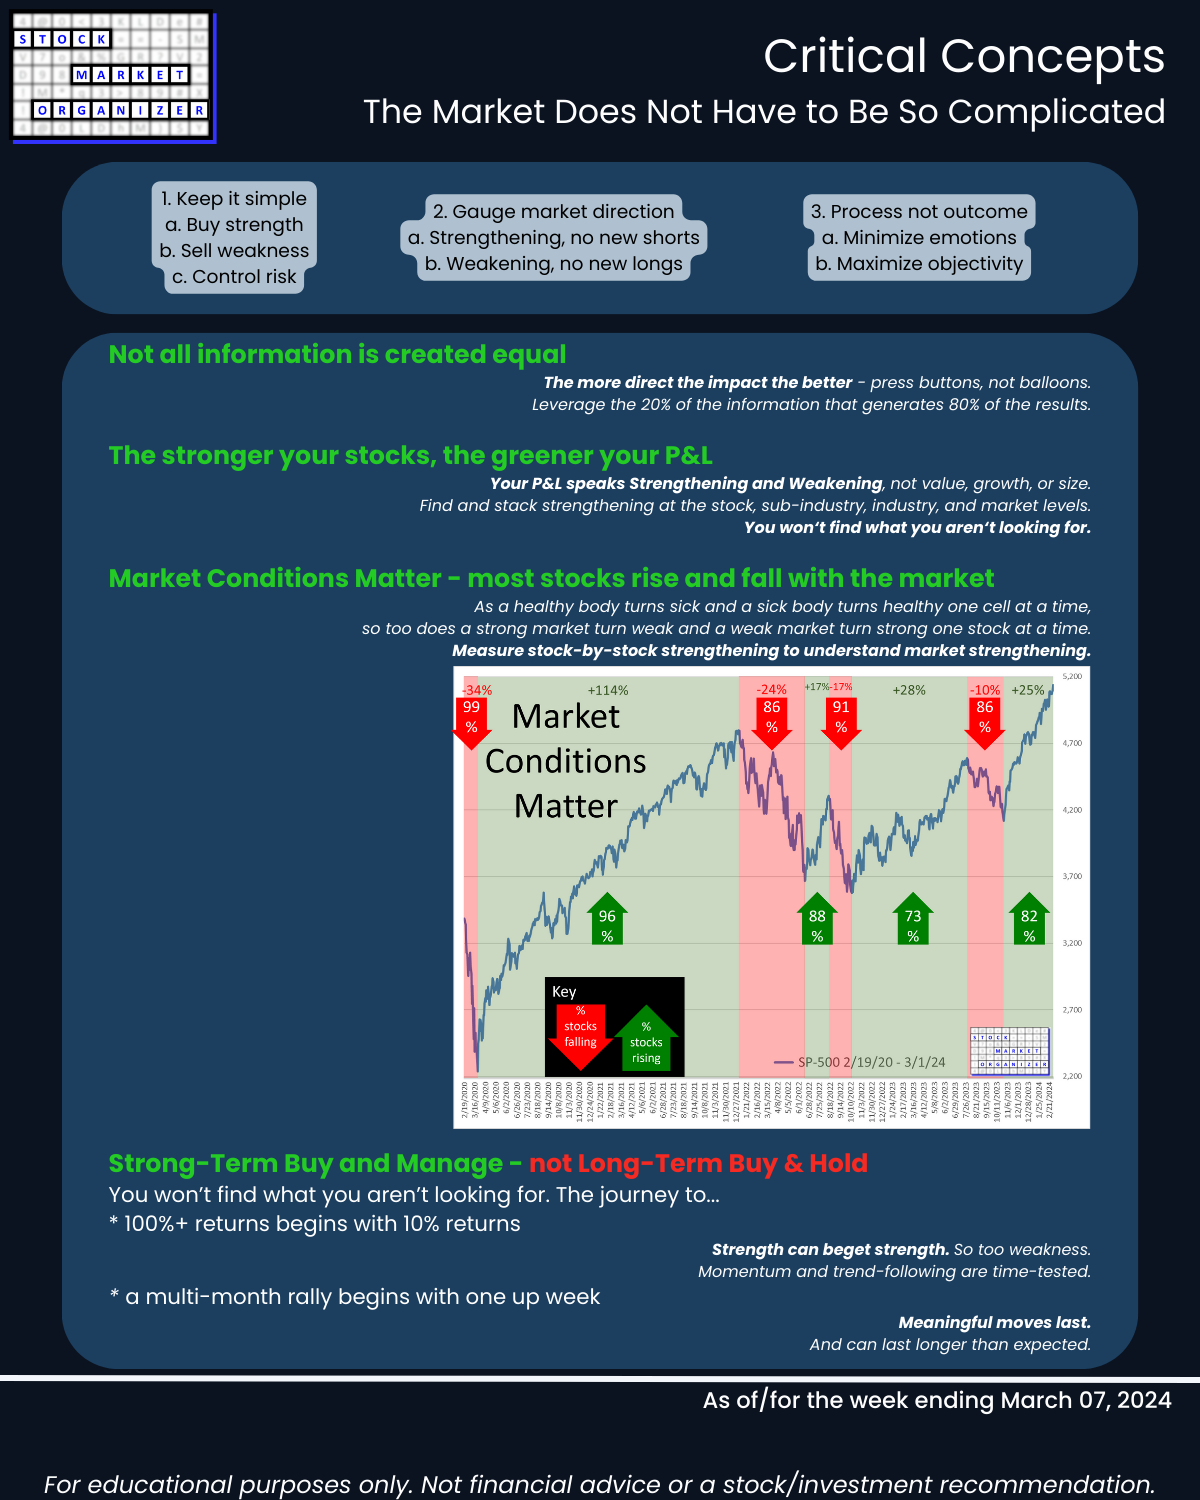
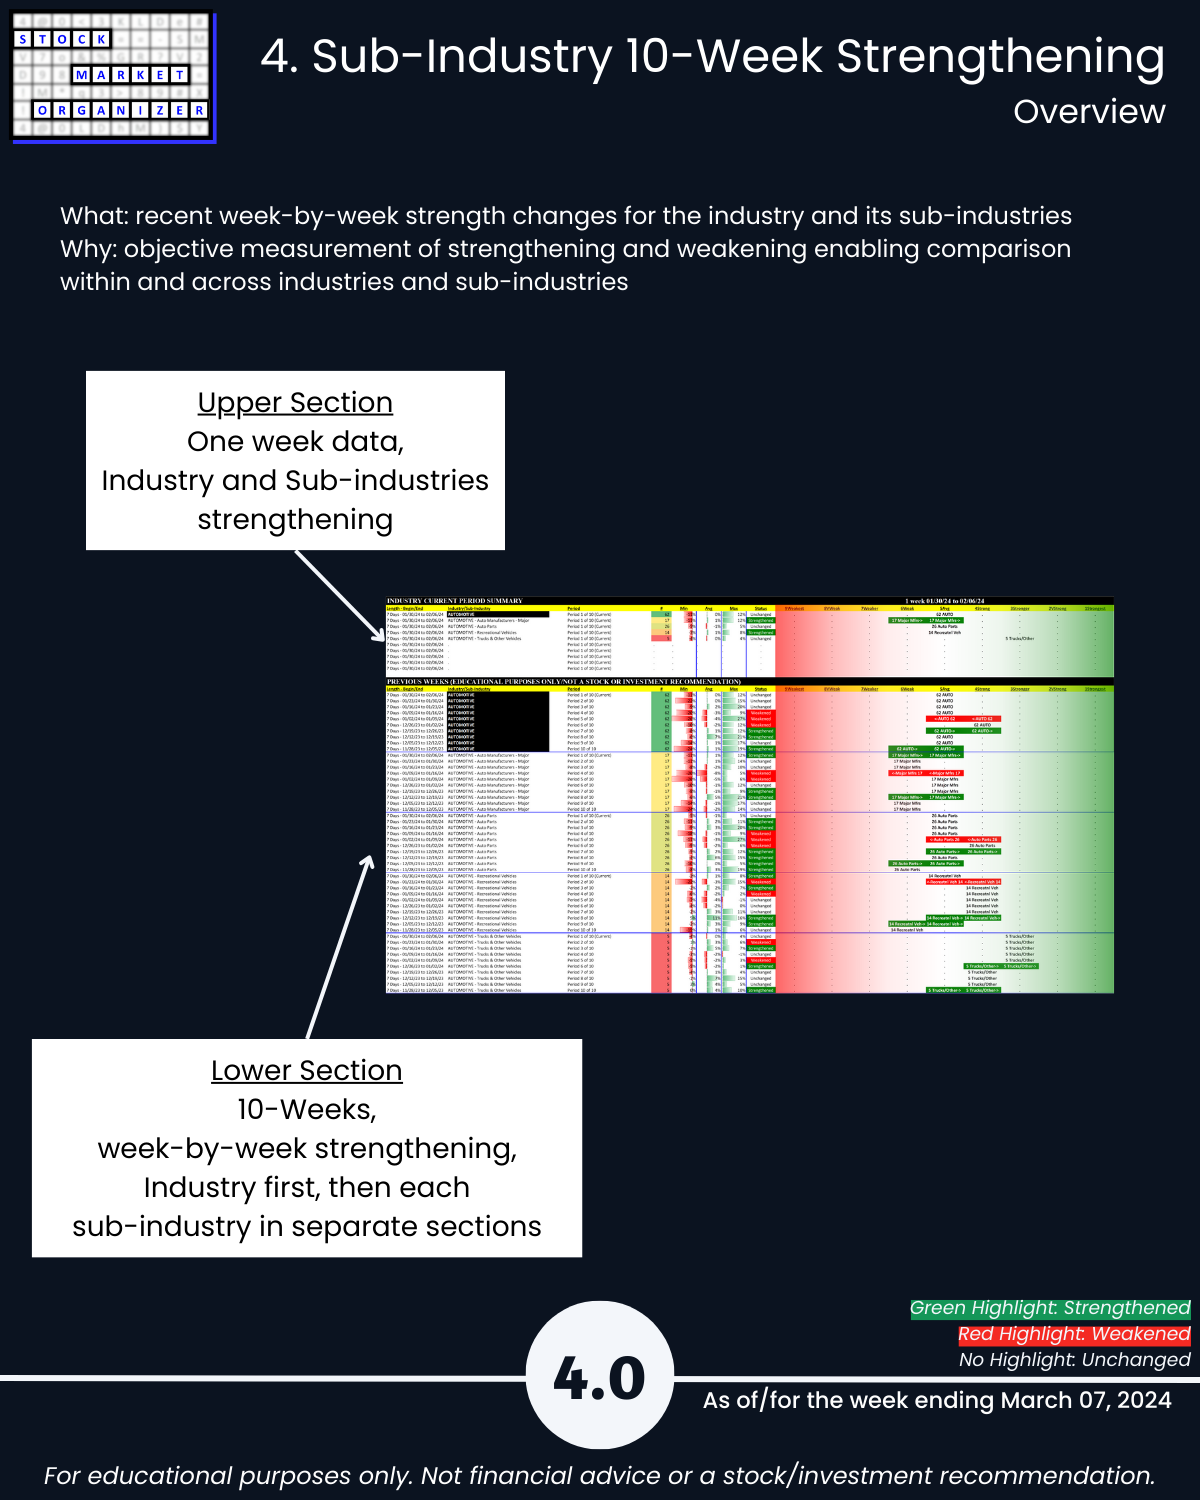
The focus: stacking strength at the stock, sub-industry, industry, and market levels.
How? Easy! Just start by tracking strengthening at the individual stock level. From this, build up strength at the higher levels and use this information to provide important context for individual stock strength.
Why? Because the stronger your stocks the greener your P&L.
Remember:
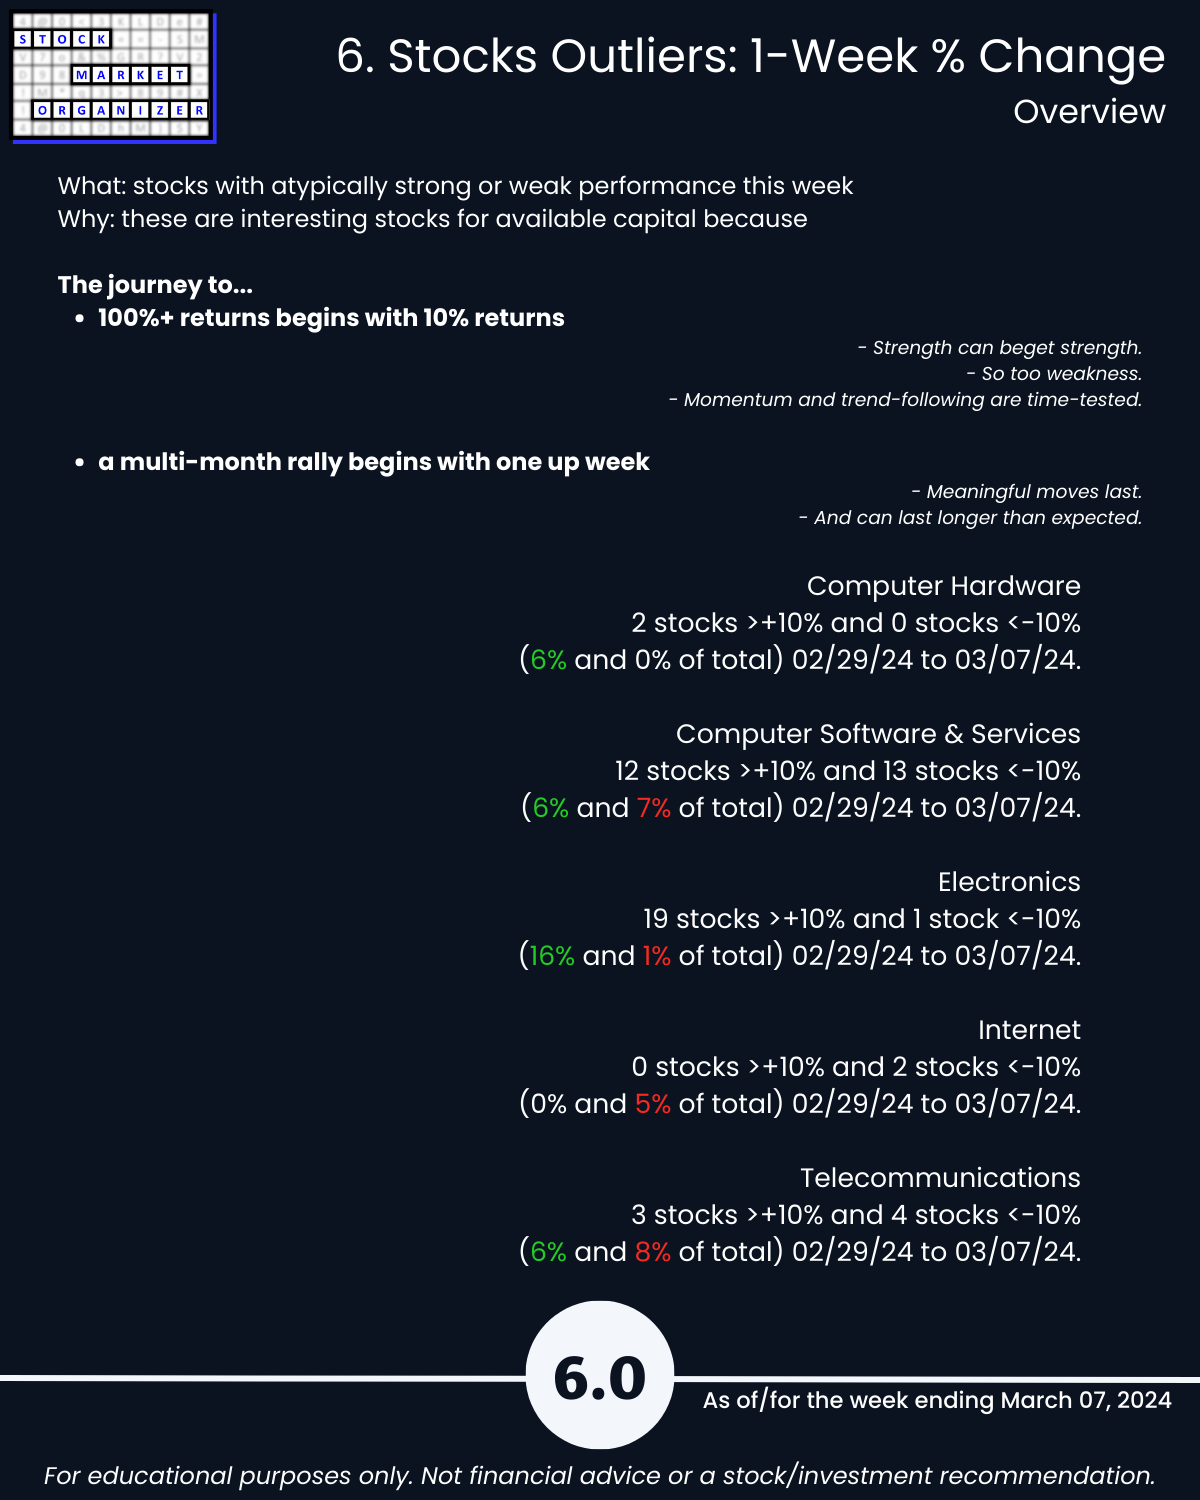
🔹 the rally of multiple months+ begins with one up week, and
🔹 the journey to 100%+ returns begins with 10% returns.
It really doesn’t have to be so complicated.
TAKEAWAYS
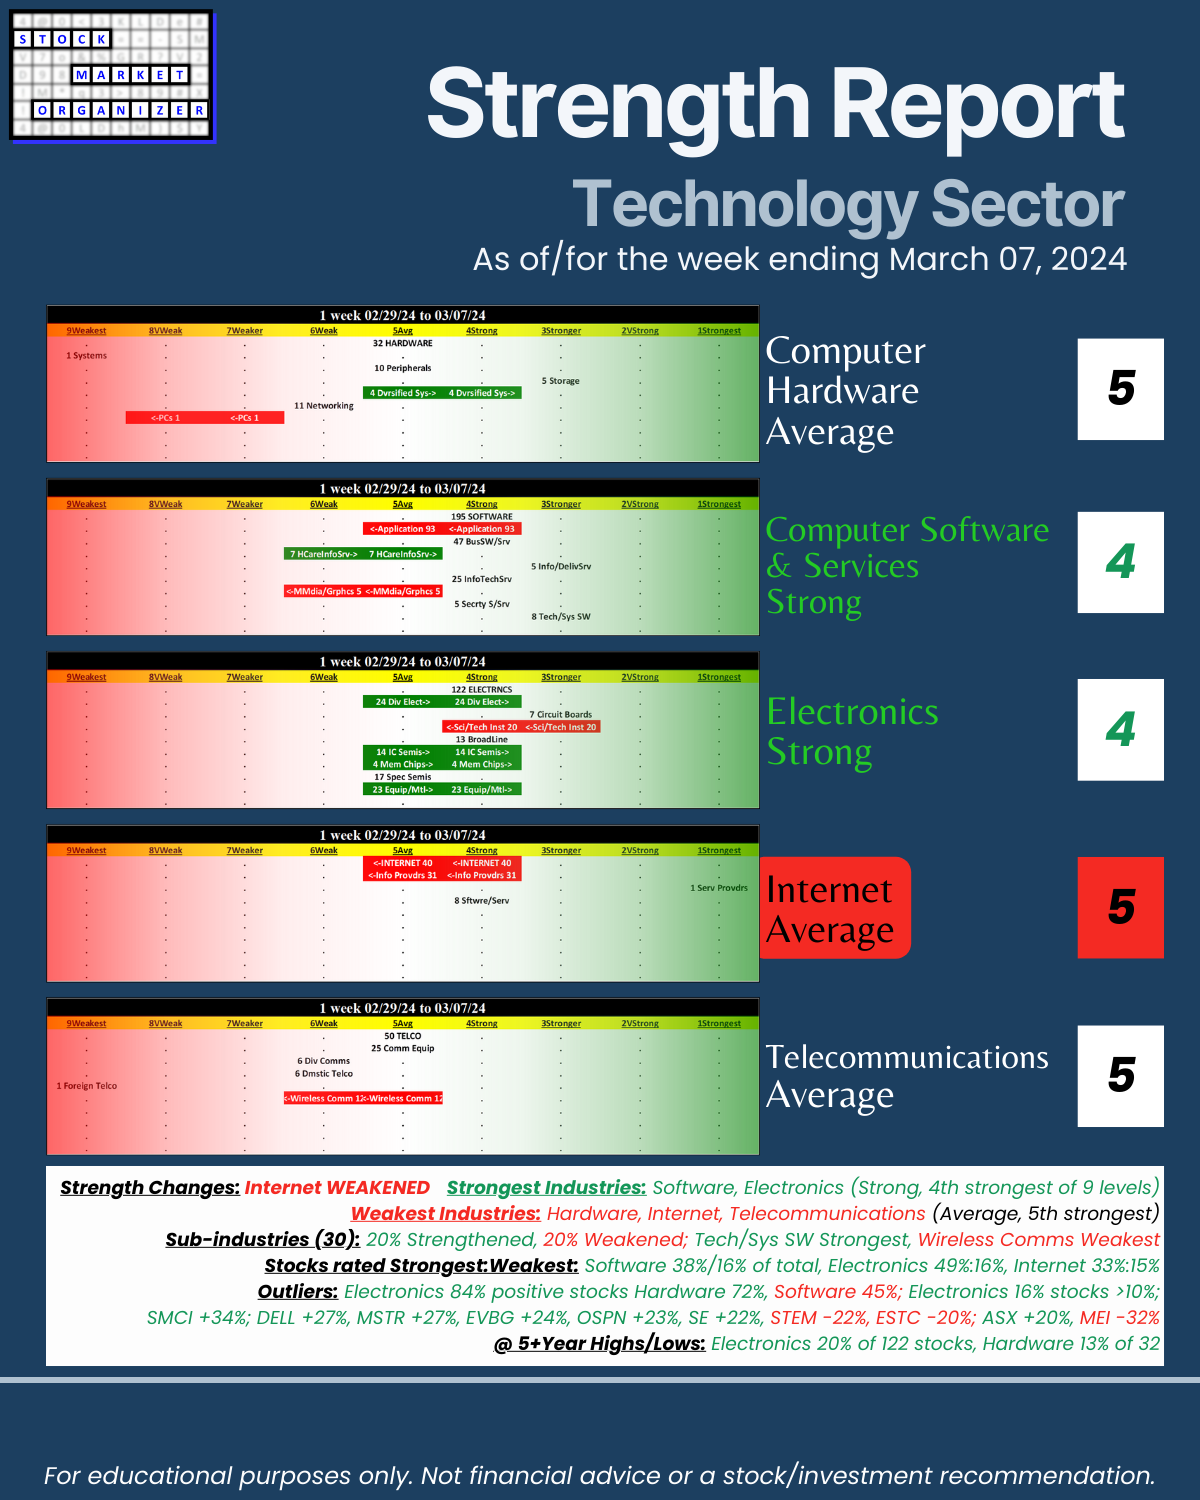
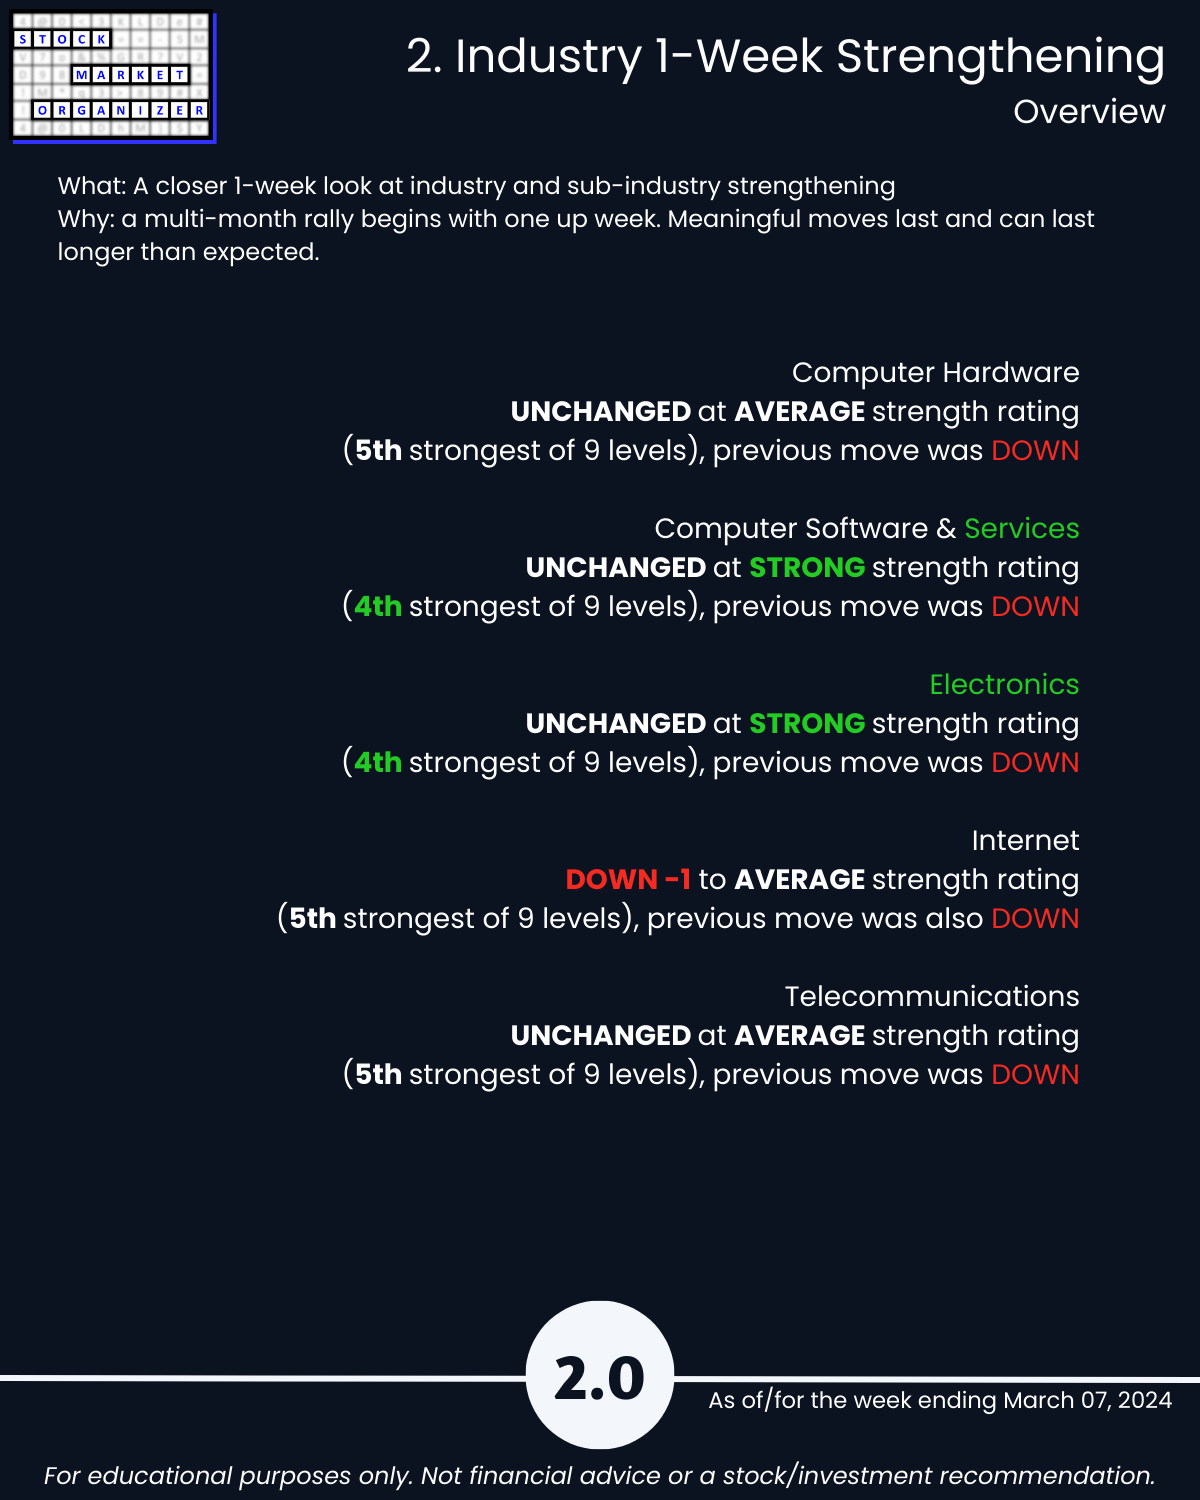
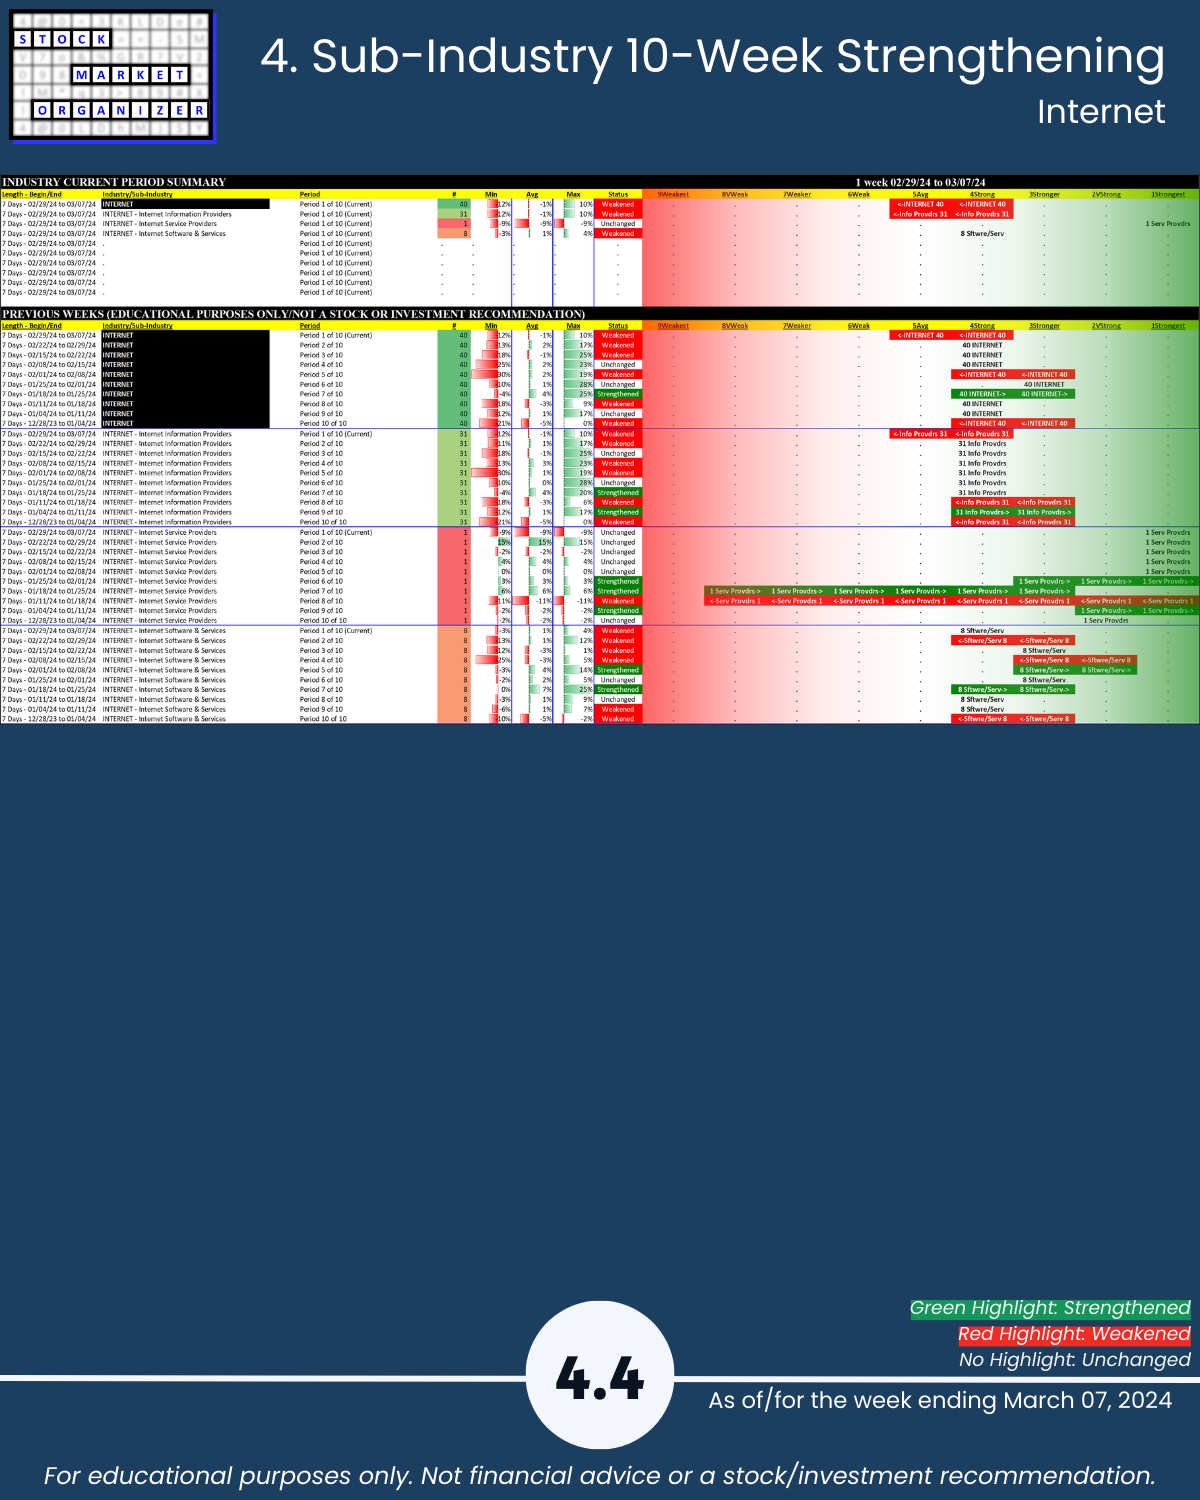
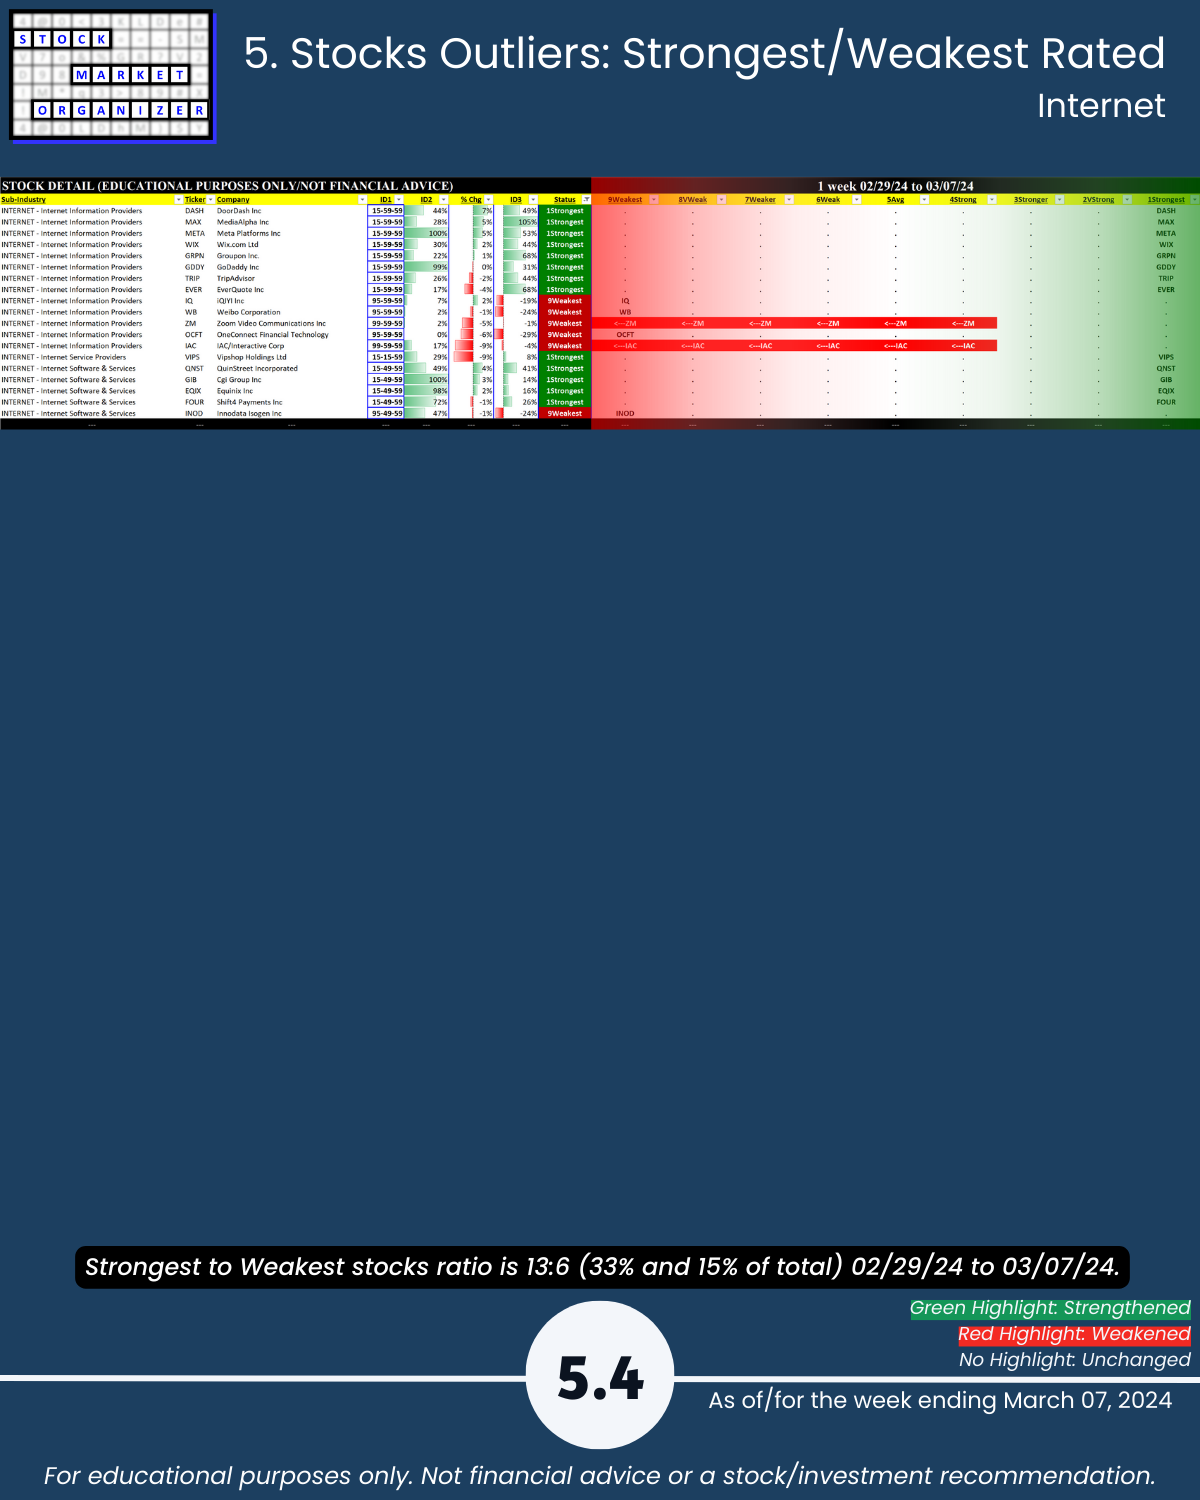
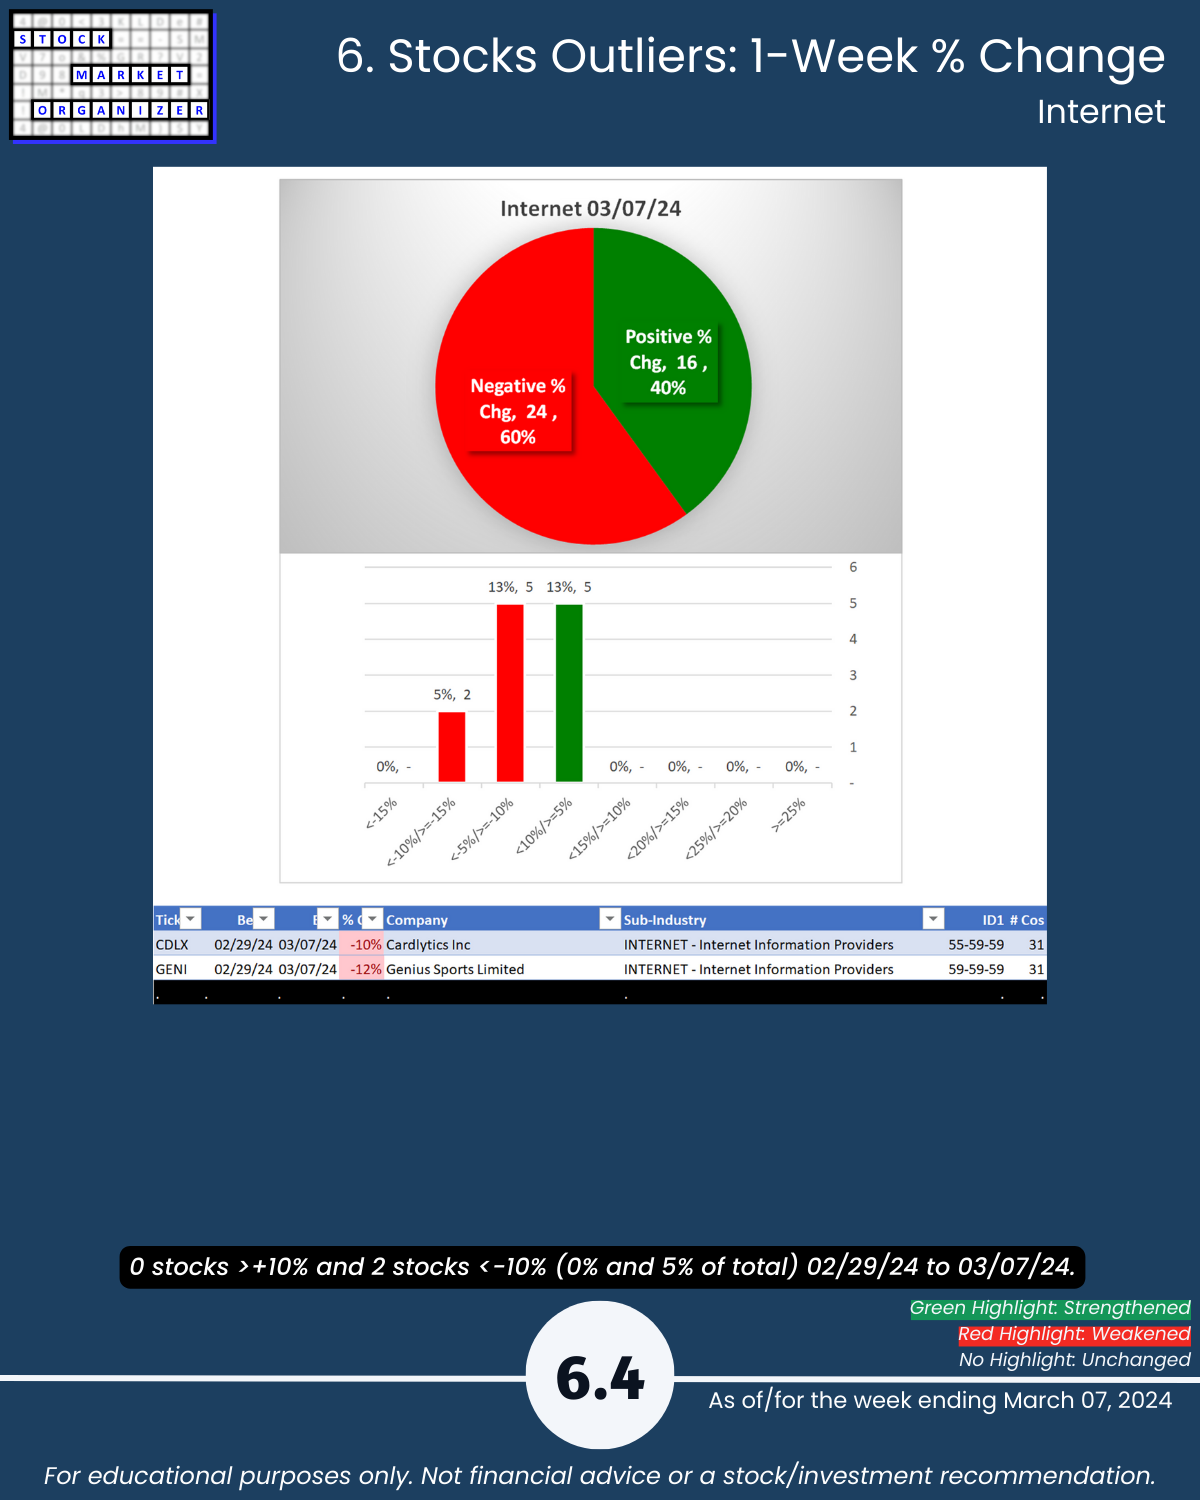
🔹 Strength Changes: Internet WEAKENED
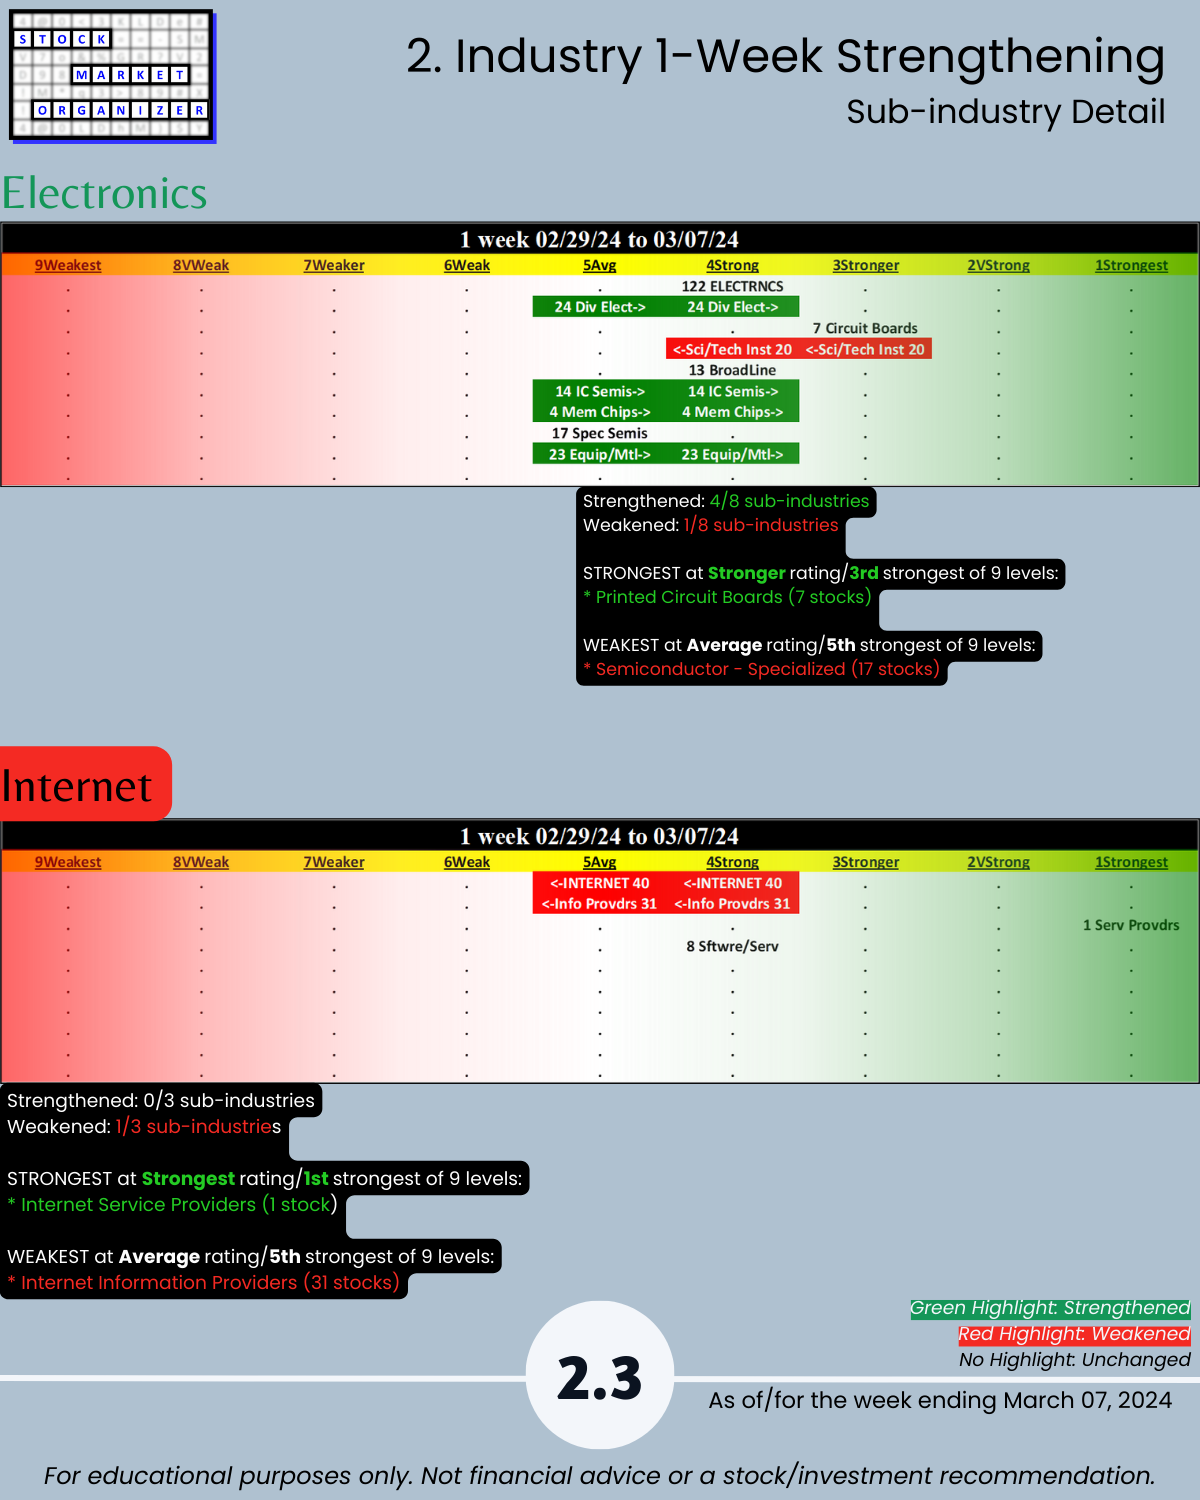
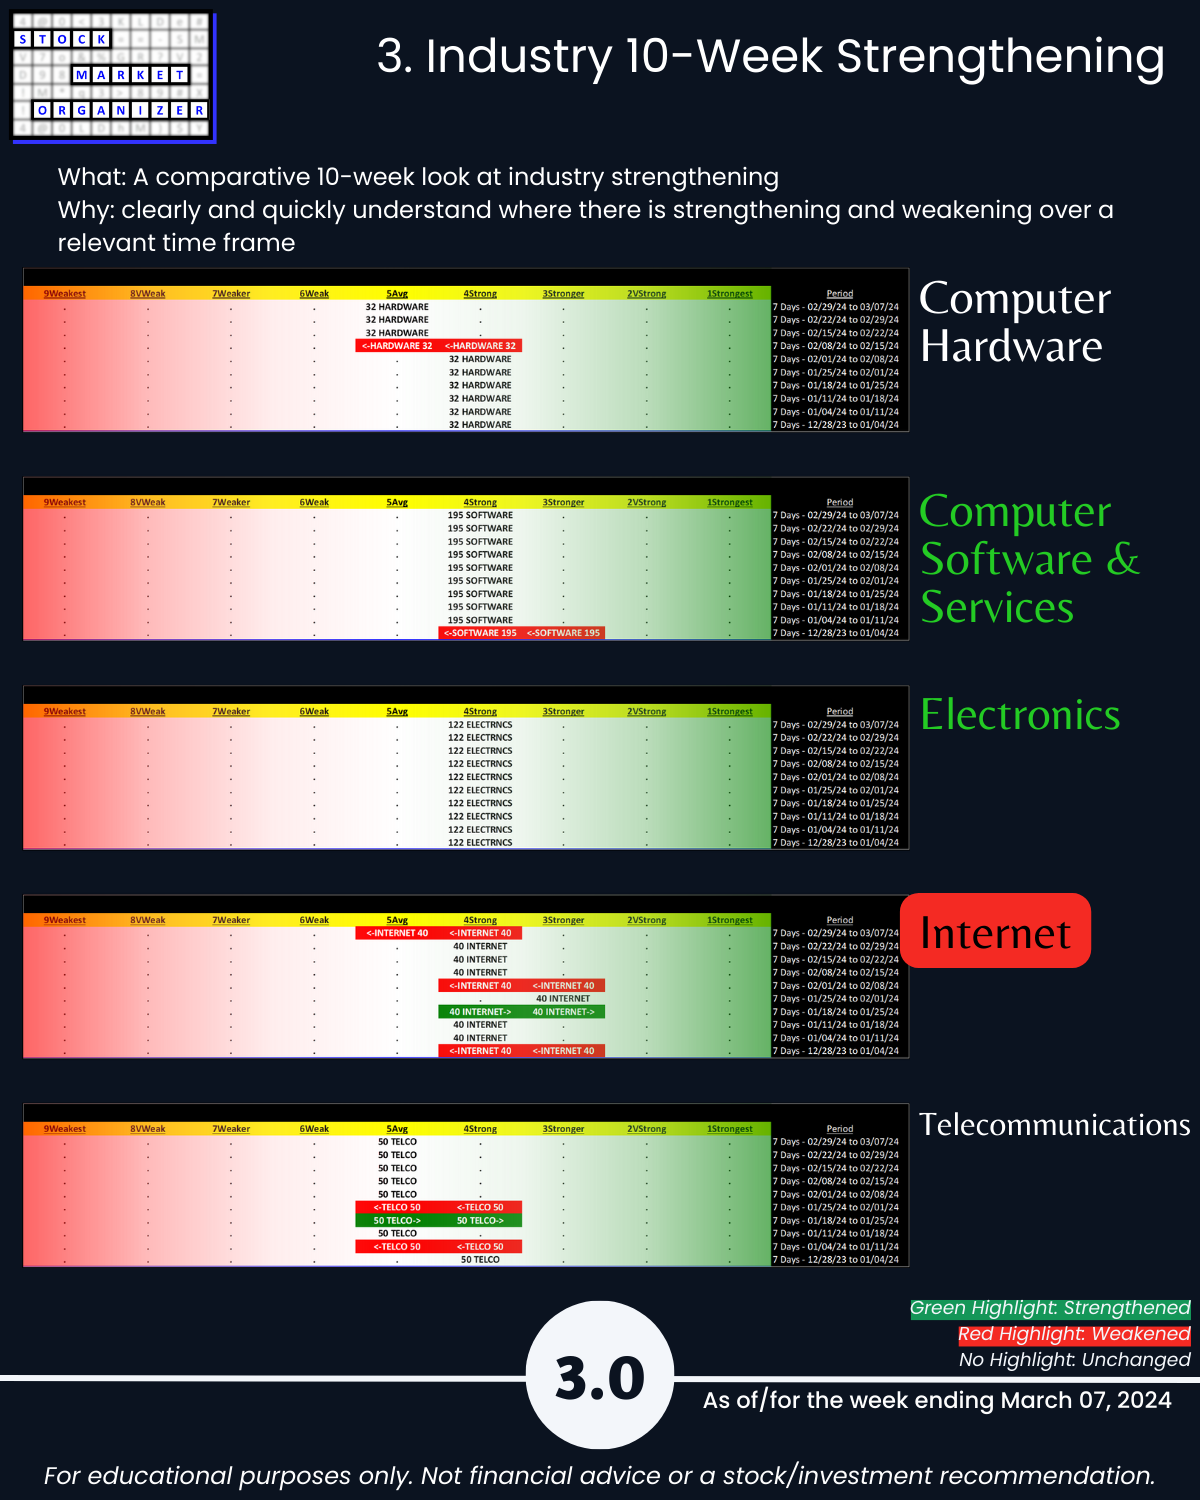
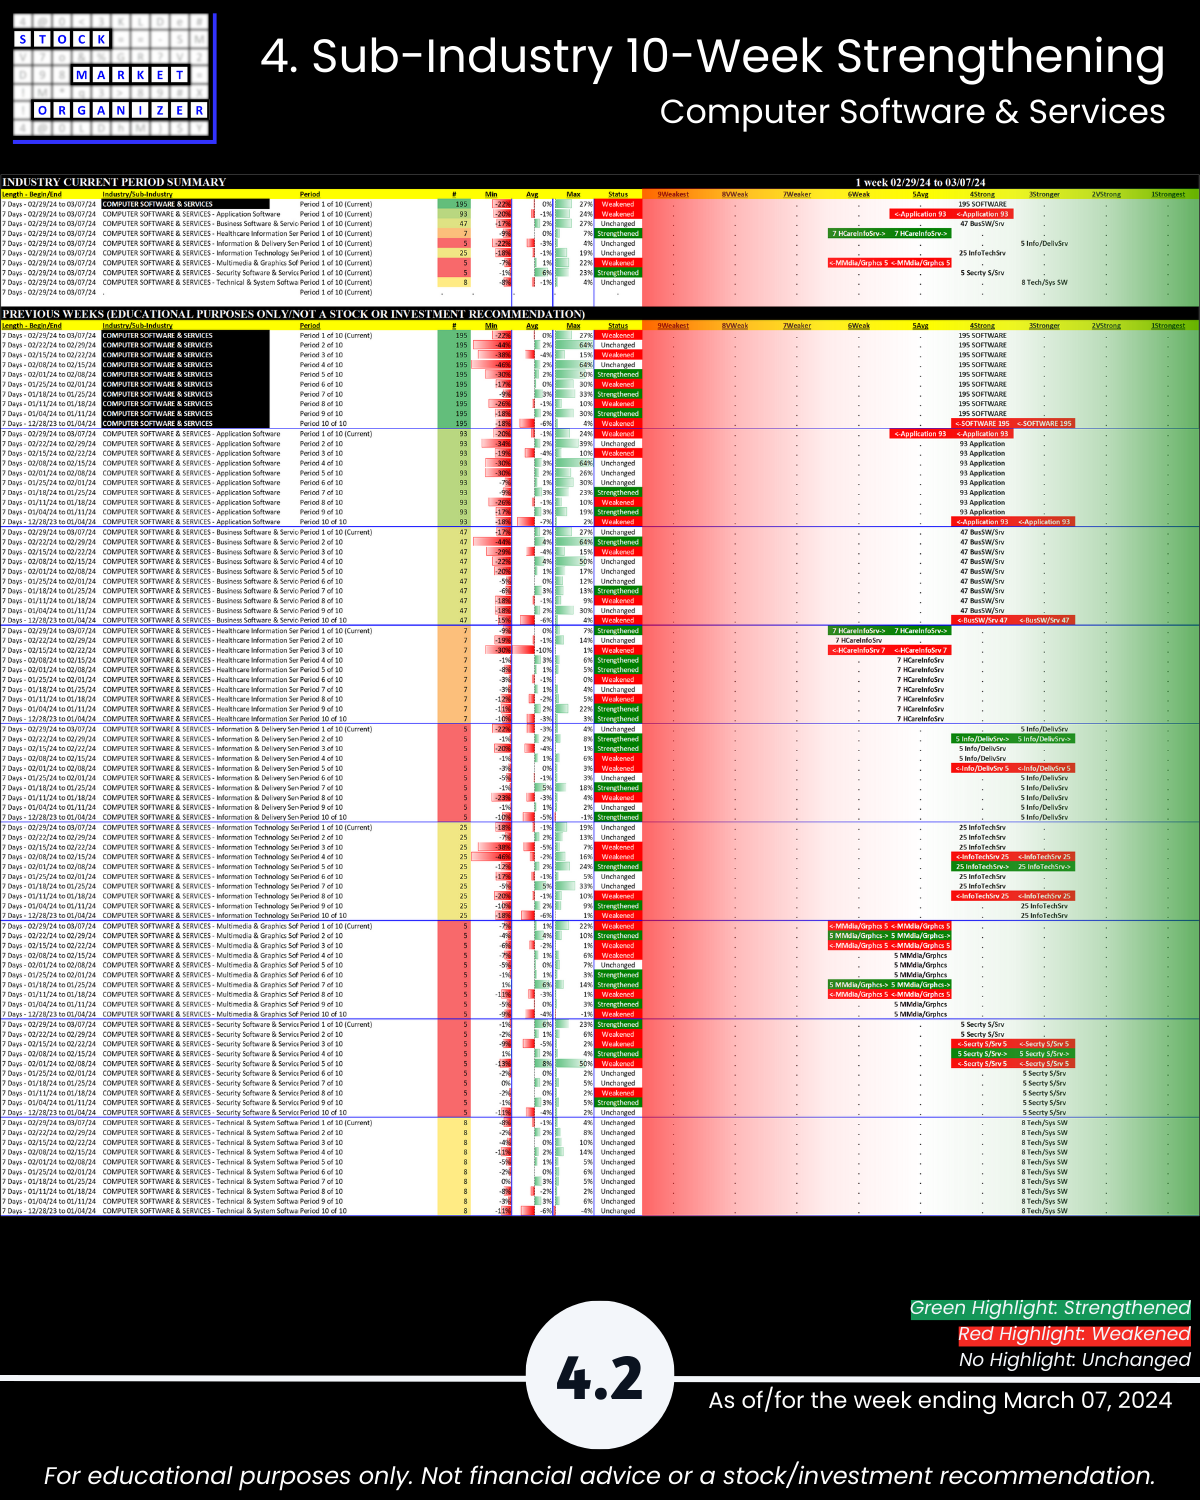
🔹 Strongest Industries: Software, Electronics (Strong, 4th strongest of 9 levels)
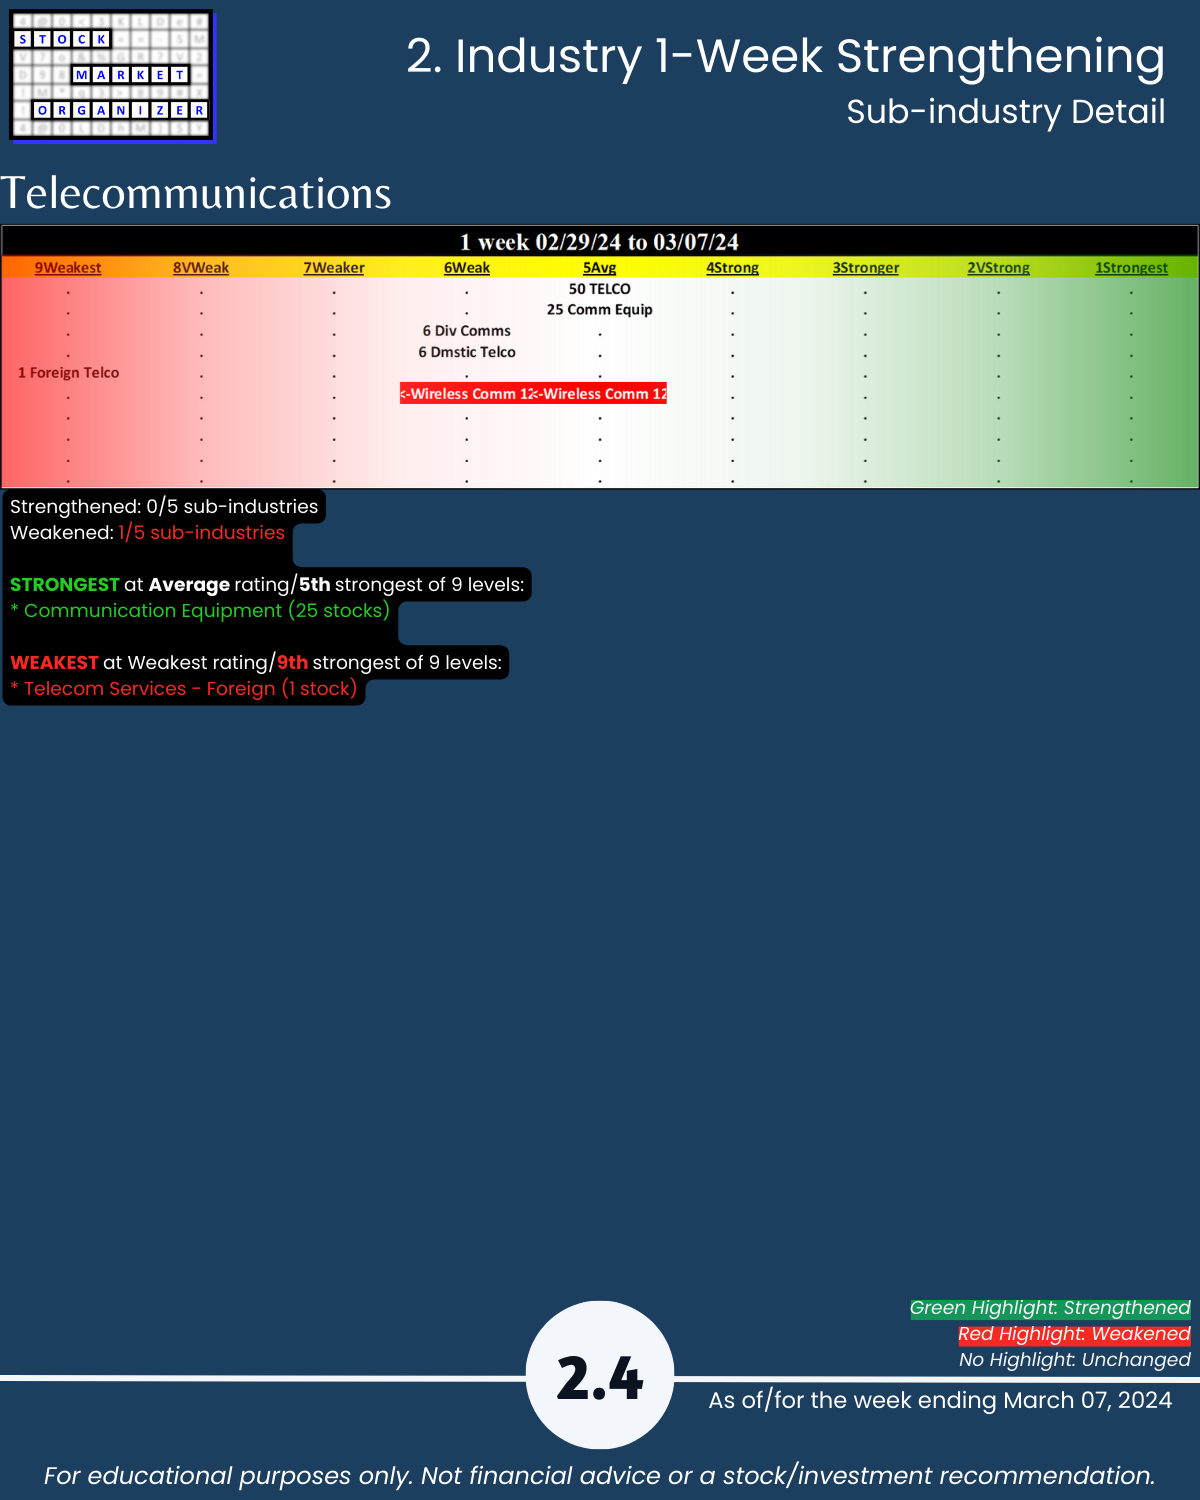
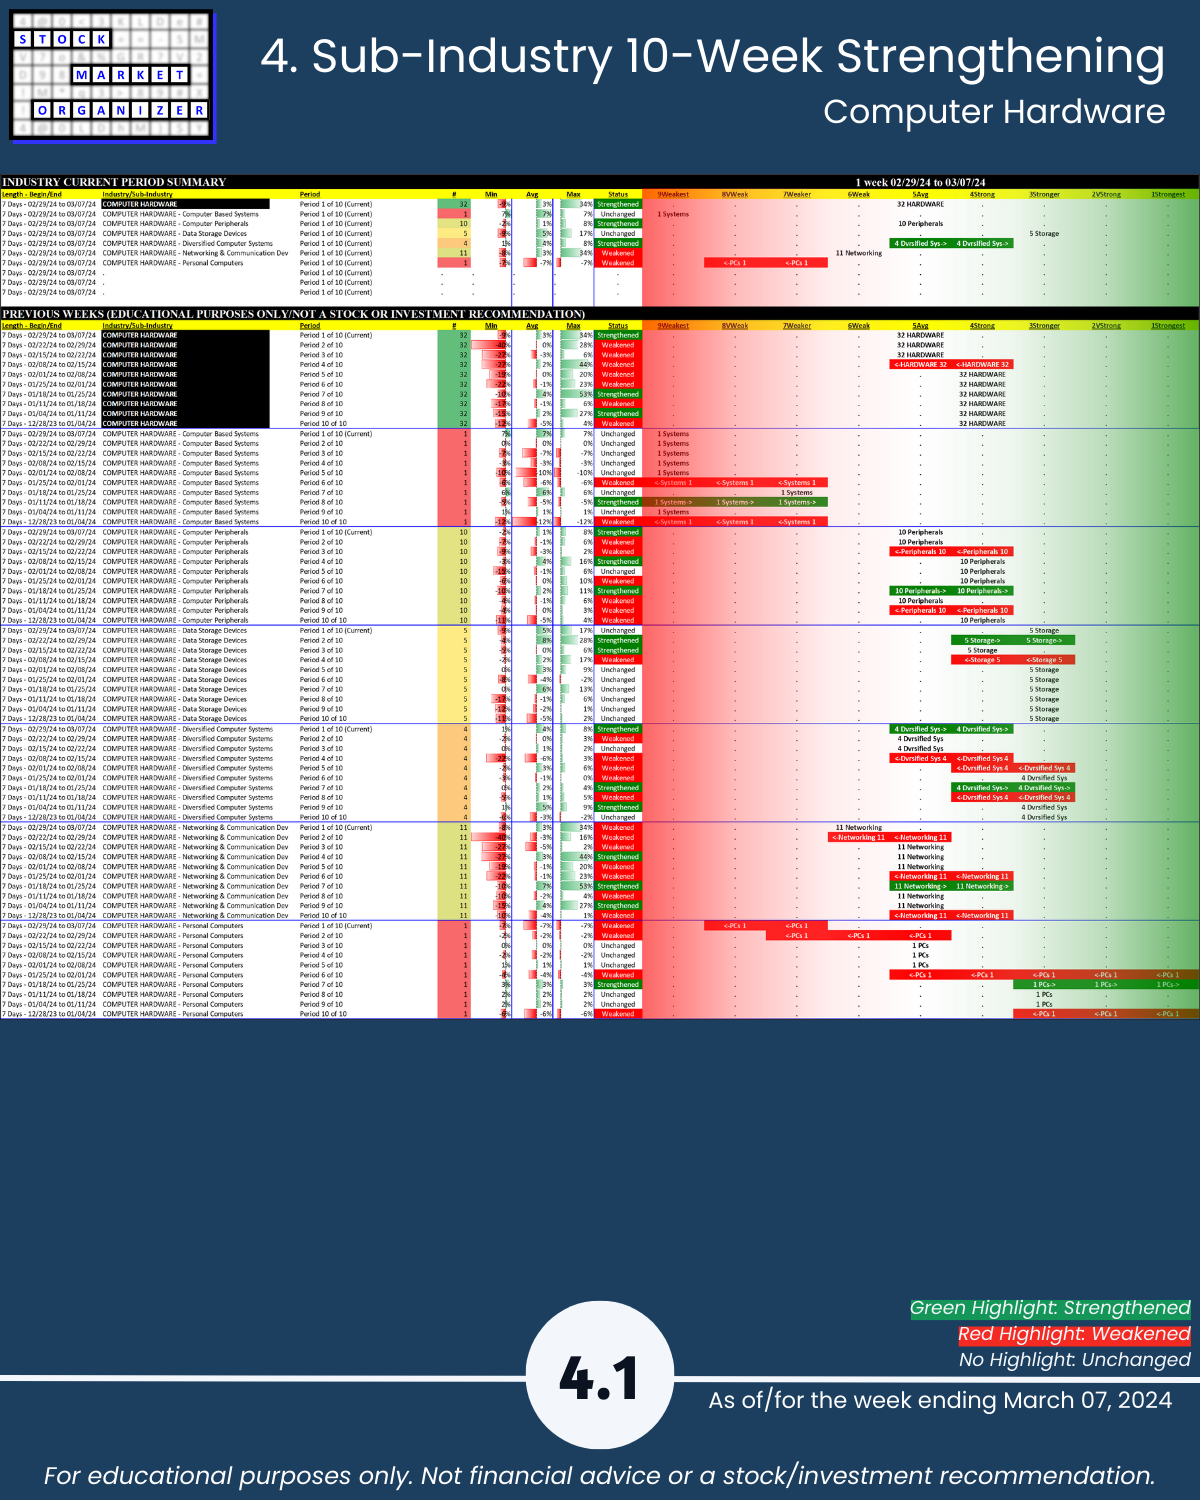
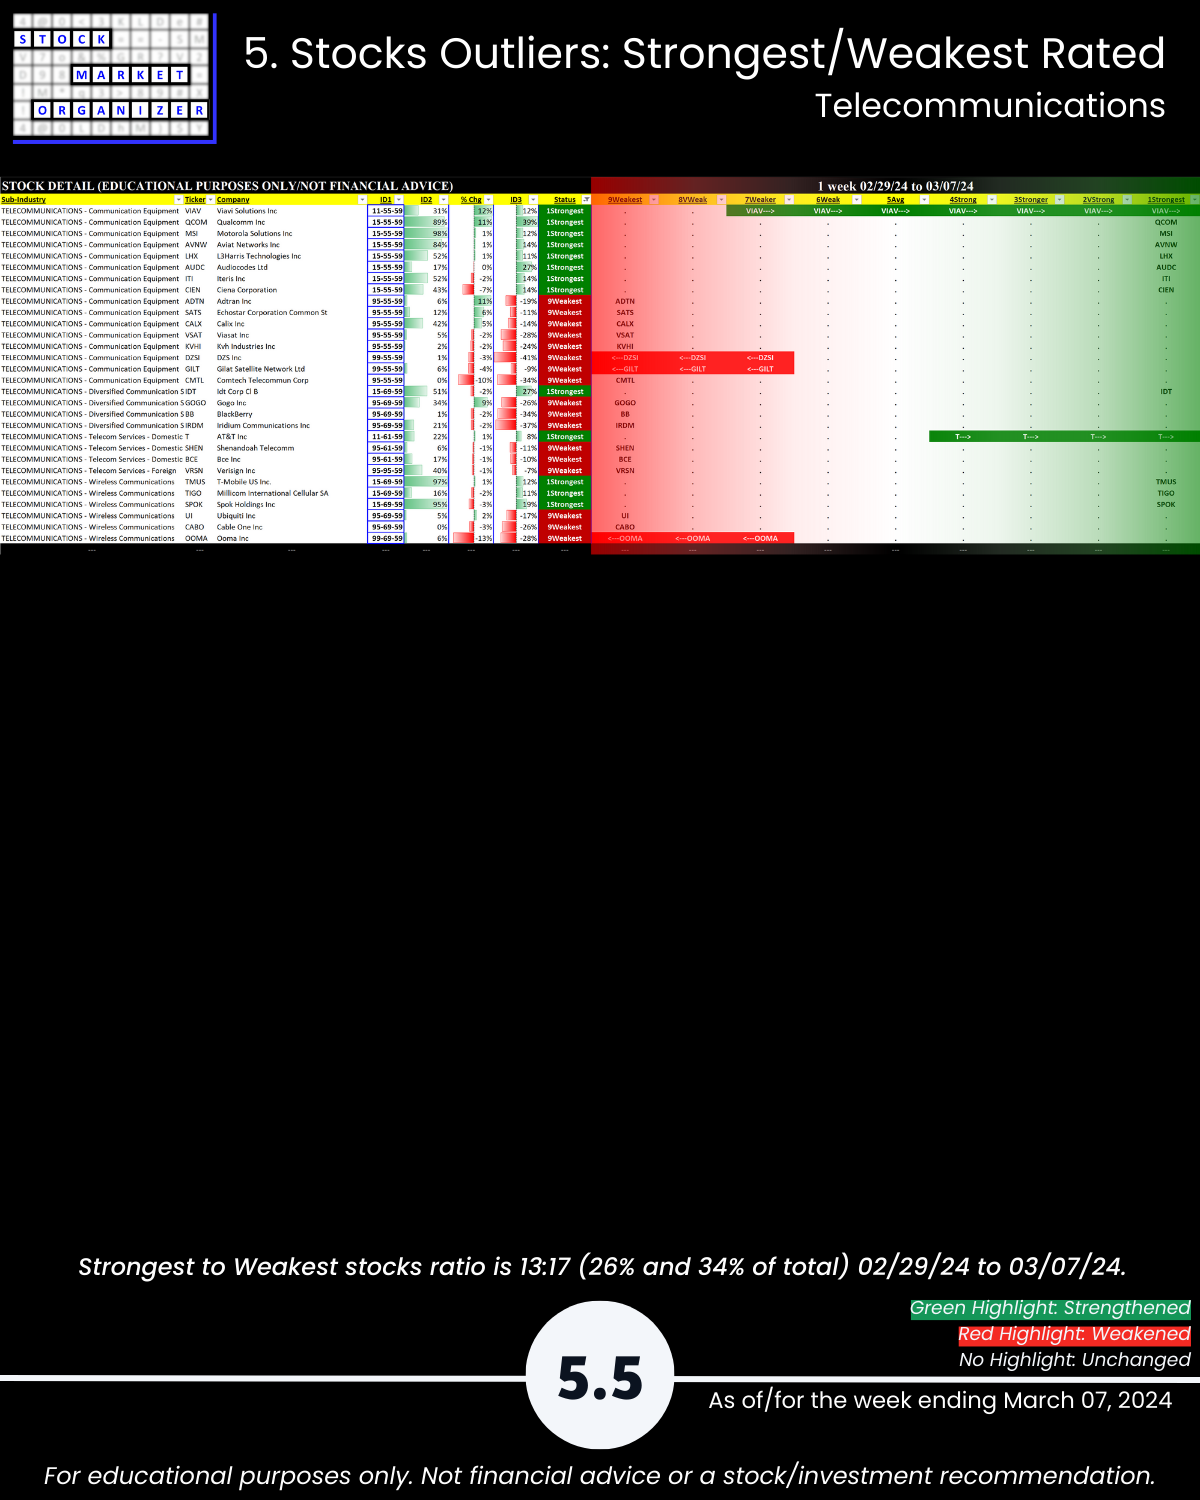
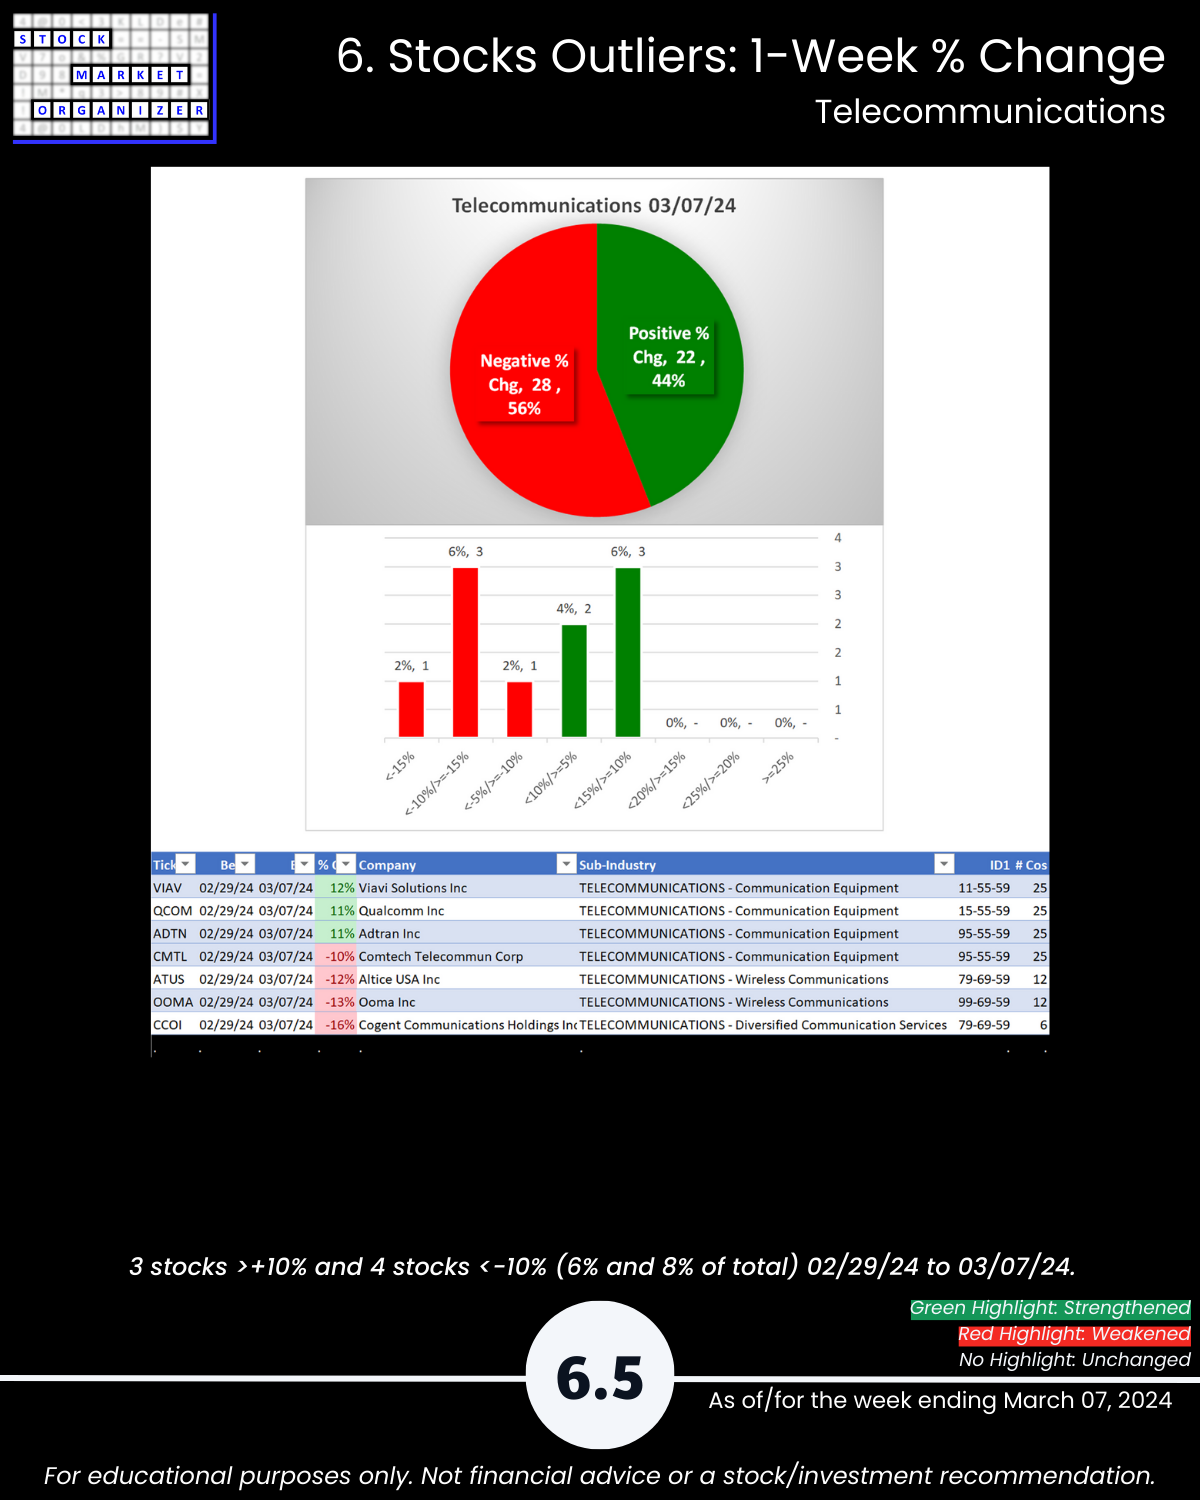
🔹 Weakest Industries: Hardware, Internet, Telecommunications (Average, 5th strongest)
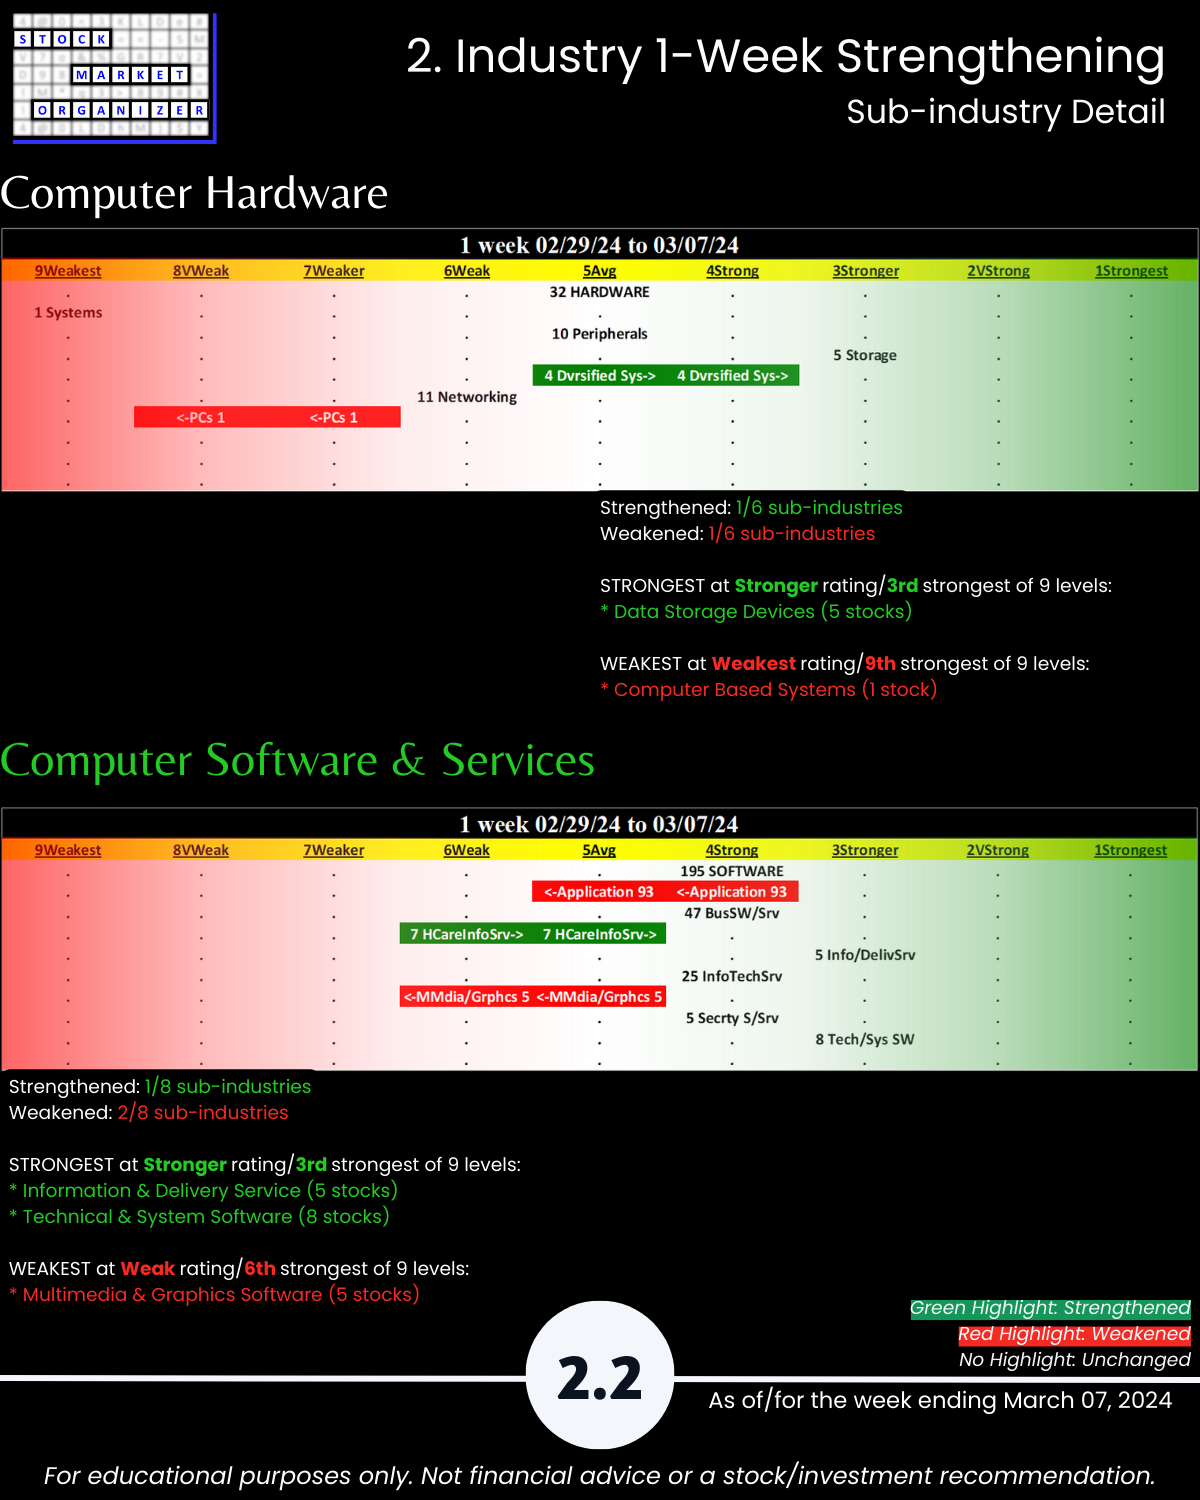
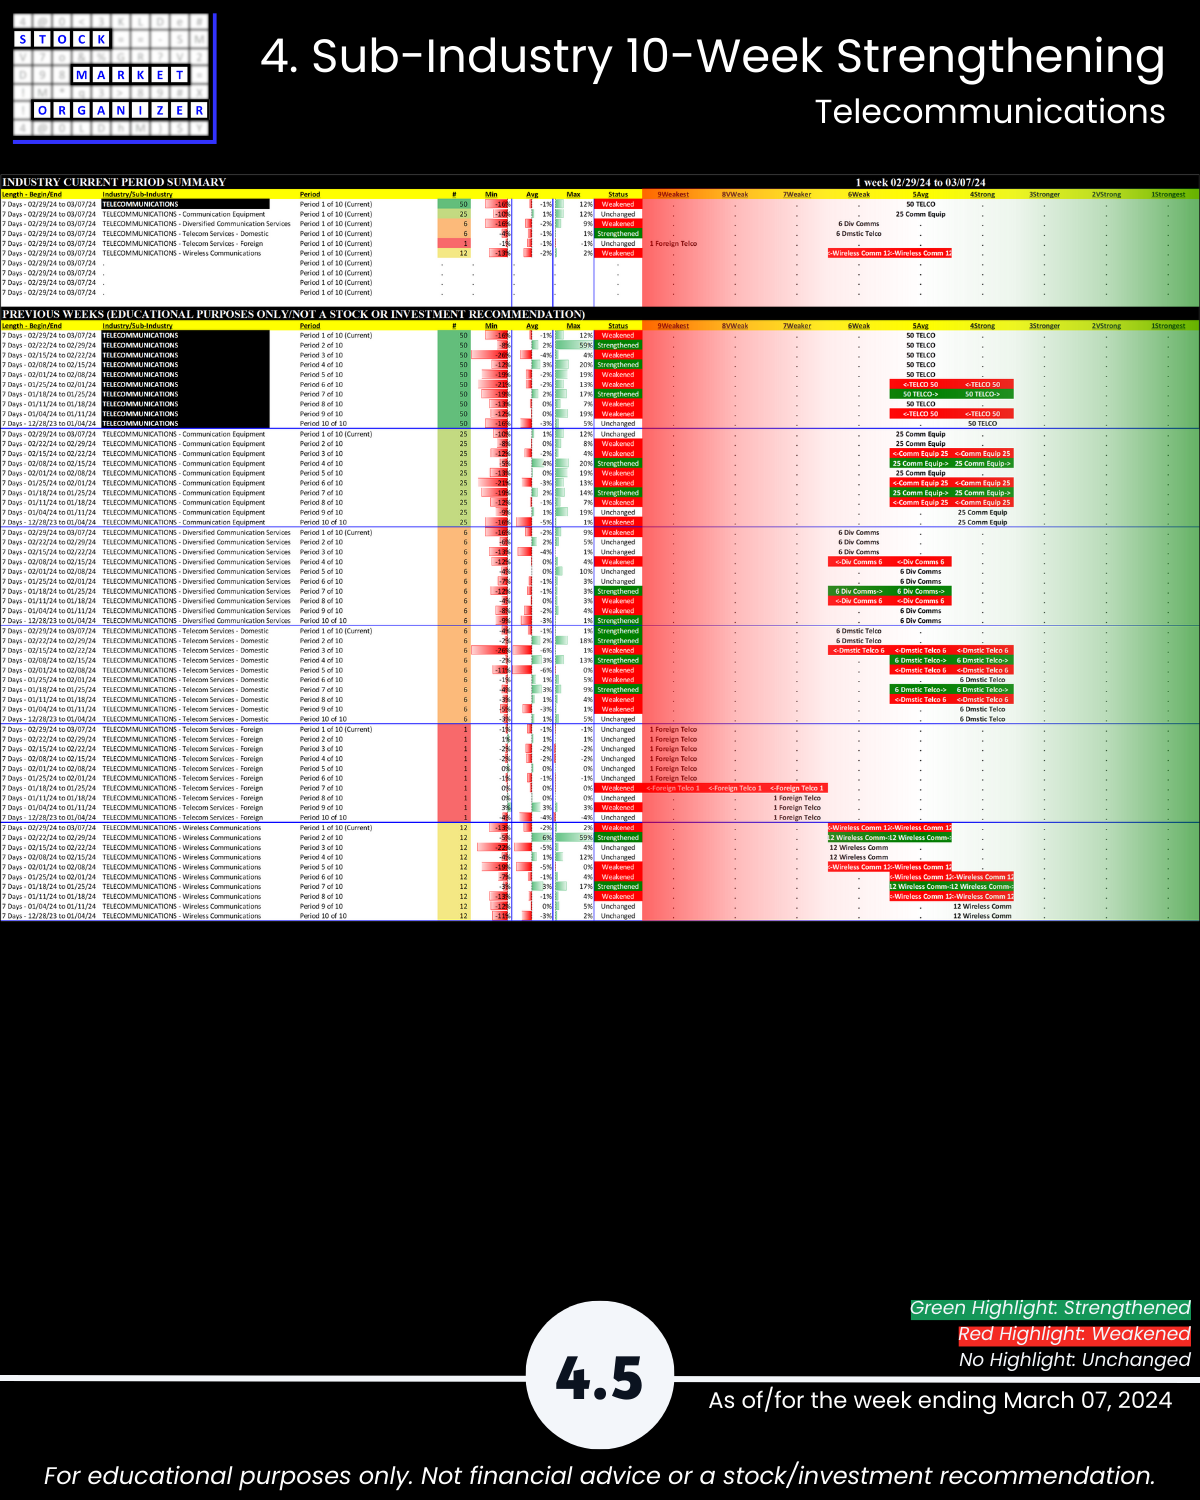
🔹 Sub-industries (30): 20% Strengthened, 20% Weakened; Tech/Sys SW Strongest, Wireless Comms Weakest
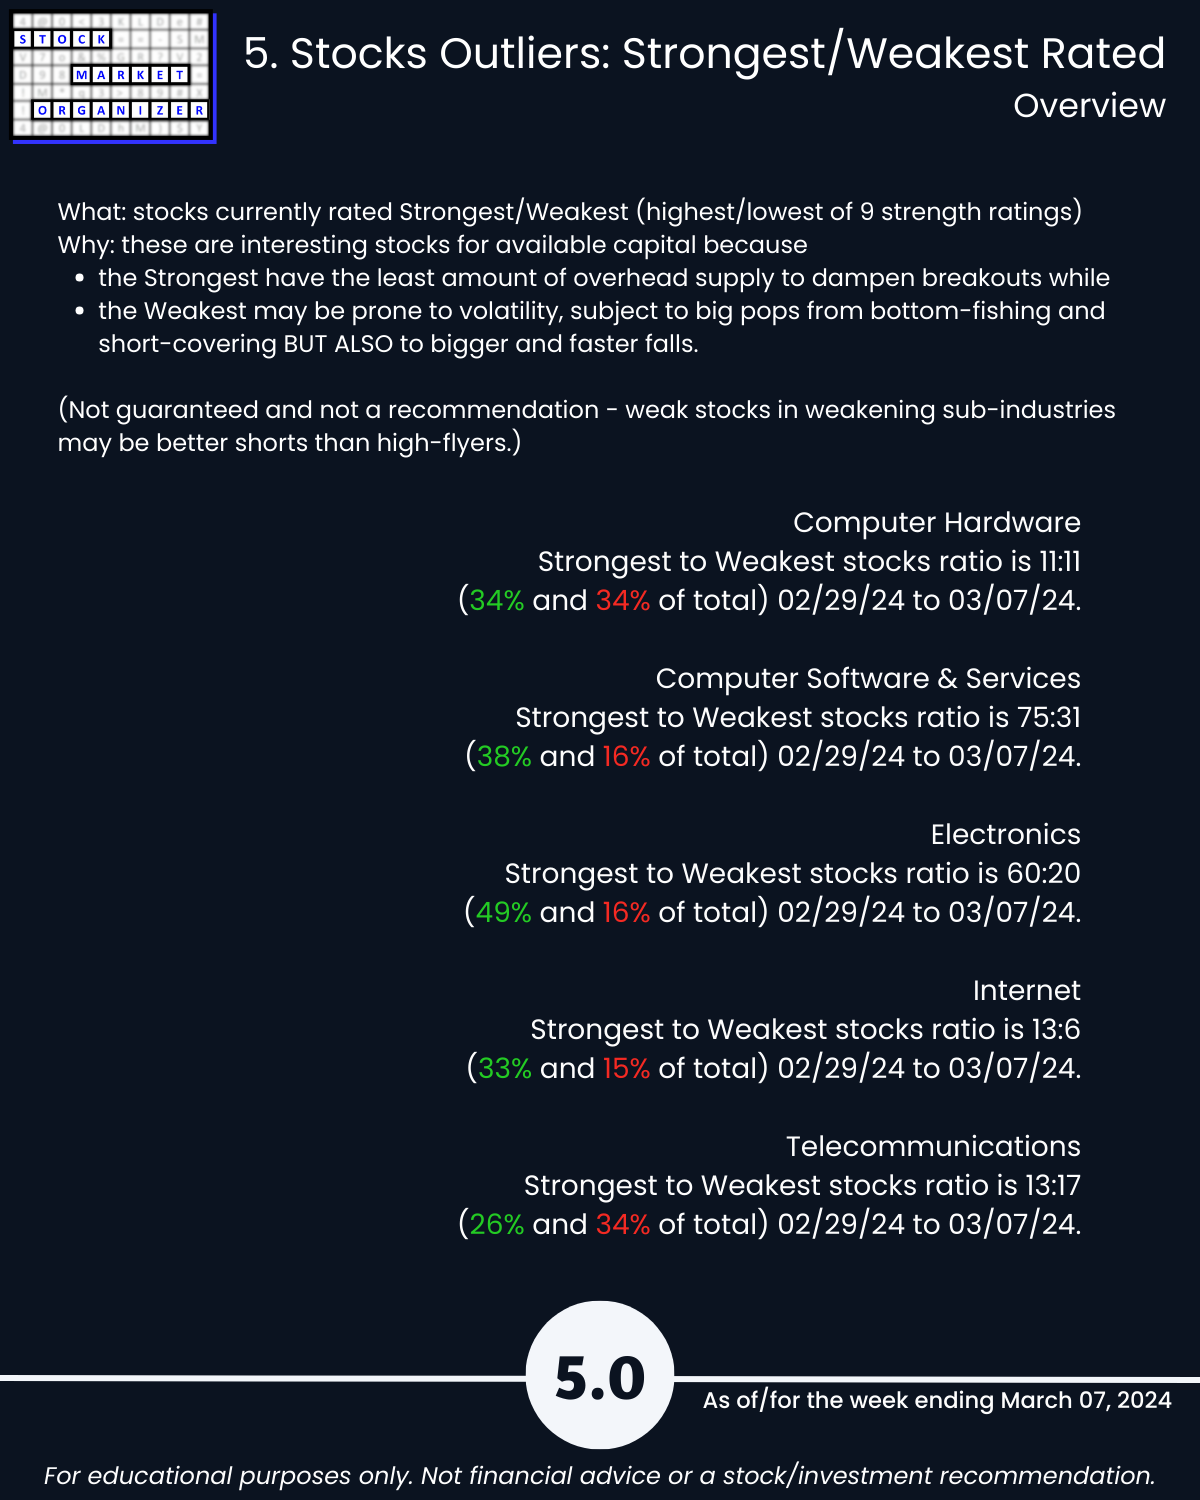
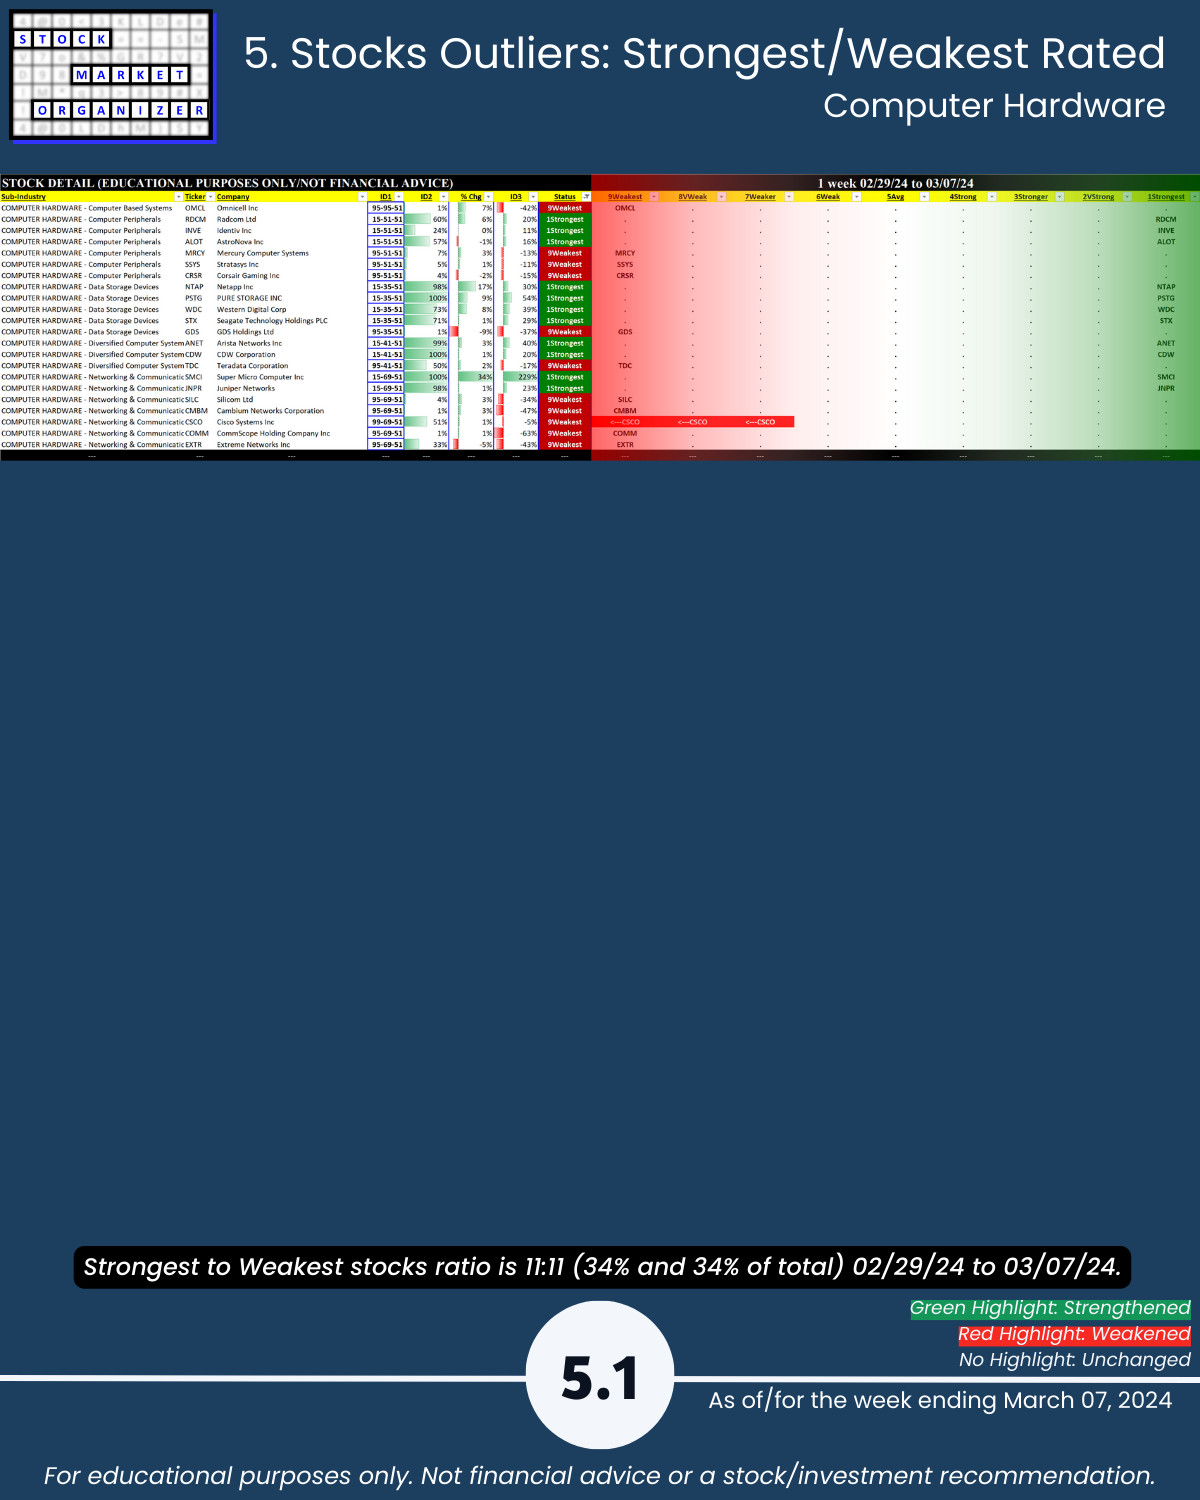
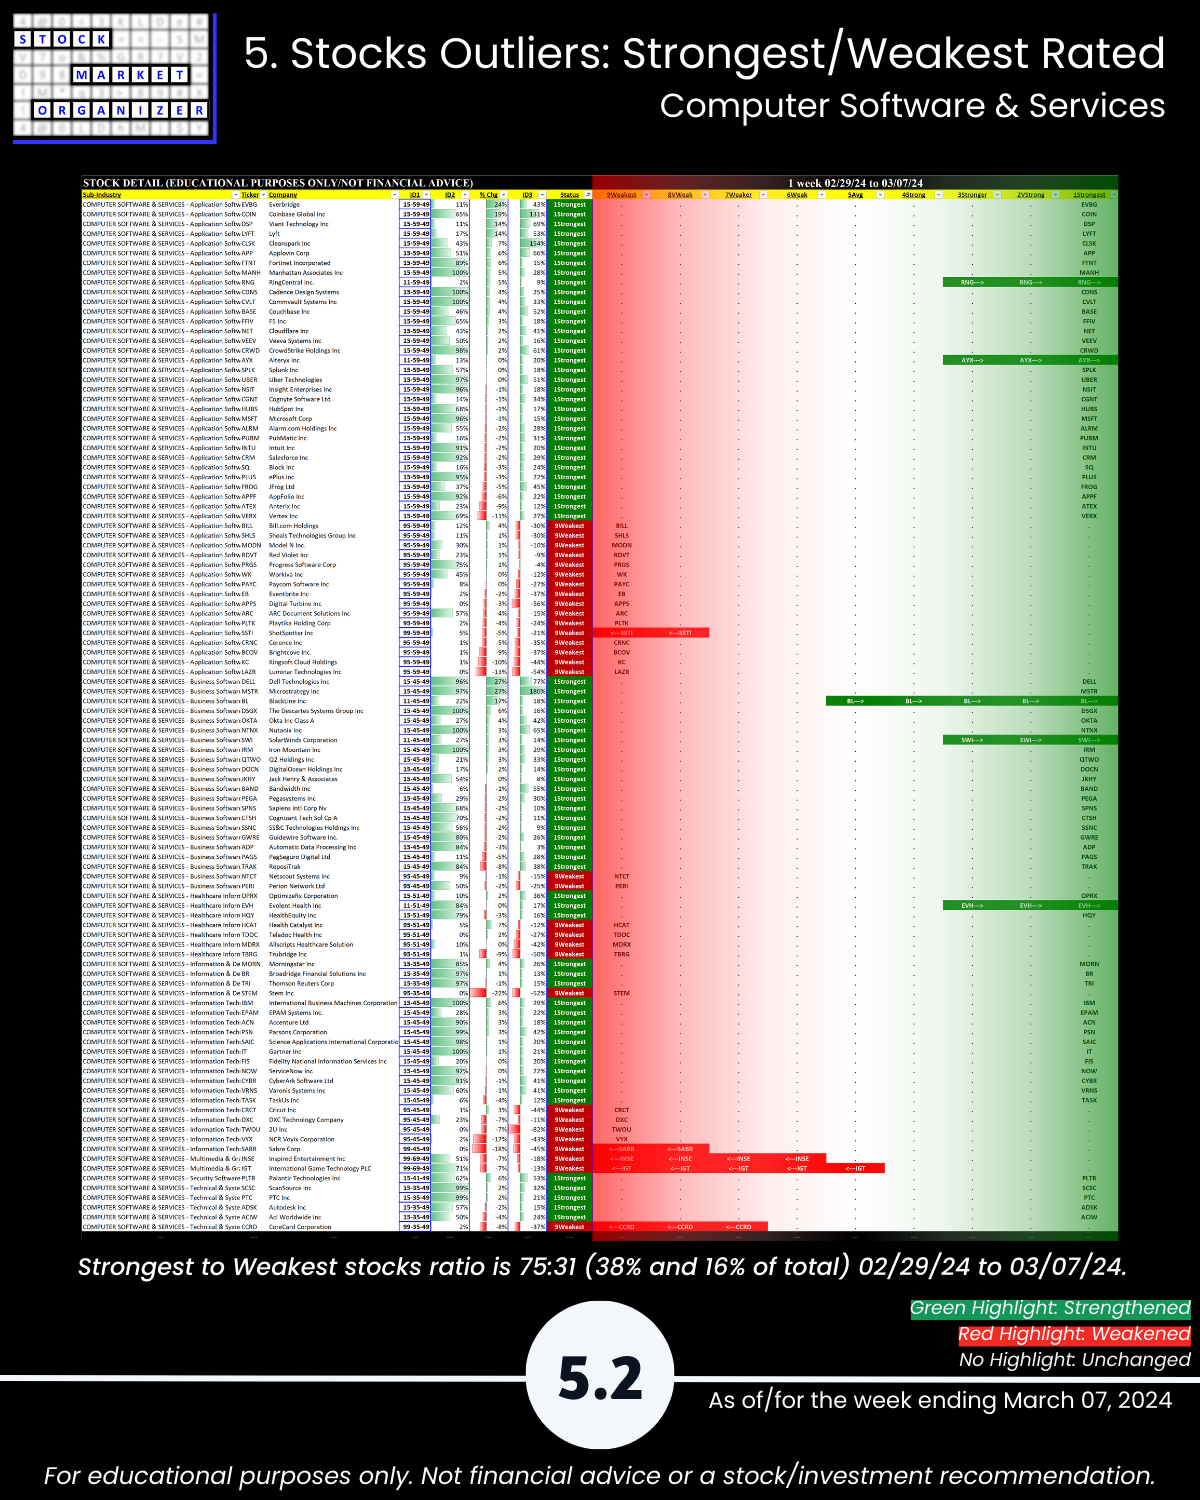
🔹 Stocks rated Strongest:Weakest: Software 38%/16% of total, Electronics 49%:16%, Internet 33%:15%
🔹 Outliers:
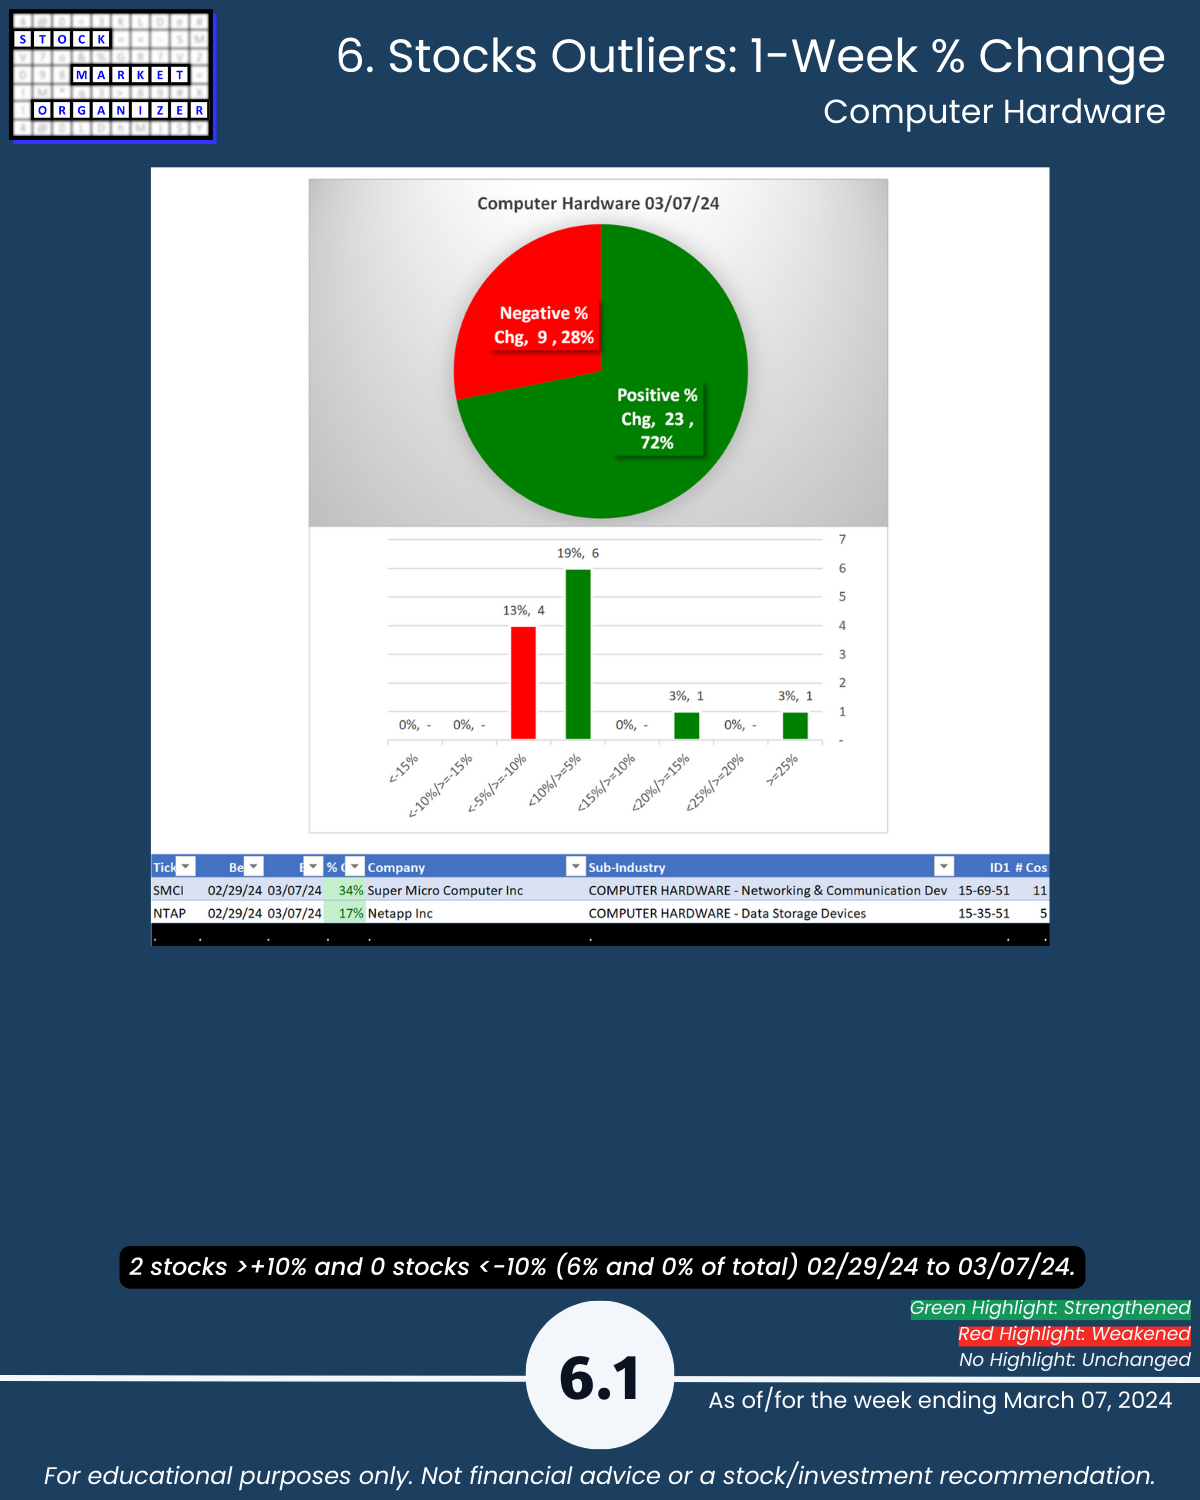
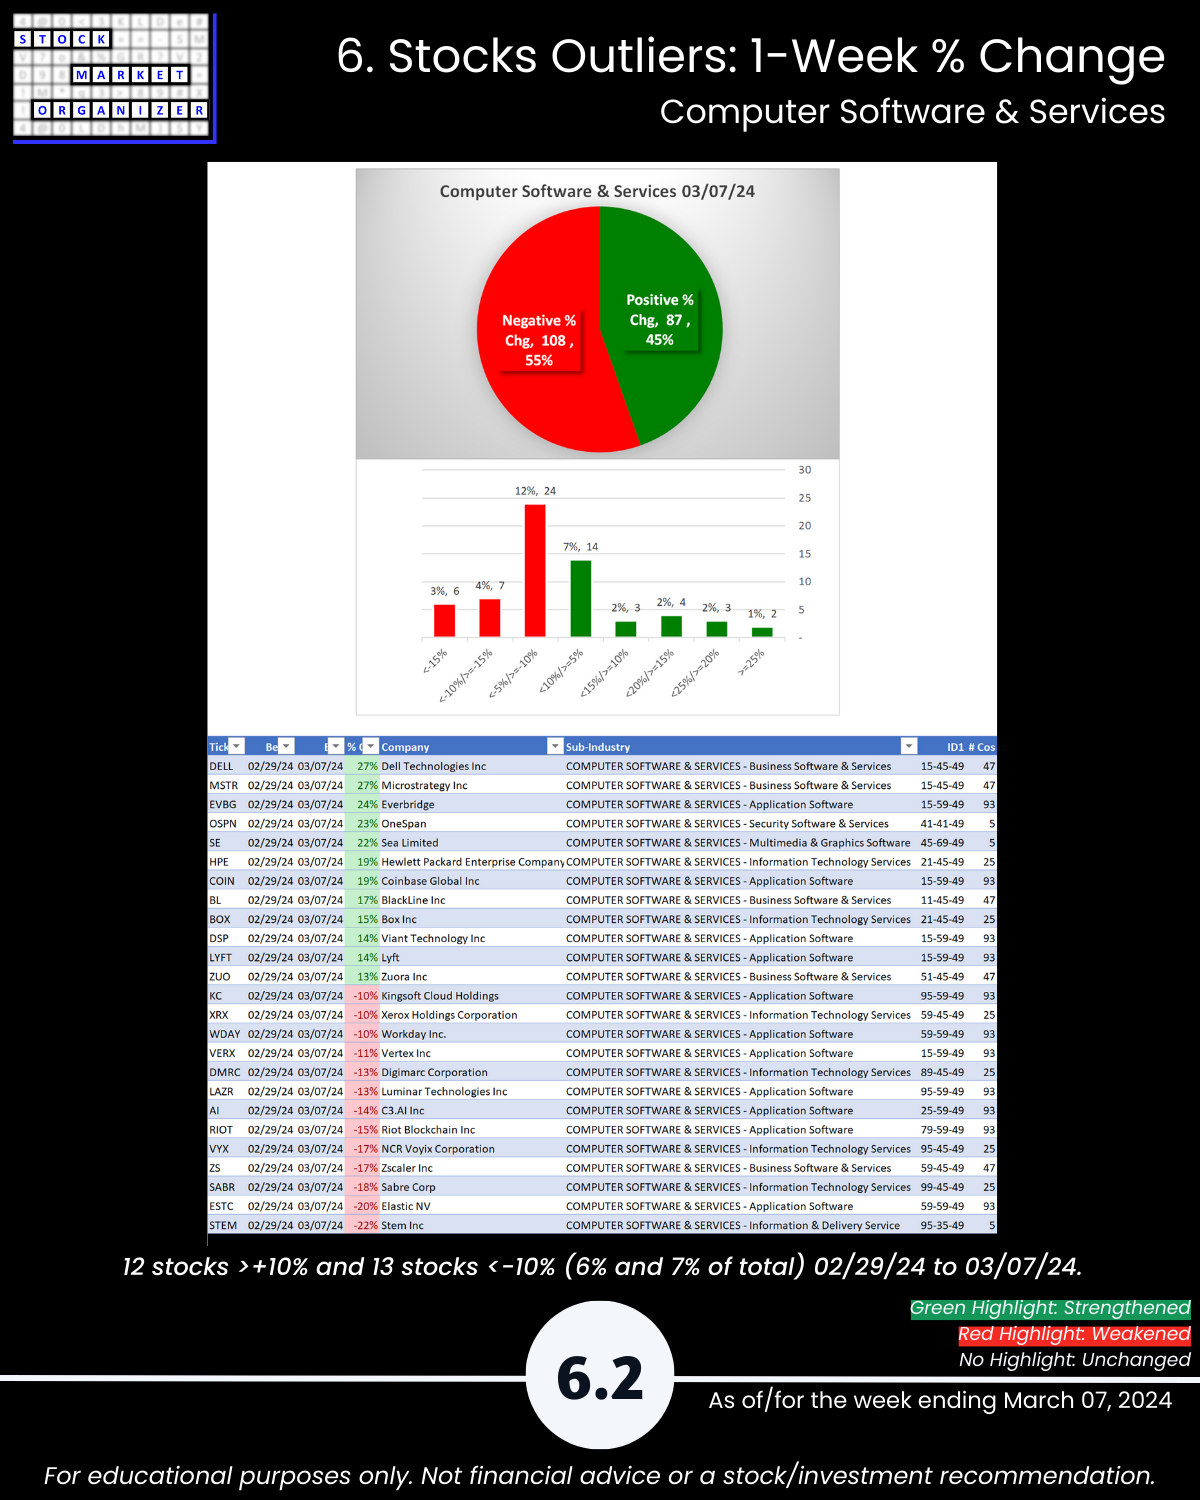
- Electronics 84% positive stocks Hardware 72%, Software 45%;
- Electronics 16% stocks >10%;
- SMCI +34%; DELL +27%, MSTR +27%, EVBG +24%, OSPN +23%, SE +22%, STEM -22%, ESTC -20%; ASX +20%, MEI -32%
🔹 @ 5+Year Highs/Lows: Electronics 20% of 122 stocks, Hardware 13% of 32
This report may particularly be of interest if the following 5 concepts resonate with you:
- The stronger your stocks, the greener your P&L.
- The journey to 100%+ returns begins with 10% returns.
- The journey to a multi-month rally begins with one up week.
- Most stocks do what the market does. (While the market can only do what its underlying stocks, sub-industries, and industries do.)
- 80/20: not all information is created equal. (Press buttons, not balloons.)
Following are galleries with page-by-page views of this report.
1. Introduction
2. Industry 1-Week Strengthening
3. Industry 10-Week Strengthening
4. Sub-Industry 10-Week Strengthening
5. Stocks Outliers: Strongest/Weakest Rated
6. Stocks Outliers: 1-Week % Change
7. Stocks Outliers: 5-Year Highs/Lows