SMO Exclusive: Strength Report Technology Sector 2024-02-29

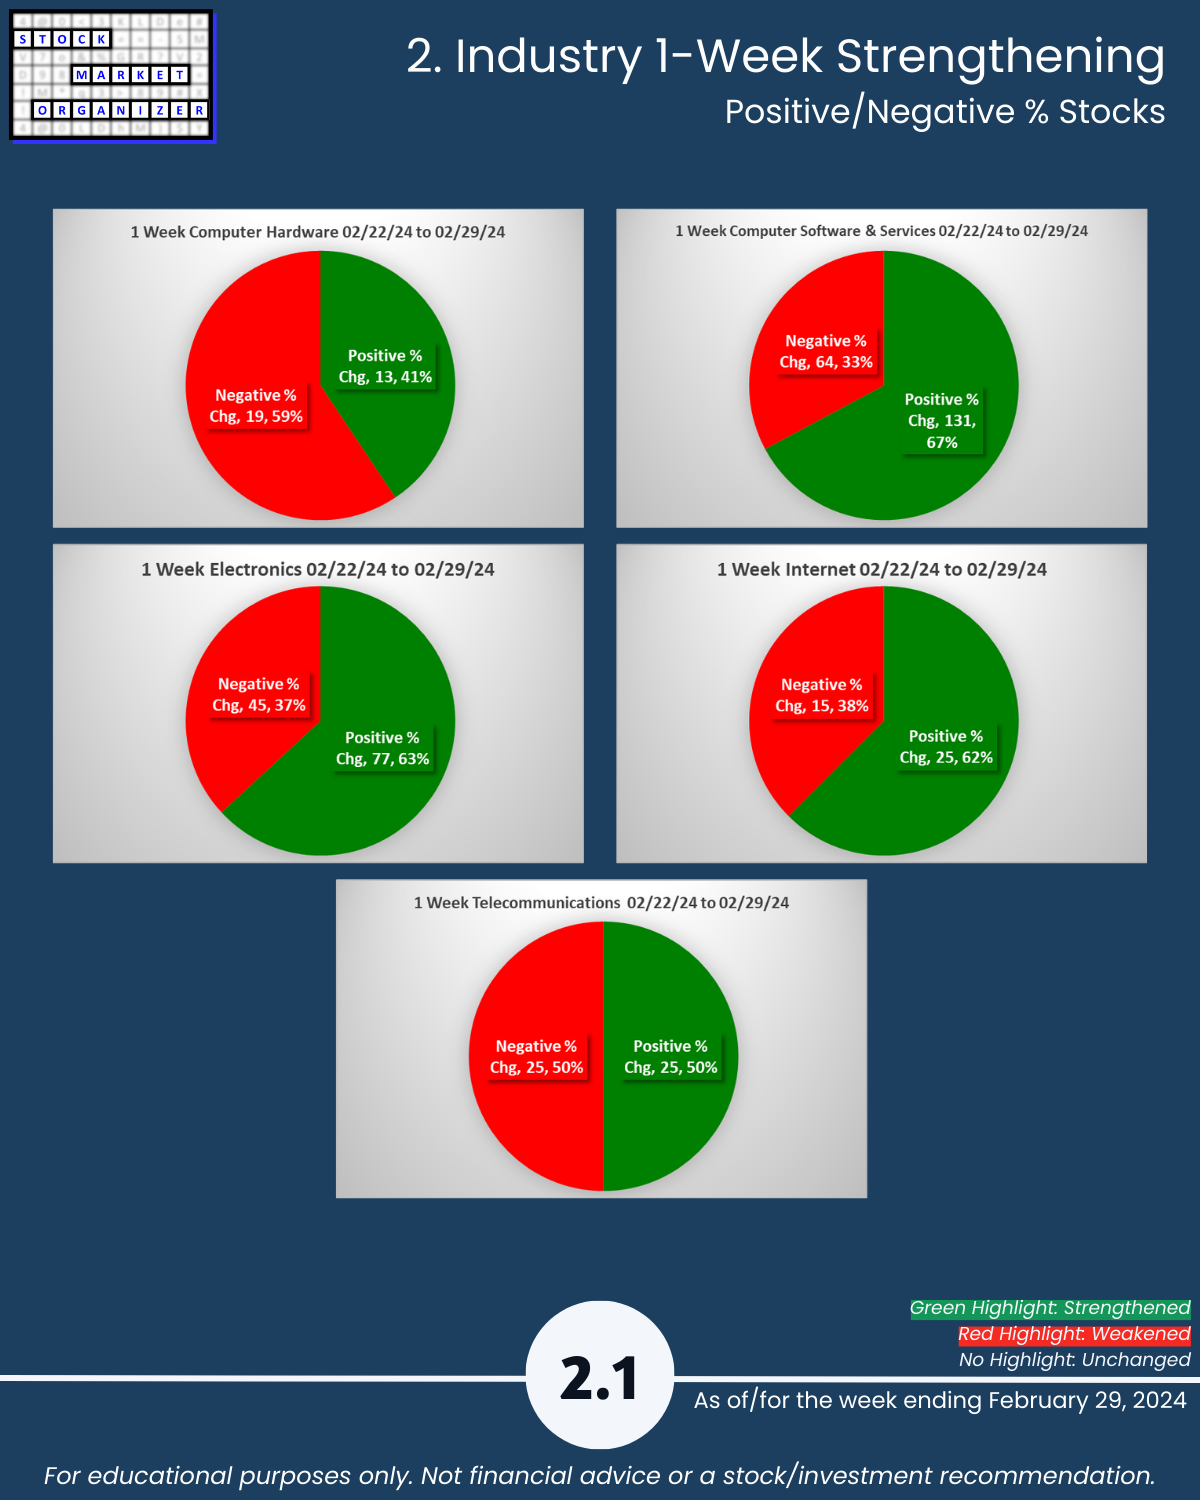
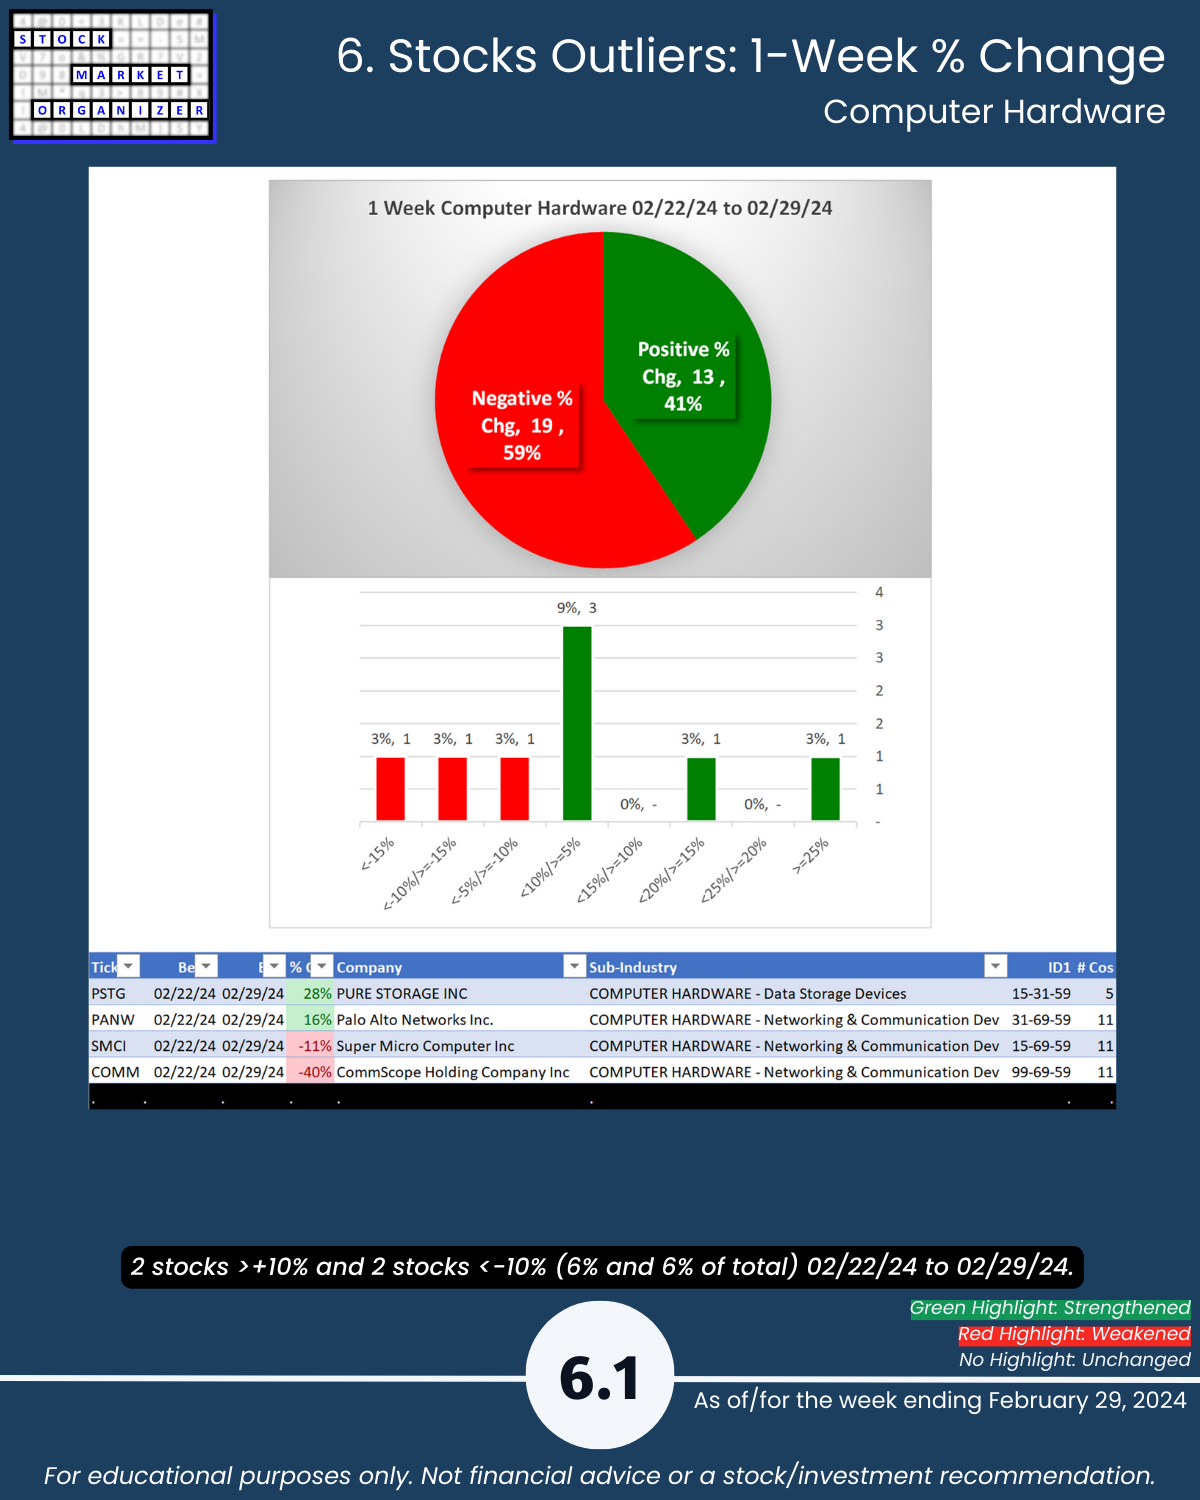
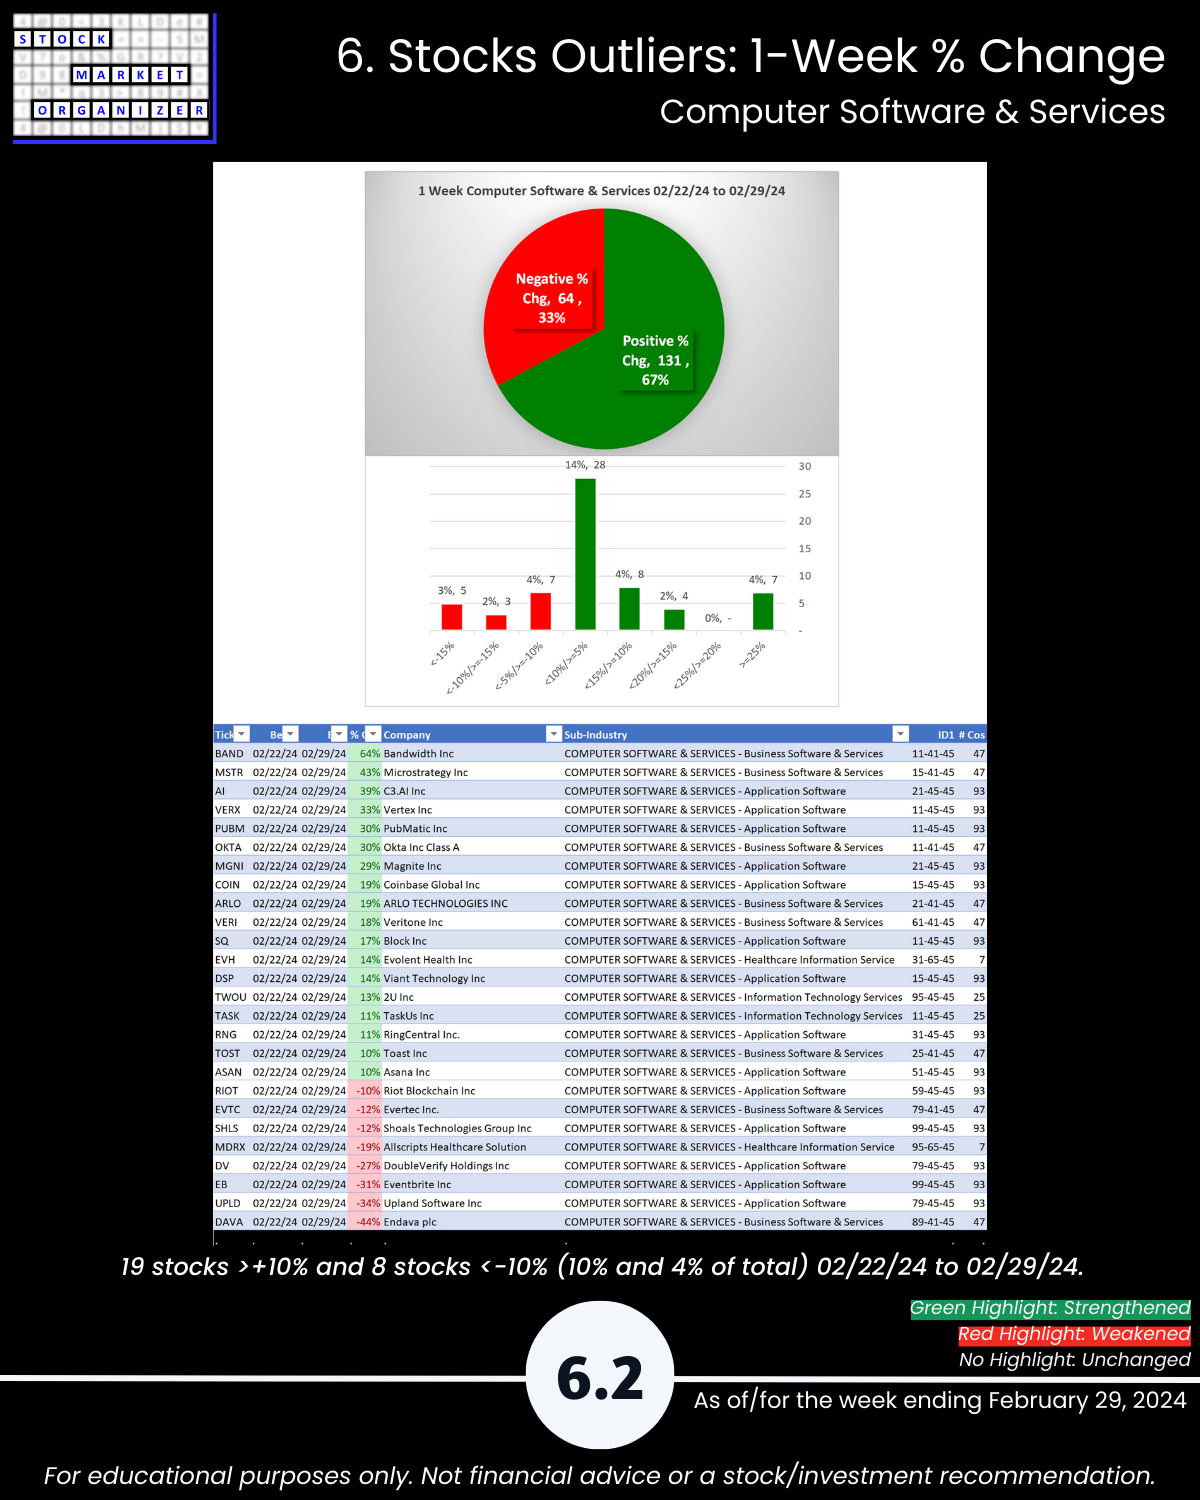
2/29/24 Tech Thursday – a Computer Software/Services bounceback this week (67% positive stocks, 10% of 195 stocks rising >10%). ACMR +50%, ATUS +59%, NVDA and SMCI who? 12% of Electronics stocks are at 5+ year highs (including NVDA). The industries: Computer Hardware, Software/Services, Electronics, Internet, Telecommunications. The focus: track strengthening at the individual stock level, because the stronger your stocks the greener your P&L. It really doesn’t have to be so complicated.
Takeaways:
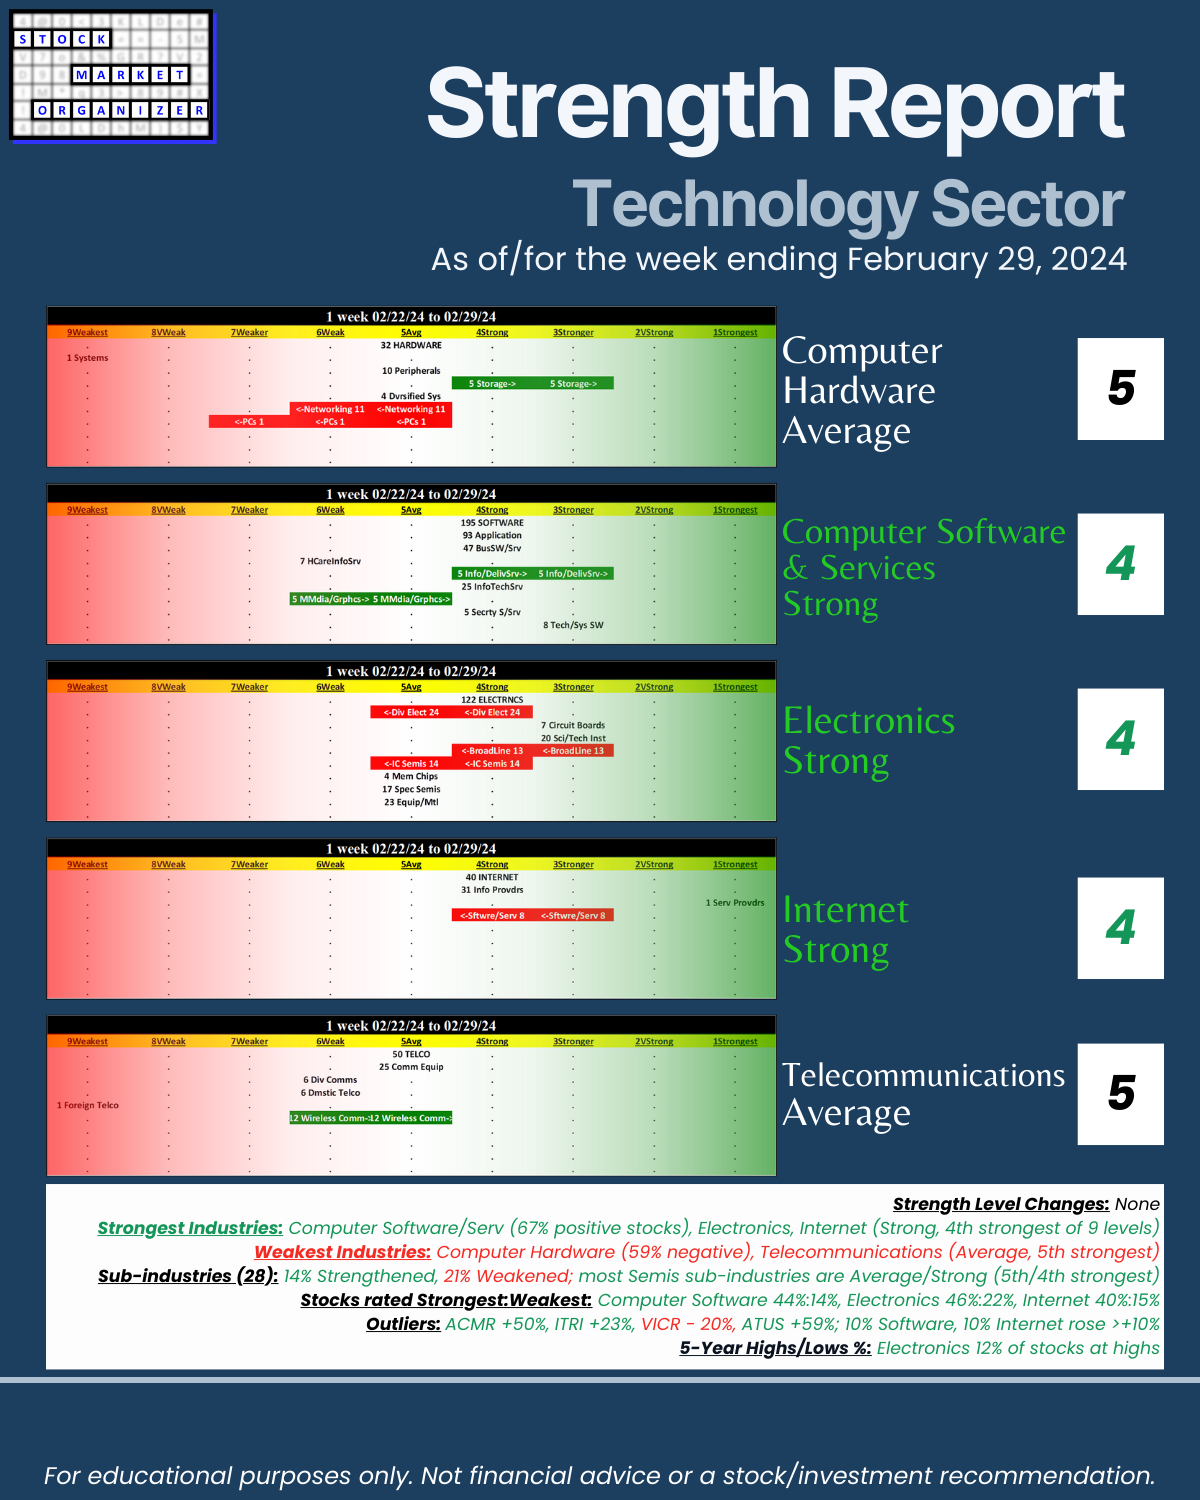
🔹 Strength Level Changes: None
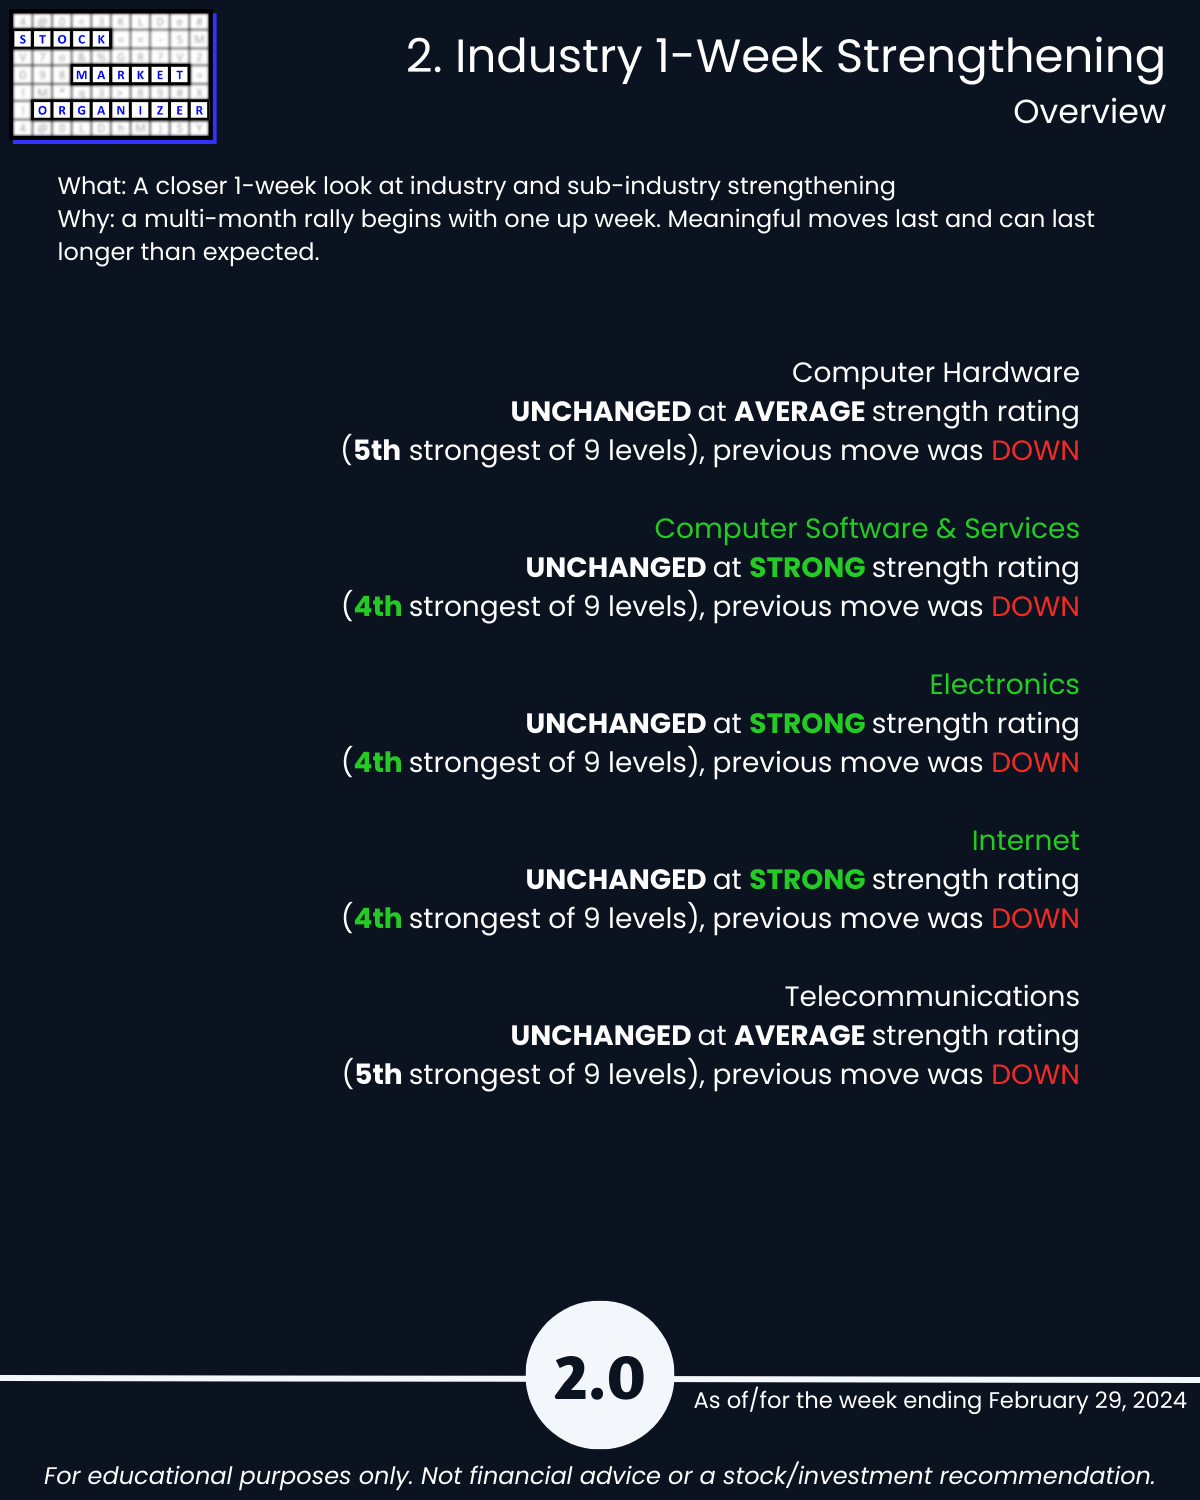
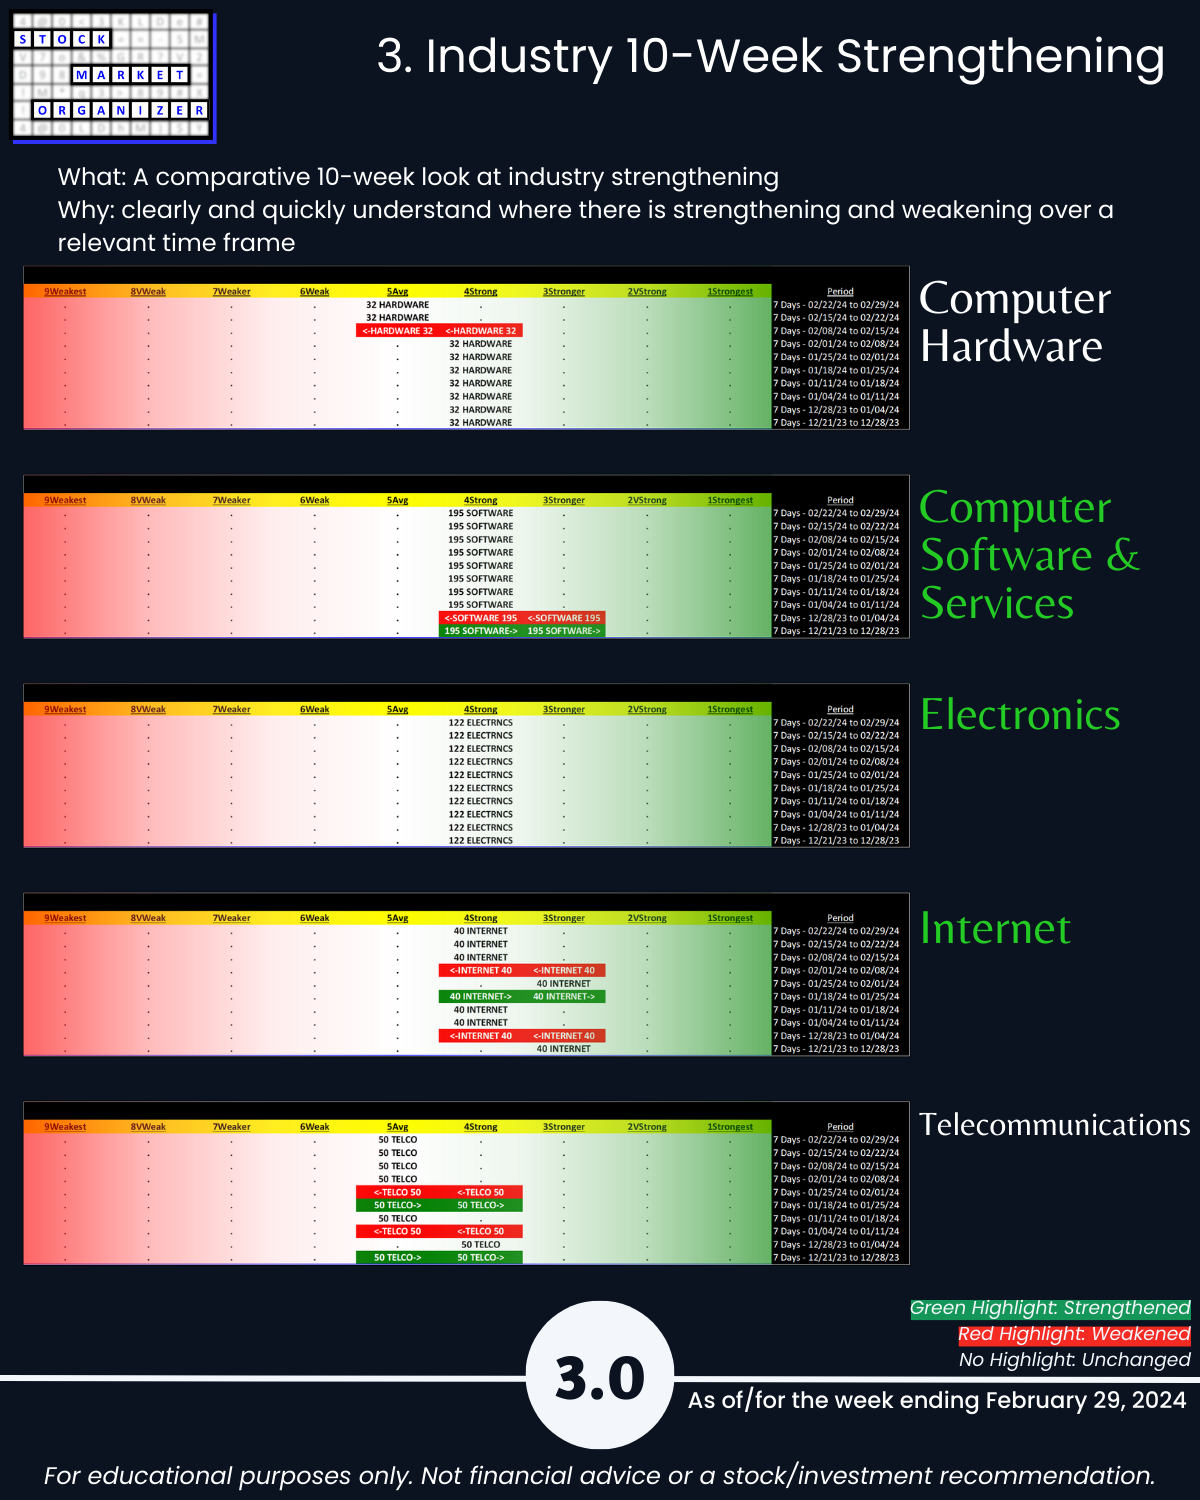
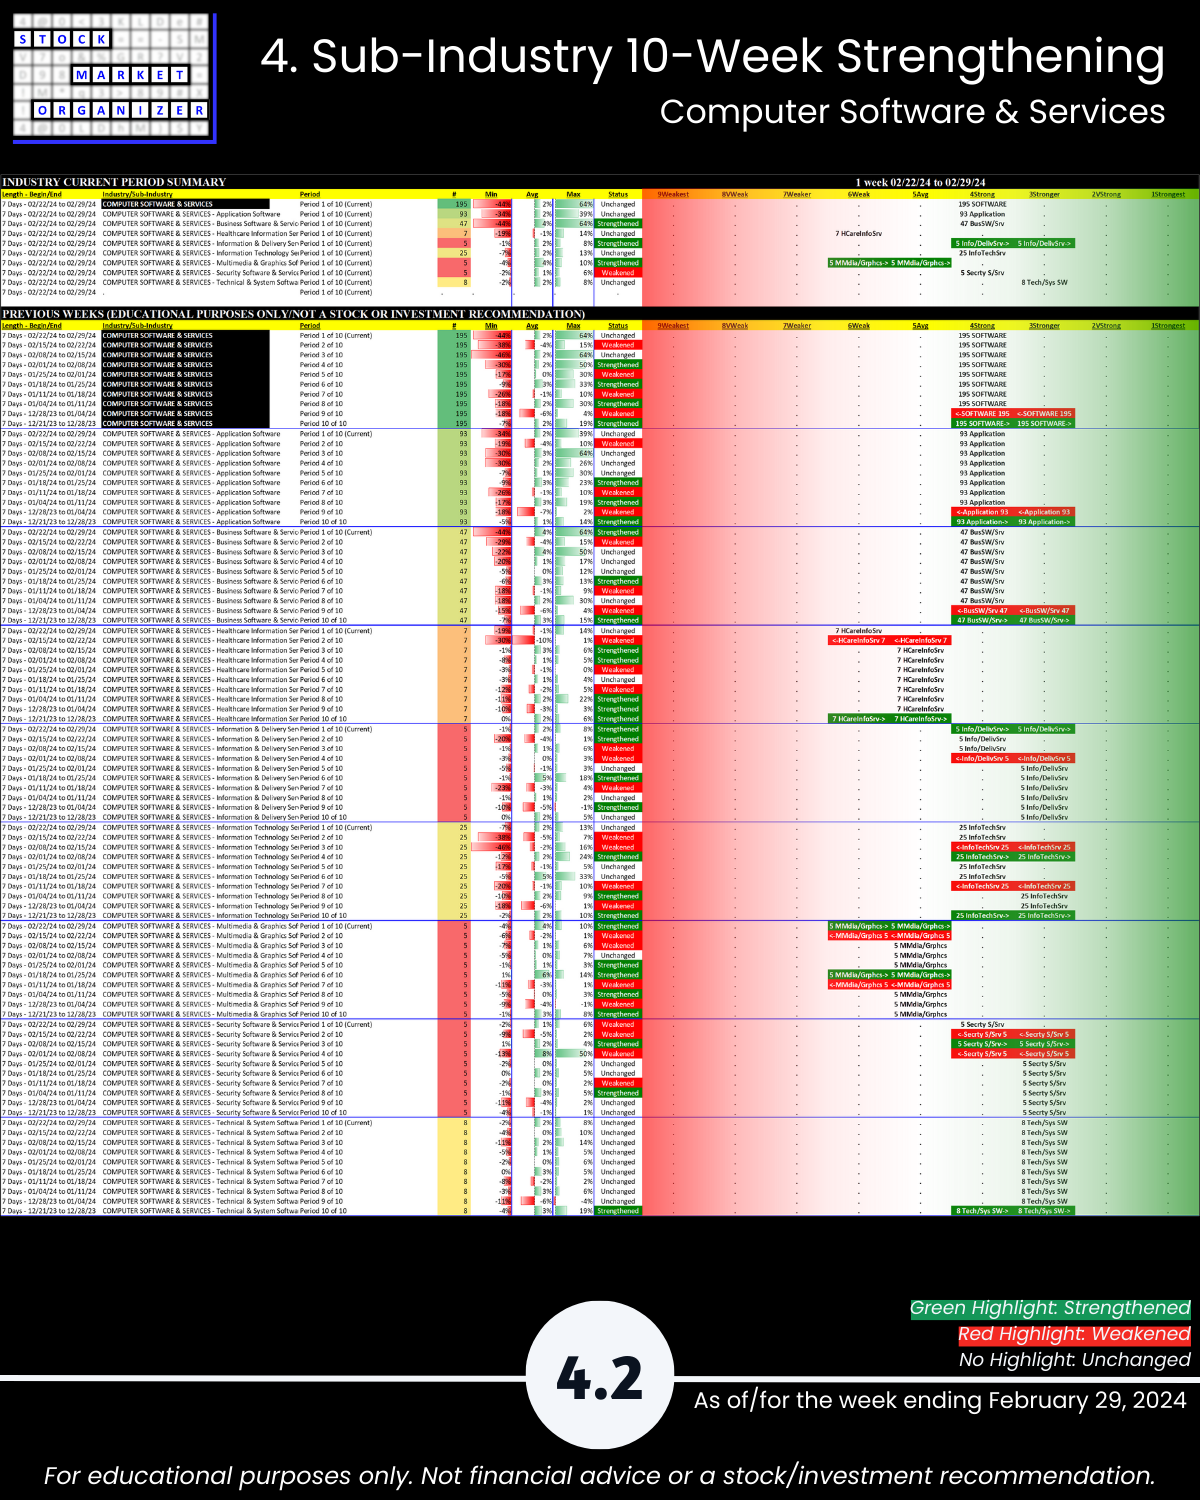
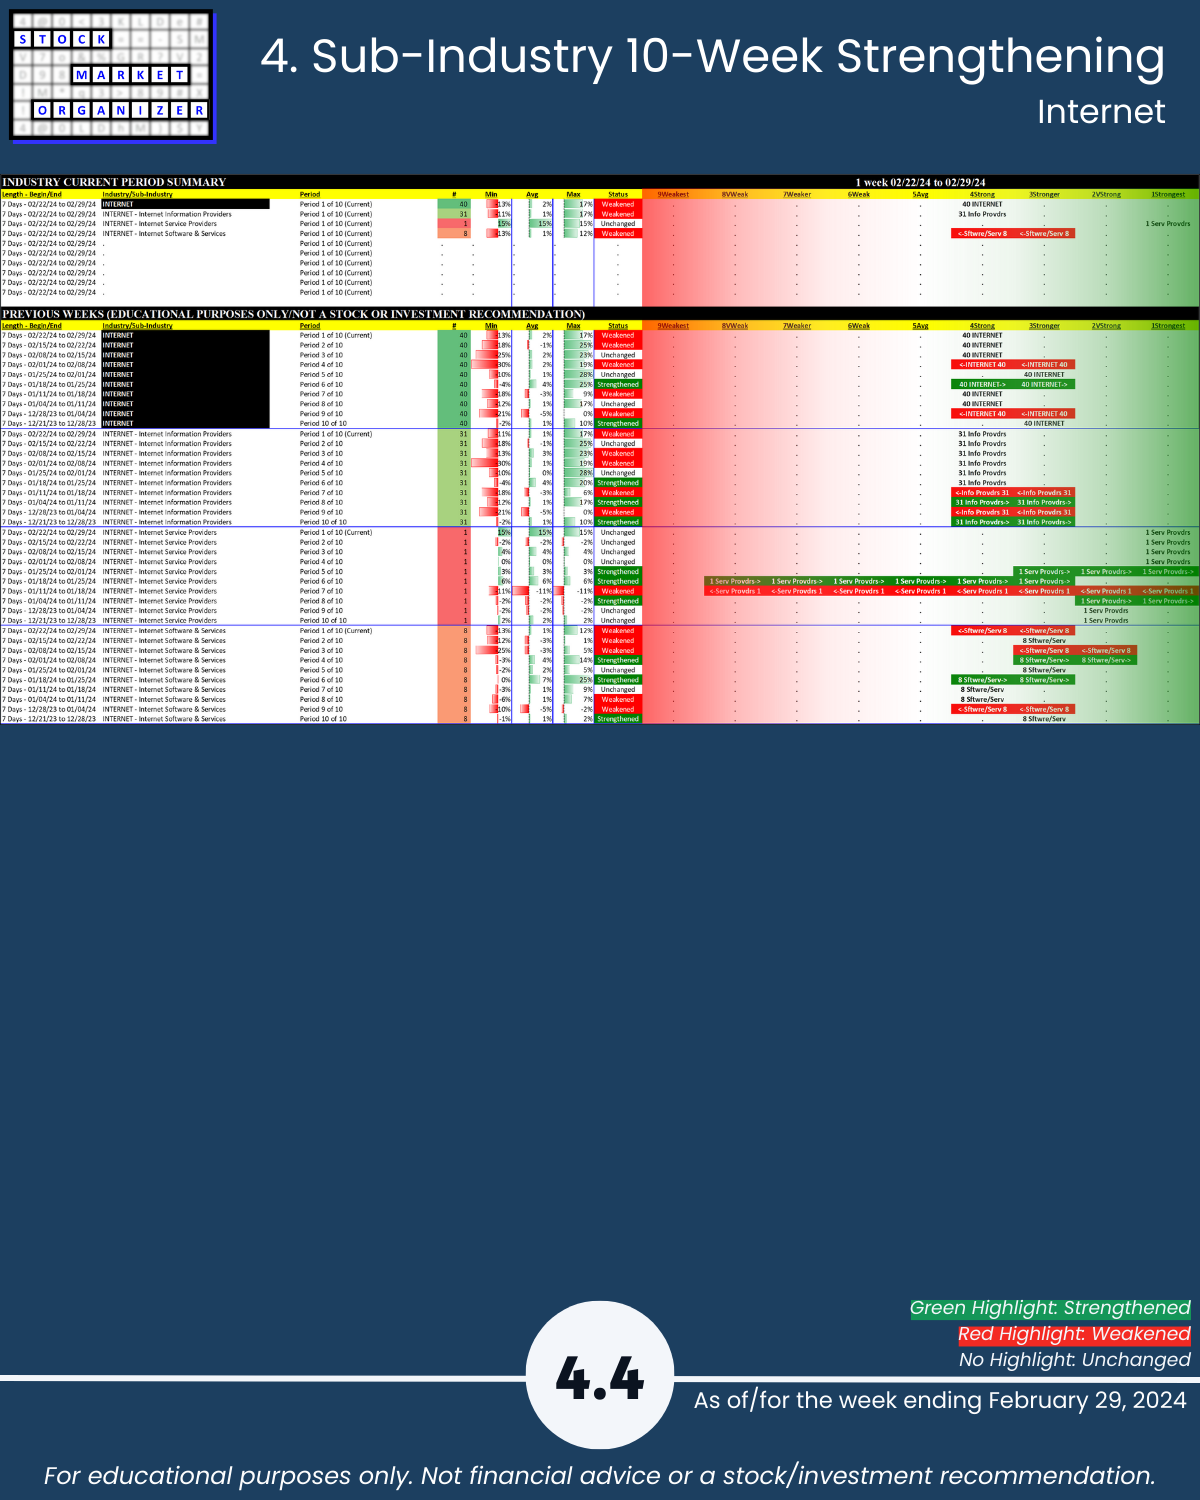
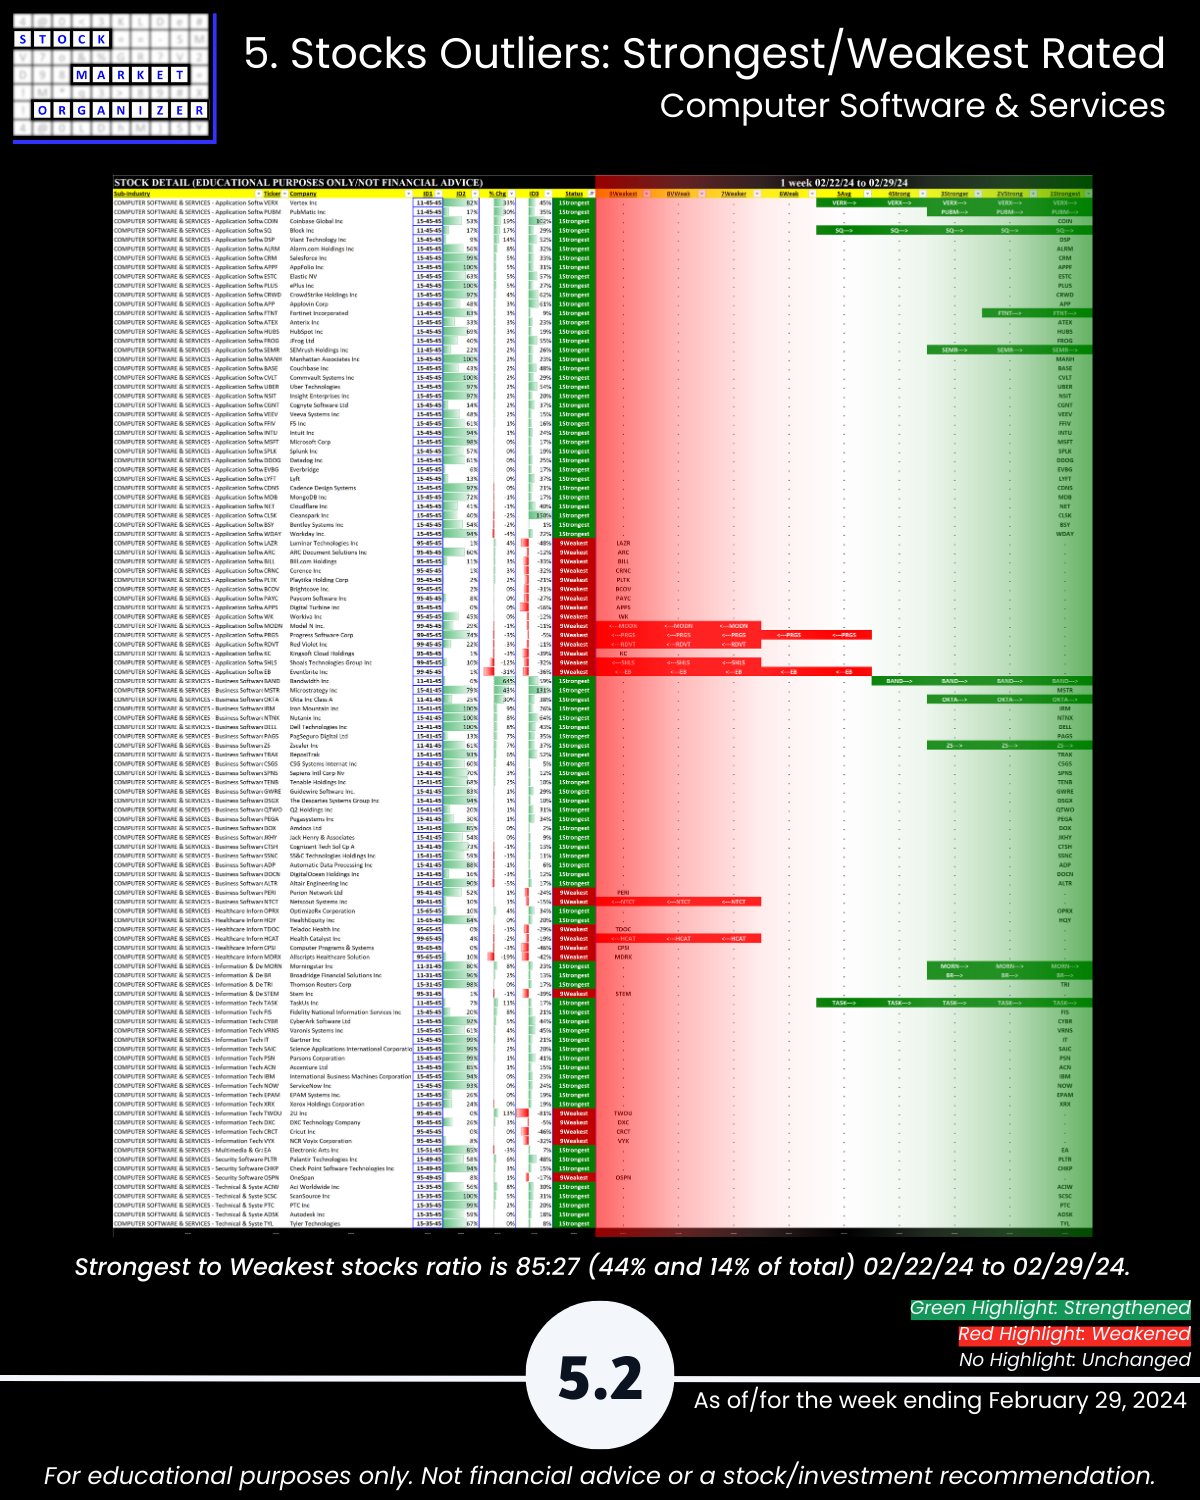
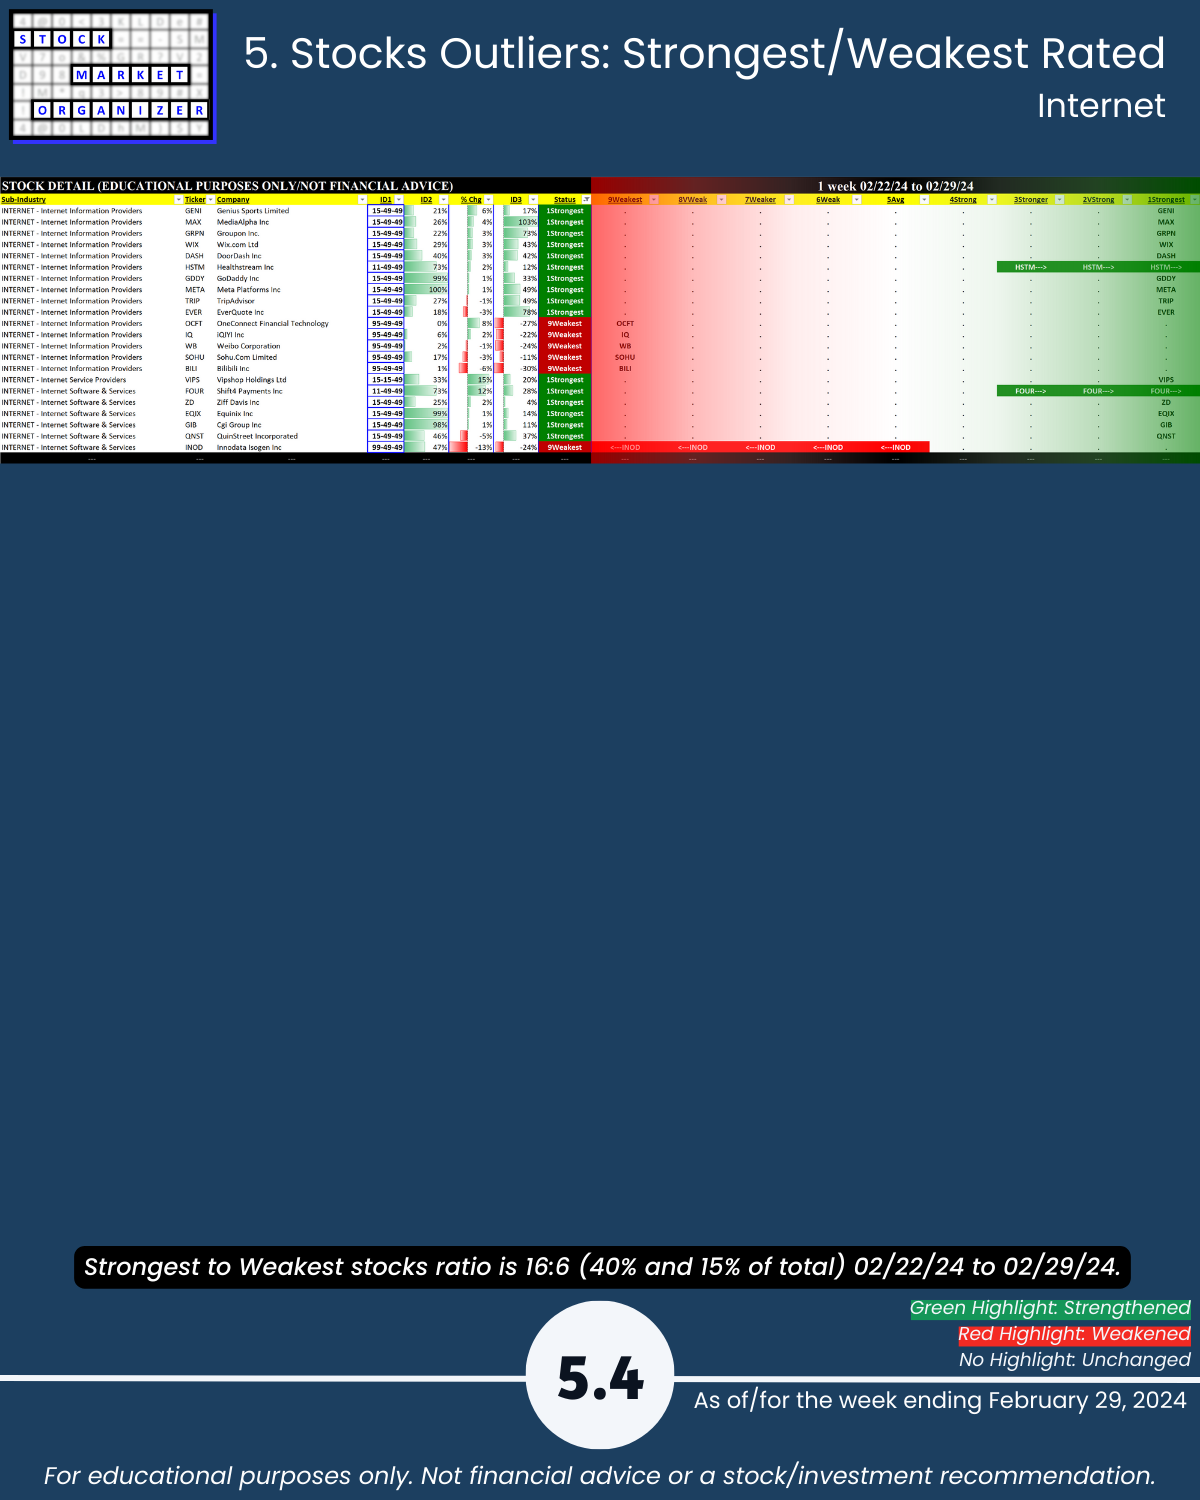
🔹 Strongest Industries: Computer Software/Serv (67% positive stocks), Electronics, Internet (Strong, 4th strongest of 9 levels)
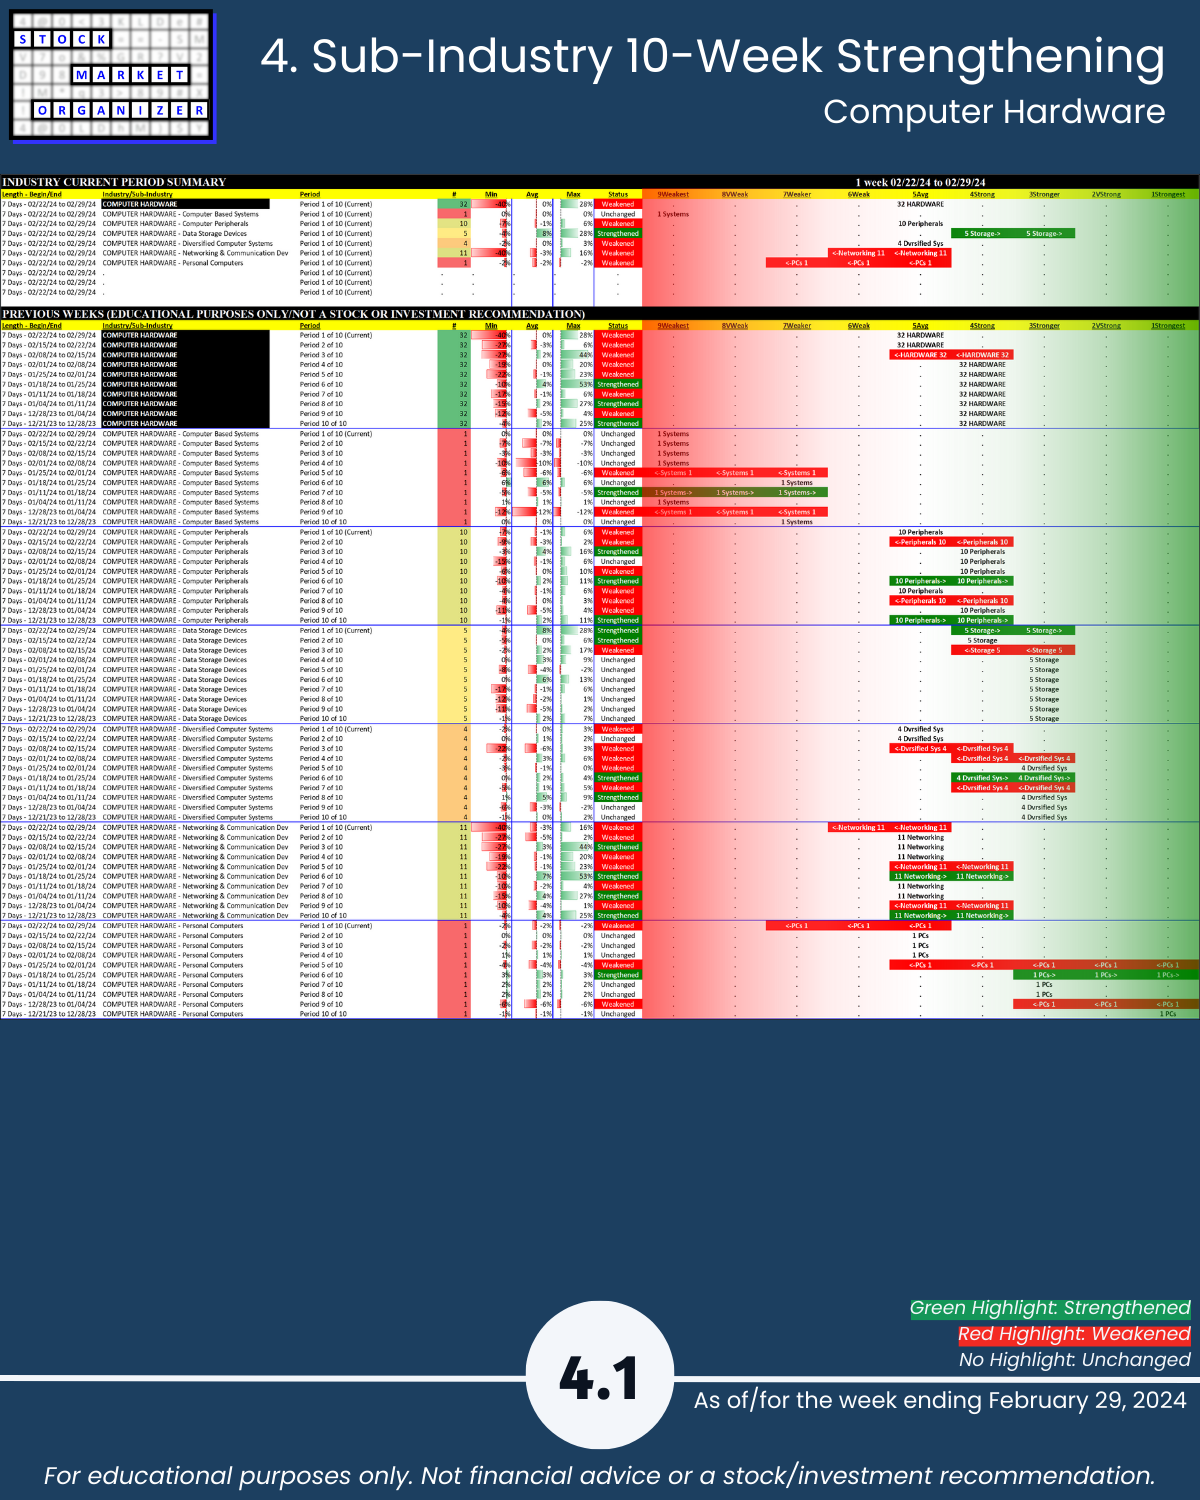
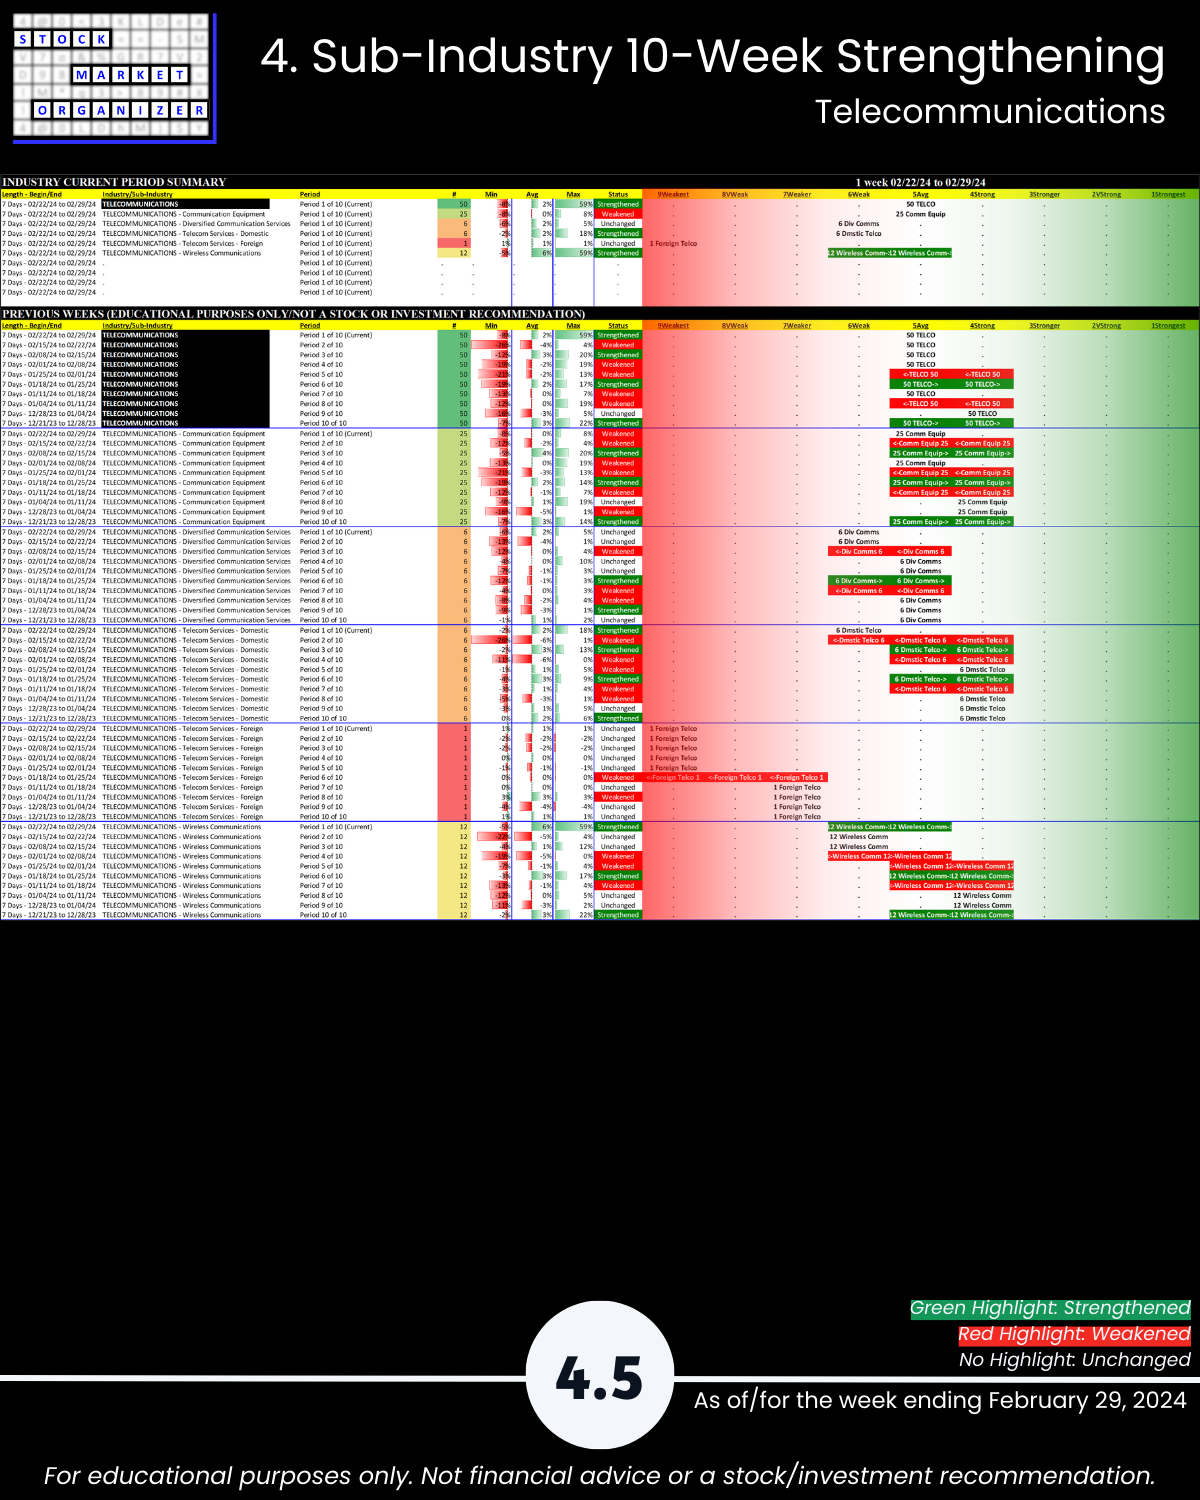
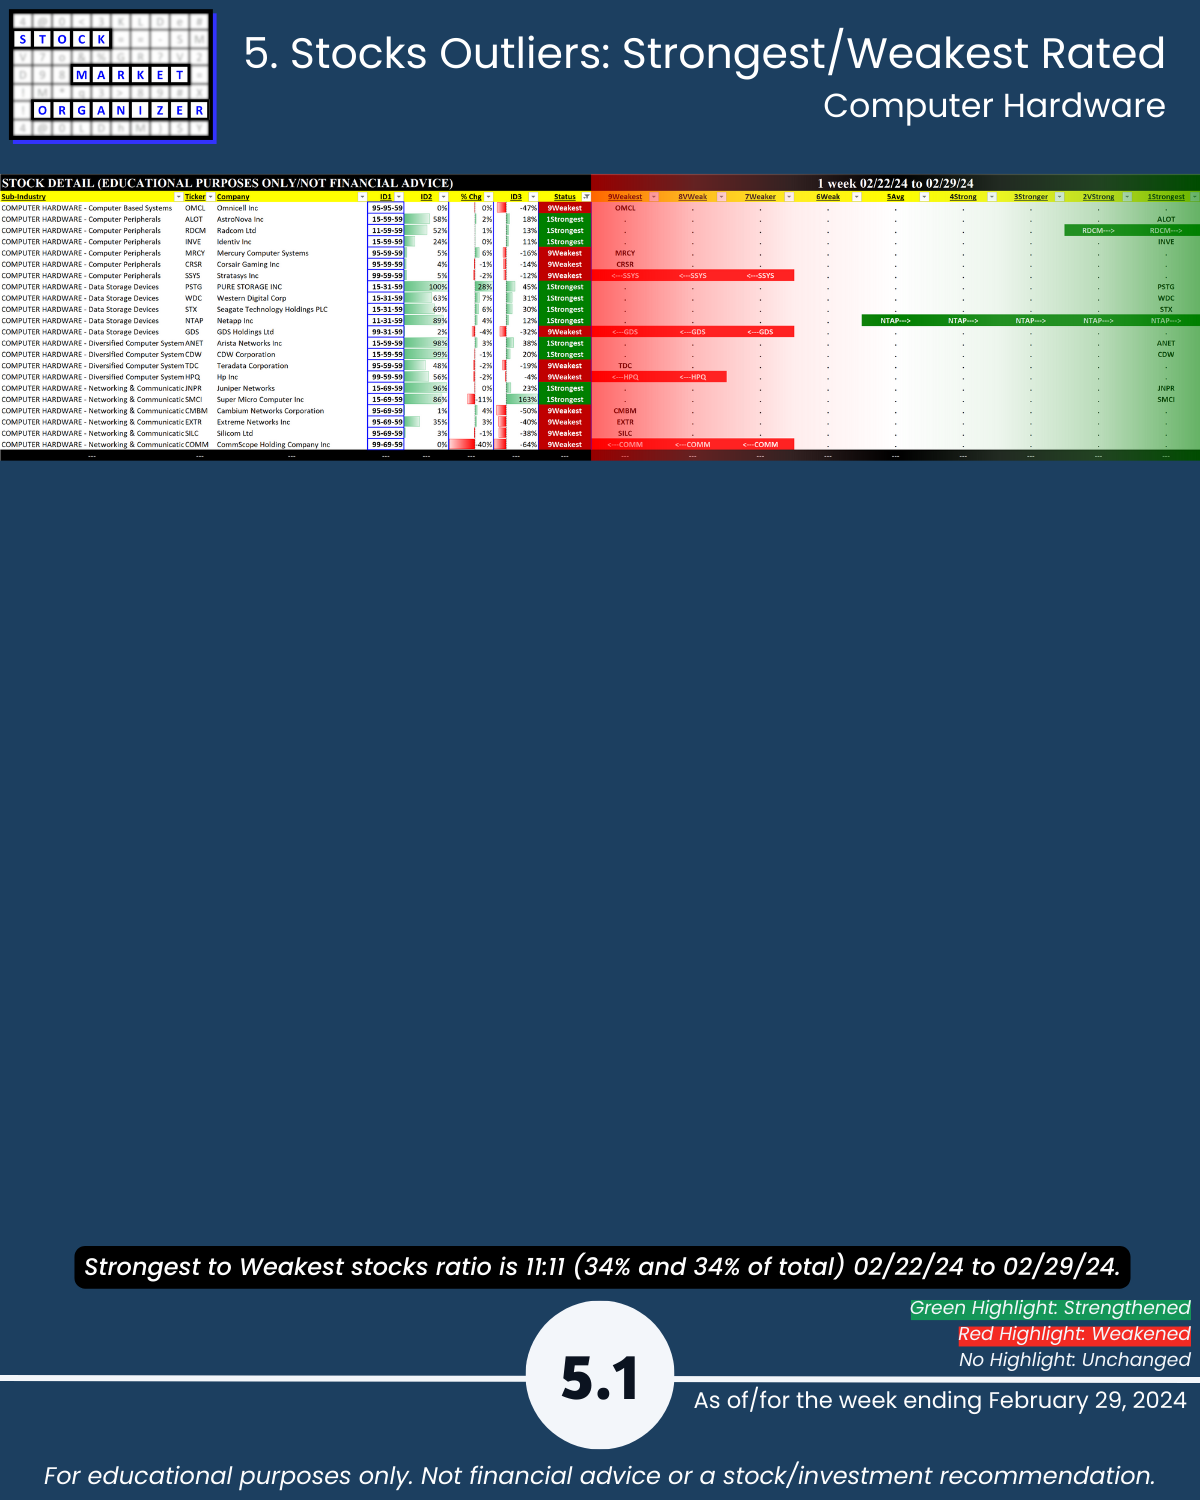
🔹 Weakest Industries: Computer Hardware (59% negative), Telecommunications (Average, 5th strongest)
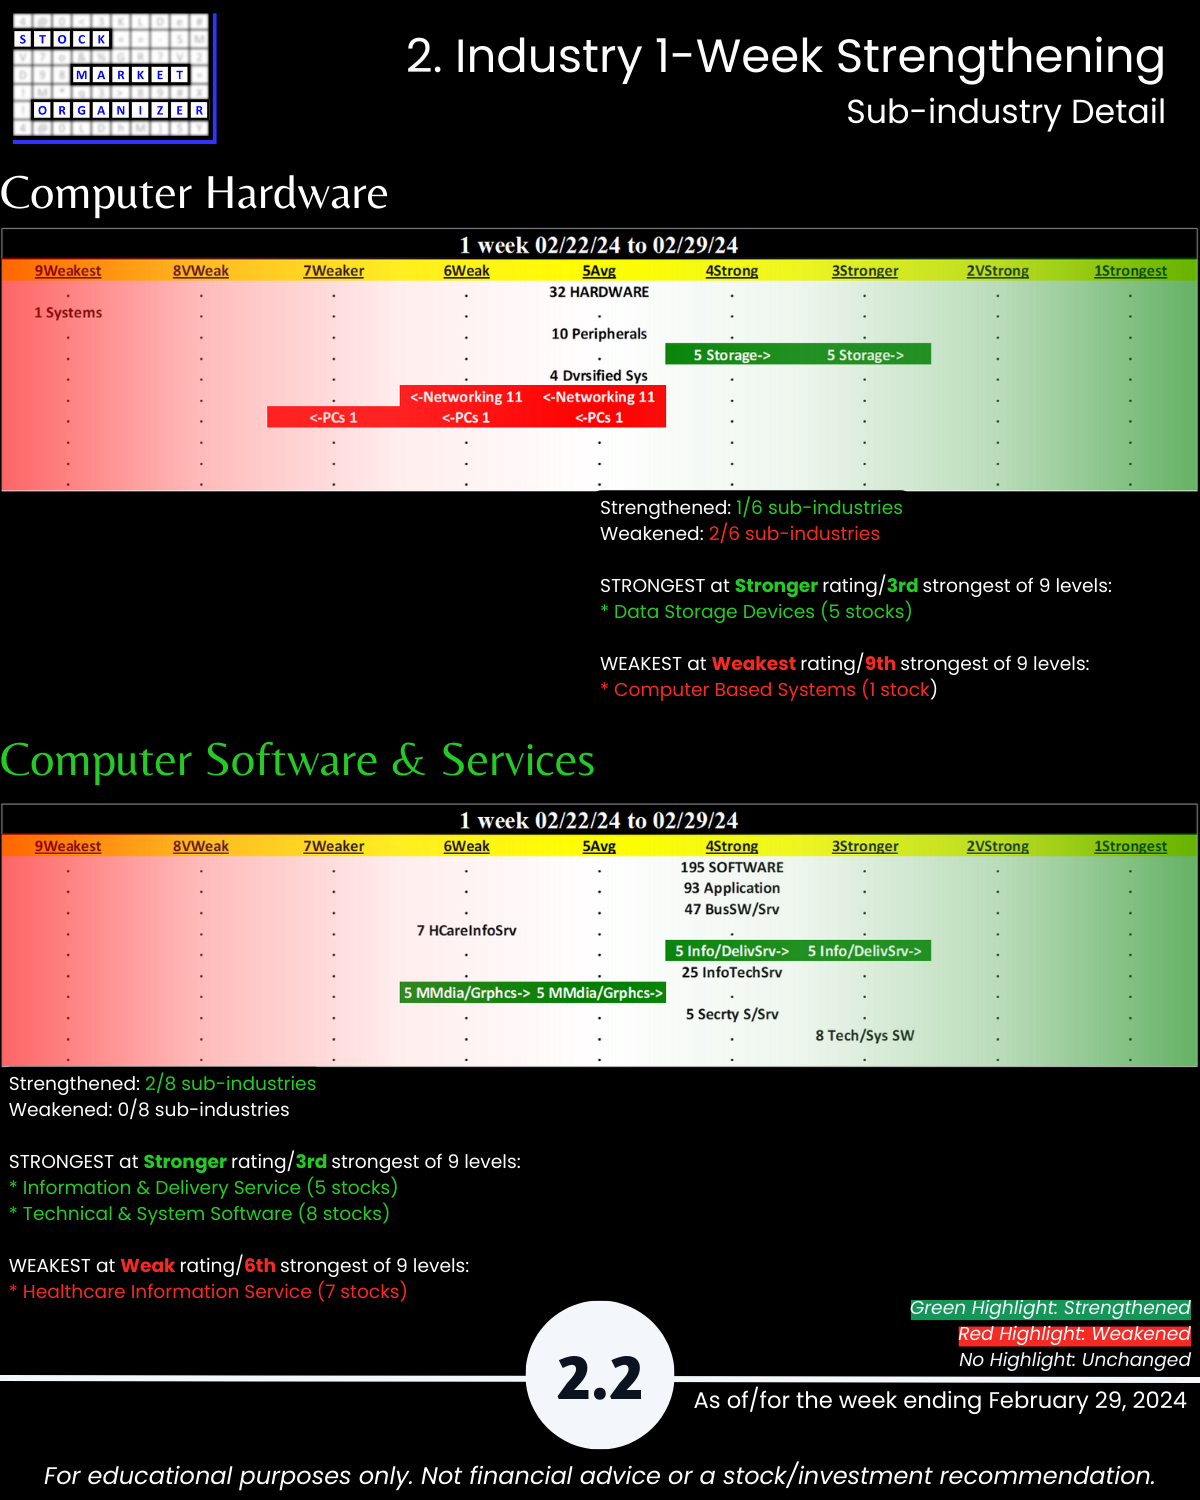
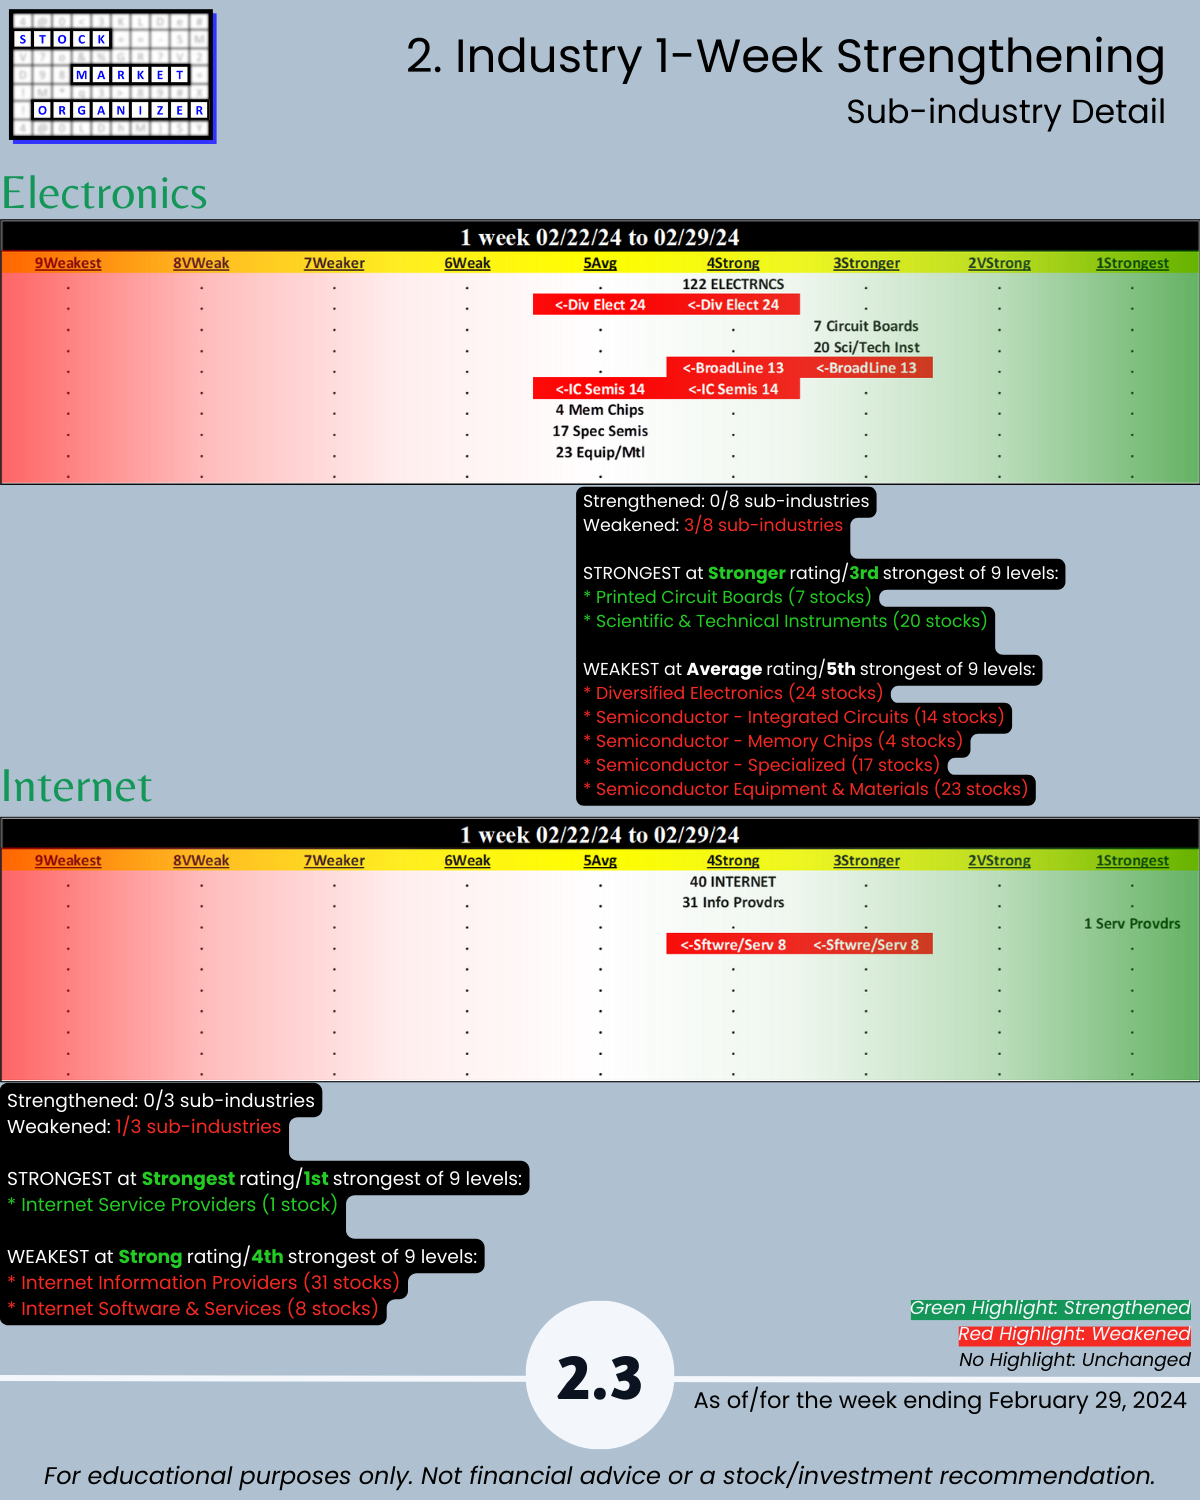
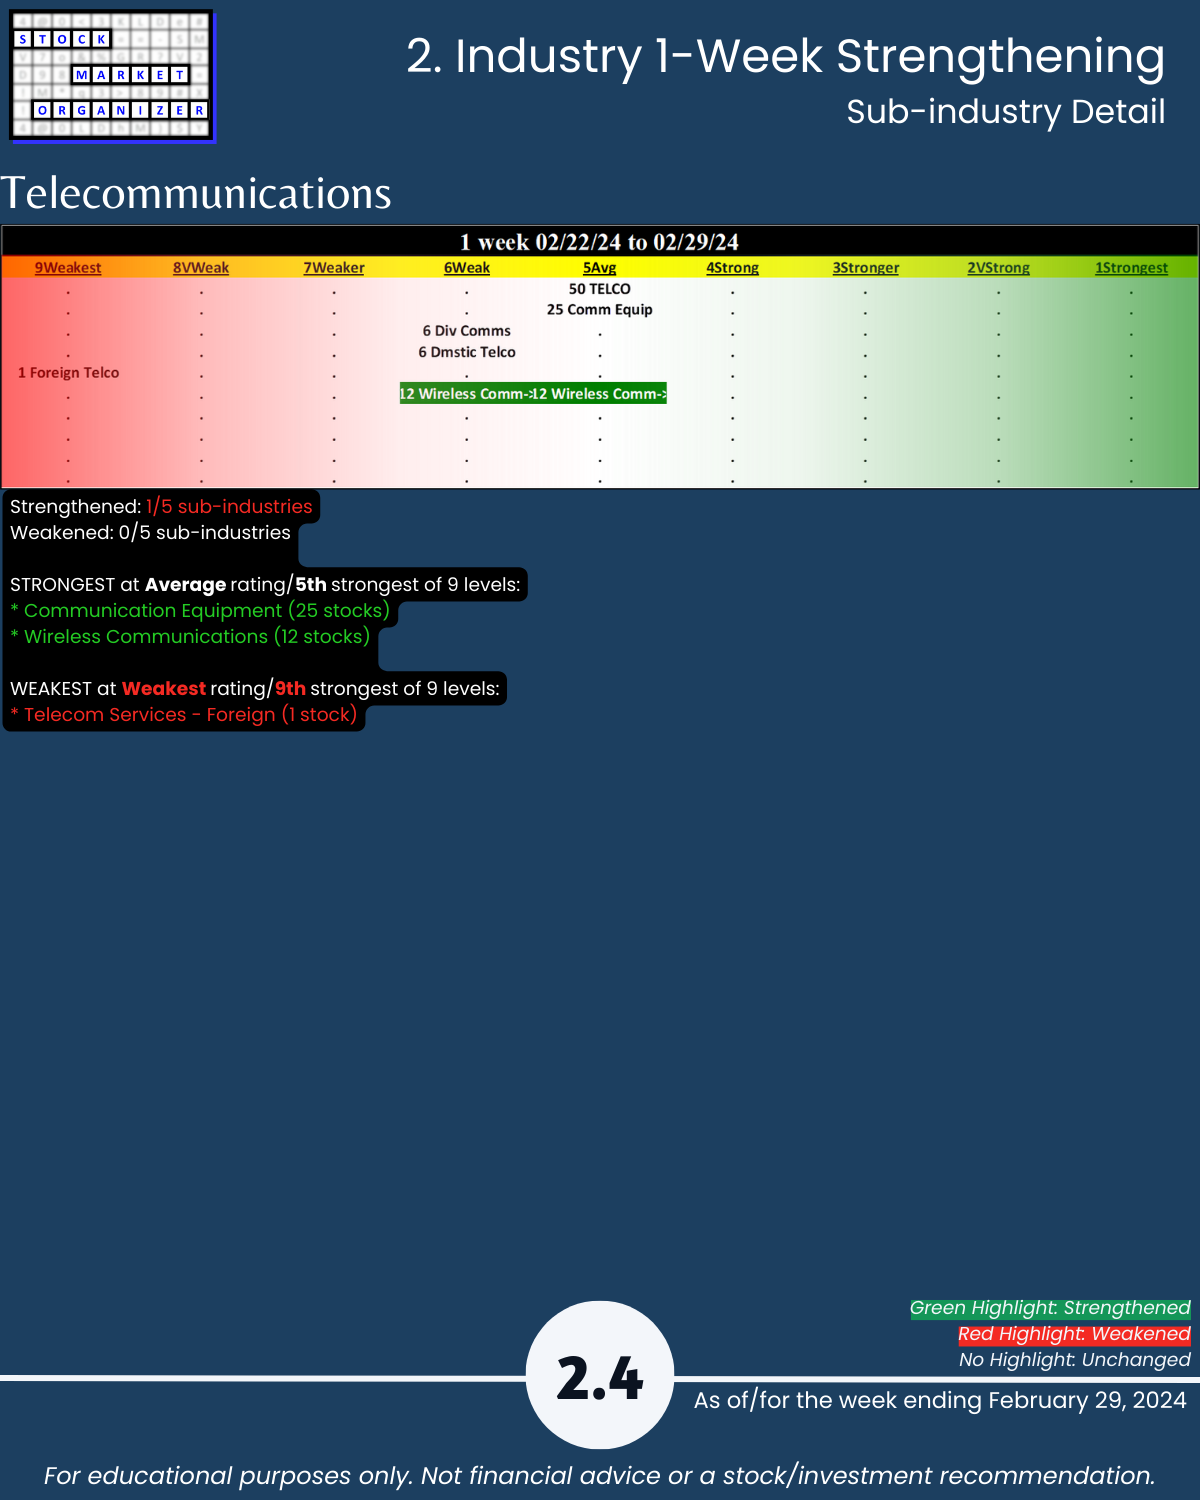
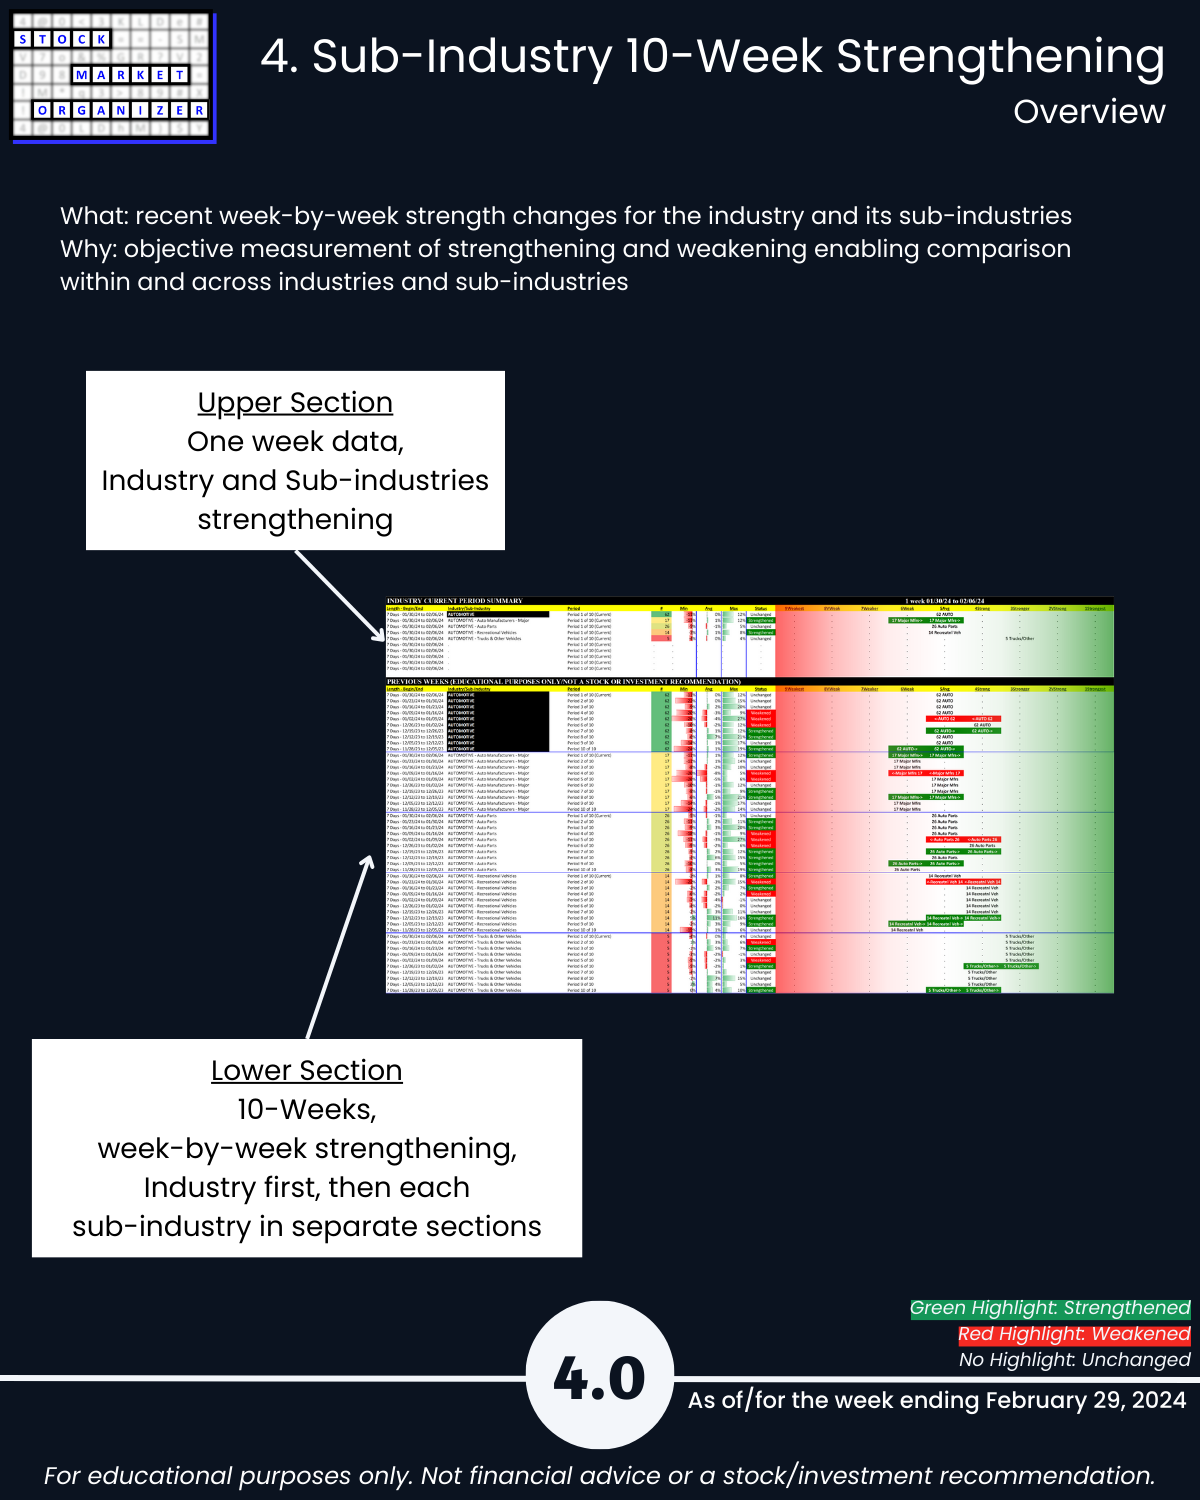
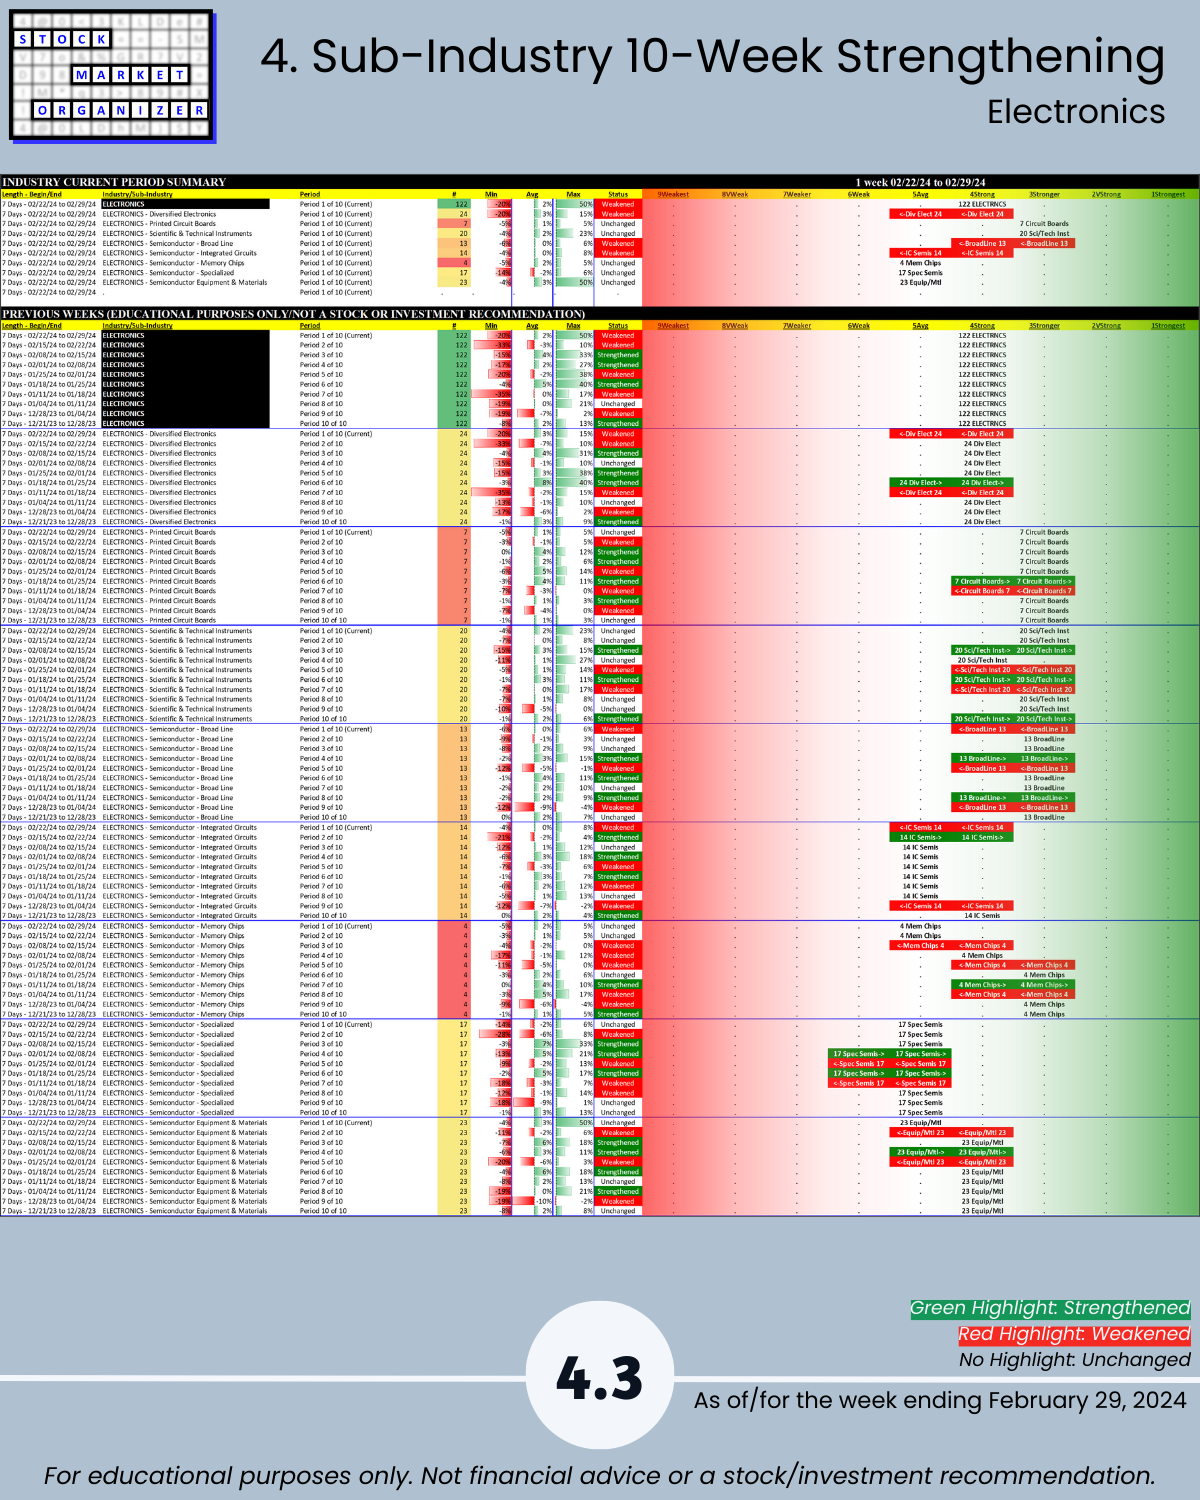
🔹 Sub-industries (28): 14% Strengthened, 21% Weakened; most Semis sub-industries are Average/Strong (5th/4th strongest)
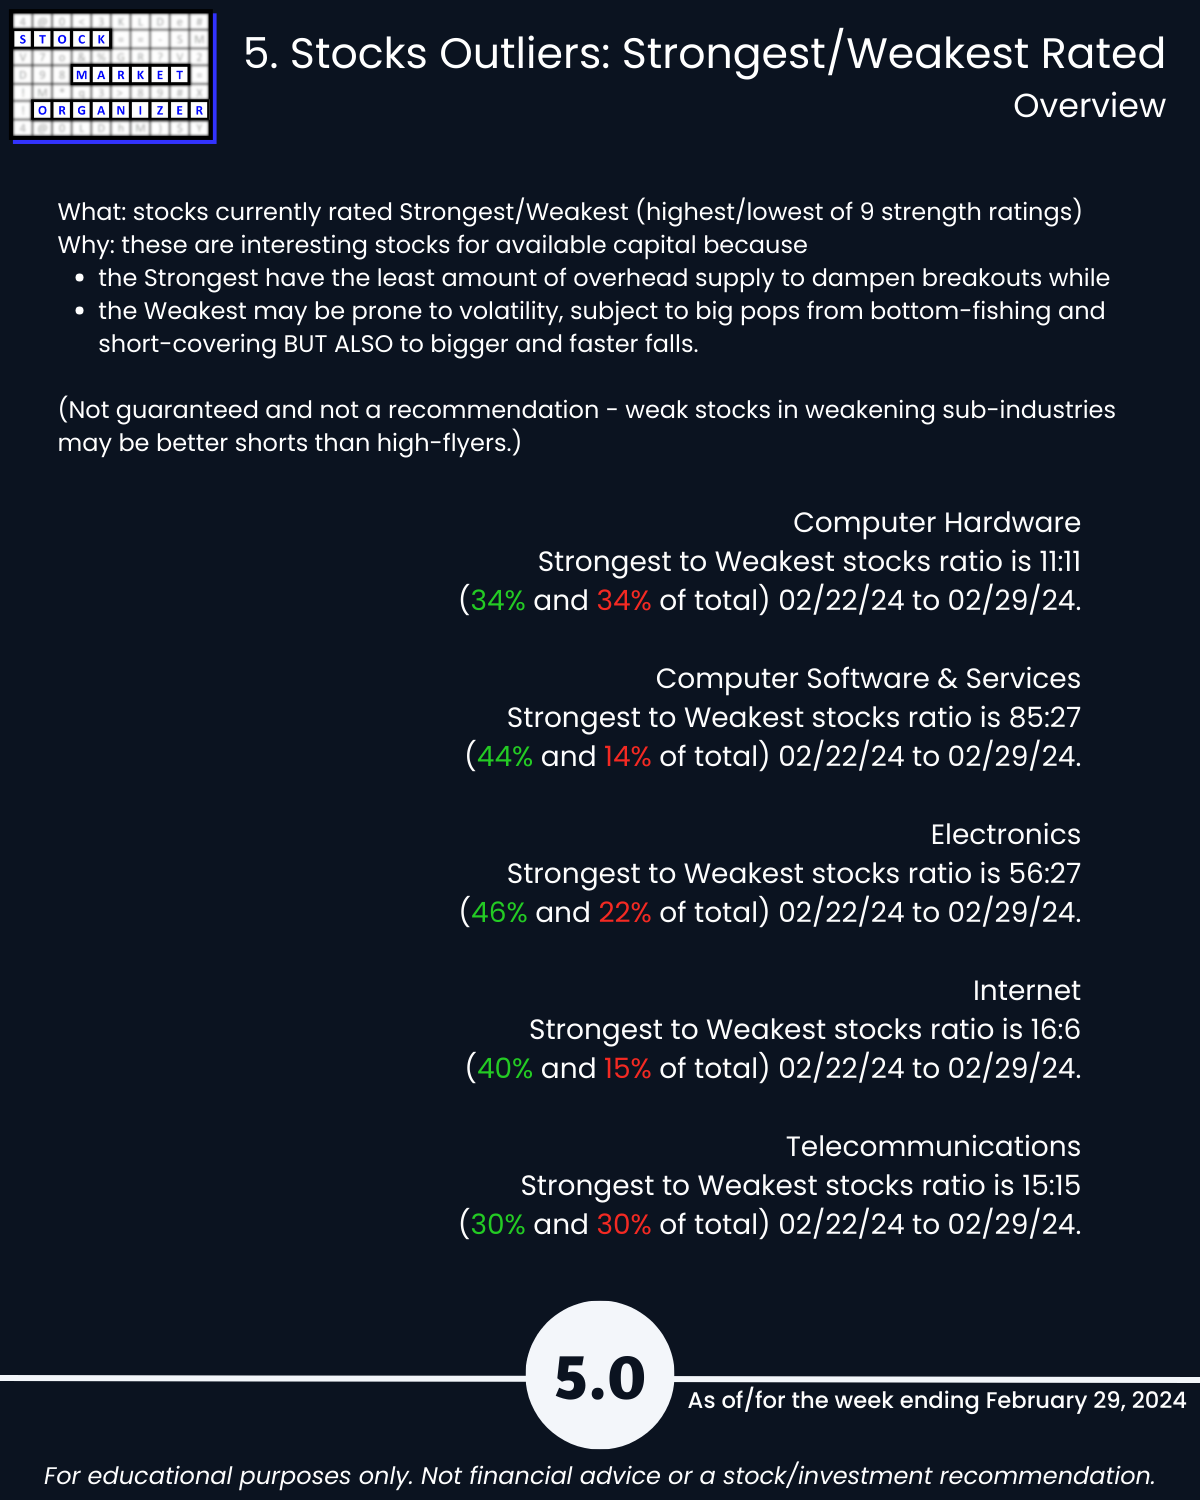
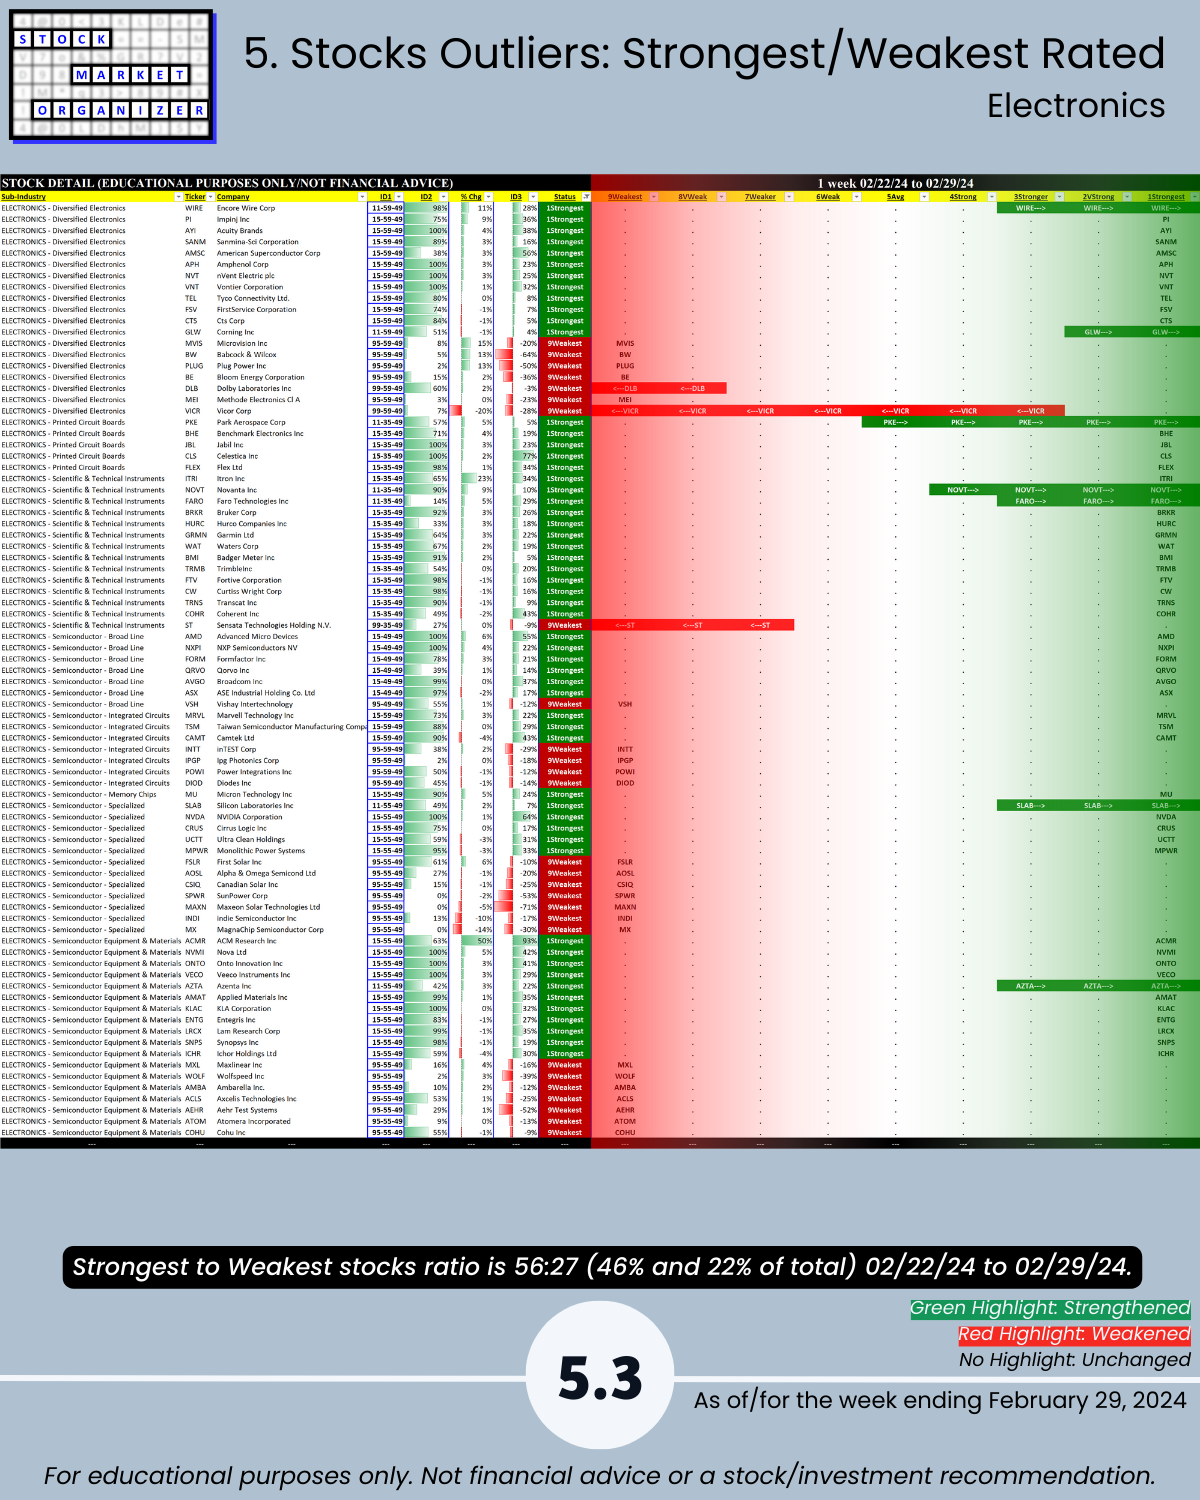
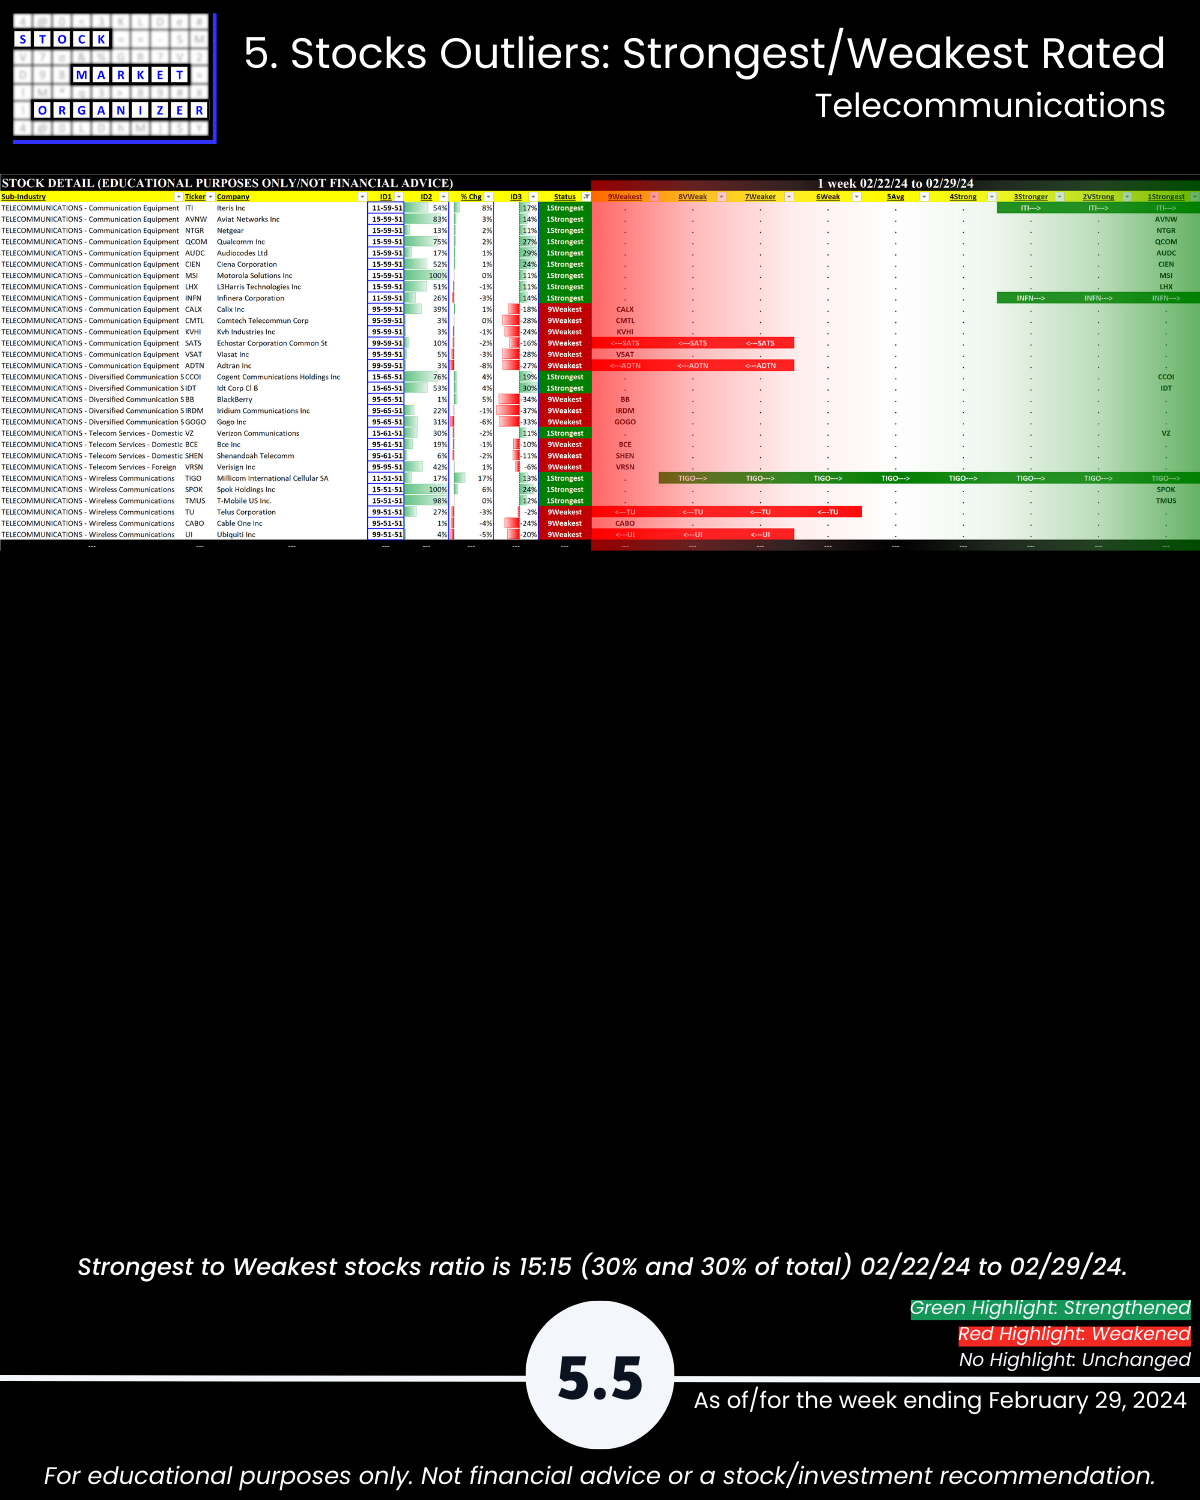
🔹 Stocks rated Strongest:Weakest: Computer Software 44%:14%, Electronics 46%:22%, Internet 40%:15%
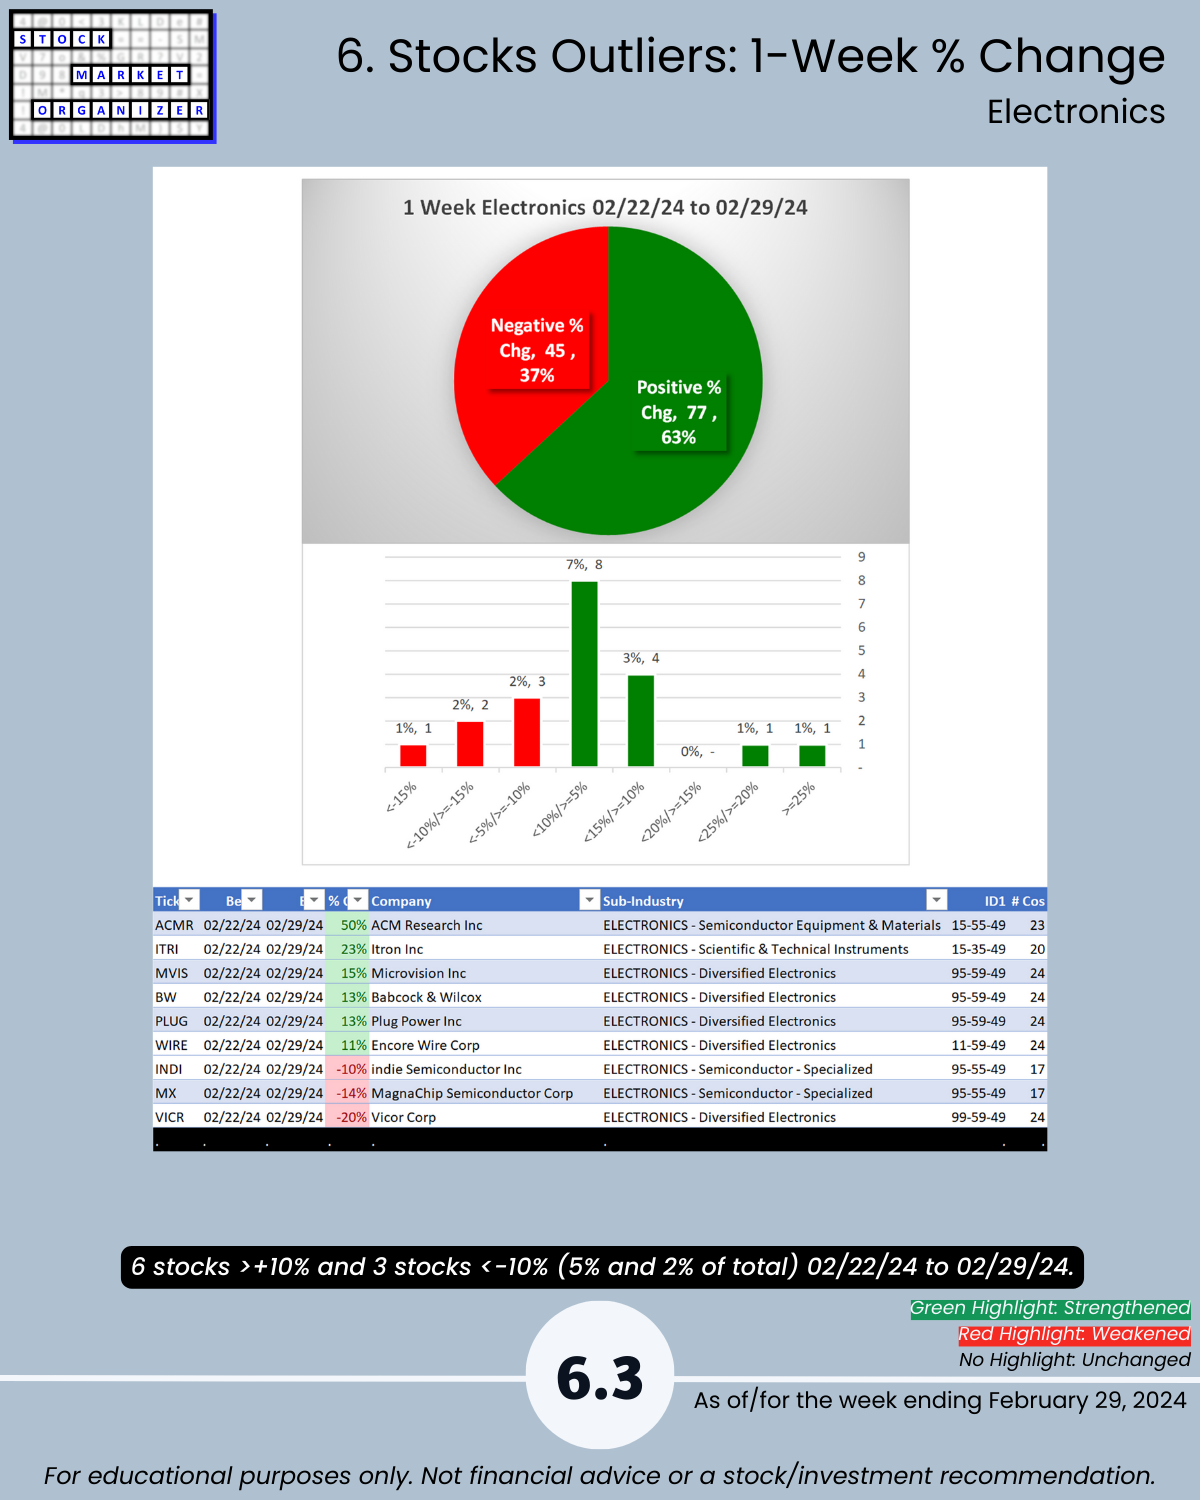
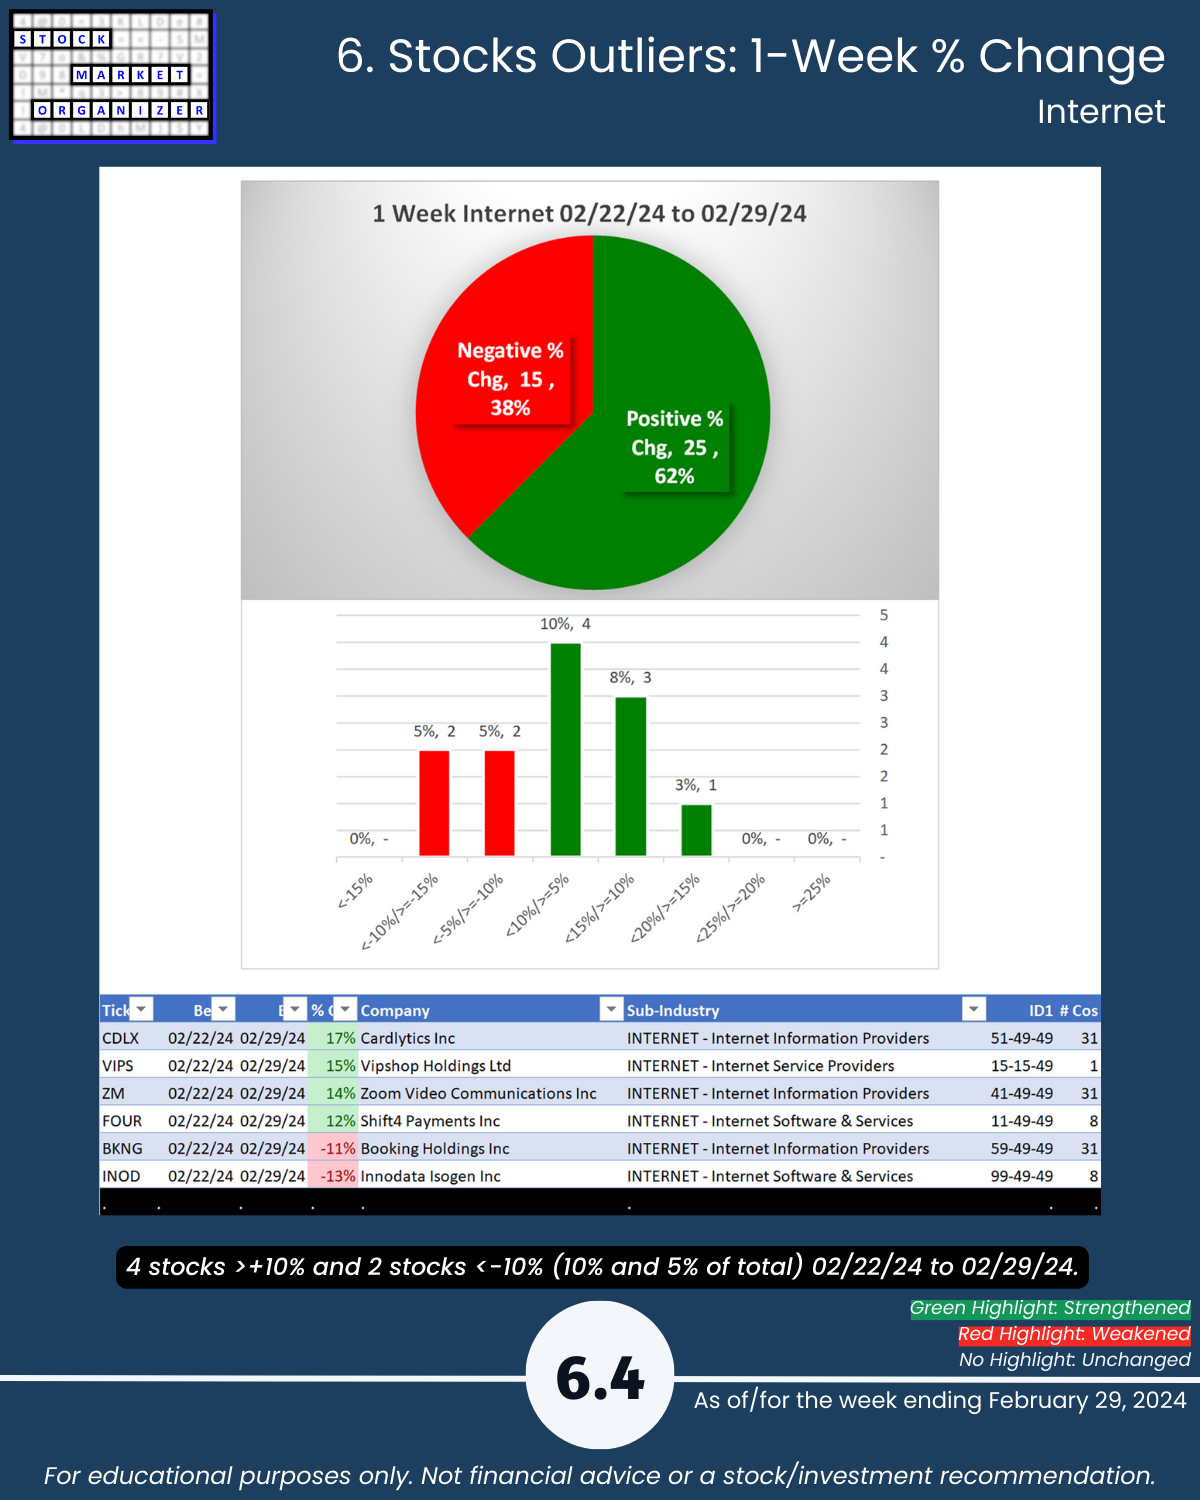
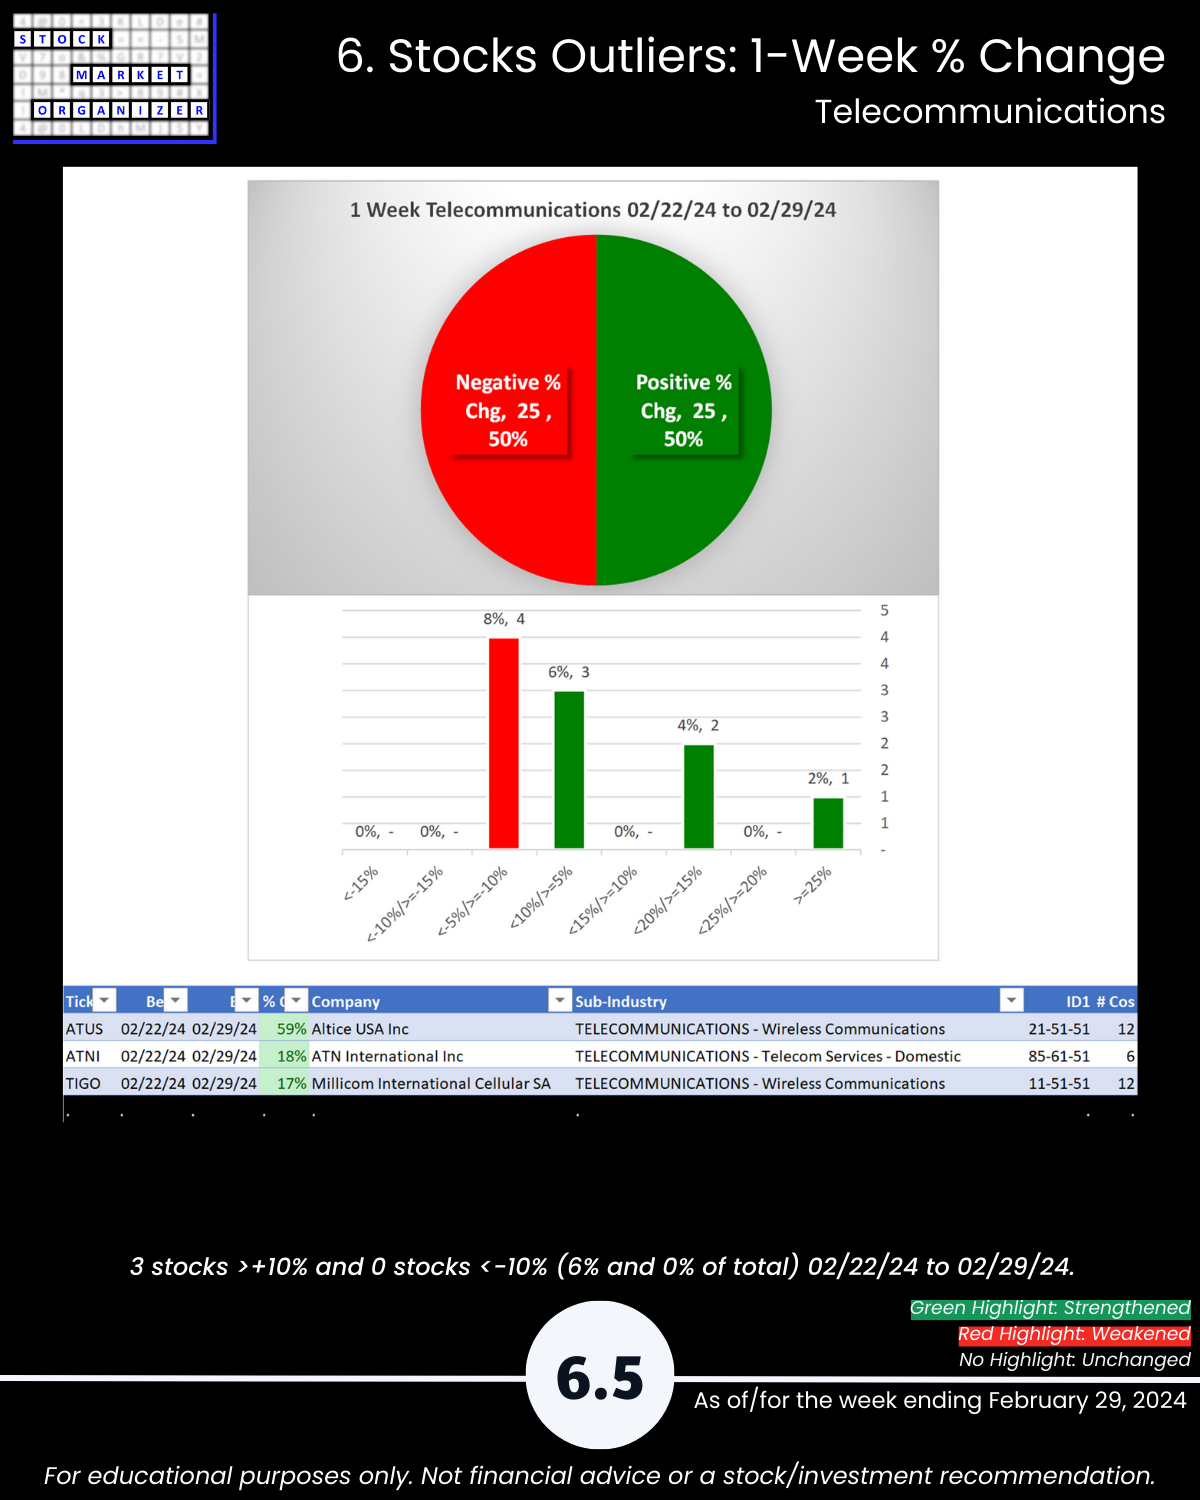
🔹 Outliers: ACMR +50%, ITRI +23%, VICR - 20%, ATUS +59%; 10% Software, 10% Internet rose >+10%
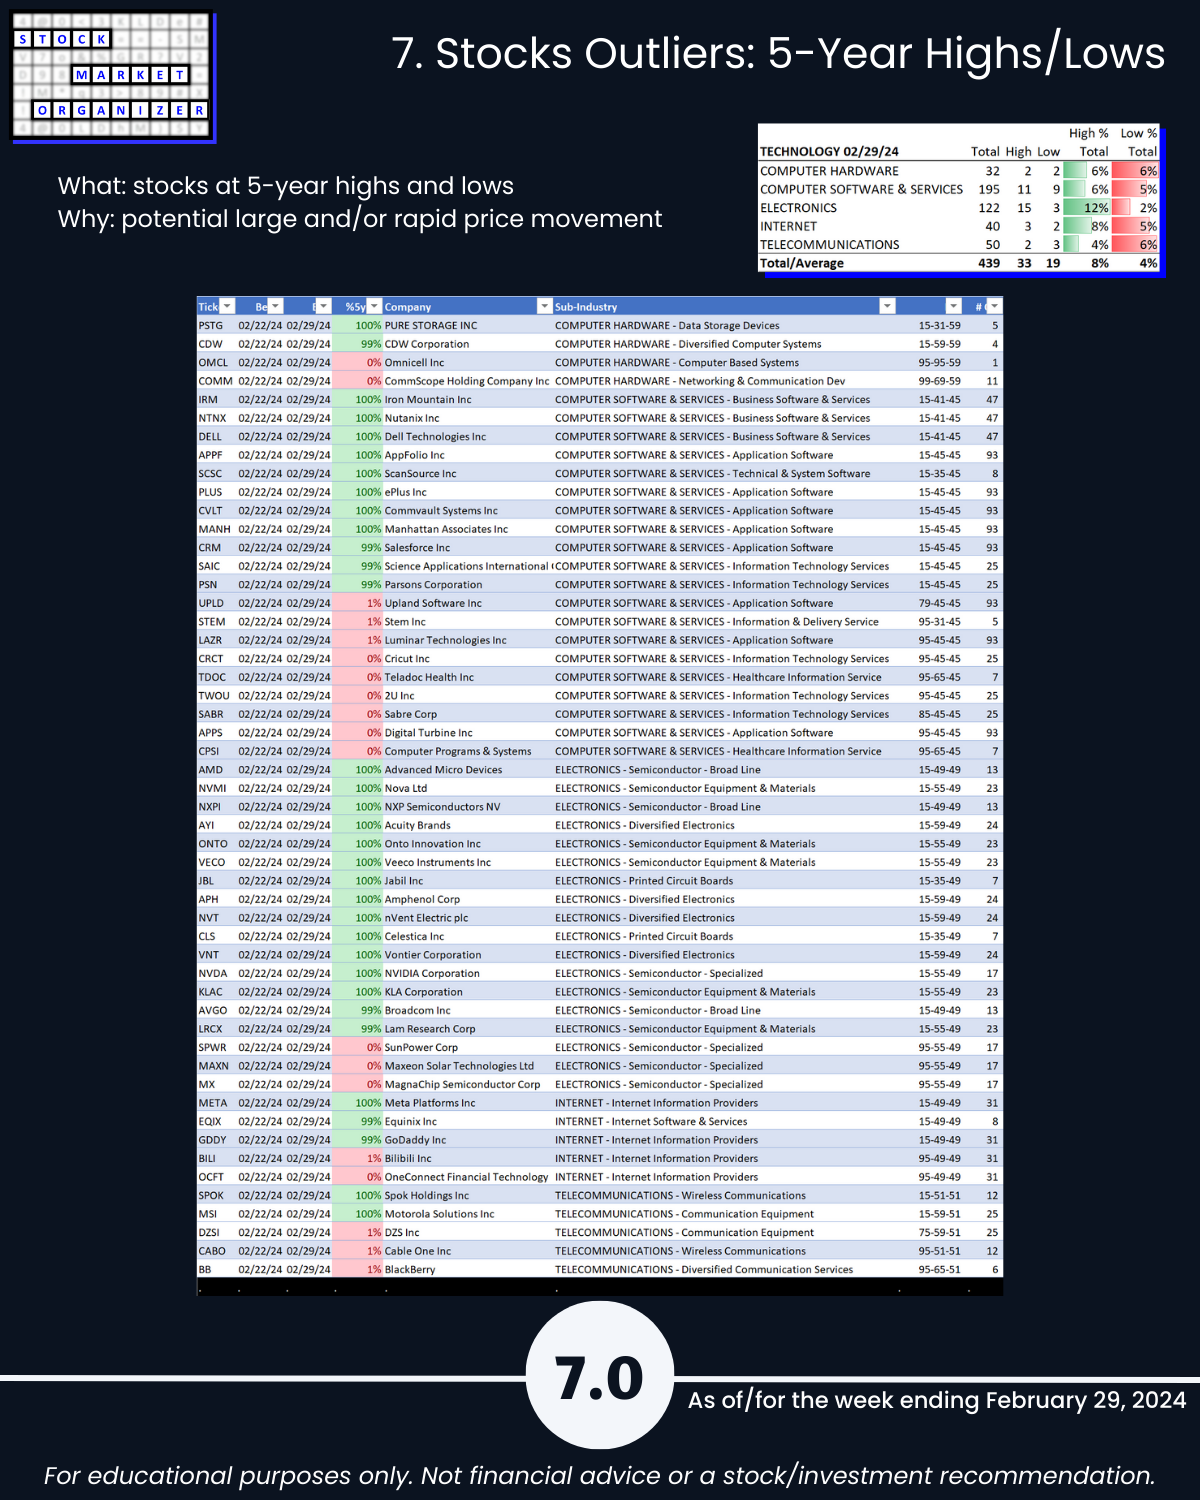
🔹 5-Year Highs/Lows %: Electronics 12% of stocks at highs
SO WHAT?
You’ll find here Strongest- and Weakest-rated Stock Market Organizer stocks and objective strengthening and weakening measurements in these industries.
This will quickly help you find strong stocks in strengthening sub-industries and strengthening industries.
WHY?
Sometimes value reigns, sometimes growth. In recent times, small caps have lagged. The common theme among top performers: strength.
The Banking industry weakened Feb-May 2023. It then strengthened until it was the strongest-rated industry as recently as the week ending 1/26/24.
From 5/15/23 through 1/26/24:
🔹 99% of banking stocks were positive
🔹 90% rose >10%
🔹 ~7 in 10 stocks rose >25%
🔹 ~1 in 4 stocks rose >50%
It was hard NOT to profit in this strengthening Banking industry. Since then, things have changed.
From 1/26/24 through 2/29/24 Banking weakened 3 of 9 strength levels and:
🔹 ~9% of banking stocks were positive
🔹 ~7 in 10 fell more than -5%
🔹 ~4 in 10 fell more than -10%
🔹 ~1 in 10 fell more than -15%
THE BOTTOM LINE
Bottom-ticking isn’t part of the program.
Measuring strength week-by-week is.
Because
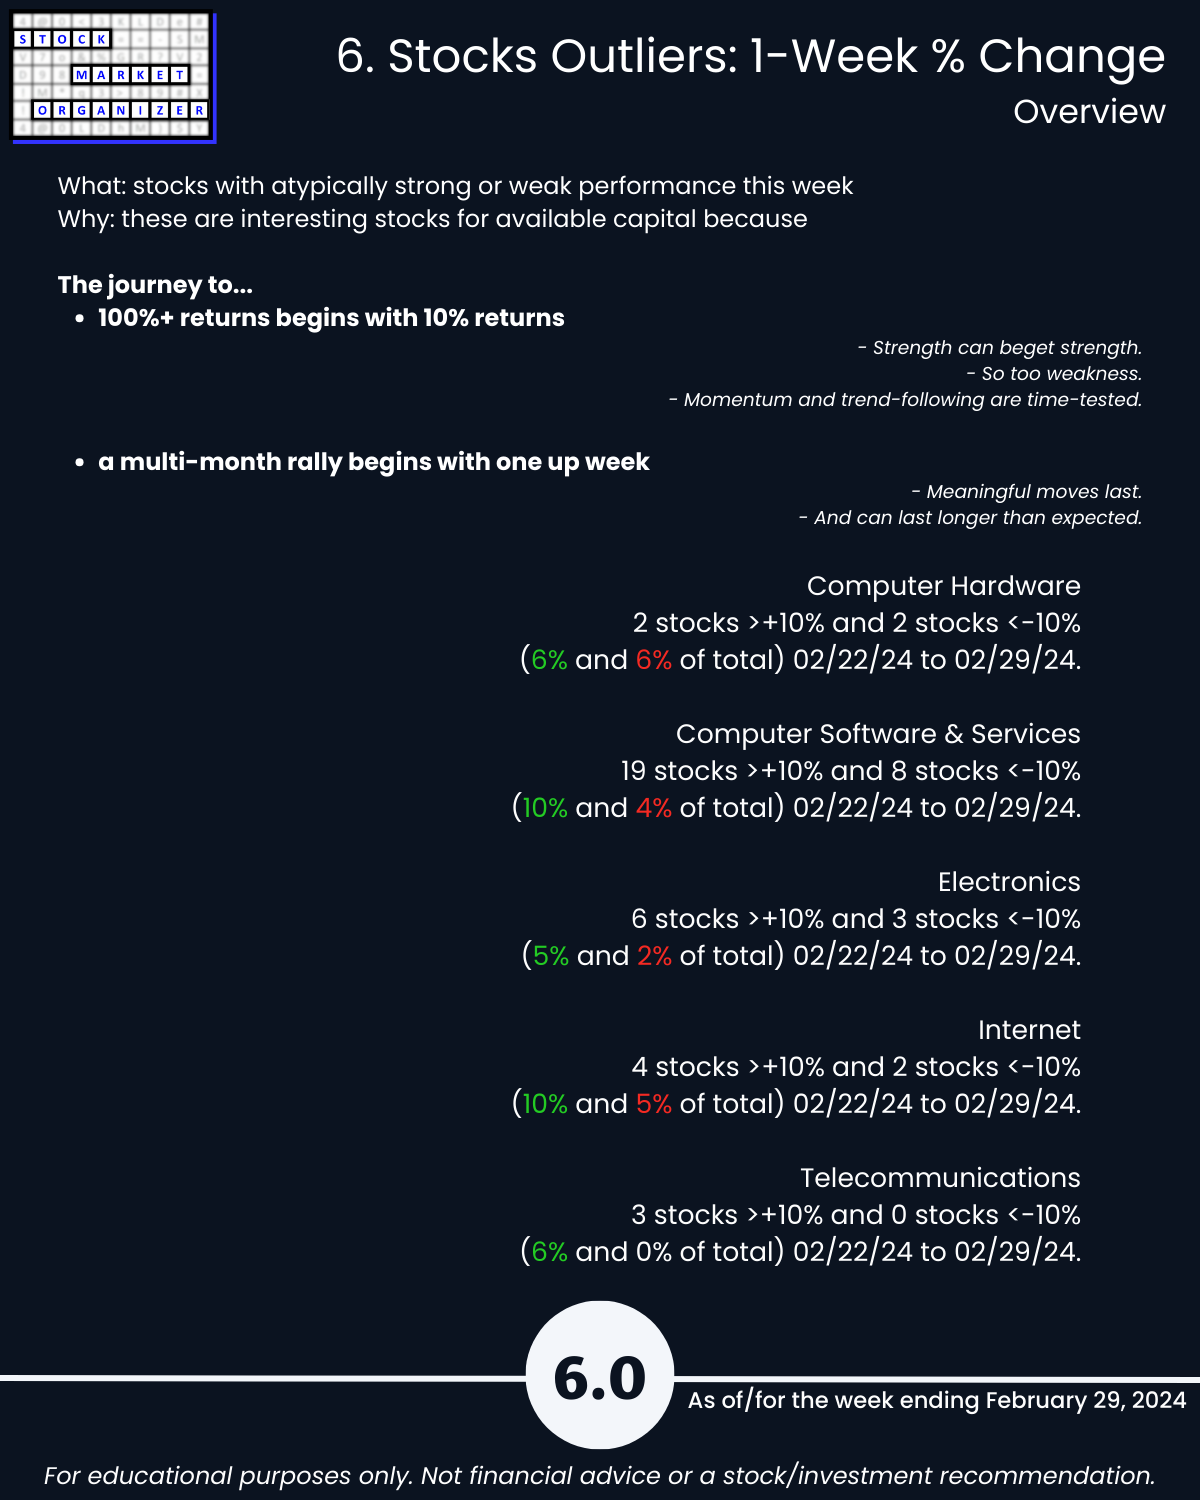
🔹 the rally of multiple months+ begins with one up week, and
🔹 the journey to 100%+ returns begins with 10% returns.
This report may particularly be of interest if the following 5 concepts resonate with you:
- The stronger your stocks, the greener your P&L.
- The journey to 100%+ returns begins with 10% returns.
- The journey to a multi-month rally begins with one up week.
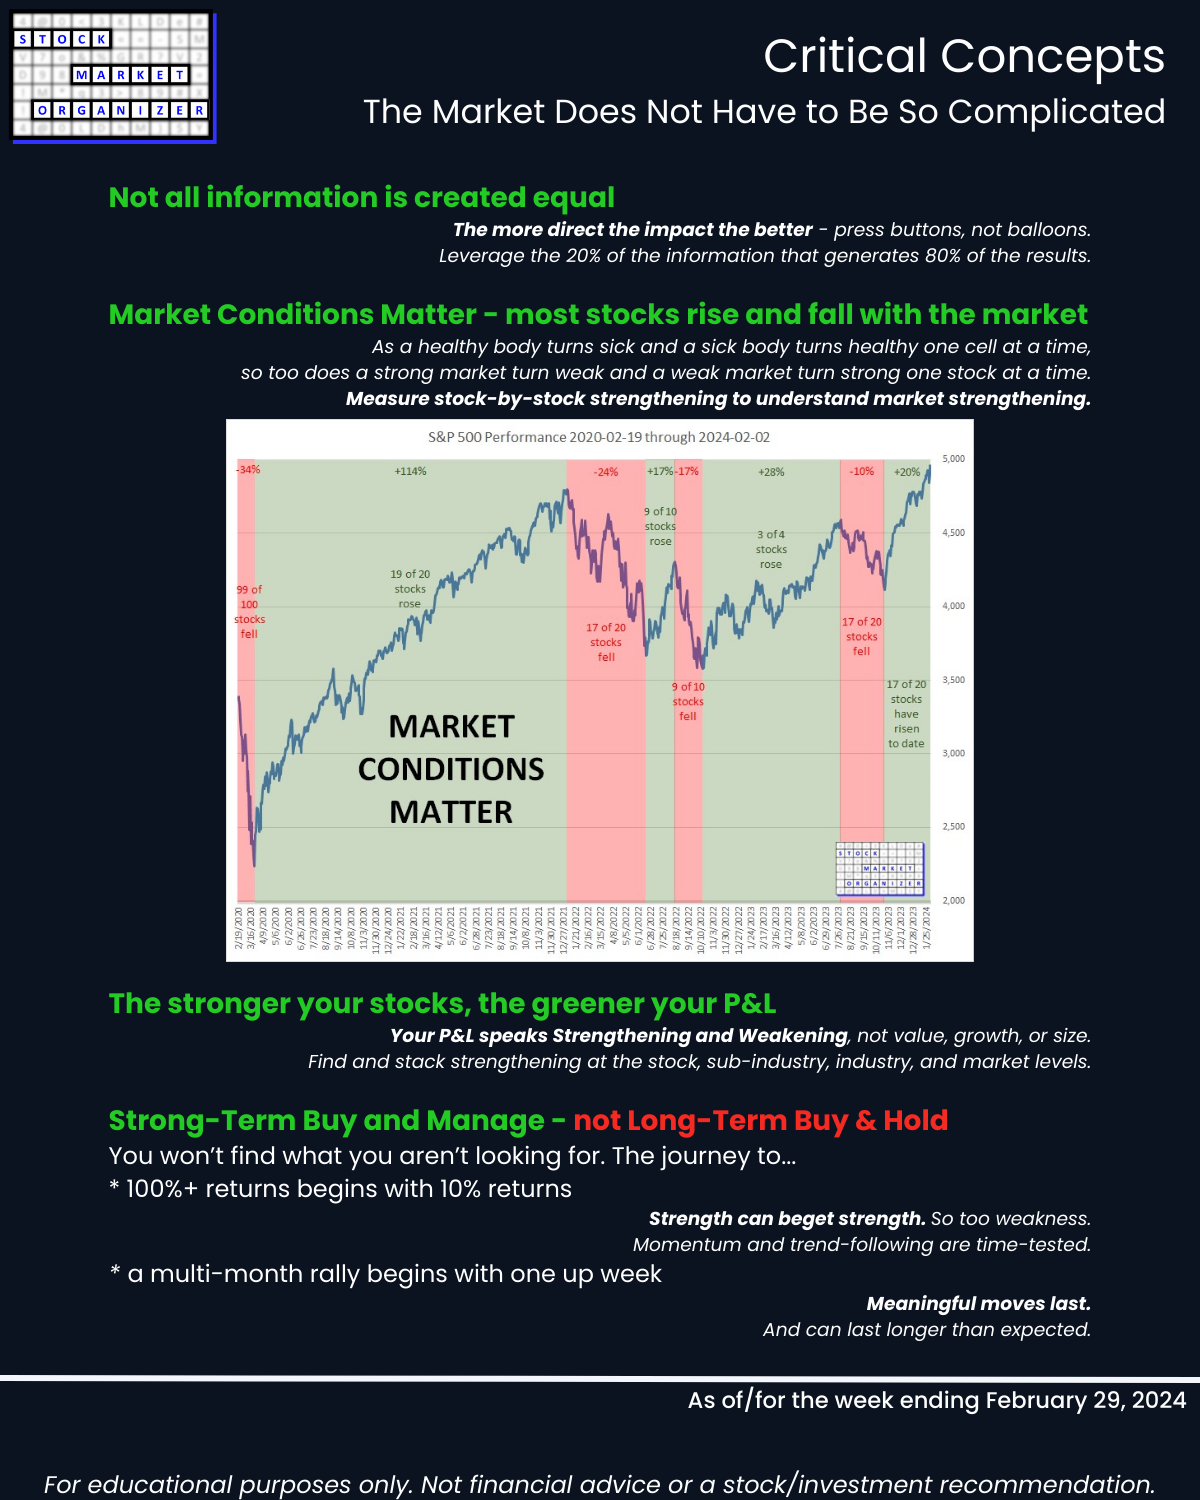
- Most stocks do what the market does. (While the market can only do what its underlying stocks, sub-industries, and industries do.)
- 80/20: not all information is created equal. (Press buttons, not balloons.)
Following are galleries with page-by-page views of this report.
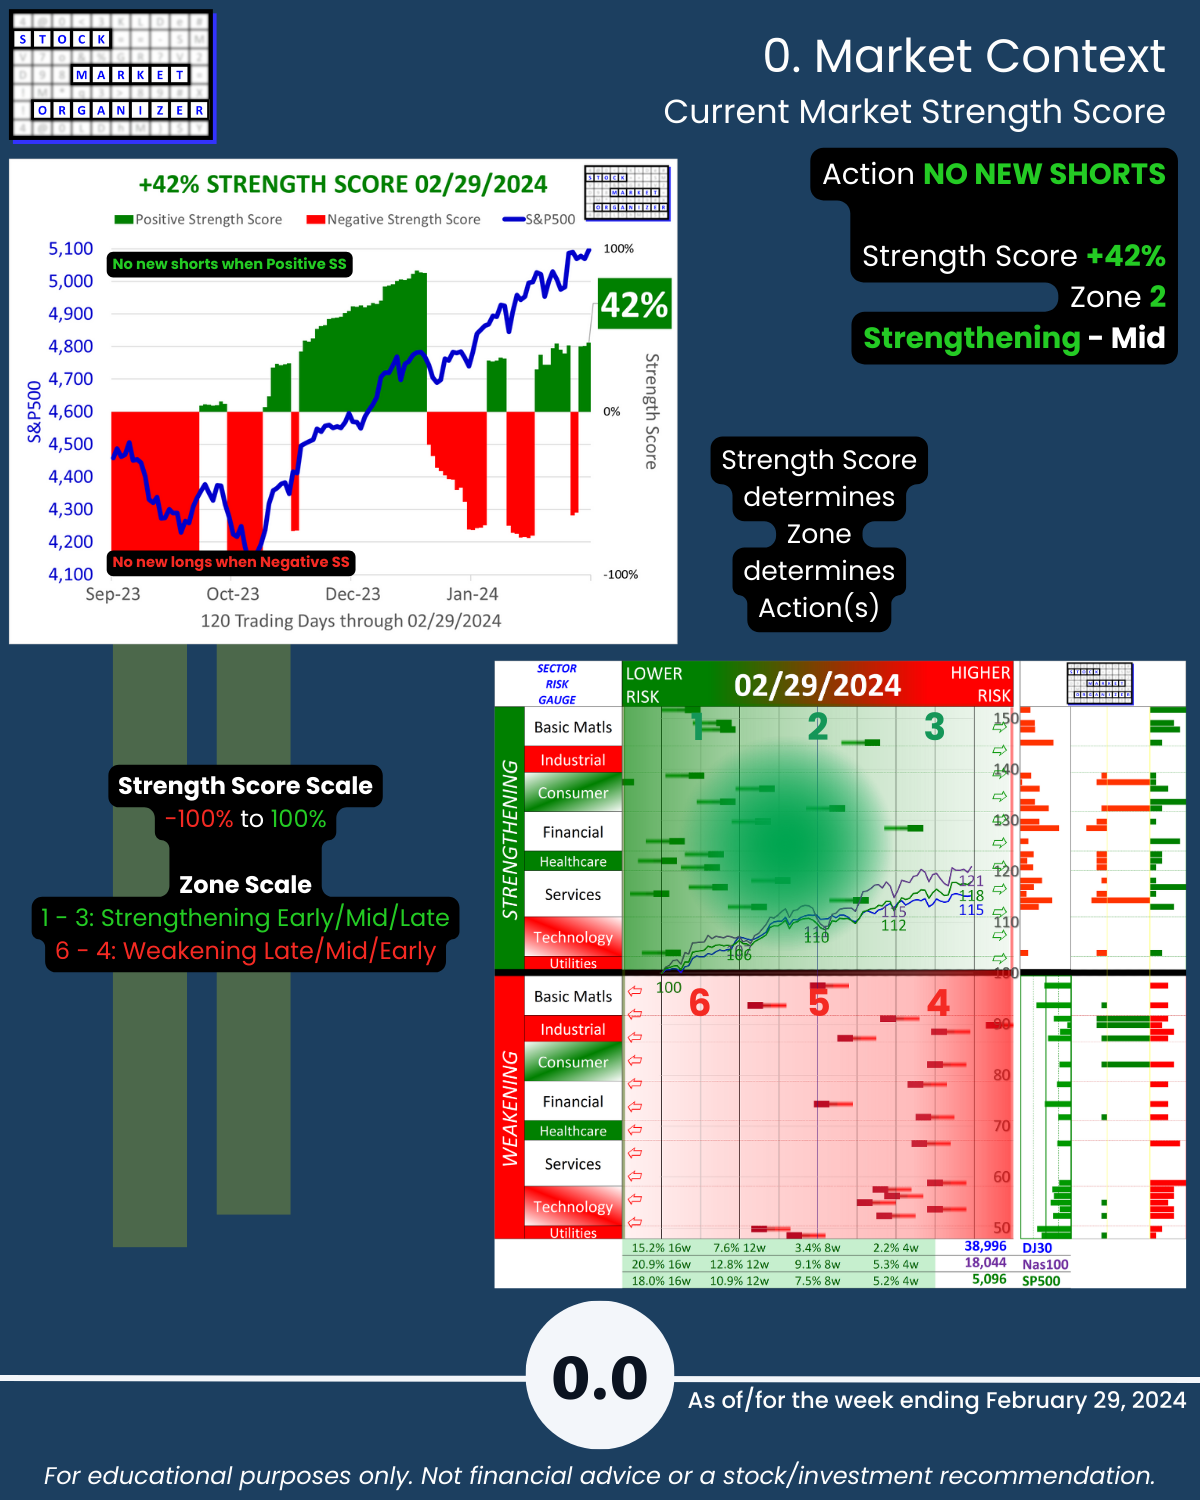
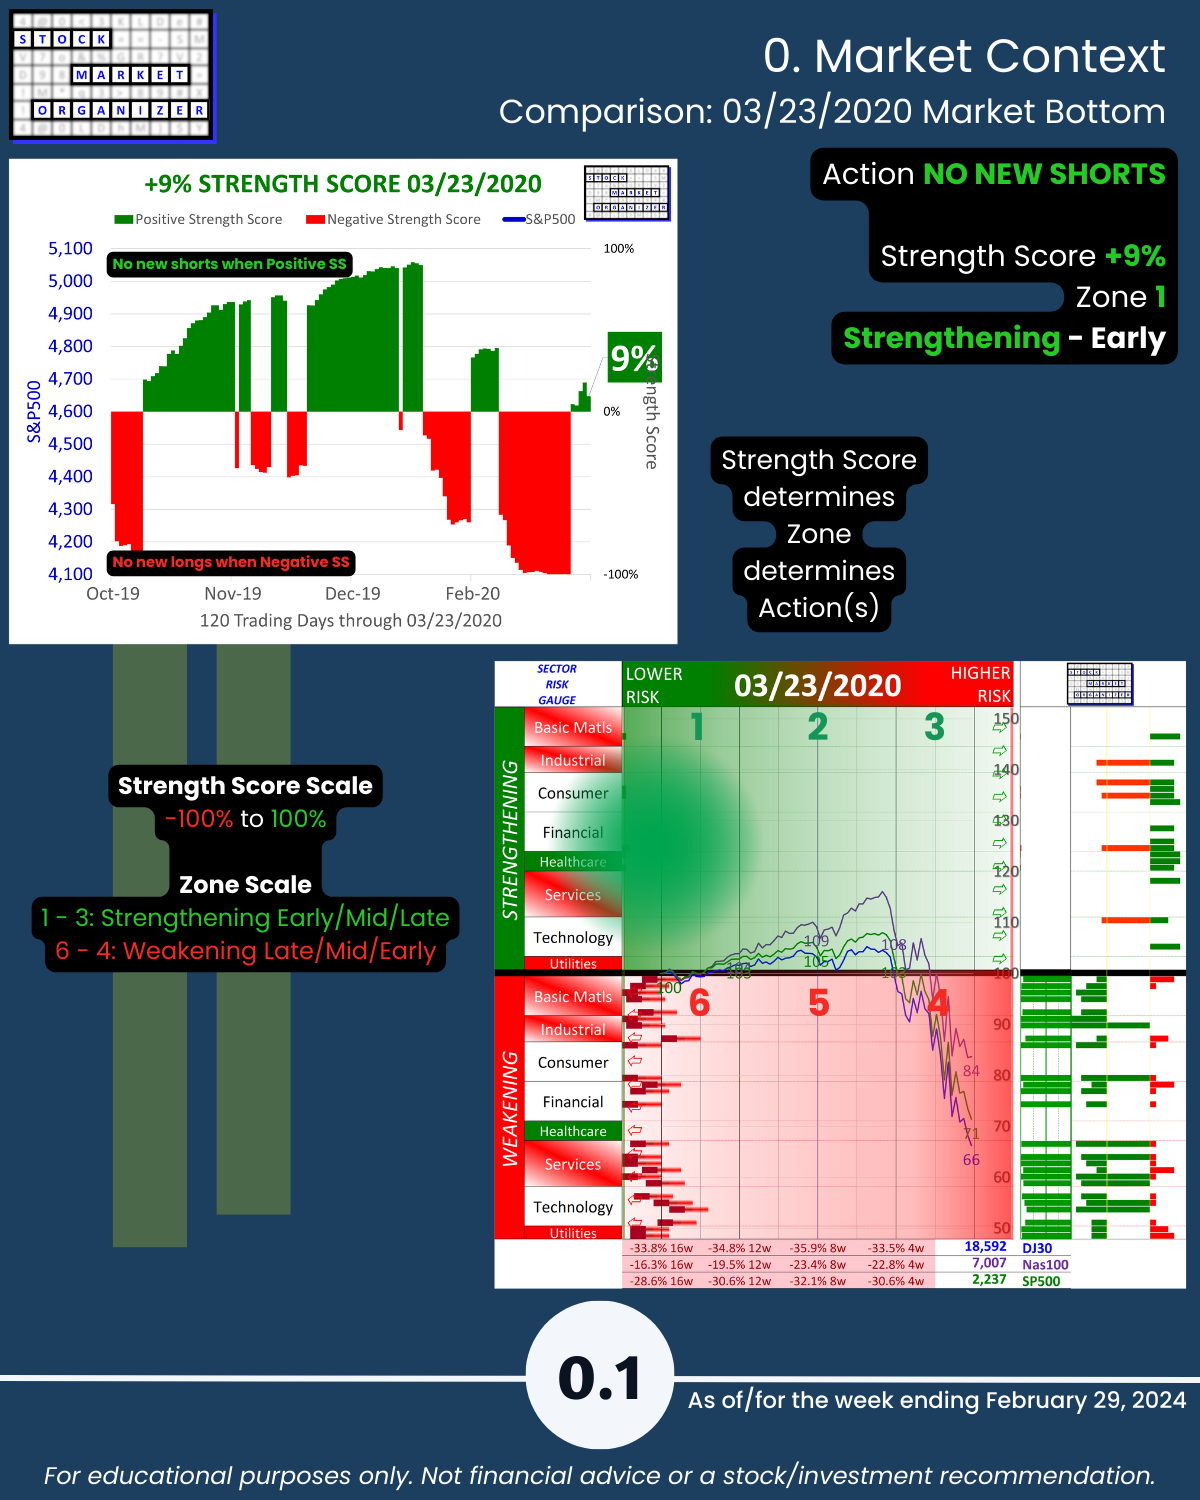
0. Market Context
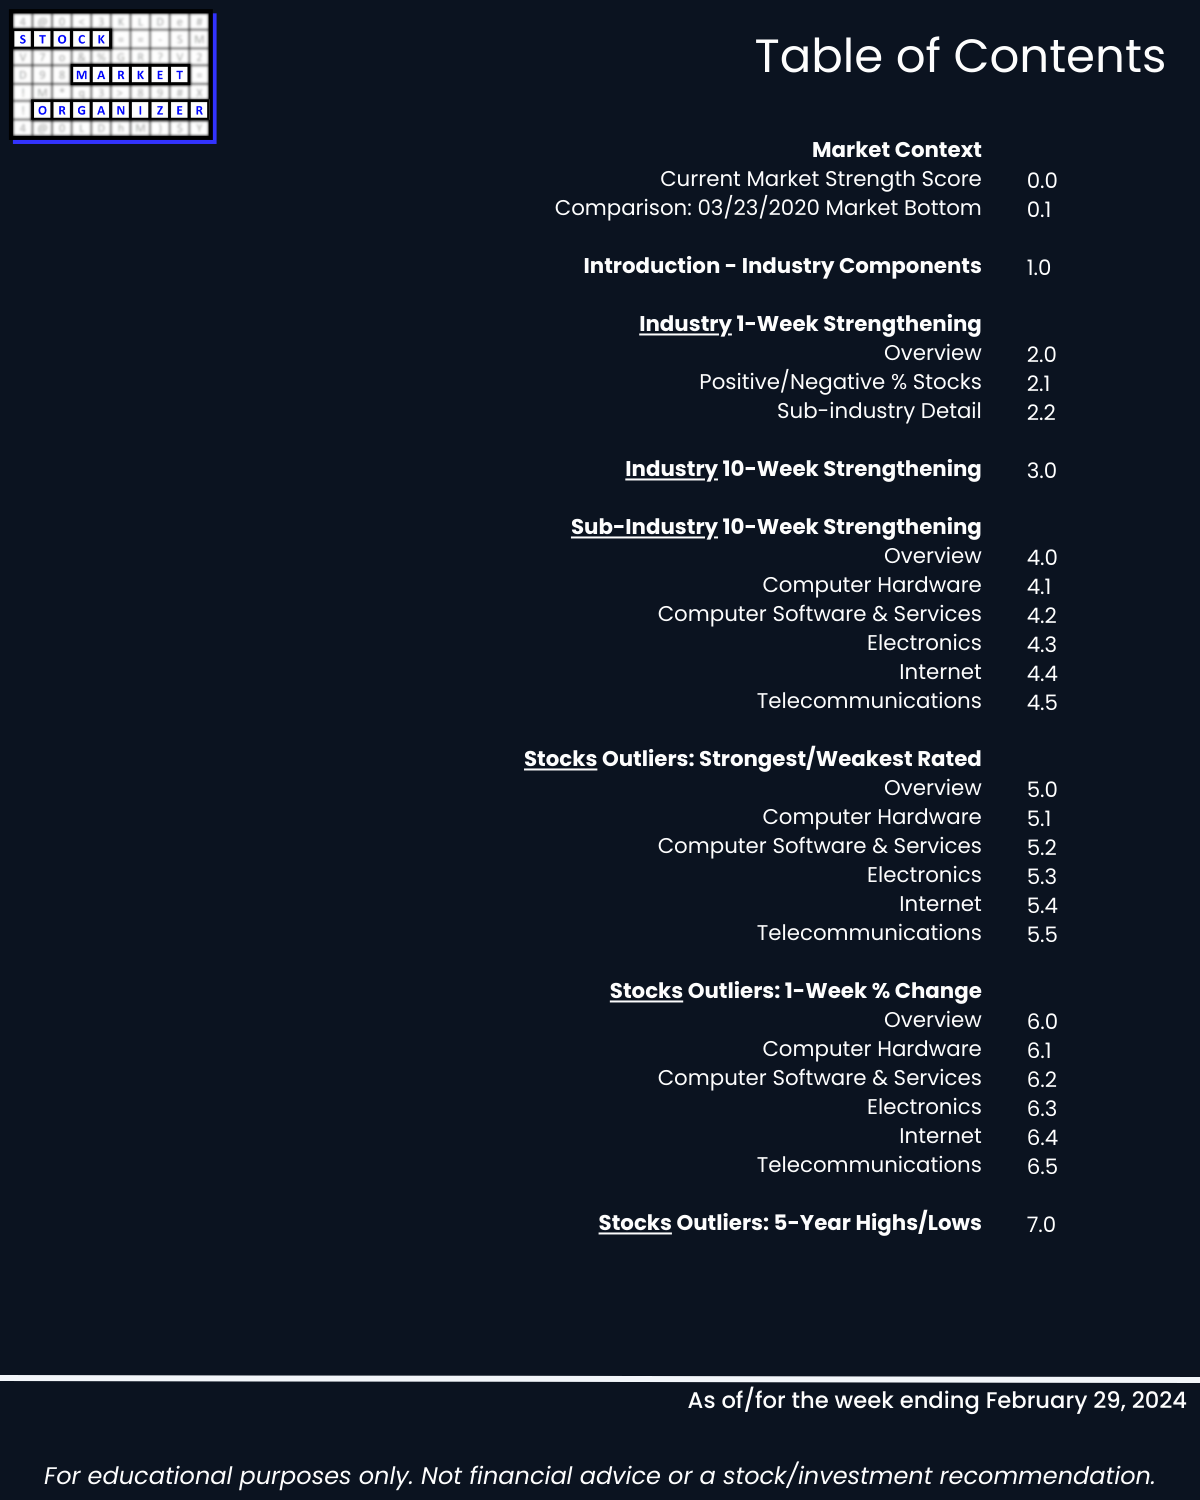
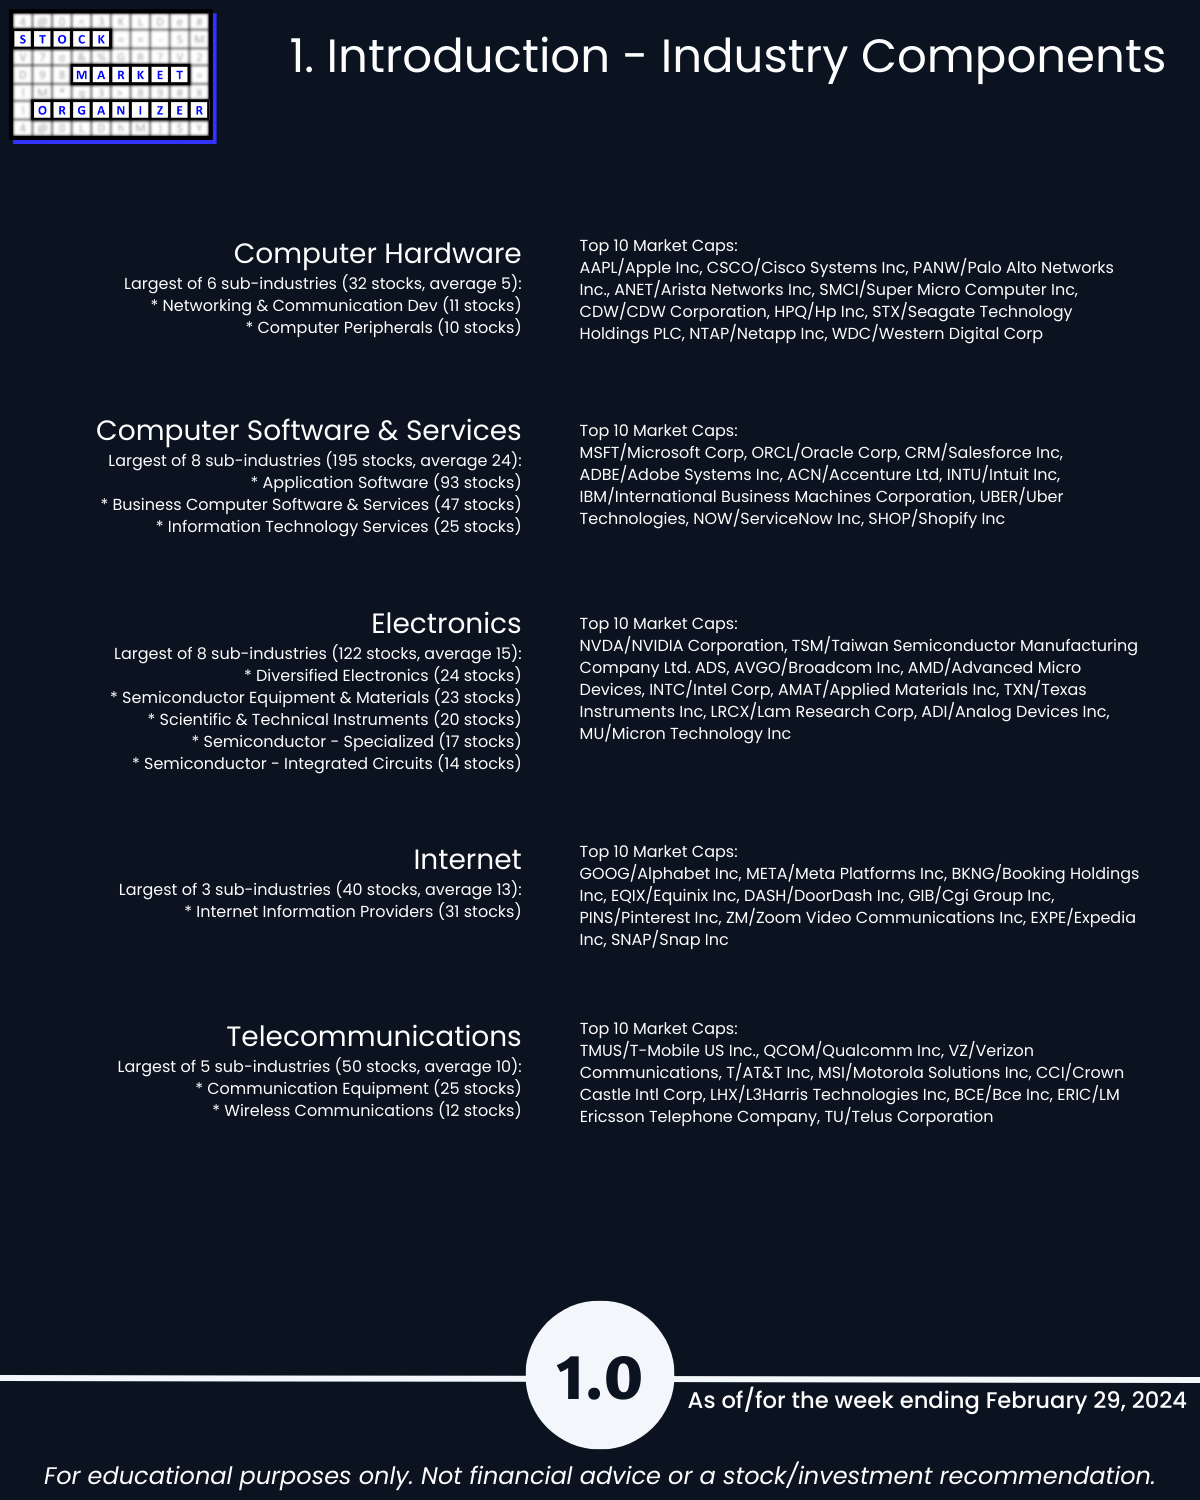
1. Introduction
2. Industry 1-Week Strengthening
3. Industry 10-Week Strengthening
4. Sub-Industry 10-Week Strengthening
5. Stocks Outliers: Strongest/Weakest Rated
6. Stocks Outliers: 1-Week % Change
7. Stocks Outliers: 5-Year Highs/Lows