SMO Exclusive: Strength Report Technology Sector 2024-02-22

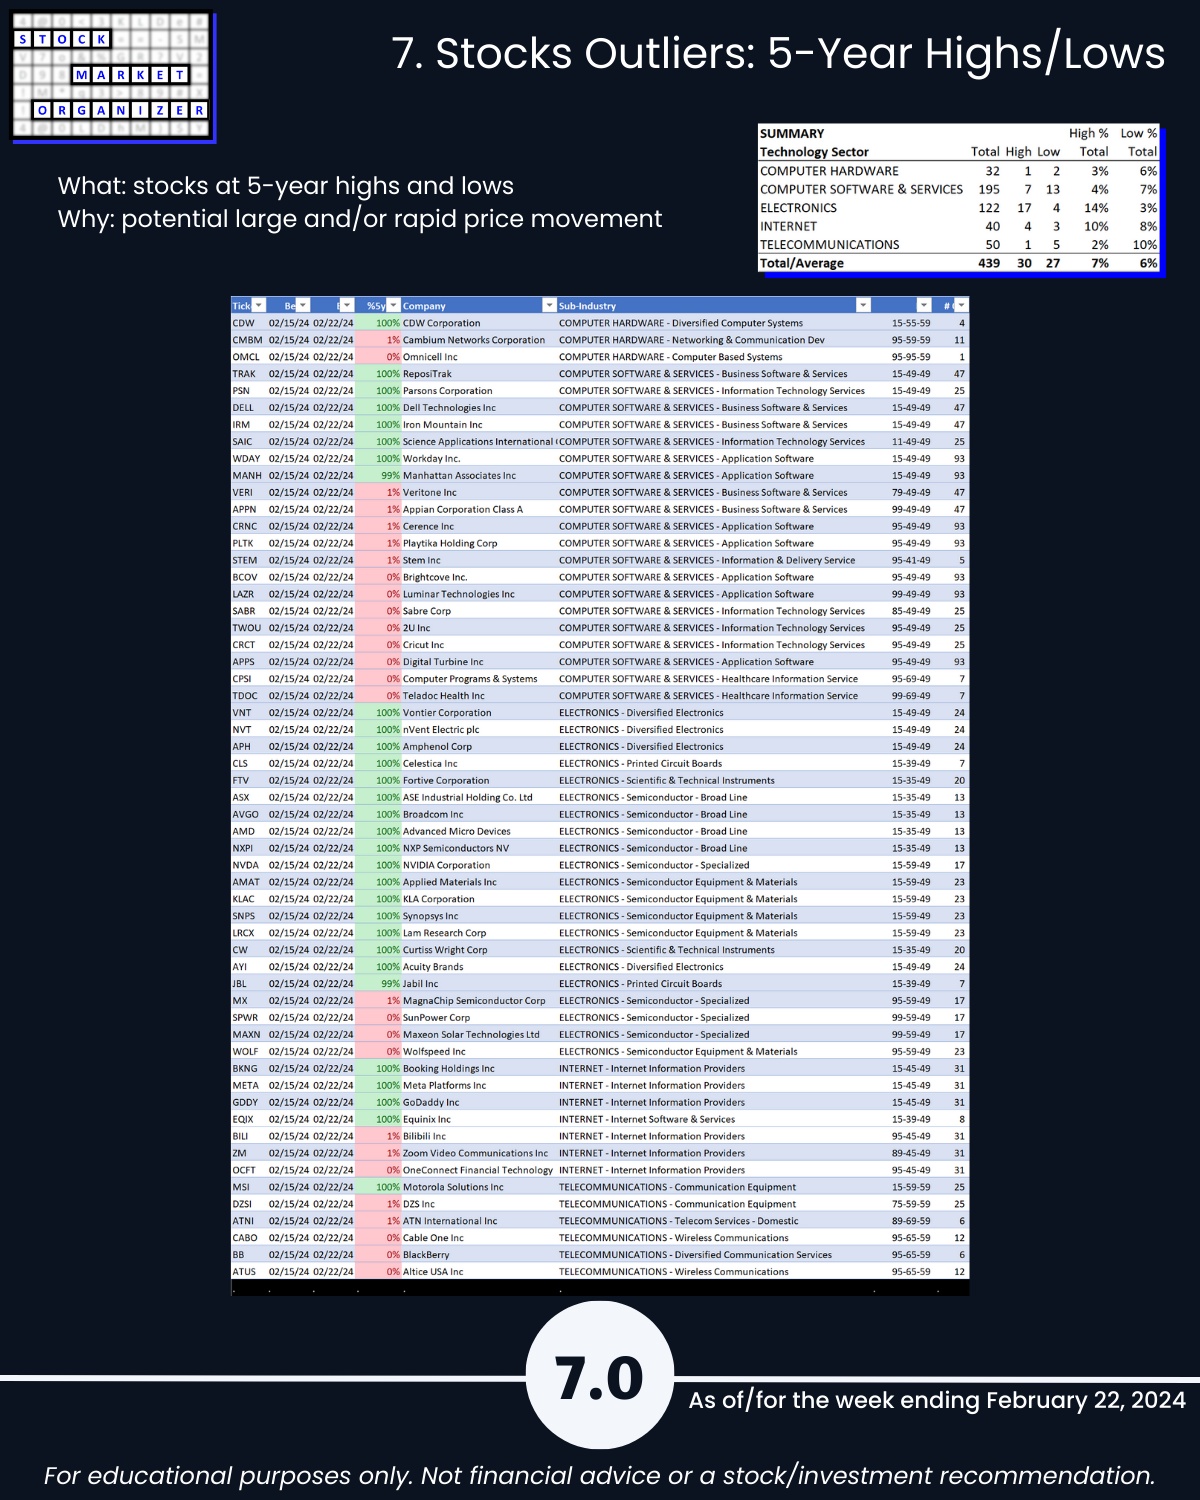
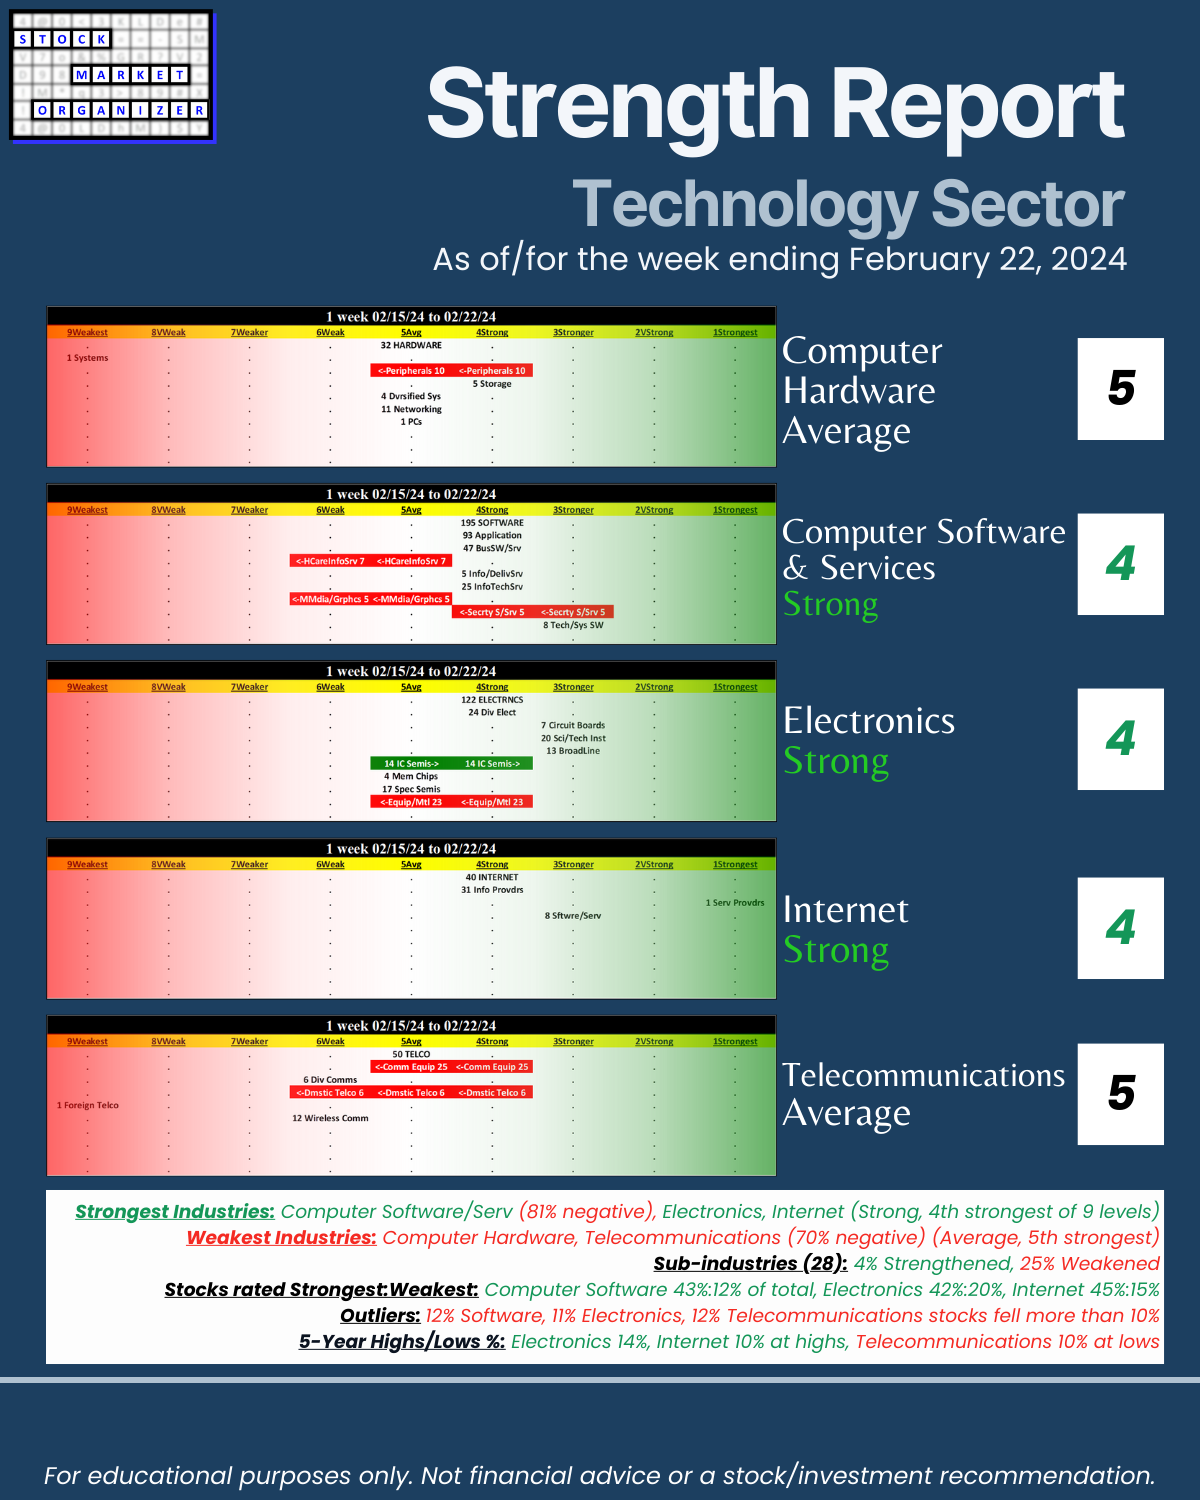
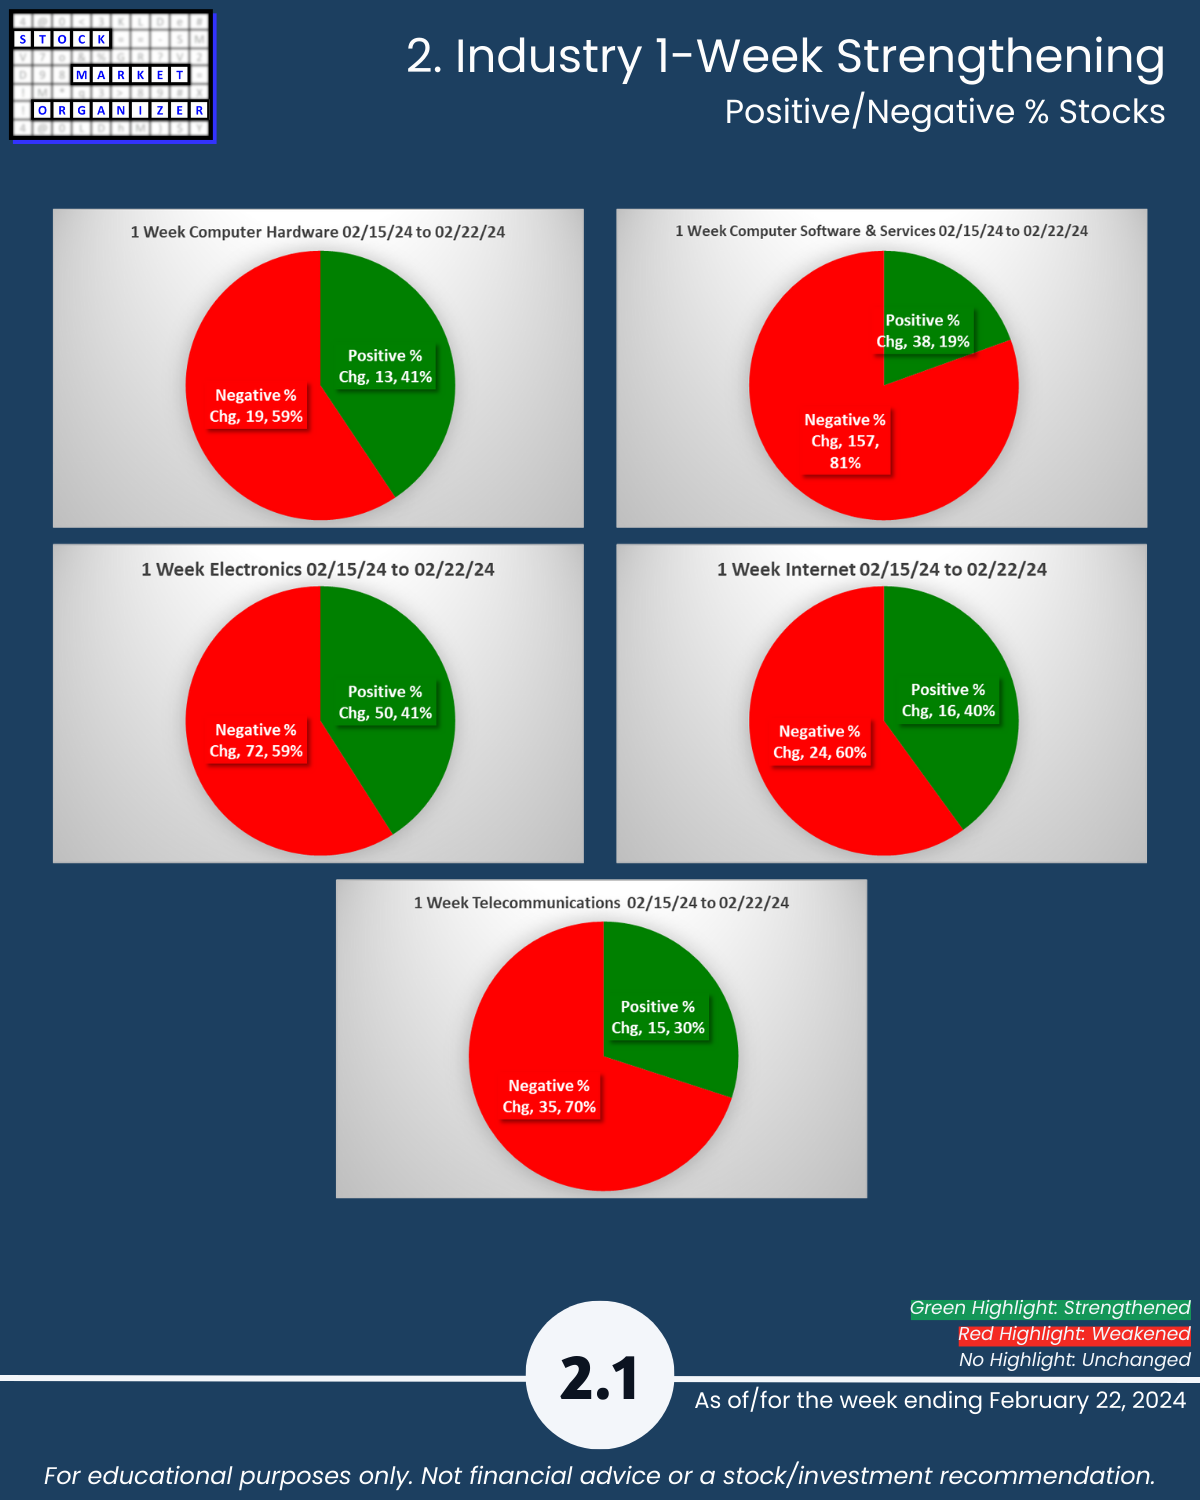
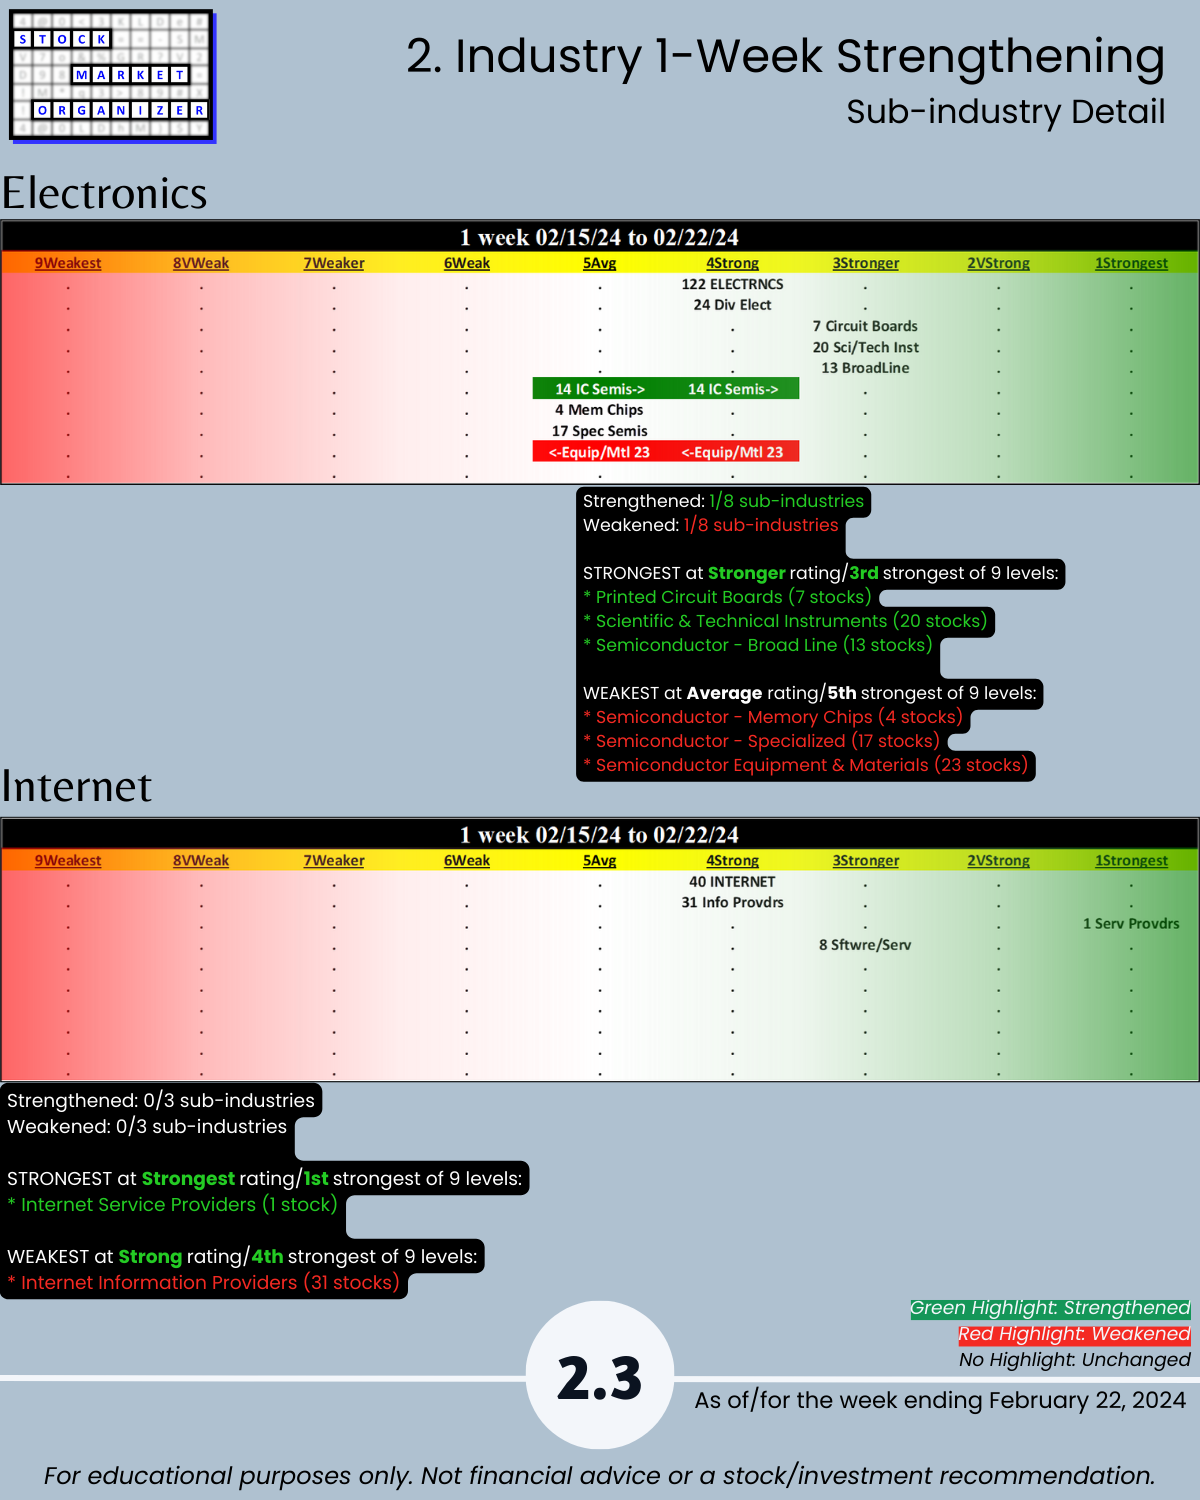
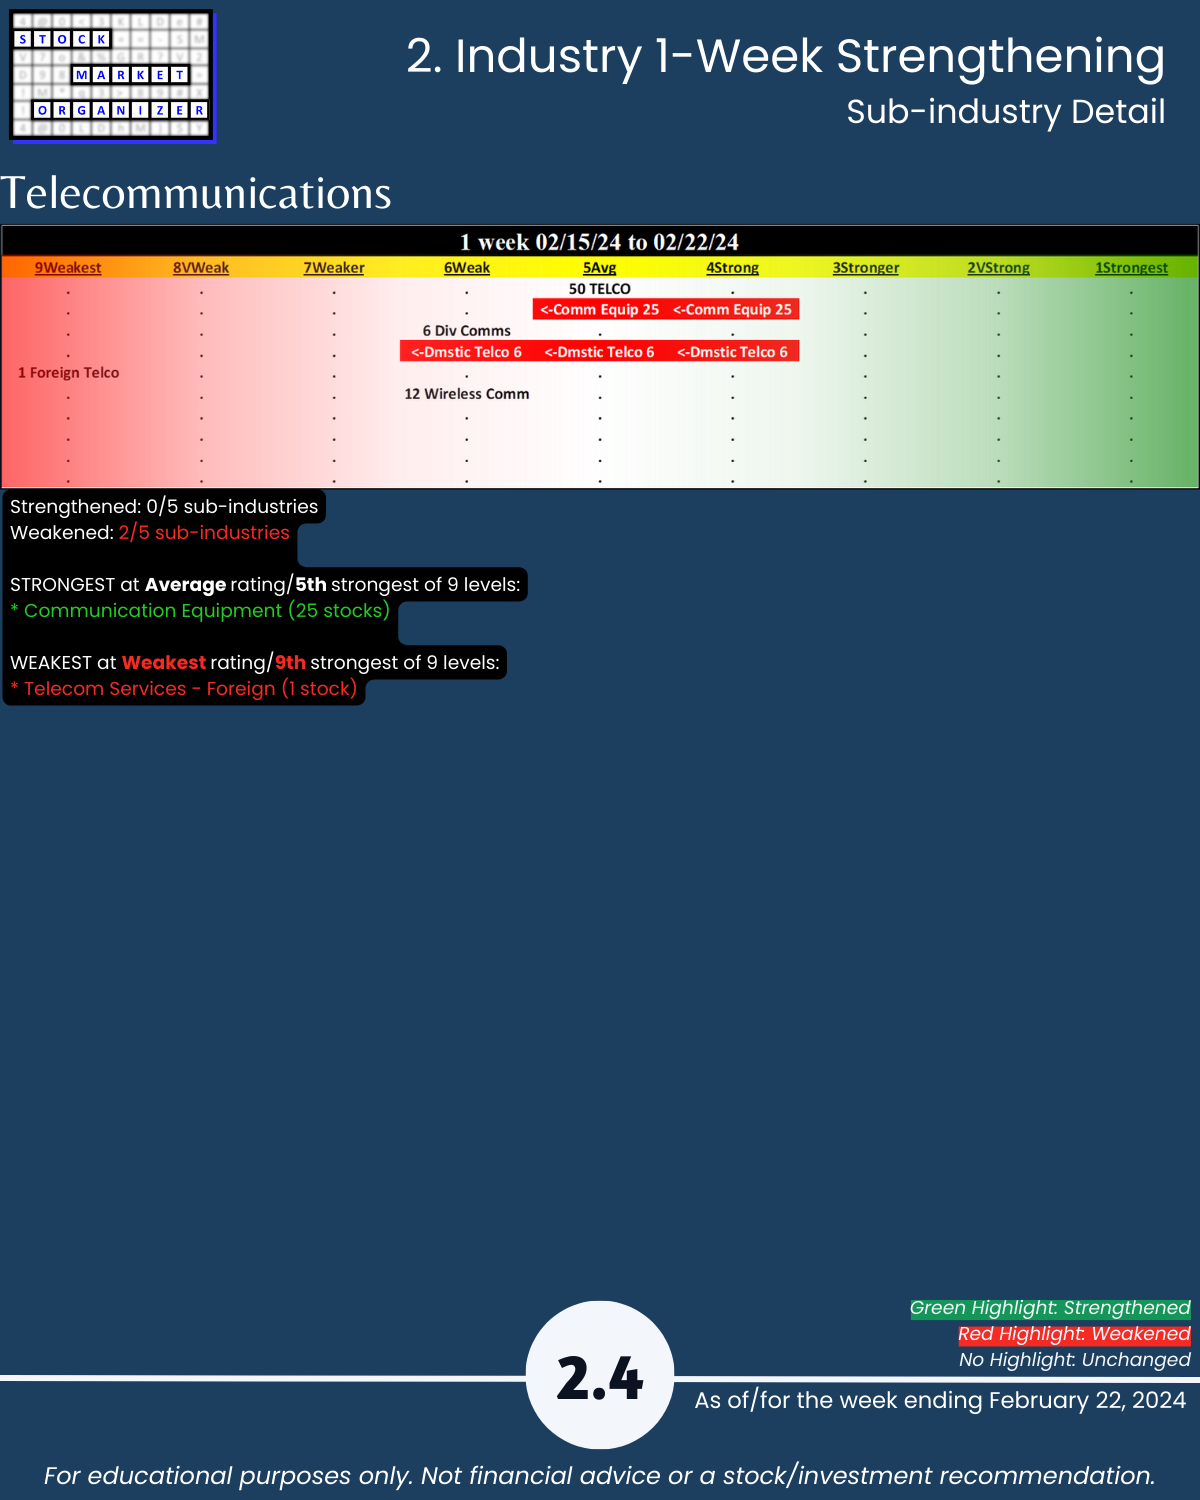
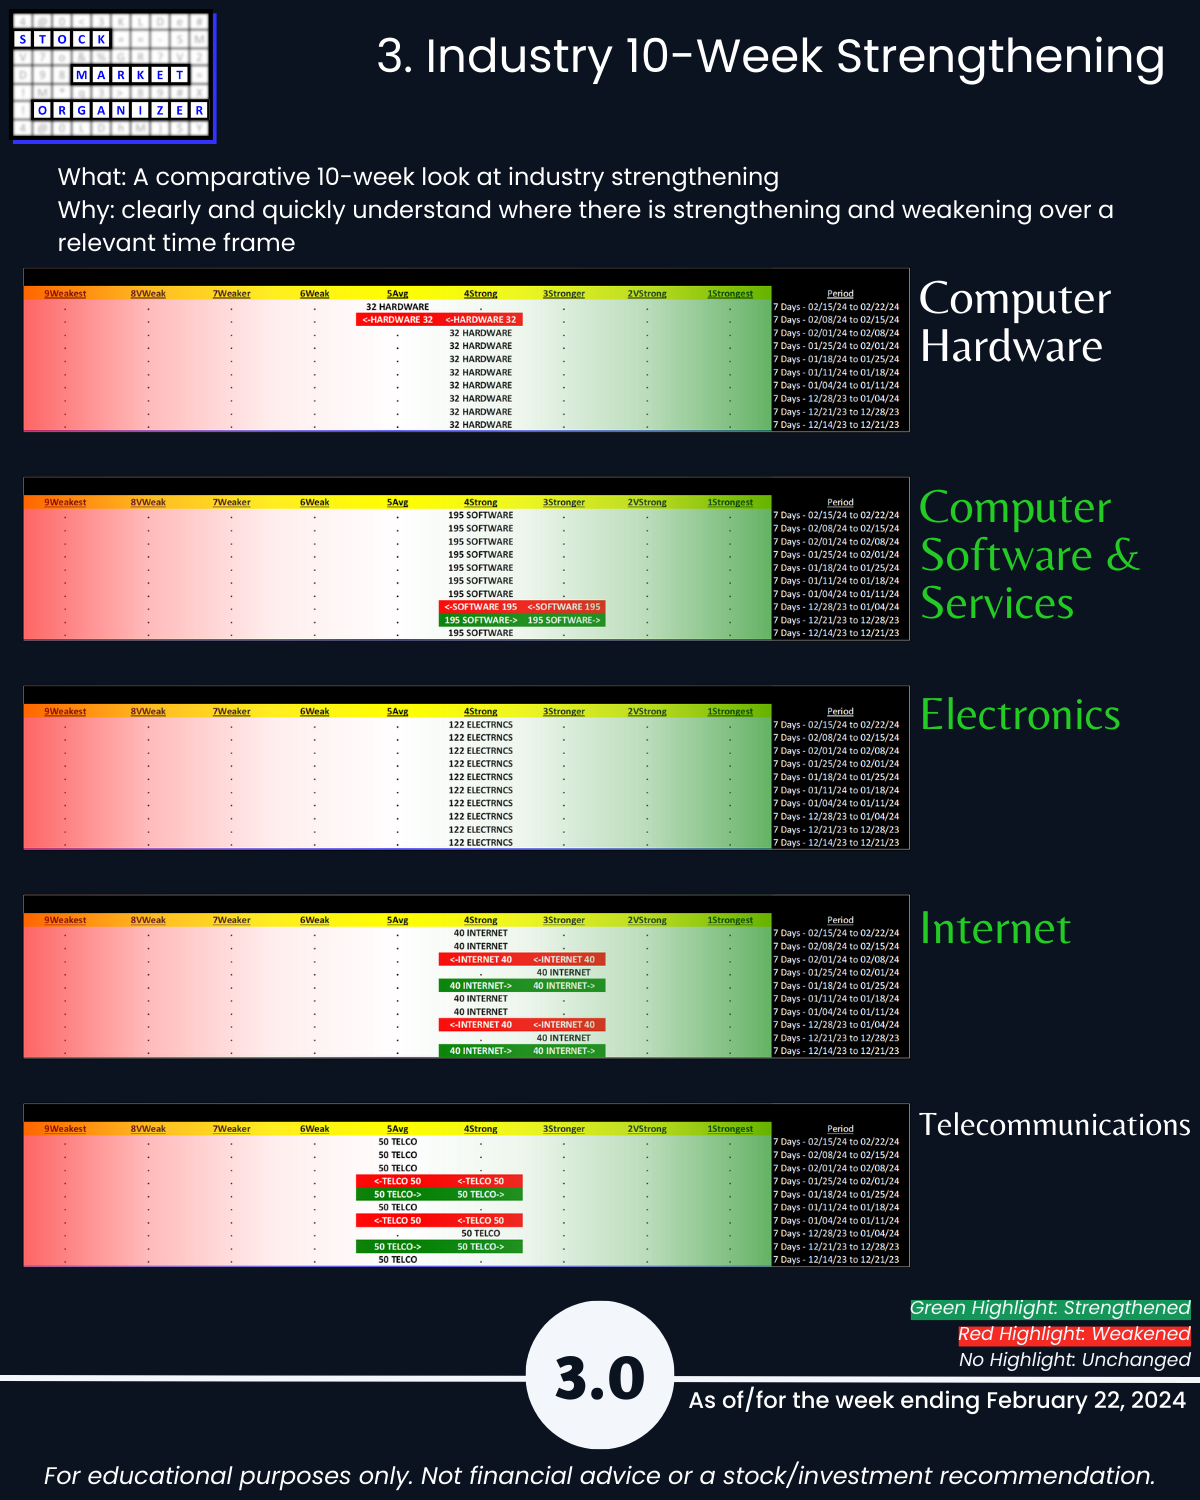
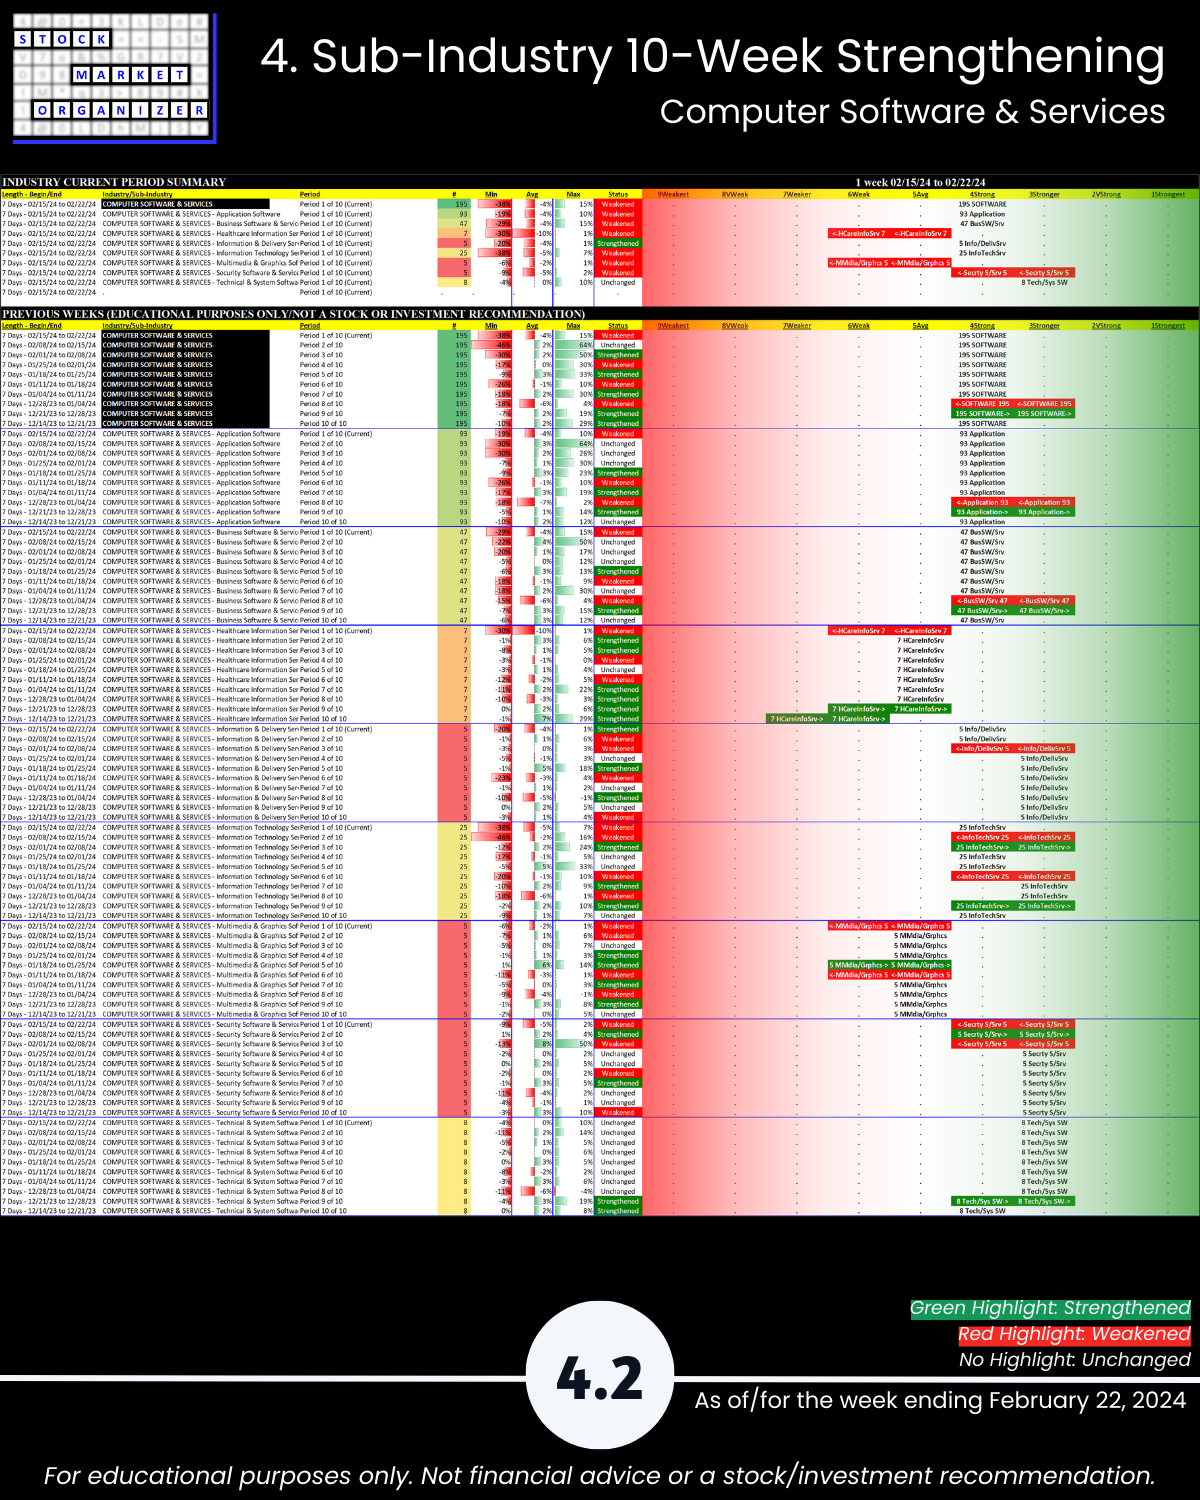
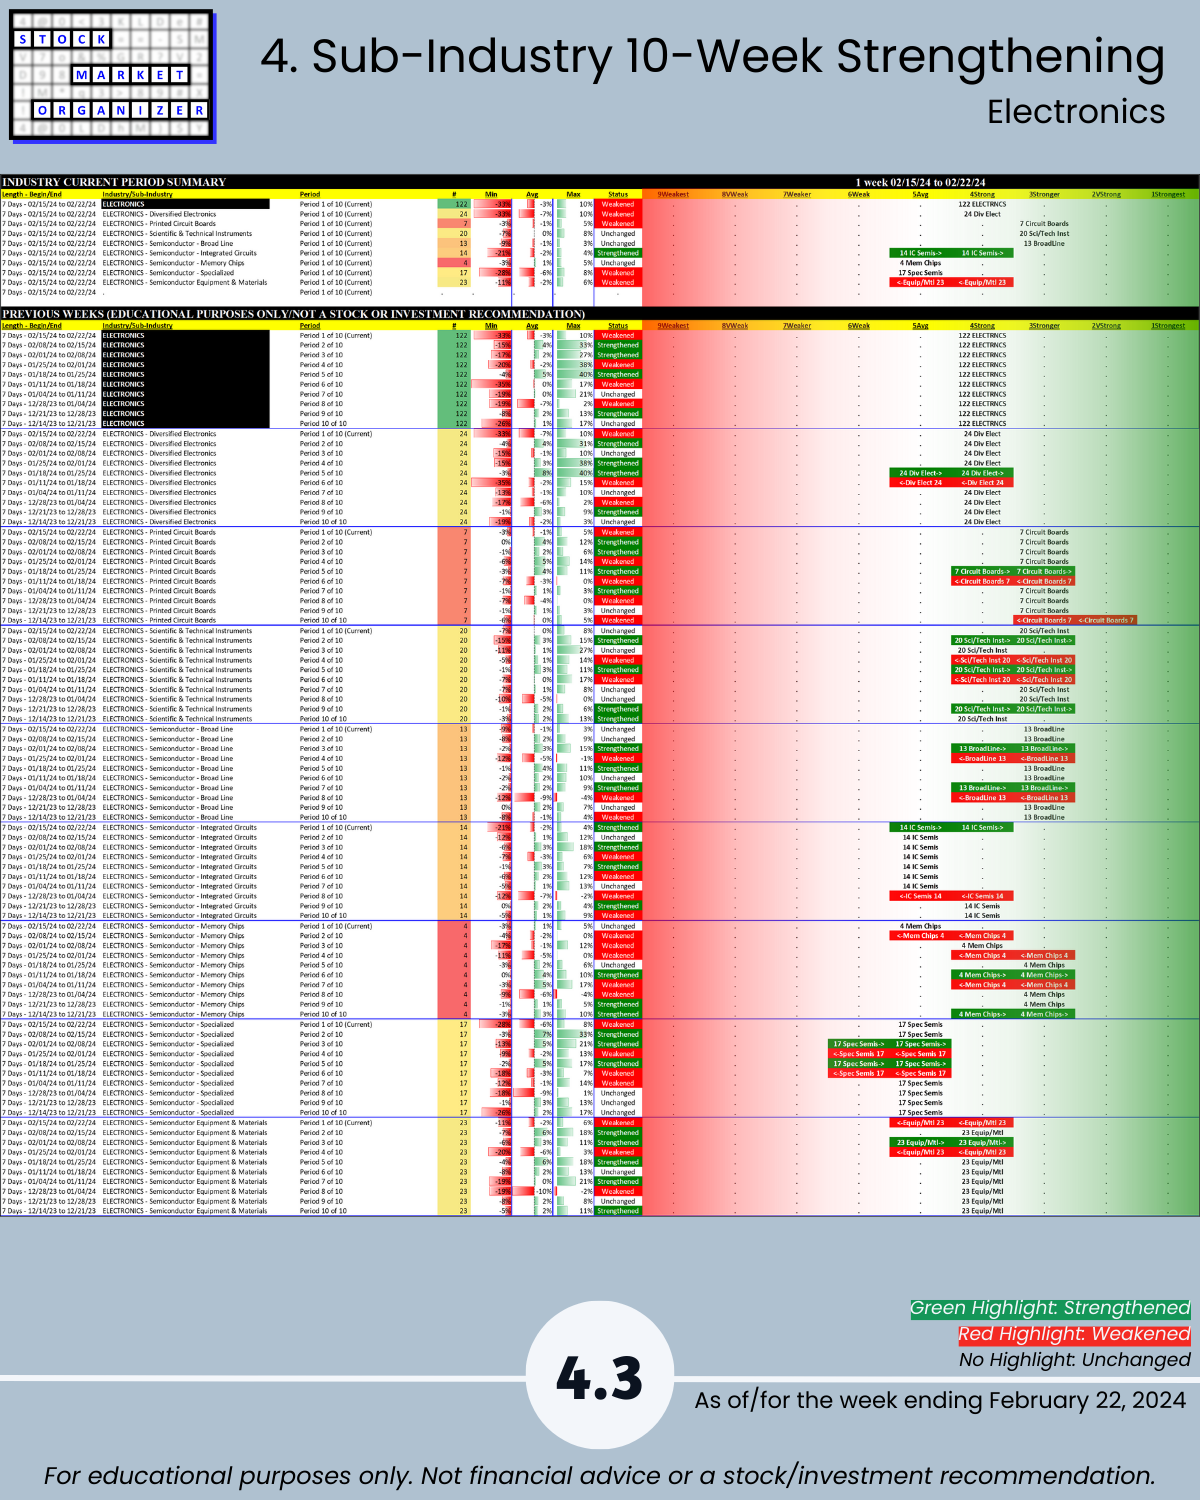
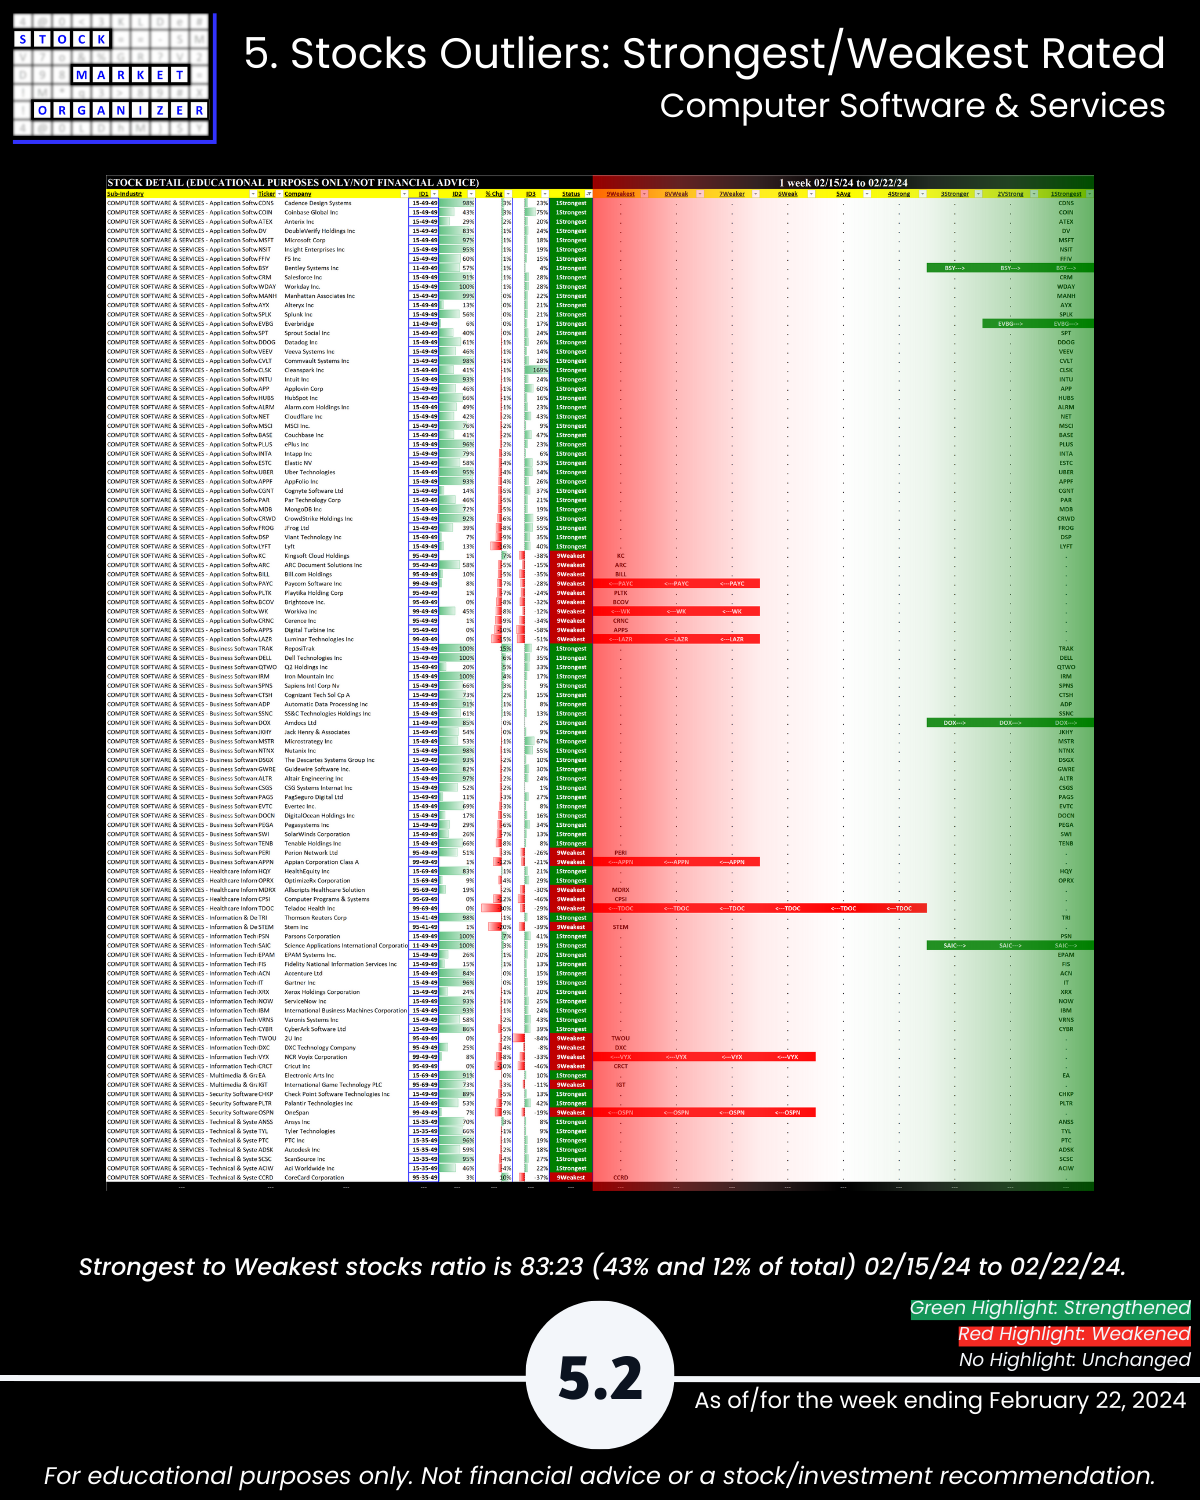
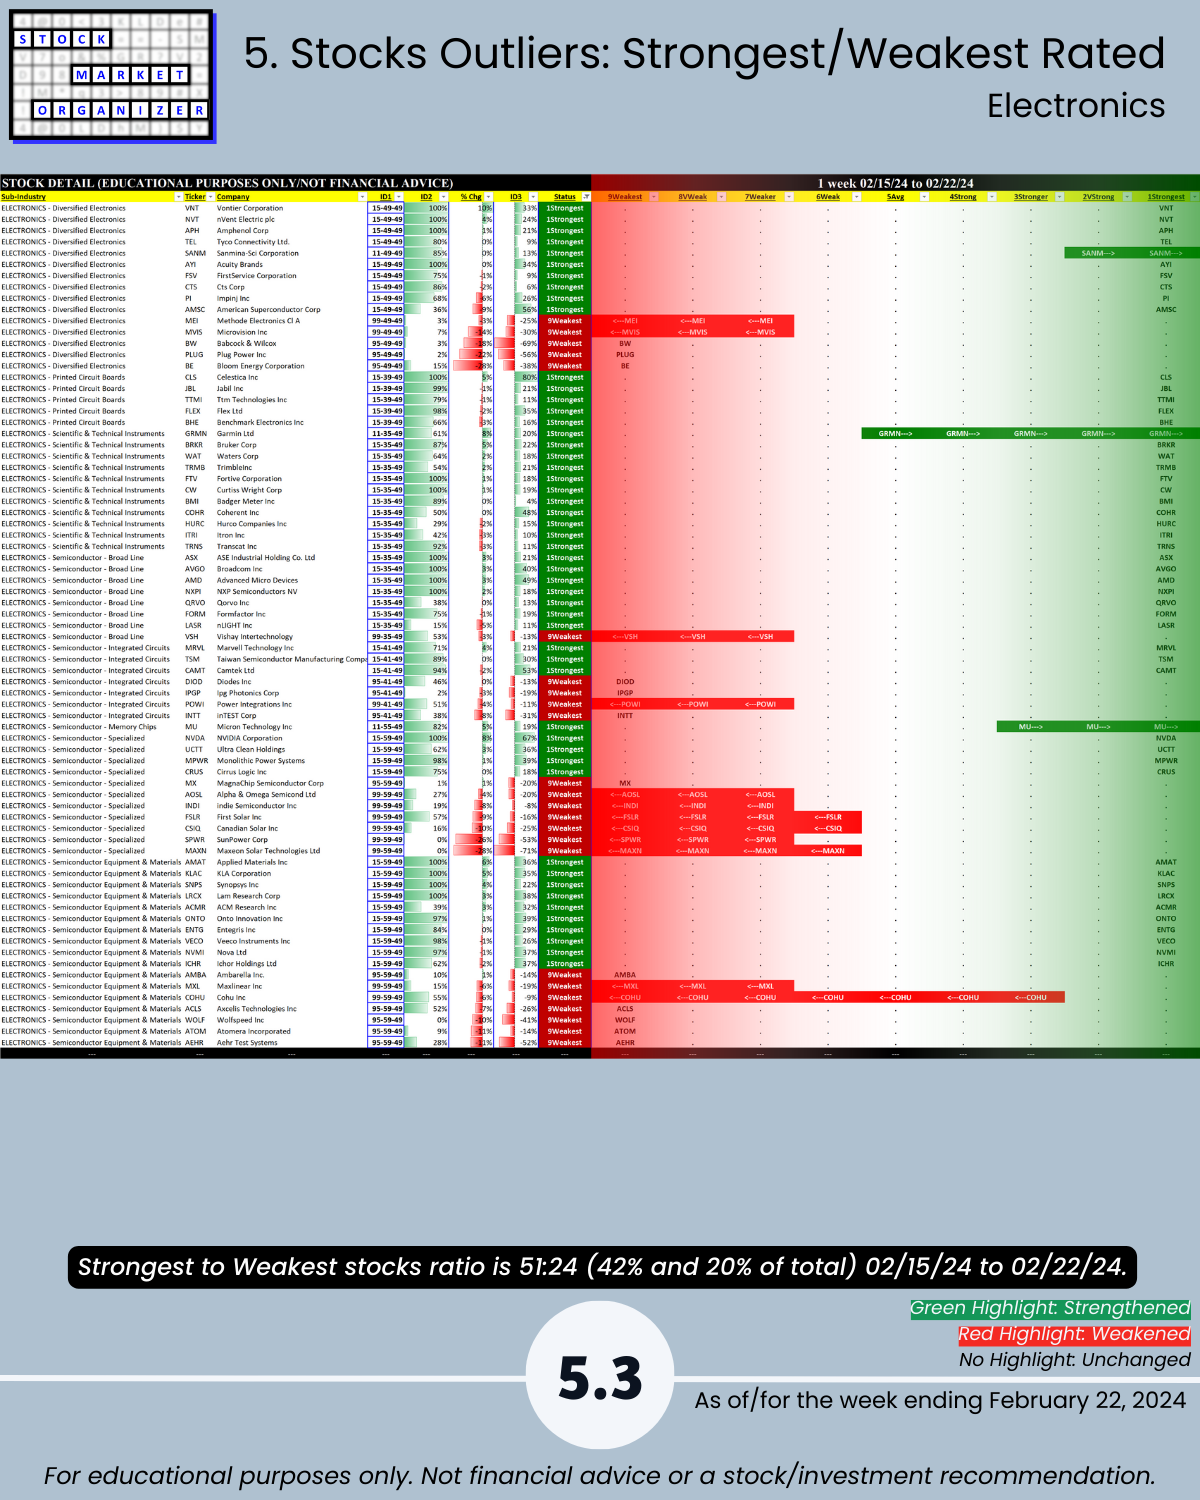
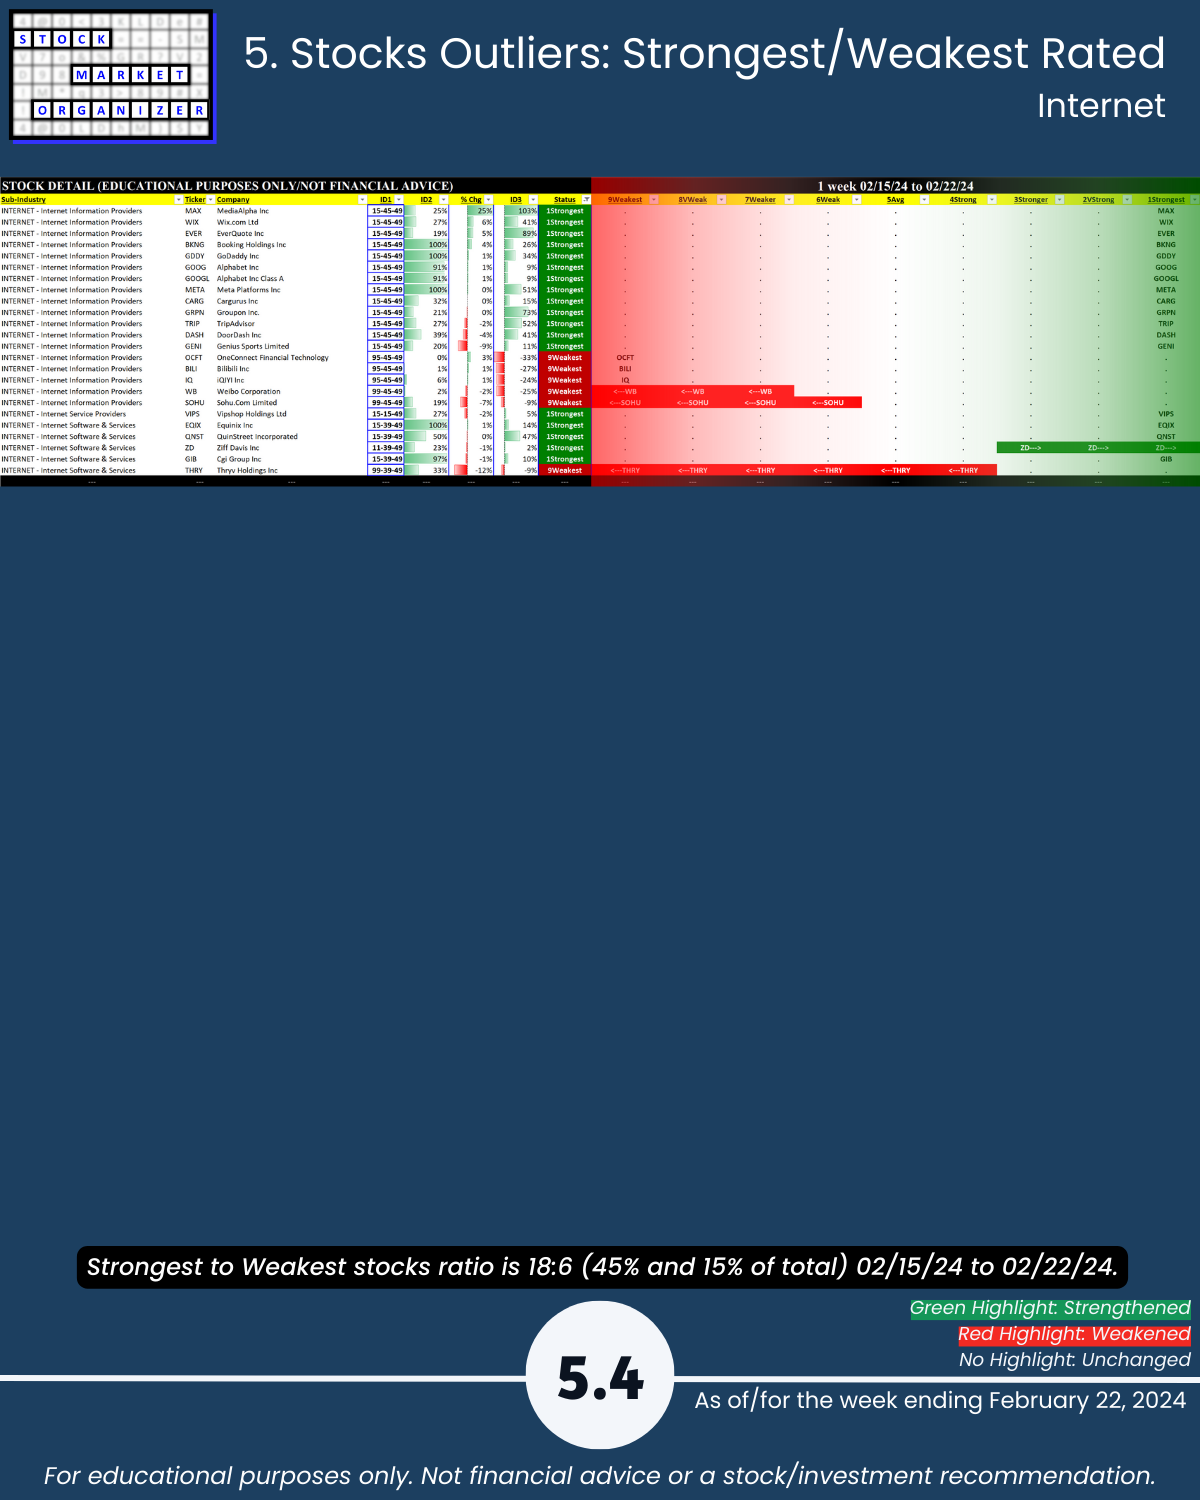
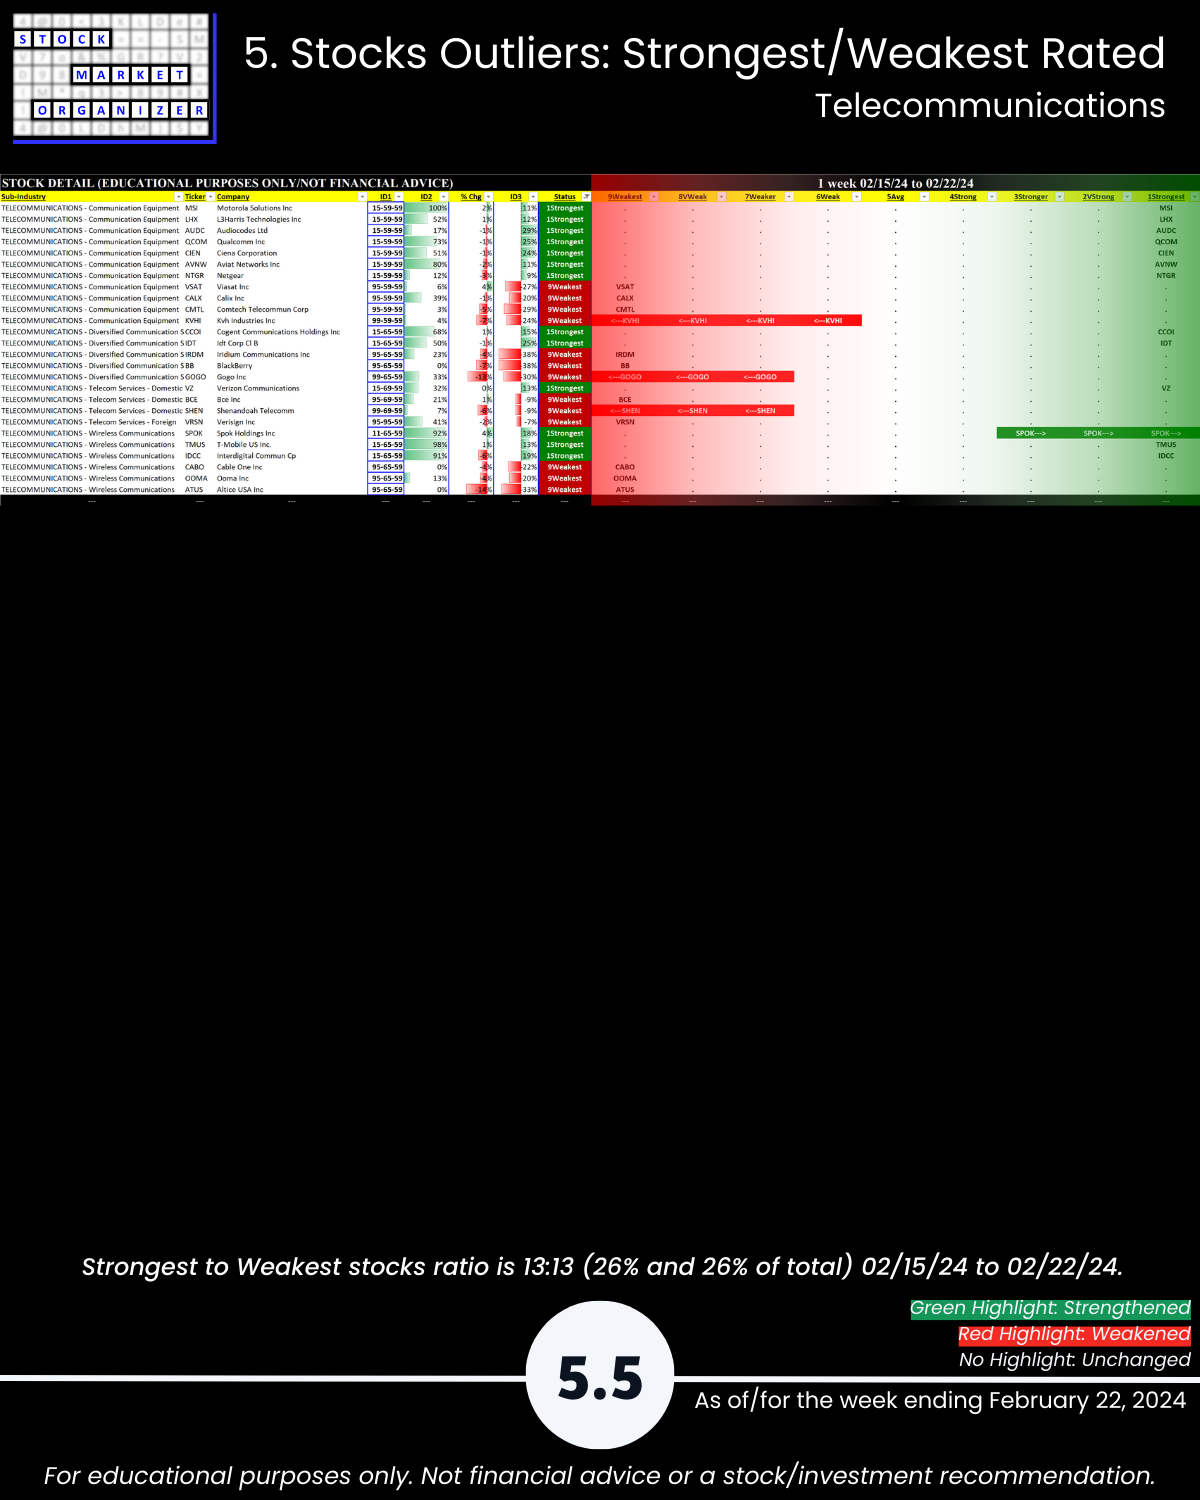
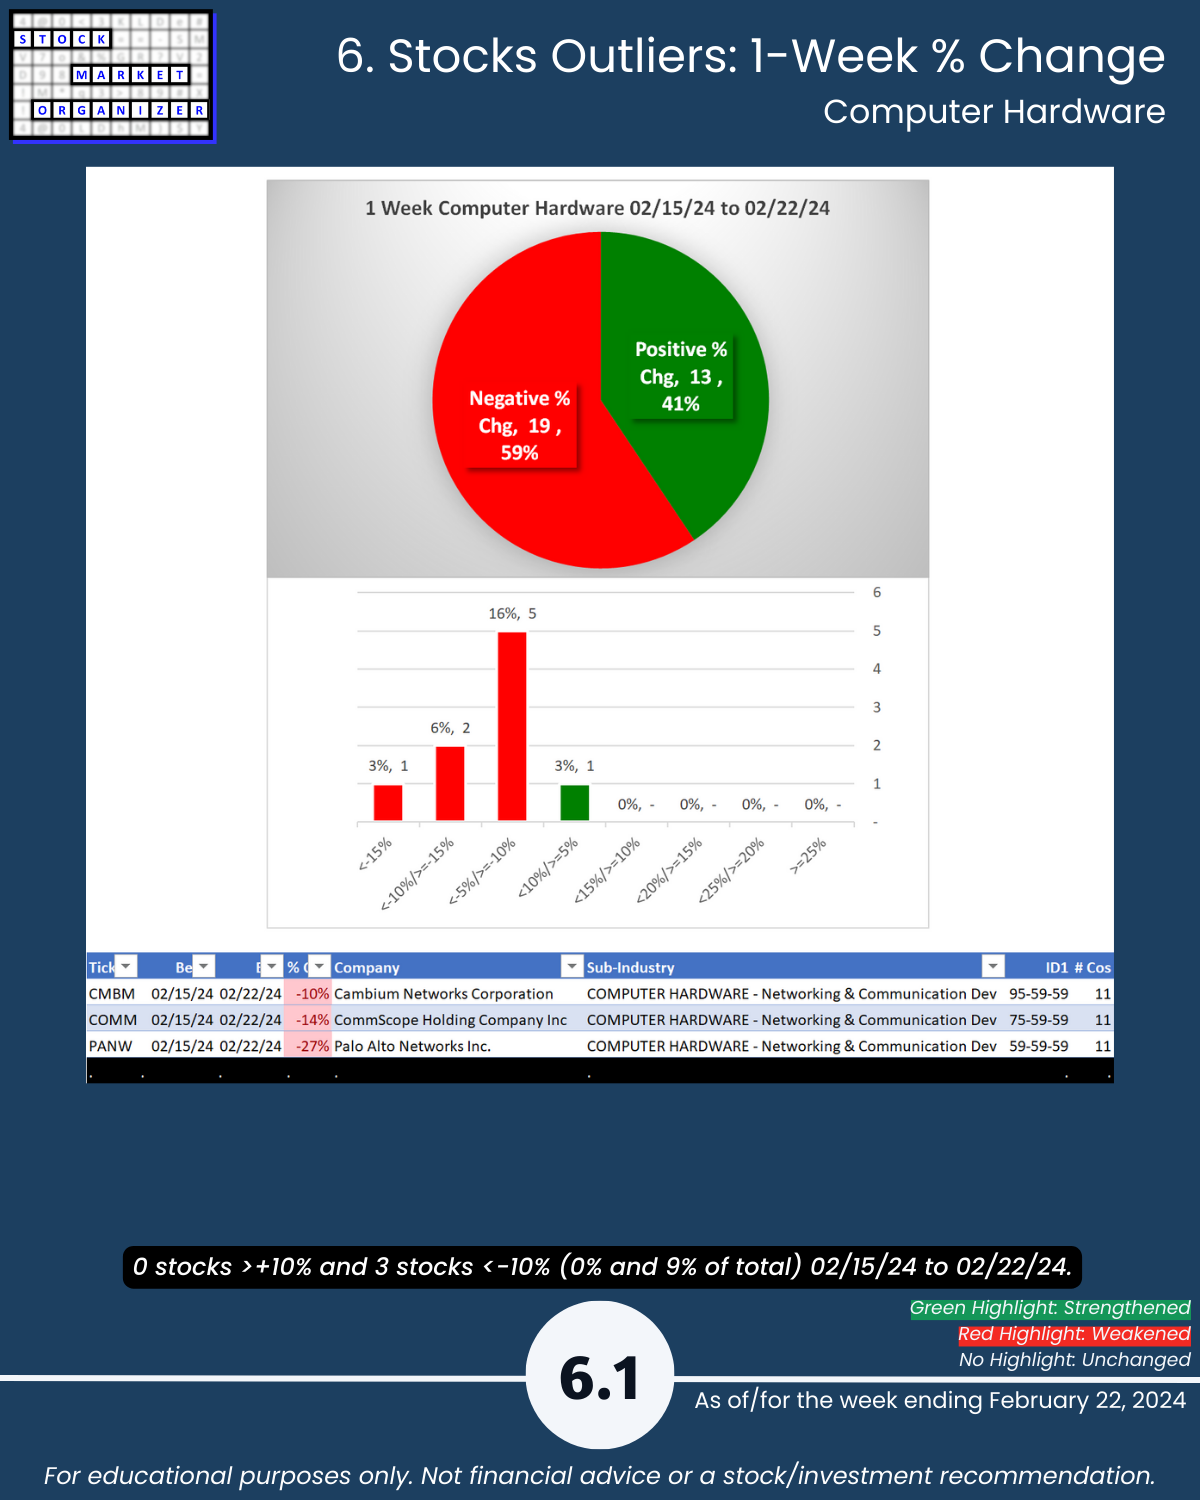
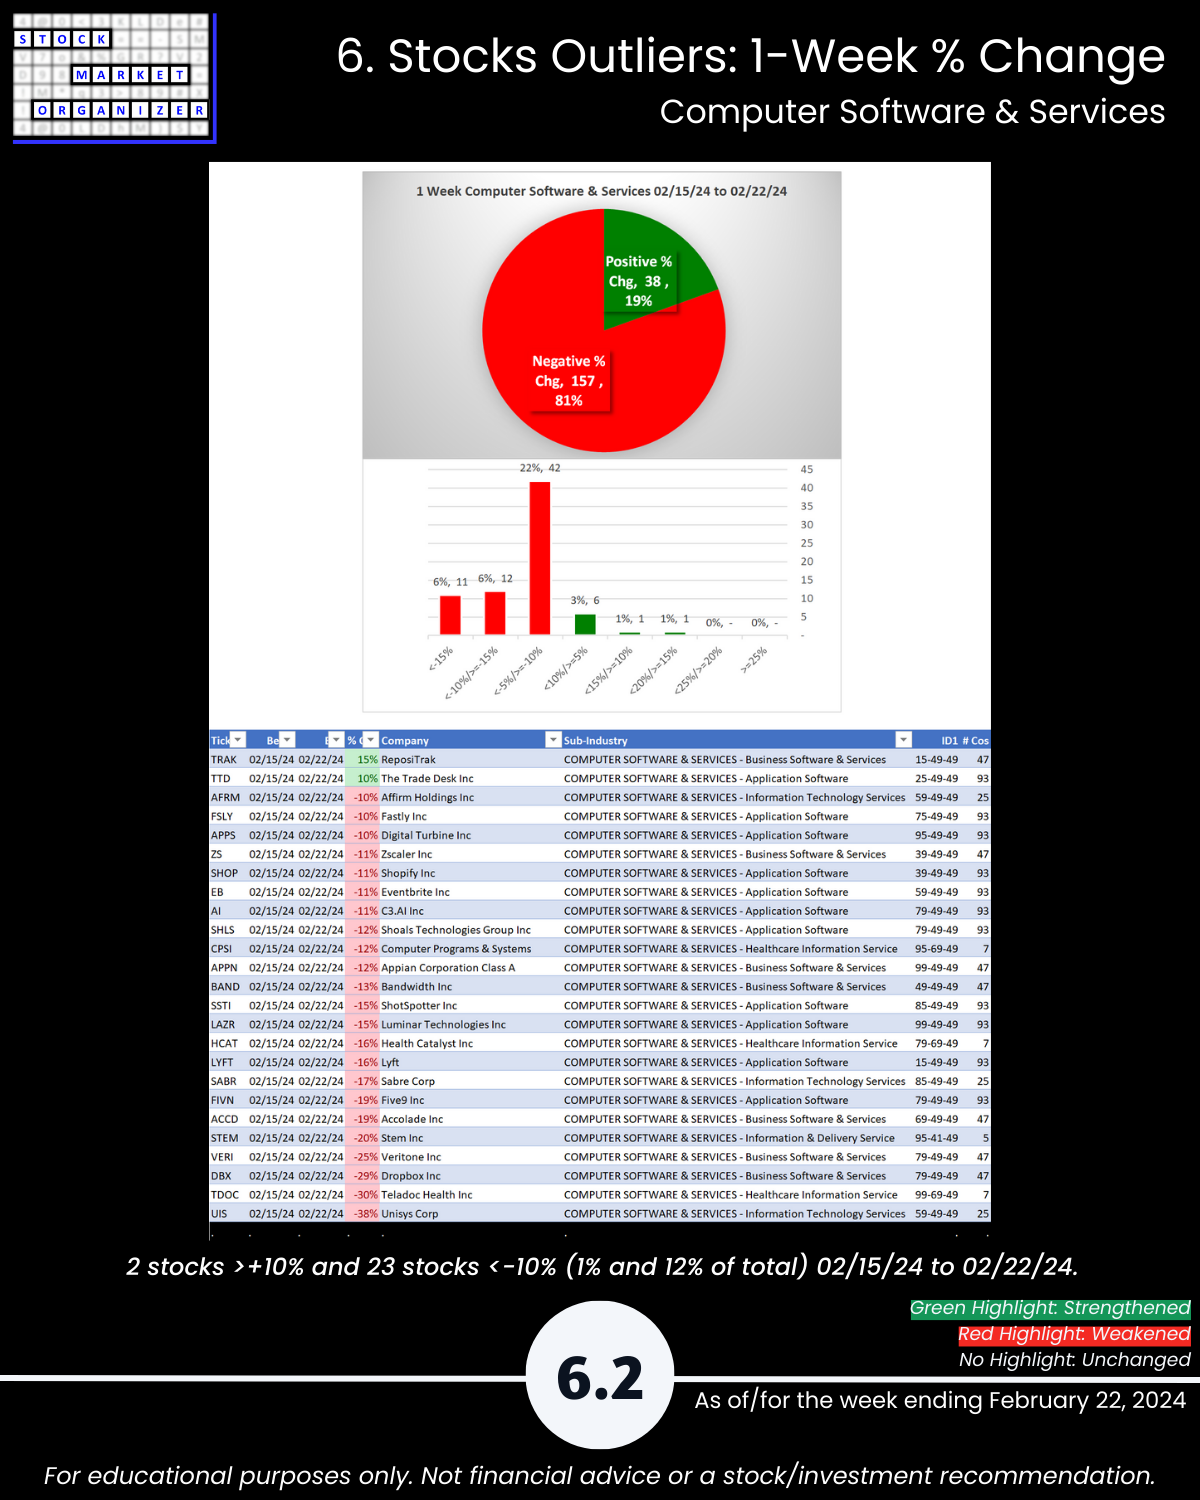
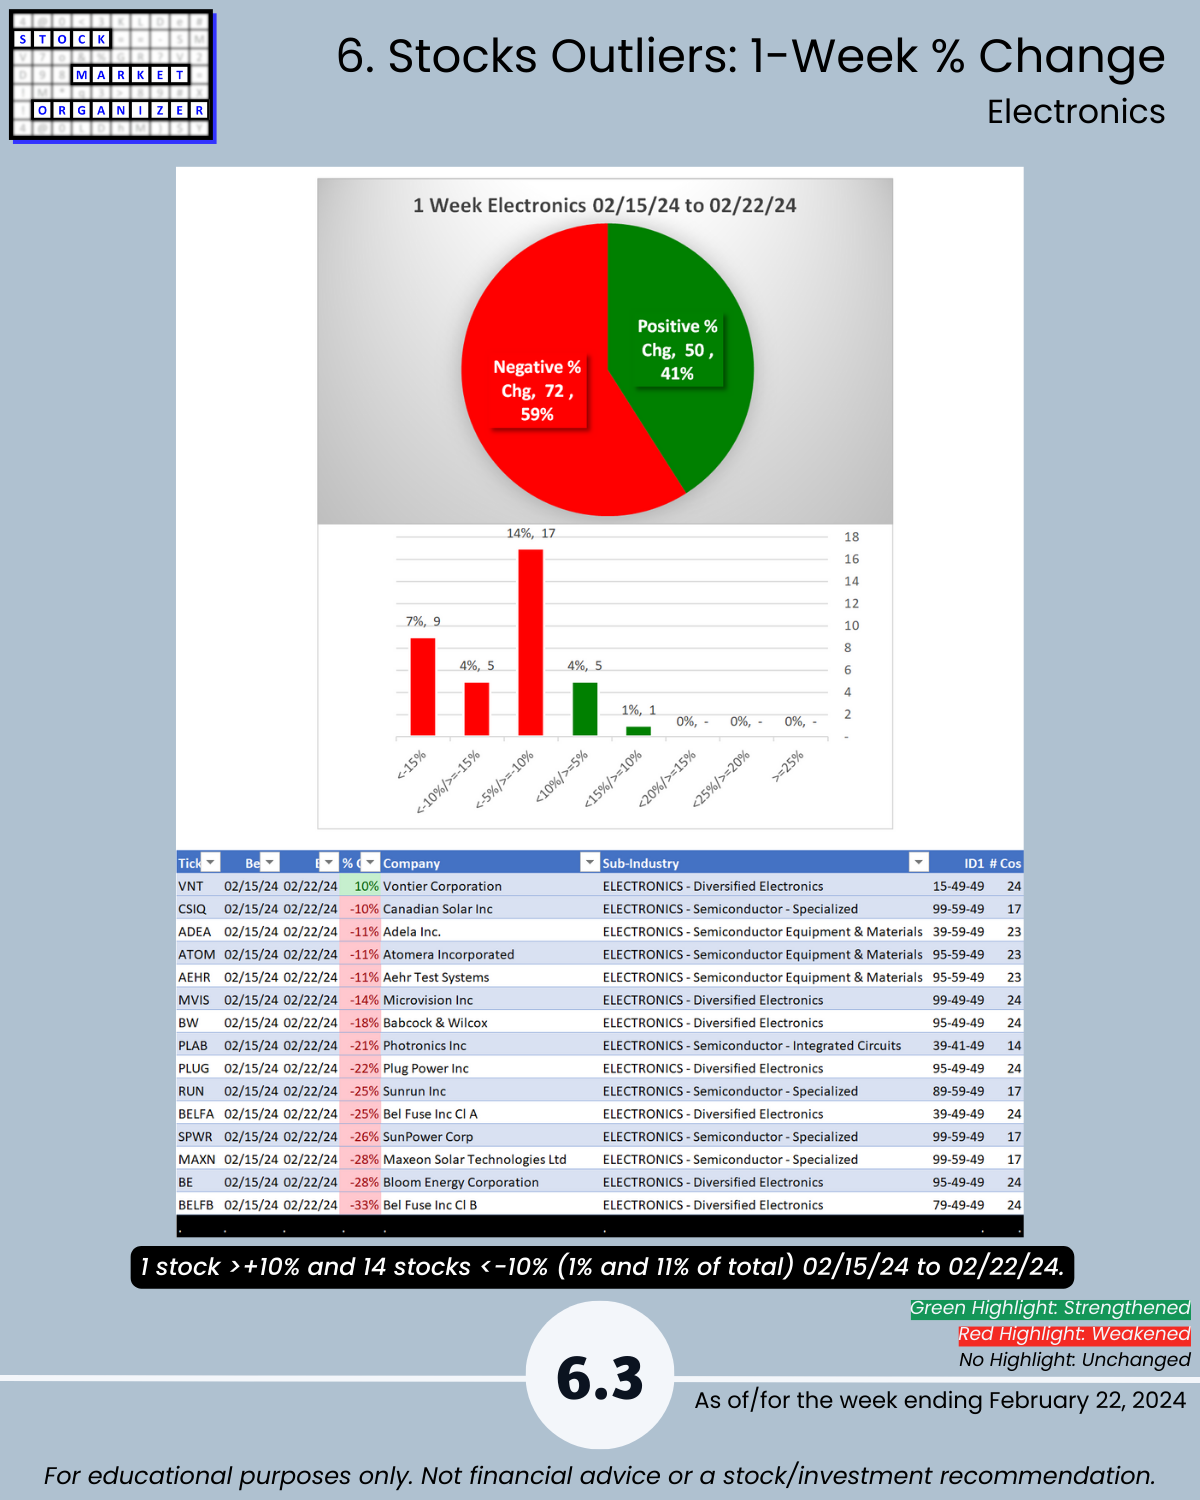
2/22/24 Tech Thursday – forget NVDA, bet you didn’t know Computer Software/Services struggled this week with 81% negative stocks and 12% of its 195 stocks falling more than 10%. Is this problematic? Who knows? But now you know. Conversely, Electronics has 14% of its stocks at 5+ year highs.
About NVDA: $2 trillion market cap / $61 billion FY24 revenue = 33x Revenues.
Not an exact comparison, but… Scott McNeely, Sun Microsystems 2002: “…two years ago we were selling at 10 times revenues when we were at $64. At 10 times revenues, to give you a 10-year payback, I have to pay you 100% of revenues for 10 straight years in dividends. That assumes I can get that by my shareholders. That assumes I have zero cost of goods sold, which is very hard for a computer company. That assumes zero expenses, which is really hard with 39,000 employees. That assumes I pay no taxes, which is very hard. And that assumes you pay no taxes on your dividends, which is kind of illegal. And that assumes with zero R&D for the next 10 years, I can maintain the current revenue run rate. Now, having done that, would any of you like to buy my stock at $64? Do you realize how ridiculous those basic assumptions are? You don't need any transparency. You don't need any footnotes.”
Takeaways:
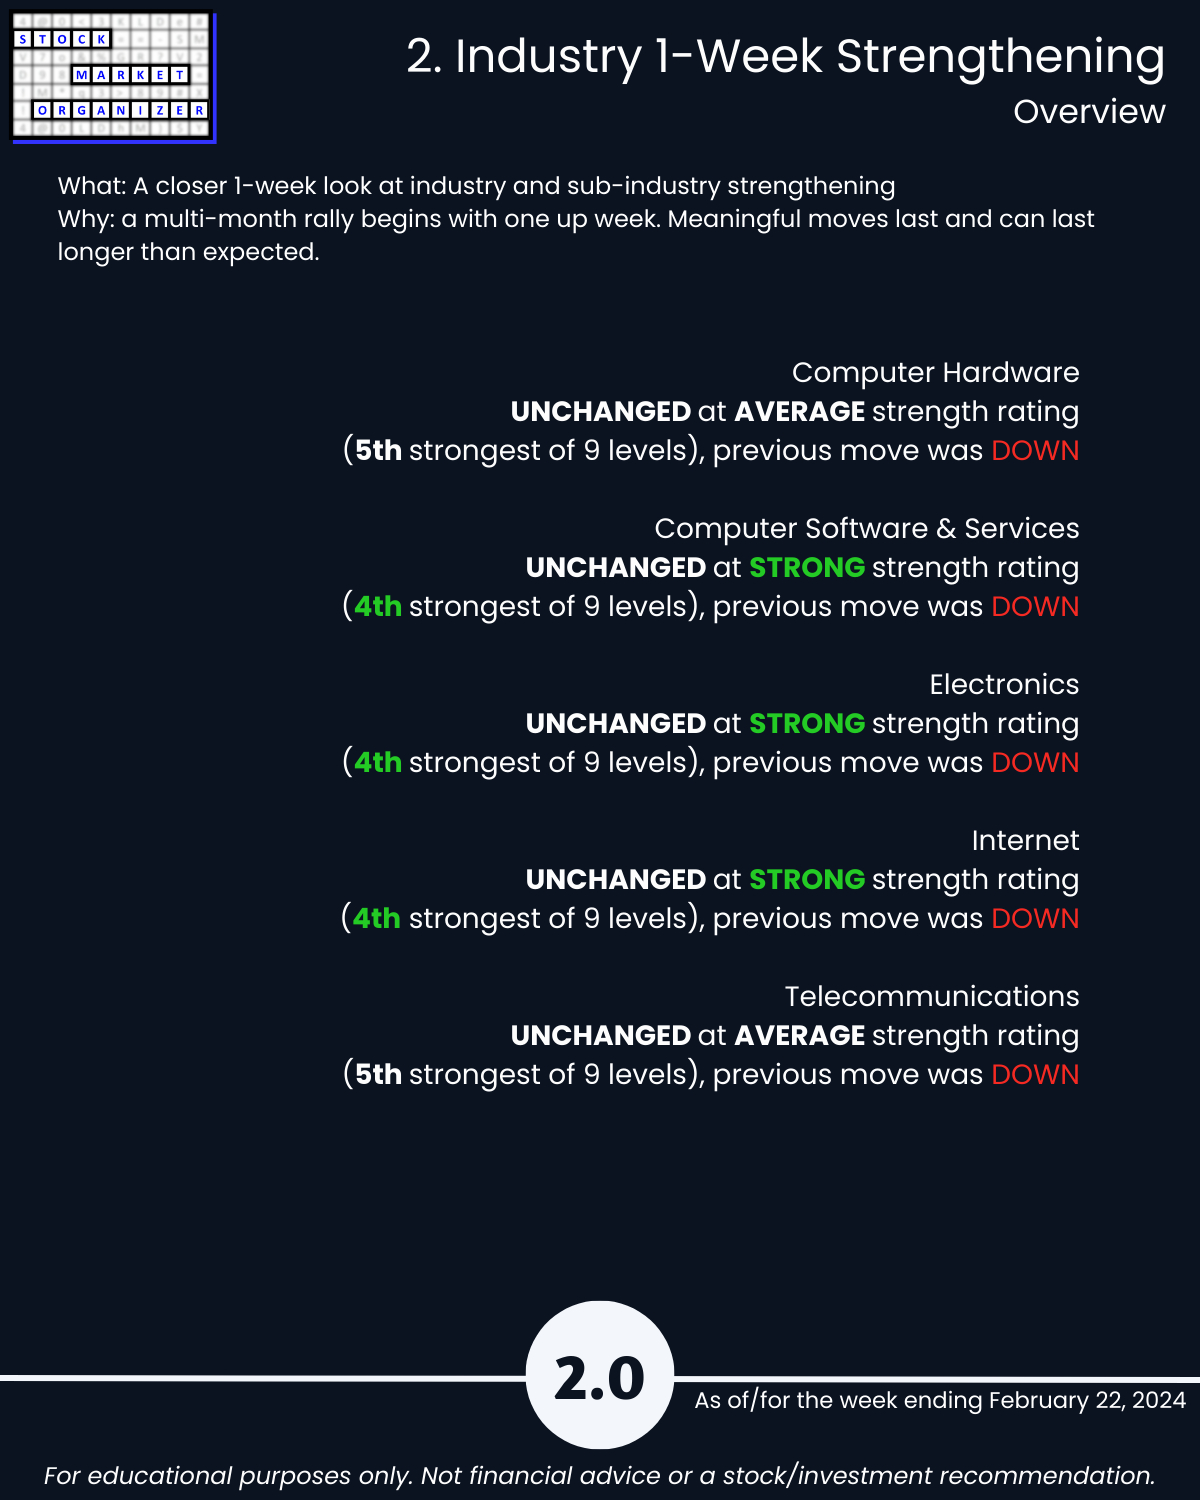
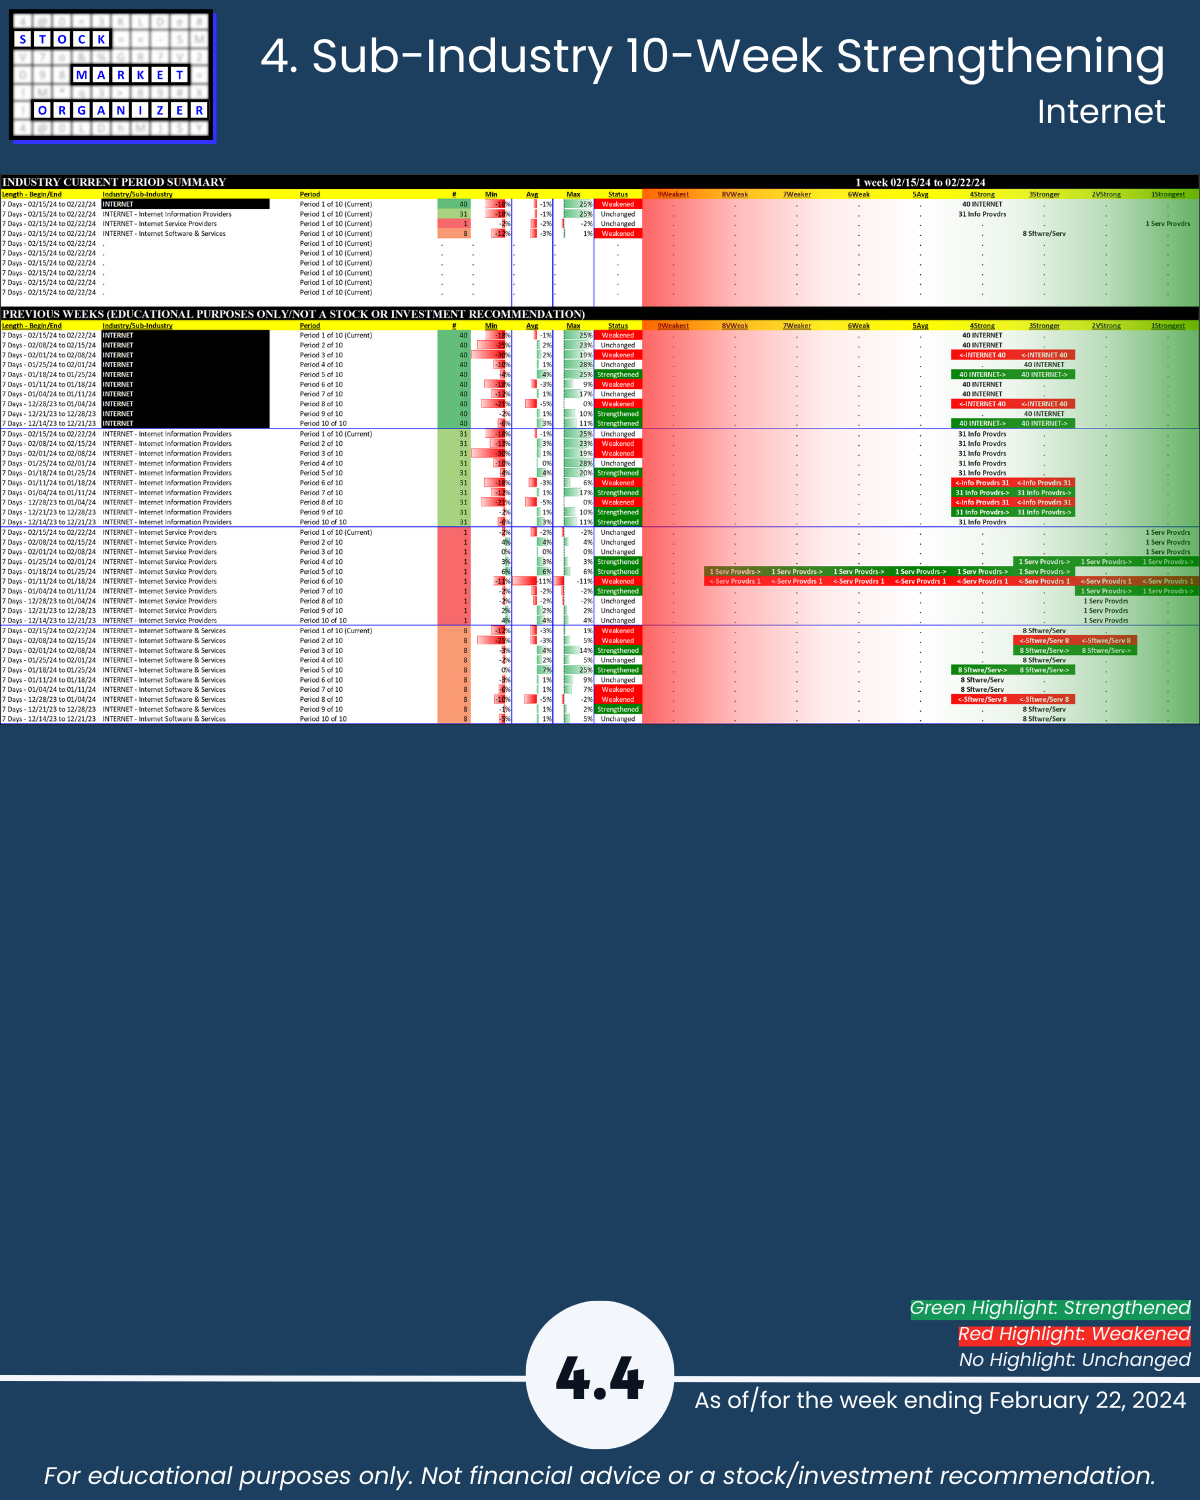
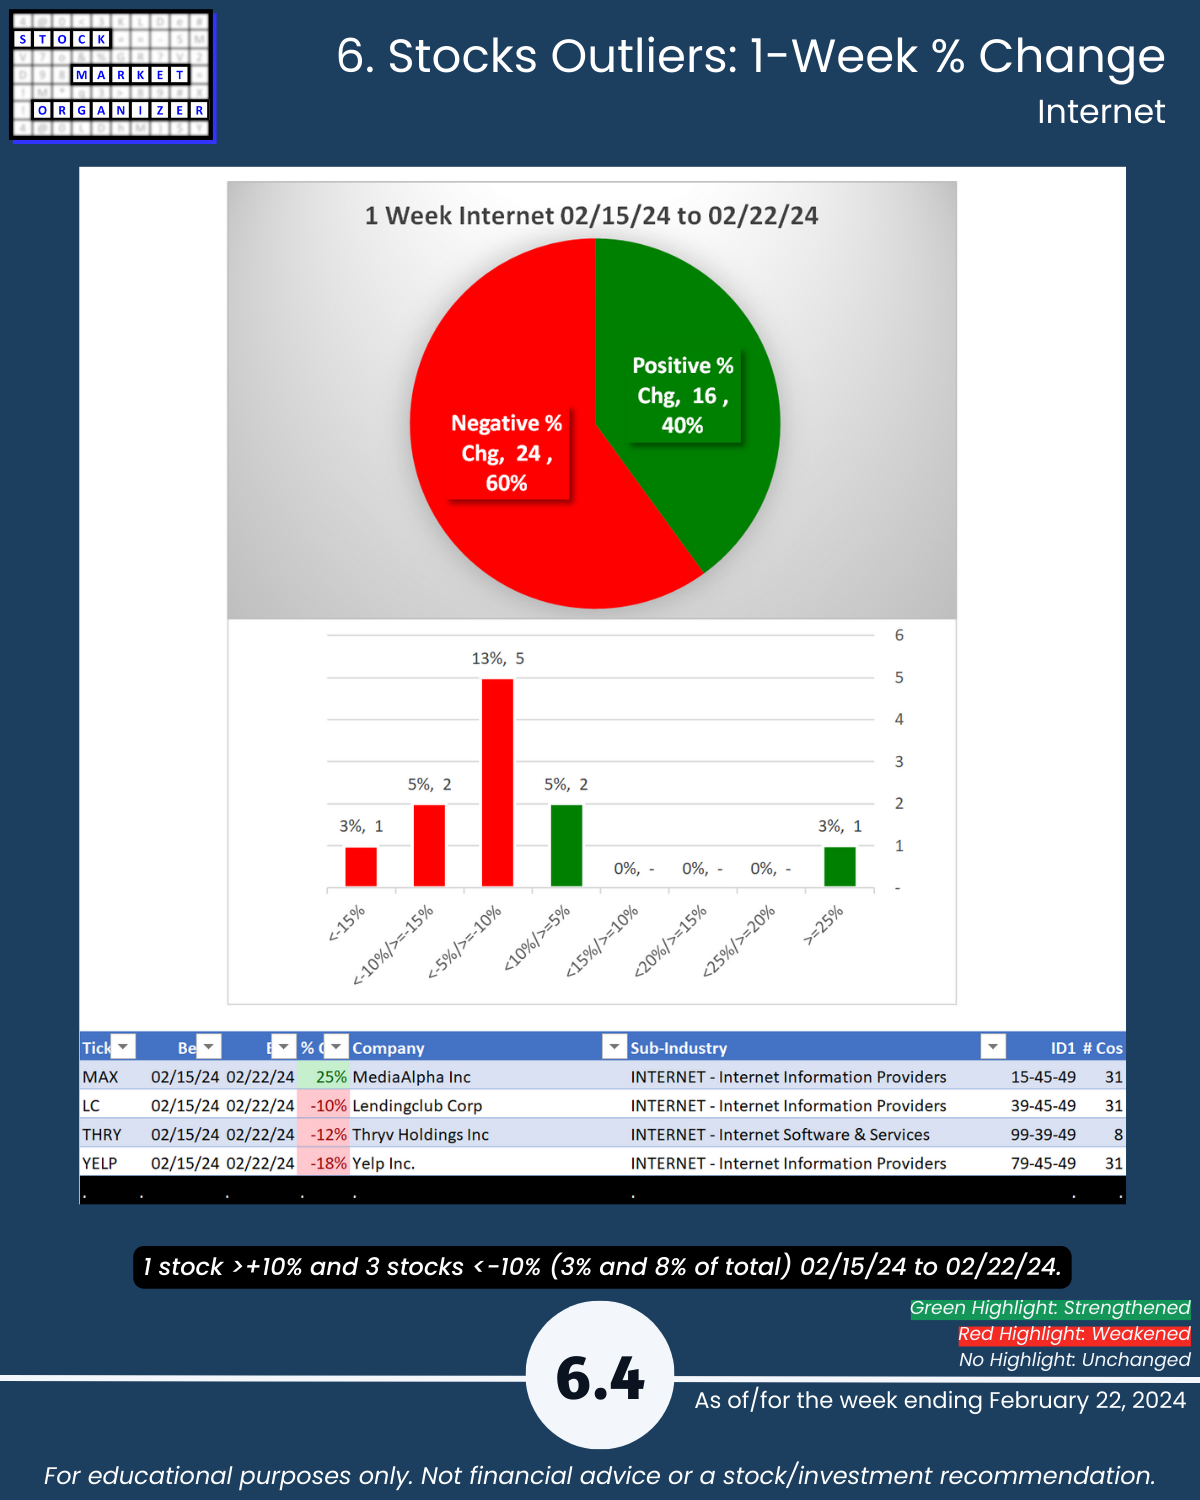
🔹 Strongest Industries: Computer Software/Serv (81% stocks negative this week), Electronics, Internet (Strong, 4th strongest of 9 levels)
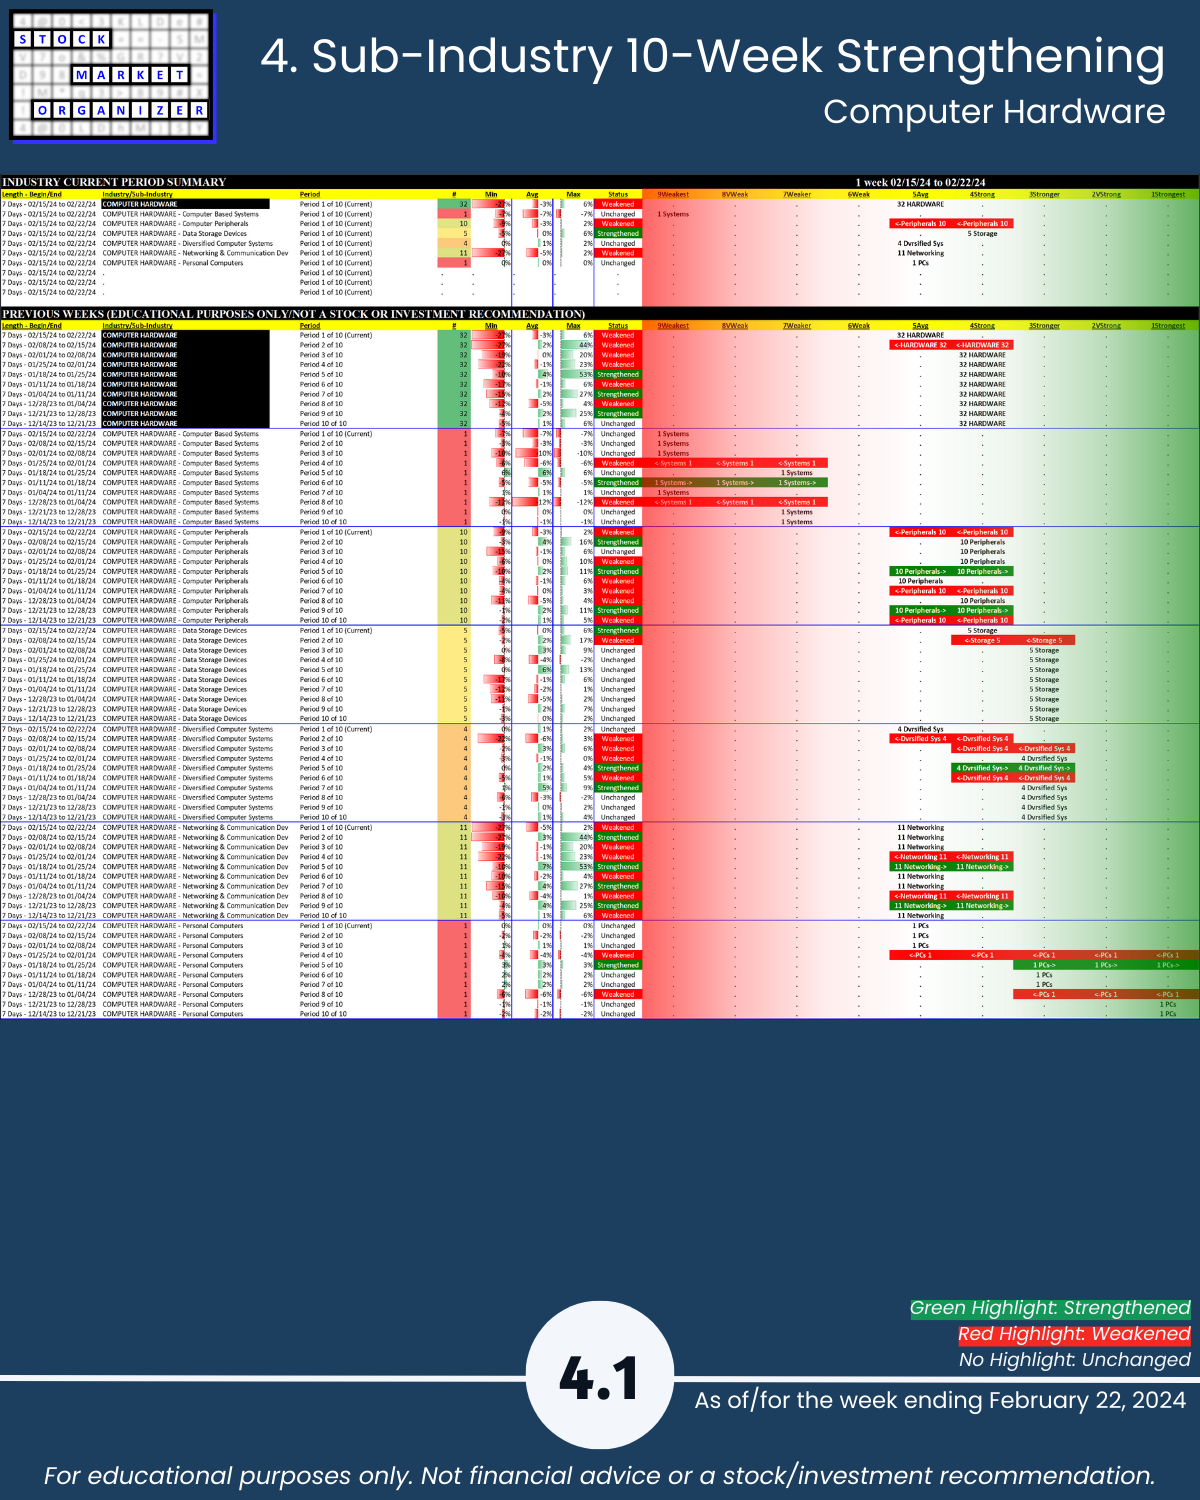
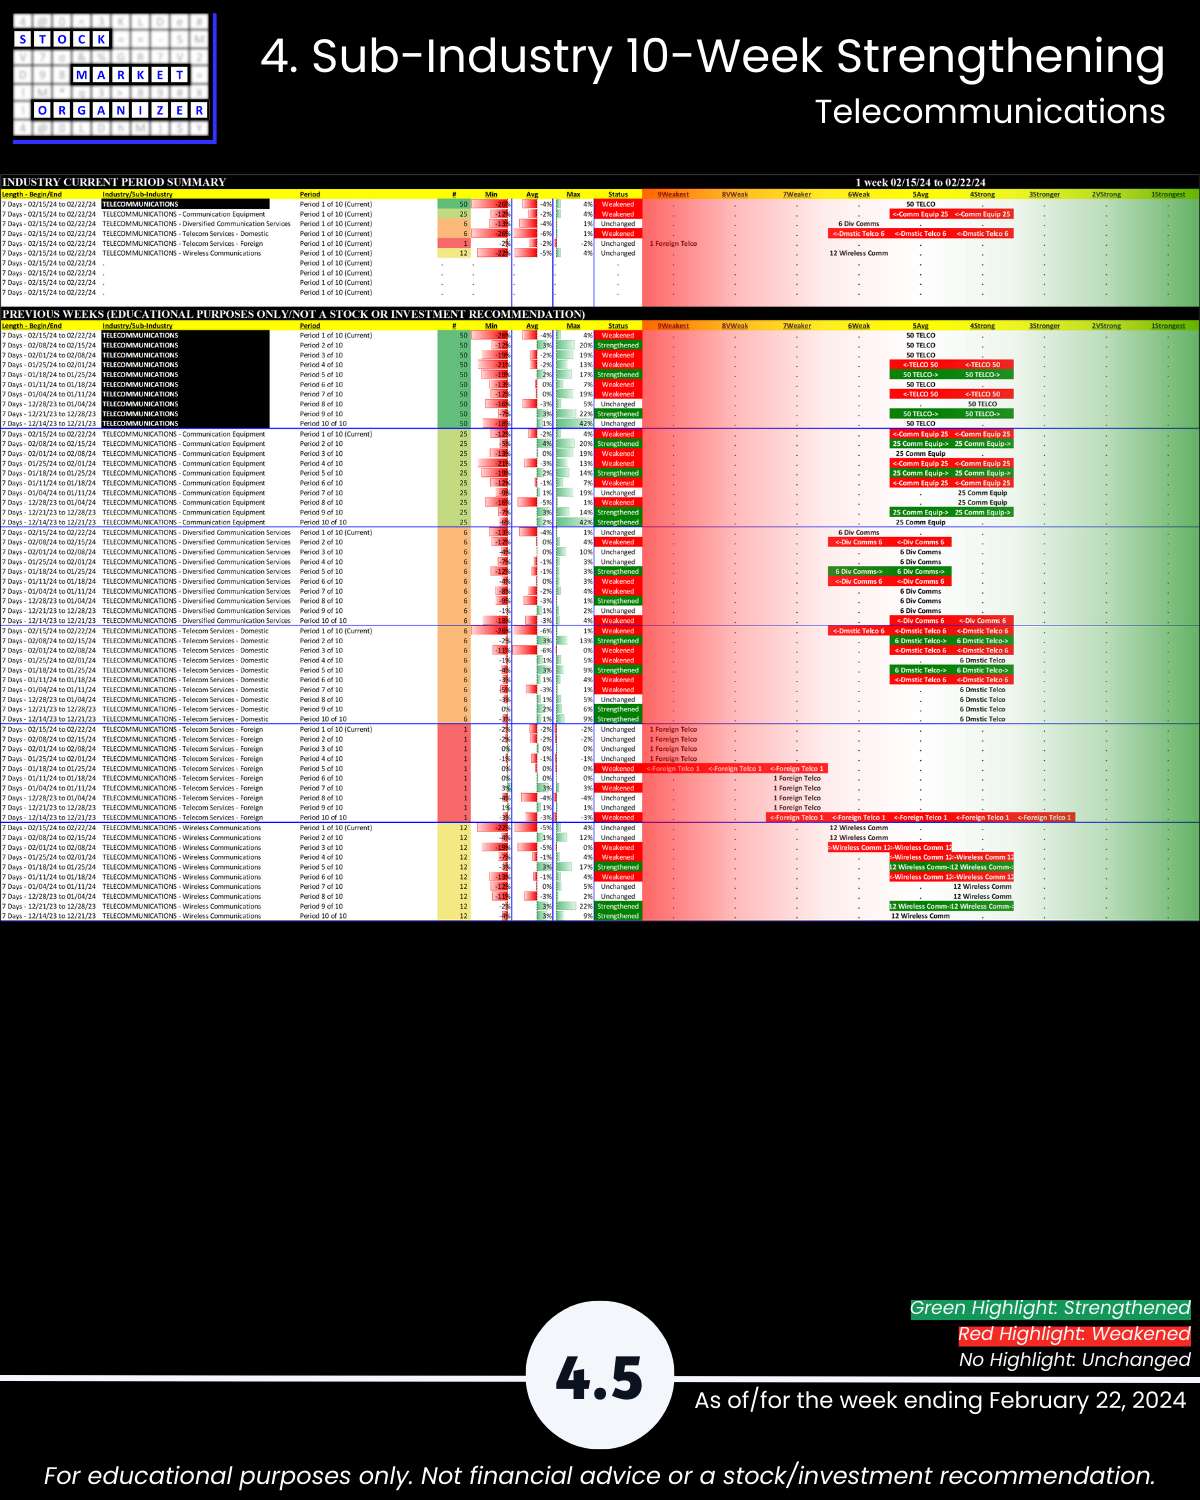
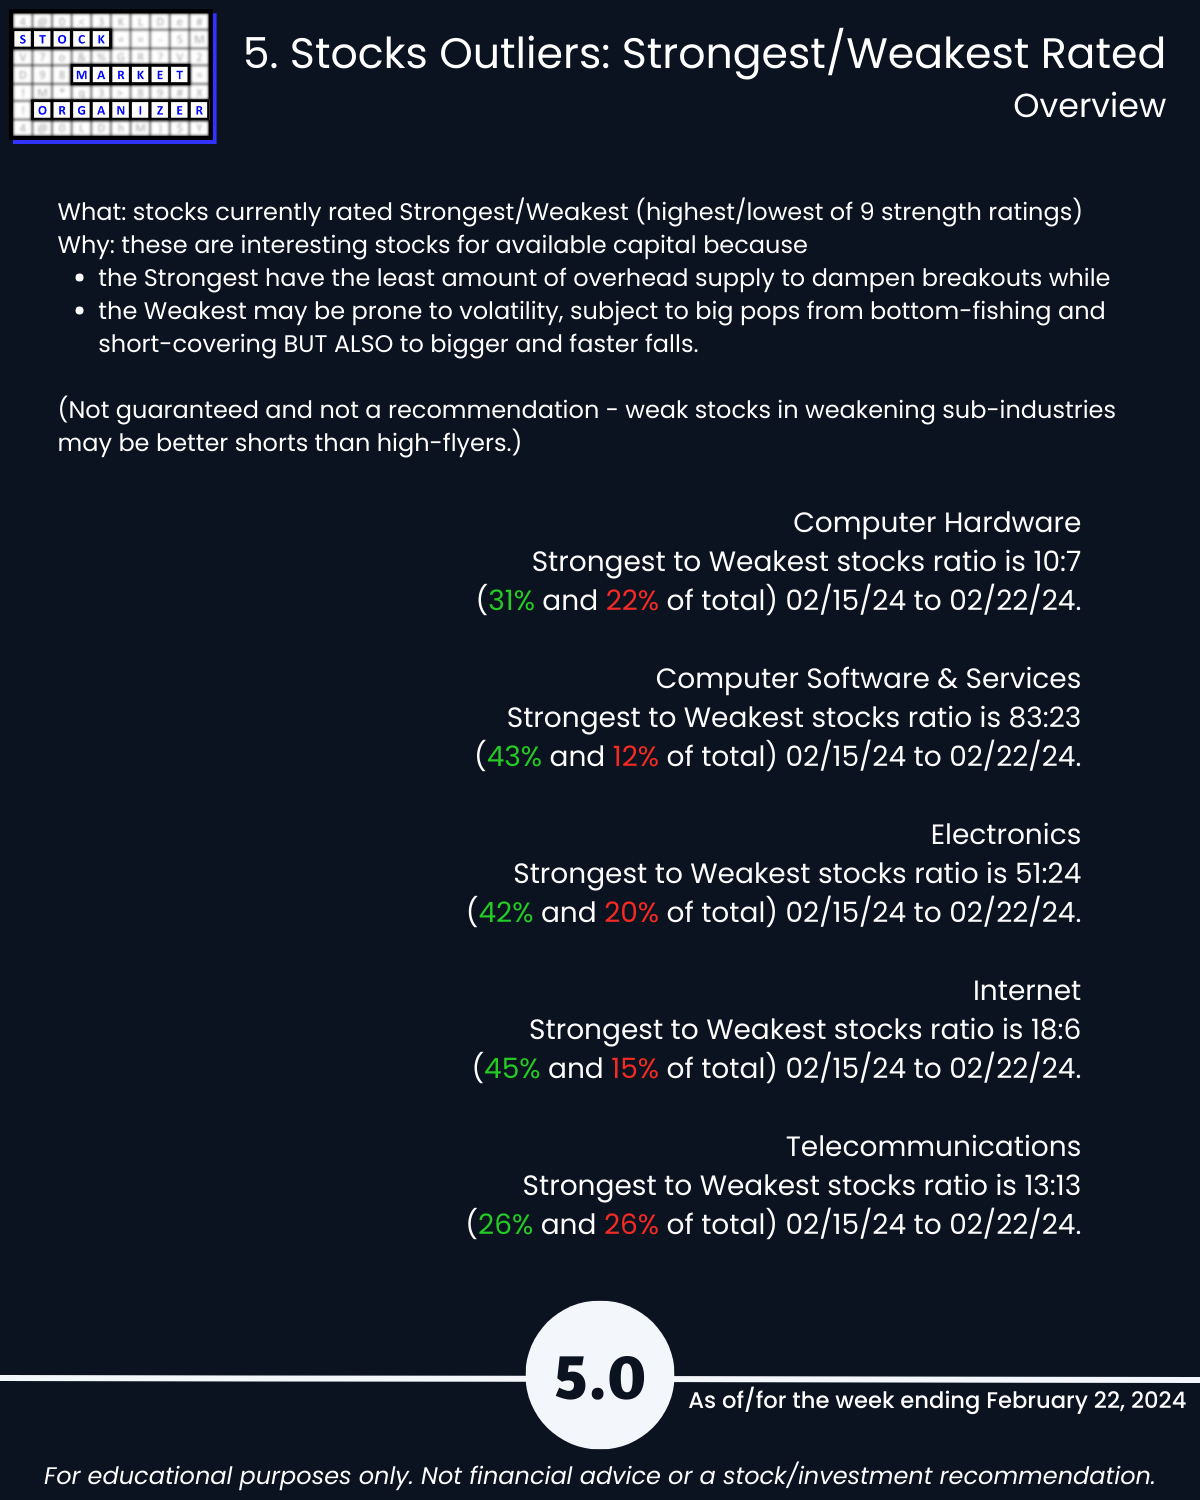
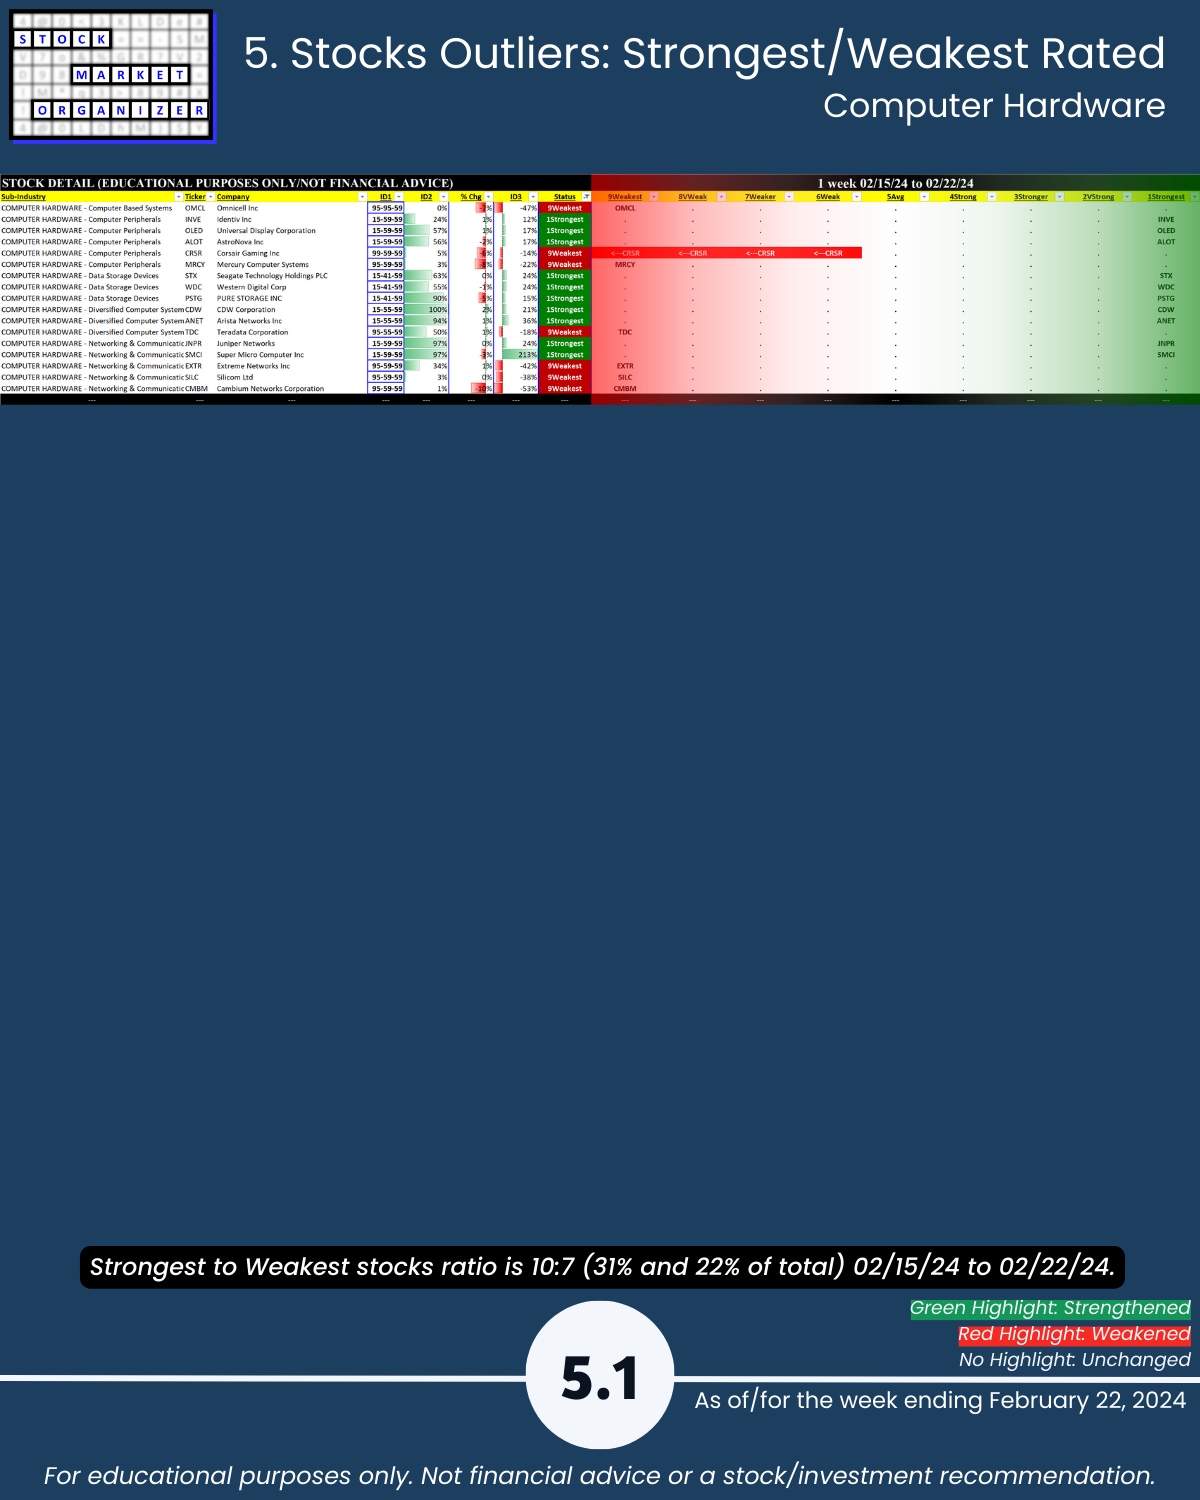
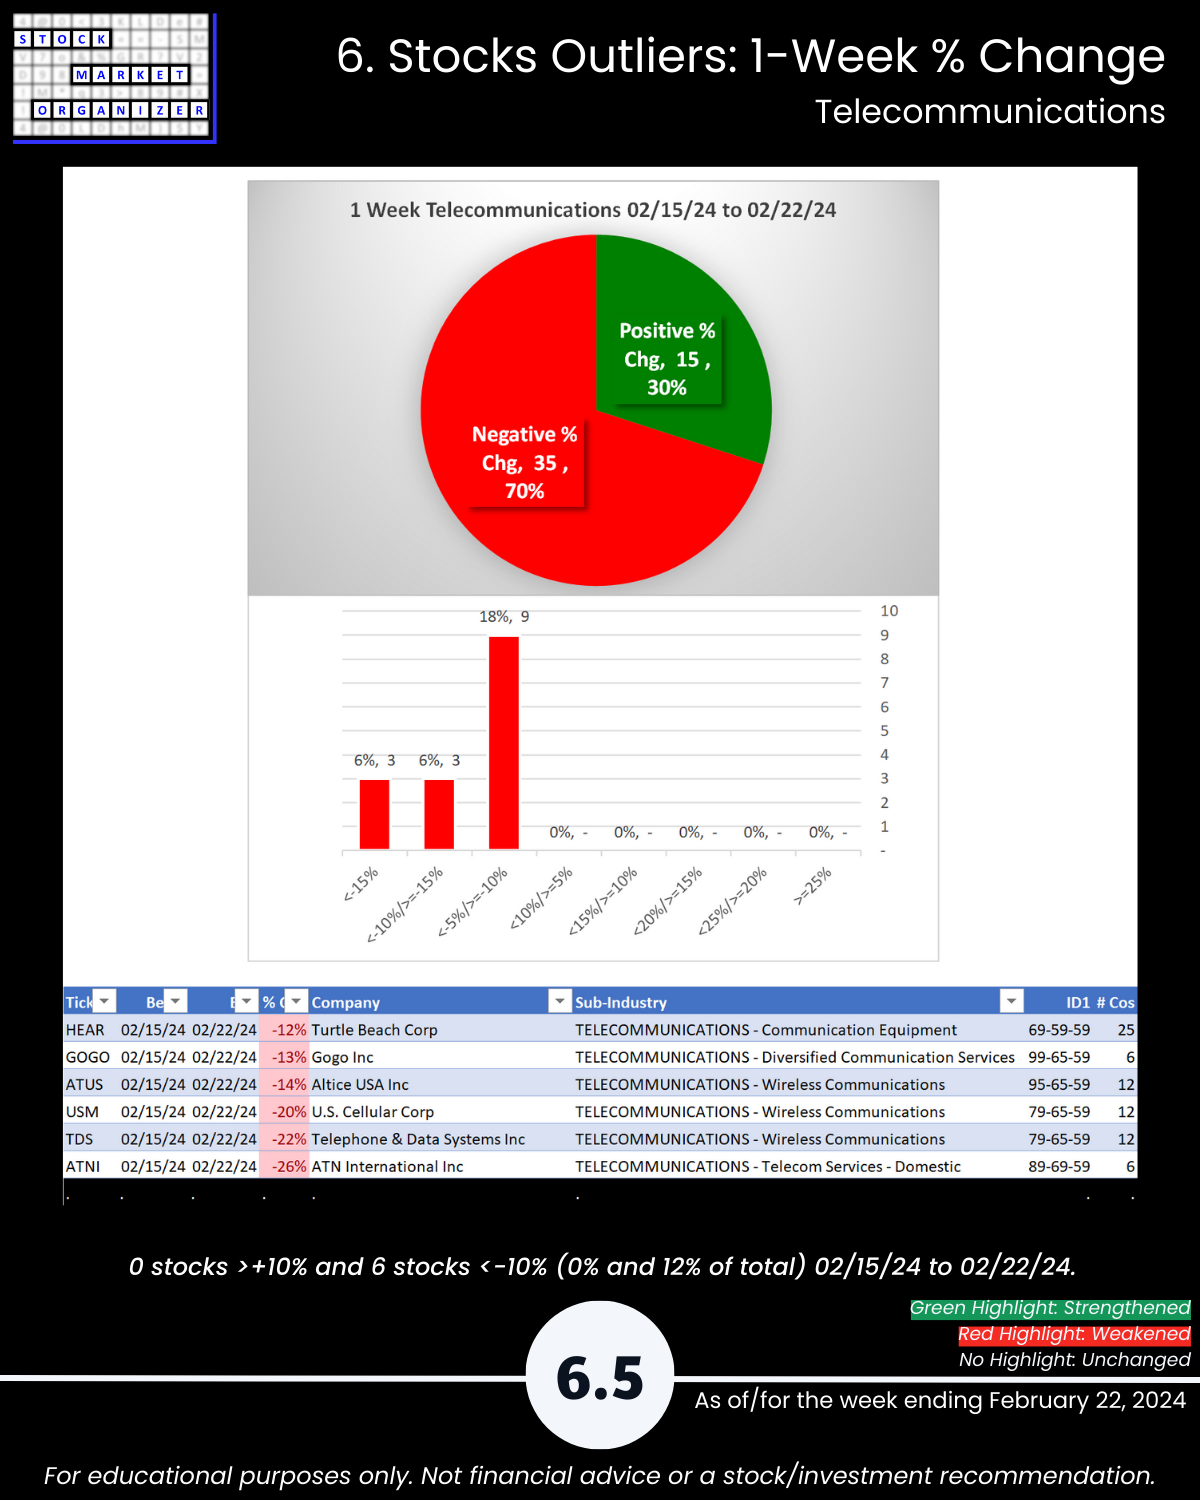
🔹 Weakest Industries: Computer Hardware, Telecommunications (70% negative) (Average, 5th strongest)
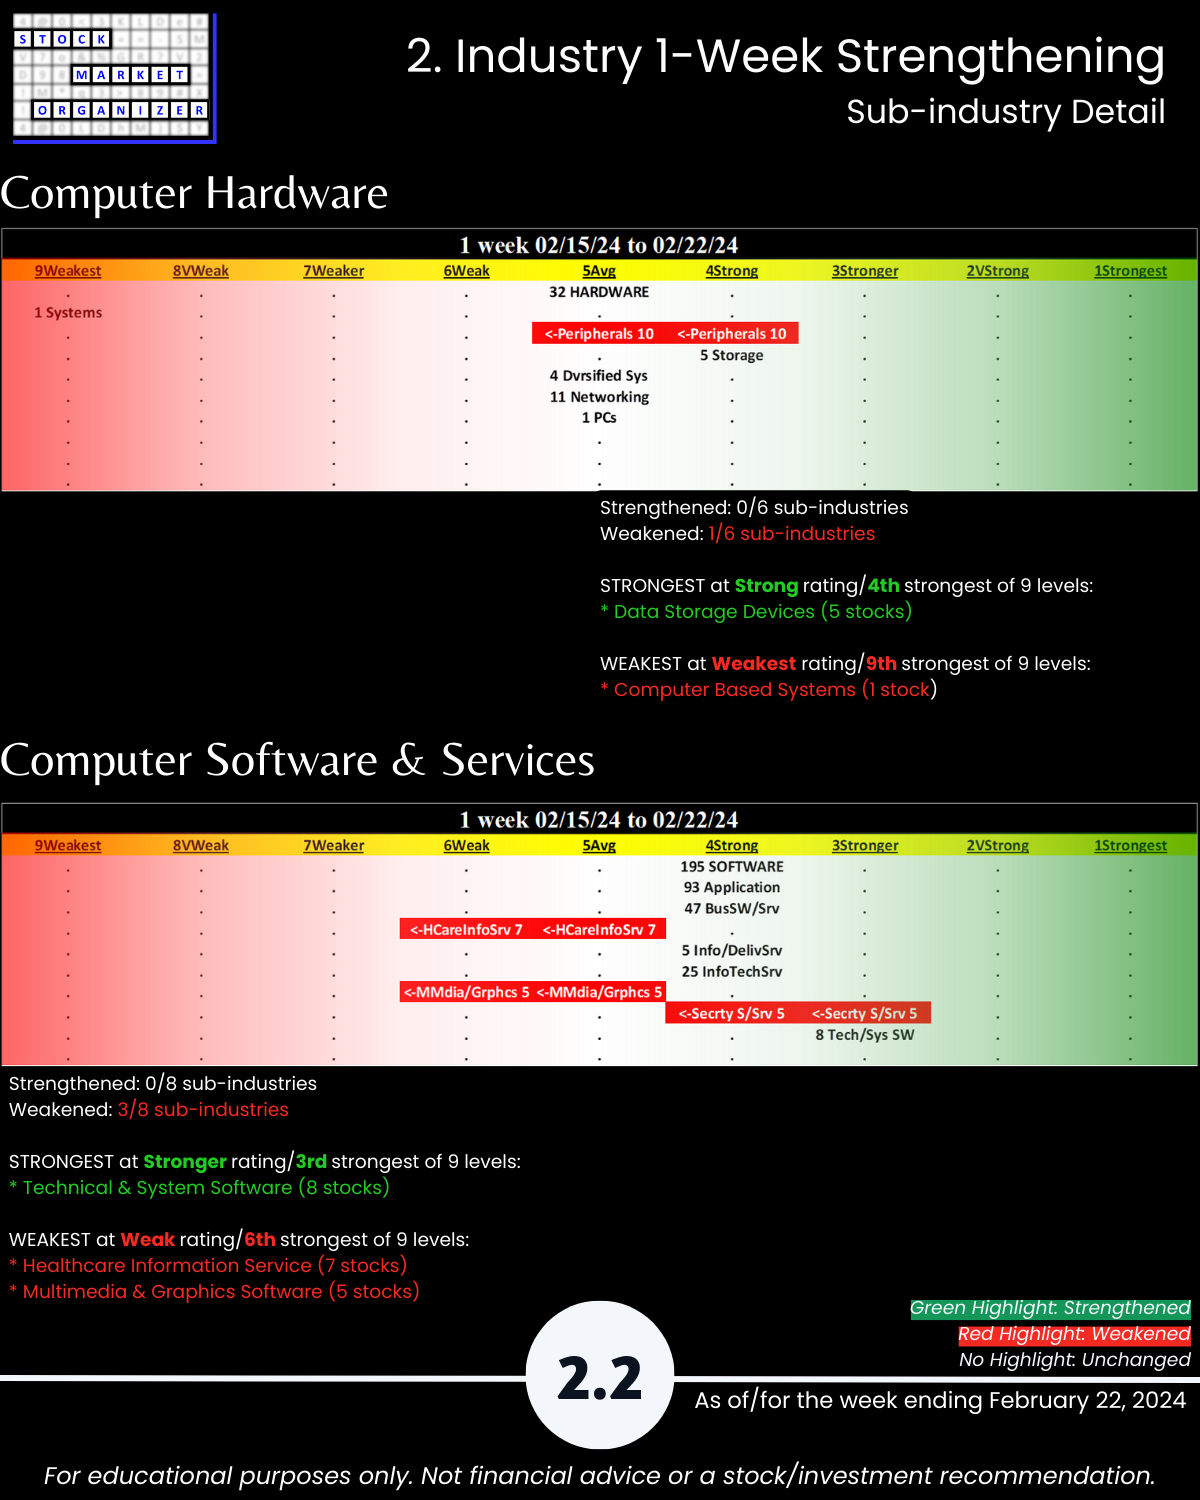
🔹 Sub-industries (28): 4% Strengthened, 25% Weakened
🔹 Stocks rated Strongest:Weakest: Computer Software 43%:12% of total, Electronics 42%:20%, Internet 45%:15%
🔹 Outliers: 12% Software, 11% Electronics, 12% Telecommunications stocks fell more than 10%
🔹 5-Year Highs/Lows %: Electronics 14%, Internet 10% at highs, Telecommunications 10% at lows
WHY CARE?
You subscribe to
🔹 The stronger your stocks, the greener your P&L, and
🔹 It doesn’t have to be so complicated.
THIS TELLS YOU:
🔹 The strongest stocks in an industry/sub-industry, proven by their price action to be those which others are favoring.
SO WHAT? See if there are better options than whatever you may currently own.
🔹 Objective strengthening measurements of all stocks in a sub-industry and industry.
SO WHAT? Quickly see the best and worst stocks and ignore the rest.
🔹 If a stock’s sub-industry and industry are currently strengthening.
SO WHAT? Know if the sub-industry and industry currently support new entries, or if you are better off waiting.
🔹 If now is a good time for new long positions based on current market strengthening or weakening.
SO WHAT? Know if the market currently supports new entries, or if you are better off waiting.
HOW?
By tracking strengthening and weakening from the individual stock level up through the market level.
This report may particularly be of interest if the following 5 concepts resonate with you:
- The stronger your stocks, the greener your P&L.
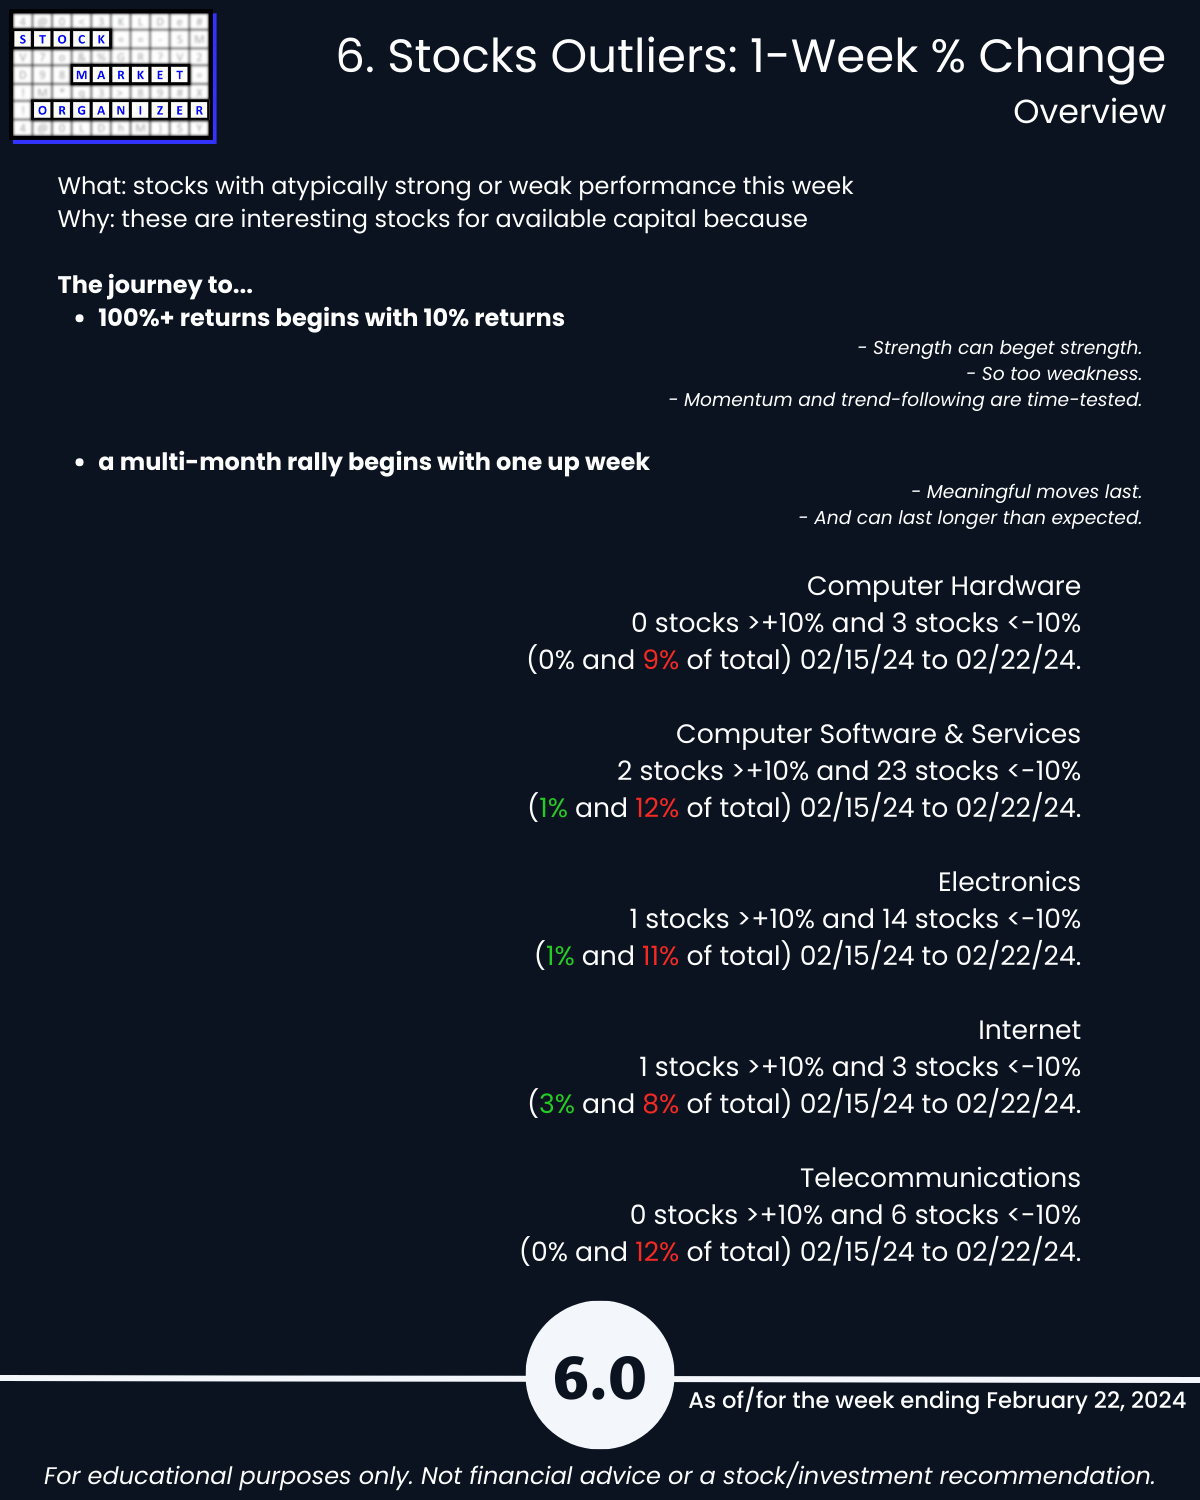
- The journey to 100%+ returns begins with 10% returns.
- The journey to a multi-month rally begins with one up week.
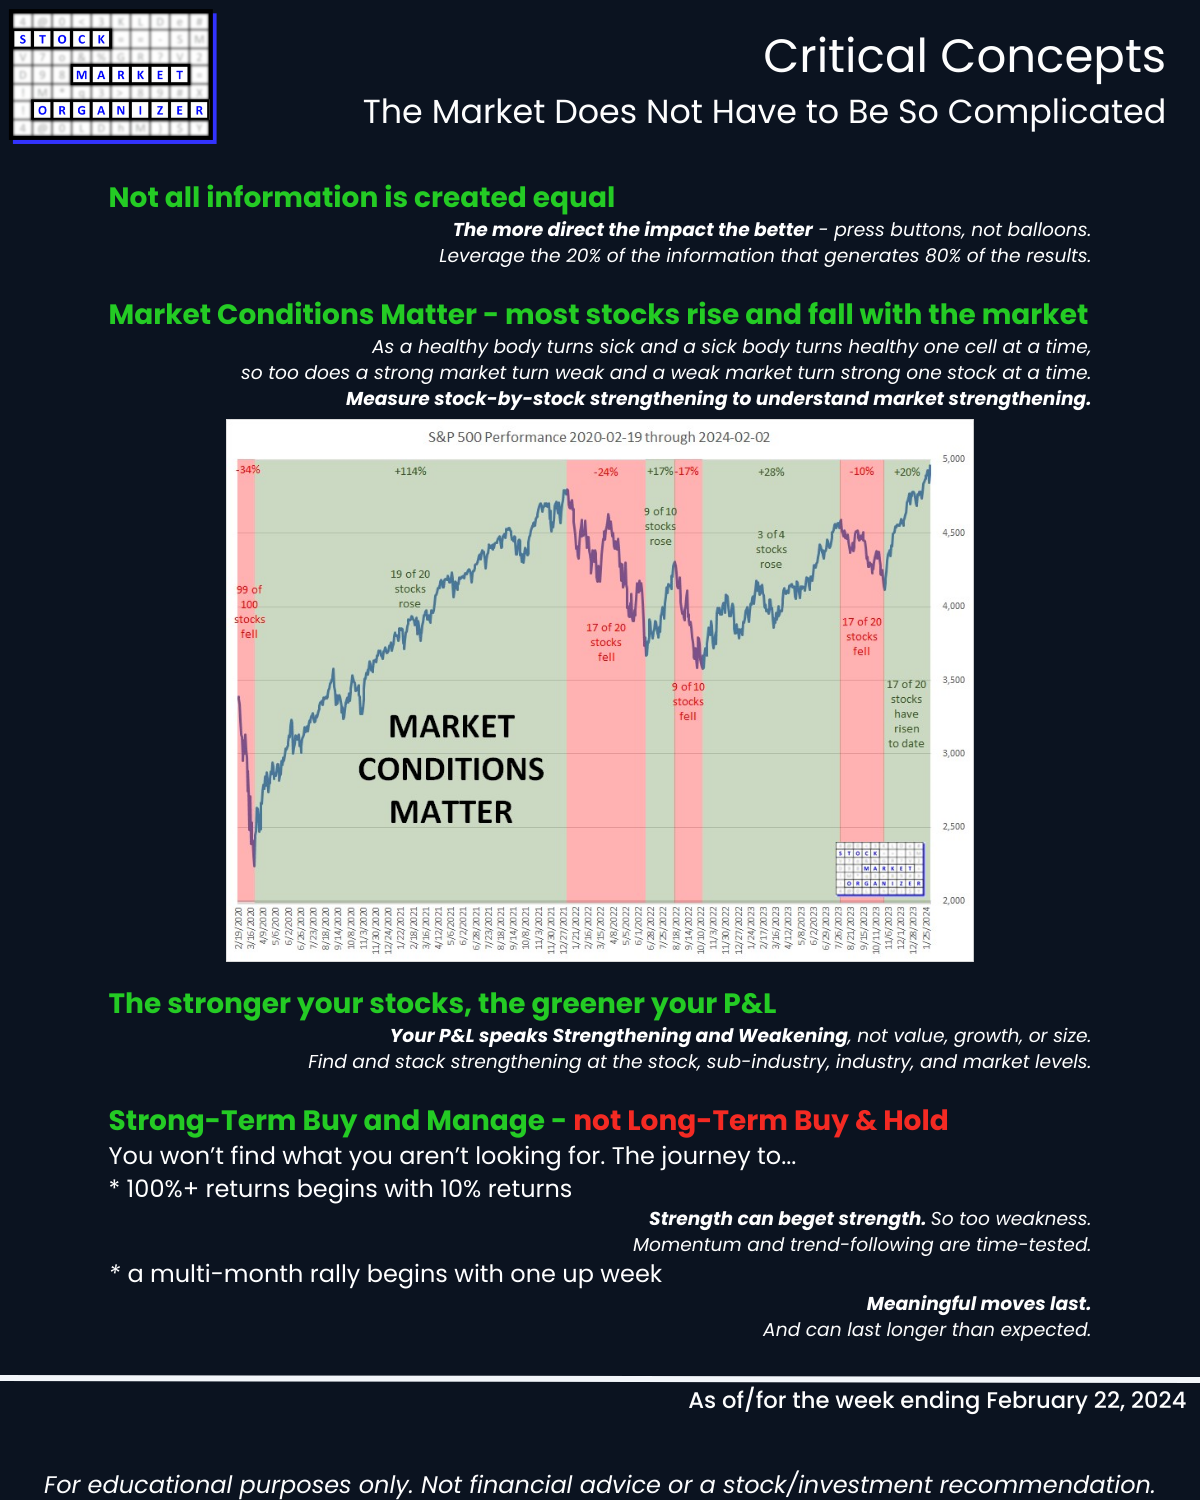
- Most stocks do what the market does. (While the market can only do what its underlying stocks, sub-industries, and industries do.)
- 80/20: not all information is created equal. (Press buttons, not balloons.)
Following are galleries with page-by-page views of this report.
1. Introduction
2. Industry 1-Week Strengthening
3. Industry 10-Week Strengthening
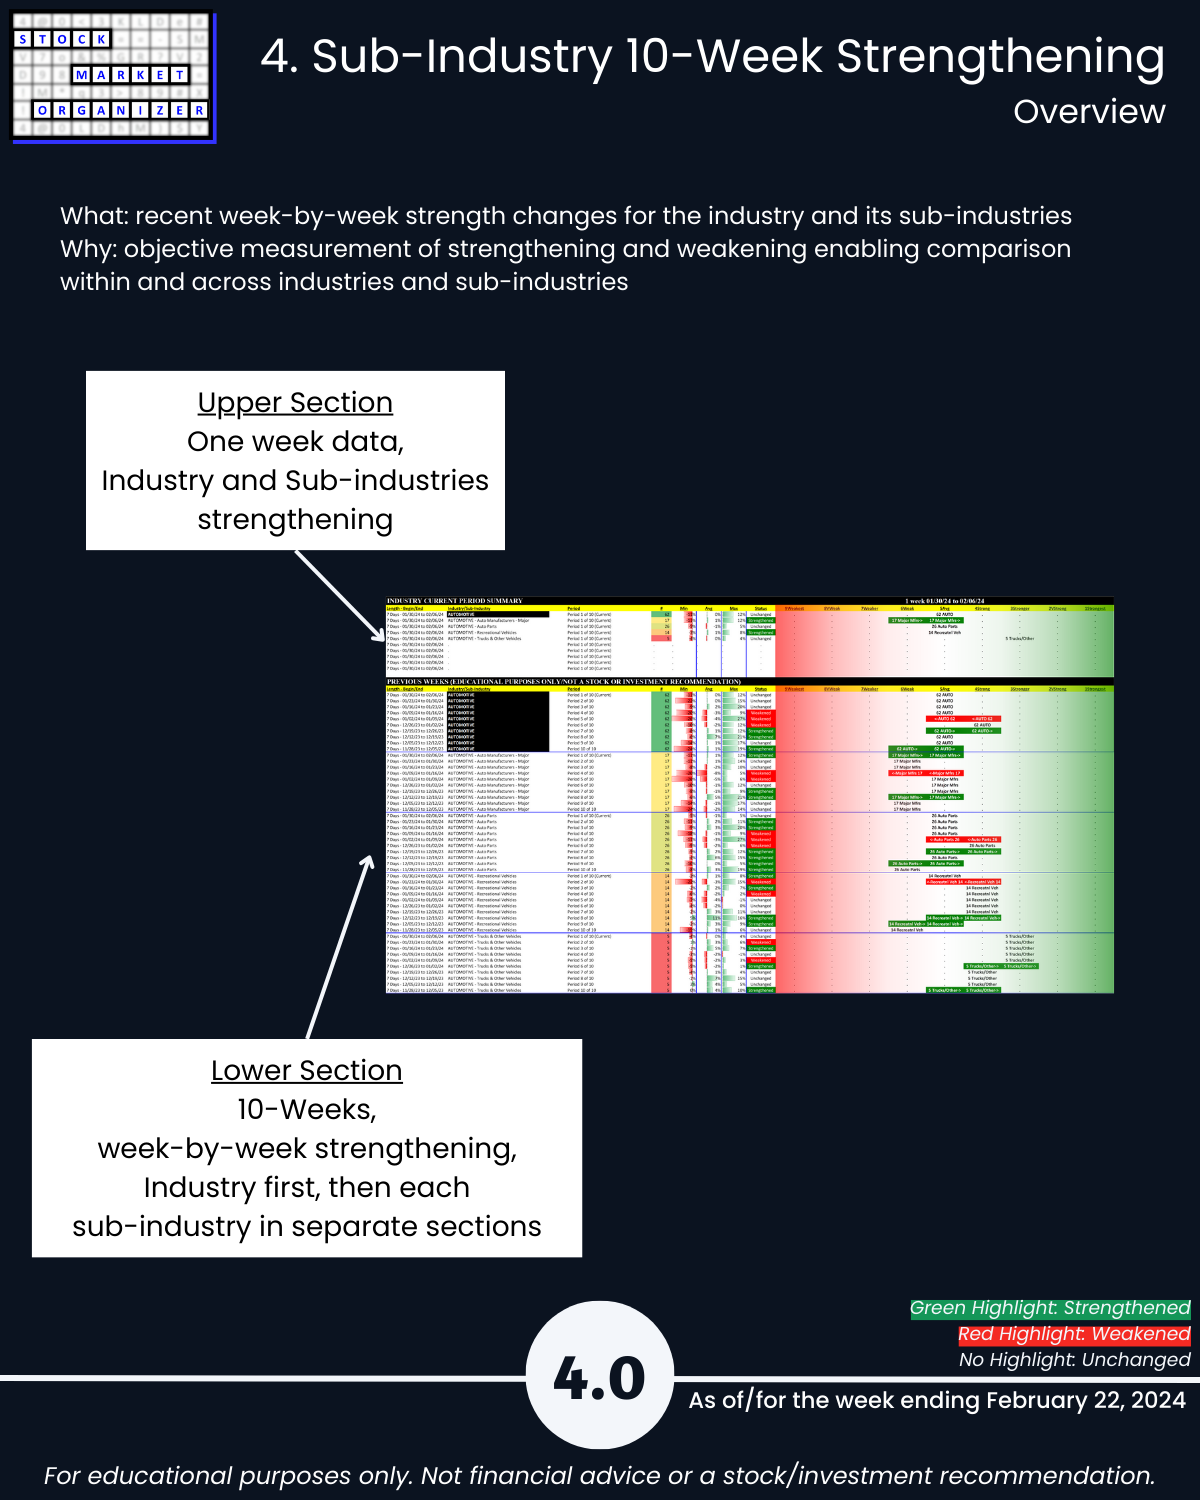
4. Sub-Industry 10-Week Strengthening
5. Stocks Outliers: Strongest/Weakest Rated
6. Stocks Outliers: 1-Week % Change
7. Stocks Outliers: 5-Year Highs/Lows