SMO Exclusive: Strength Report Technology Sector 2024-02-15

2/15/24 Thursday strength report = Tech. SMCI stellar 253% YTD still well behind QCOM 1999 2,667%. LYFT goes from cars to roller-coaster – up/down big Tuesday after-hours (due to a press release typo!) then explodes to a +49% week. AKAM craters HARD on volume from multi-year highs. Attached includes Strongest- and Weakest-rated Stock Market Organizer stocks and objective strengthening/weakening measurements in Computer Hardware, Computer Software & Services, Electronics (Chips/Semis), Internet, and Telecommunications.
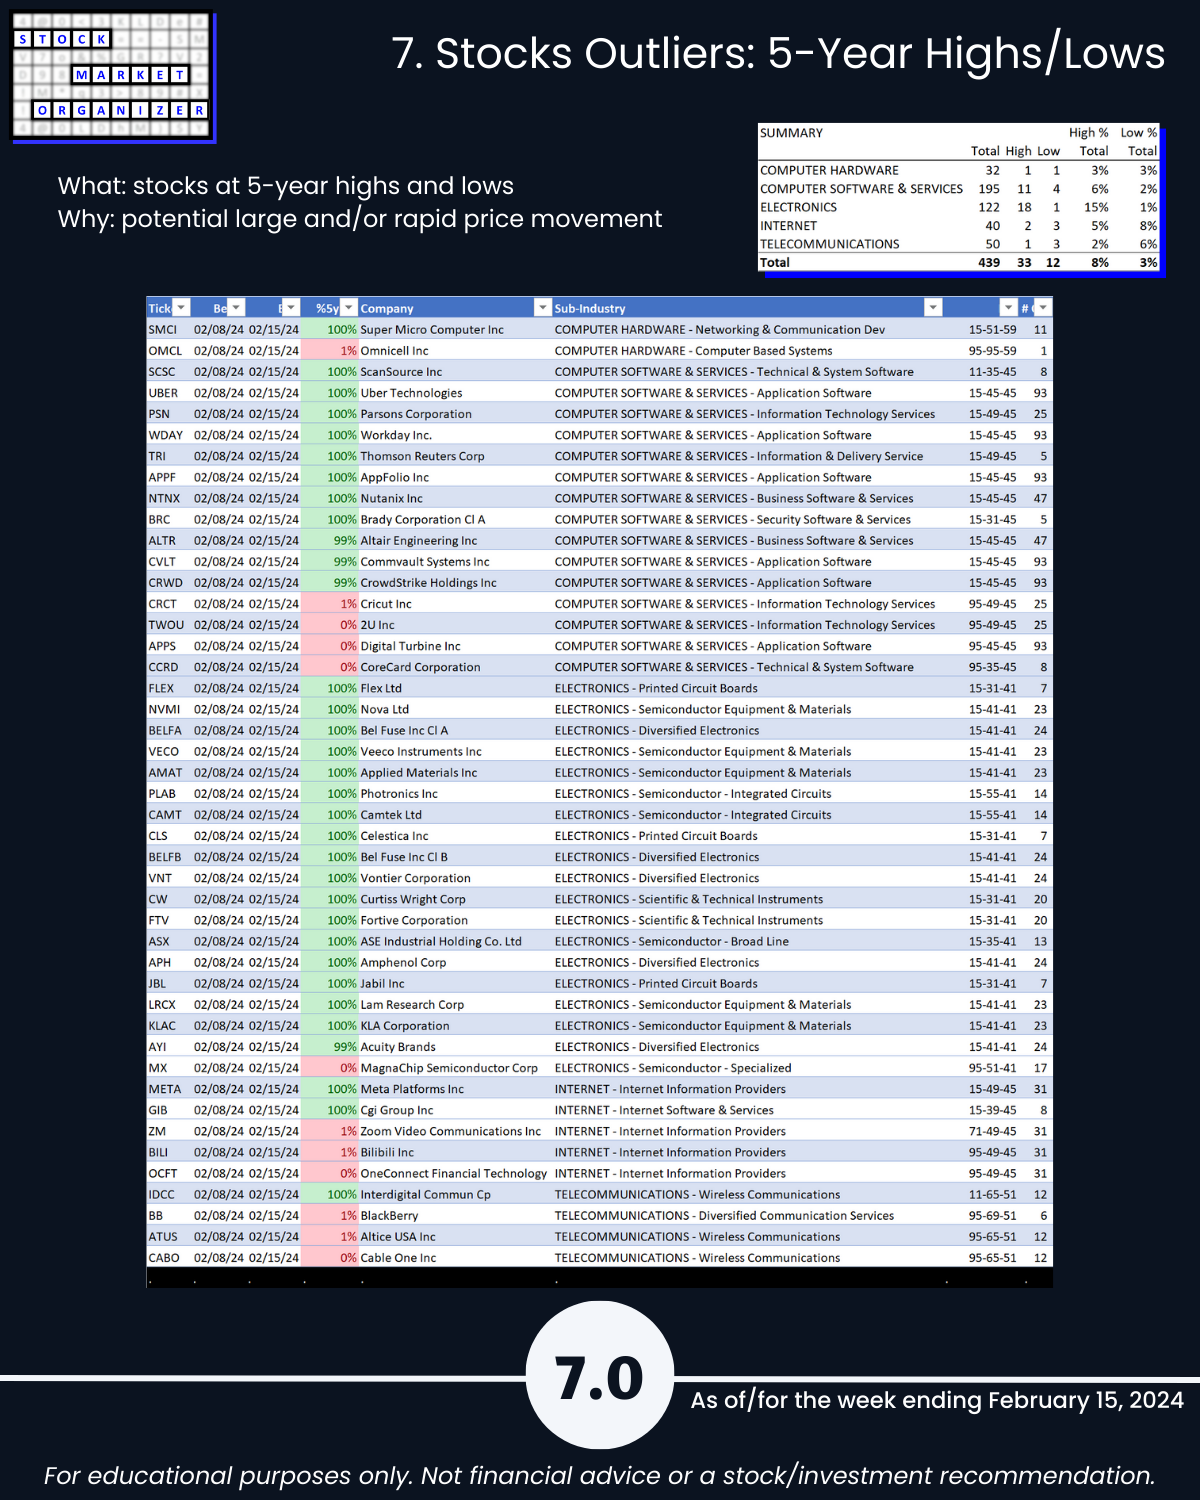
28 tech sector stocks at 5-year highs:
AMAT, APH, APPF, ASX, BELFA, BRC, CAMT, CLS, CW, FLEX, FTV, GIB, IDCC, JBL, KLAC, LRCX, META, NTNX, NVMI, PLAB, PSN, SCSC, SMCI, TRI, UBER, VECO, VNT, WDAY
5 at 5-year lows:
APPS, CABO, CCRD, MX, OCFT
Takeaways:
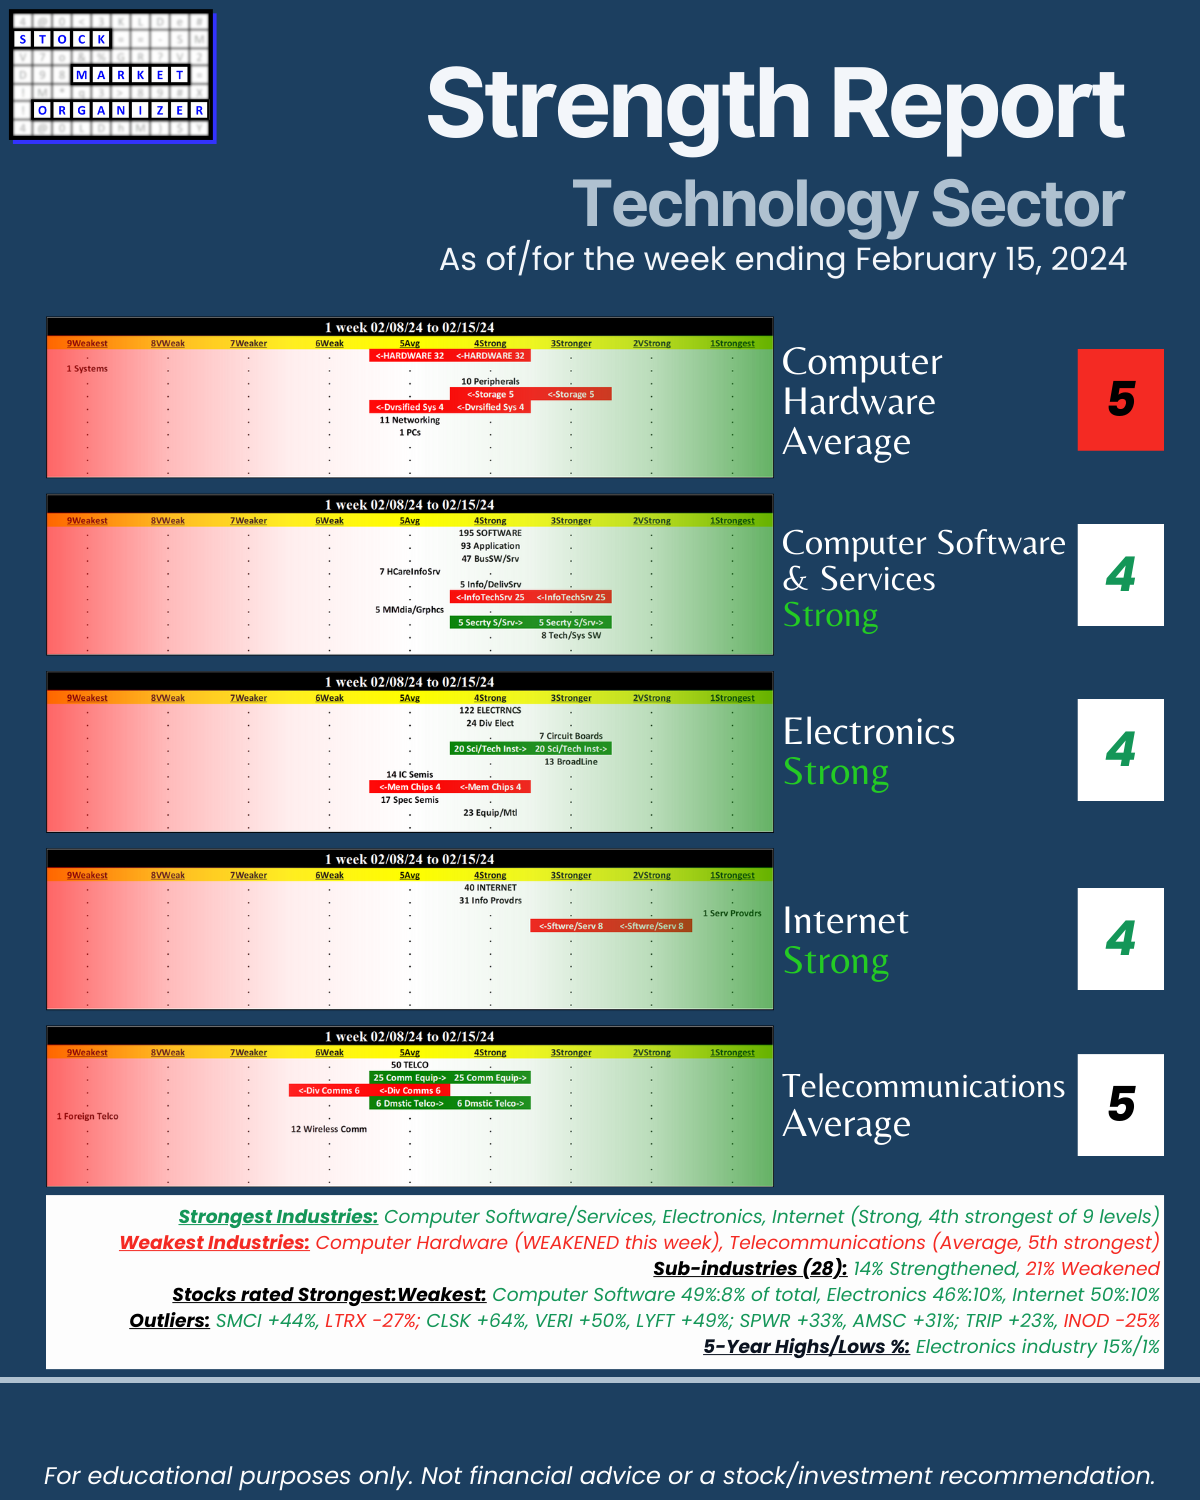
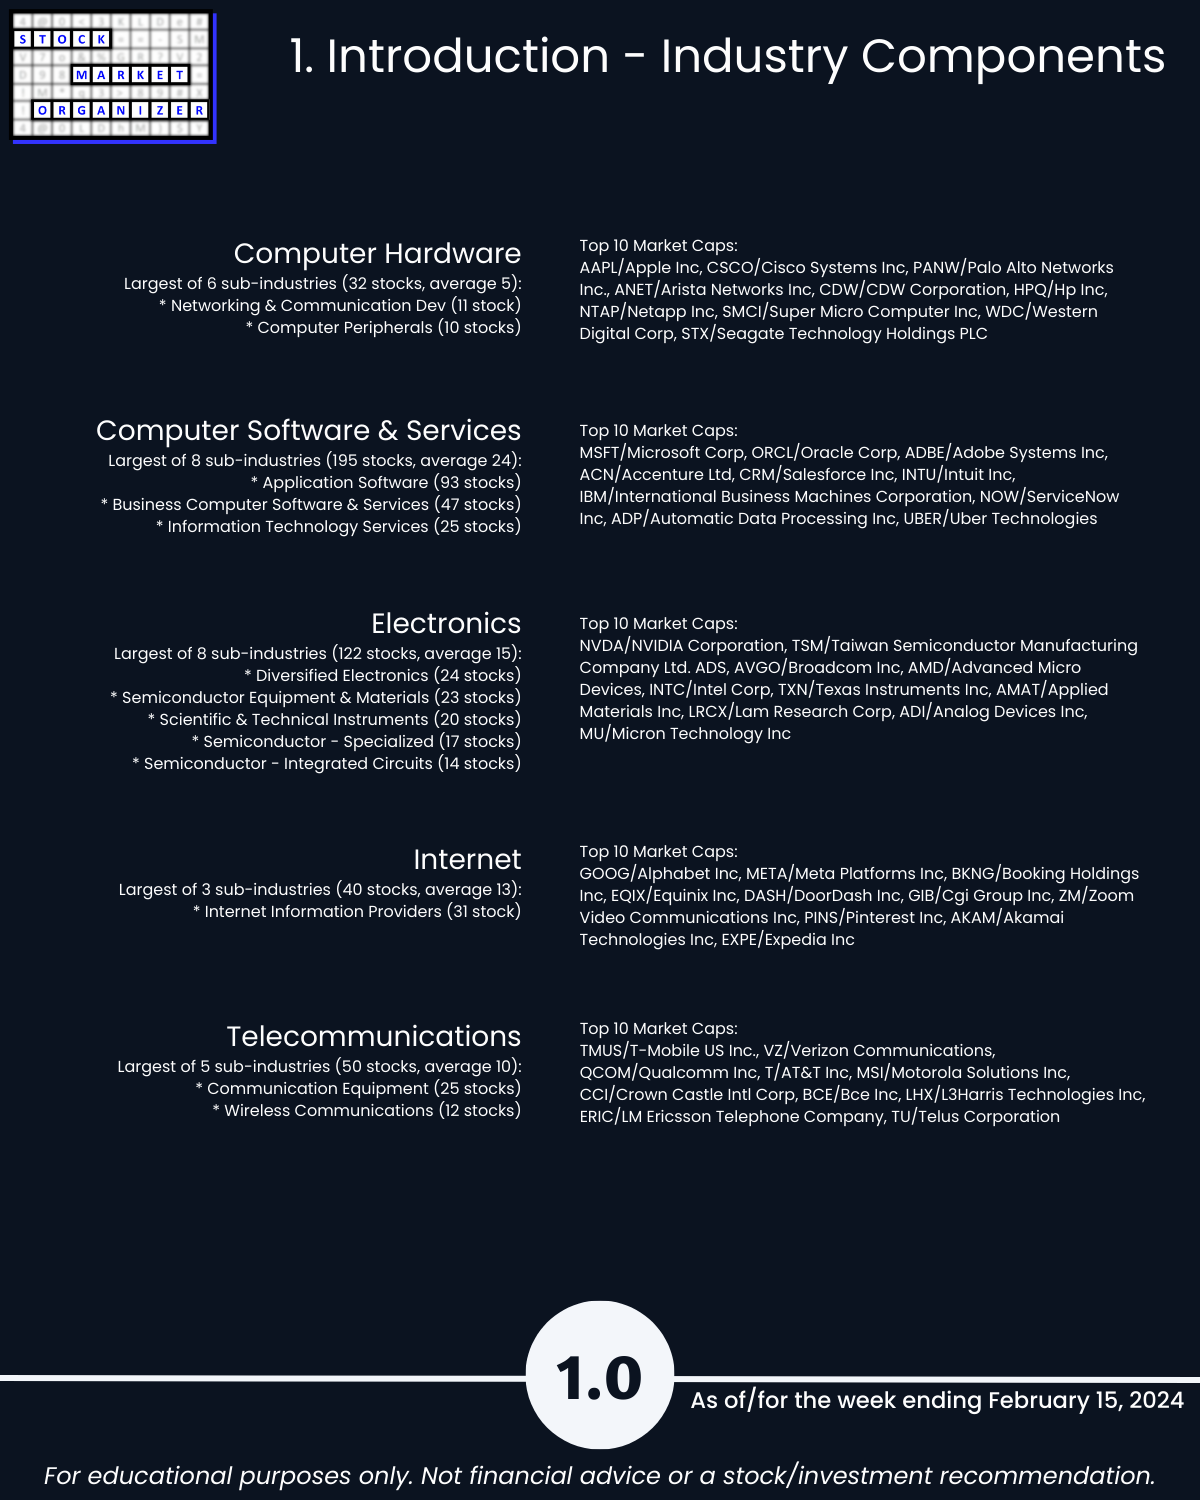
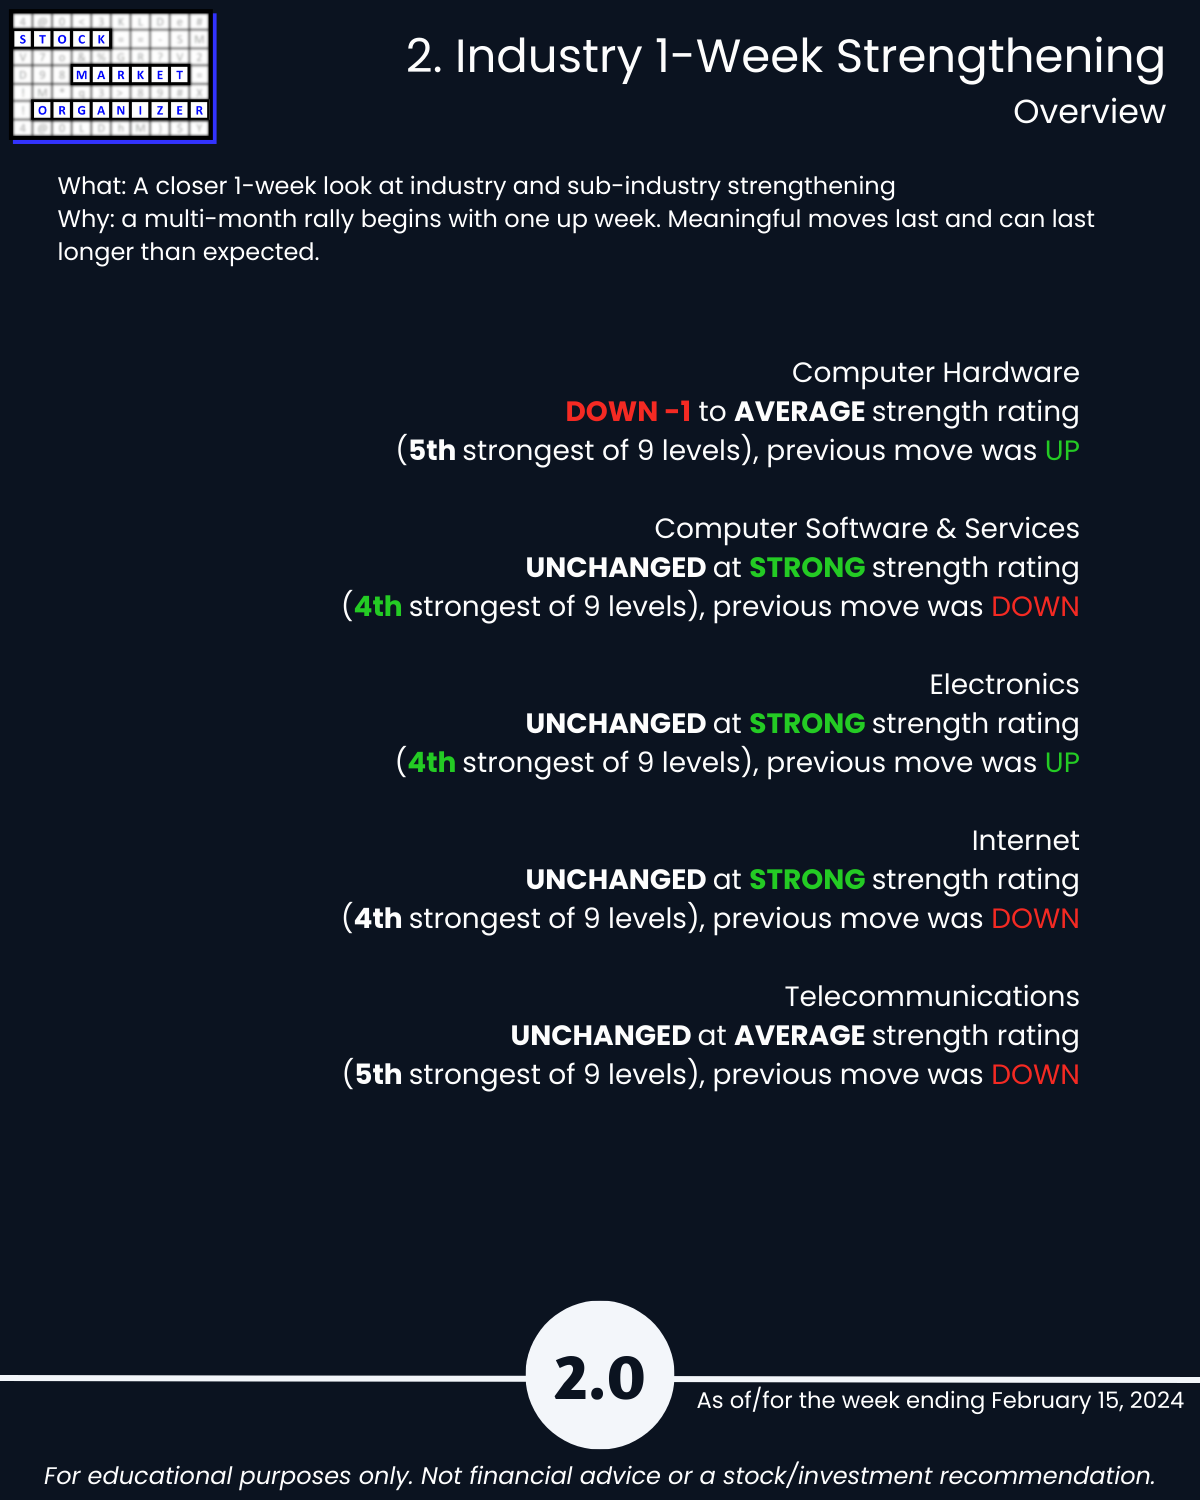
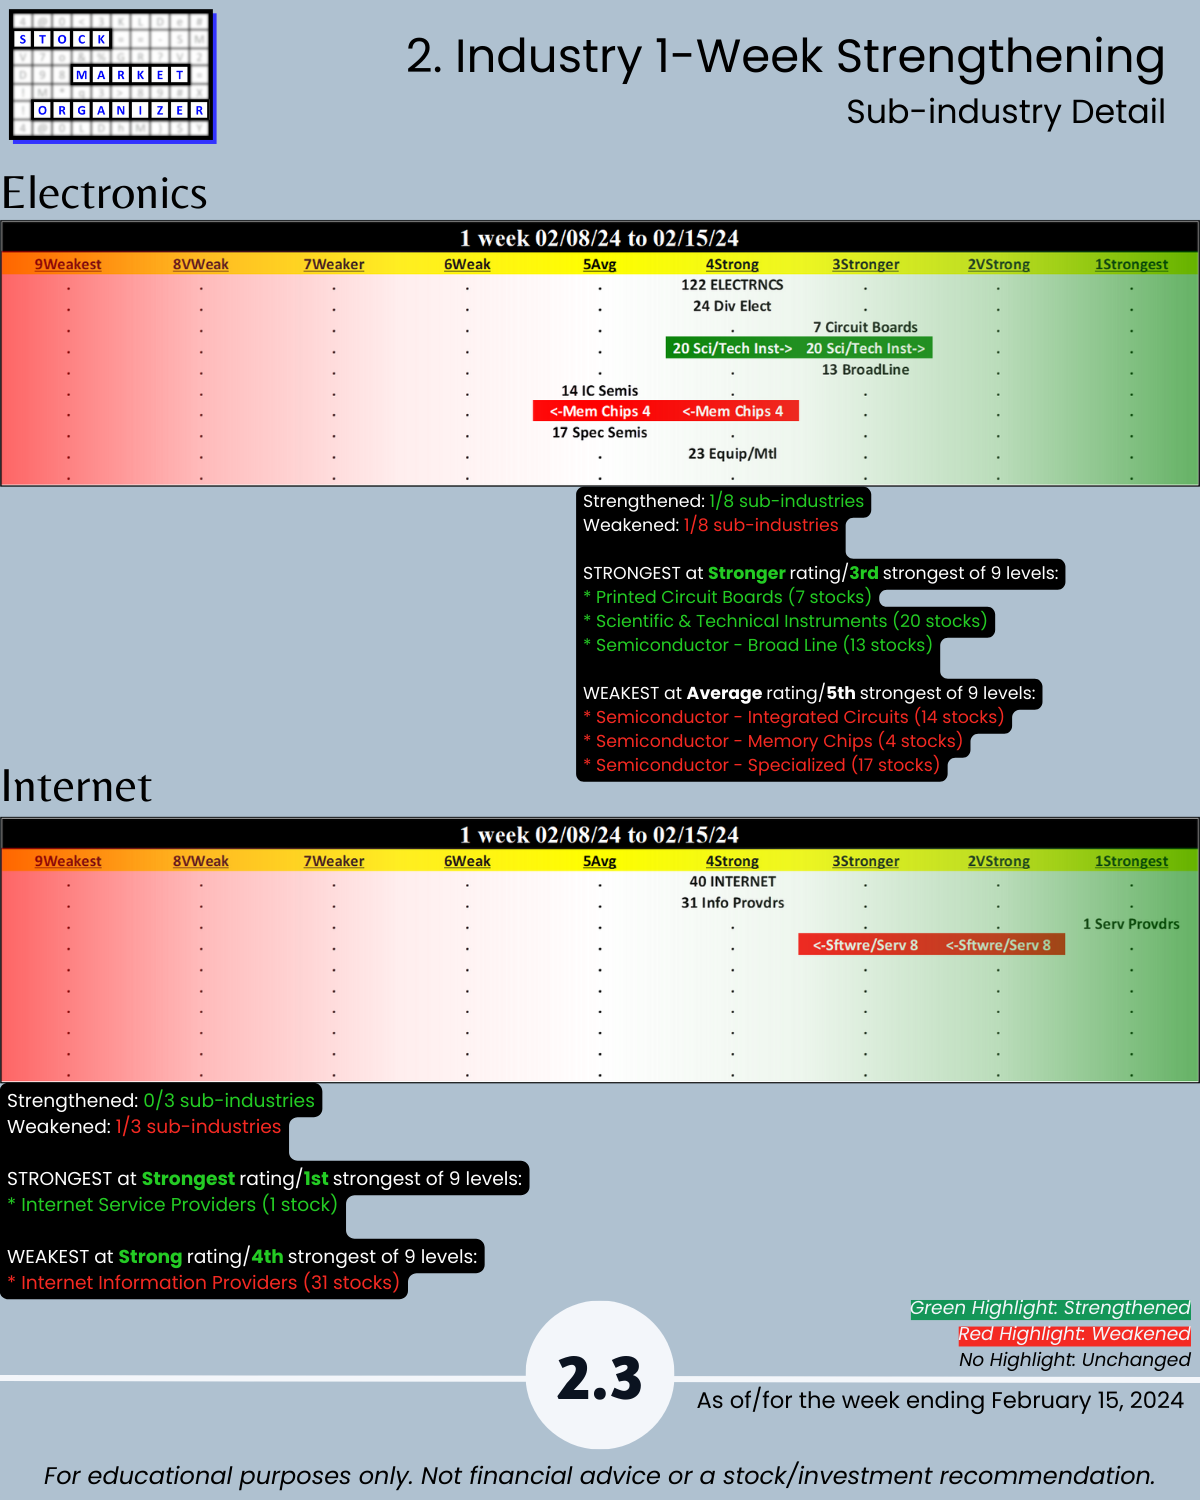
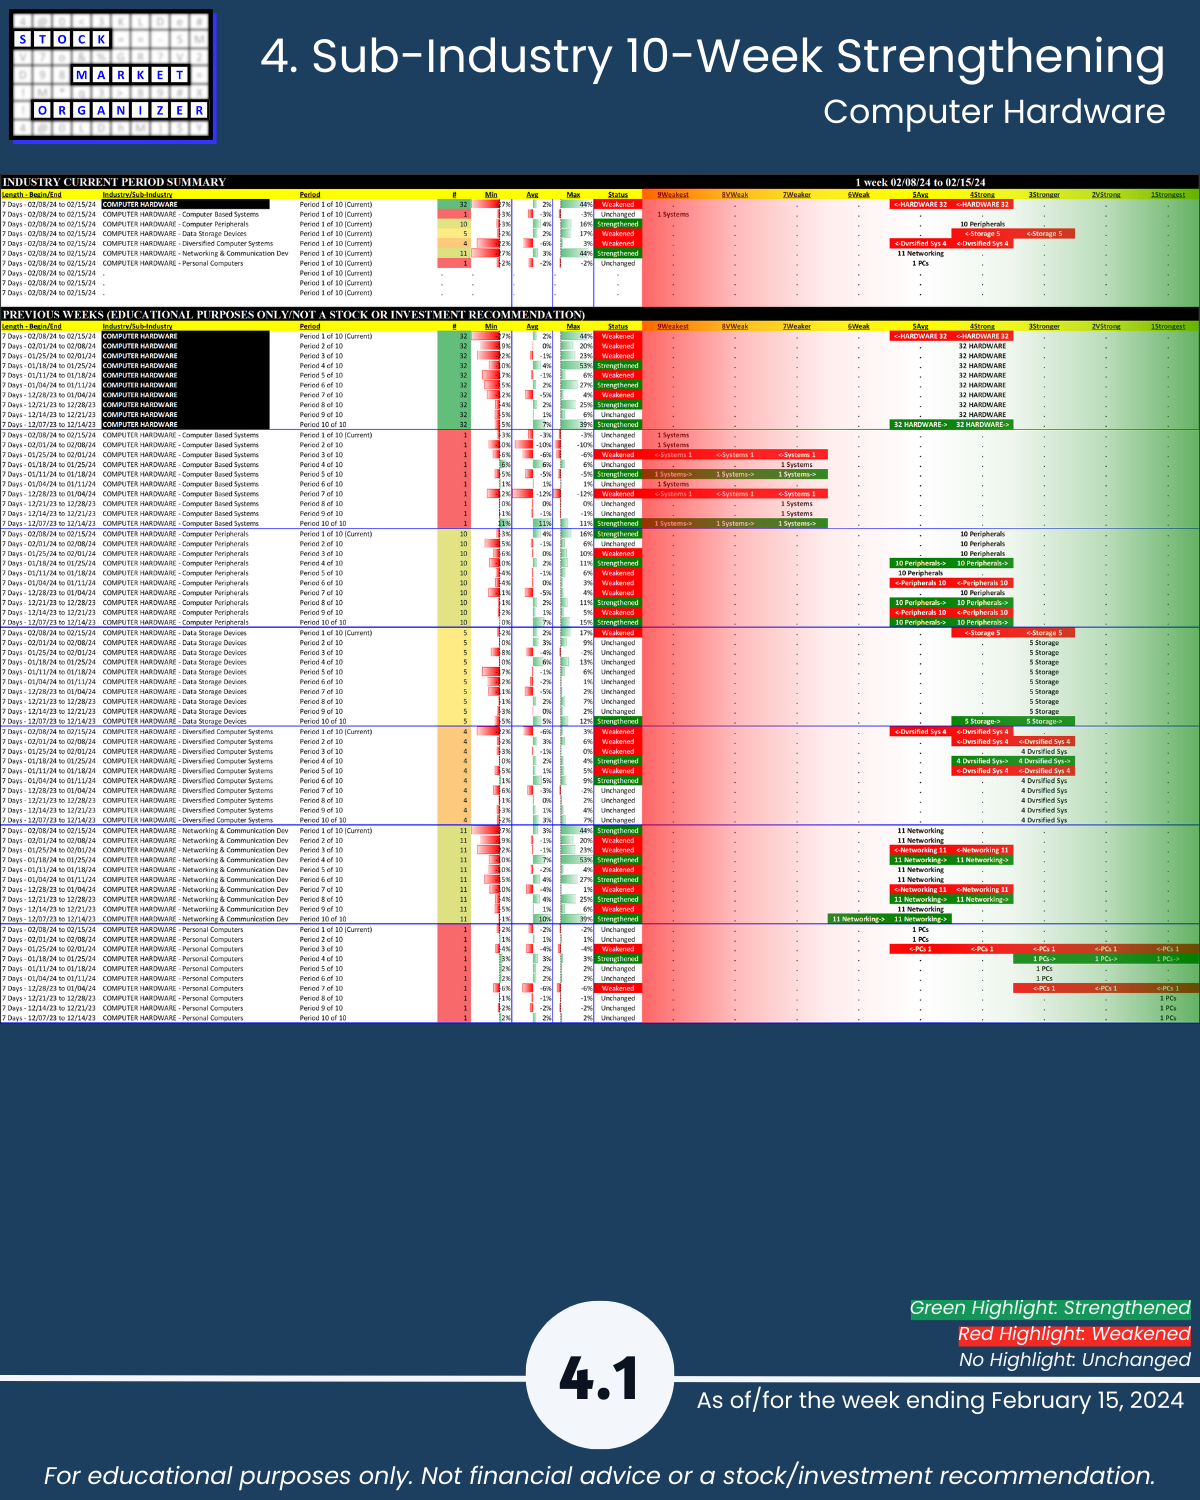
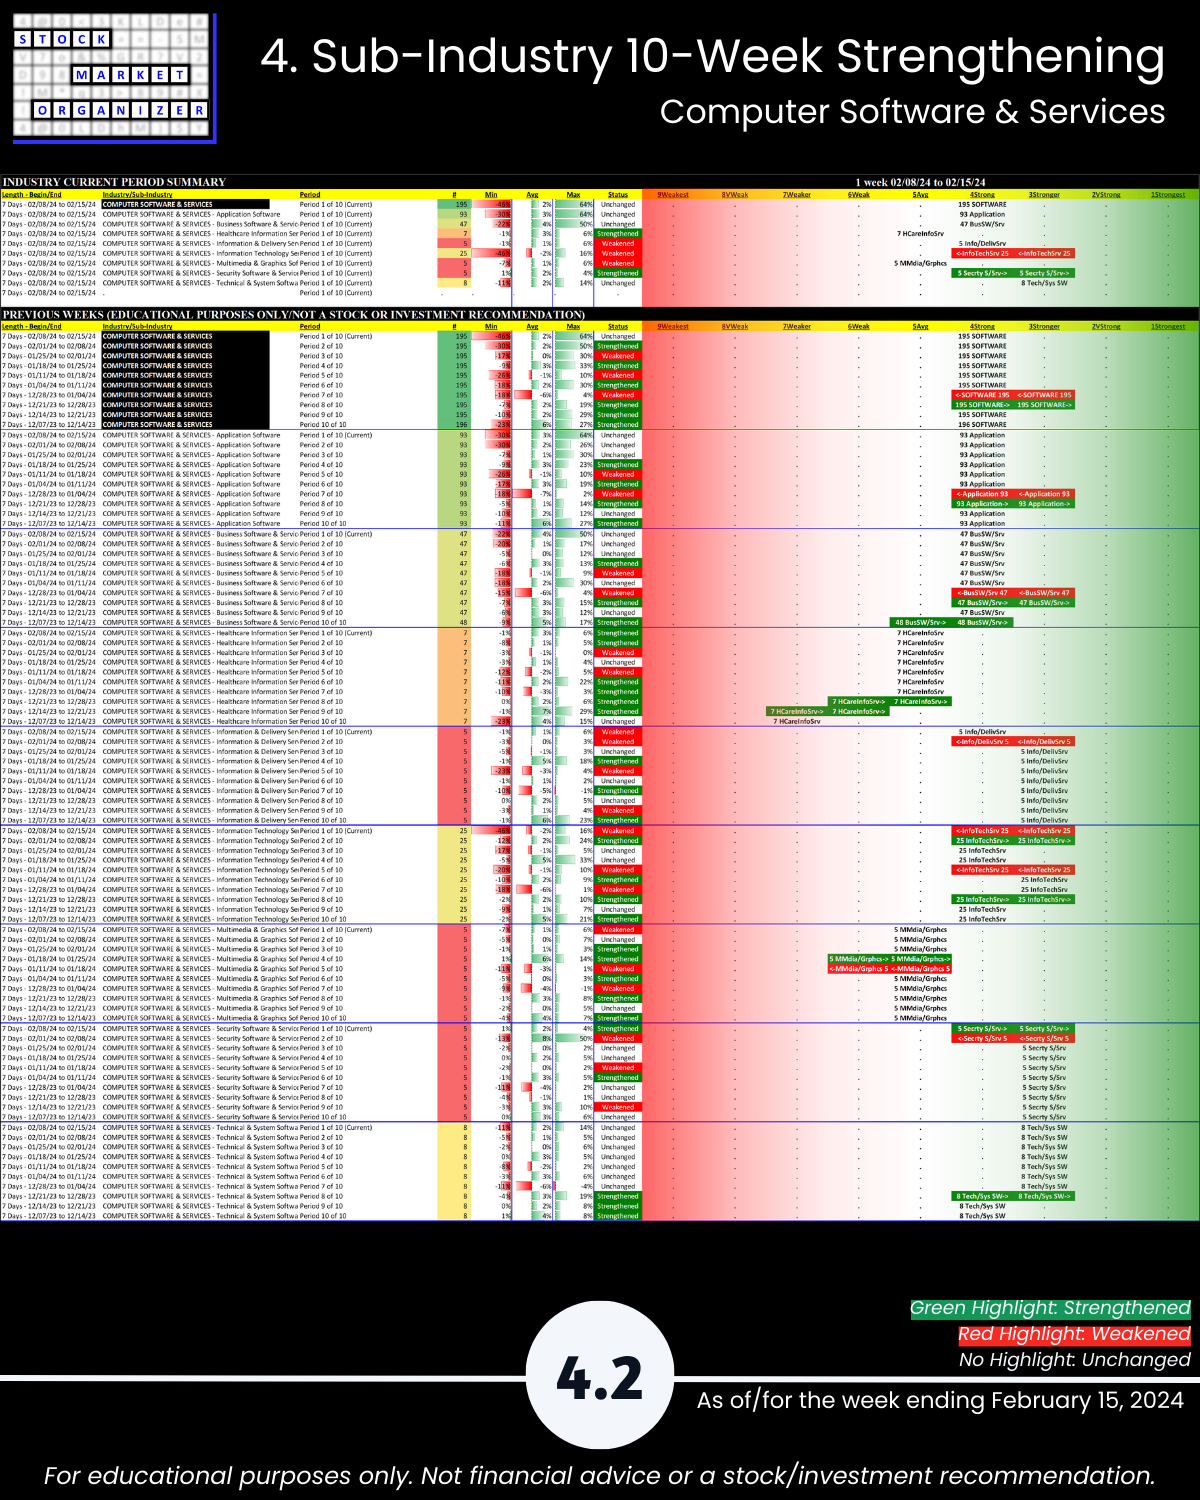
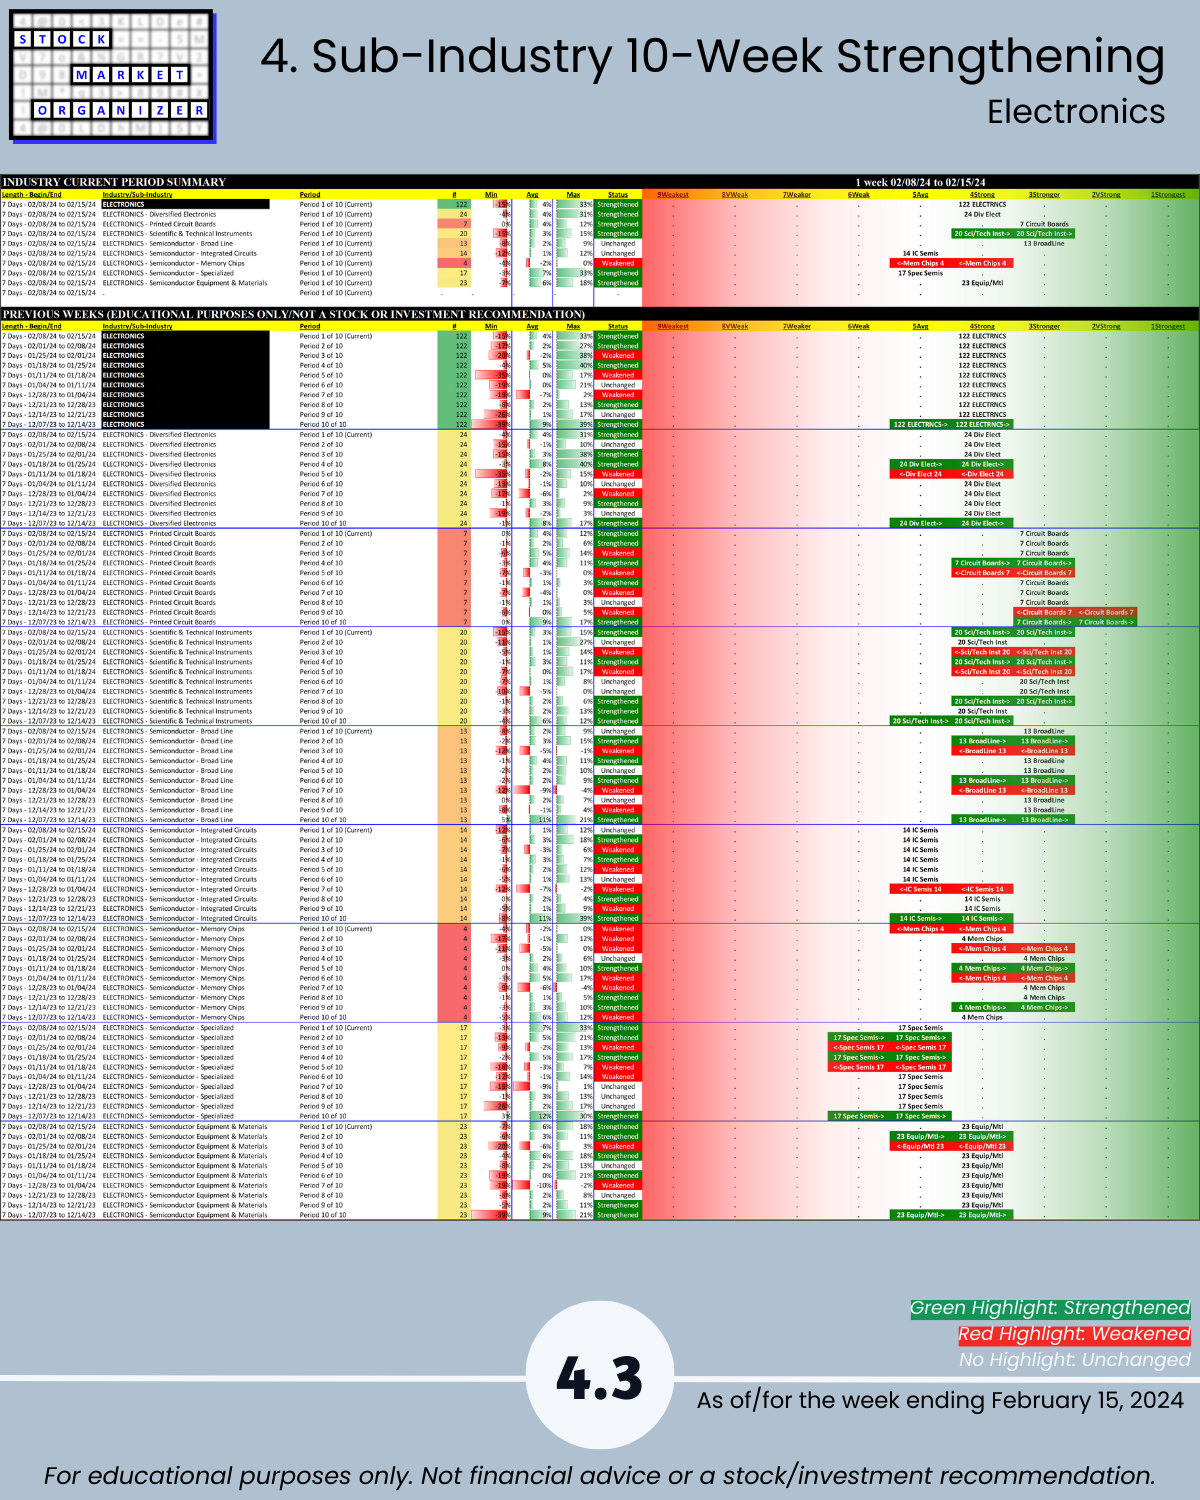
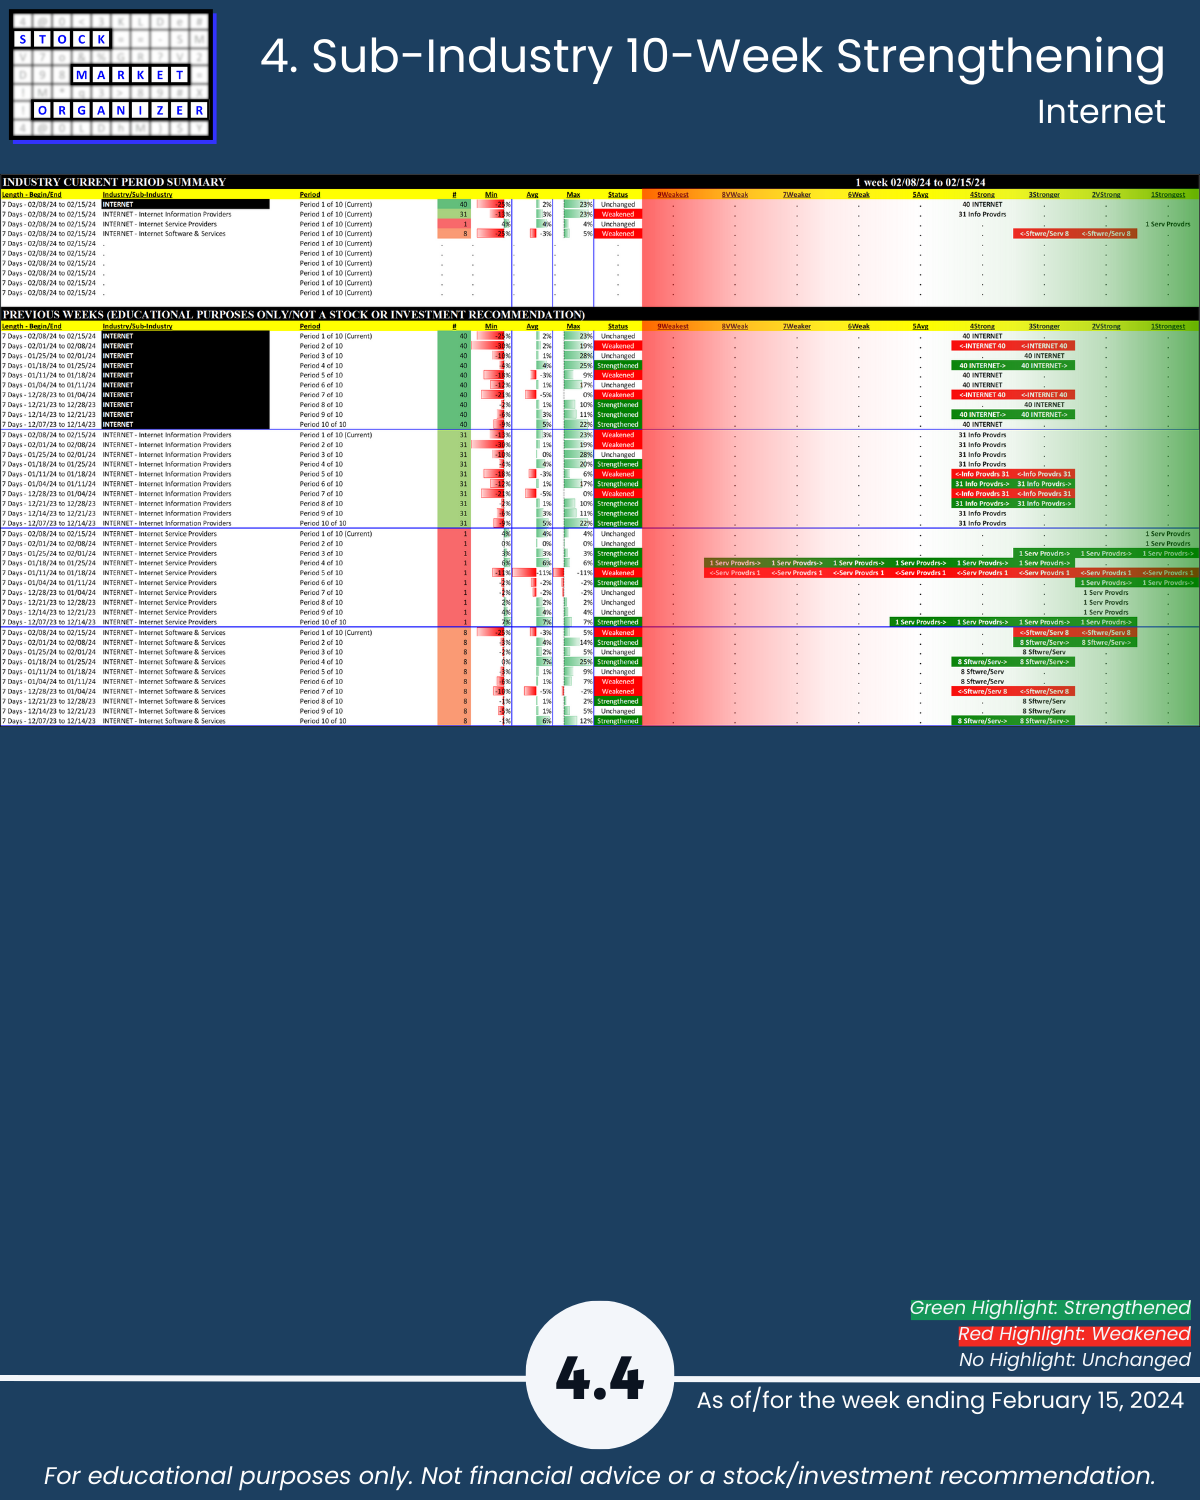
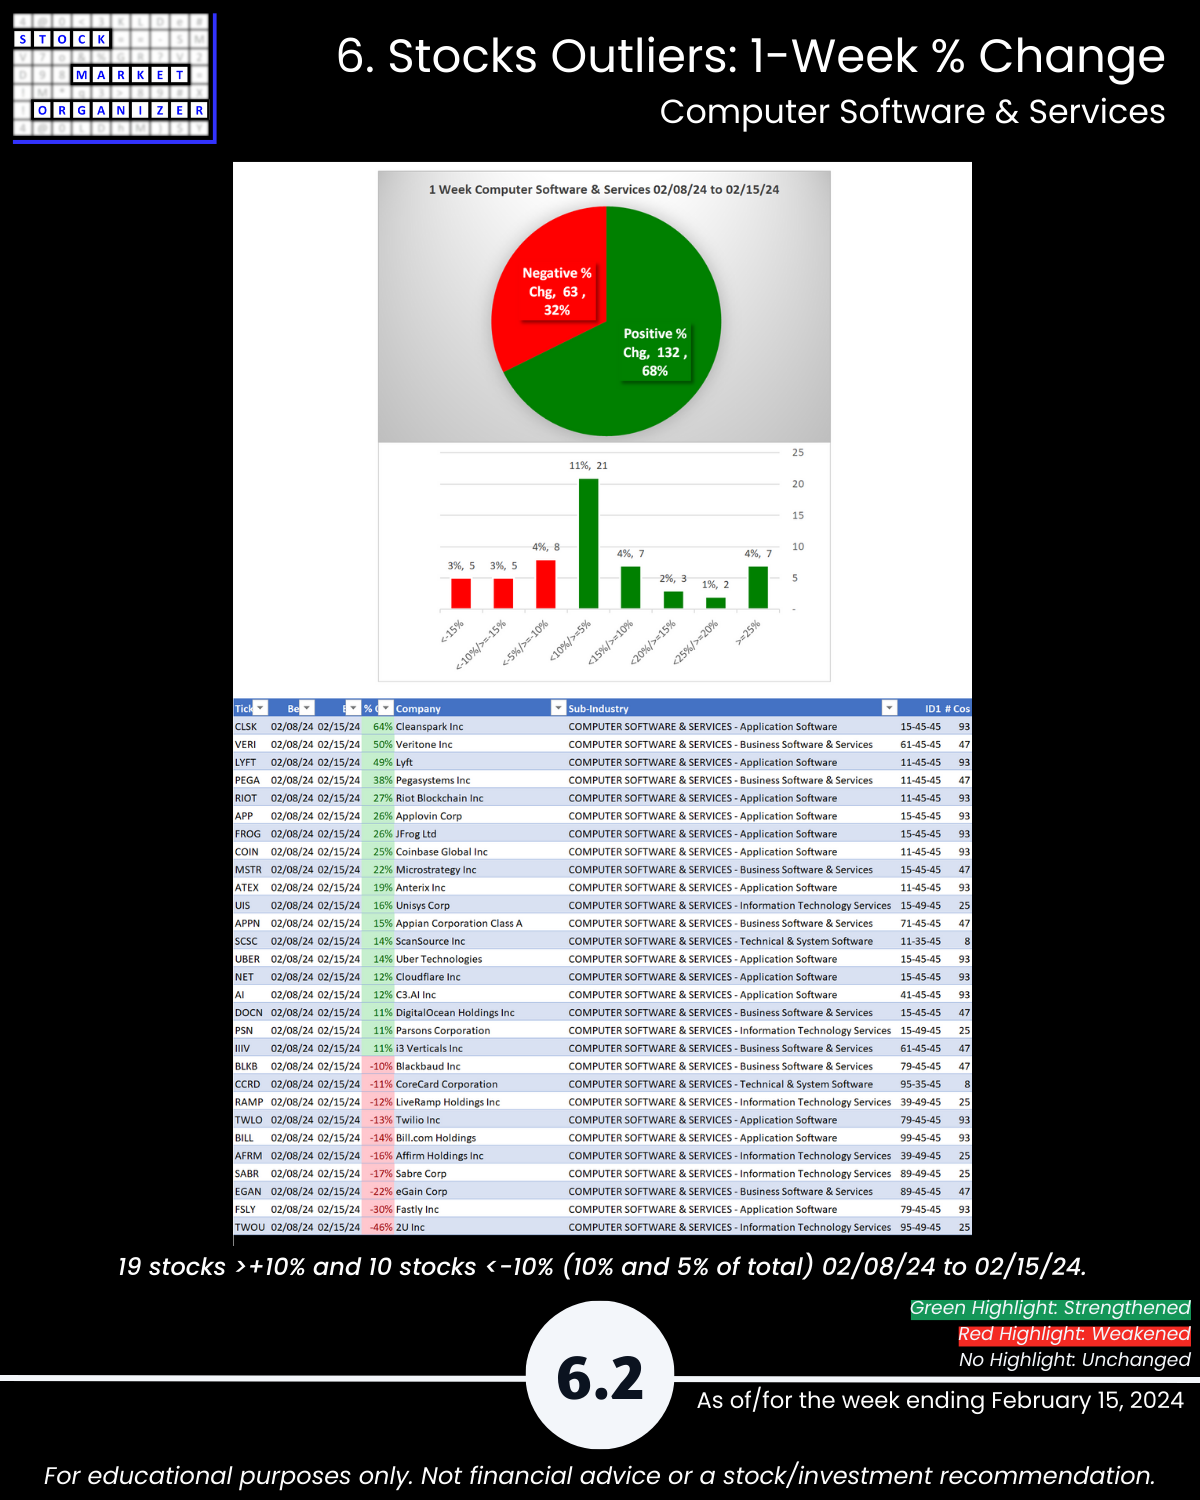
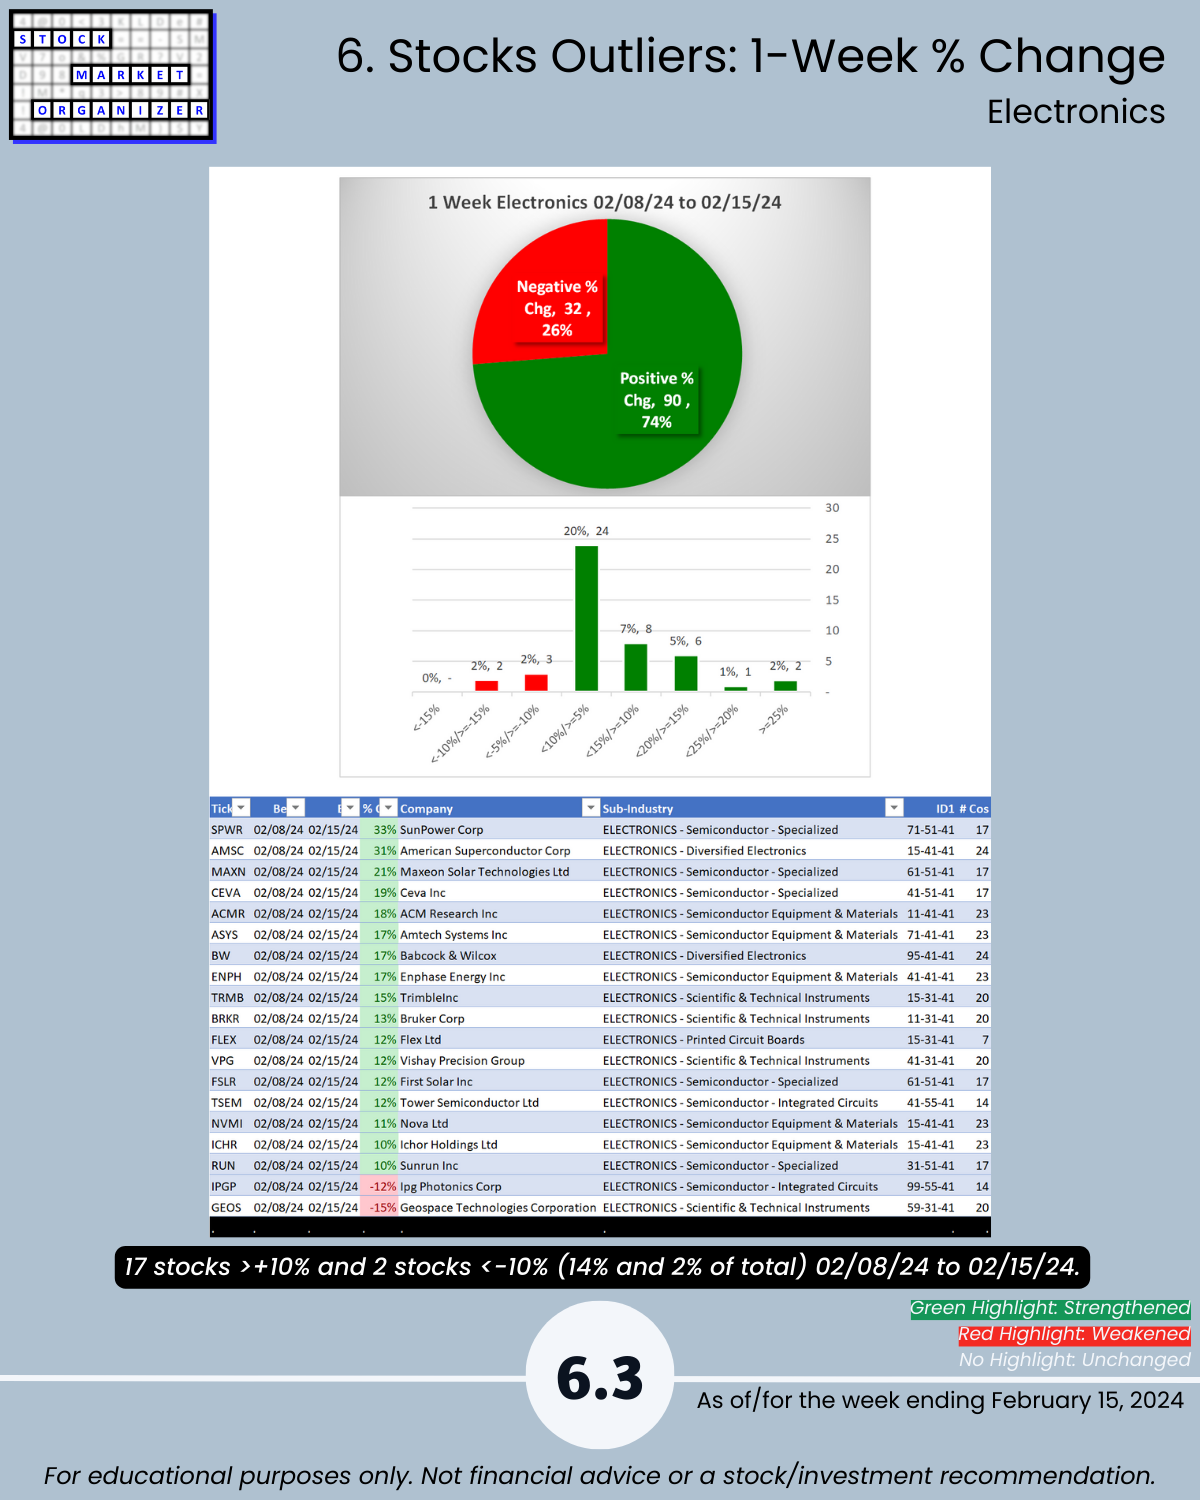
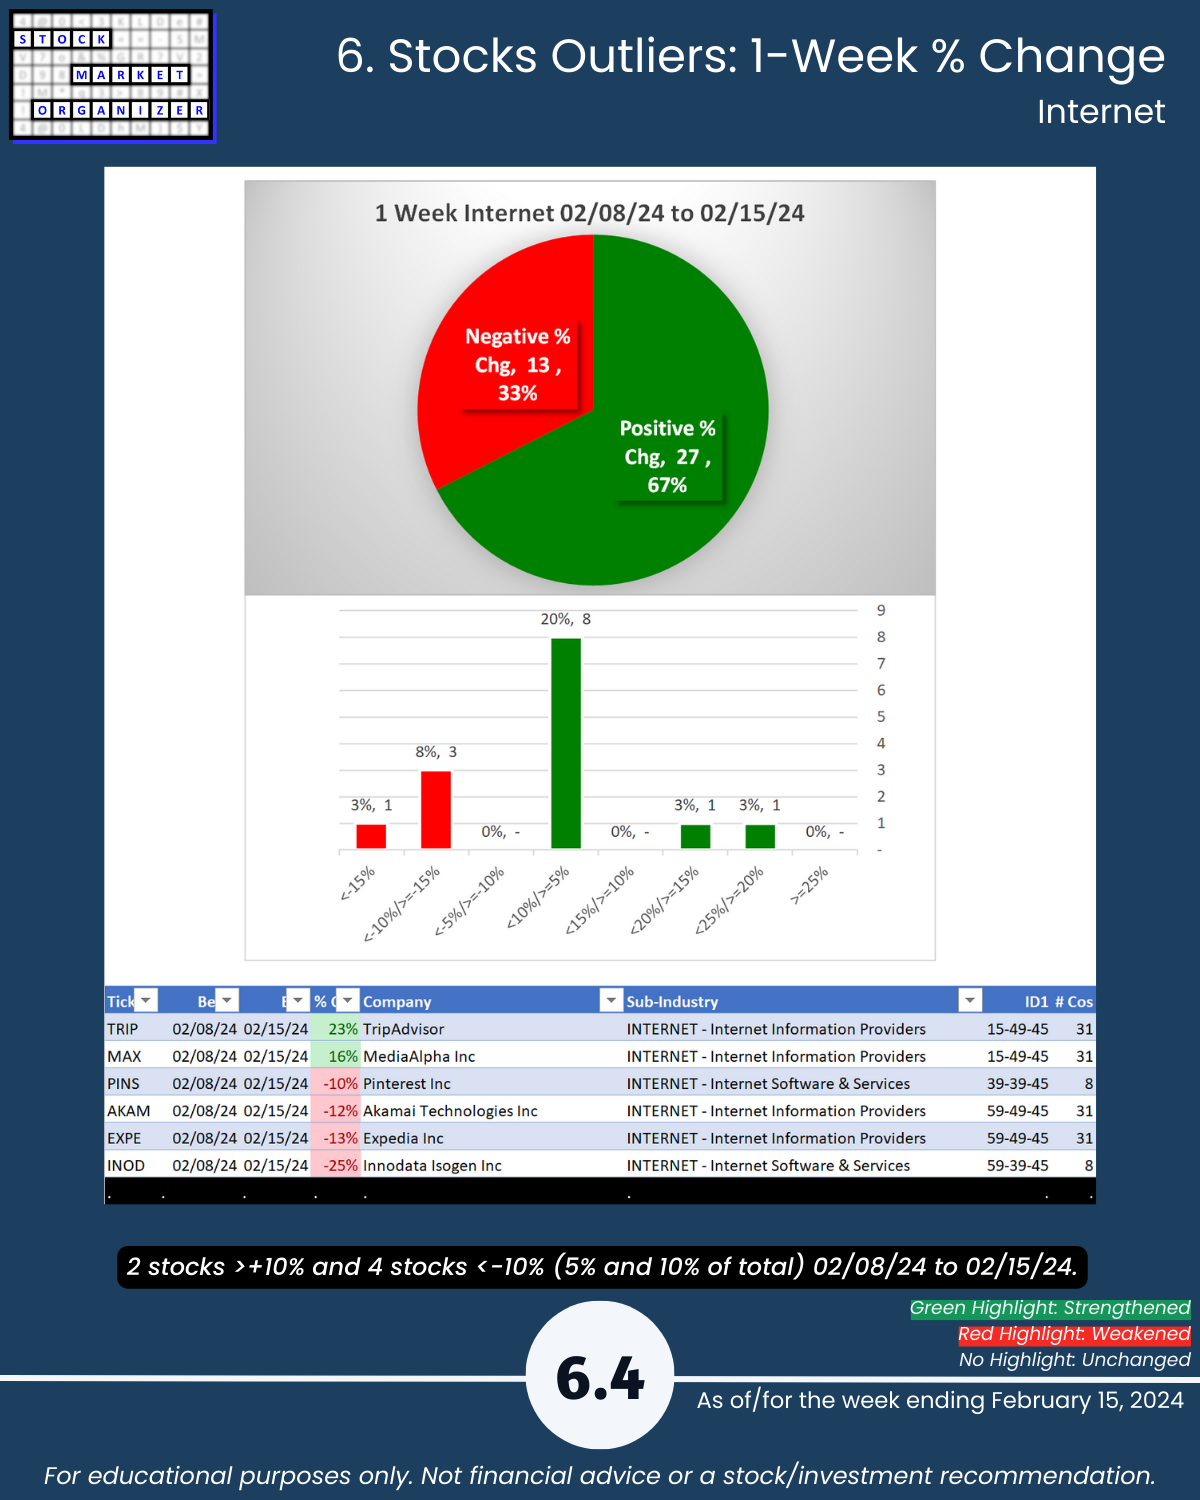
🔹 Strongest Industries: Computer Software/Services, Electronics, Internet (Strong, 4th strongest of 9 levels)
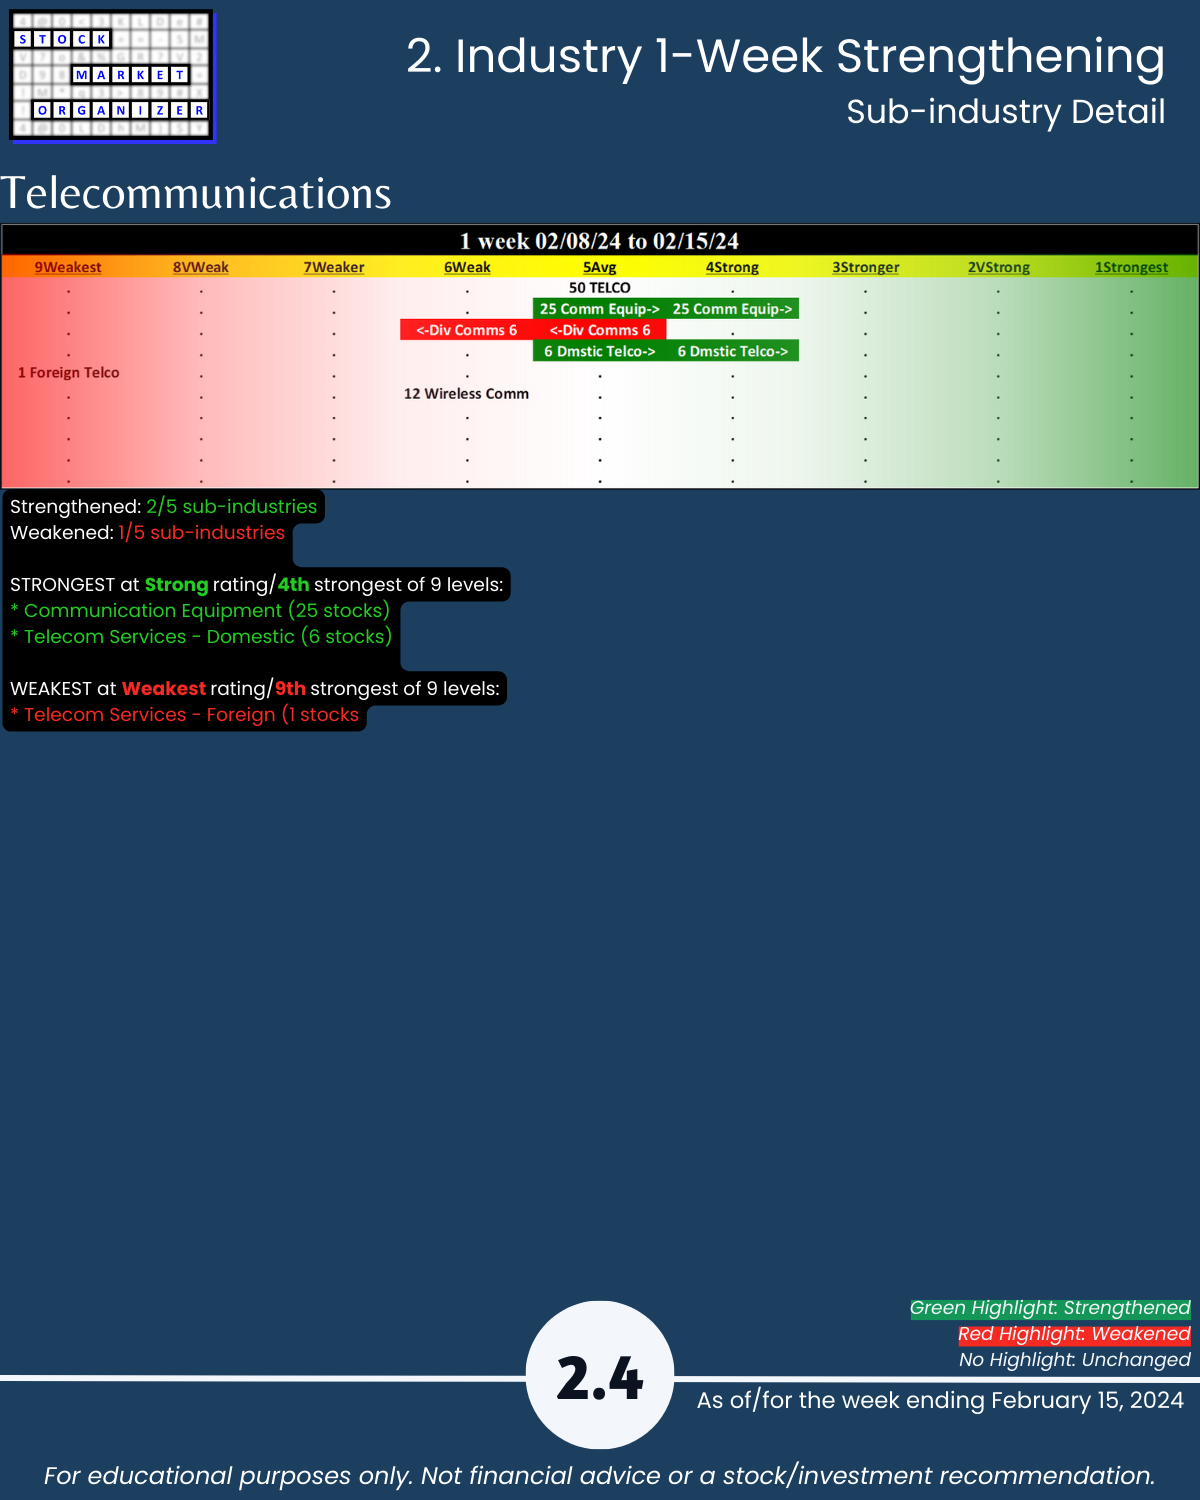
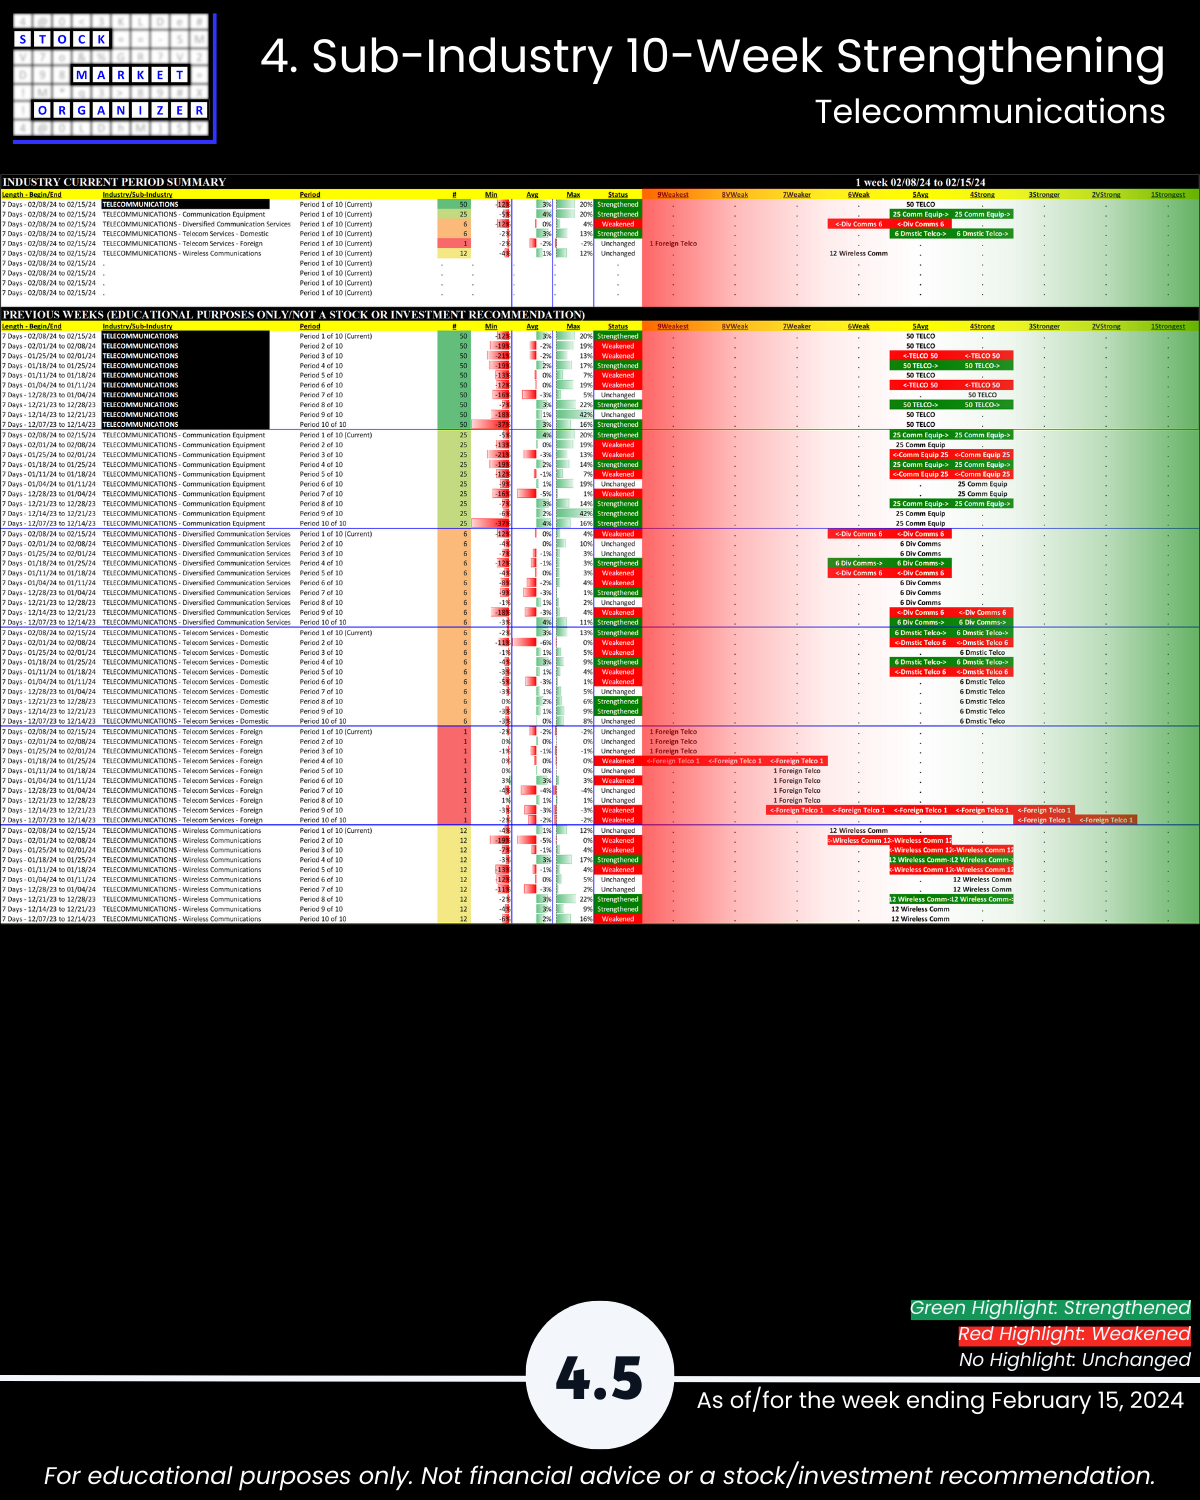
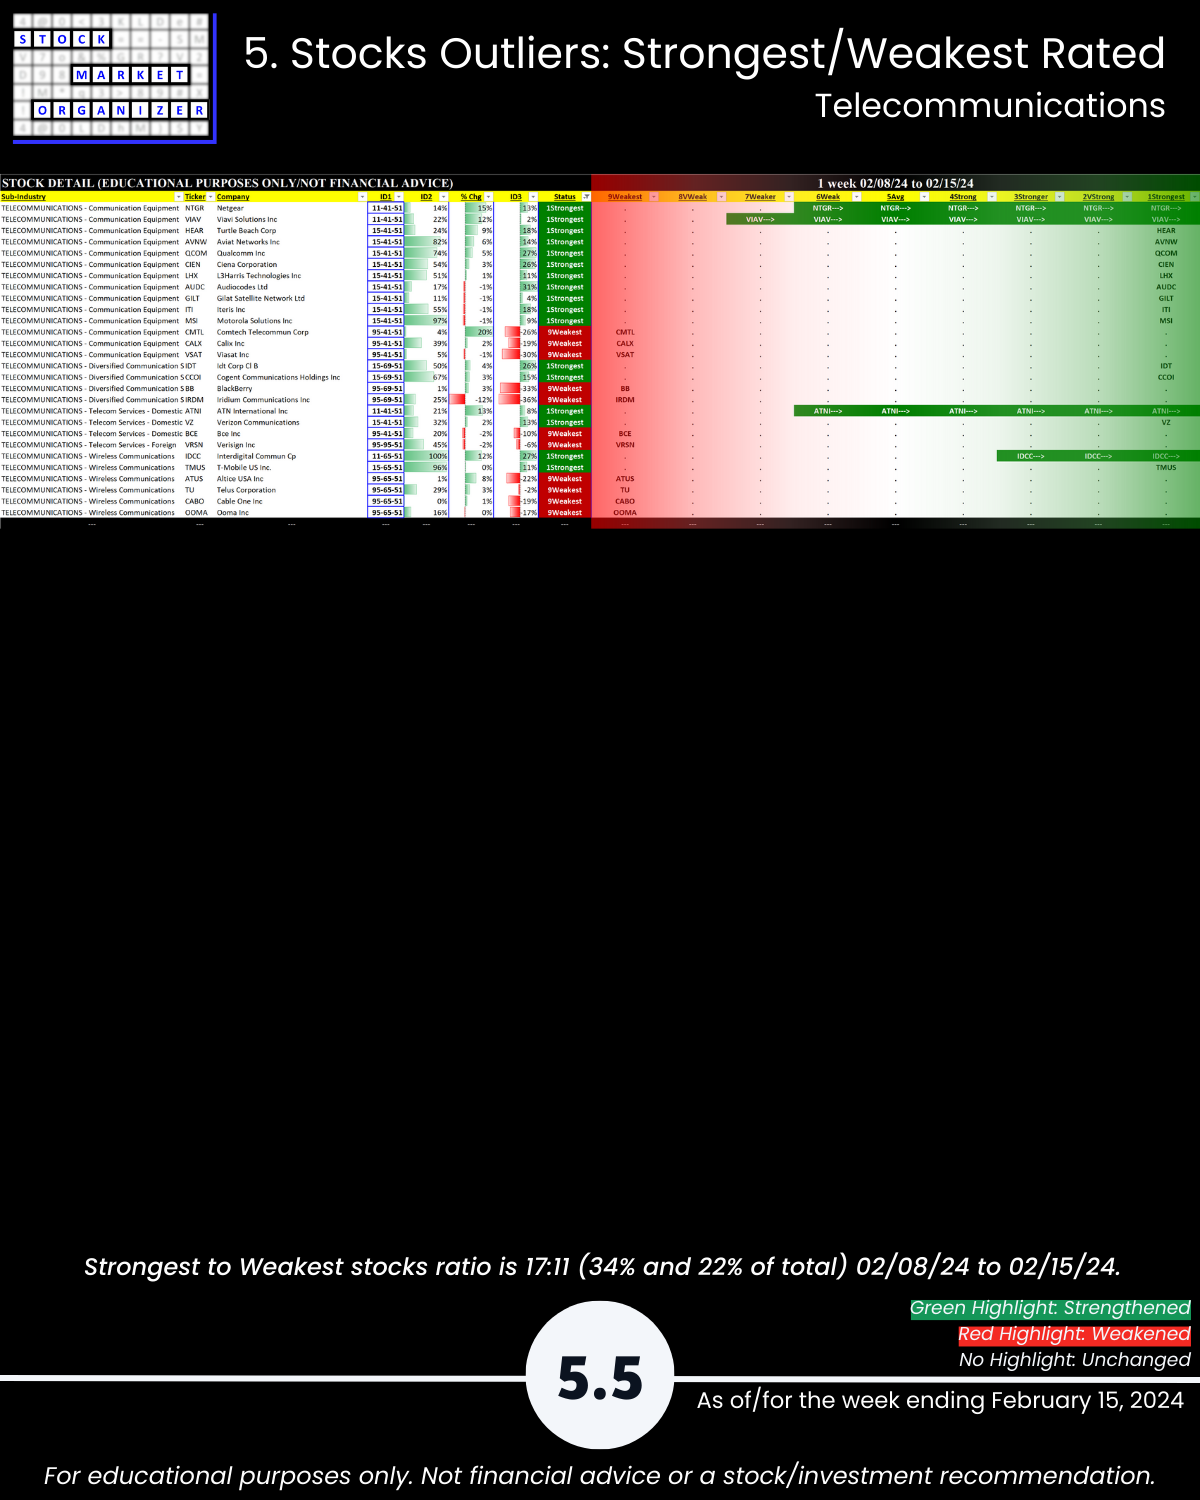
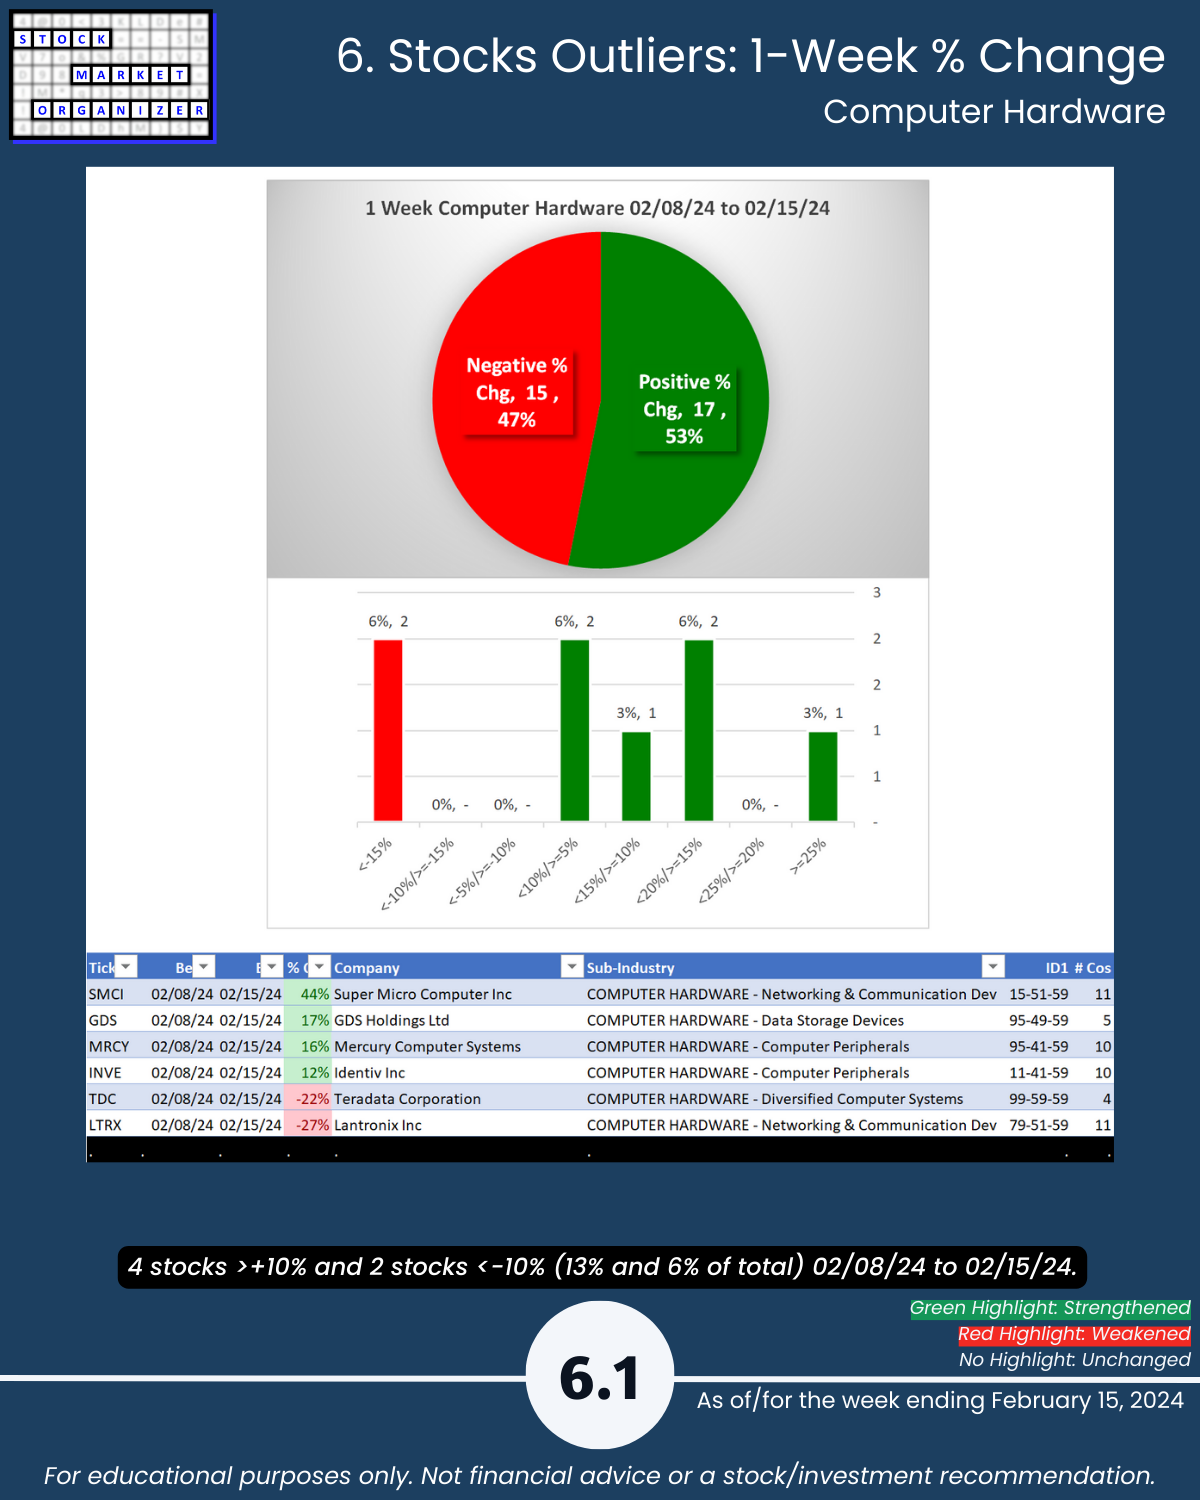
🔹 Weakest Industries: Computer Hardware (WEAKENED this week), Telecommunications (Average, 5th strongest)
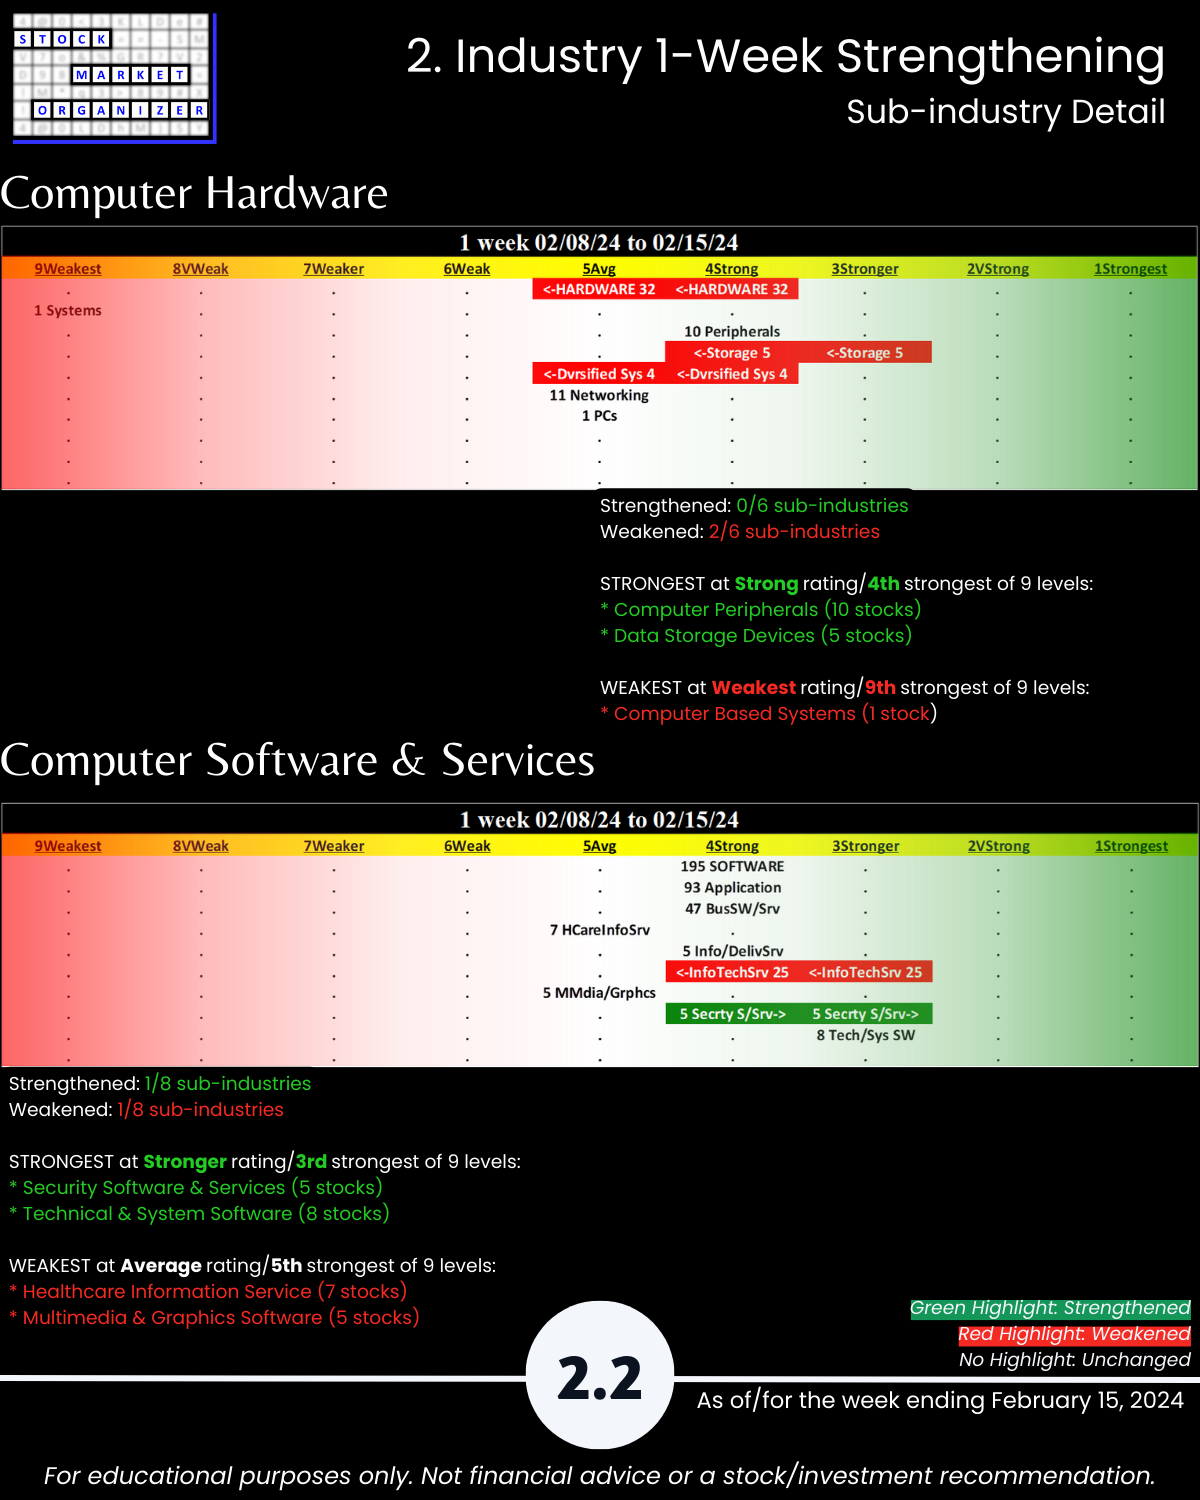
🔹 Sub-industries (28): 14% Strengthened, 21% Weakened
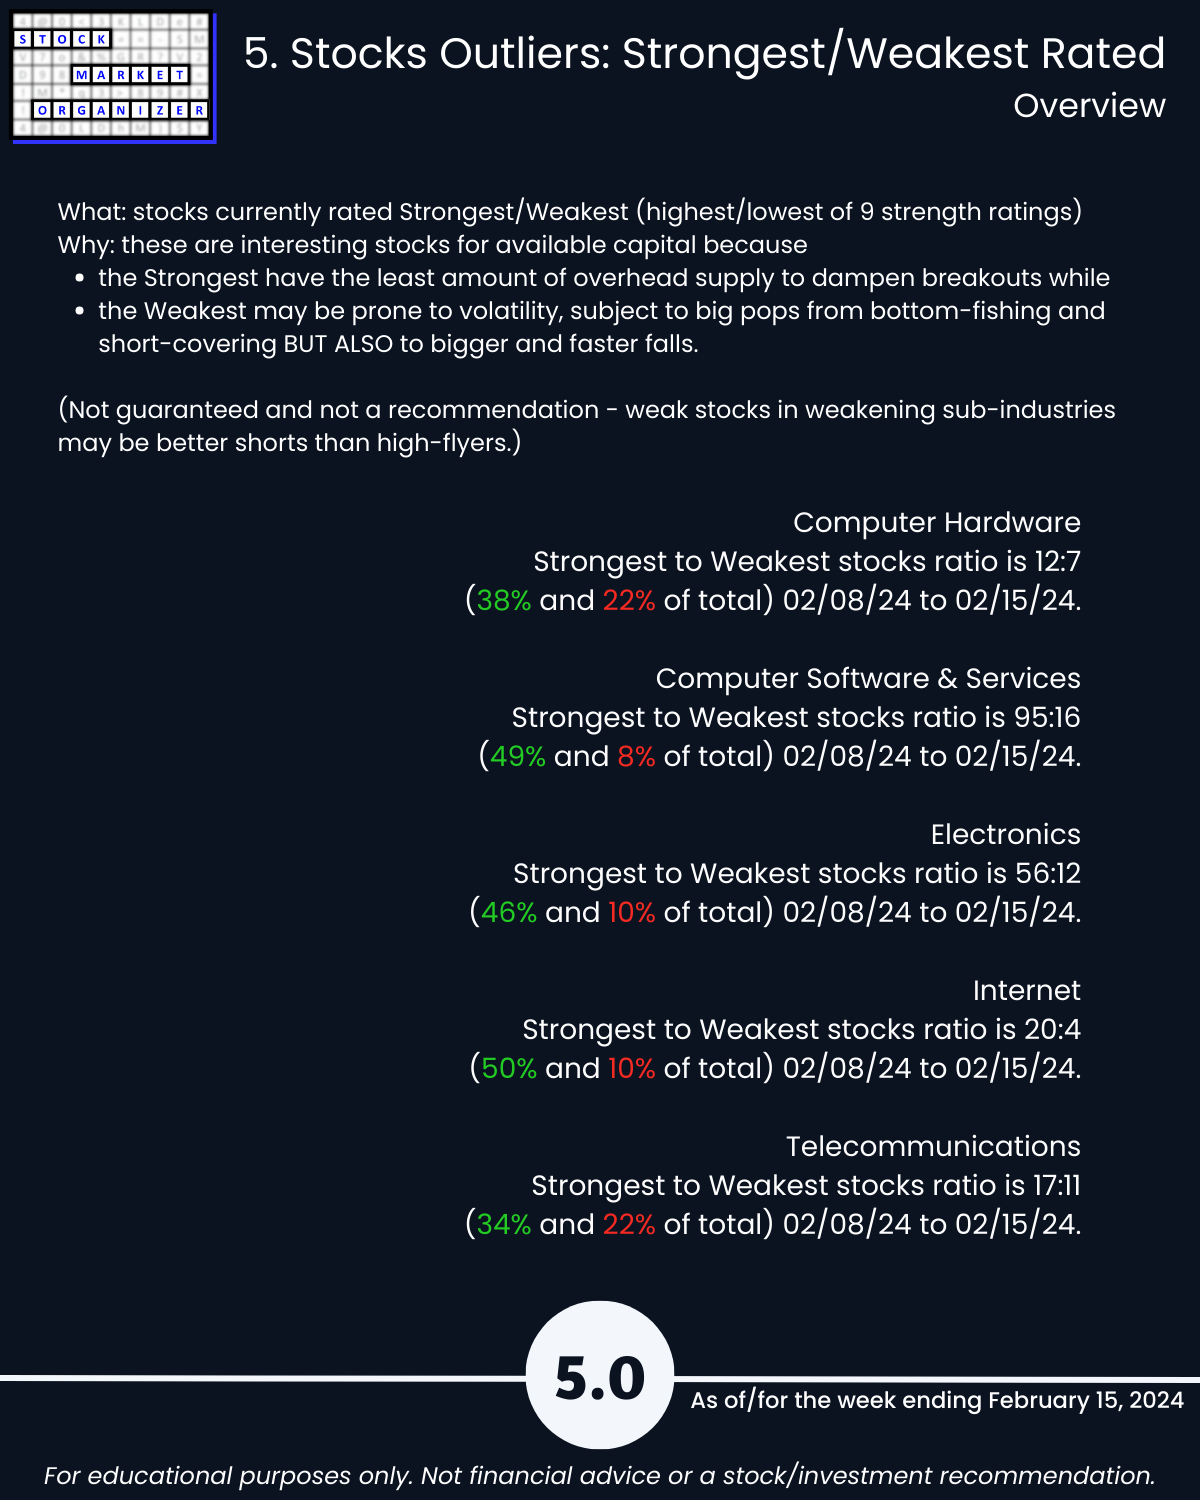
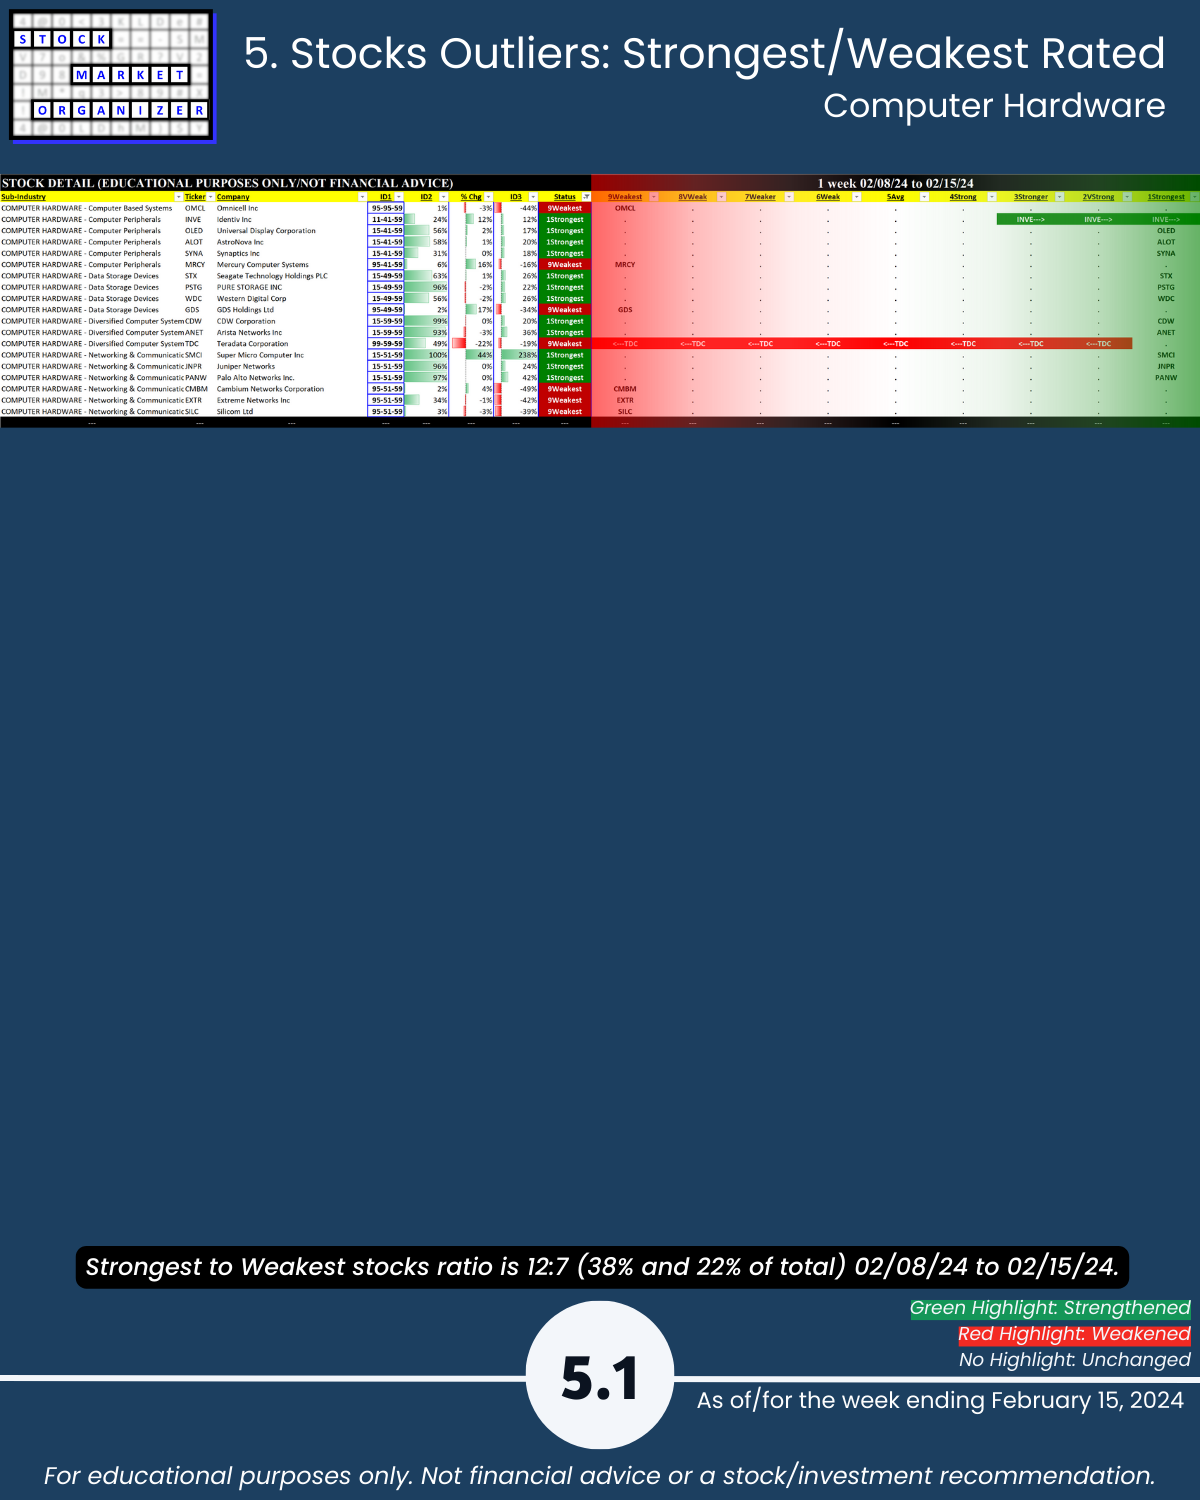
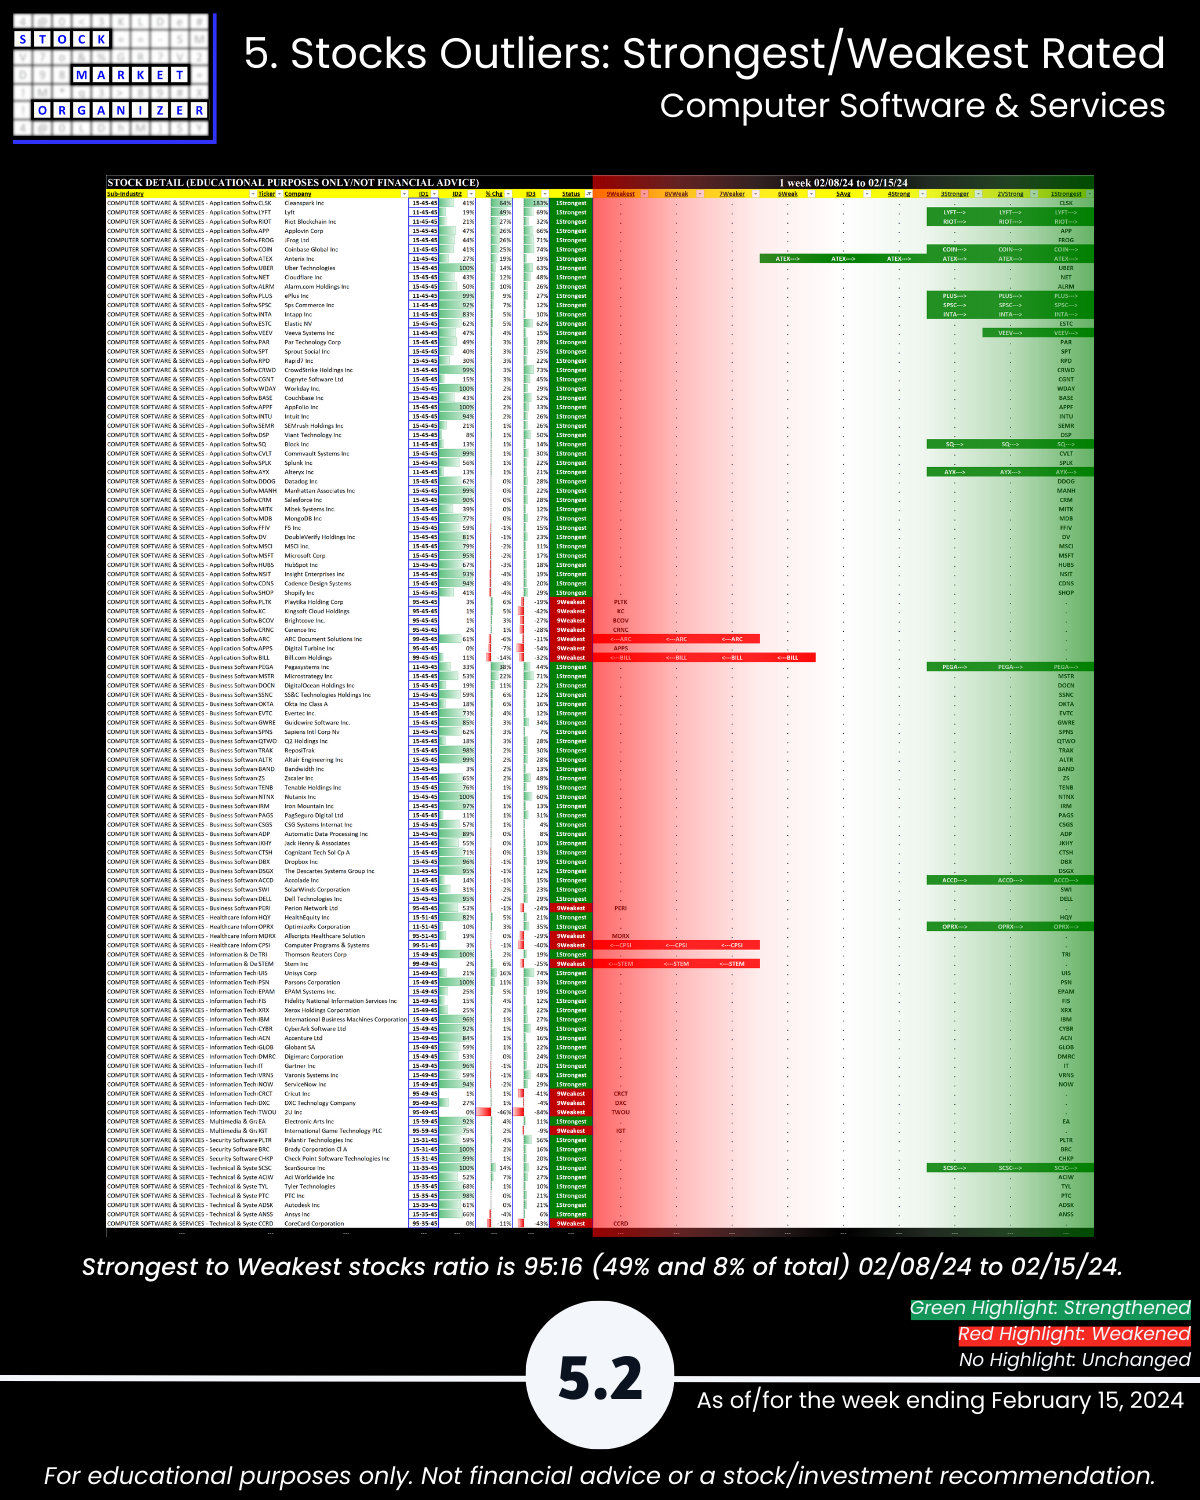
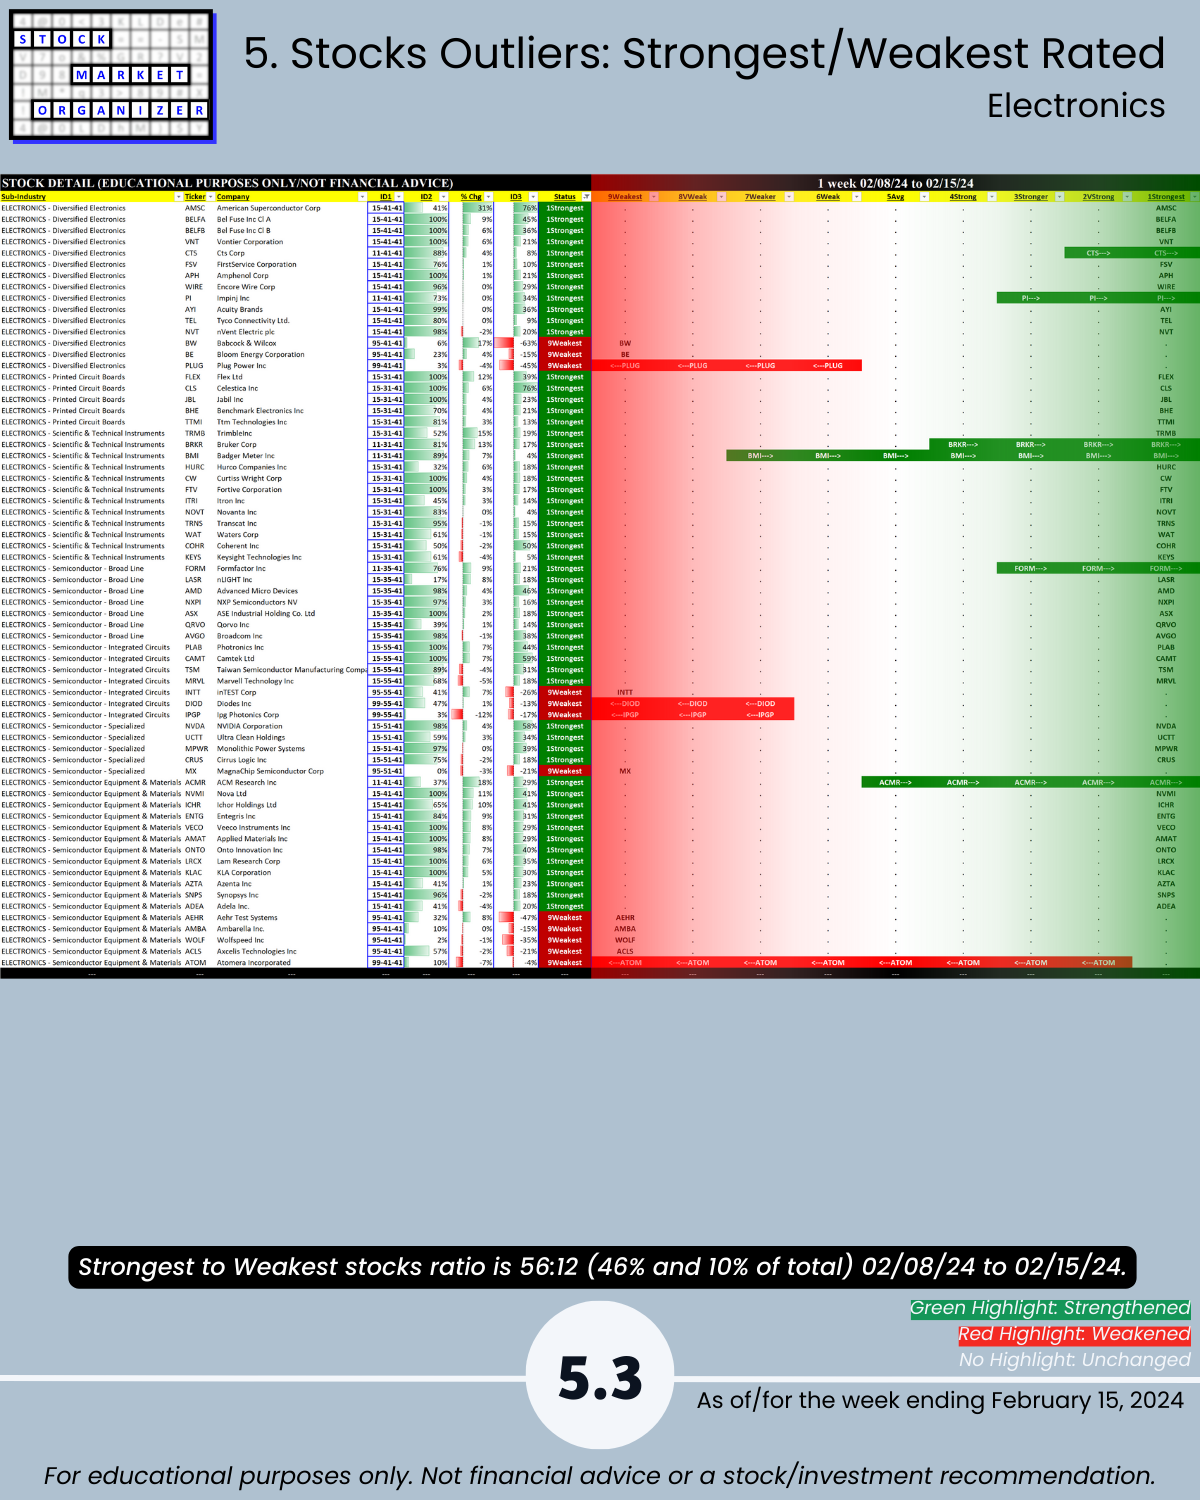
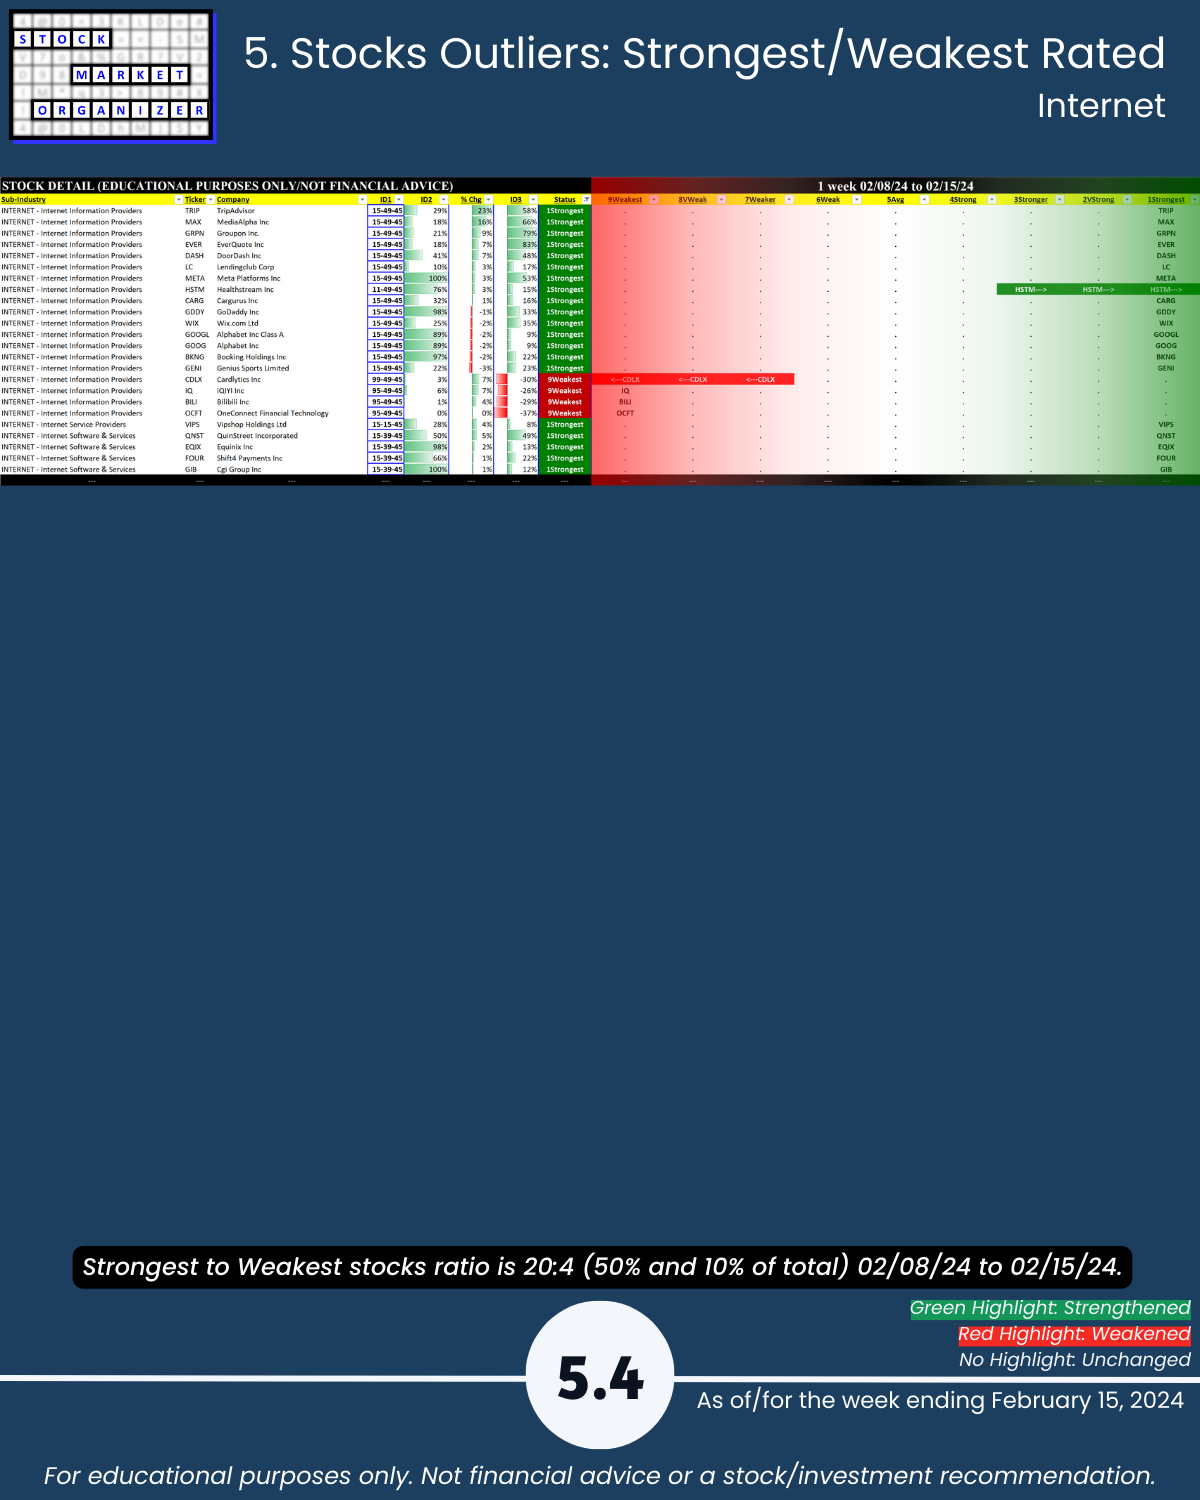
🔹 Stocks rated Strongest:Weakest: Computer Software 49%:8% of total, Electronics 46%:10%, Internet 50%:10%
🔹 Outliers: SMCI +44%, LTRX -27%; CLSK +64%, VERI +50%, LYFT +49%; SPWR +33%, AMSC +31%; TRIP +23%, INOD -25%
🔹 5-Year Highs/Lows %: Electronics industry 15%/1%
WHY CARE?
You subscribe to
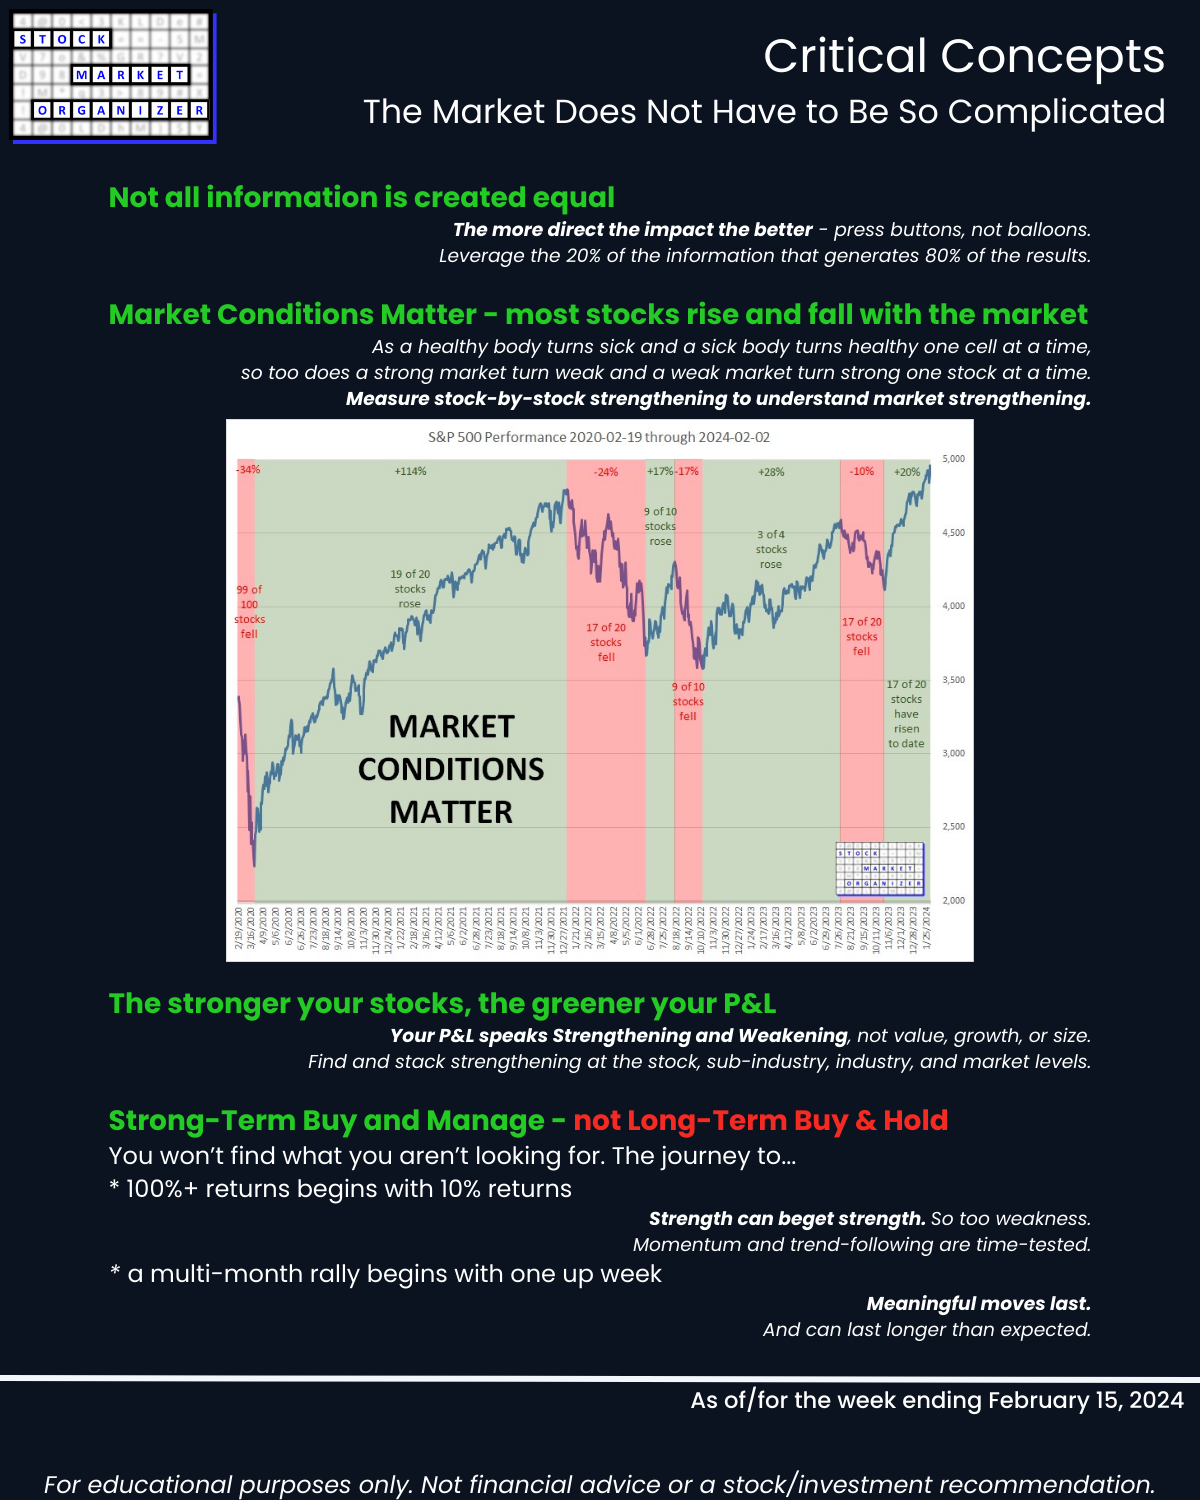
🔹 The stronger your stocks, the greener your P&L, and
🔹 It doesn’t have to be so complicated.
THIS TELLS YOU:
🔹 The strongest stocks in an industry/sub-industry, proven by their price action to be those which others are favoring.
SO WHAT? See if there are better options than whatever you may currently own.
🔹 Objective strengthening measurements of all stocks in a sub-industry and industry.
SO WHAT? Quickly see the best and worst stocks and ignore the rest.
🔹 If a stock’s sub-industry and industry are currently strengthening.
SO WHAT? Know if the sub-industry and industry currently support new entries, or if you are better off waiting.
🔹 If now is a good time for new long positions based on current market strengthening or weakening.
SO WHAT? Know if the market currently supports new entries, or if you are better off waiting.
HOW?
By tracking strengthening and weakening from the individual stock level up through the market level.
This report may particularly be of interest if the following 5 concepts resonate with you:
- The stronger your stocks, the greener your P&L.
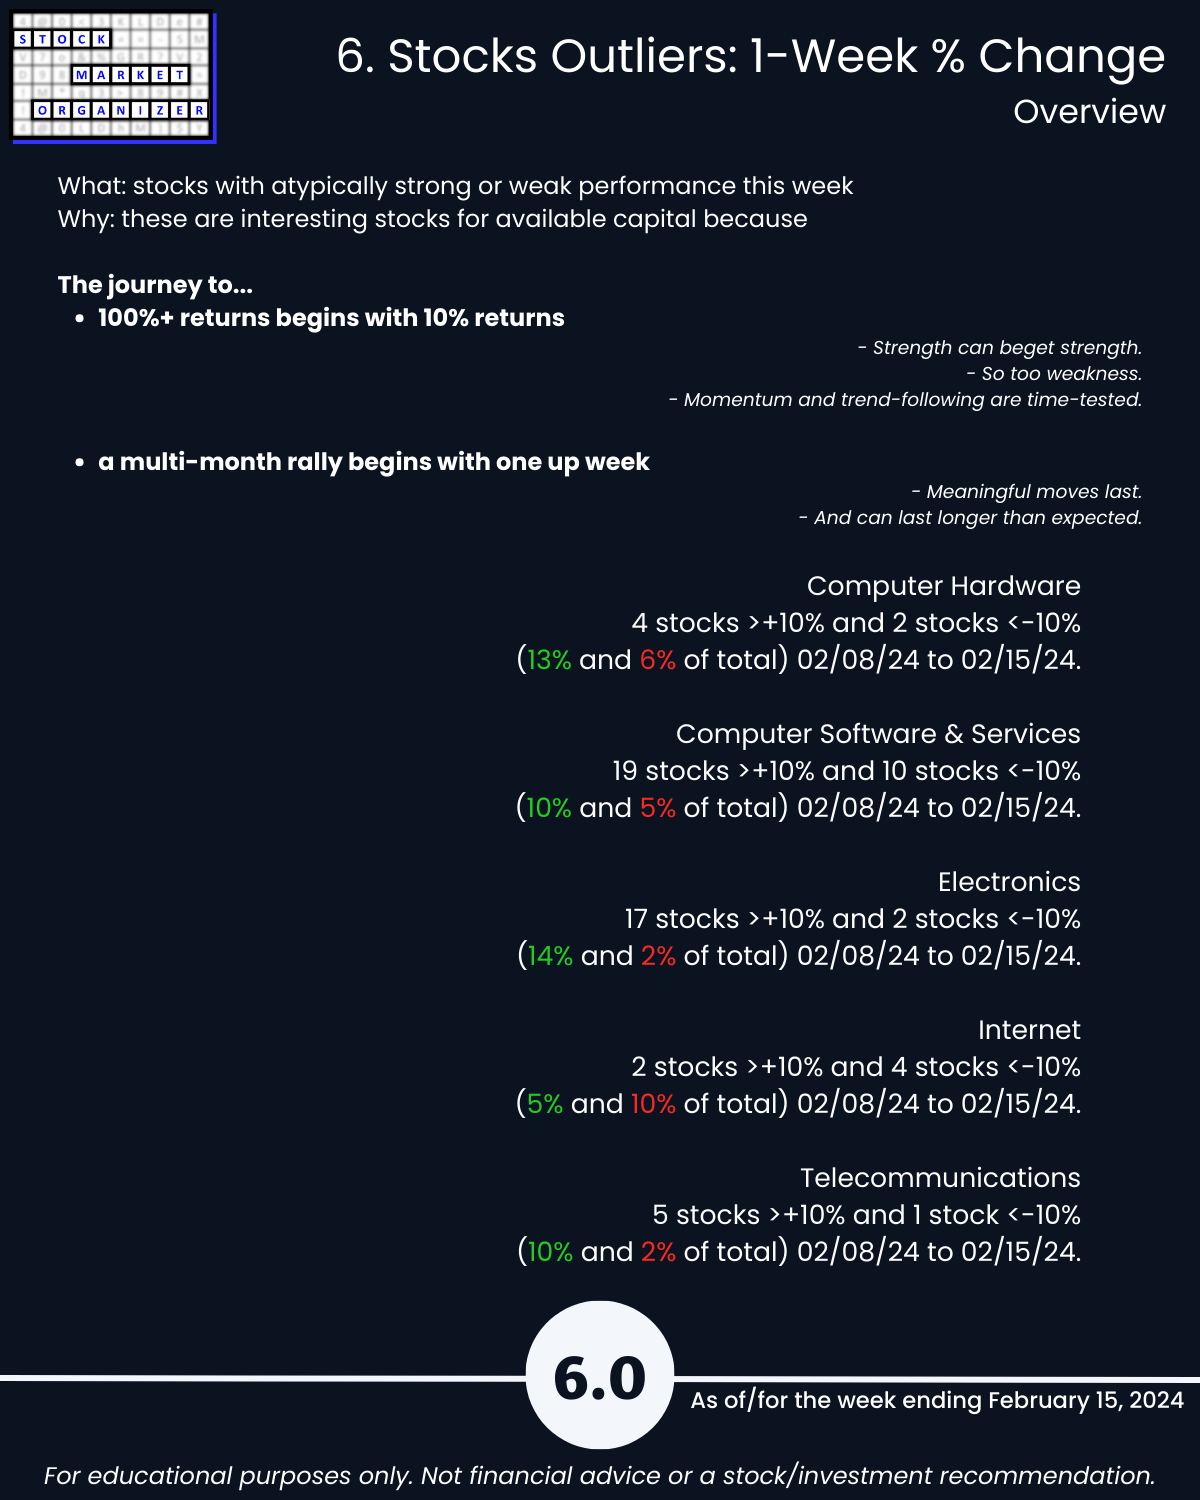
- The journey to 100%+ returns begins with 10% returns.
- The journey to a multi-month rally begins with one up week.
- Most stocks do what the market does. (While the market can only do what its underlying stocks, sub-industries, and industries do.)
- 80/20: not all information is created equal. (Press buttons, not balloons.)
Following are galleries with page-by-page views of this report.
1. Introduction
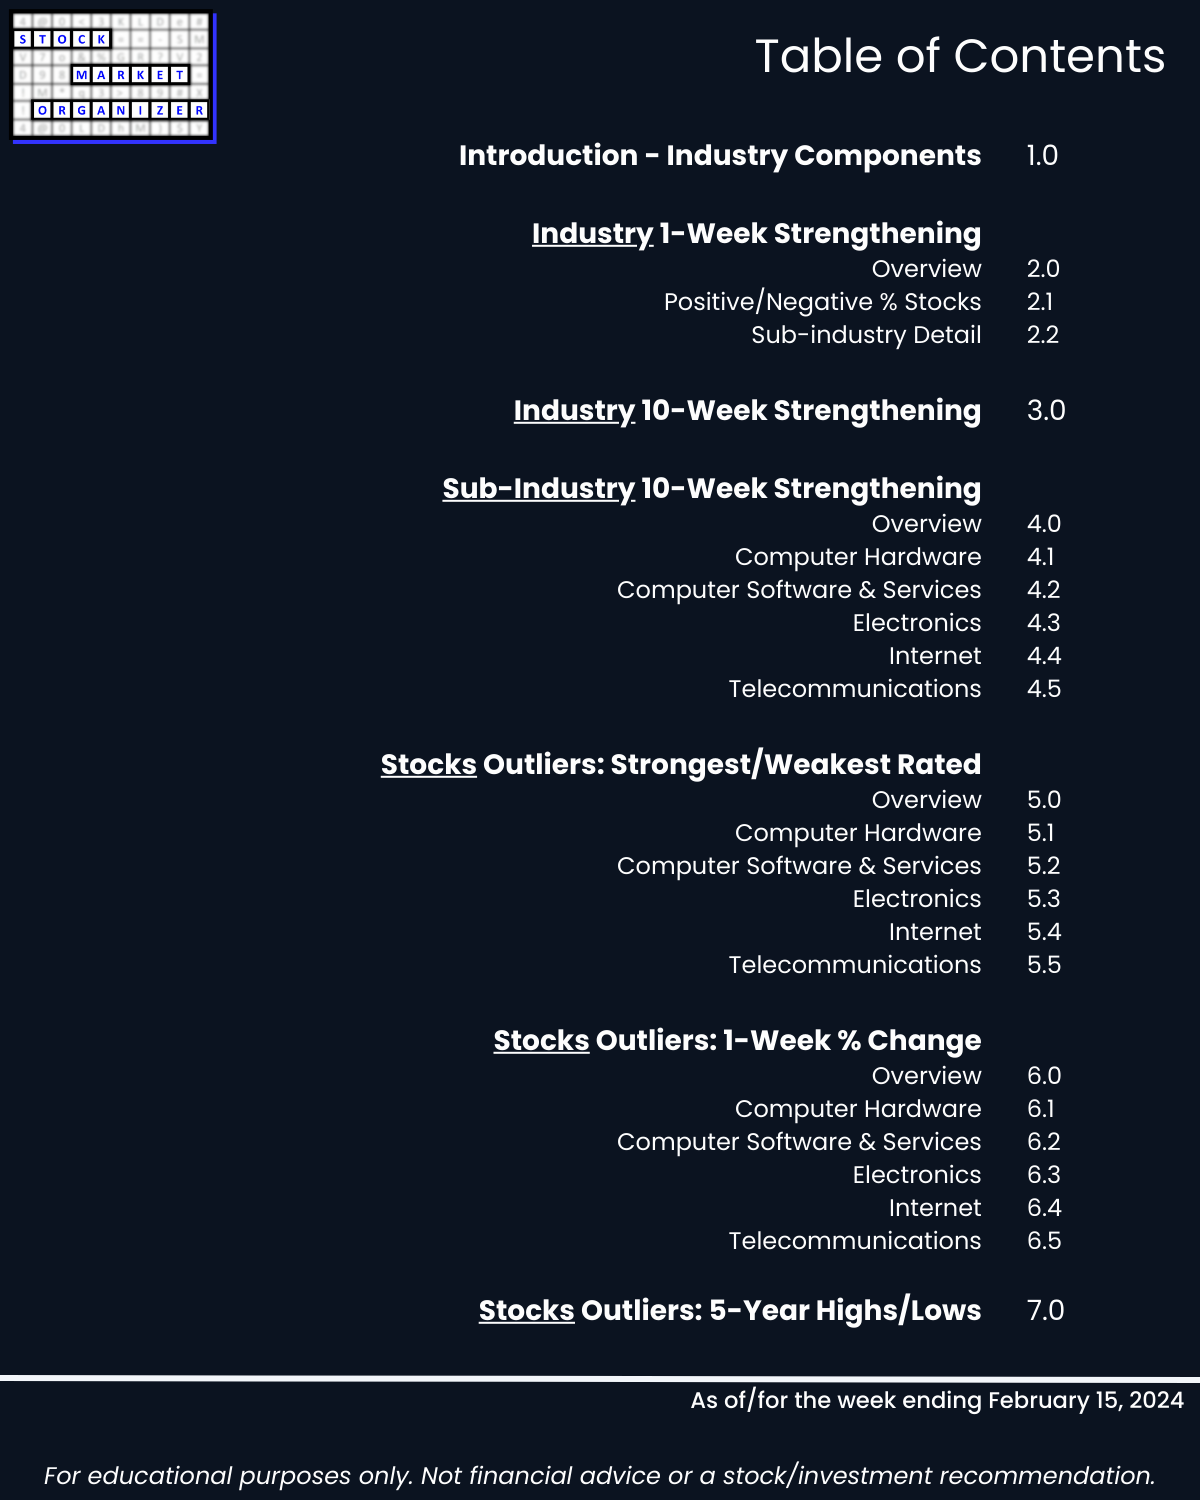
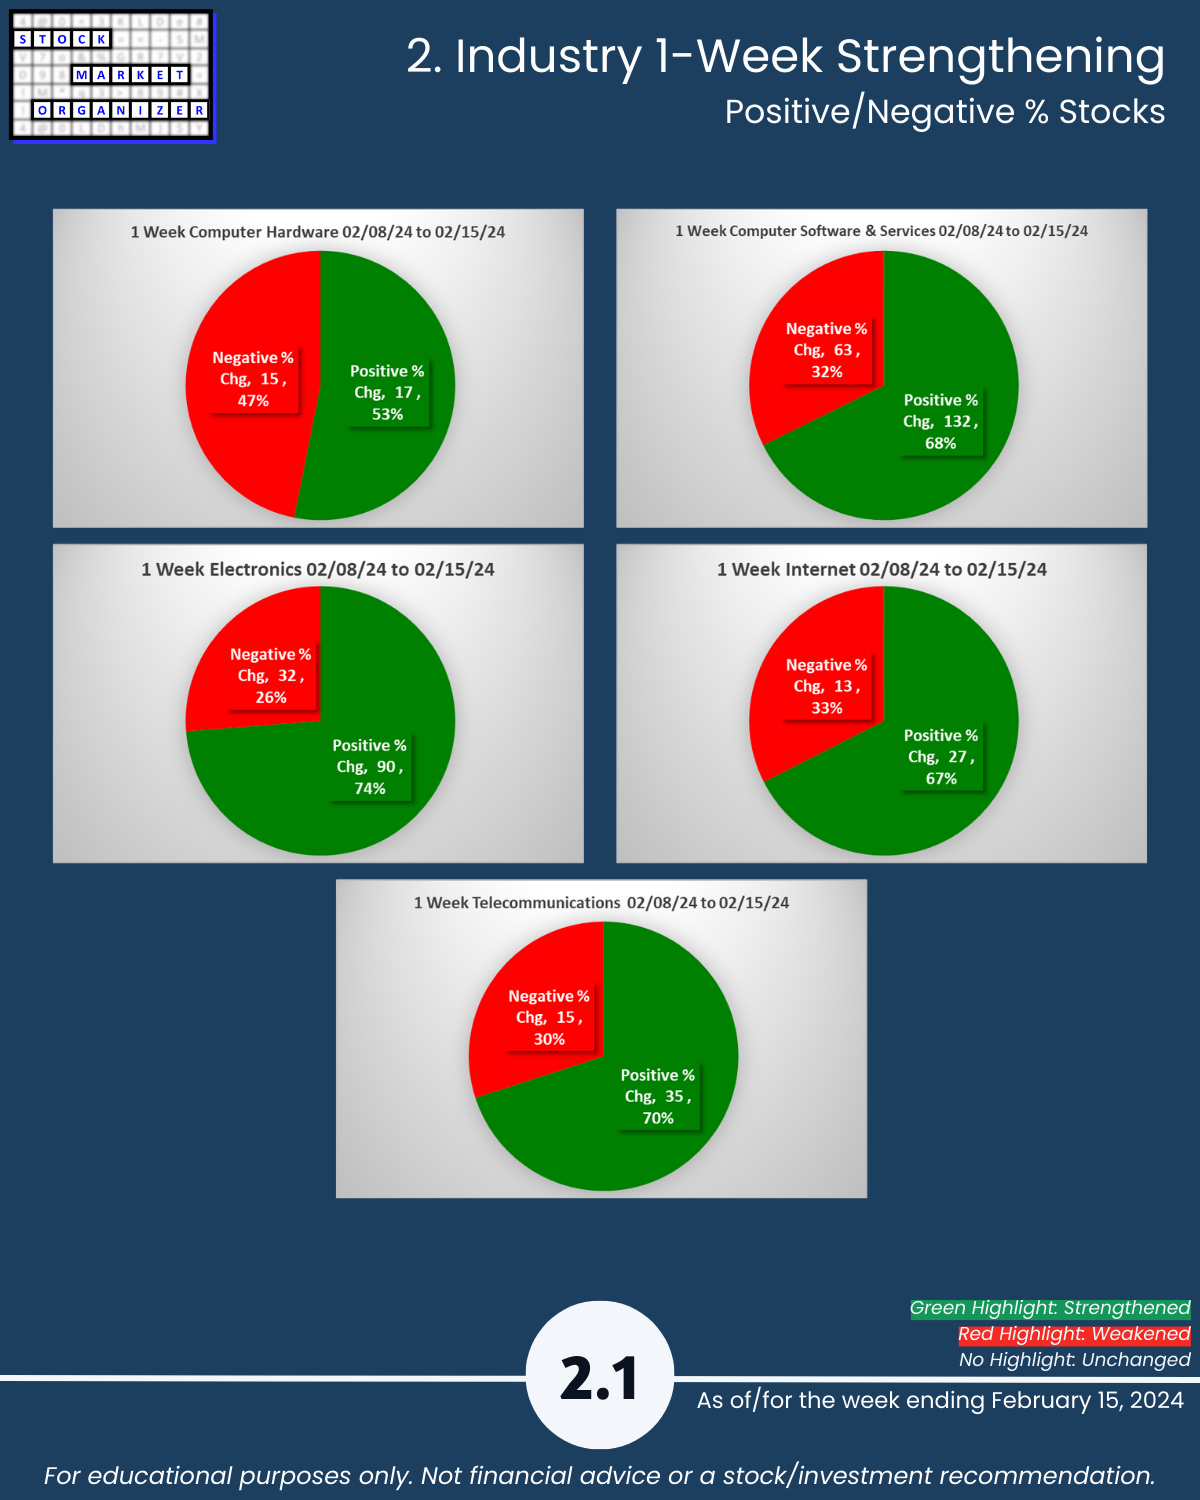
2. Industry 1-Week Strengthening
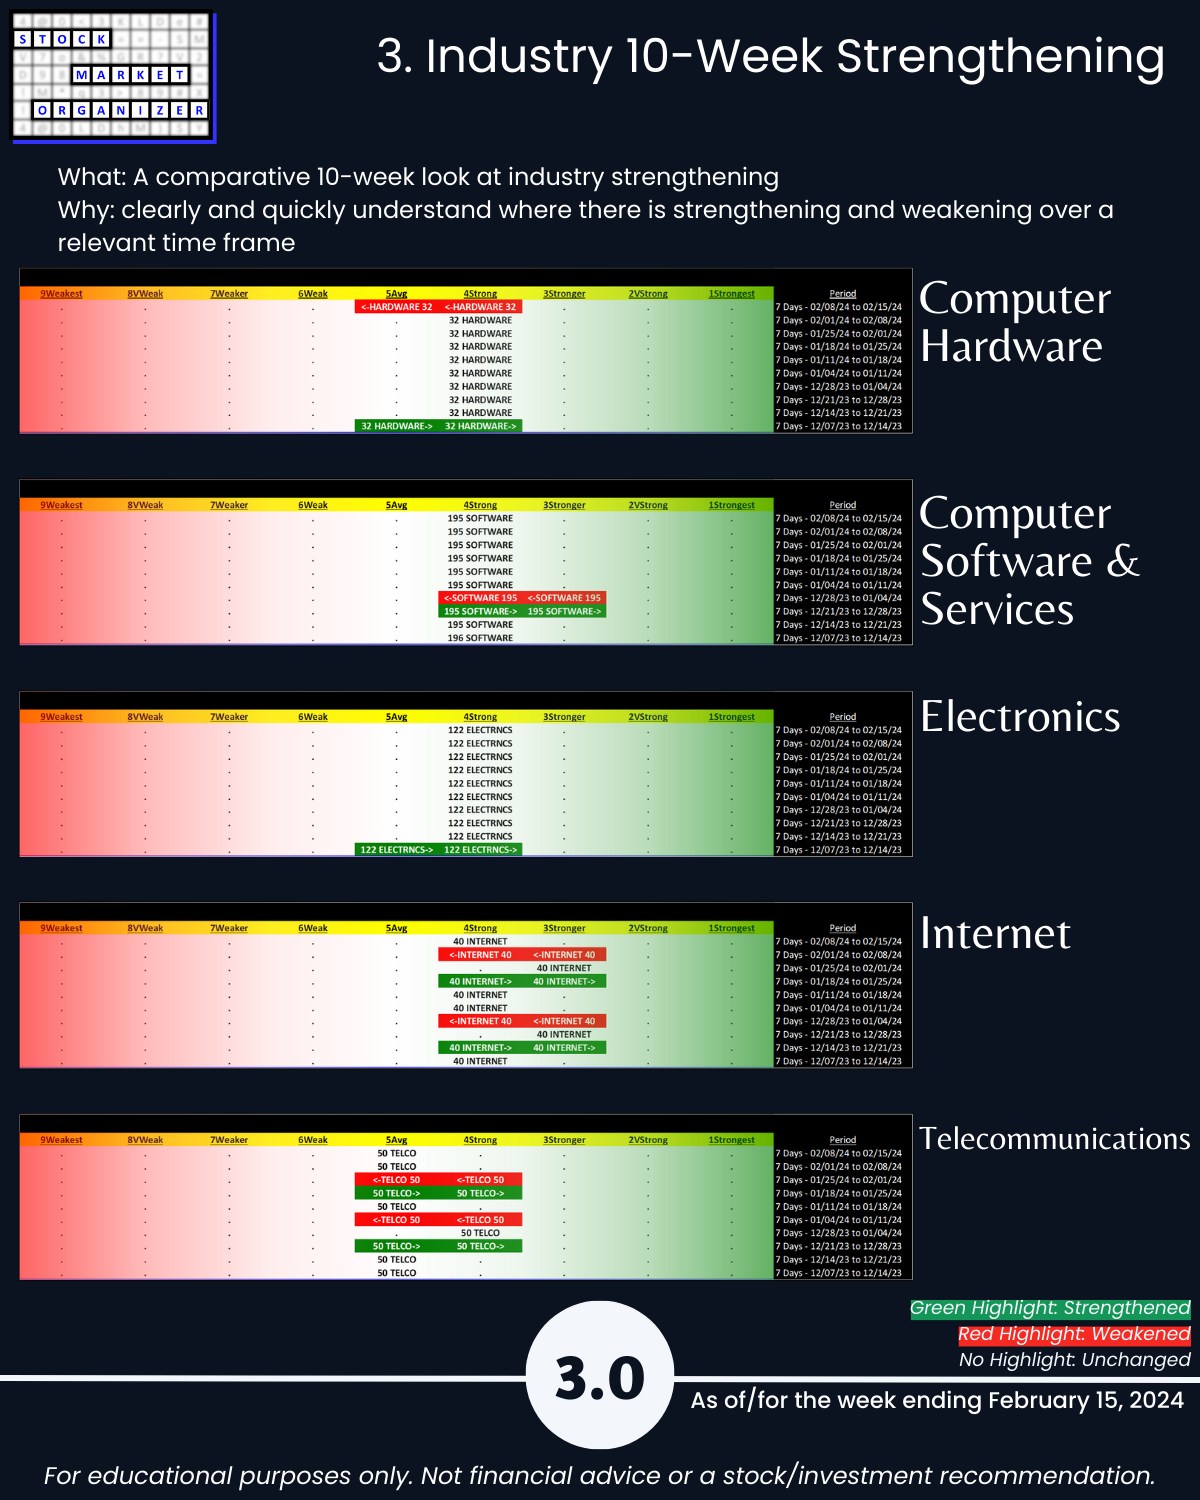
3. Industry 10-Week Strengthening
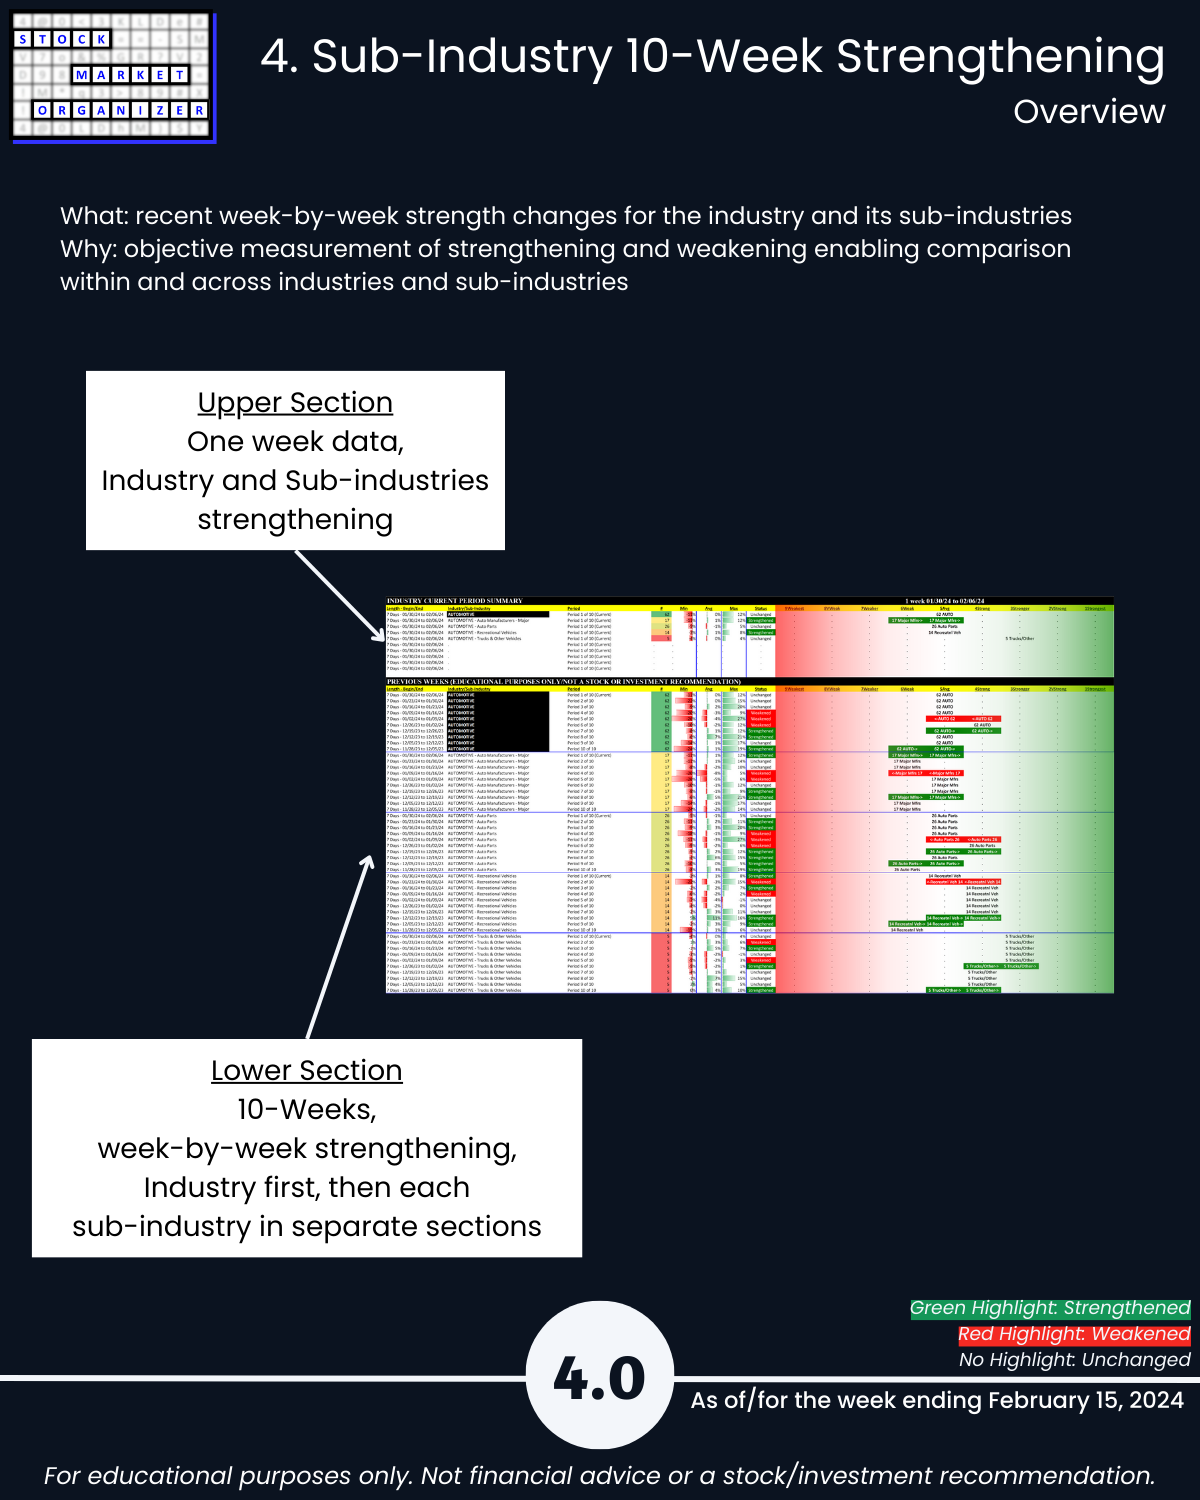
4. Sub-Industry 10-Week Strengthening
5. Stocks Outliers: Strongest/Weakest Rated
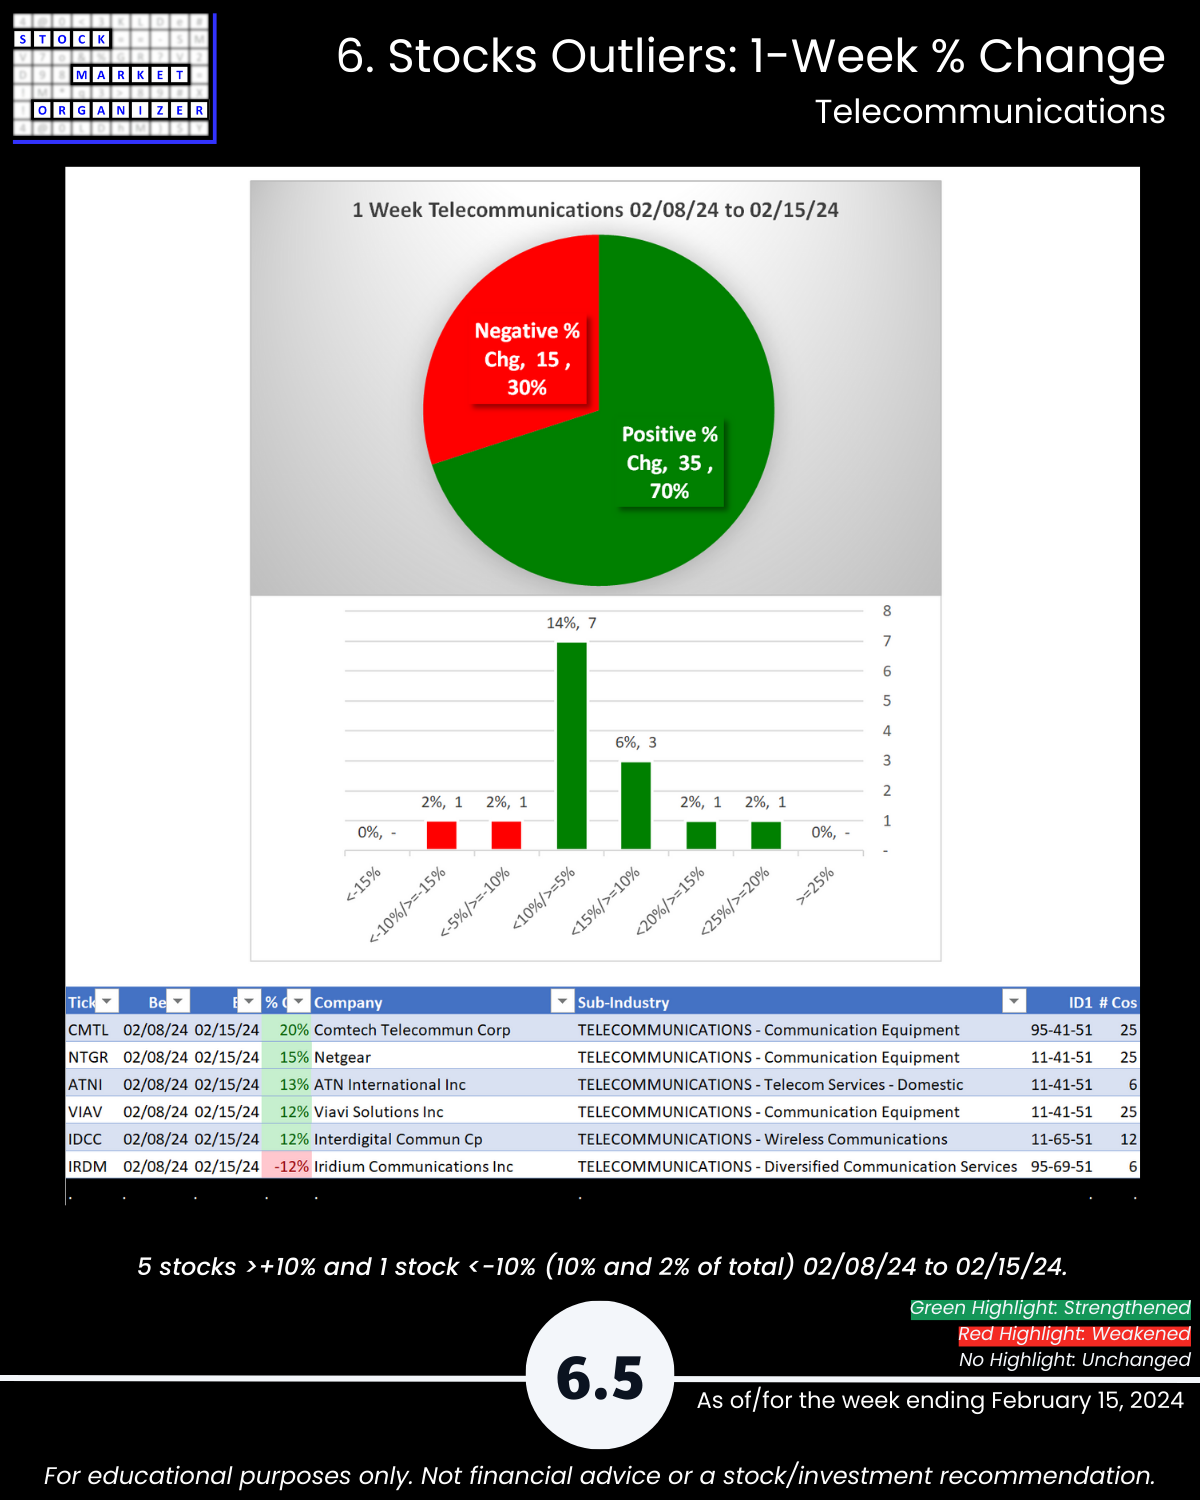
6. Stocks Outliers: 1-Week % Change
7. Stocks Outliers: 5-Year Highs/Lows