SMO Exclusive: Strength Report Technology Sector 2024-02-08

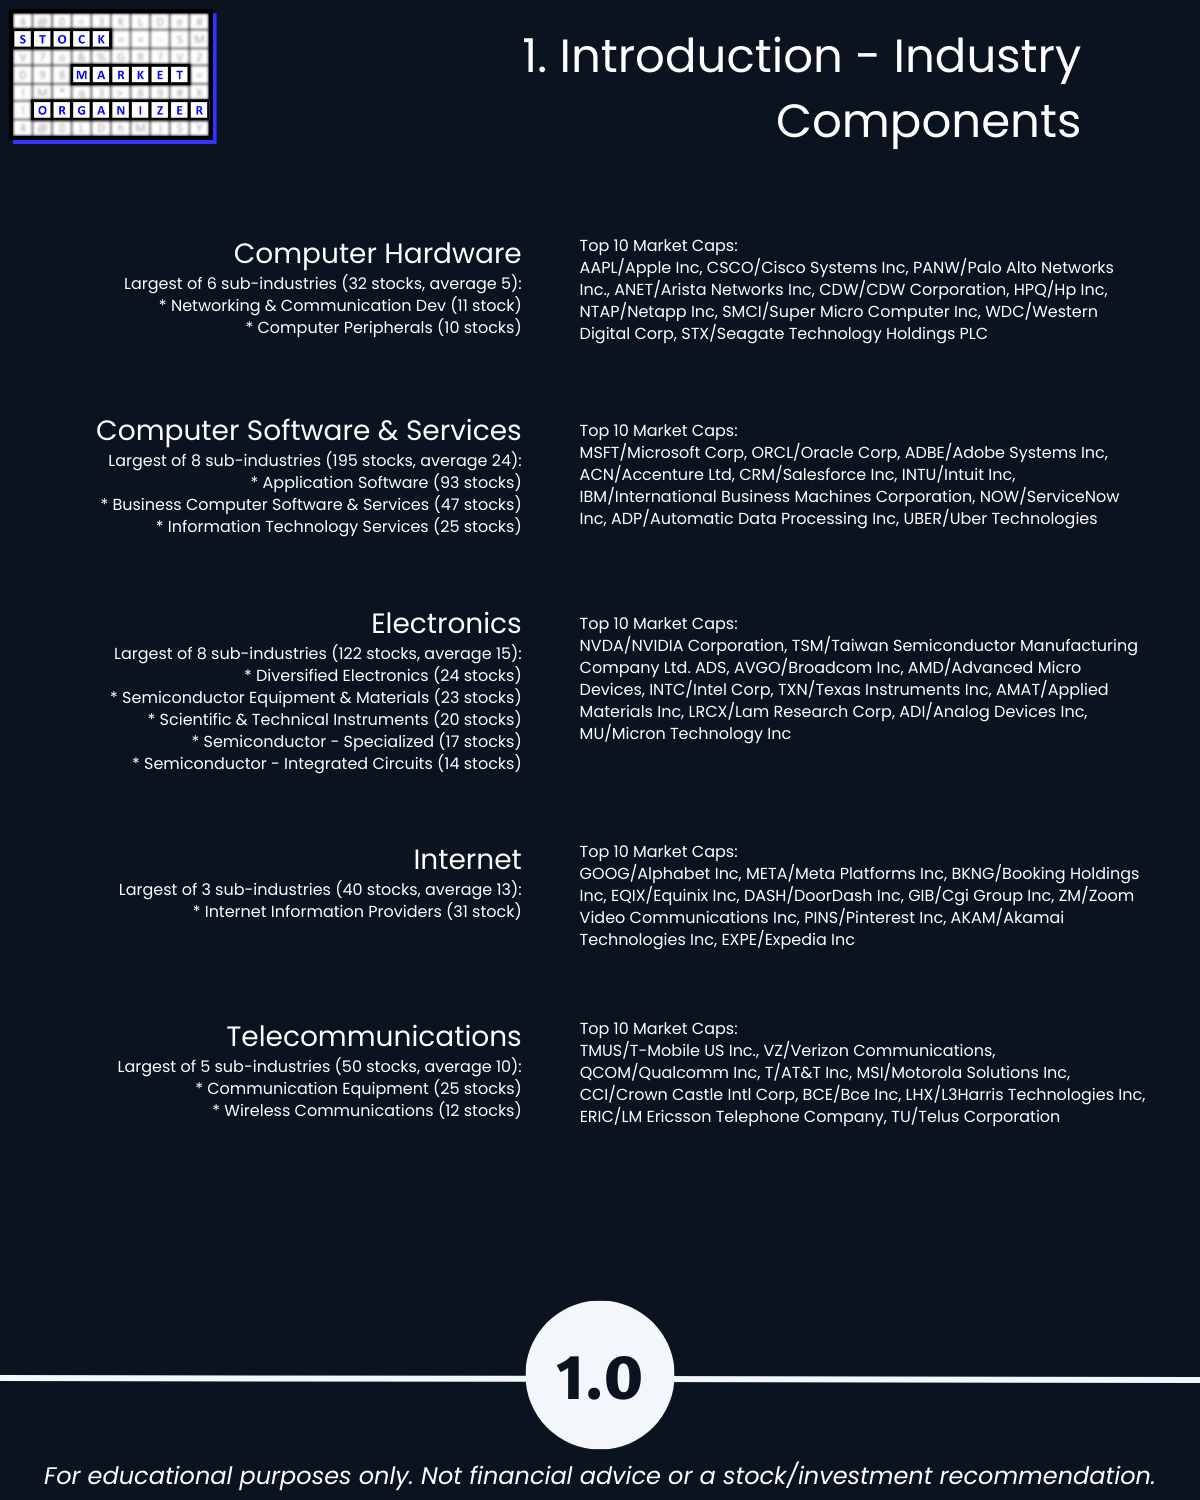
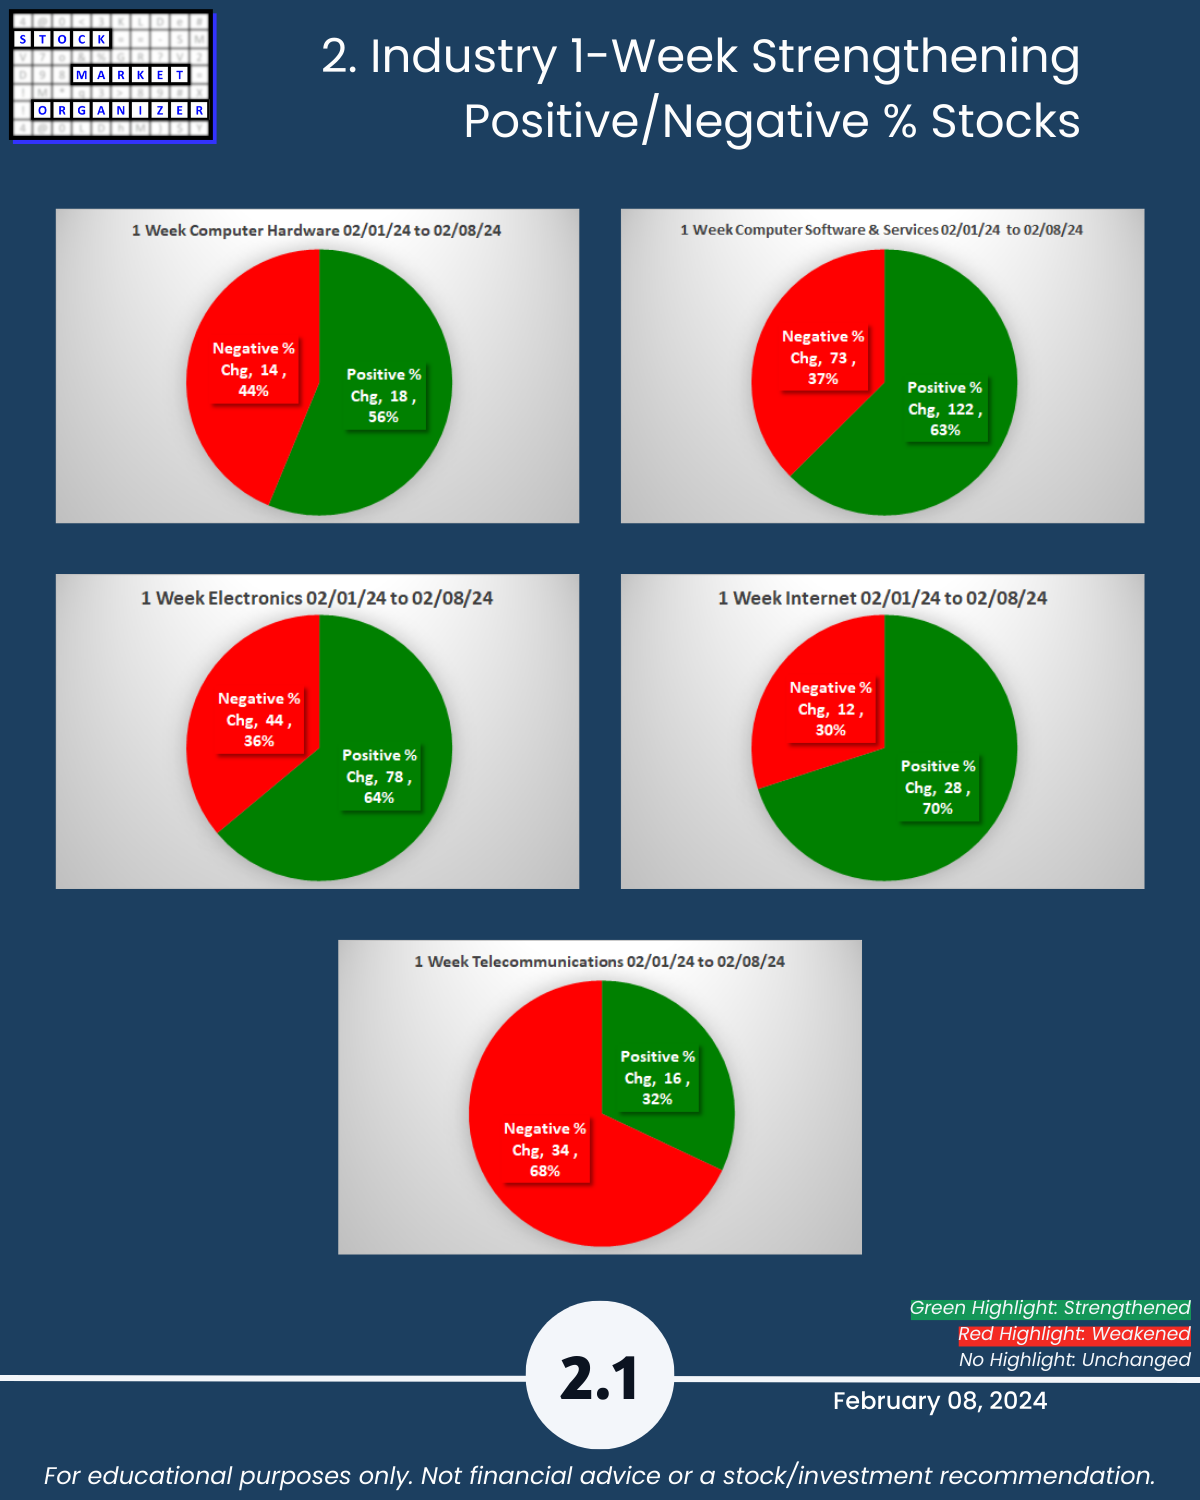
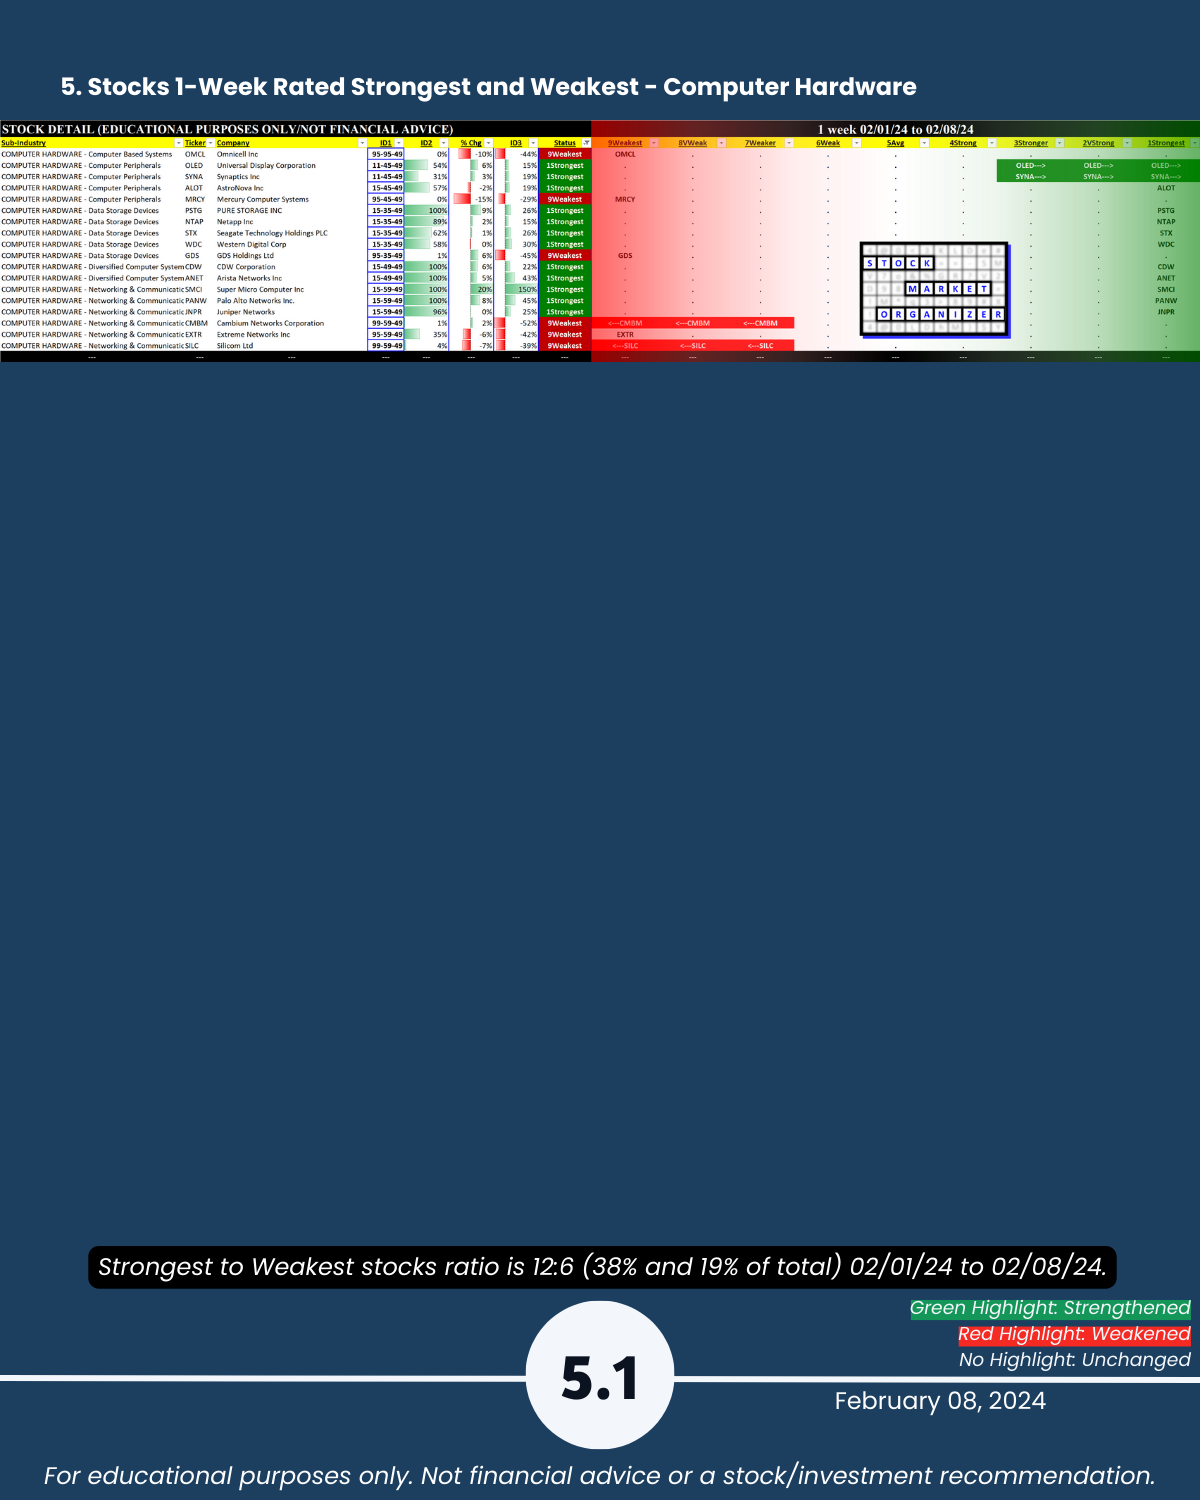
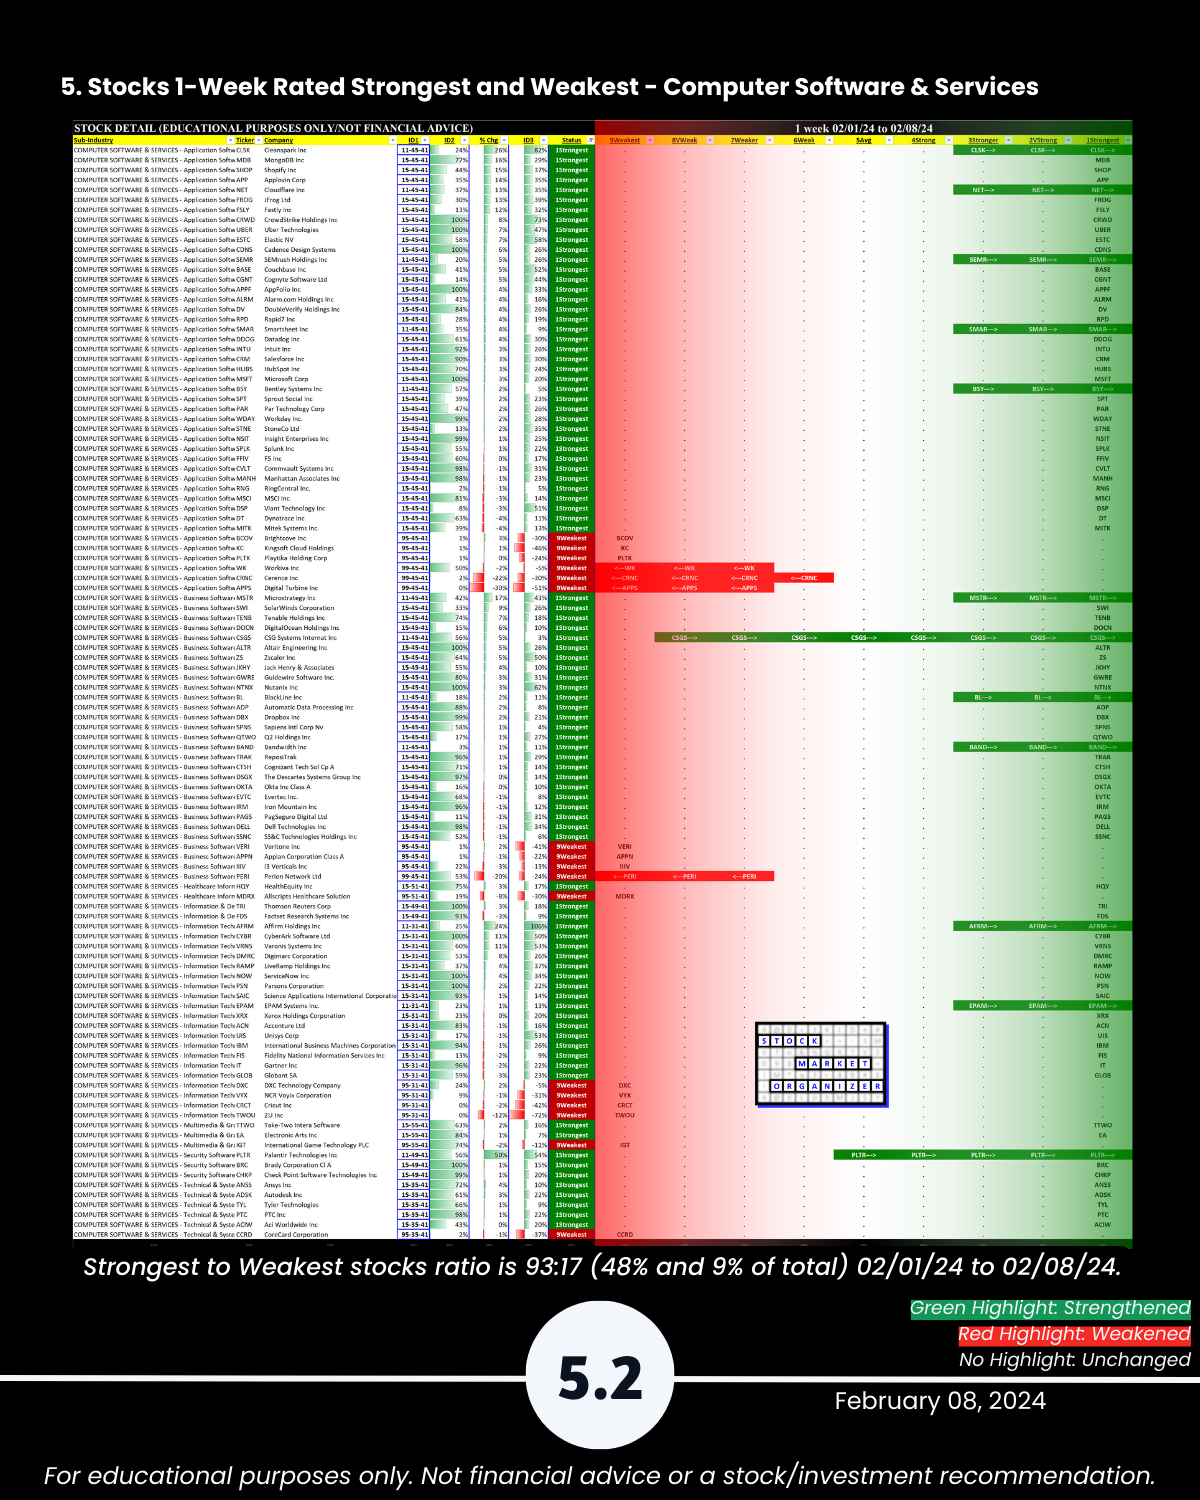
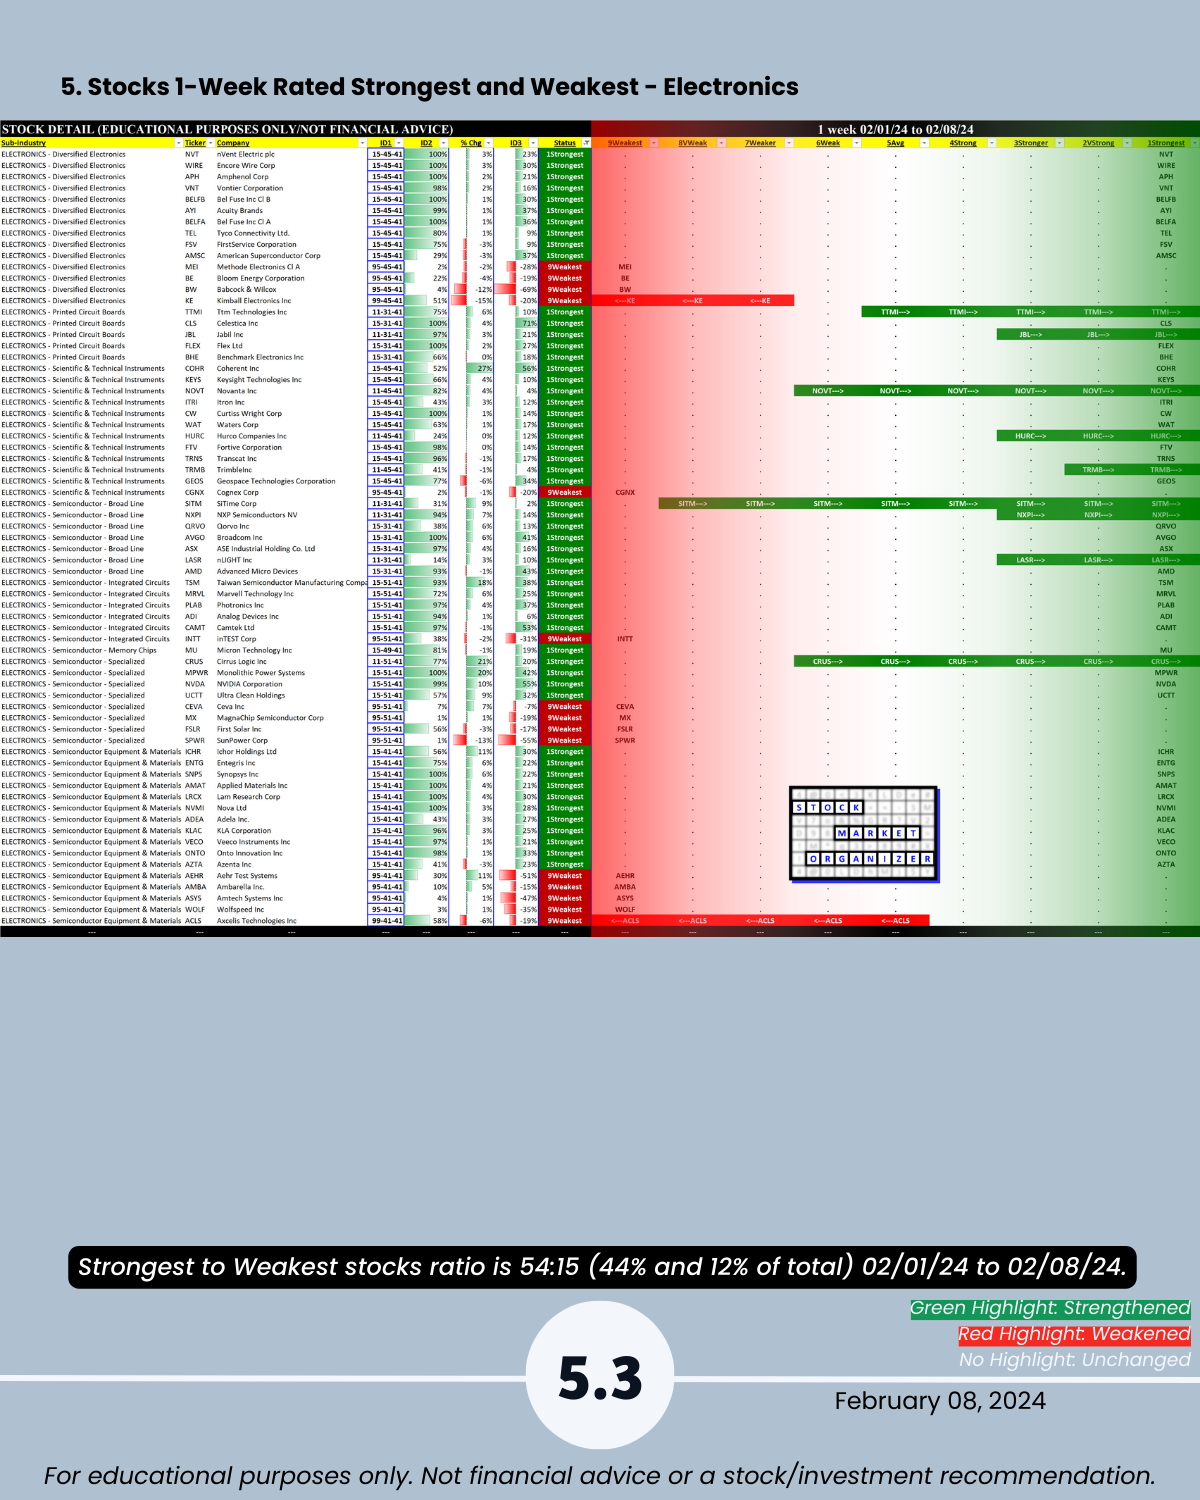
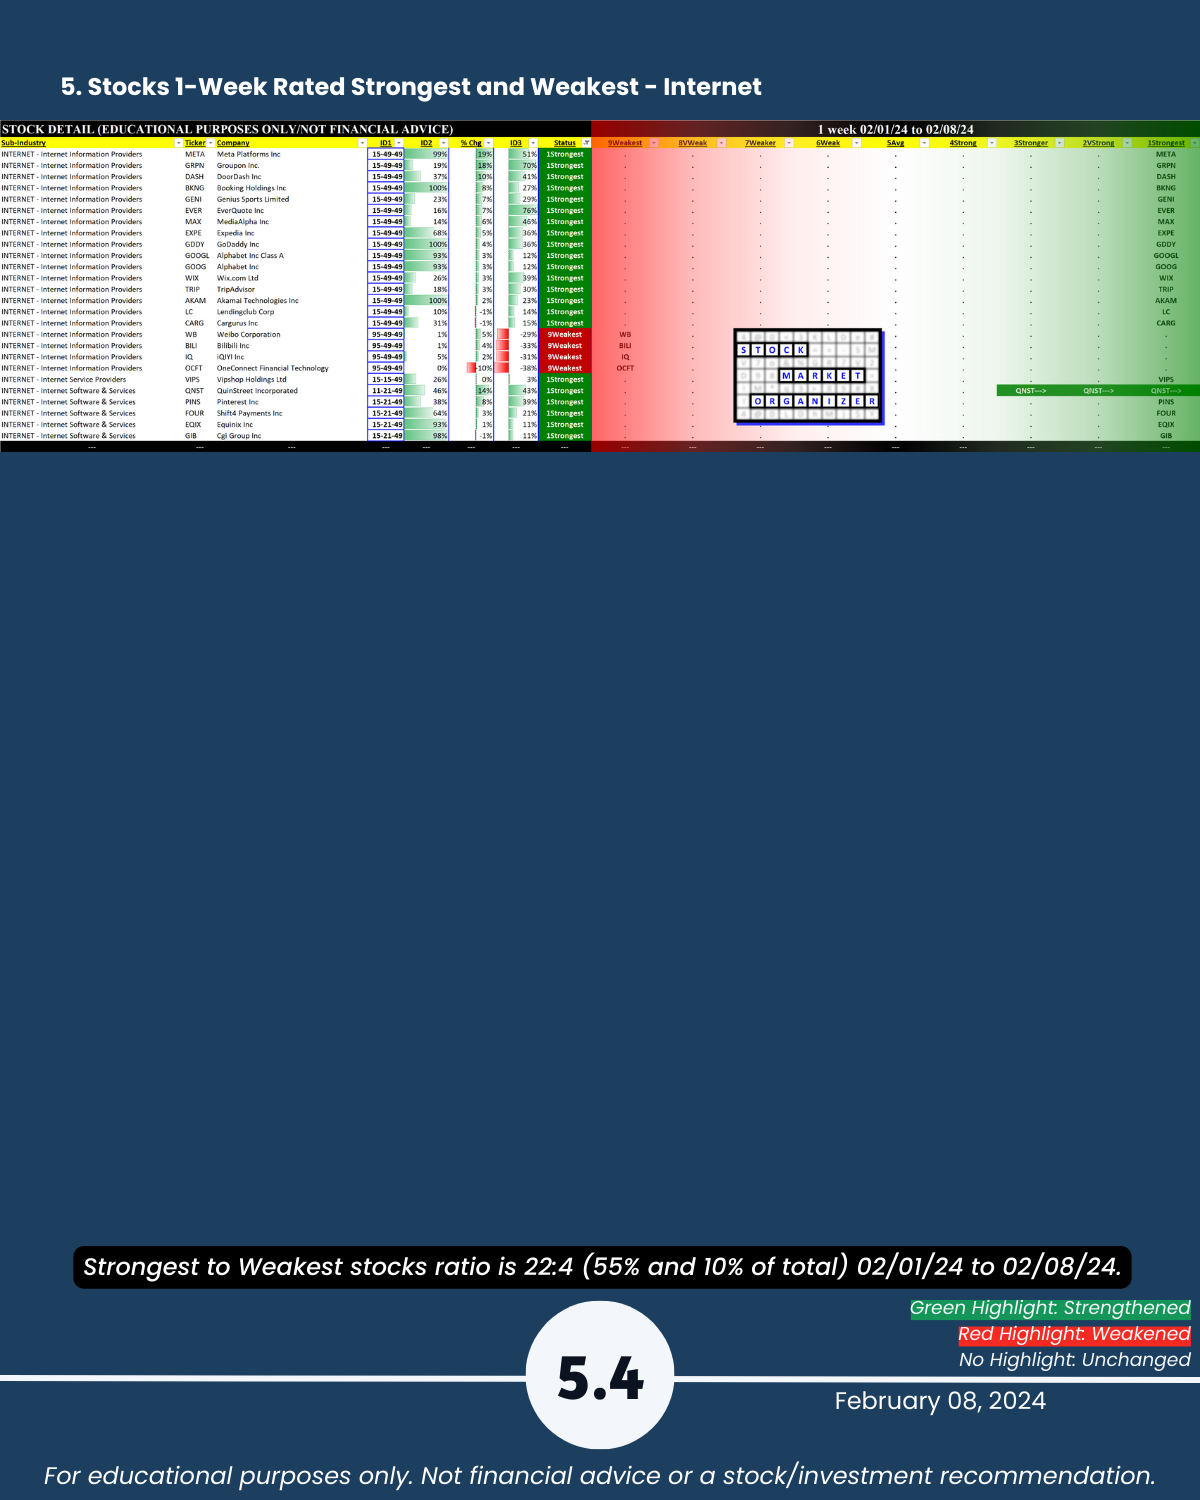
Today: Tech. Is there any legitimate reason NOT to look for strength in the market? With its +50% week PLTR says “hold my beer” to SMCI (+20% this week after +23% last week). NVDA +10% for the week to $696, continuing its explosive run after blasting through $500/share 1/8/24. Attached: an organized 2/8/24 Tech sector strengthening/weakening analysis. Includes Strongest- and Weakest-rated Stock Market Organizer stocks and objective strengthening/weakening measurements in Computer Hardware, Computer Software & Services, Electronics (Chips/Semis), Internet, and Telecommunications.
Top 3 gainers PLTR +50%, COHR +27%, CLSK +26%.
Is there really a breadth issue? Stocks at multi-year (if not all-time) highs: MPWR, SMCI, CYBR, PSTG, PANW, BKNG, AVGO, CDW, CDNS, SNPS, ANET, ALTR, APPF, CLS, GDDY, NOW (low $700s important?), NVMI, NVT, TRI, NTNX, MSFT, WIRE, APH, AKAM ($120 area = peak for several years, now at $127), FLEX, BELFB/A, LCRX, AMAT, CW, BRC (like AKAM now above an area which has been a peak for several years - $61.49 close, high $50s peaks back to 2019).
Takeaways:
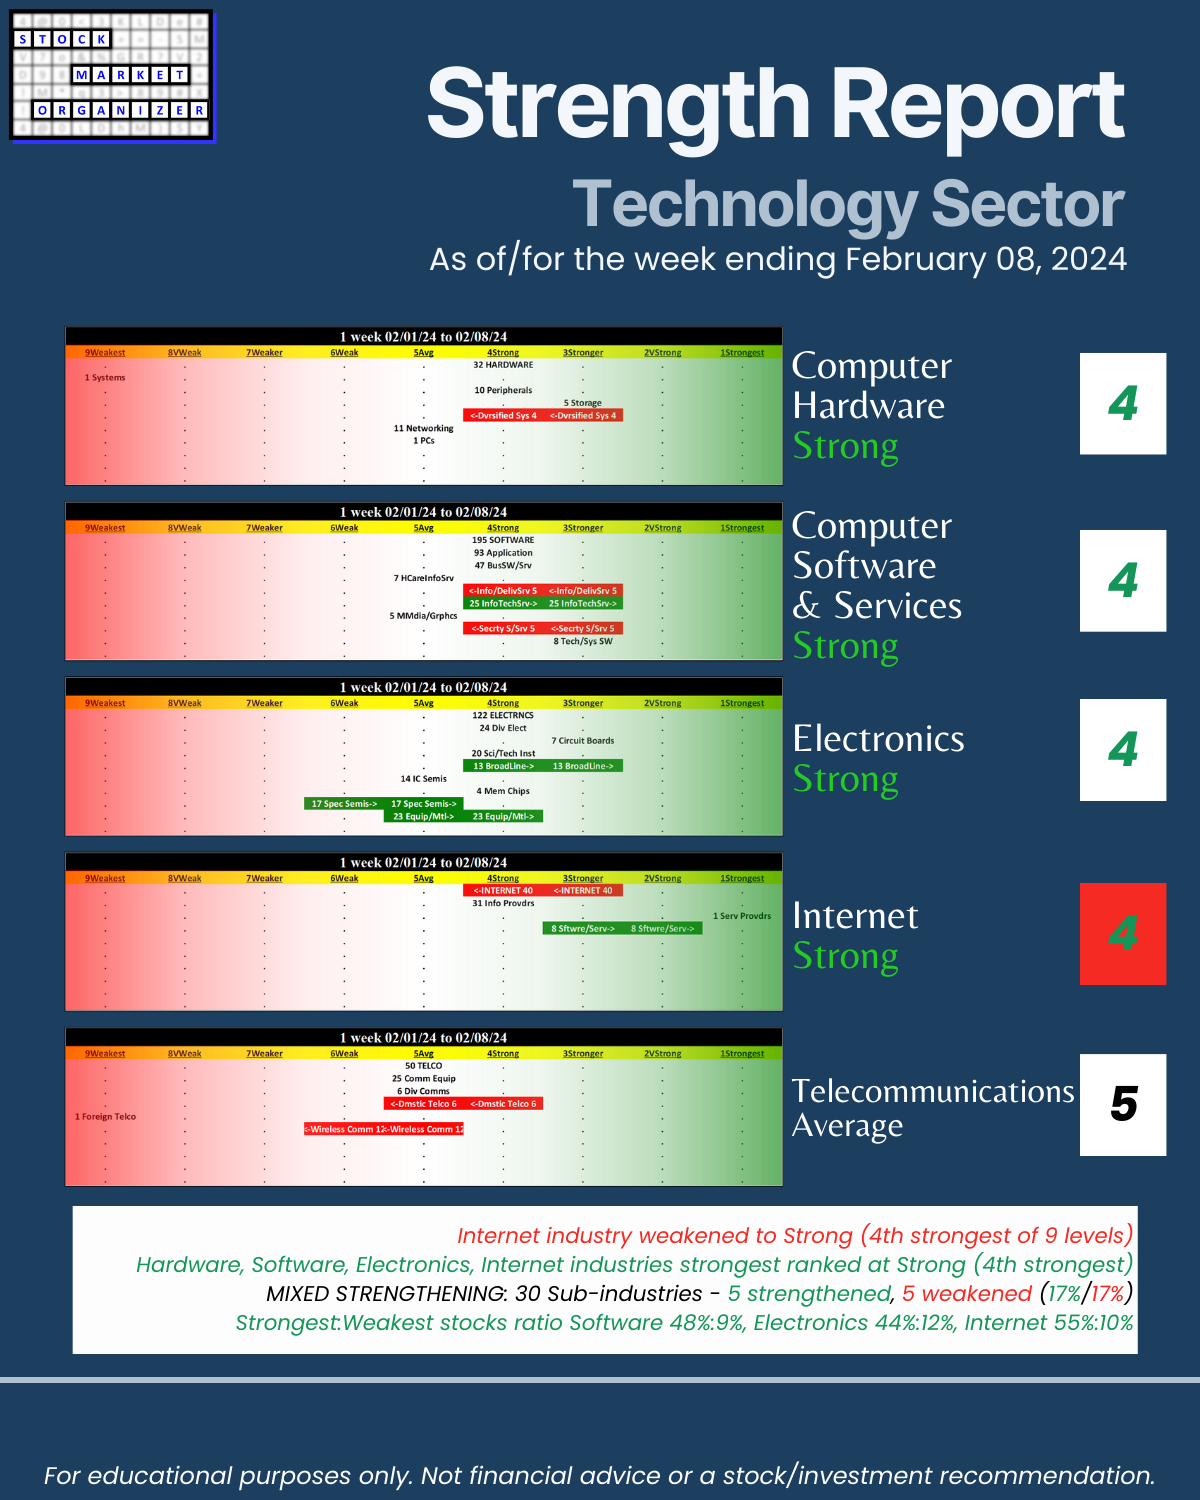
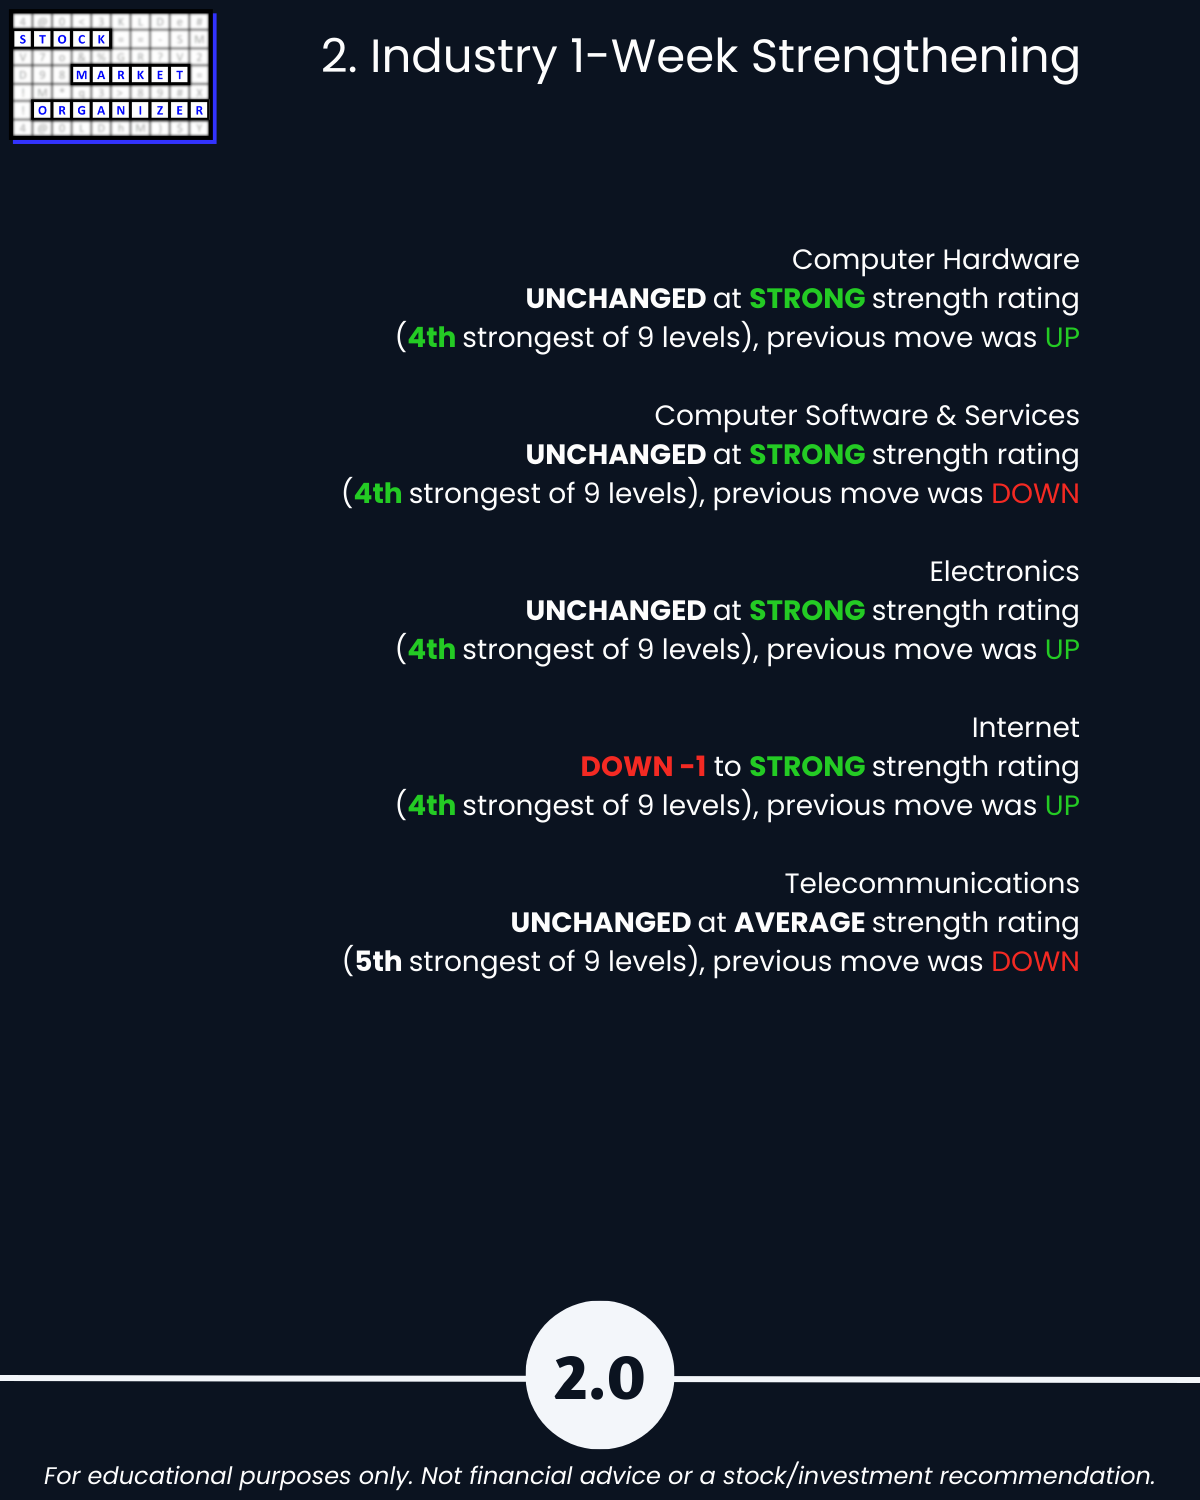
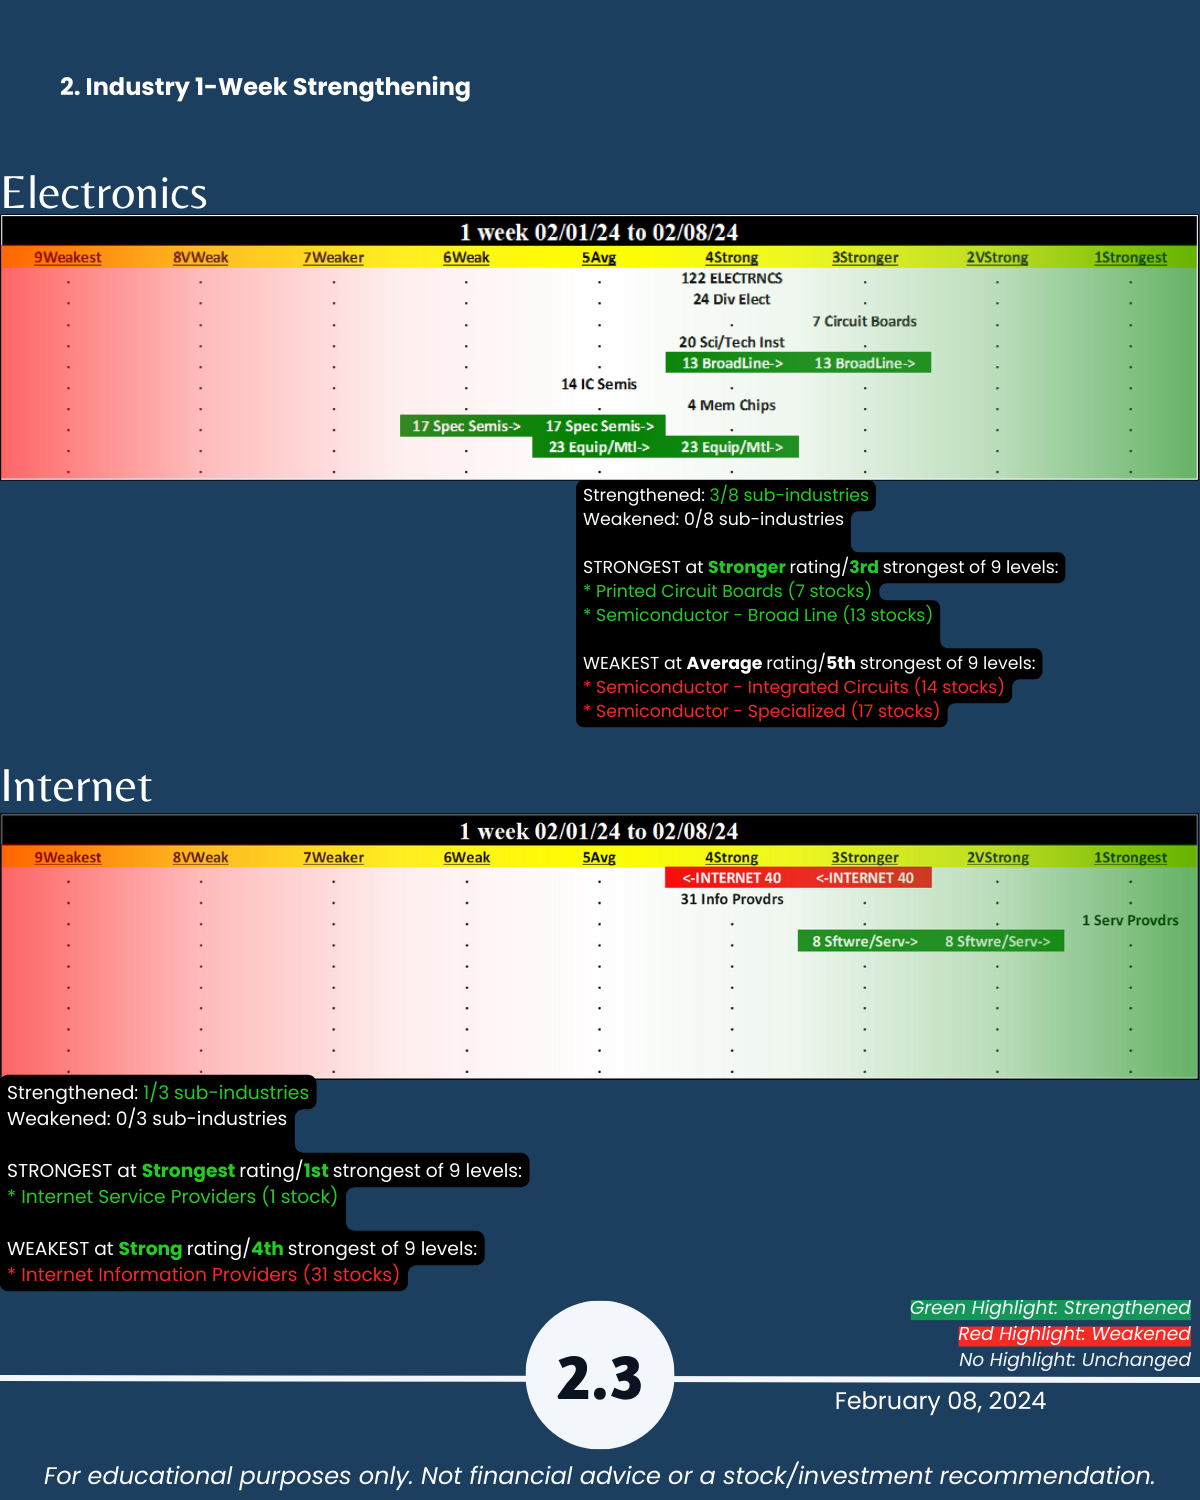
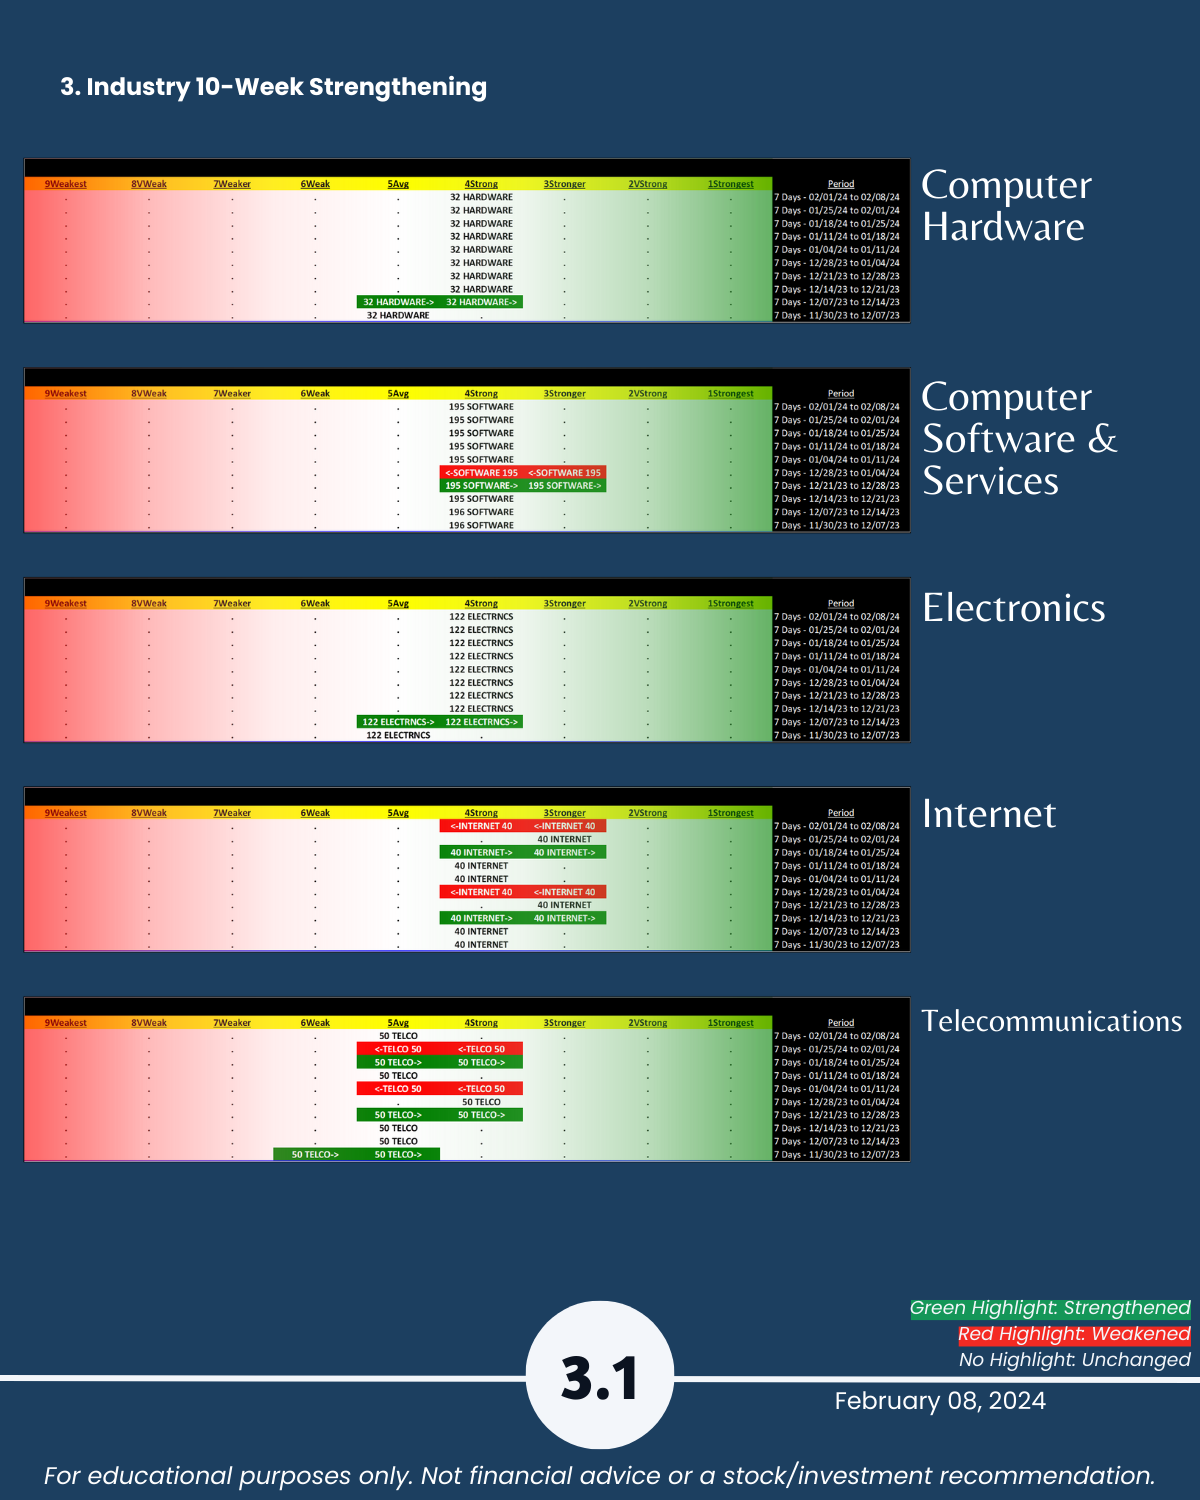
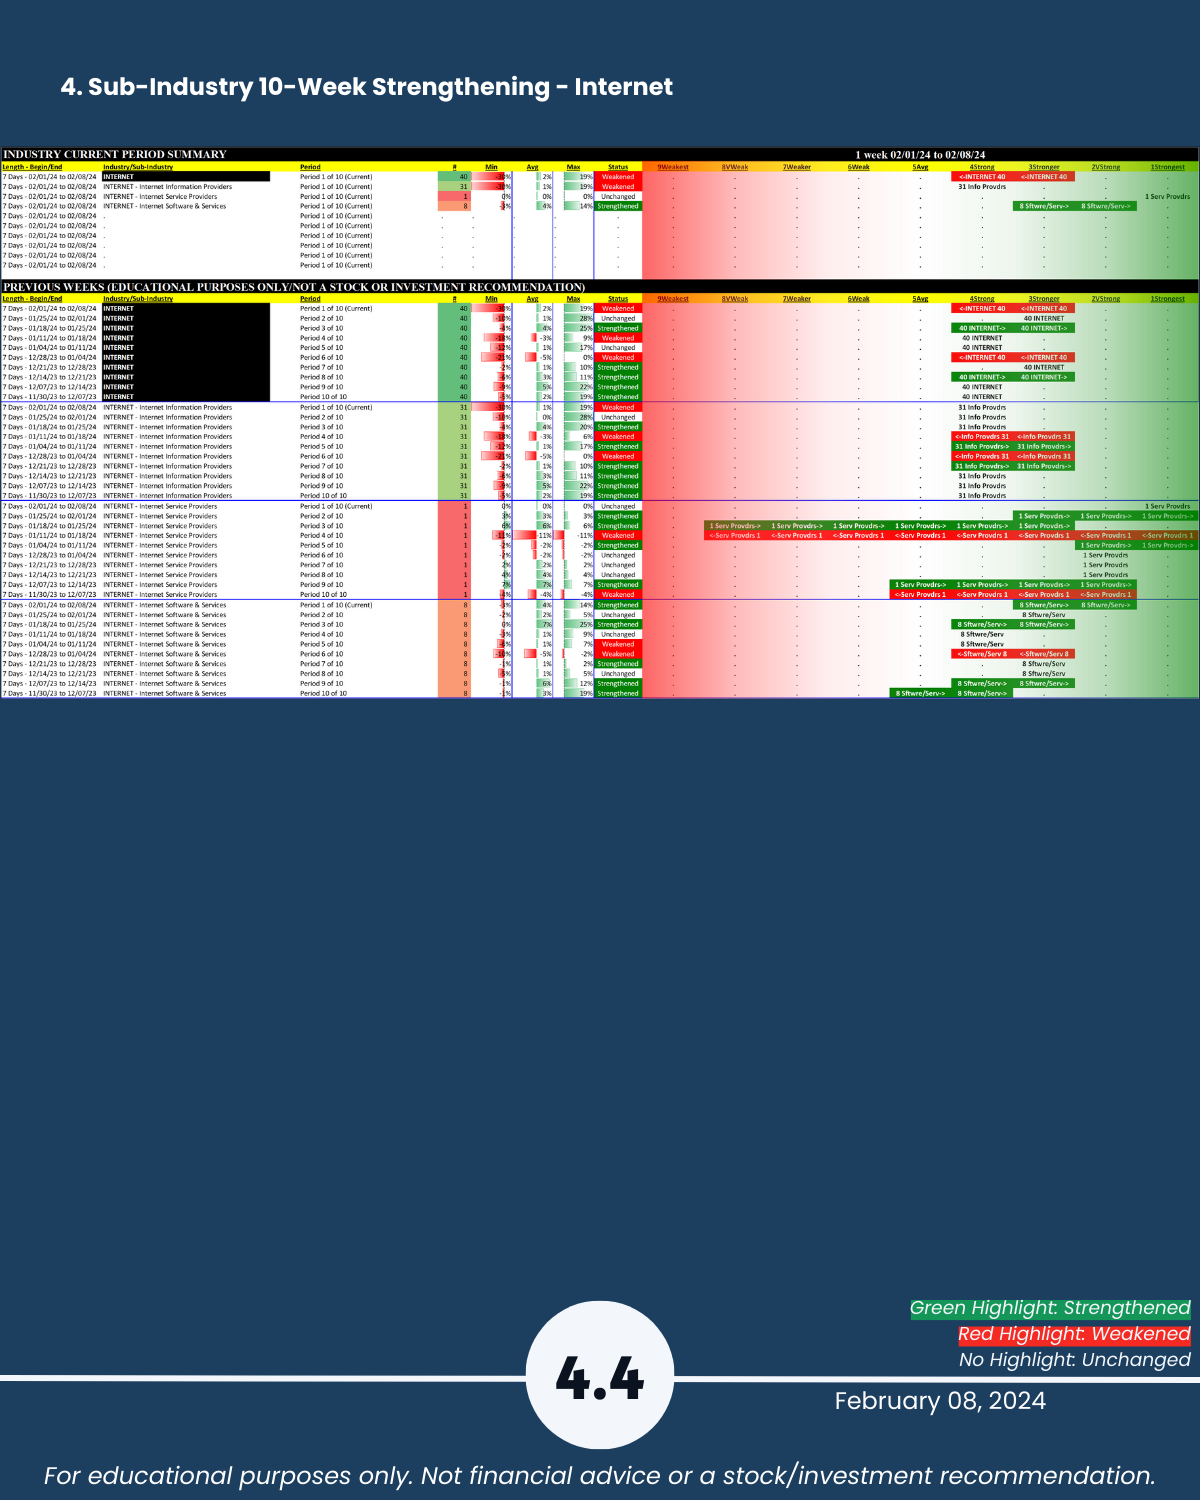
🔹 Internet industry weakened to Strong (4th strongest of 9 levels)
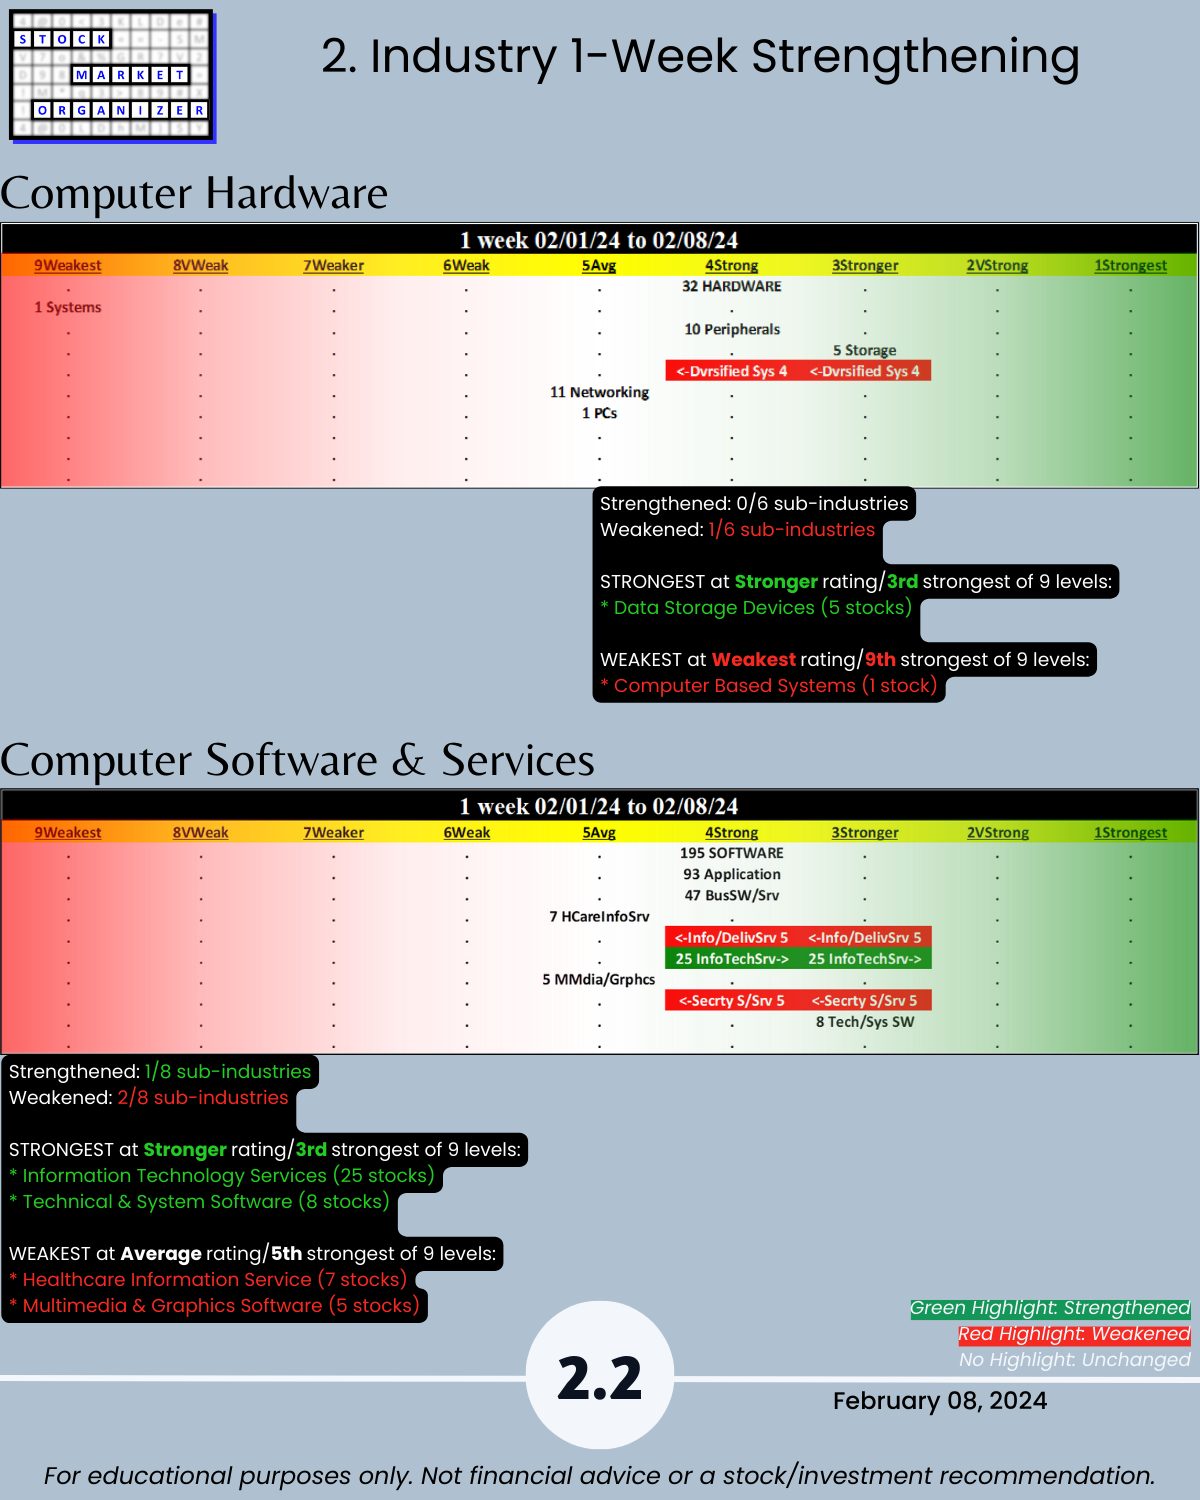
🔹 Hardware, Software, Electronics, Internet industries strongest ranked at Strong (4th strongest)
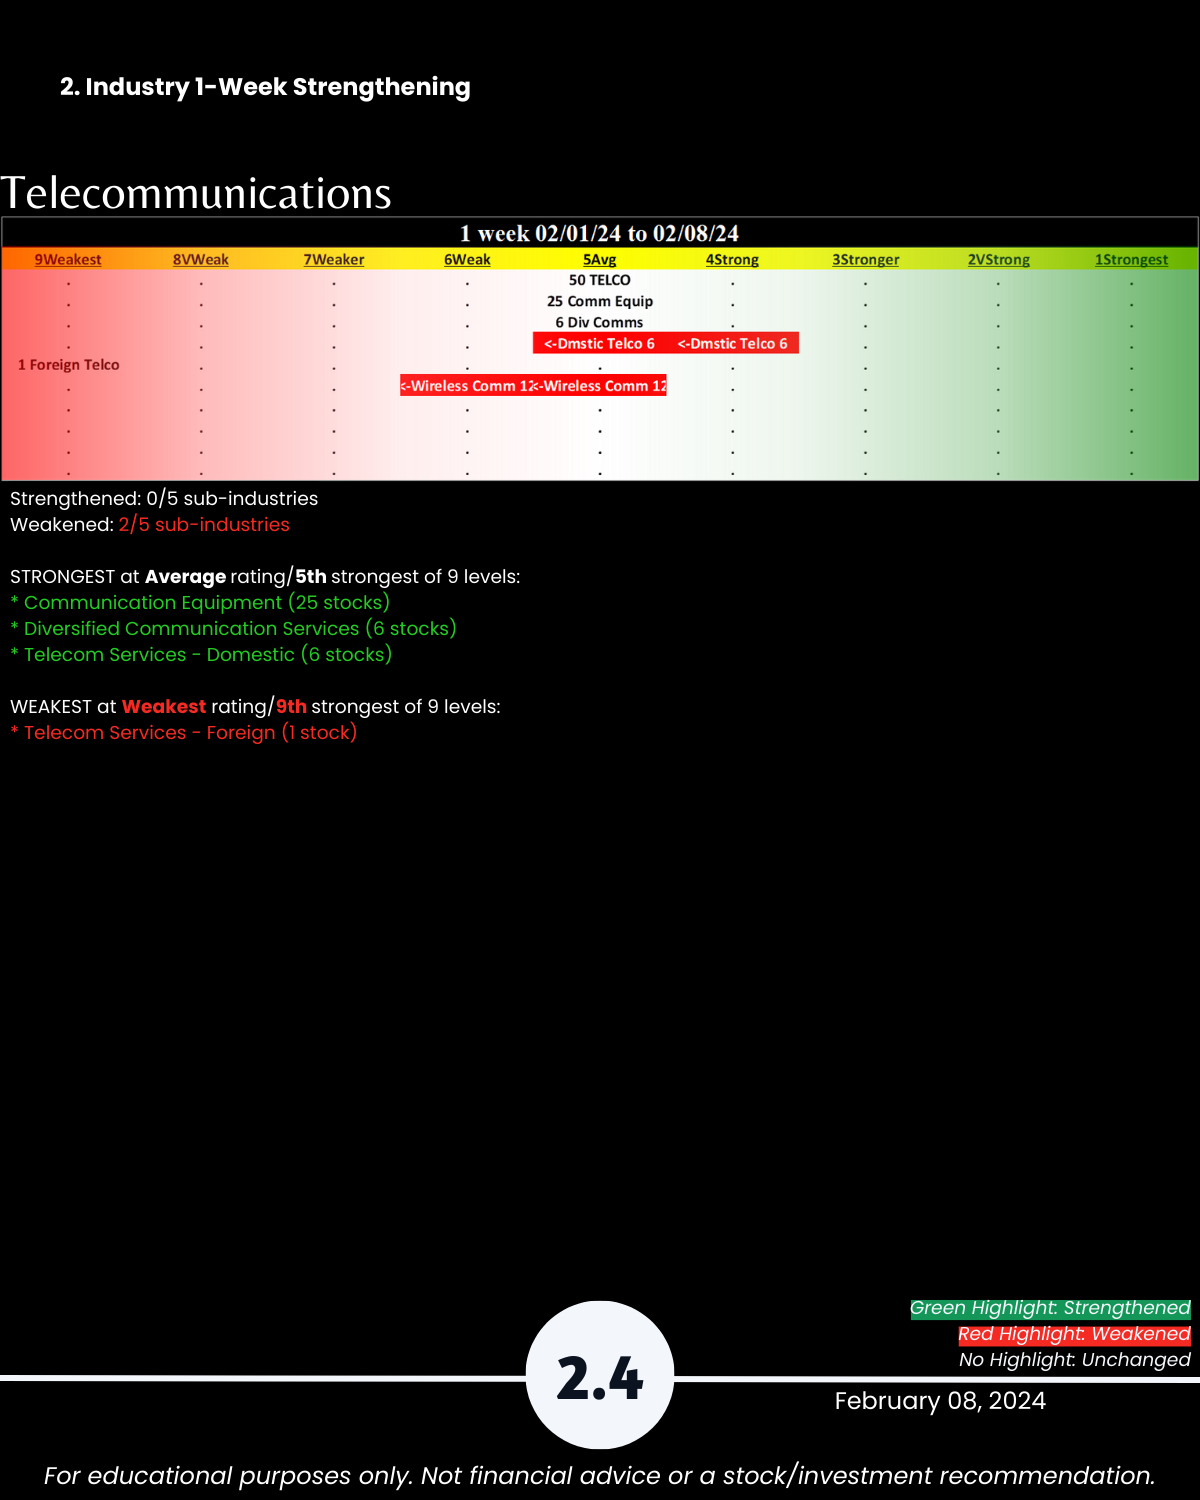
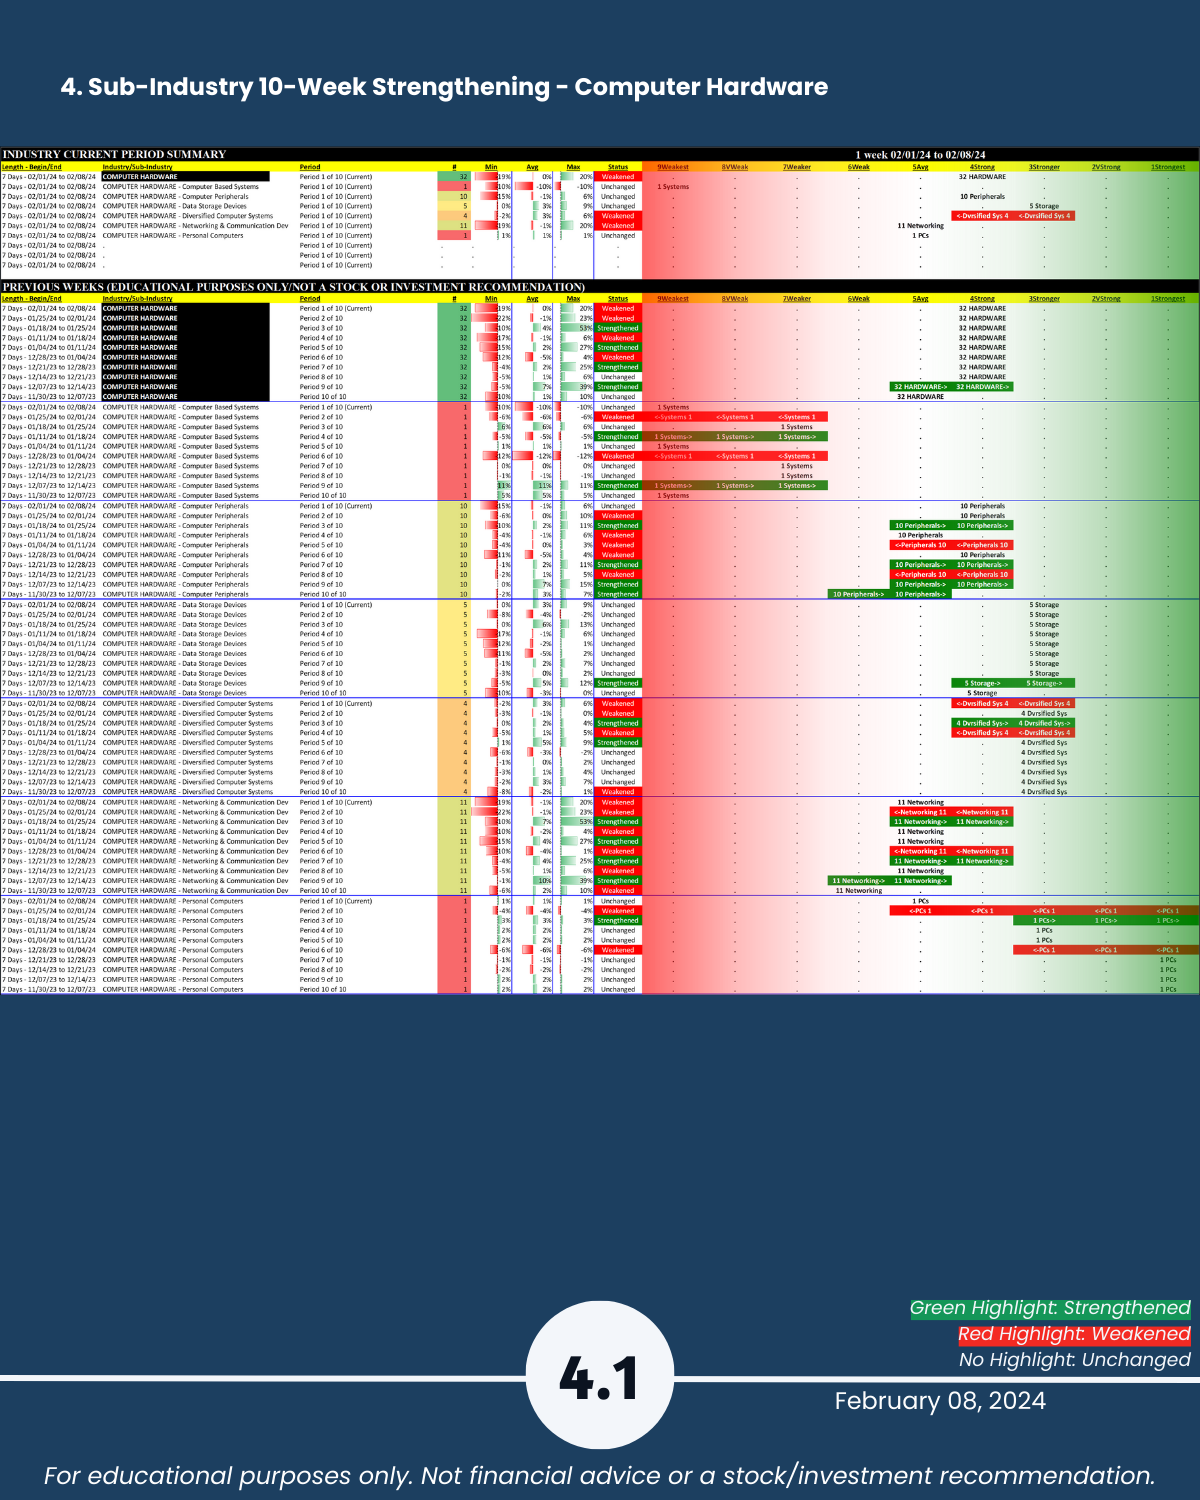
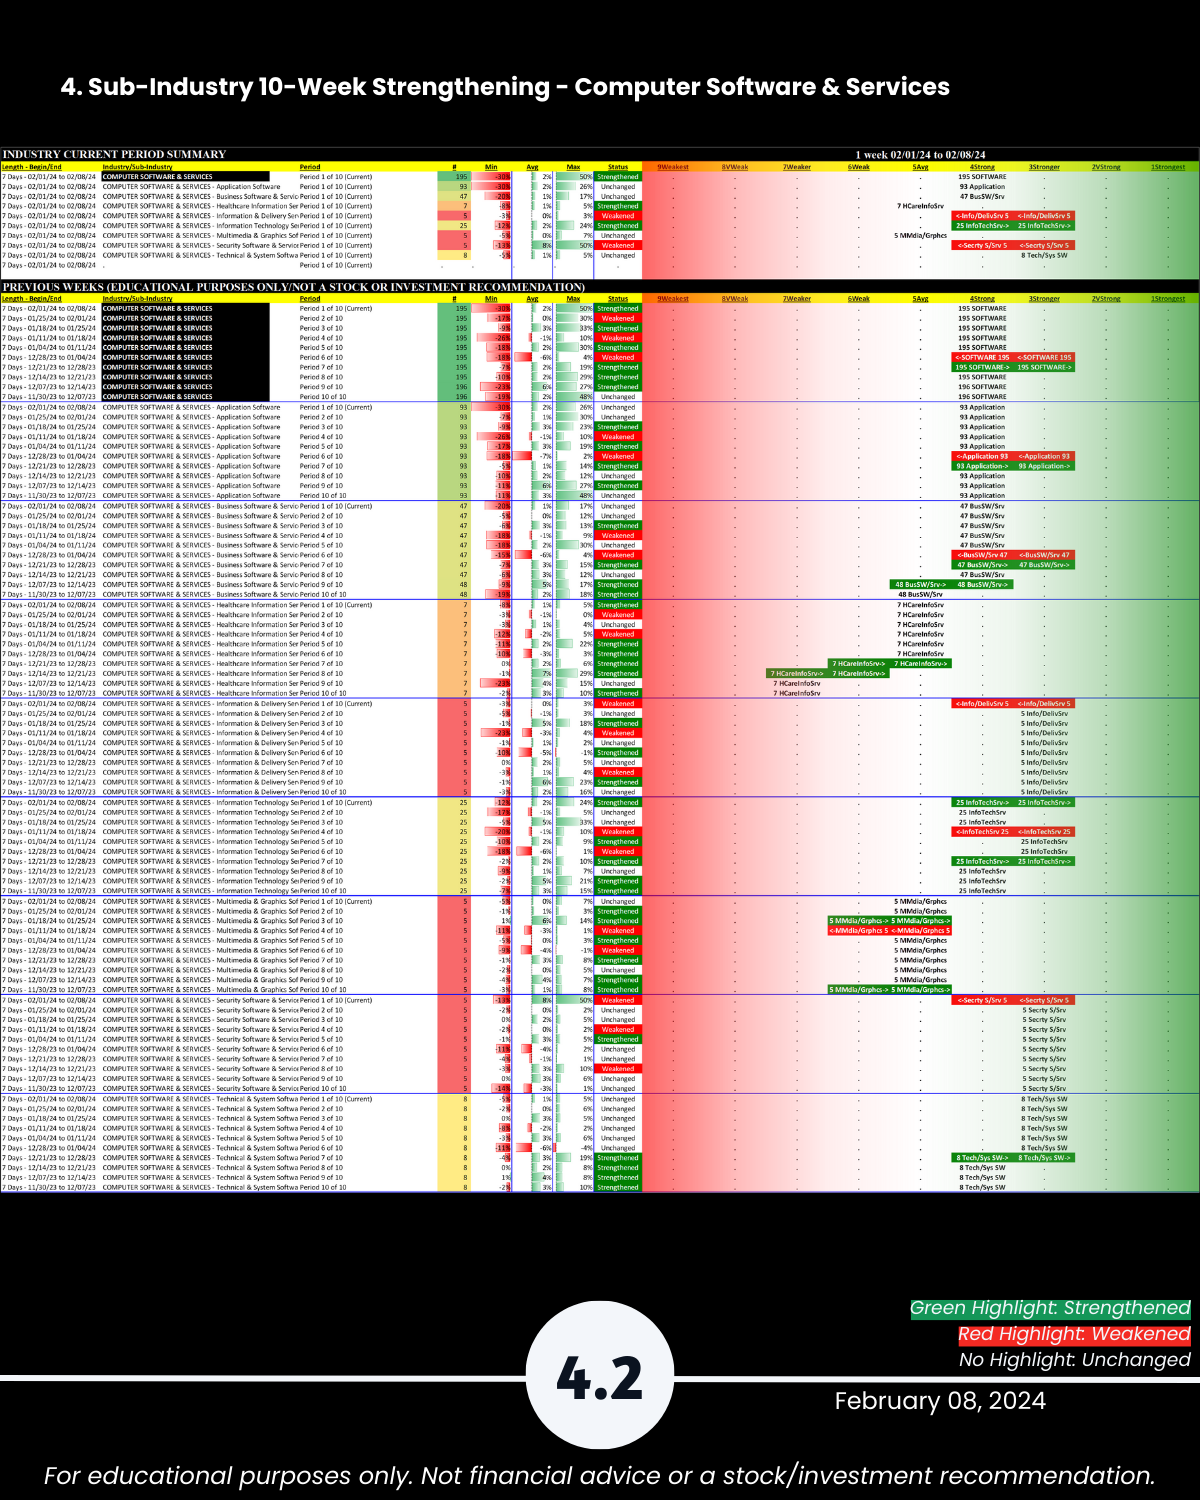
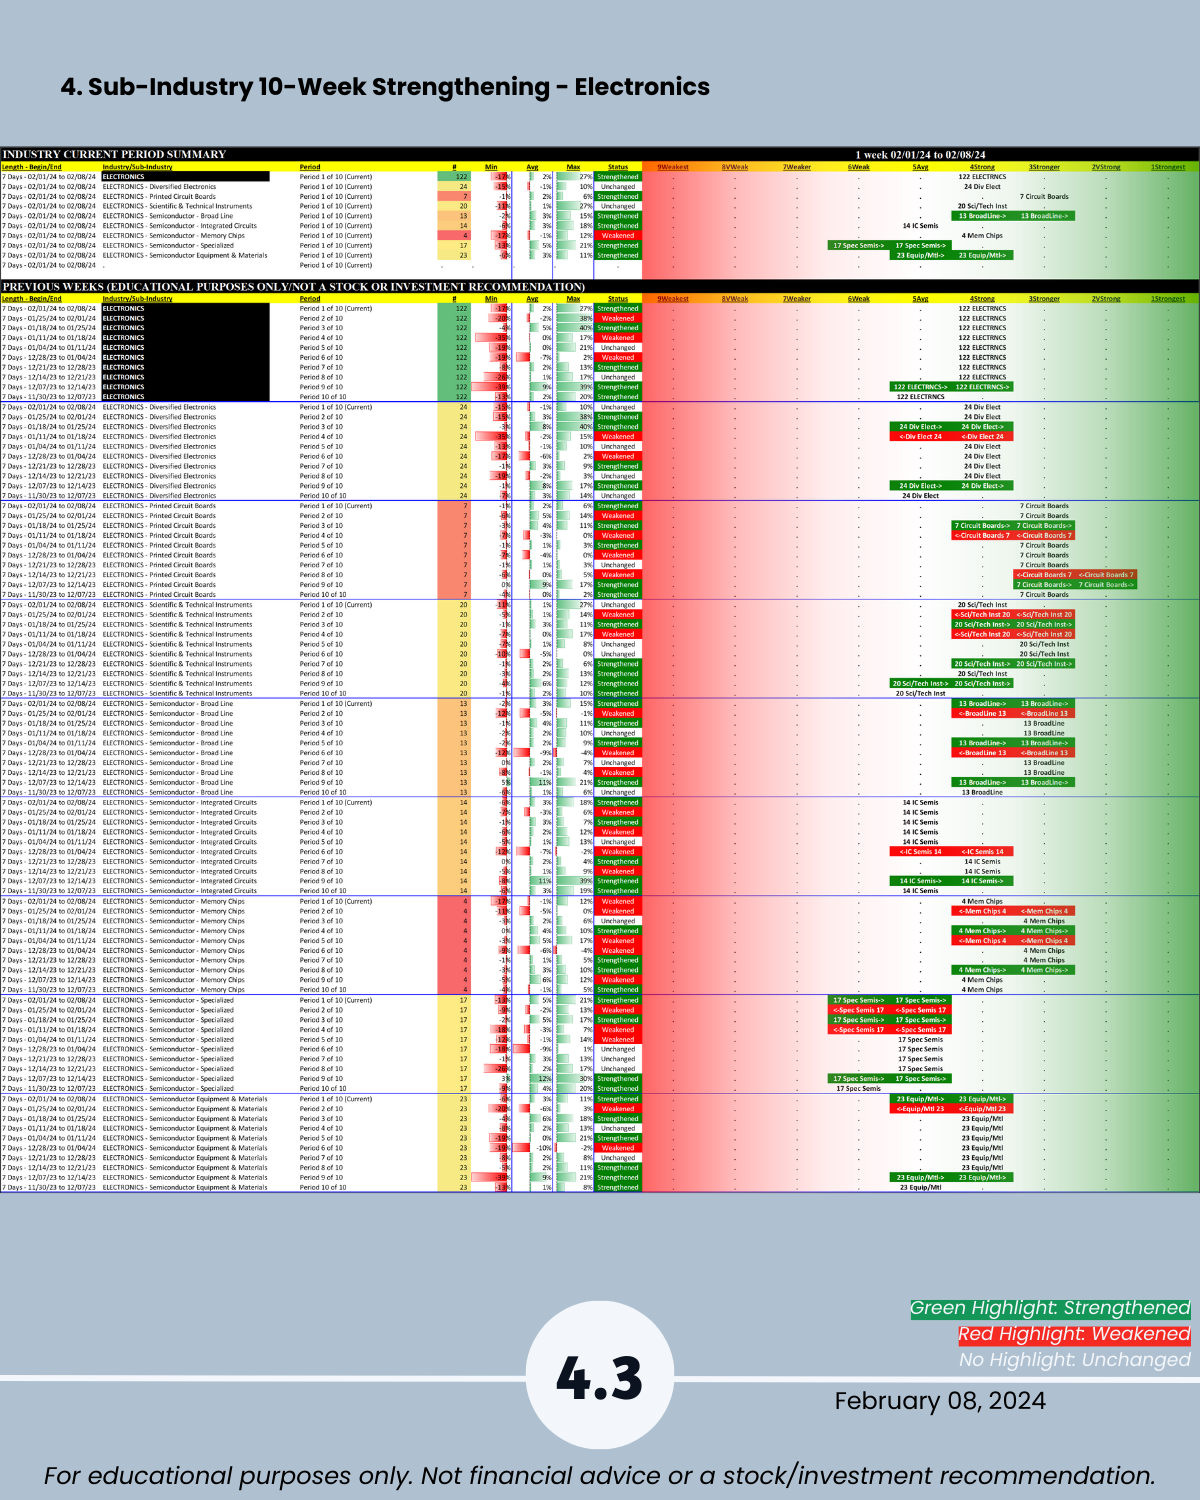
🔹 MIXED STRENGTHENING: 30 Sub-industries - 5 strengthened, 5 weakened (17%/17%)
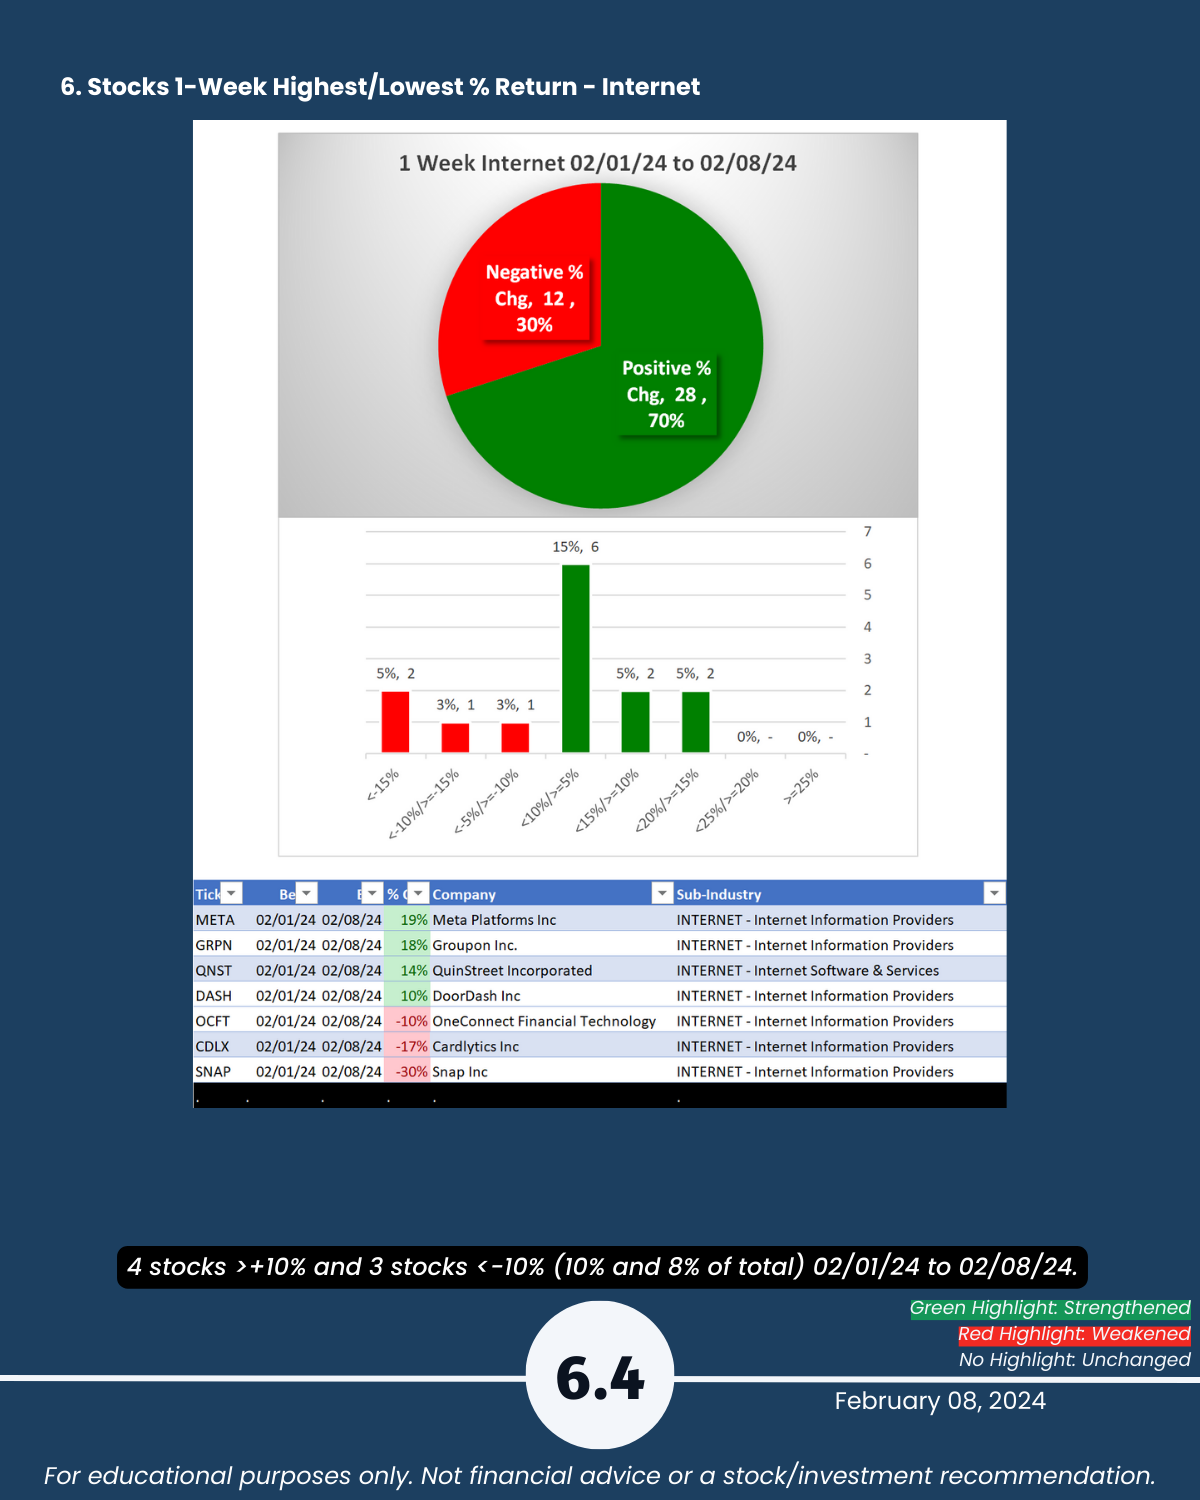
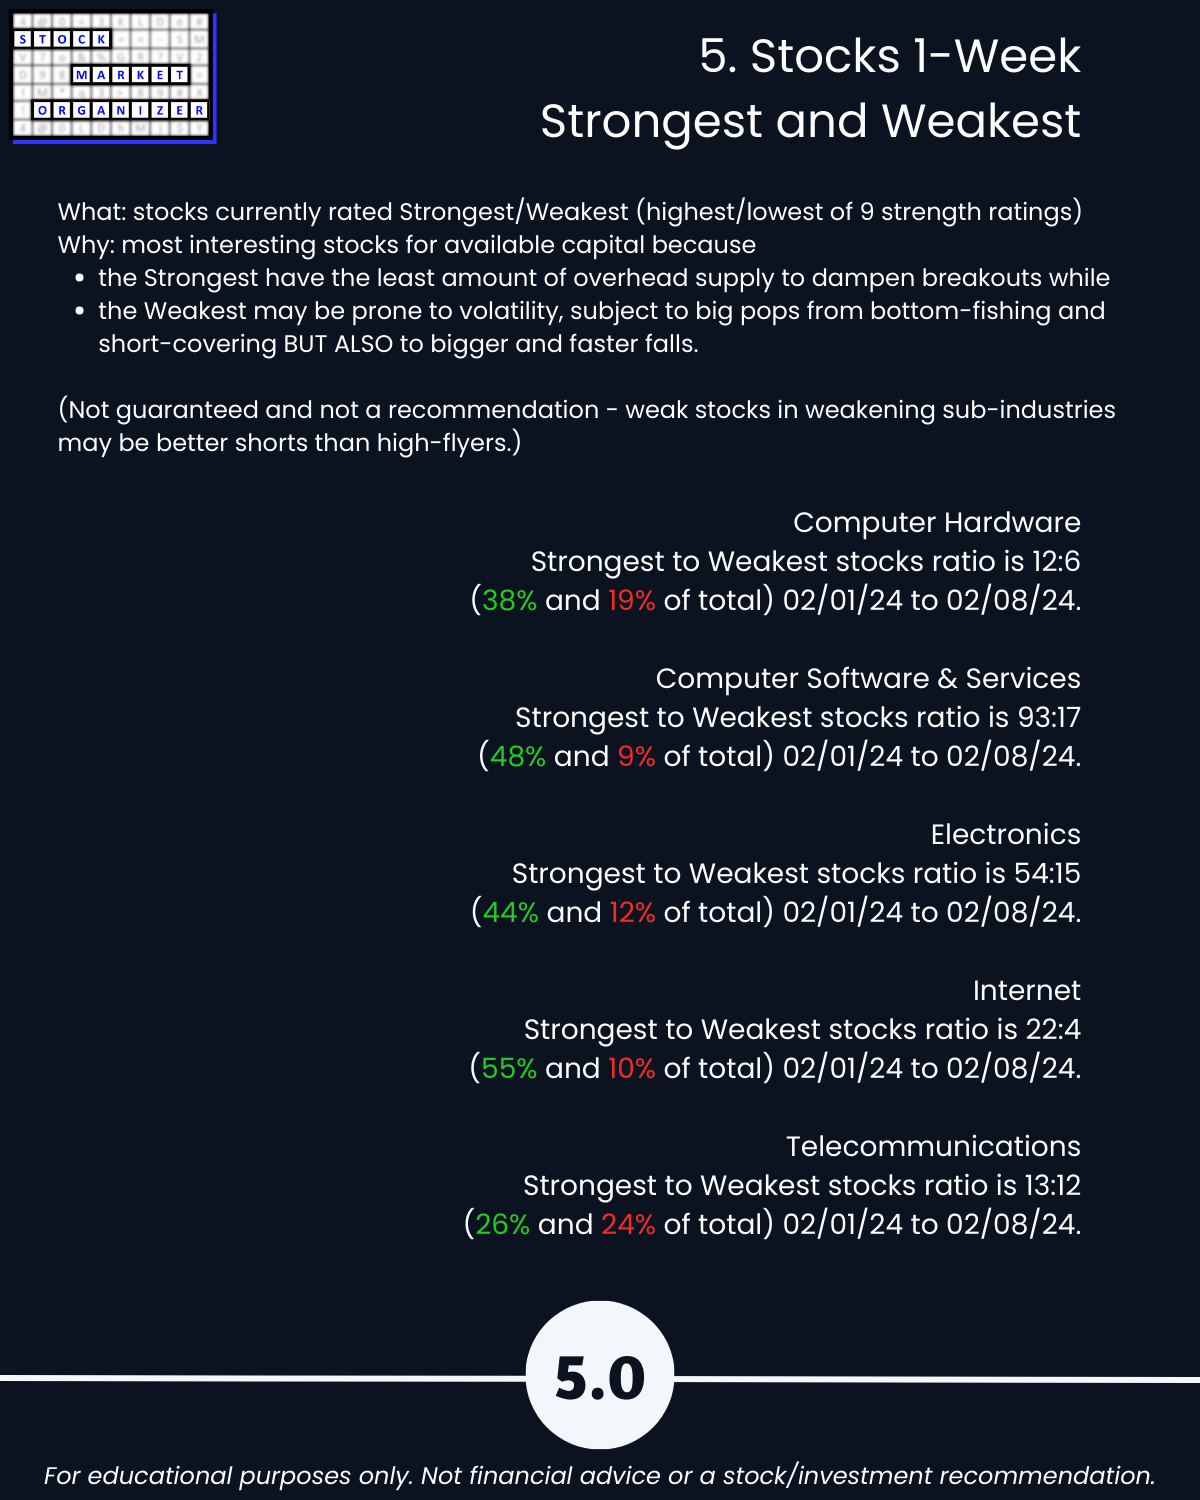
🔹 Strongest:Weakest stocks ratio Software 48%:9%, Electronics 44%:12%, Internet 55%:10%
WHY CARE?
You subscribe to
🔹 The stronger your stocks, the greener your P&L, and
🔹 It doesn’t have to be so complicated.
THIS TELLS YOU:
🔹 The strongest stocks in an industry/sub-industry, proven by their price action to be those which others are favoring.
SO WHAT? See if there are better options than whatever you may currently own.
🔹 Objective strengthening measurements of all stocks in a sub-industry and industry.
SO WHAT? Quickly see the best and worst stocks and ignore the rest.
🔹 If a stock’s sub-industry and industry are currently strengthening.
SO WHAT? Know if the sub-industry and industry currently support new entries, or if you are better off waiting.
🔹 If now is a good time for new long positions based on current market strengthening or weakening.
SO WHAT? Know if the market currently supports new entries, or if you are better off waiting.
HOW?
By tracking strengthening and weakening from the individual stock level up through the market level.
This report may particularly be of interest if the following 5 concepts resonate with you:
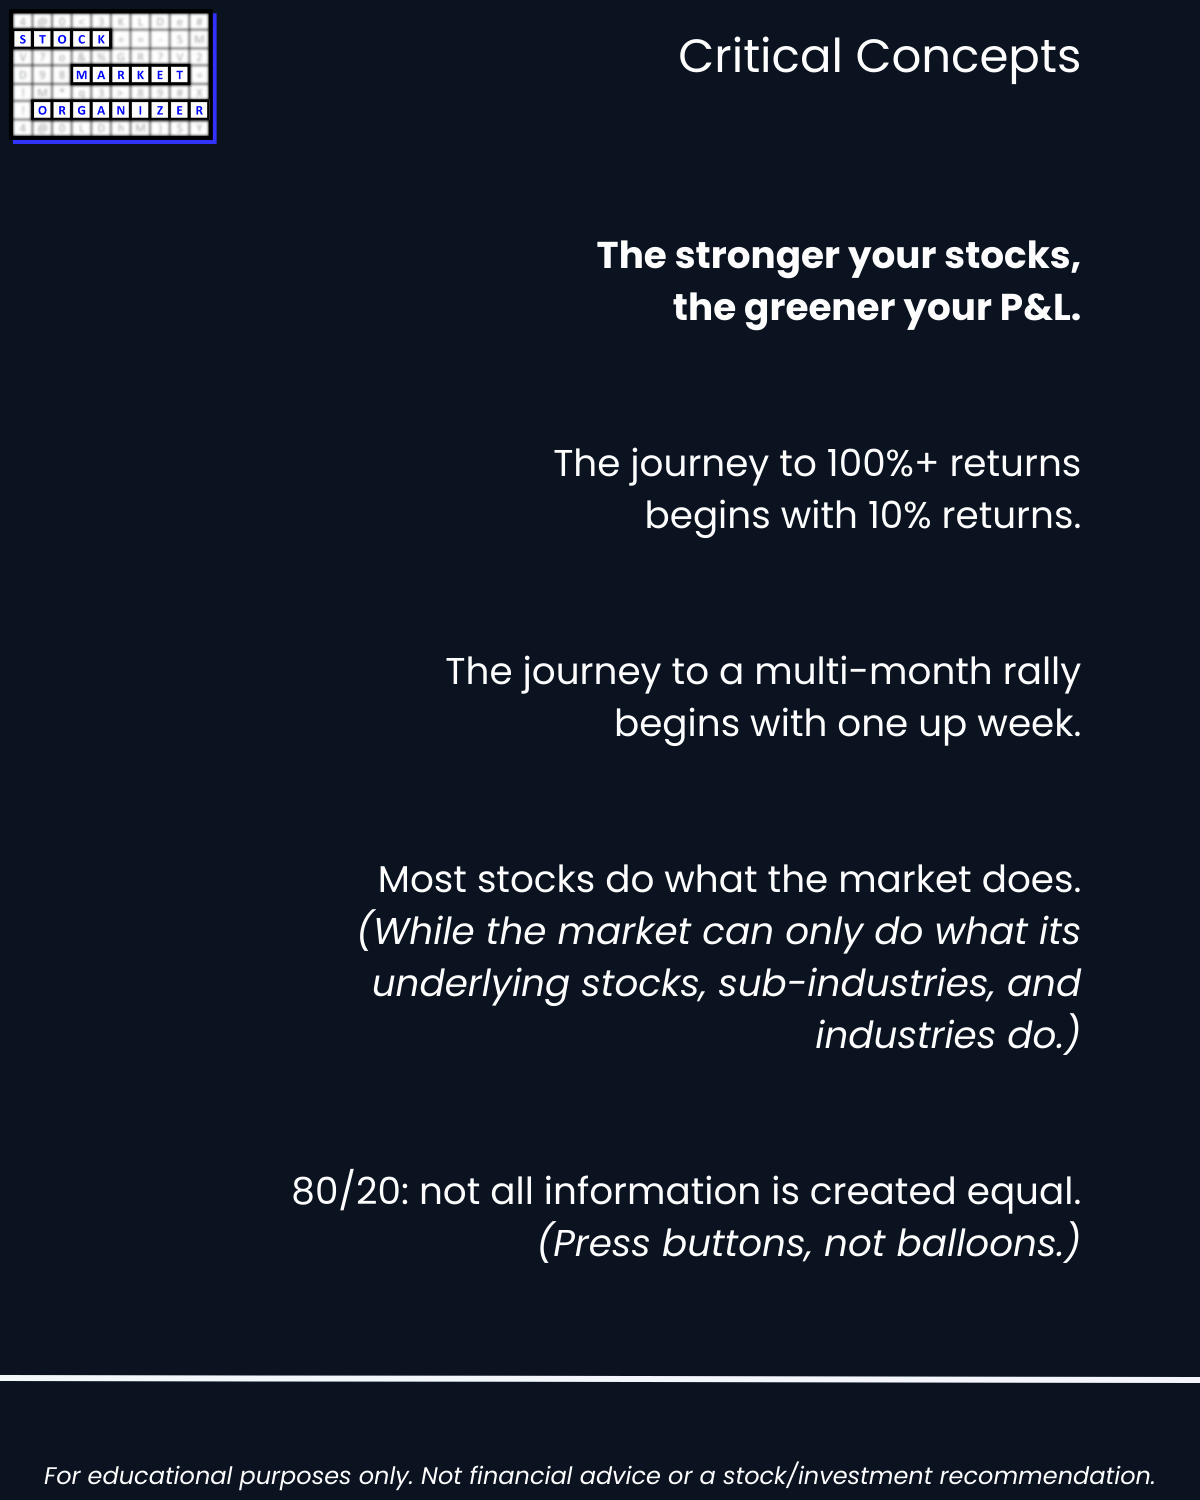
- The stronger your stocks, the greener your P&L.
- The journey to 100%+ returns begins with 10% returns.
- The journey to a multi-month rally begins with one up week.
- Most stocks do what the market does. (While the market can only do what its underlying stocks, sub-industries, and industries do.)
- 80/20: not all information is created equal. (Press buttons, not balloons.)
Following are galleries with page-by-page views of this report.
1. Introduction
2. Industry 1-Week Strengthening
3. Industry 10-Week Strengthening
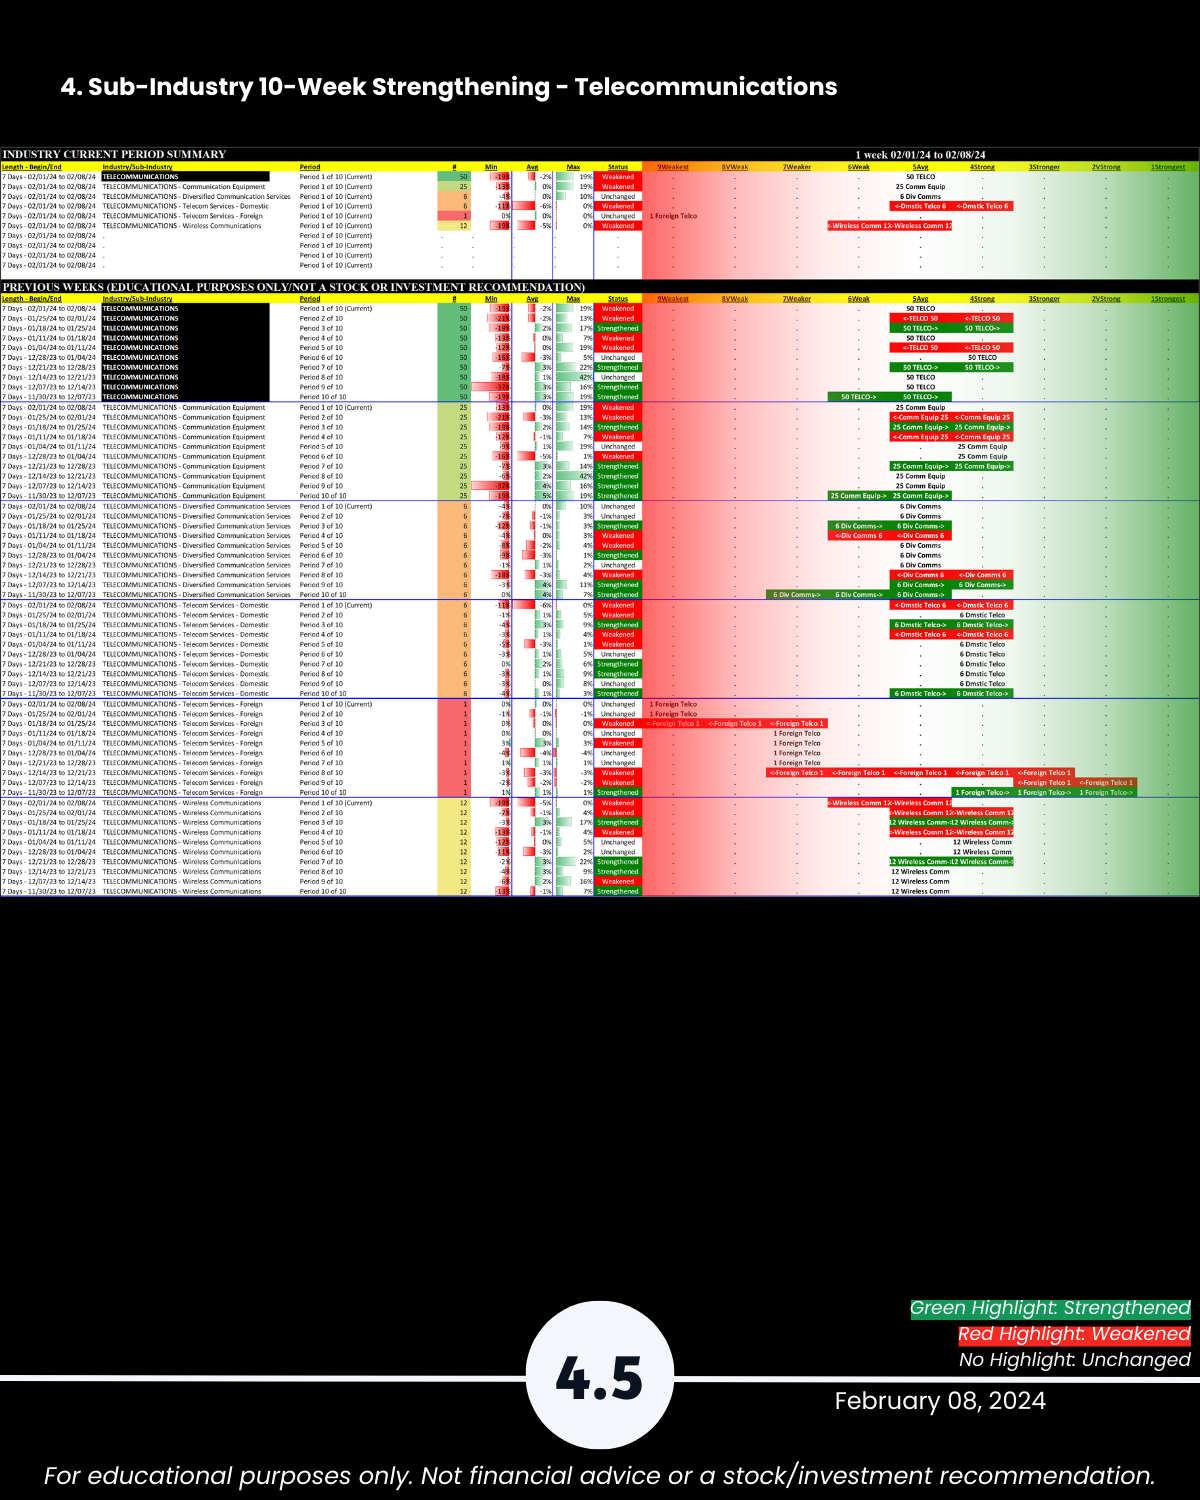
4. Sub-industry 10-Week Strengthening
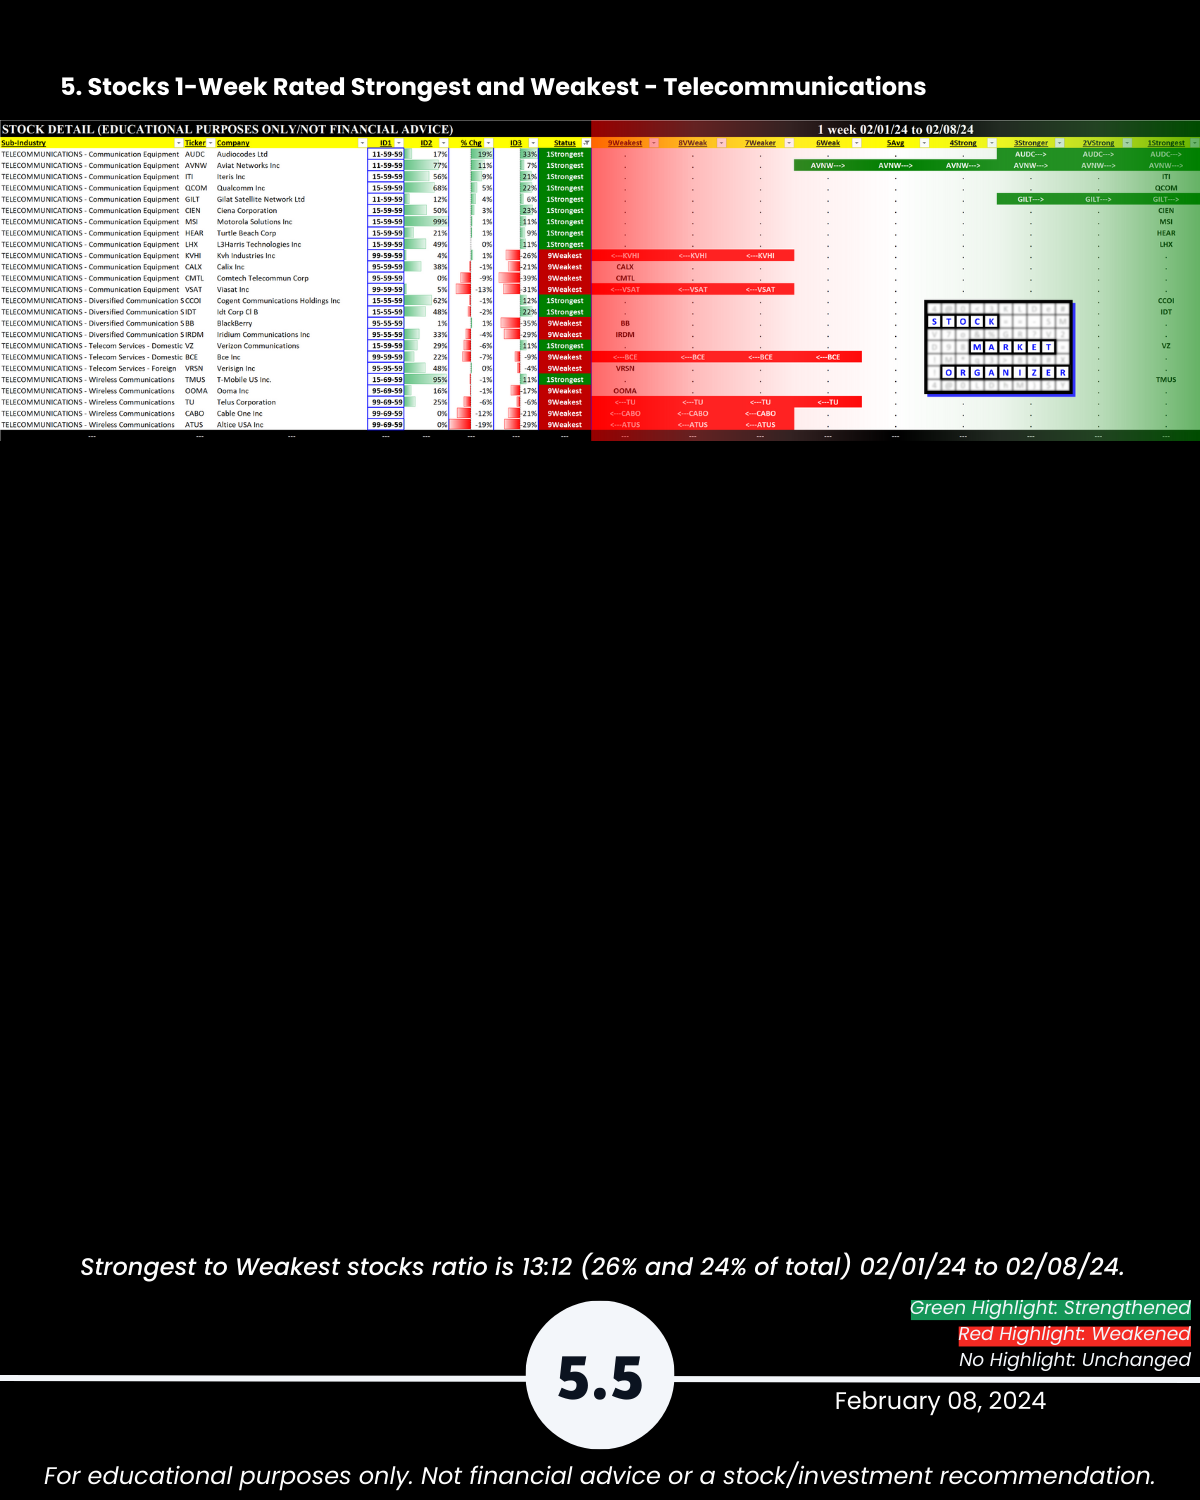
5. Stocks 1-Week Strongest and Weakest
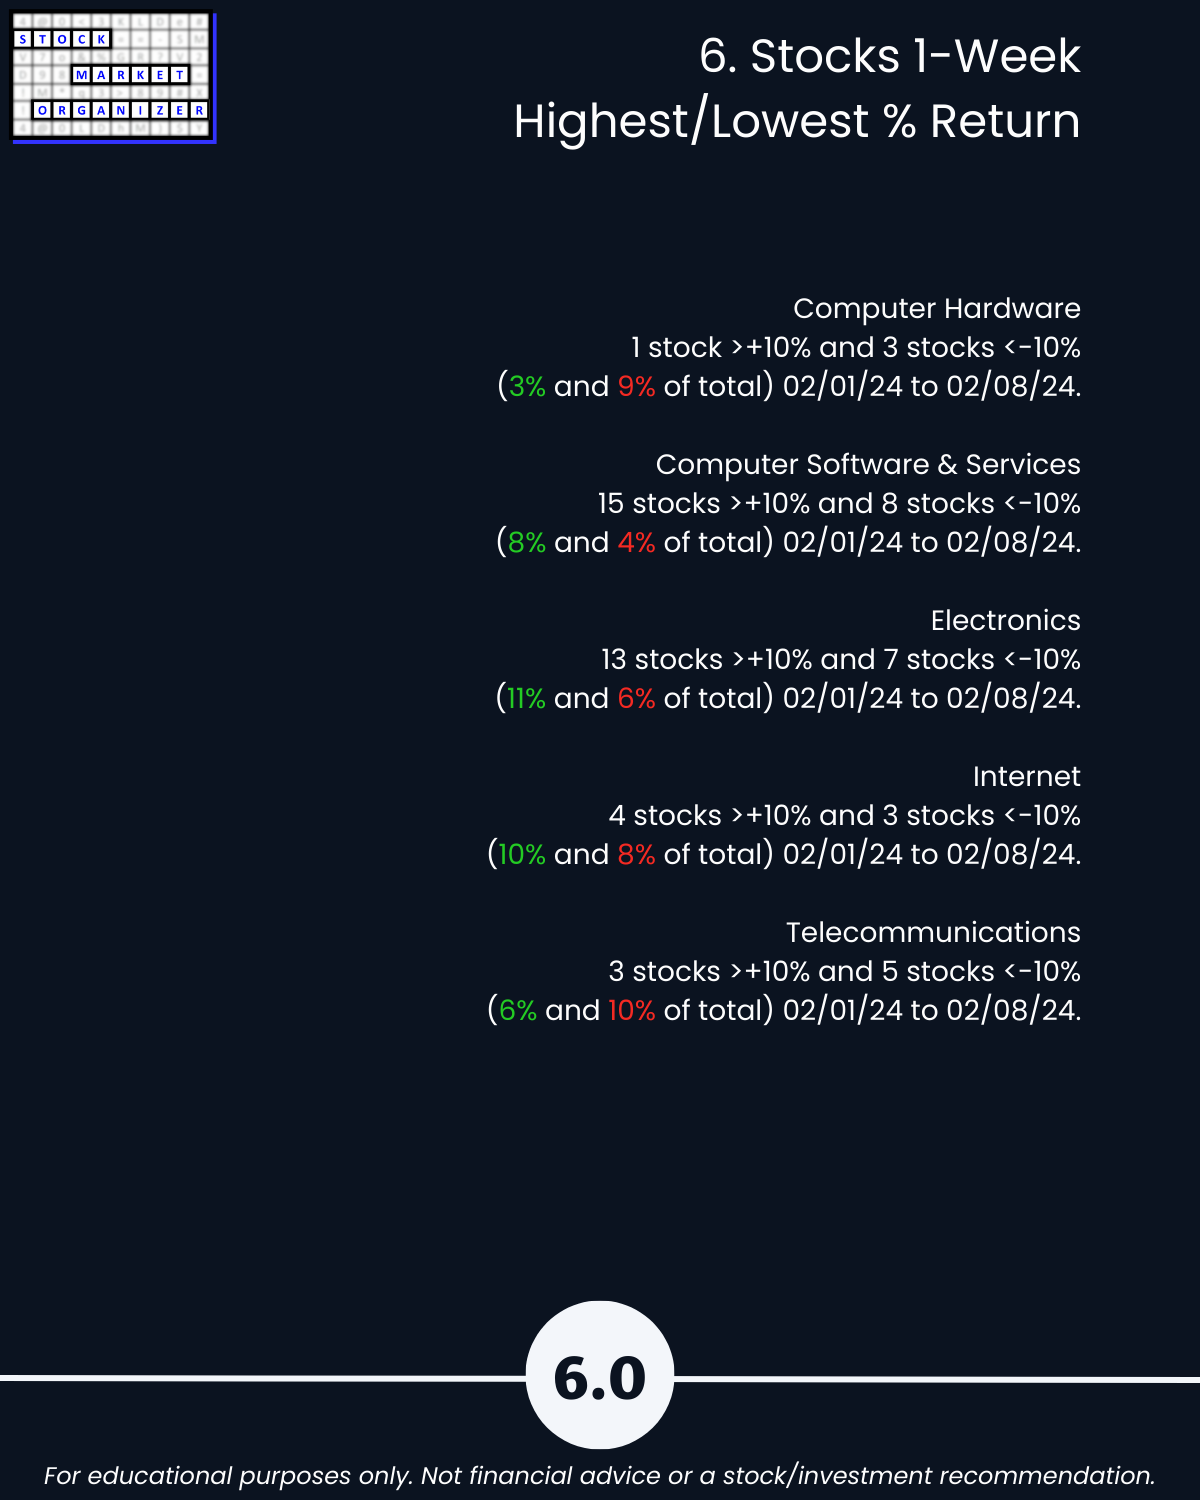
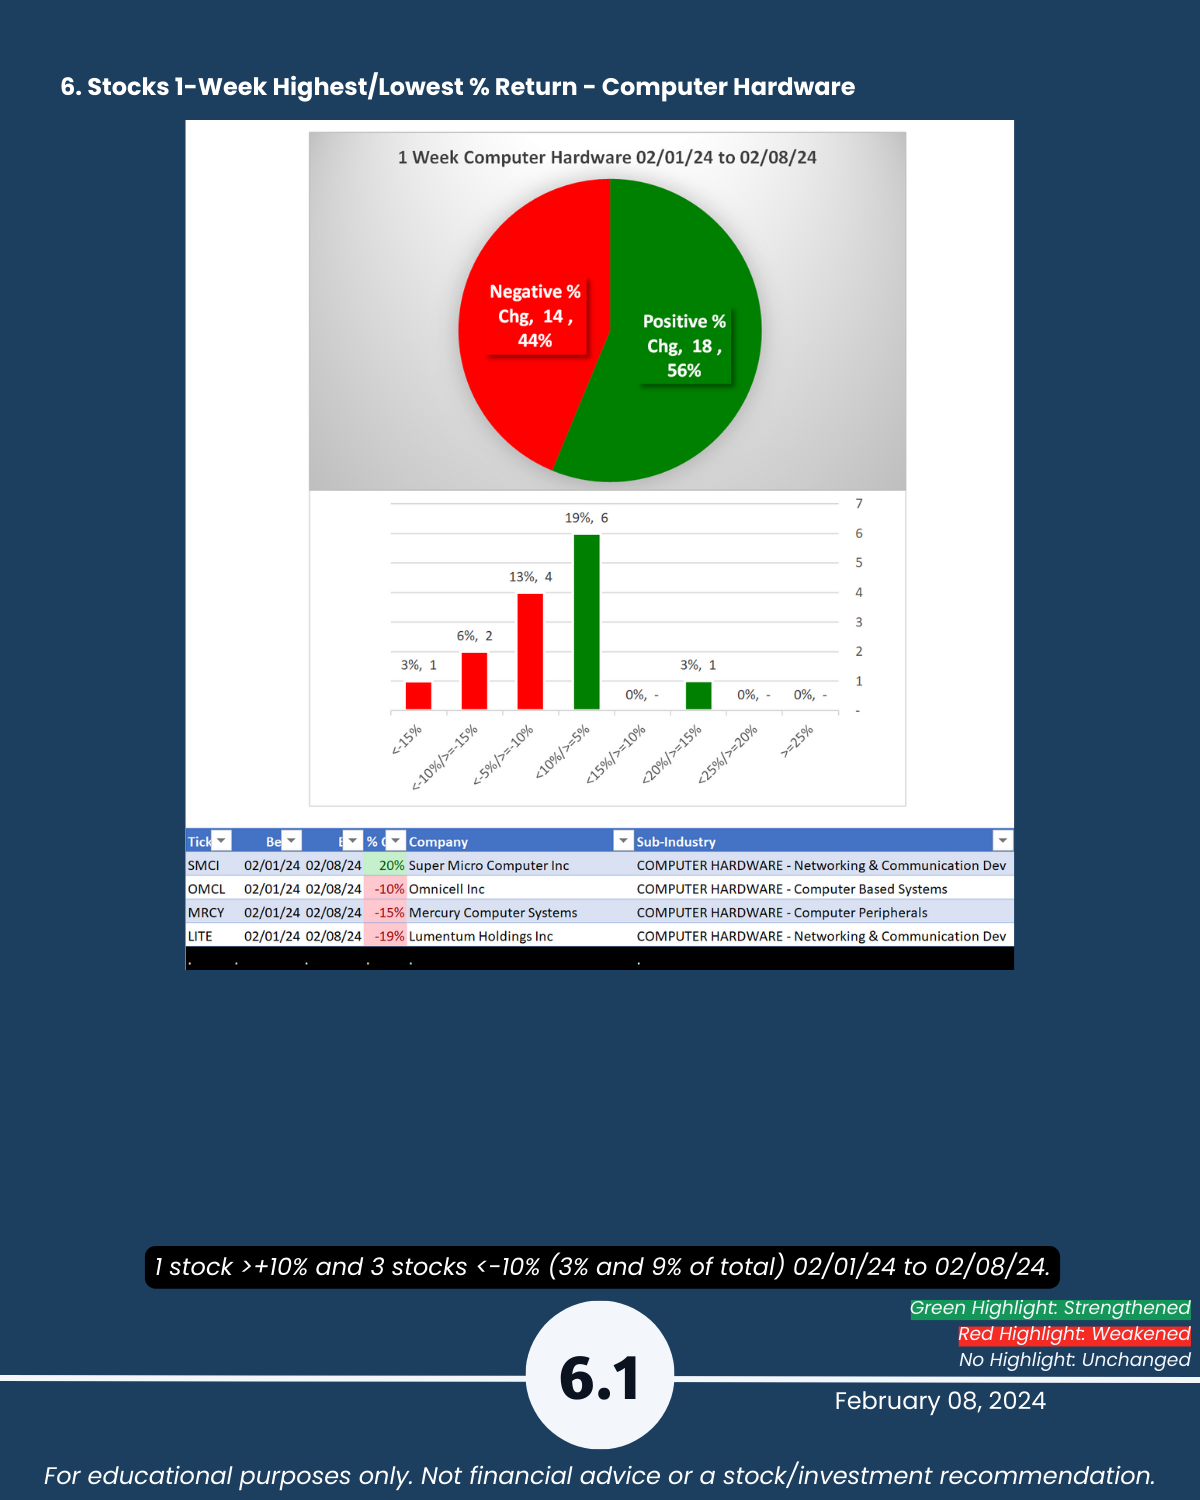
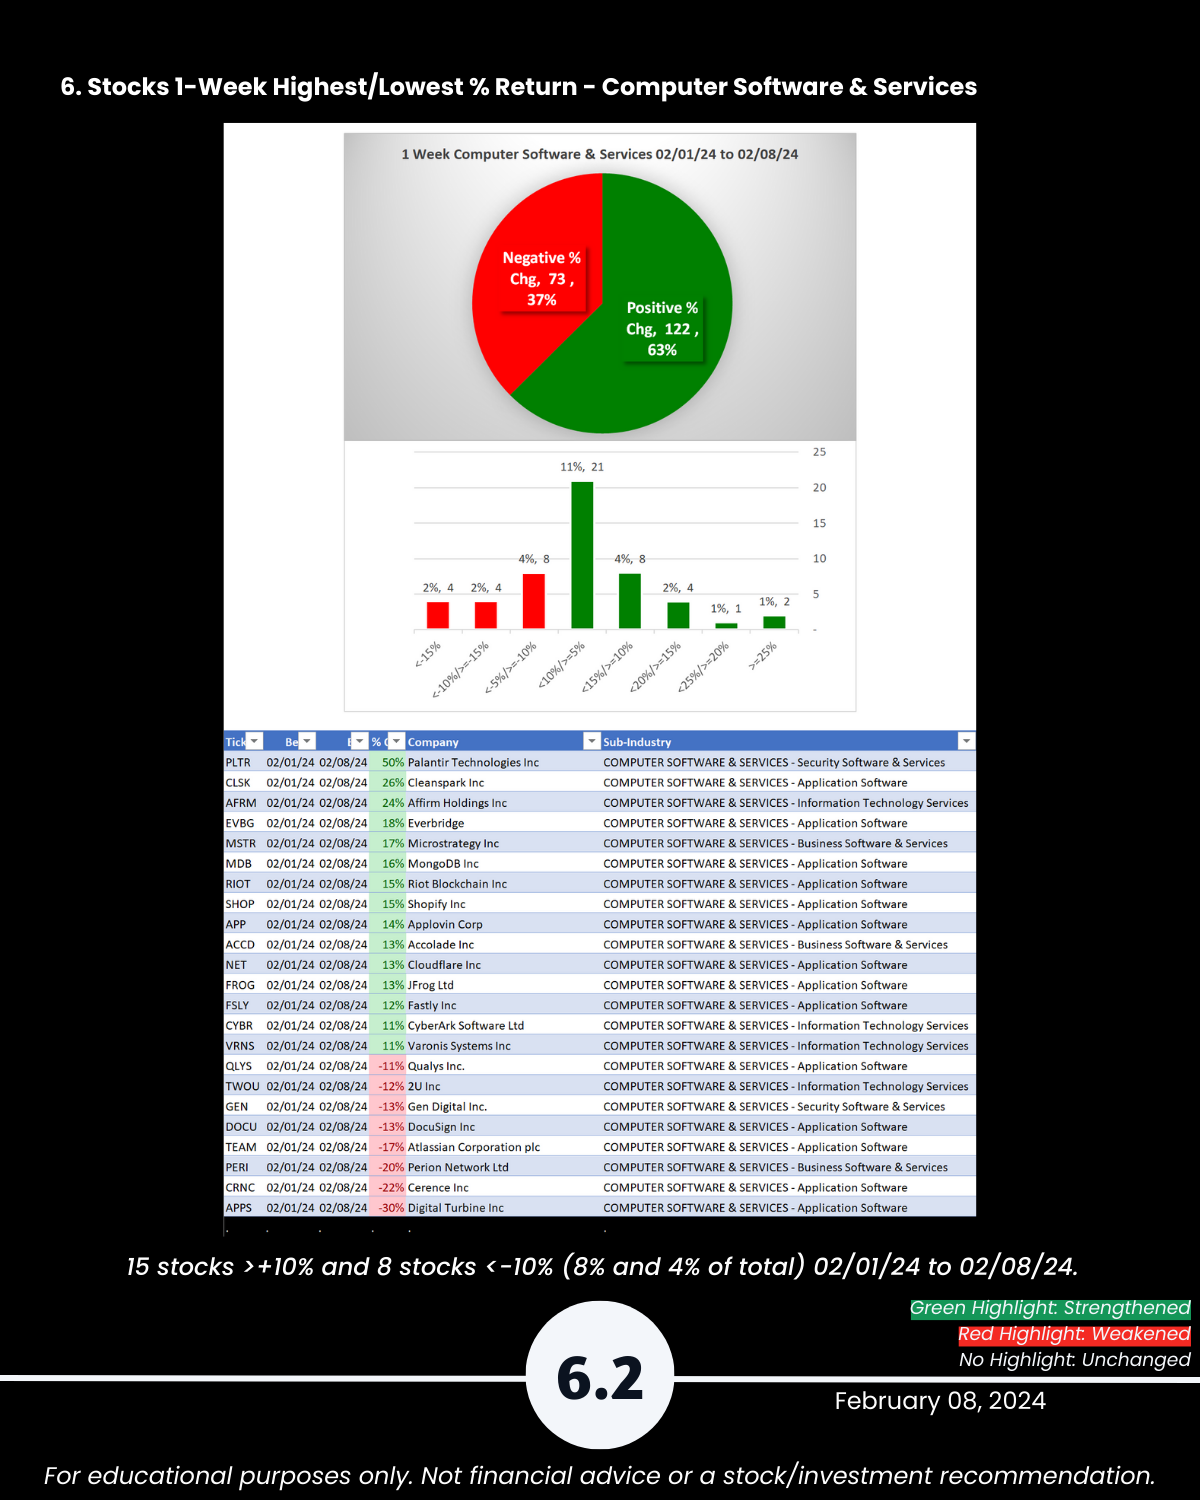
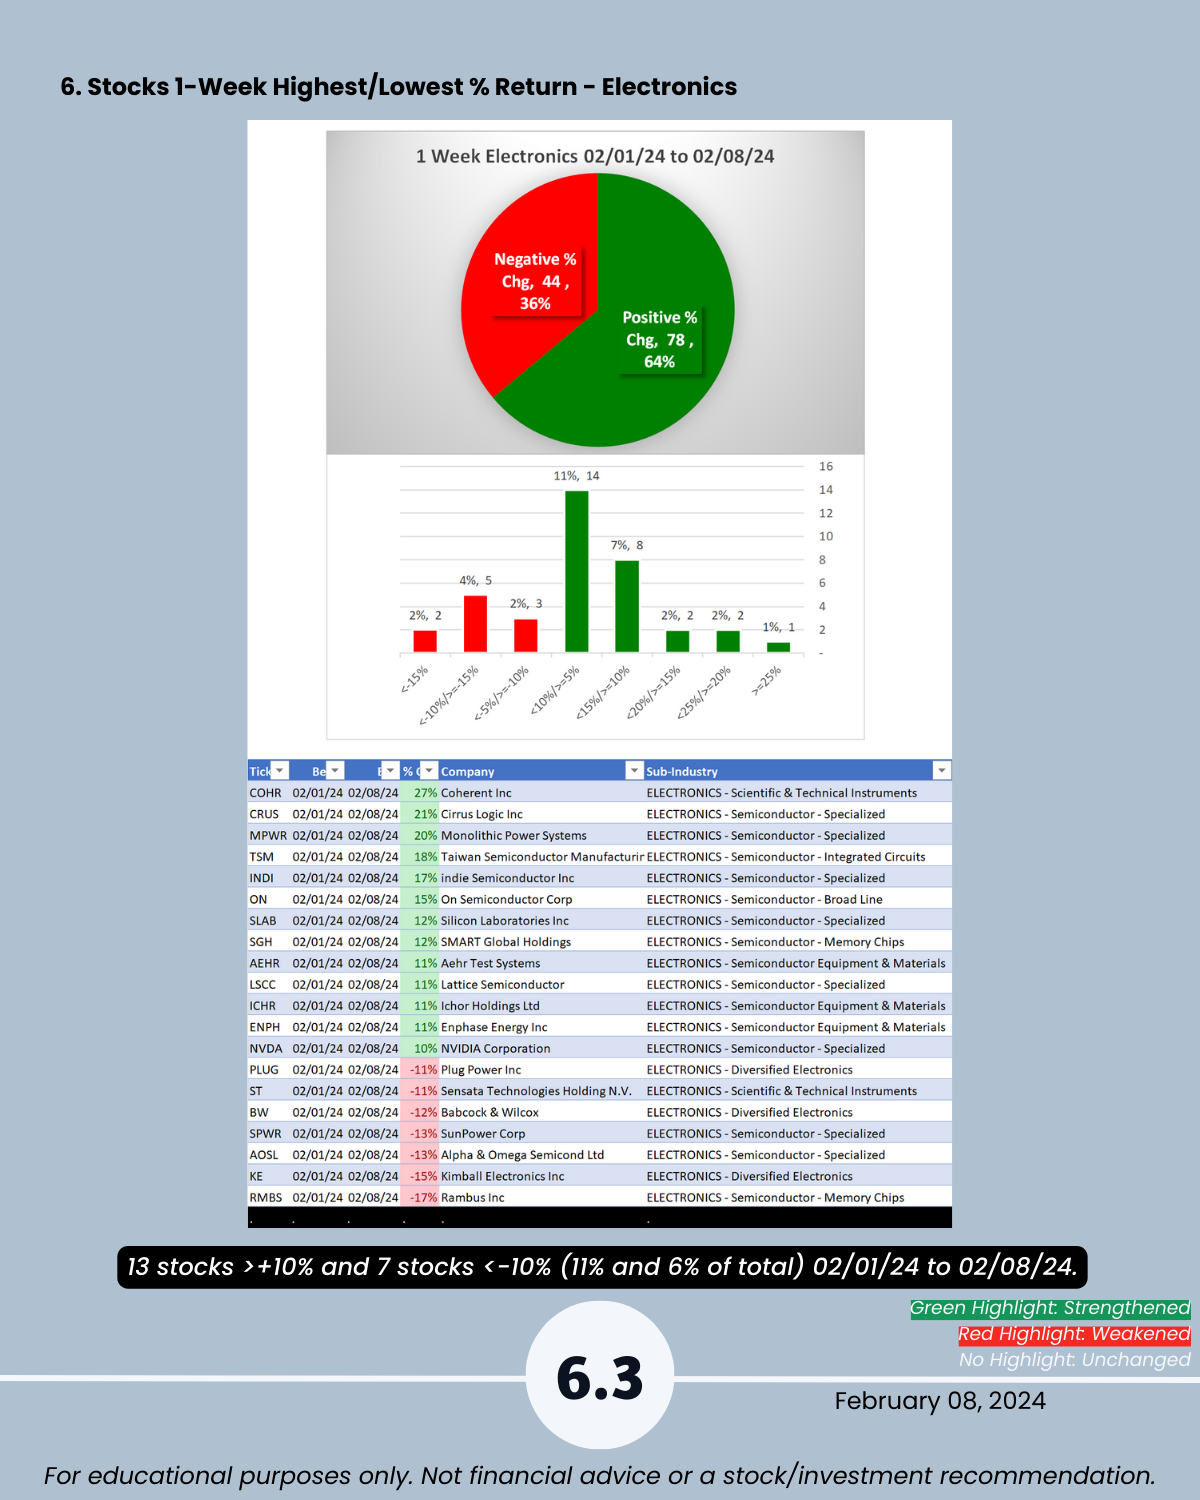
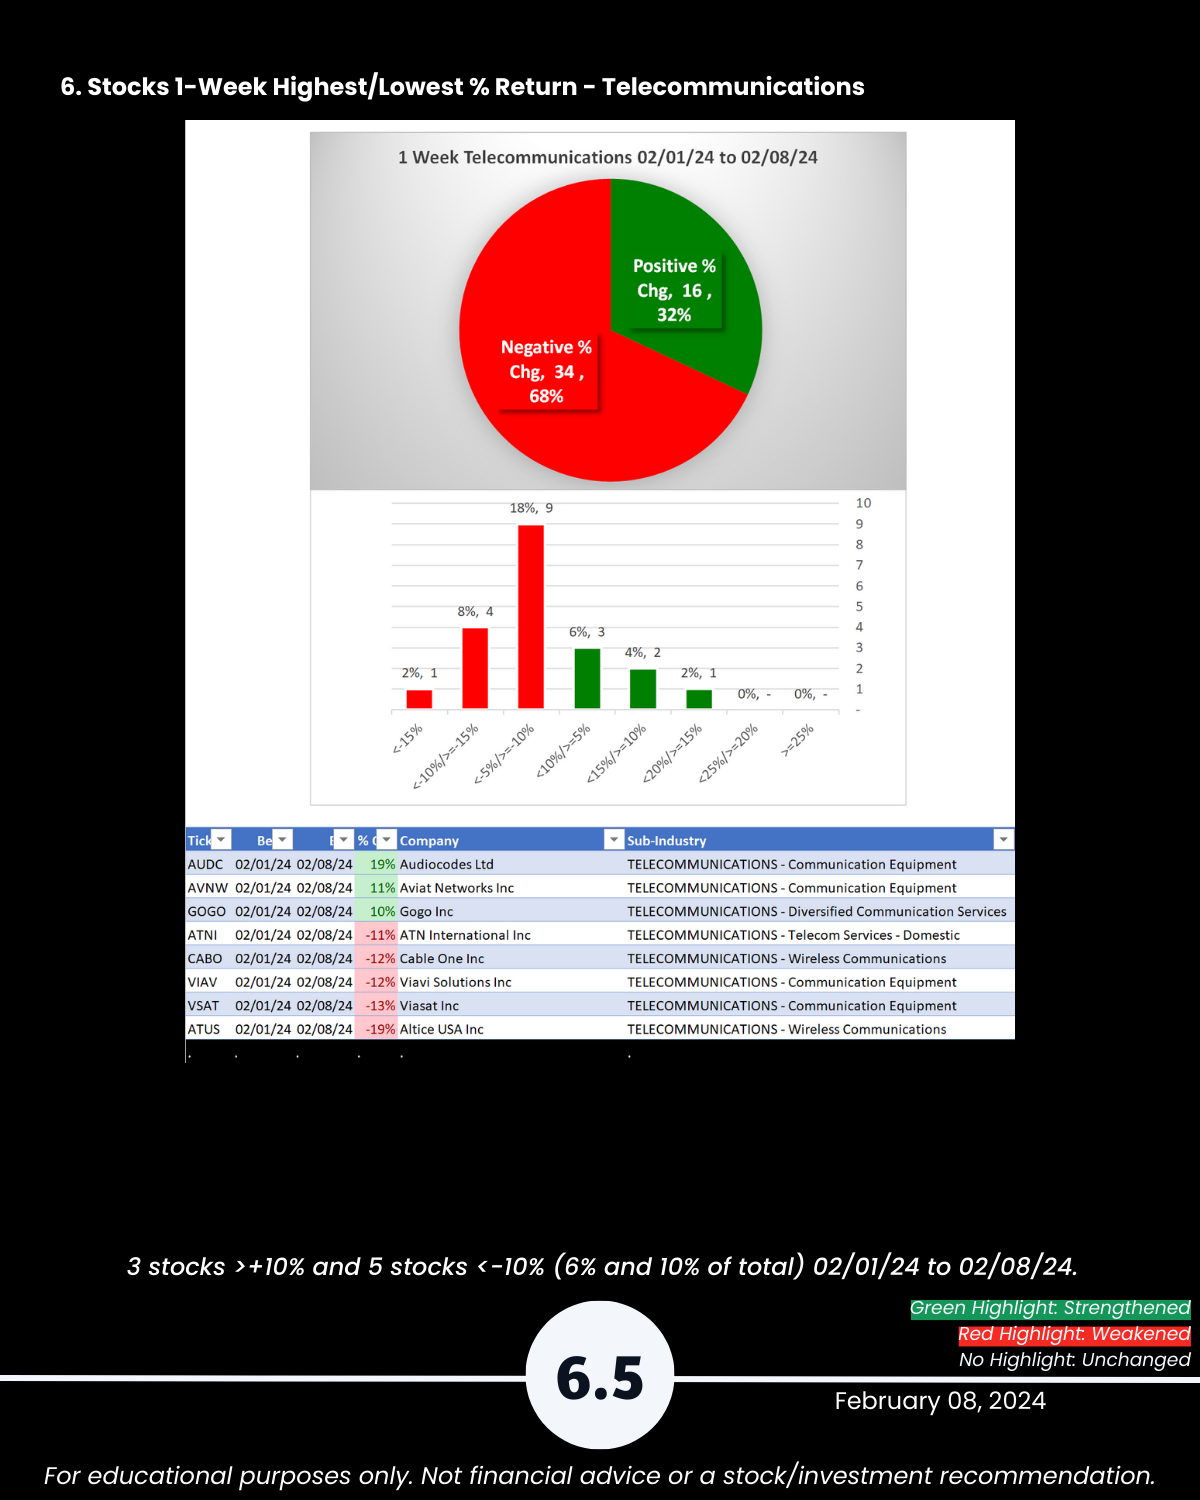
6. Stocks 1-Week Highest/Lowest % Return