SMO Exclusive: Strength Report Industry Group 2 2024-02-26

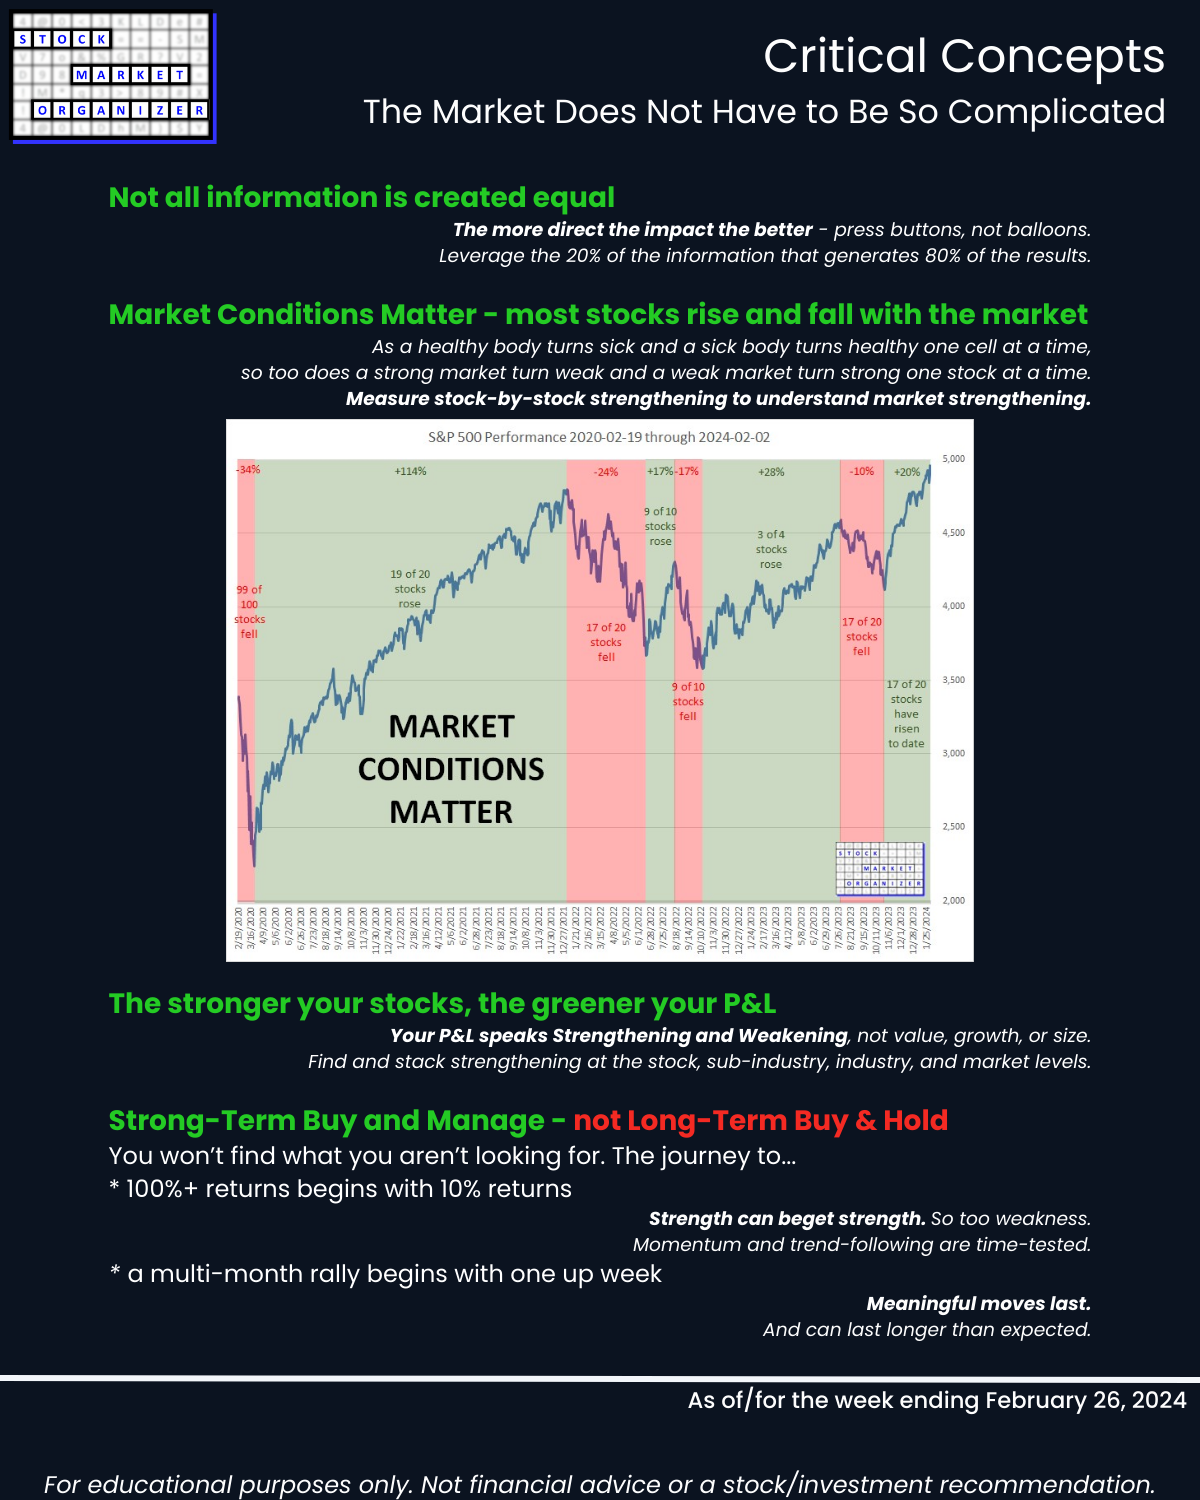
Not debatable: 🔹 The stronger your stocks, the greener your P&L. 🔹 Market conditions matter. 🔹 You won’t find what you aren’t looking for. This is all put into practice in the attached 2/26/24 analysis of Group 2 industries (loosely, the Services sector) – Diversified Services, Health Services, Leisure, Media, and Utilities.
SO WHAT?
You’ll find here Strongest- and Weakest-rated Stock Market Organizer stocks and objective strengthening and weakening measurements in these industries.
This will quickly help you find strong stocks in strengthening sub-industries and strengthening industries.
WHY?
Sometimes value reigns, sometimes growth. In recent times, small caps have lagged. The common theme among top performers: strength.
The Banking industry weakened Feb-May 2023. It then strengthened until it was the strongest-rated industry as recently as the week ending 1/26/24.
From 5/15/23 through 1/26/24:
🔹 99% of banking stocks were positive
🔹 90% rose >10%
🔹 ~7 in 10 stocks rose >25%
🔹 ~1 in 4 stocks rose >50%
It was hard NOT to profit in this strengthening Banking industry.
It has been the opposite since then.
From 1/26/24 through 2/26/24 (Banking has weakened 3 of 9 strength levels):
🔹 7% of banking stocks were positive
🔹 ~3 in 4 fell more than -5%
🔹 ~4 in 10 fell more than -10%
🔹 ~1 in 10 fell more than -15%
THE BOTTOM LINE
Bottom-ticking isn’t part of the program.
Measuring strength week-by-week is.
Because
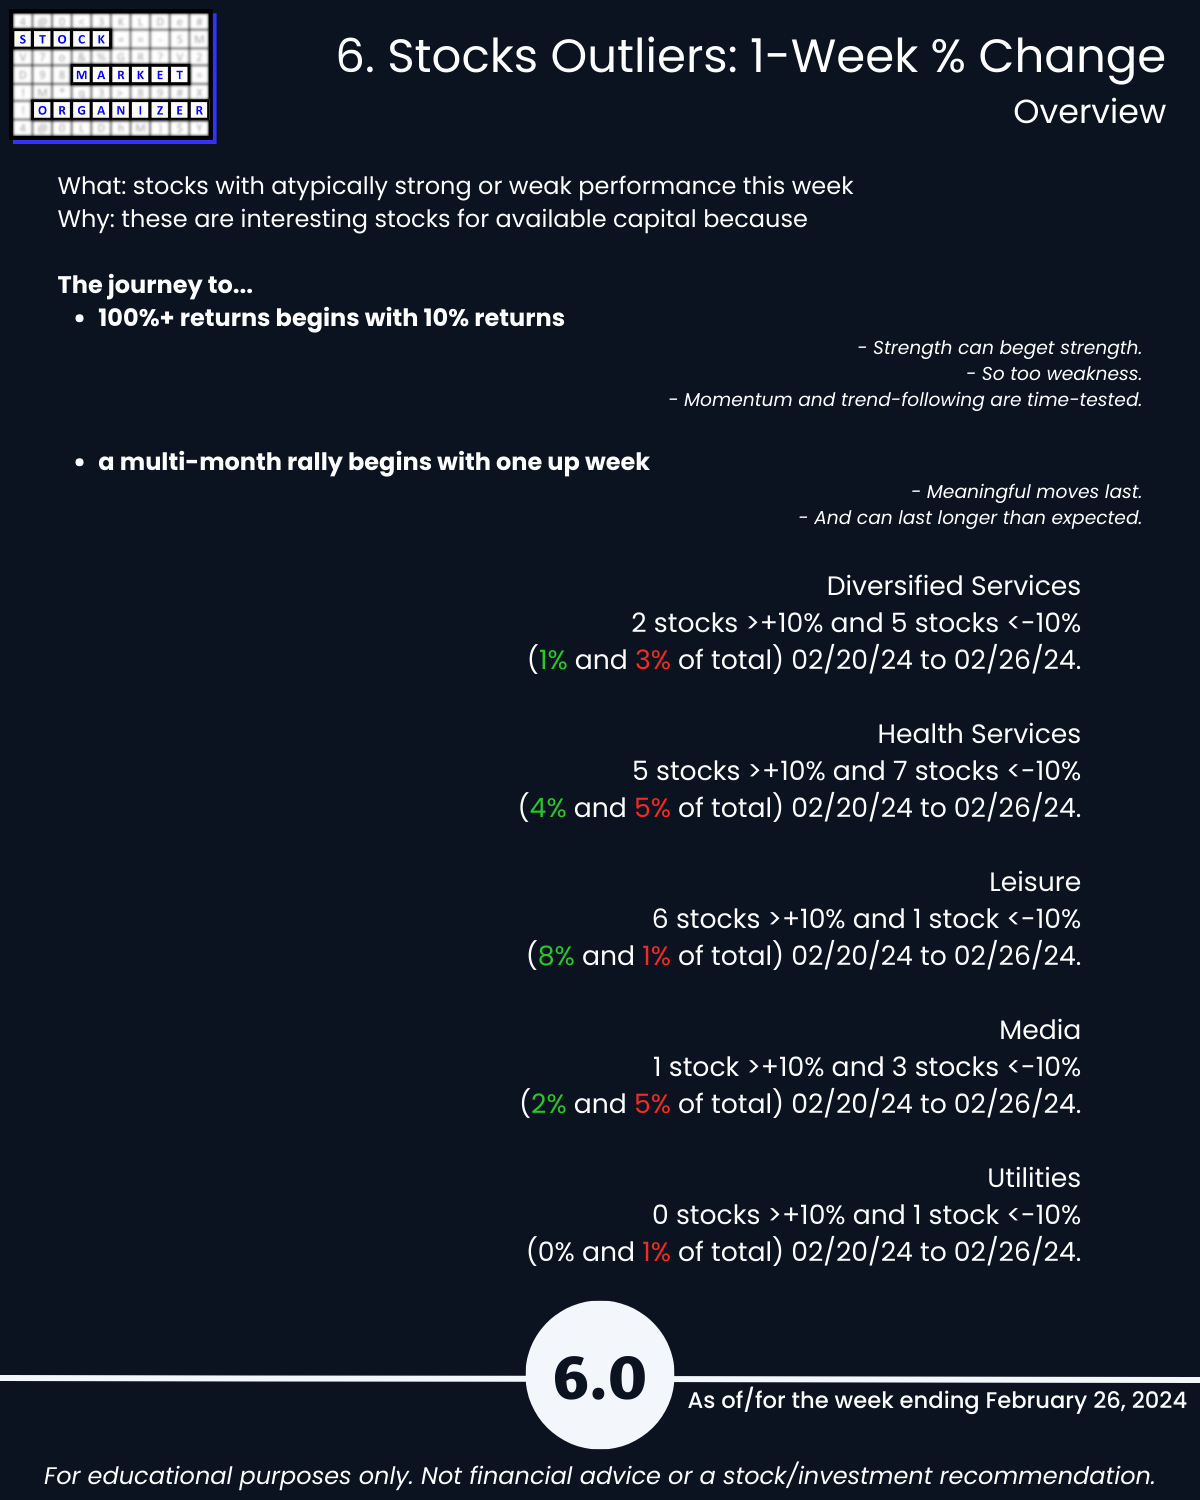
🔹 the rally of multiple months+ begins with one up week, and
🔹 the journey to 100%+ returns begins with 10% returns.
It really doesn’t have to be so complicated.
REPORT TAKEWAYS
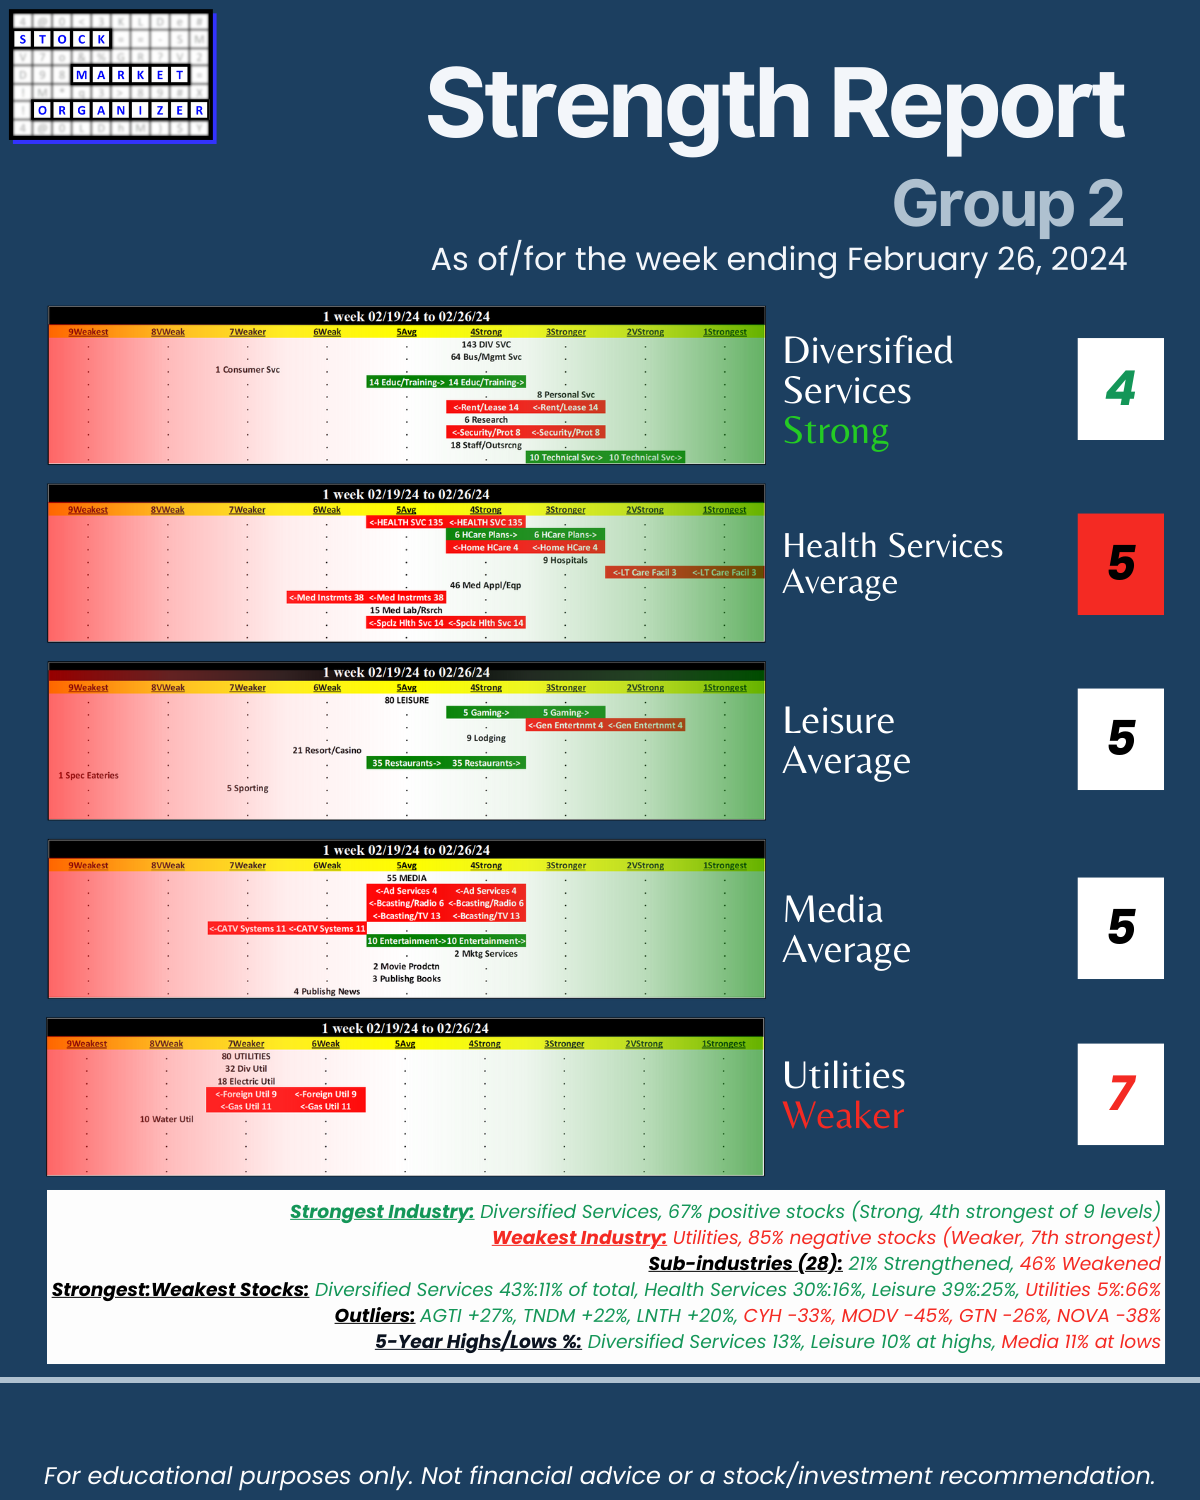
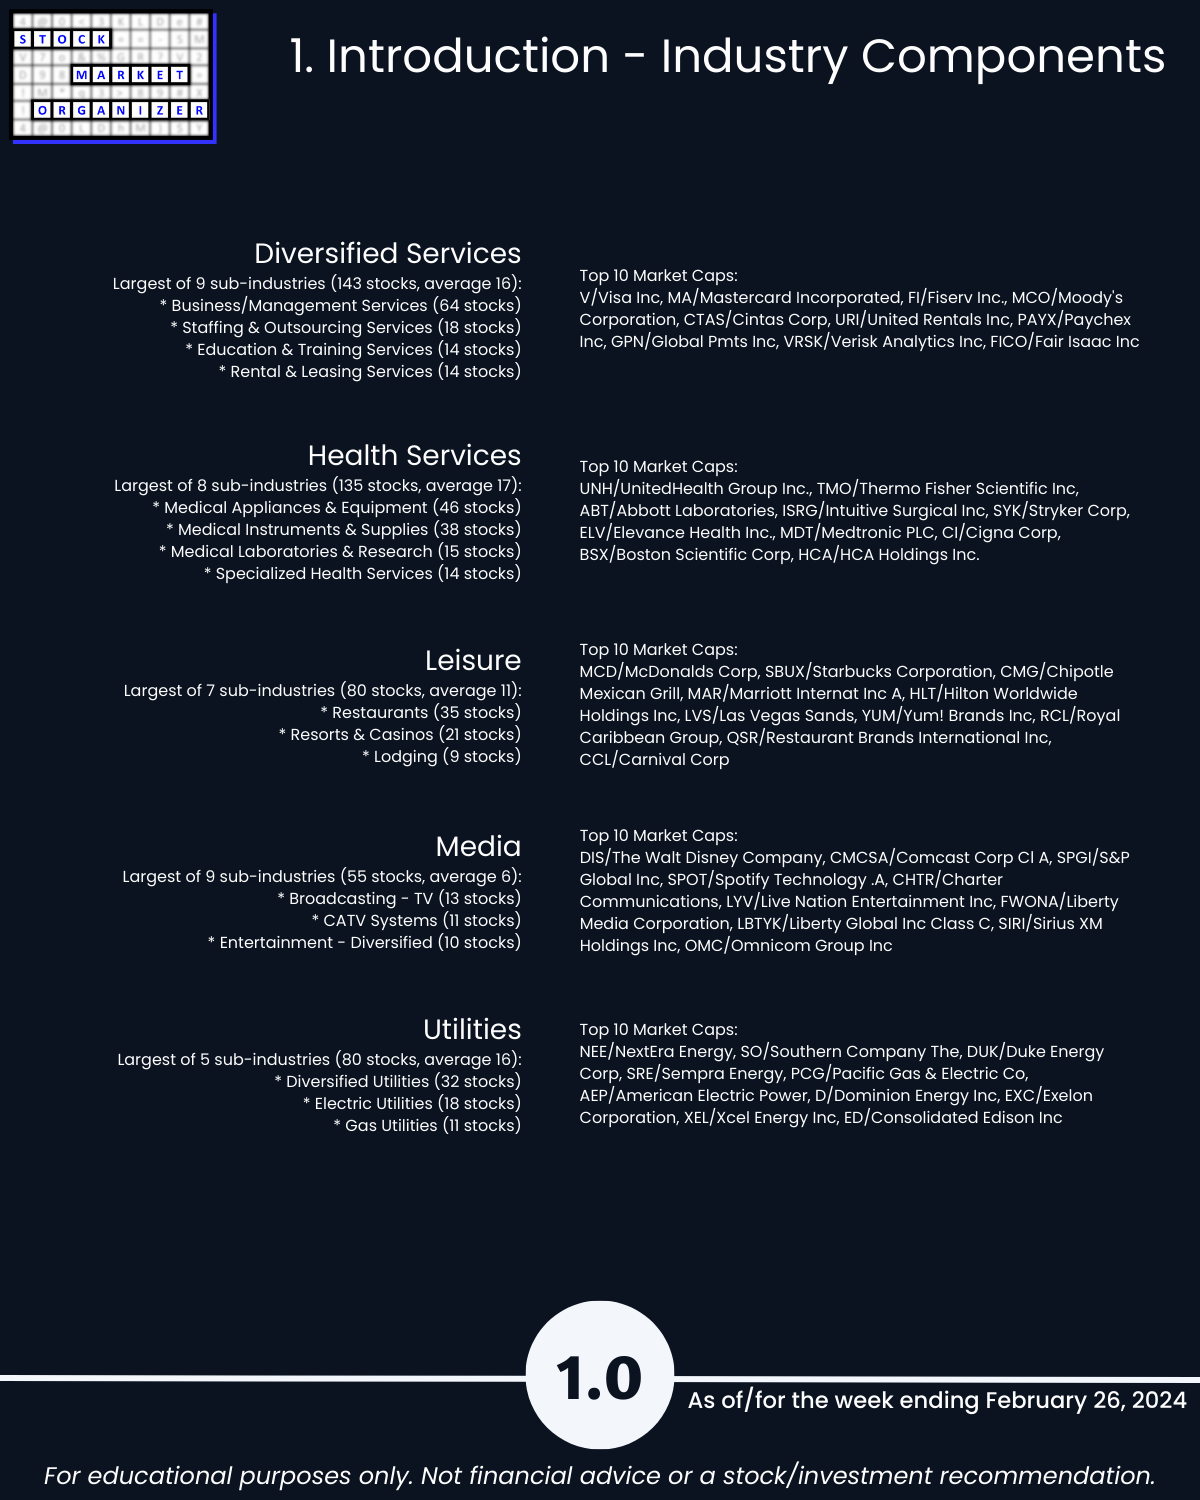
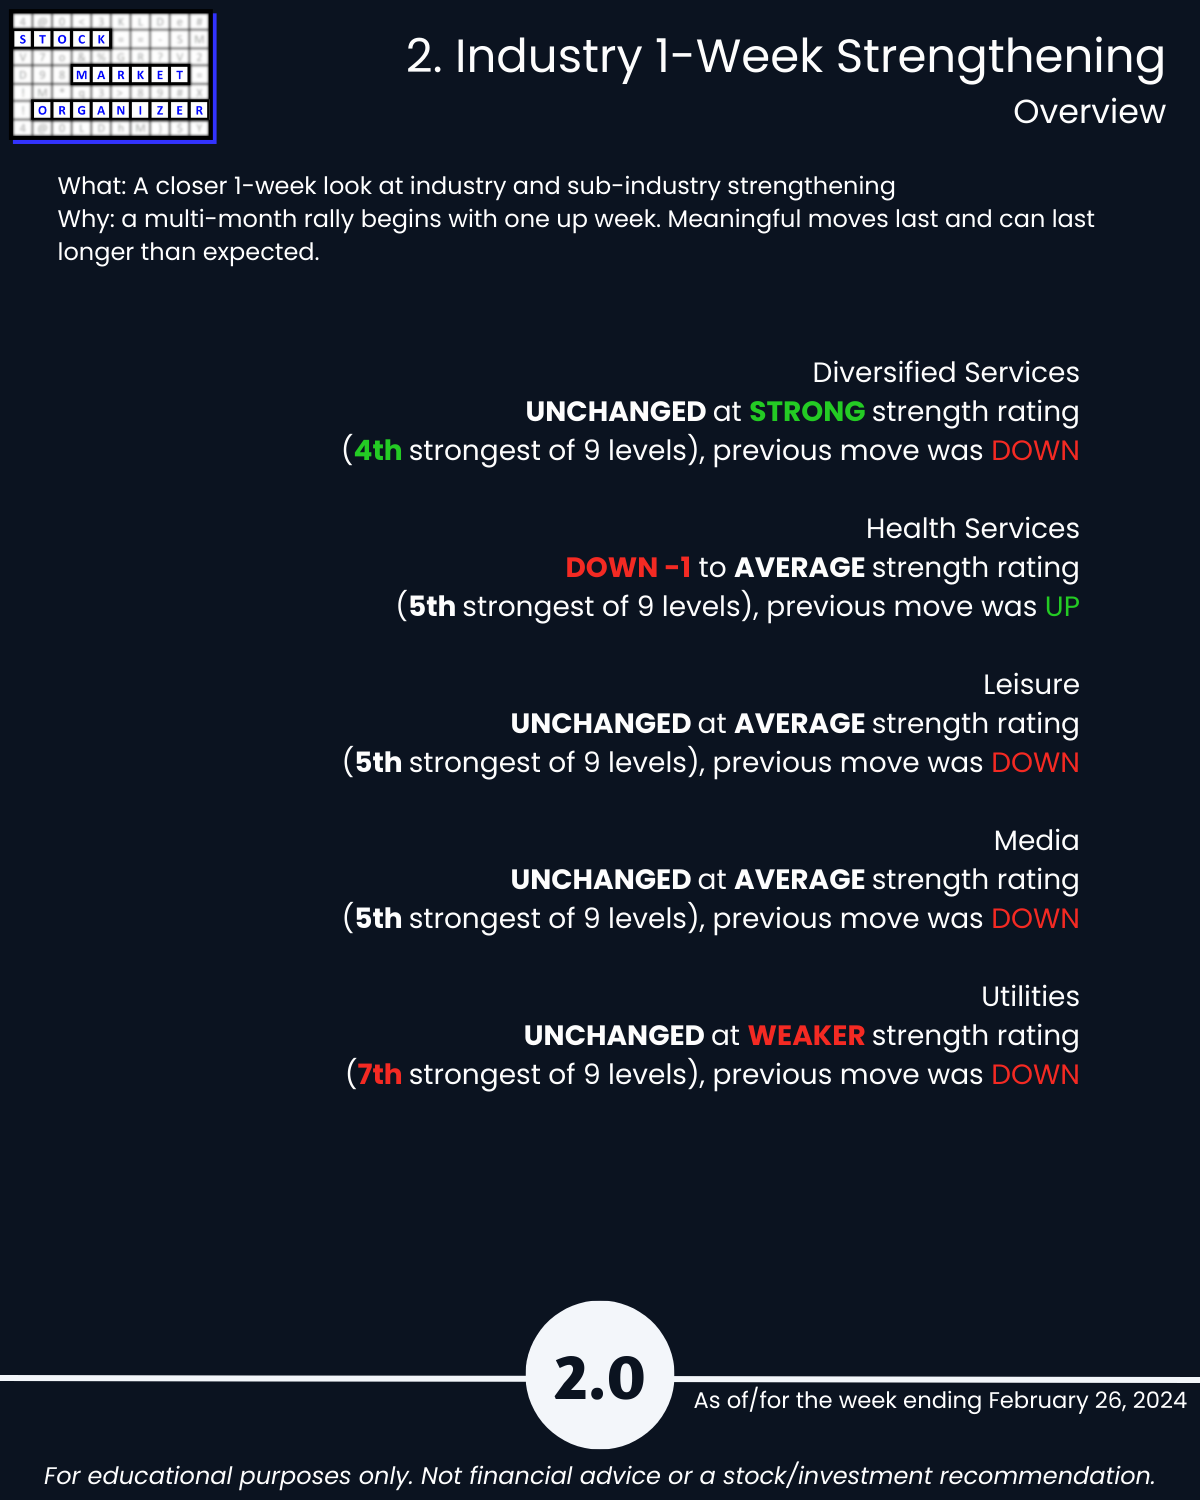
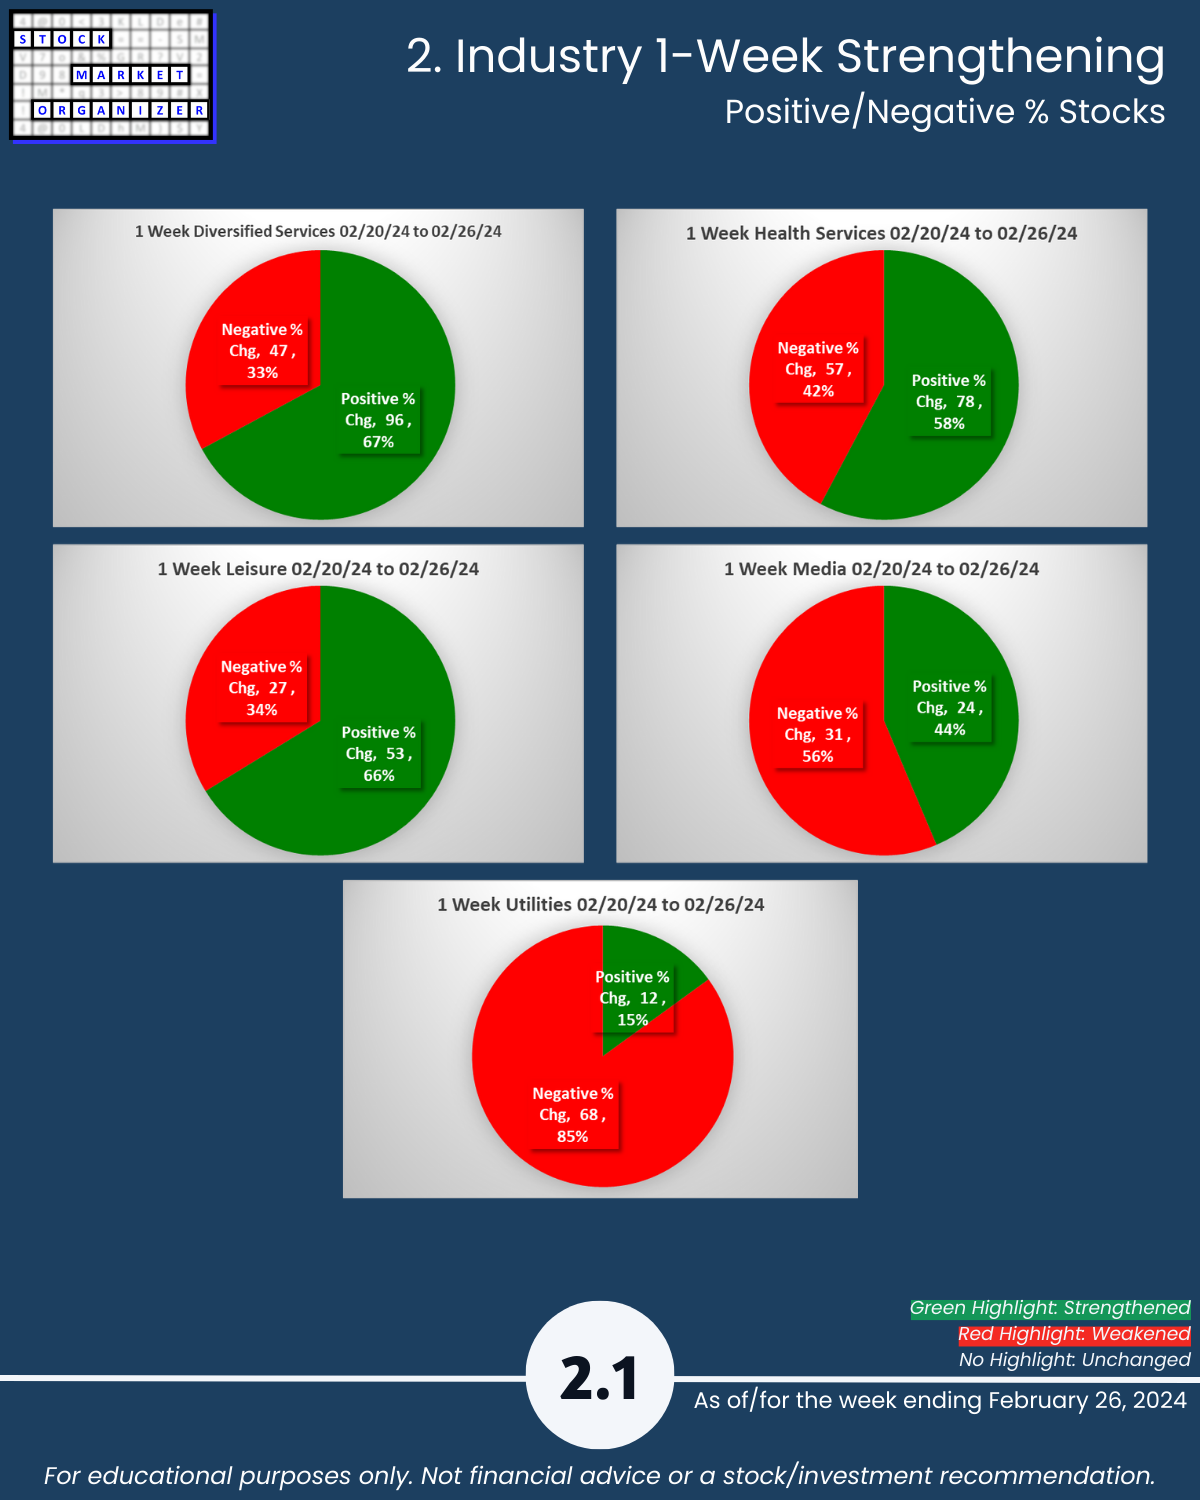
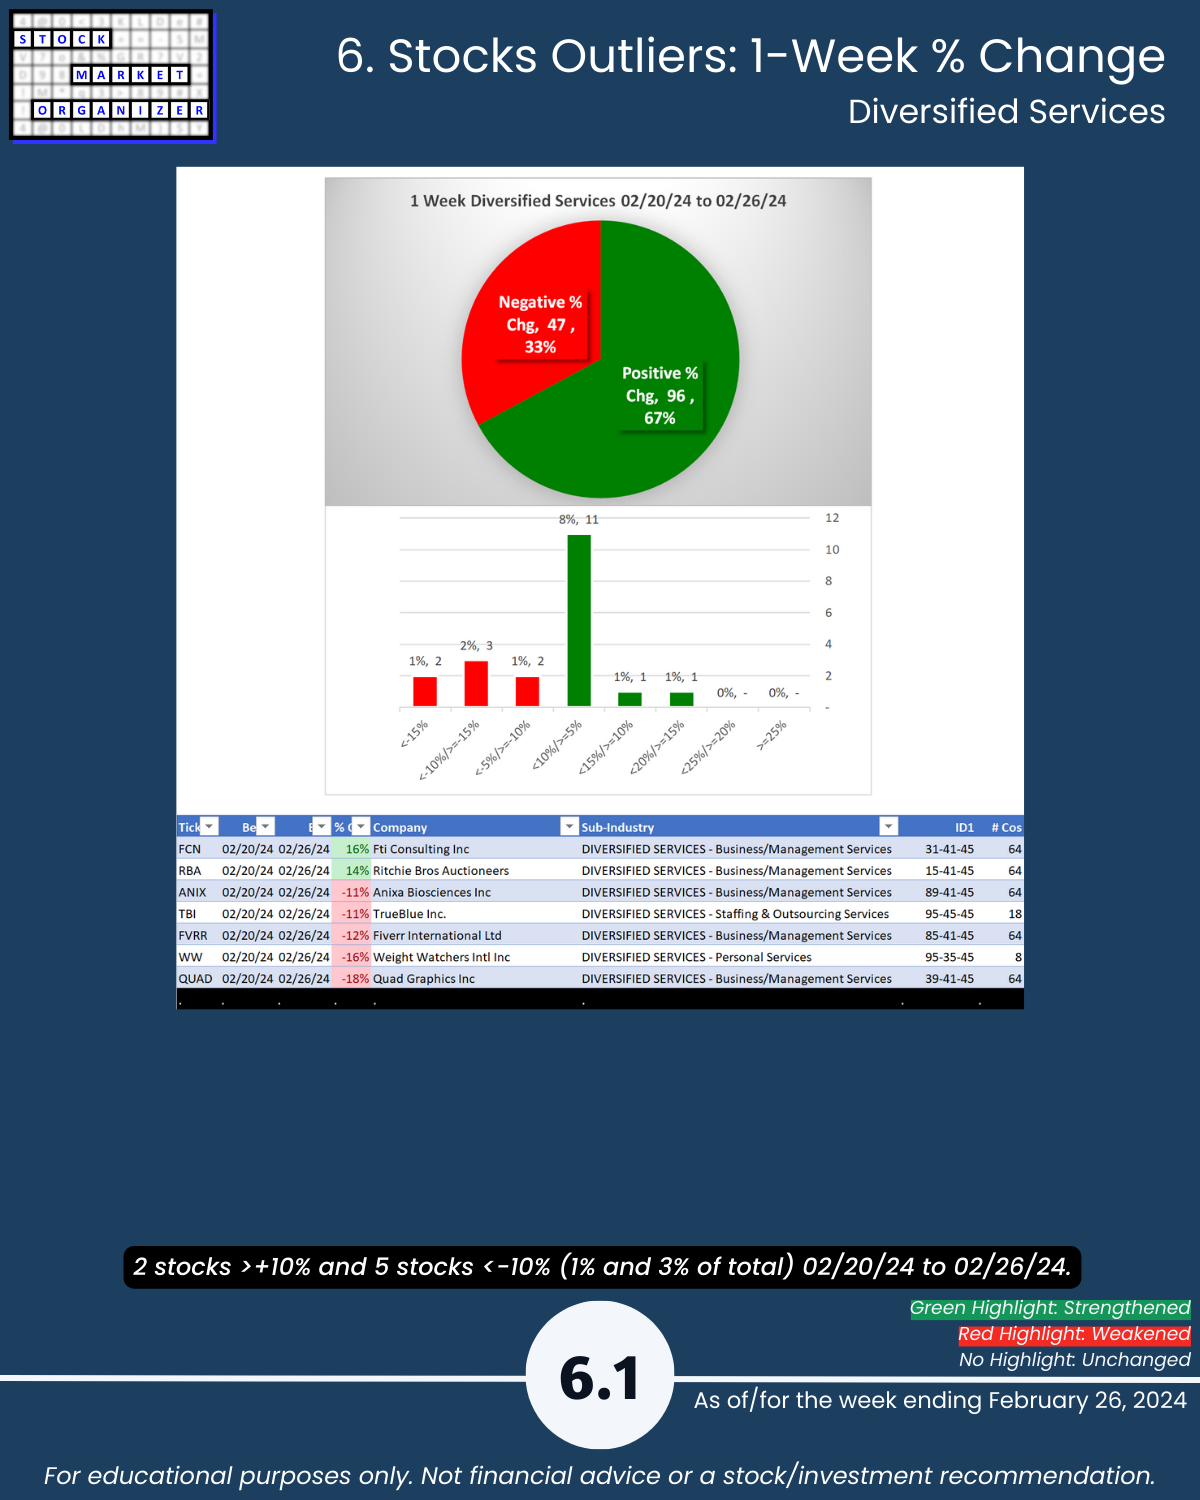
🔹 Strongest Industry: Diversified Services, 67% positive stocks (Strong, 4th strongest of 9 levels)
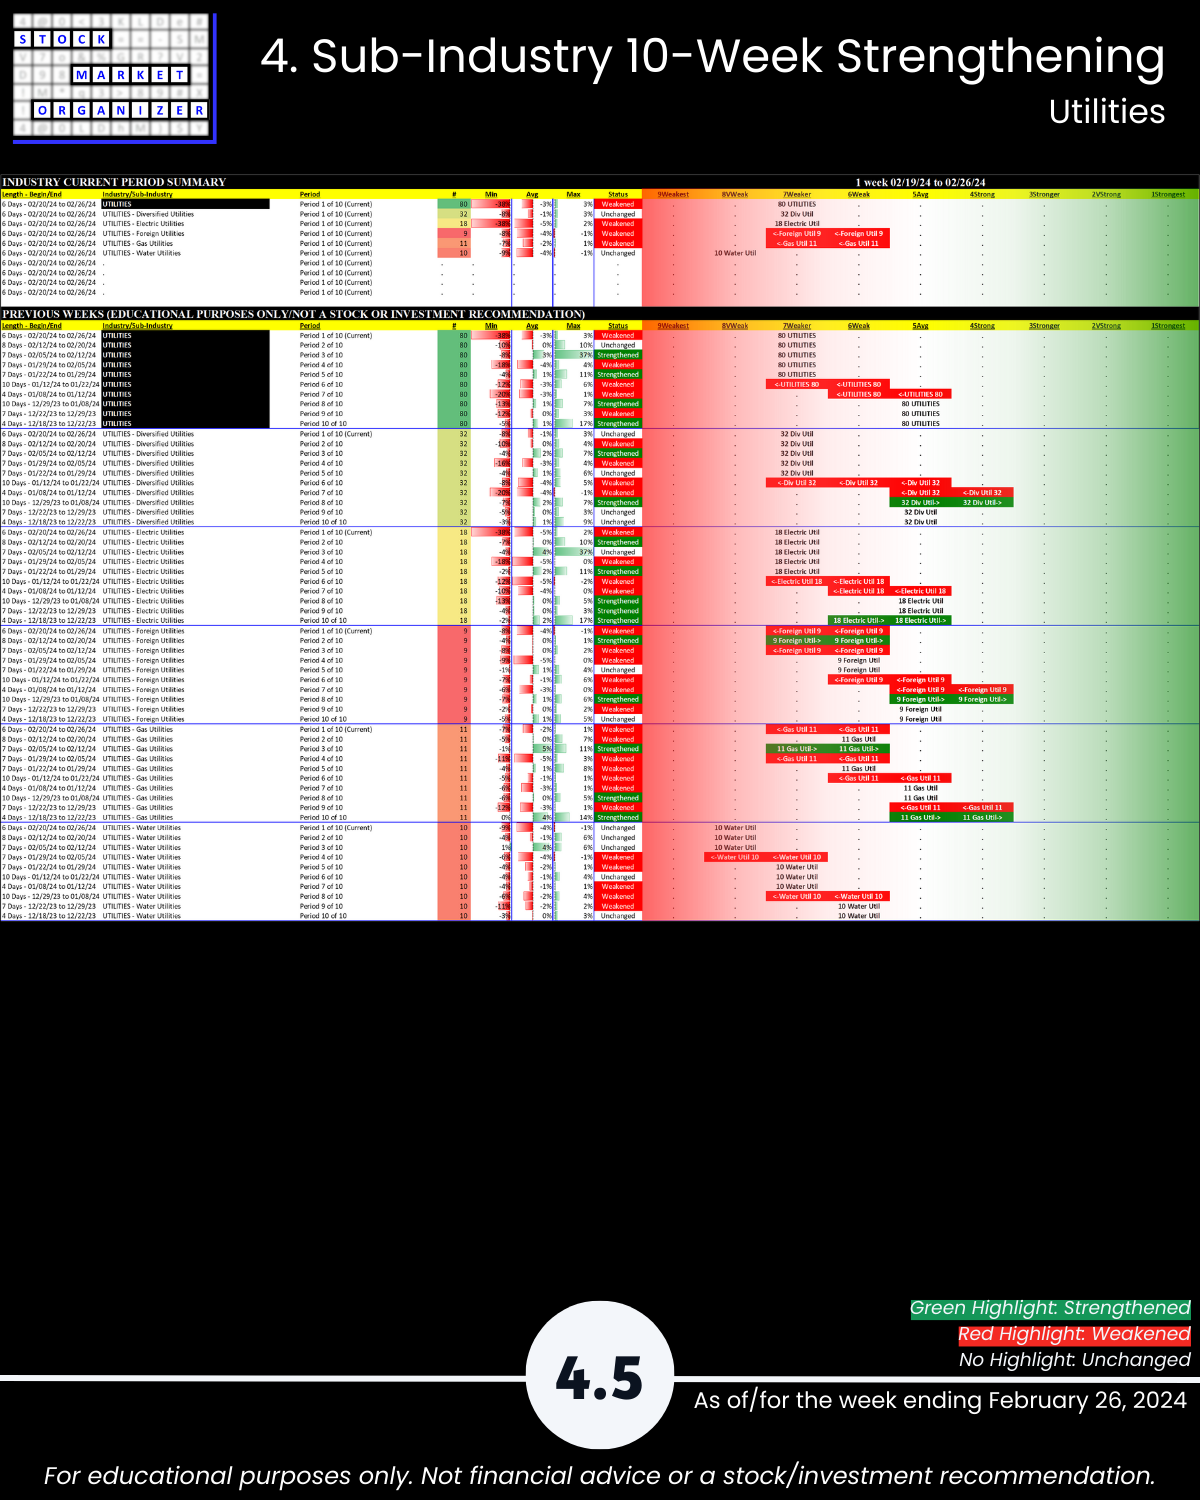
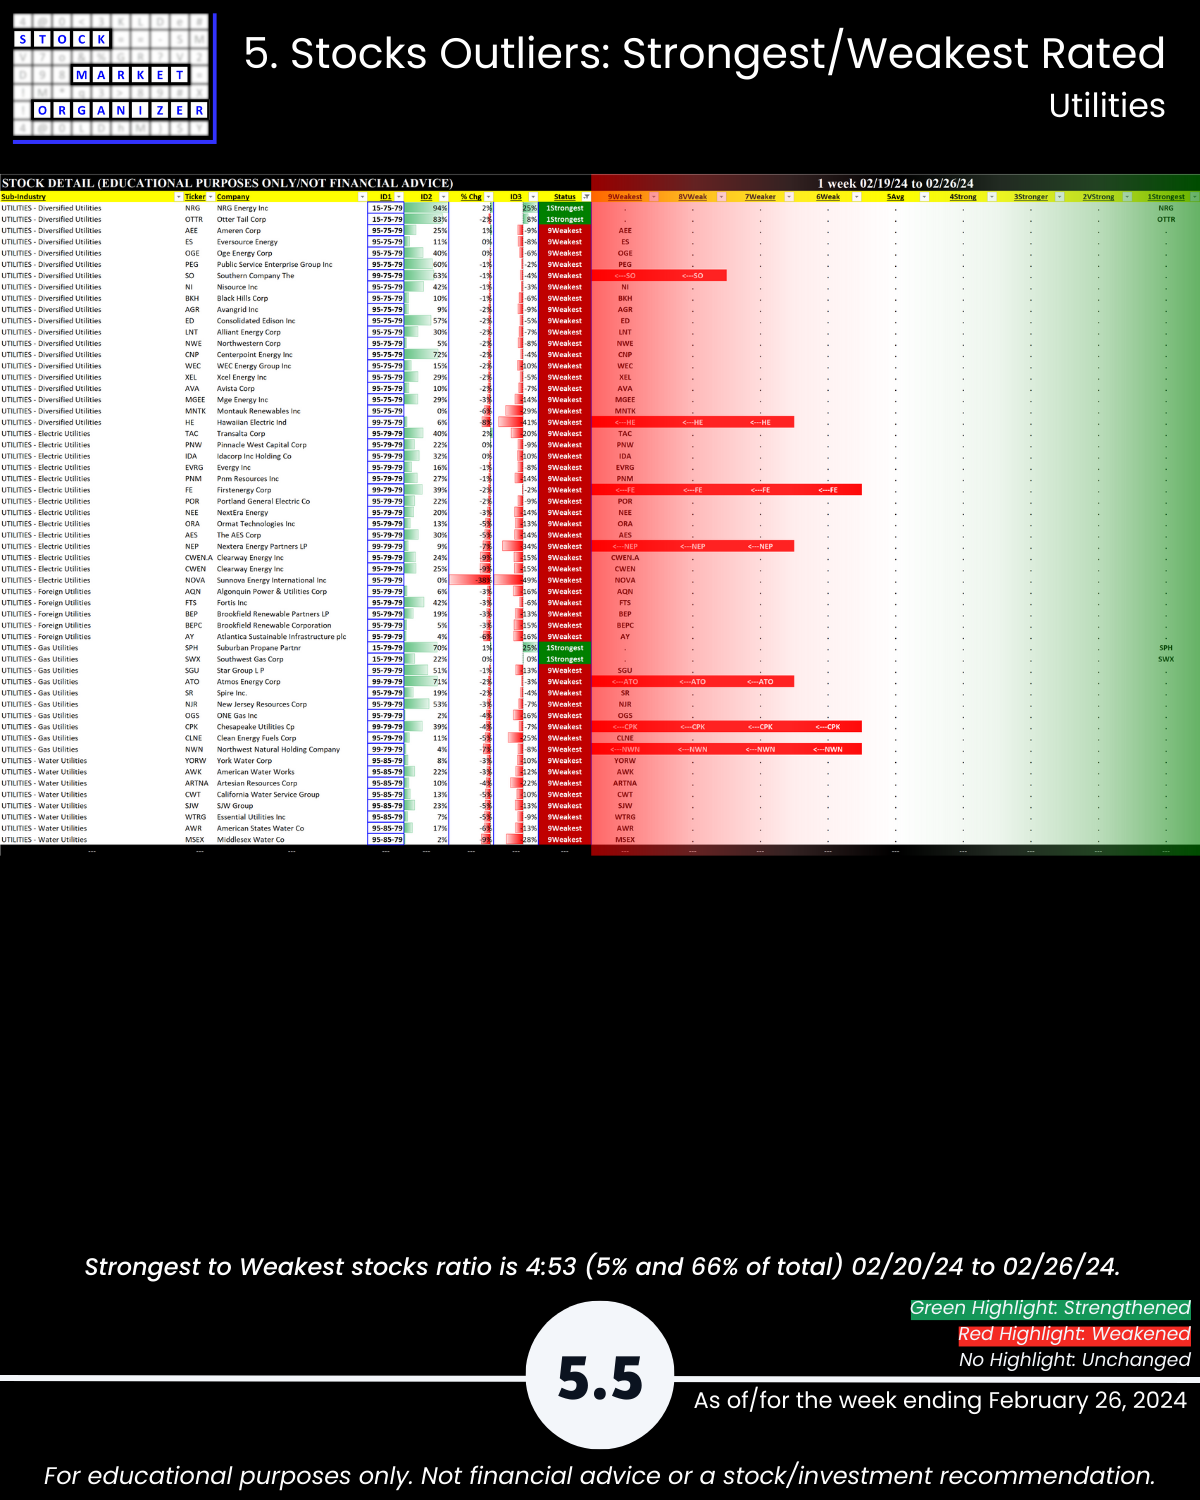
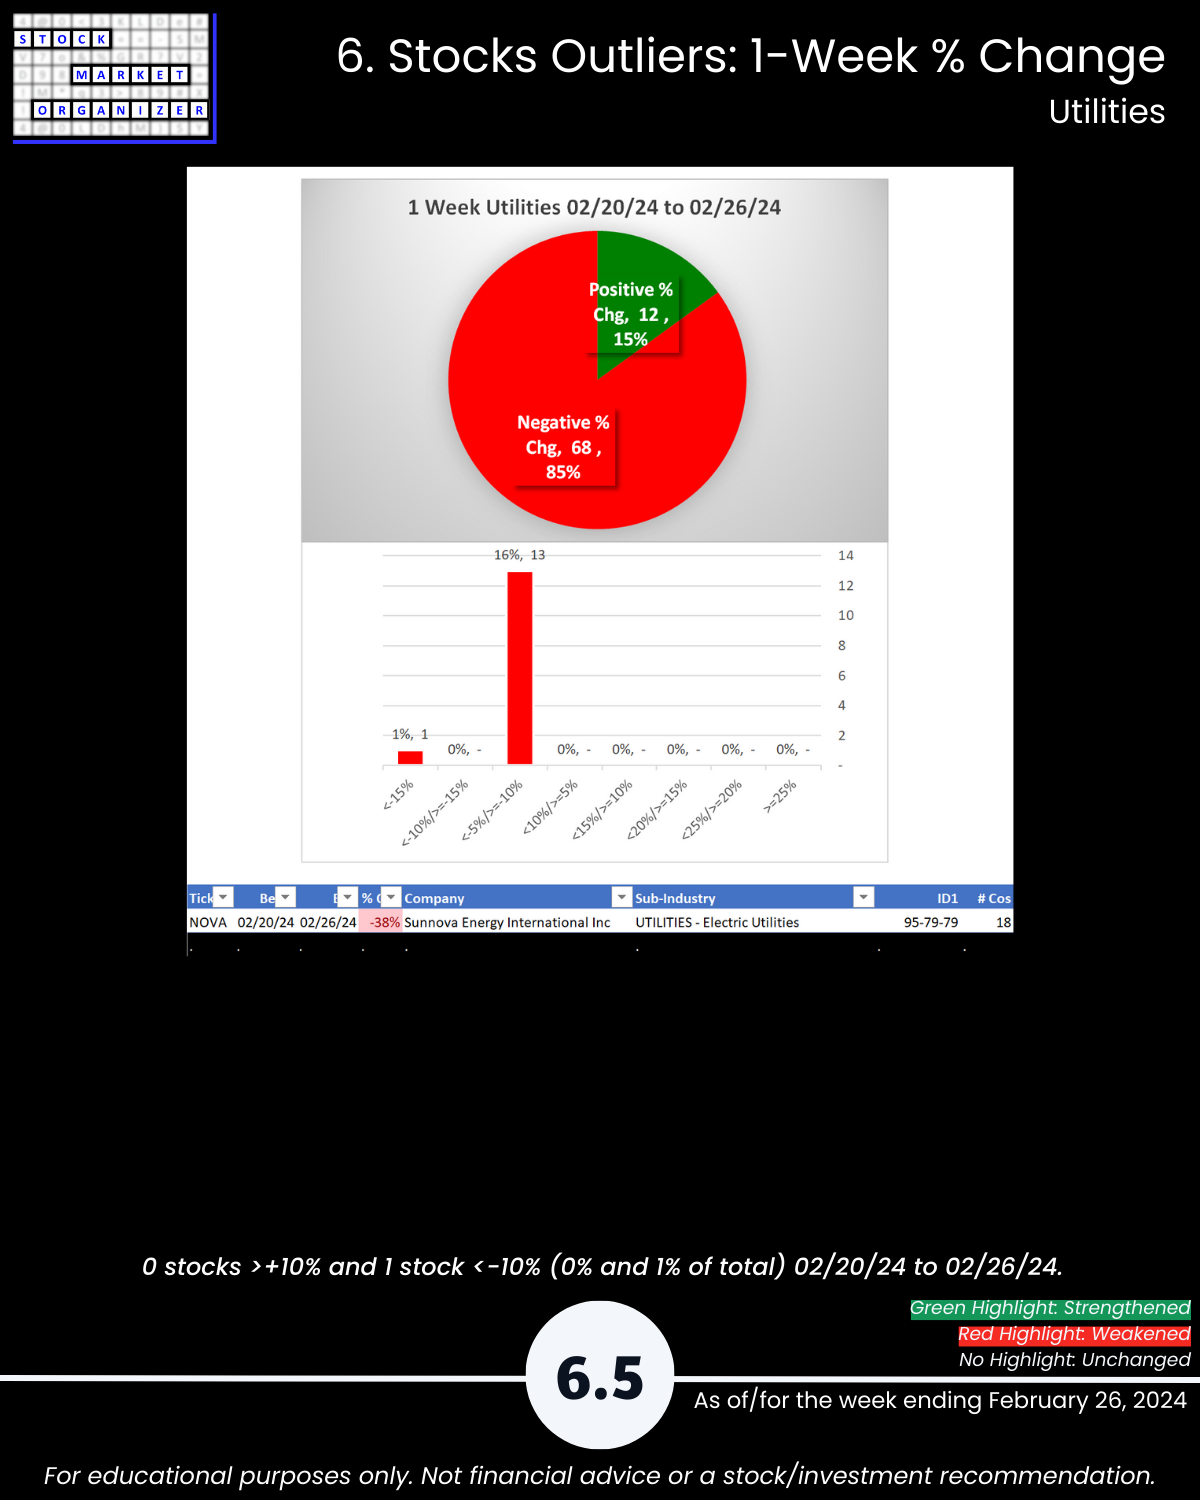
🔹 Weakest Industry: Utilities, 85% negative stocks (Weaker, 7th strongest)
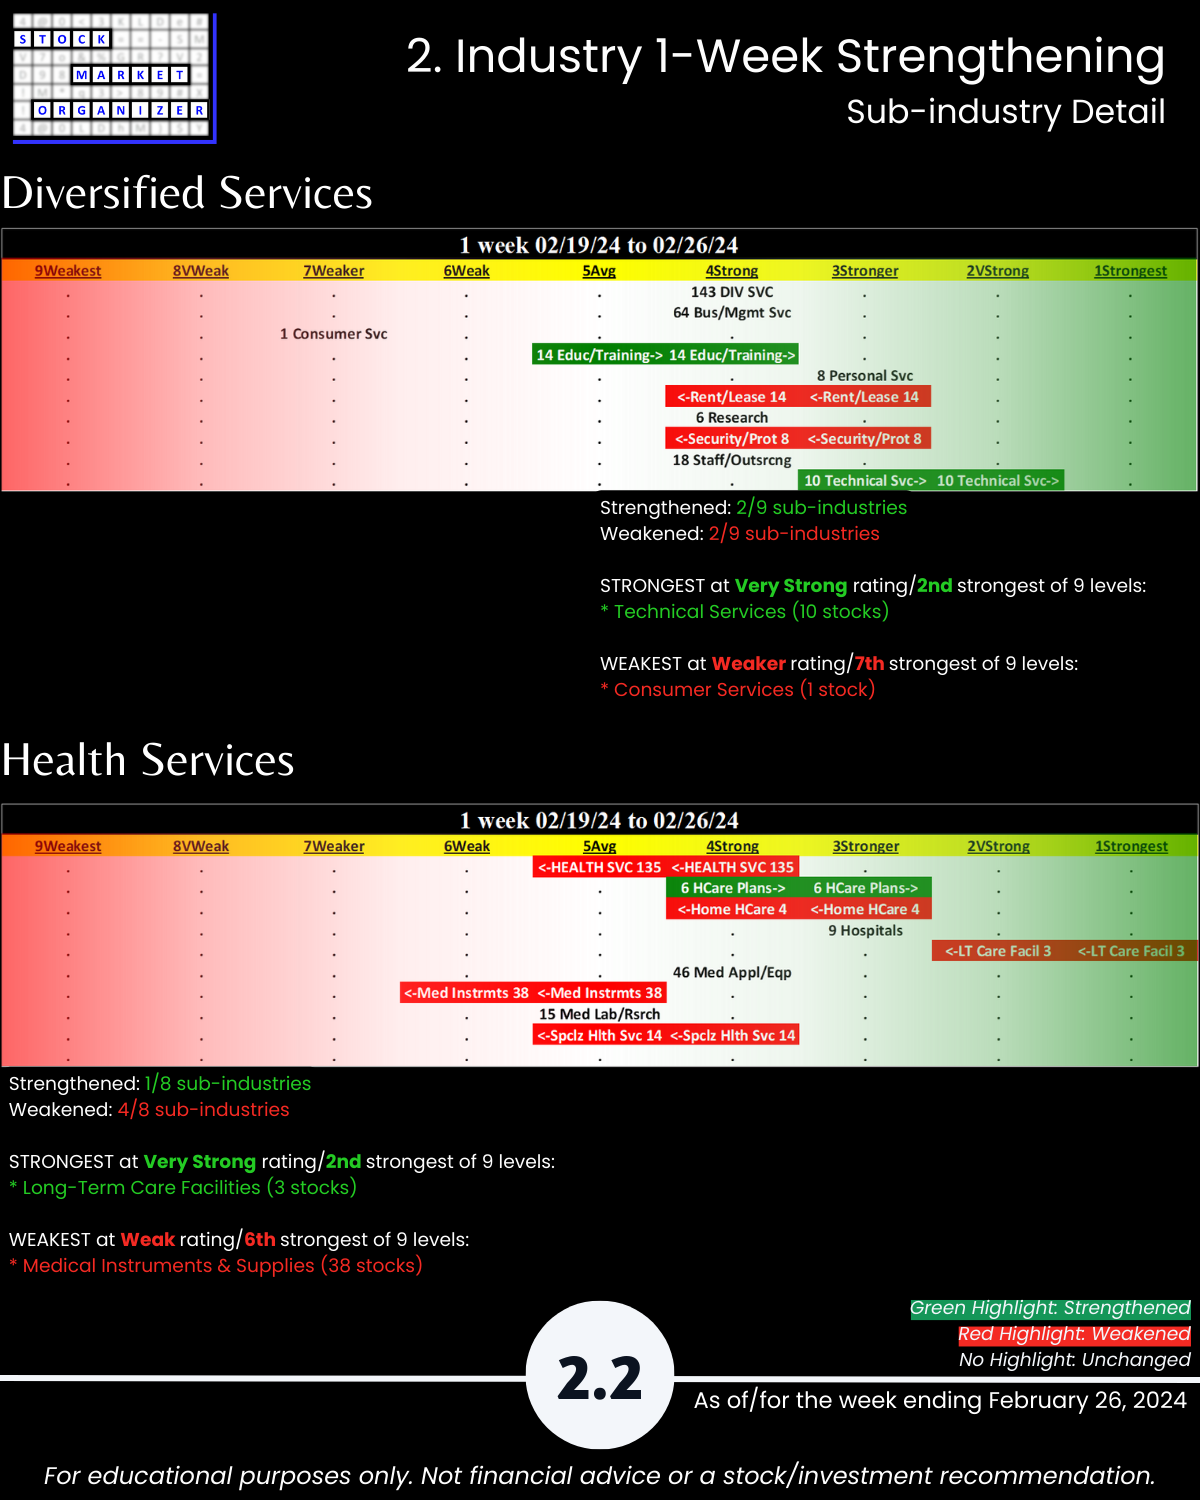
🔹 Sub-industries (28): 21% Strengthened, 46% Weakened
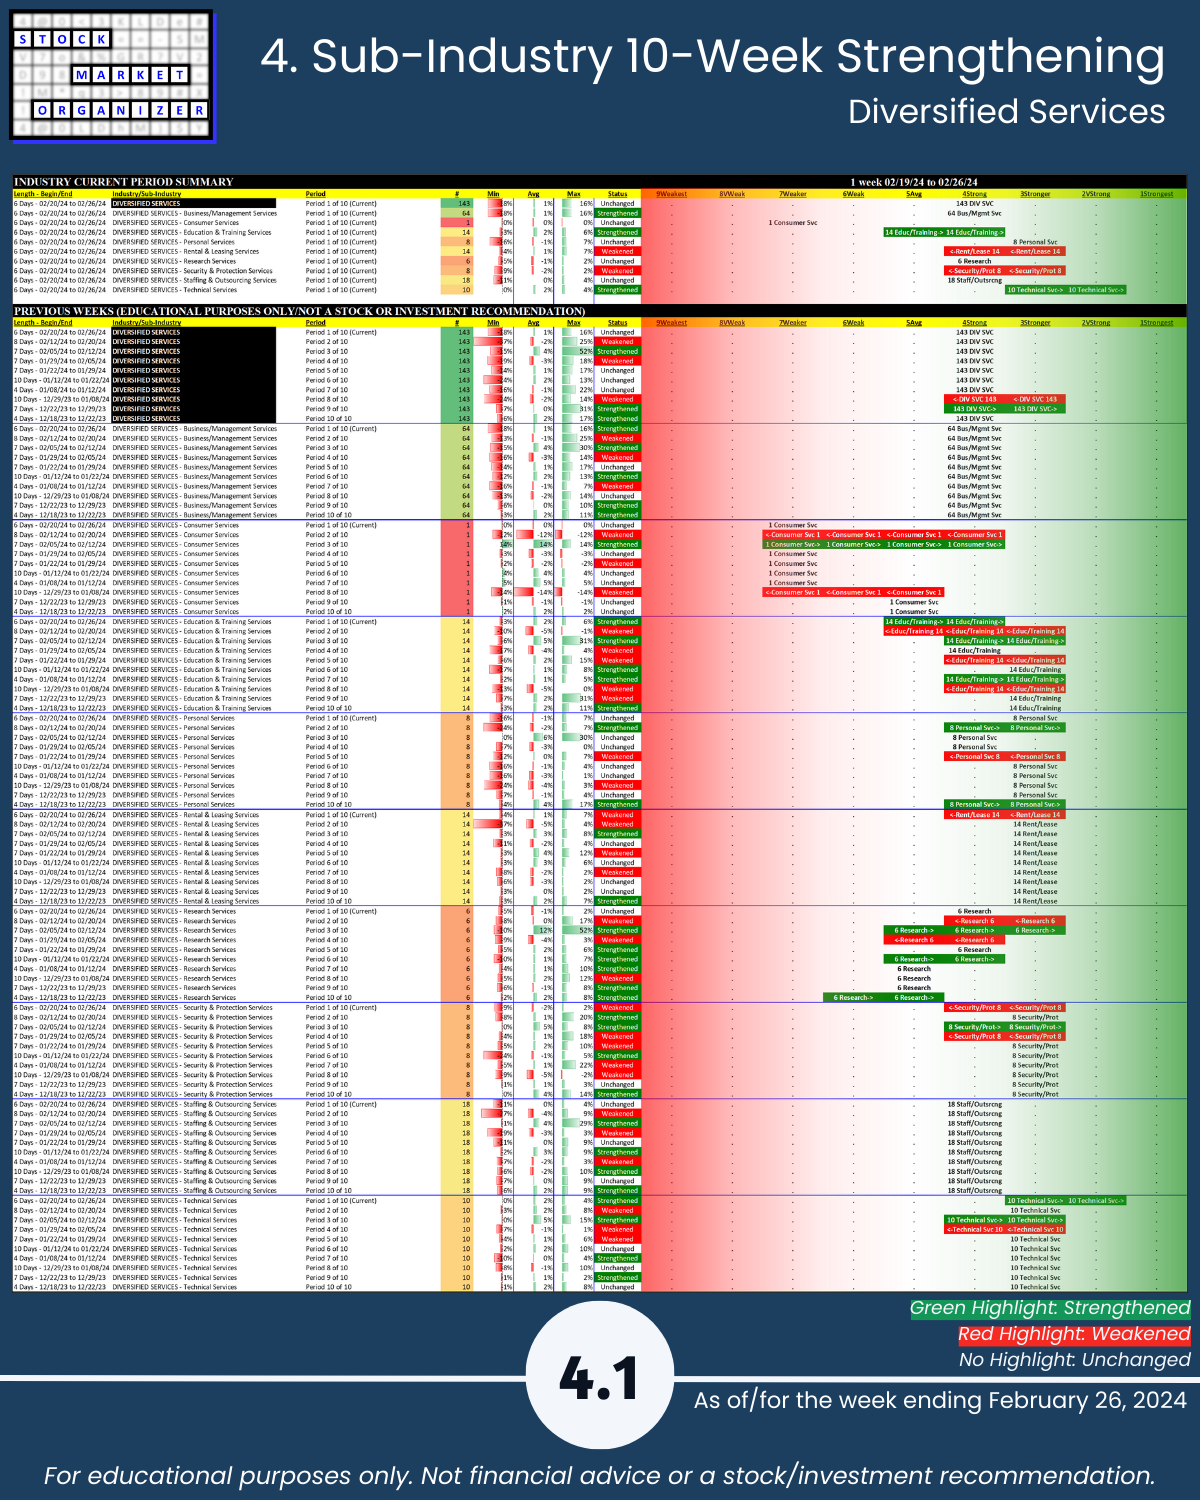
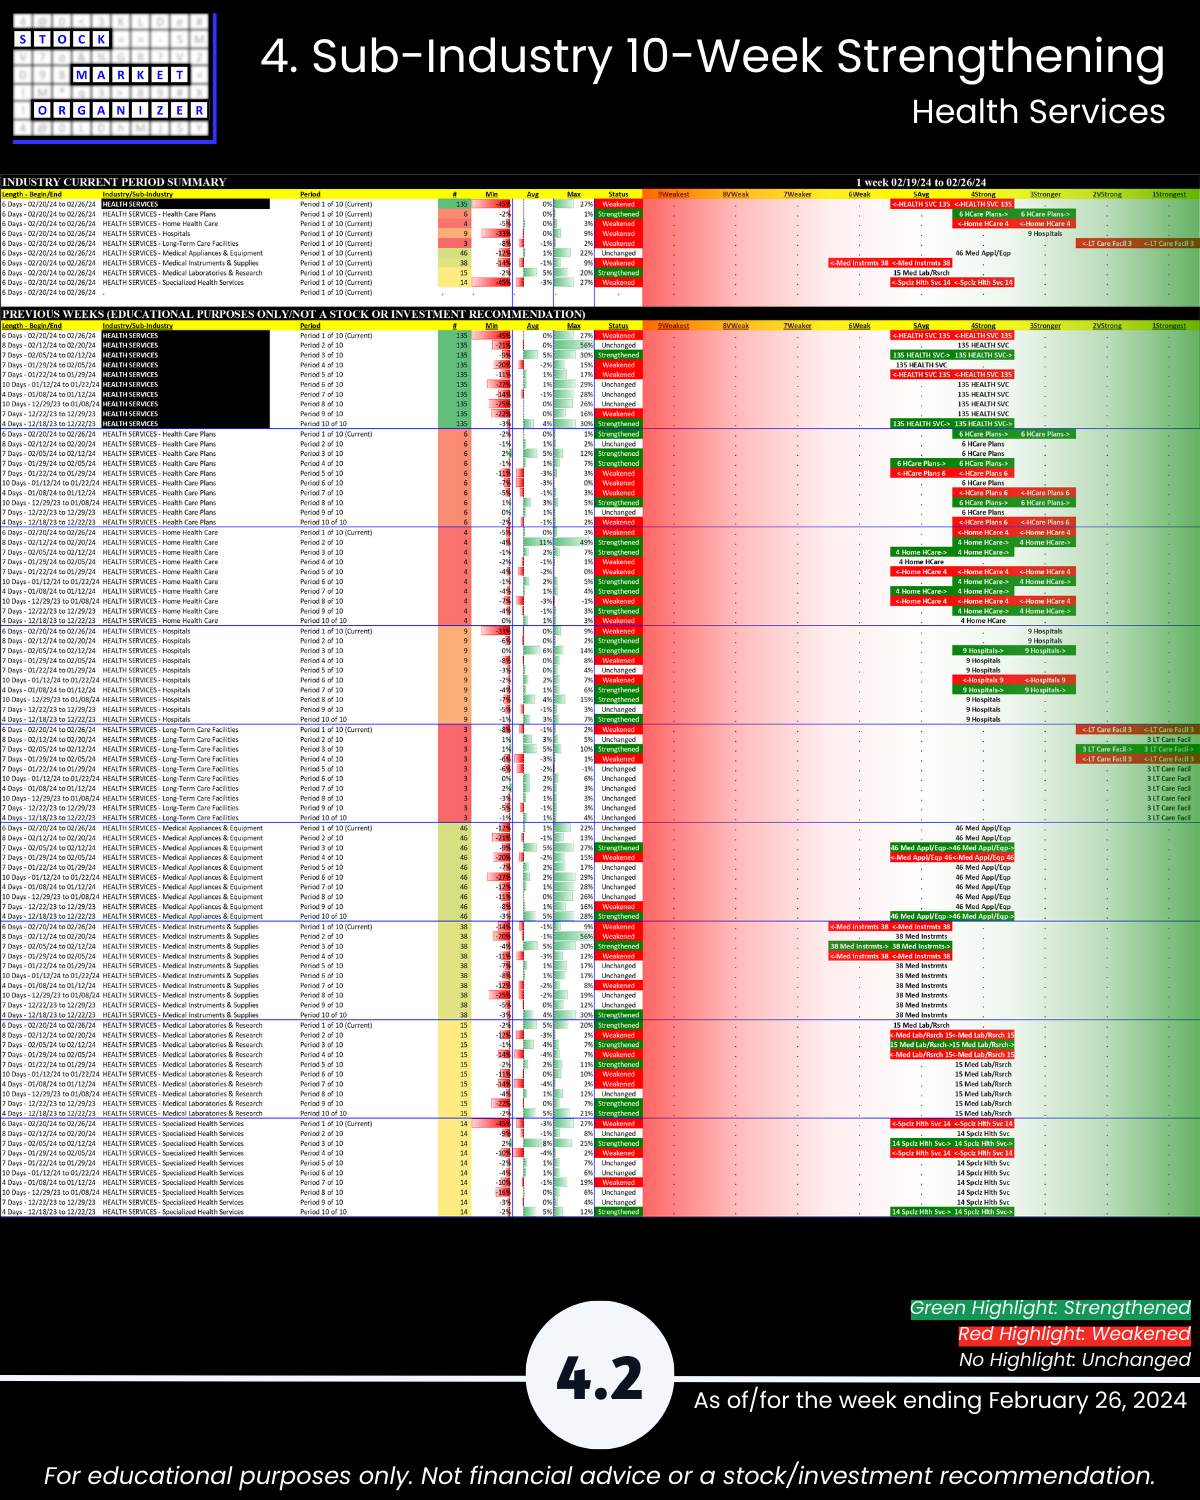
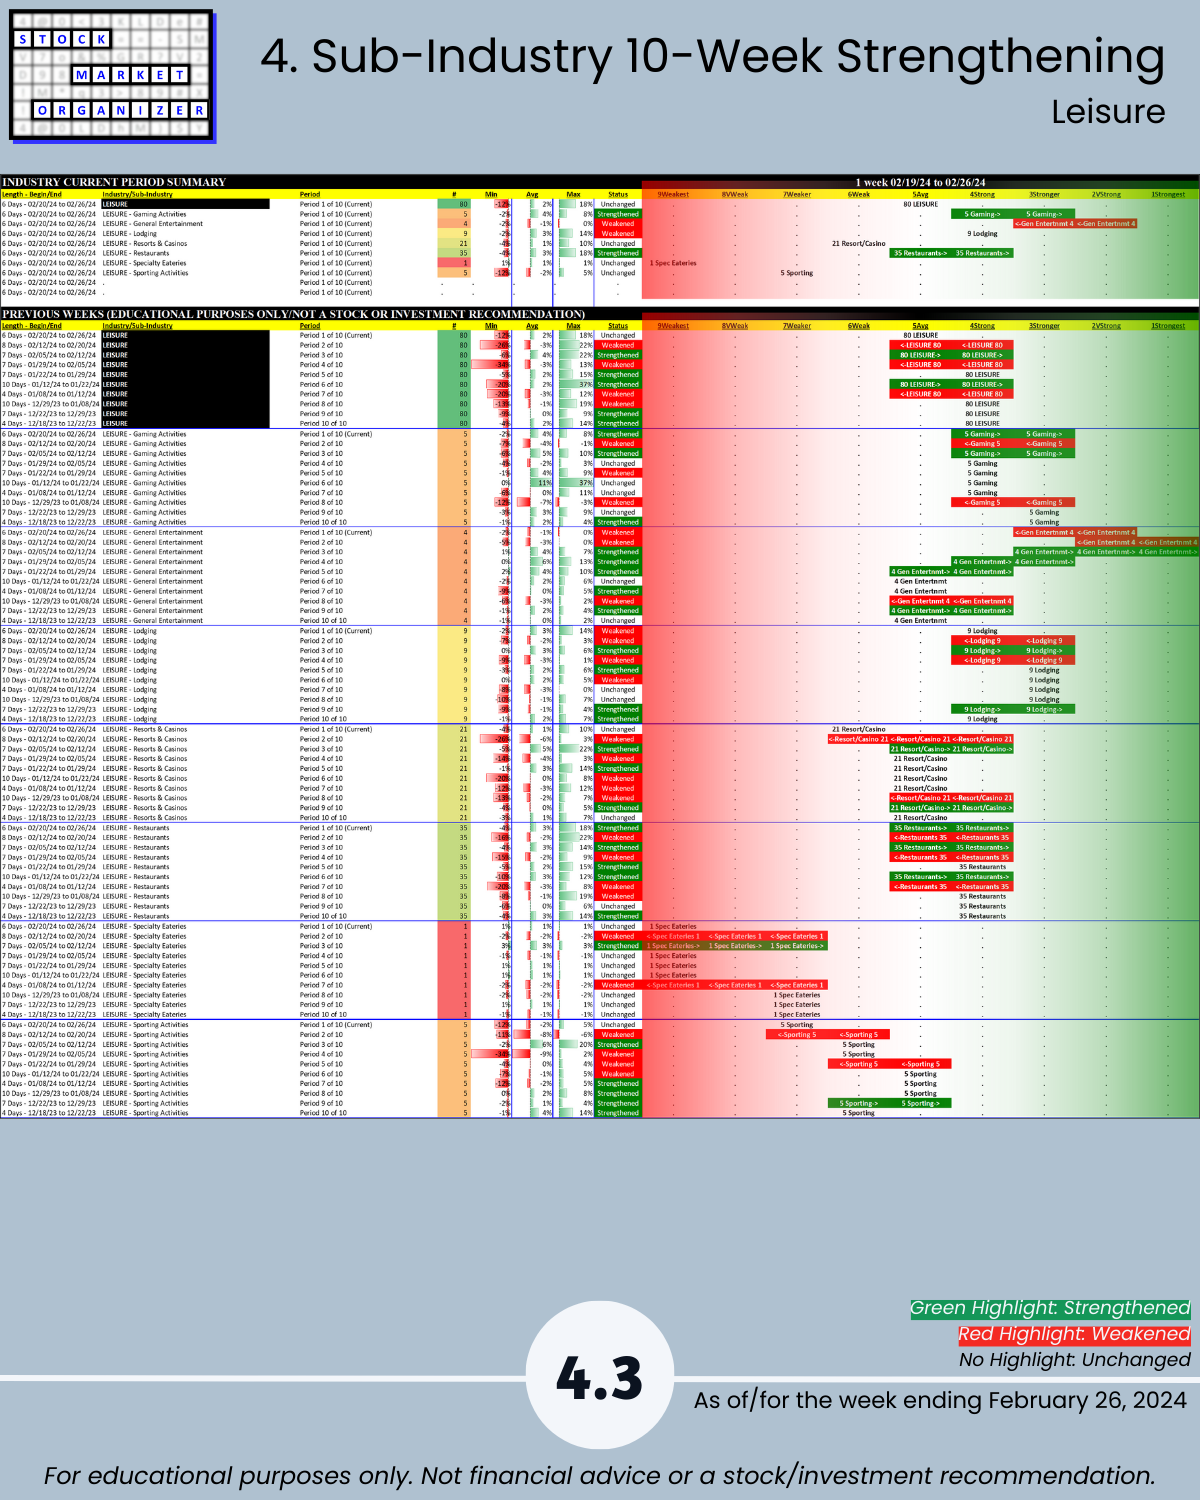
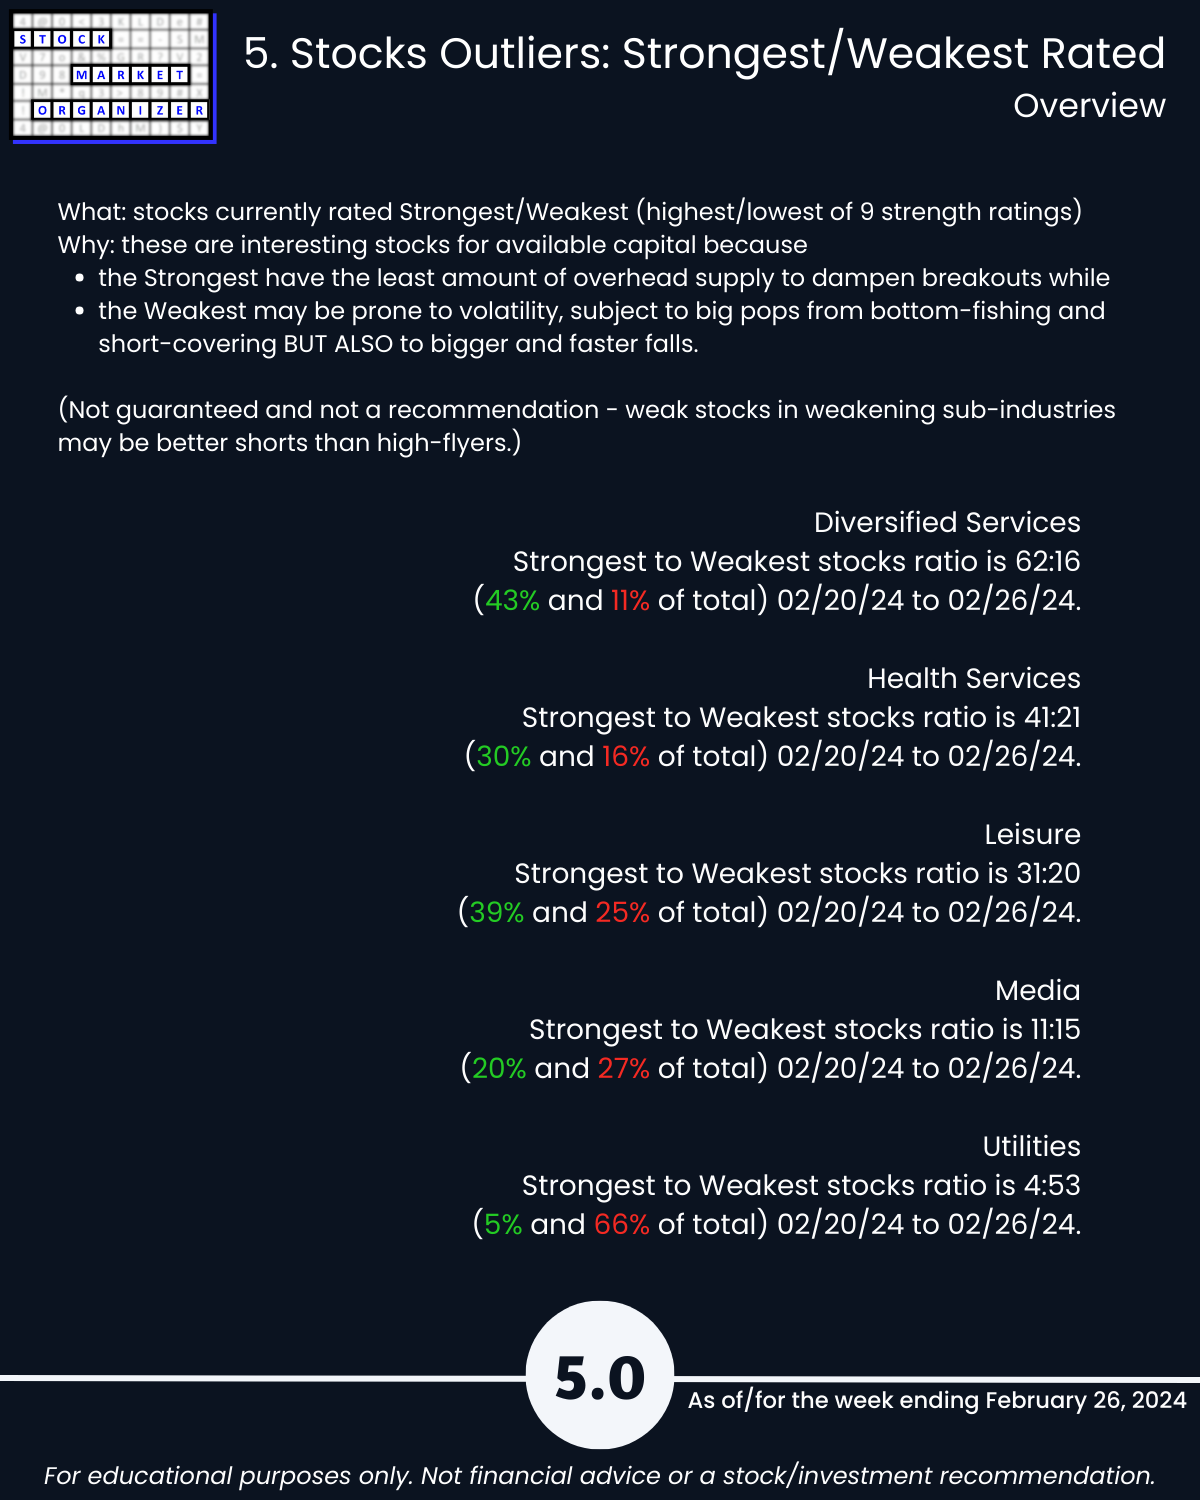
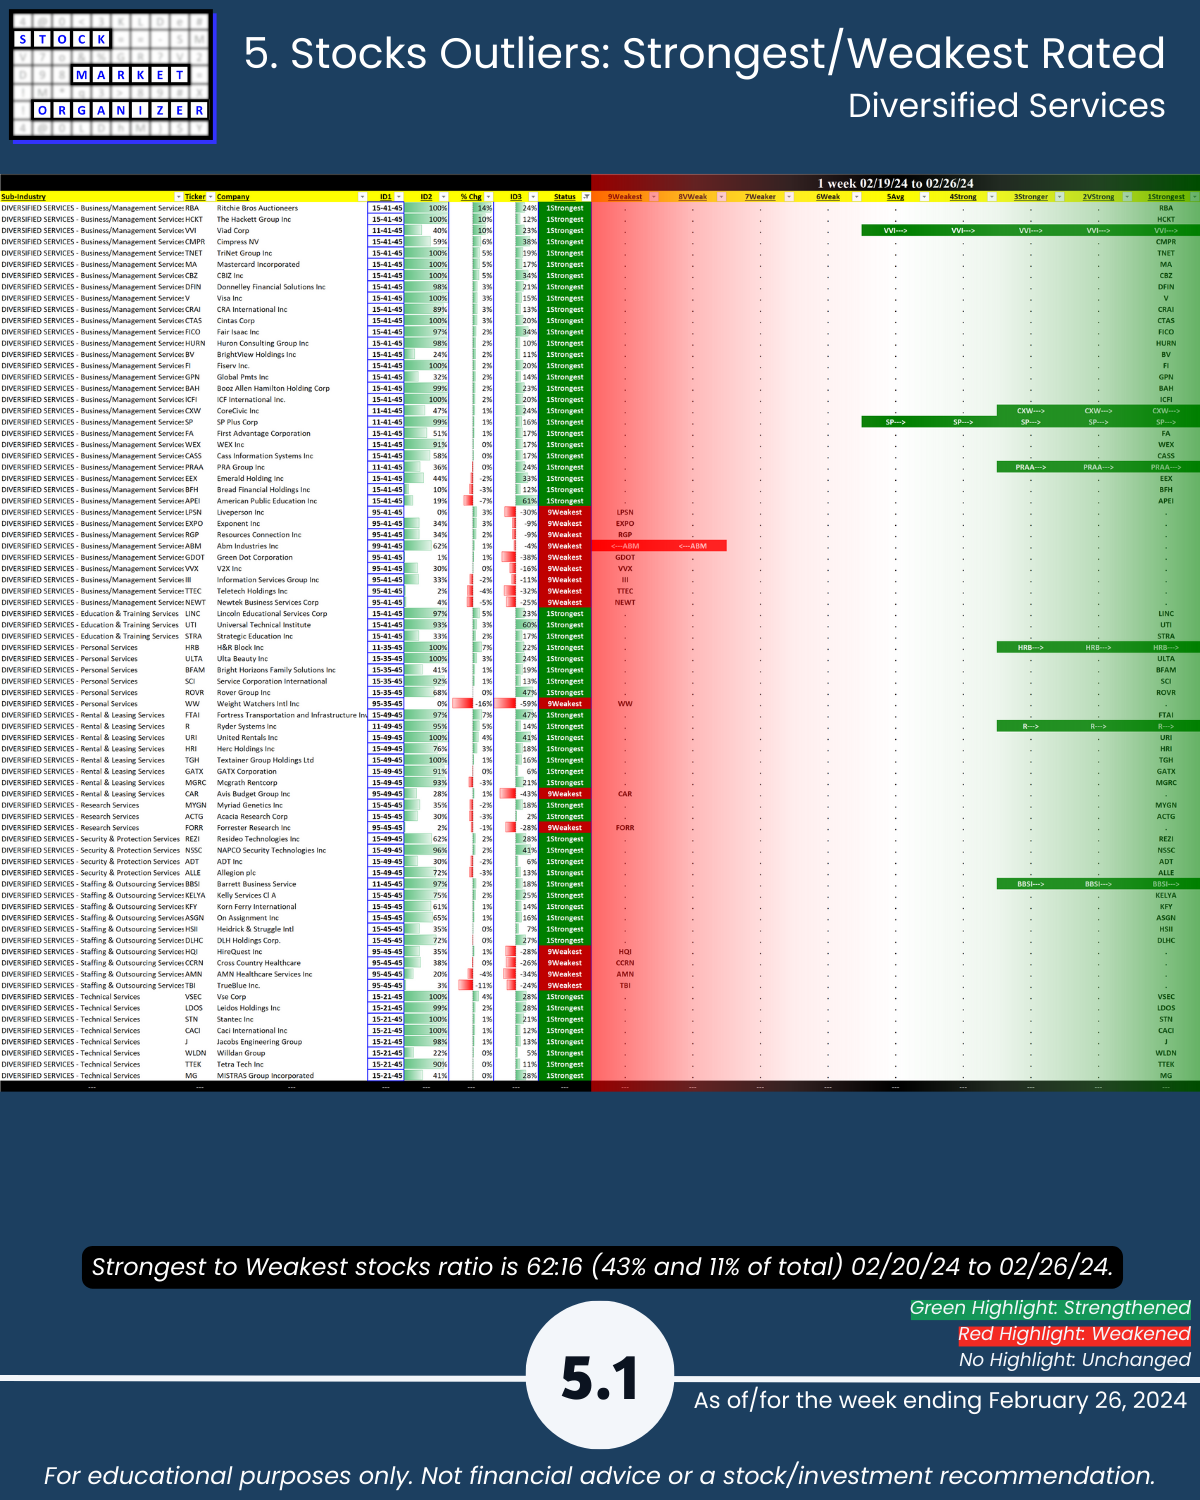
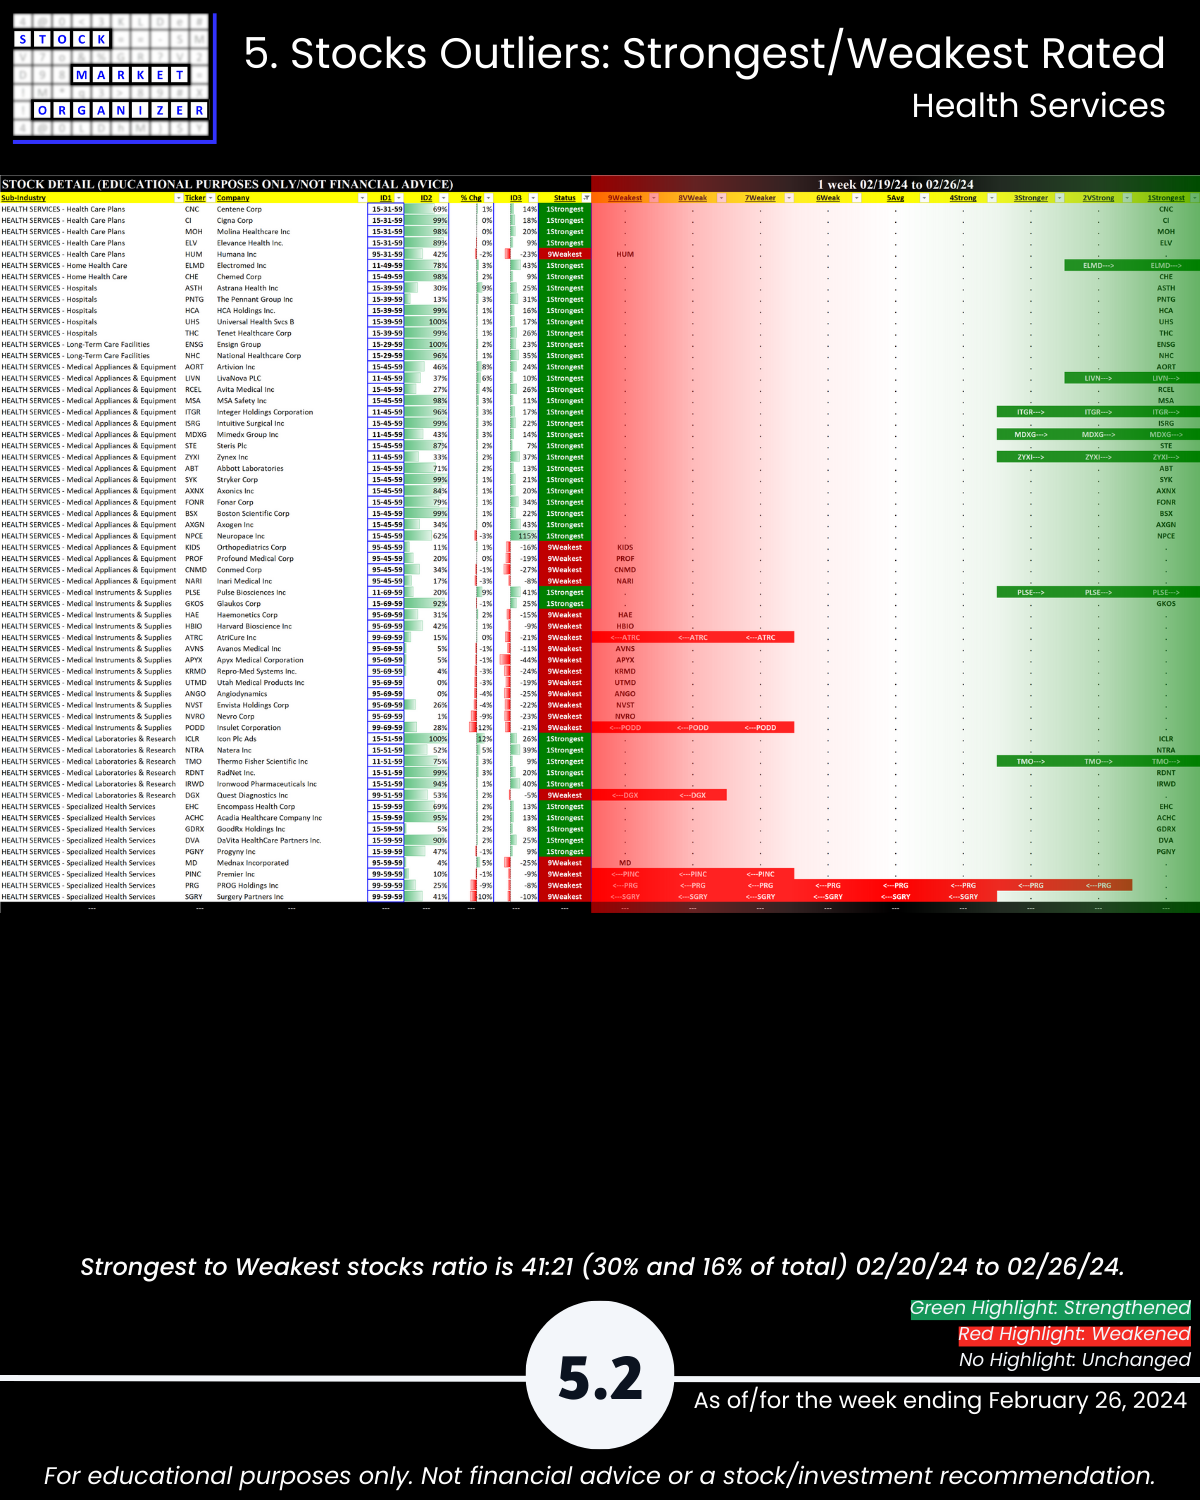
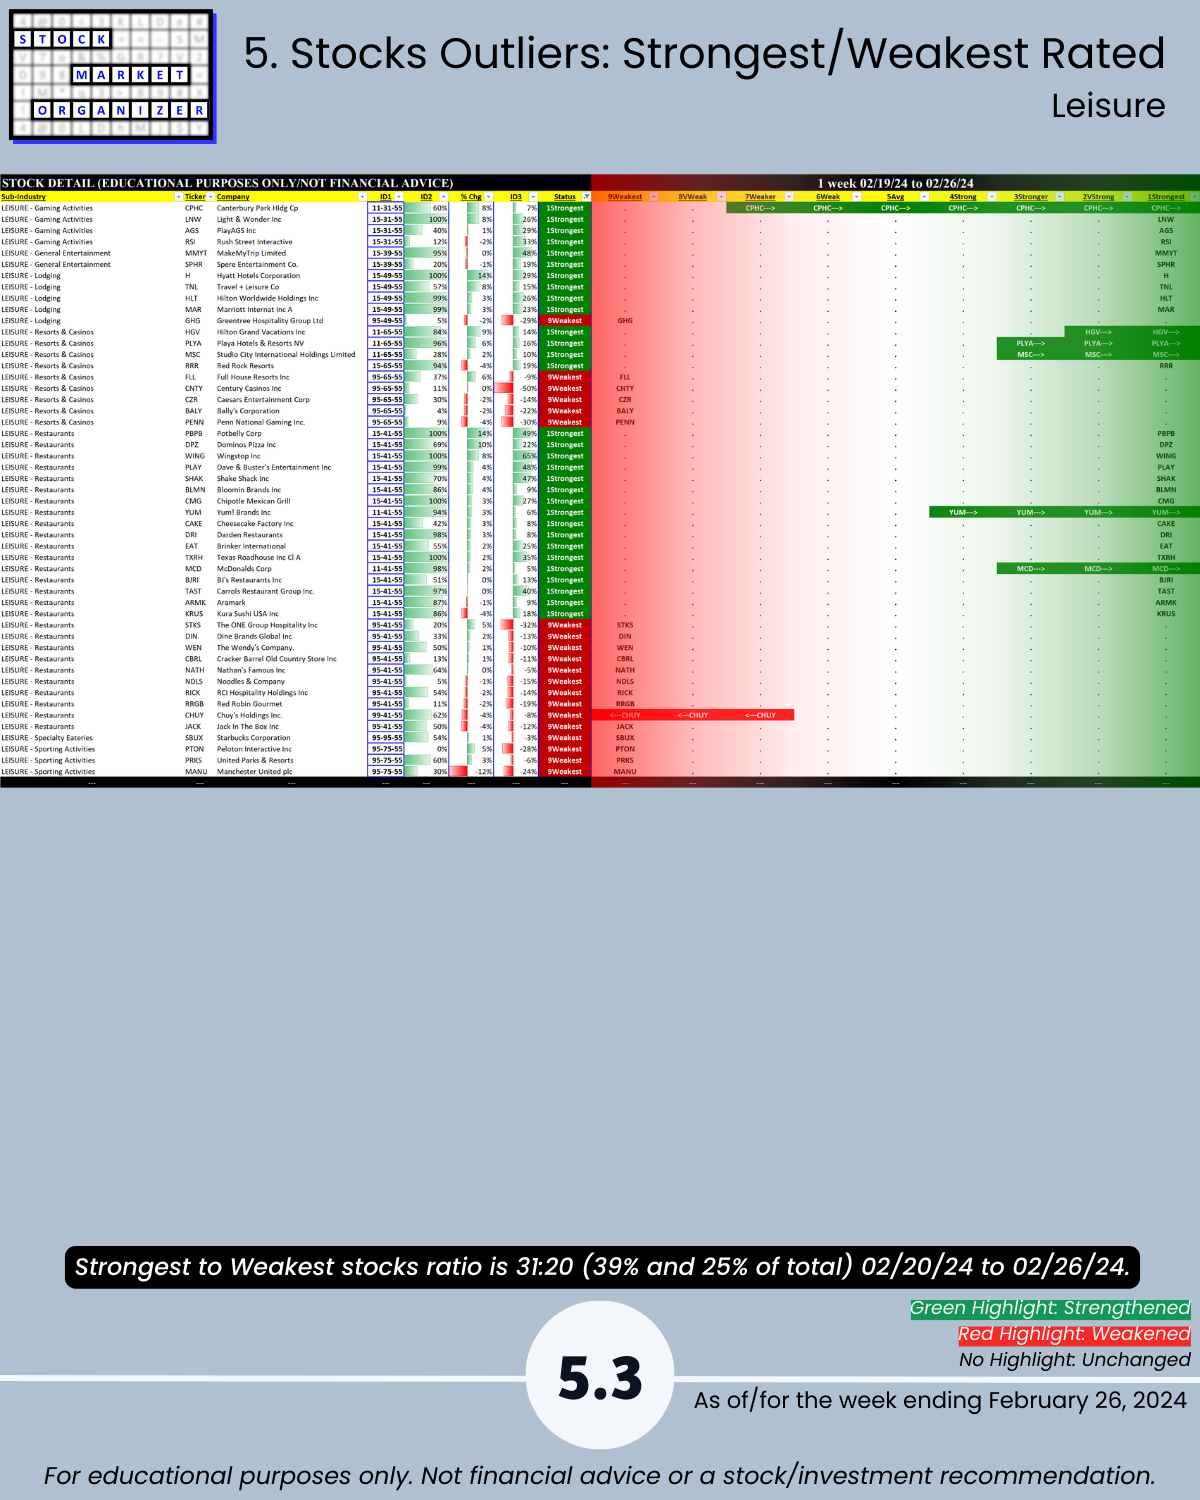
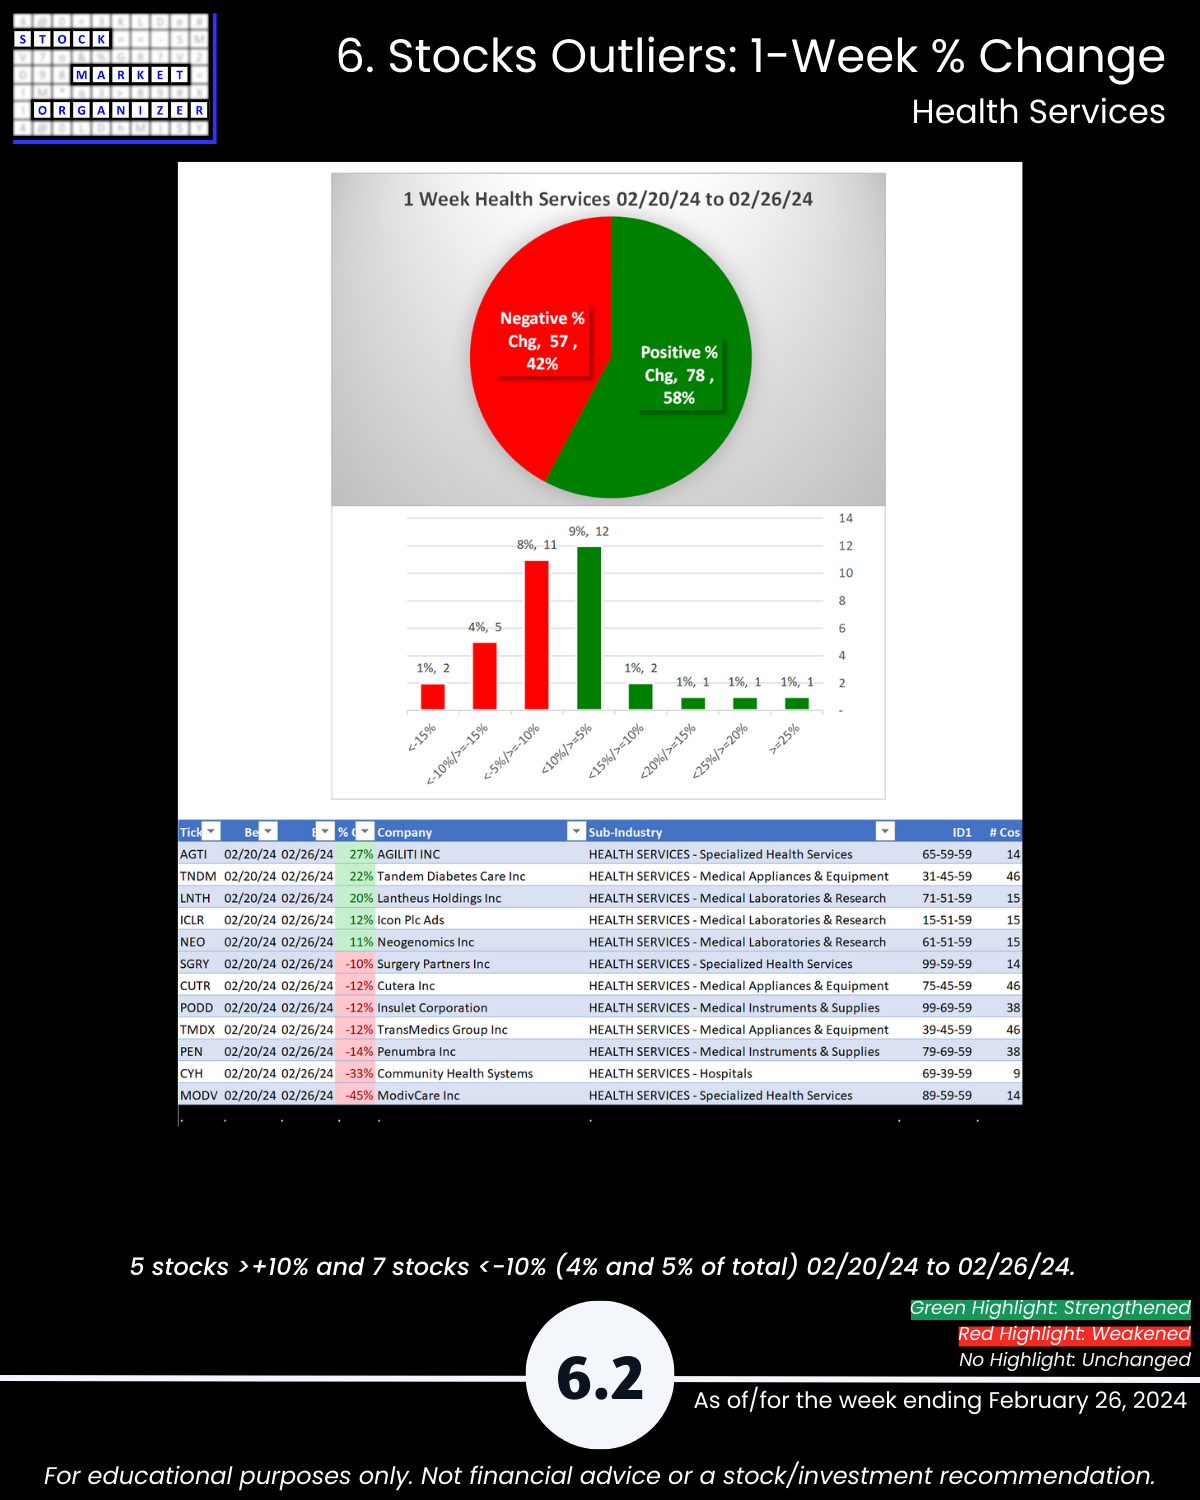
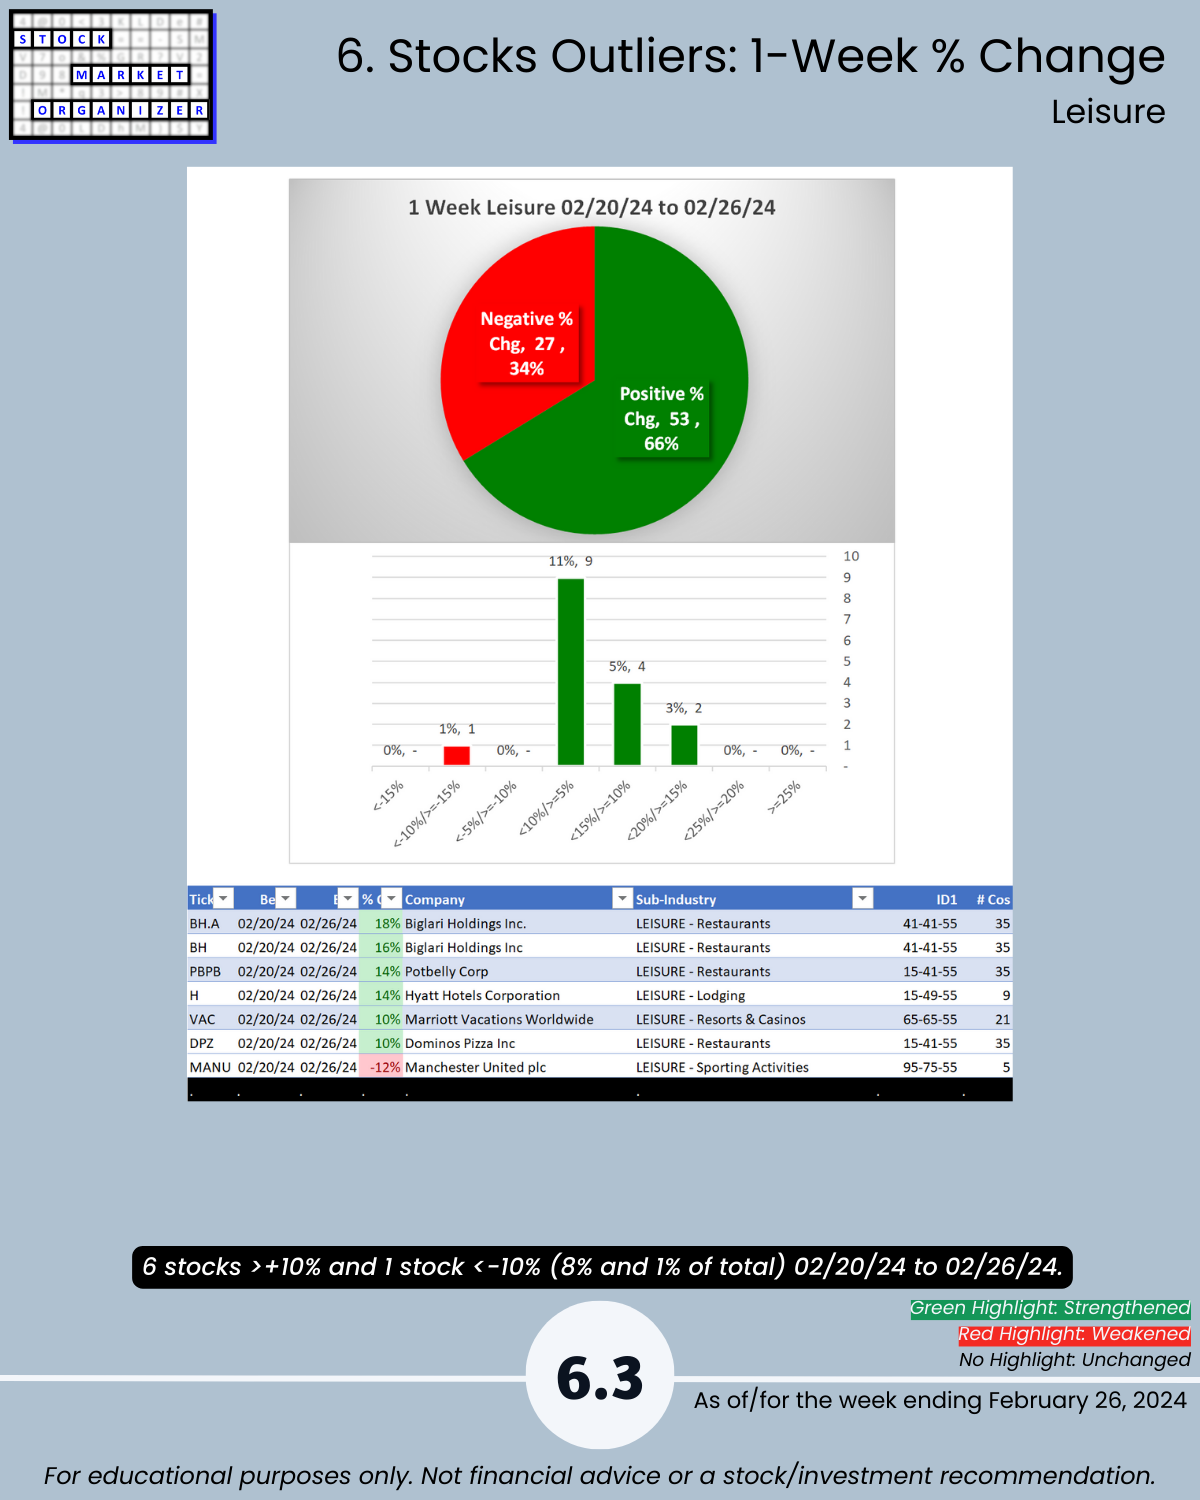
🔹 Strongest:Weakest Stocks: Diversified Services 43%:11% of total, Health Services 30%:16%, Leisure 39%:25%, Utilities 5%:66%
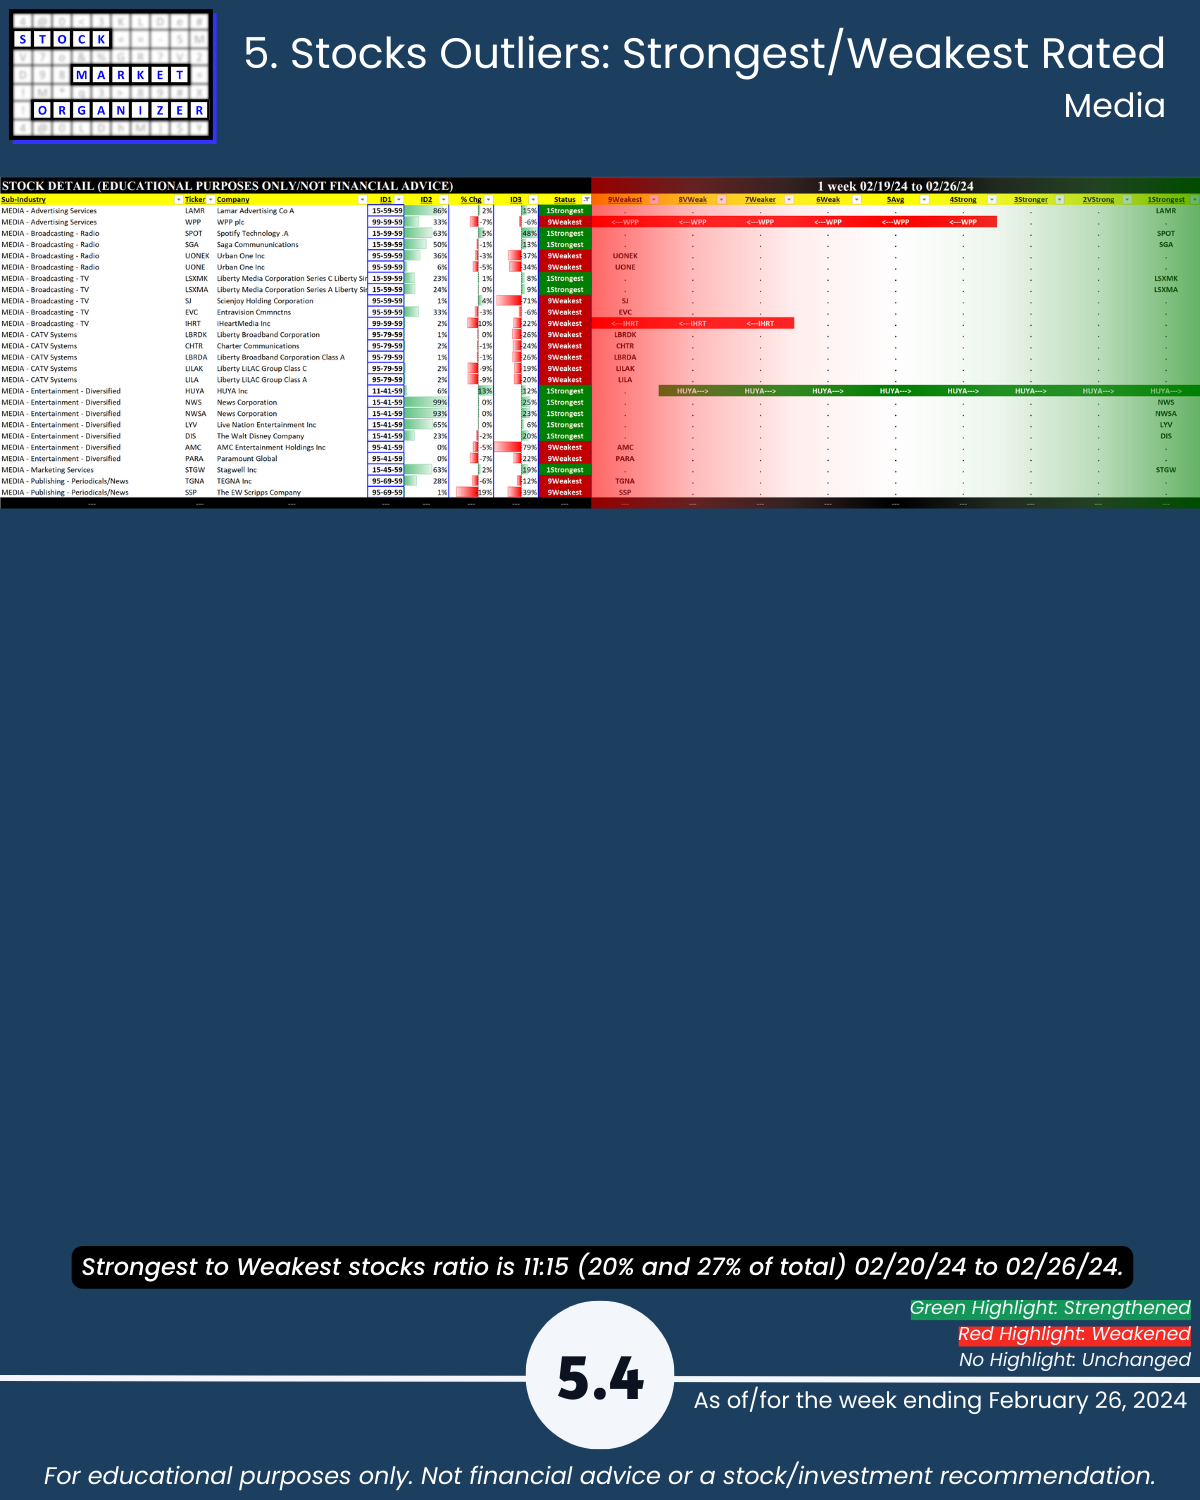
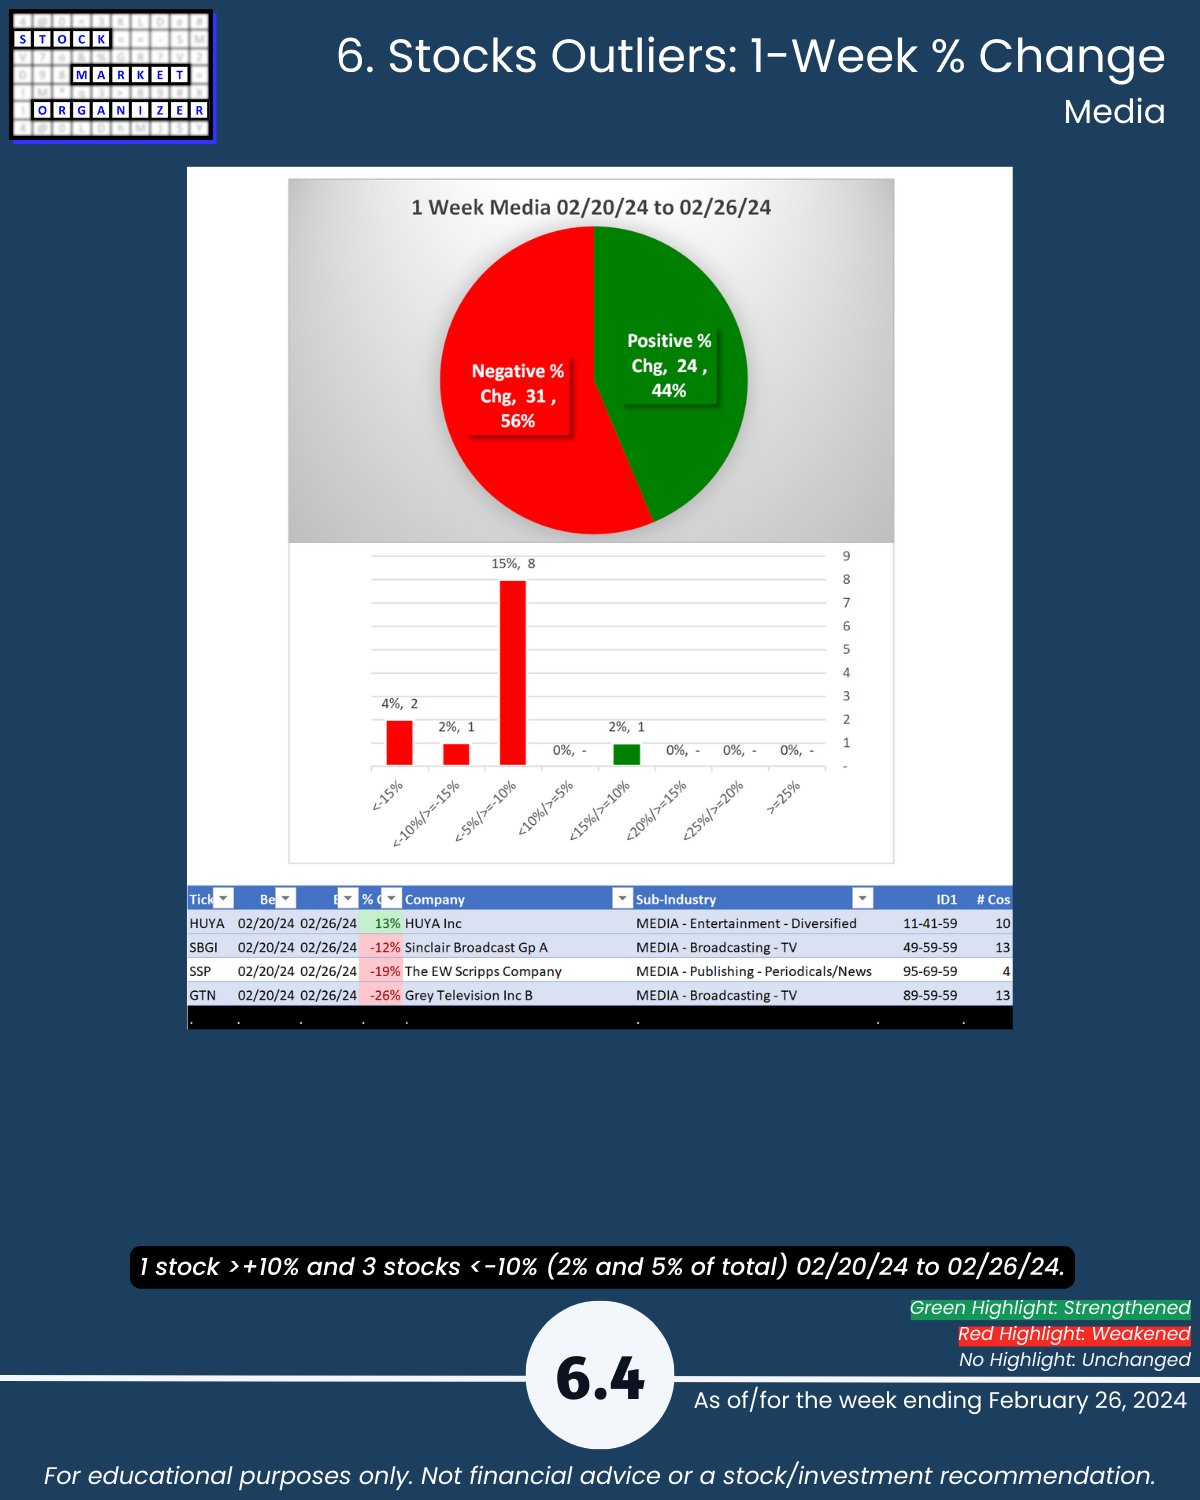
🔹 Outliers: AGTI +27%, TNDM +22%, LNTH +20%, CYH -33%, MODV -45%, GTN -26%, NOVA -38%
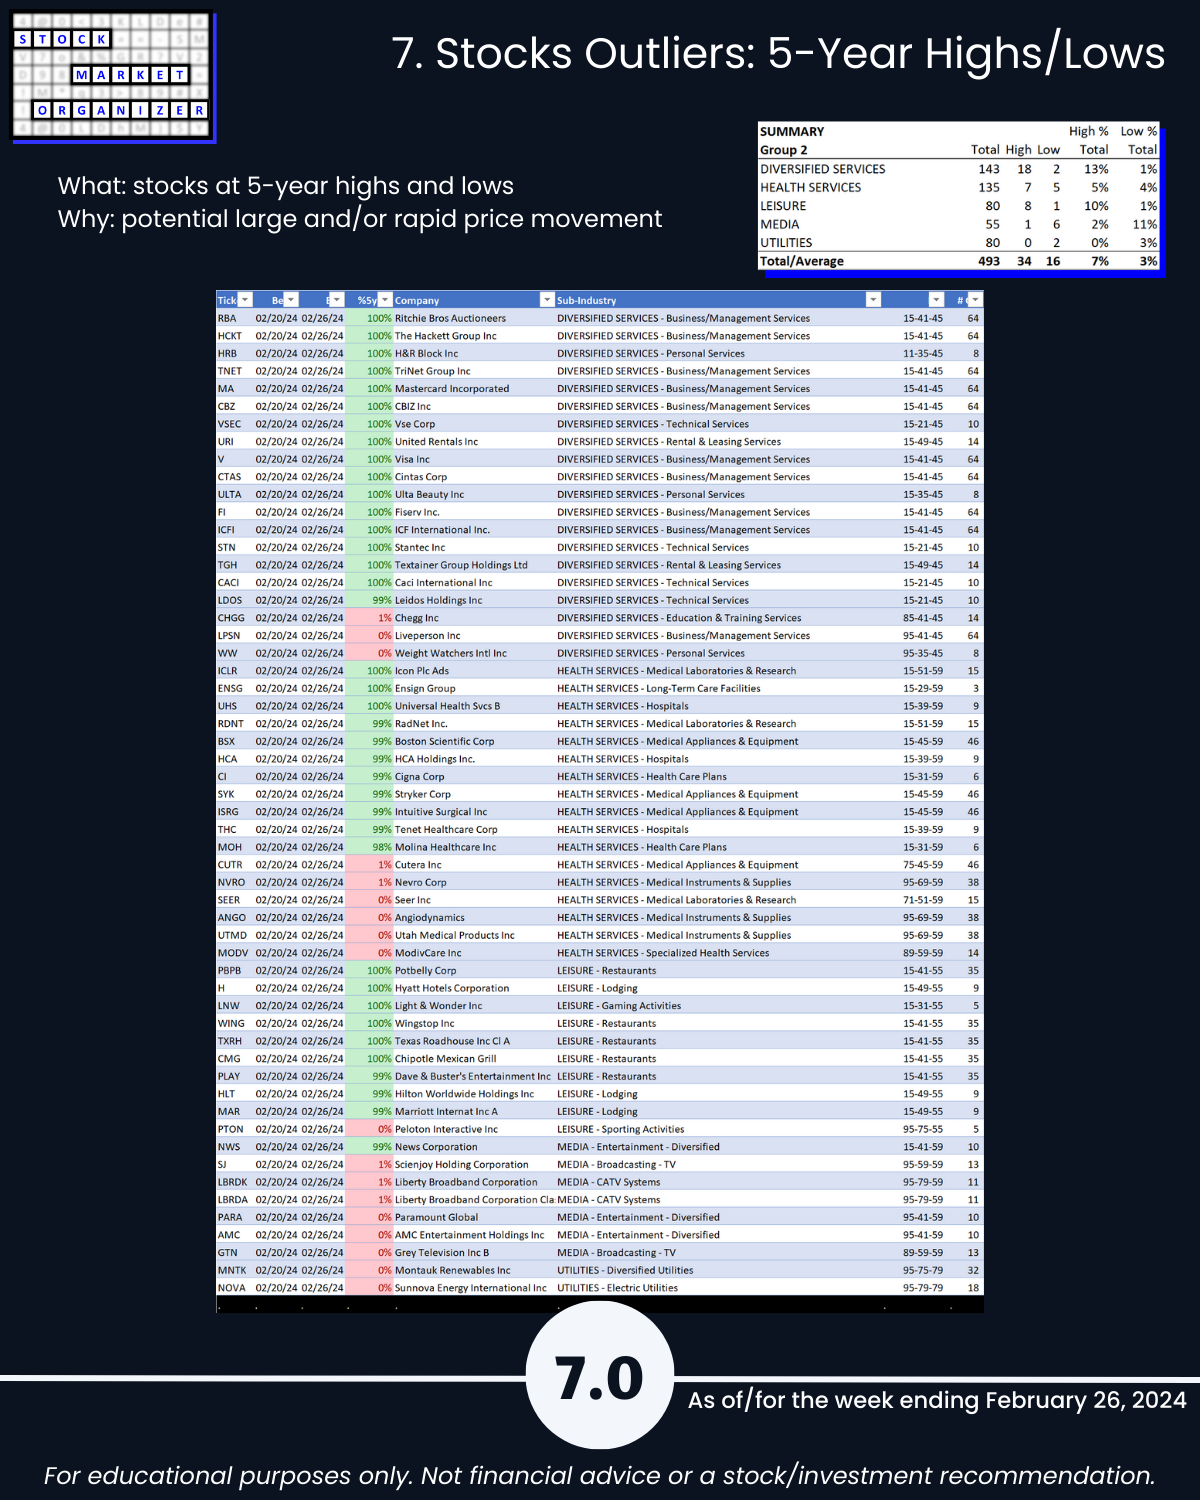
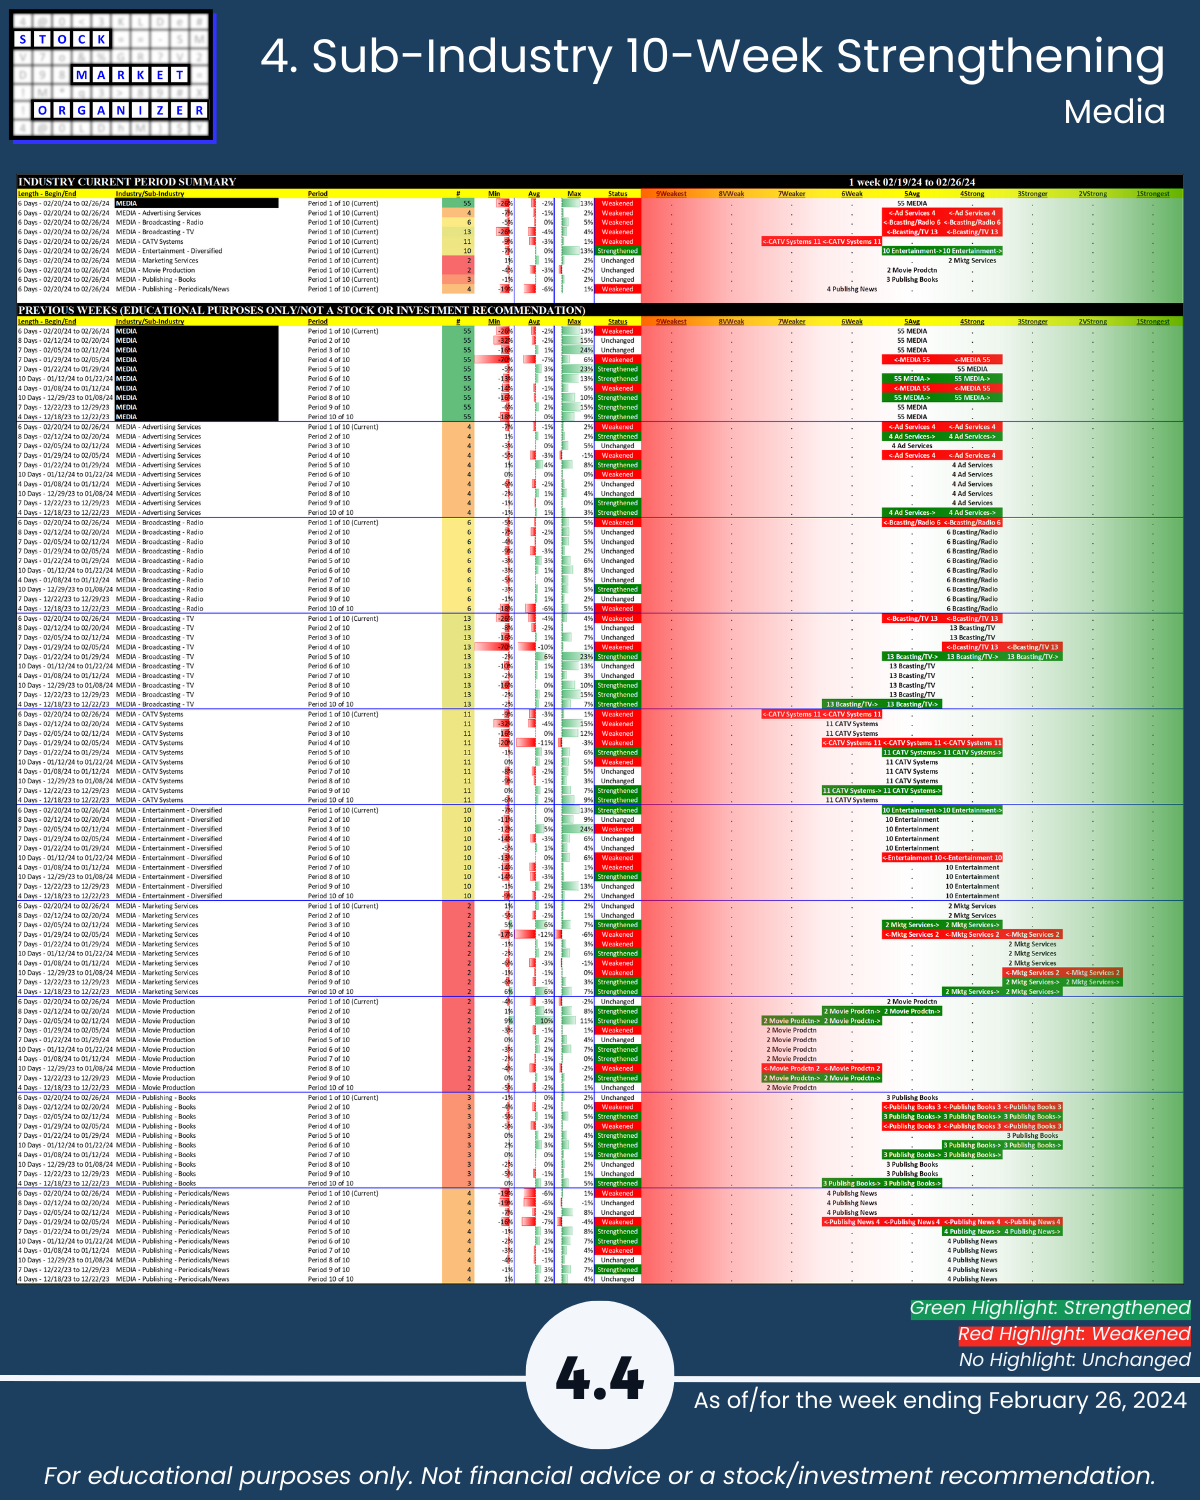
🔹 5-Year Highs/Lows %: Diversified Services 13%, Leisure 10% at highs, Media 11% at lows
This report may particularly be of interest if the following 5 concepts resonate with you:
- The stronger your stocks, the greener your P&L.
- The journey to 100%+ returns begins with 10% returns.
- The journey to a multi-month rally begins with one up week.
- Most stocks do what the market does. (While the market can only do what its underlying stocks, sub-industries, and industries do.)
- 80/20: not all information is created equal. (Press buttons, not balloons.)
Following are galleries with page-by-page views of this report.
1. Introduction
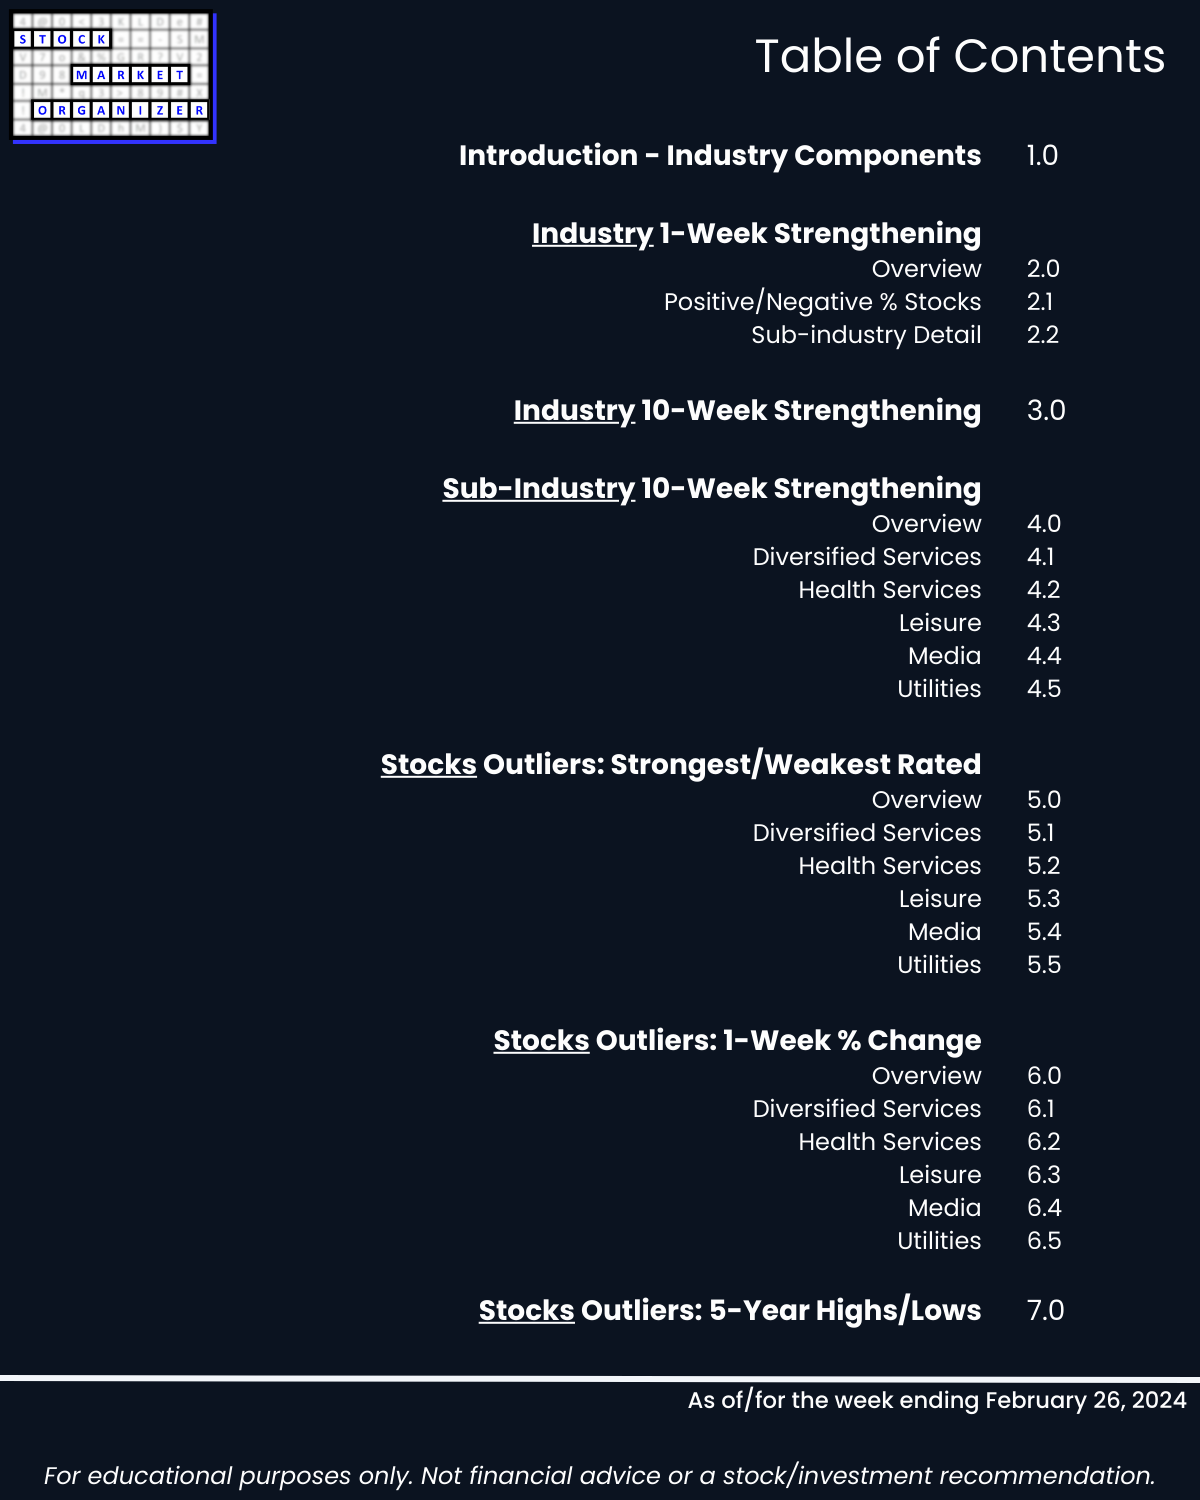
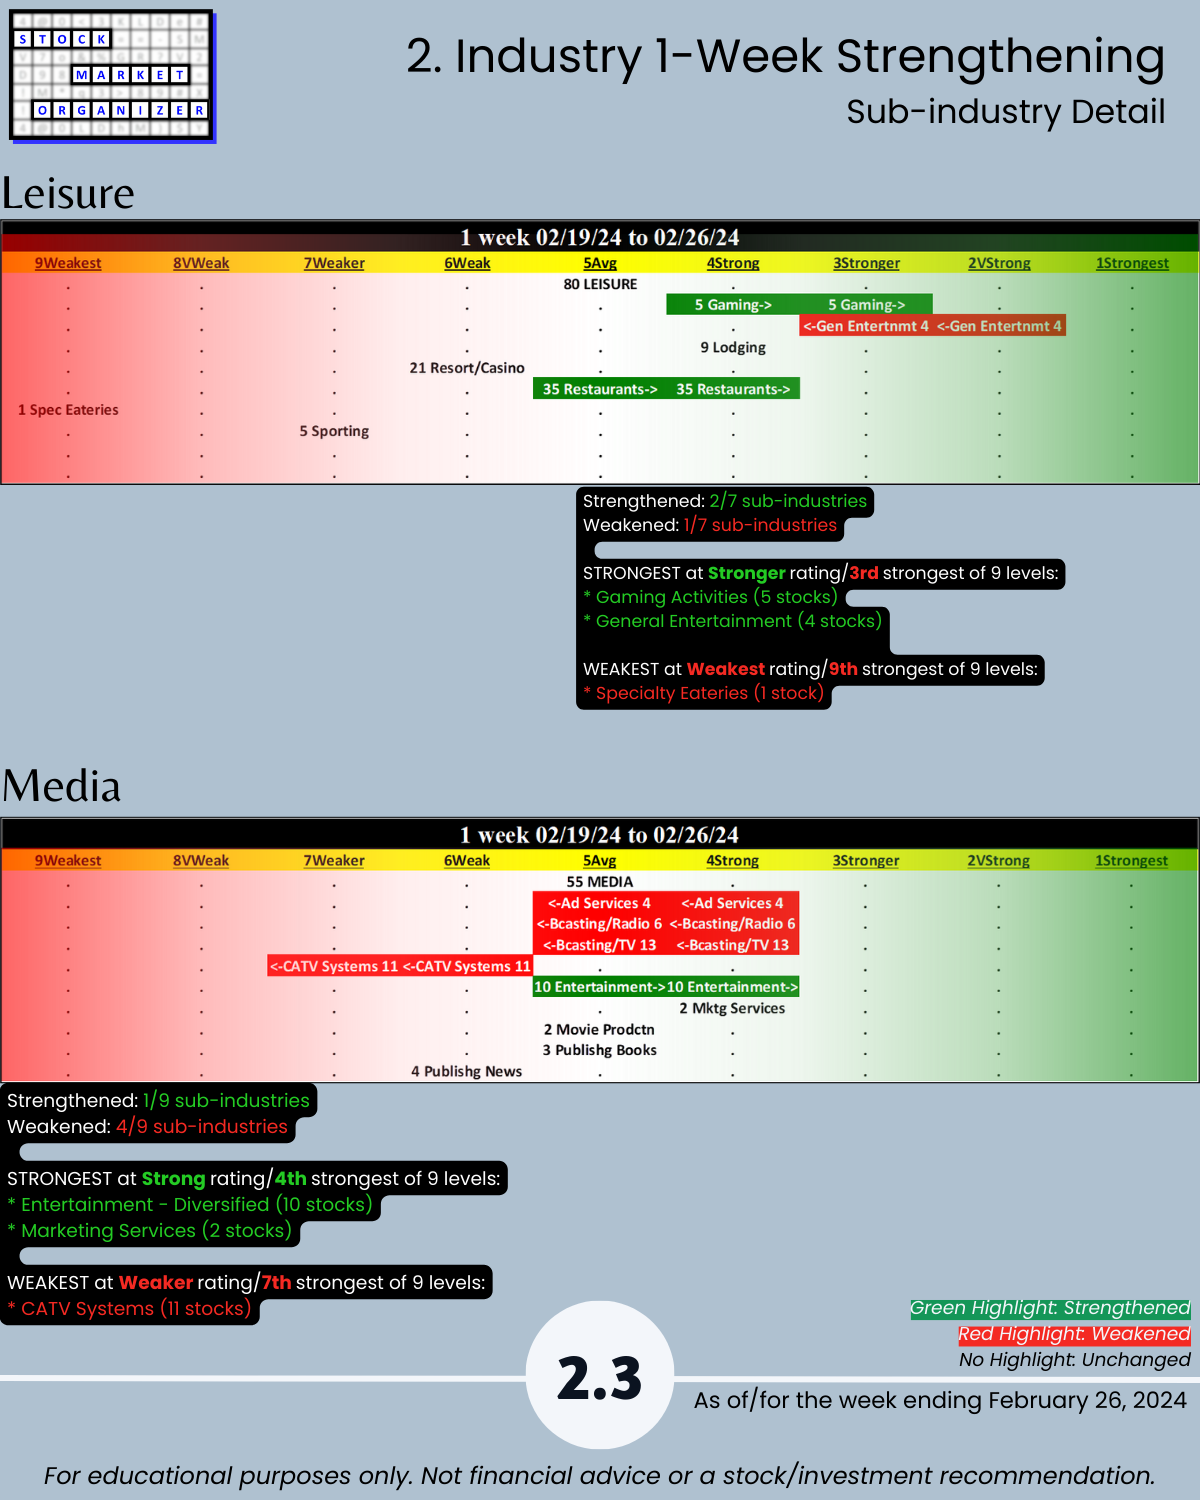
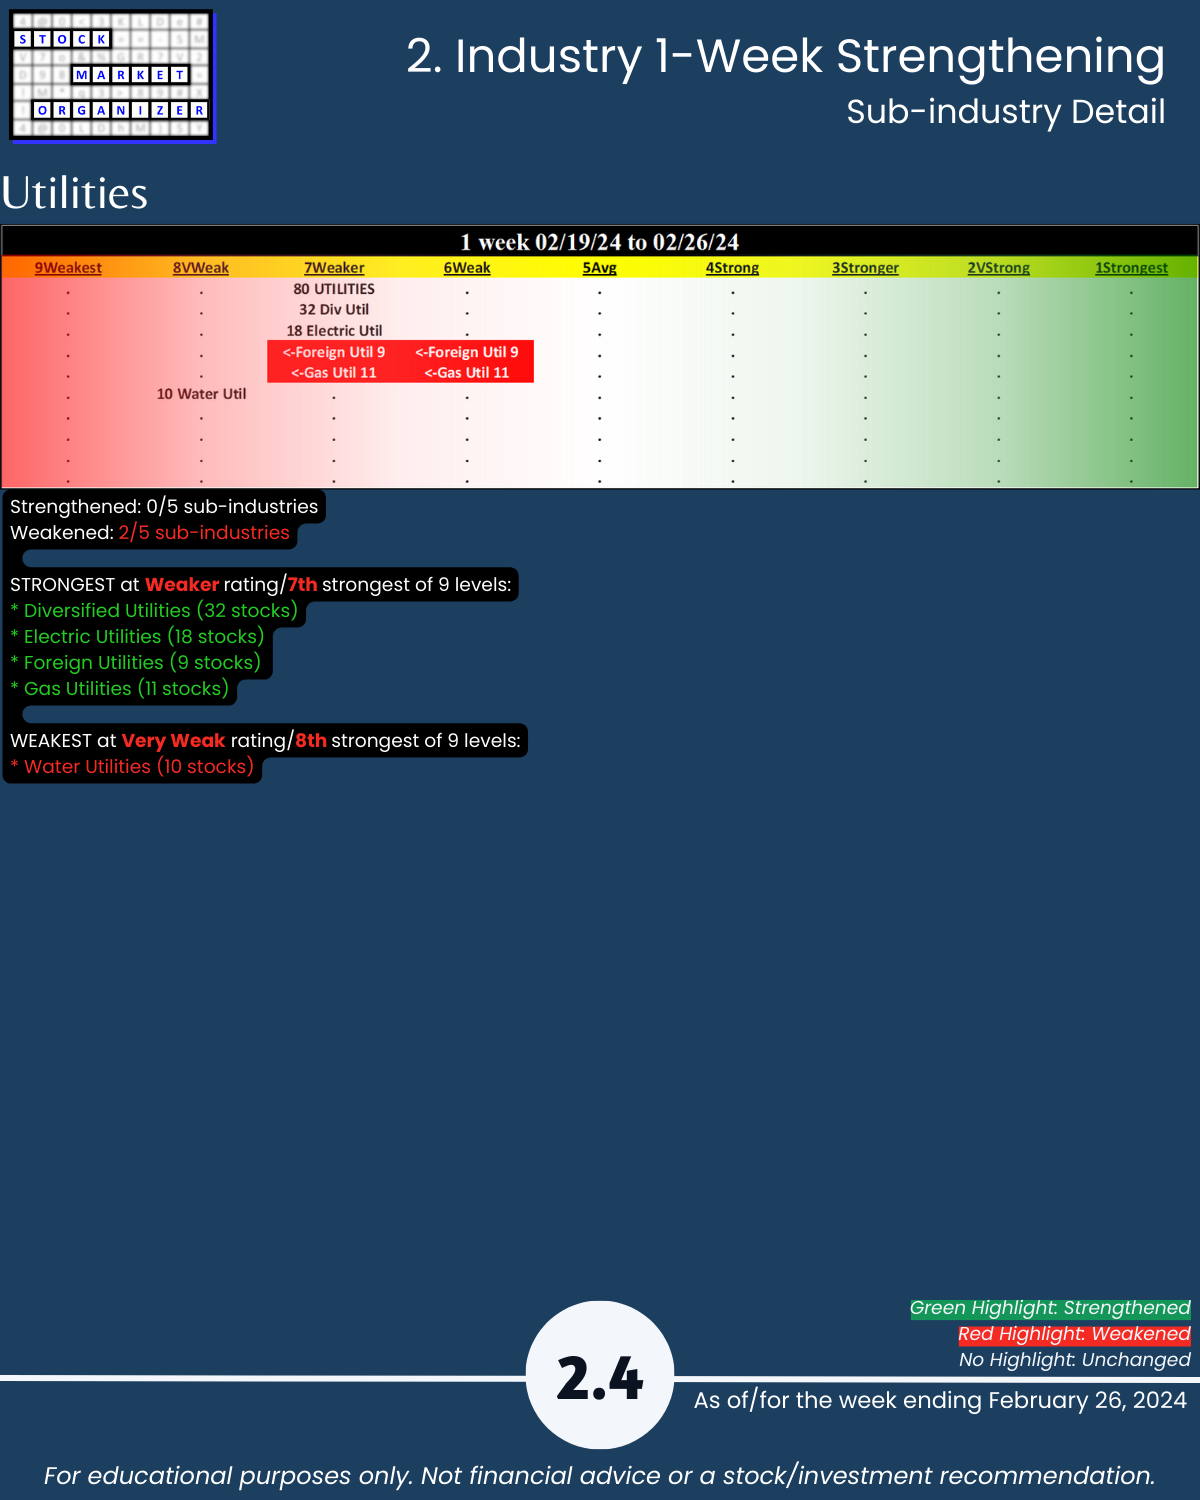
2. Industry 1-Week Strengthening
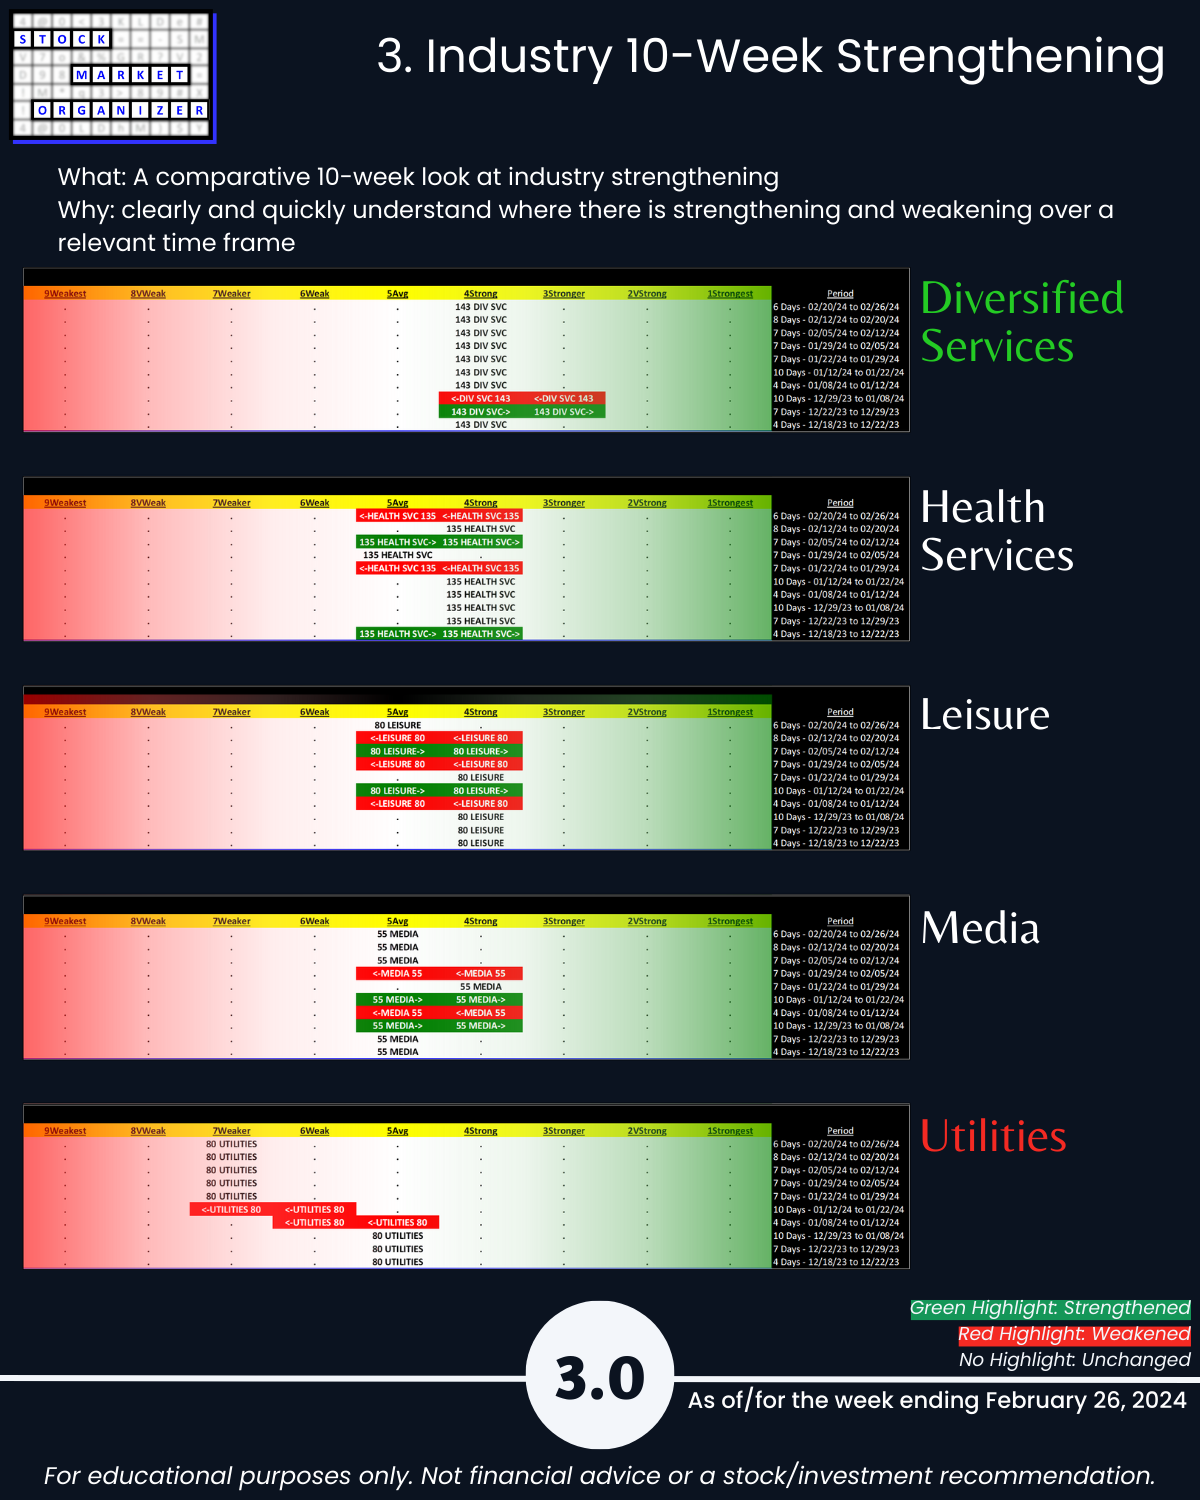
3. Industry 10-Week Strengthening
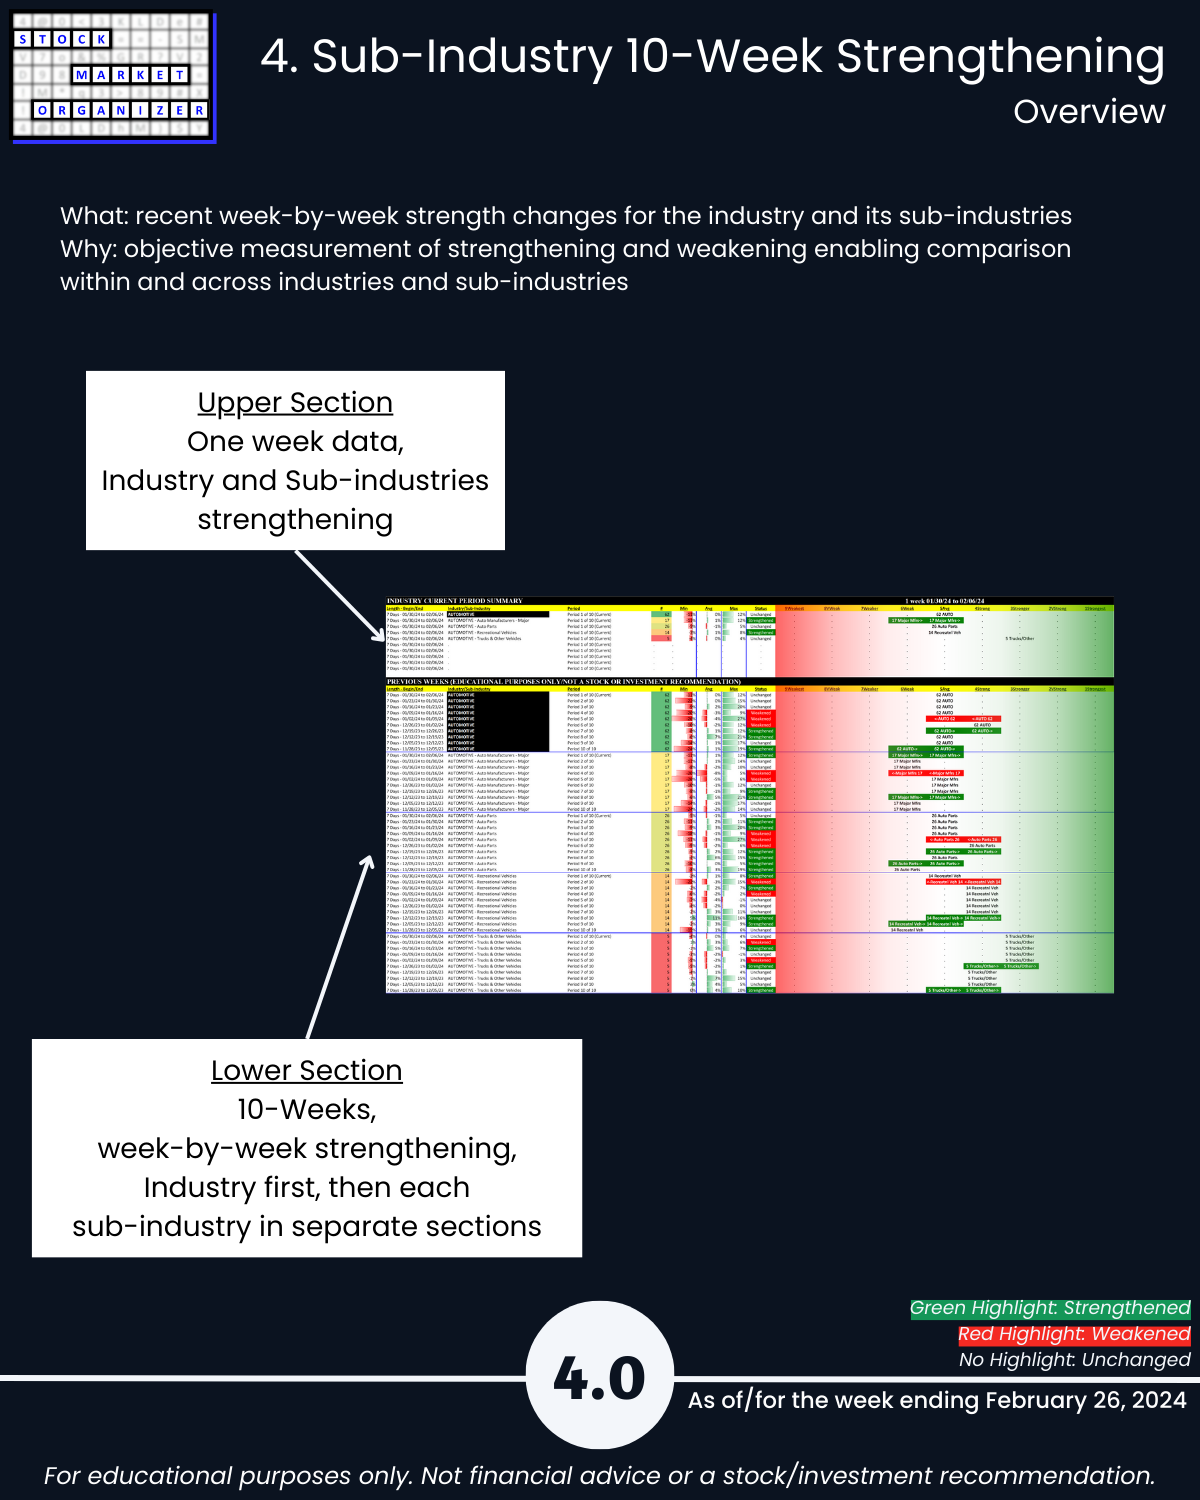
4. Sub-industry 10-Week Strengthening
5. Stocks Outliers: Strongest/Weakest Rated
6. Stocks Outliers: 1-Week % Change
7. Stocks Outliers: 5-Year Highs/Lows