SMO Exclusive: Strength Report Industry Group 1 2024-12-03 Strengthened +0.3 to 4.1 Strength Score
Summary
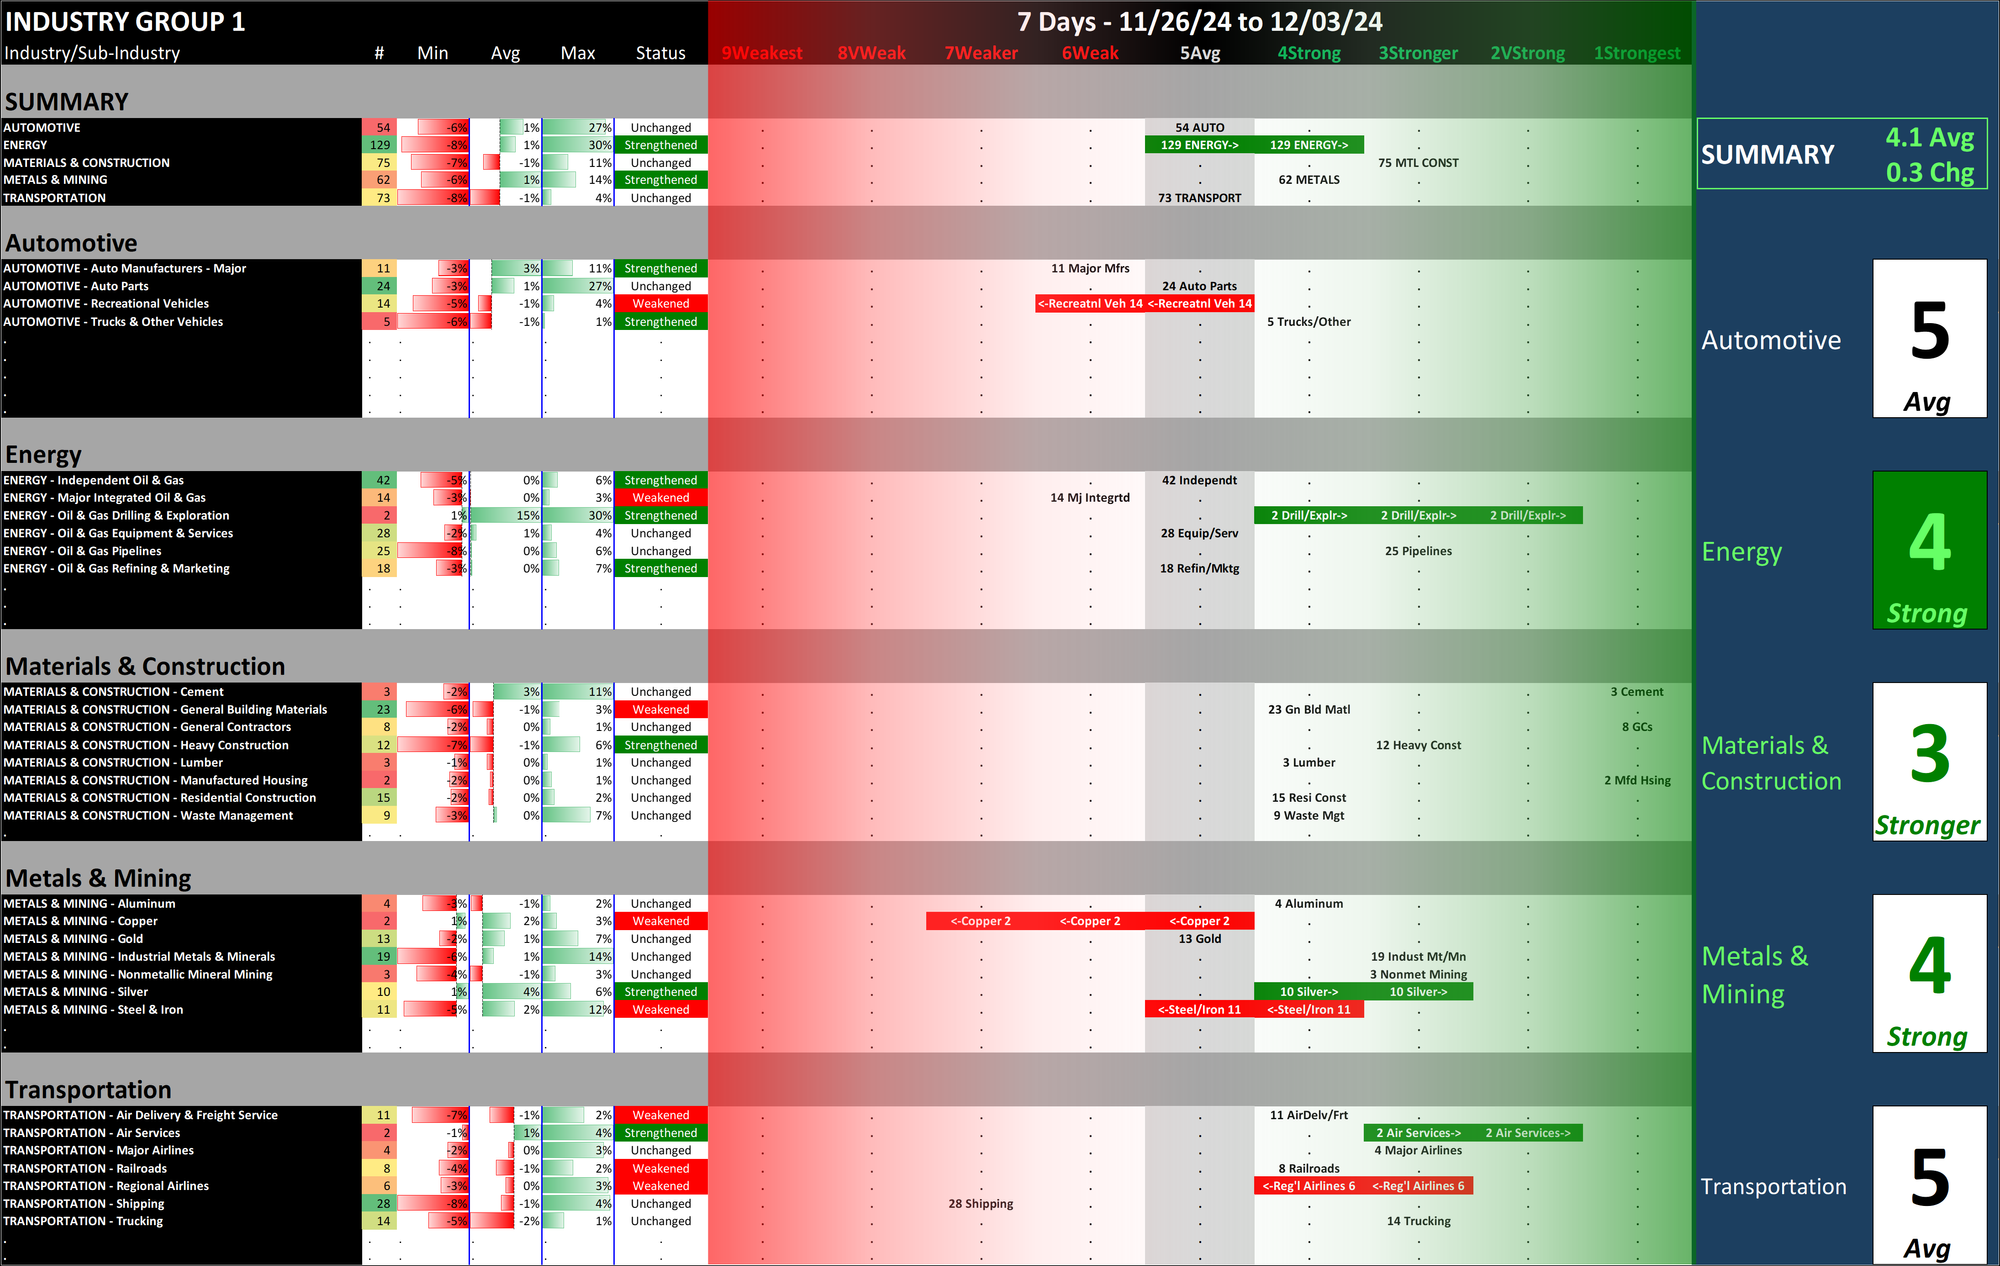
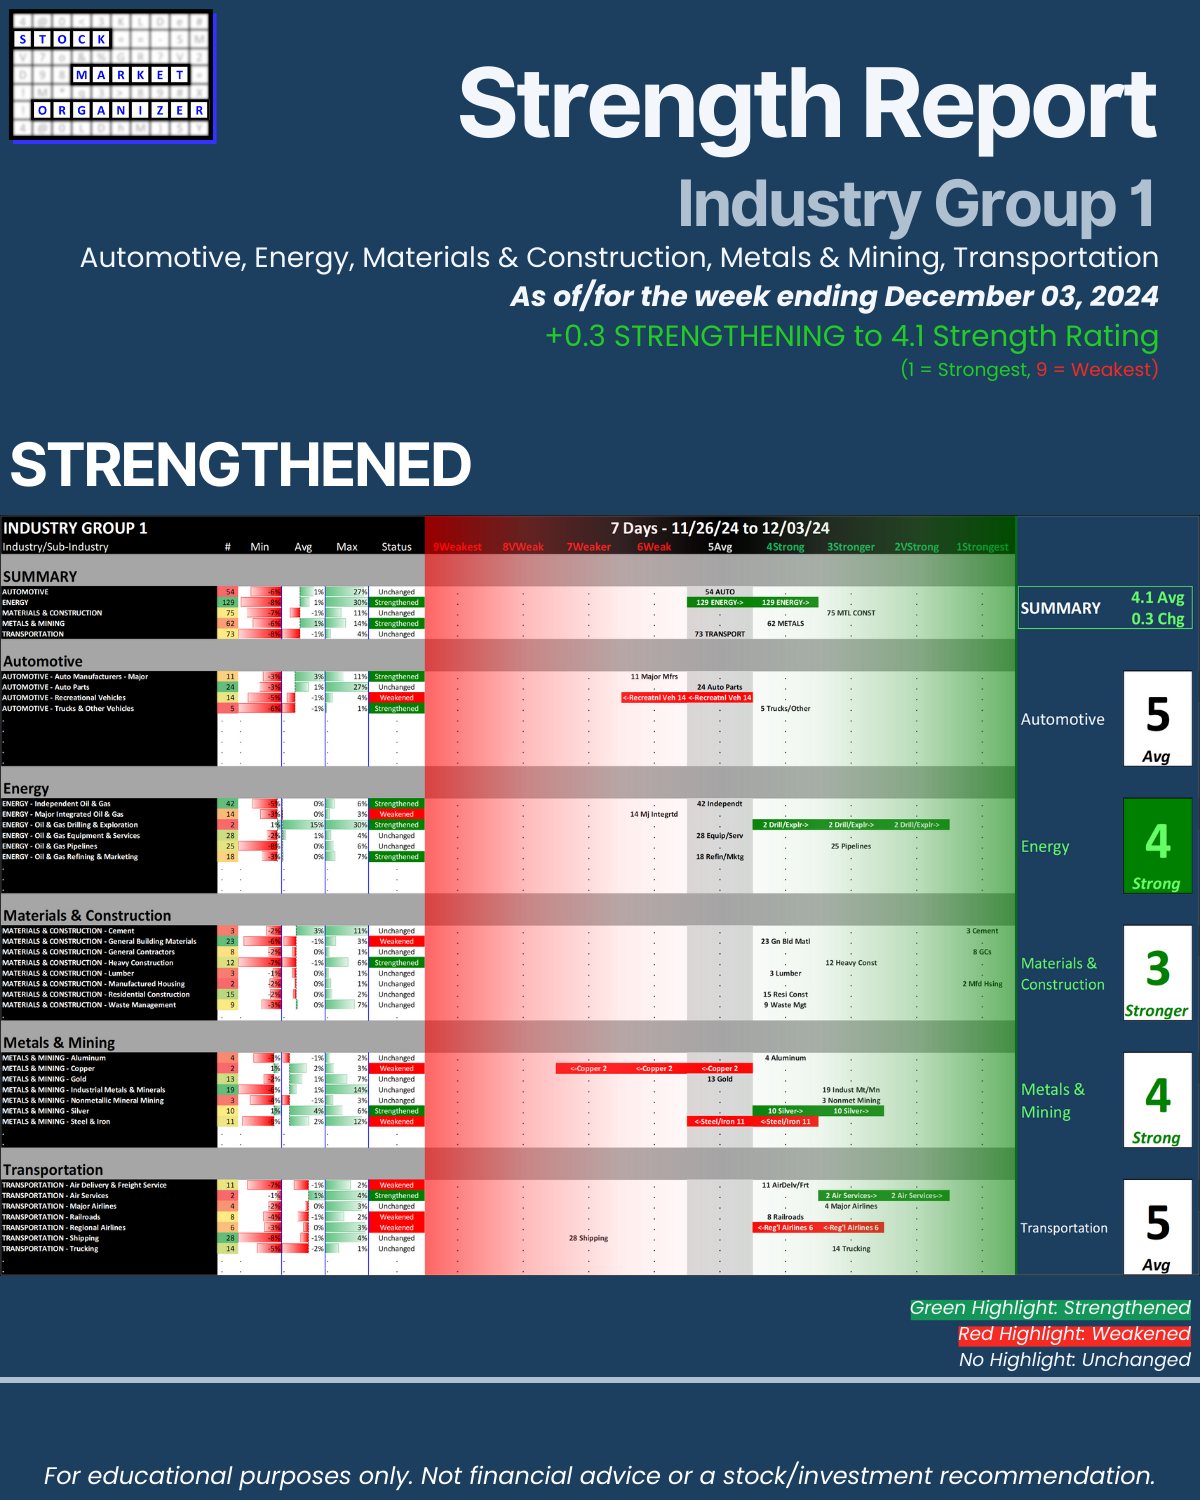
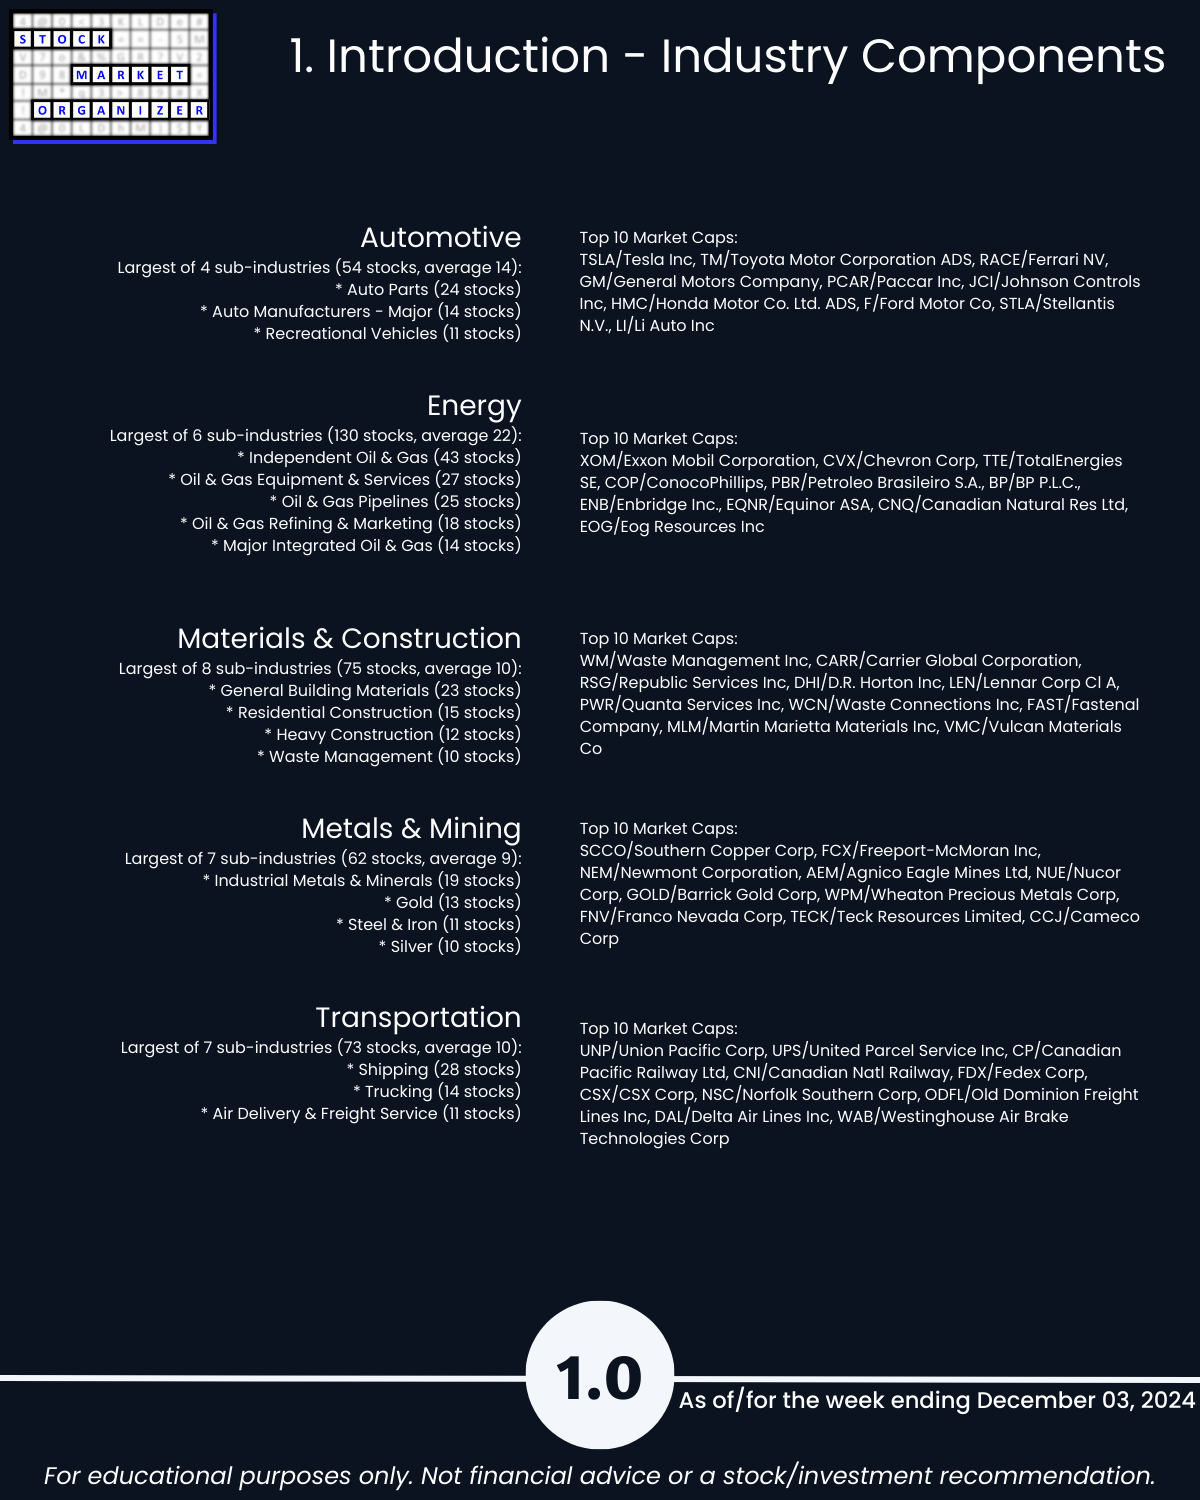
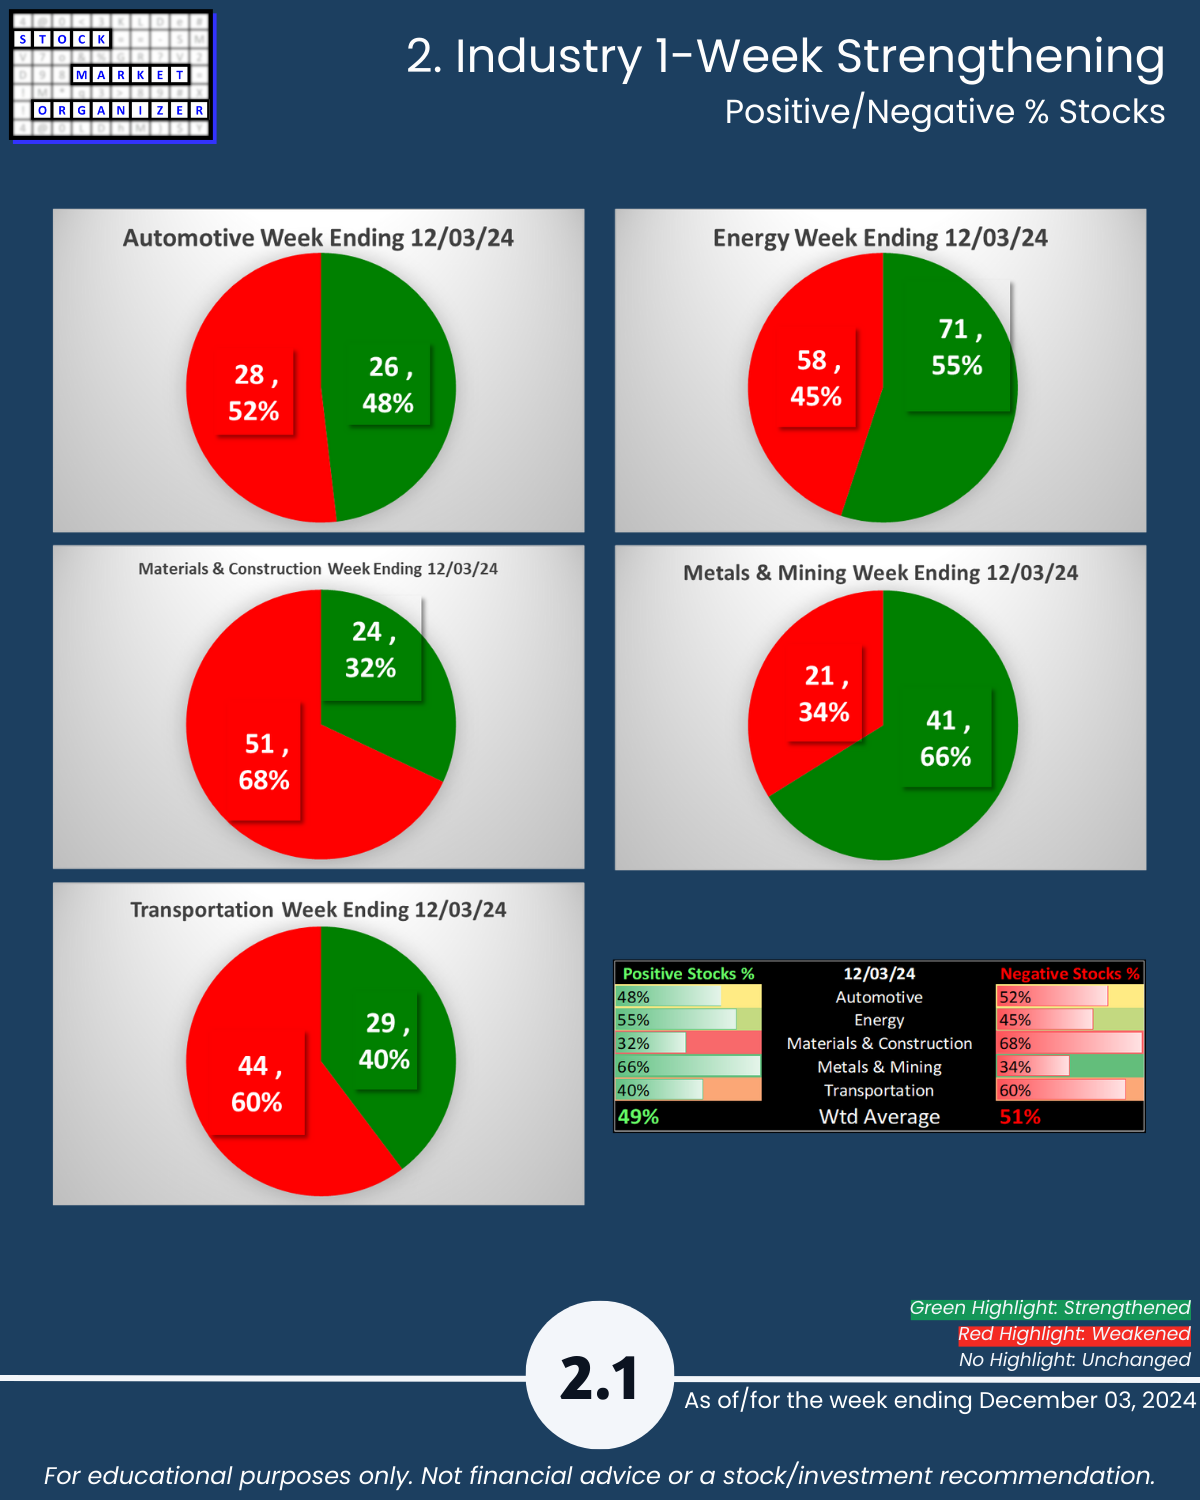
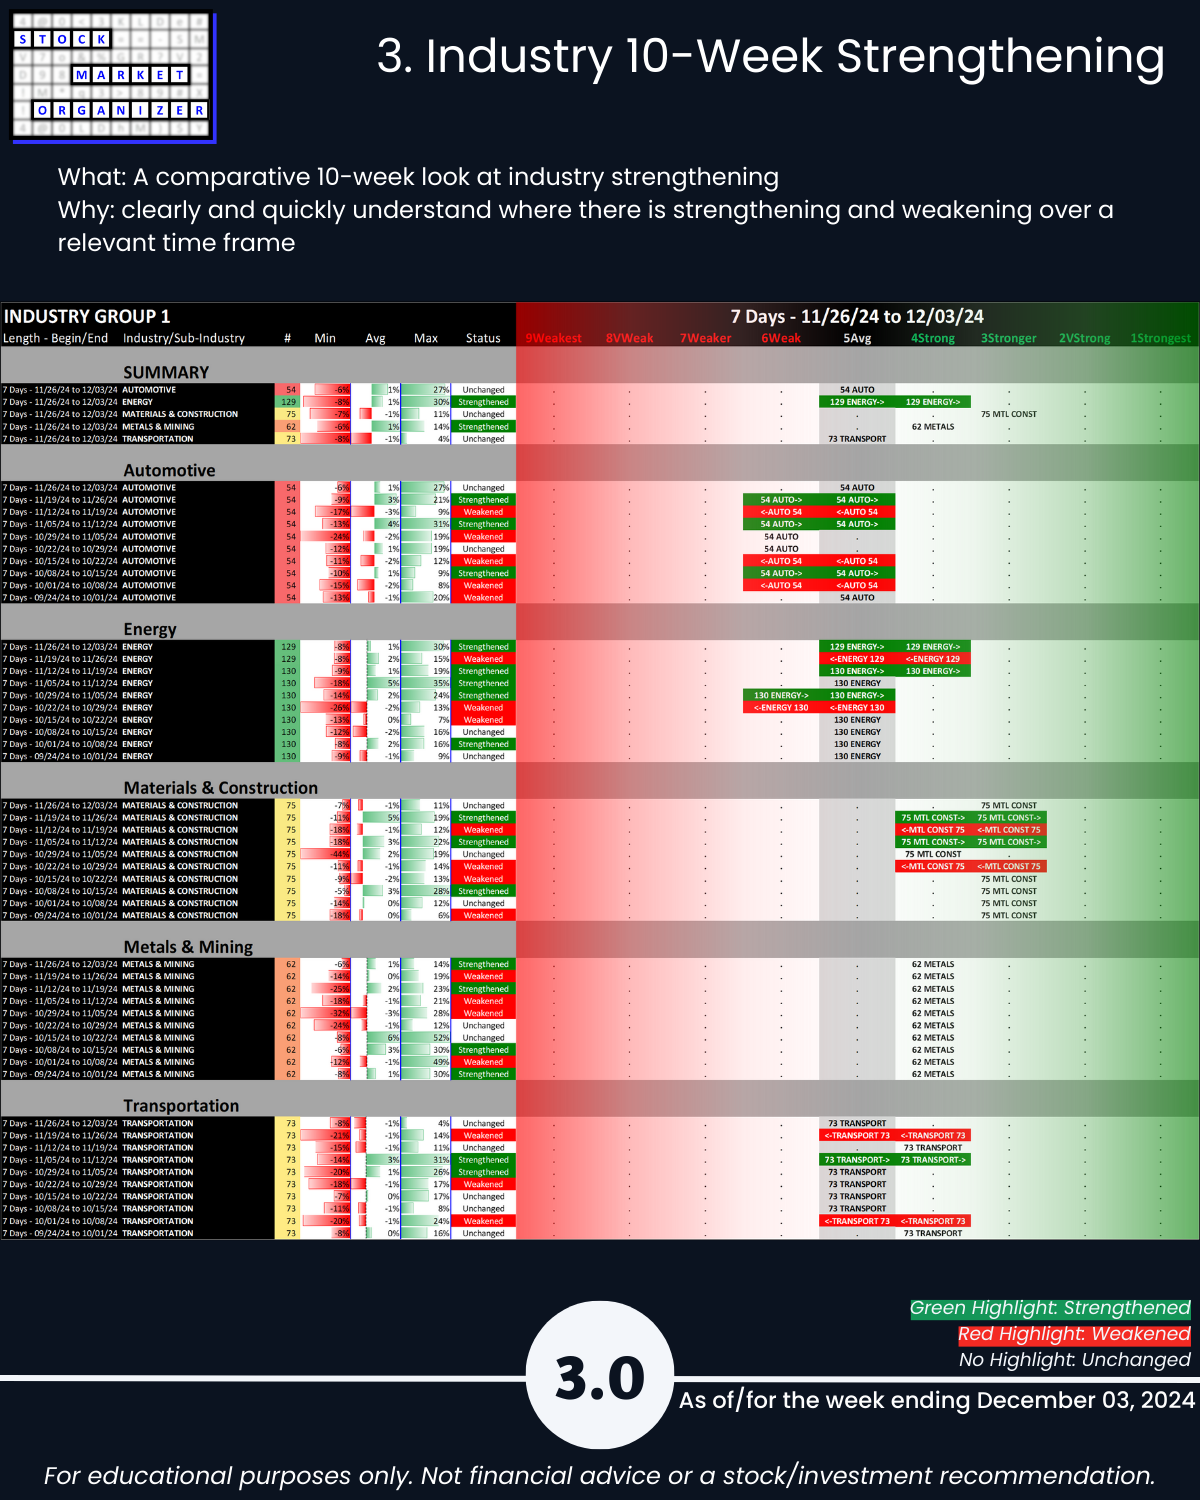
Industry Group 1 strengthened to a 4.1 composite score this week. This group consists of Automotive (TSLA, GM, Ford), Energy, Materials & Construction (Residential Construction/Homebuilders), and Transportation.
Difference This vs. ETFs Analysis
Note this analysis is the same as that used for the SPDR ETFs but the two main differences are:
1. Universe of stocks. The ETFs are the largest capitalization stocks, 500 of them in the 11 sector ETFs. In this analysis, there are approximately 2,700 stocks.
2. Sub-categorization below the market level. The ETF analysis with 500 stocks is limited to sector strengthening and weakening. This analysis with +/-2,700 stocks can be and is segregated into 29 industry groups and in turn 189 sub-industry groups.
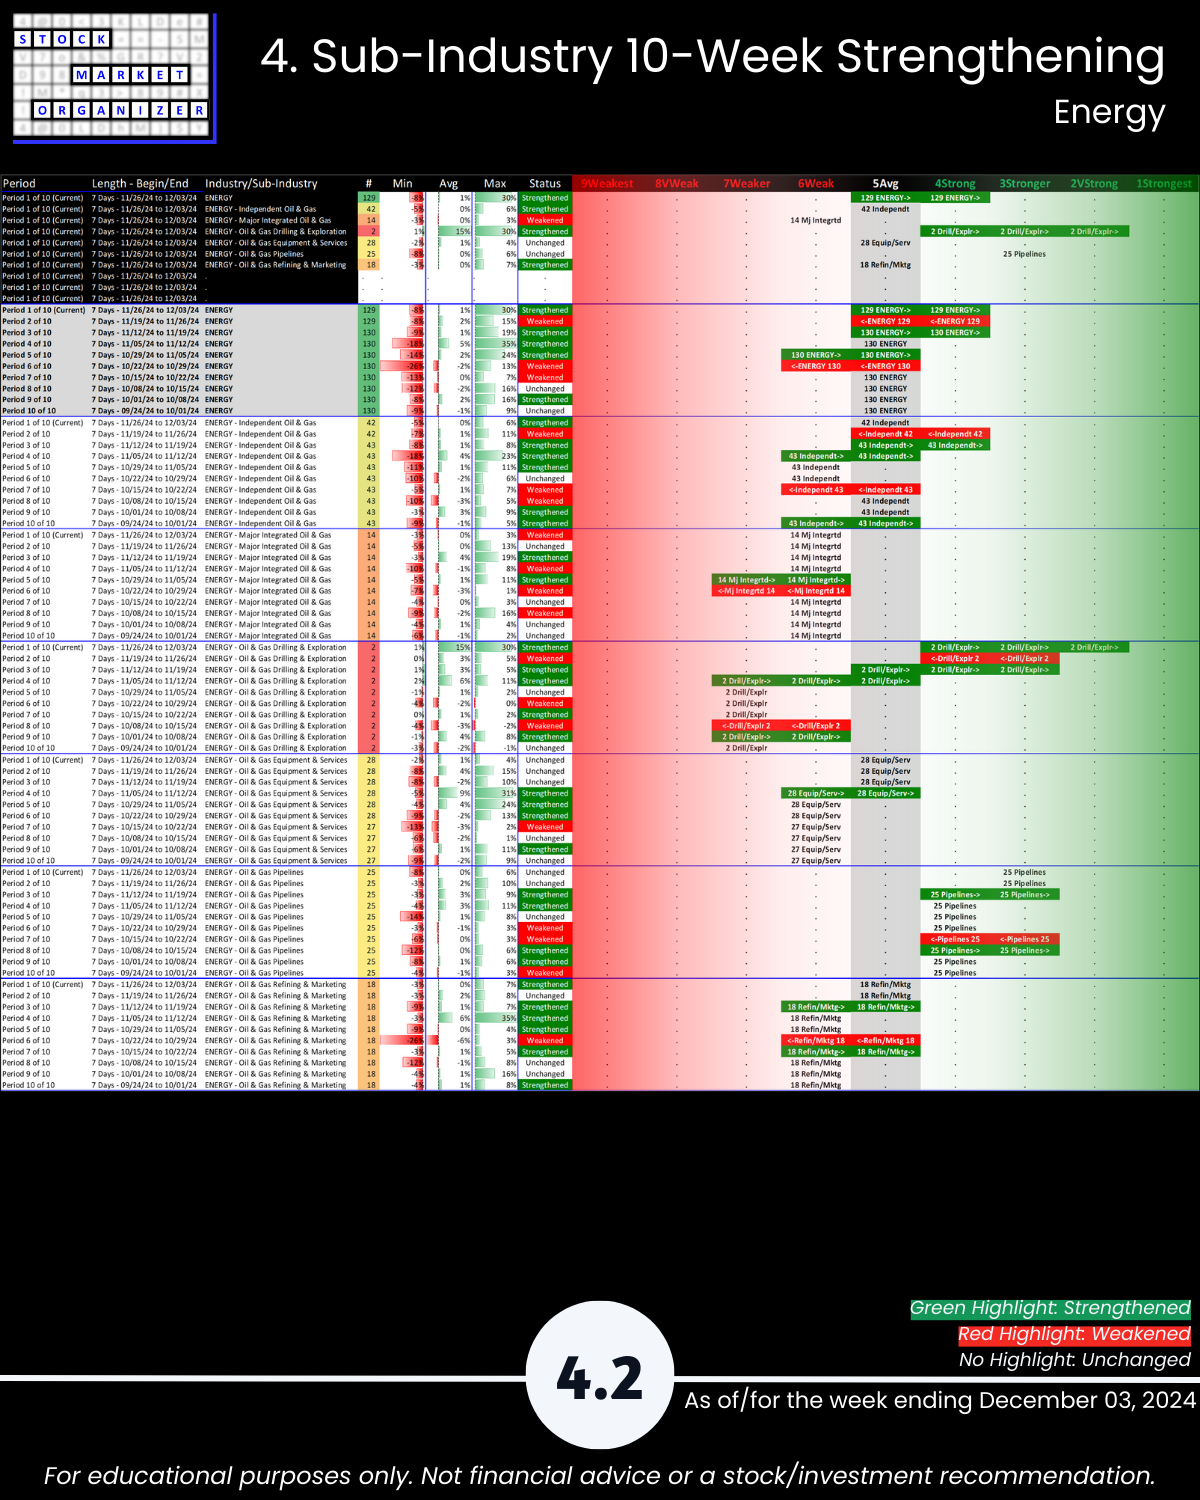
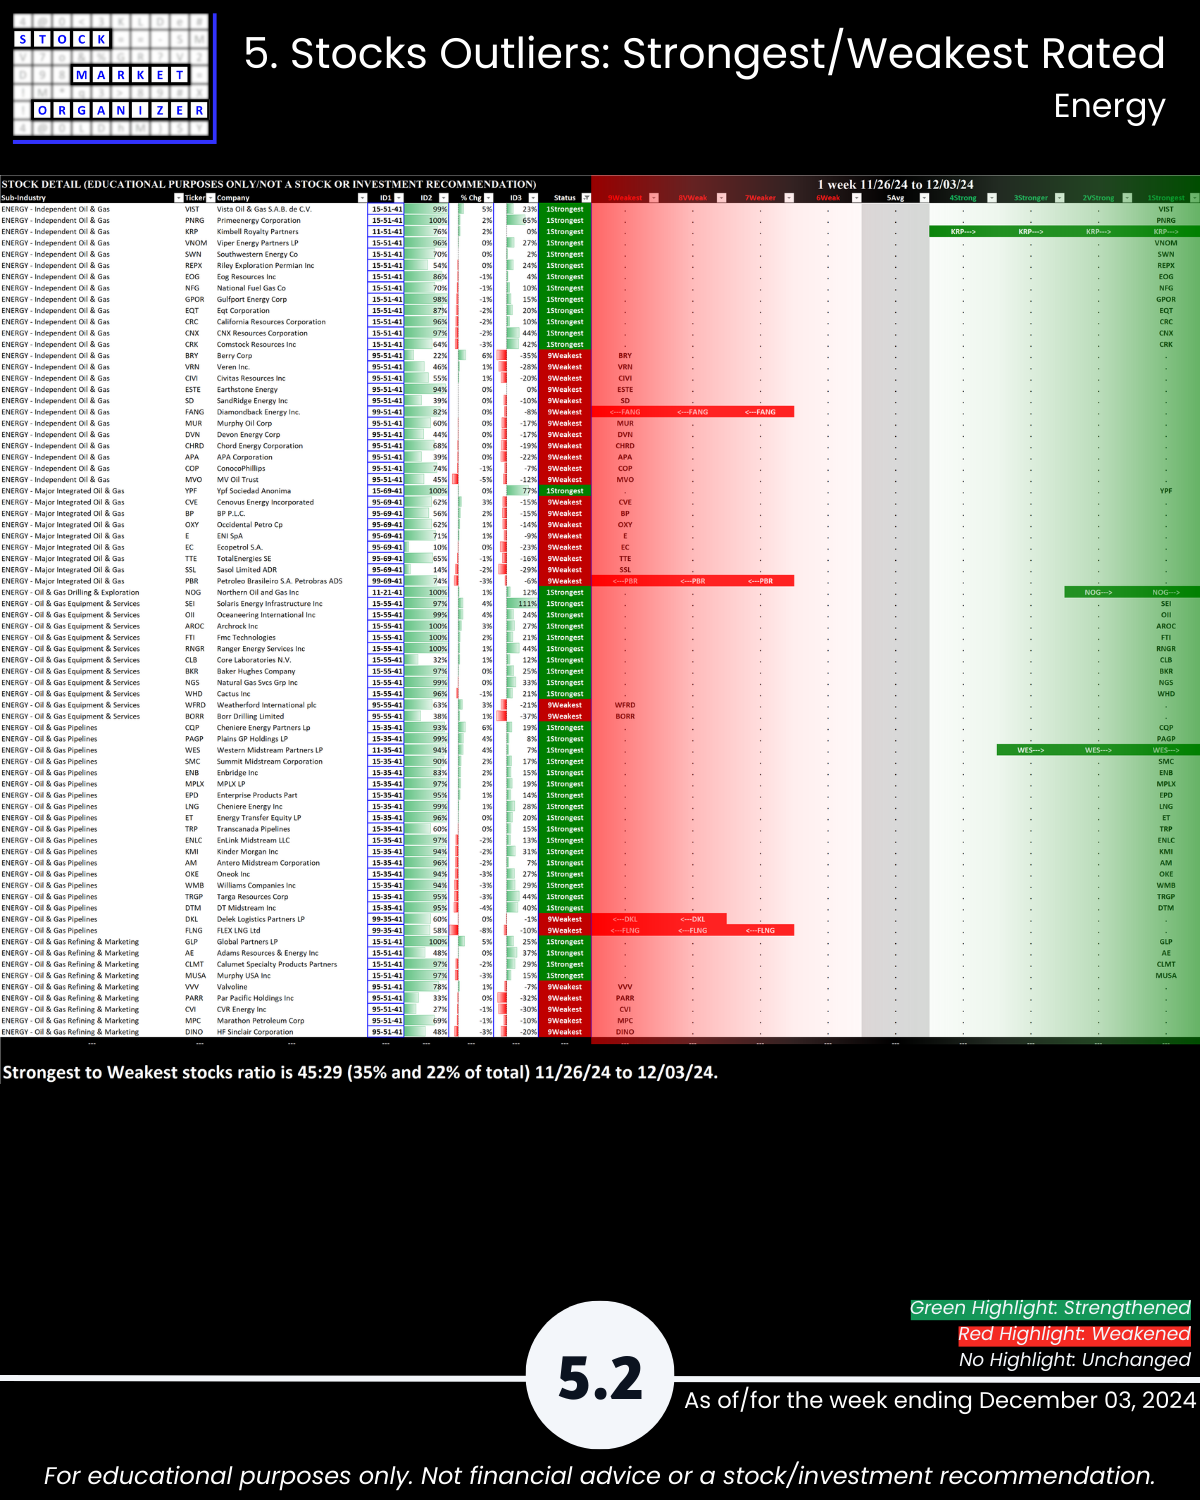
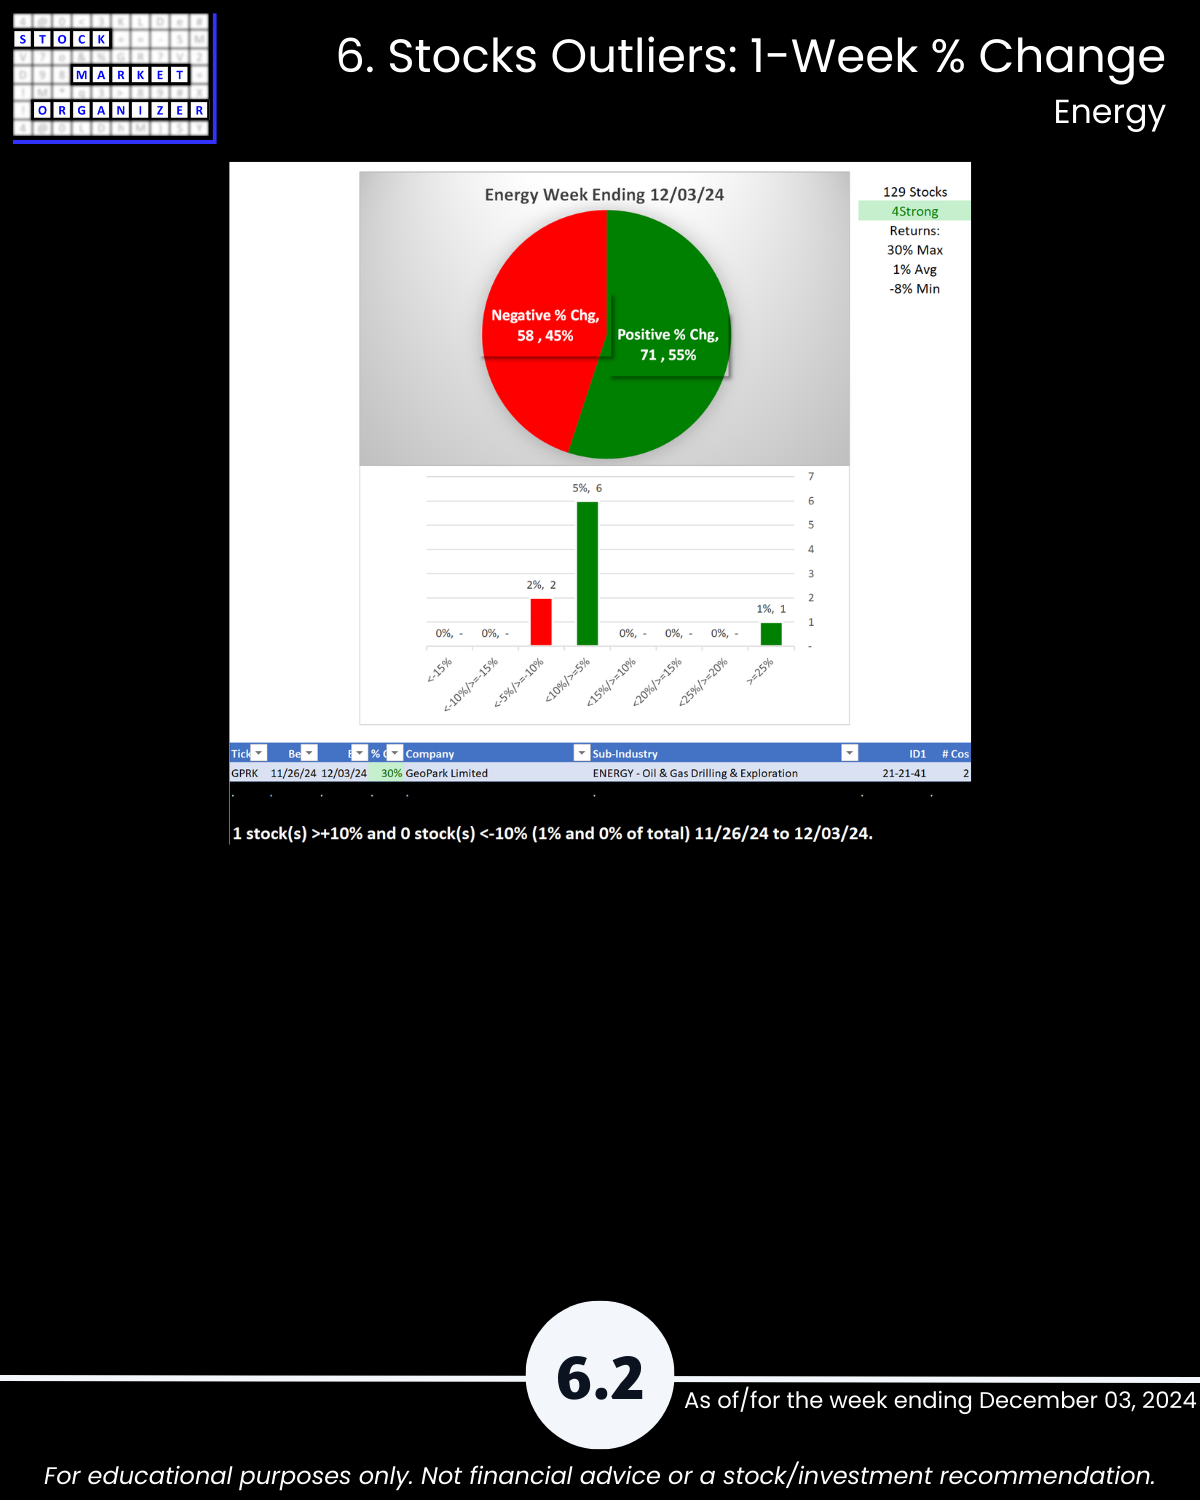
There is an Energy ETF (symbol XLE). Per Tuesday's ETF strength analysis, this ETF WEAKENED one rating to 5Average. Note here that Energy STRENGTHENED to 4Strong. The reason for this discrepancy is that the ETF consists of 22 large cap stocks while this larger analysis has 129 energy stocks. Therefore the smaller stocks are outperforming the larger cap stocks.
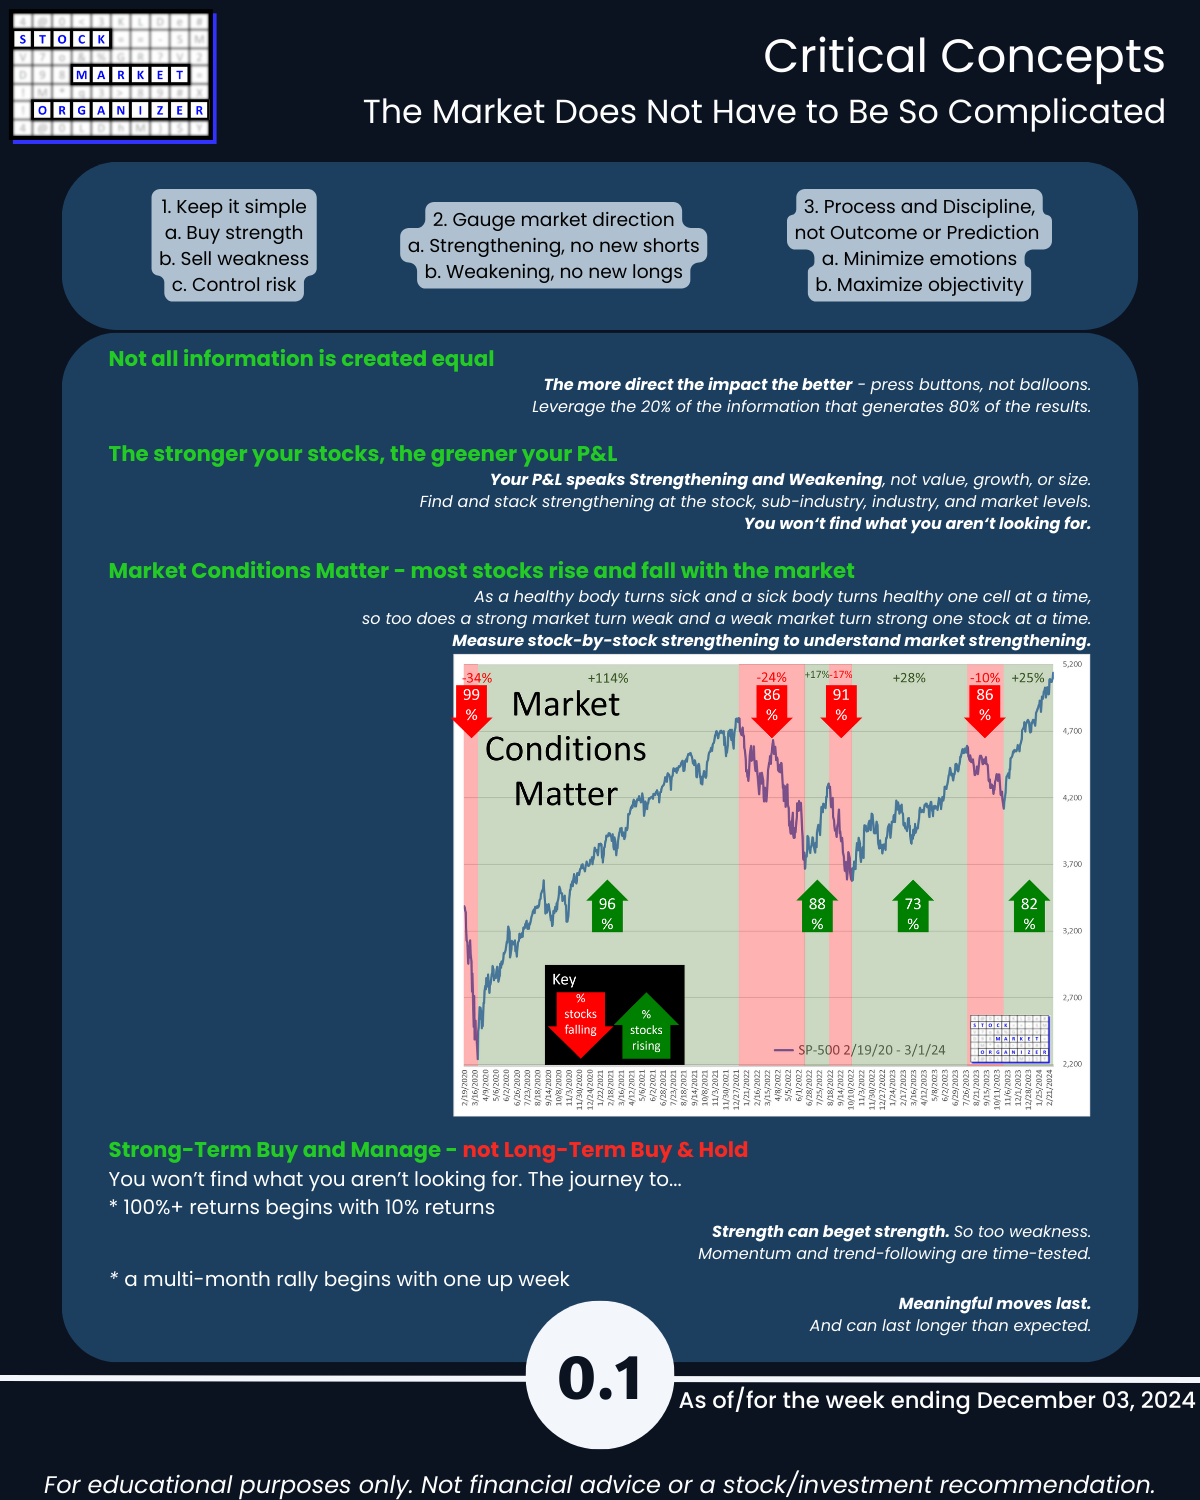
How would I interpret and use this information?
Recognizing that anything can happen at any time and I will never know the reason why until after the fact if ever, I am looking to give myself the best chances of an individual stock going my desired direction by stacking strength going long or stacking weakness going short, depending on strength/strengthening and weakness/weakening at the stock, sub-industry, industry, sector, and market levels.
Following are summary statements regarding the current environment:
- The Market Strength Score is now positive = tailwind
- Industry Group 1 strengthened with one strength rating change = tailwind
- Note this industry grouping is not as homogenous as are Financial or Technology so this signal is not as important as would be for these other sectors. While there might be some relations between Automotive, Energy, and Transportation, there is none between Metals & Mining and the others. This needs to be considered when reviewing this analysis.
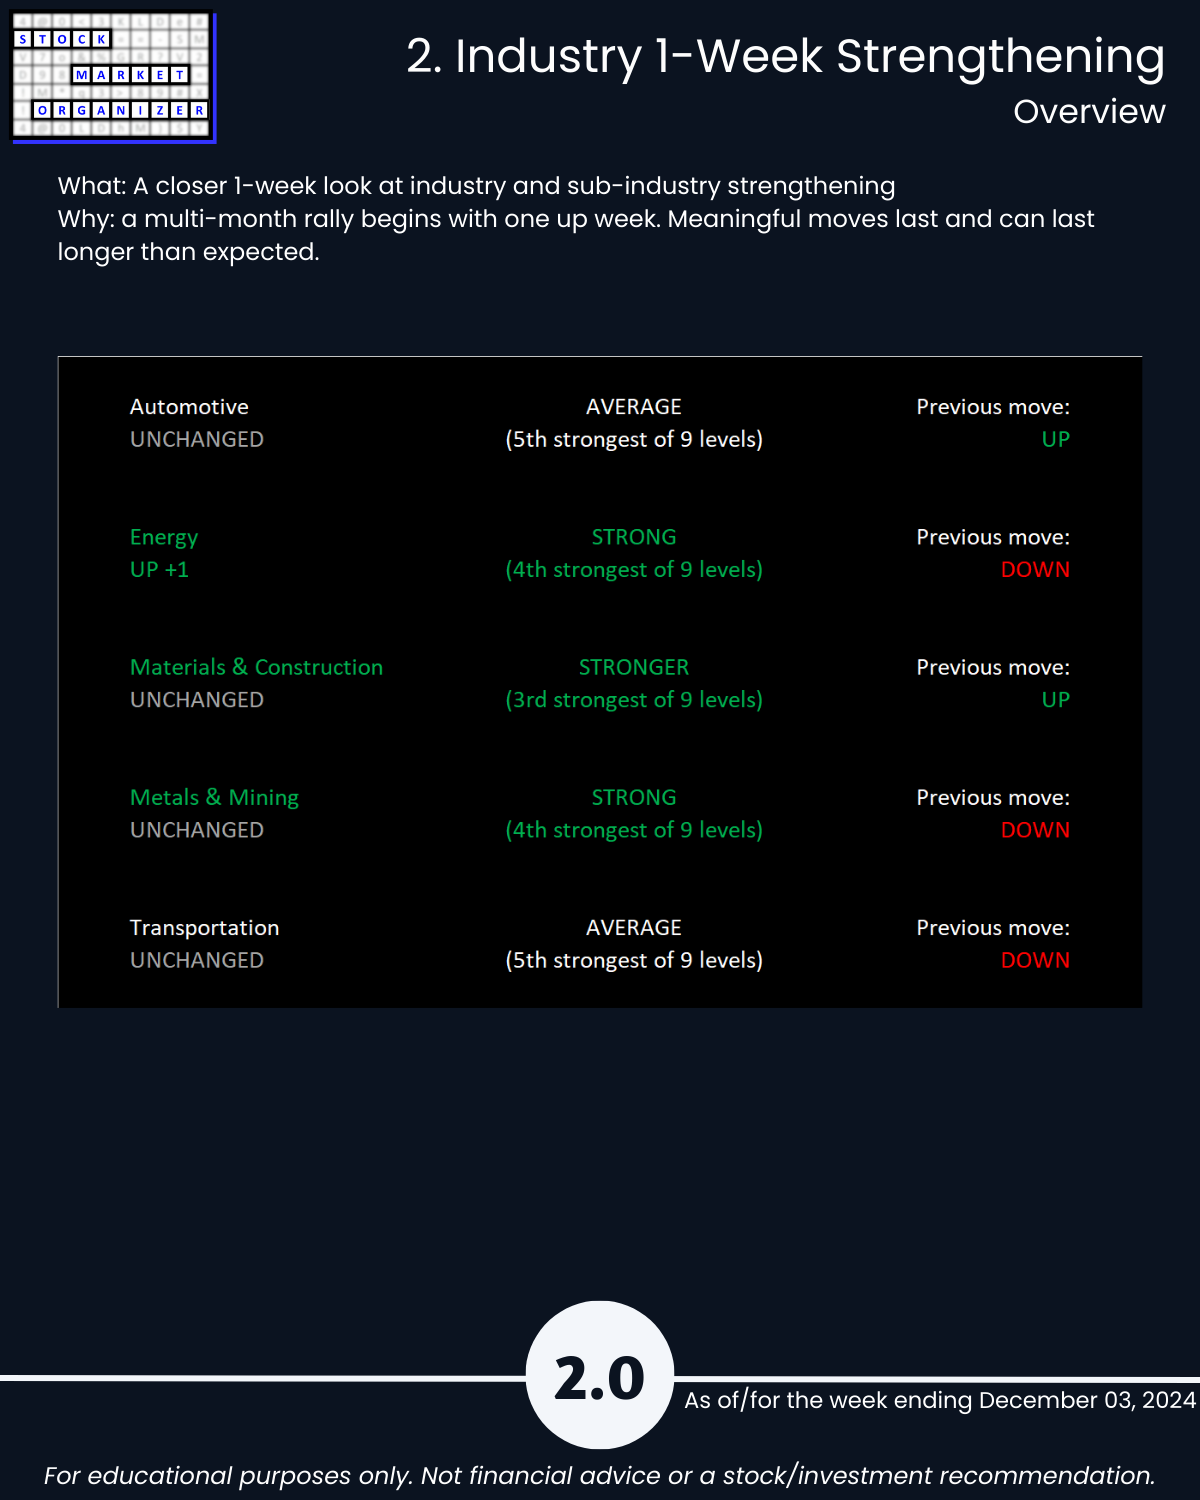
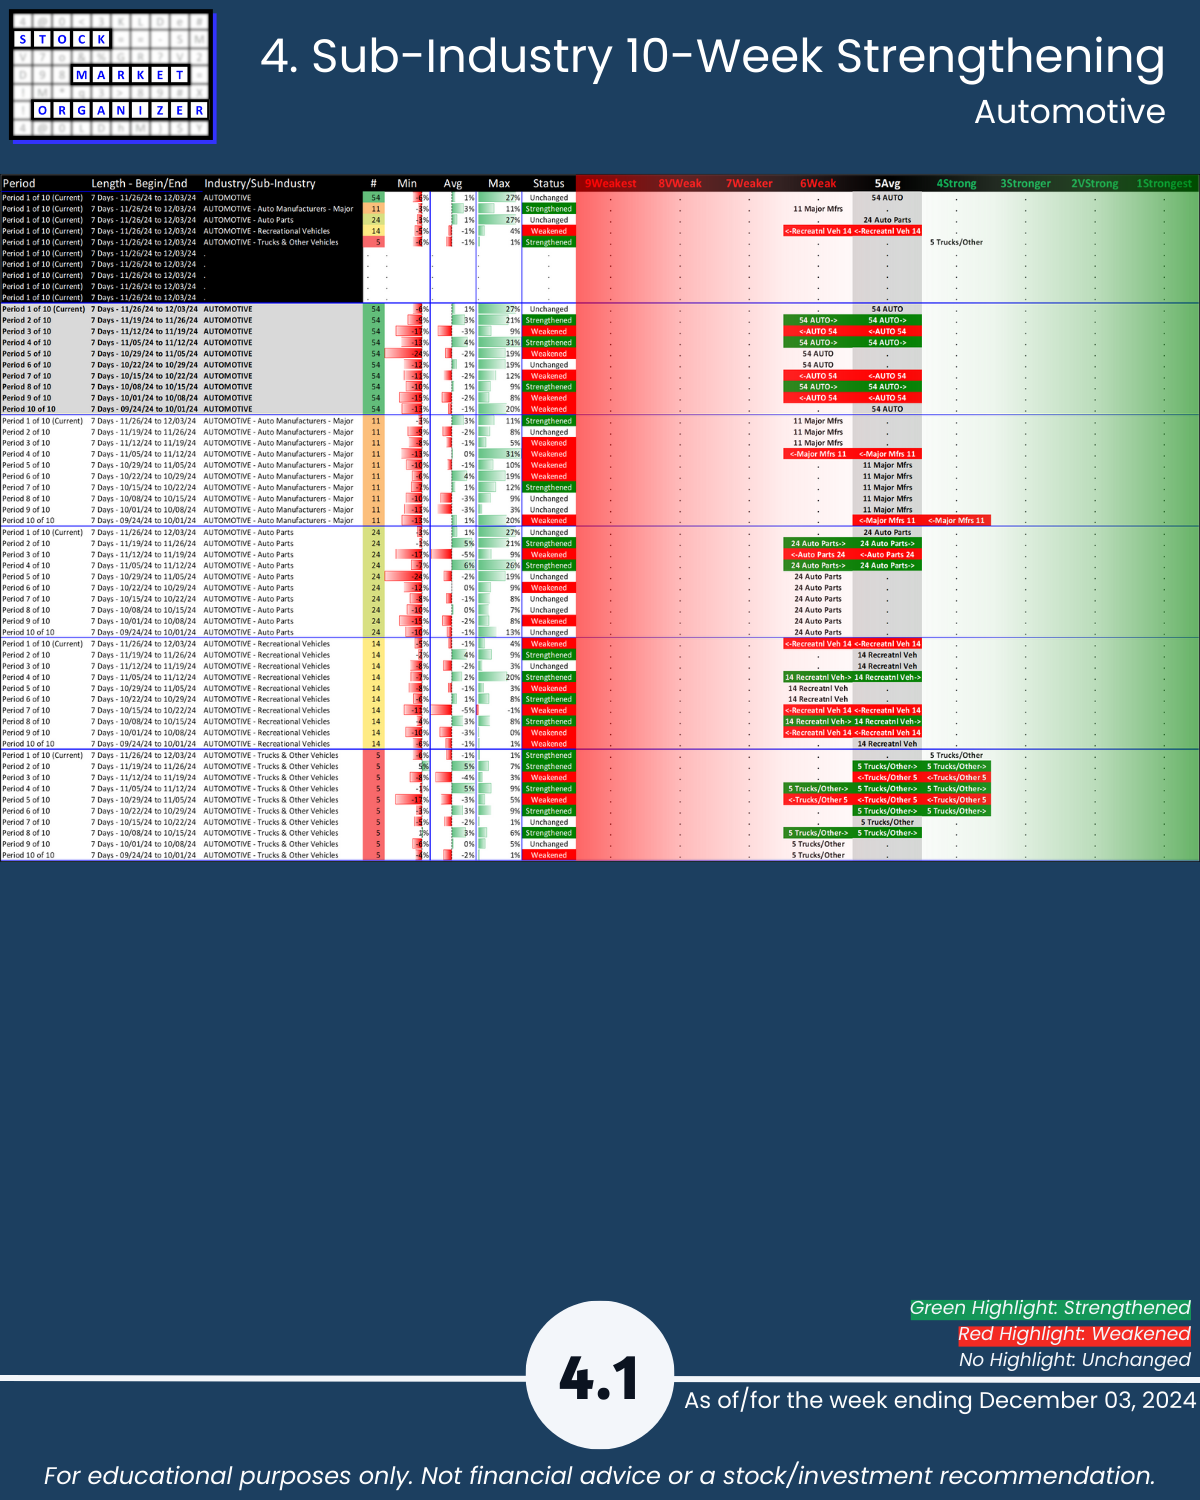
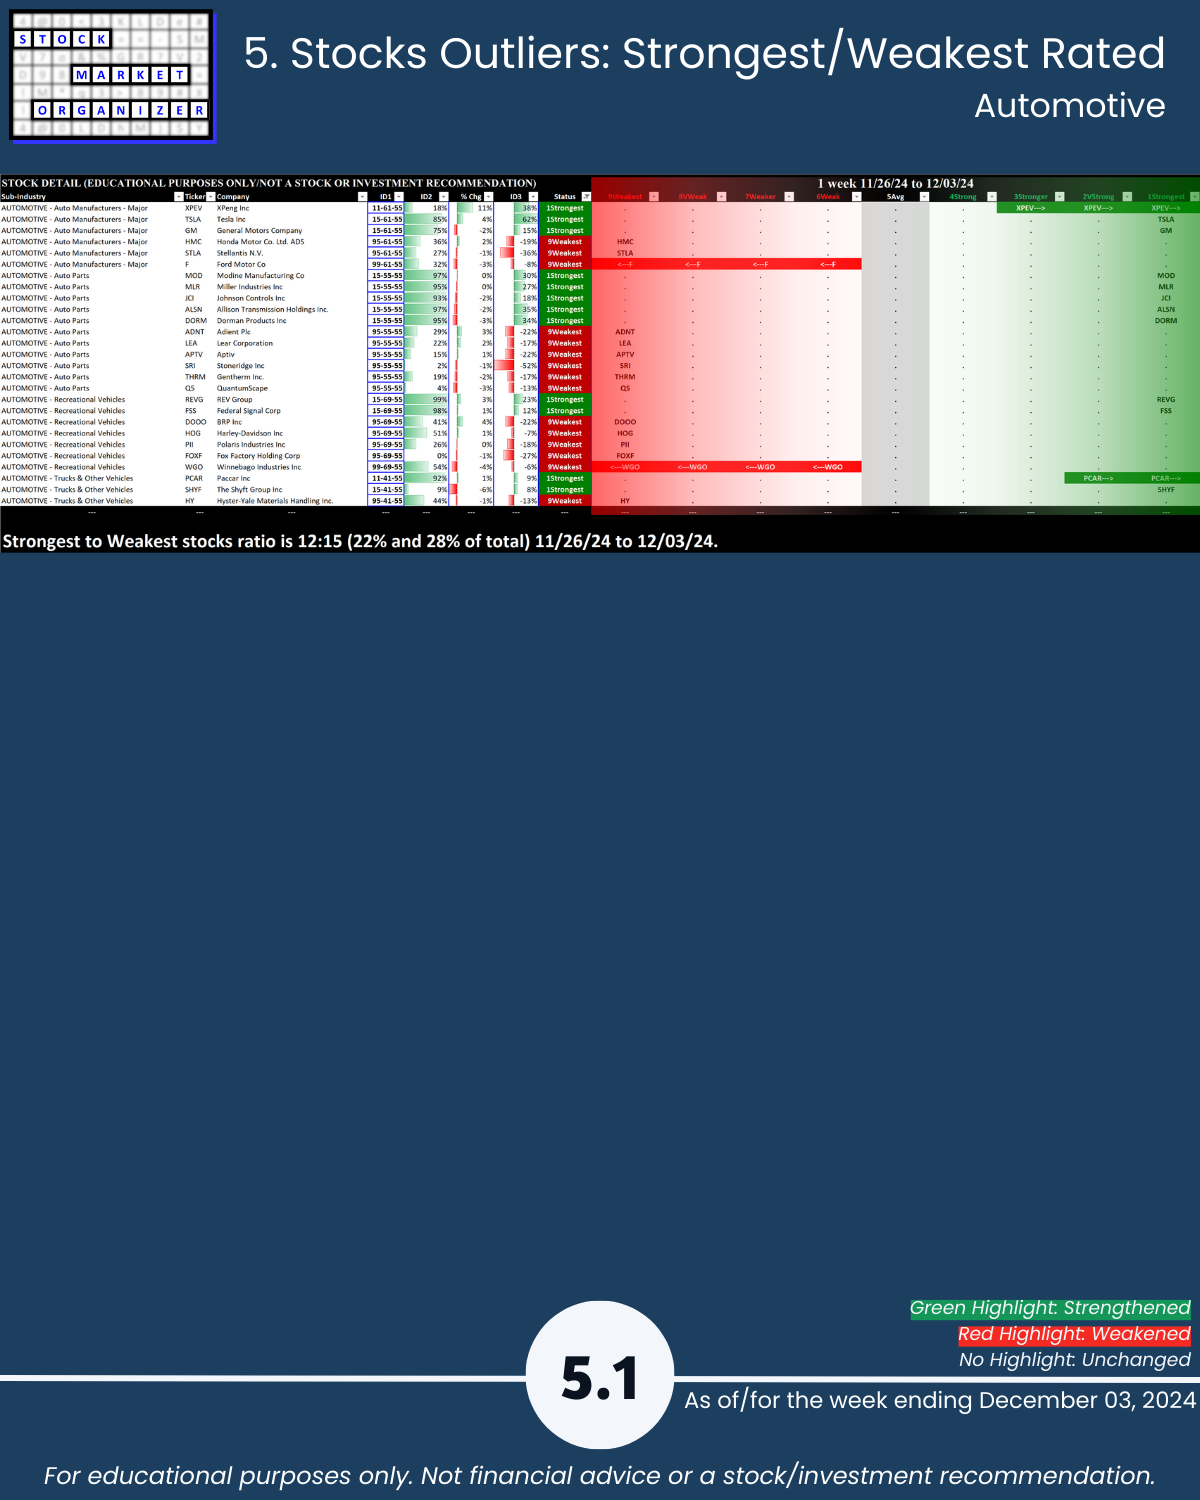
- Automotive is unchanged at 5Average = neutral
- TSLA remains 1Strongest, along with GM
- Energy strengthened rating one level to 4Strong = tailwind
- Per the above comment about the ETF XLE/Energy weakening, note that the 14 Major Integrated Oil & Gas companies are rated 6Weak.
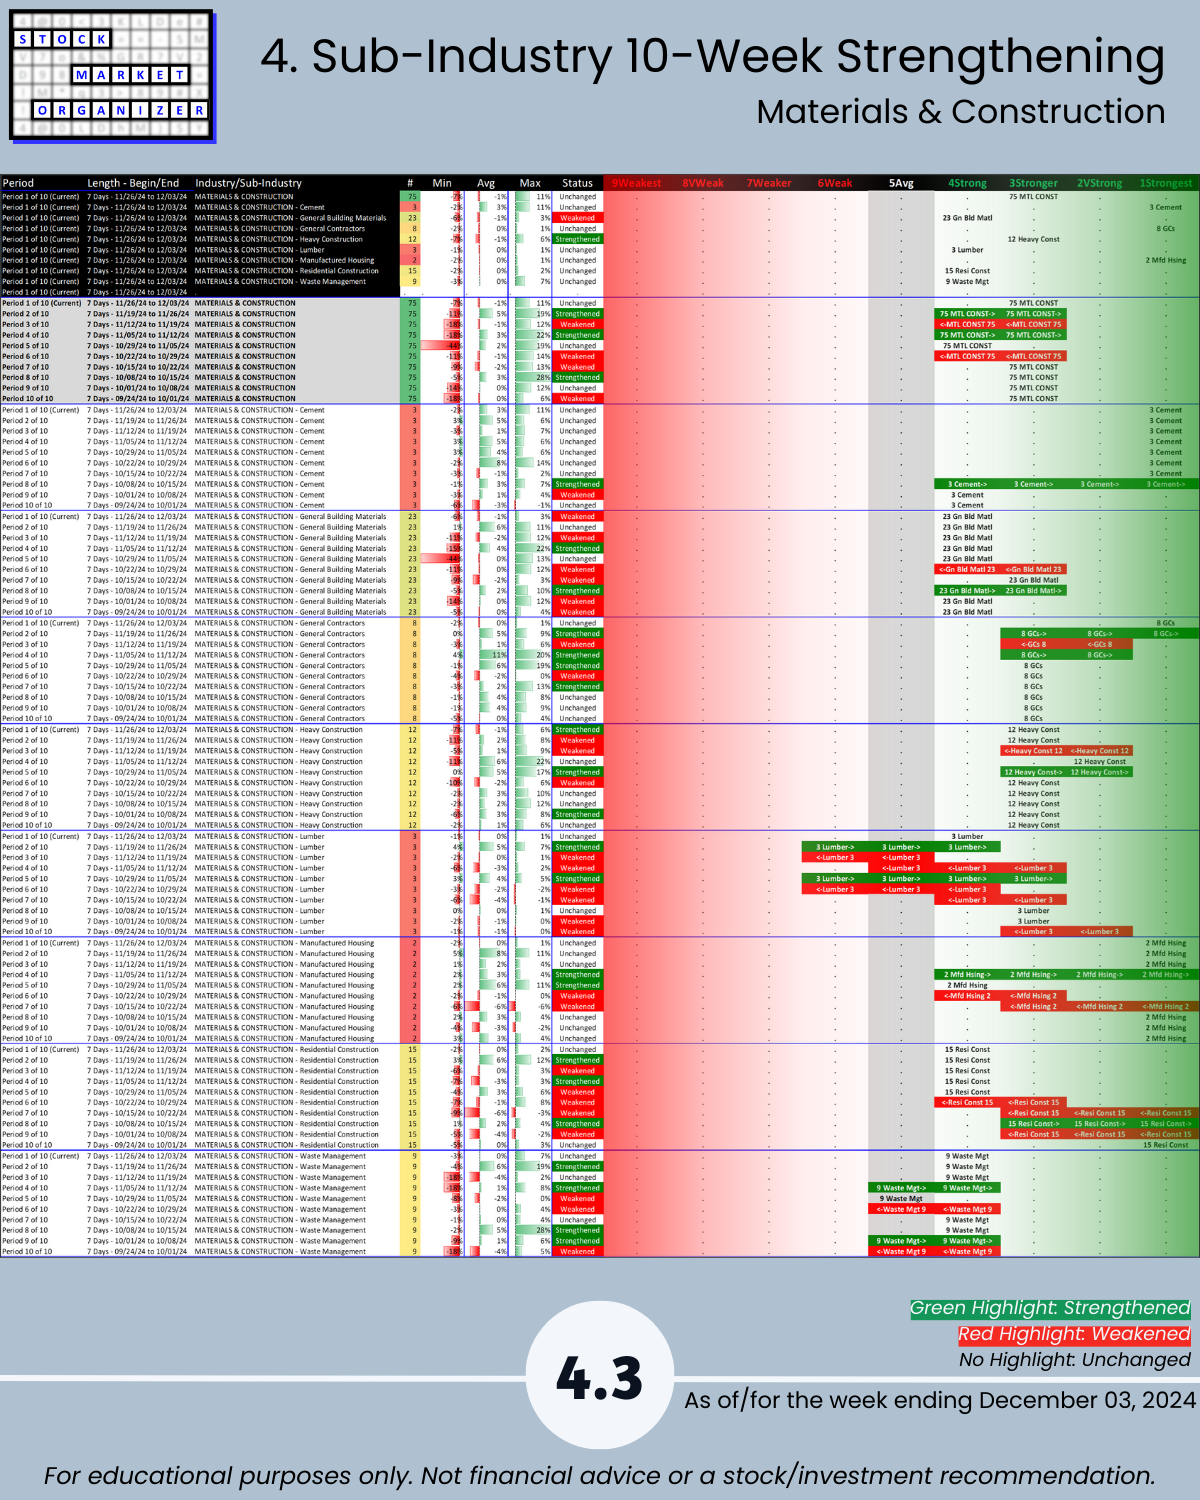
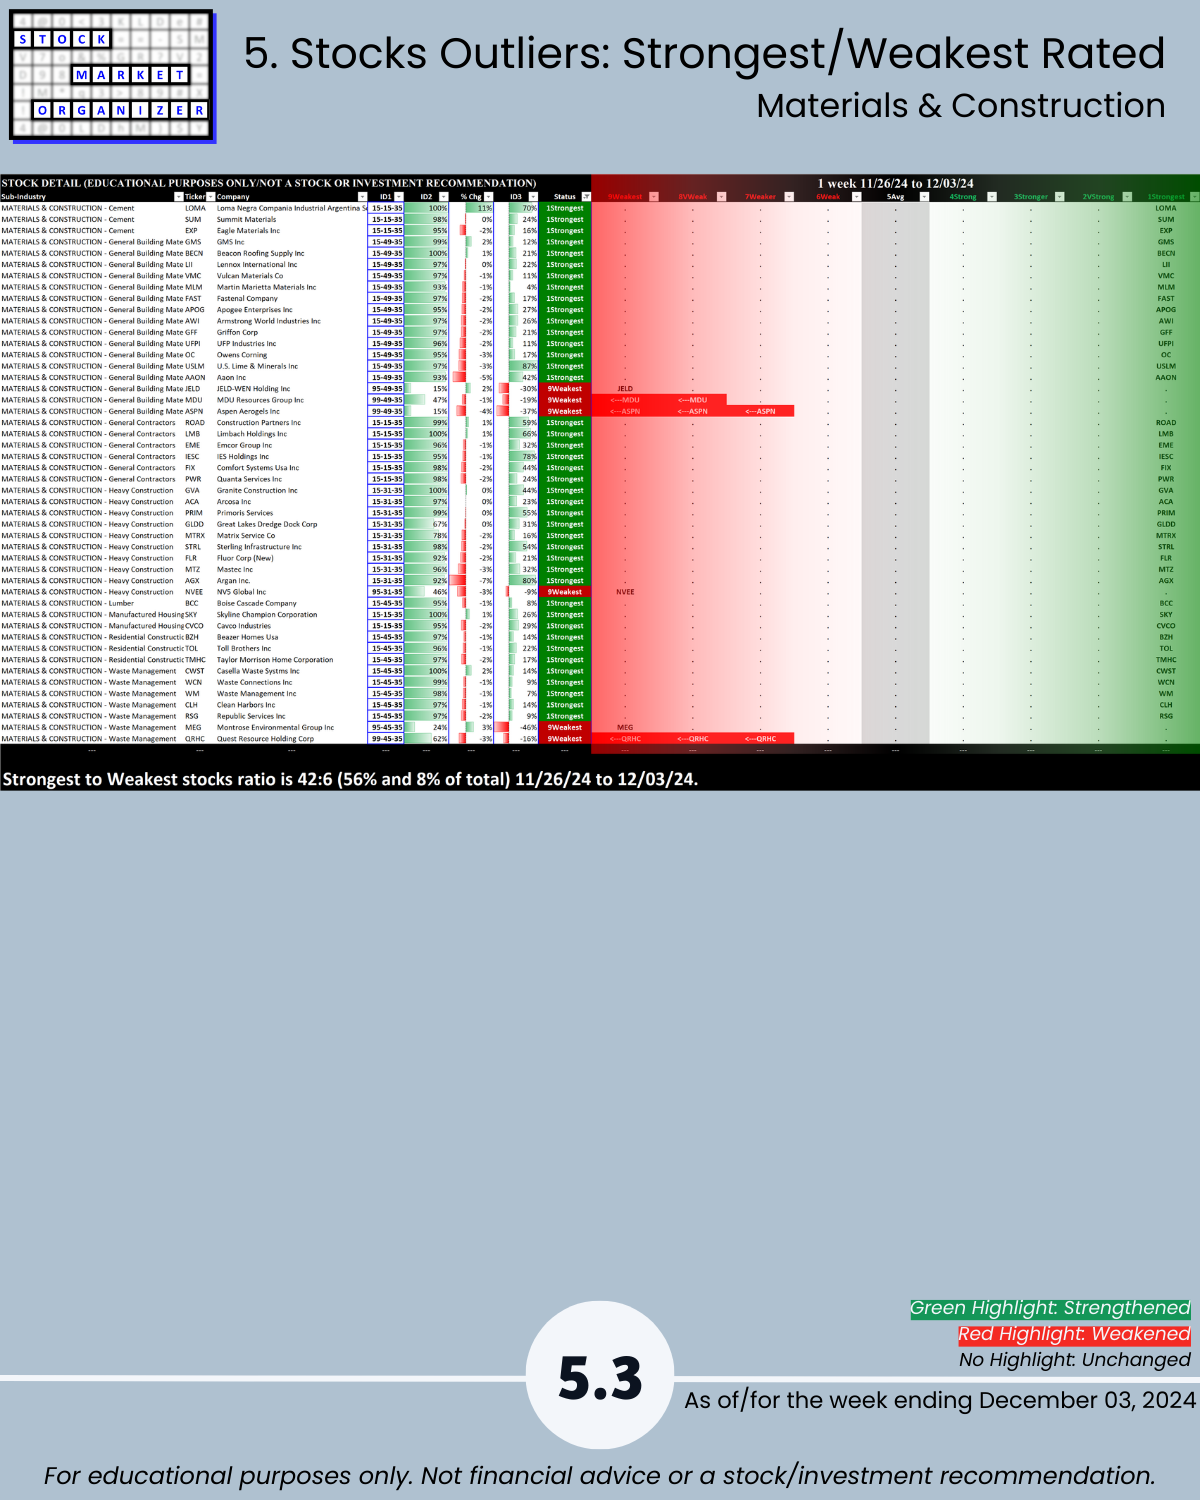
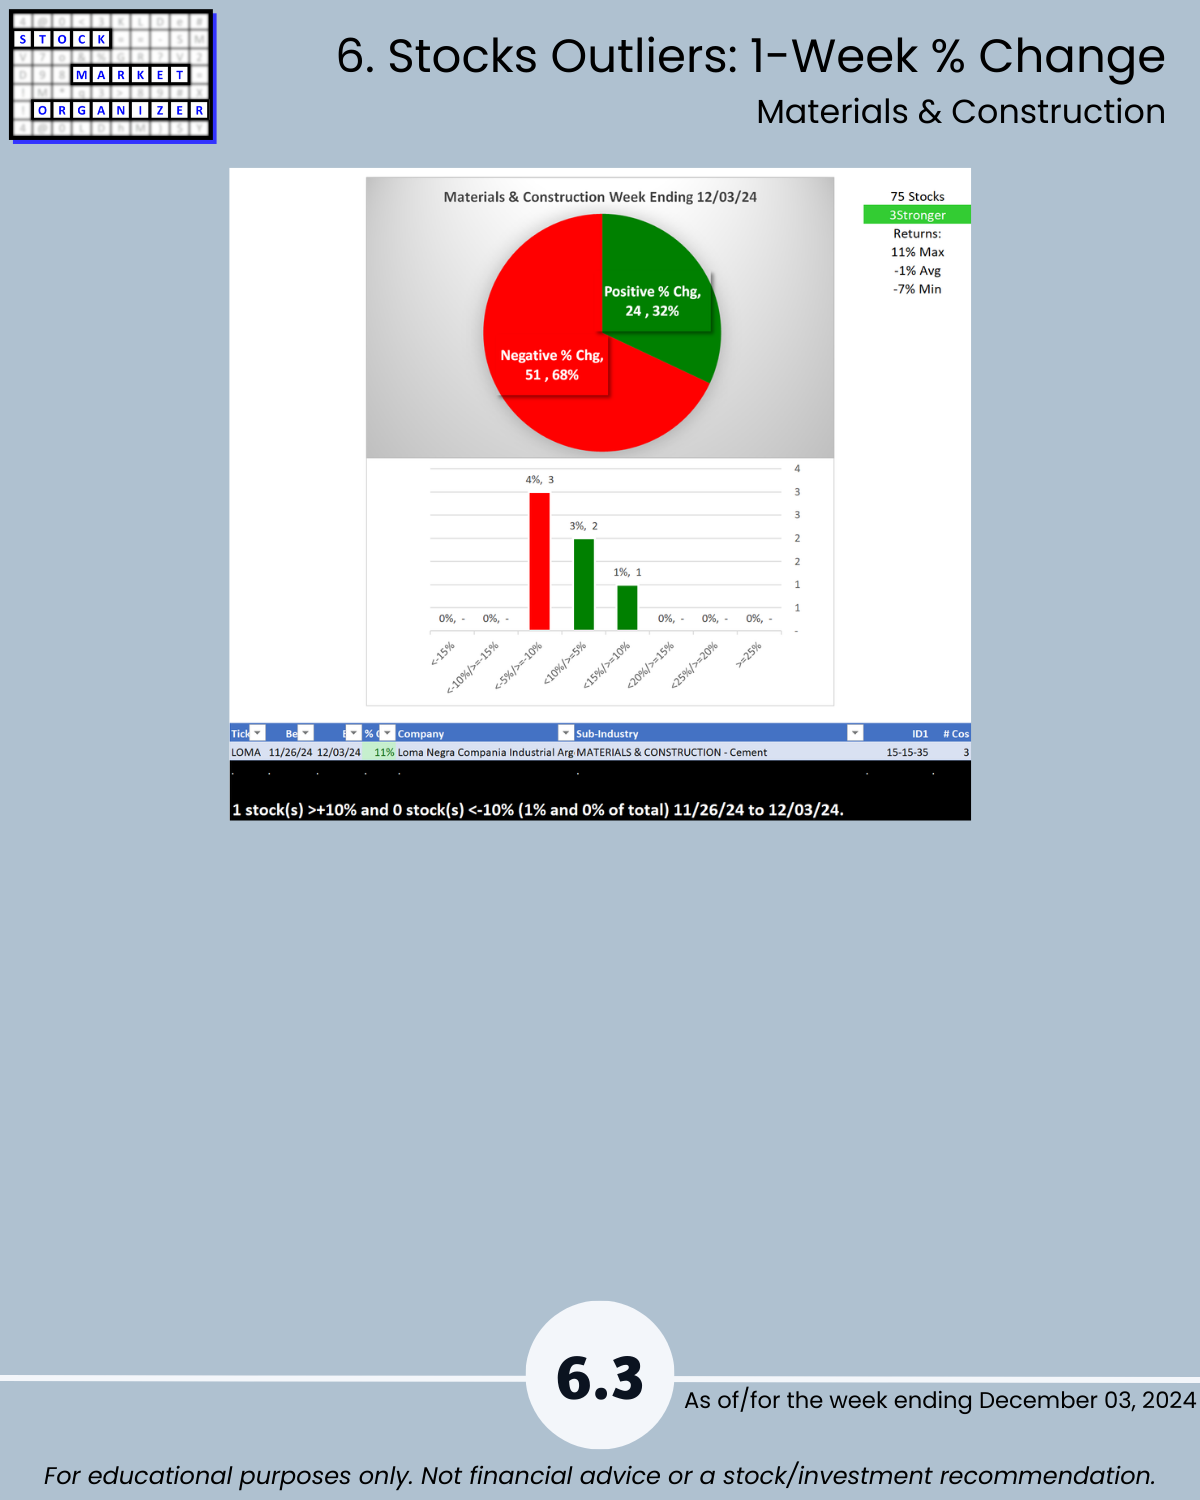
- Materials & Construction is unchanged at 4Strong = neutral
- Residential Construction remains at 4Strong
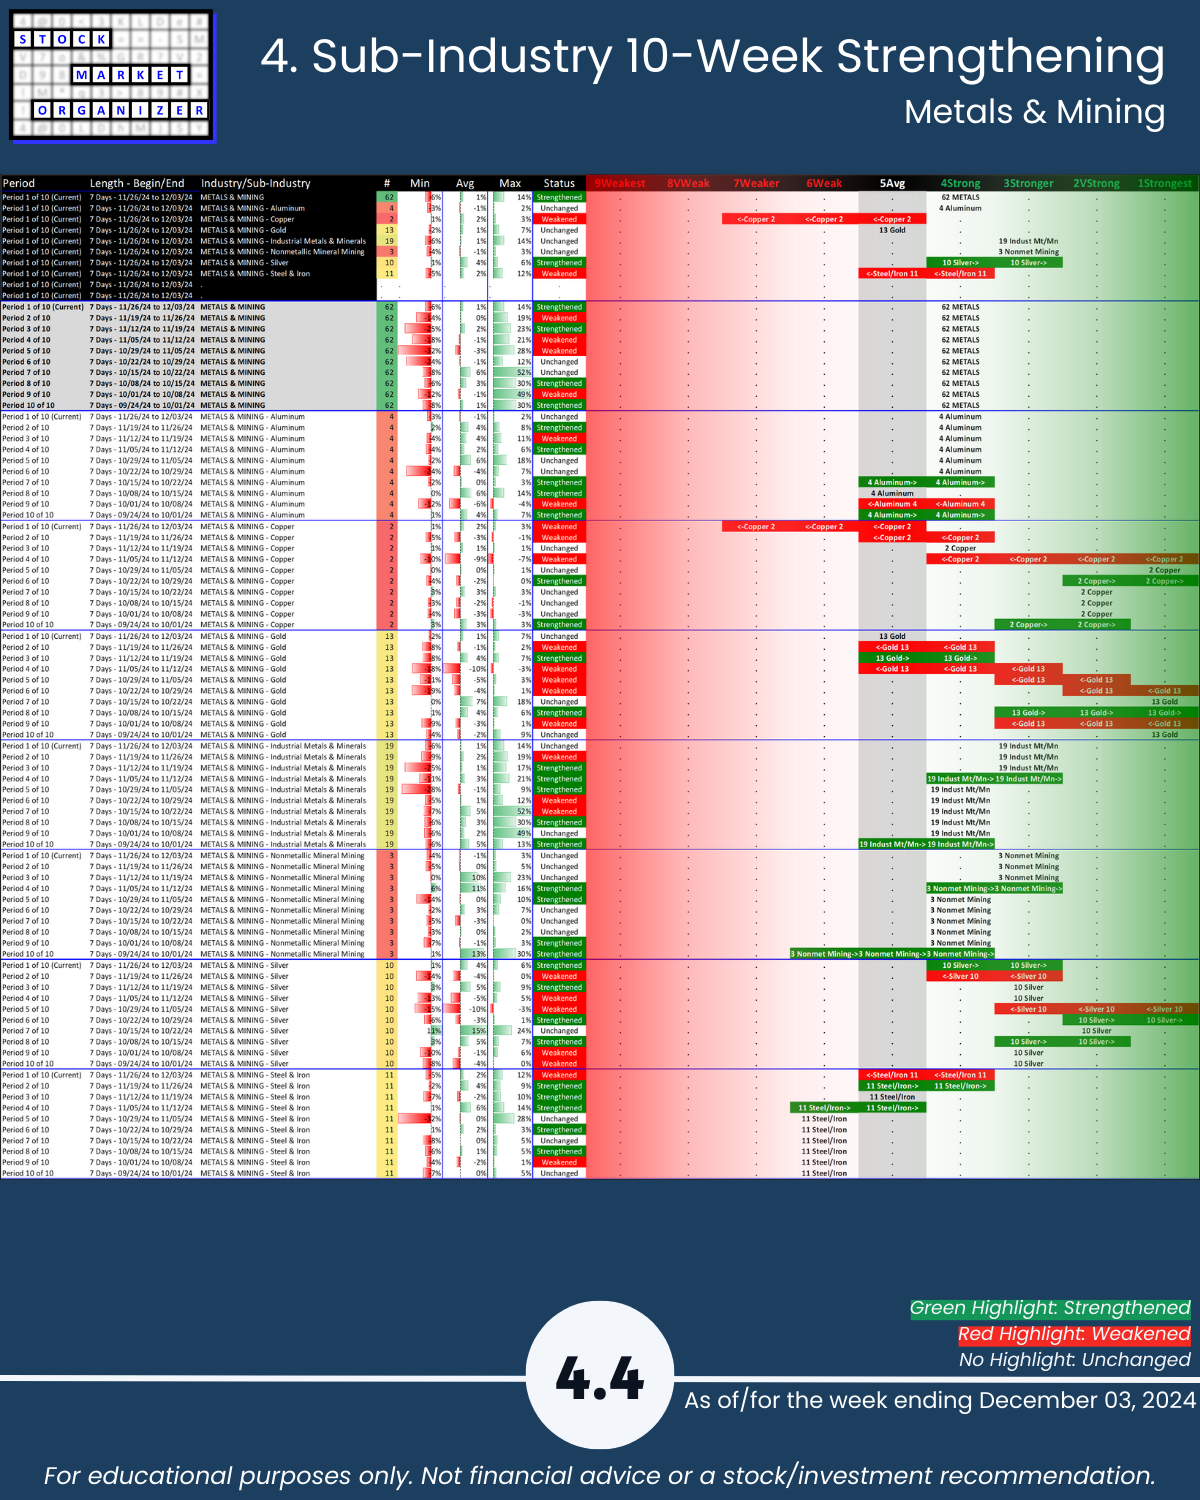
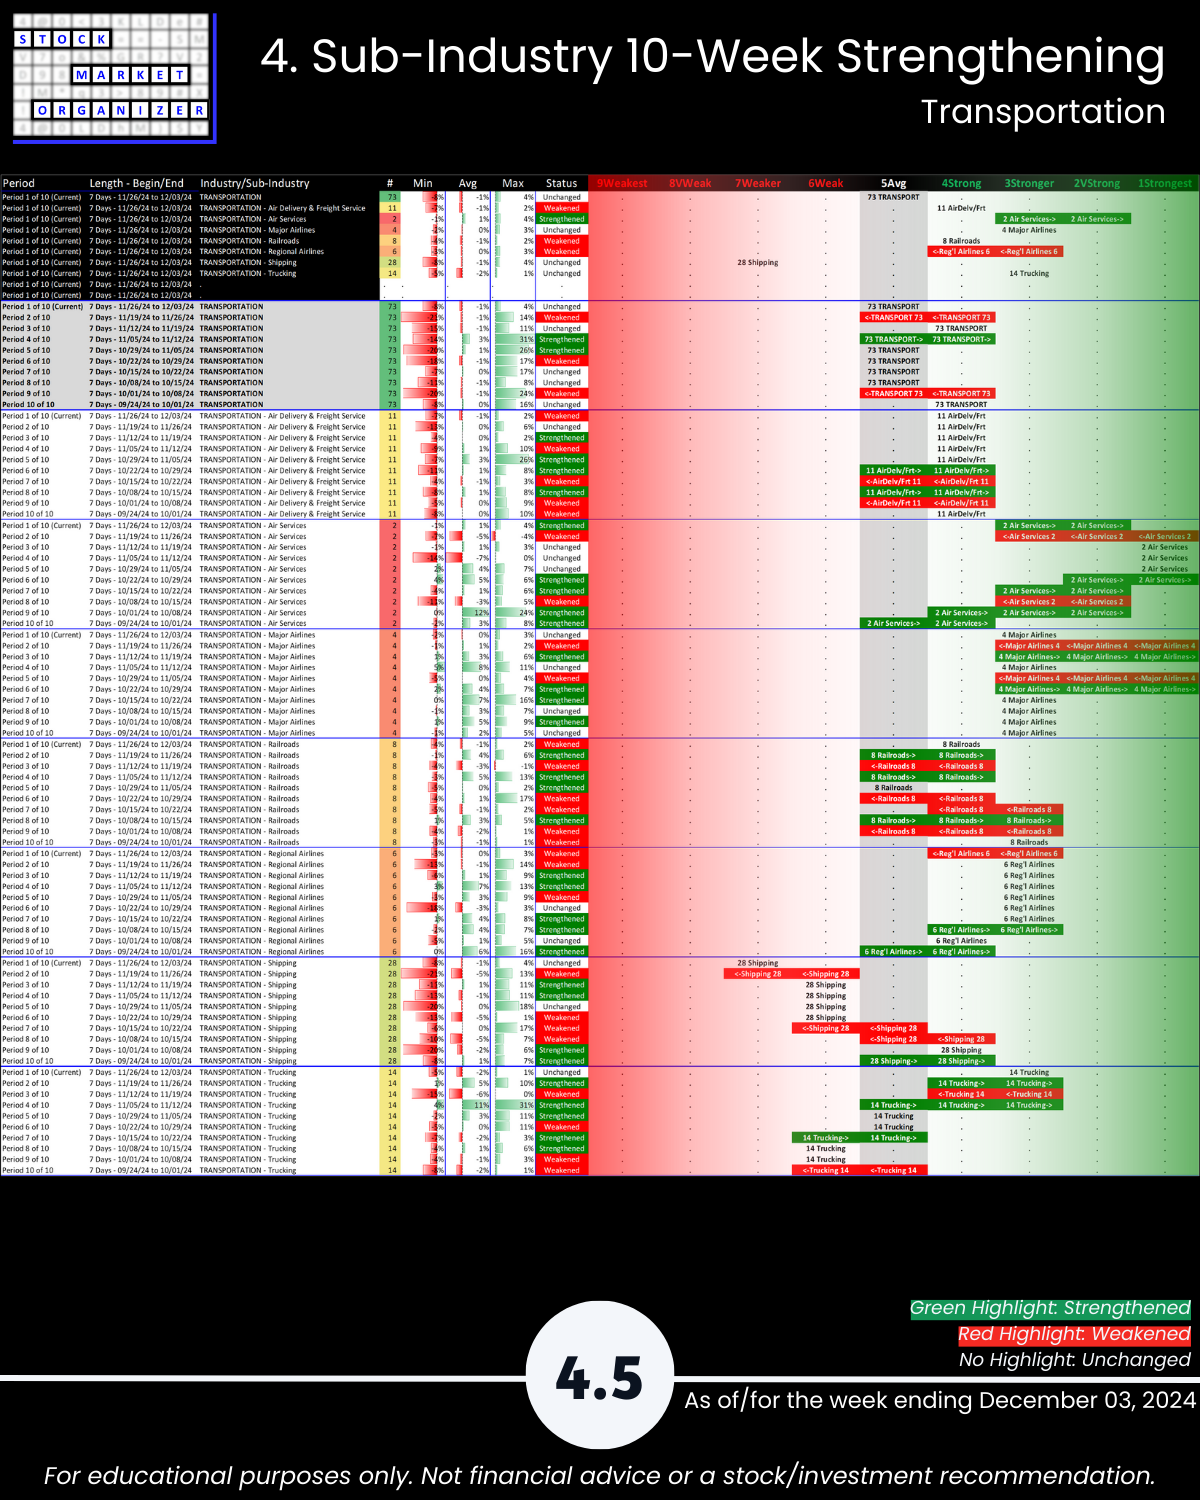
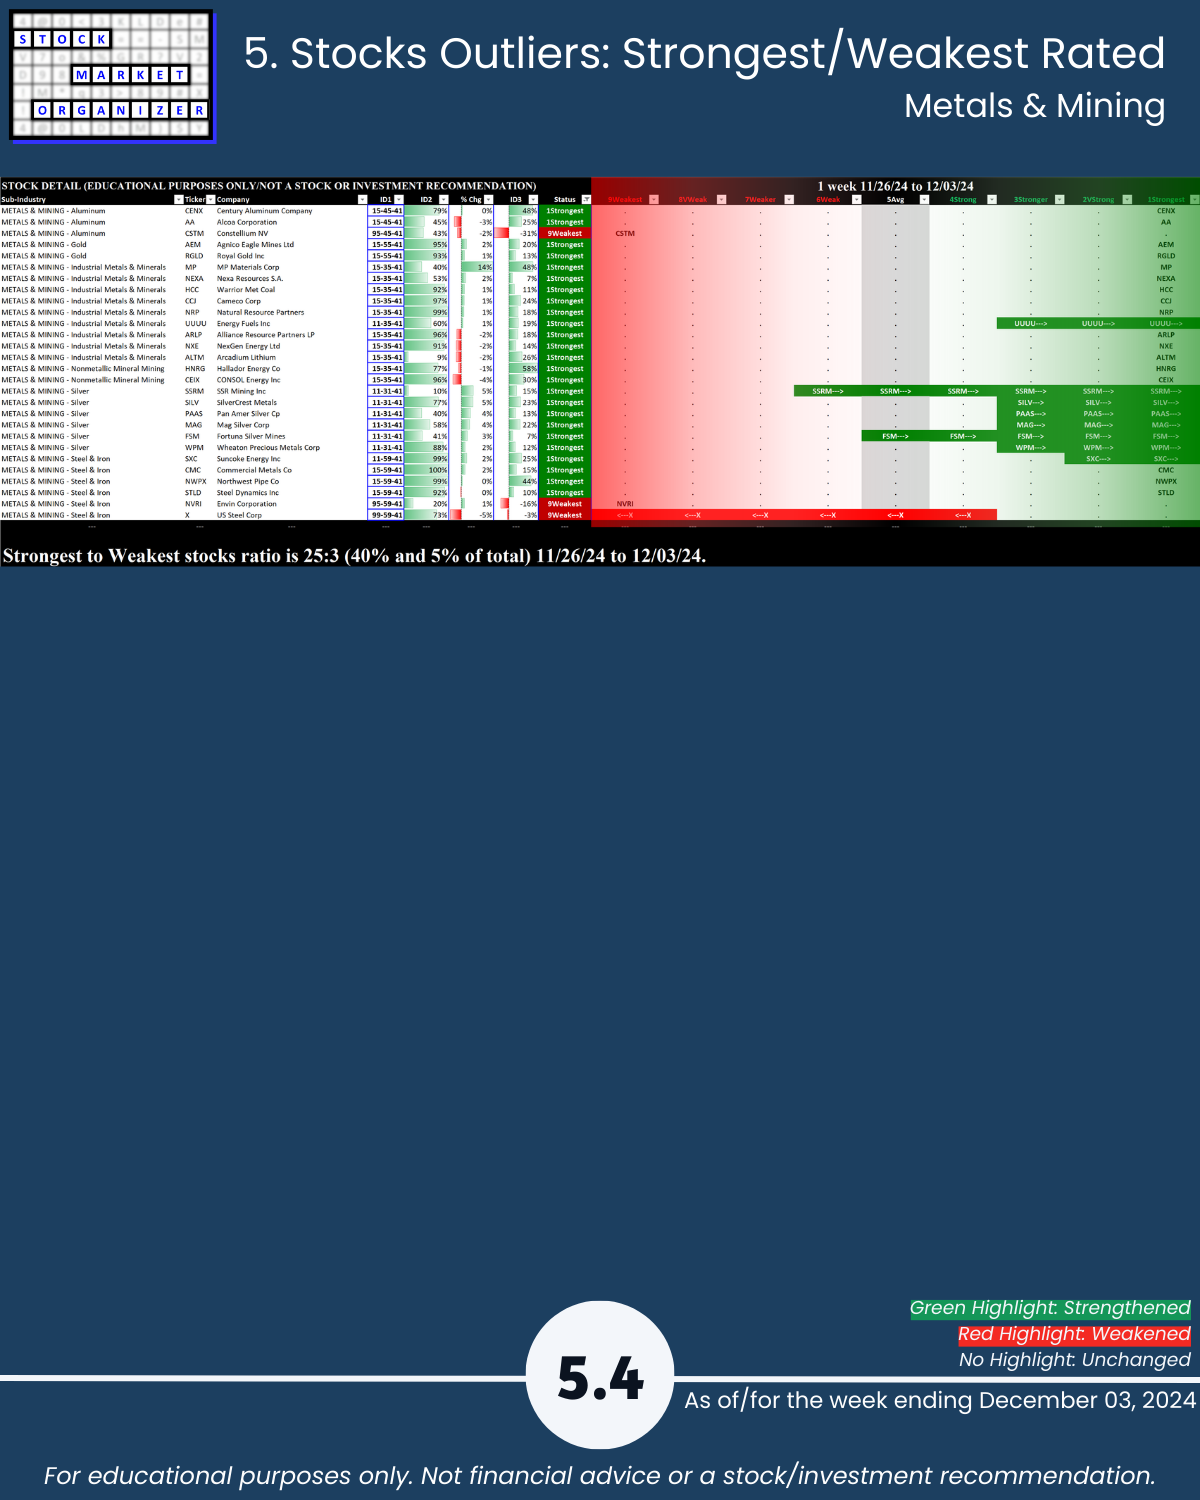
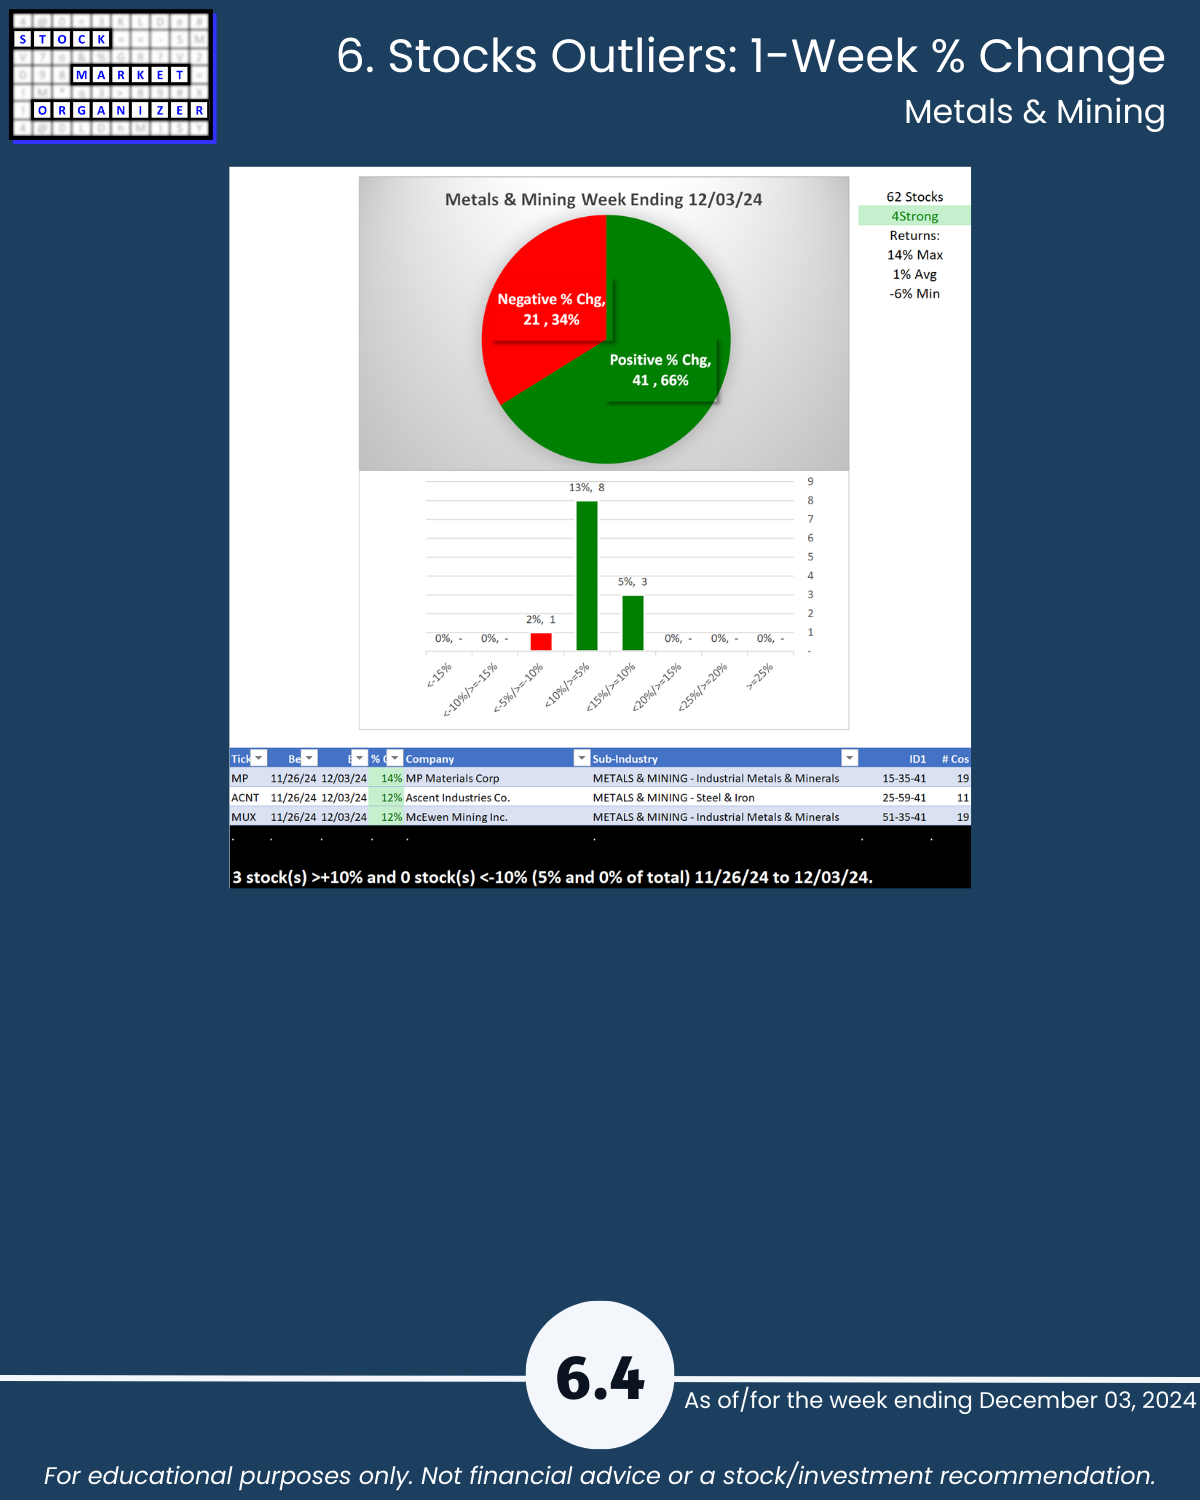
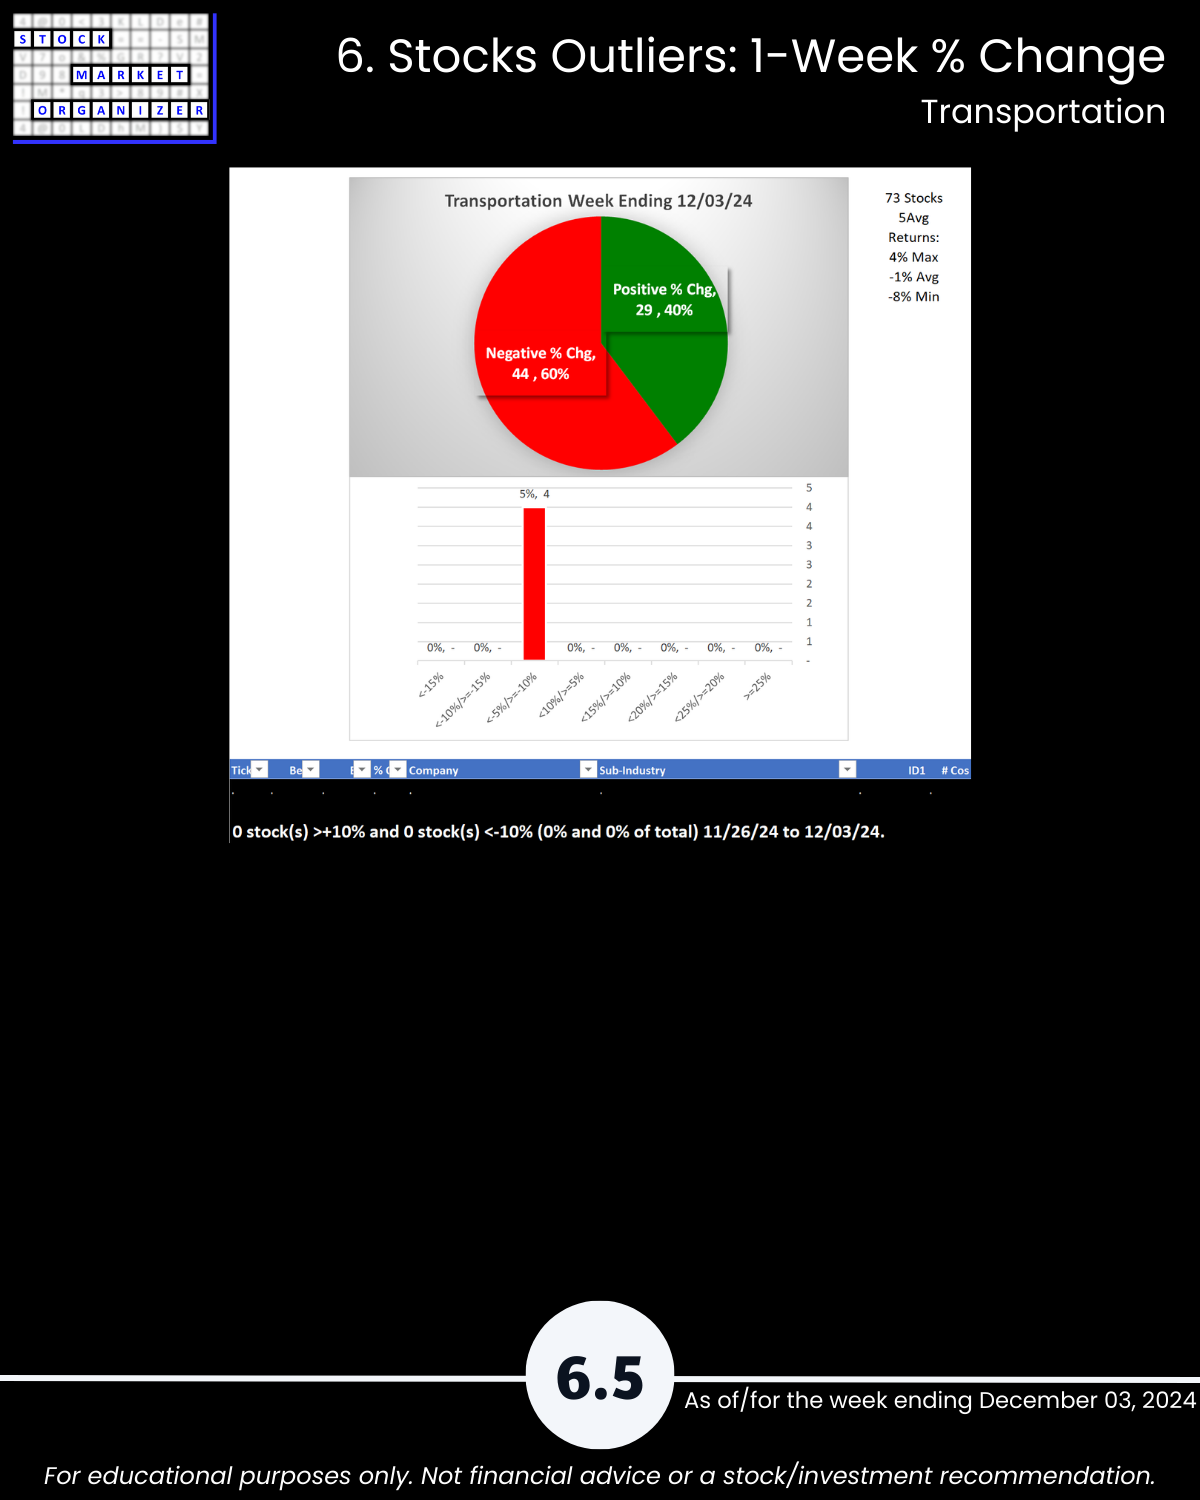
- Metals & Mining and Transportation were both unchanged = neutral
- The 13 Gold companies are at 5Average
Final Comments
There is absolutely no way of determining how long this environment will last. All one can do is find an objective way of measuring whether any given environment offers headwinds or tailwinds and then act accordingly based on these measurements.
Details are below shown in a manner not available elsewhere because I created it from scratch to continually answer this question: “Where is there strengthening and weakening in the market at the stock, sub-industry, industry, and sector levels?” Combine this with the top-down Market Strength Score and Sector Risk Gauge to get a key competitive advantage of understanding strength at every level.
1. Introduction
2. Industry 1-Week Strengthening
3. Industry 10-Week Strengthening
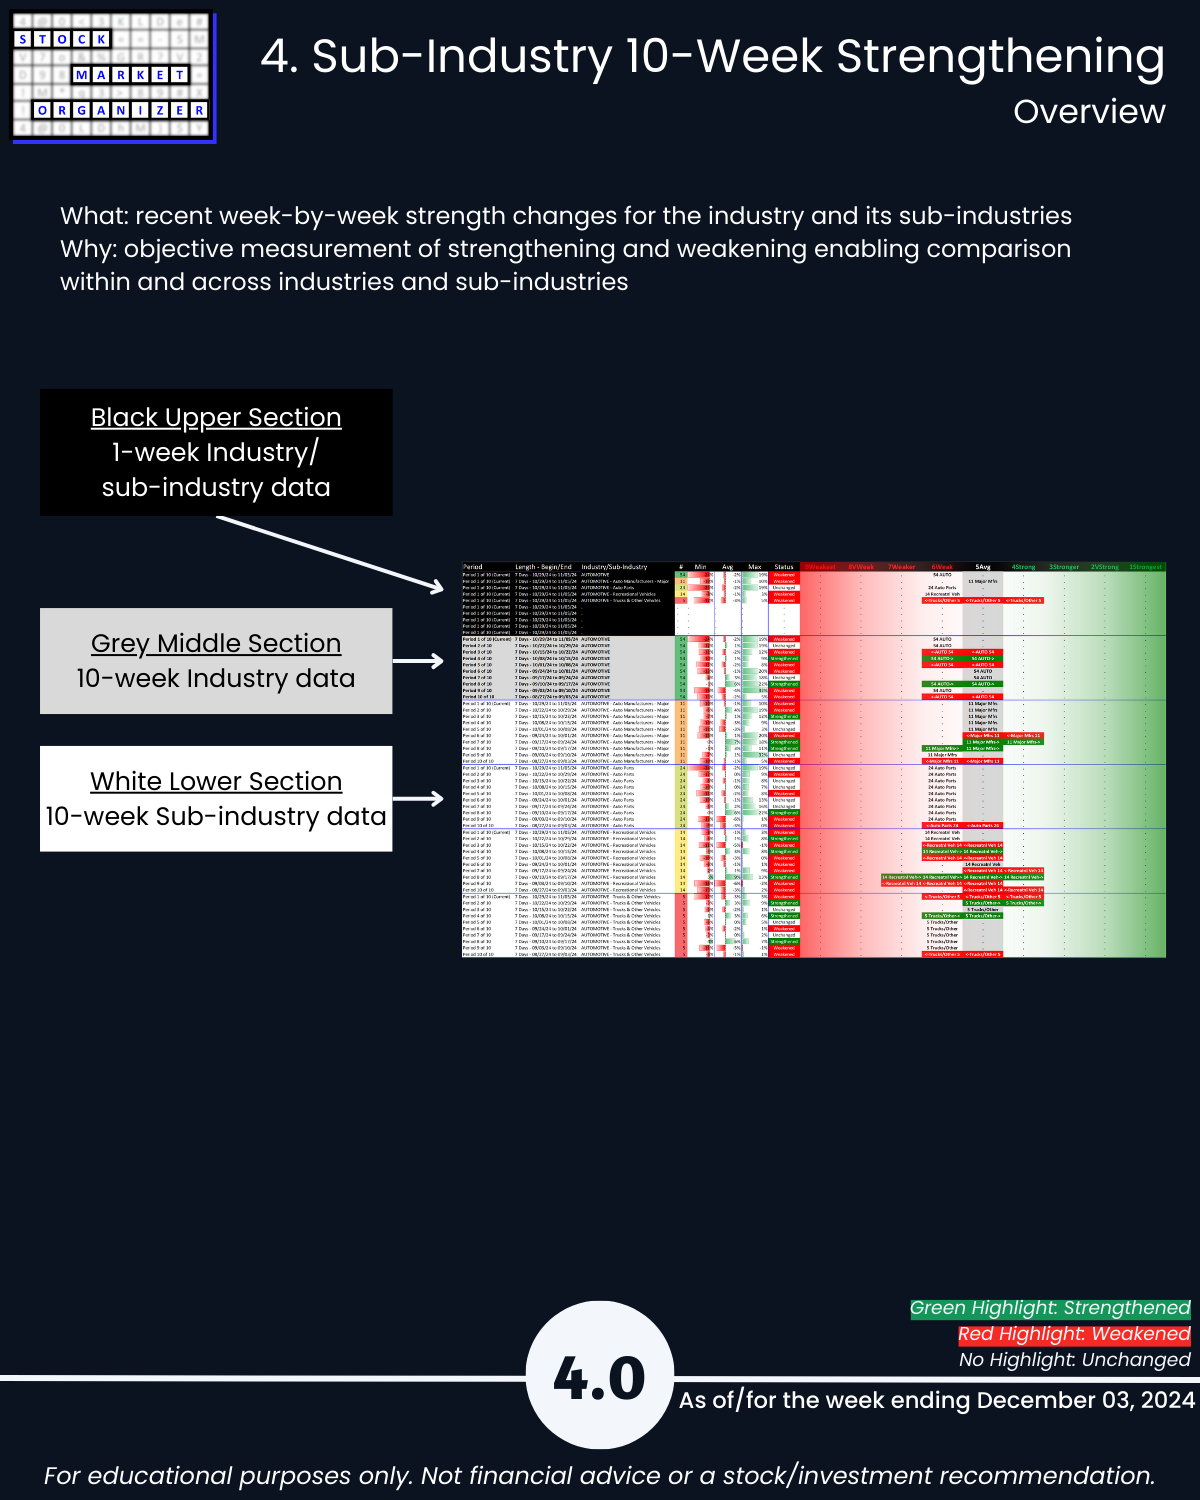
4. Sub-Industry 10-Week Strengthening
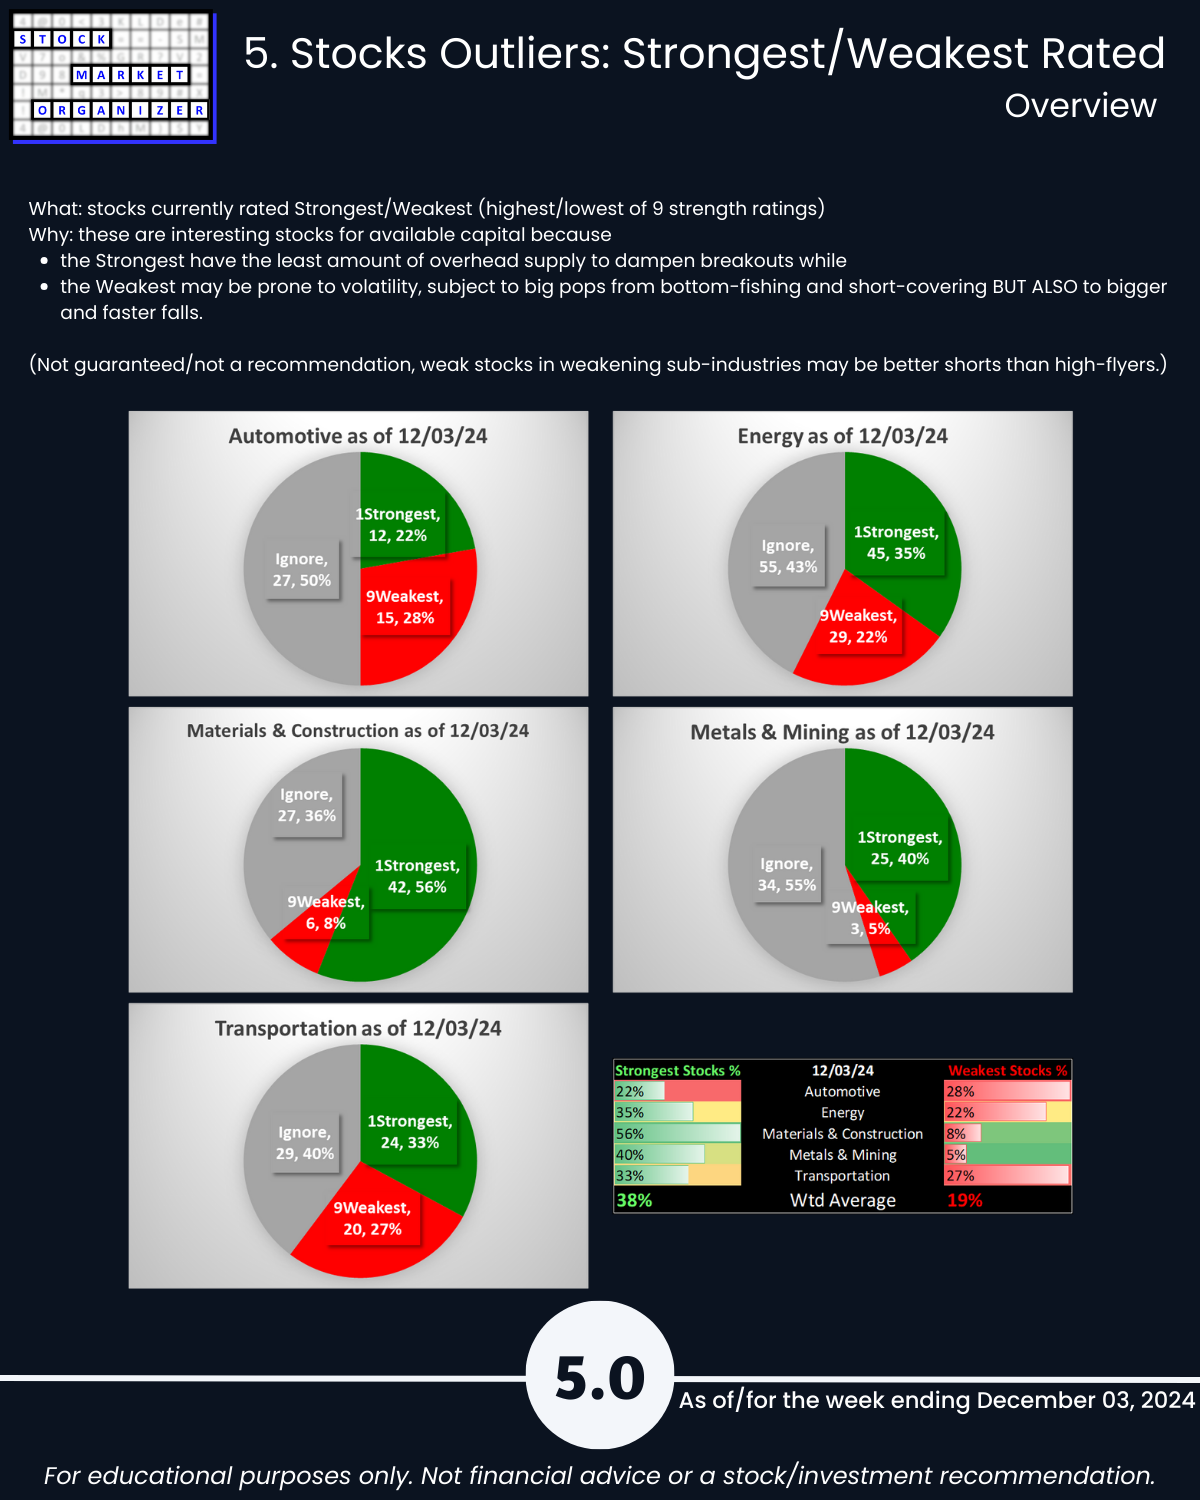
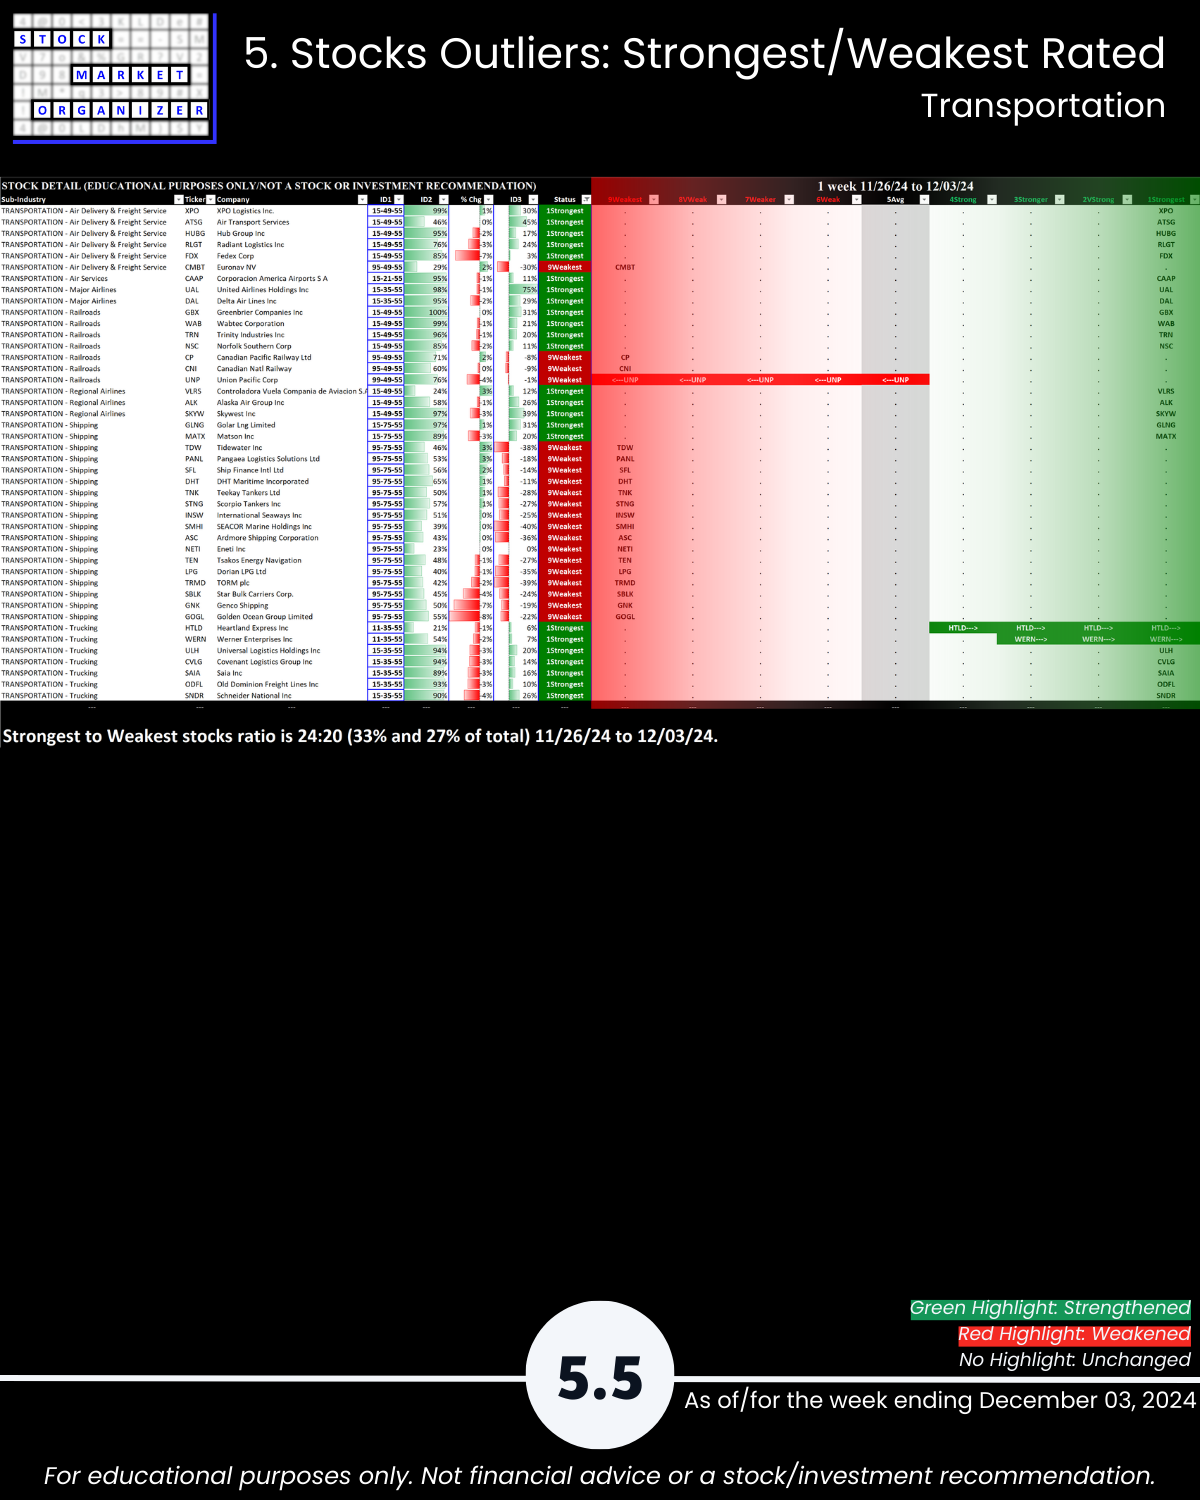
5. Stocks Outliers: Strongest/Weakest Rated
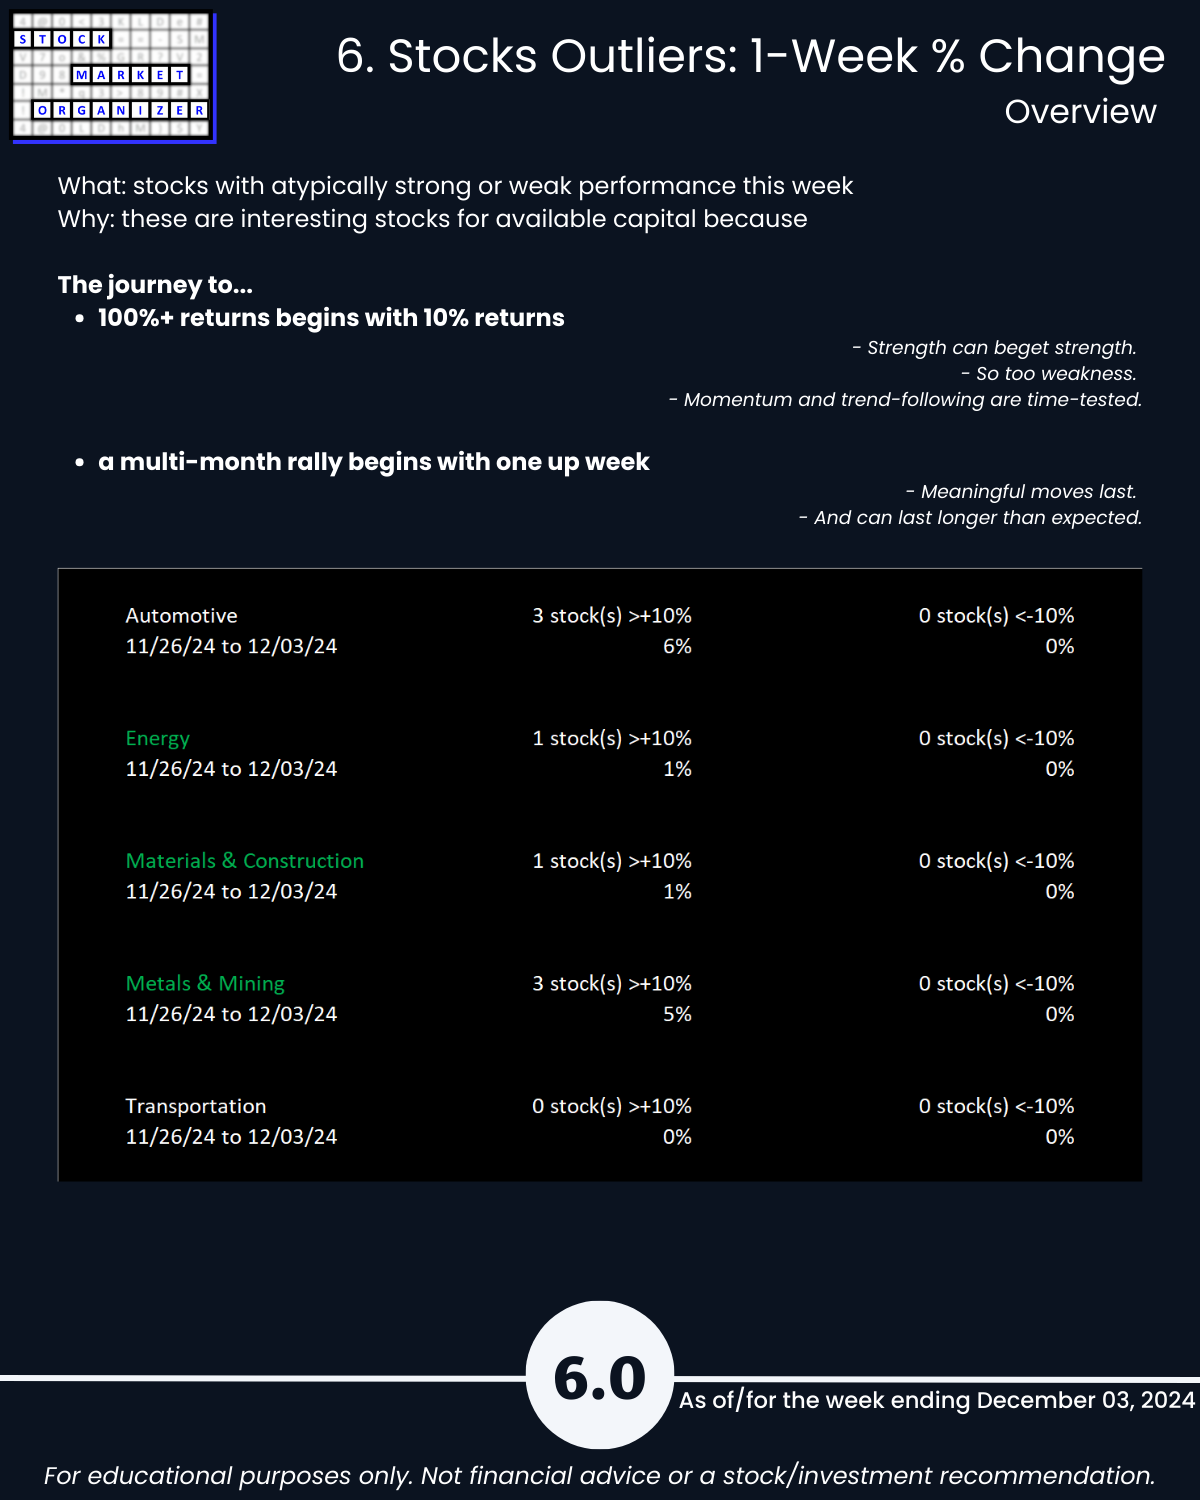
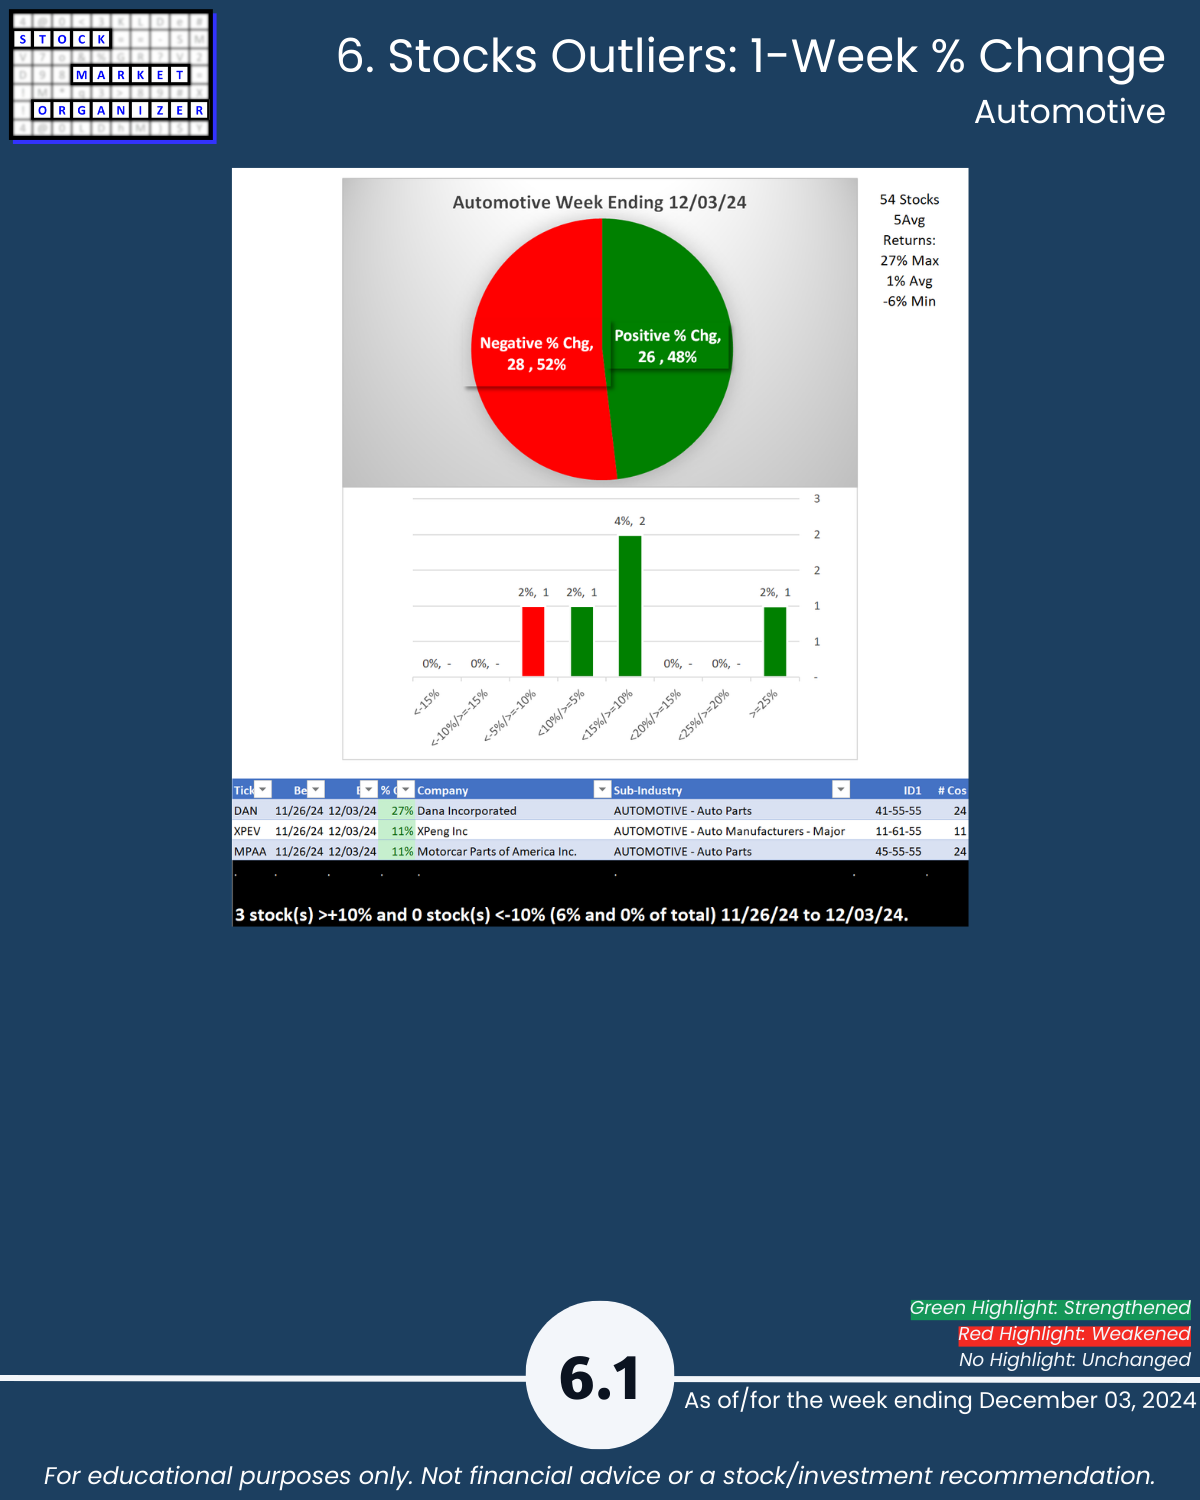
6. Stocks Outliers: 1-Week % Change
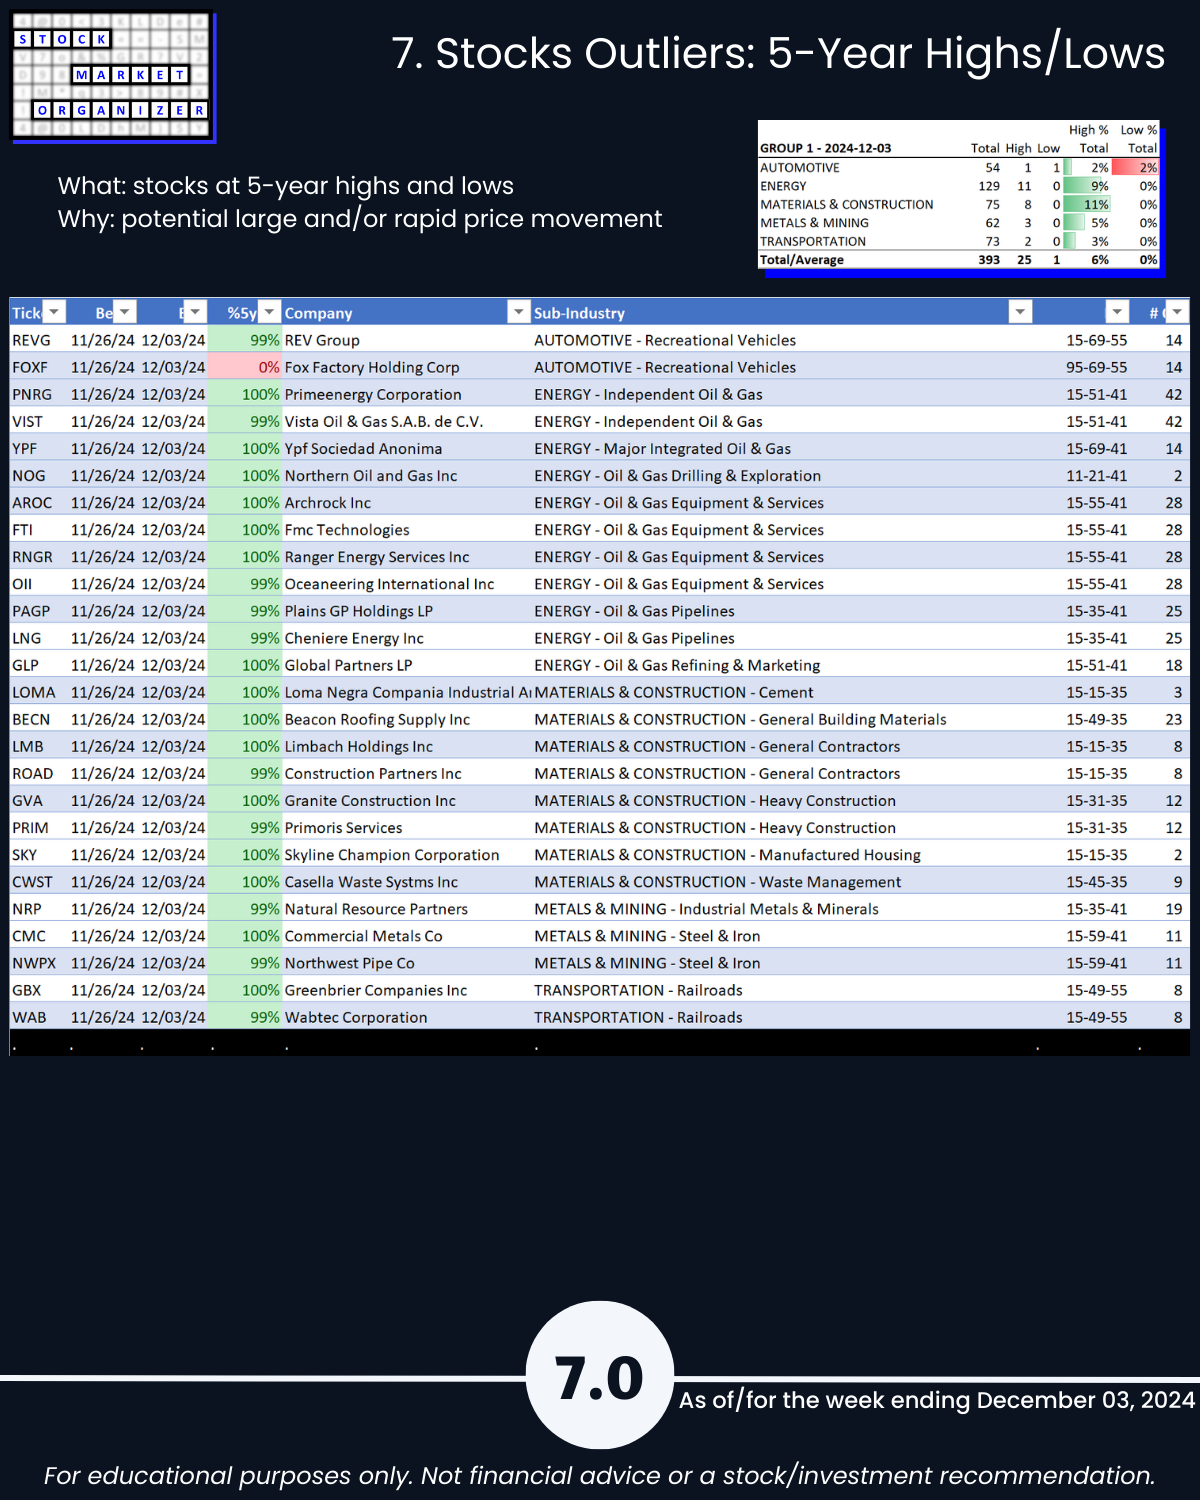
7. Stocks Outliers: 5-Year Highs/Lows