SMO Exclusive: Strength Report Group 3 2024-04-05

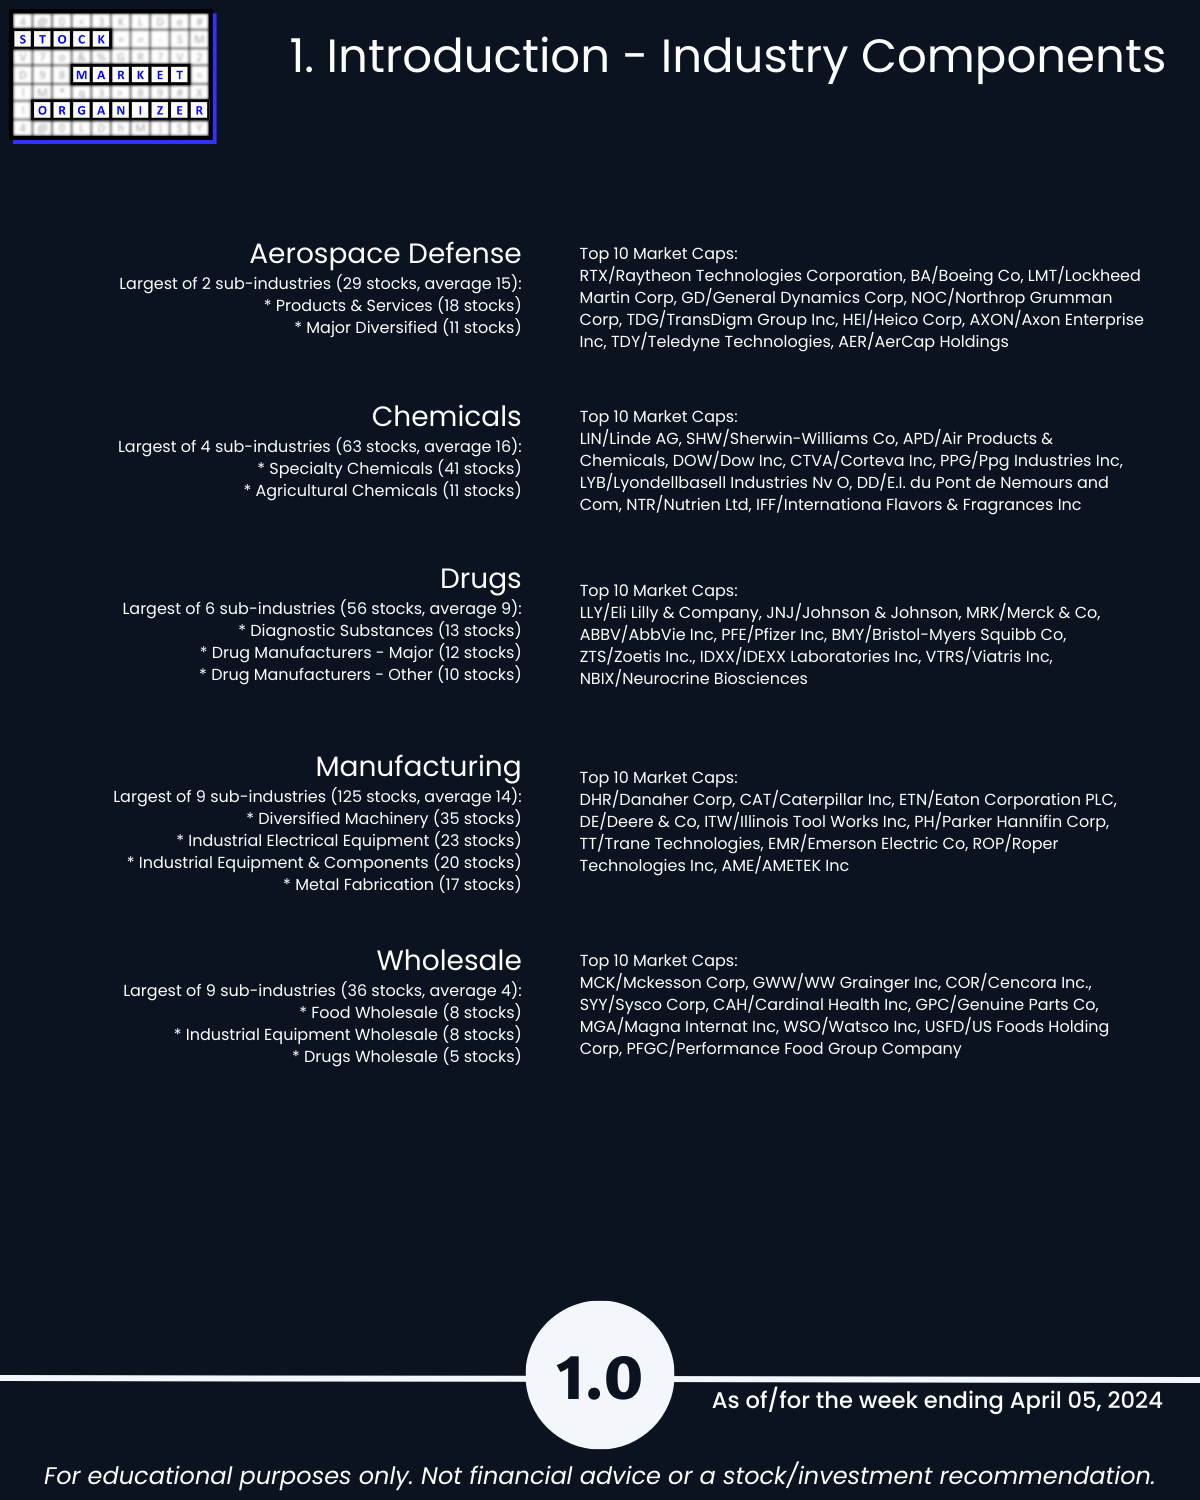
Closing the full market loop for the week ending 4/5/24 (previous reports Industry Groups 1 and 2 and the Consumer, Financial, and Technology sector reports published over the past week), attached is the Industry Group 3 report. My universe consists of almost 2,700 stocks across 29 industries and the last 5 industries covered today are the cats and dogs Aerospace Defense, Chemicals, Drugs, Manufacturing, and Wholesale. Unique U.S. Stock Market strength-based insights: 🔹 3 of 5 industries weakened as the average strength score falls 0.7 (a large drop) to 4.2, 🔹 72% average negative stocks with Drugs 84%, Manufacturing 72%, and Wholesale 75%, 🔹 40% weakening sub-industries with none strengthening.
WHAT CAN I TELL YOU THAT YOU PROBABLY DON’T KNOW
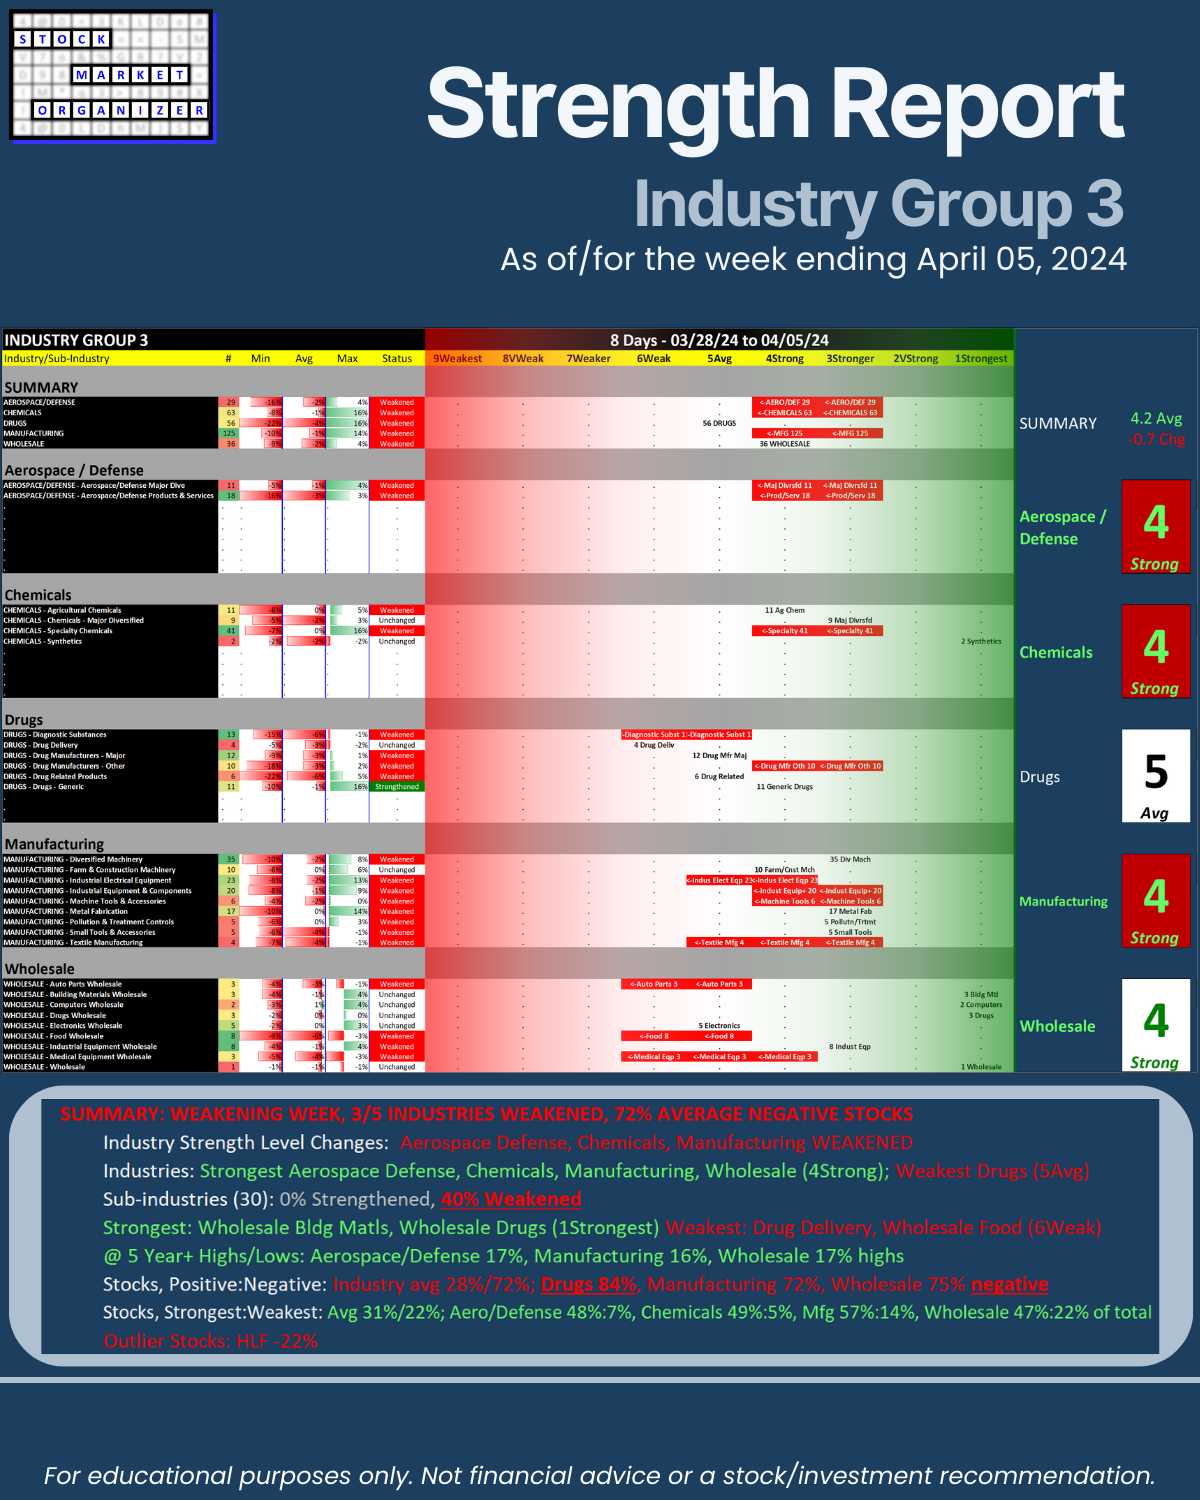
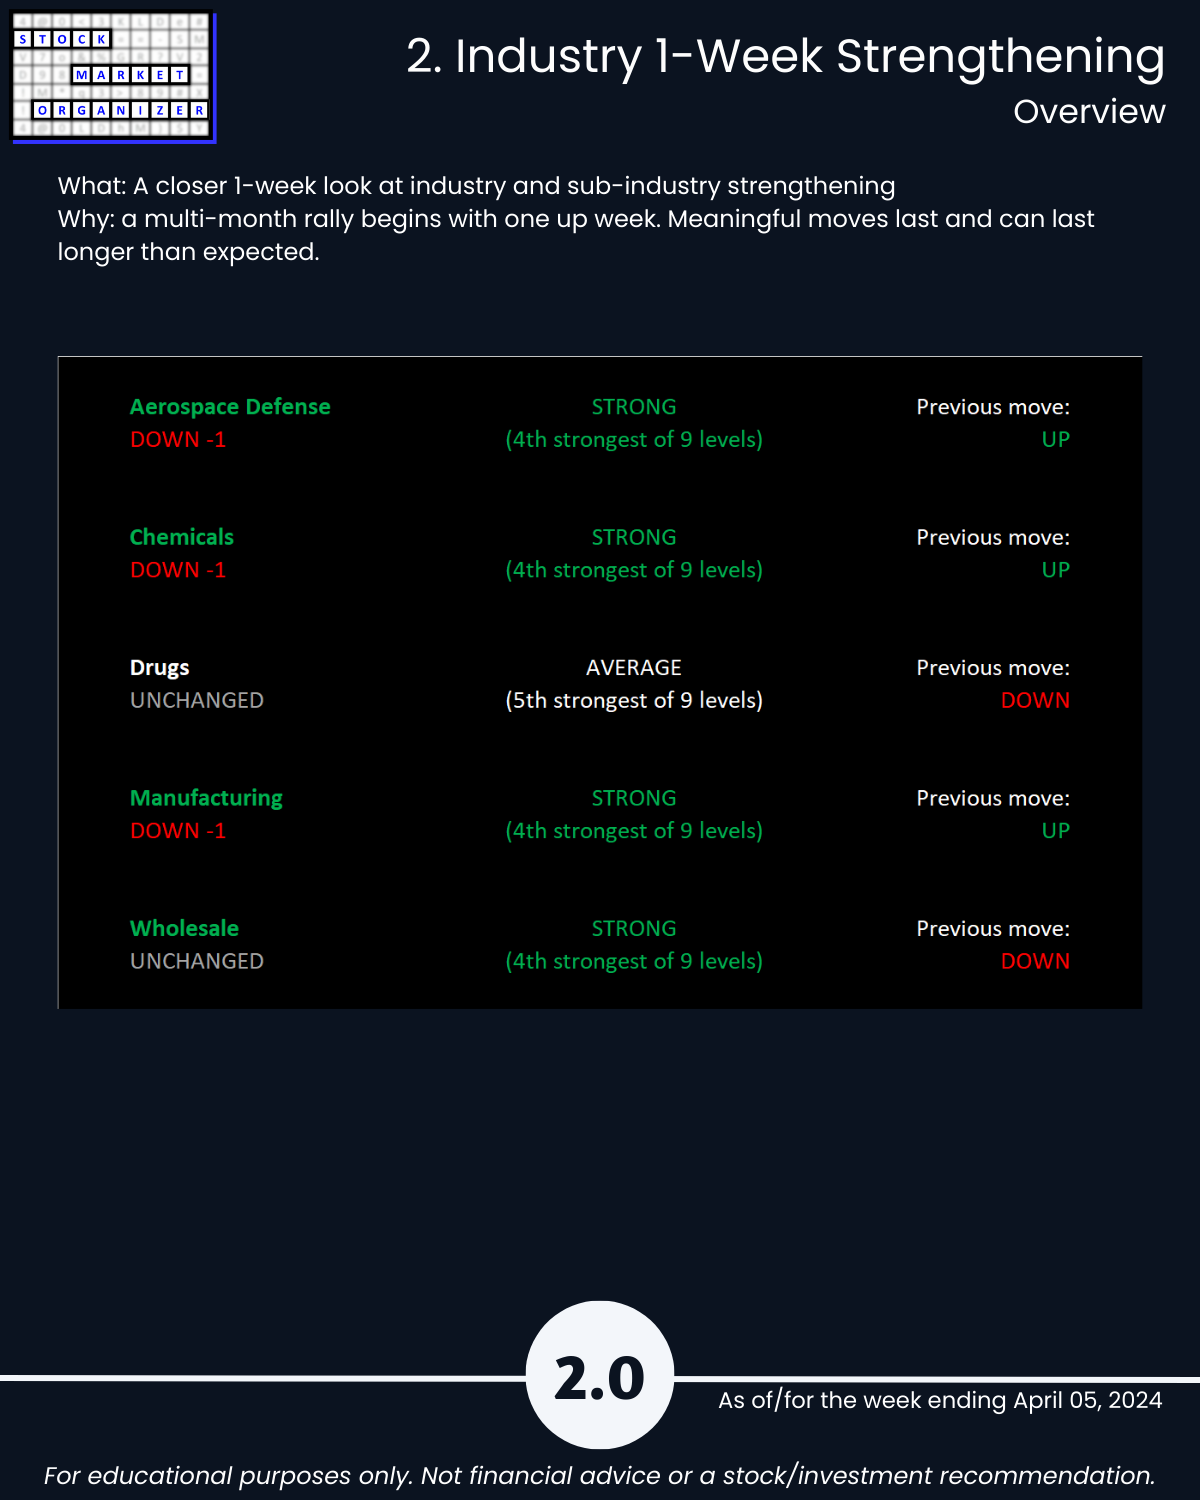
SUMMARY: WEAKENING WEEK, 3/5 INDUSTRIES WEAKENED, 72% AVERAGE NEGATIVE STOCKS
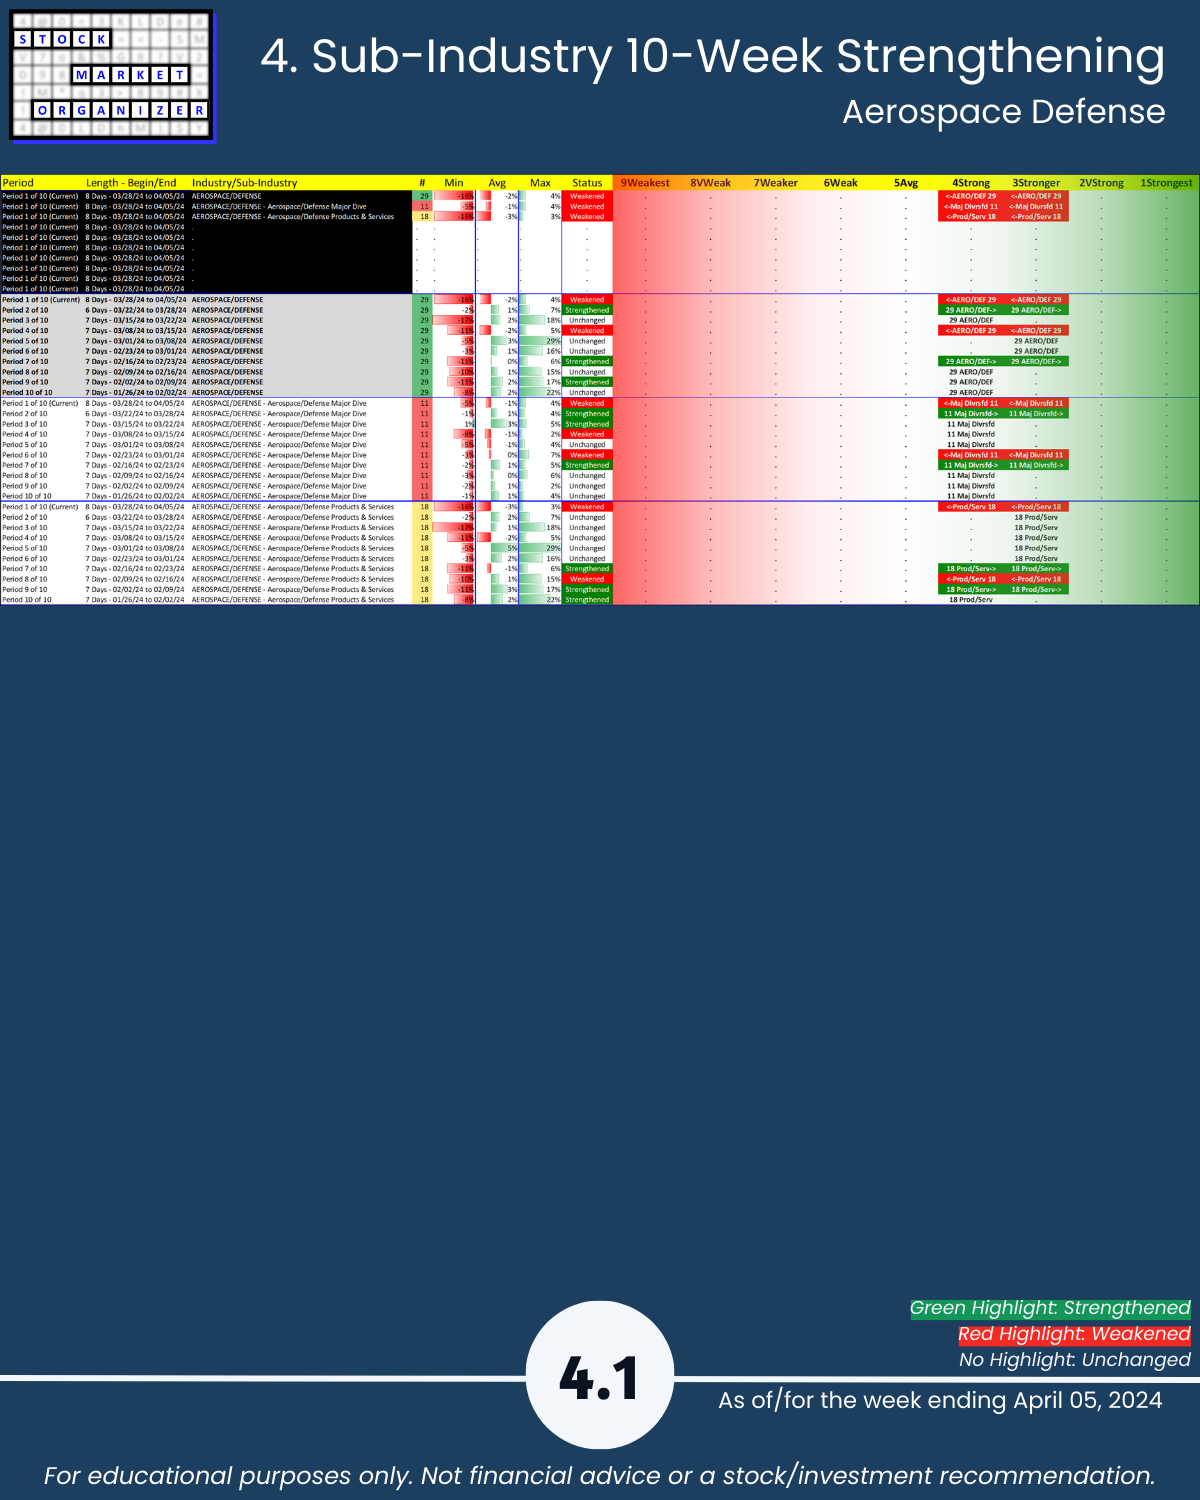
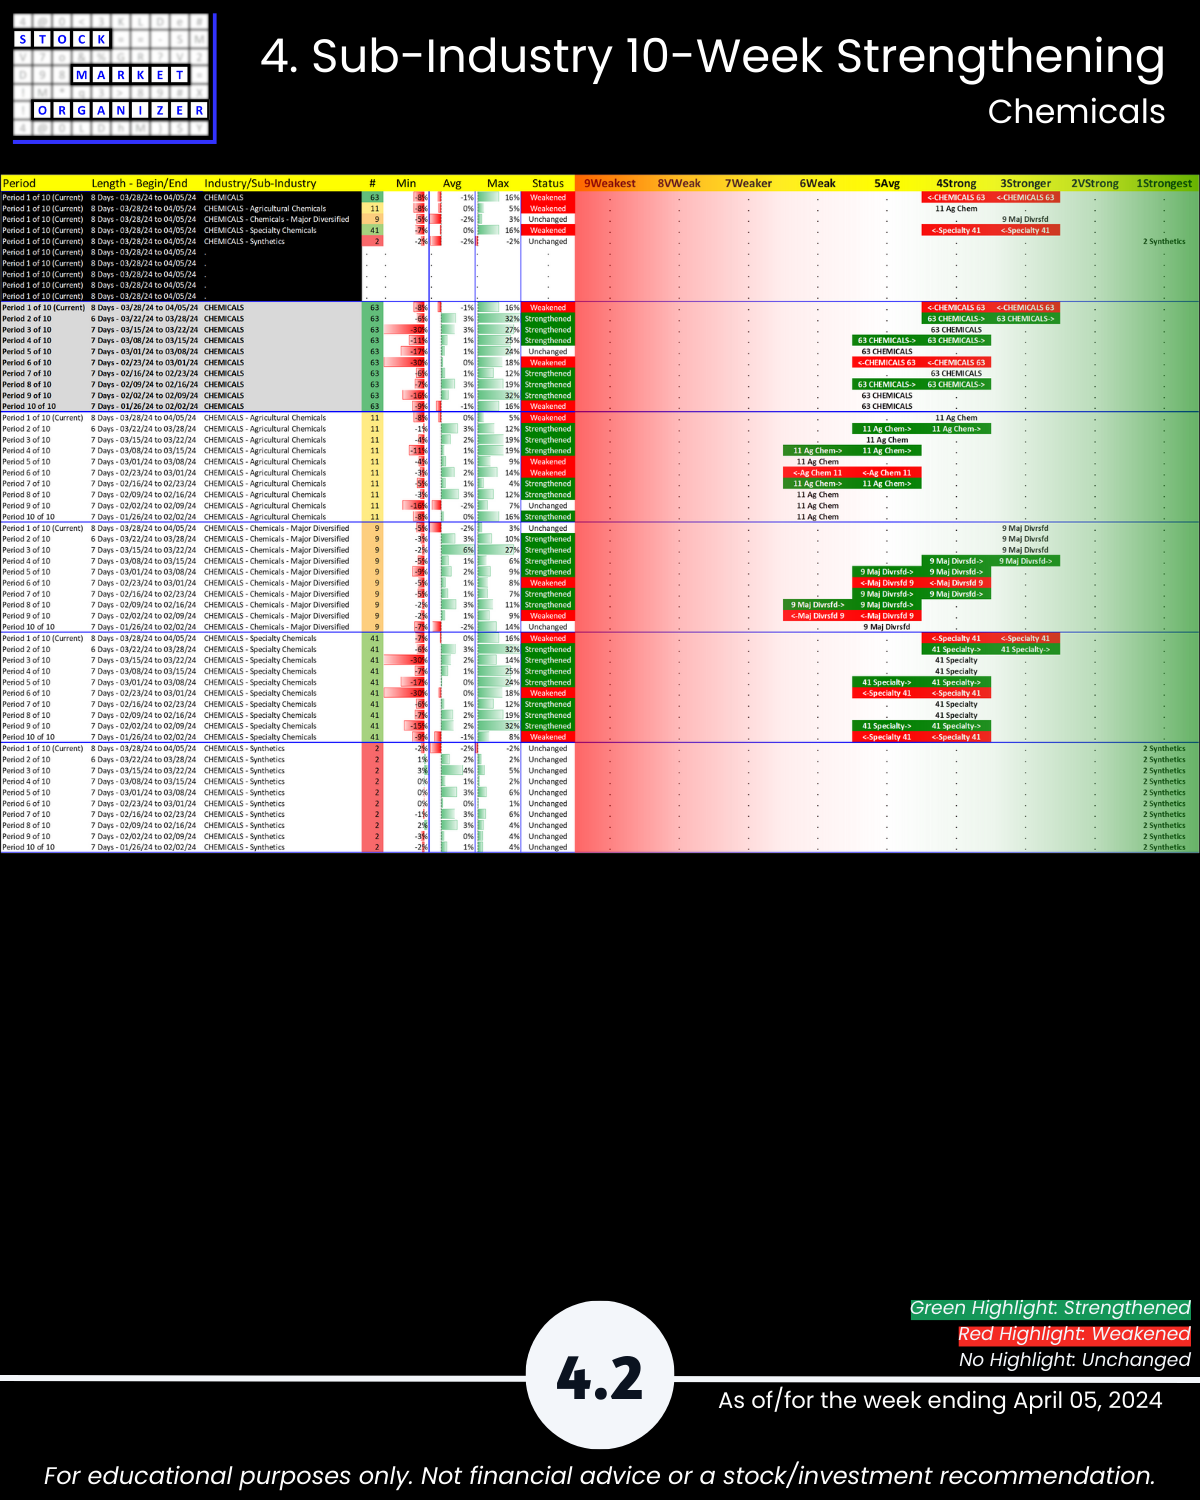
🔹 Industry Strength Level Changes: Aerospace Defense, Chemicals, Manufacturing WEAKENED
🔹 Industries:
- Strongest Aerospace Defense, Chemicals, Manufacturing, Wholesale (4Strong)
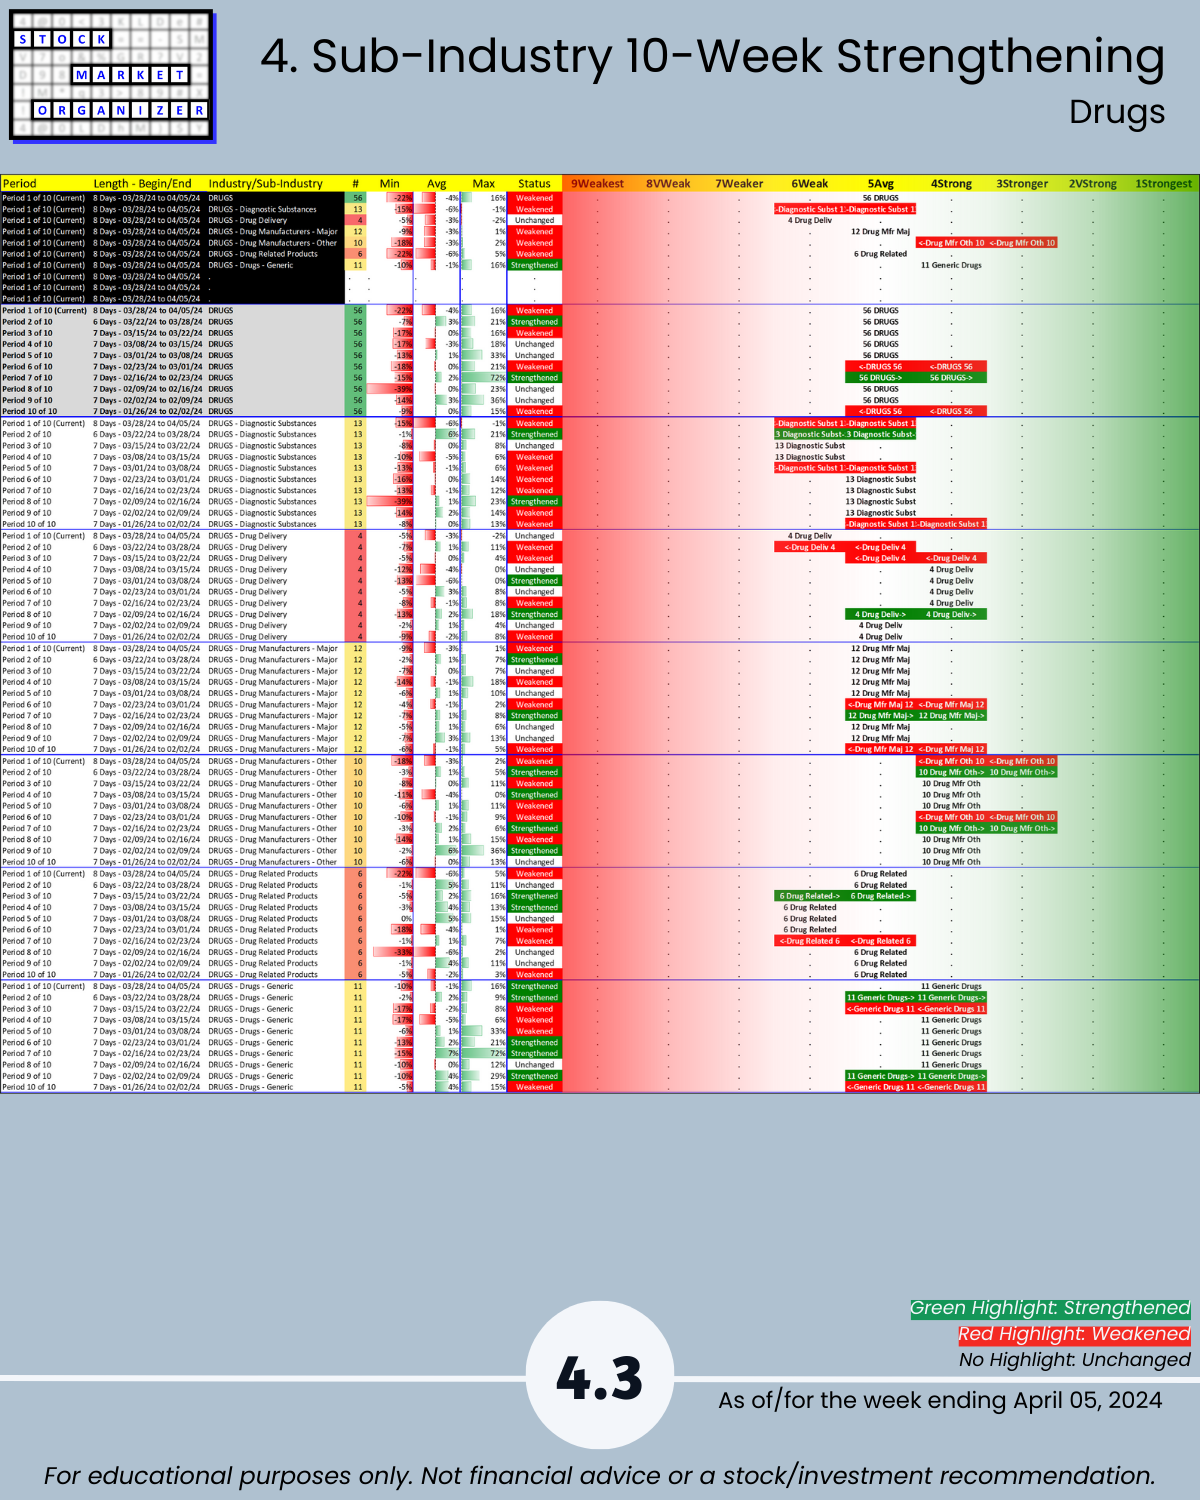
- Weakest Drugs (5Avg)
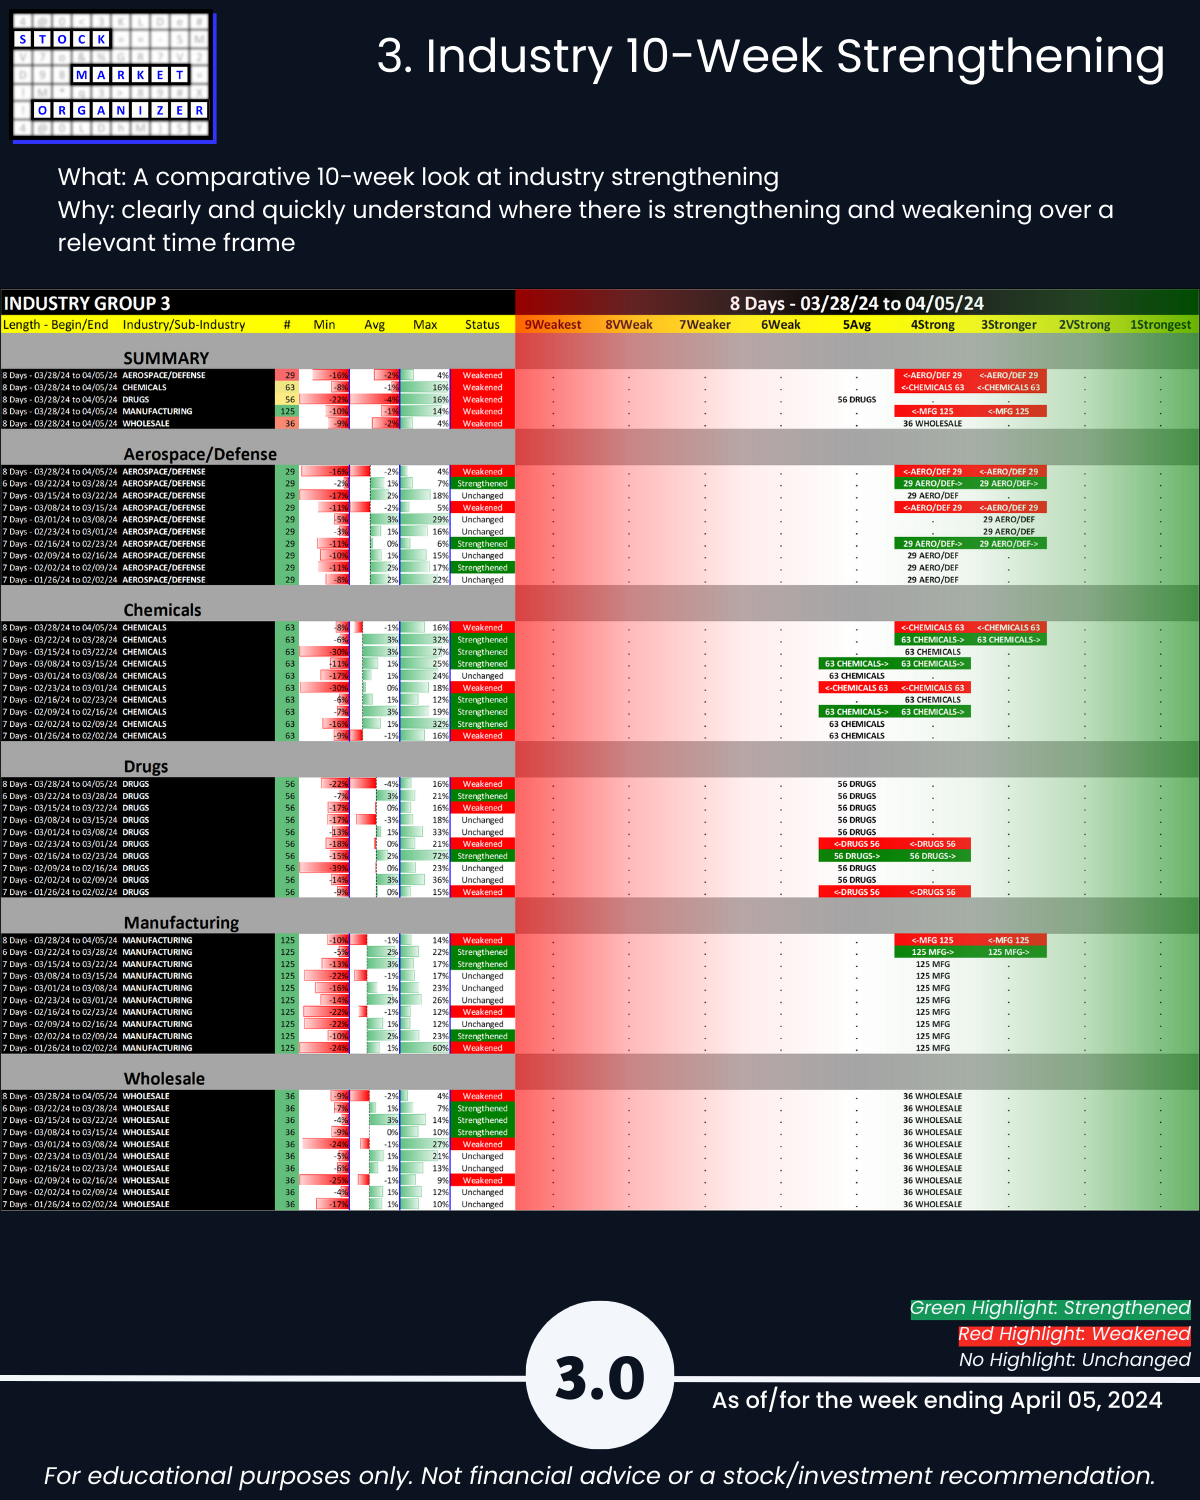
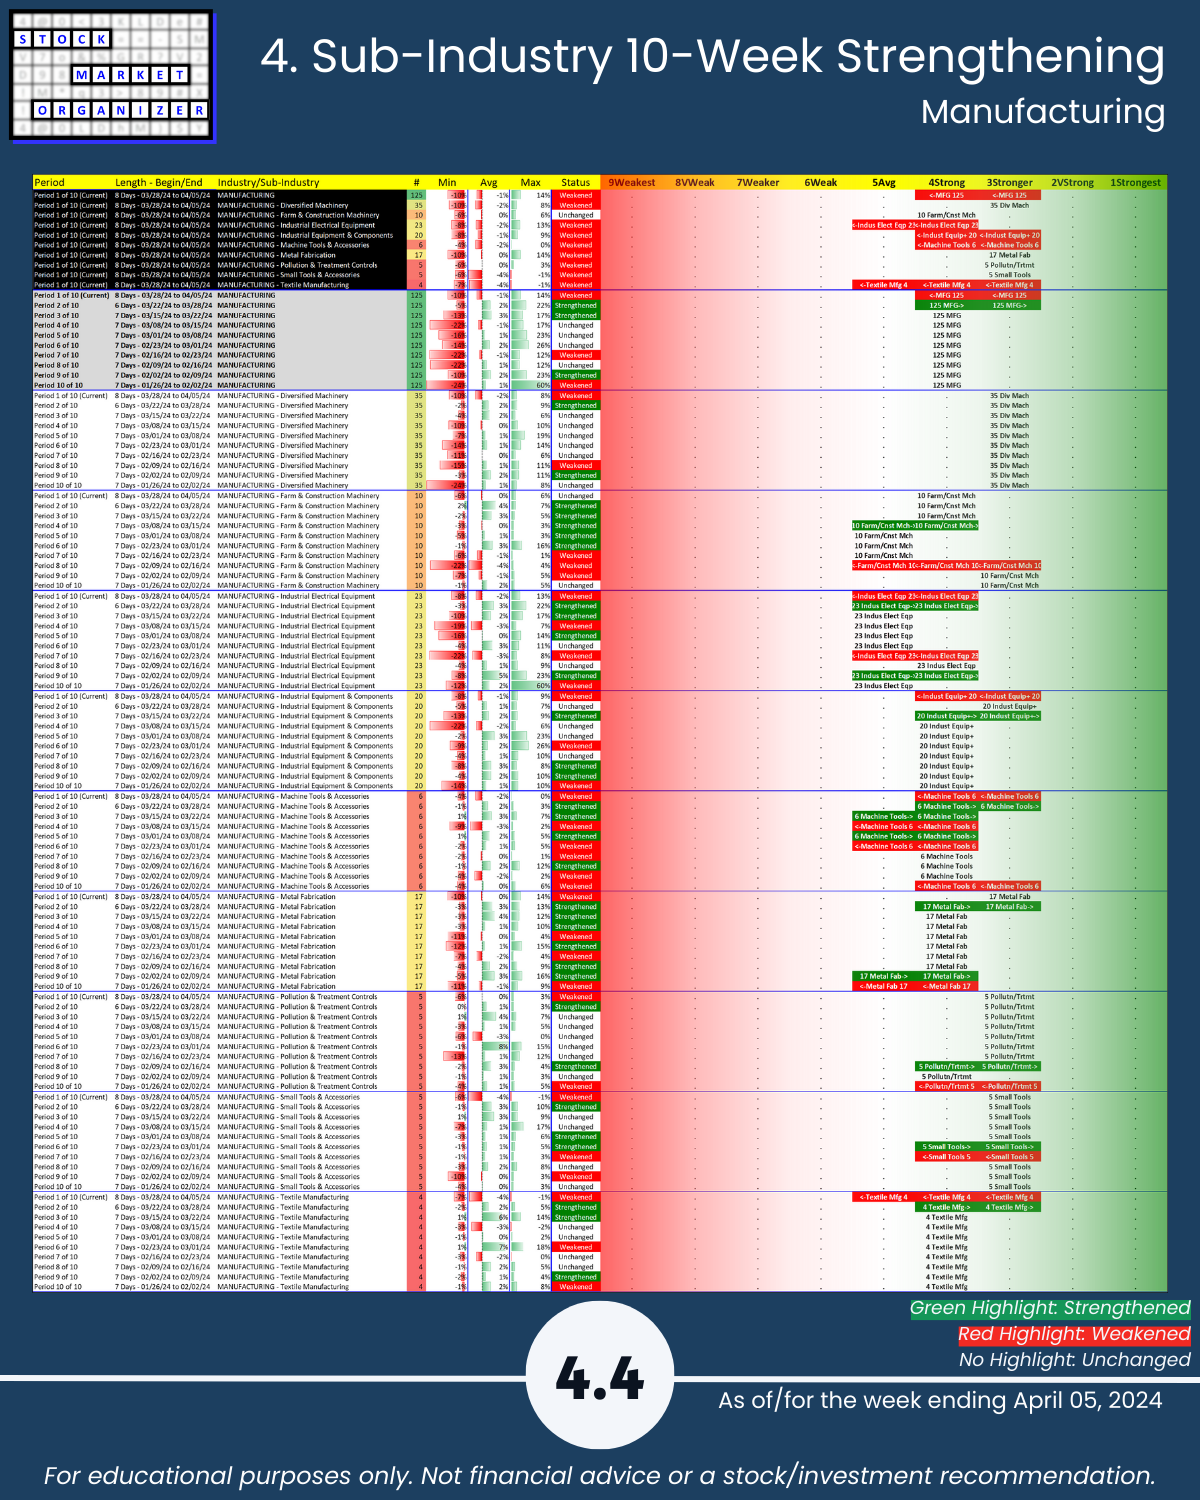
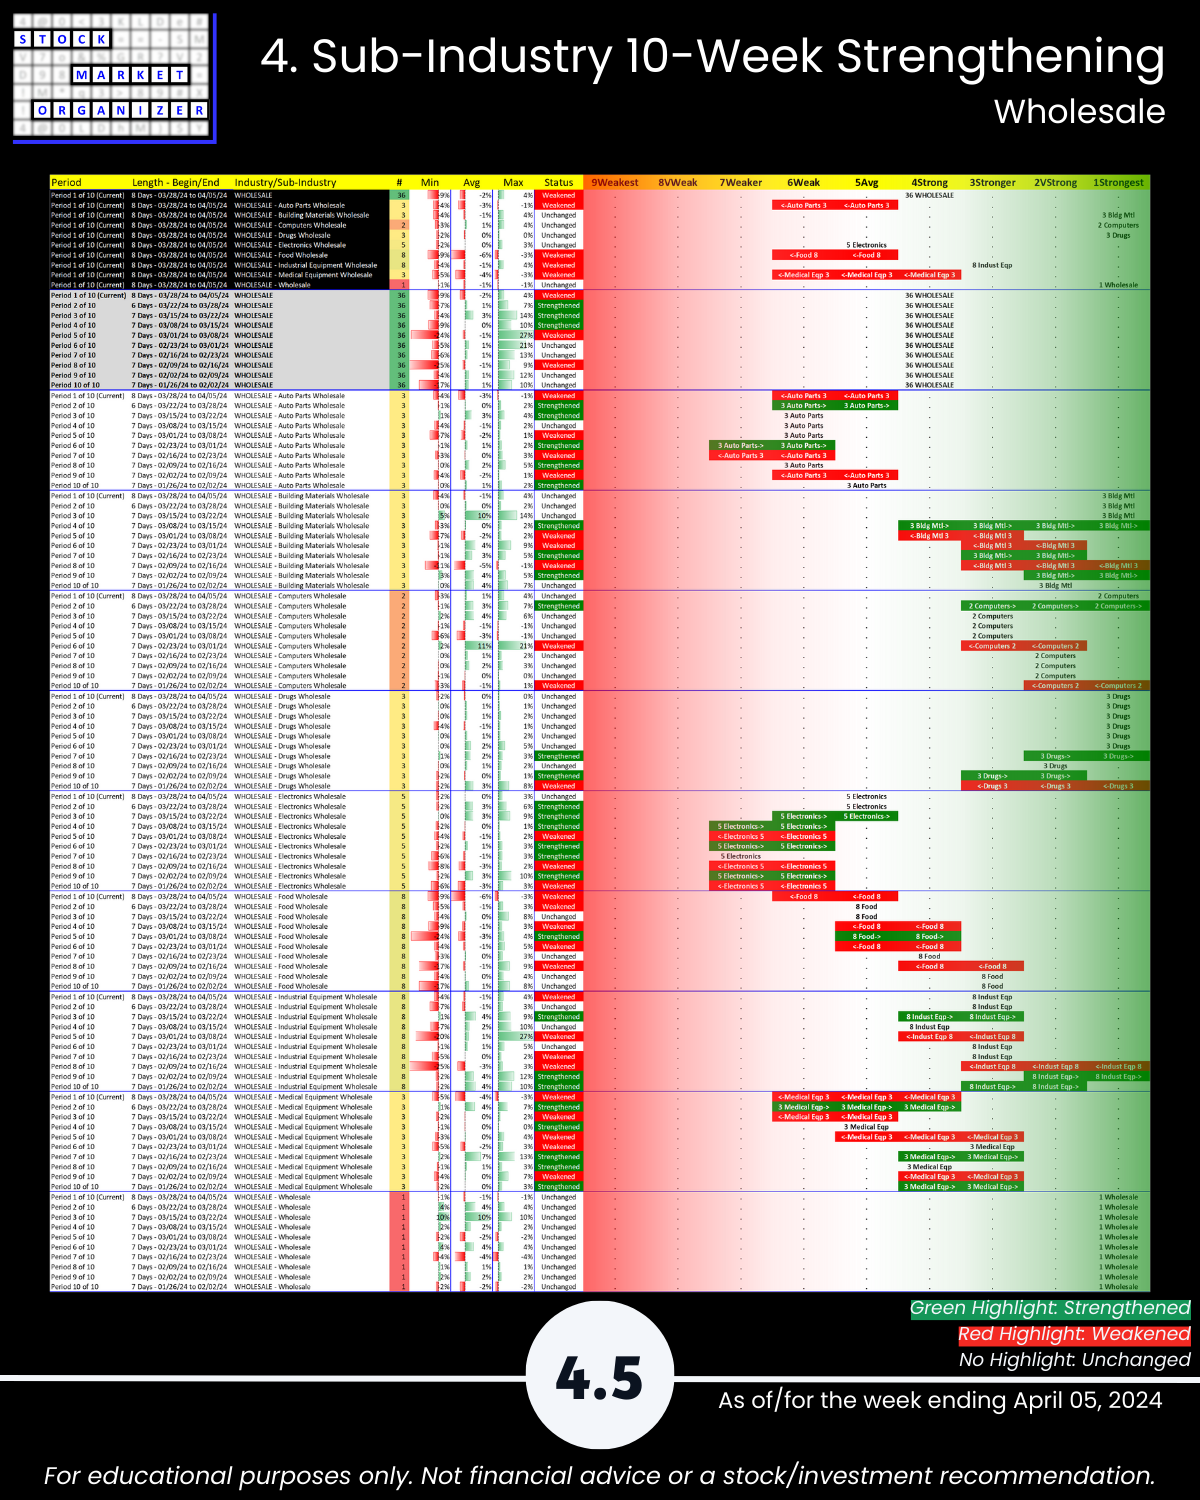
🔹 Sub-industries (30)
- 0% Strengthened, 40% Weakened
- Strongest: Wholesale Bldg Matls, Wholesale Drugs (1Strongest)
- Weakest: Drug Delivery, Wholesale Food (6Weak)
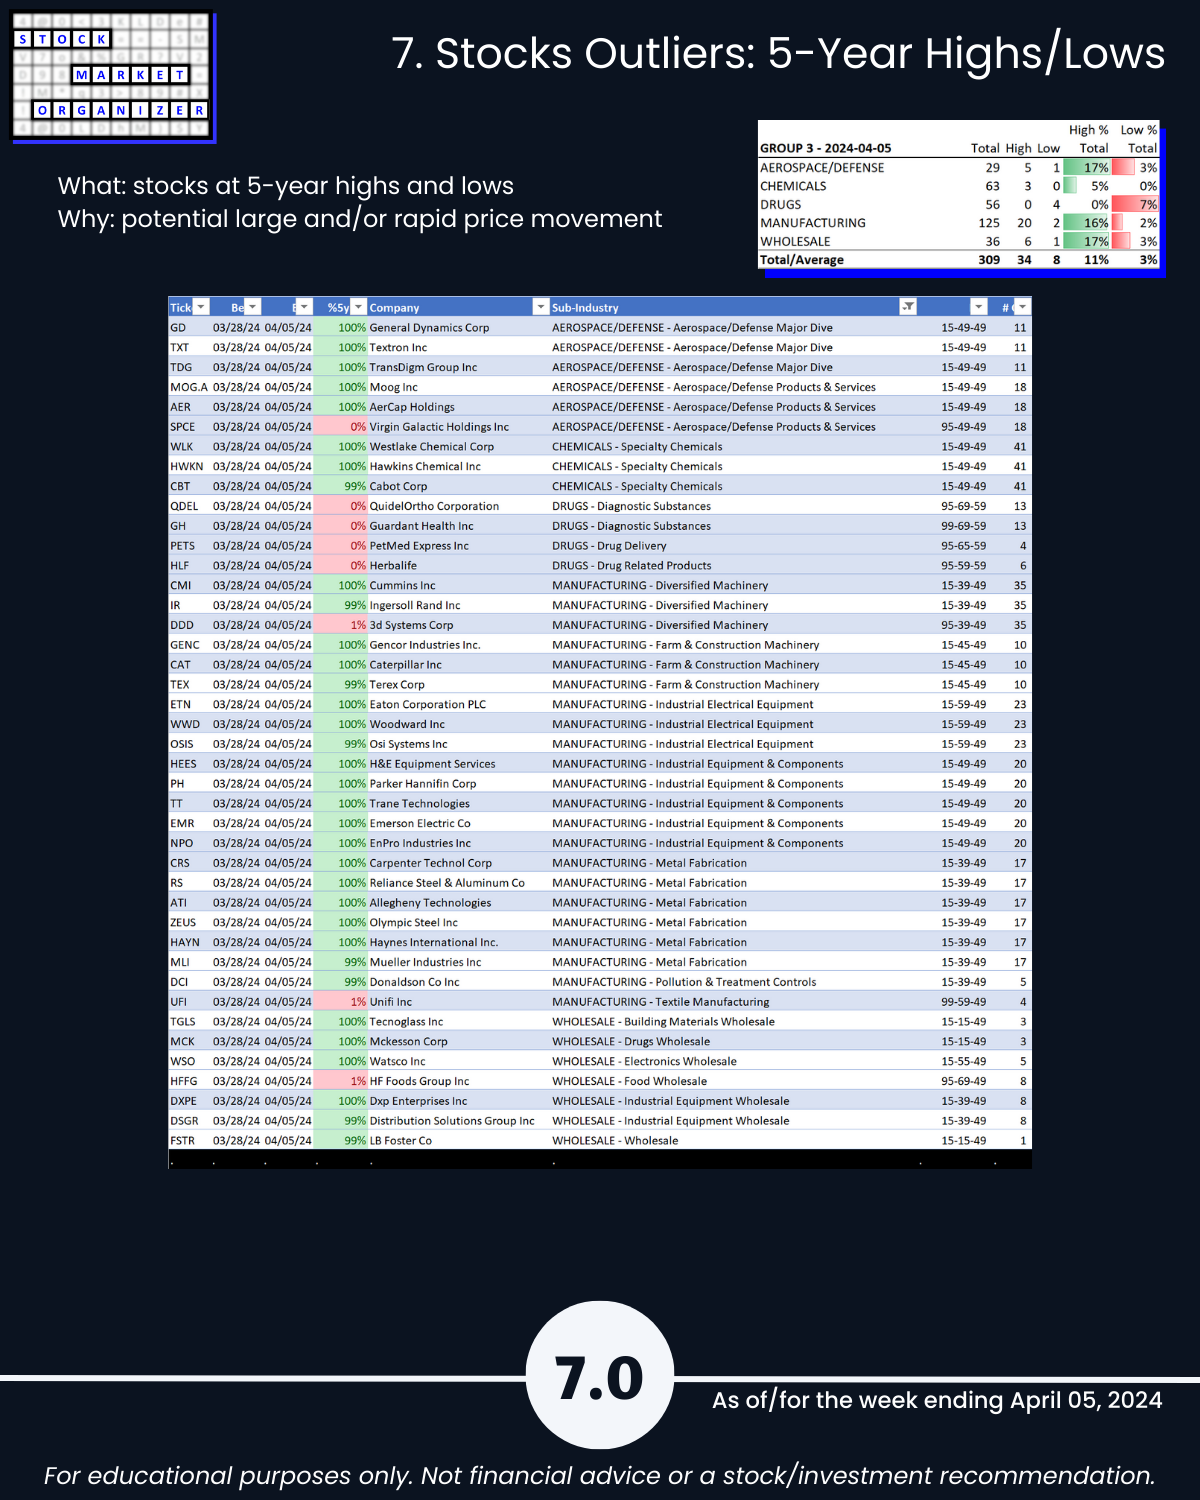
- @ 5 Year+ Highs/Lows: Aerospace/Defense 17%, Manufacturing 16%, Wholesale 17% highs
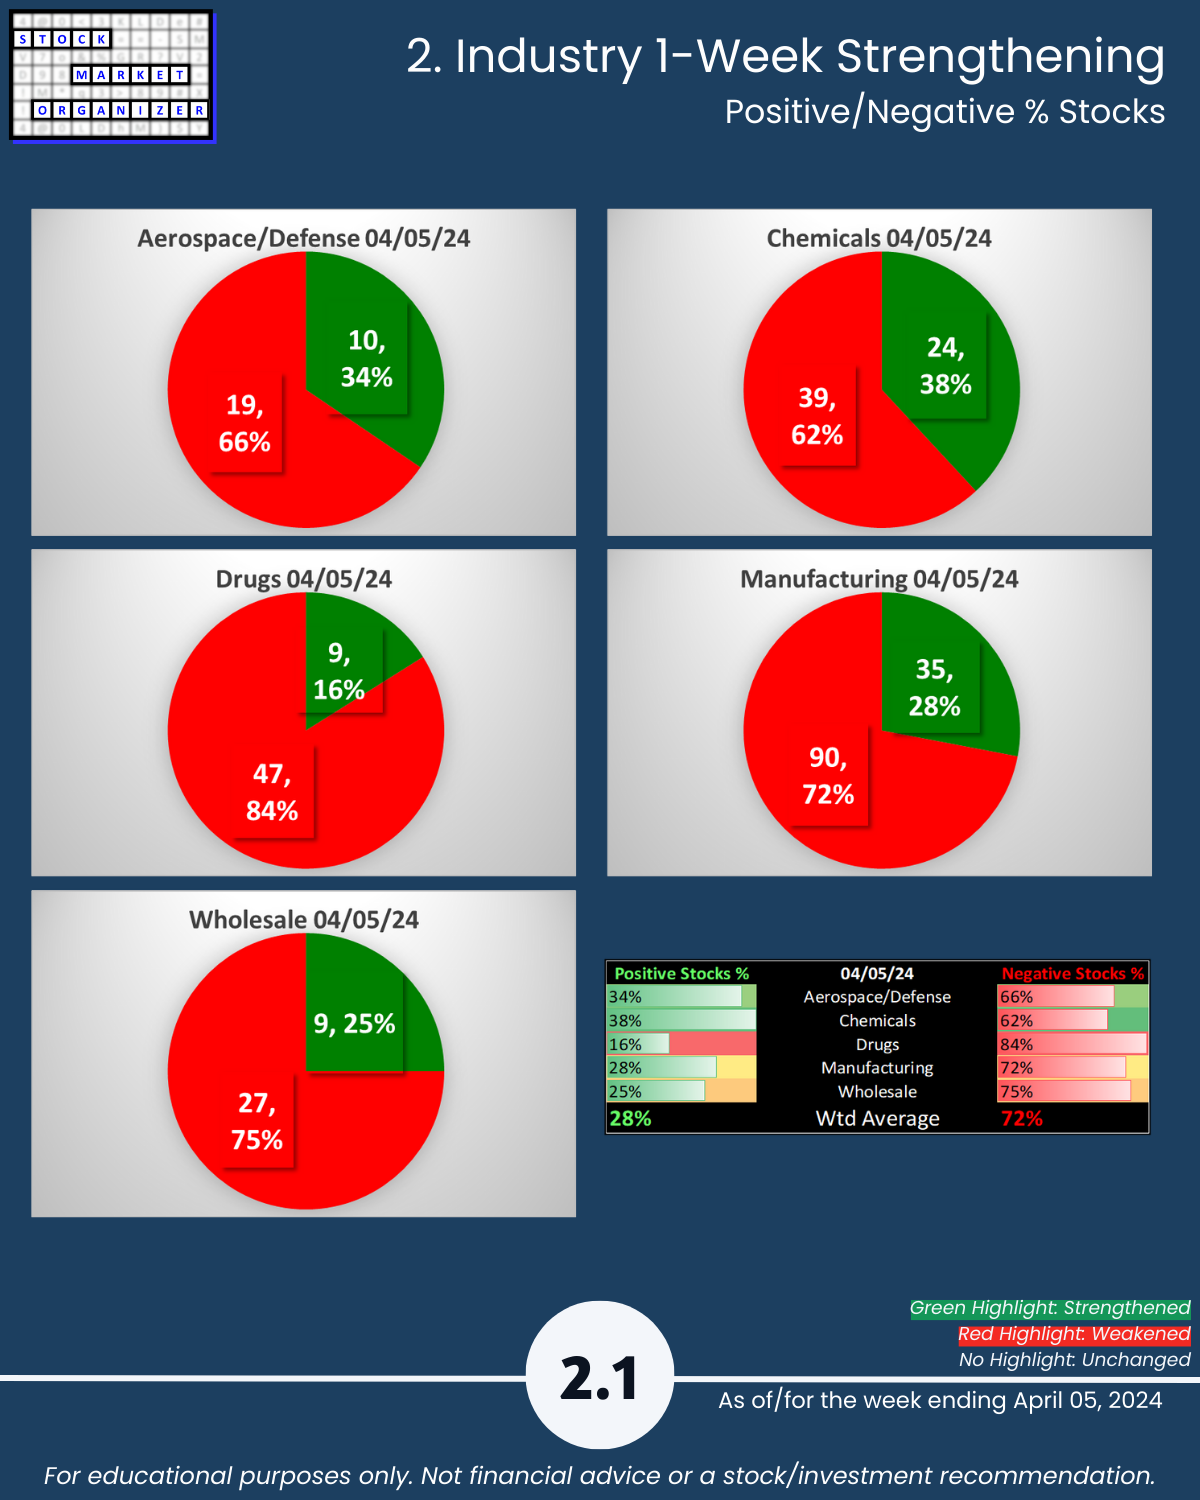
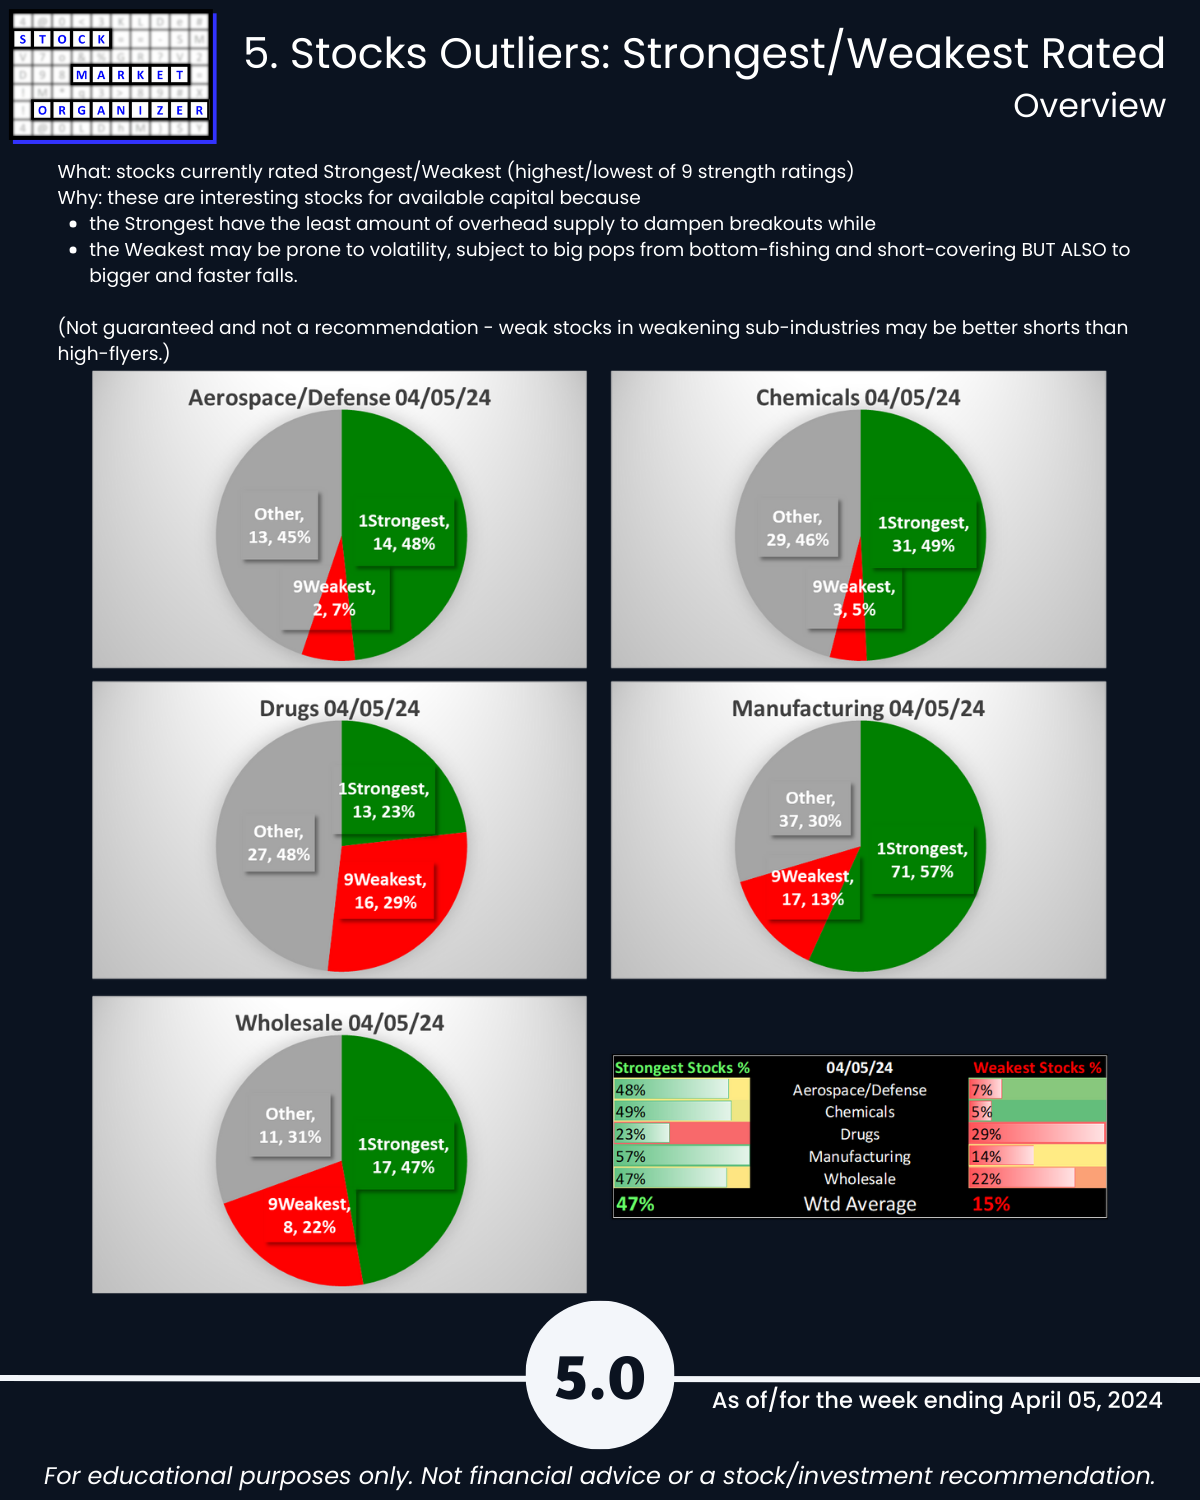
🔹 Stocks
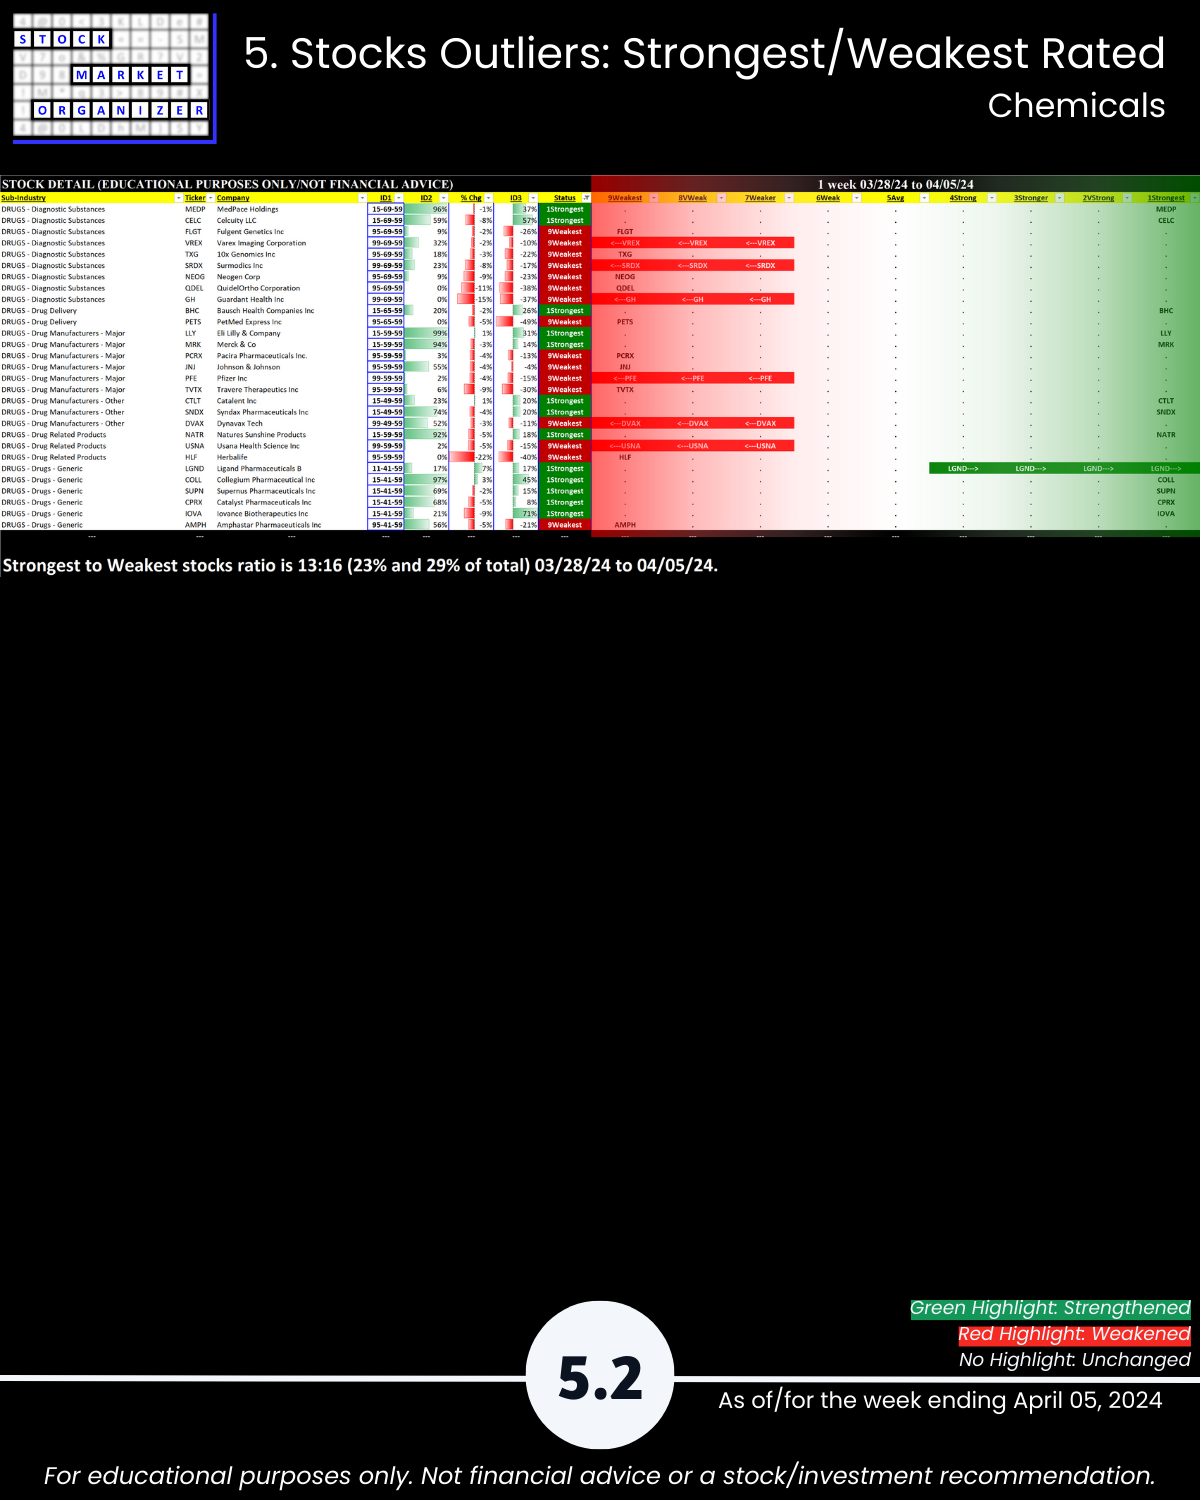
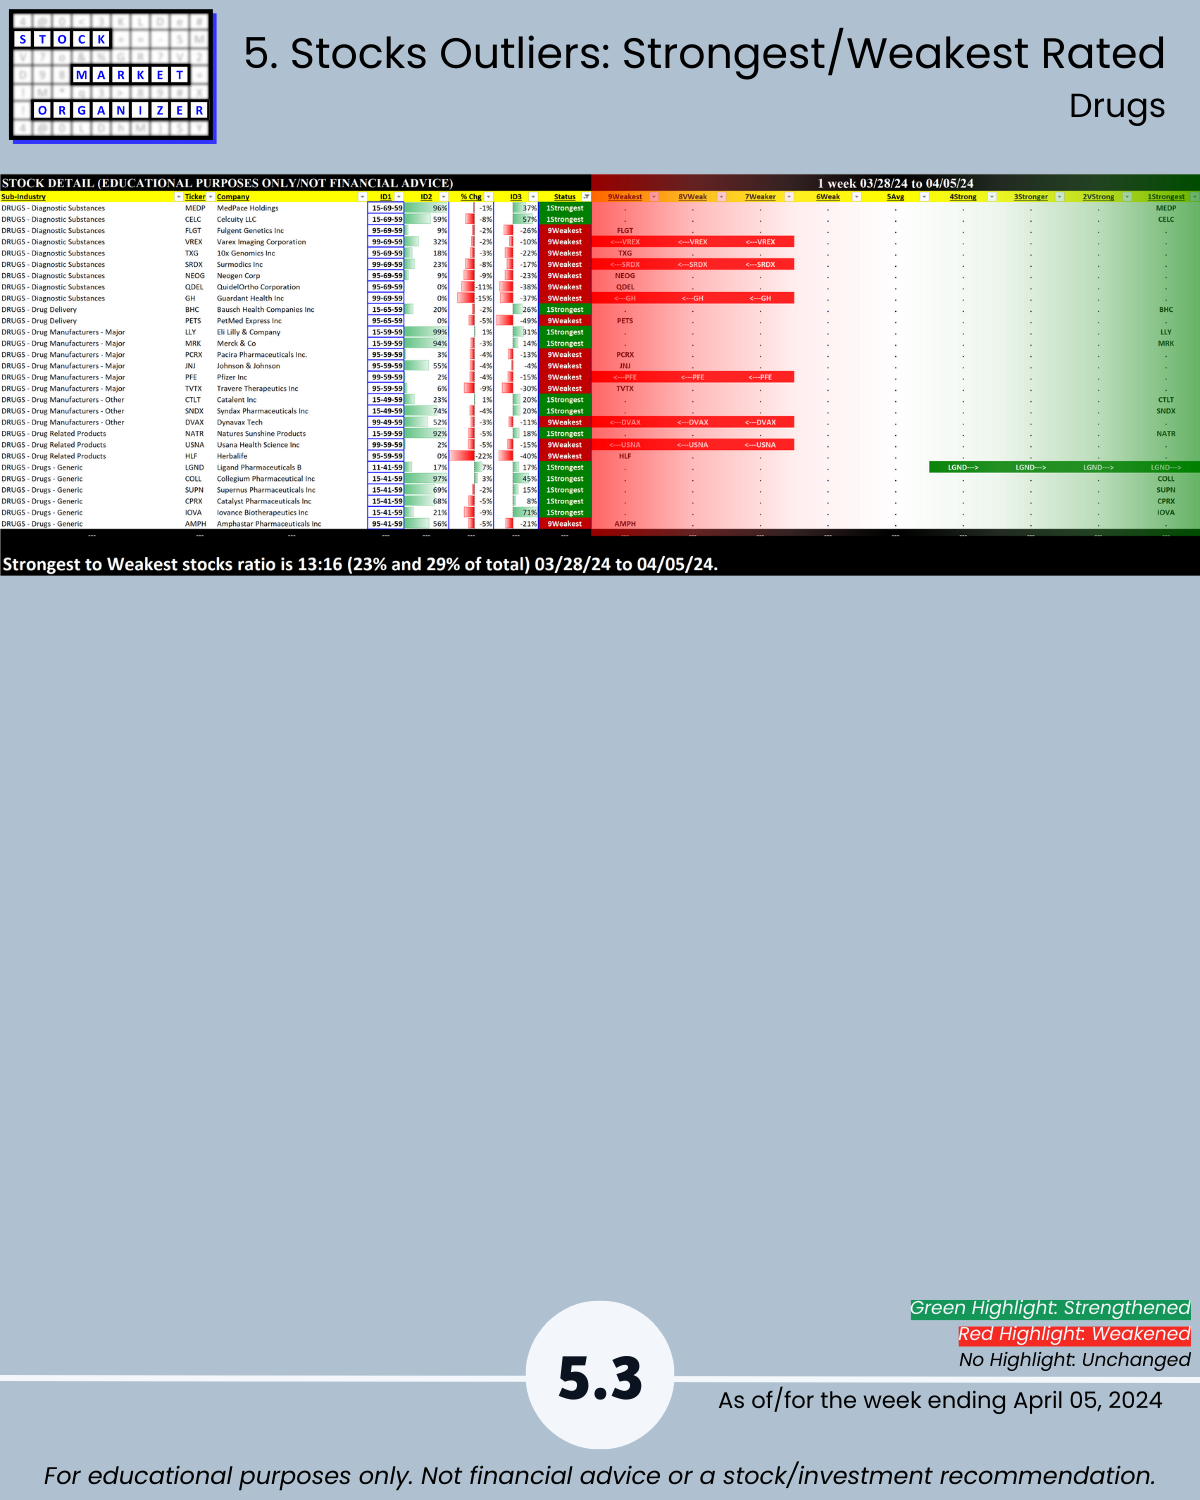
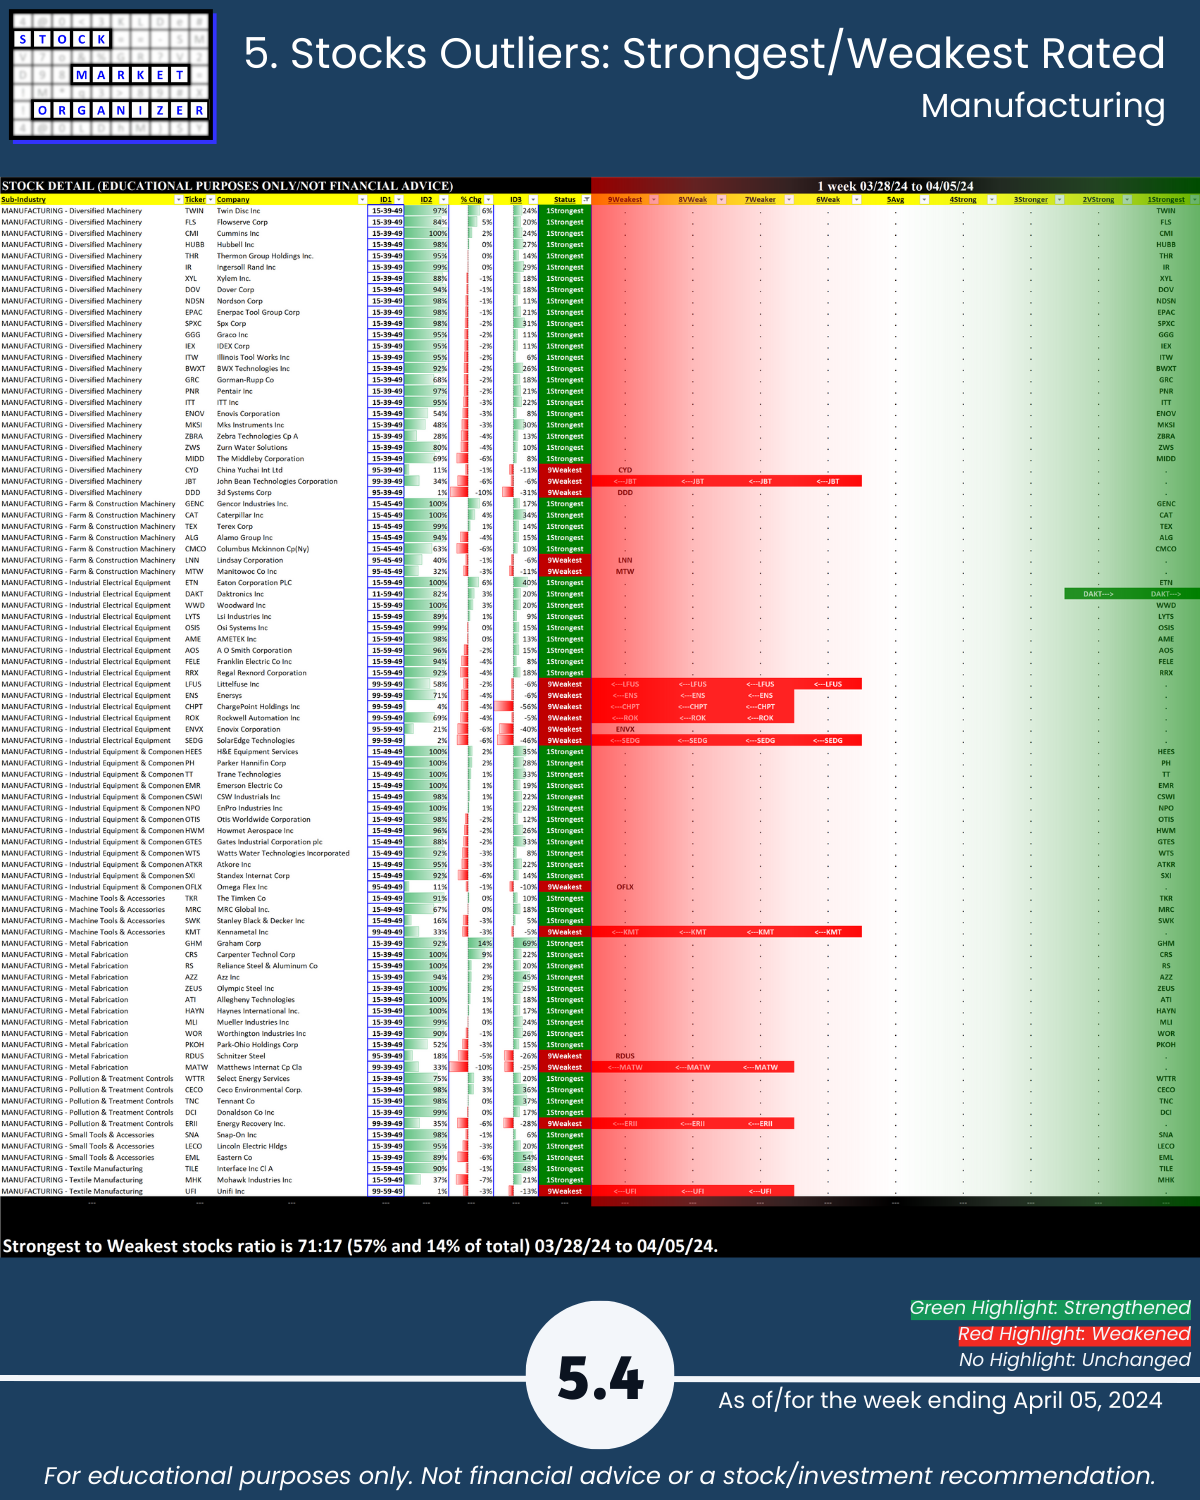
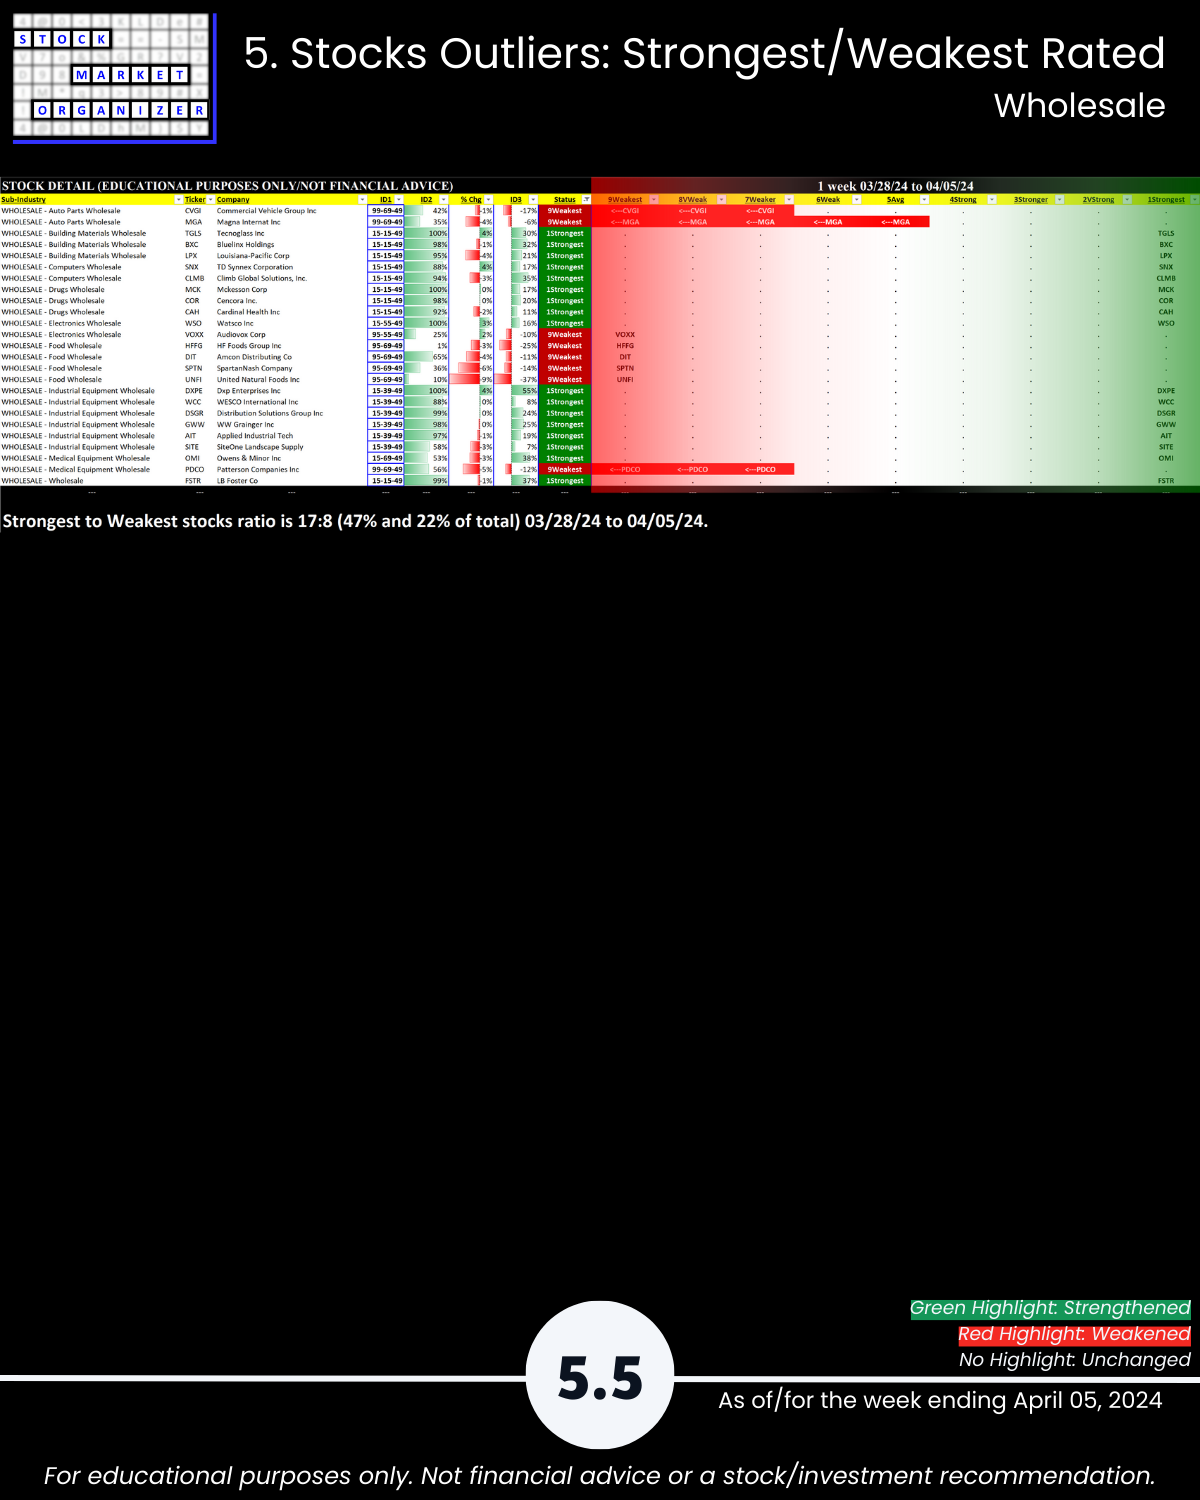
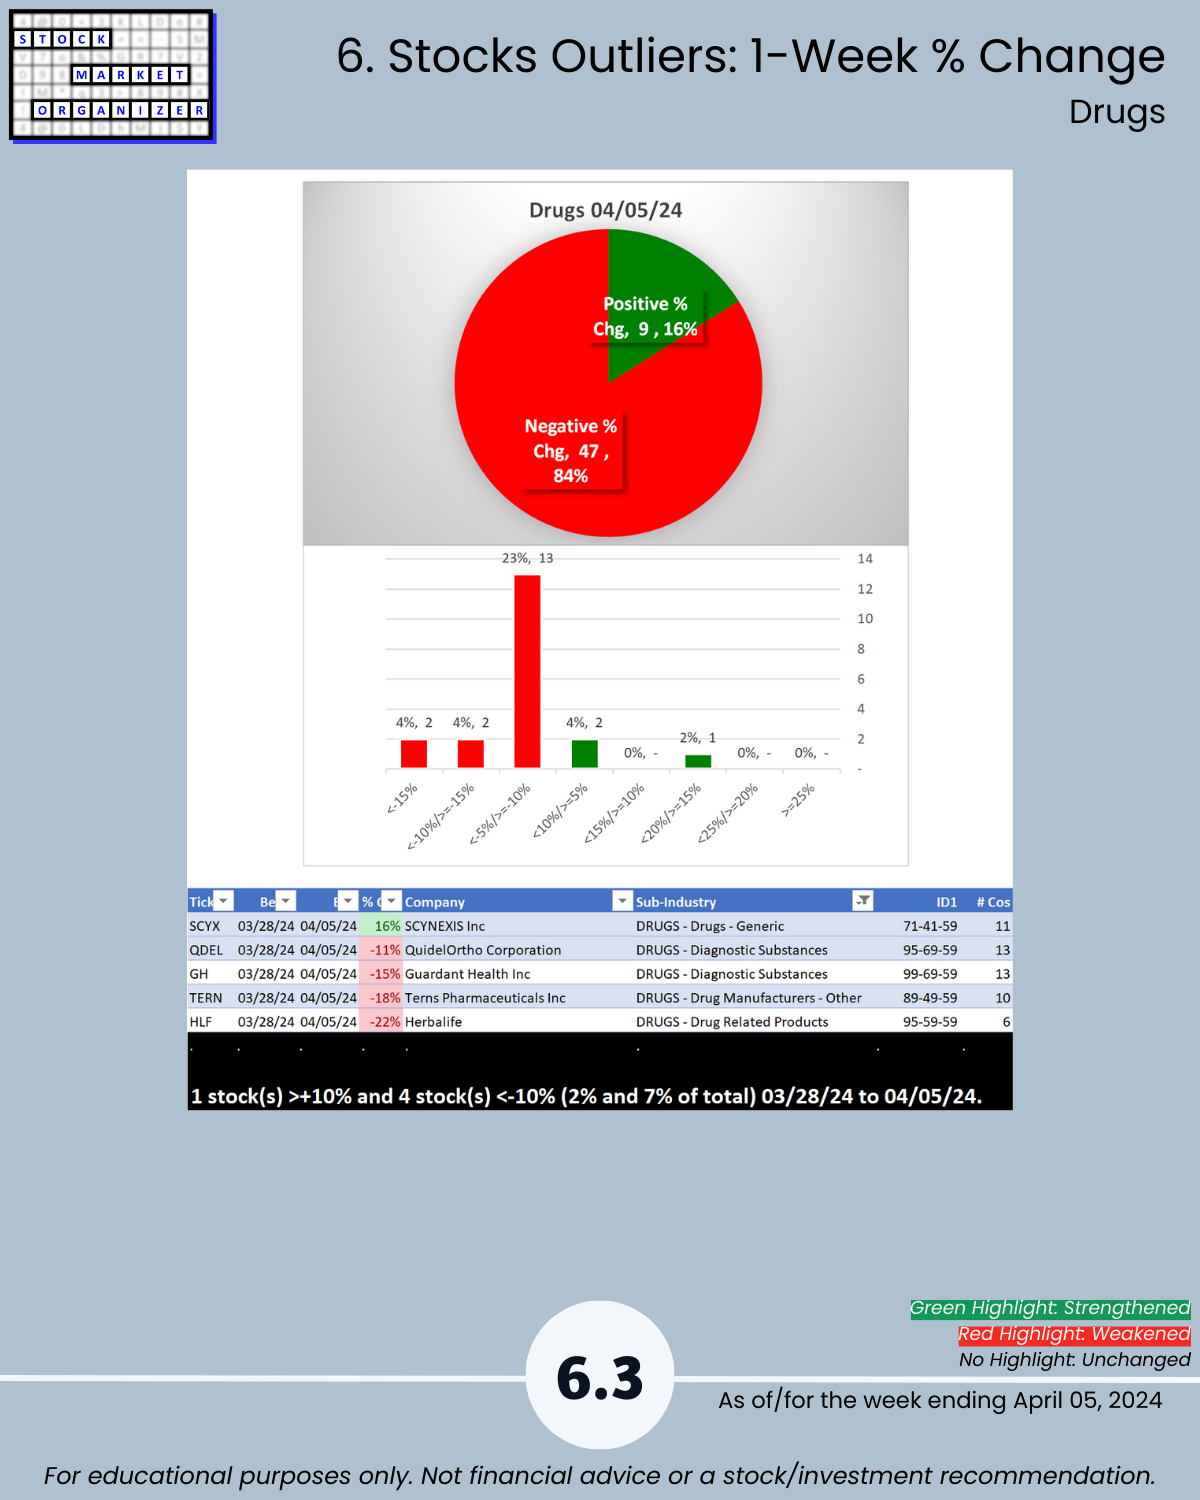
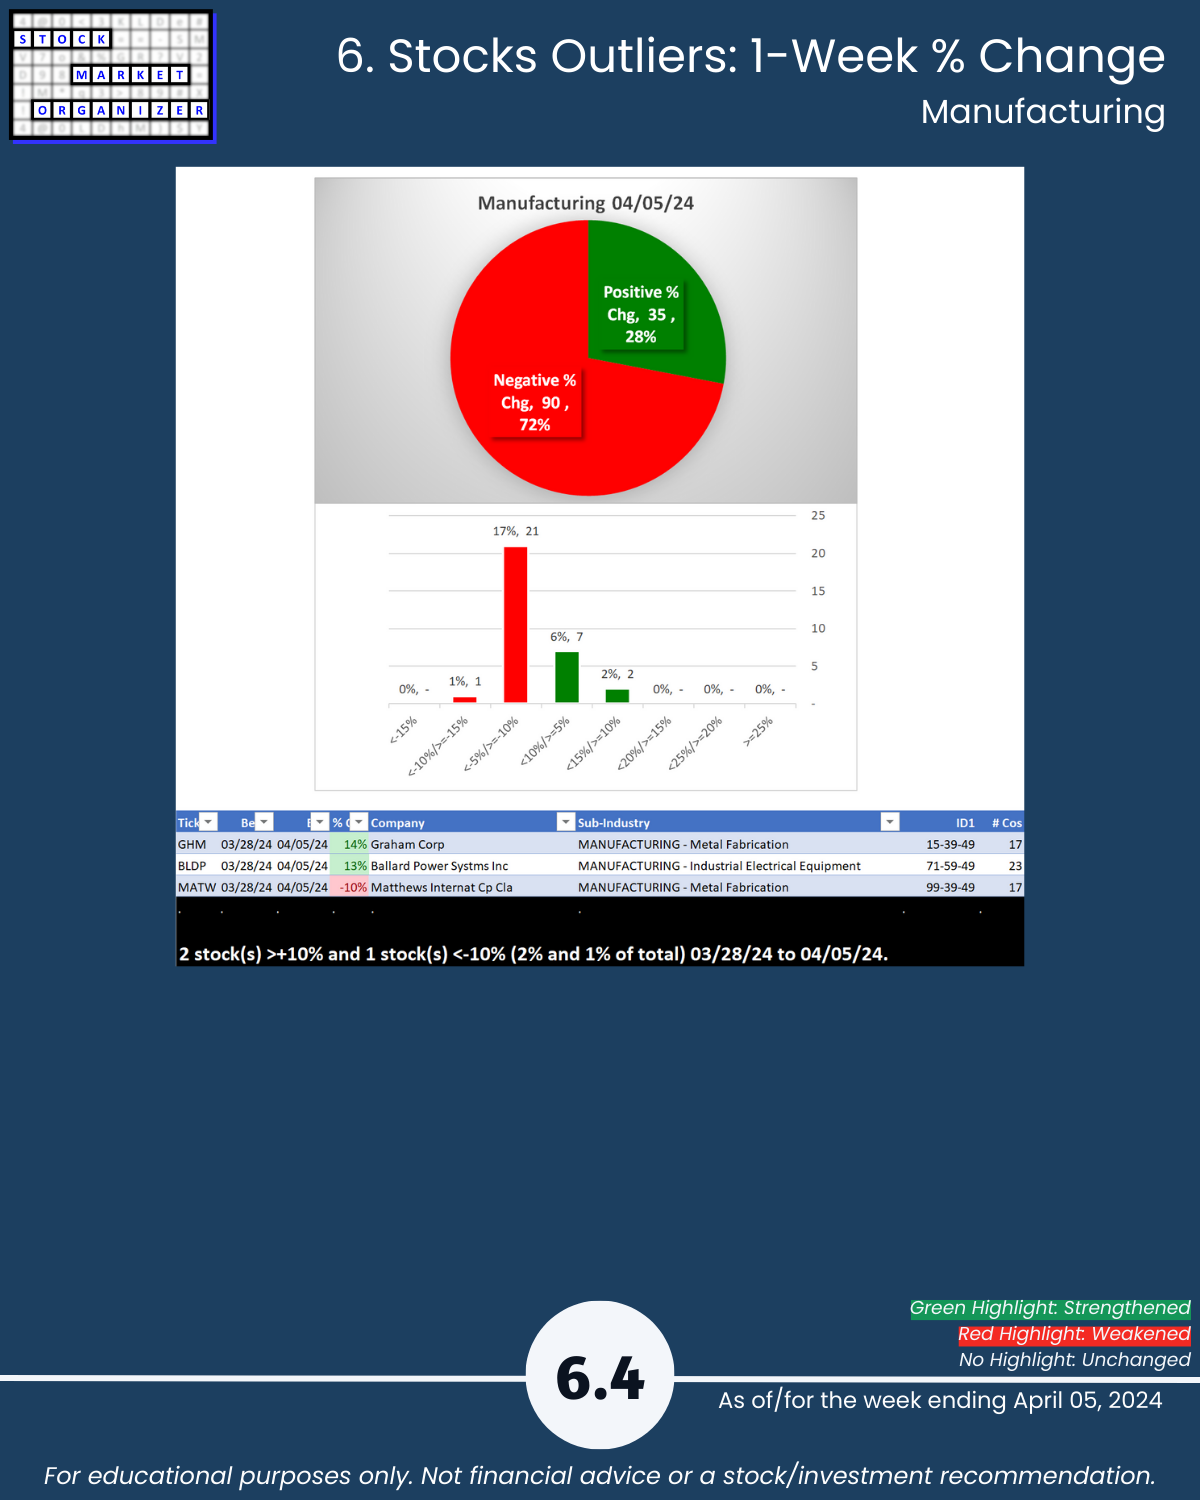
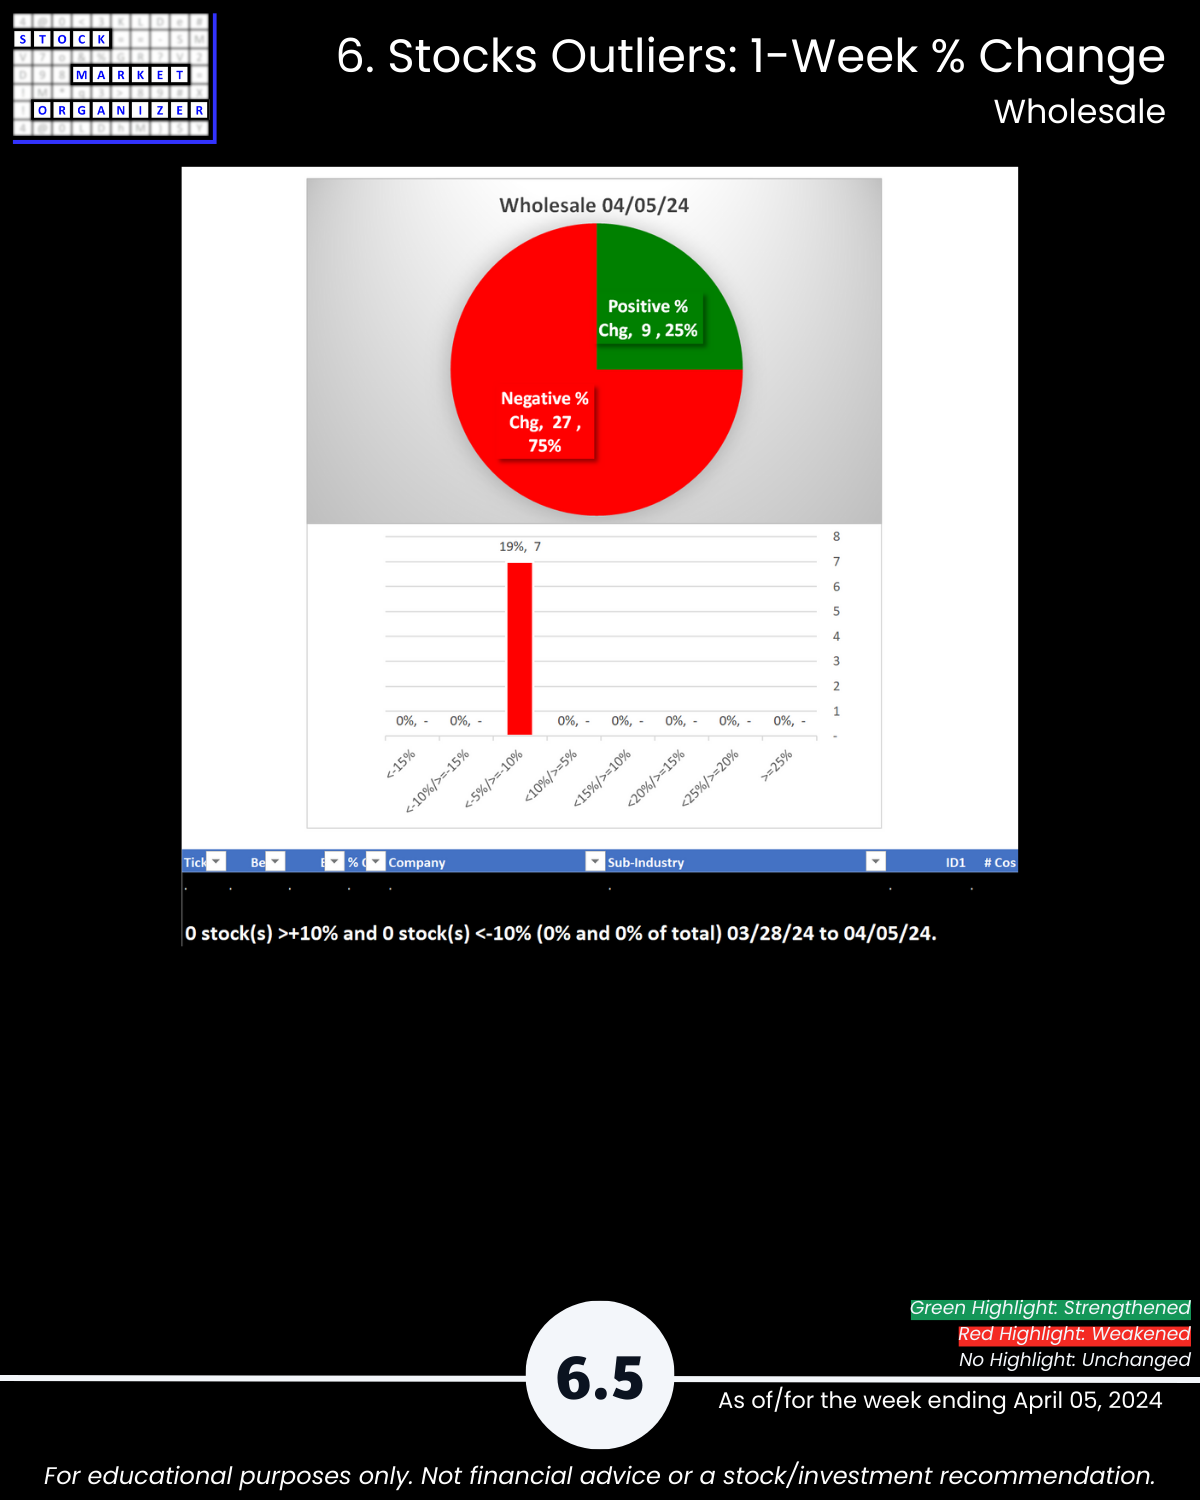
- Positive:Negative: Industry avg 28%/72%; Drugs 84%, Manufacturing 72%, Wholesale 75% negative
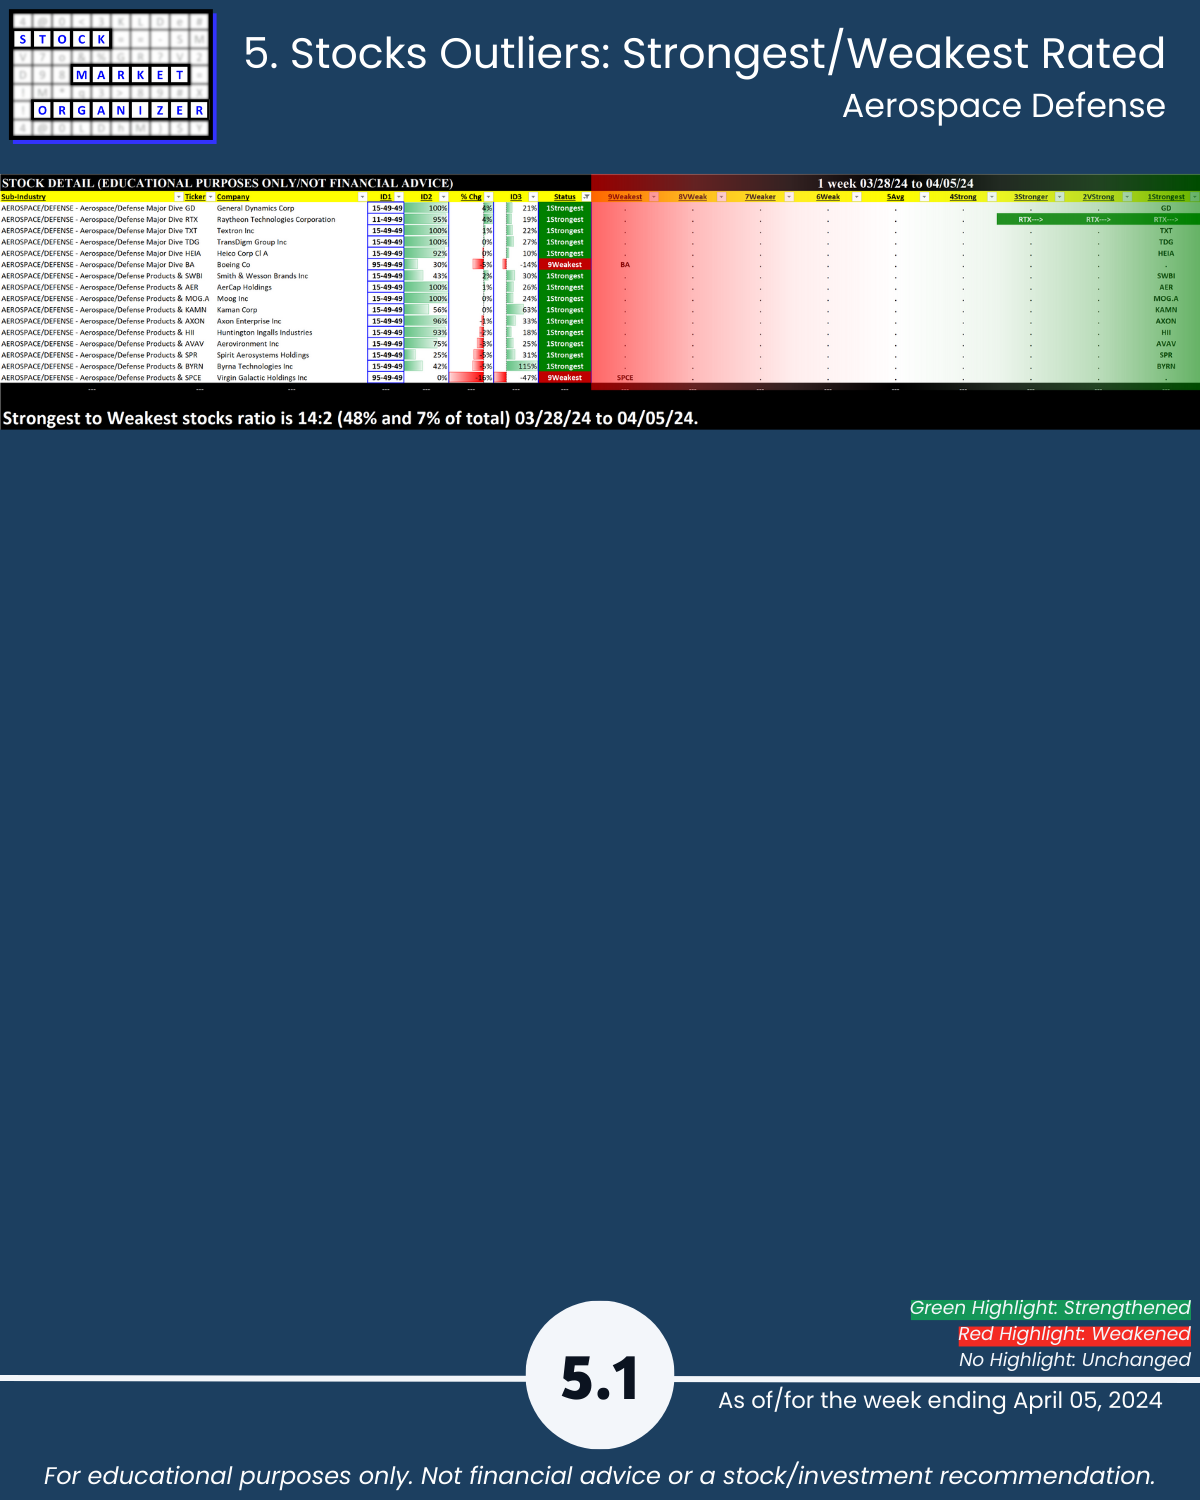
- Strongest:Weakest: Avg 31%/22%; Aero/Defense 48%:7%, Chemicals 49%:5%, Mfg 57%:14%, Wholesale 47%:22% of total
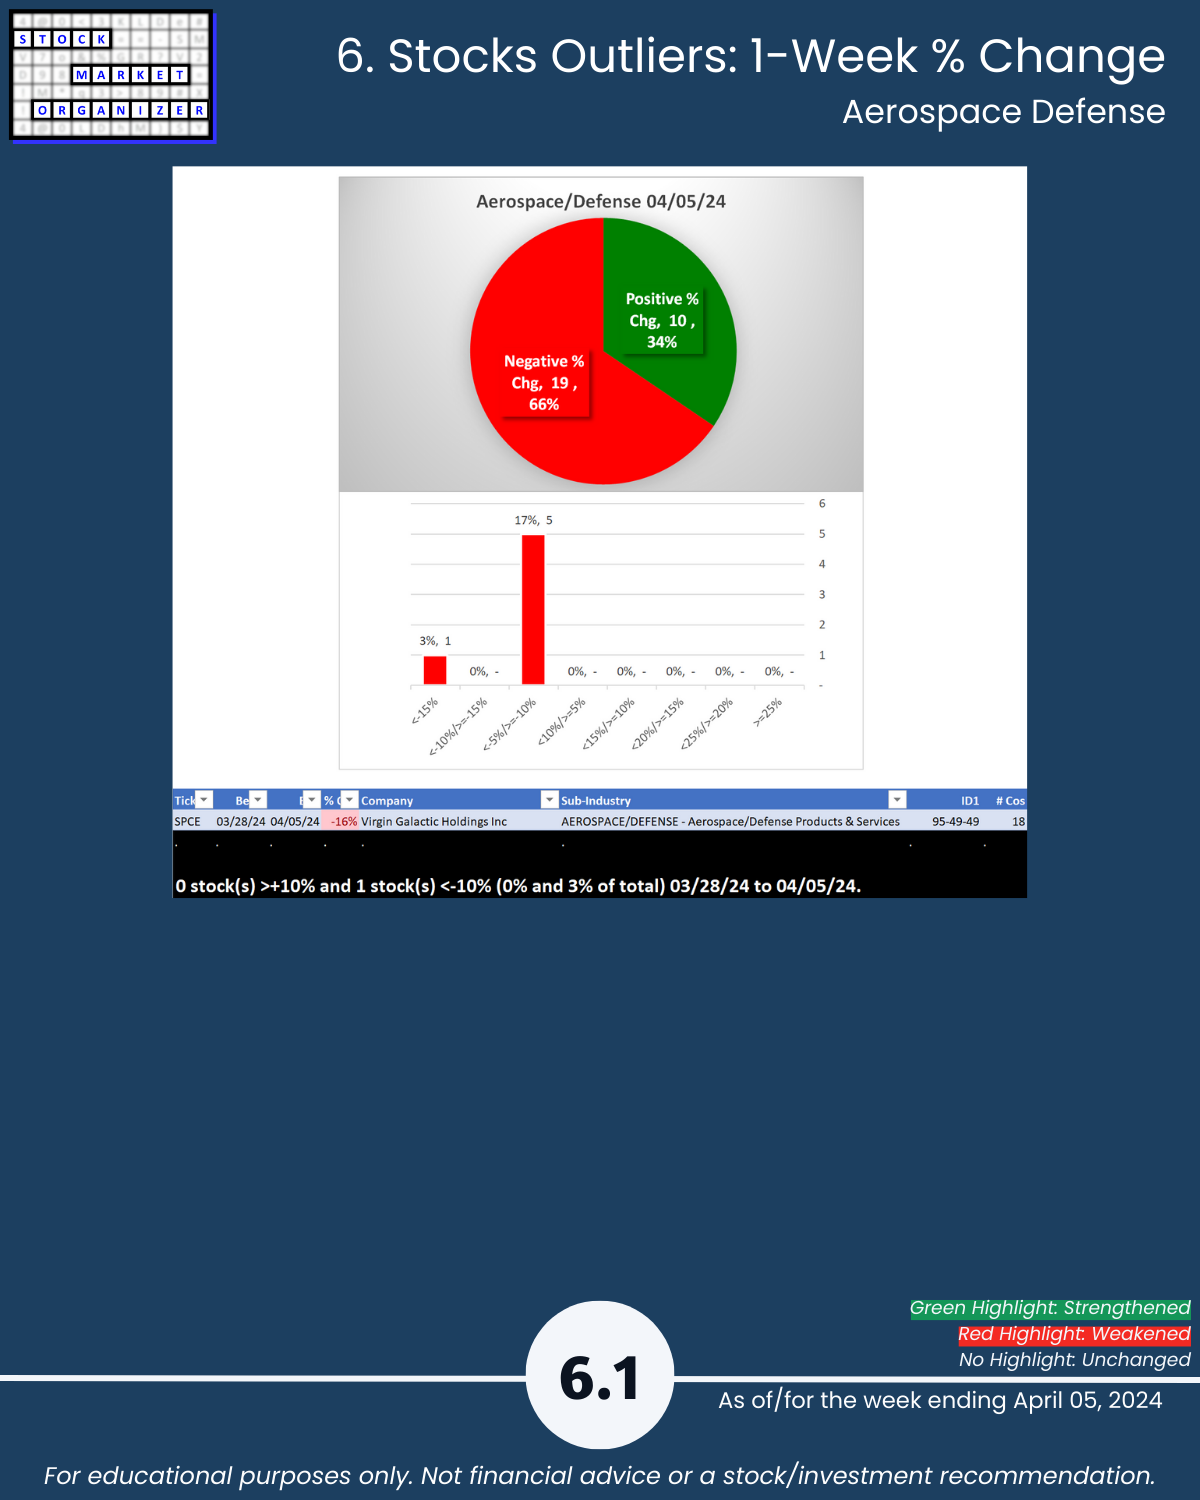
- Outlier Stocks: HLF -22%
WHAT’S HAPPENING HERE?
I am…
Finding U.S. Stock Market strength from the
top down,
inside out,
and bottom up, because
the stronger your stocks, the greener your P&L.
THE “WHY” BEHIND THIS METHOD (SEEKING STRENGTH MARKETWIDE)
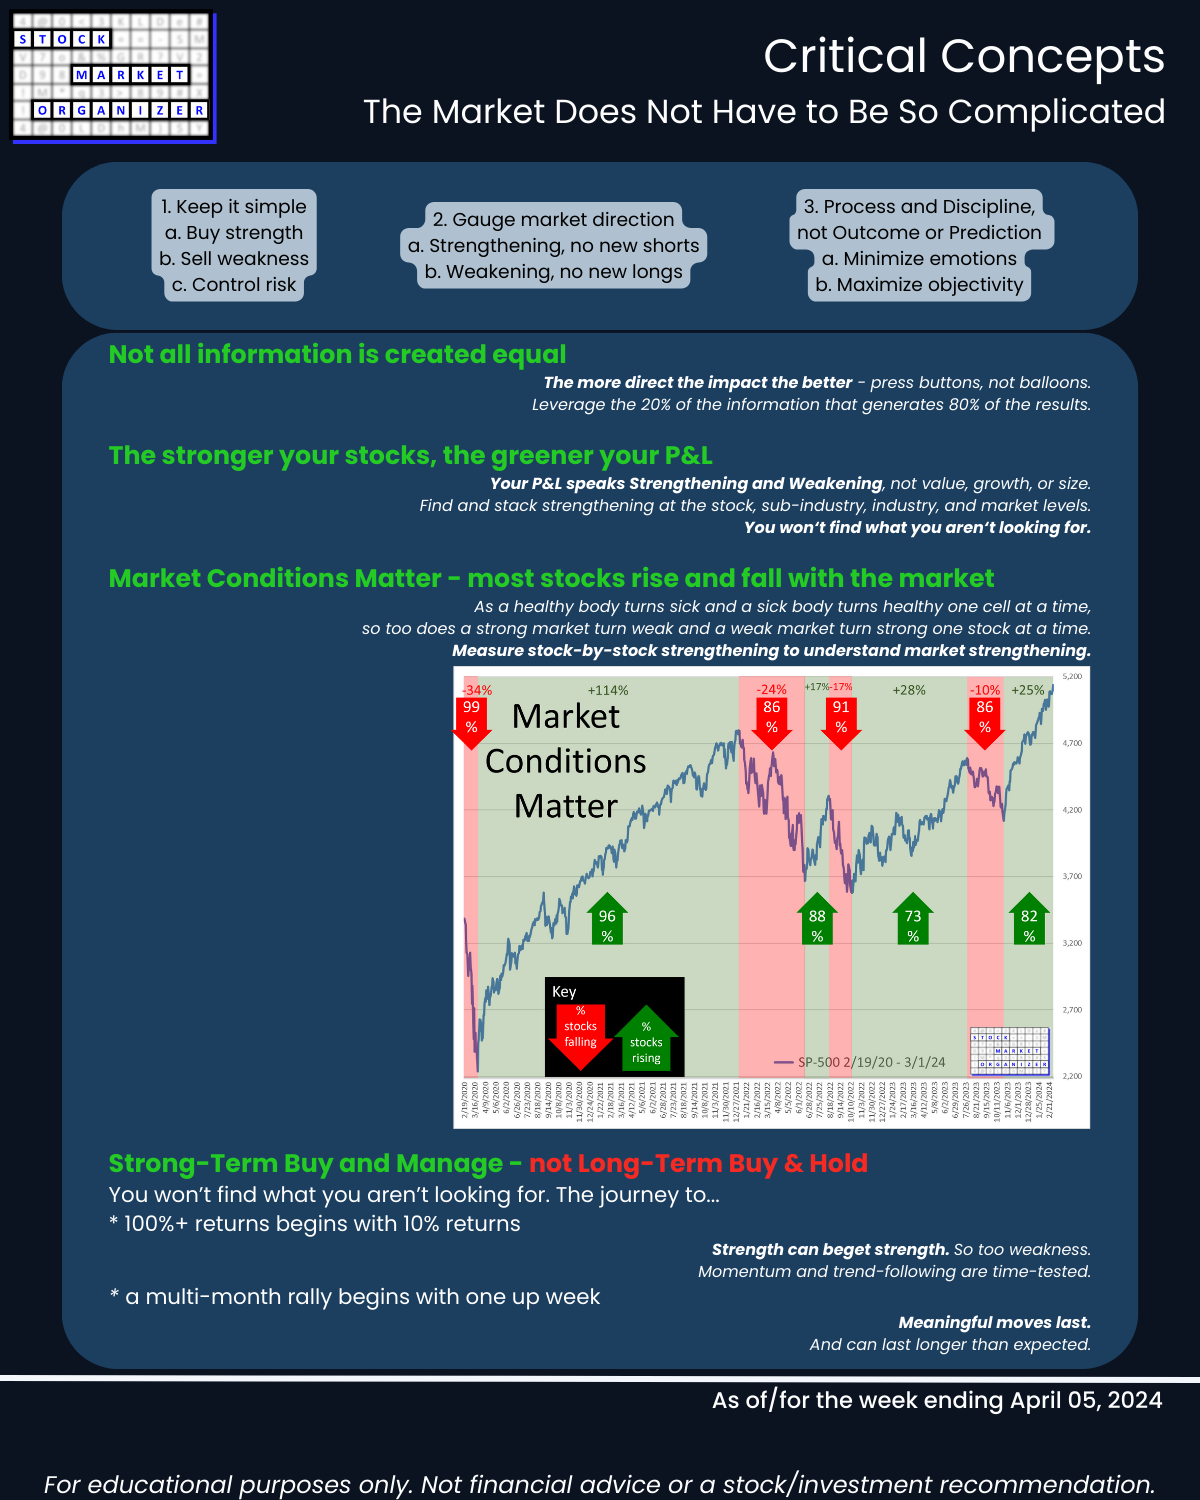
The stronger your stocks the greener your P&L.
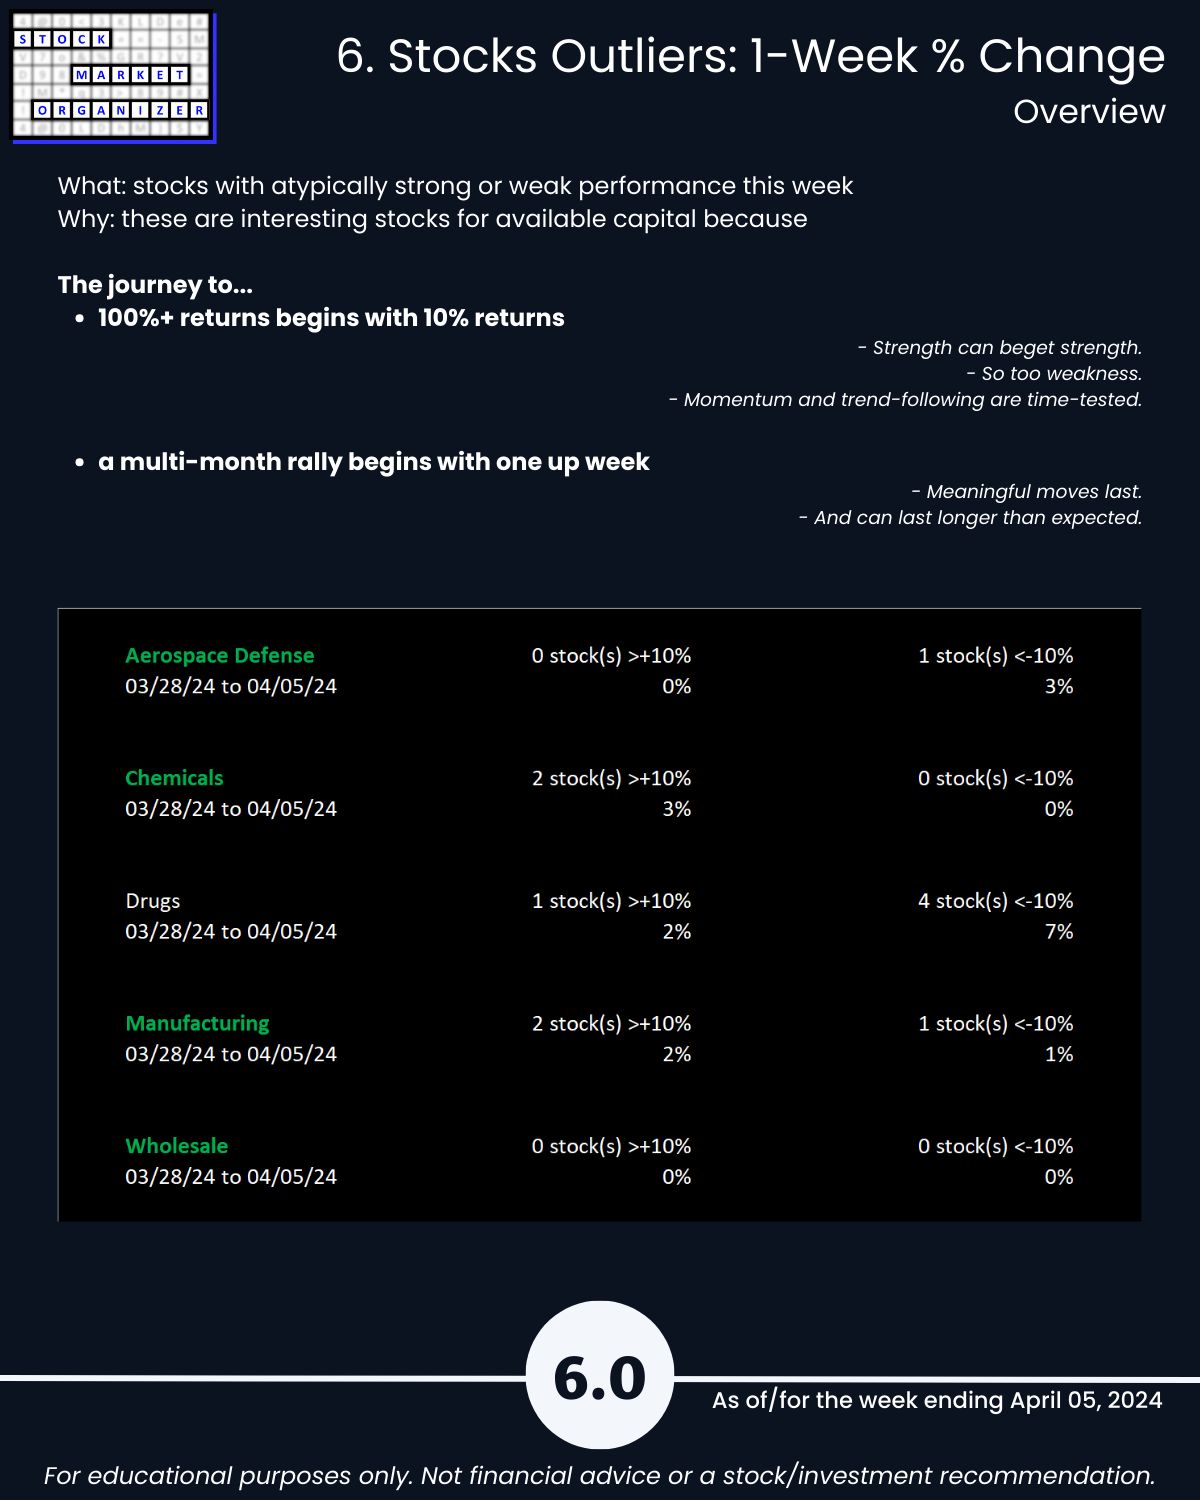
The journey to 100%+ returns begins with 10% returns.
The journey to multi-month rallies begins with one up week.
You won’t find what you aren’t looking for.
Look at any number of triple-digit gainers over the past year or less - obviously NVDA, certainly CVNA, SKYW, POWL, ANF, SMCI.
Each started with 10% gains.
Maybe 10% gainers keep going, and maybe they don’t.
But if you aren’t looking for them, and what might keep them rising (strengthening sub-industry, industry, and market), then you won’t find them.
The market does not have to be so complicated.
This report may particularly be of interest if the following 5 concepts resonate with you:
- The stronger your stocks, the greener your P&L.
- The journey to 100%+ returns begins with 10% returns.
- The journey to a multi-month rally begins with one up week.
- Most stocks do what the market does. (While the market can only do what its underlying stocks, sub-industries, and industries do.)
- 80/20: not all information is created equal. (Press buttons, not balloons.)
Following are galleries with page-by-page views of this report.
1. Introduction
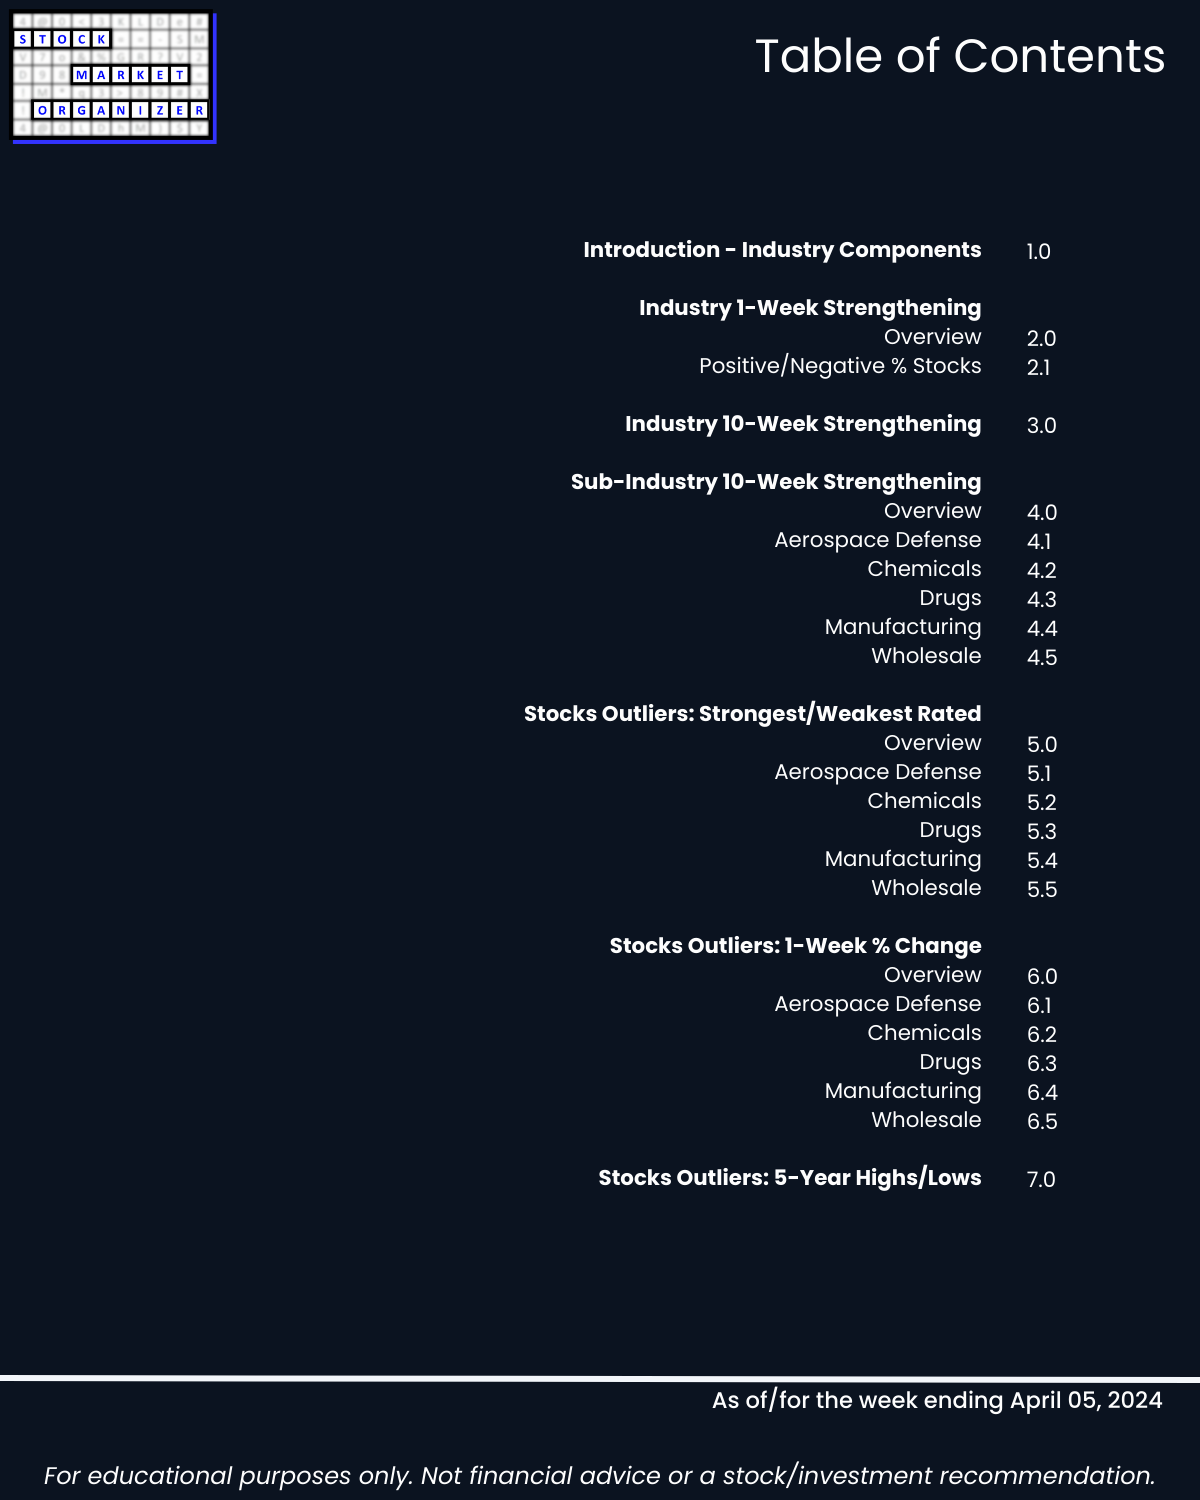
2. Industry 1-Week Strengthening
3. Industry 10-Week Strengthening
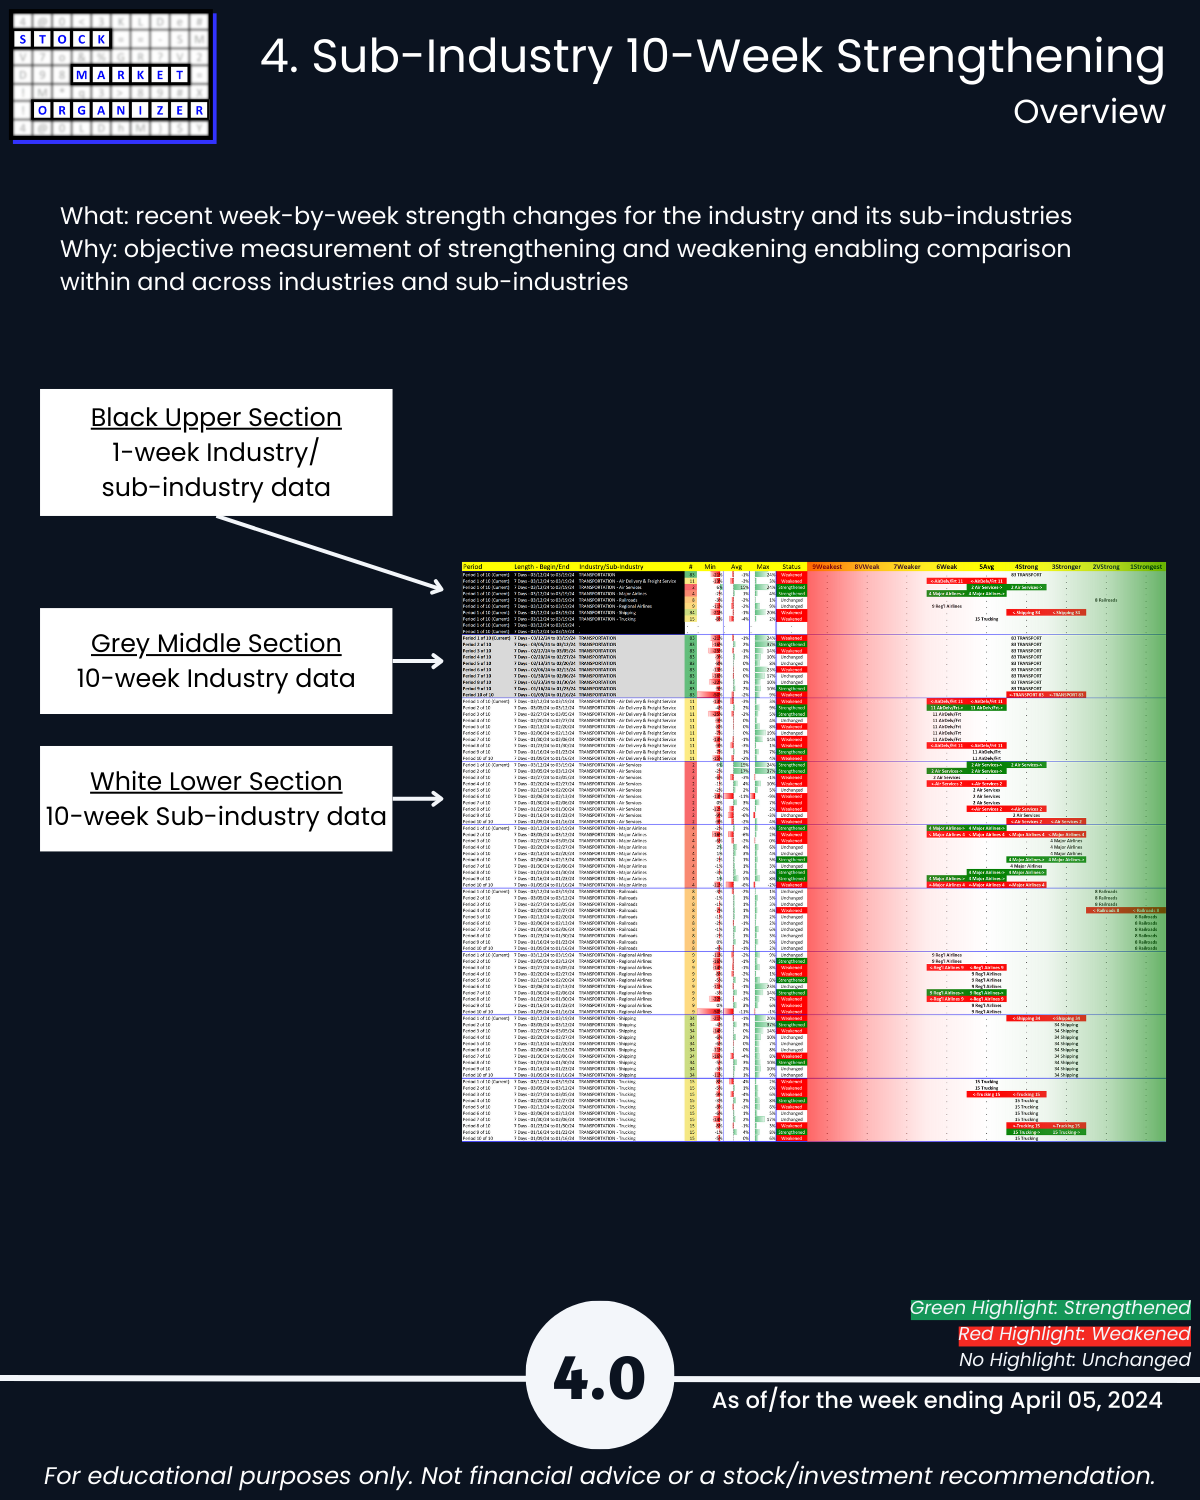
4. Sub-Industry 10-Week Strengthening
5. Stocks Outliers: Strongest/Weakest Rated
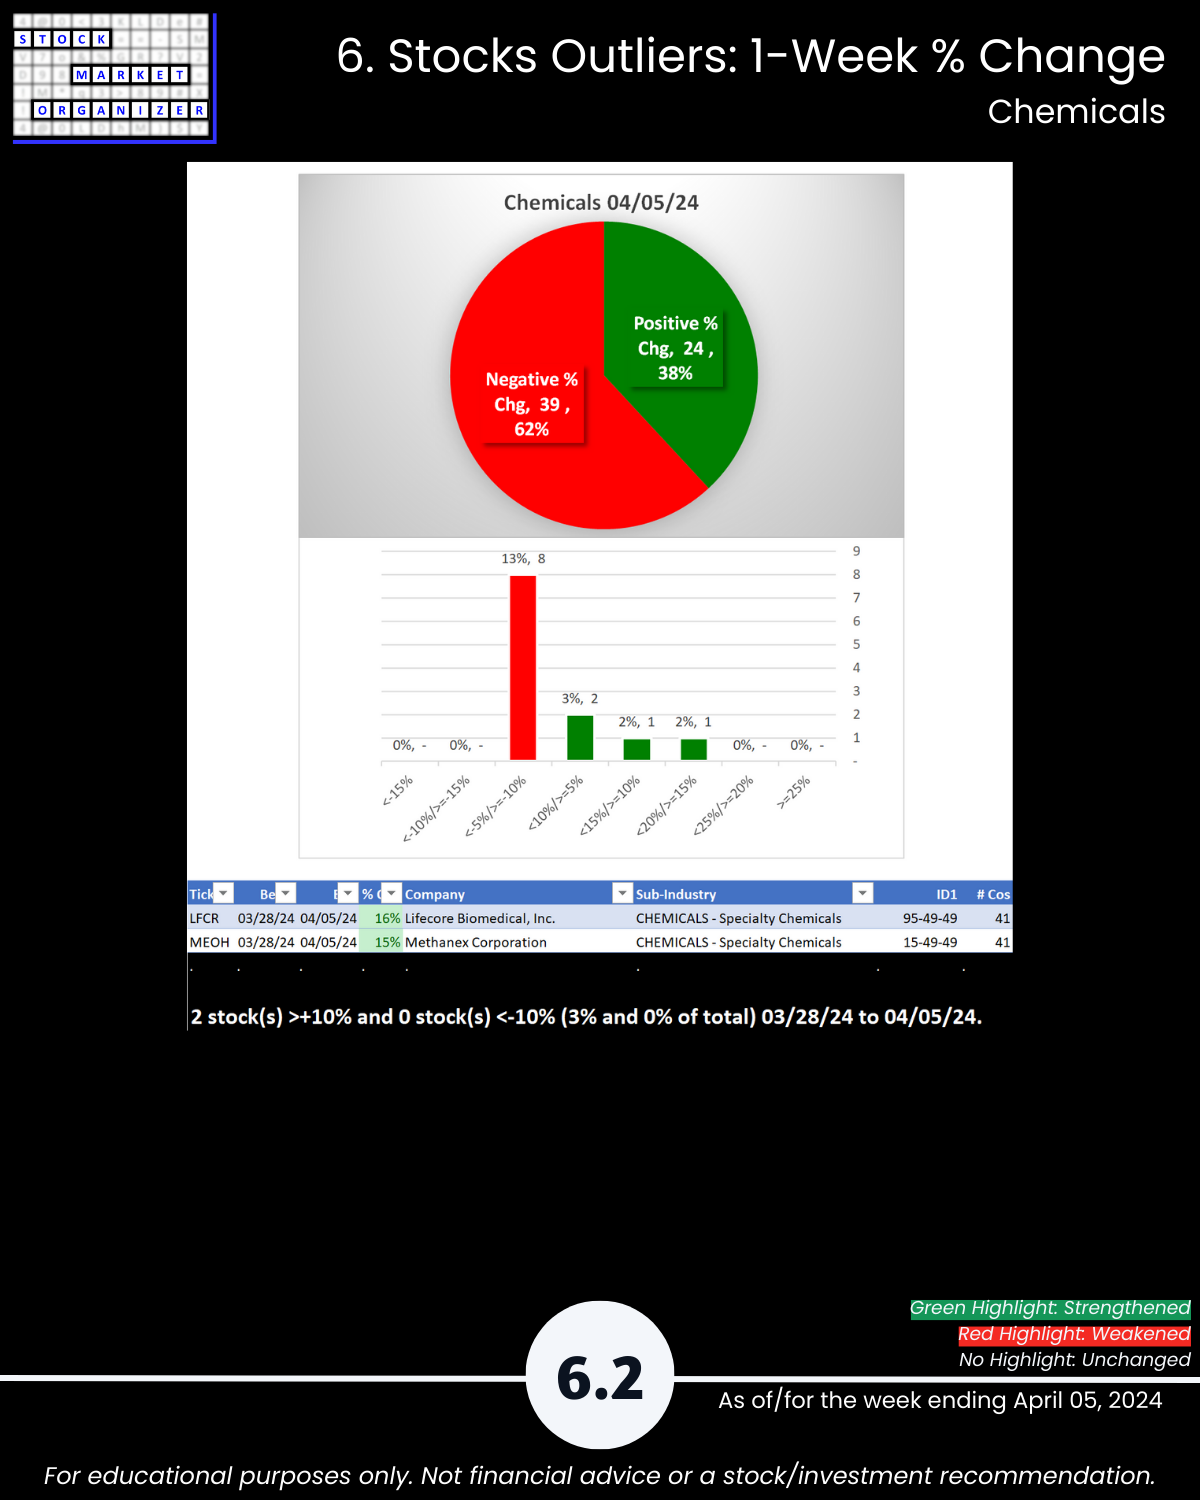
6. Stocks Outliers: 1-Week % Change
7. Stocks Outliers: 5-Year Highs/Lows