SMO Exclusive: Strength Report Group 2 2024-04-22

U.S. stock market 4/22/24 “To the moon, Alice!” An incredibly old sitcom reference comes to mind with today’s market rally. Perhaps it is too much to expect the market to fall every single day. It couldn’t possibly be that easy. Short sellers cover, value players step in, and bottoms happen. But are they processes, or events? Was this the bottom? Since we won’t know except in retrospect, all I can do is measure the impact of this one day in the context of the relevant recent past. How important was it?
Captain Obvious alert: there is a shelf life to information in the dynamic stock market, with new influences emerging regularly. And, with the magnitude of ever-present influences changing regularly, this makes for a remarkably script-free situation that defies prediction. For me at least, perhaps not the smartest people in the room.
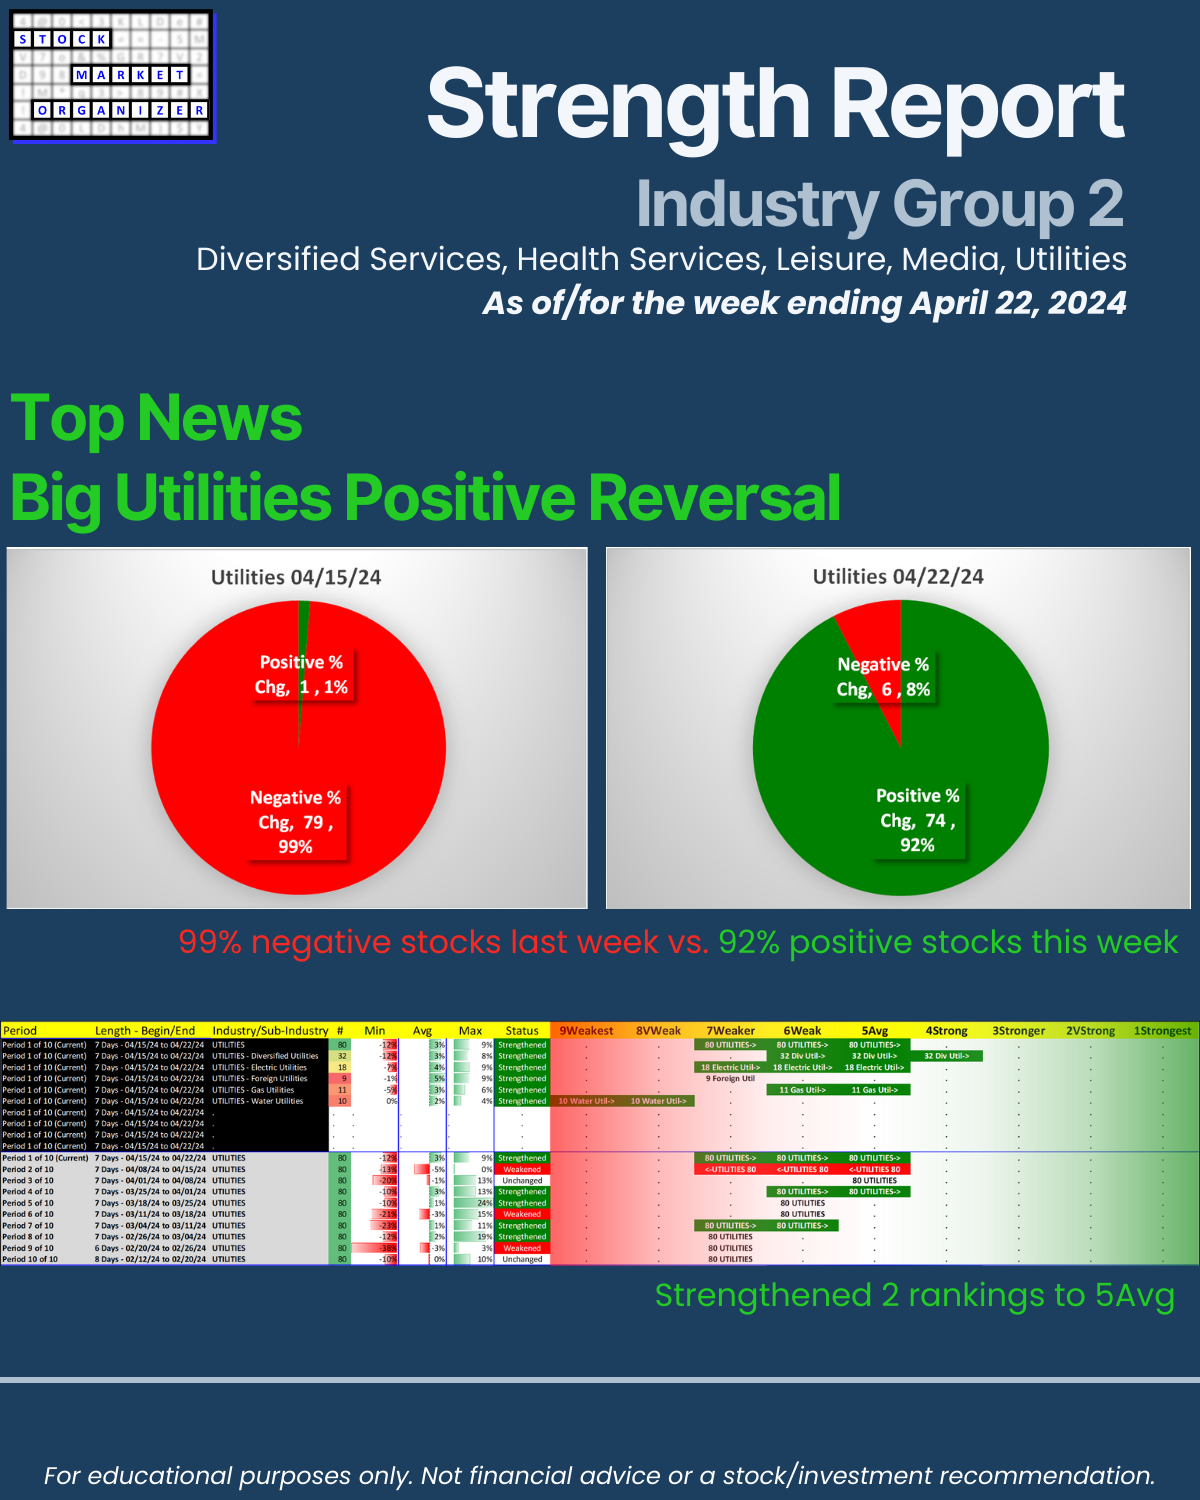
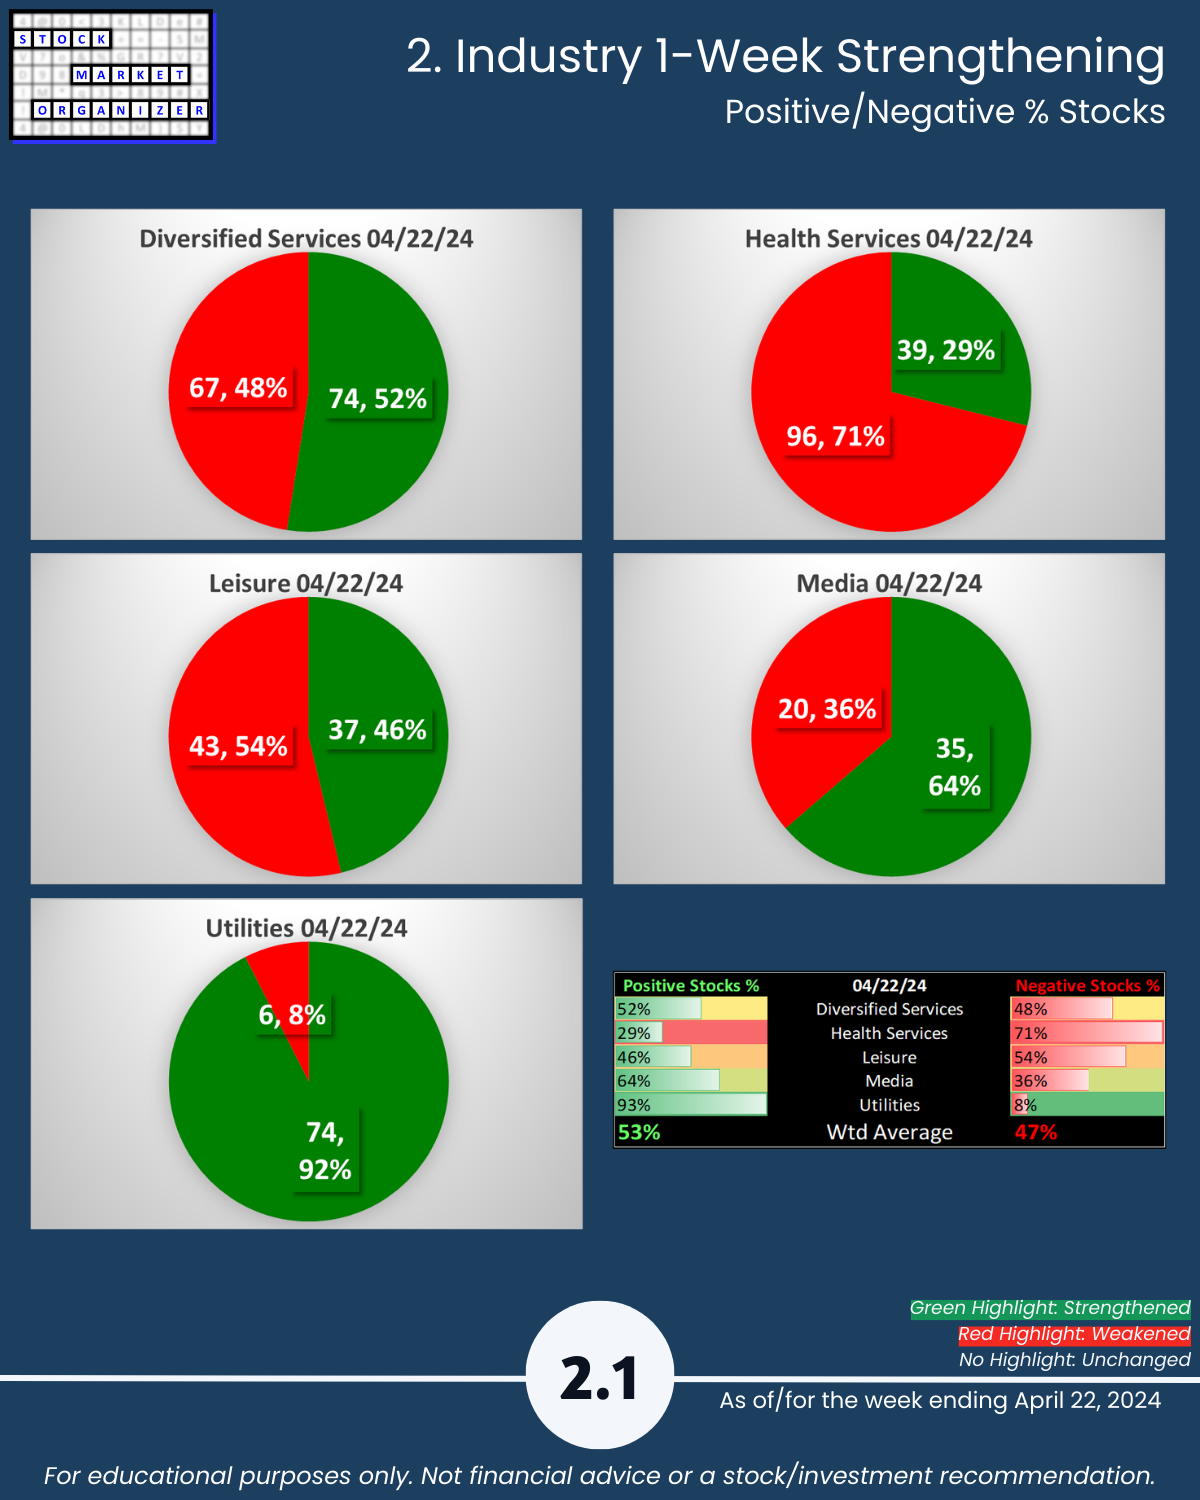
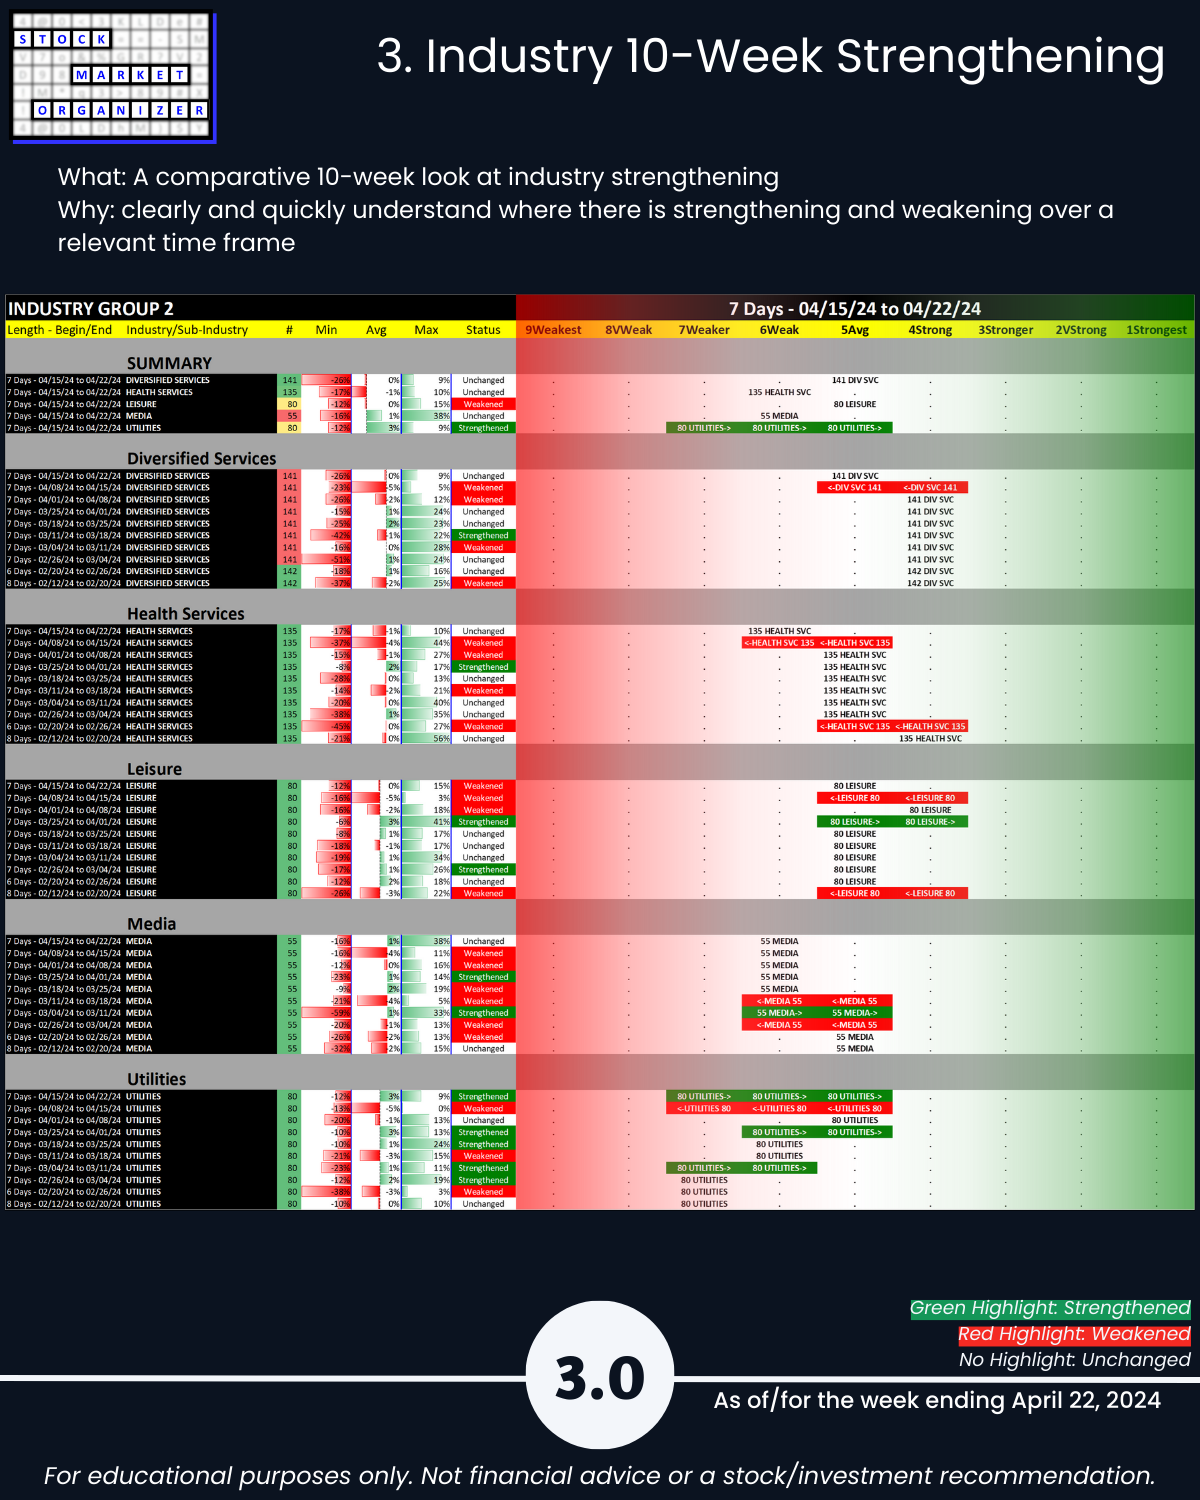
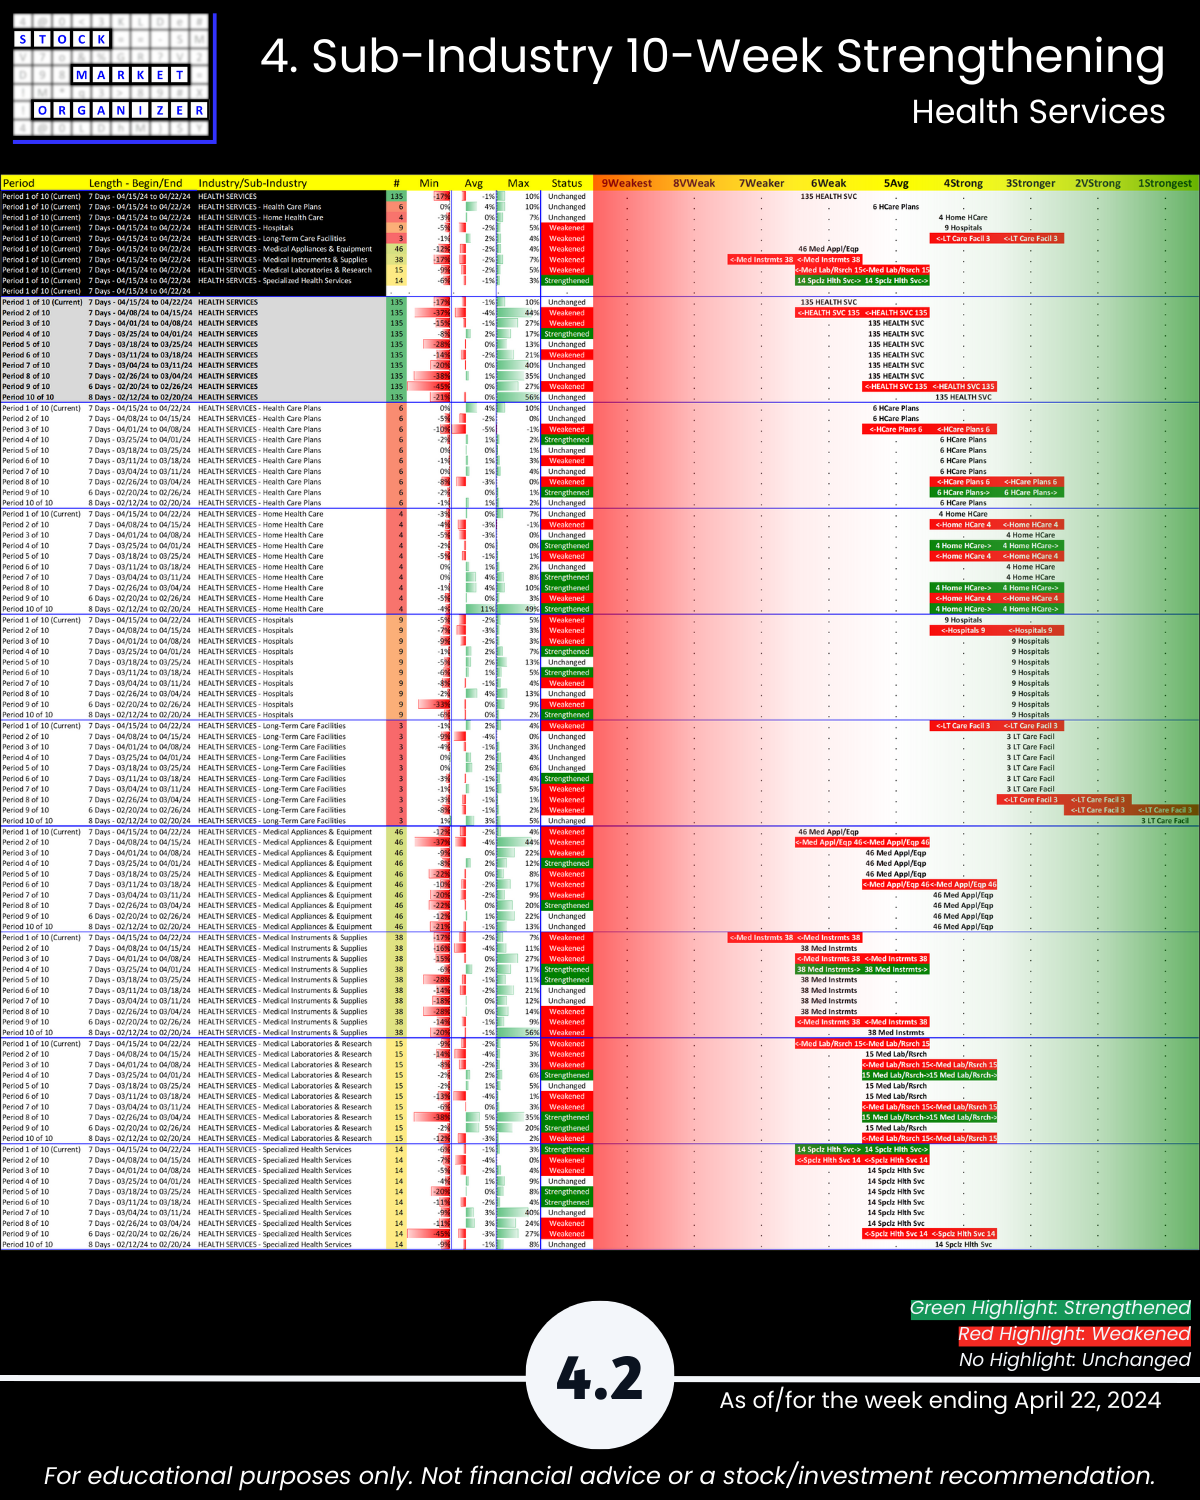
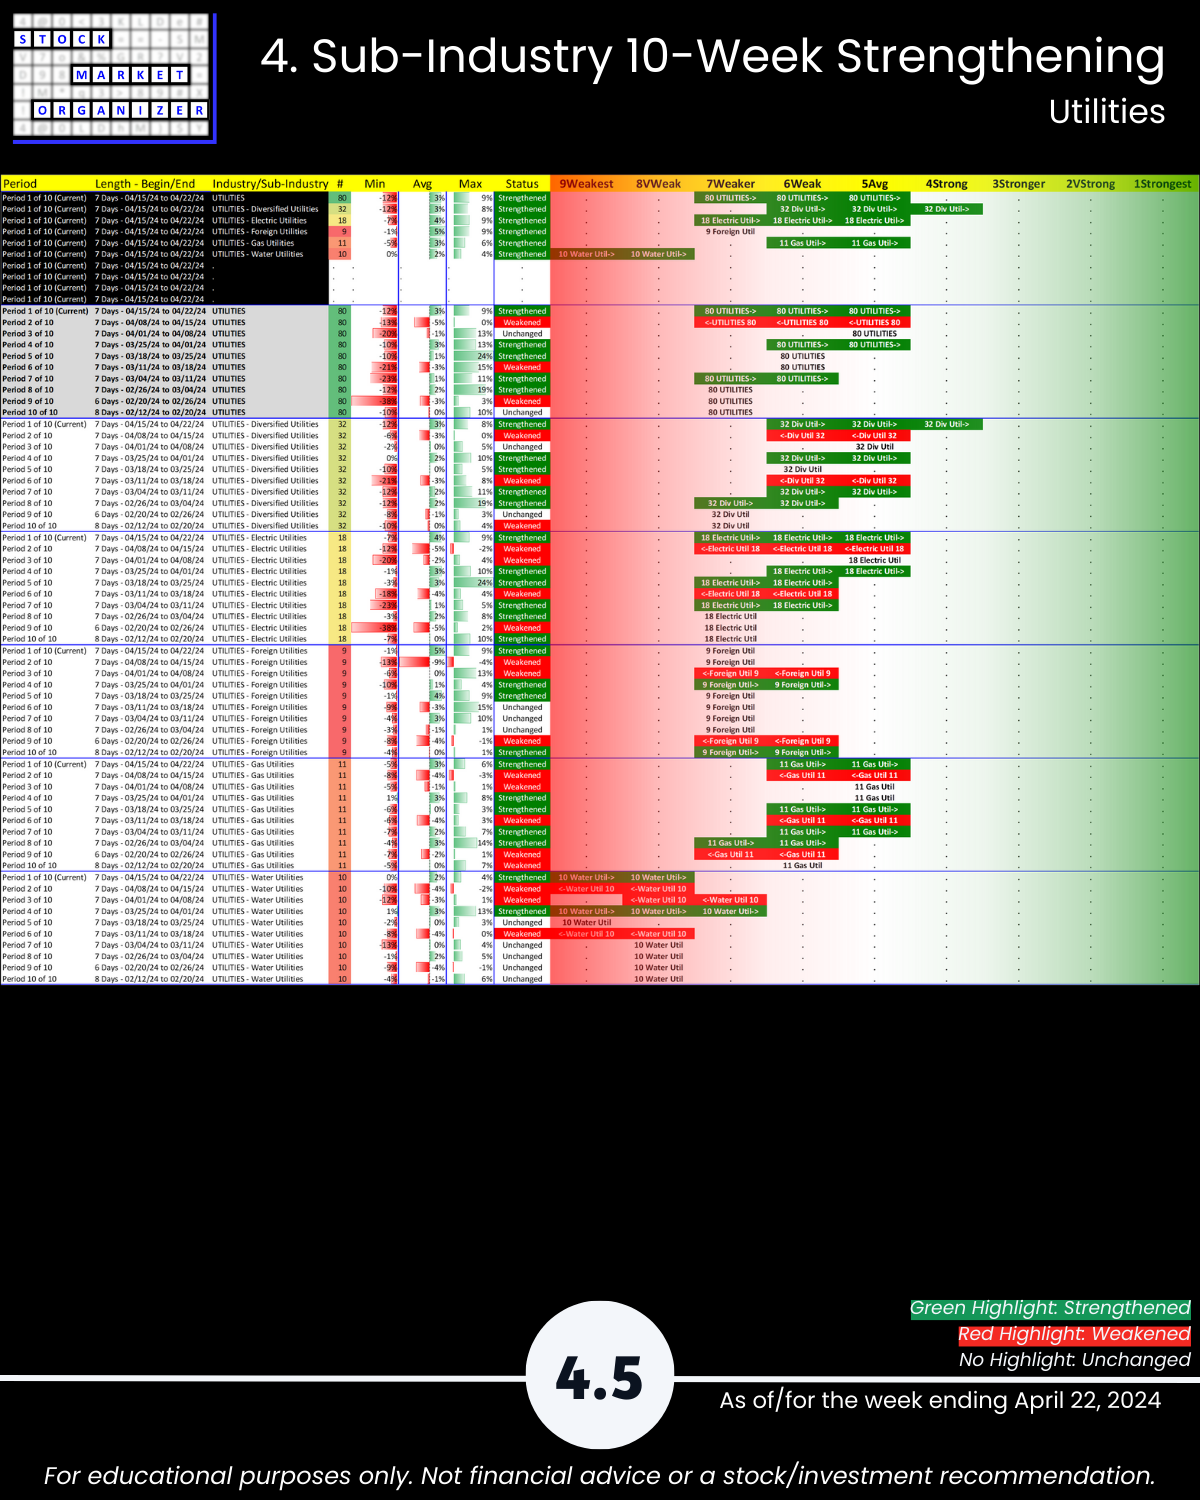
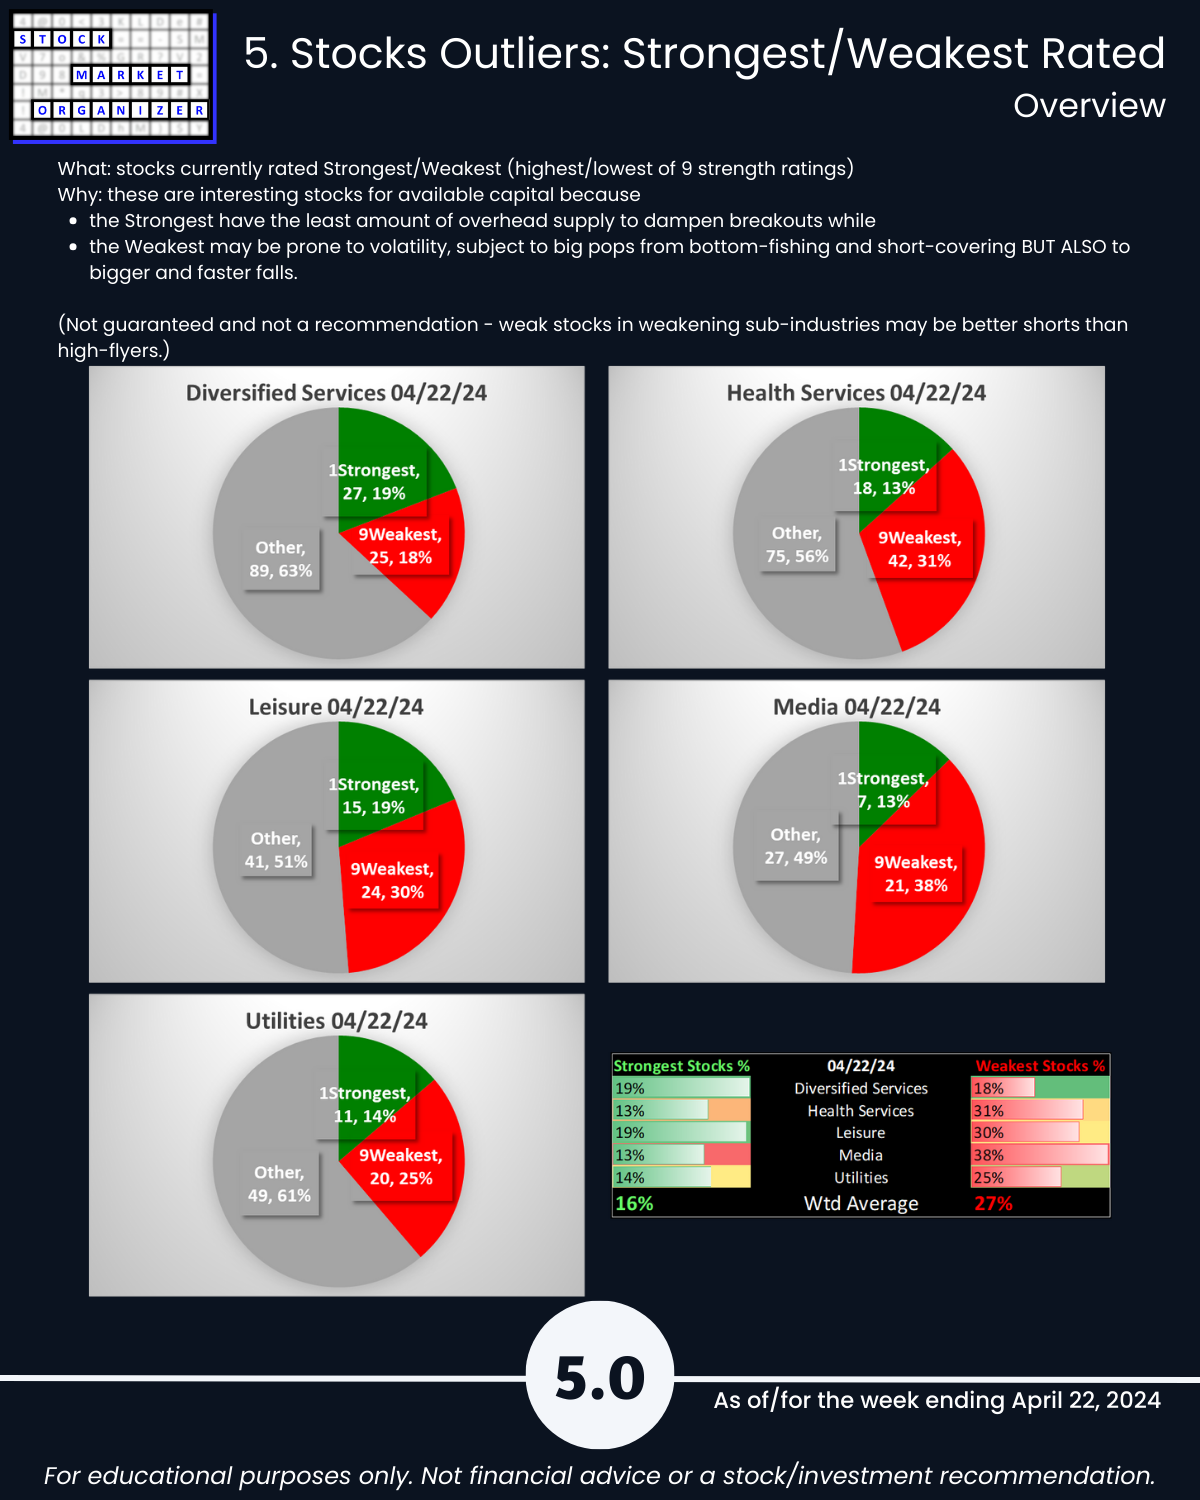
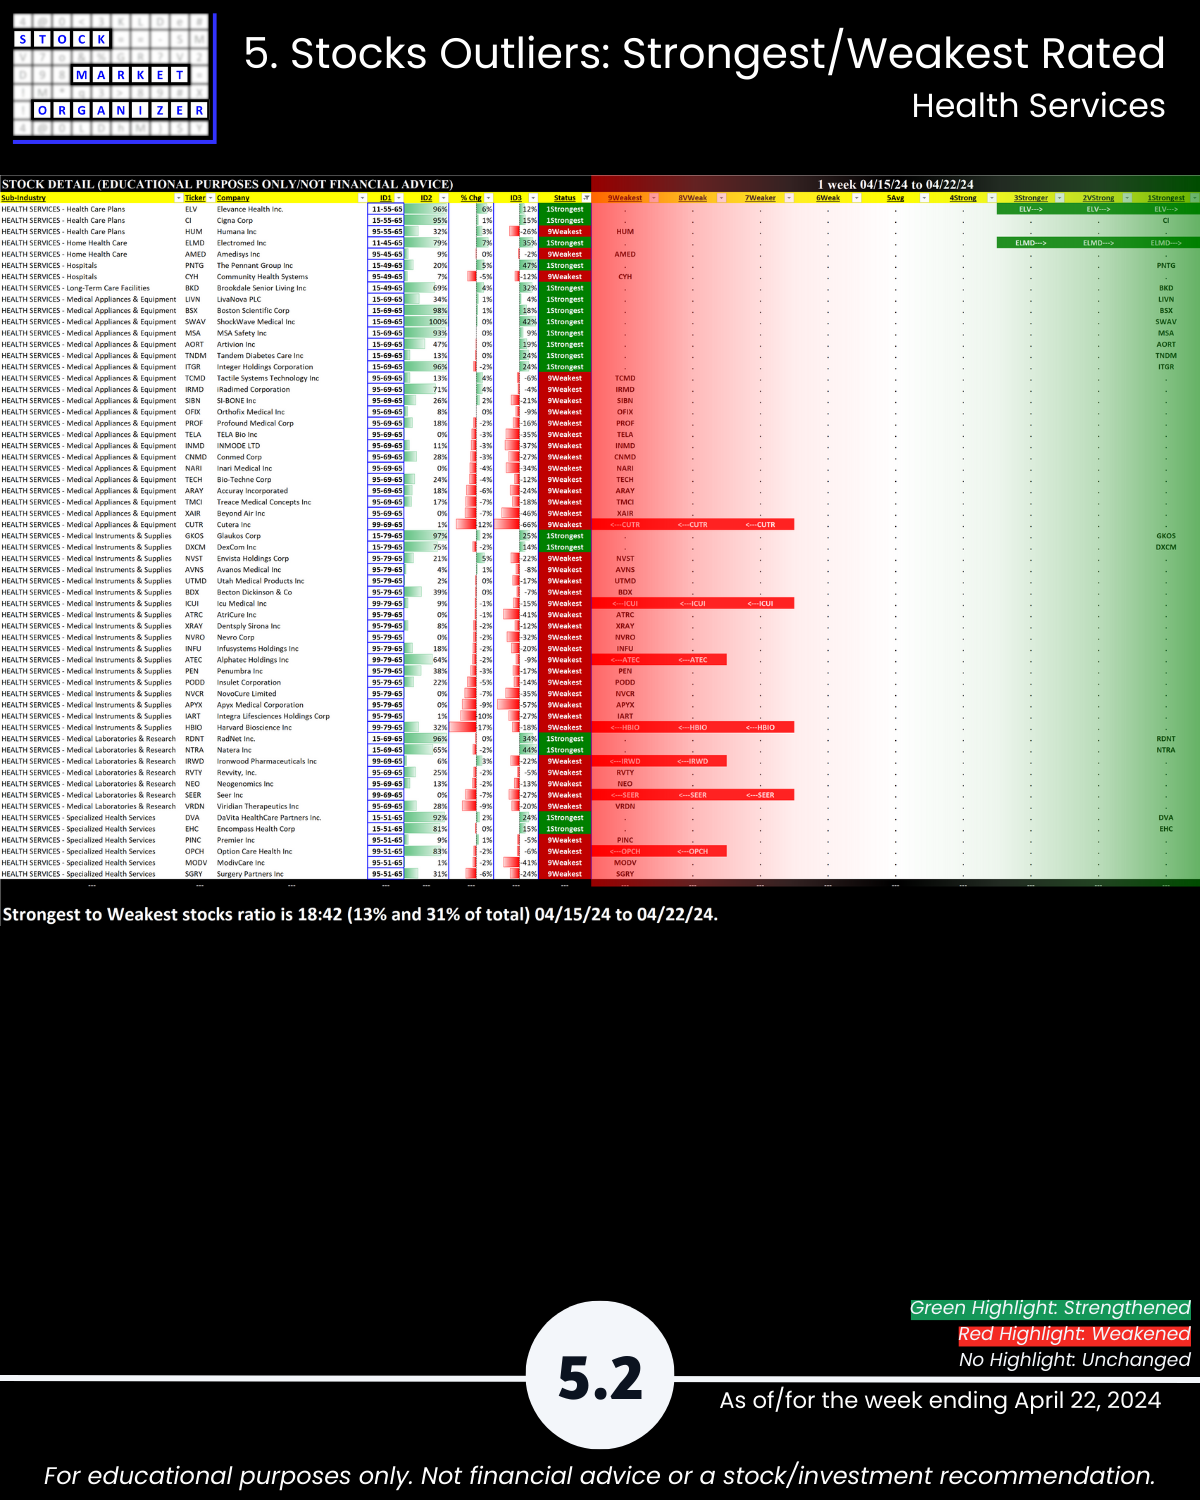
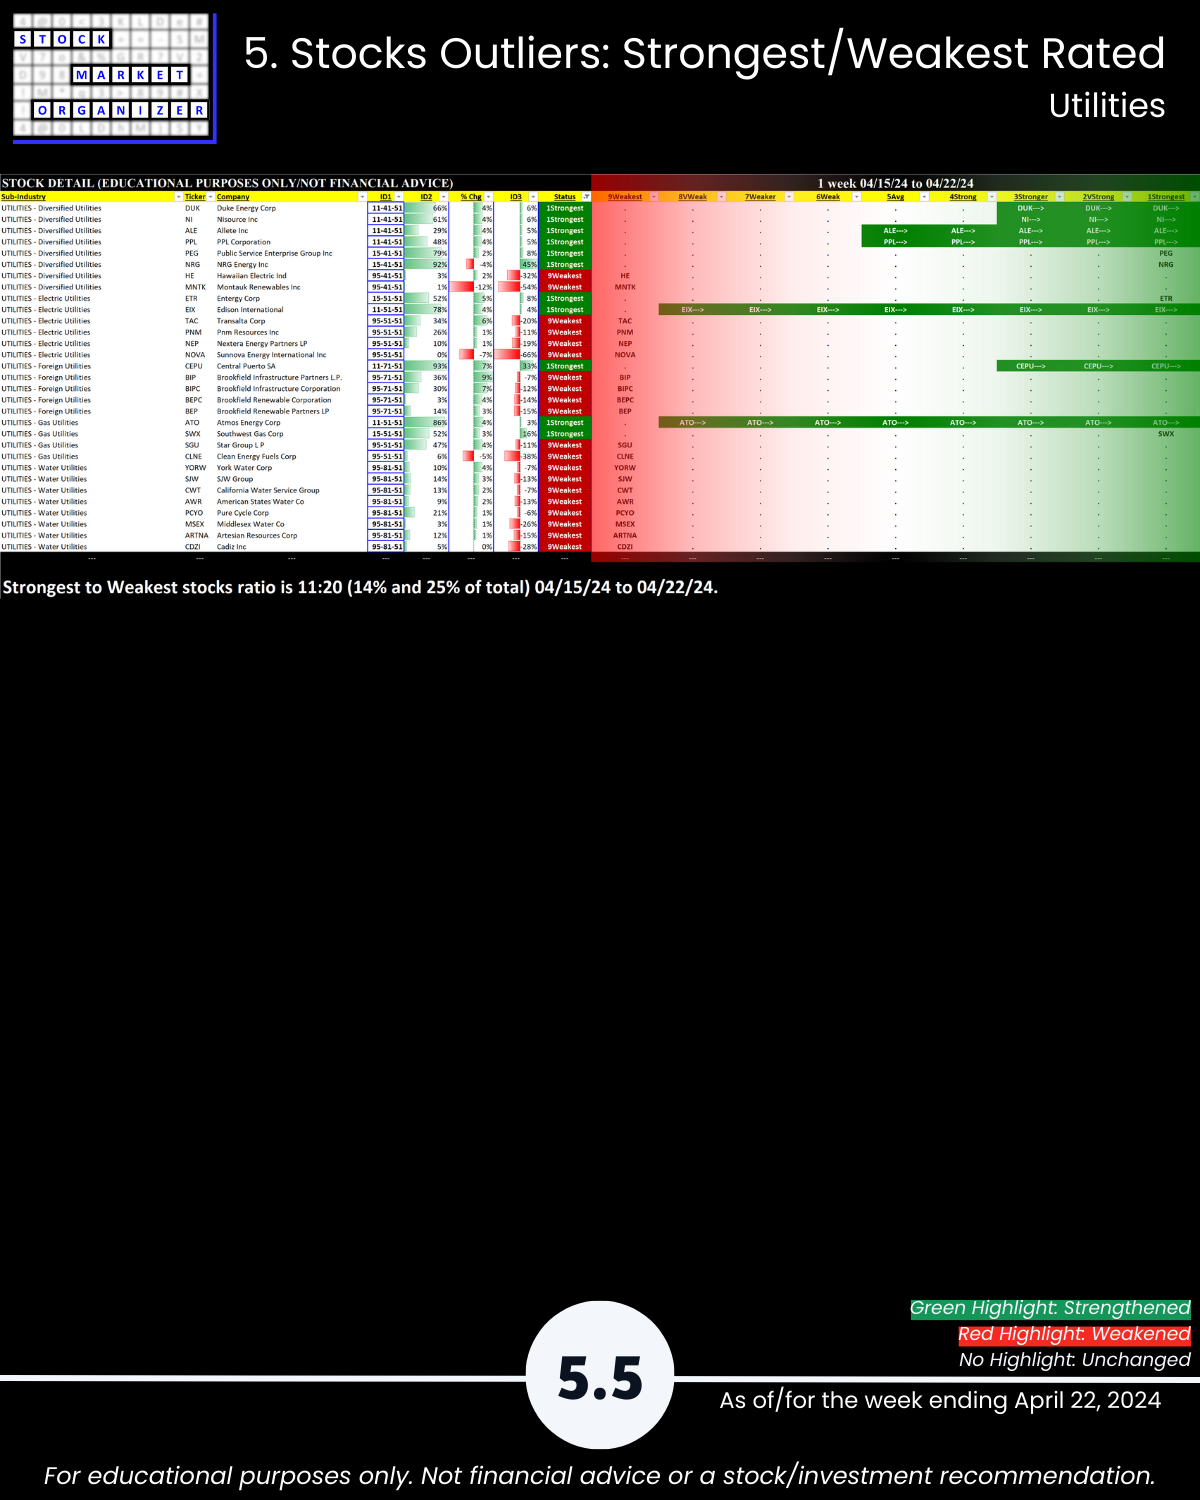
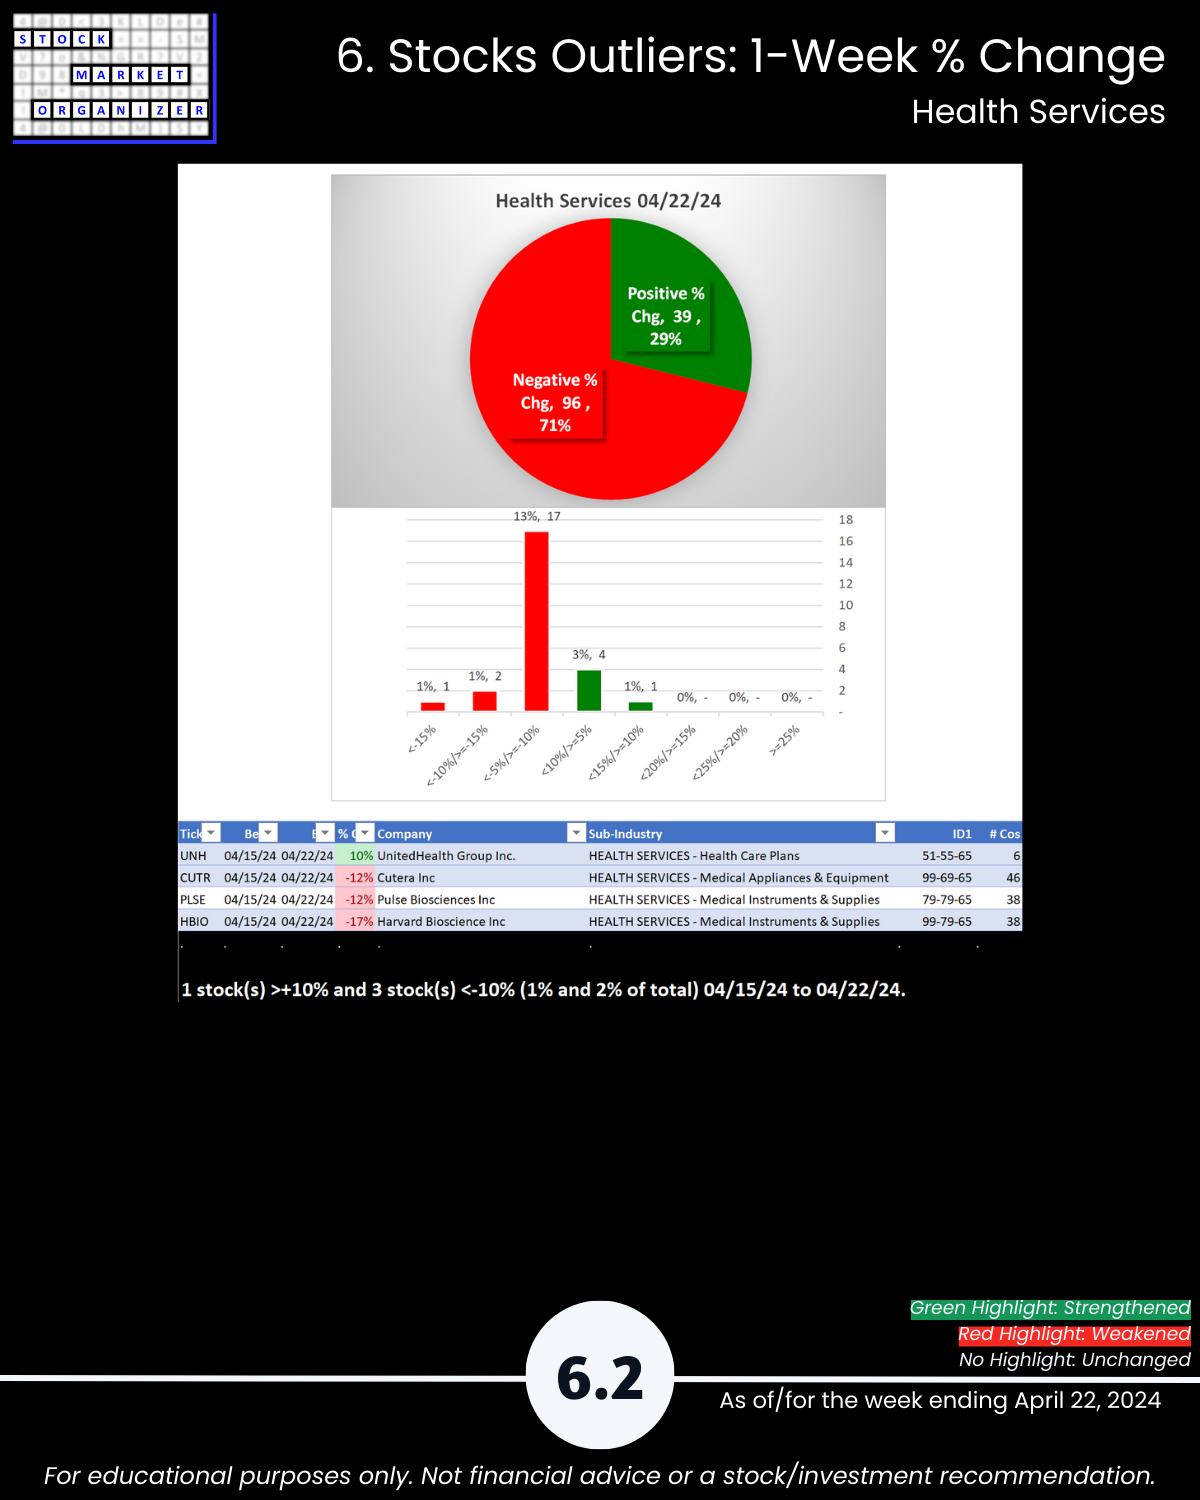
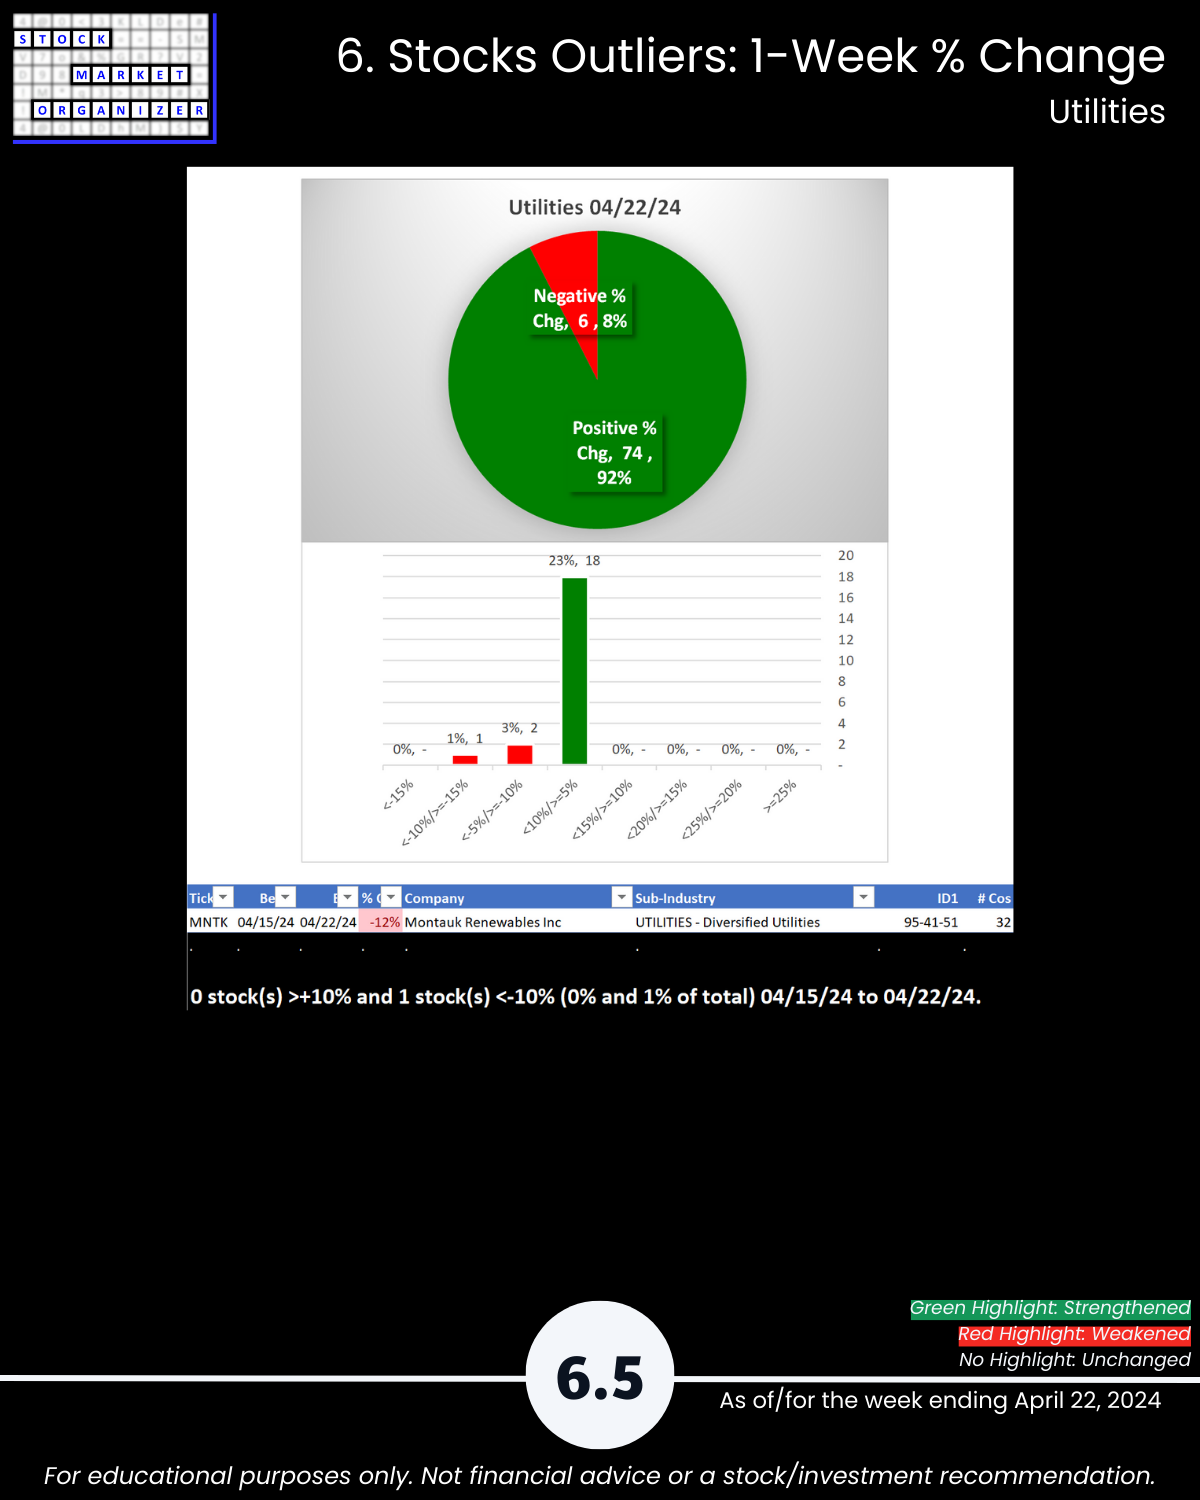
What you may not know that could be relevant: 🔹 Utilities completely reversed last week’s debacle and re-strengthened the 2 ranking levels it lost, enjoying 92% positive stocks vs. last week’s 99% negative, 🔹 Health Services is this group’s weak link with 71% negative stocks and a lagging Strongest:Weakest ratio of 13%:31%.
A LOOK AHEAD = TSLA EARNINGS AFTER HOURS 4/23/24
Tomorrow’s report will include Automotive. About TSLA:
🔹 Not a chartist but TSLA’s chart does not look good to me. It is at 15-month lows last seen when the overall market was generally early in its October 2023 to March 2024 rally.
🔹 Friday 4/19/24 TSLA’s ID was 95-69-69:
- stock: 9Weakest ranking, was flat for the week
- sub-industry Major Auto Manufacturers: 6Weak ranking, WEAKENED during the week
- industry Automotive: 6Weak ranking, WEAKENED during the week
Not the resounding picture of health + No New Longs environment = TSLA is an Ignore at this moment.
And even if it reported blowout earnings, without at least sub-industry and market strengthening I’m not interested. And with sub-industry and market strengthening there are stronger, more interesting candidates in this sub-industry than TSLA. Based on CURRENT information.
TODAY’S REPORT TAKEAWAYS
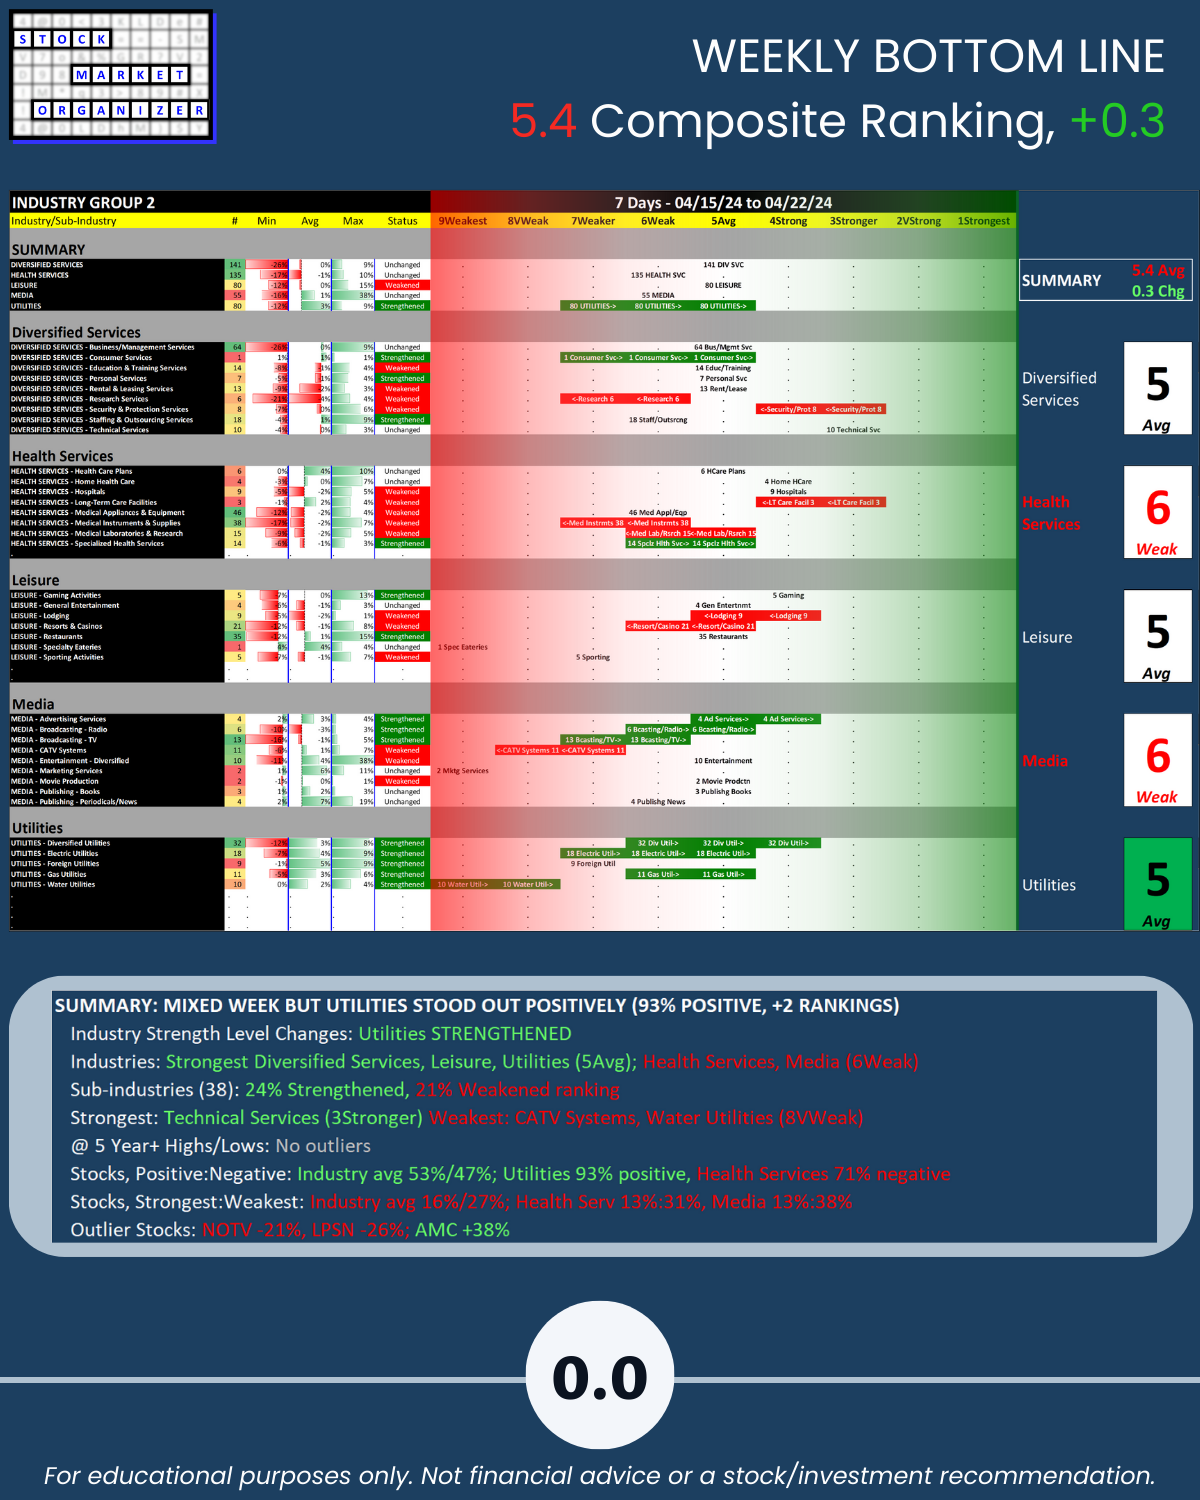
SUMMARY: MIXED WEEK BUT UTILITIES STOOD OUT POSITIVELY (93% POSITIVE, +2 RANKINGS)
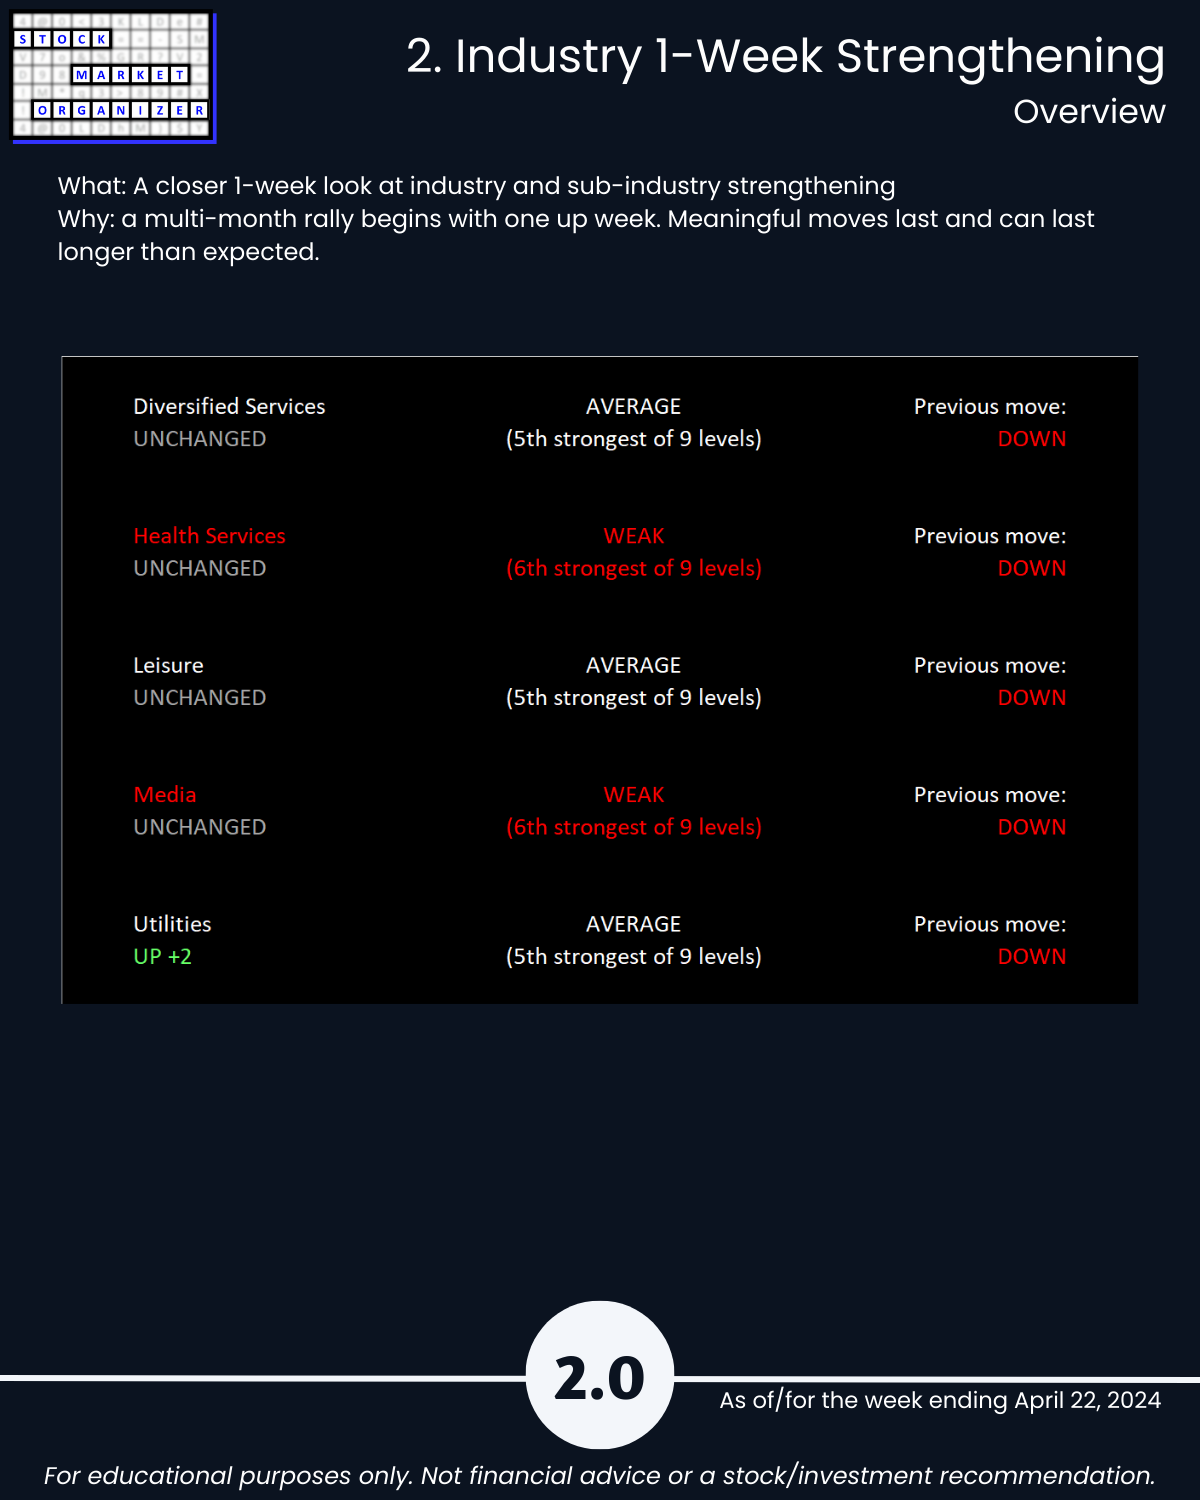
🔹 Industry Strength Level Changes: Utilities STRENGTHENED
🔹 Industries
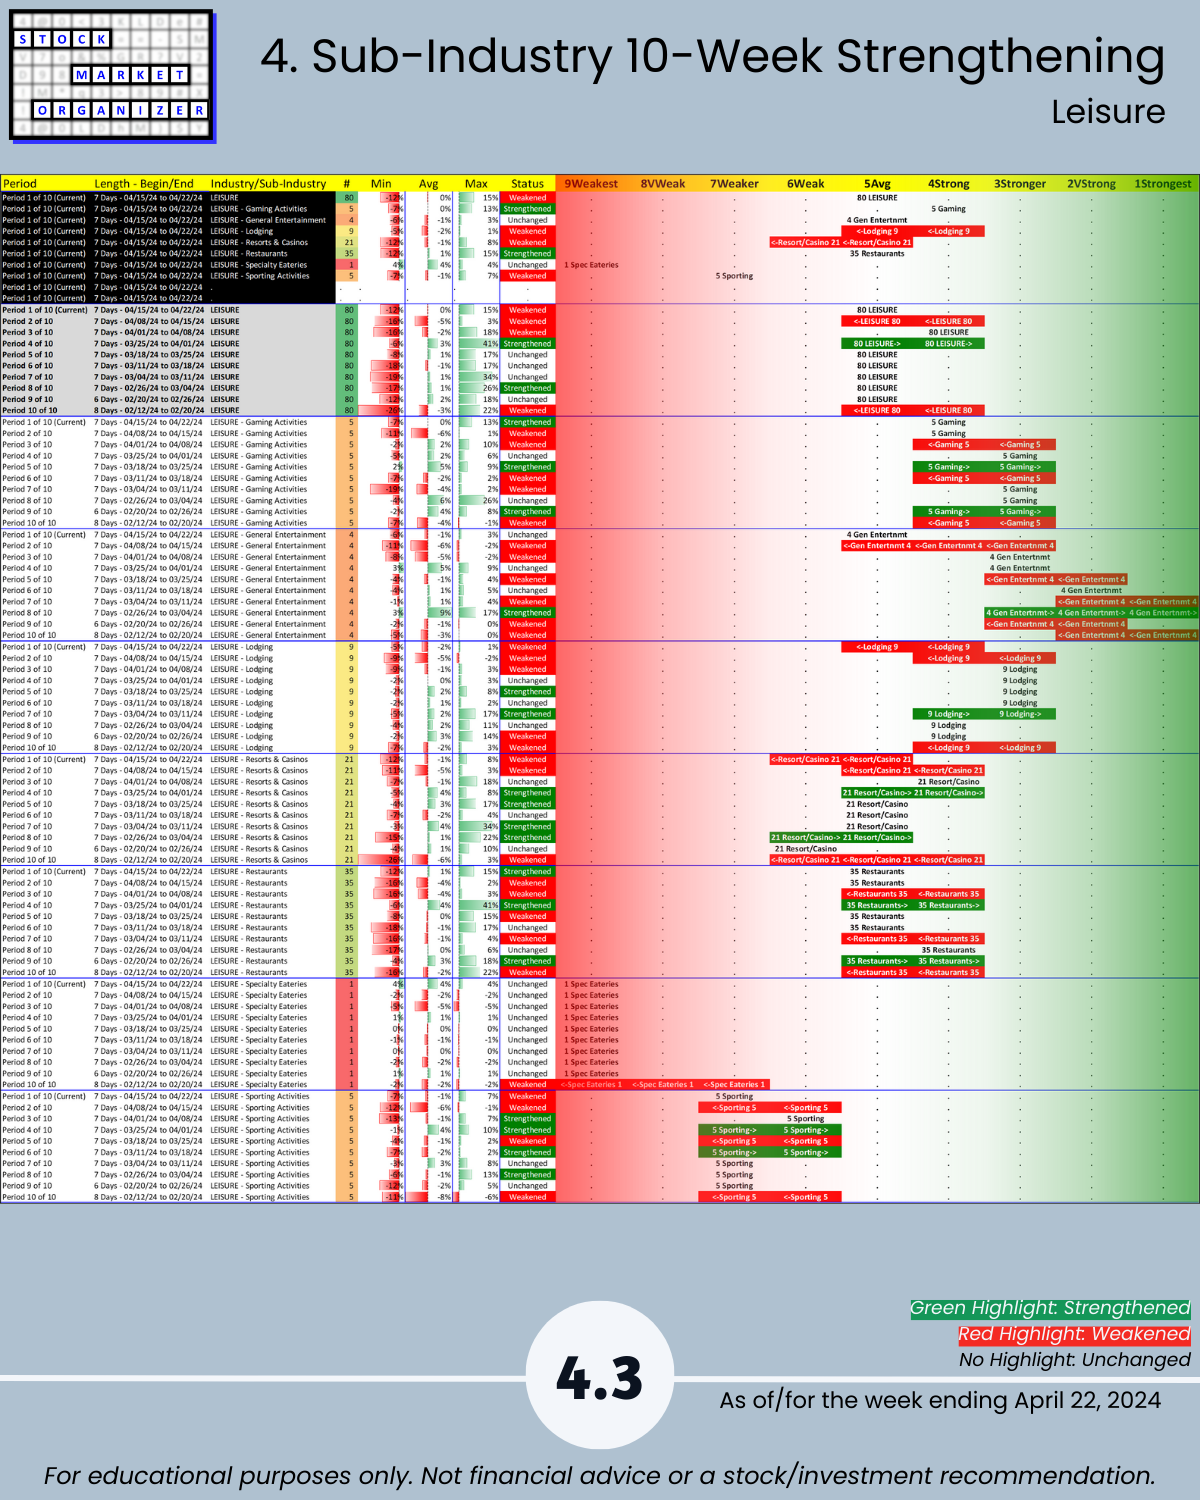
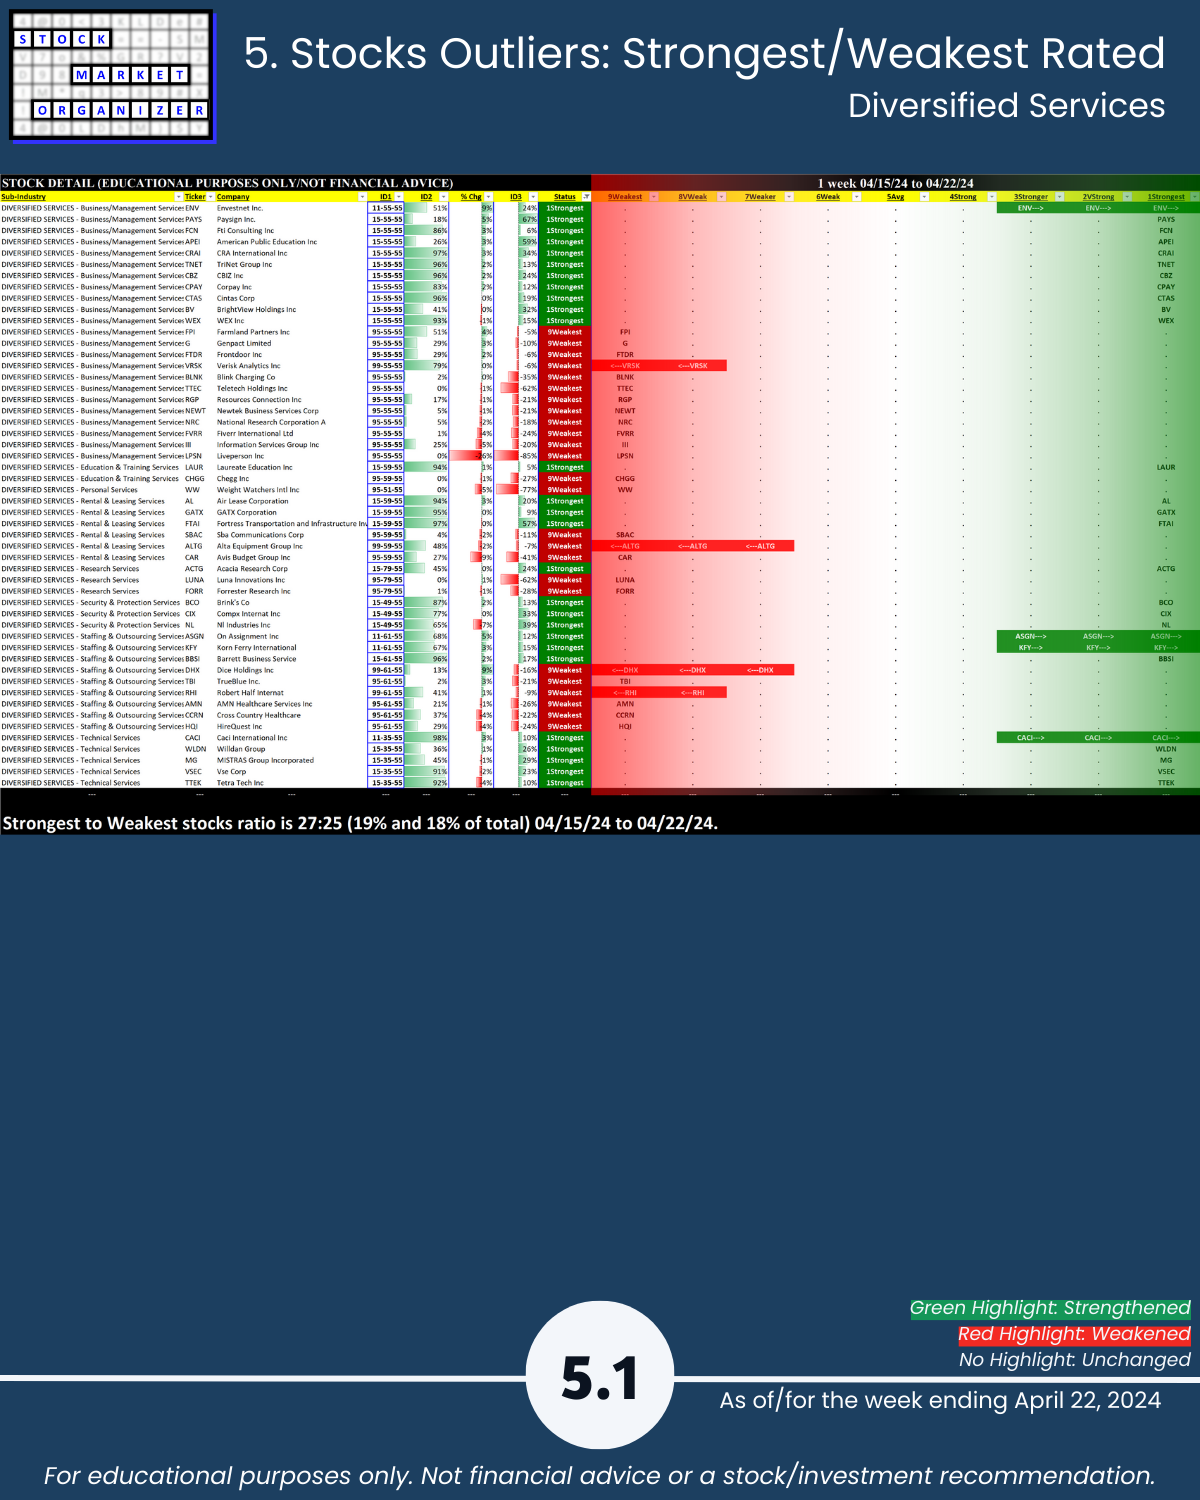
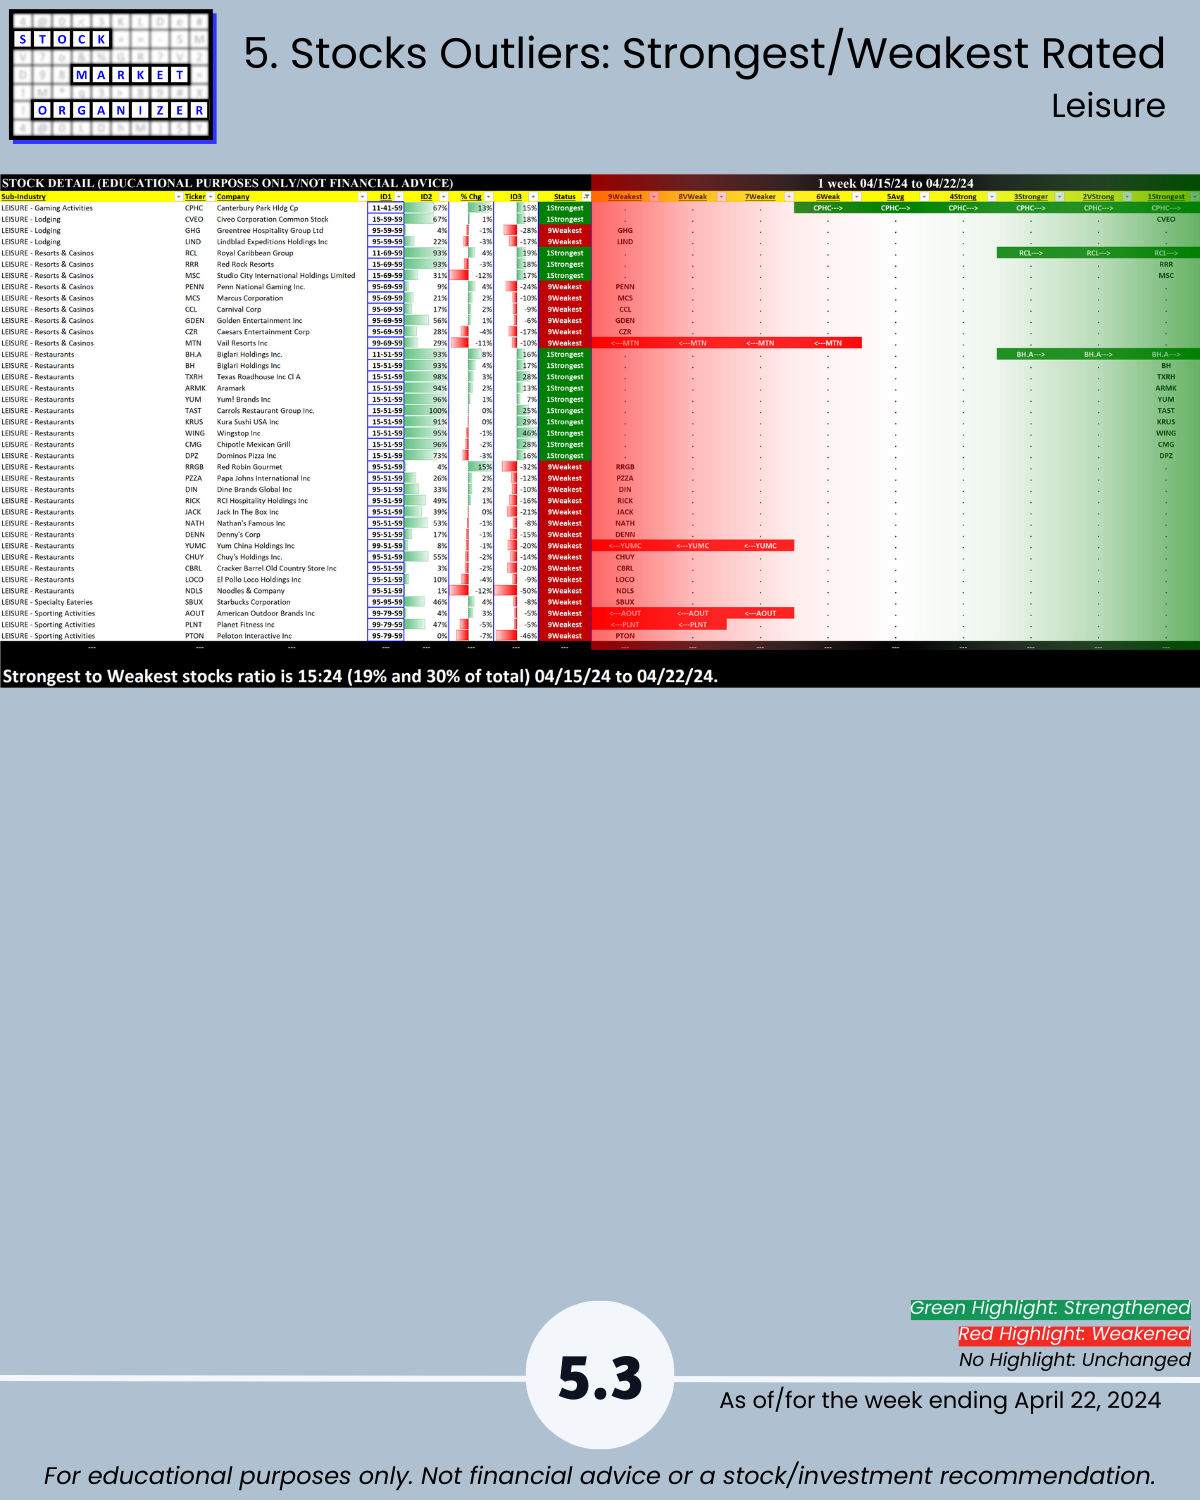
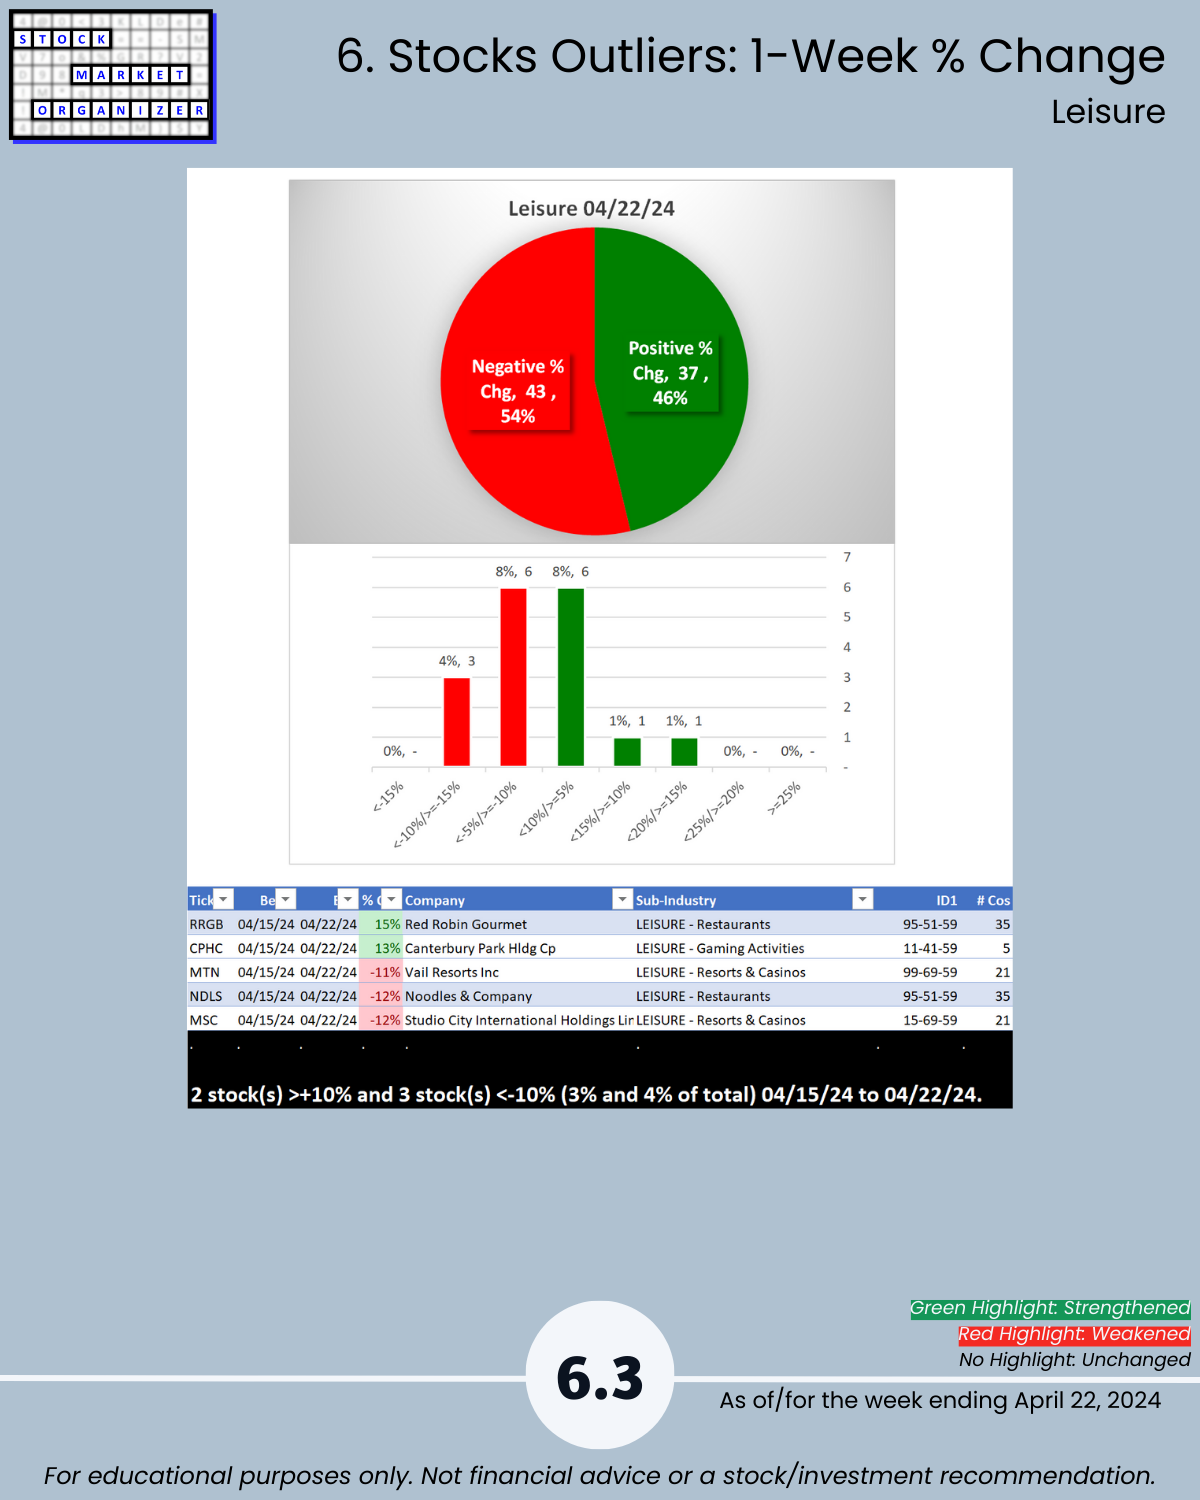
- Strongest Diversified Services, Leisure, Utilities (5Avg)
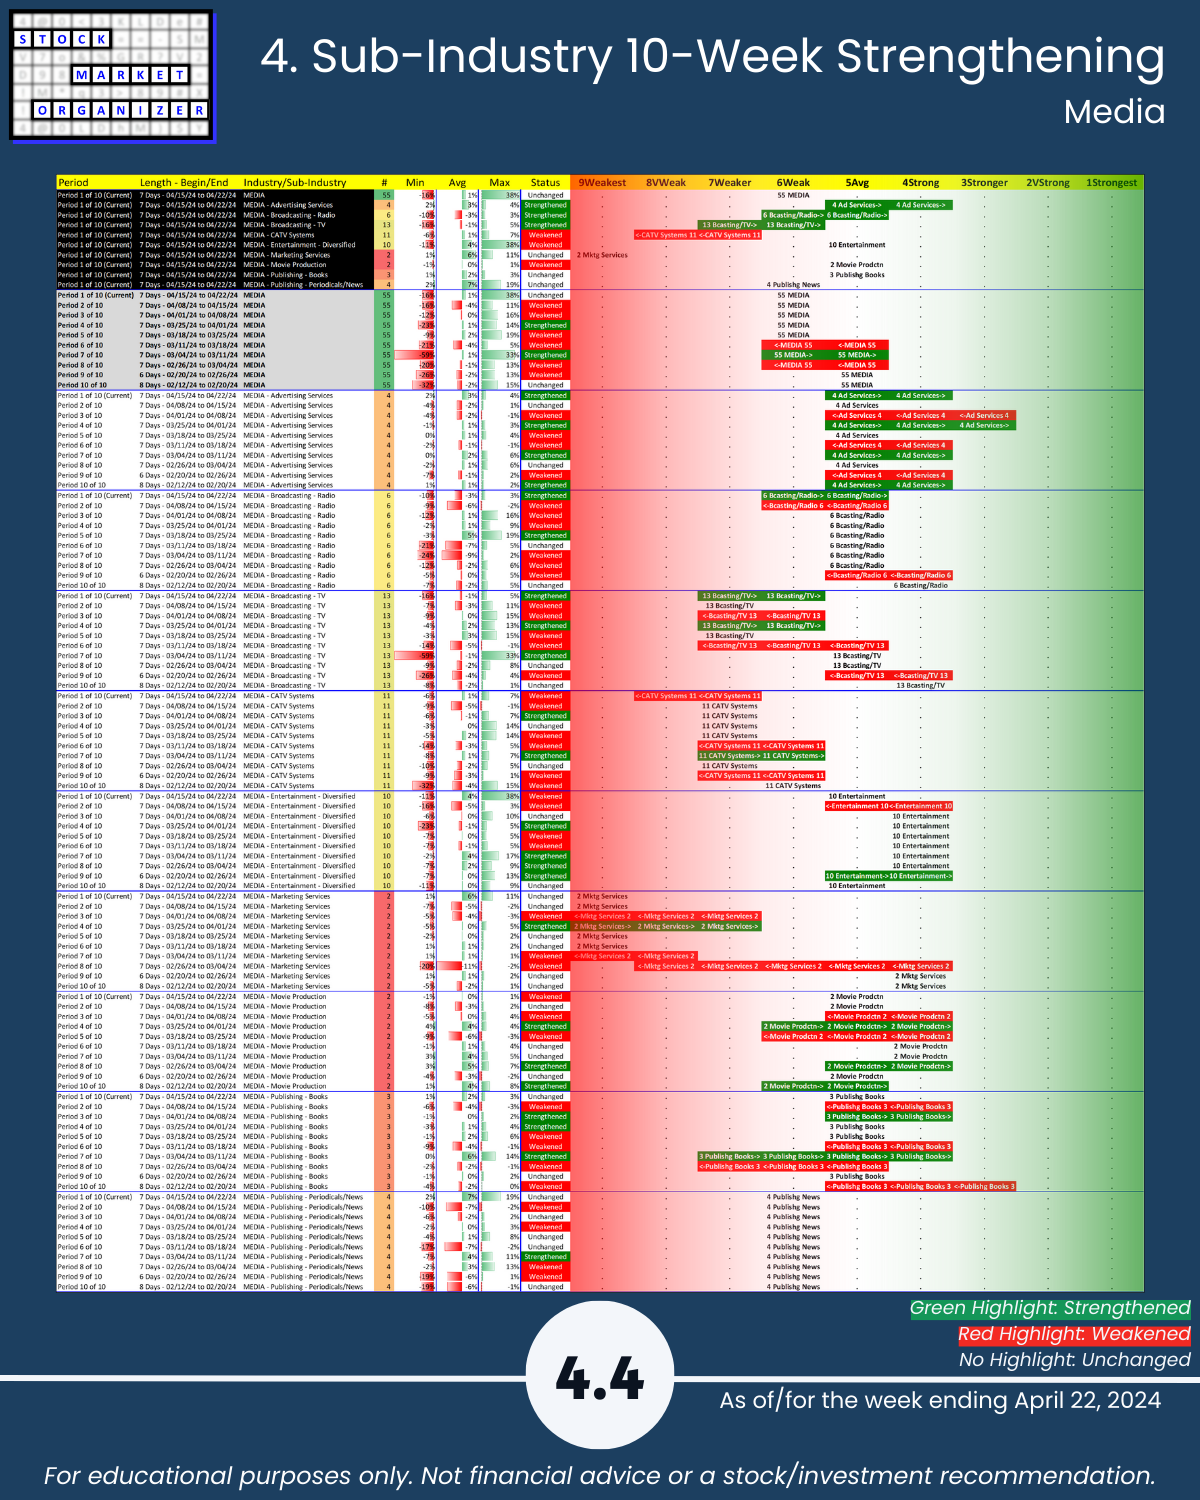
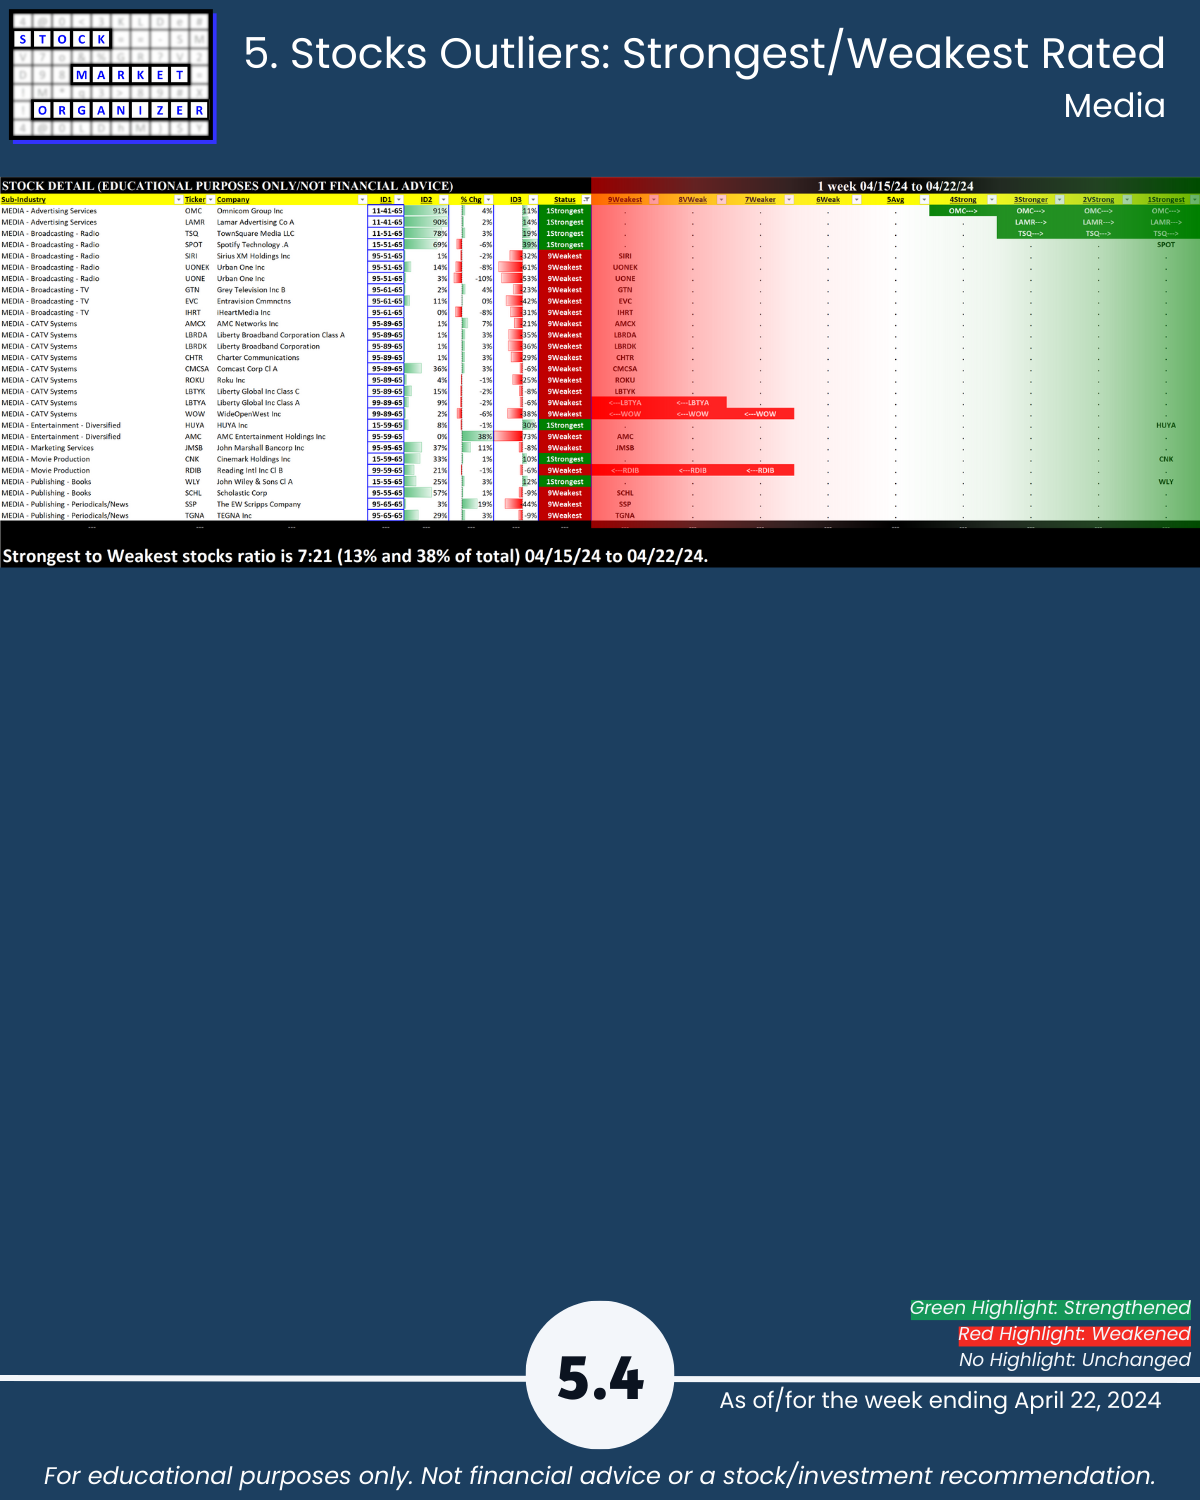
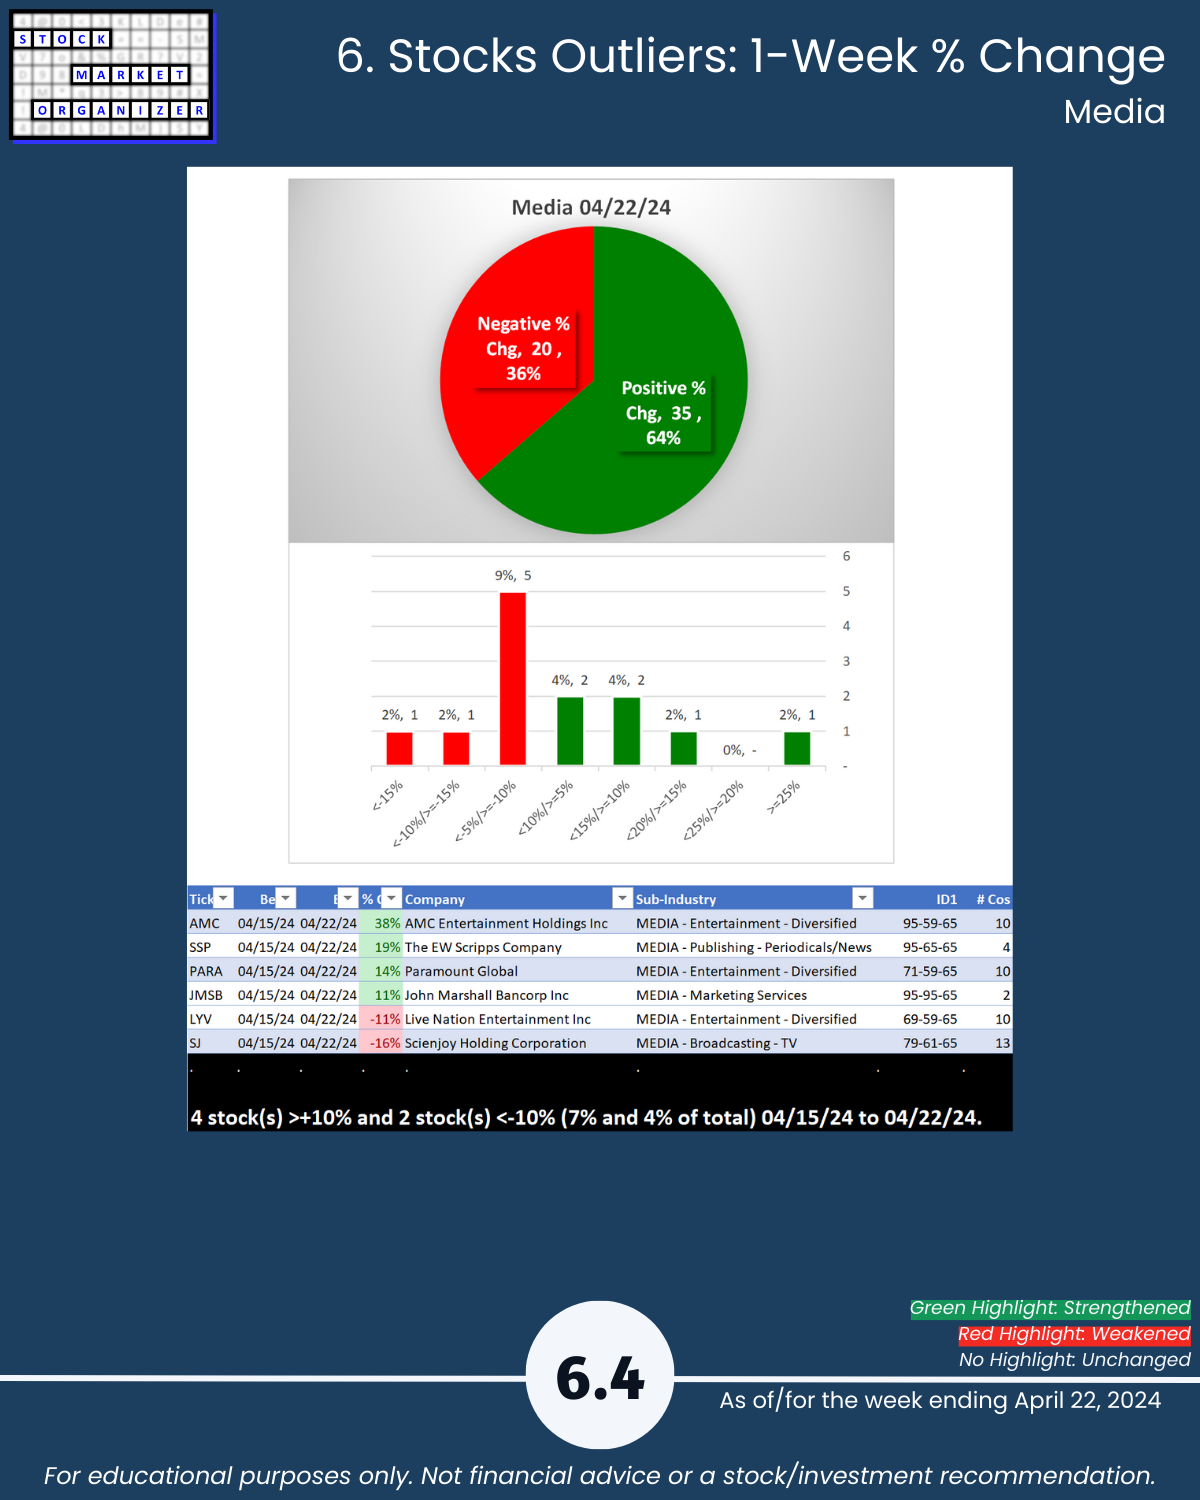
- Health Services, Media (6Weak)
🔹 Sub-industries (38)
- 24% Strengthened, 21% Weakened ranking
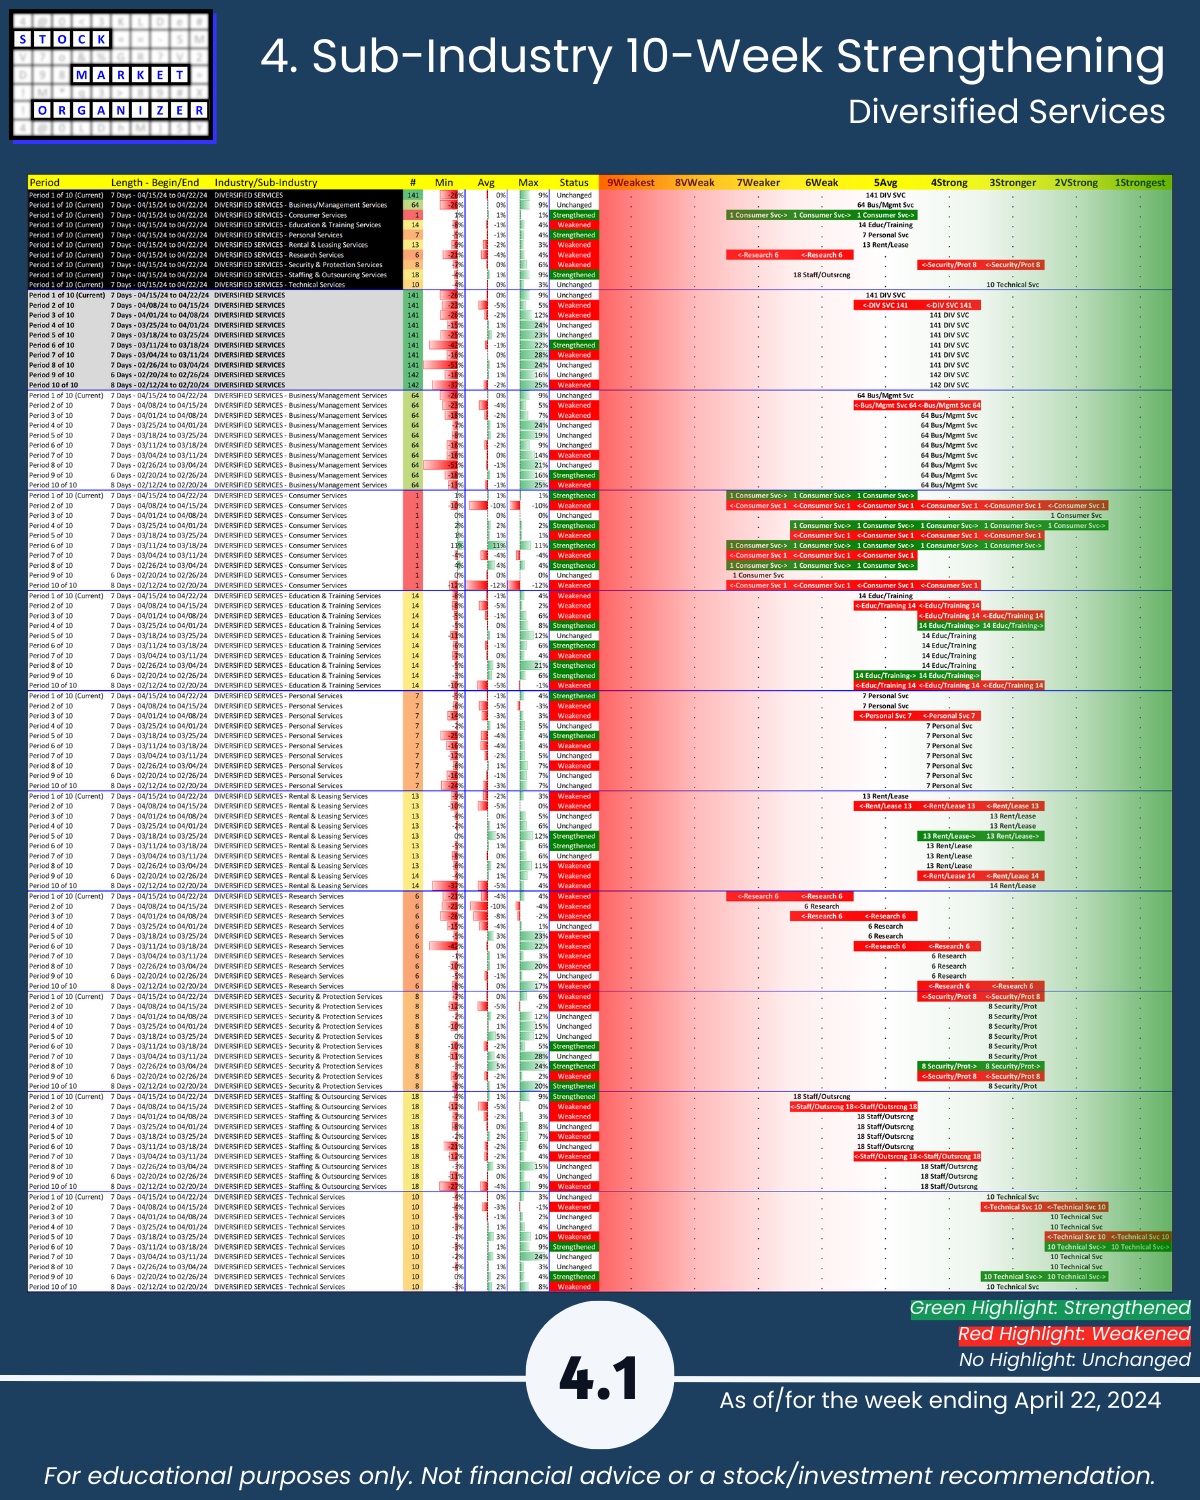
- Strongest: Technical Services (3Stronger)
- Weakest: CATV Systems, Water Utilities (8VWeak)
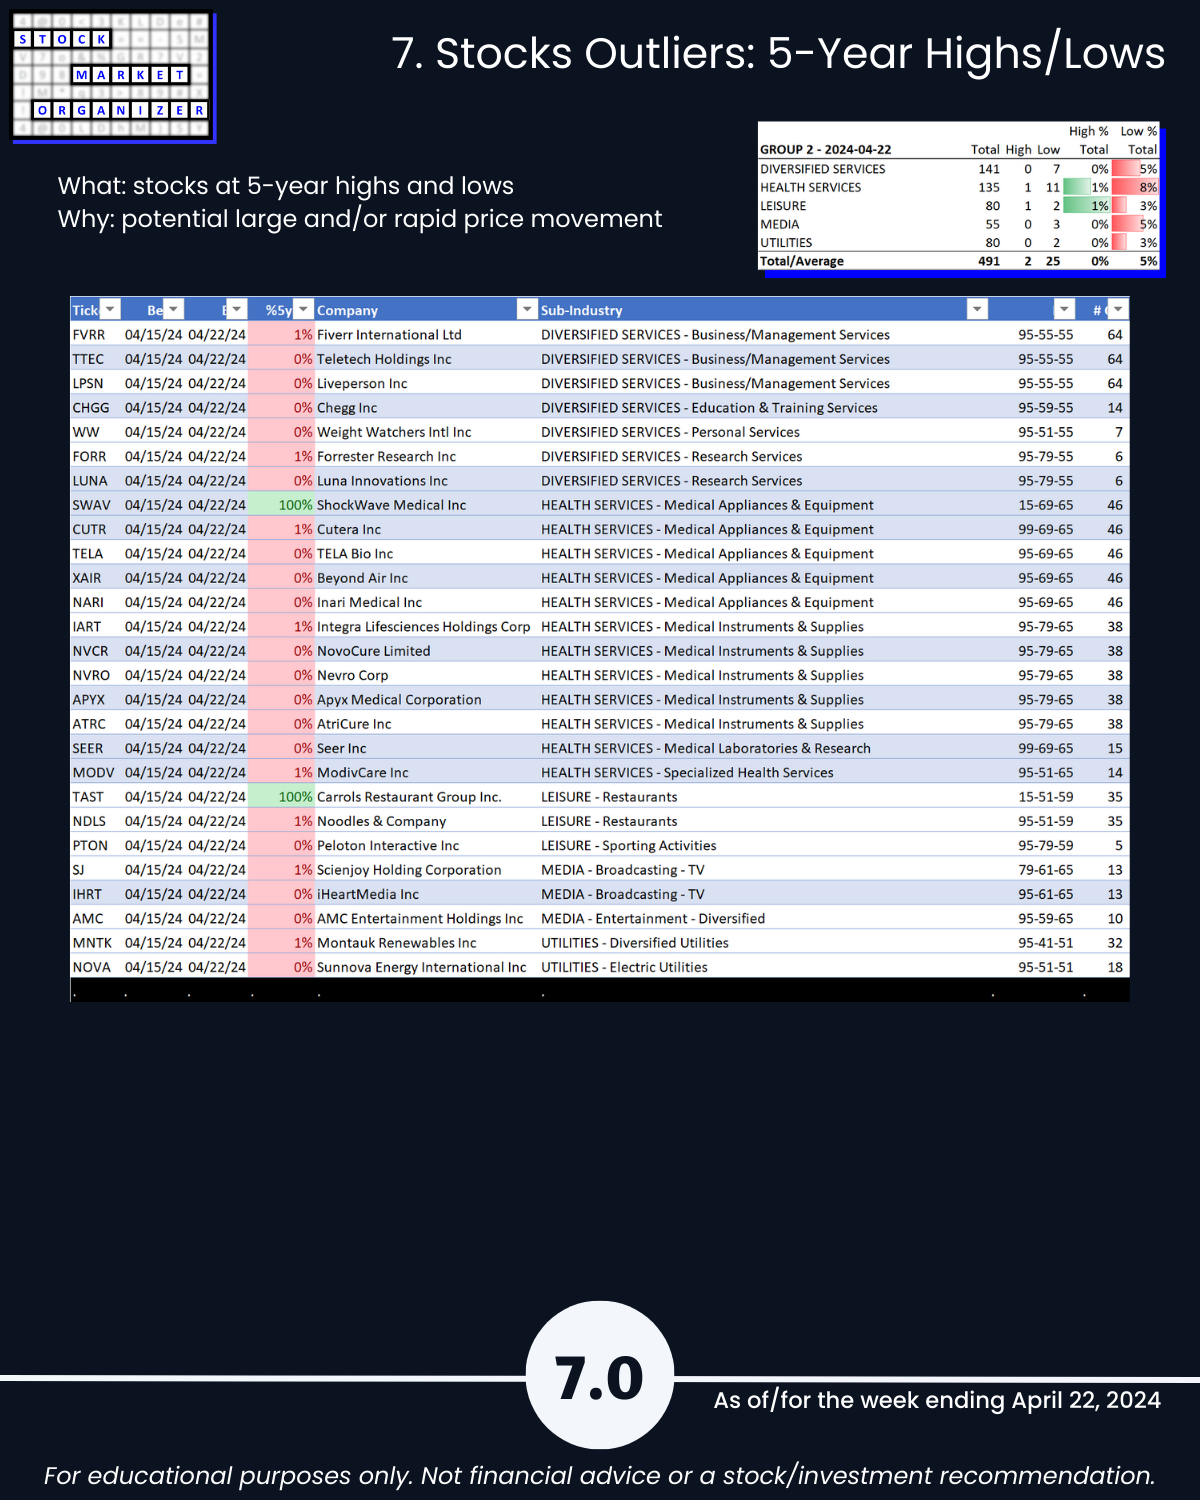
- @ 5 Year+ Highs/Lows: No outliers
🔹 Stocks
- Positive:Negative: Industry avg 53%/47%; Utilities 93% positive, Health Services 71% negative
- Strongest:Weakest: Industry avg 16%/27%; Health Services 13%:31%, Media 13%:38%
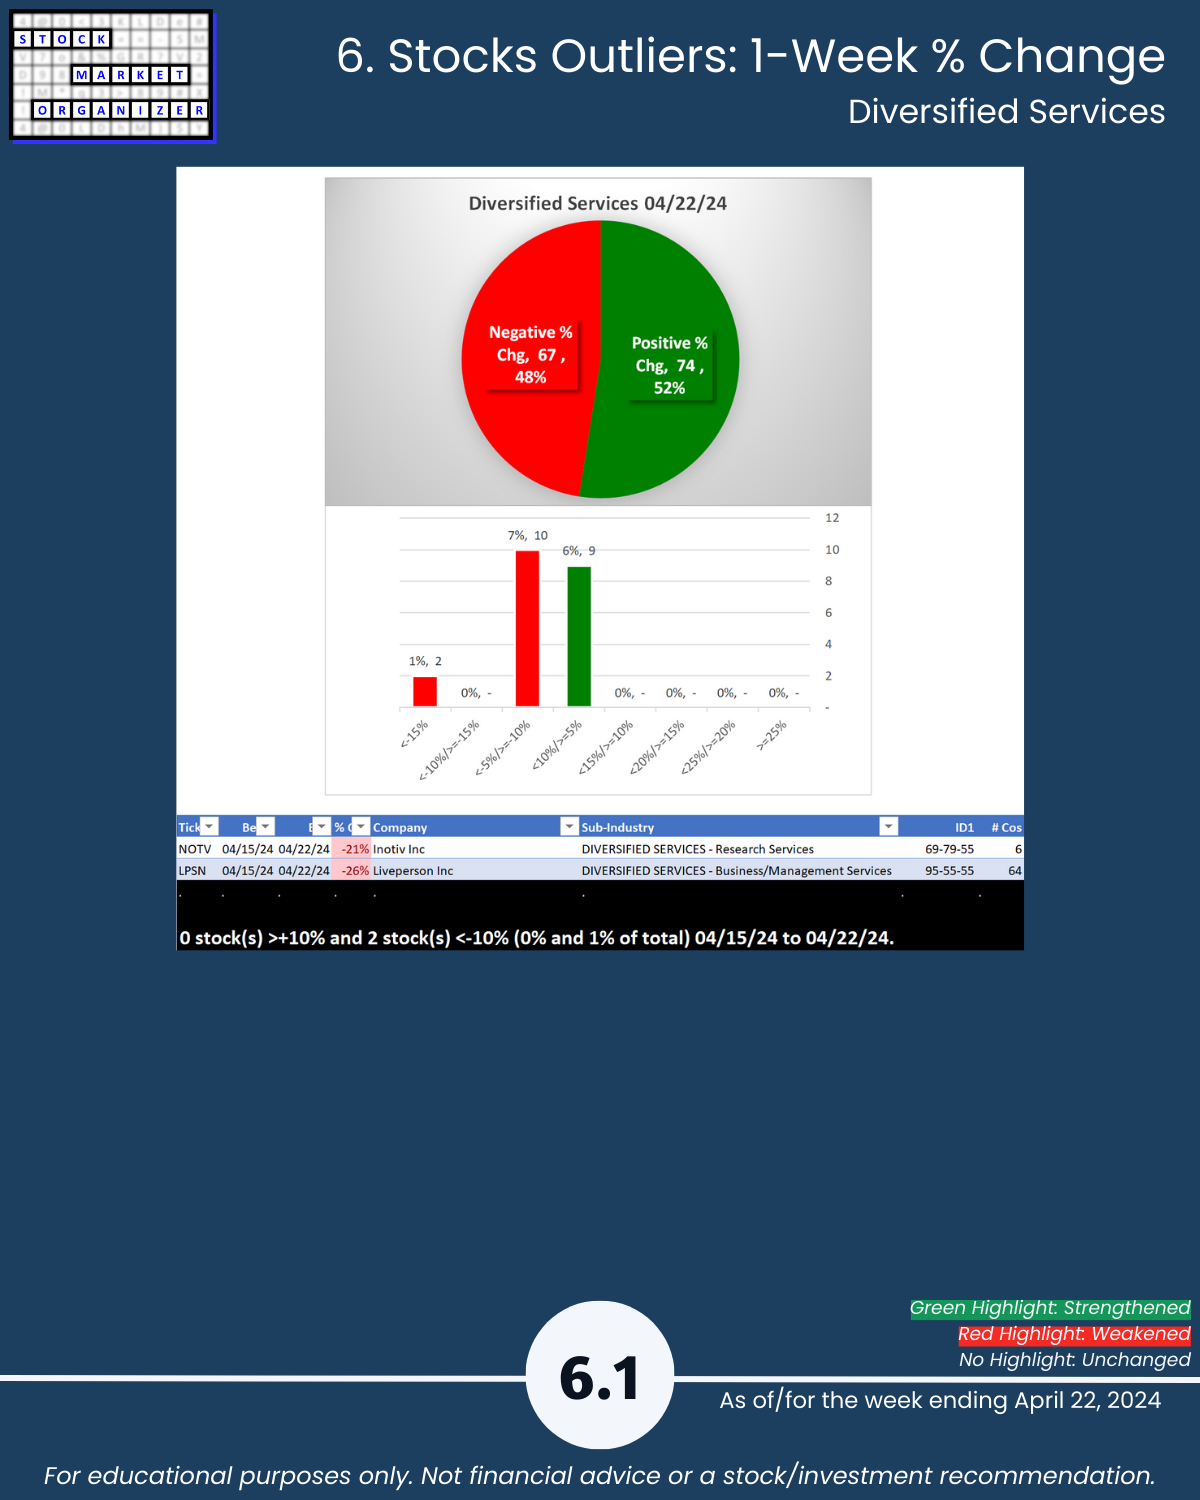
- Outlier Stocks: NOTV -21%, LPSN -26%; AMC +38%
This report may particularly be of interest if the following 5 concepts resonate with you:
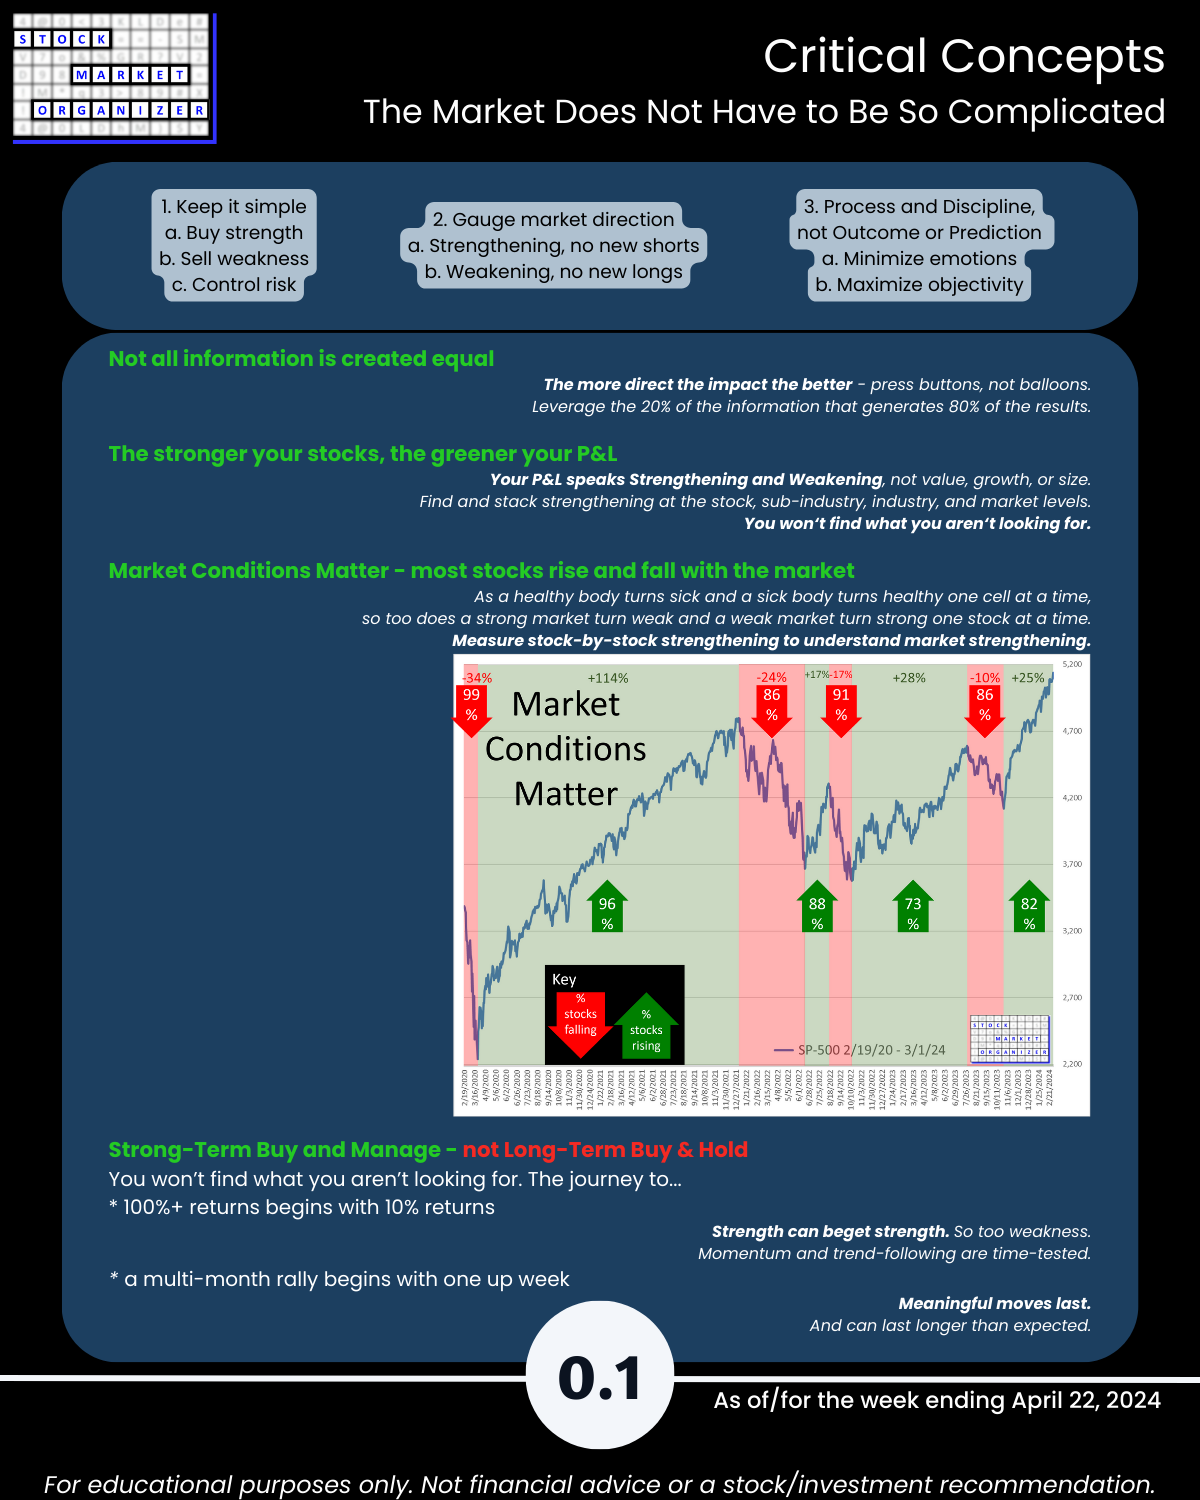
- The stronger your stocks, the greener your P&L.
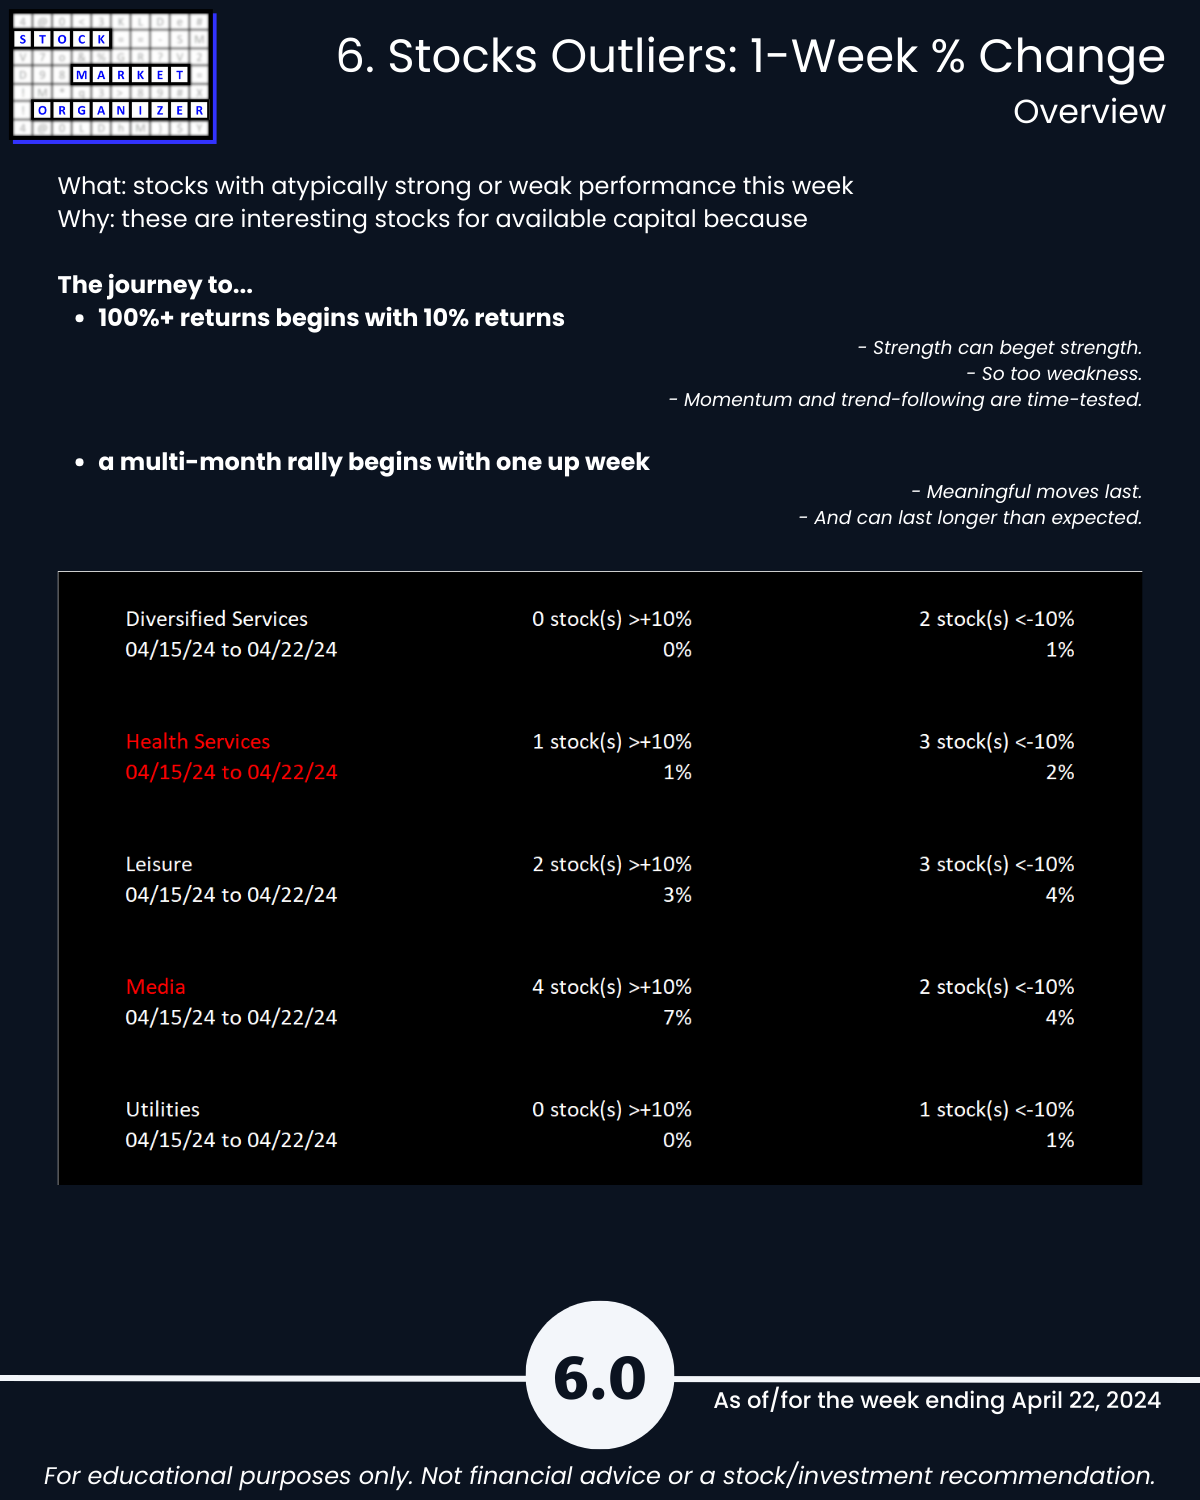
- The journey to 100%+ returns begins with 10% returns.
- The journey to a multi-month rally begins with one up week.
- Most stocks do what the market does. (While the market can only do what its underlying stocks, sub-industries, and industries do.)
- 80/20: not all information is created equal. (Press buttons, not balloons.)
Following are galleries with page-by-page views of this report.
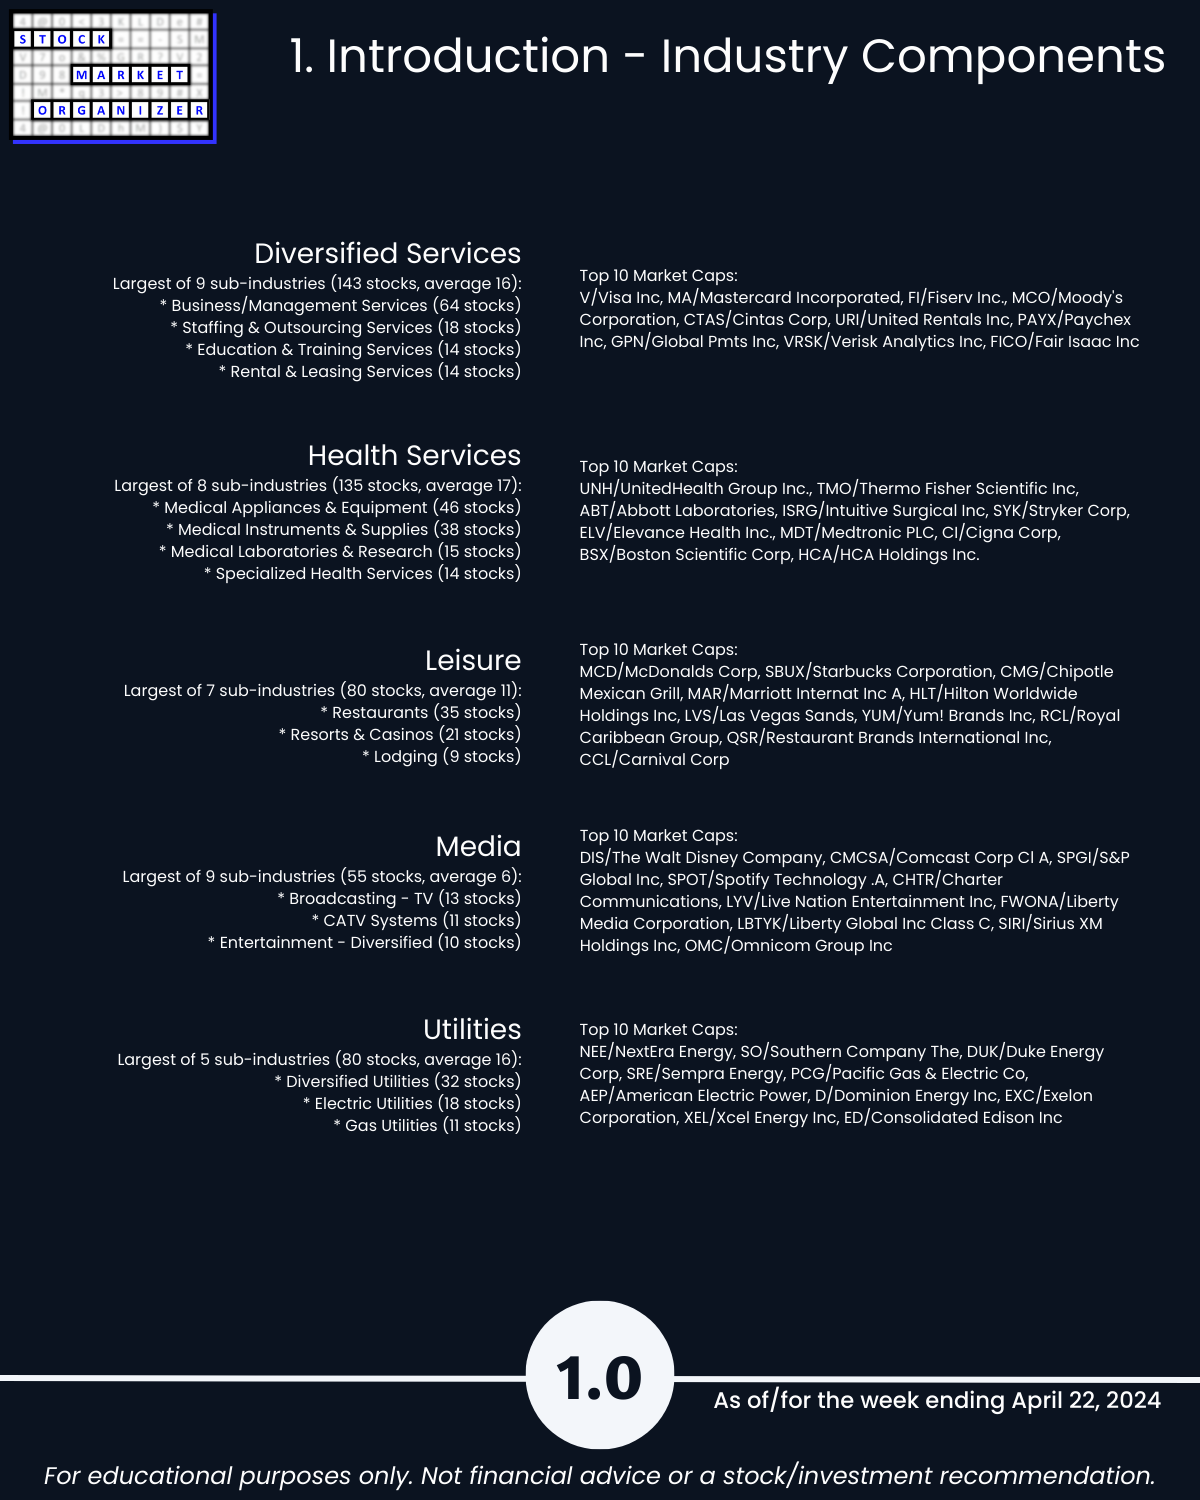
1. Introduction
2. Industry 1-Week Strengthening
3. Industry 10-Week Strengthening
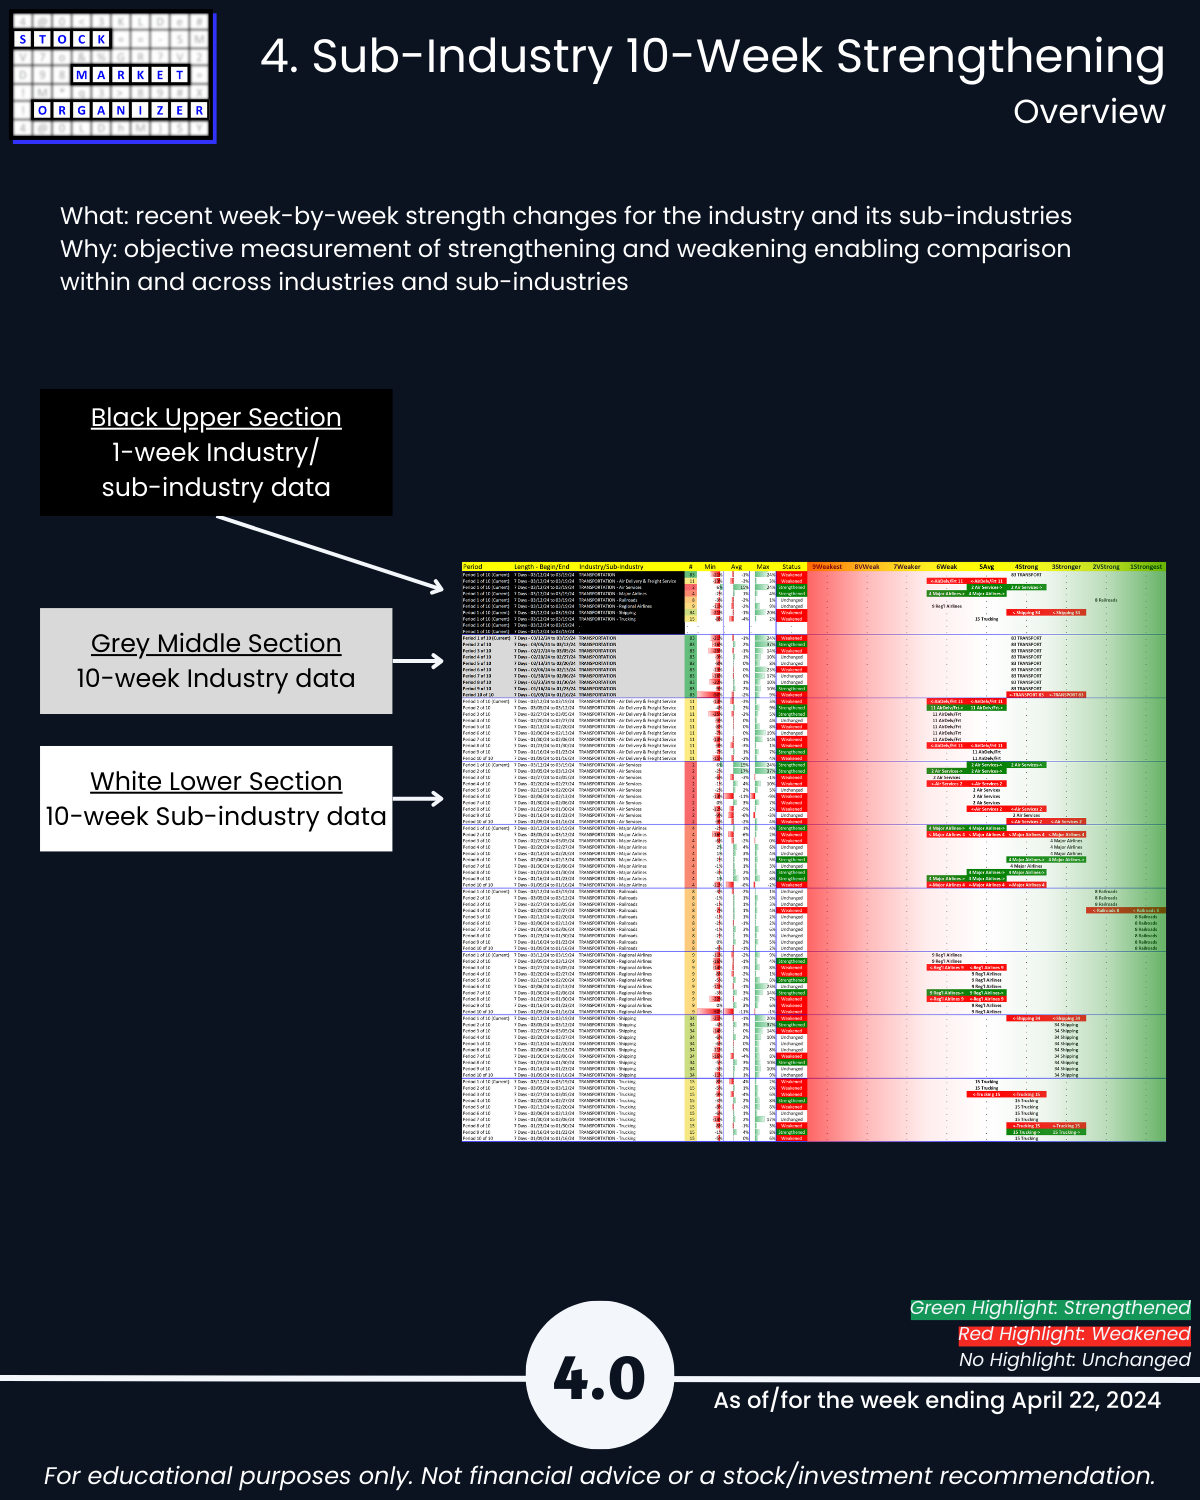
4. Sub-Industry 10-Week Strengthening
5. Stocks Outliers: Strongest/Weakest Rated
6. Stocks Outliers: 1-Week % Change
7. Stocks Outliers: 5-Year Highs/Lows