SMO Exclusive: Strength Report Group 2 2024-04-15

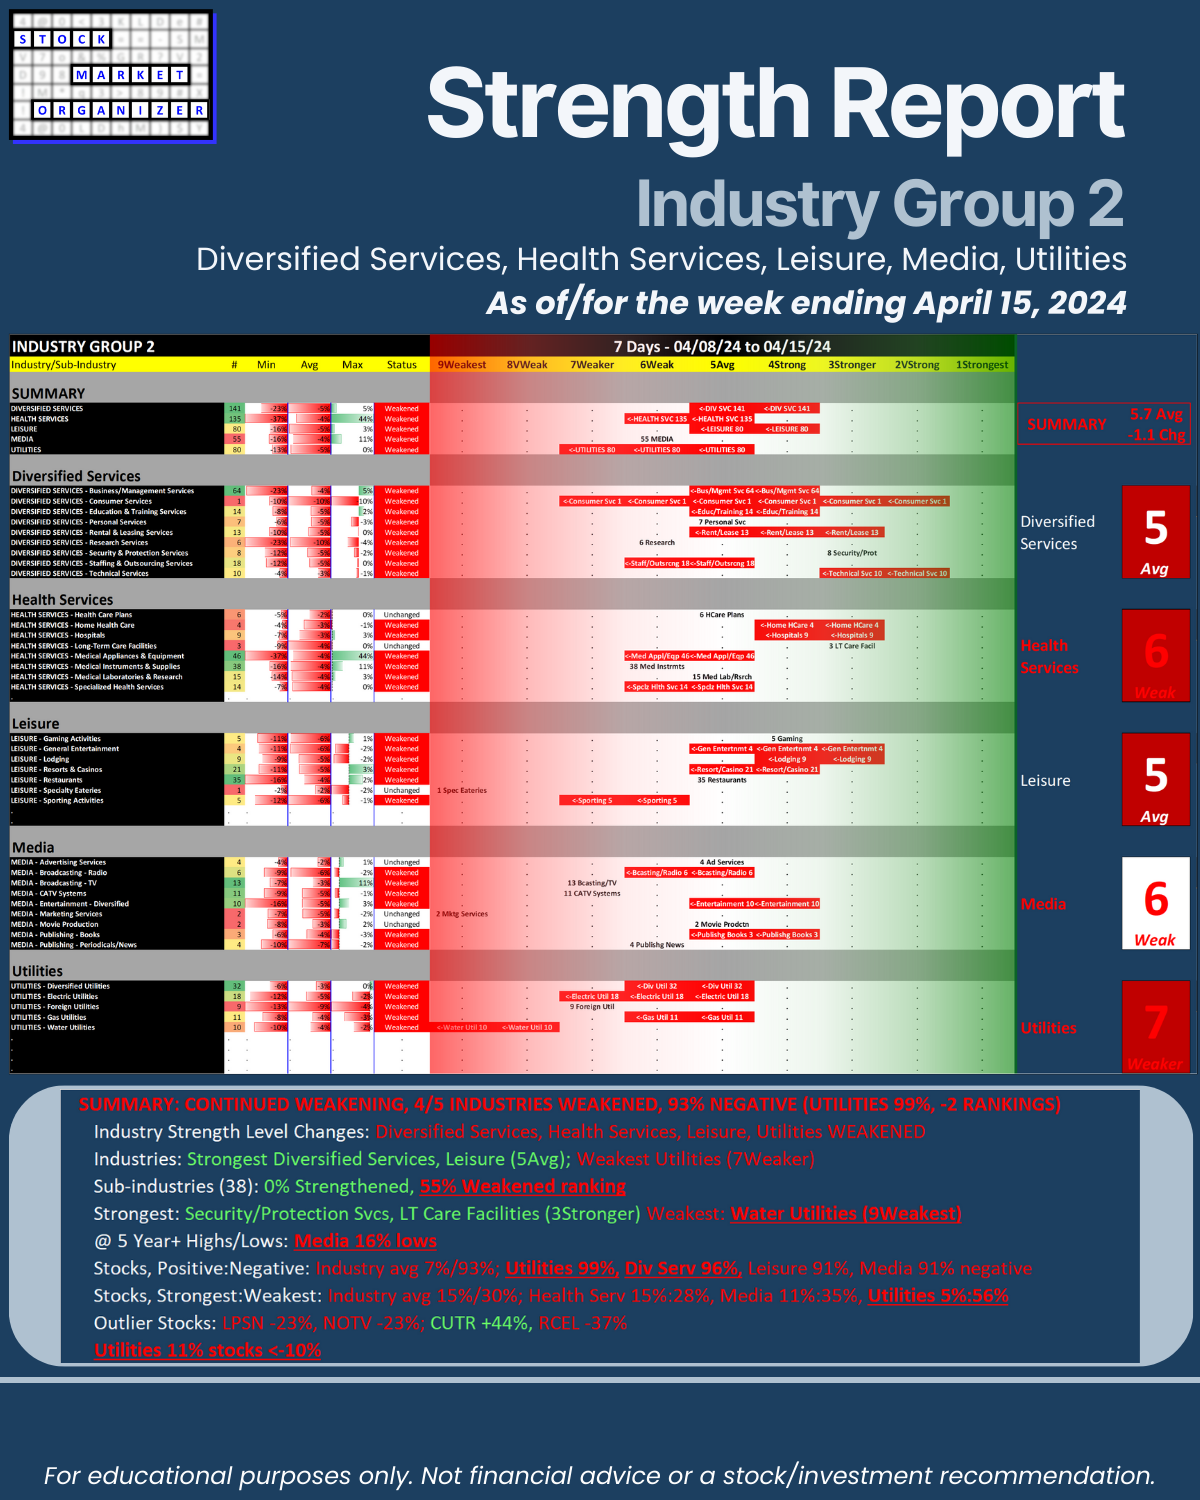
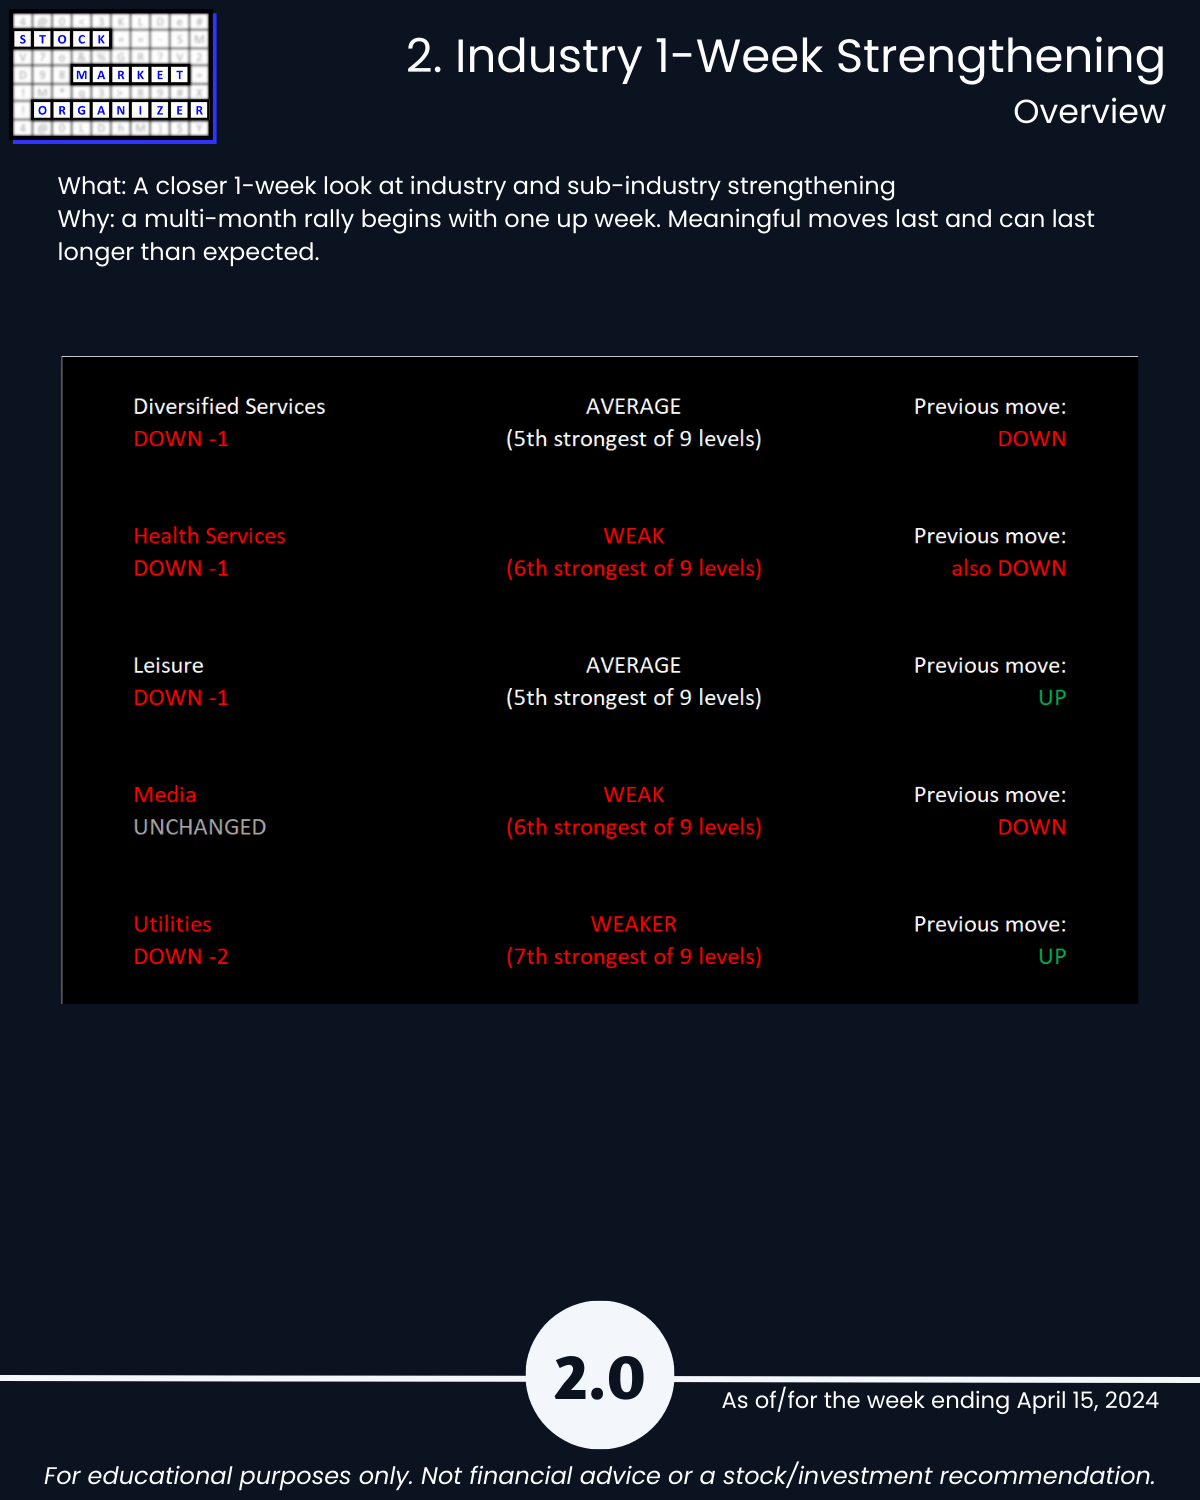
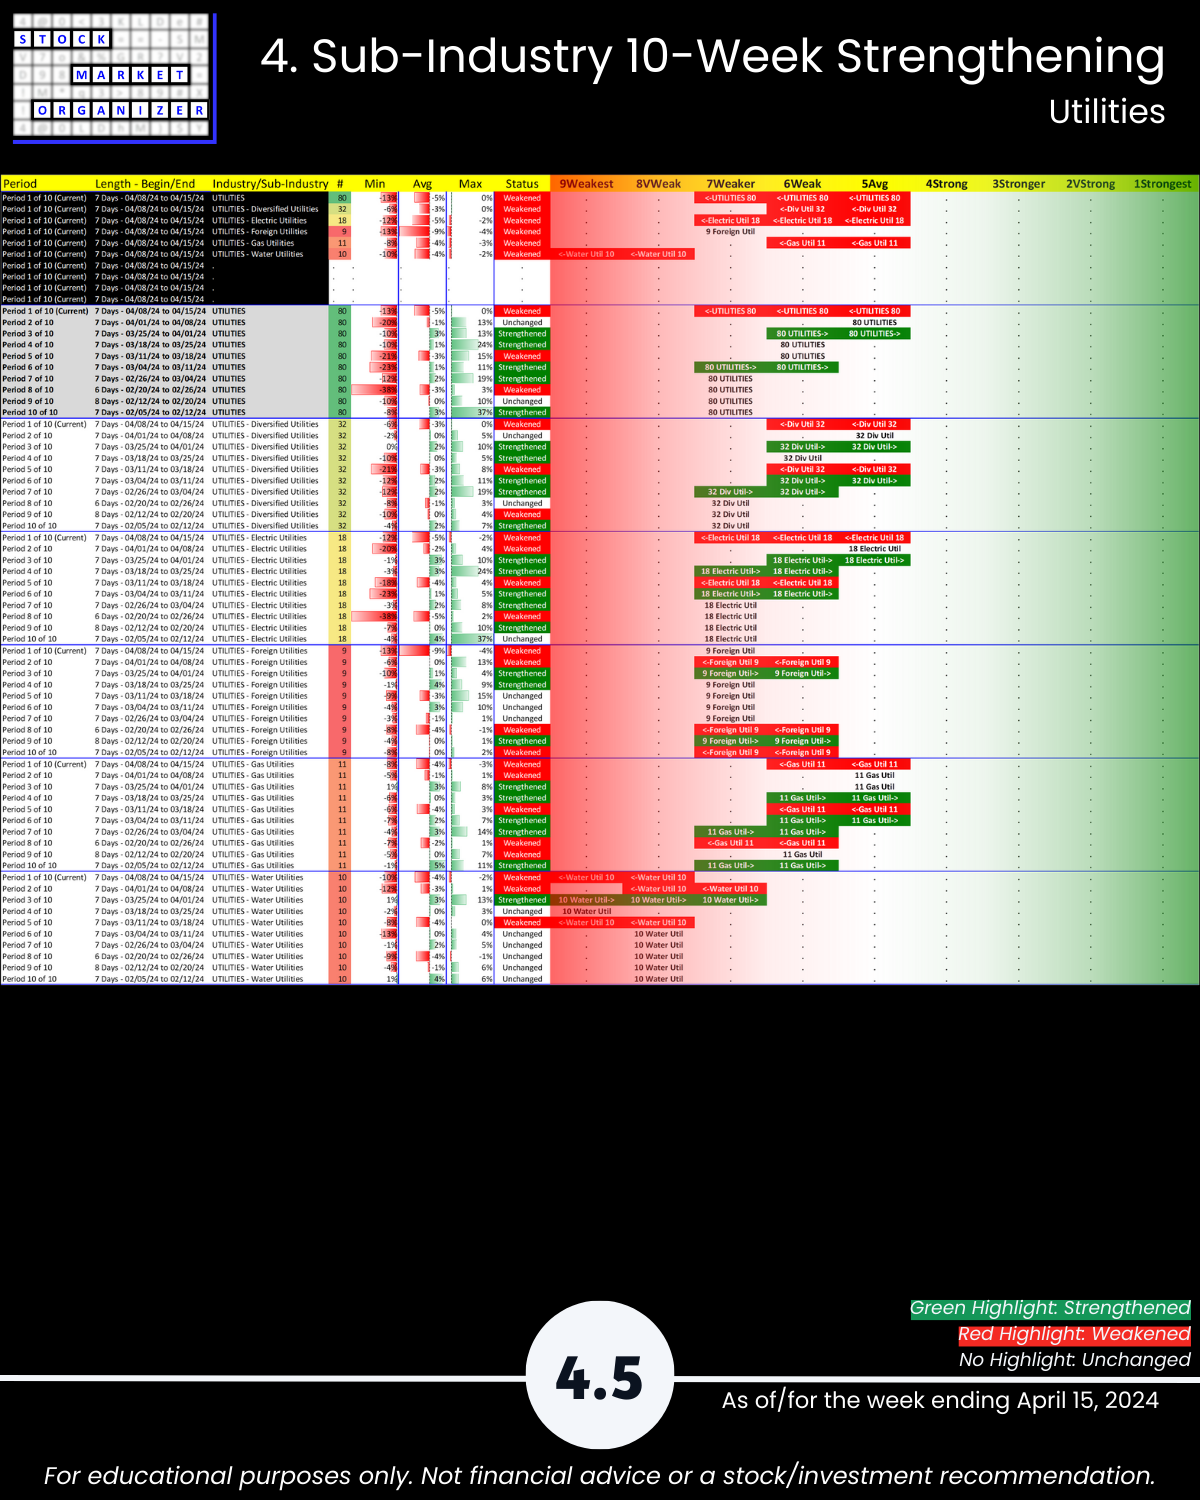
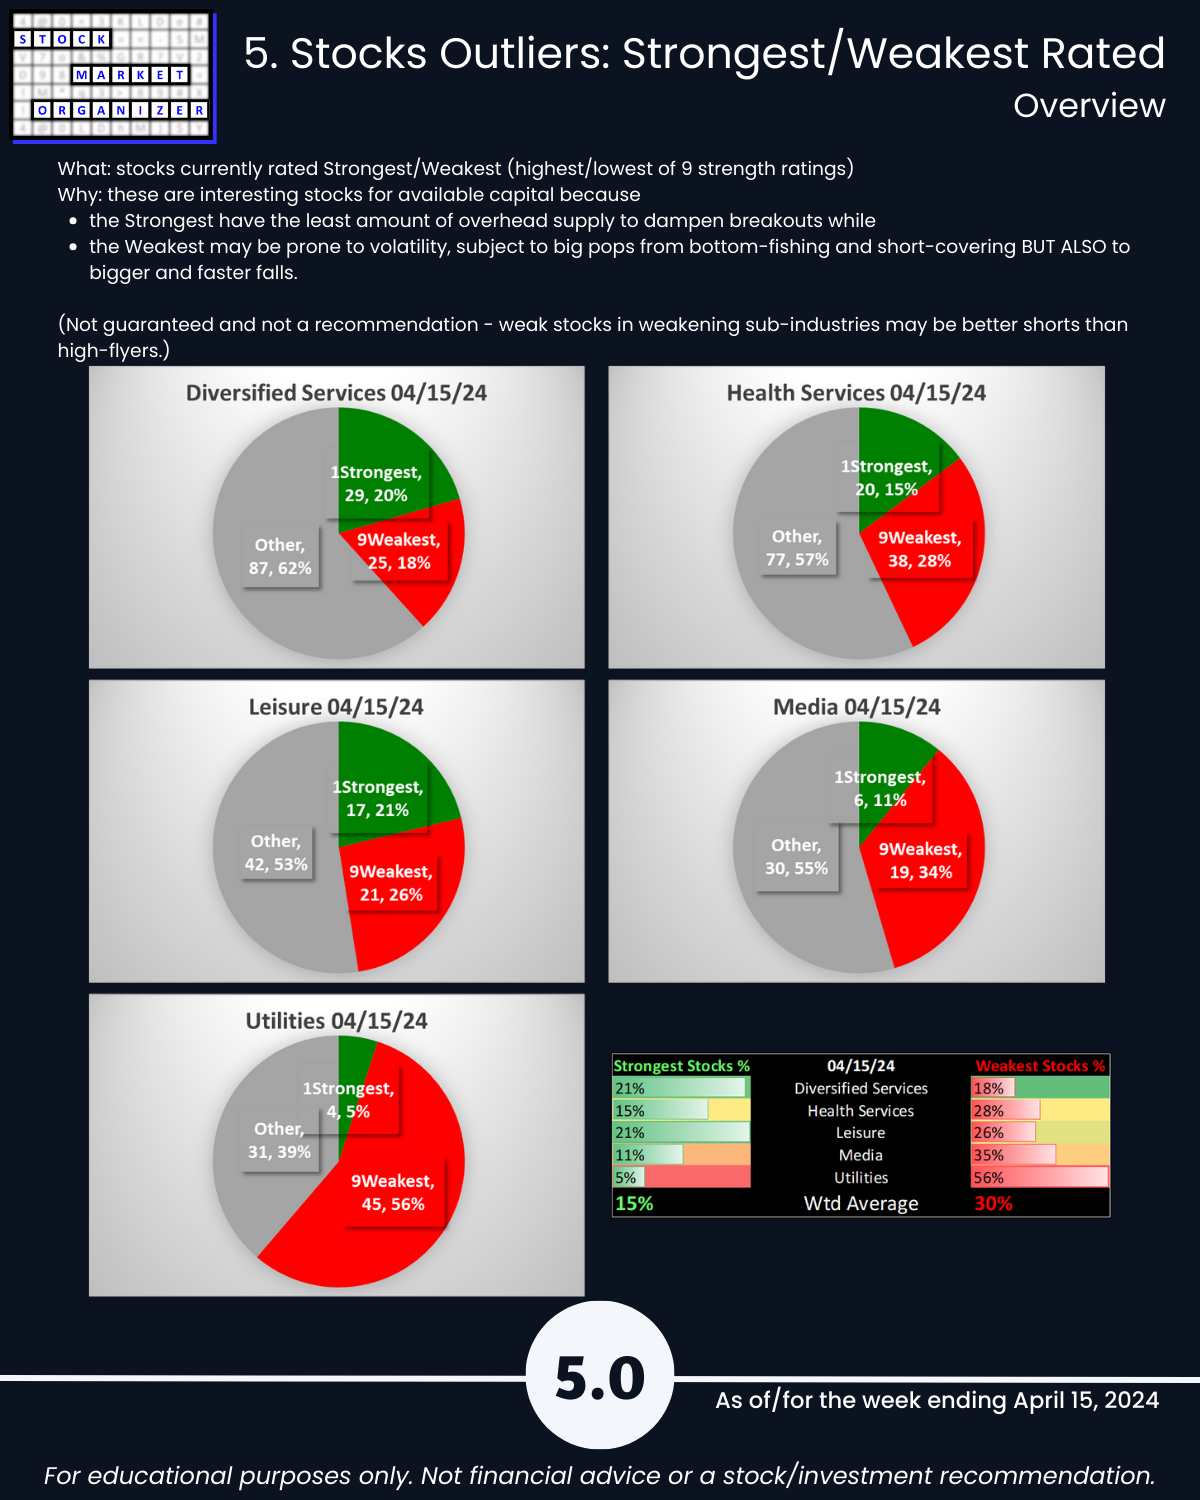
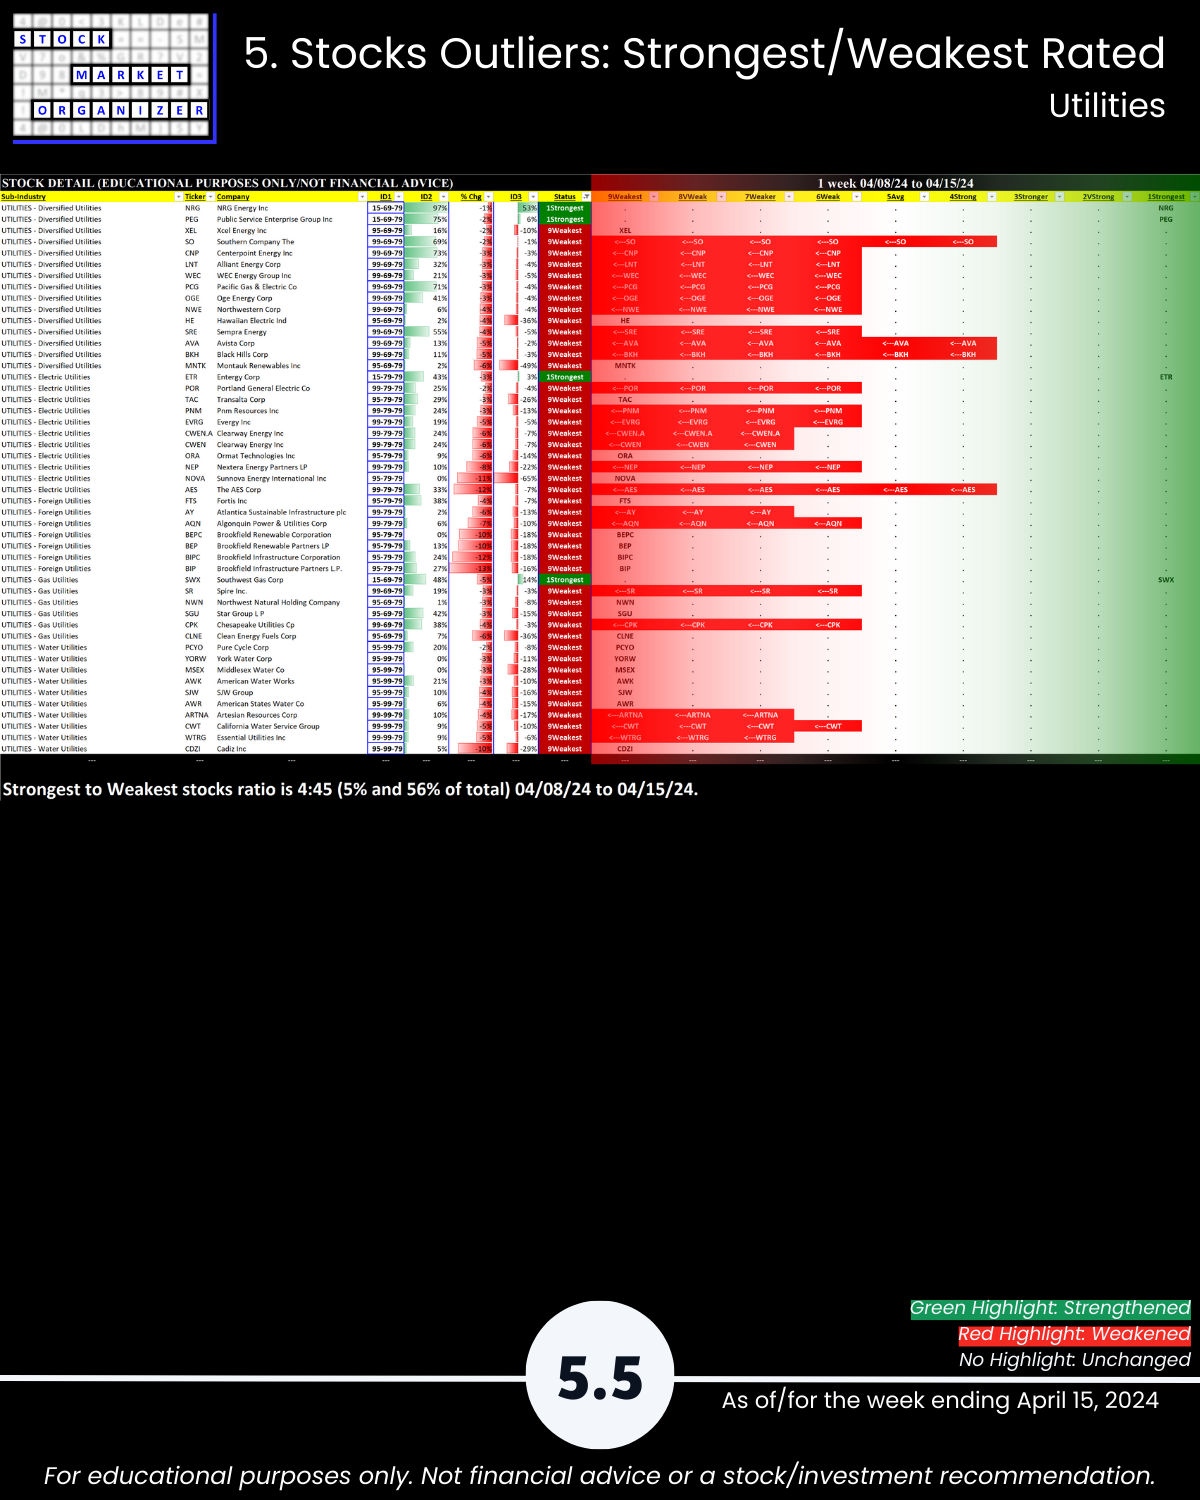
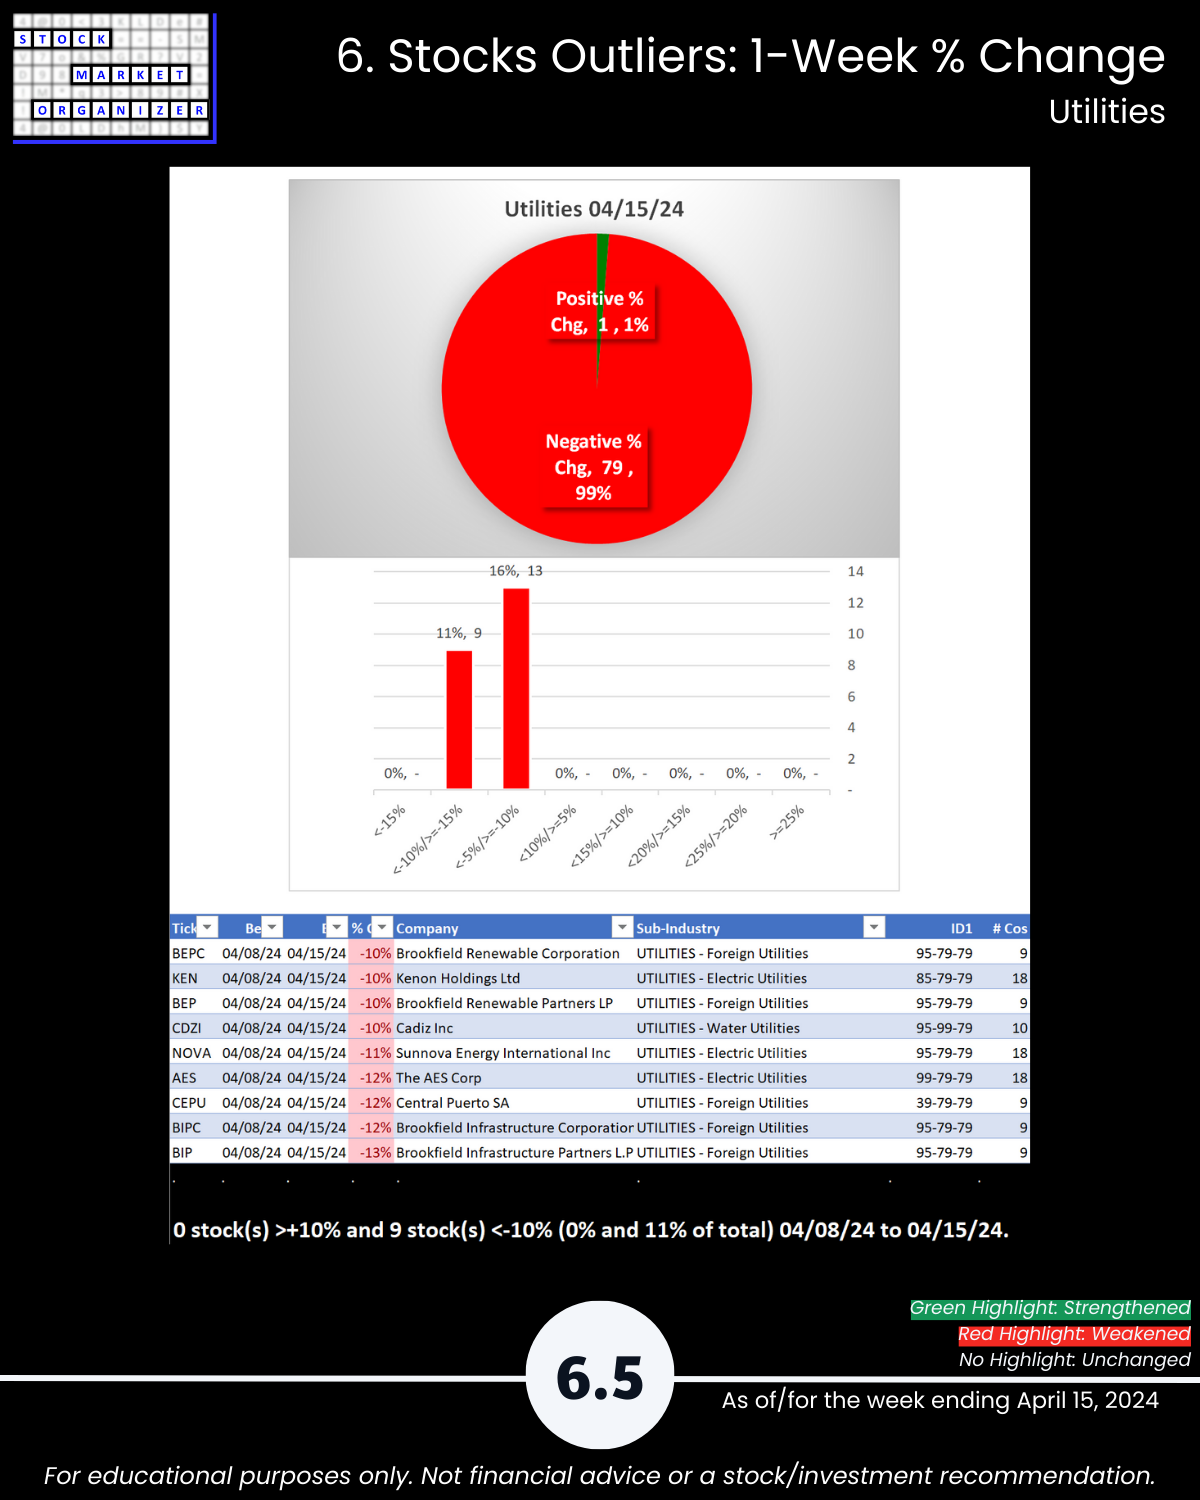
U.S. taxes due day 4/15/24 as longs are “taxed” with a loss to start the week, continuing recent market weakness. Especially Utilities: 🔹 Utilities -2 strength rankings to 7Weaker (7th strongest of 9 levels and now lowest of all 29 industries), 99% negative stocks with -5% average return for the week, 5%:56% 1Strongest:9Weakest stocks ratio, 11% stocks at 5+ year lows, 🔹 the Industry Group ranking fell by a large -1.1 to 5.7 weighted average composite ranking, 🔹 55% of sub-industries weakened rankings as 84% sub-industries weakened generally.
Time for mean reversion plays? Or run like the wind?
WHAT TO DO ABOUT UNCERTAINTY?
Hikes not cuts? Geopolitical instability? How to game plan for an uncertain world? Do you poll the smartest, most experienced, and well-read people you know? Or do you ask the market?
I ask the market. It is never wrong. Even when it is “wrong” about fundamentals because emotions have decoupled prices from these fundamentals.
TRUTHS
🔹 This decoupling provides opportunity. The stronger your stocks, the greener your P&L.
🔹 The strength of your stocks is impacted by sub-industry, industry, sector, and market forces.
Act accordingly.
ANALYSIS SCHEDULE AND SCOPE
I uncover existing and emerging strength through on-going strength measurement in 29 industries, 198 sub-industries, and almost 2,700 stocks.
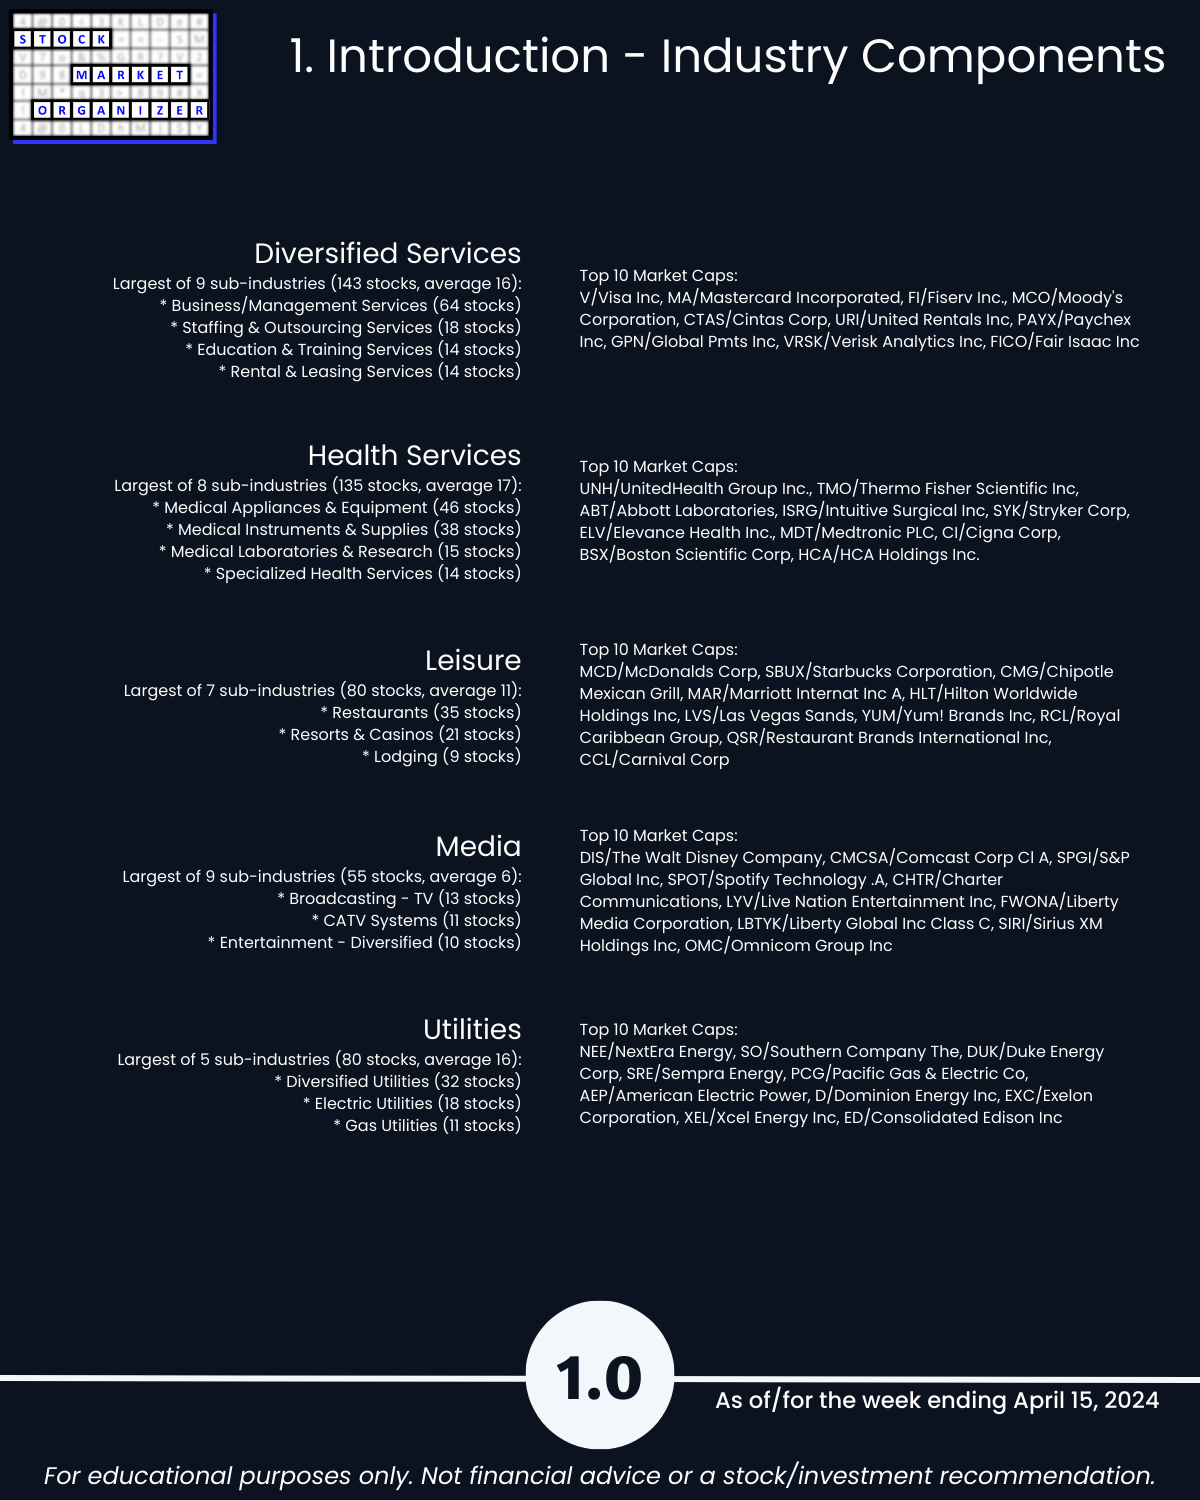
Today: Industry Group 2 – loosely, services (Diversified Services, Health Services, Leisure, Media, and Utilities).
Rest of the week: 5 other sectors/industry groupings: Consumer, Financial, and Tech sectors, and industry groups 1 and 3 (1 = Automotive, Energy, Materials & Construction, Metals & Mining, and Transportation, and 3 = Aerospace/Defense, Chemicals, Drugs, Manufacturing, and Wholesale).
After Friday action weekly, I typically issue my Consumer and Industry Group 3 reports along with my comprehensive market report.
LOWLIGHTS
CONTINUED WEAKENING, 4/5 INDUSTRIES WEAKENED, 93% NEGATIVE (UTILITIES 99%, -2 RANKINGS)
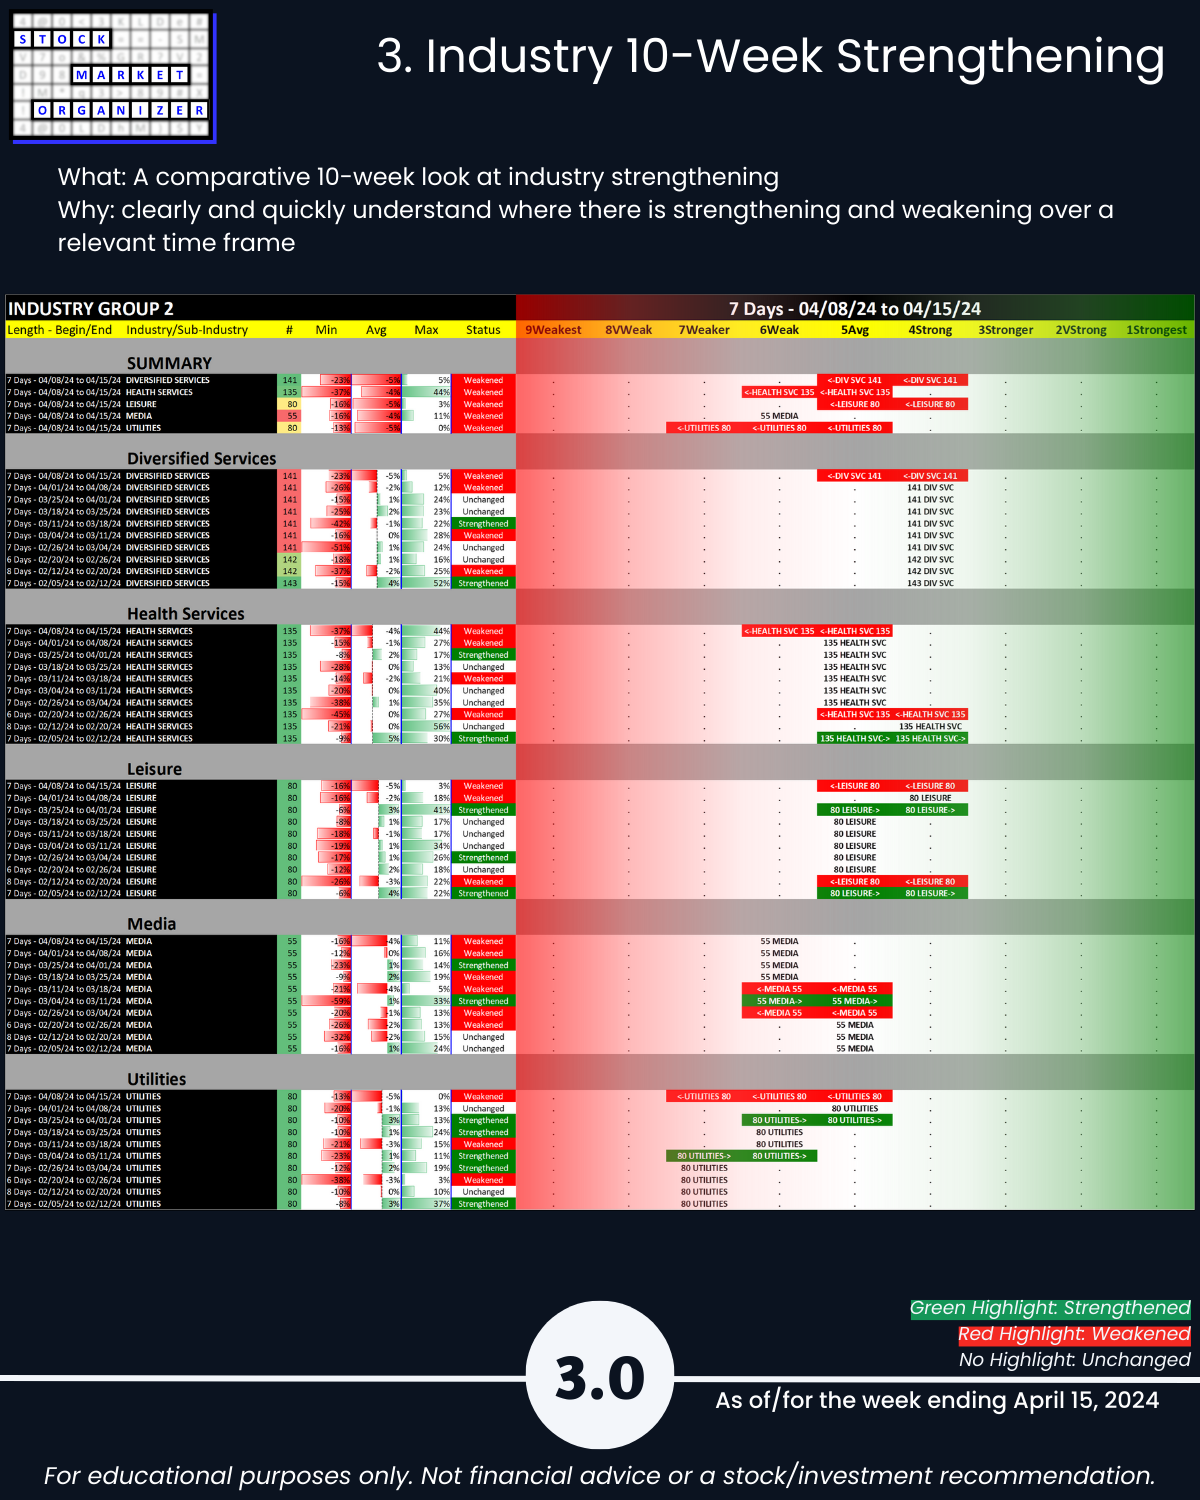
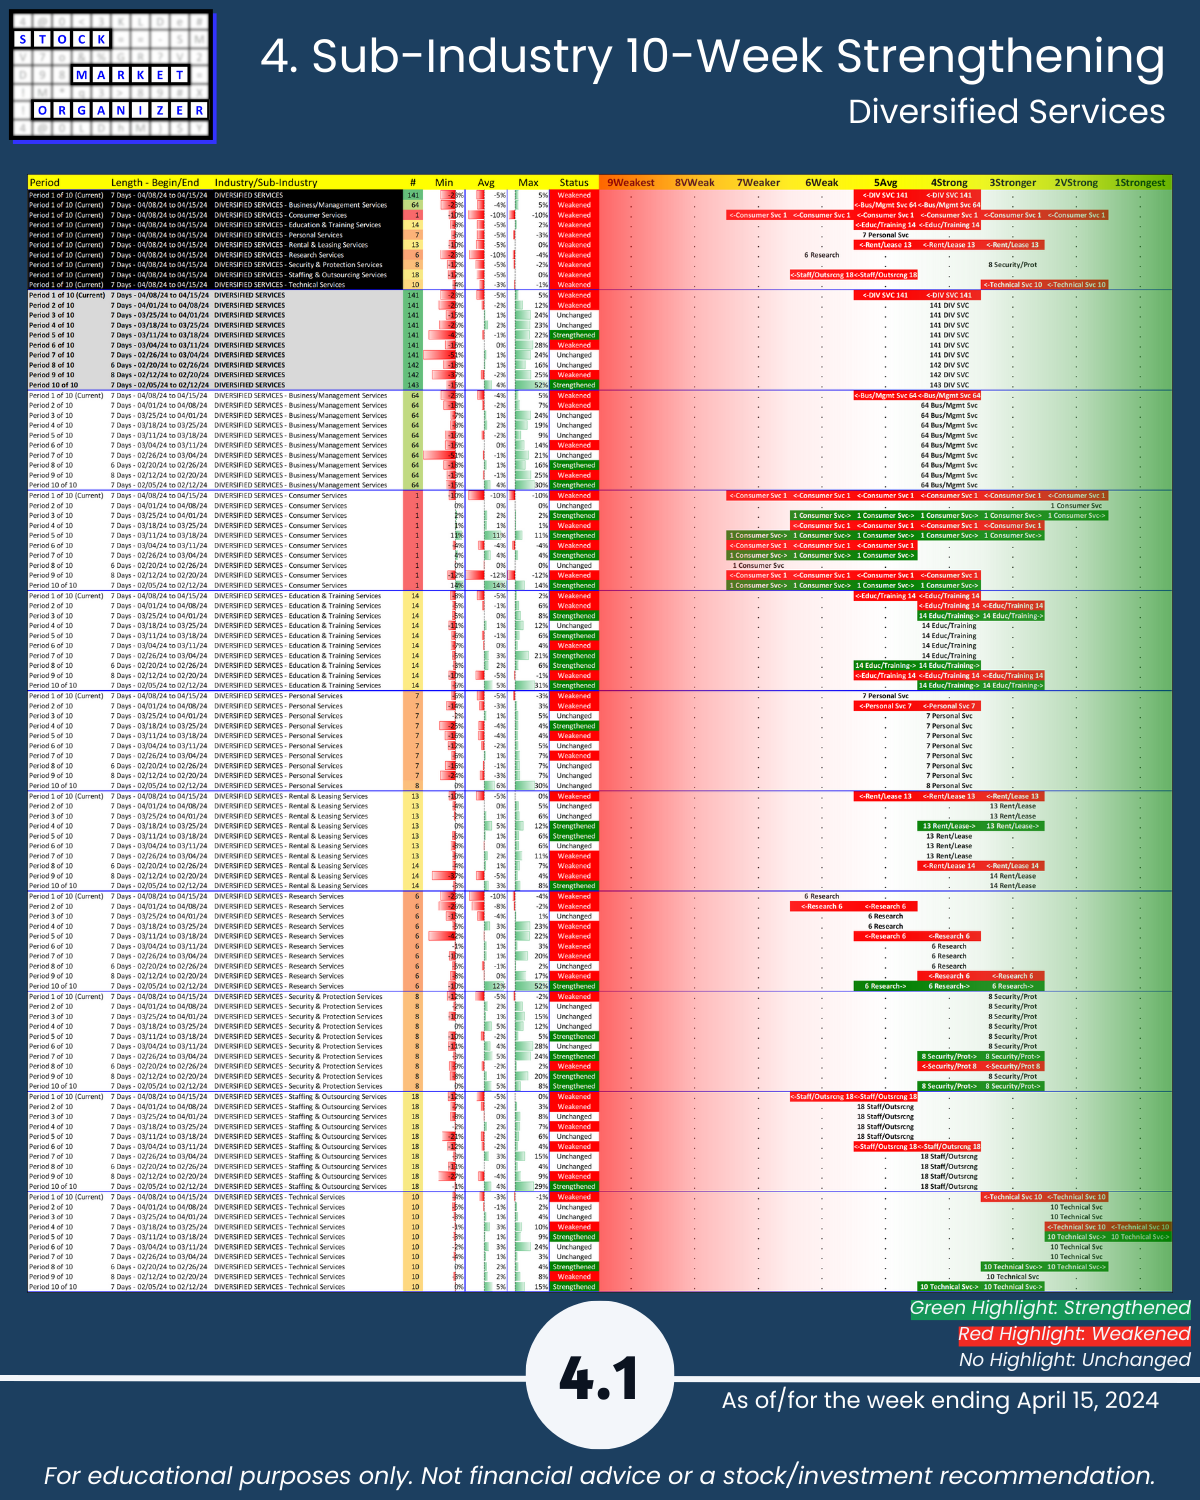
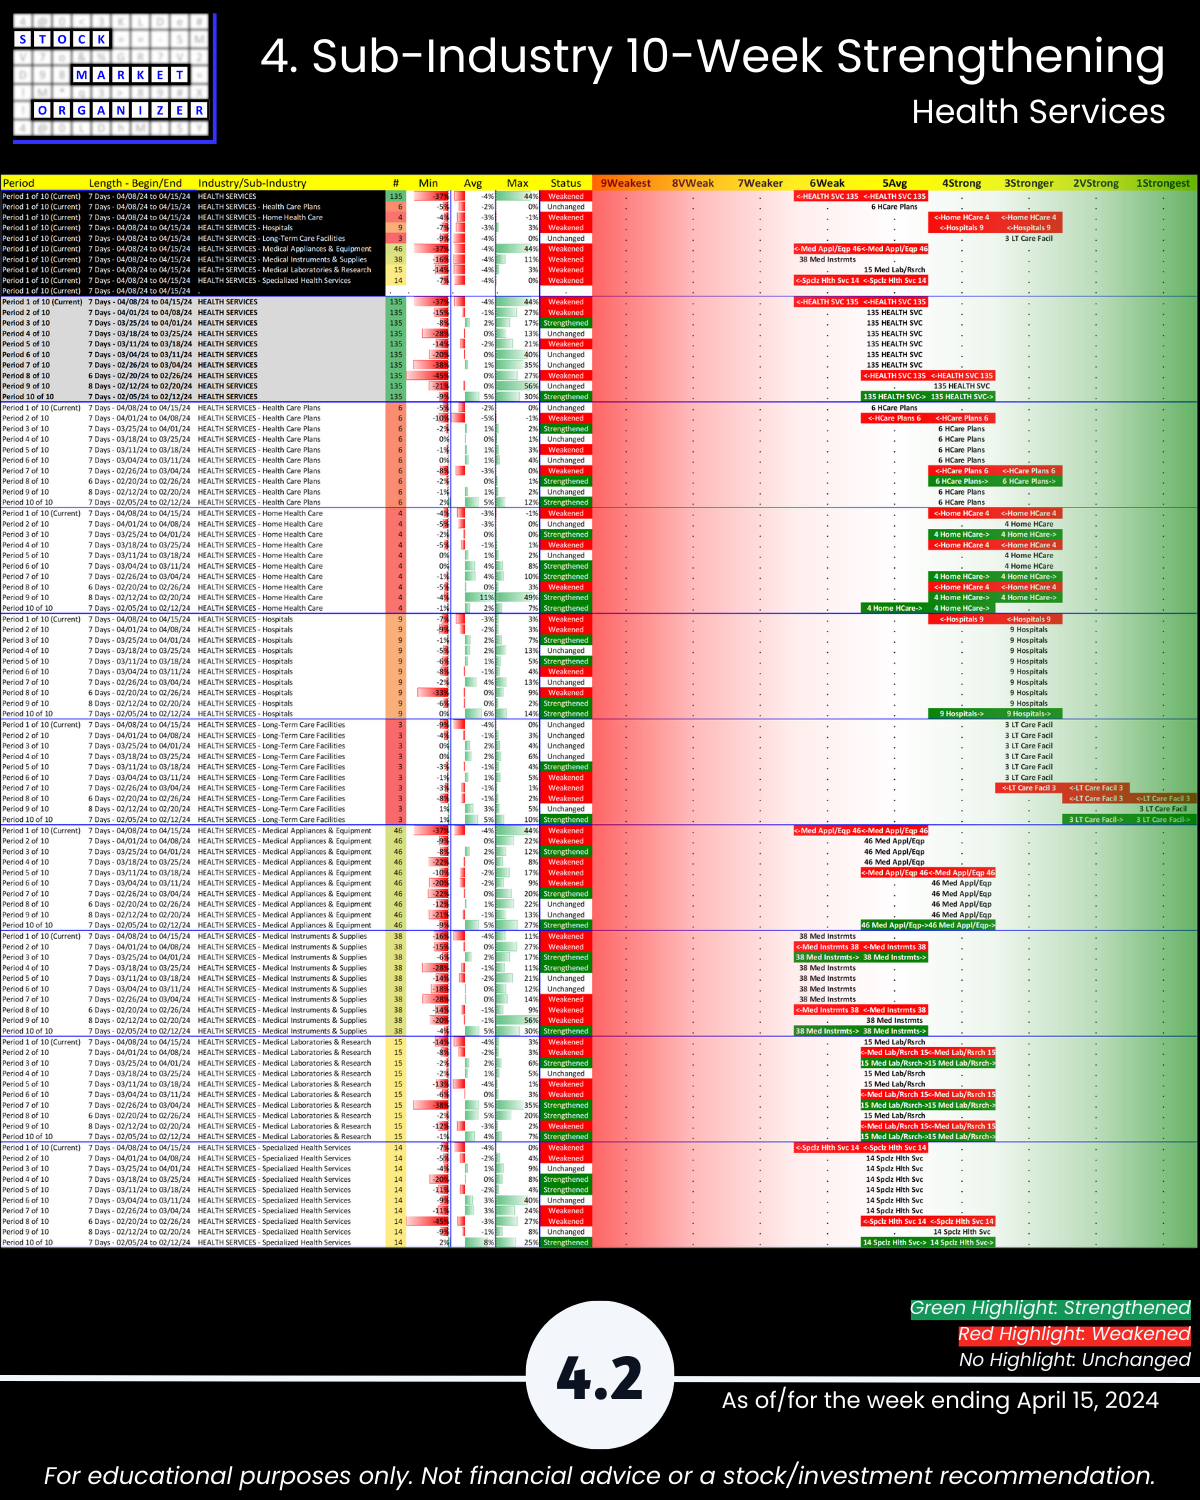
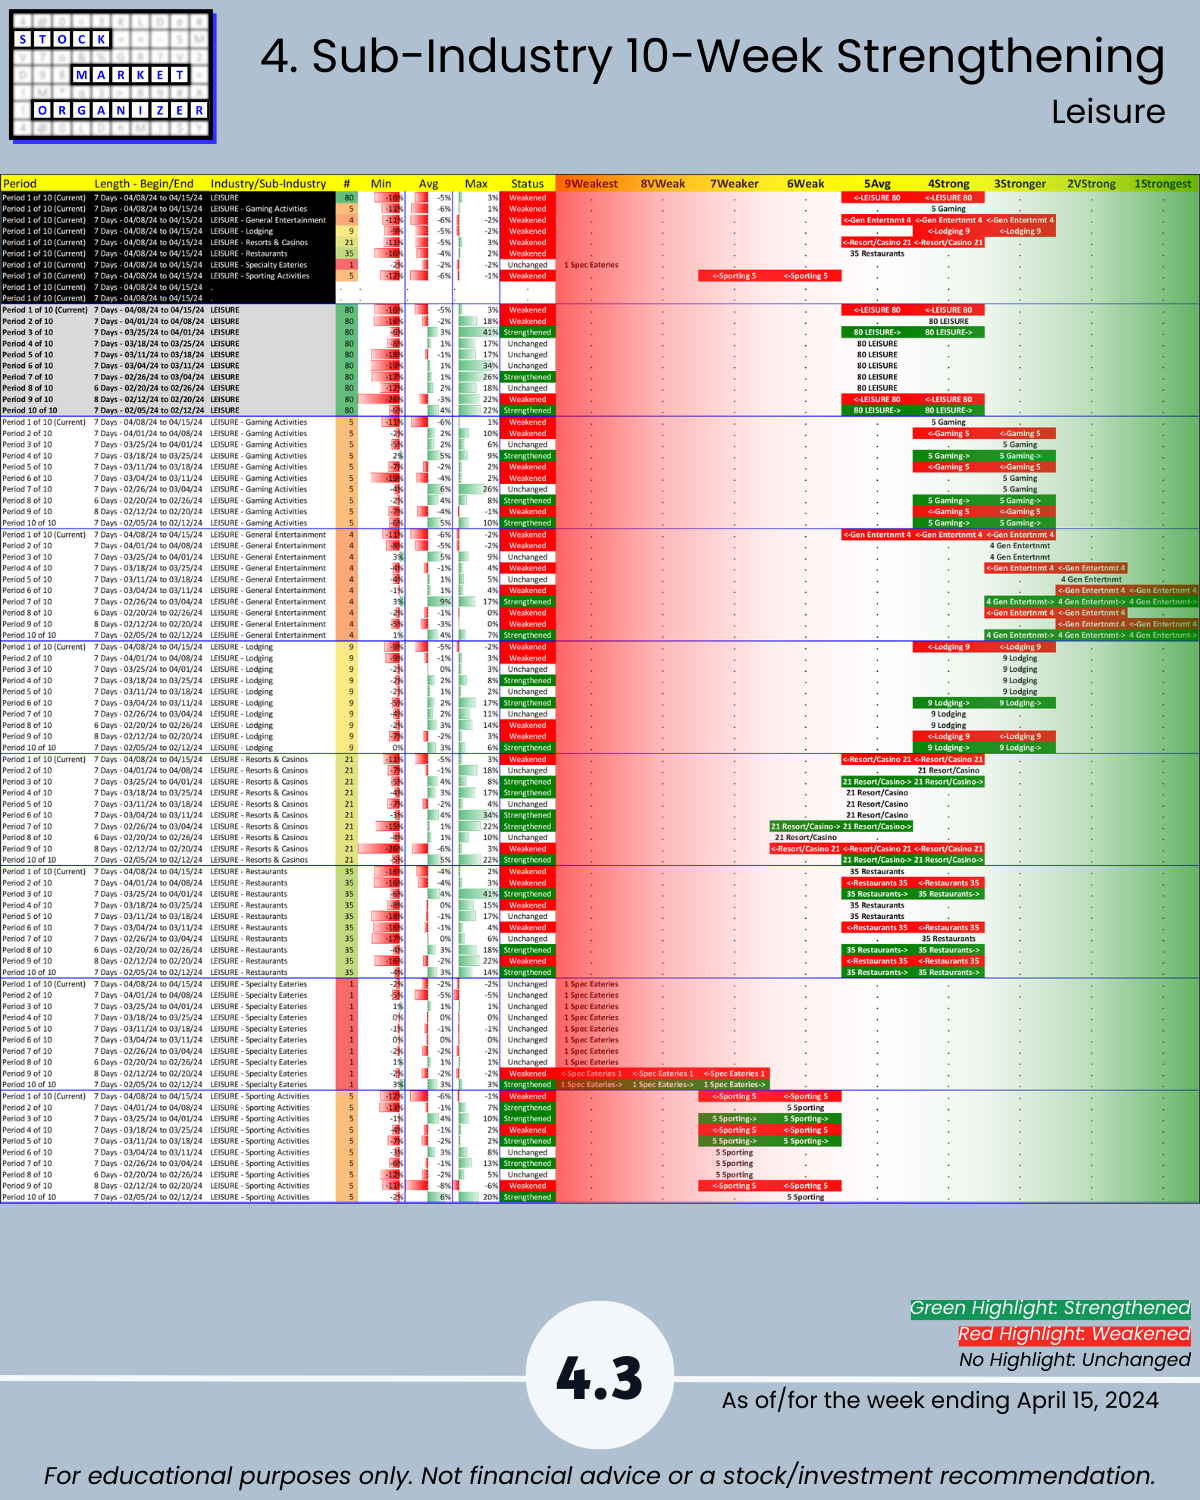
🔹 Industry Strength Level Changes: Diversified Services, Health Services, Leisure, Utilities WEAKENED
🔹 Industries
- Strongest Diversified Services, Leisure (5Avg)
- Weakest Utilities (7Weaker)
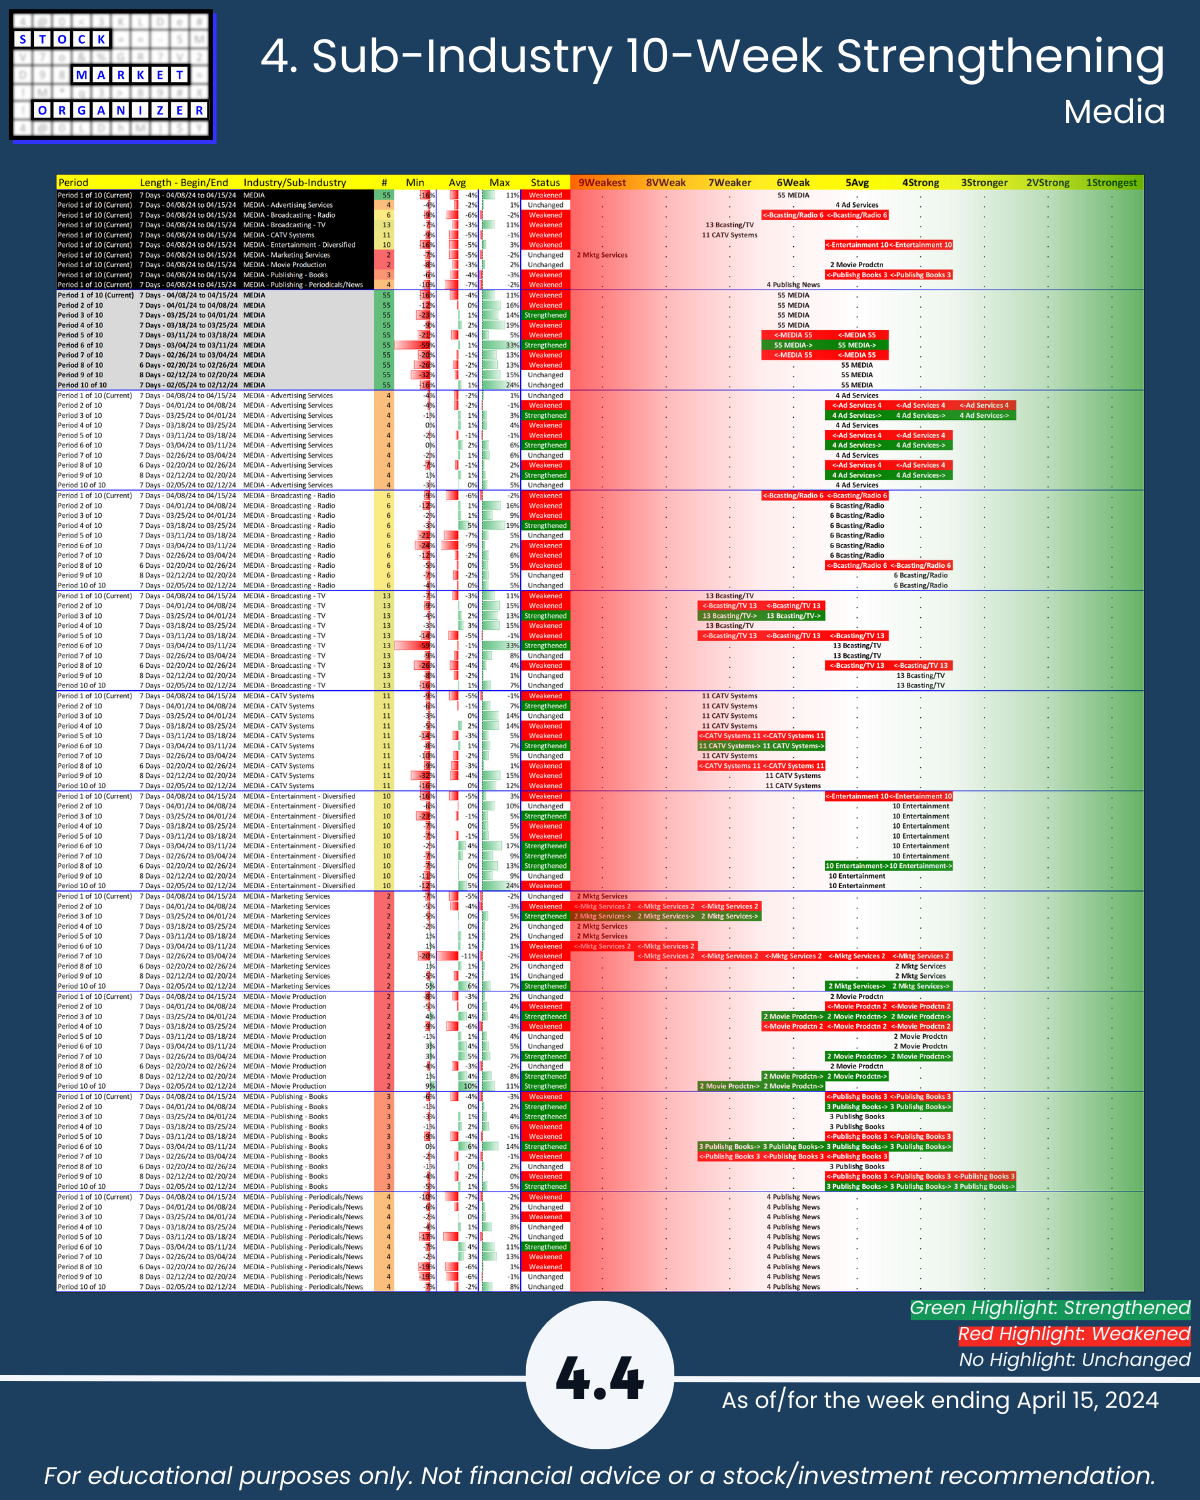
🔹 Sub-industries (38)
- 0% Strengthened, 55% Weakened ranking
- Strongest: Security/Protection Svcs, LT Care Facilities (3Stronger)
- Weakest: Water Utilities (9Weakest)
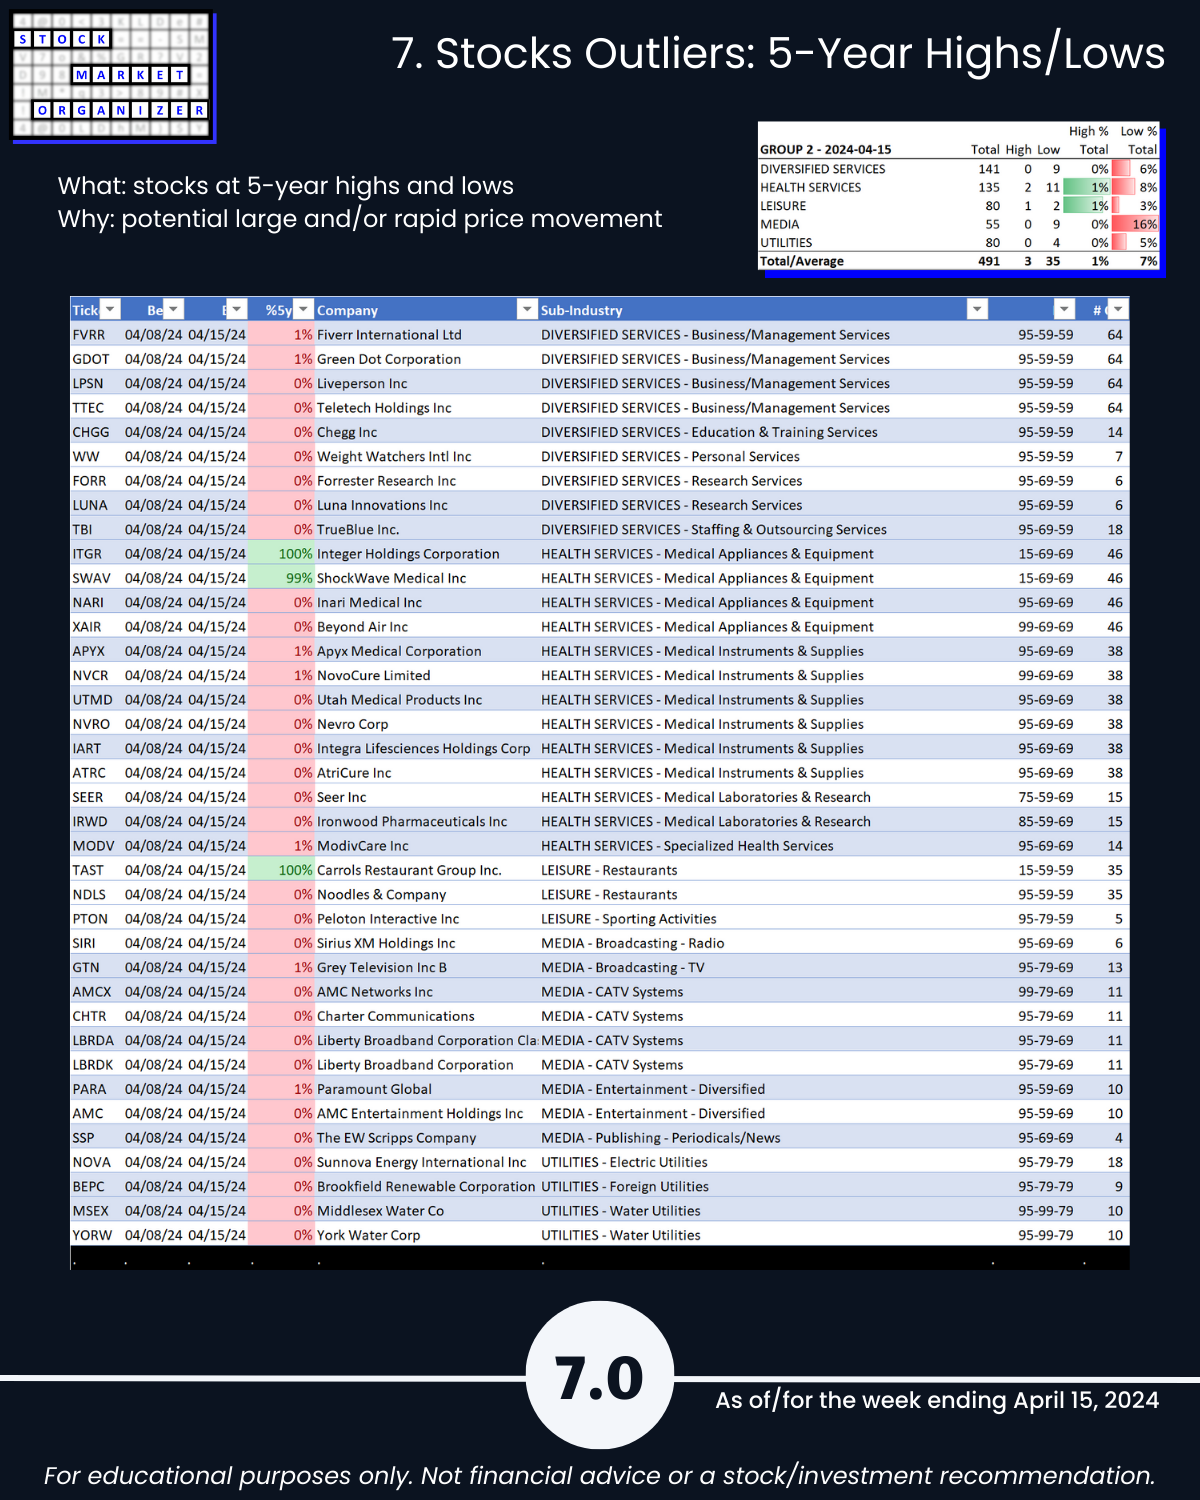
- @ 5 Year+ Highs/Lows: Media 16% lows
🔹 Stocks
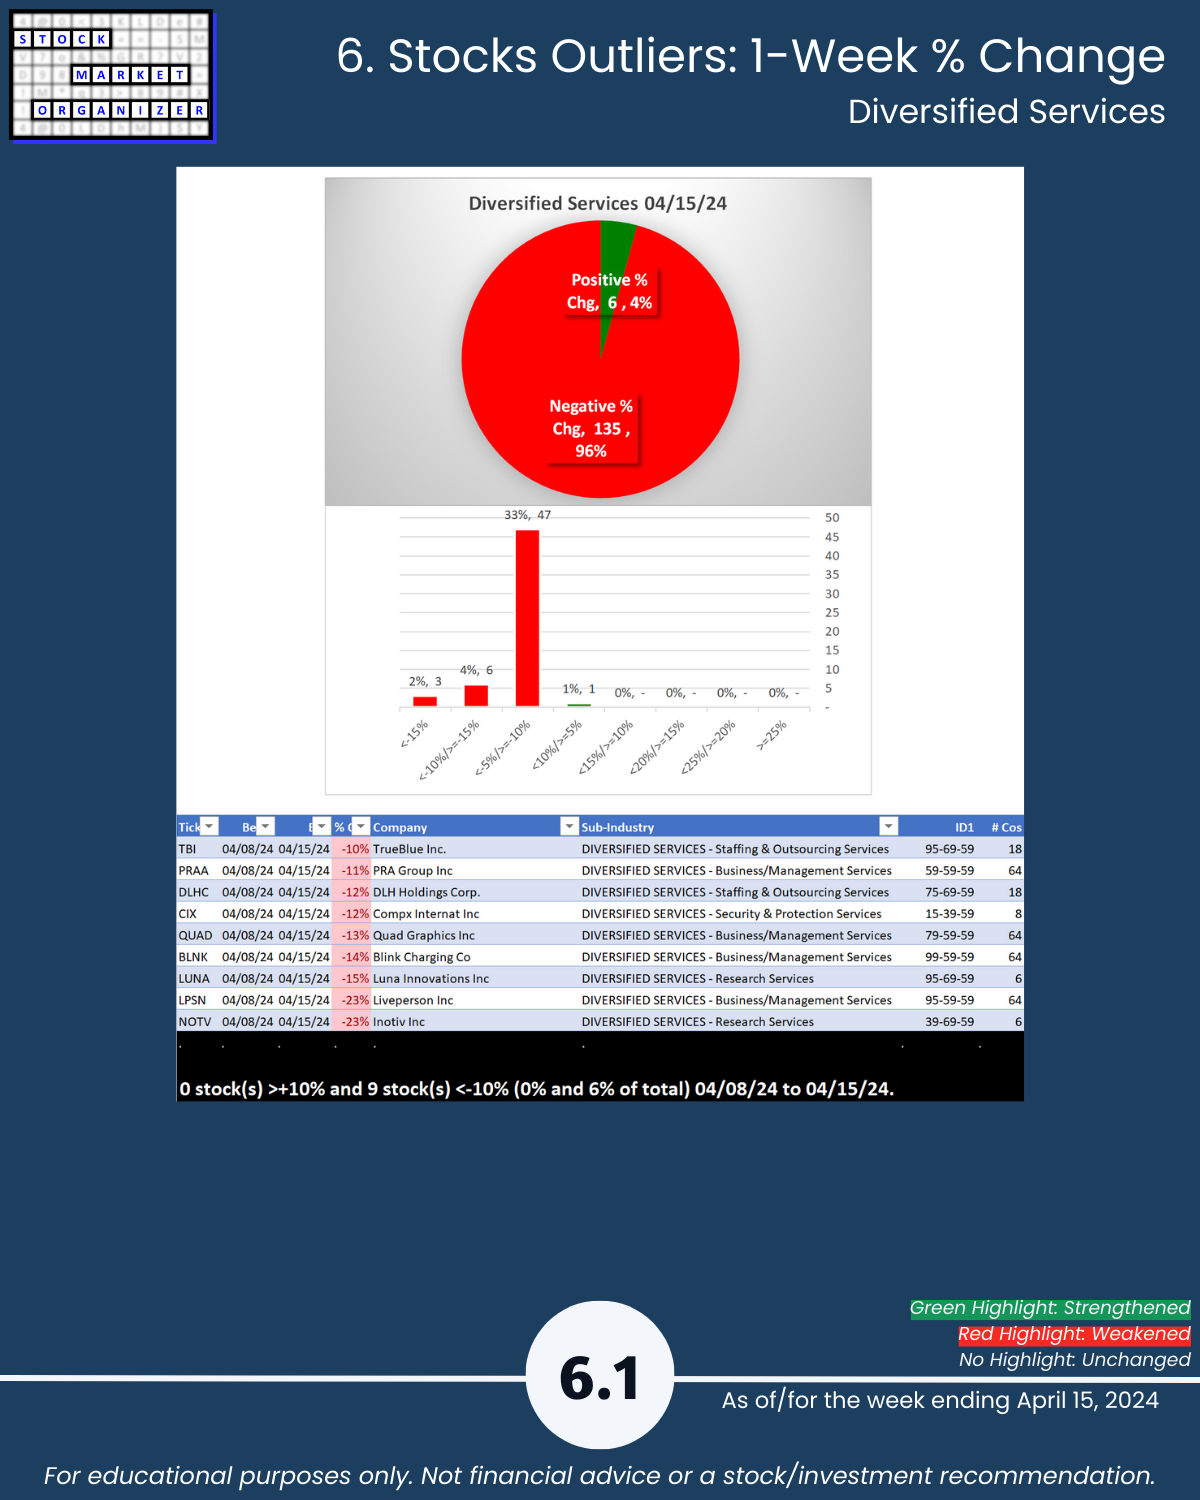
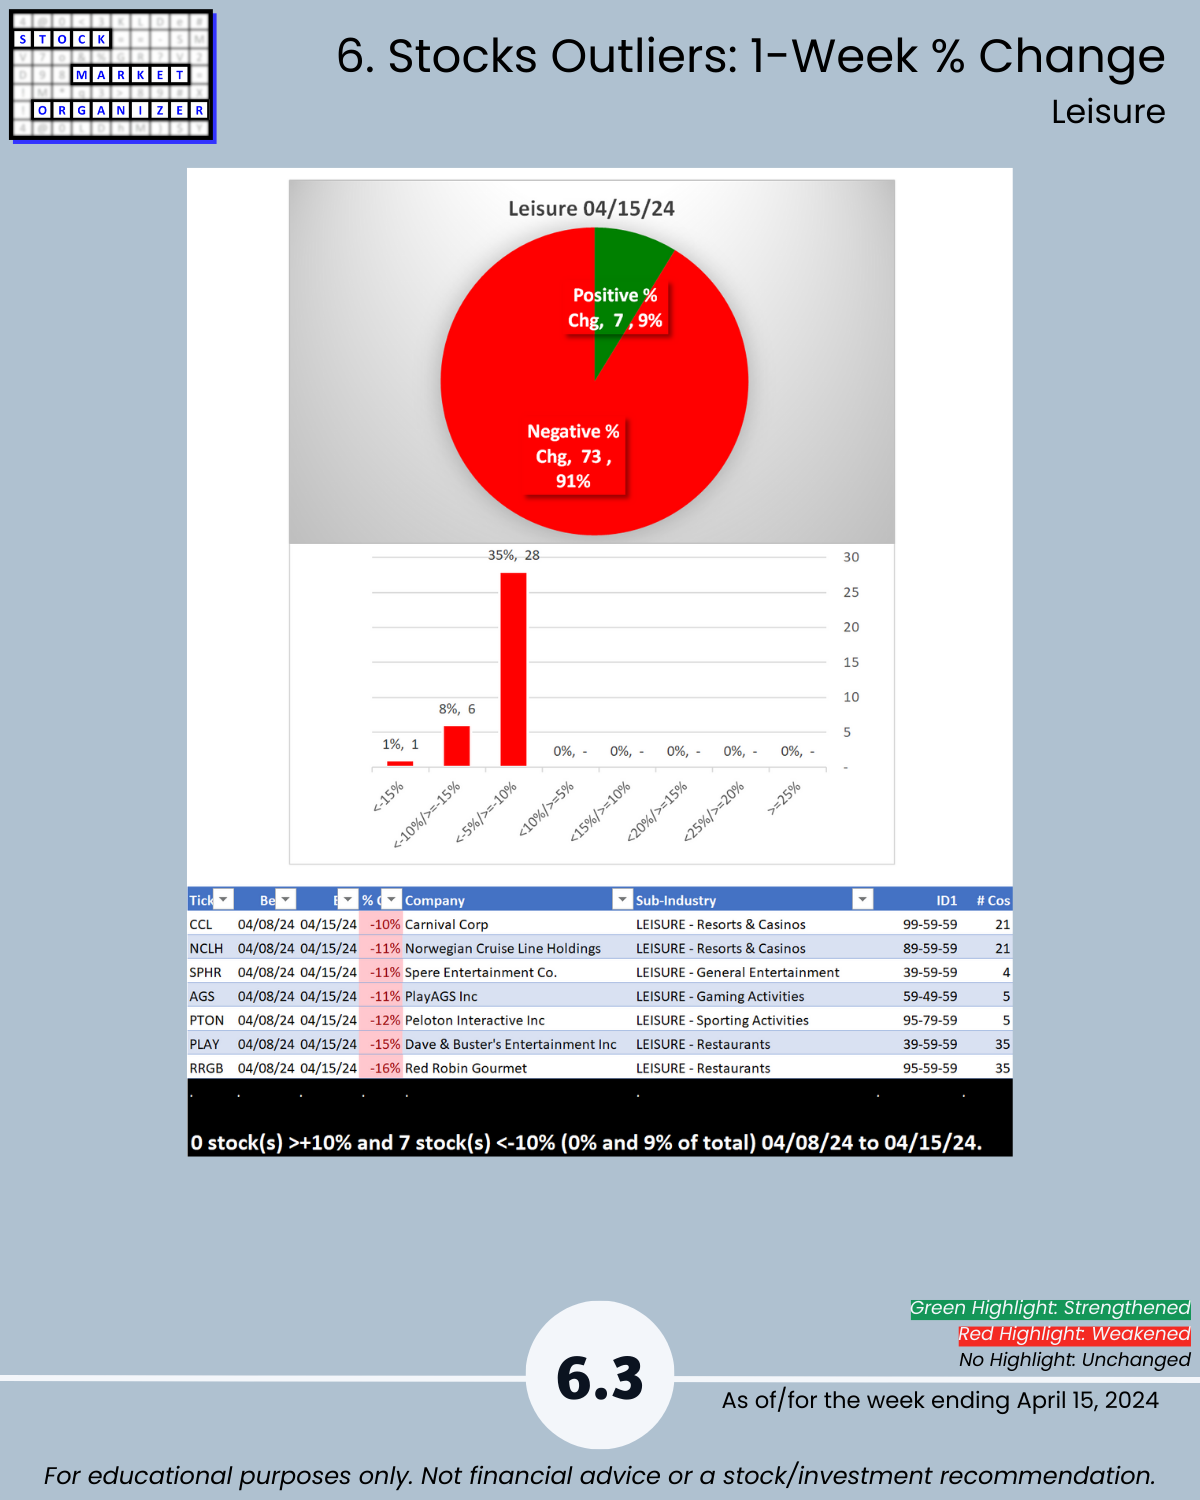
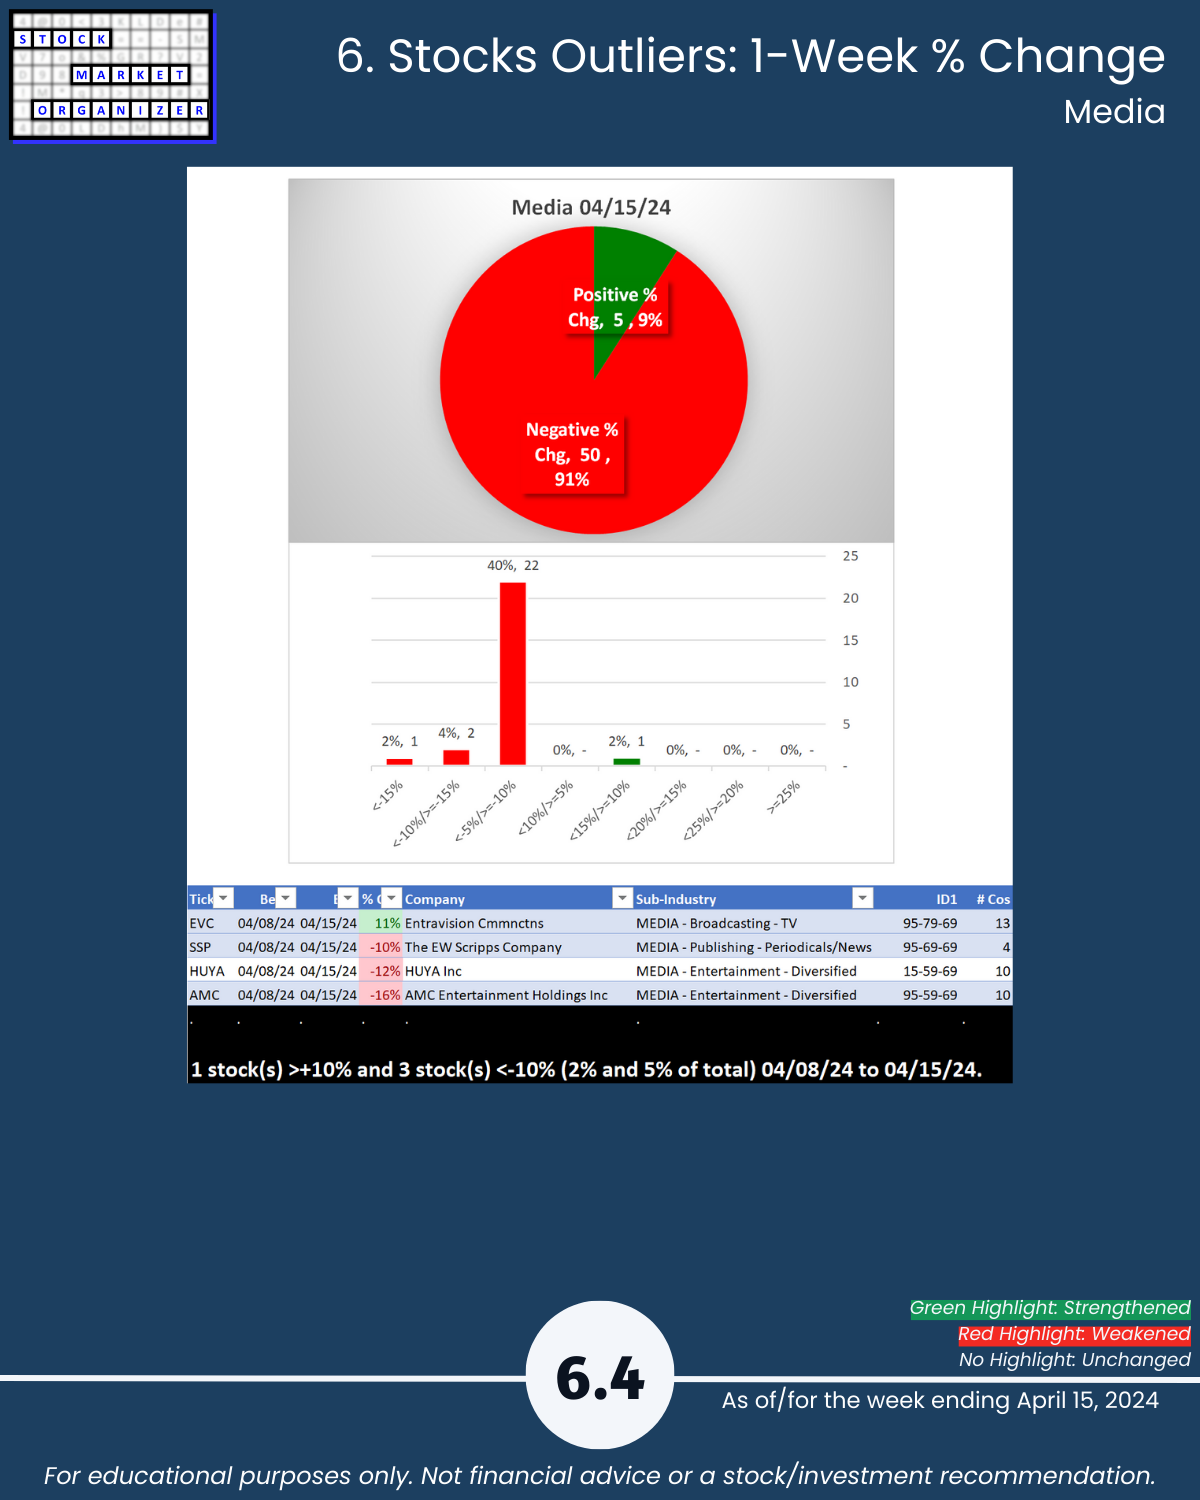
- Positive:Negative: Industry avg 7%/93%; Utilities 99%, Div Serv 96%, Leisure 91%, Media 91% negative
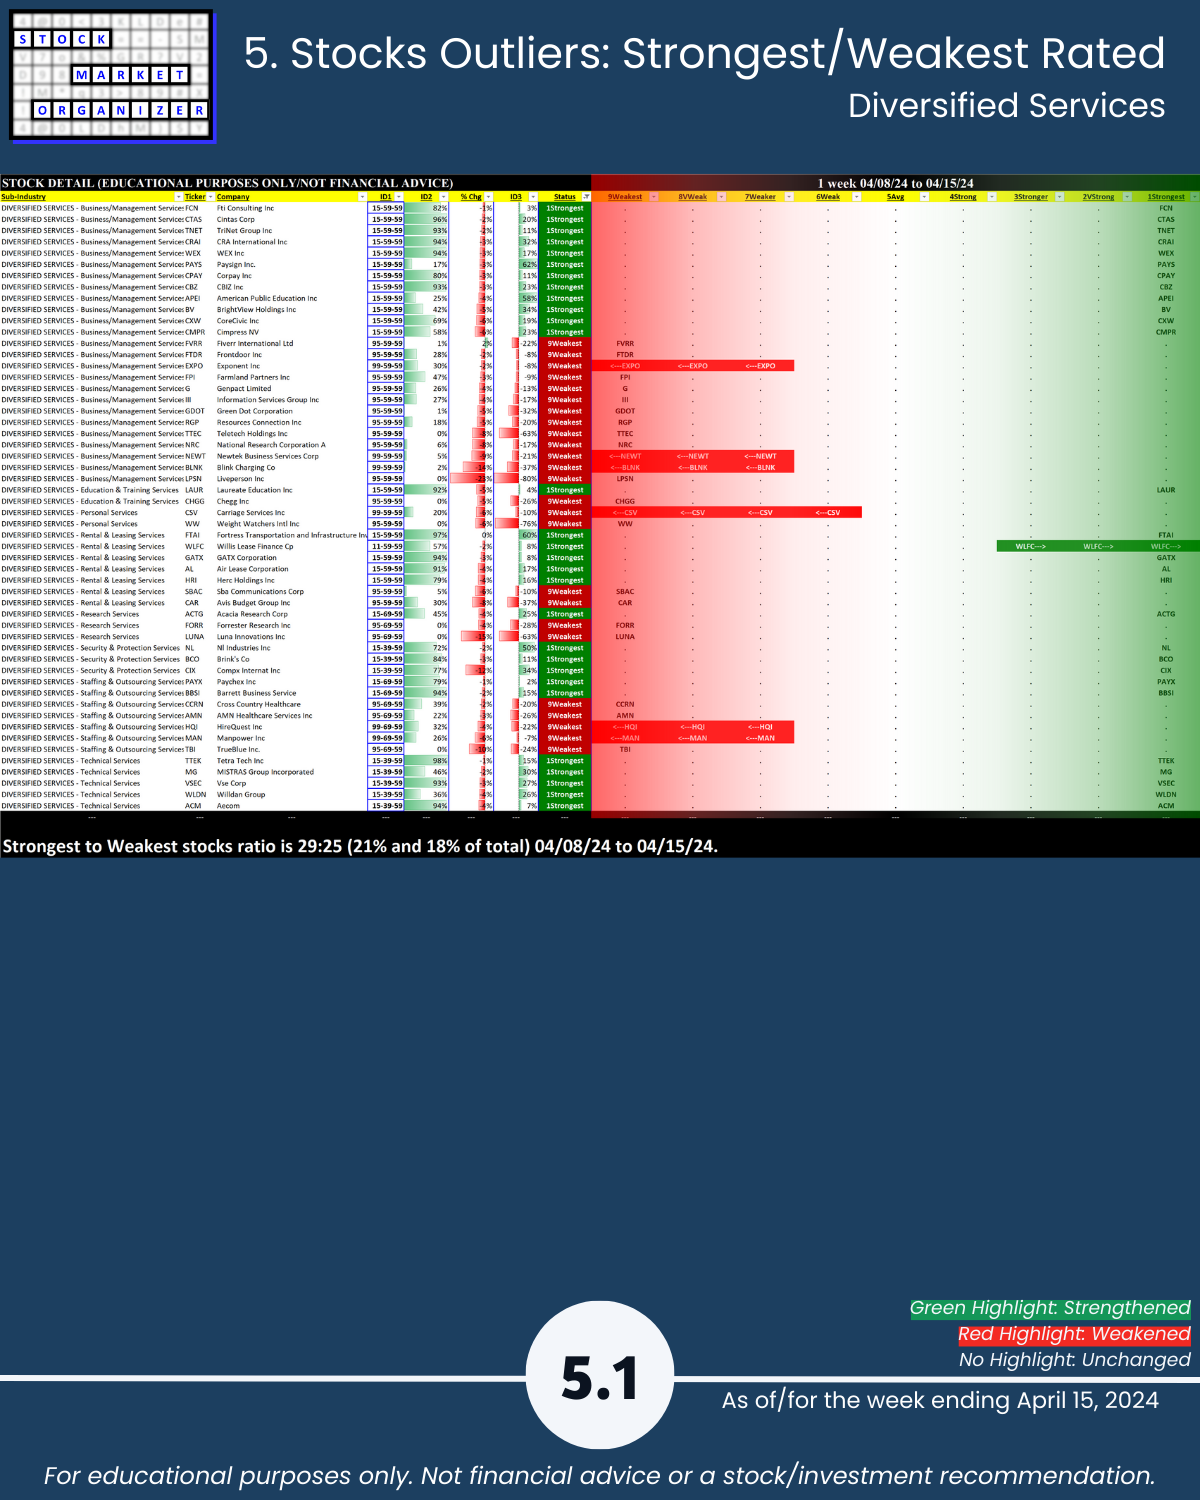
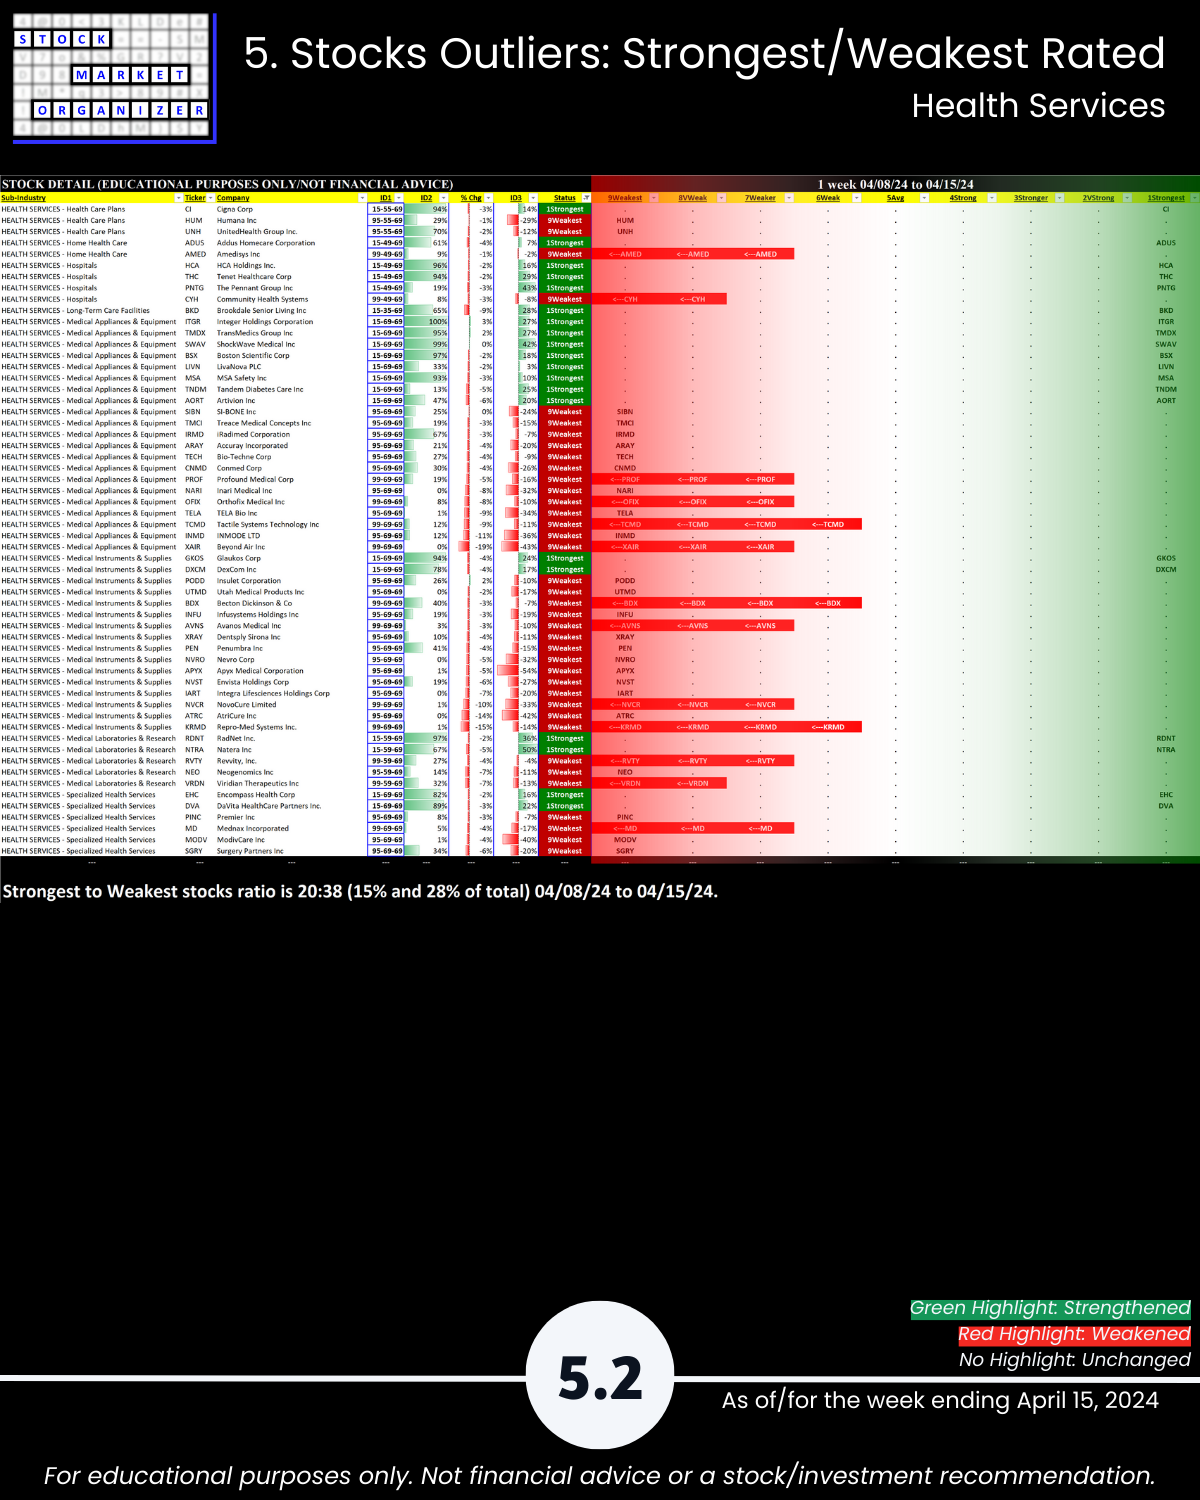
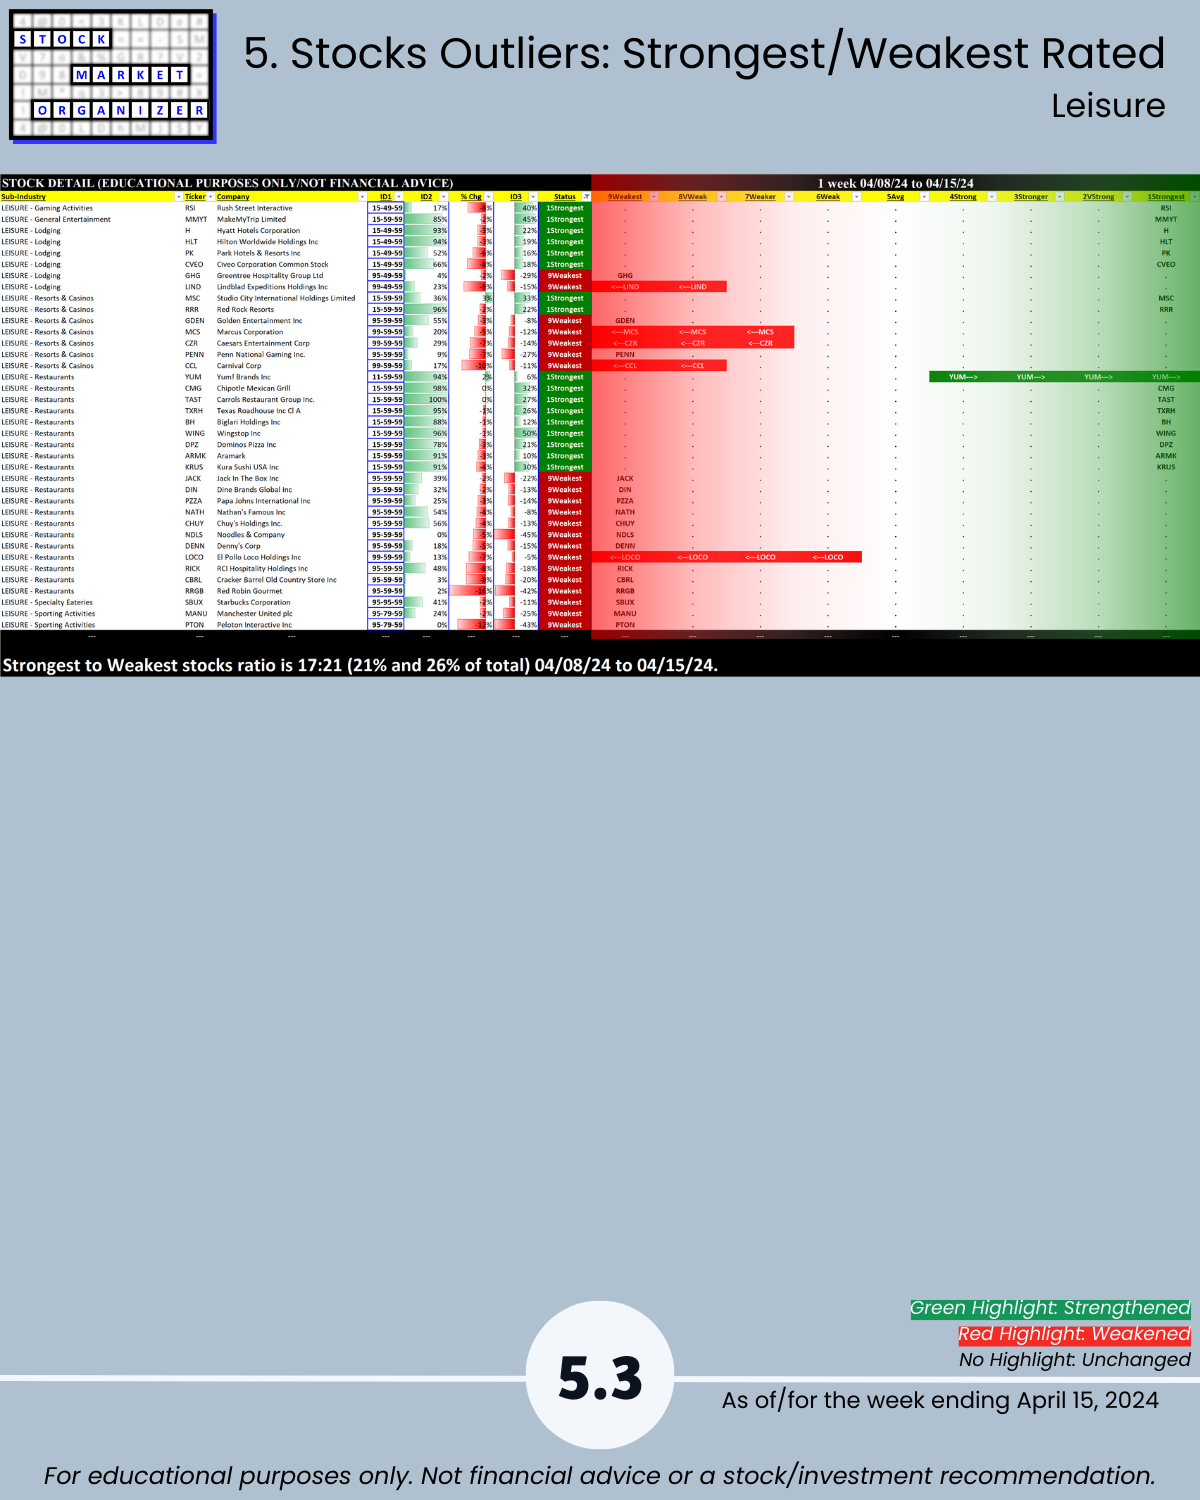
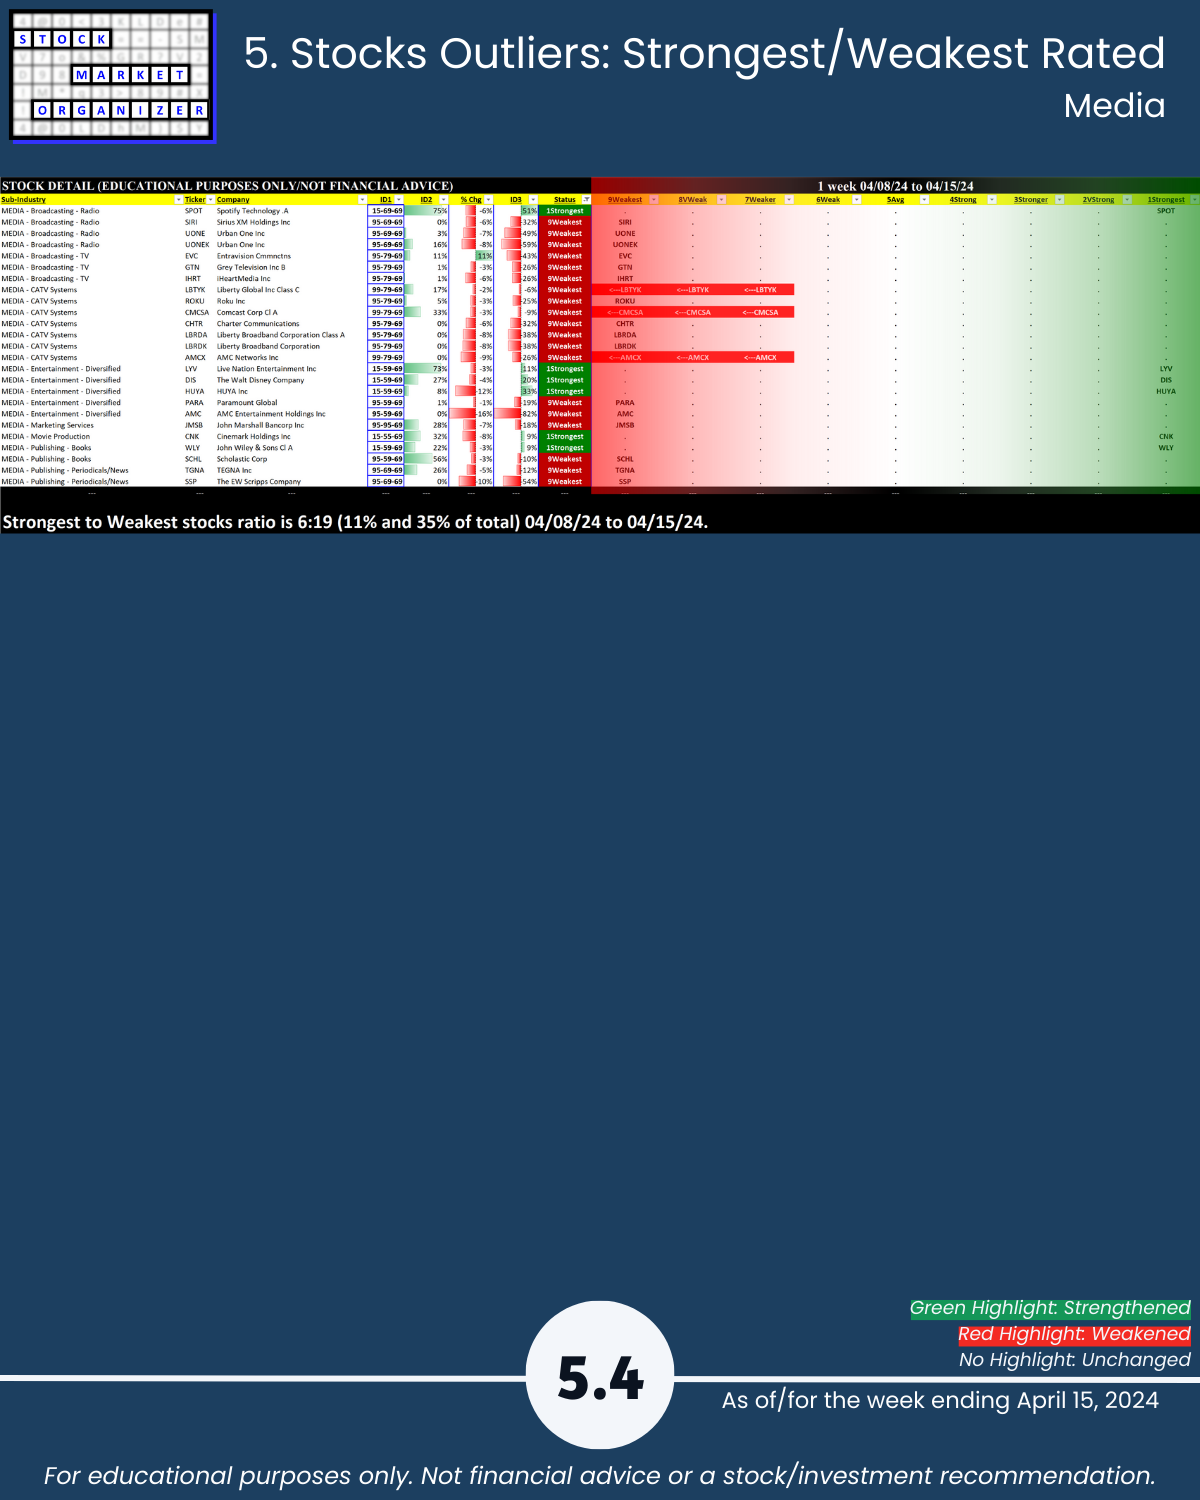
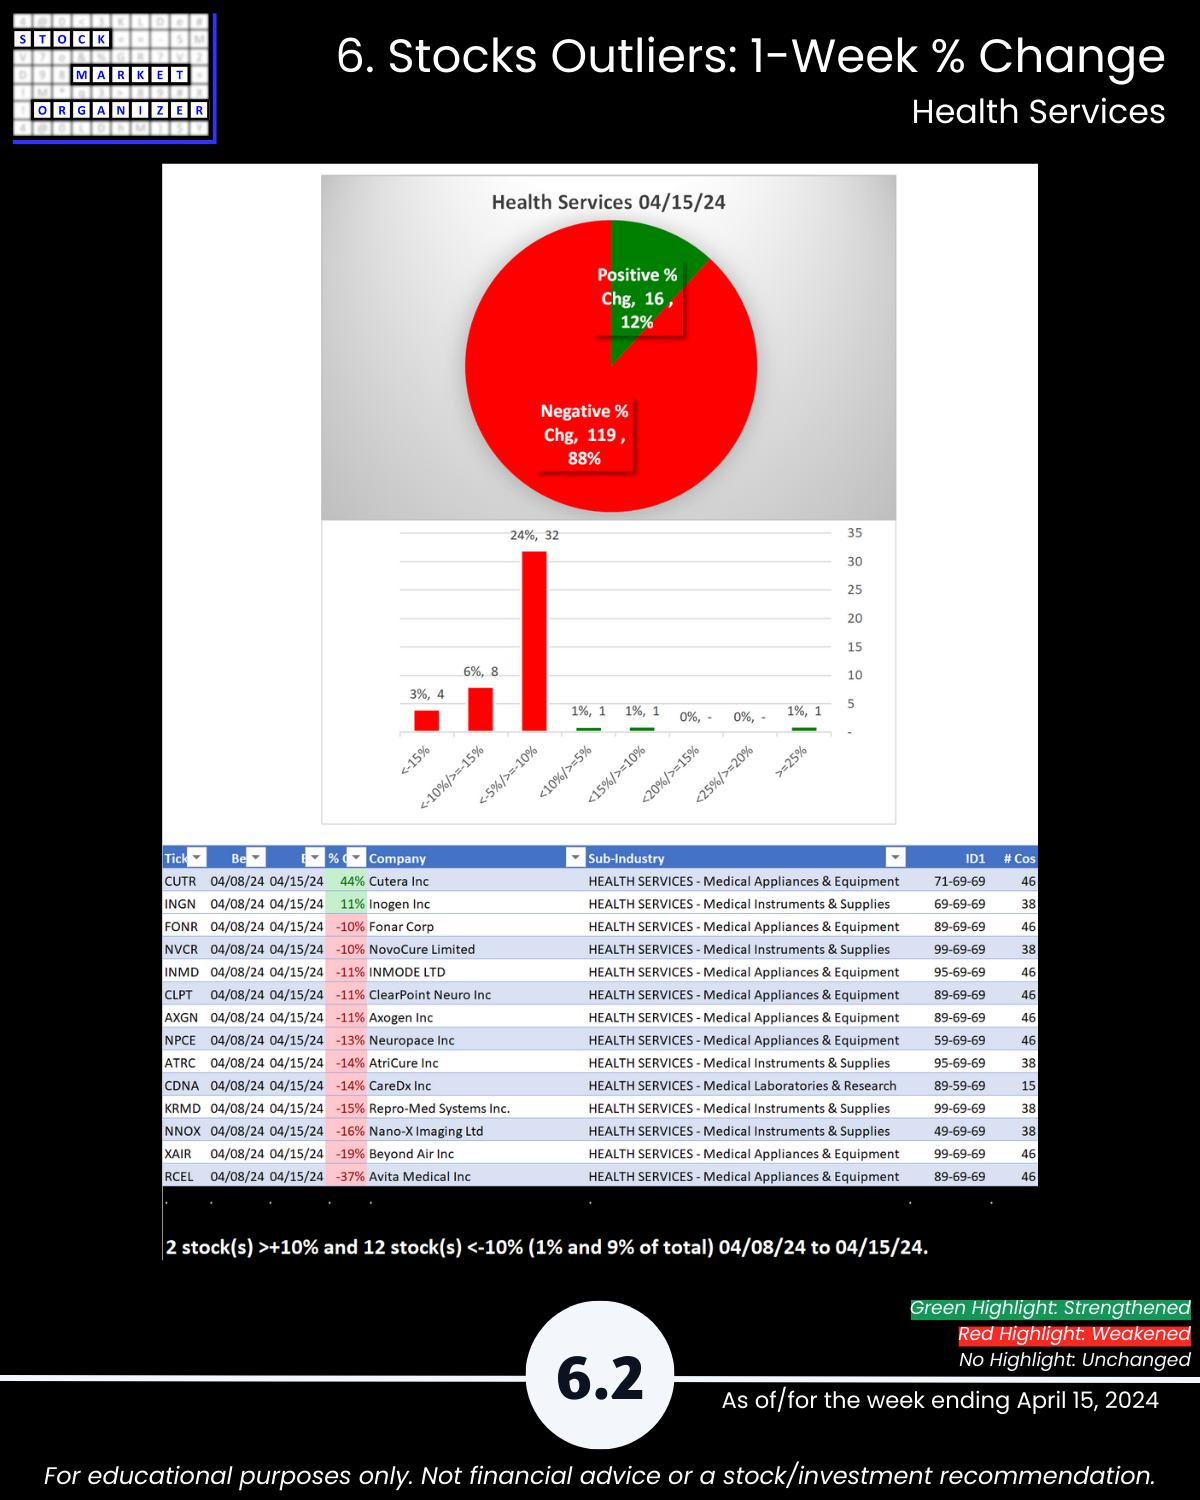
- Strongest:Weakest: Industry avg 15%/30%; Health Serv 15%:28%, Media 11%:35%, Utilities 5%:56%
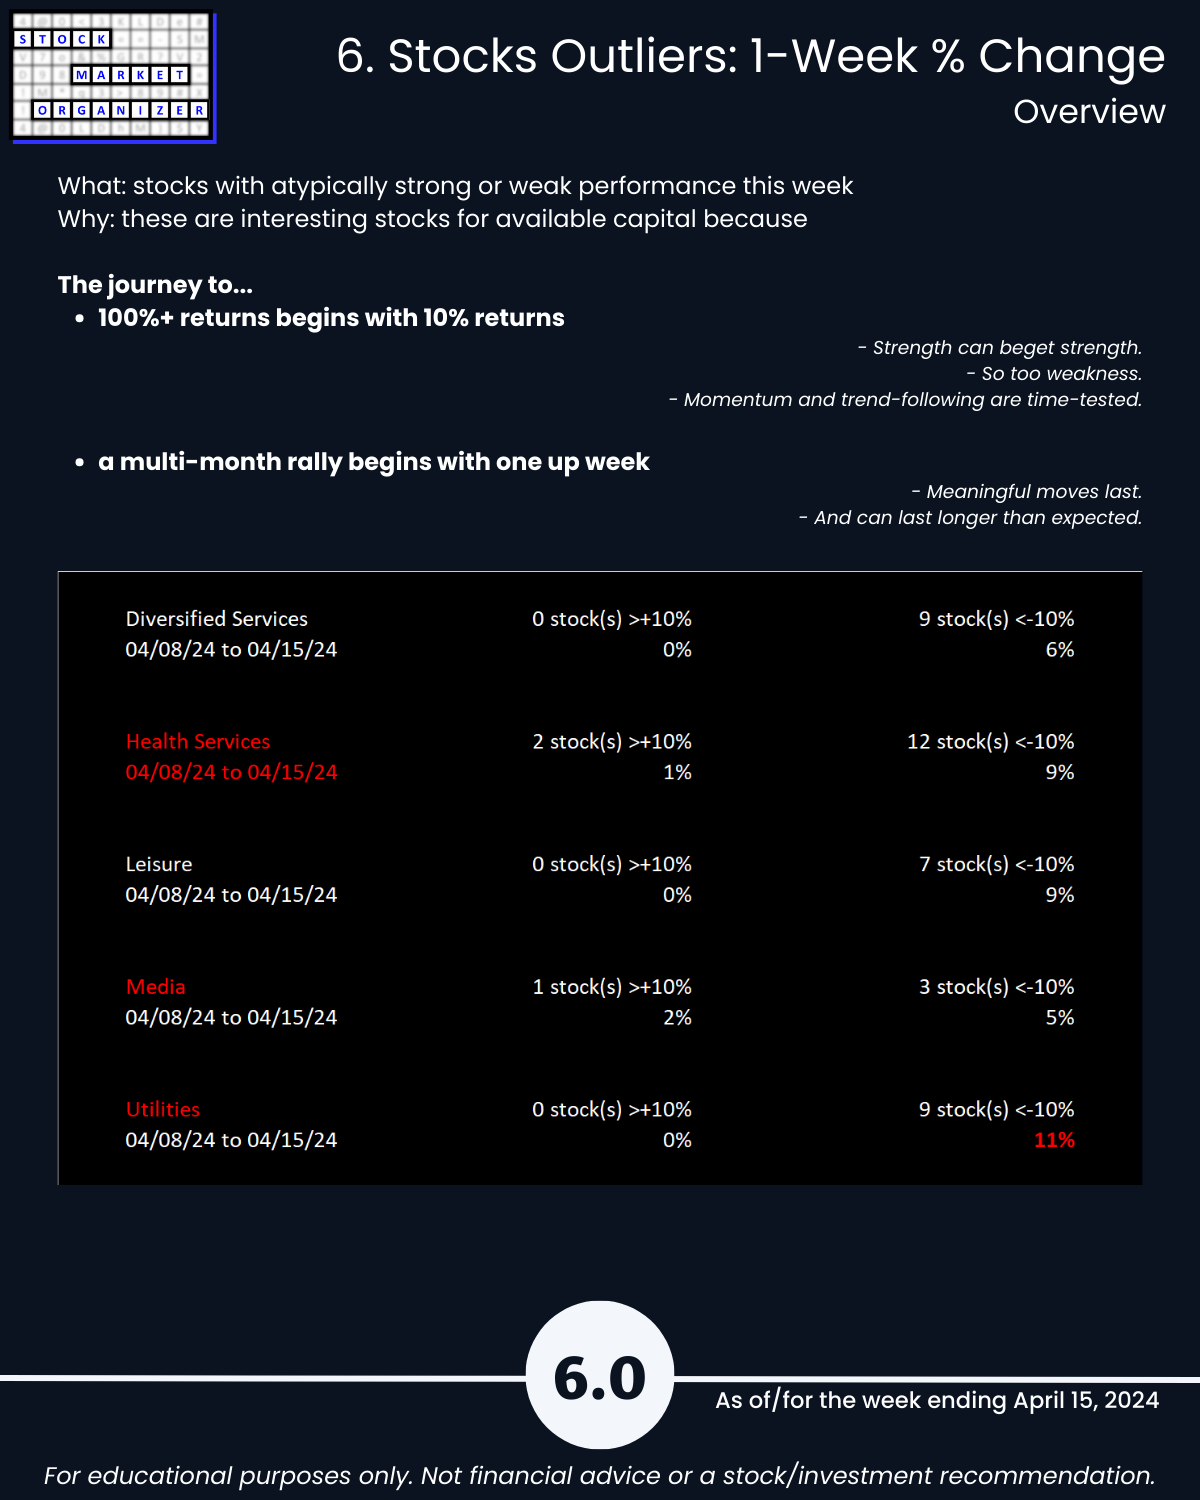
- Outlier Stocks: LPSN -23%, NOTV -23%; CUTR +44%, RCEL -37%
- Utilities 11% Stocks <-10%:
This report may particularly be of interest if the following 5 concepts resonate with you:
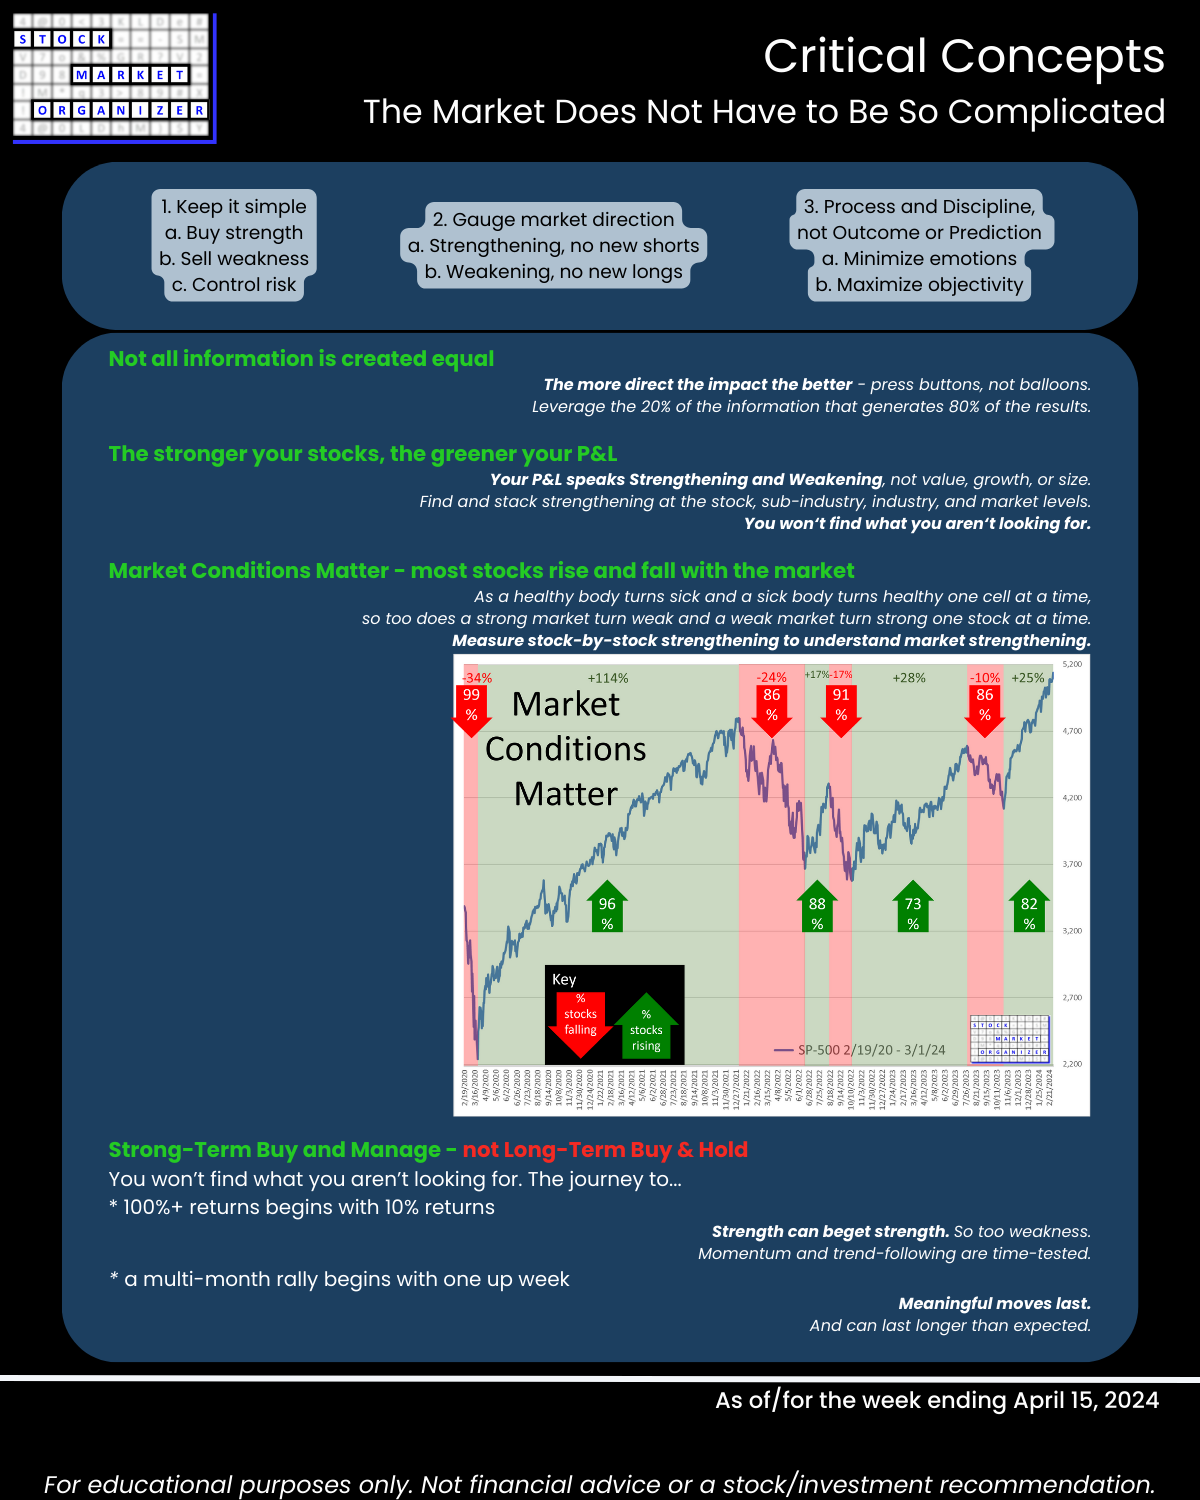
- The stronger your stocks, the greener your P&L.
- The journey to 100%+ returns begins with 10% returns.
- The journey to a multi-month rally begins with one up week.
- Most stocks do what the market does. (While the market can only do what its underlying stocks, sub-industries, and industries do.)
- 80/20: not all information is created equal. (Press buttons, not balloons.)
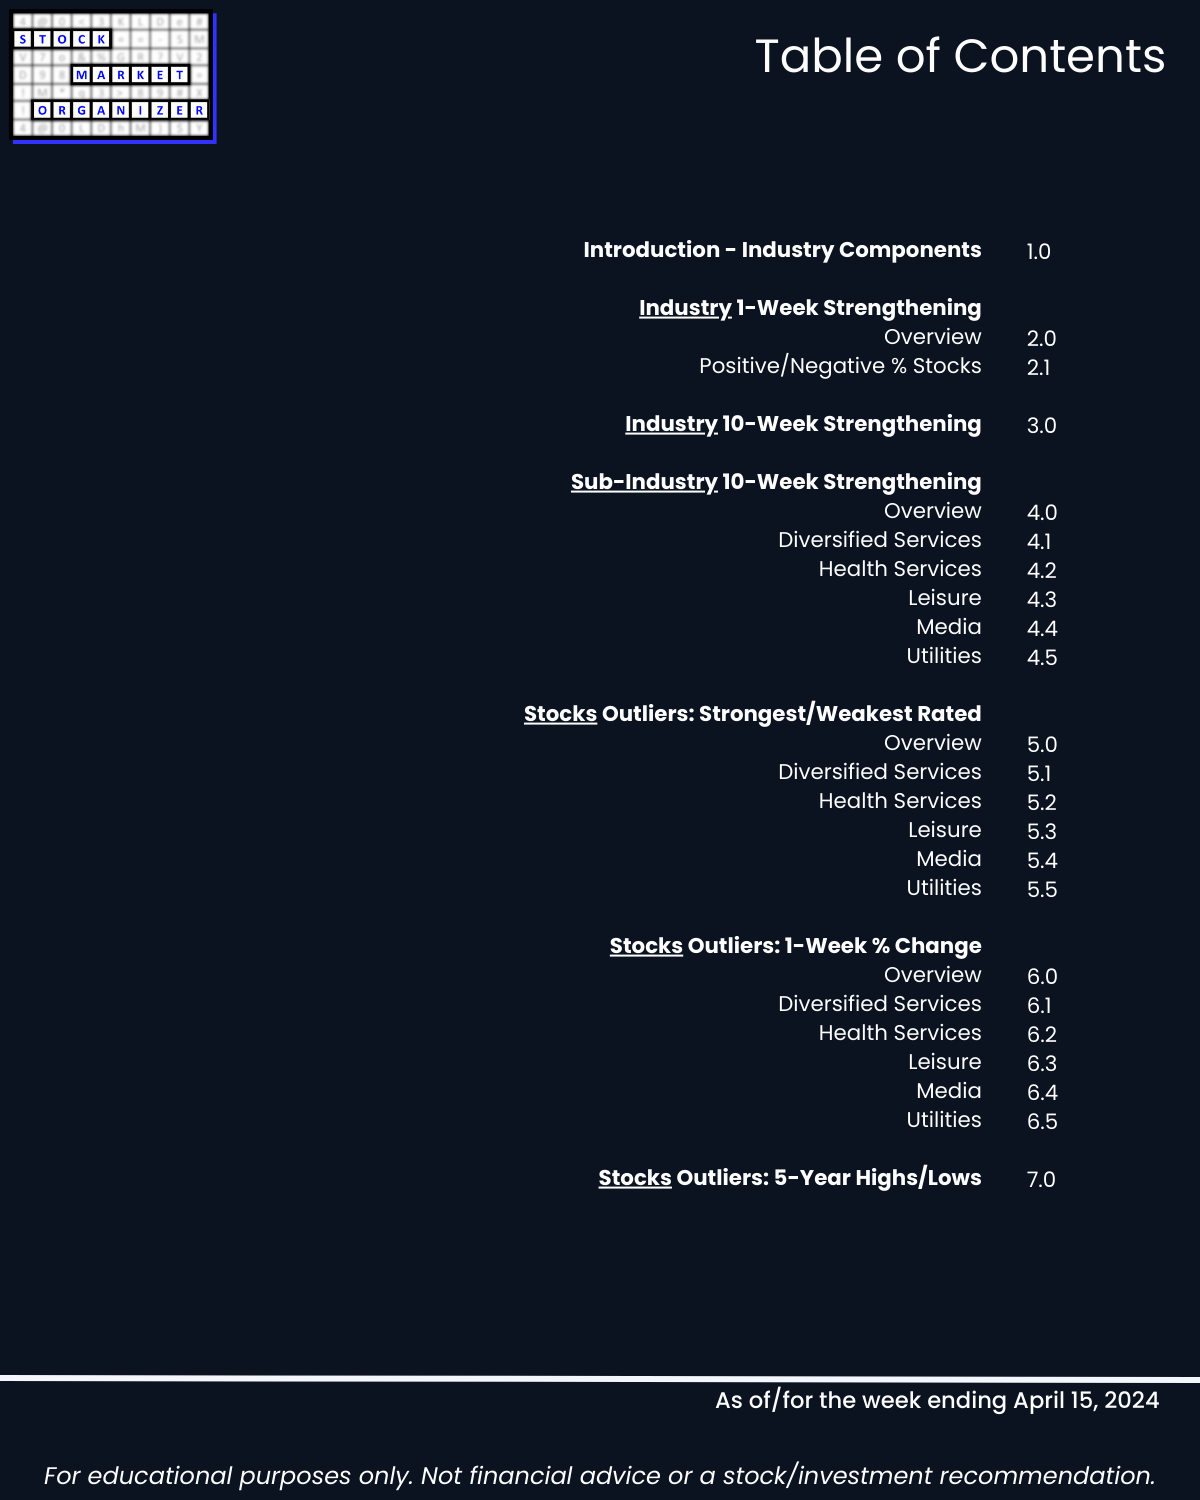
Following are galleries with page-by-page views of this report.
1. Introduction
2. Industry 1-Week Strengthening
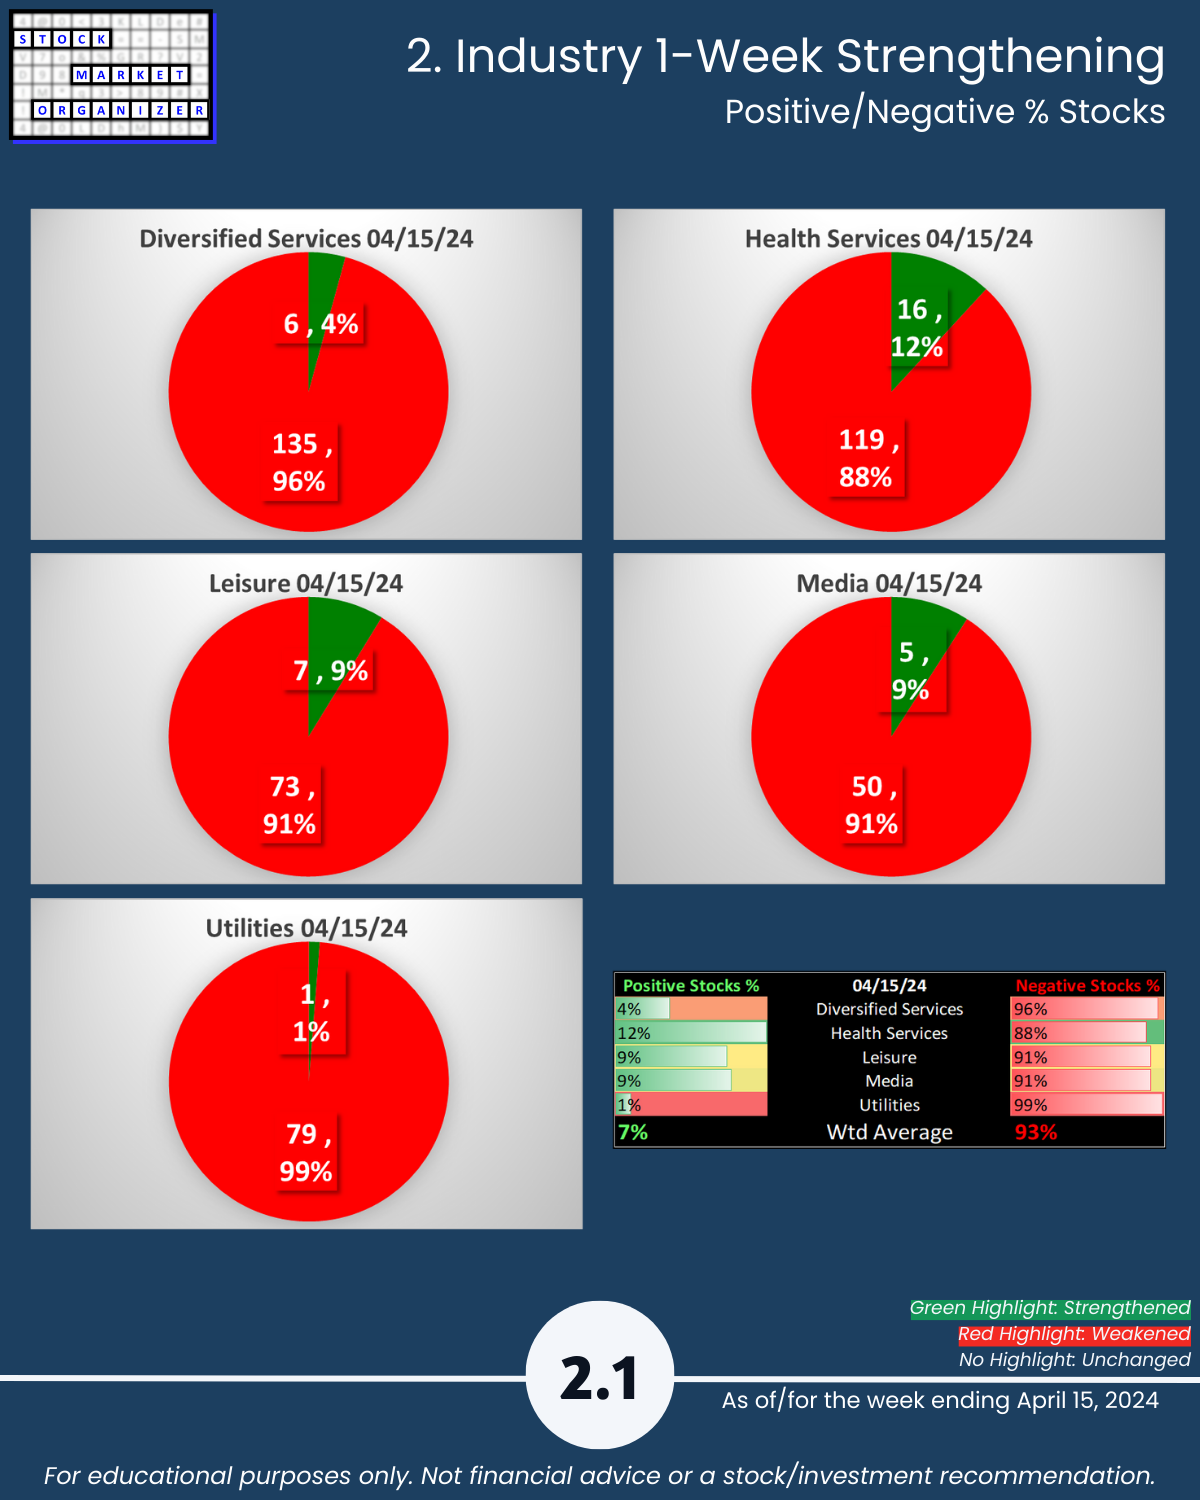
3. Industry 10-Week Strengthening
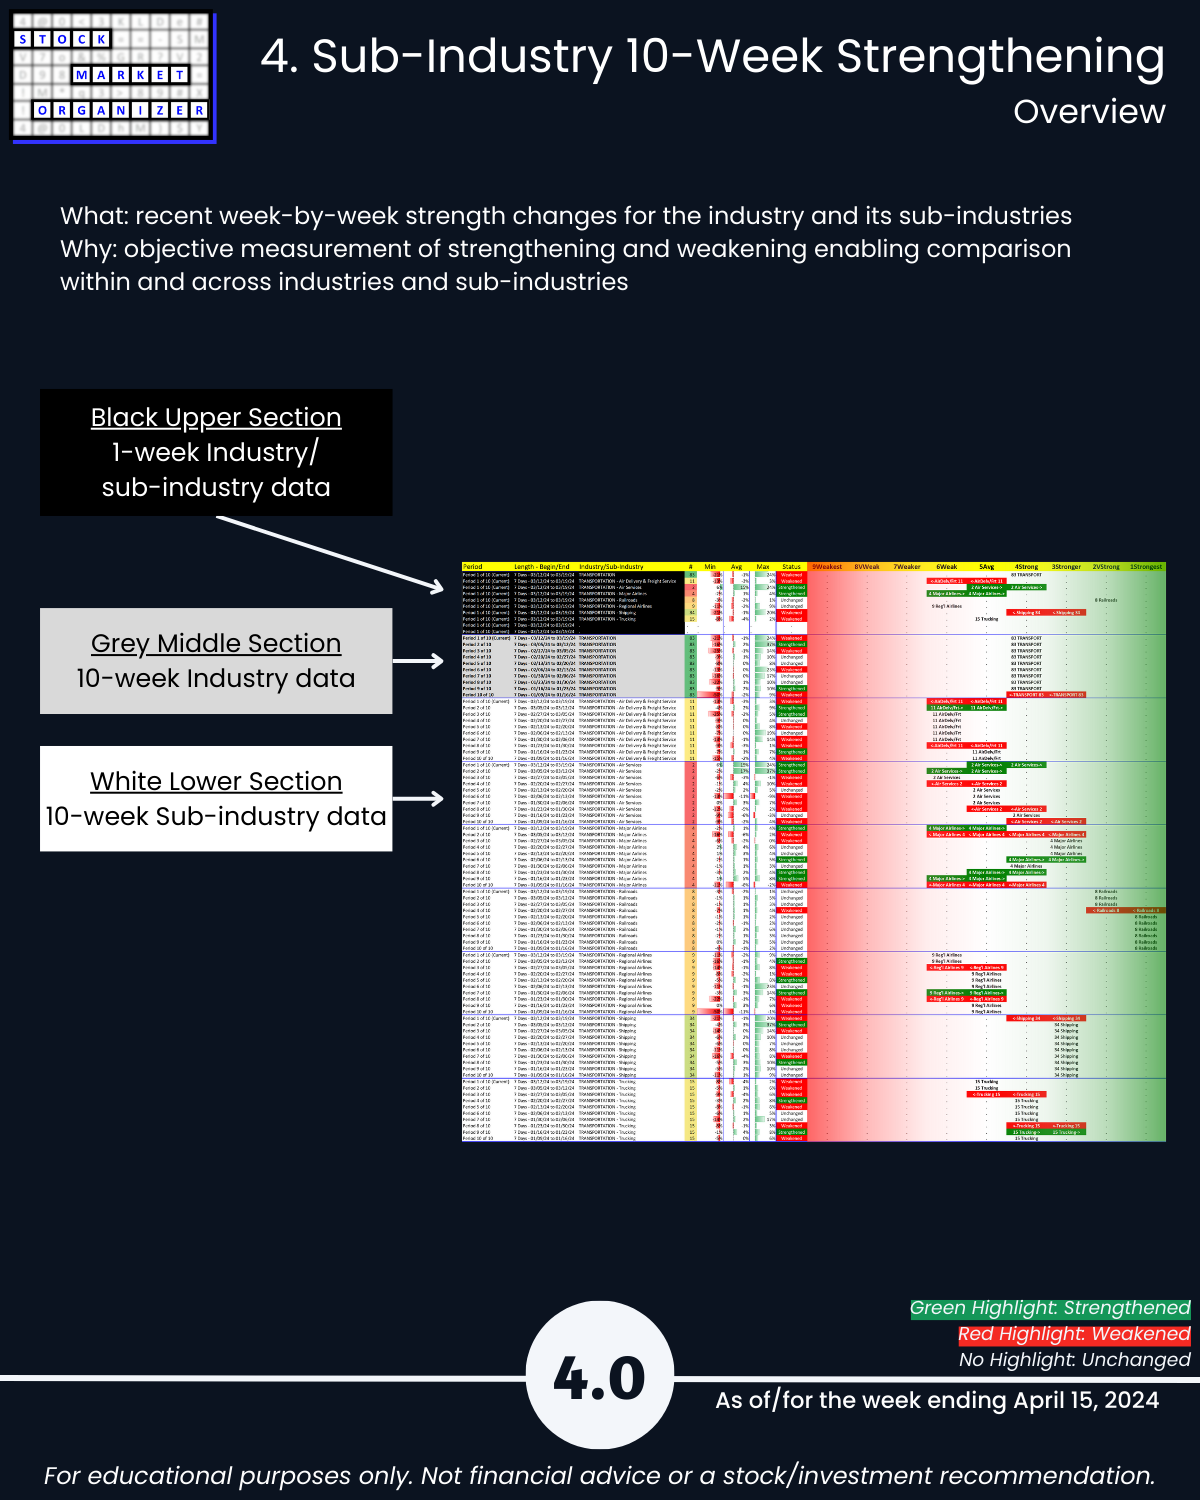
4. Sub-Industry 10-Week Strengthening
5. Stocks Outliers: Strongest/Weakest Rated
6. Stocks Outliers: 1-Week % Change
7. Stocks Outliers: 5-Year Highs/Lows
