SMO Exclusive: Strength Report Group 2 2024-04-08

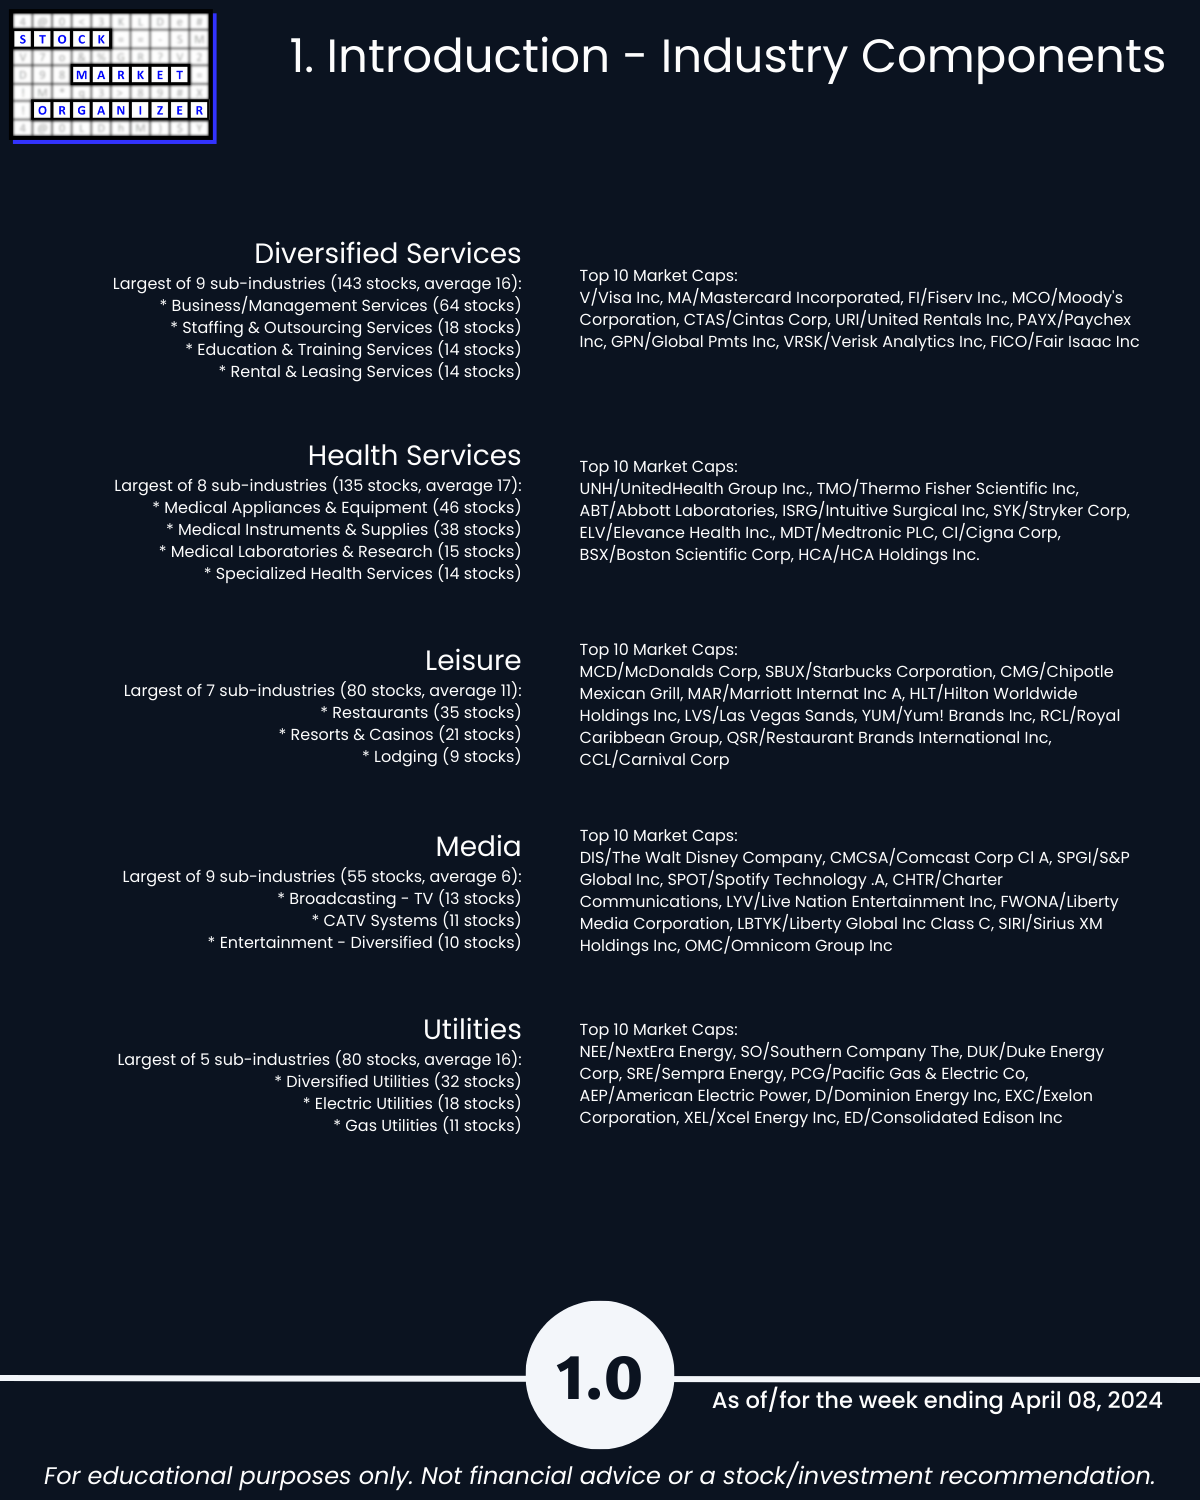
4/8/24 quiet though weakening-biased week in today’s Industry Group 2 – Diversified Services, Health Services, Media, Leisure, and Utilities. What’s happening here? In this specific analysis, I’m comparing the strength of 491 stocks across 5 industries and 38 sub-industries. You may not care about Leisure stocks. But how do you know you don’t unless you have an objective way to regularly measure their strength against all other stocks? The action isn’t just in the NVDAs and SMCIs of the world. And if one is focusing just on those, is it possible you are missing out on viable investing, speculating, and trading opportunities?
ANALYSIS SCHEDULE AND SCOPE
On other days during the week I review the 5 other sectors and industry groupings: Consumer, Financial, and Tech sectors, and industry groups 1 and 3 (Industry Group 1 is Automotive, Energy, Materials & Construction, Metals & Mining, and Transportation, and Industry Group 3 is Aerospace/Defense, Chemicals, Drugs, Manufacturing, and Wholesale).
During the week I review each industry twice (except those in the Consumer Sector and Industry Group 3, whose reports are on Fridays). Once on their Sector or Industry Group day, and once at the week’s end when I compare all industries and stocks to each other based on the trading week ending that Friday.
In total, I regularly review 29 industries and 198 sub-industries which encompass almost 2,700 stocks.
SO WHAT?
With this I obtain on a timely basis objective insights unavailable elsewhere.
Through this, I discern where there is strength at all market levels, and seek to stack this strength as much as possible.
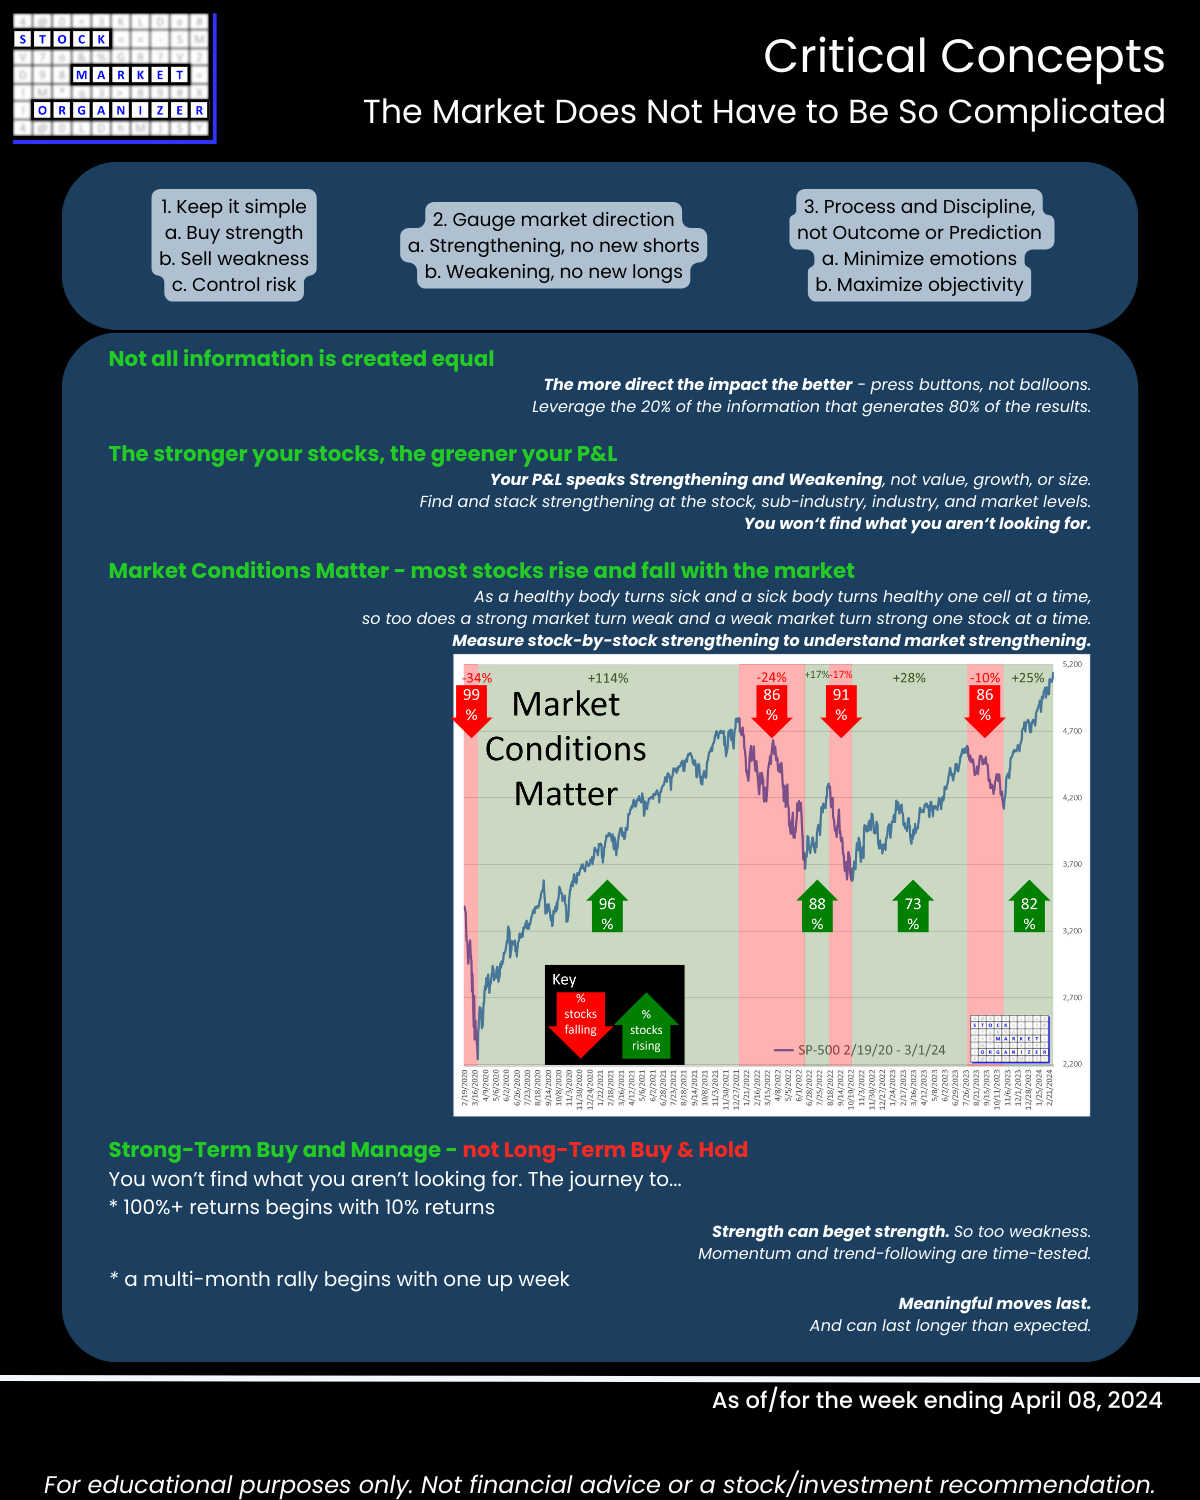
Ultimately, my system is based on momentum and trend following – two proven concepts. I’m a believer that the market does not need to be so complicated.
Bottom line: the stronger your stocks, the greener your P&L. And I’ve built this system to take advantage of this truth.
HIGHLIGHTS
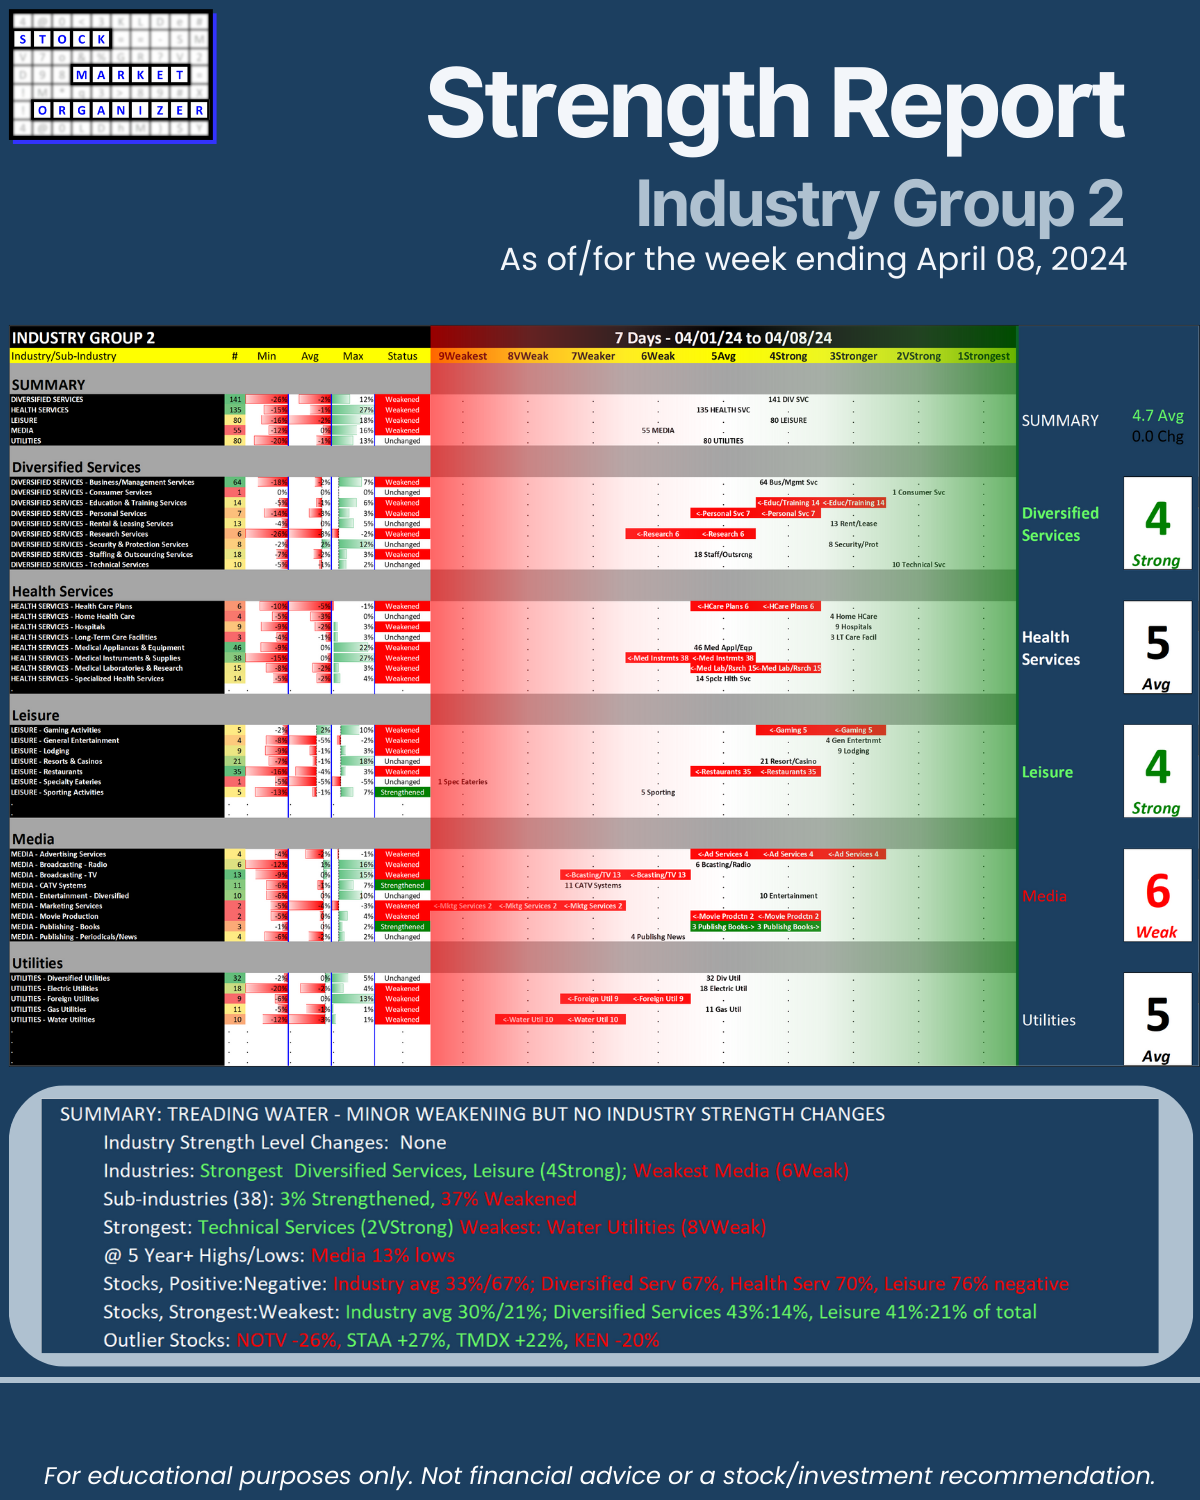
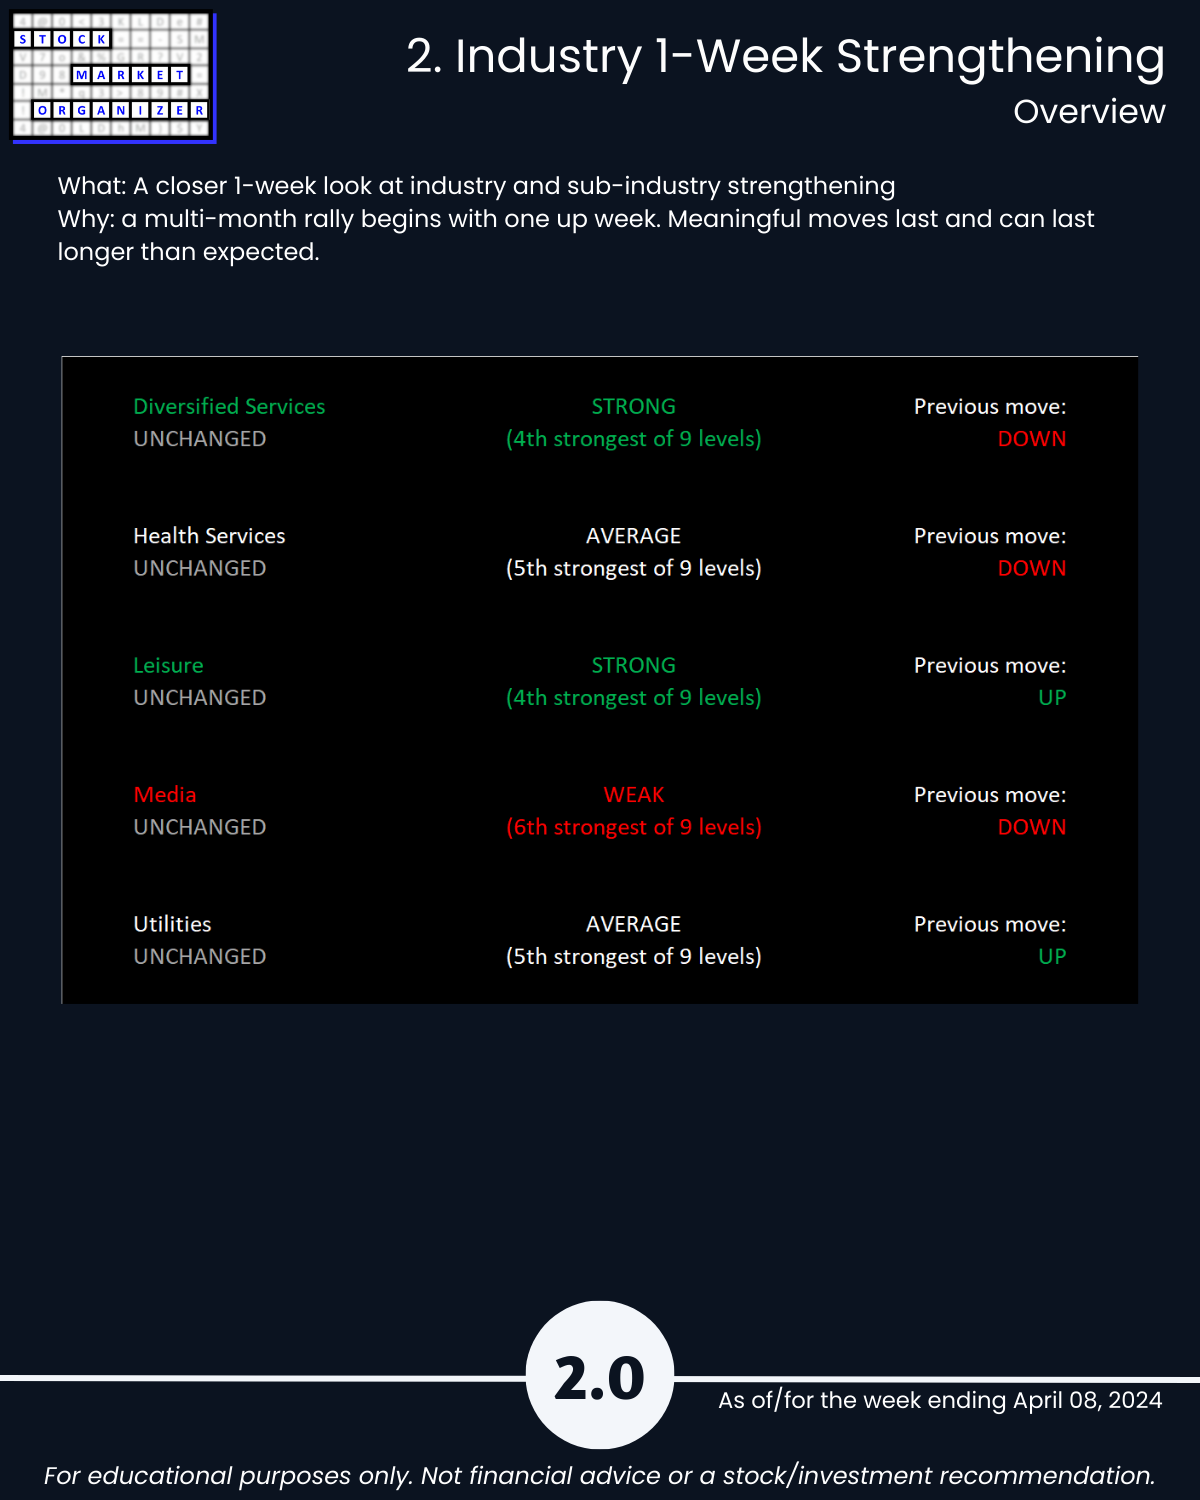
SUMMARY: TREADING WATER - MINOR WEAKENING BUT NO INDUSTRY STRENGTH CHANGES
🔹 Industry Strength Level Changes: None
🔹 Industries:
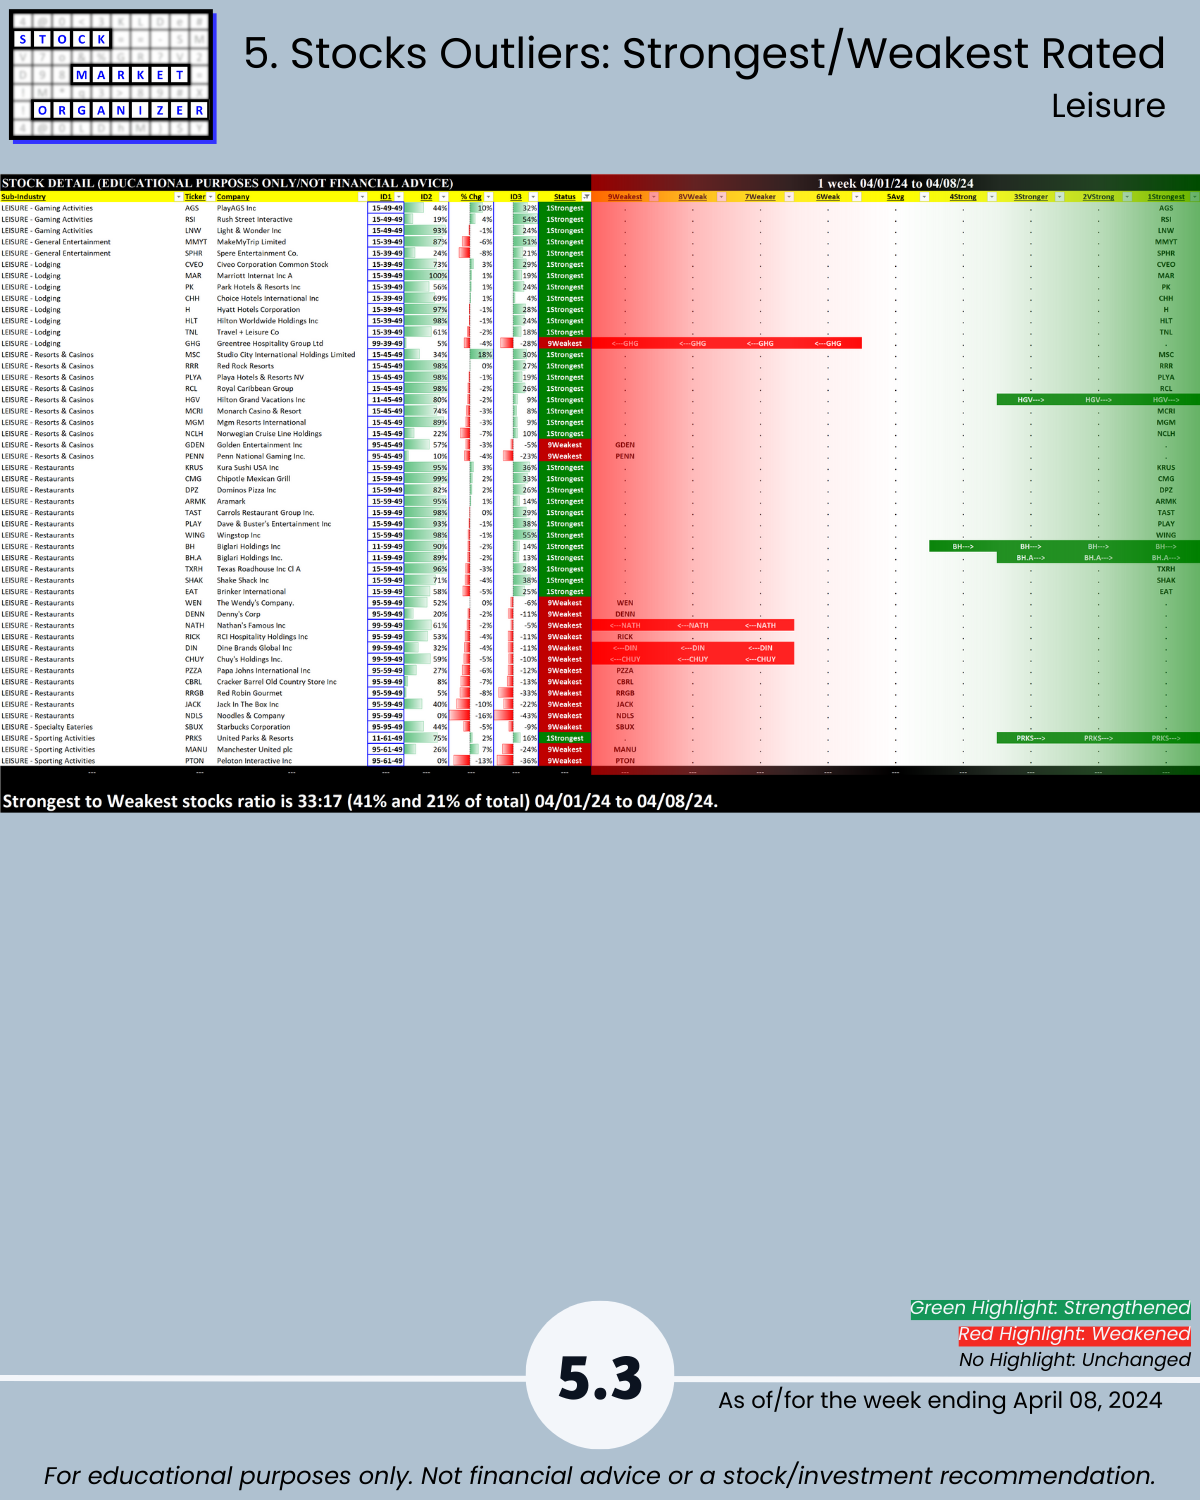
- Strongest Diversified Services, Leisure (4Strong)
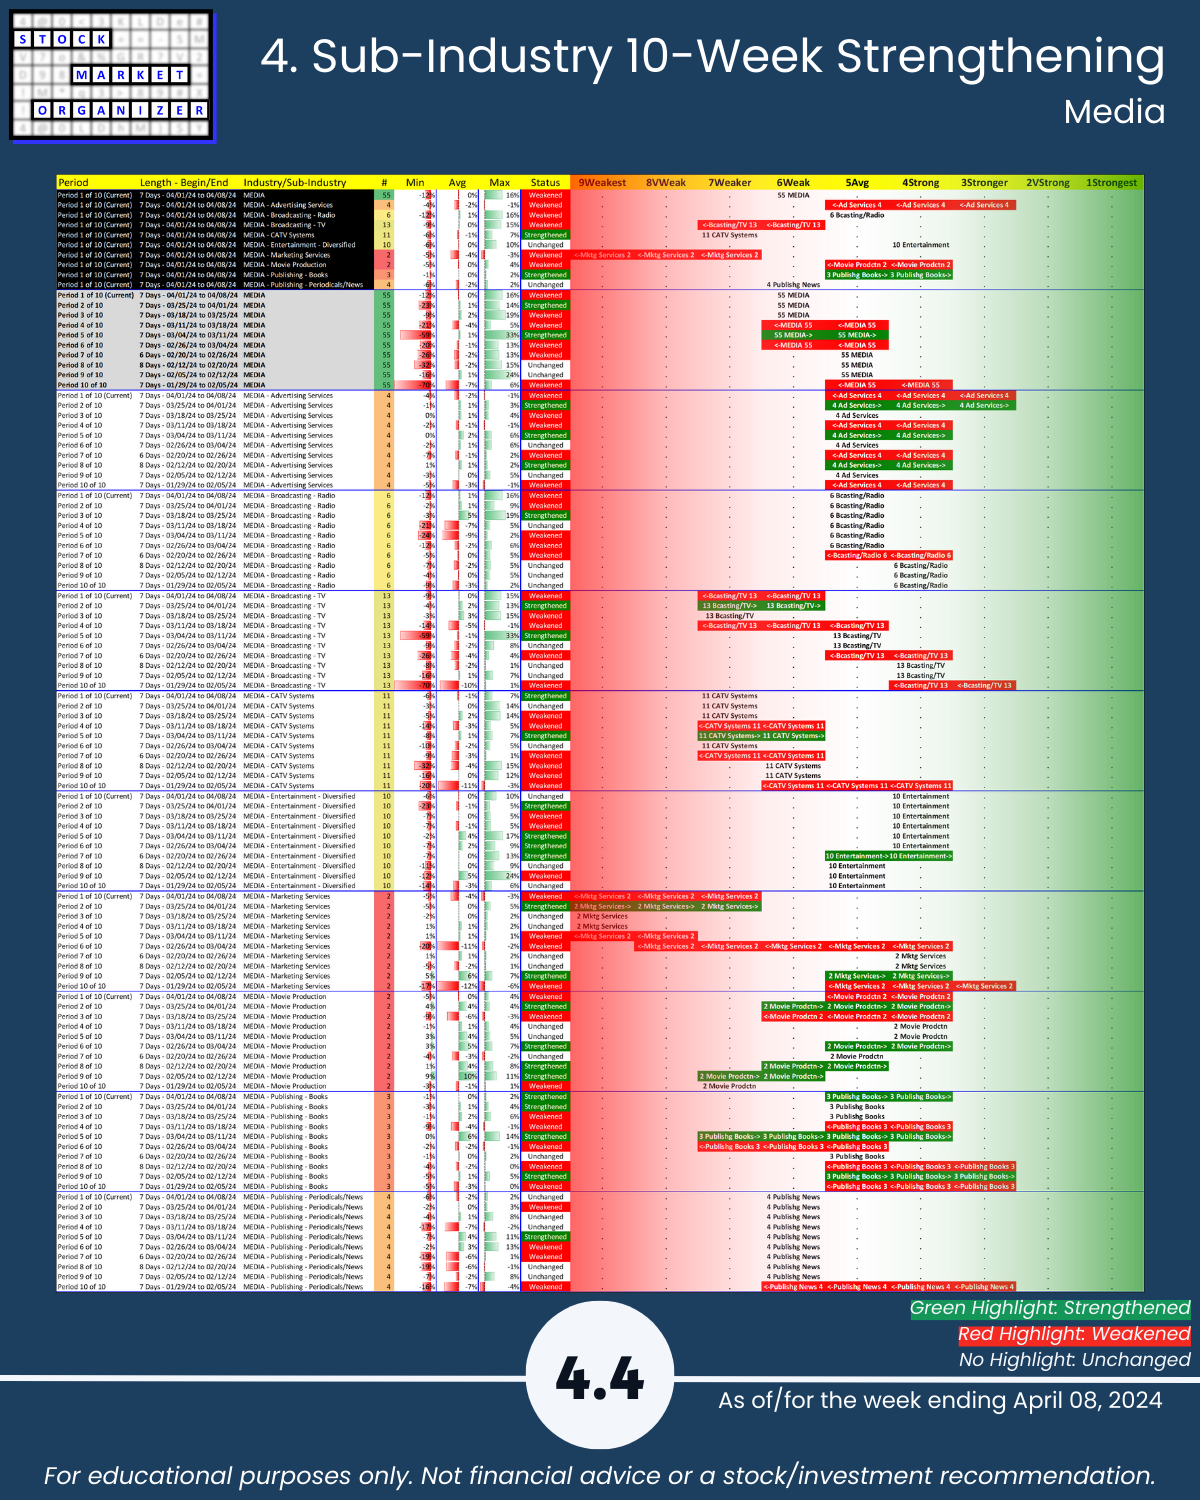
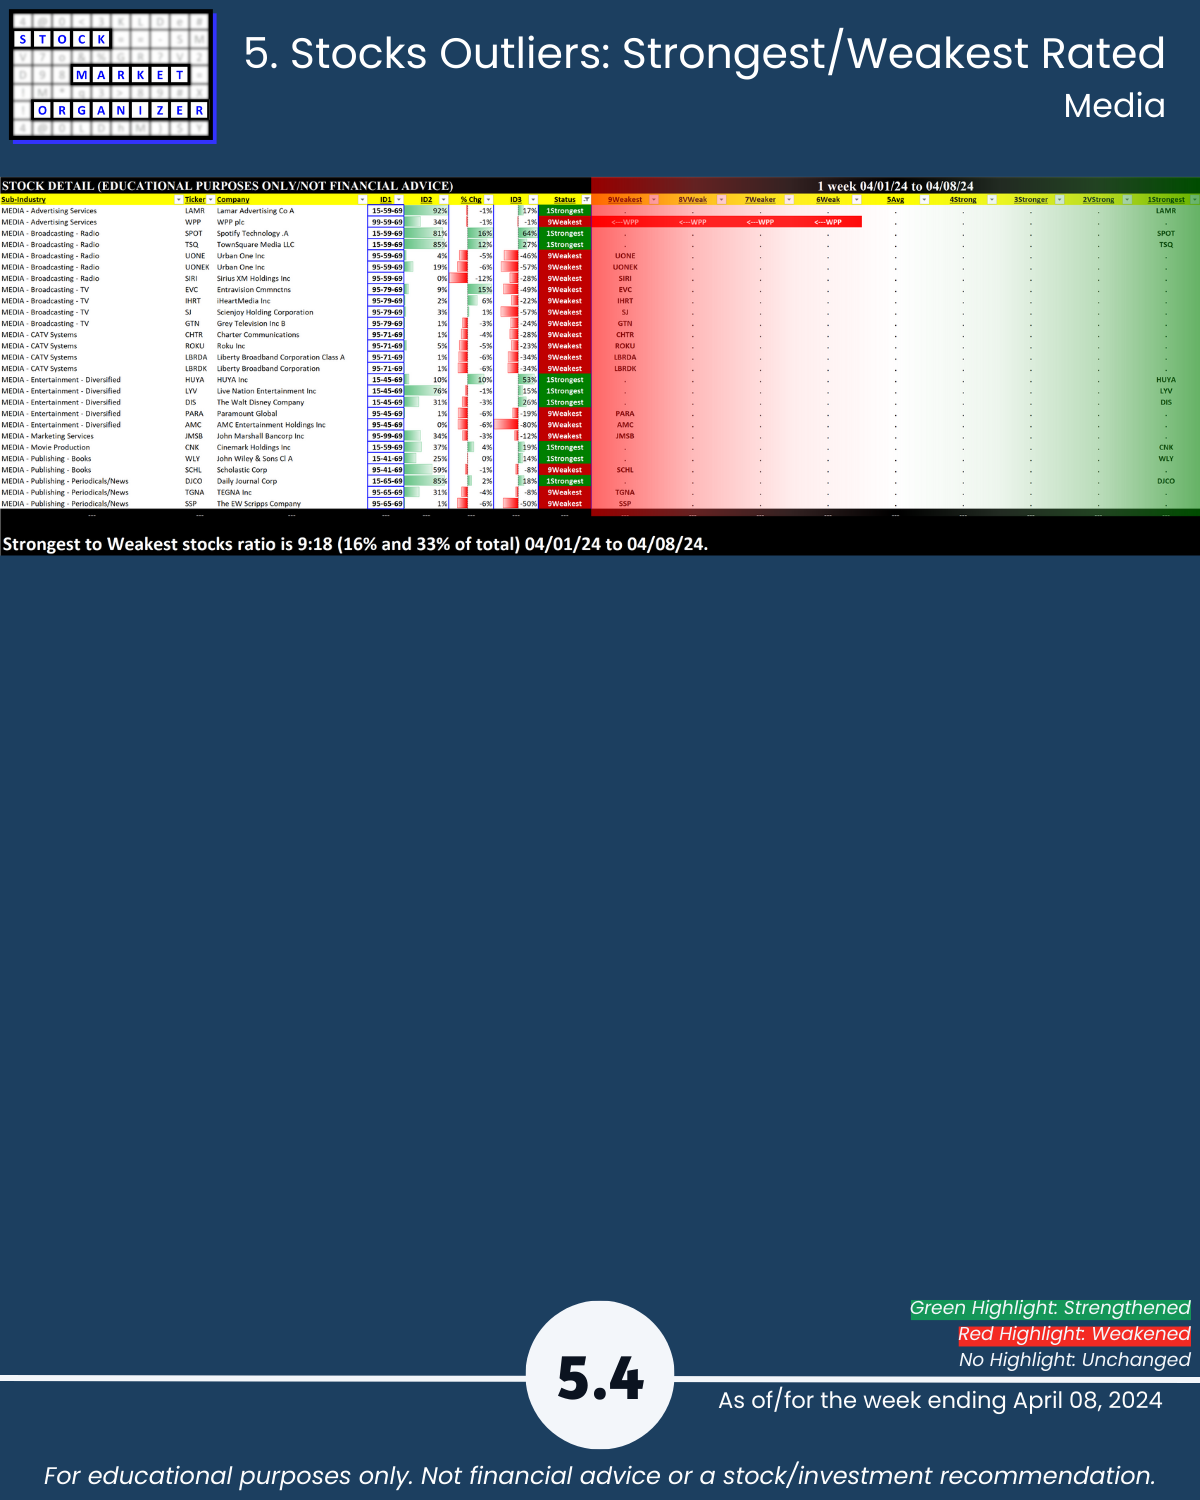
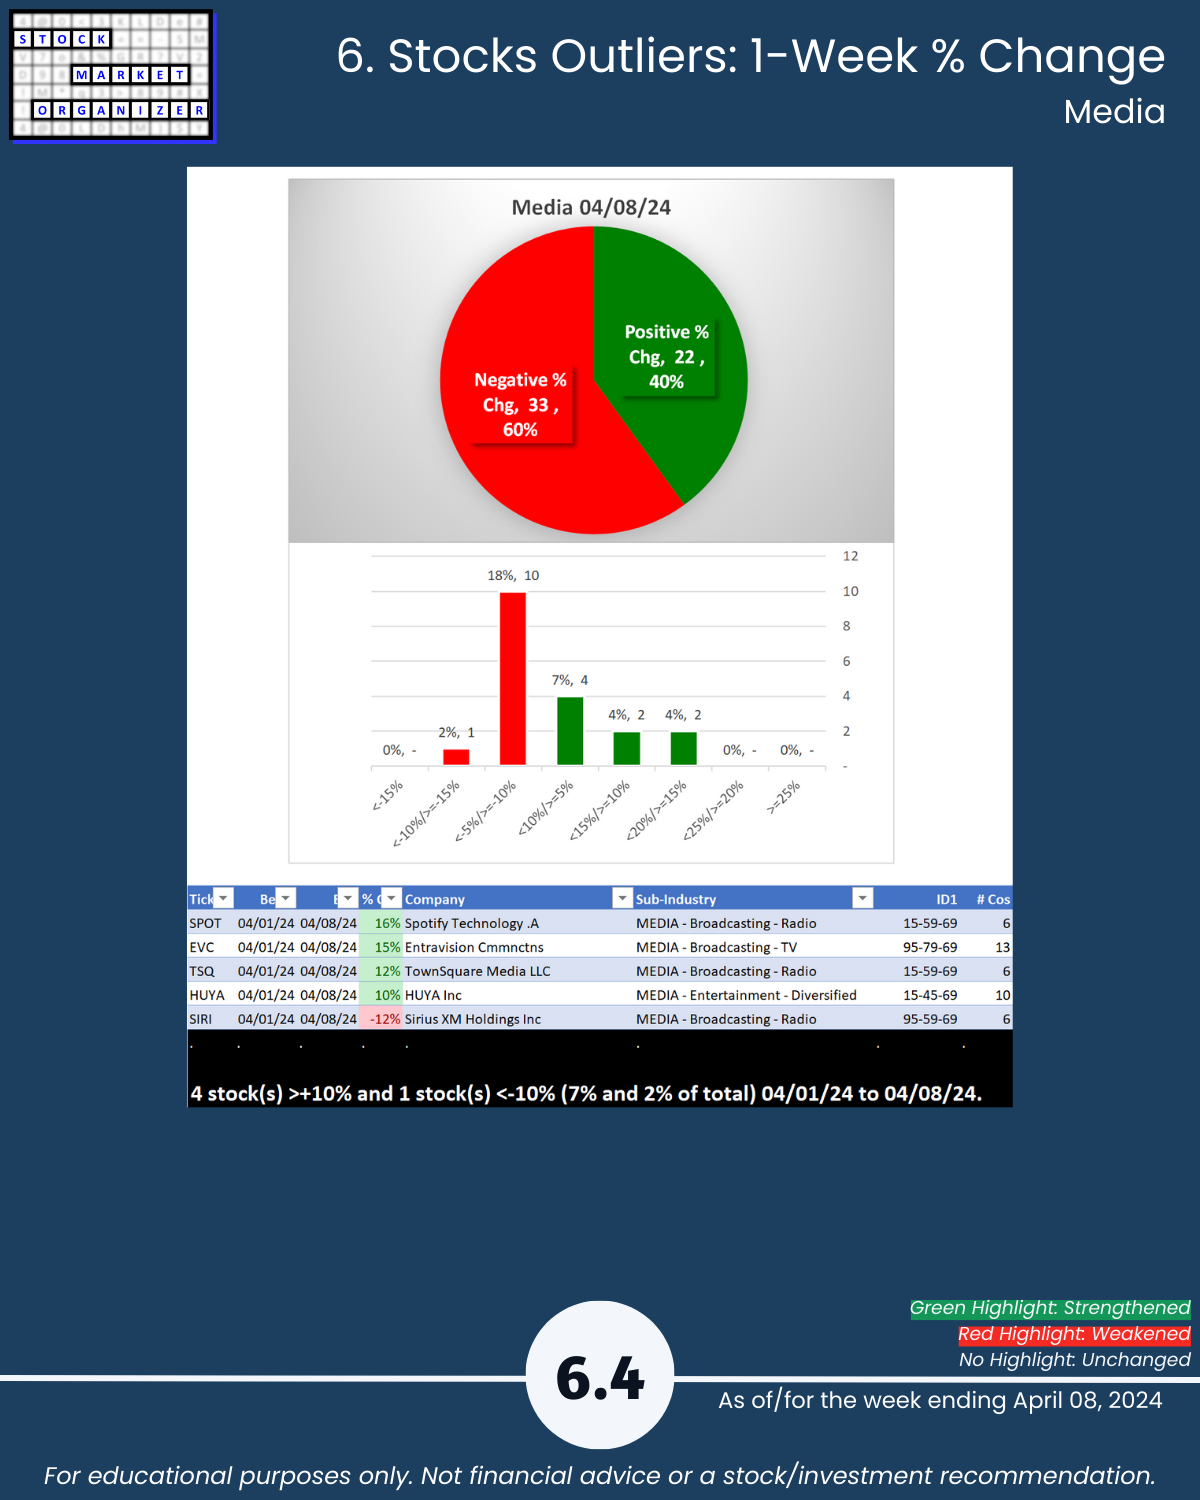
- Weakest Media (6Weak)
🔹 Sub-industries (38):
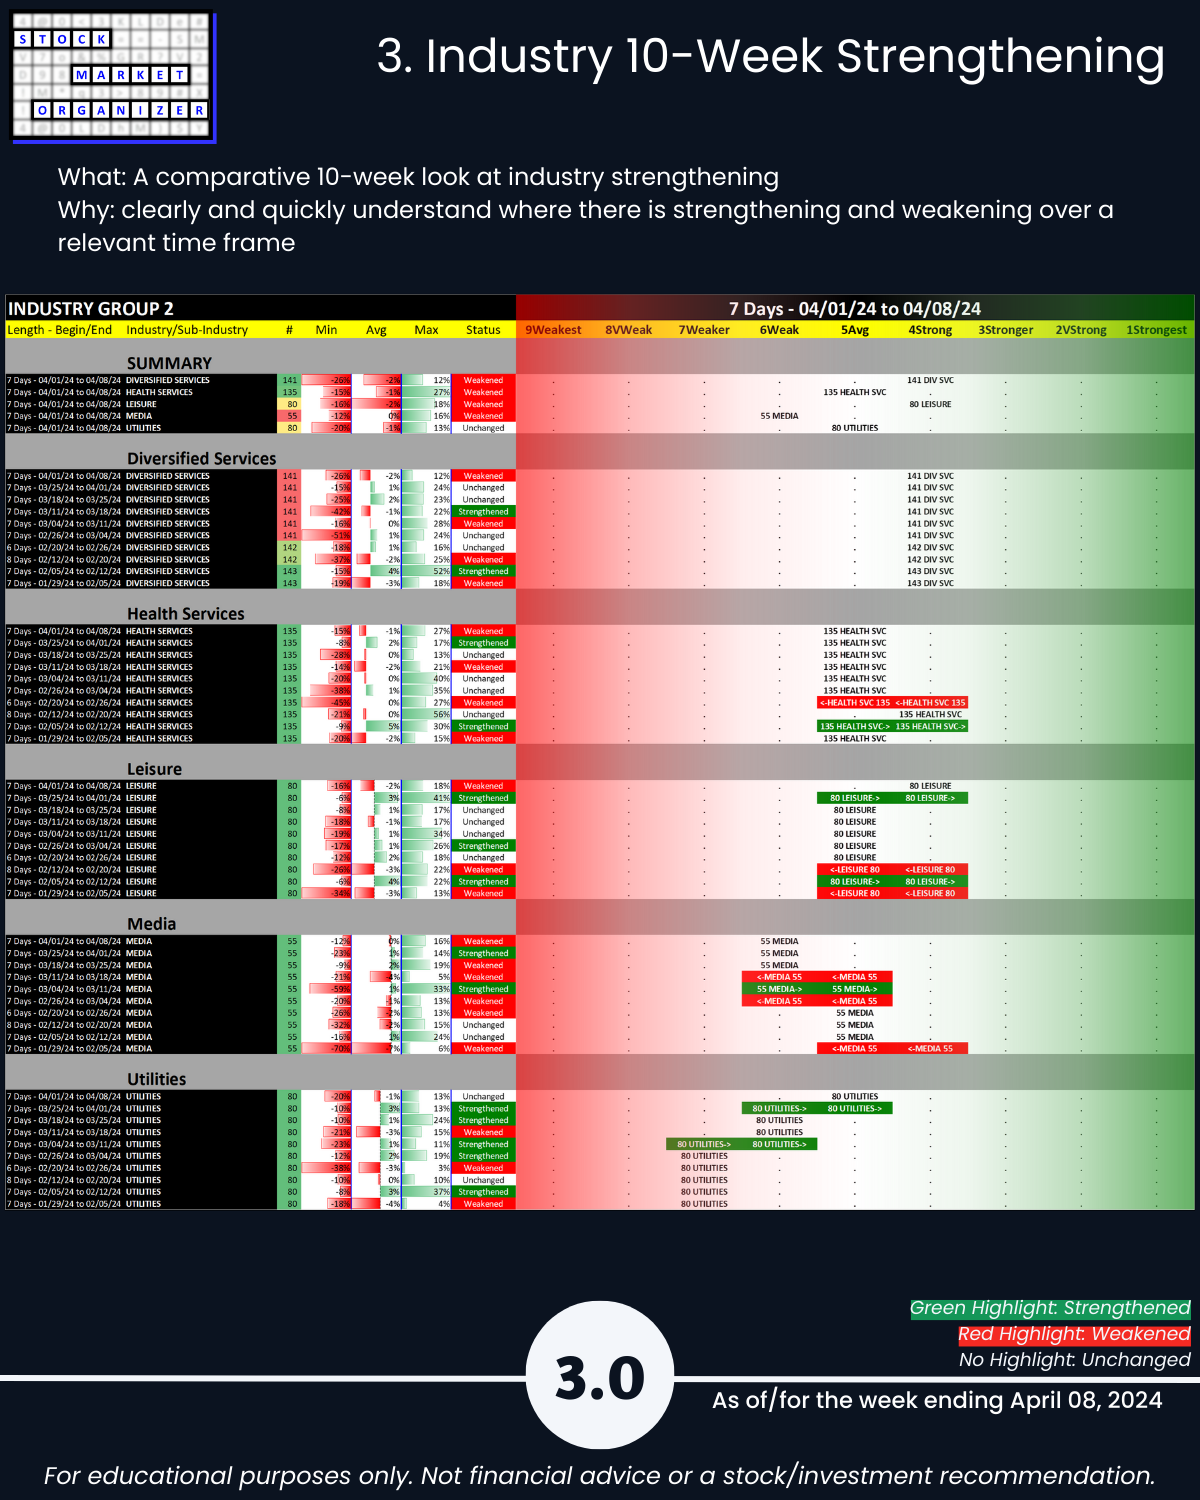
- 3% Strengthened, 37% Weakened
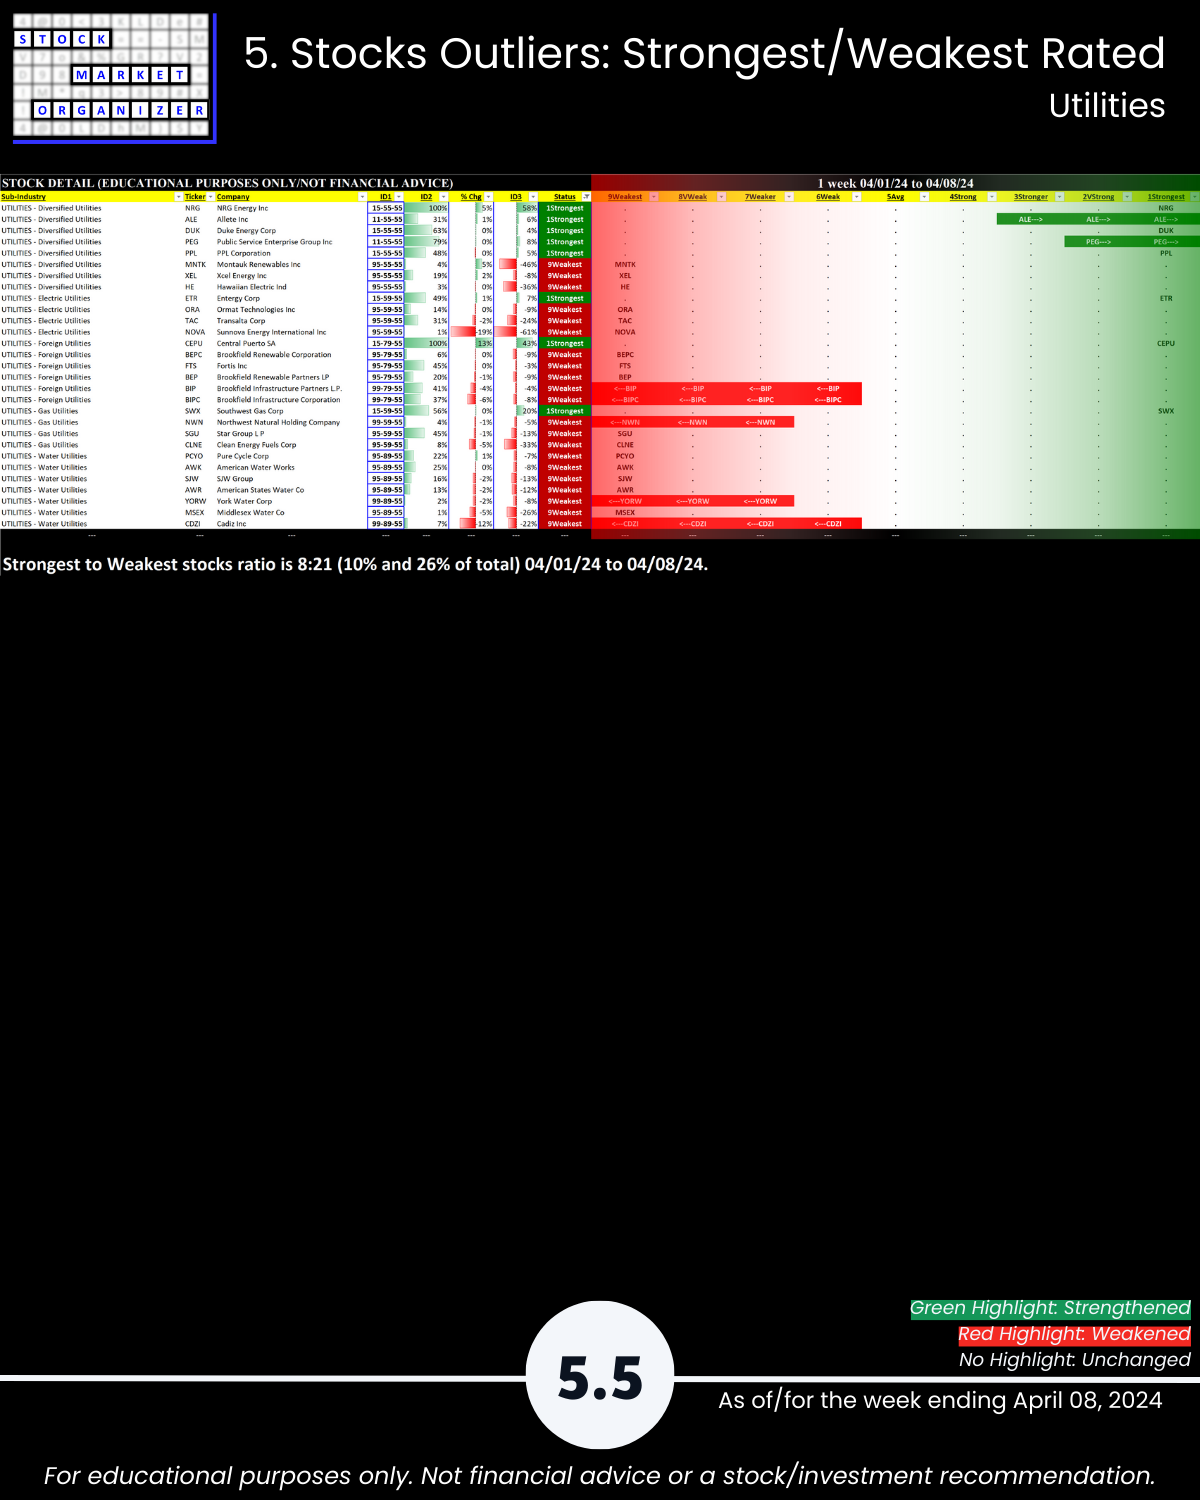
- Strongest: Technical Services (2VStrong)
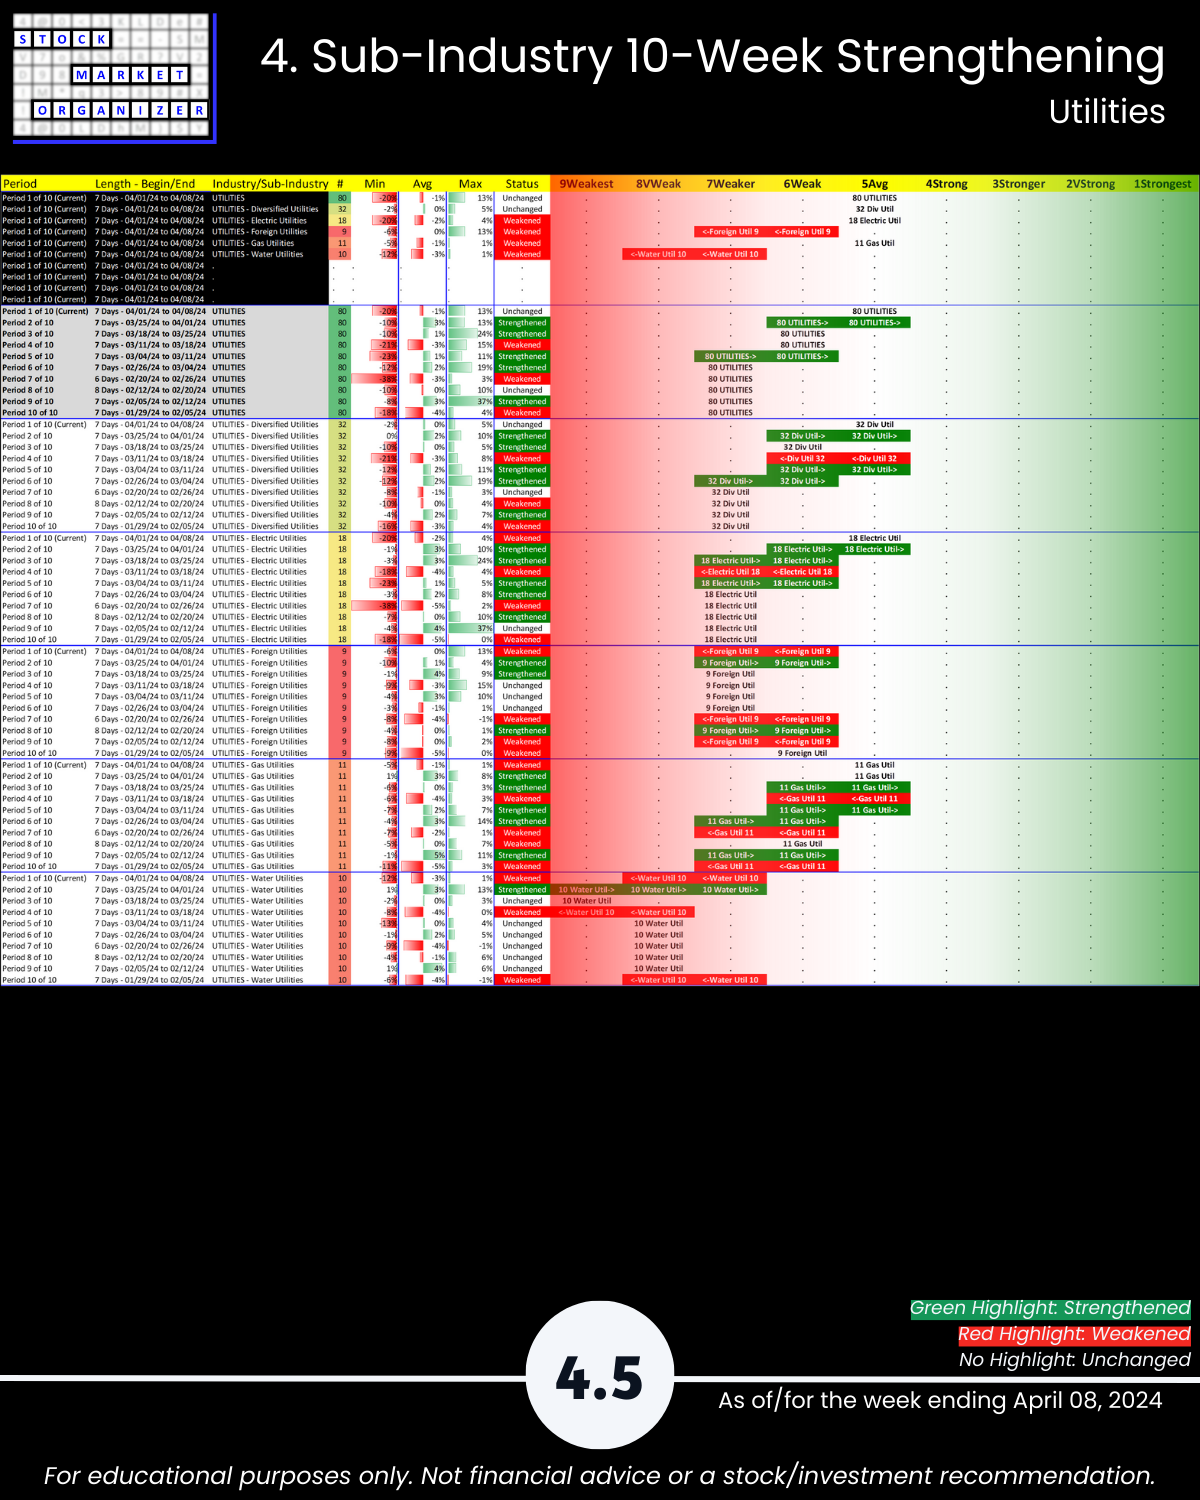
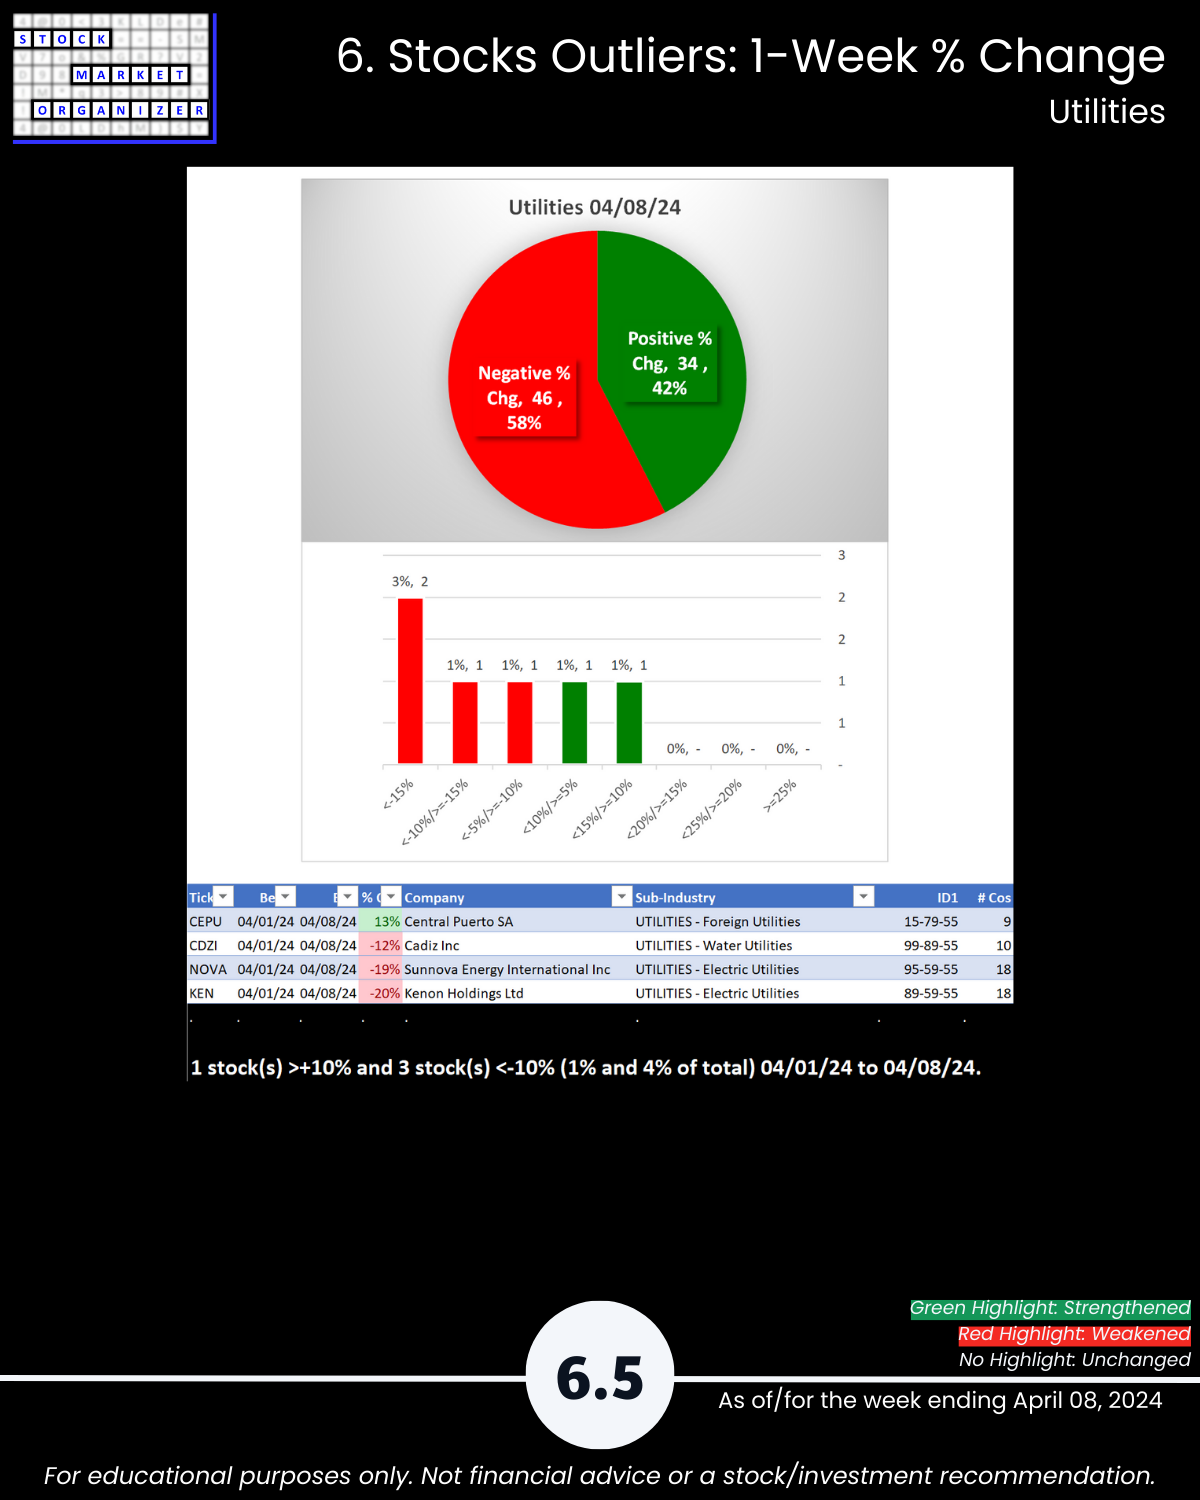
- Weakest: Water Utilities (8VWeak)
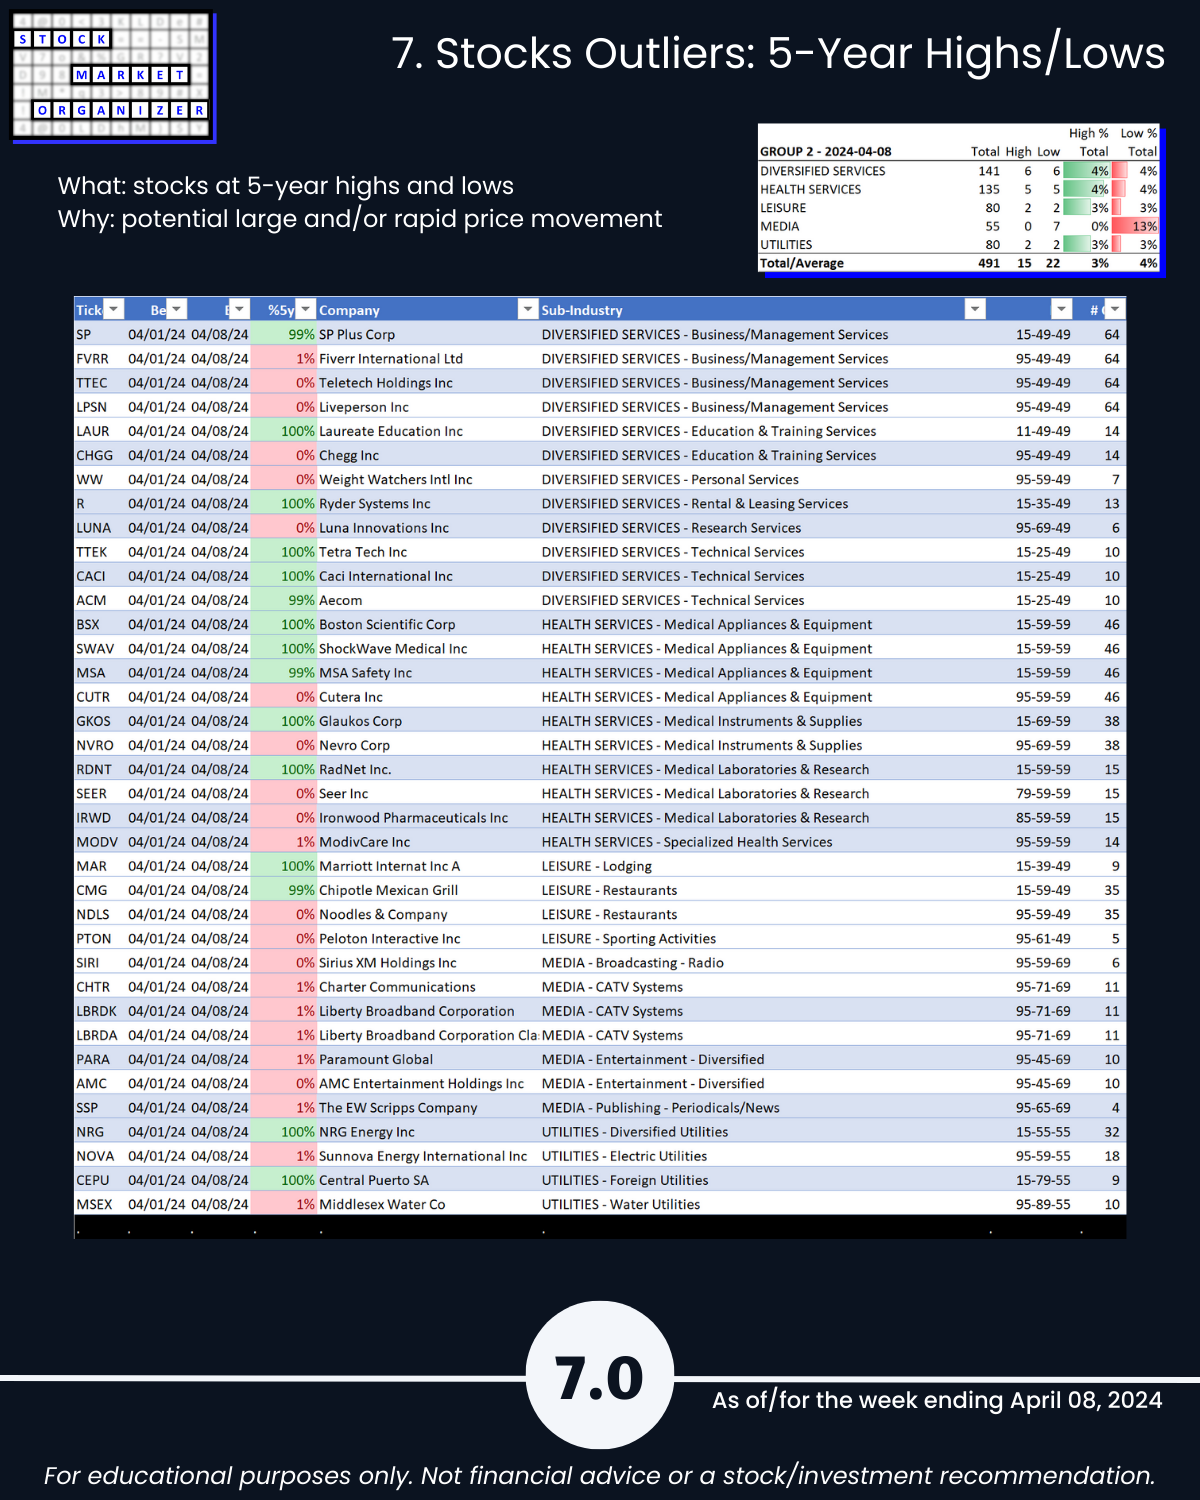
- @ 5 Year+ Highs/Lows: Media 13% lows
🔹 Stocks
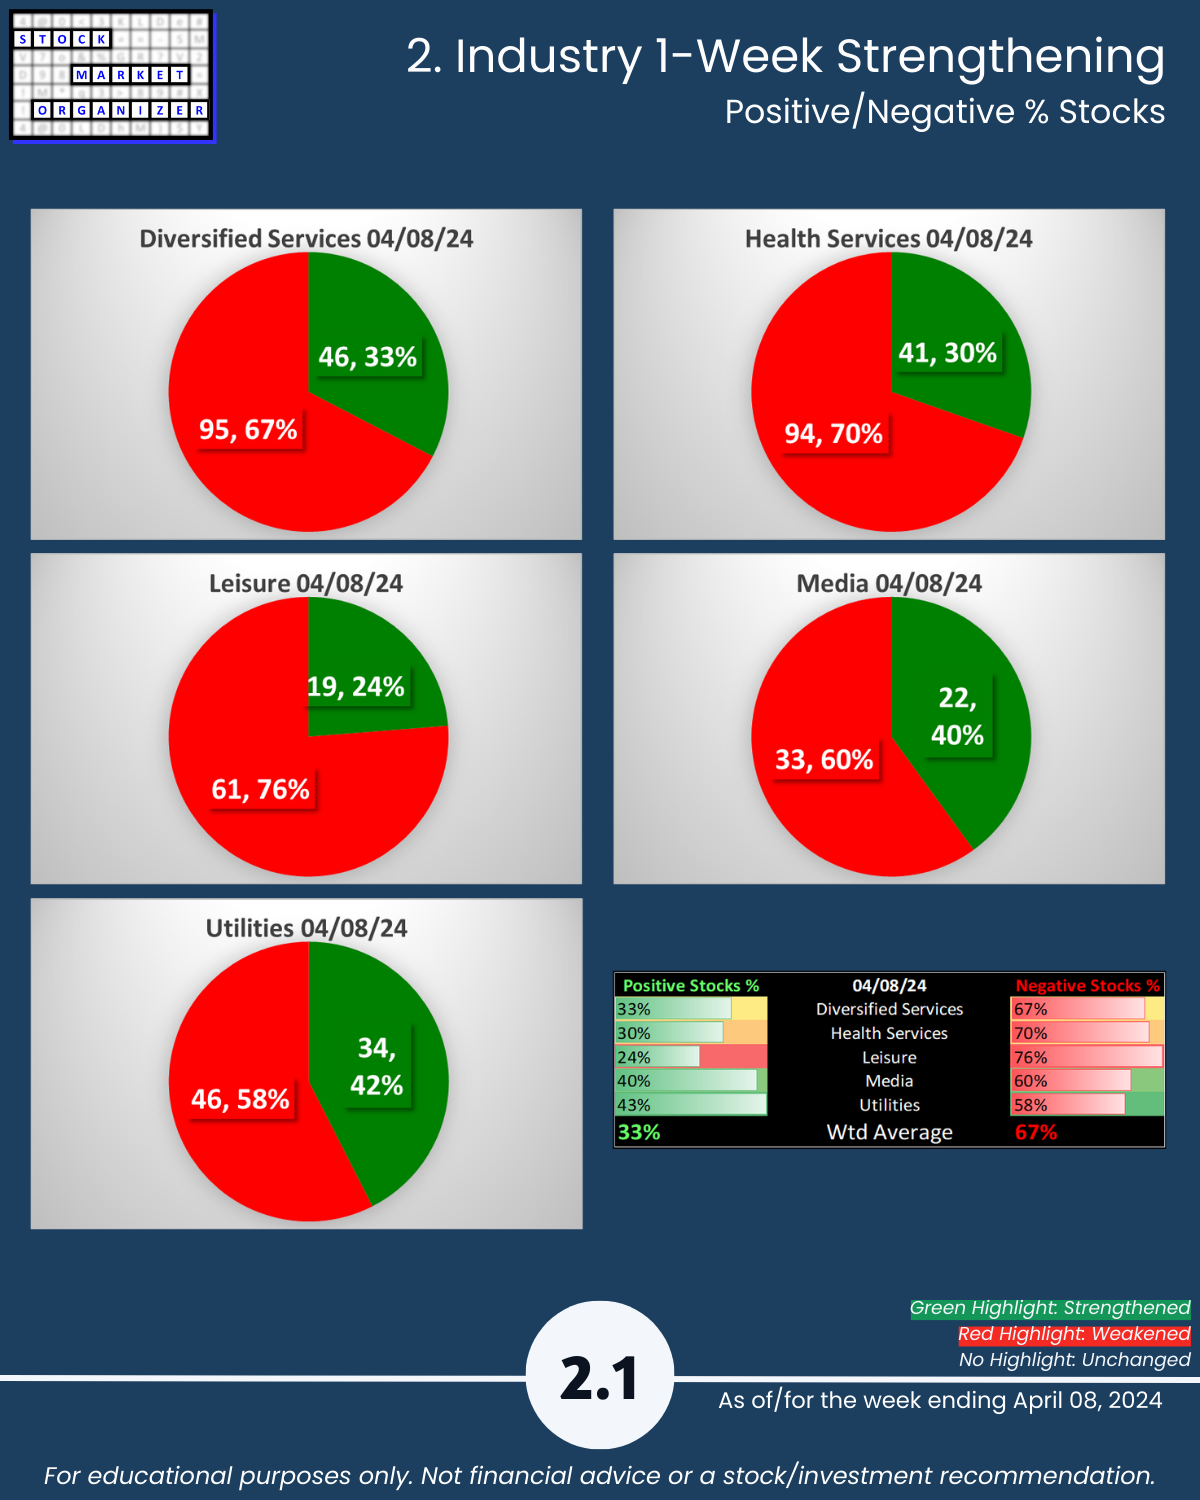
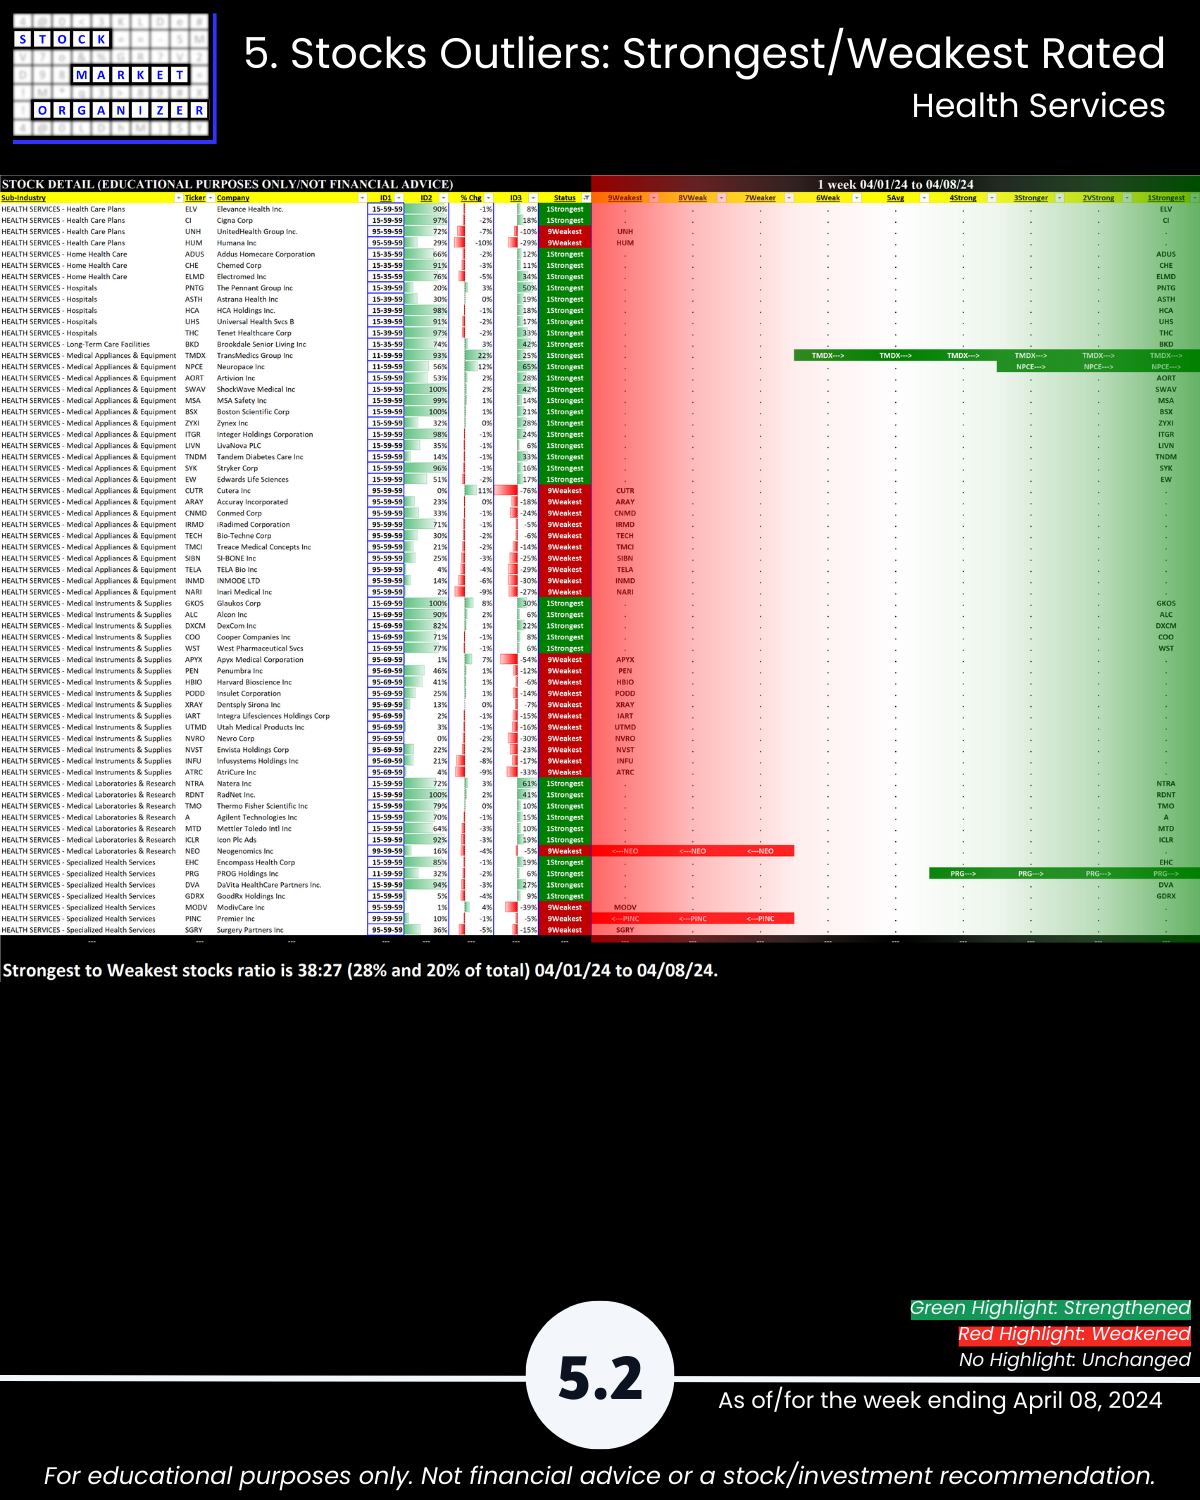
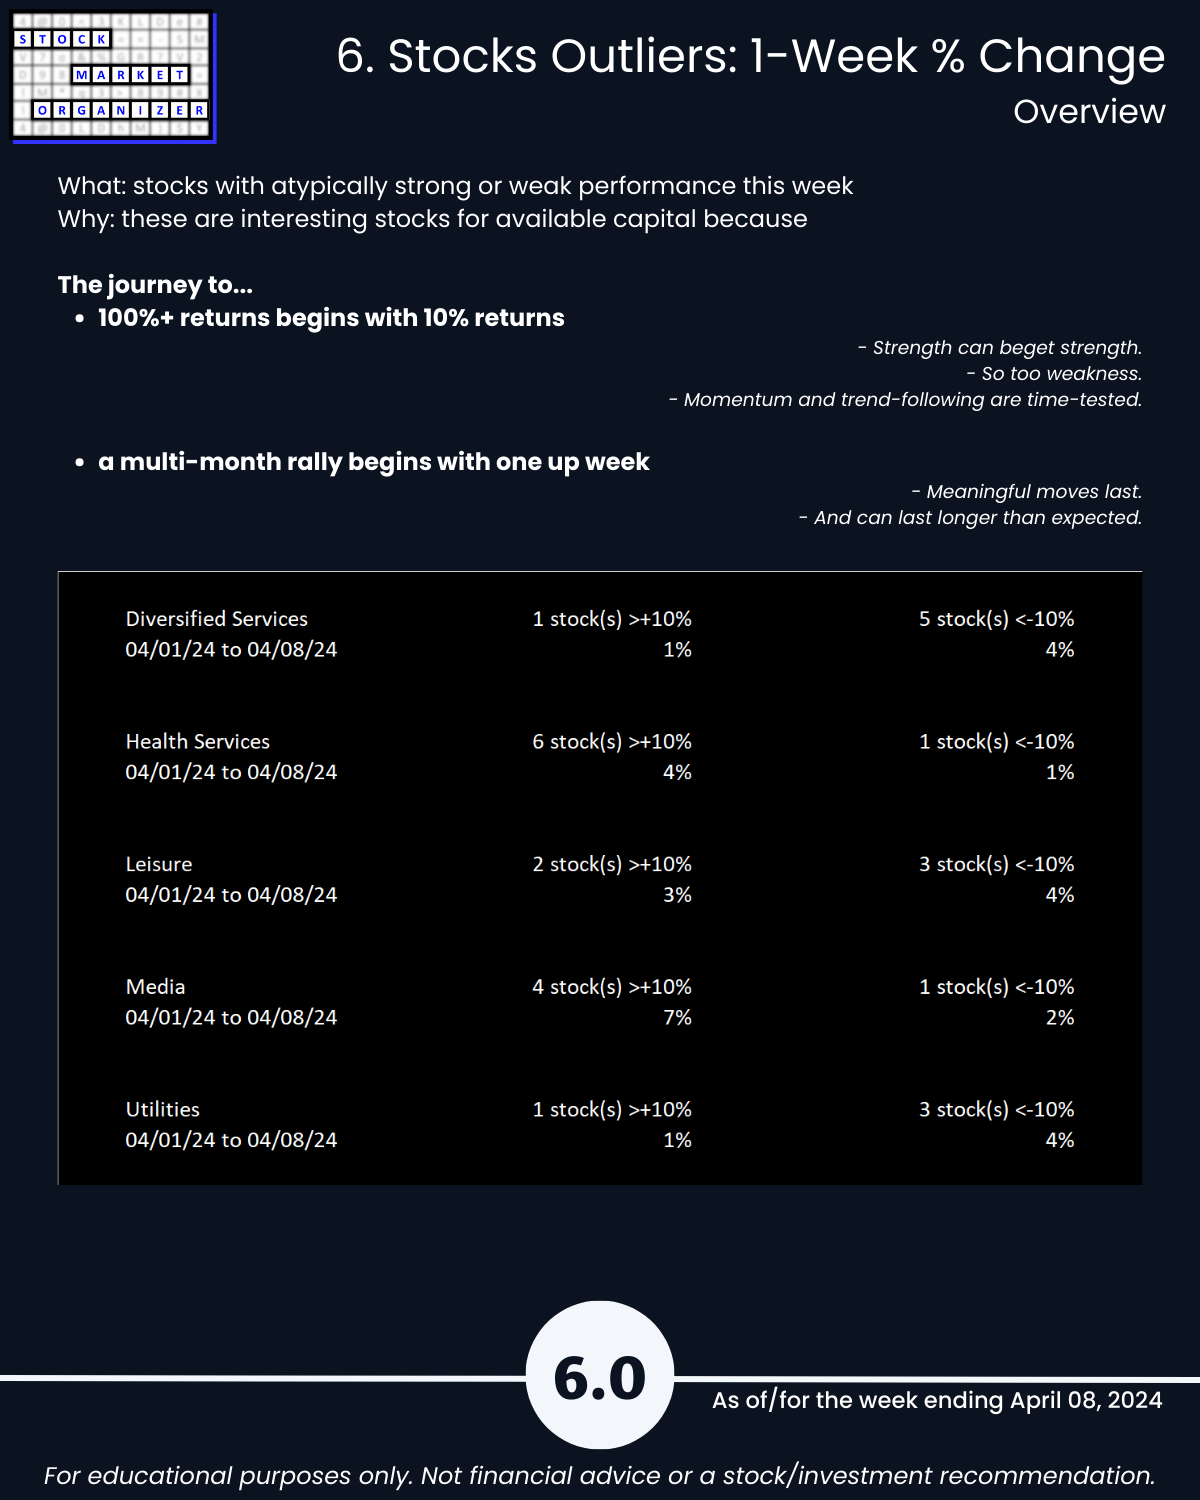
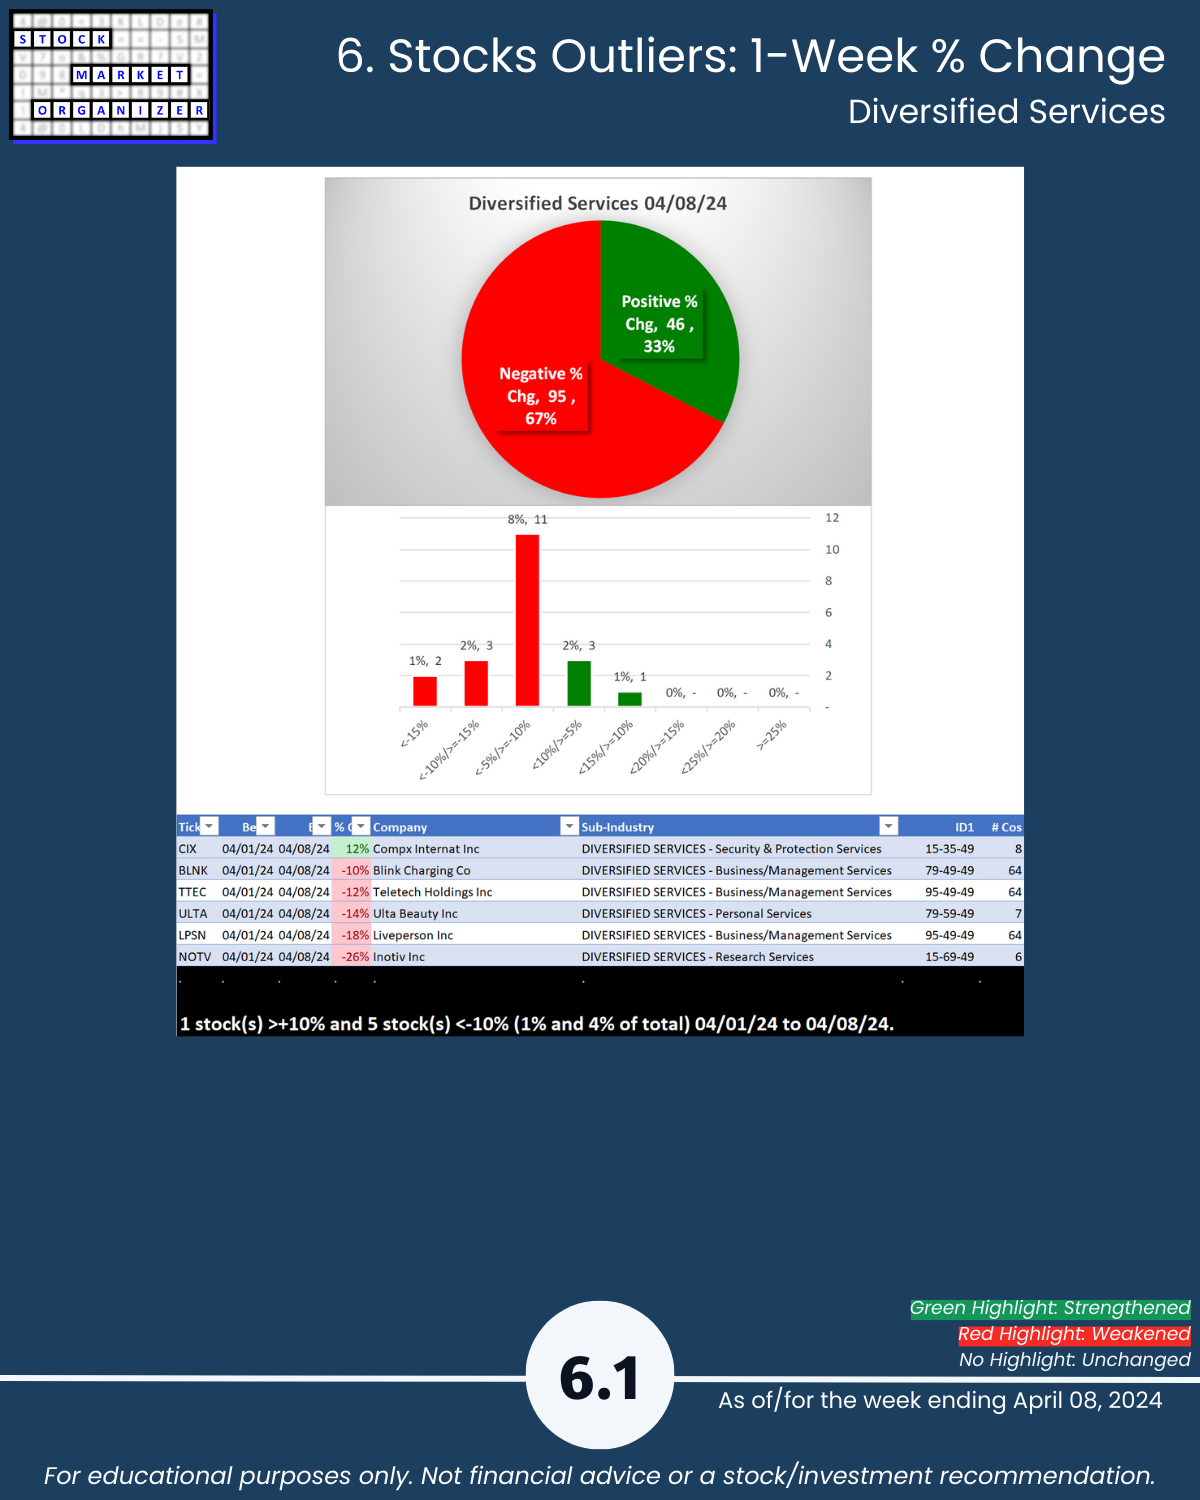
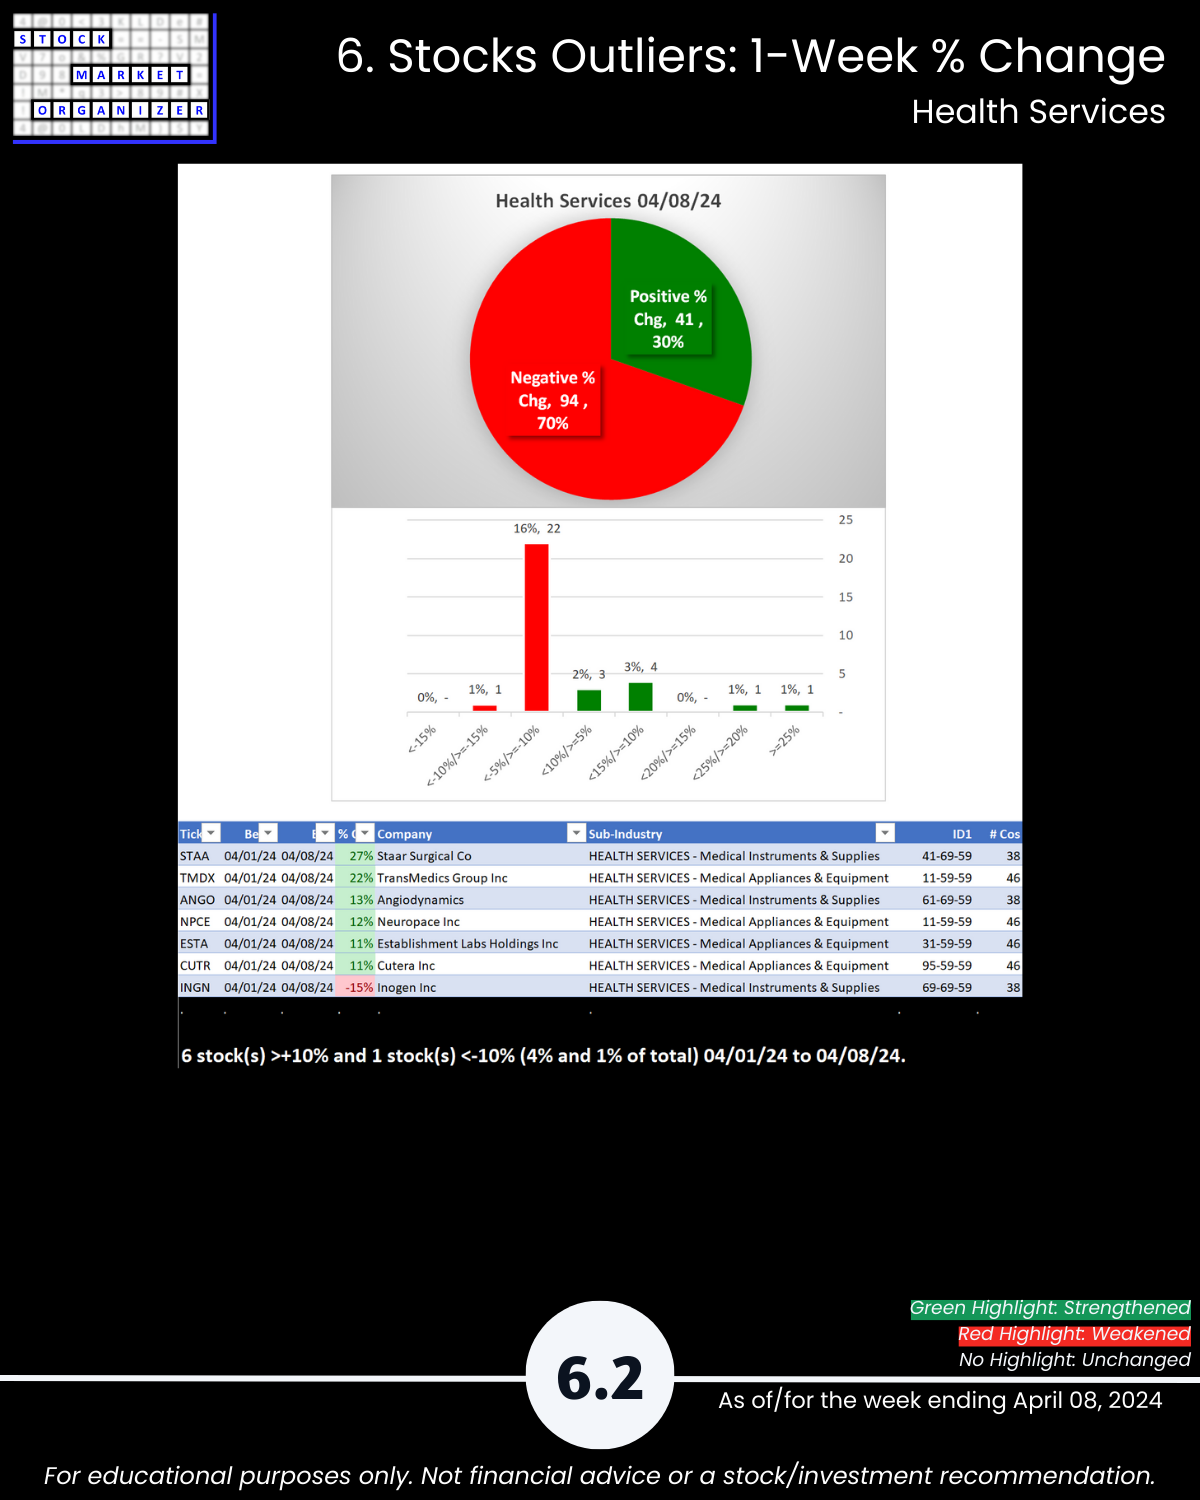
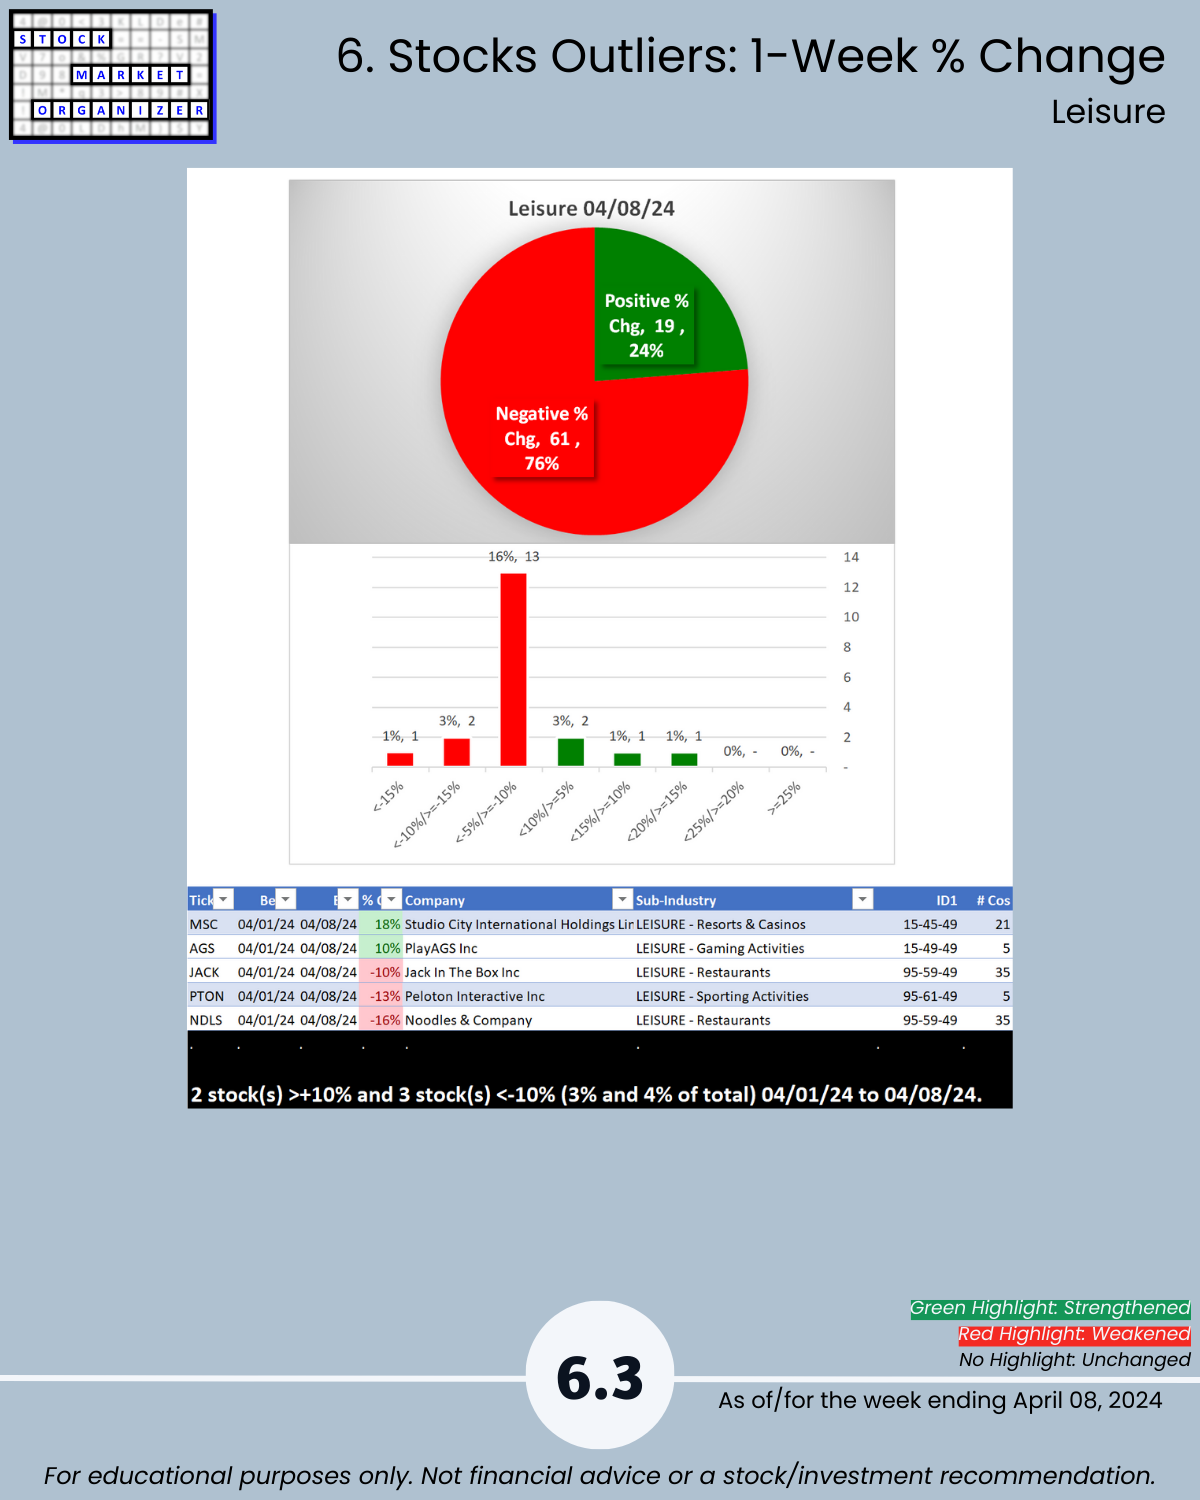
- Positive:Negative: Industry avg 33%/67%; Diversified Serv 67%, Health Serv 70%, Leisure 76% negative
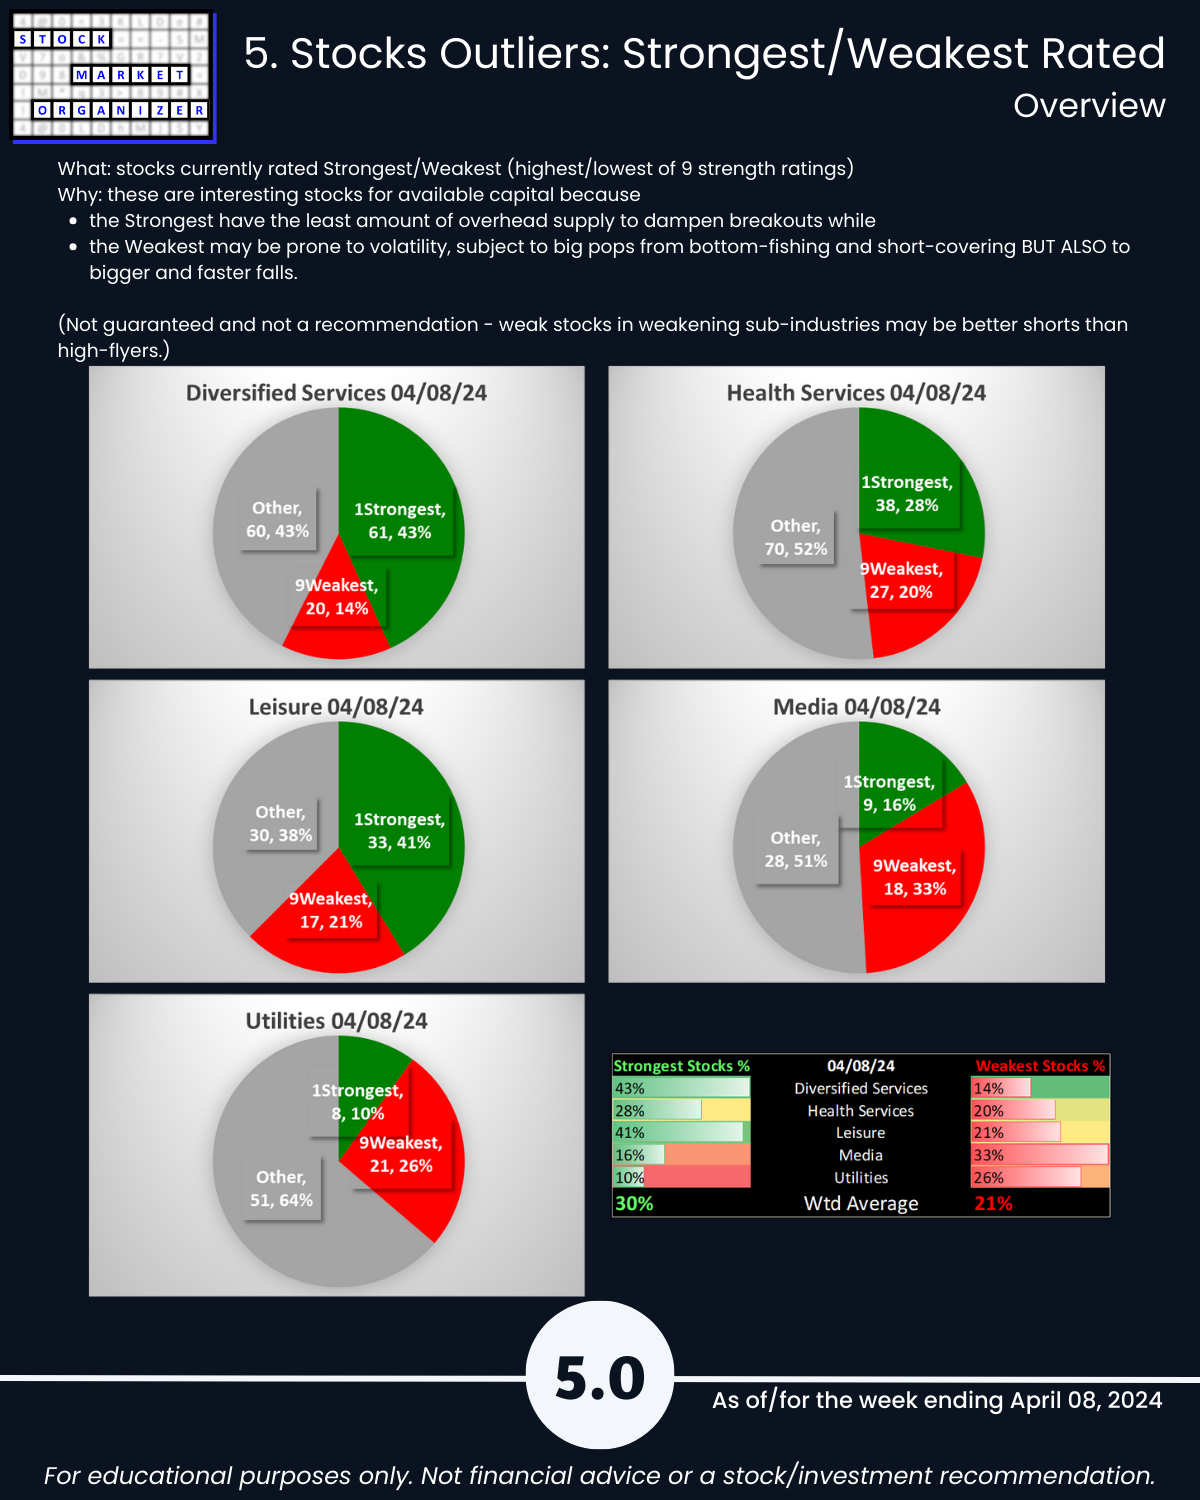
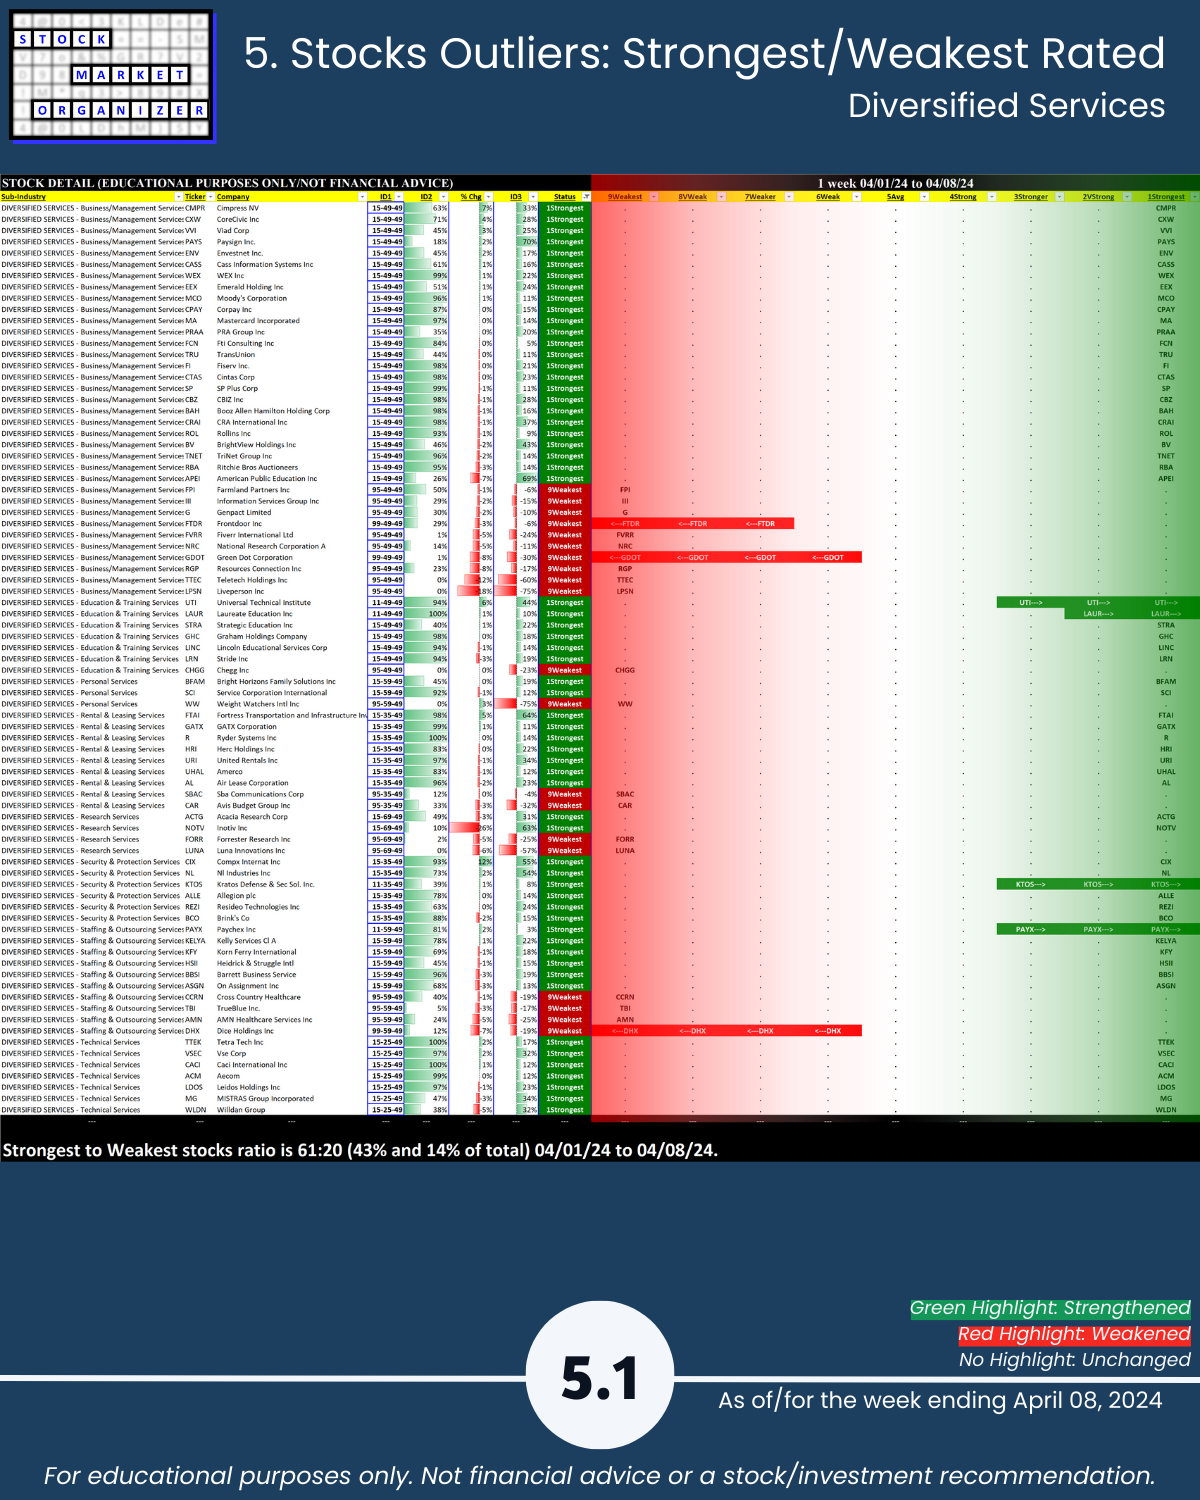
- Strongest:Weakest: Industry avg 30%/21%; Diversified Services 43%:14%, Leisure 41%:21% of total
- Outlier Stocks: NOTV -26%, STAA +27%, TMDX +22%, KEN -20%
This report may particularly be of interest if the following 5 concepts resonate with you:
- The stronger your stocks, the greener your P&L.
- The journey to 100%+ returns begins with 10% returns.
- The journey to a multi-month rally begins with one up week.
- Most stocks do what the market does. (While the market can only do what its underlying stocks, sub-industries, and industries do.)
- 80/20: not all information is created equal. (Press buttons, not balloons.)
Following are galleries with page-by-page views of this report.
1. Introduction
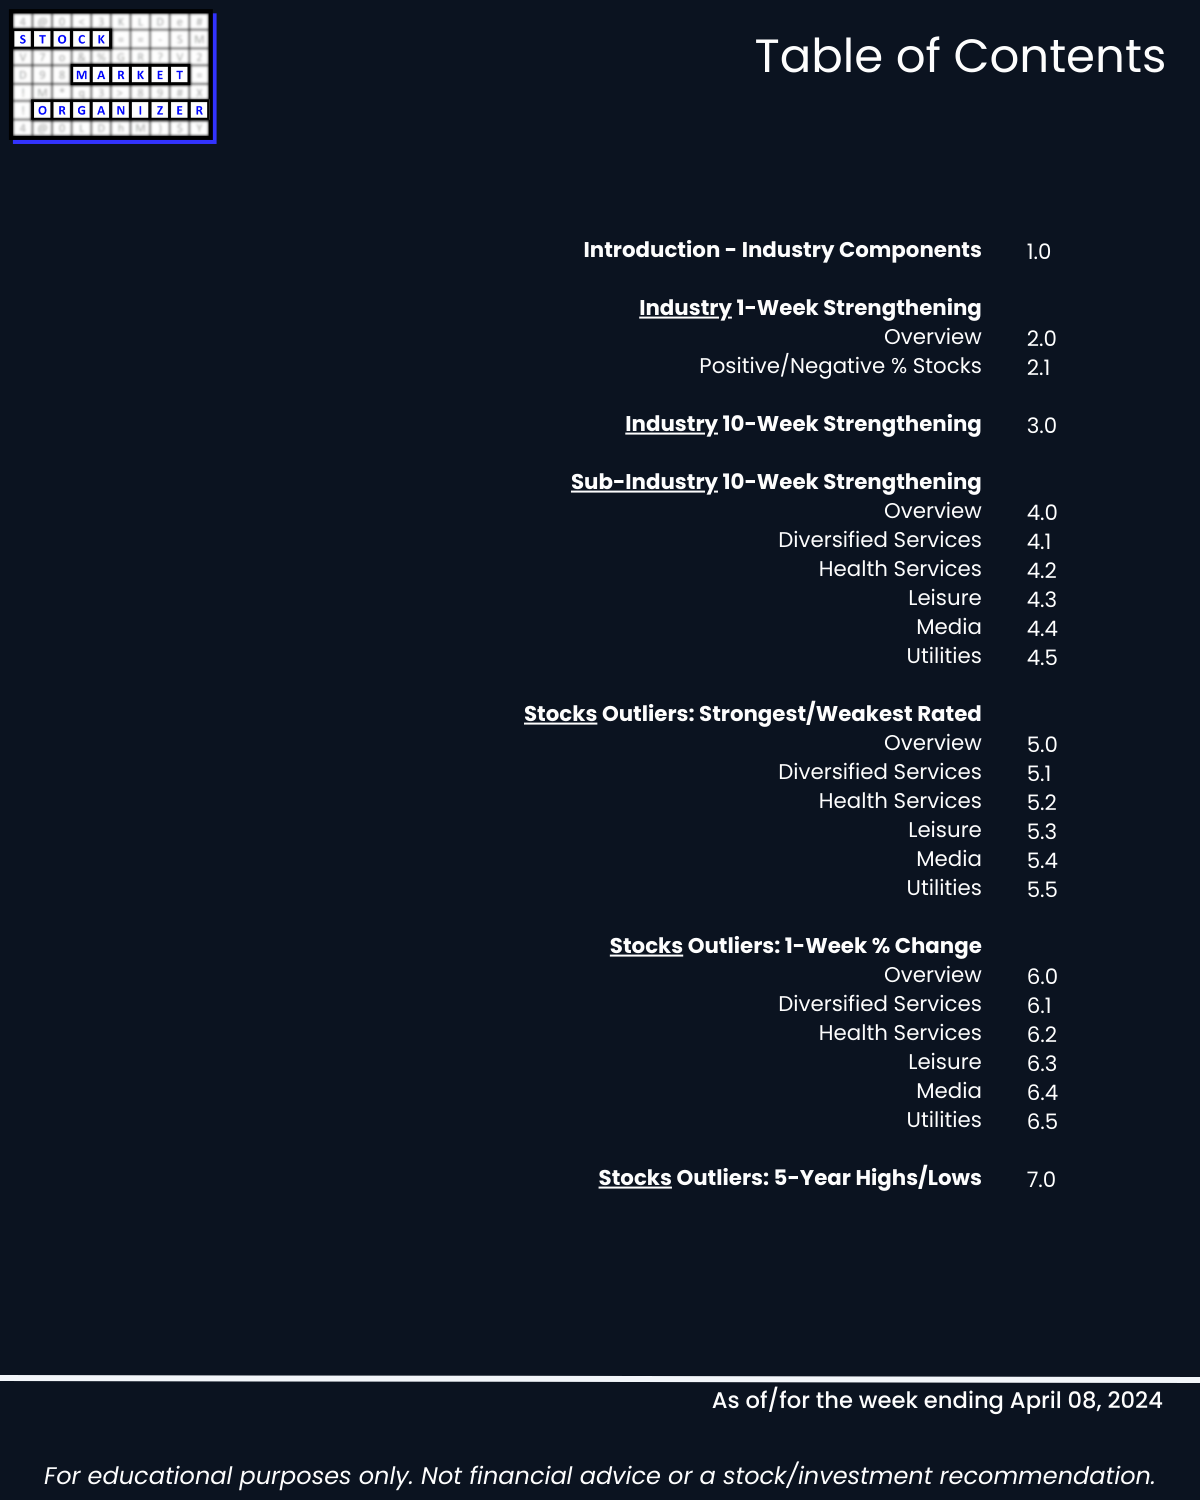
2. Industry 1-Week Strengthening
3. Industry 10-Week Strengthening
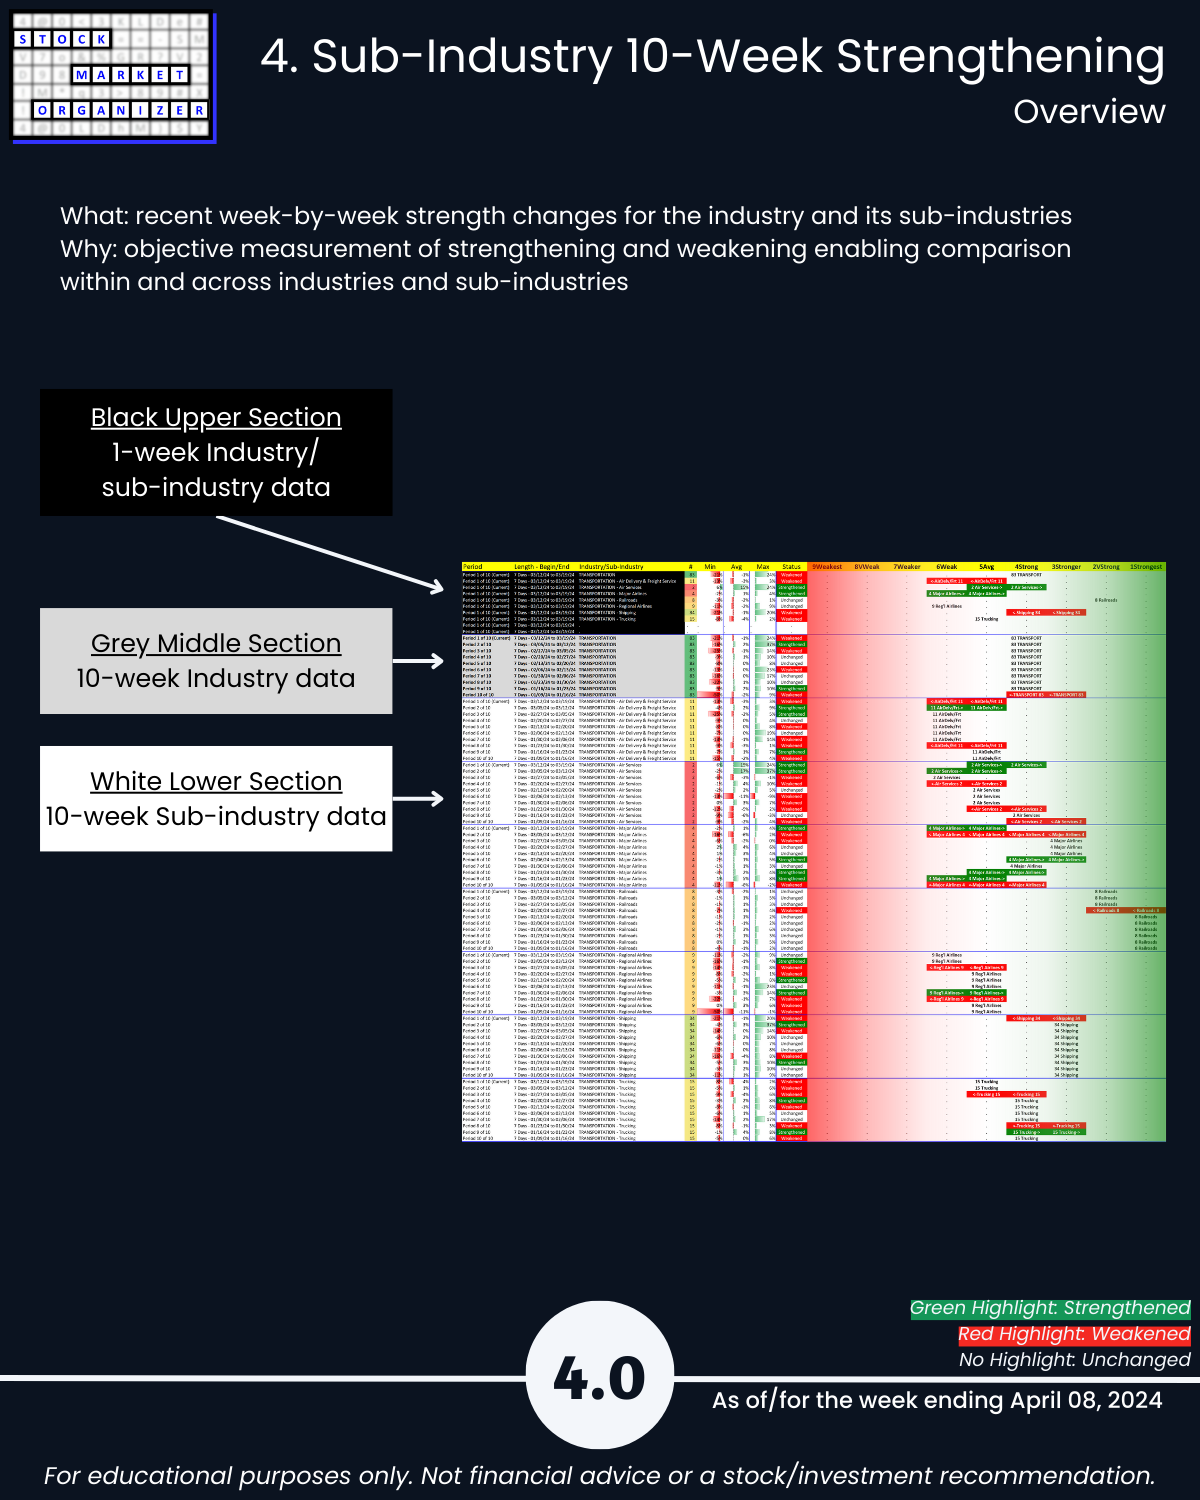
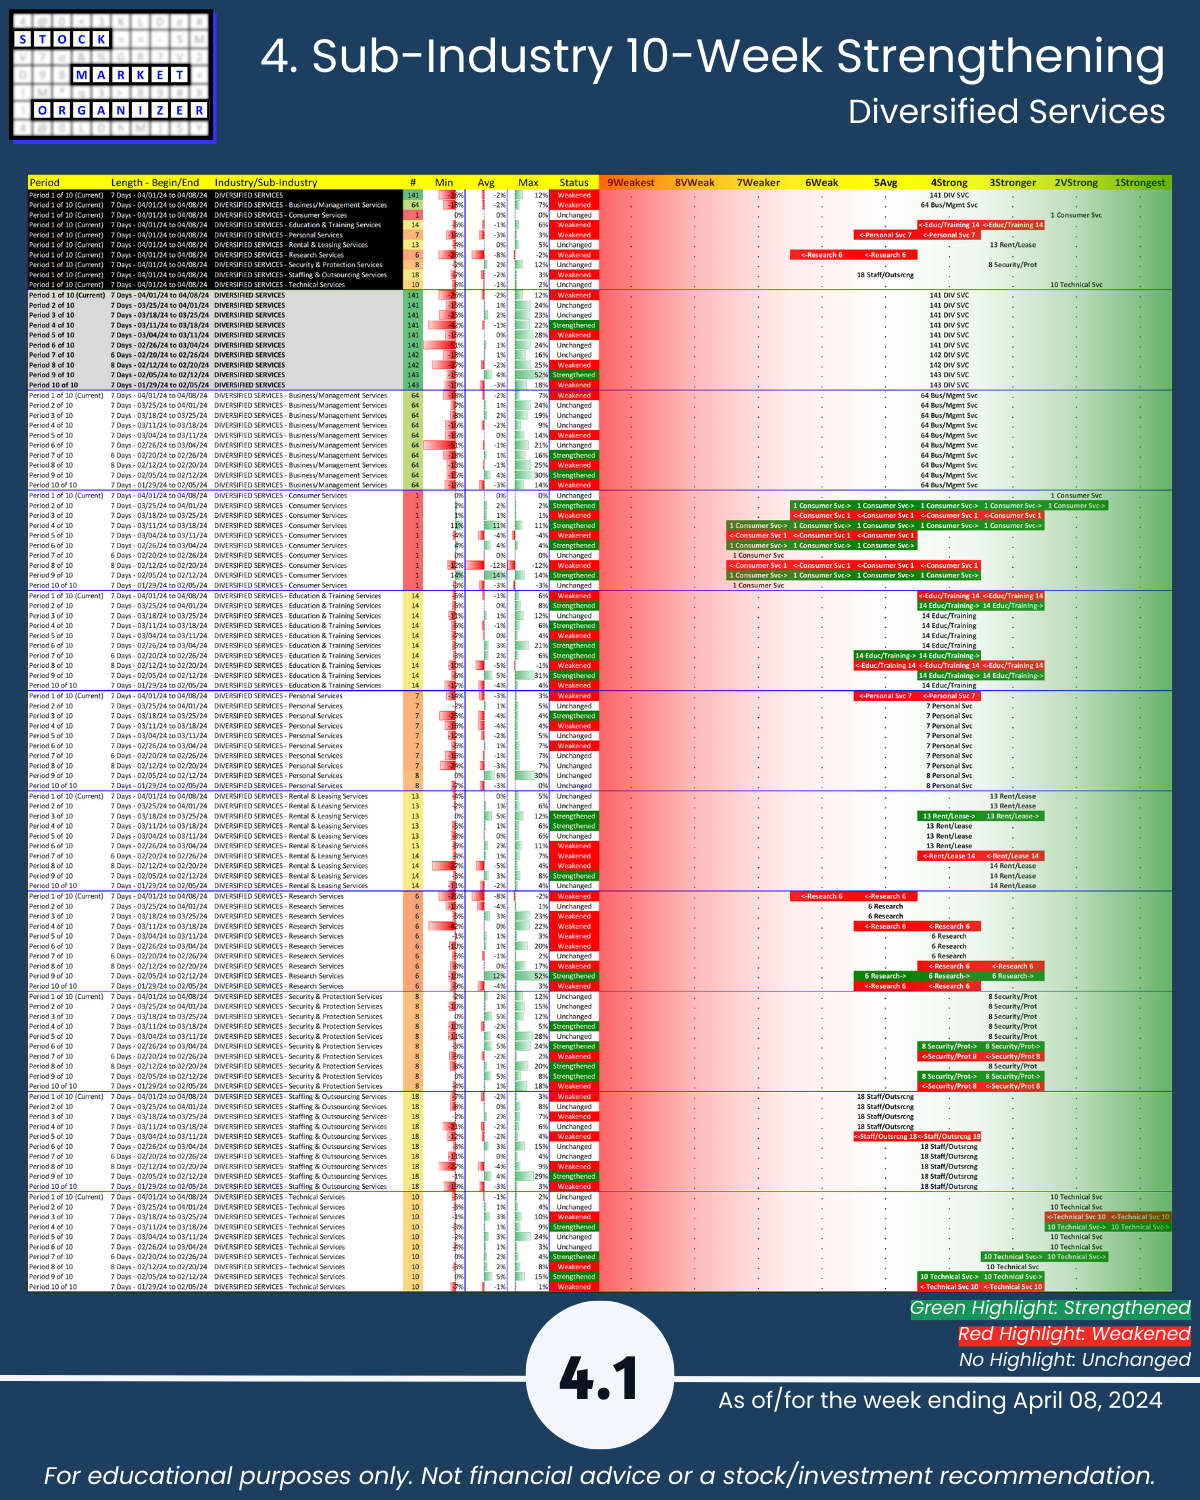
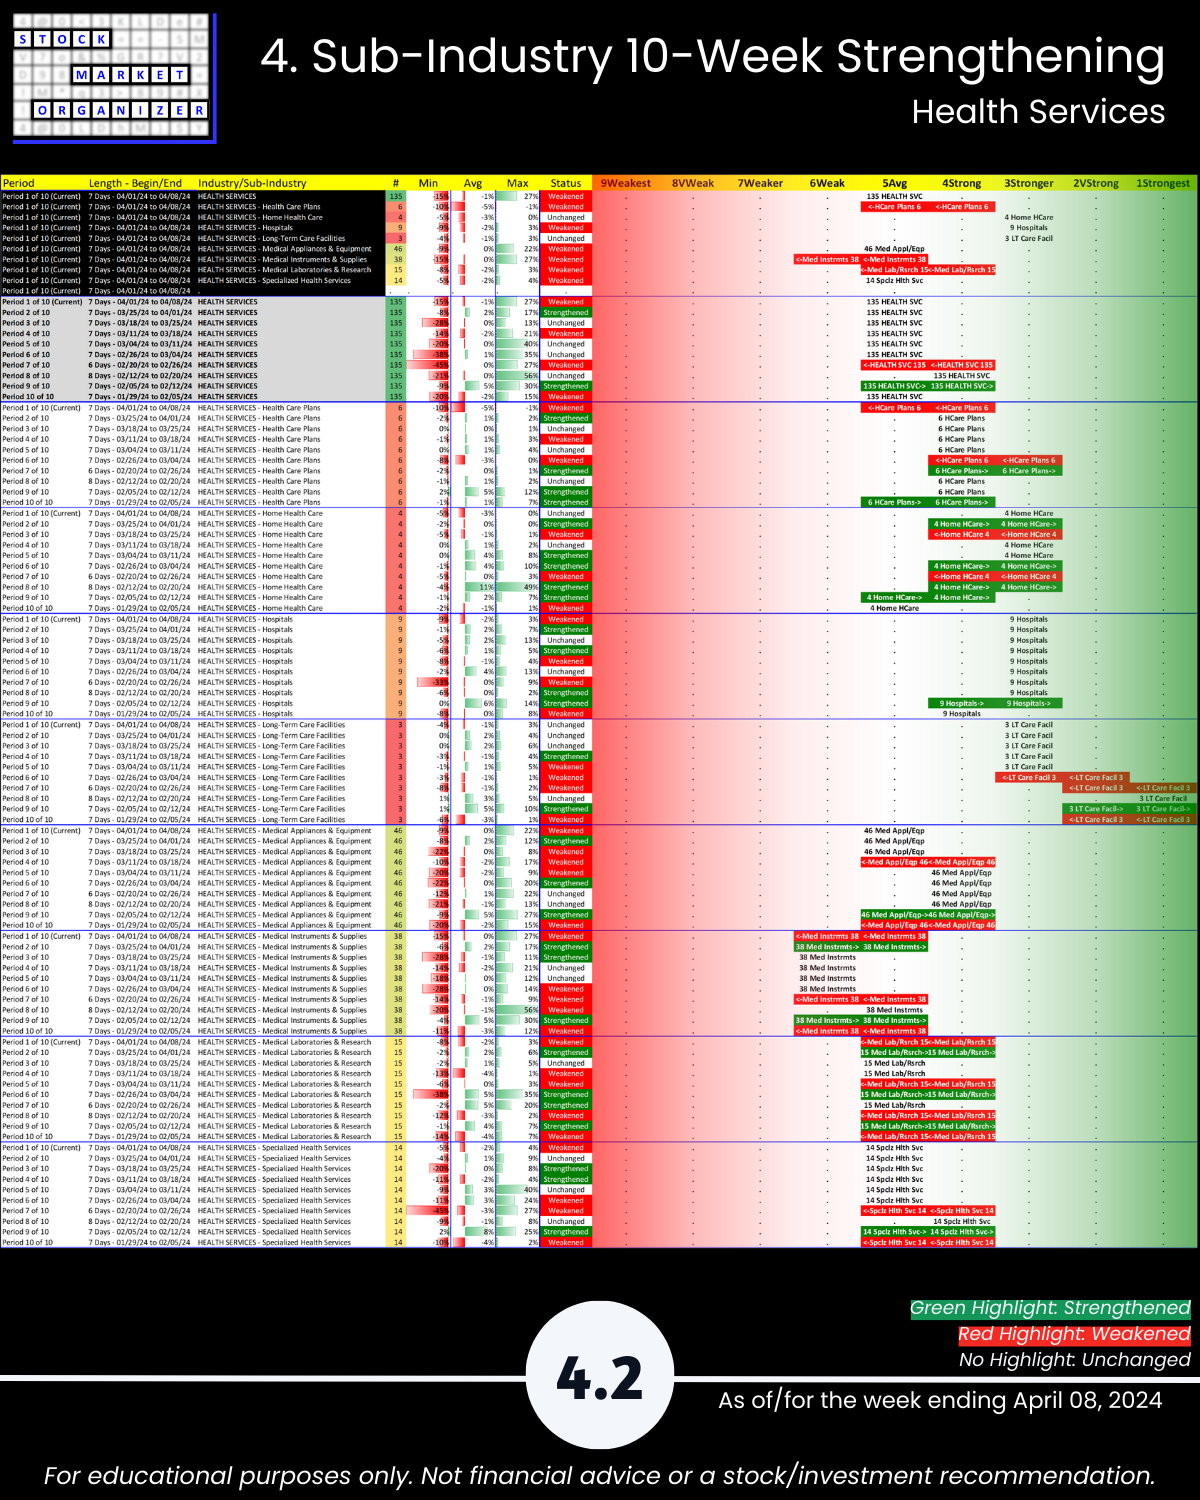
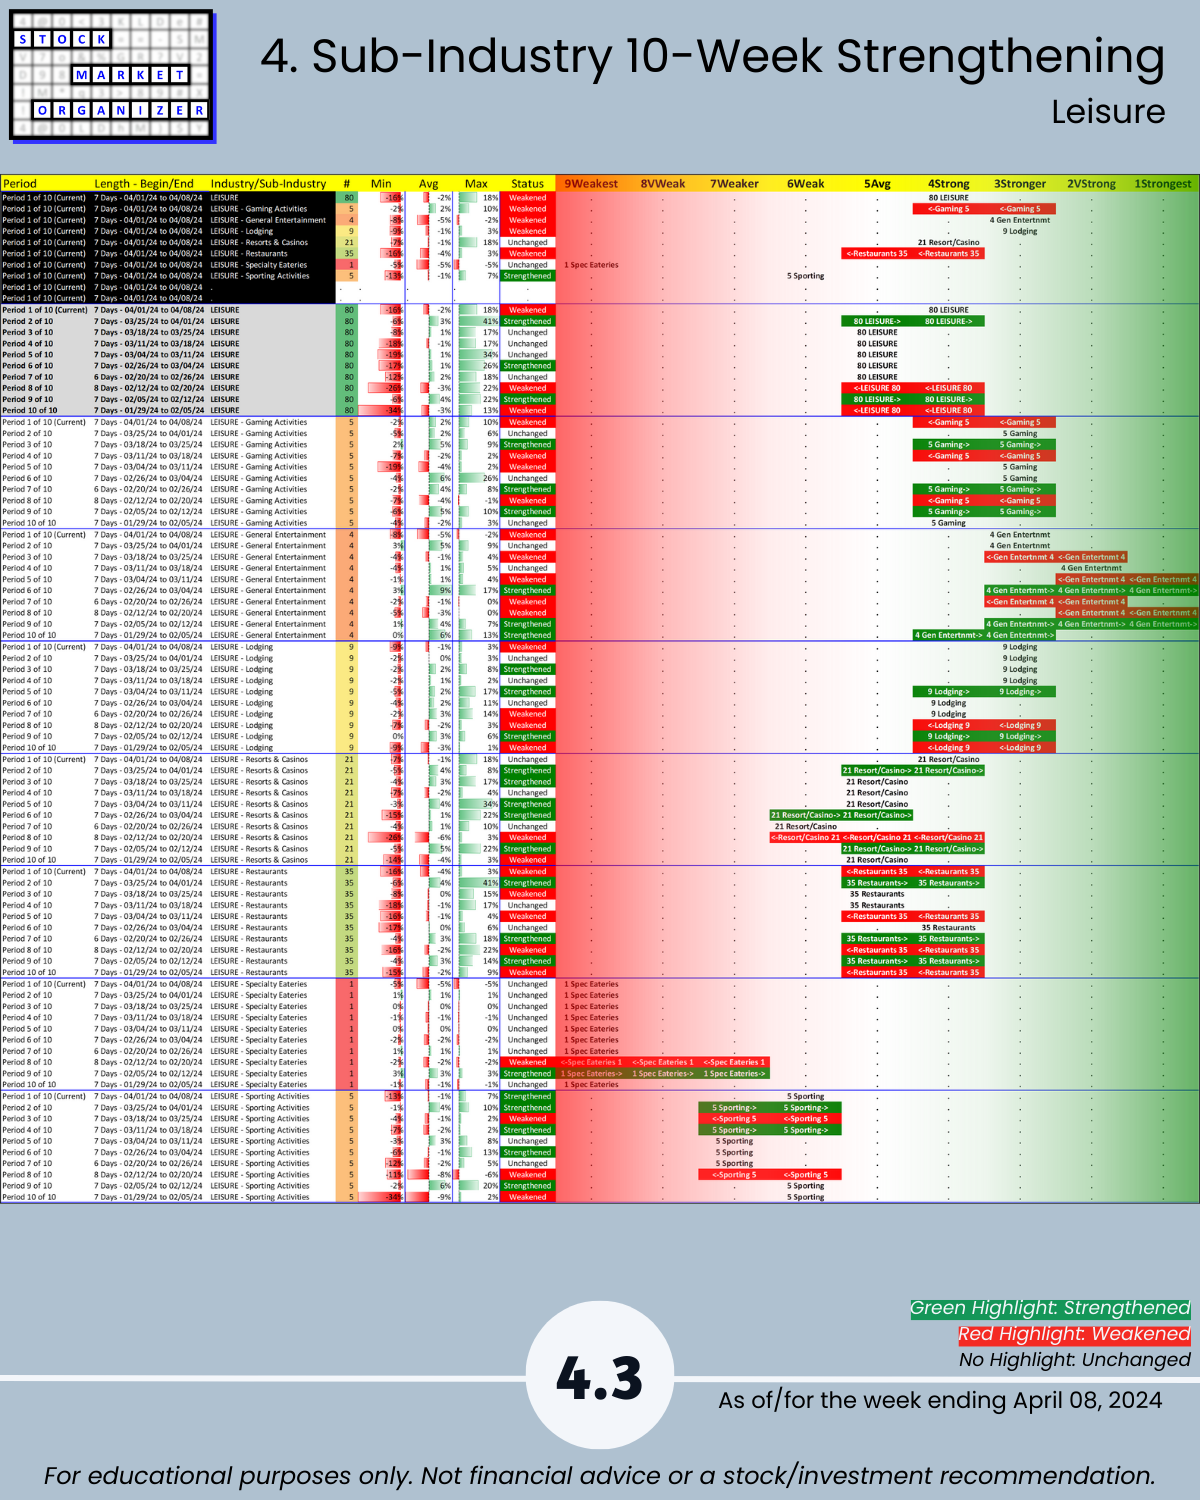
4. Sub-Industry 10-Week Strengthening
5. Stocks Outliers: Strongest/Weakest Rated
6. Stocks Outliers: 1-Week % Change
7. Stocks Outliers: 5-Year Highs/Lows