SMO Exclusive: Strength Report Group 2 2024-04-01

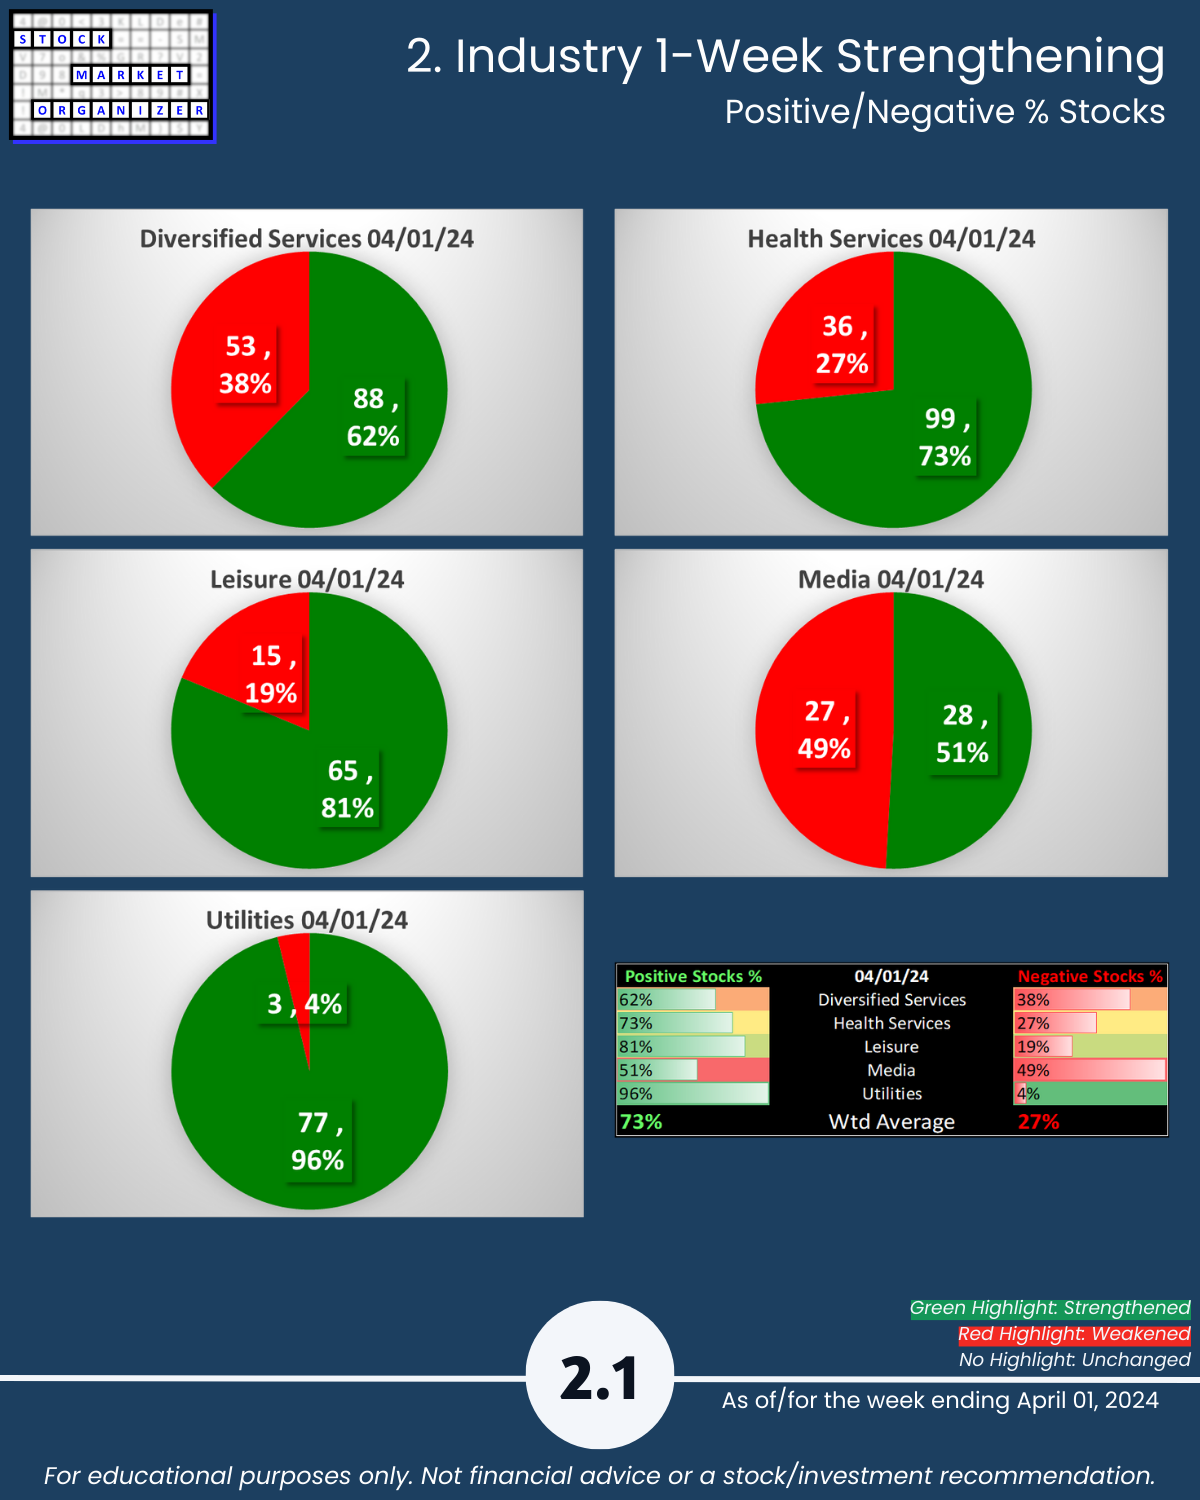
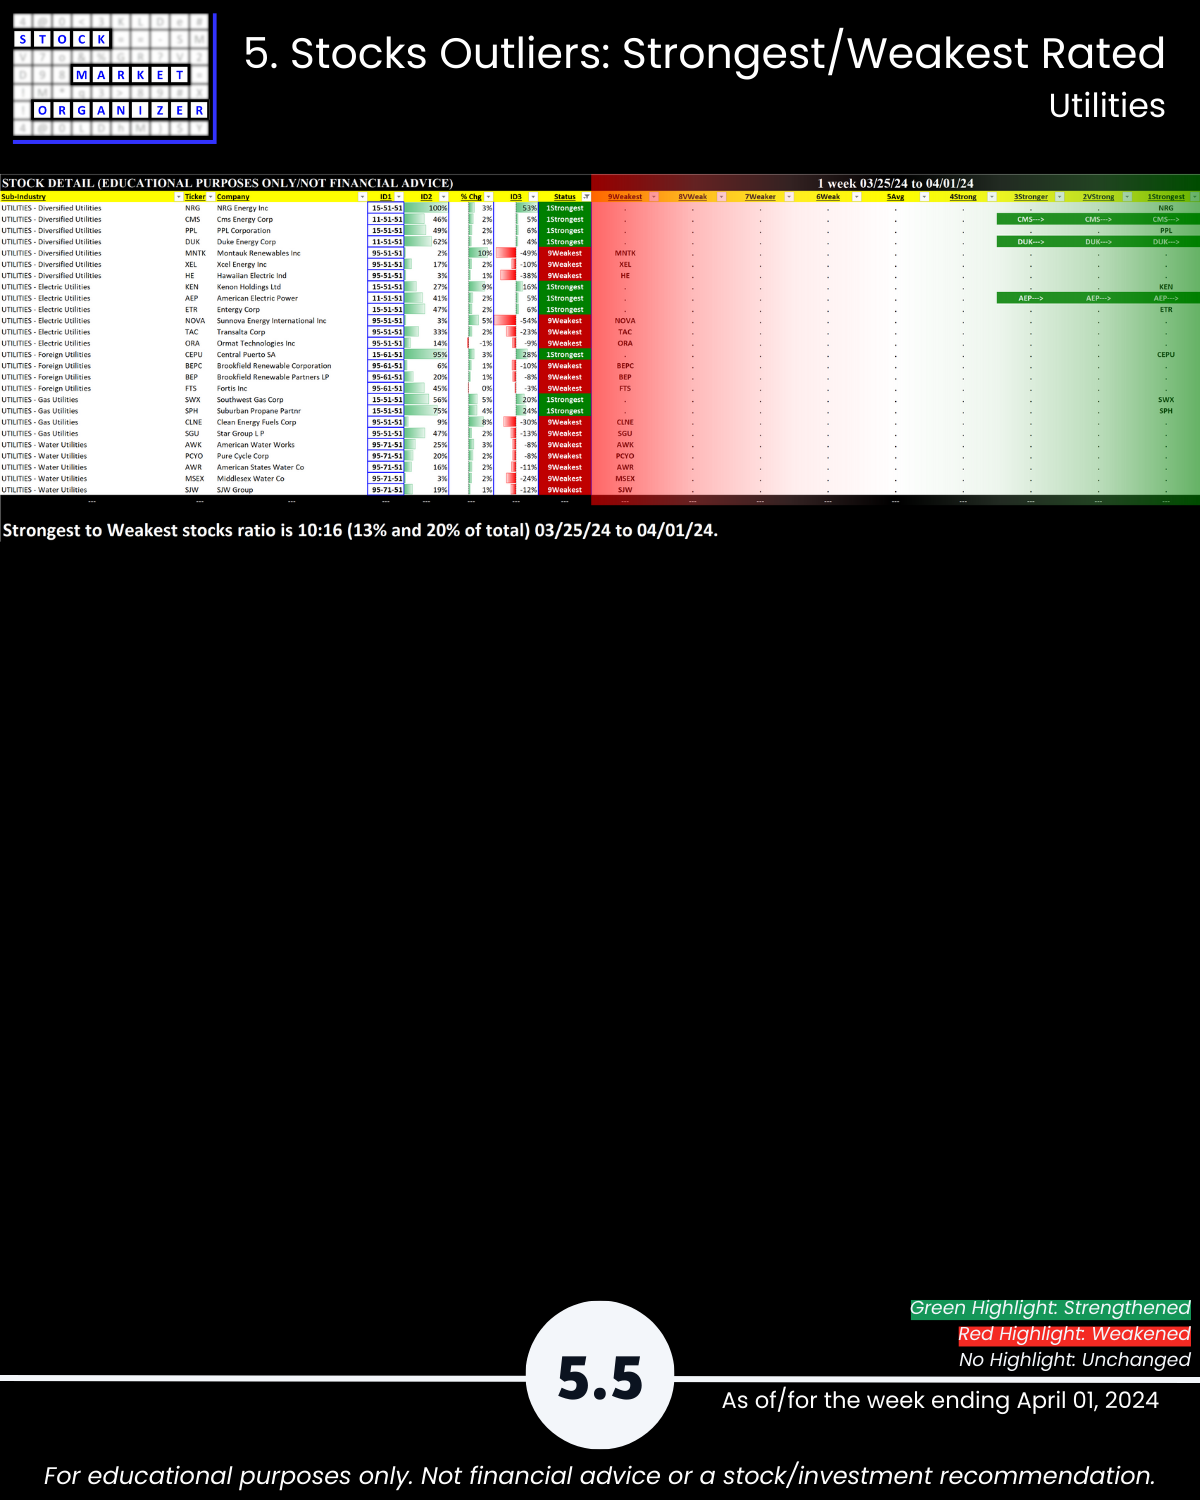
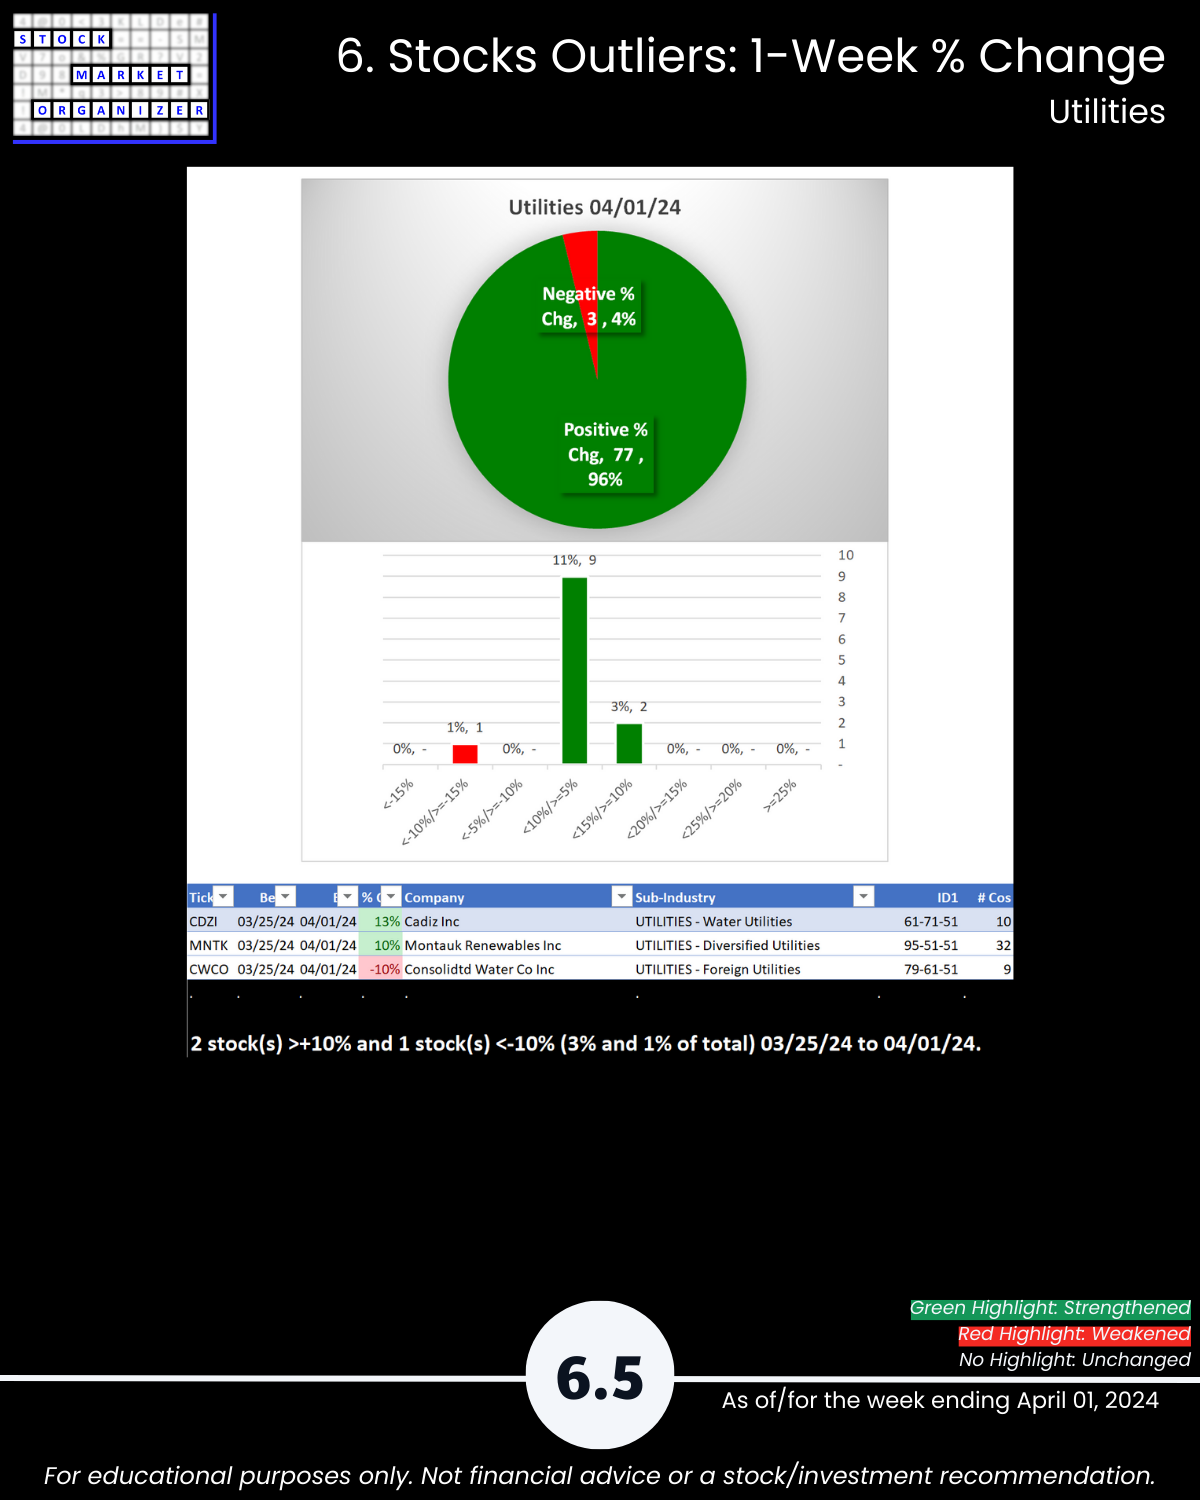
4/1/24 U.S. Market report no April Fool’s Day joke Utilities 96% positive stocks this week, continuing its improvement. What does this tell us, if anything, about rotation into other areas besides tech? I don’t know. I just know what to do about it. I also know where there is strengthening elsewhere in the market.
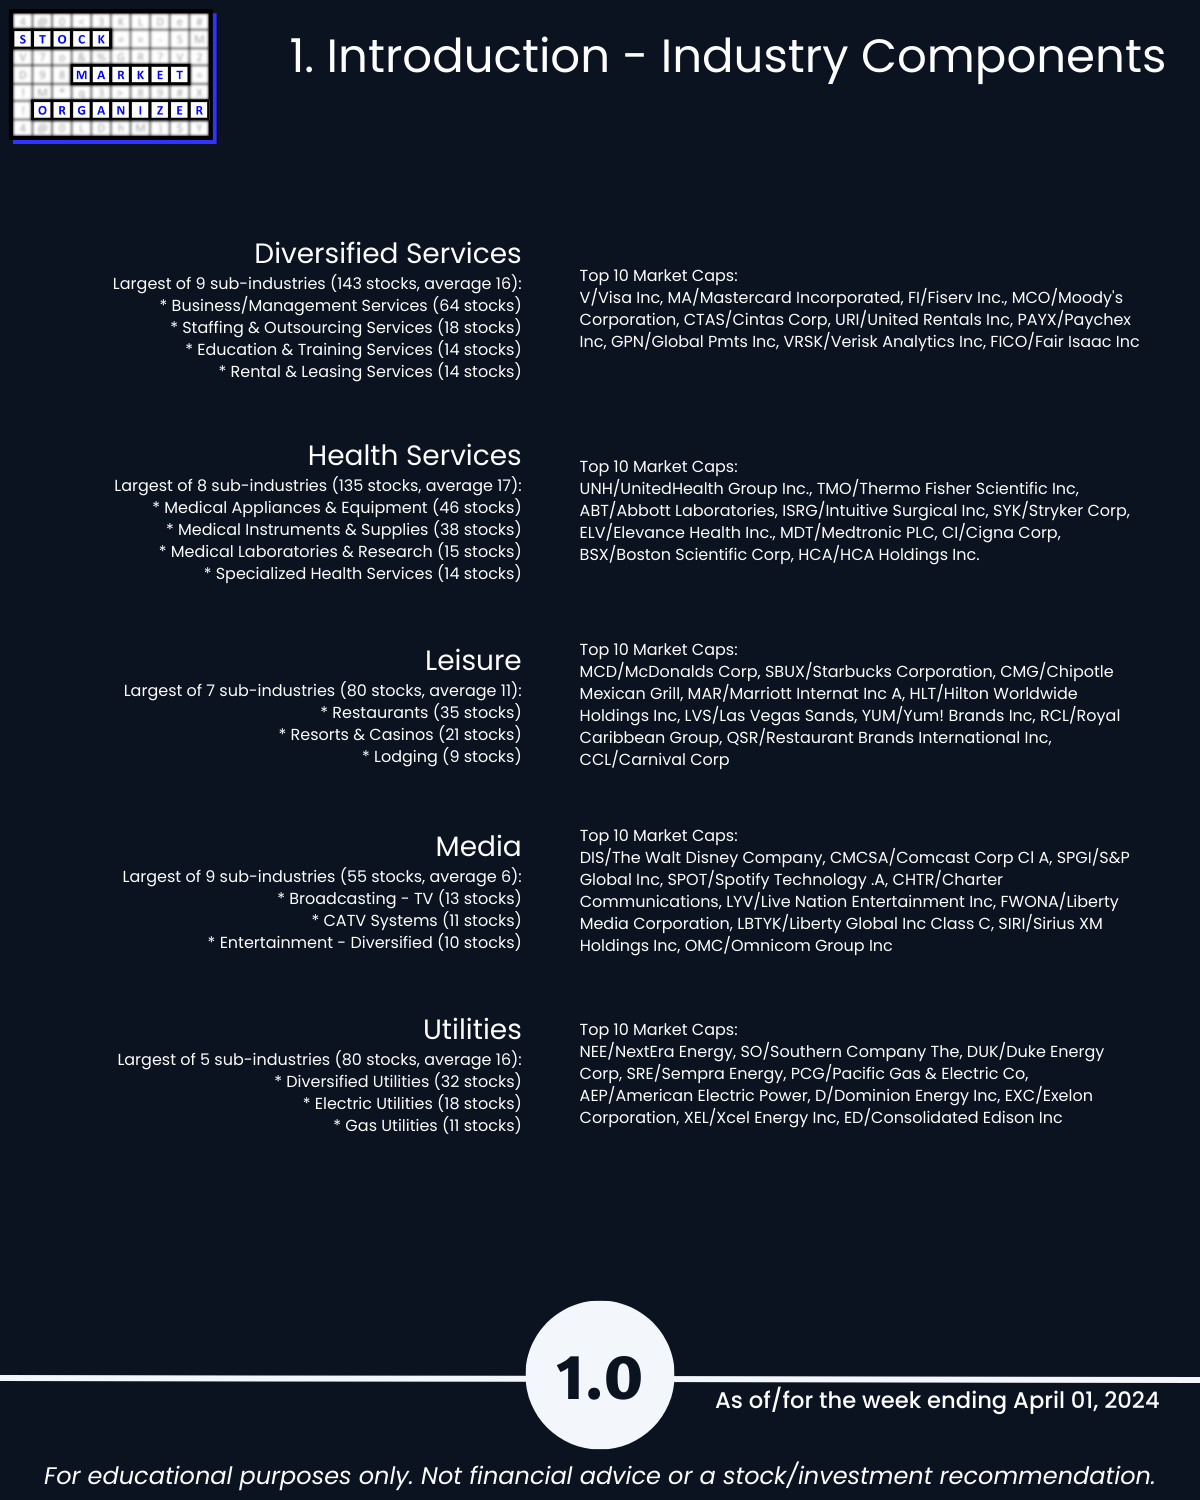
Today – a close look at Diversified Services, Health Services, Leisure, Media, and Utilities.
What’s happening here: I’m
Finding U.S. Stock Market strength from the
top down,
inside out,
and bottom up, because
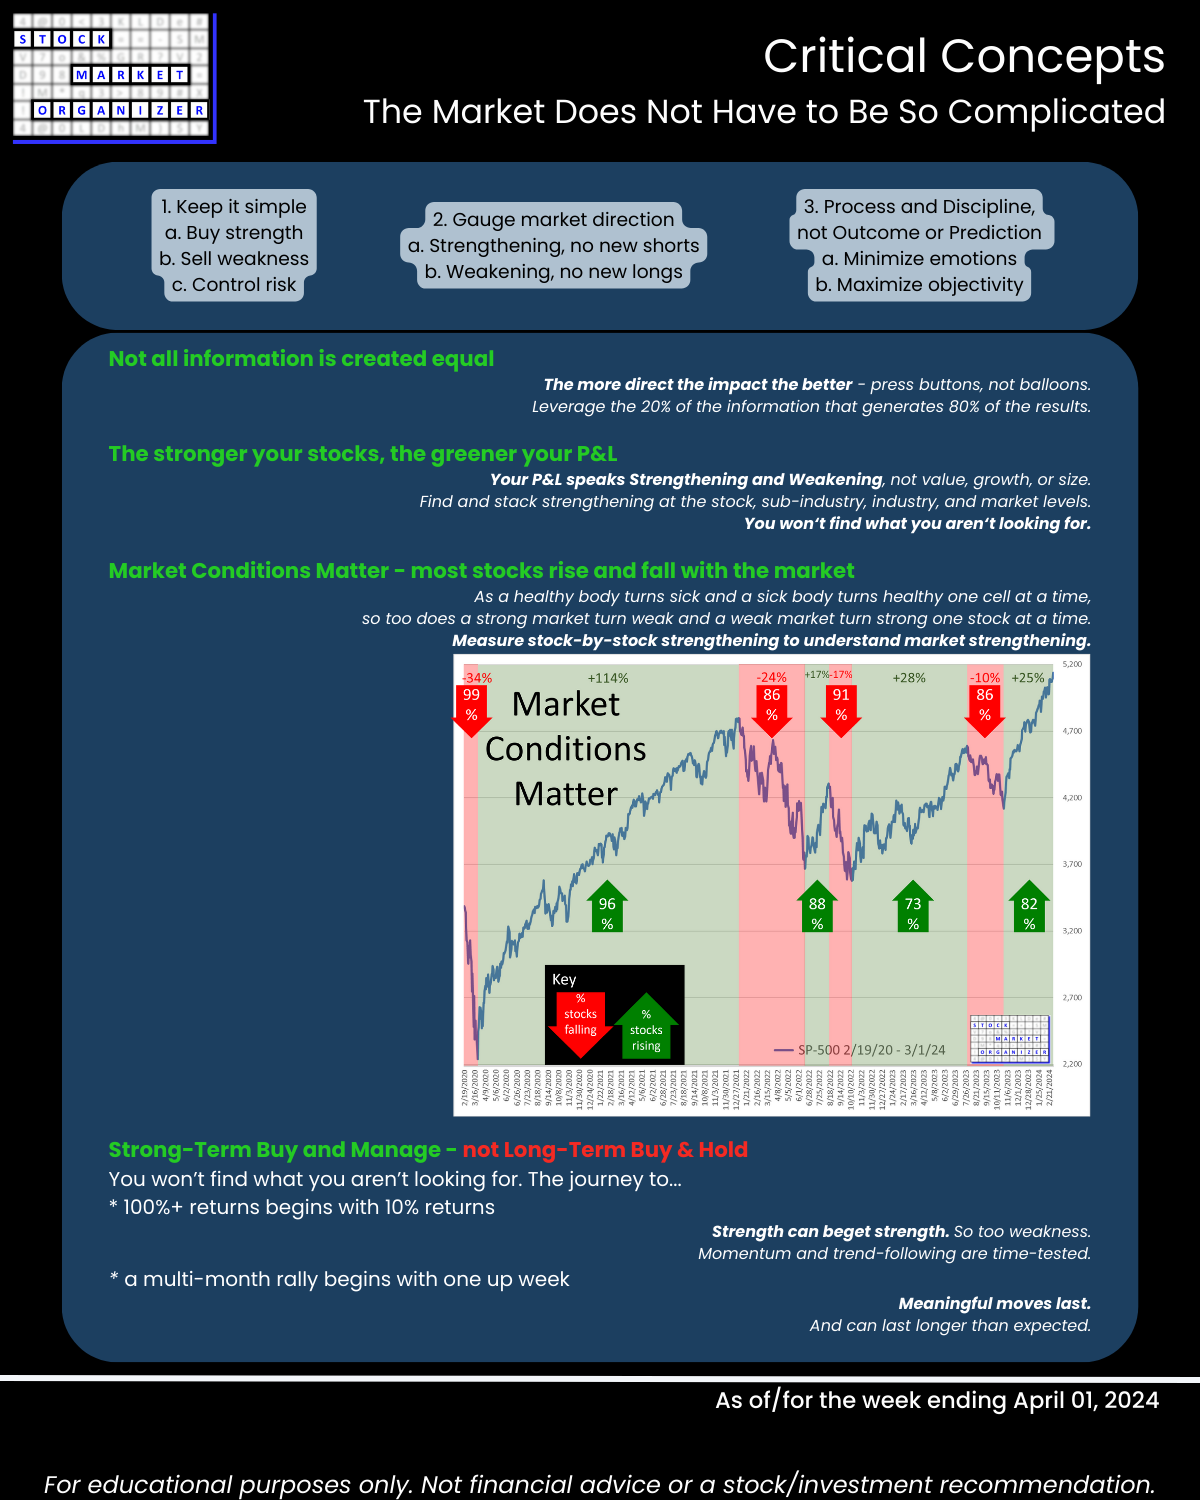
the stronger your stocks, the greener your P&L.
The market does not need to be so complicated.
WHAT CAN I TELL YOU THAT YOU MAY NOT KNOW?
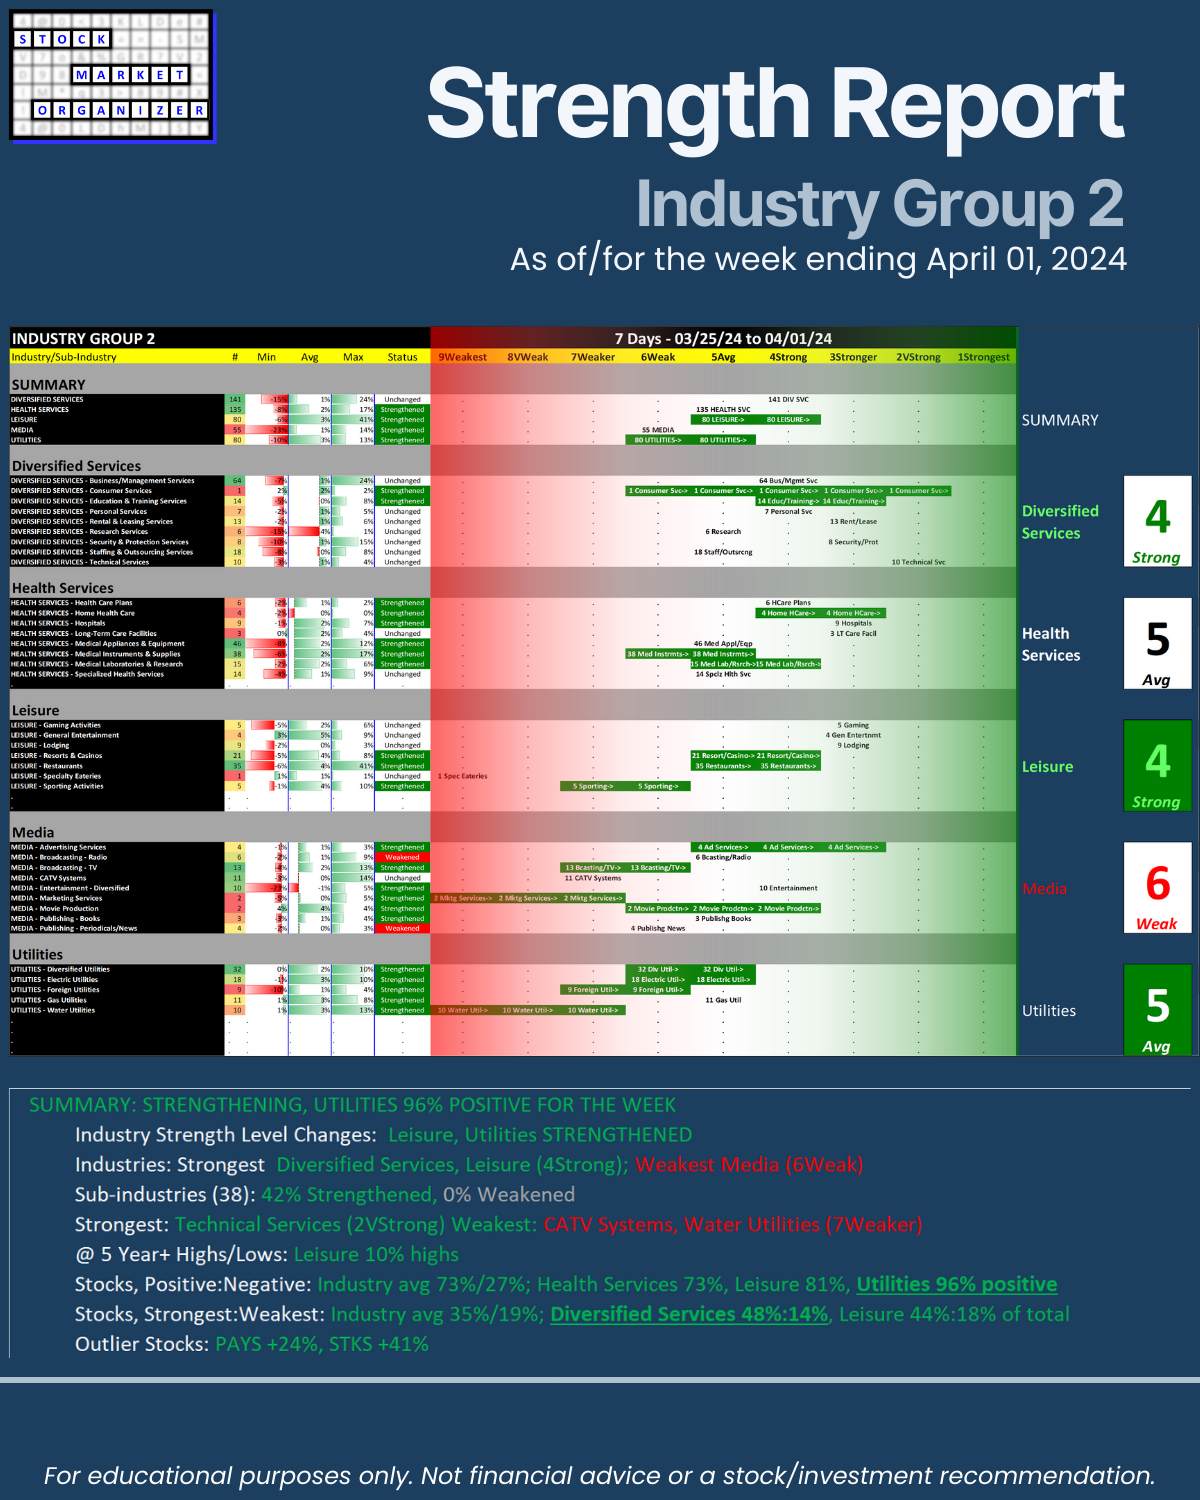
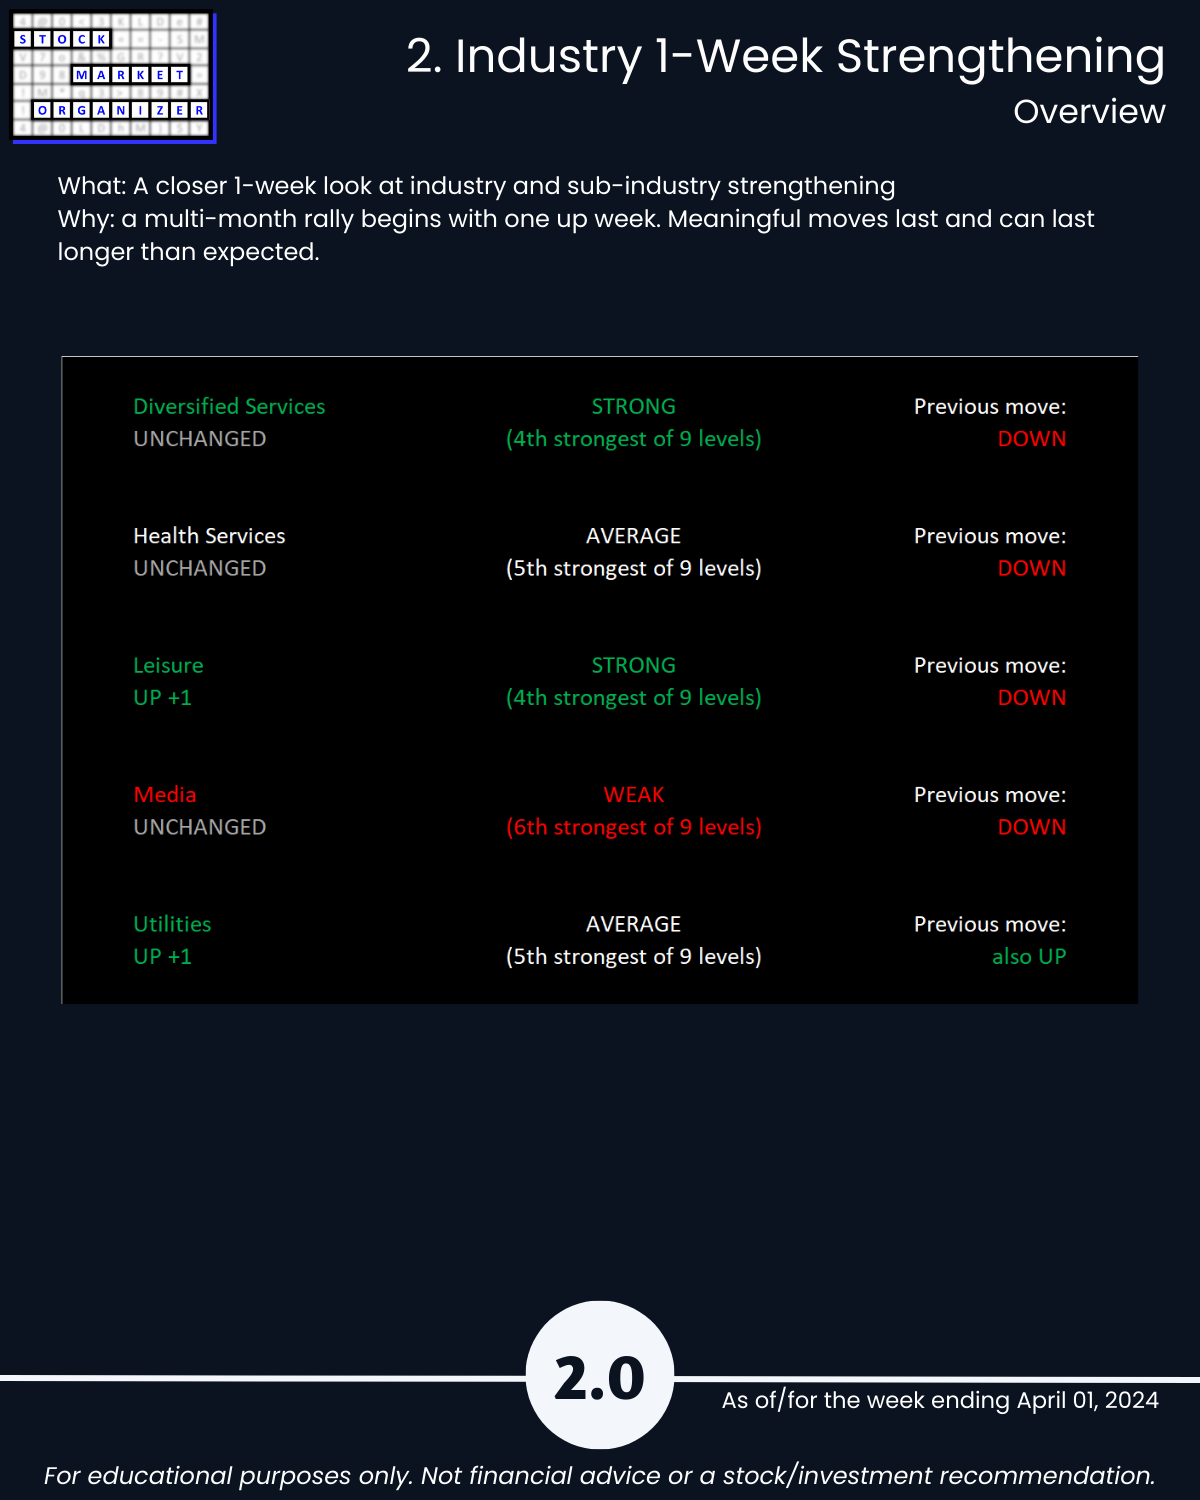
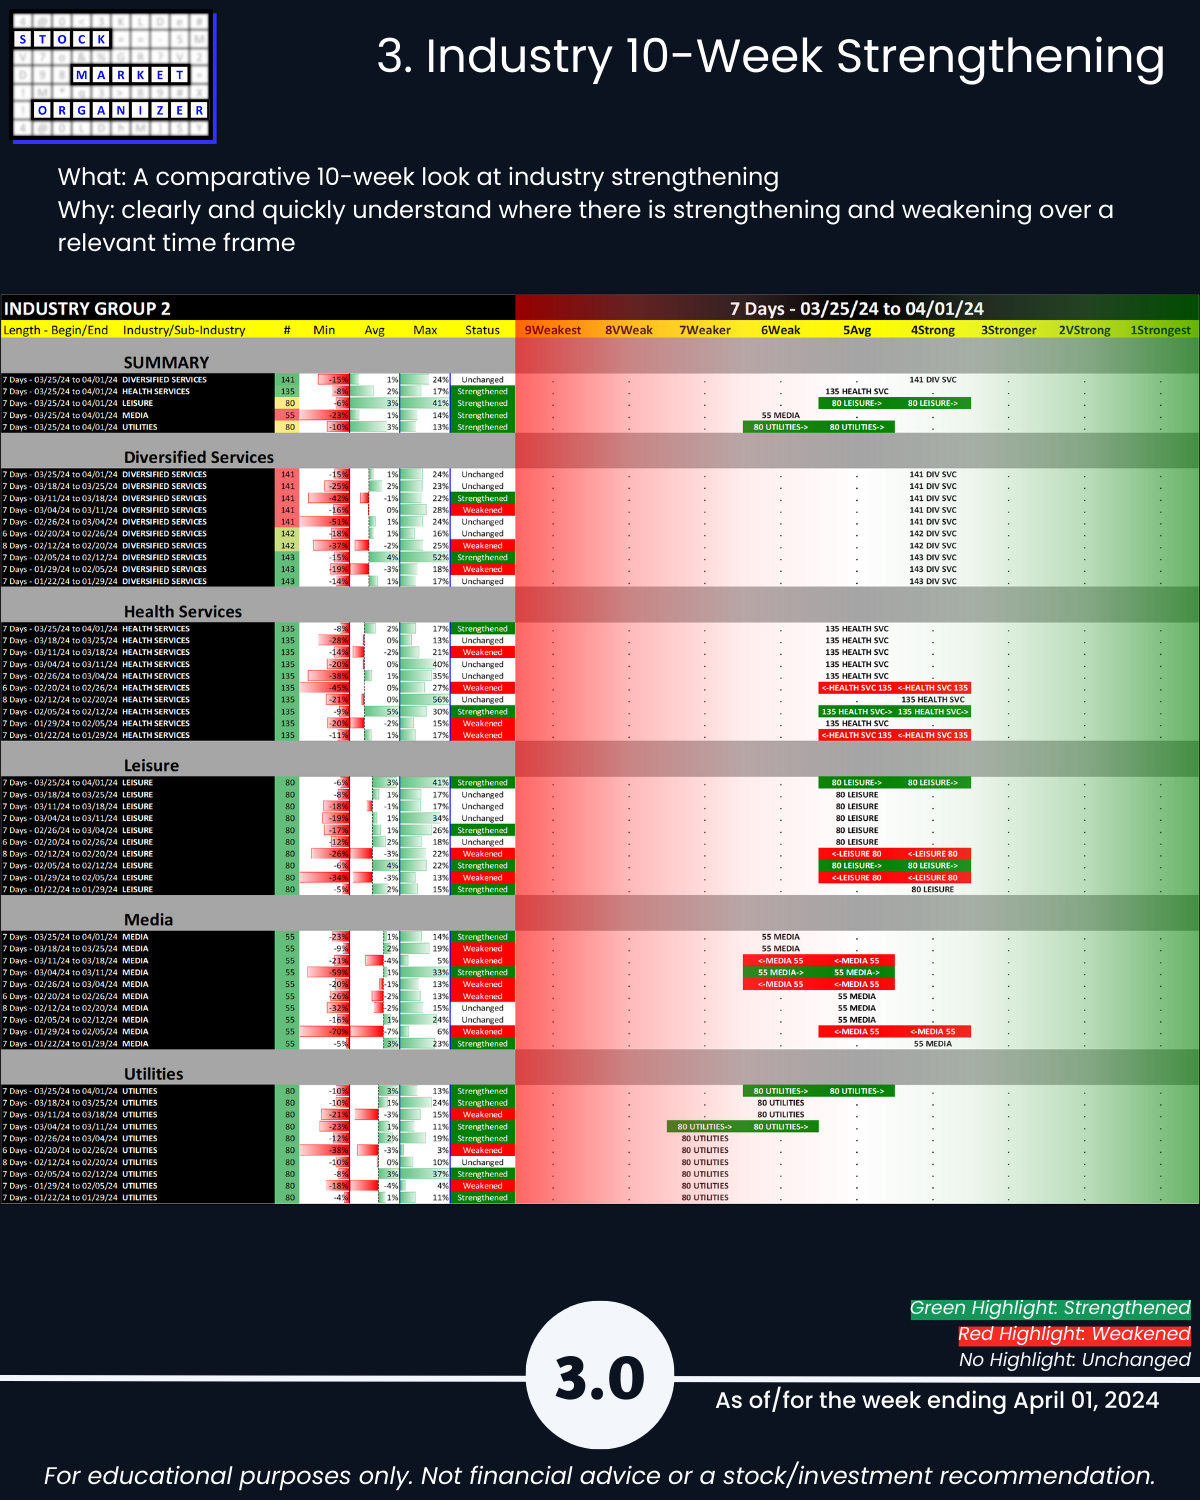
🔹 Industry Strength Level Changes: Leisure, Utilities STRENGTHENED
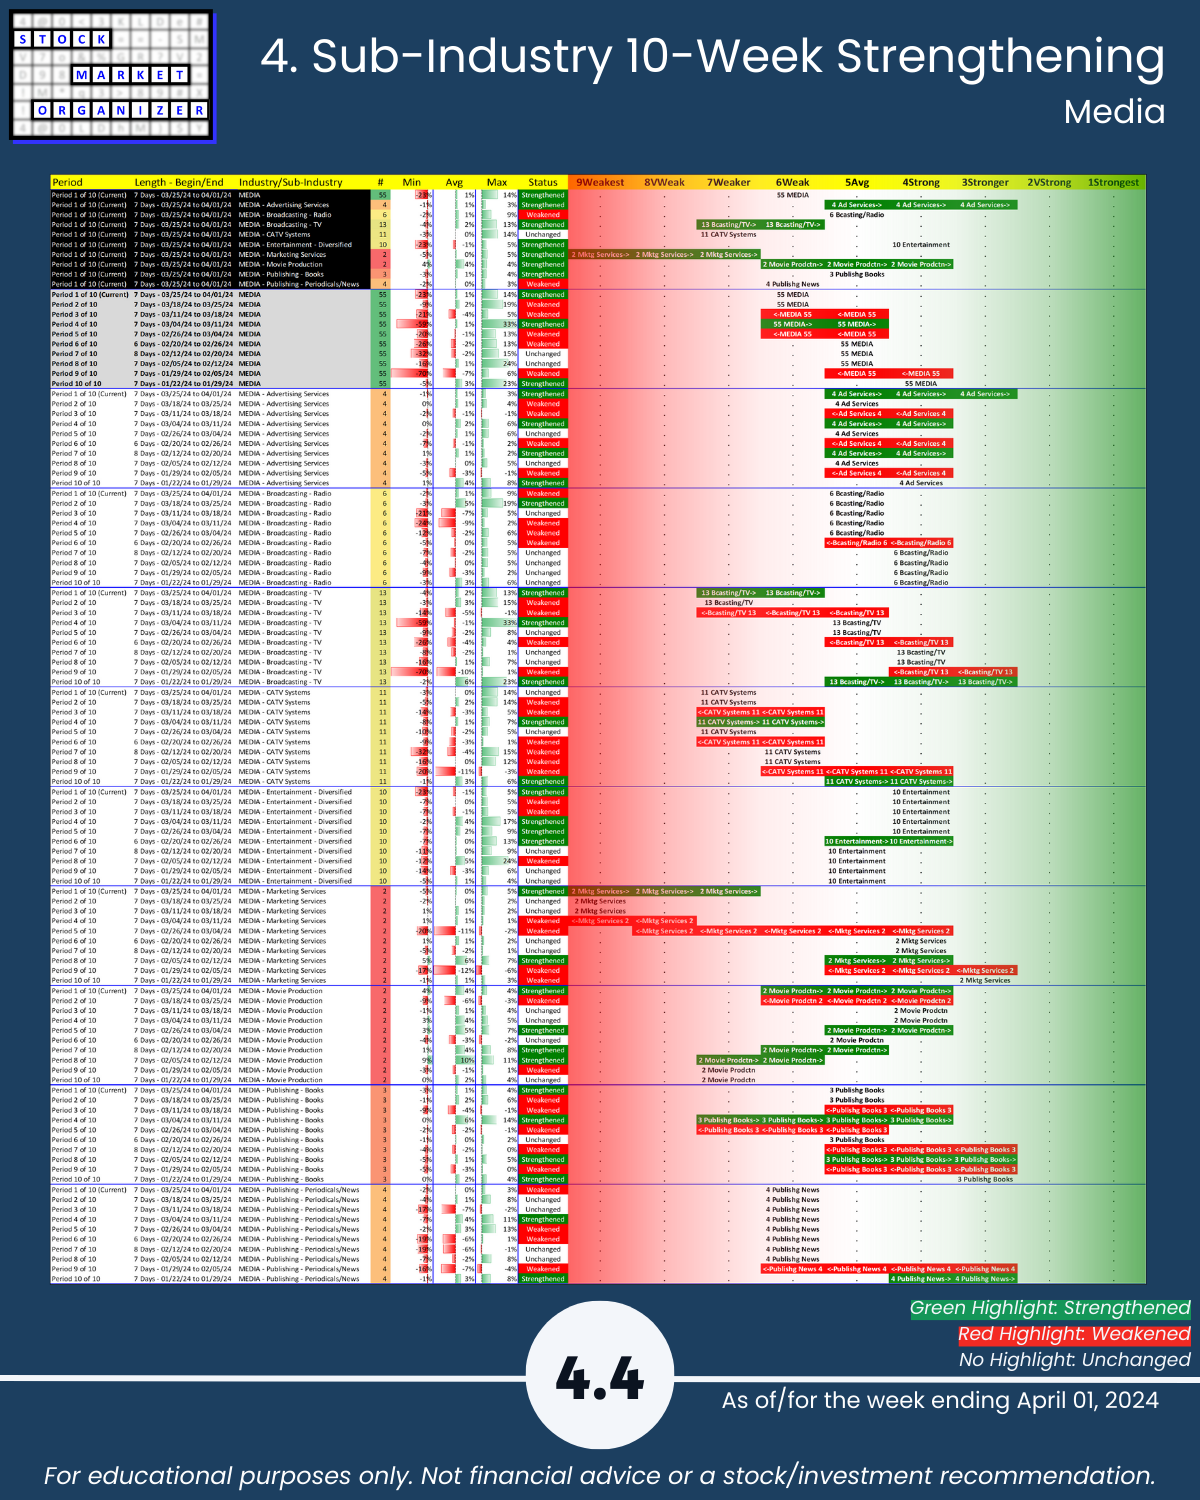
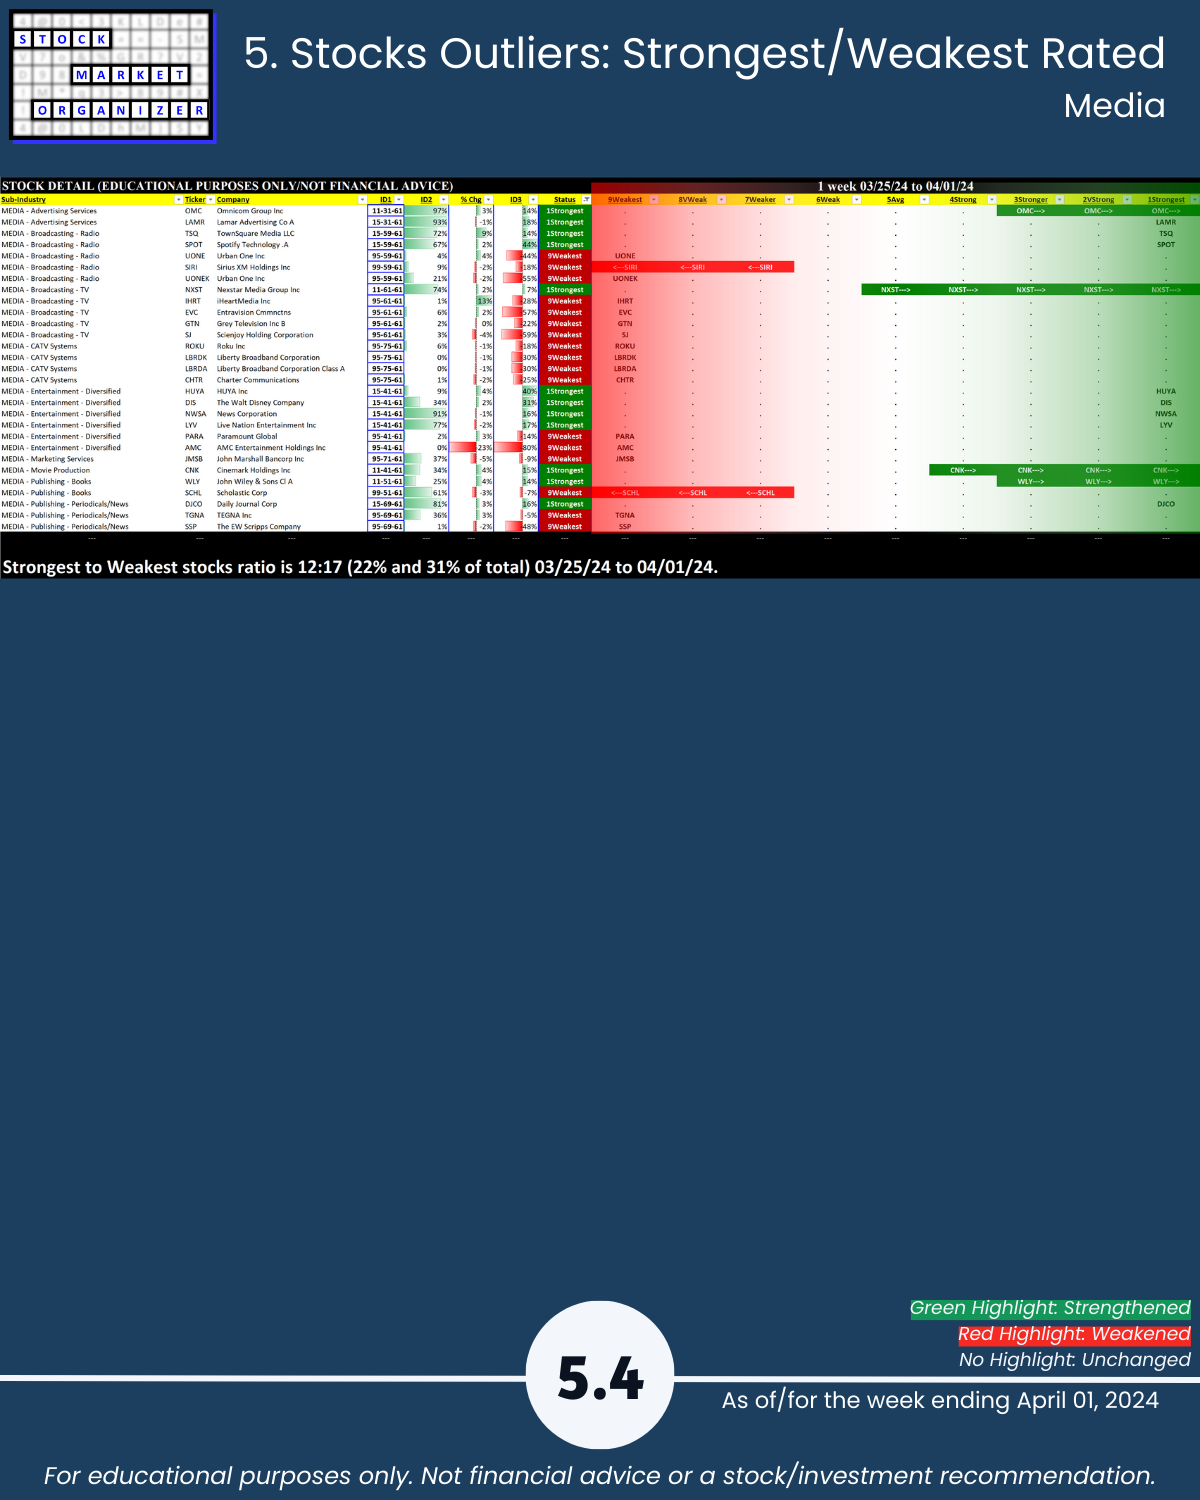
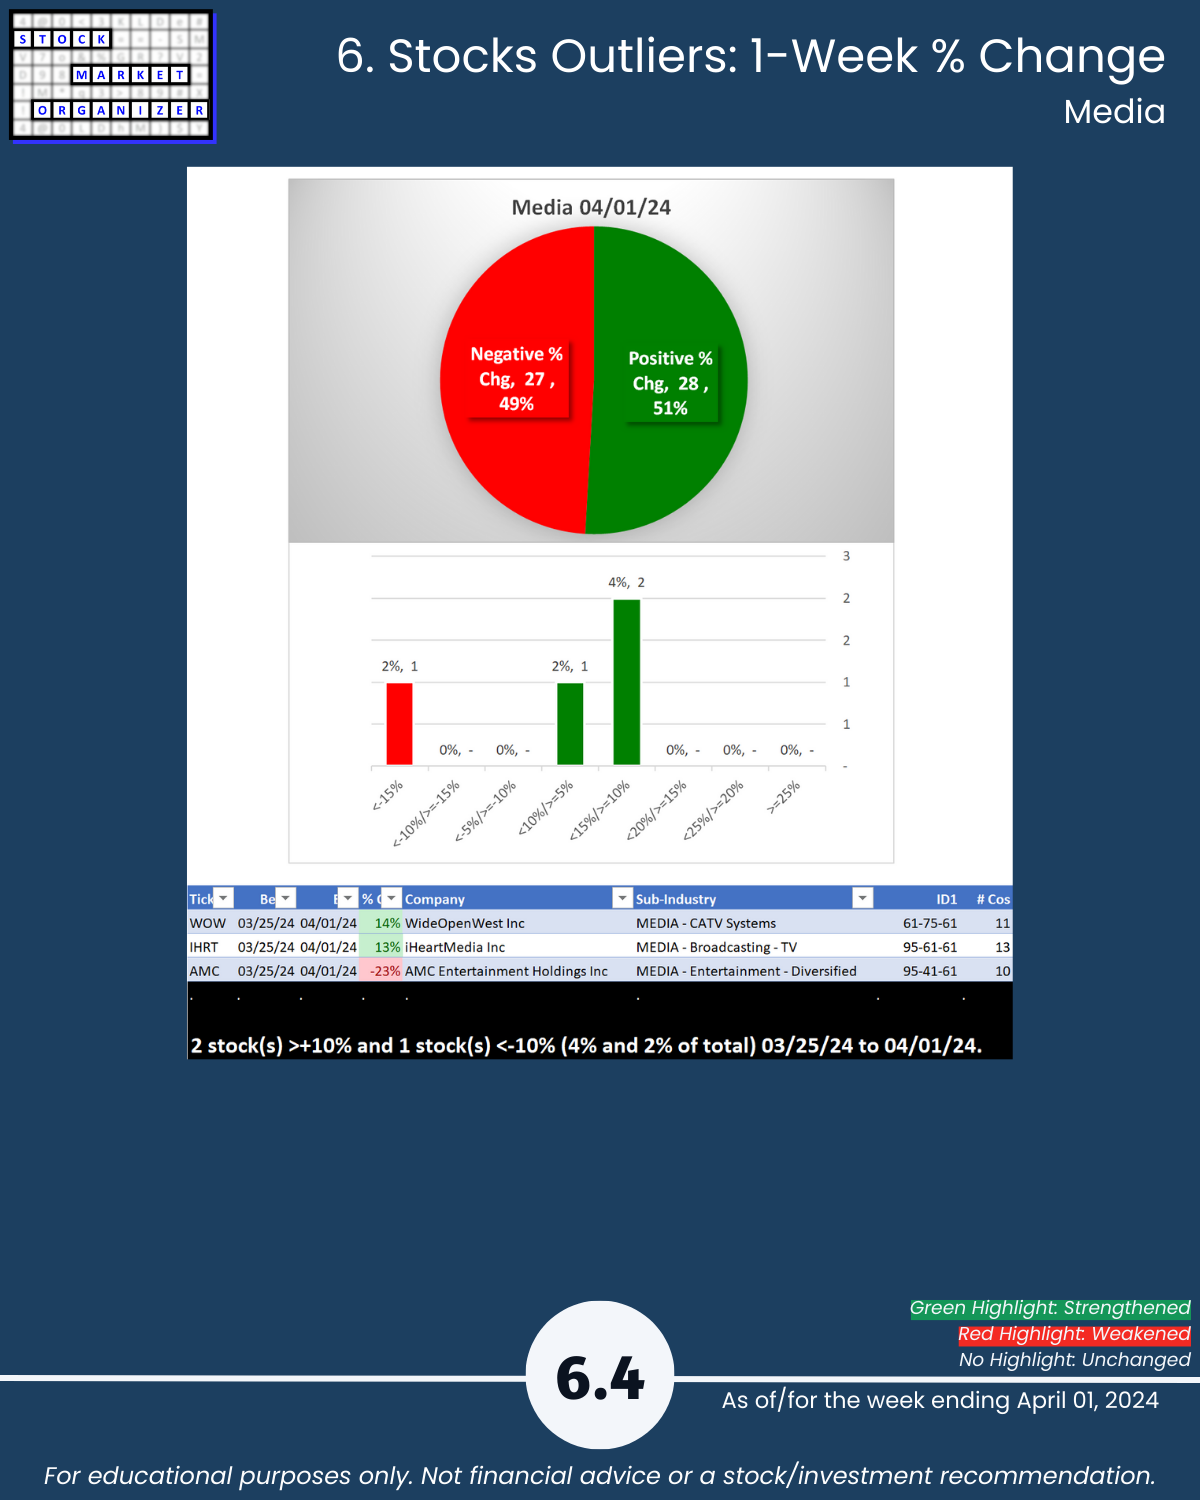
🔹 Industries: Strongest Diversified Services, Leisure (4Strong); Weakest Media (6Weak)
🔹 Sub-industries (38): 42% Strengthened, 0% Weakened
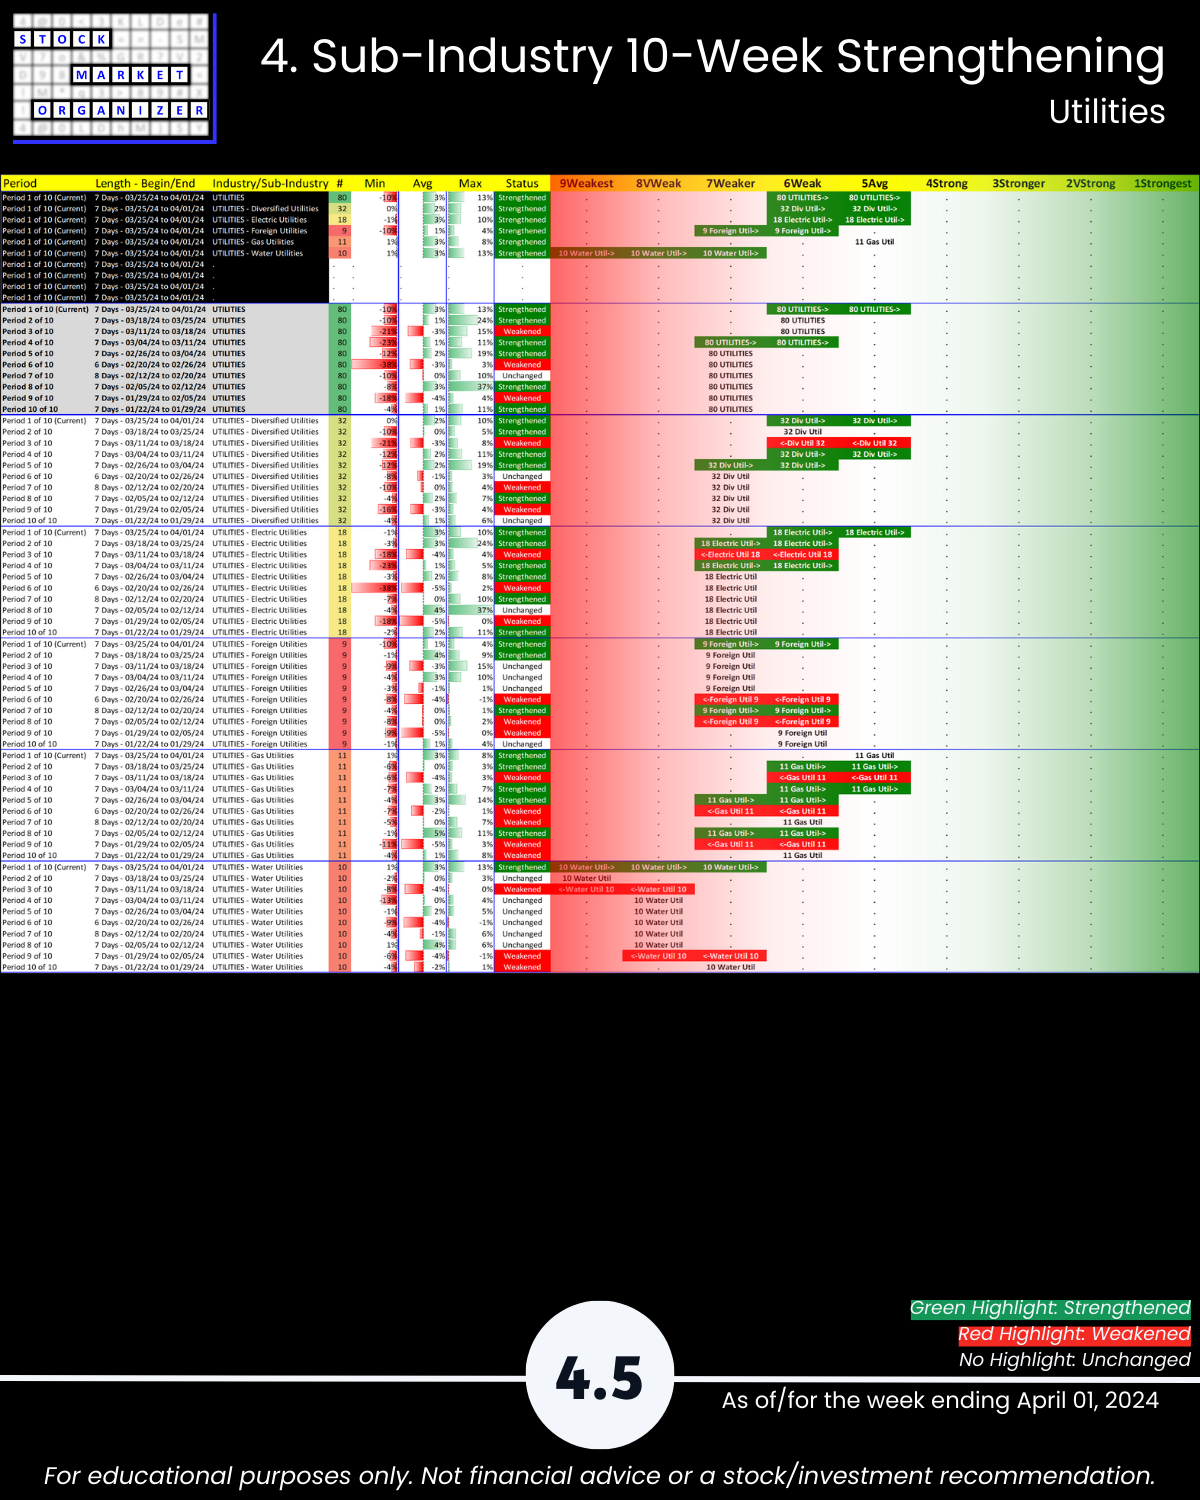
🔹 Strongest: Technical Services (2VStrong) Weakest: CATV Systems, Water Utilities (7Weaker)
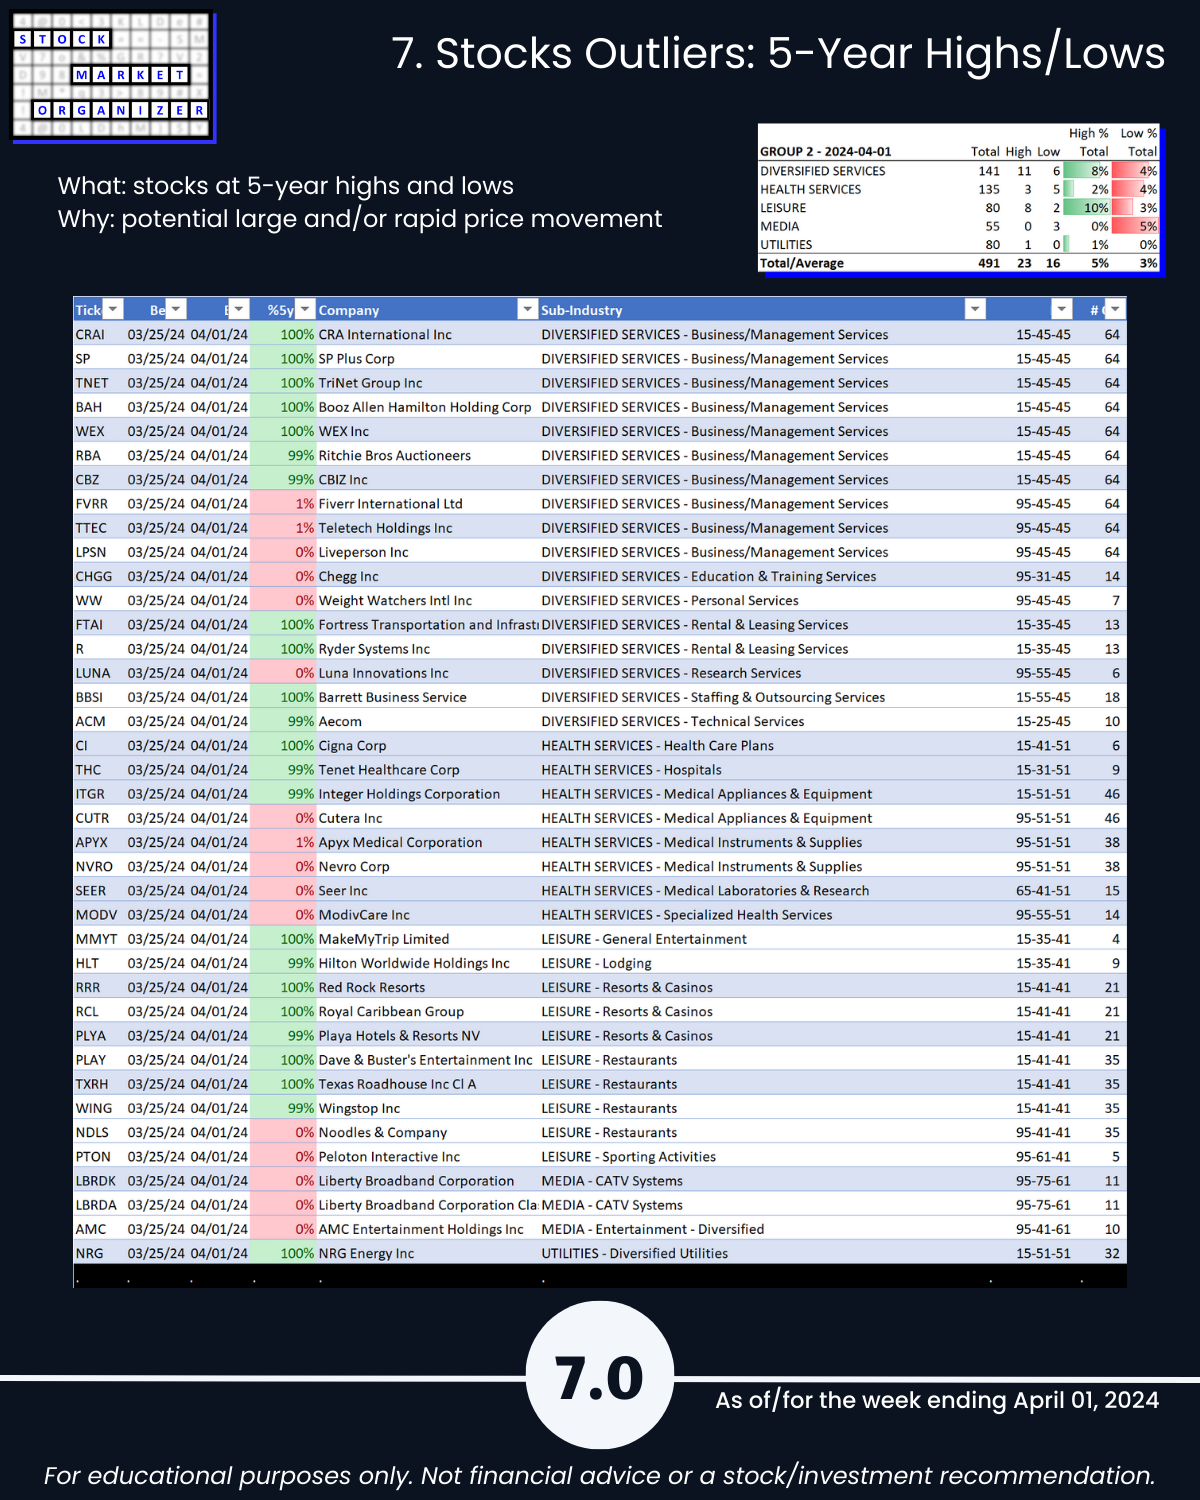
🔹 @ 5 Year+ Highs/Lows: Leisure 10% highs
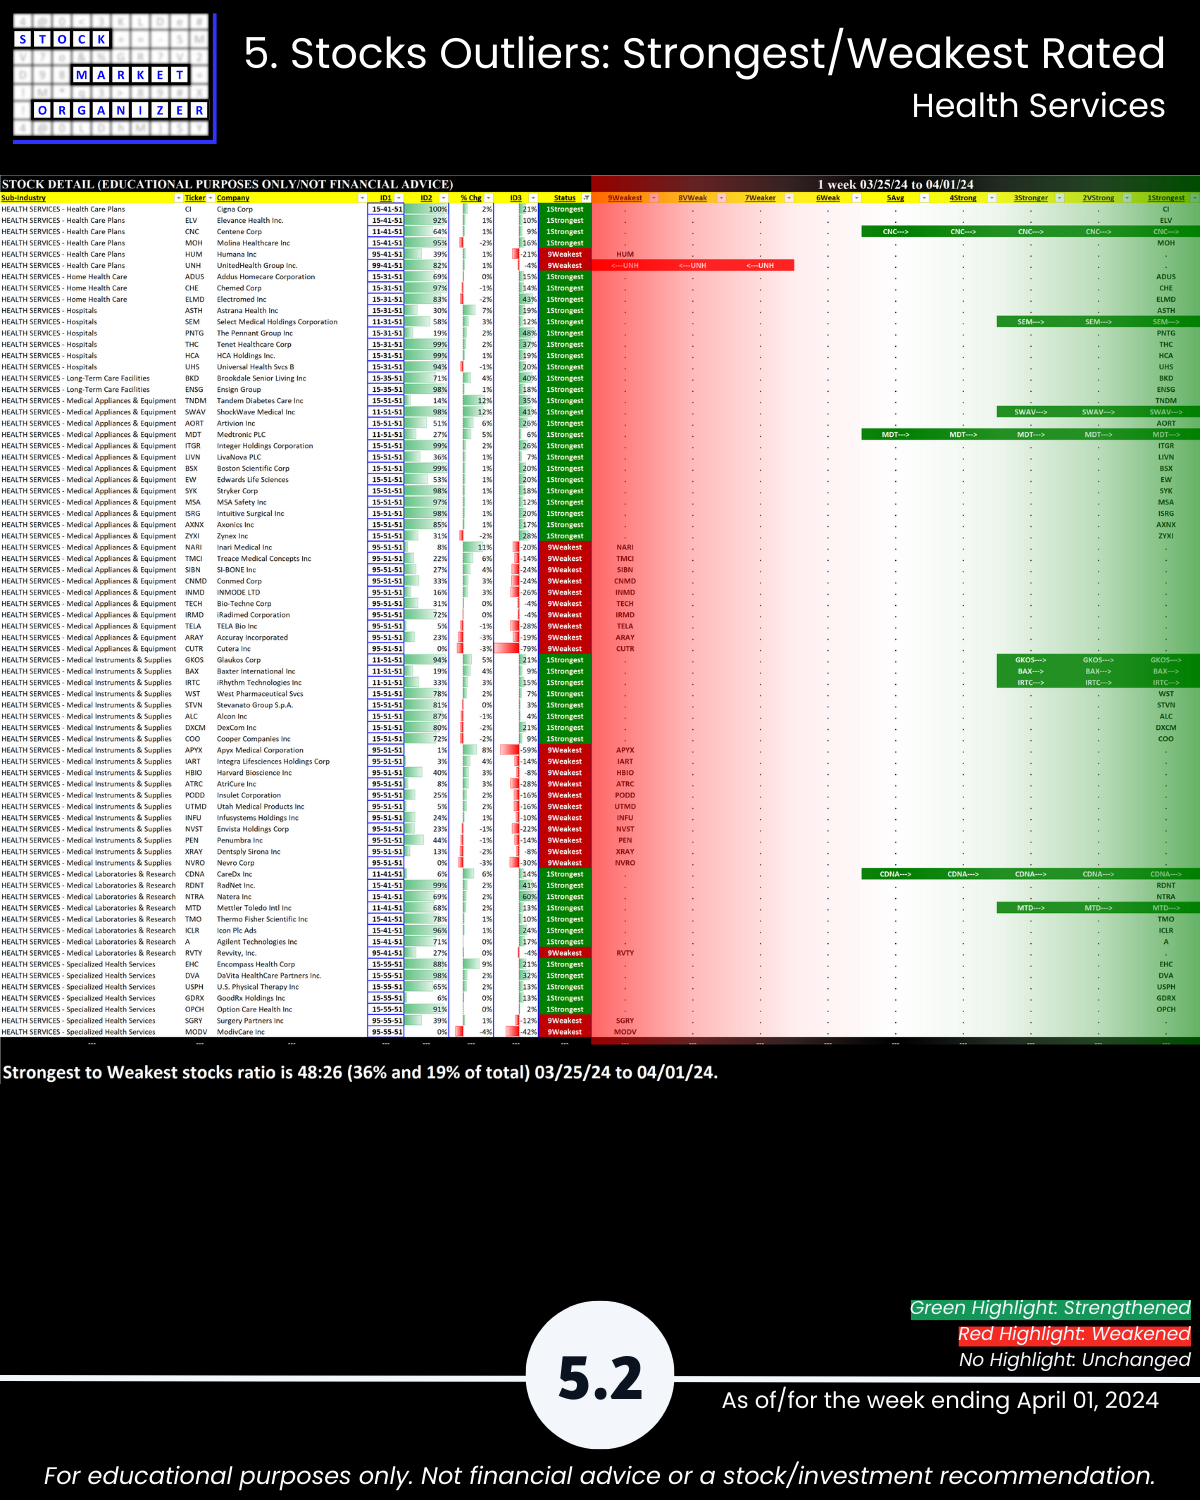
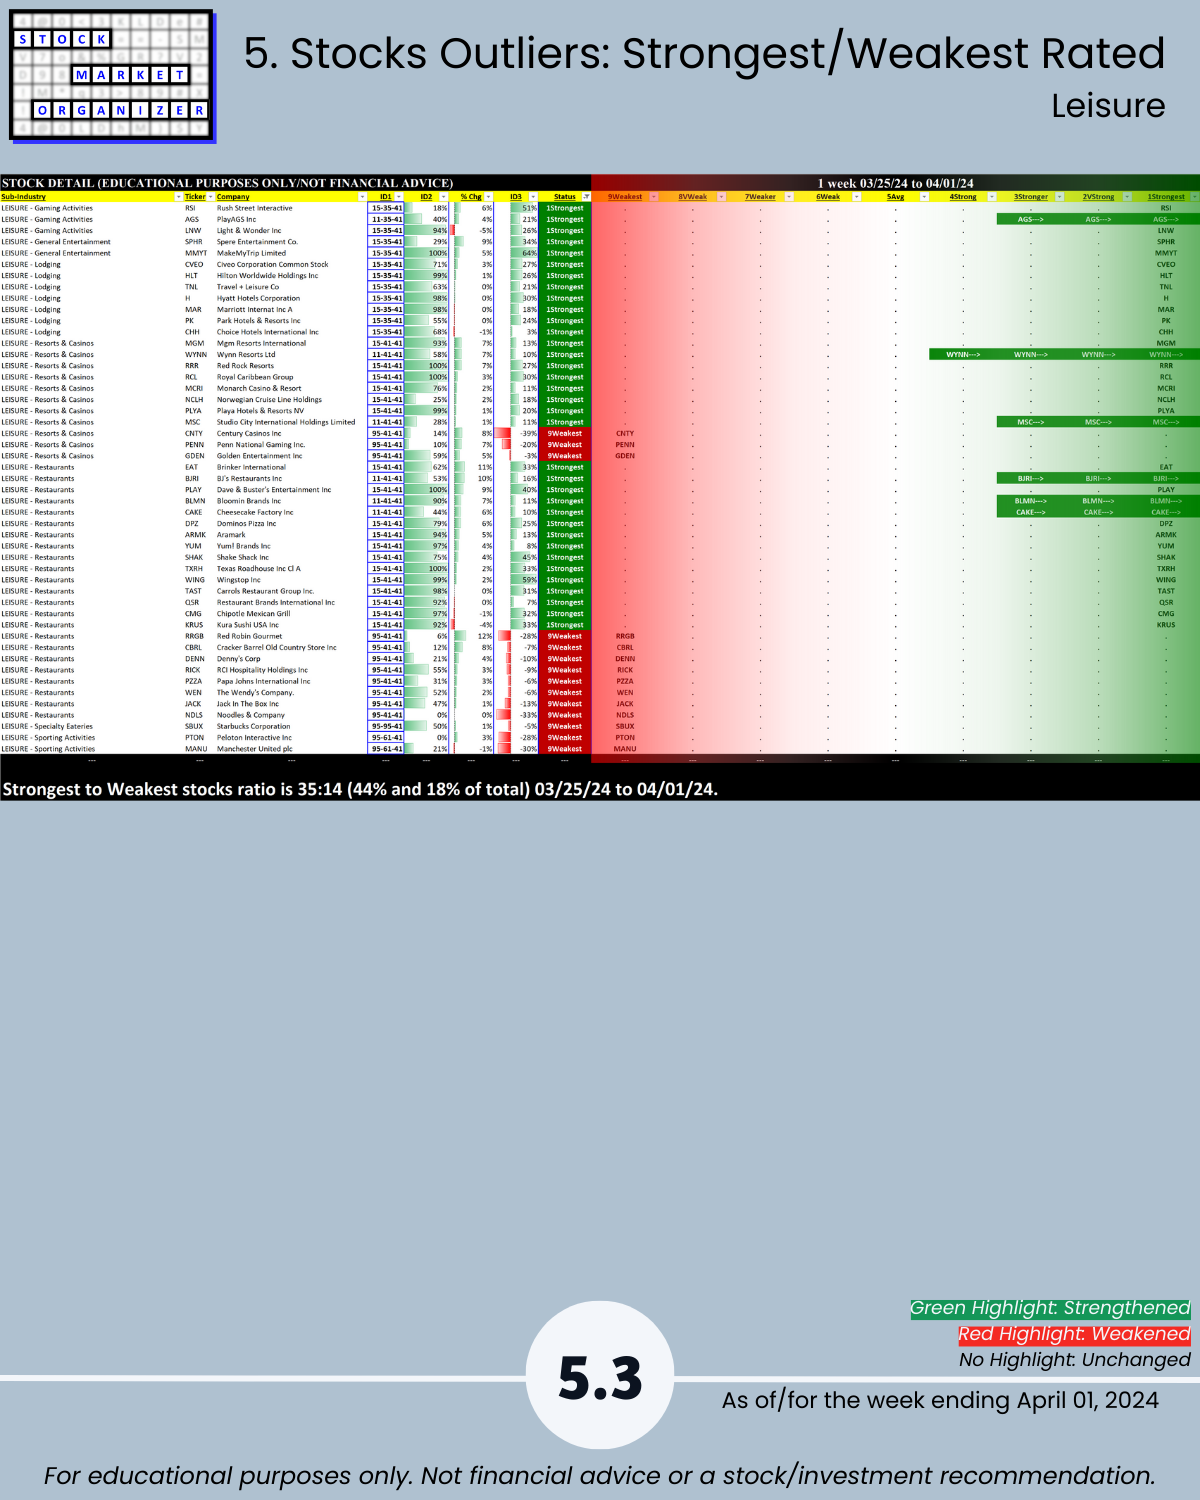
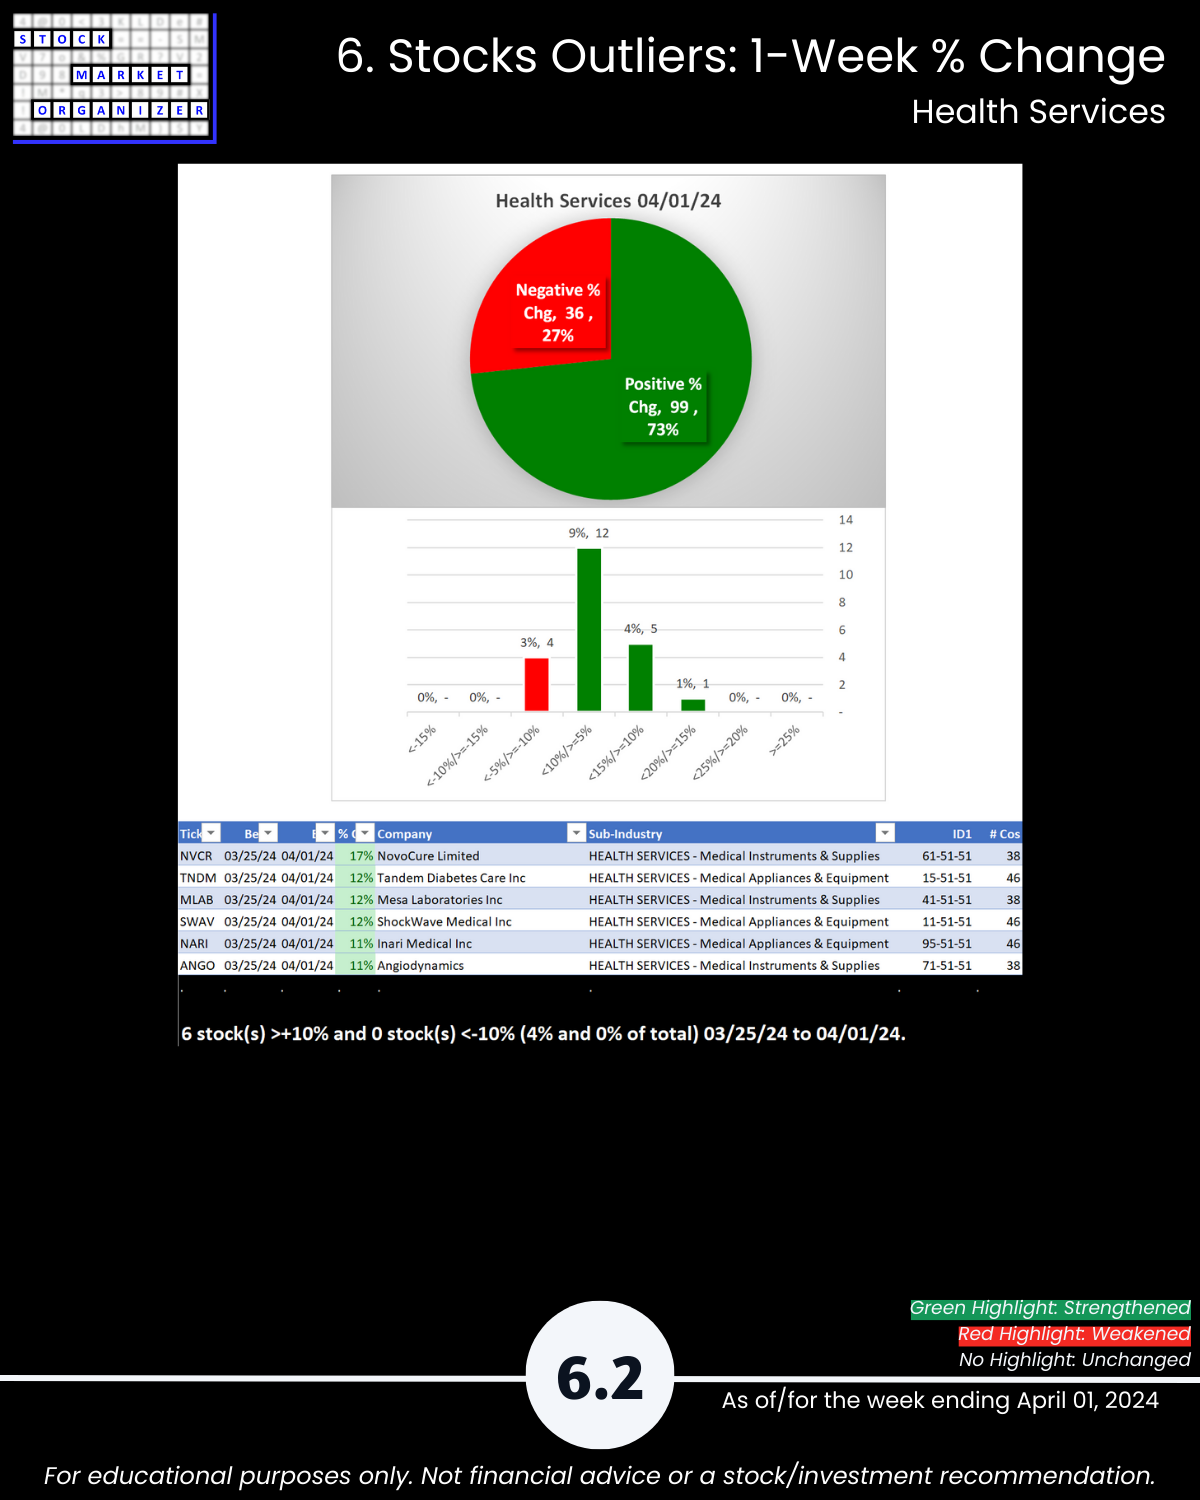
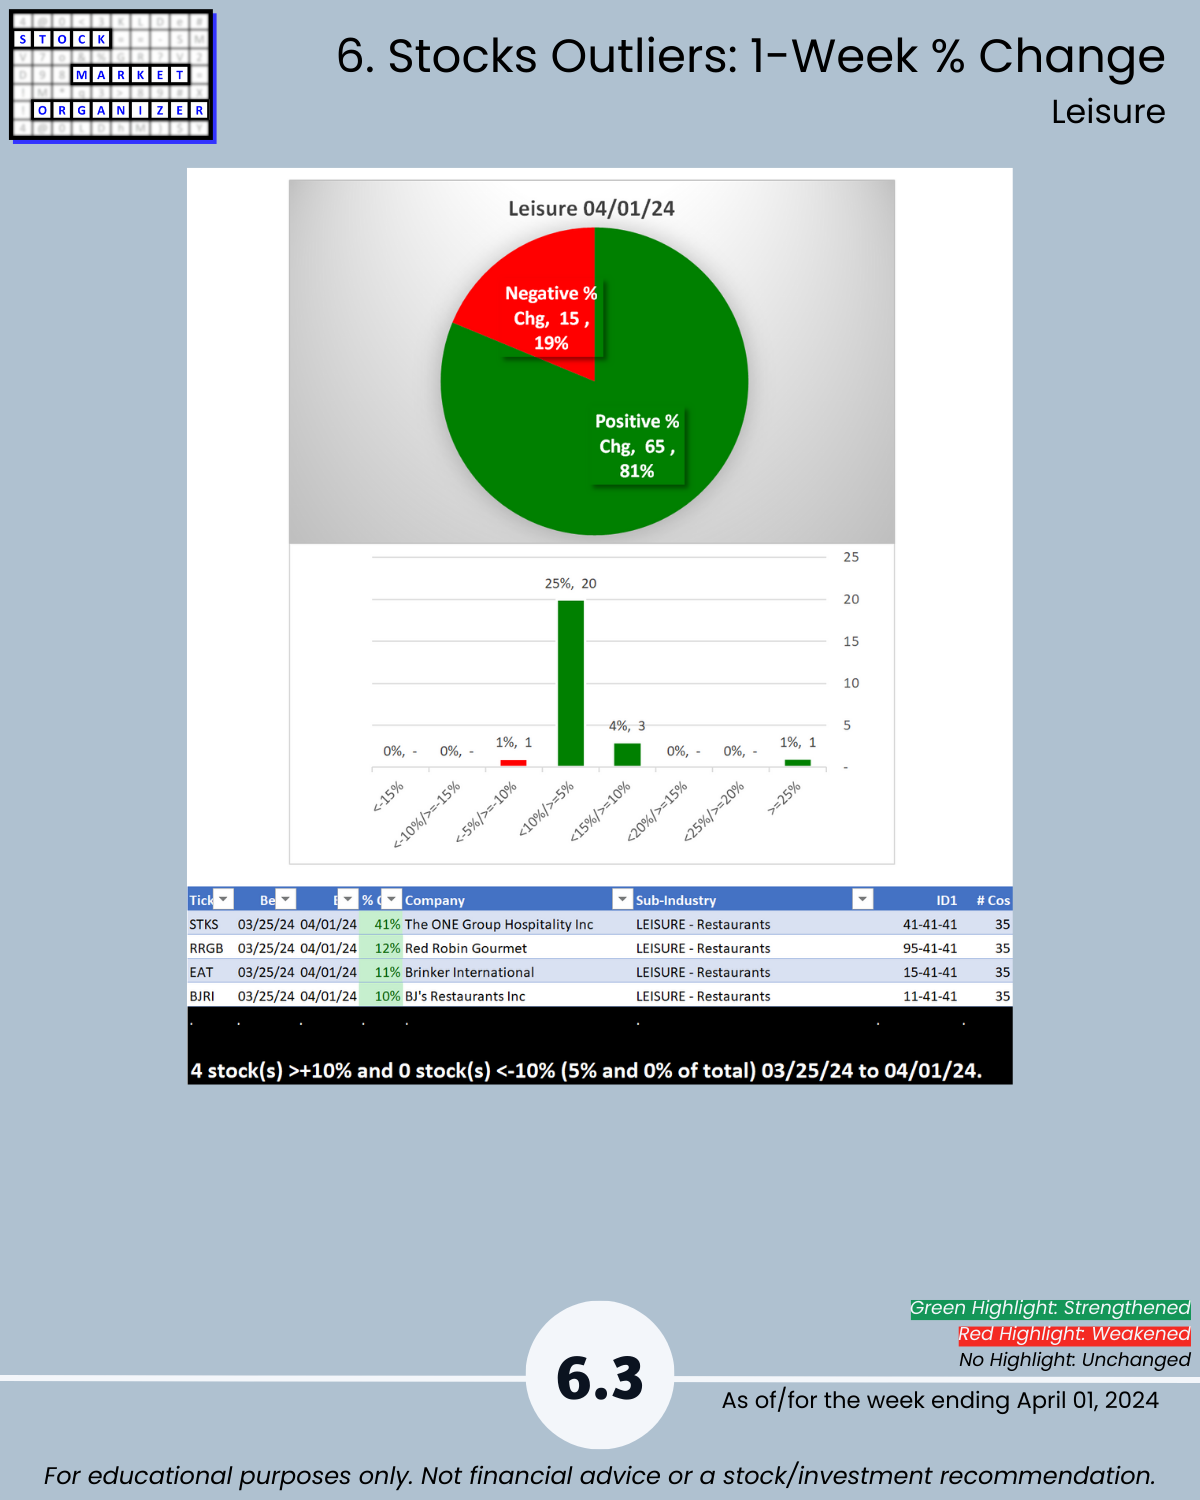
🔹 Stocks, Positive:Negative: Industry avg 73%/27%; Health Services 73%, Leisure 81%, Utilities 96% positive
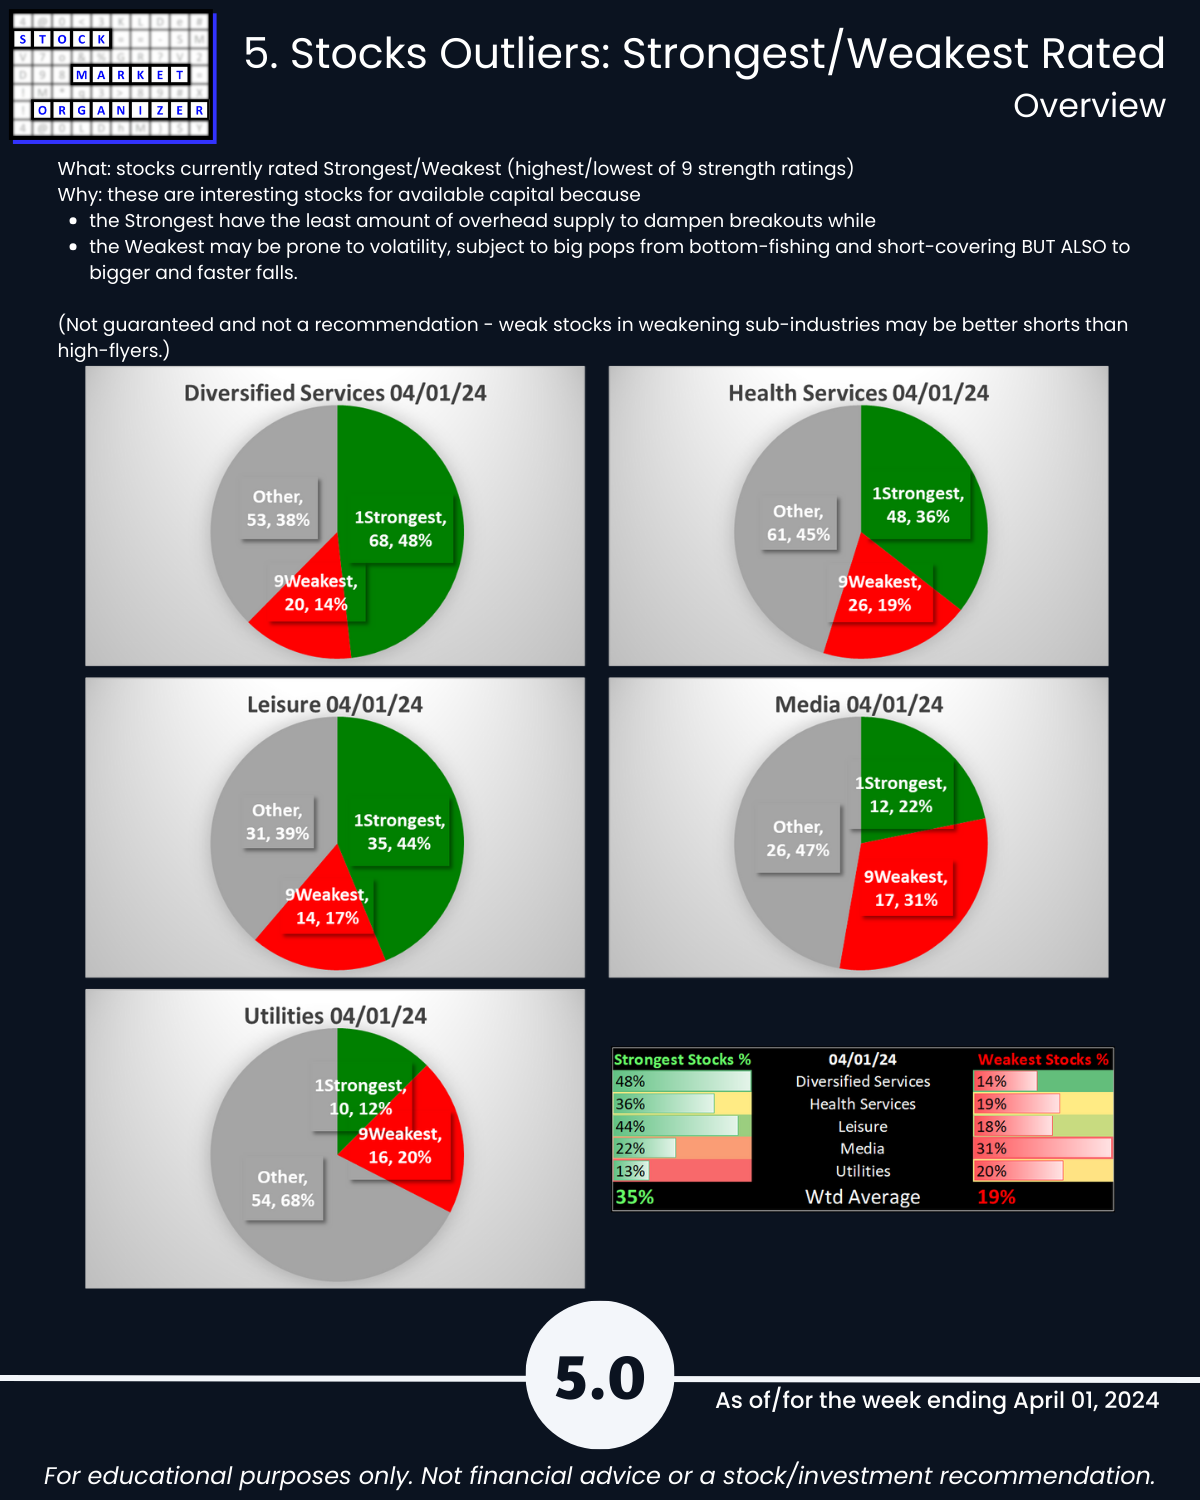
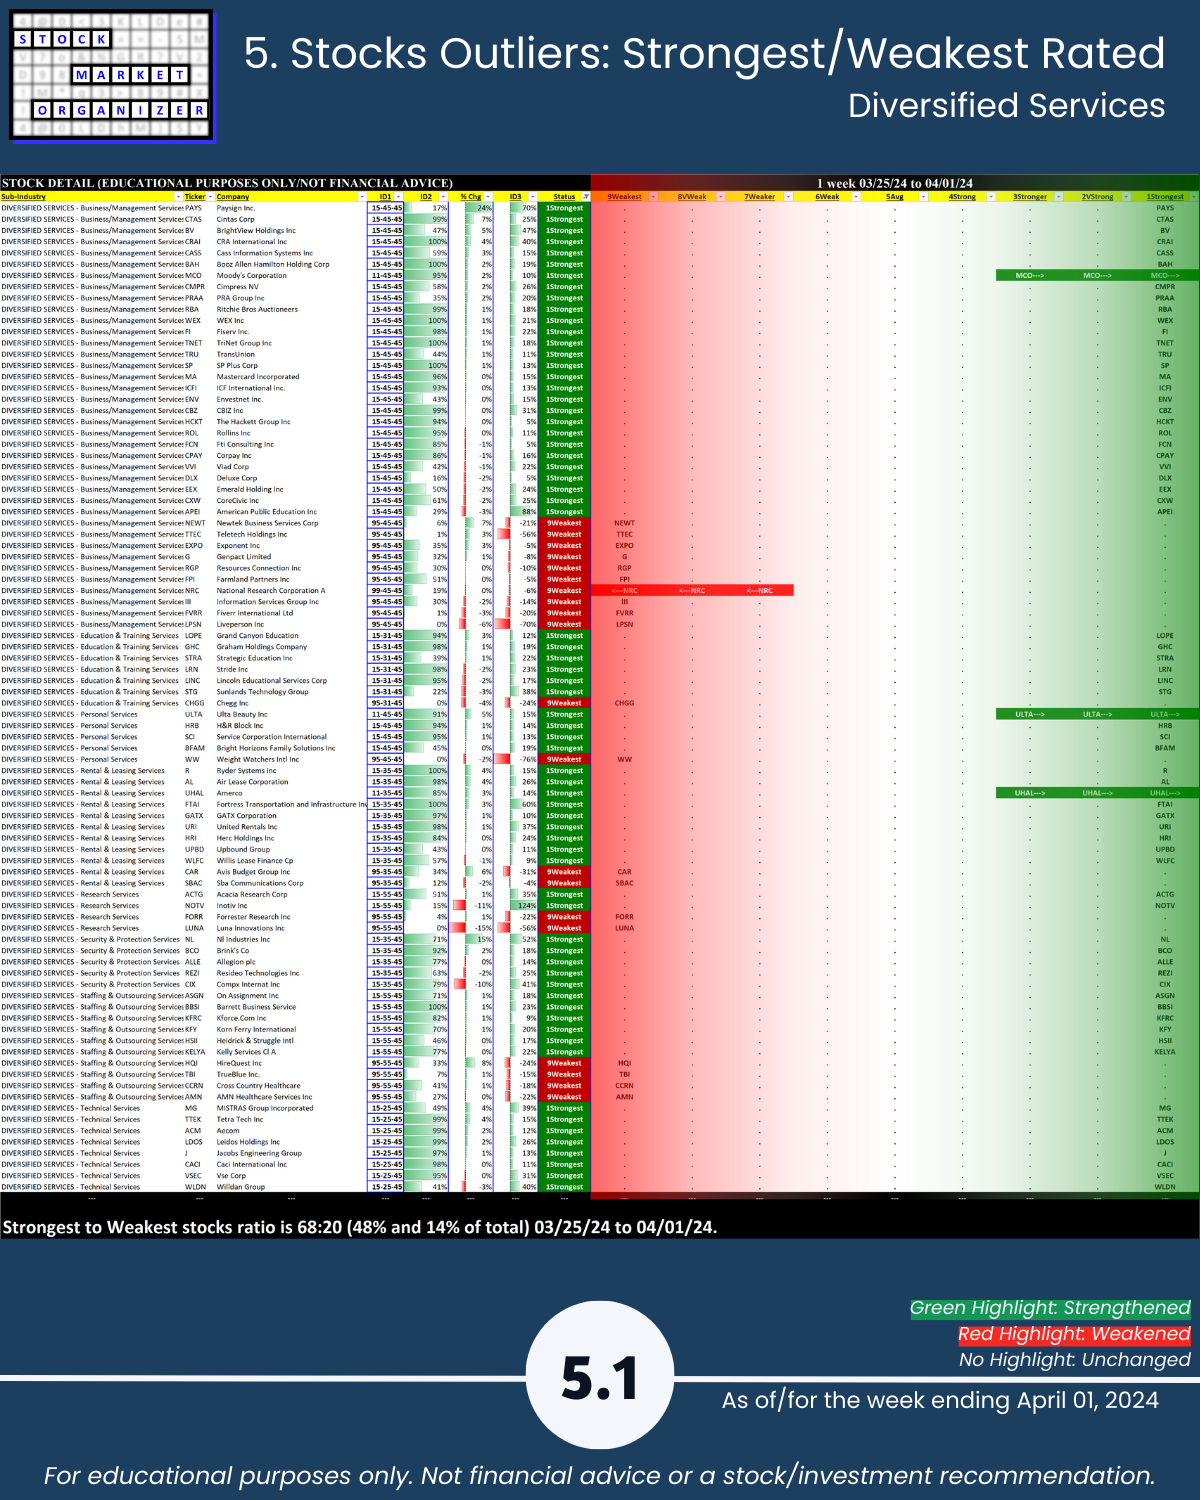
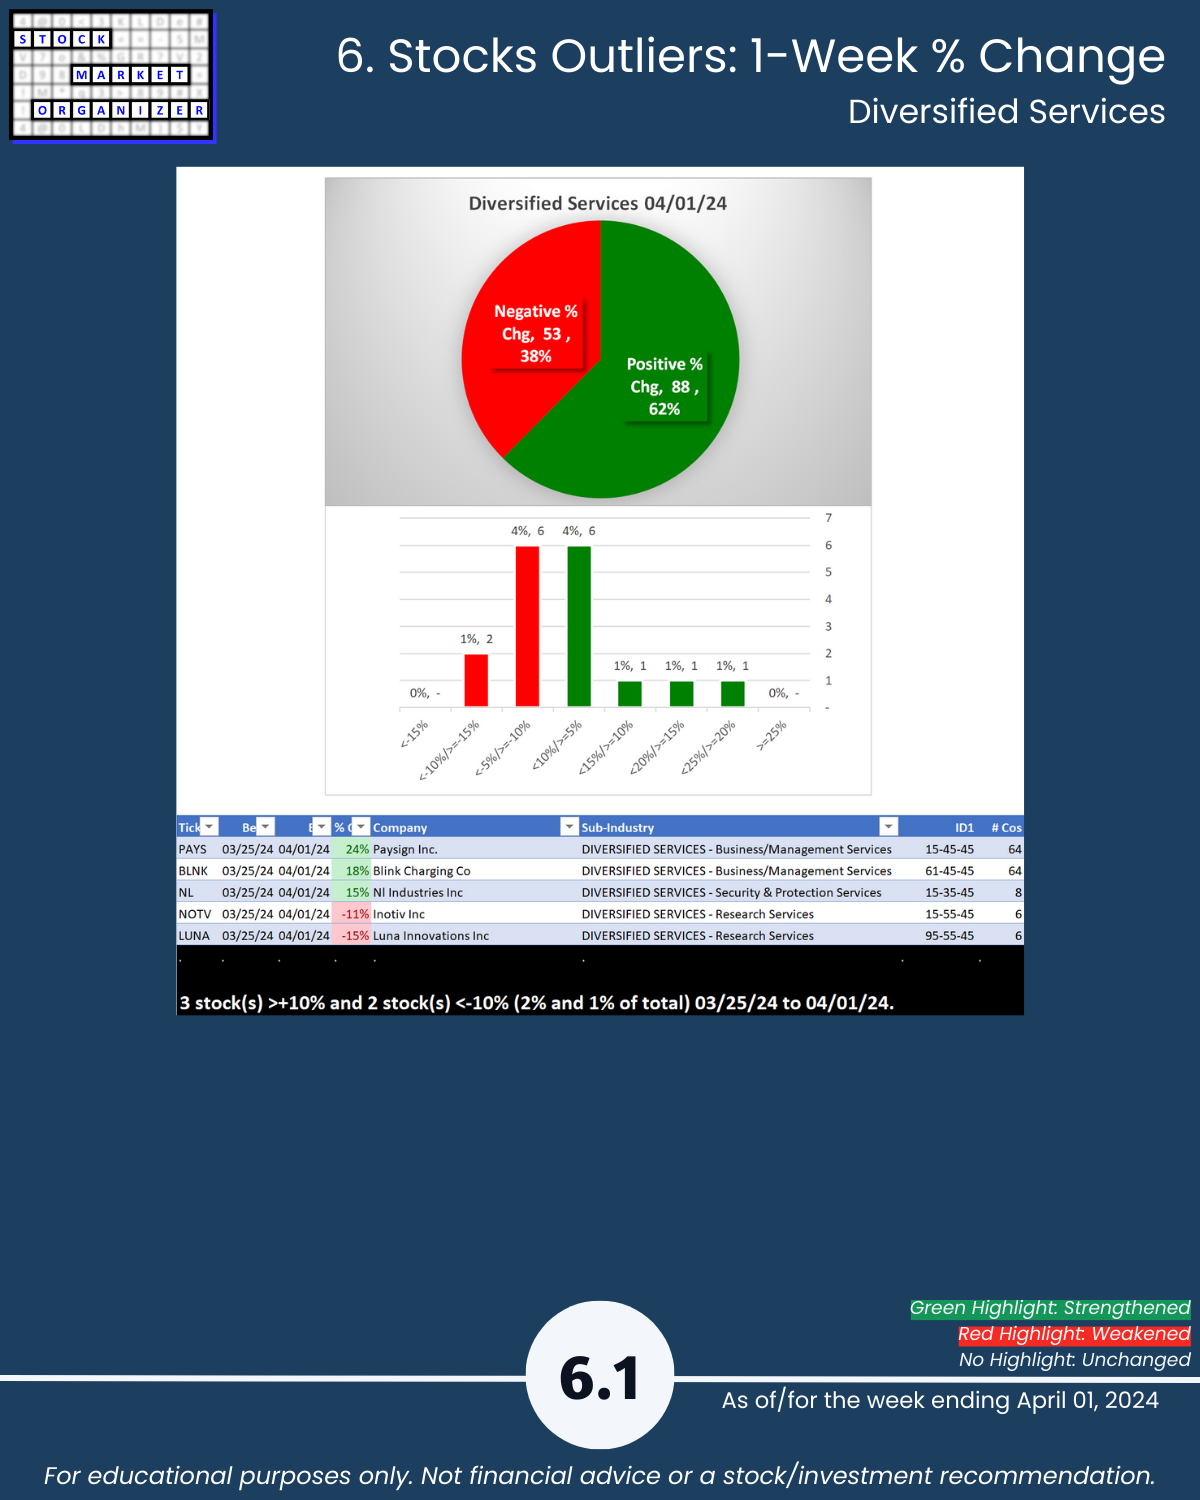
🔹 Stocks, Strongest:Weakest: Industry avg 35%/19%; Diversified Services 48%:14%, Leisure 44%:18% of total
🔹 Outlier Stocks: PAYS +24%, STKS +41%
This report may particularly be of interest if the following 5 concepts resonate with you:
- The stronger your stocks, the greener your P&L.
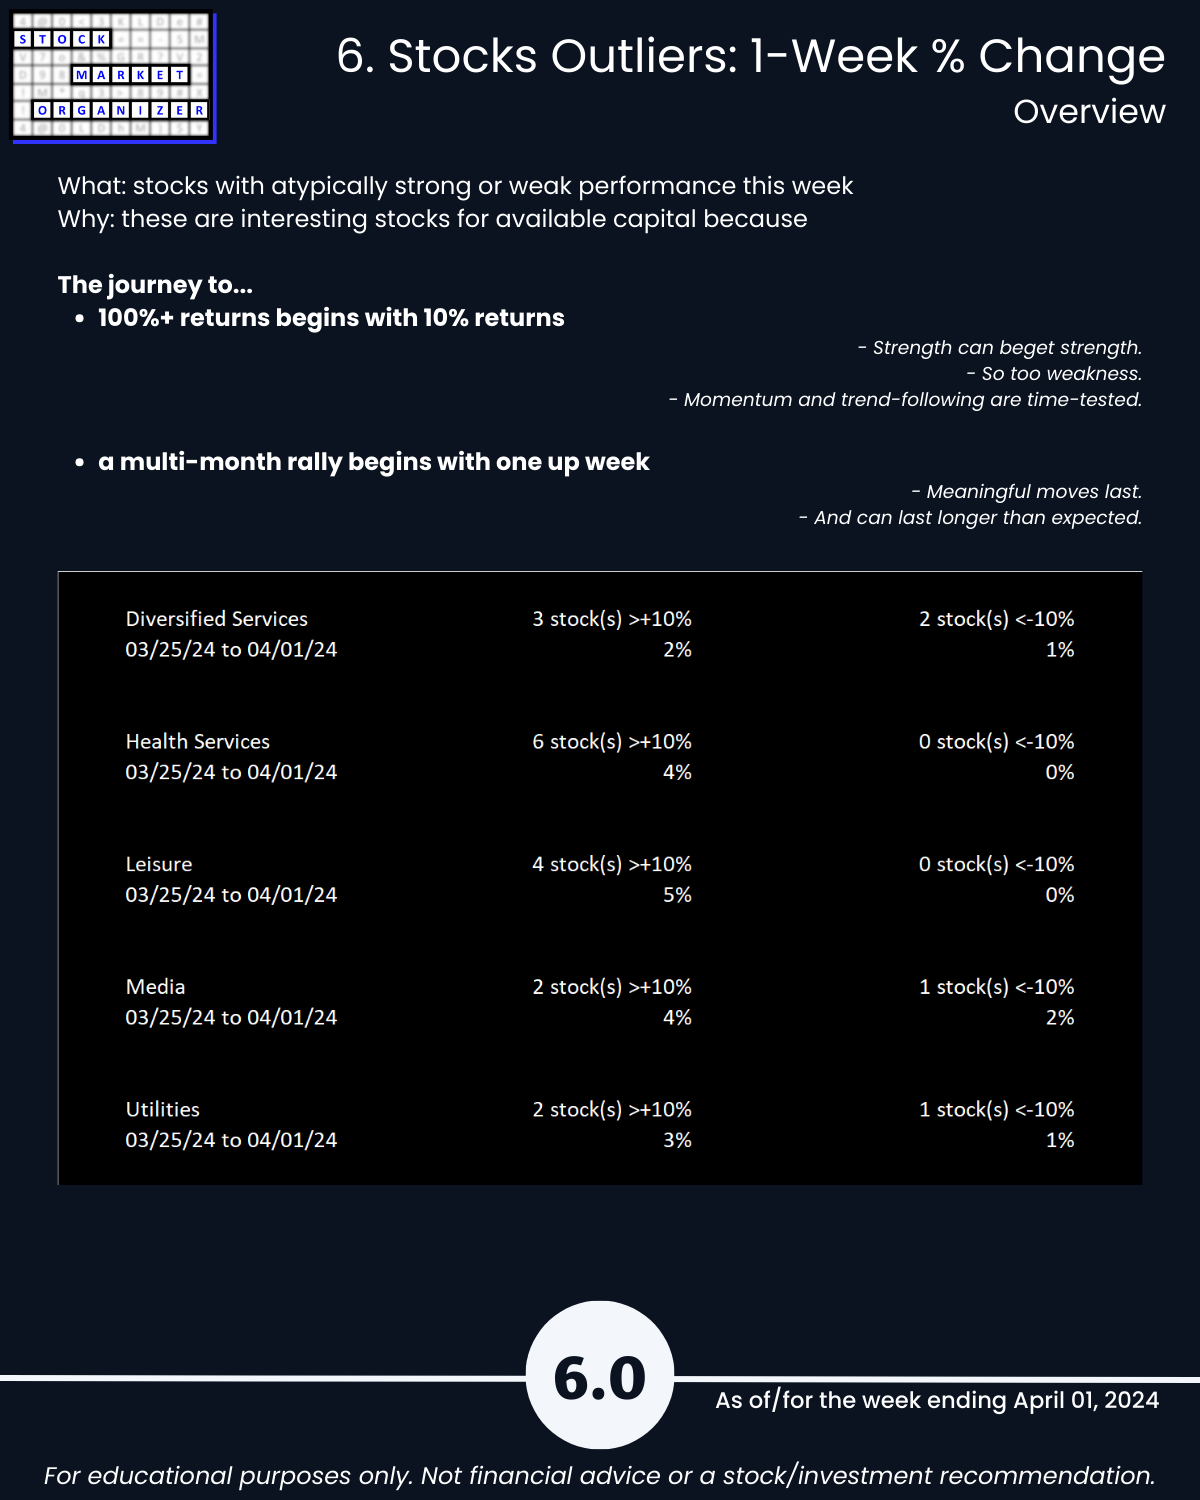
- The journey to 100%+ returns begins with 10% returns.
- The journey to a multi-month rally begins with one up week.
- Most stocks do what the market does. (While the market can only do what its underlying stocks, sub-industries, and industries do.)
- 80/20: not all information is created equal. (Press buttons, not balloons.)
Following are galleries with page-by-page views of this report.
1. Introduction
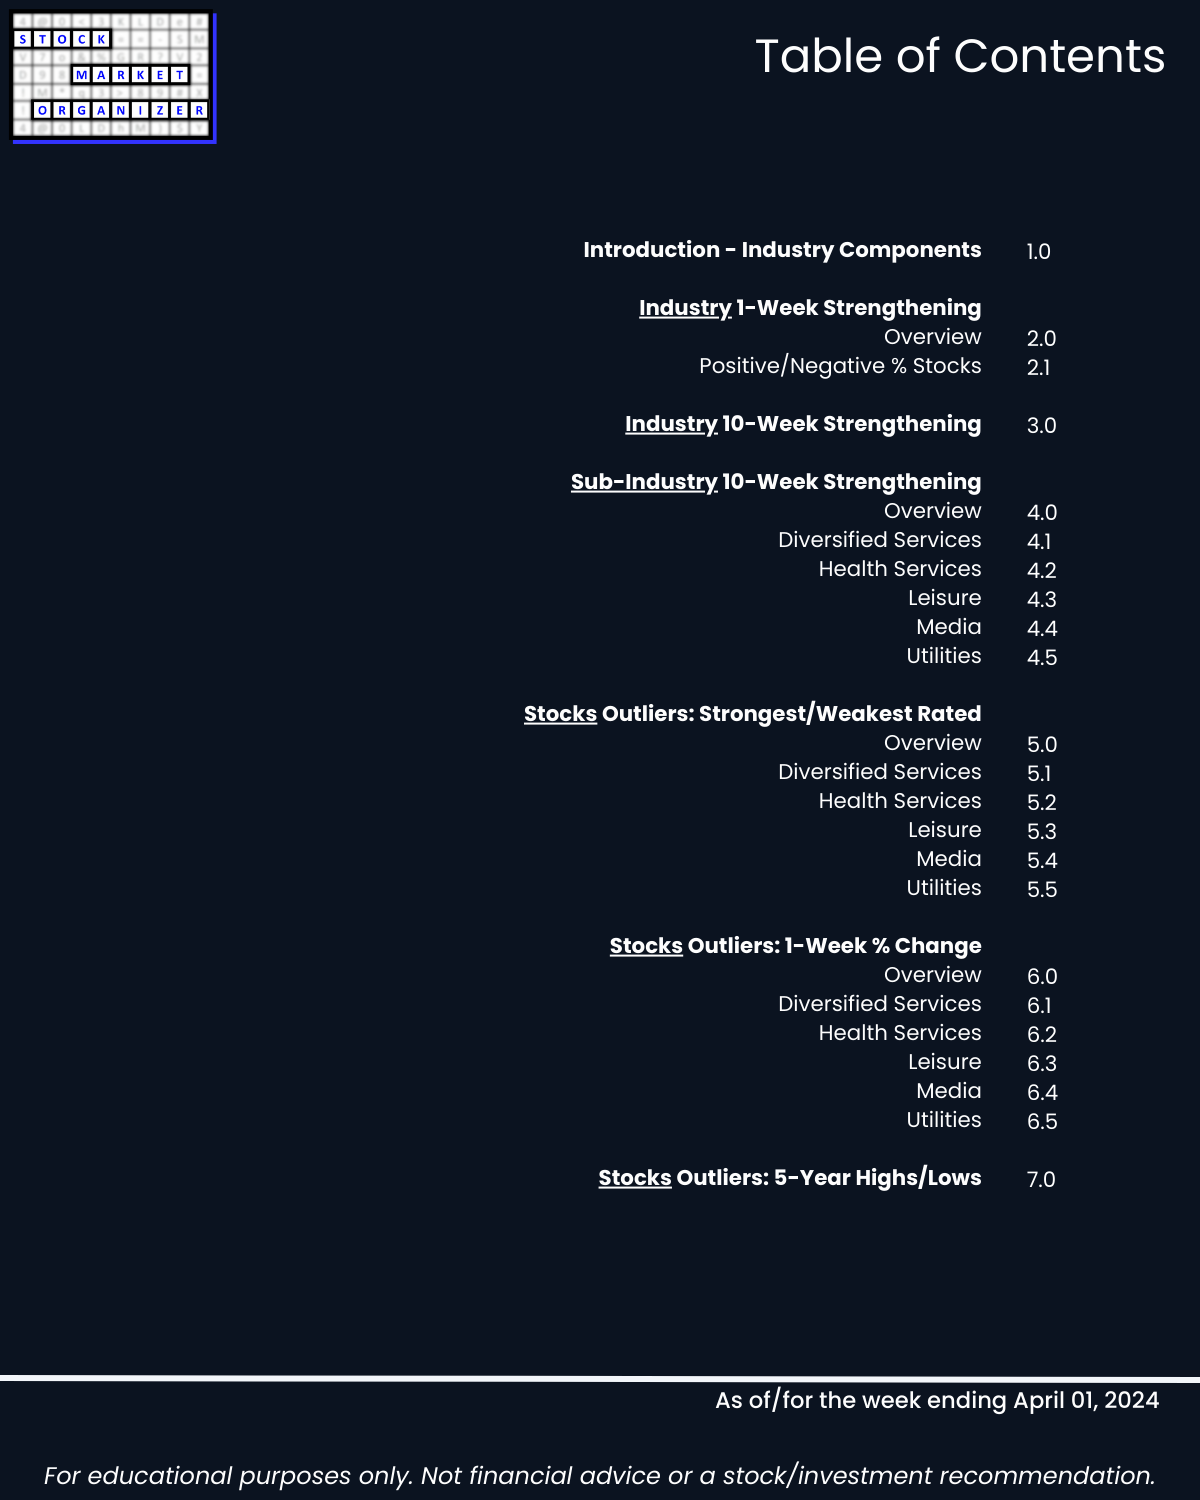
2. Industry 1-Week Strengthening
3. Industry 10-Week Strengthening
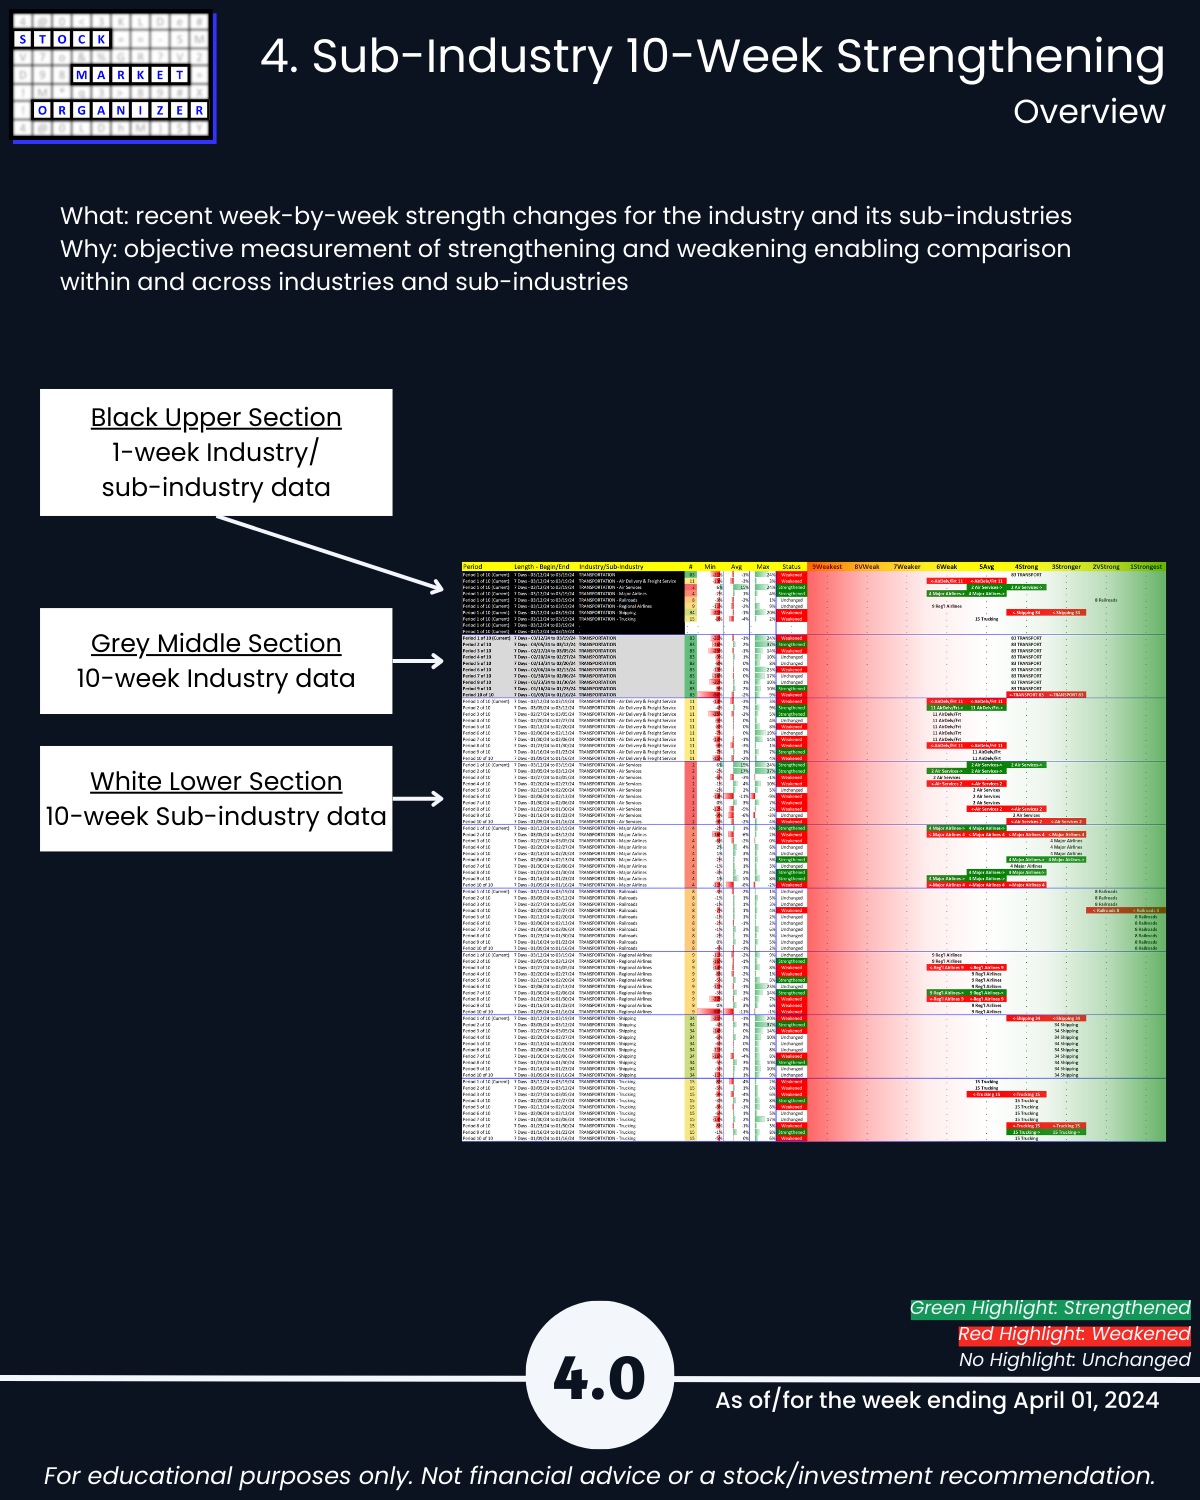
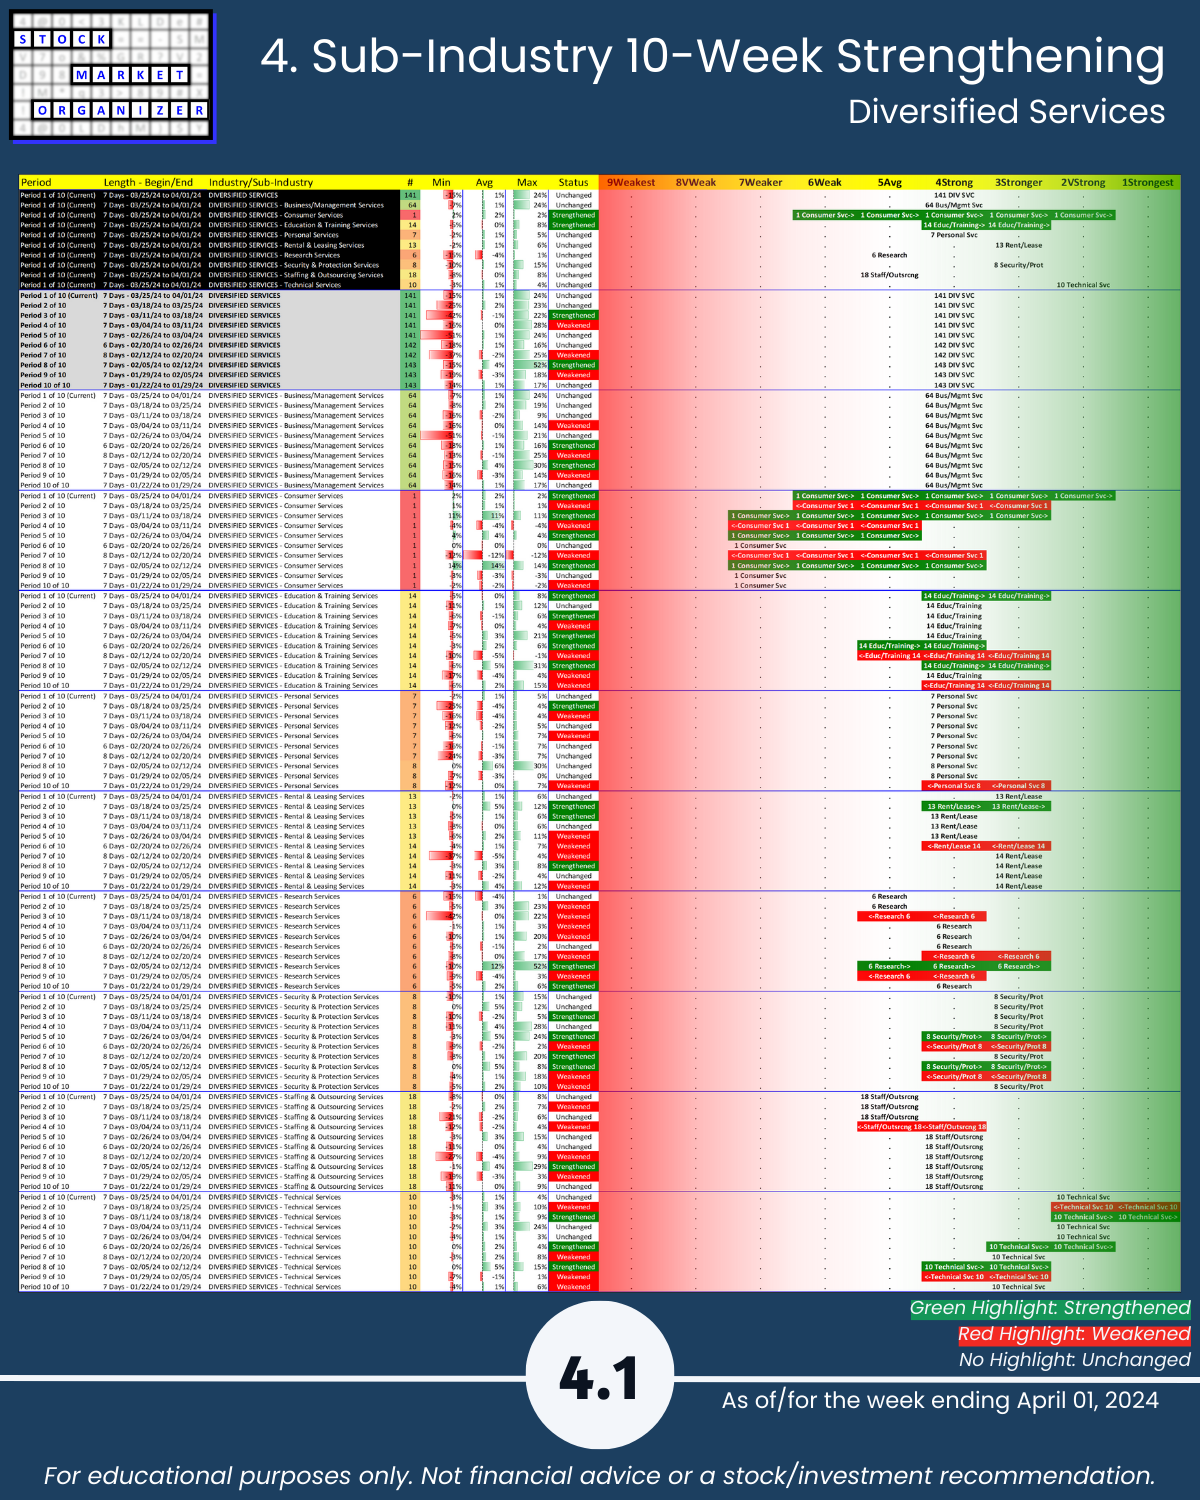
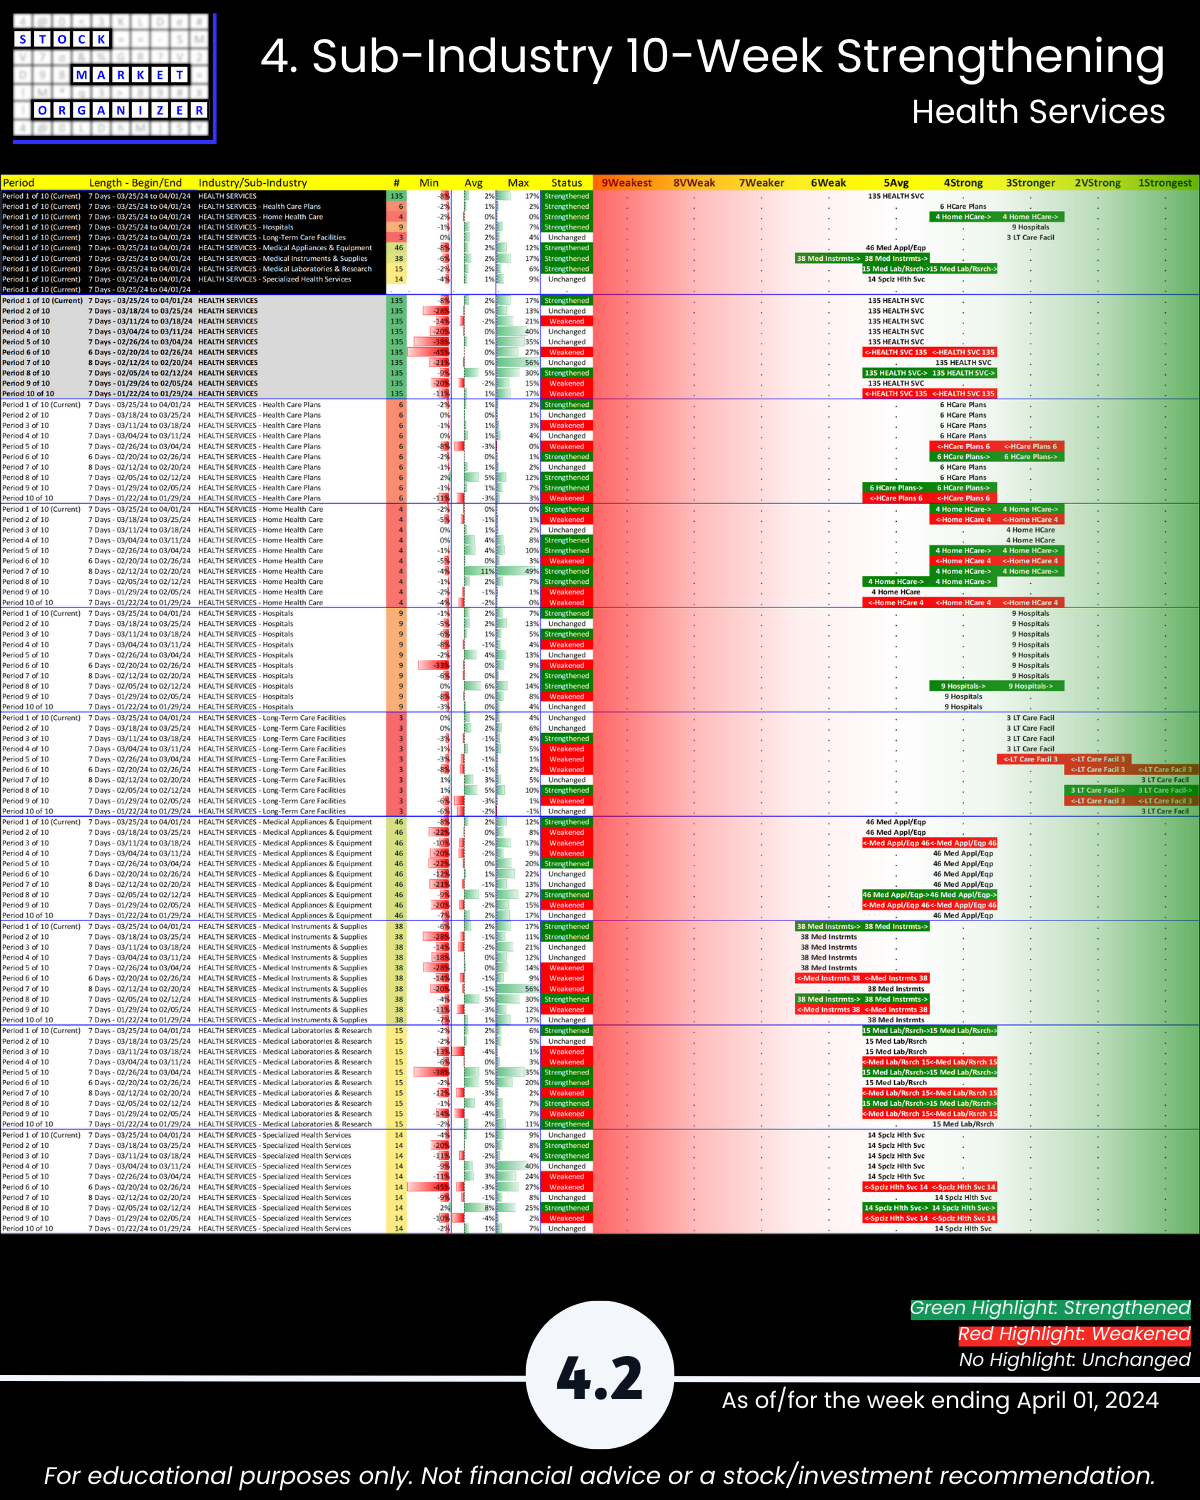
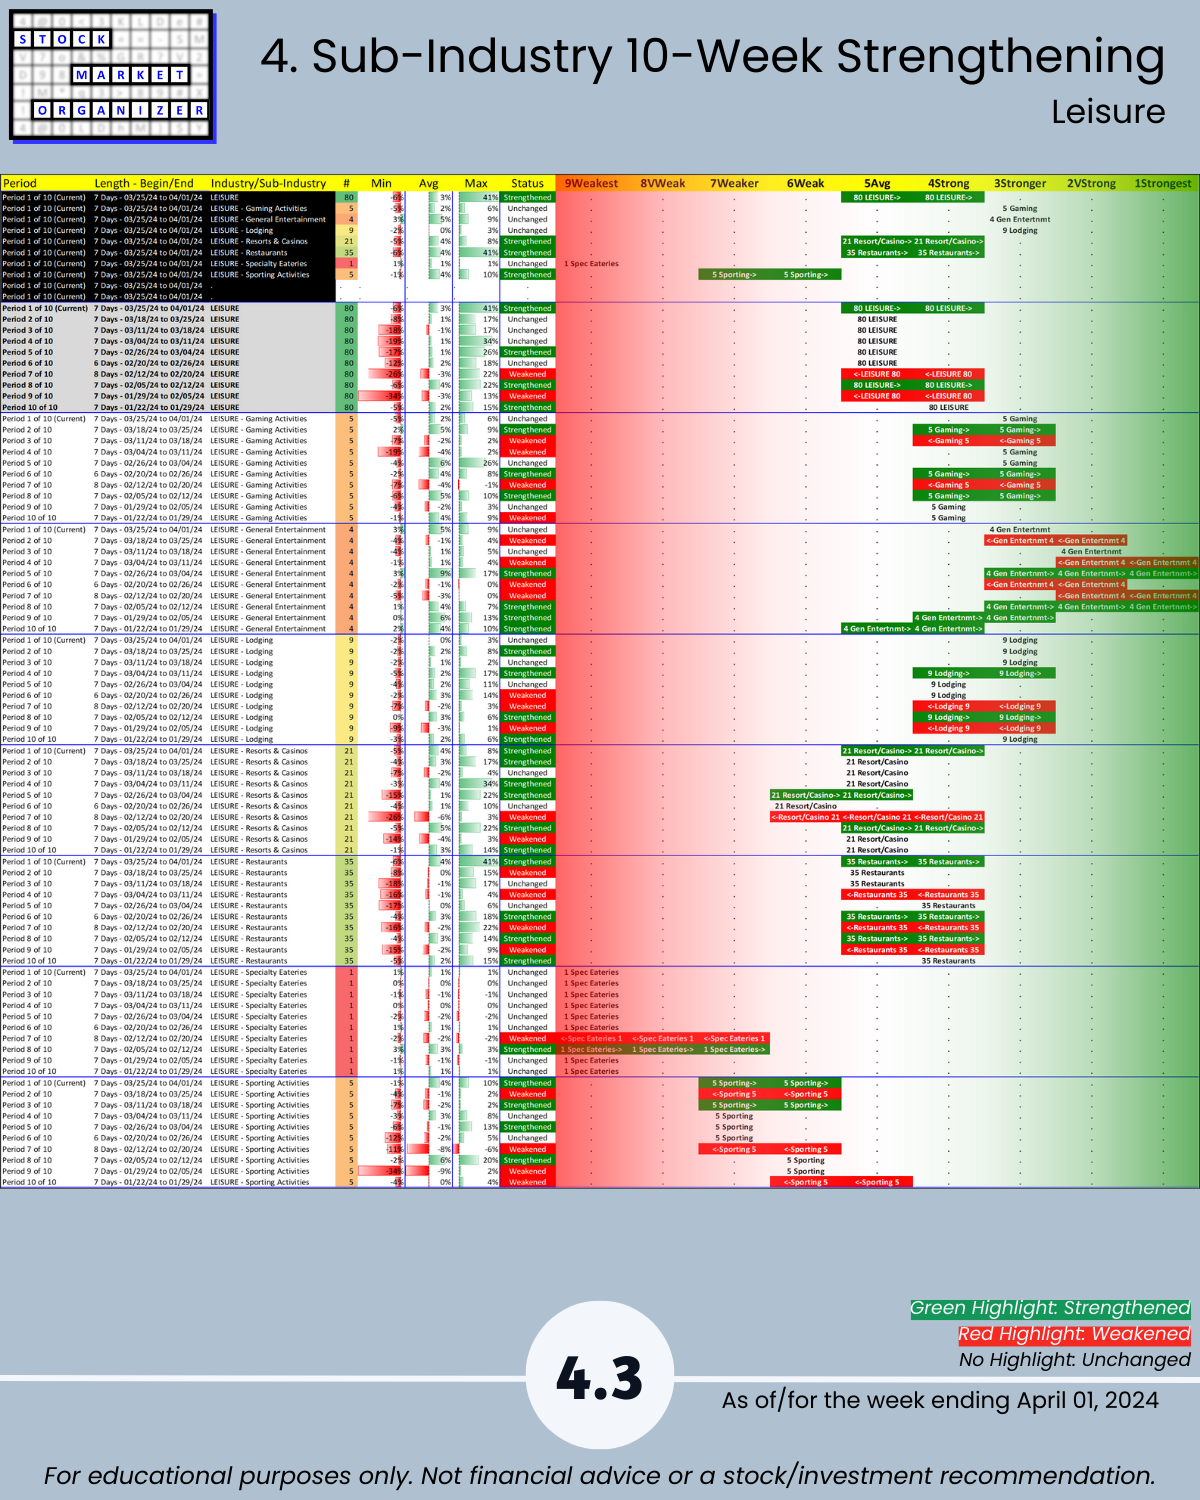
4. Sub-Industry 10-Week Strengthening
5. Stocks Outliers: Strongest/Weakest Rated
6. Stocks Outliers: 1-Week % Change
7. Stocks Outliers: 5-Year Highs/Lows