SMO Exclusive: Strength Report Group 2 2024-03-18

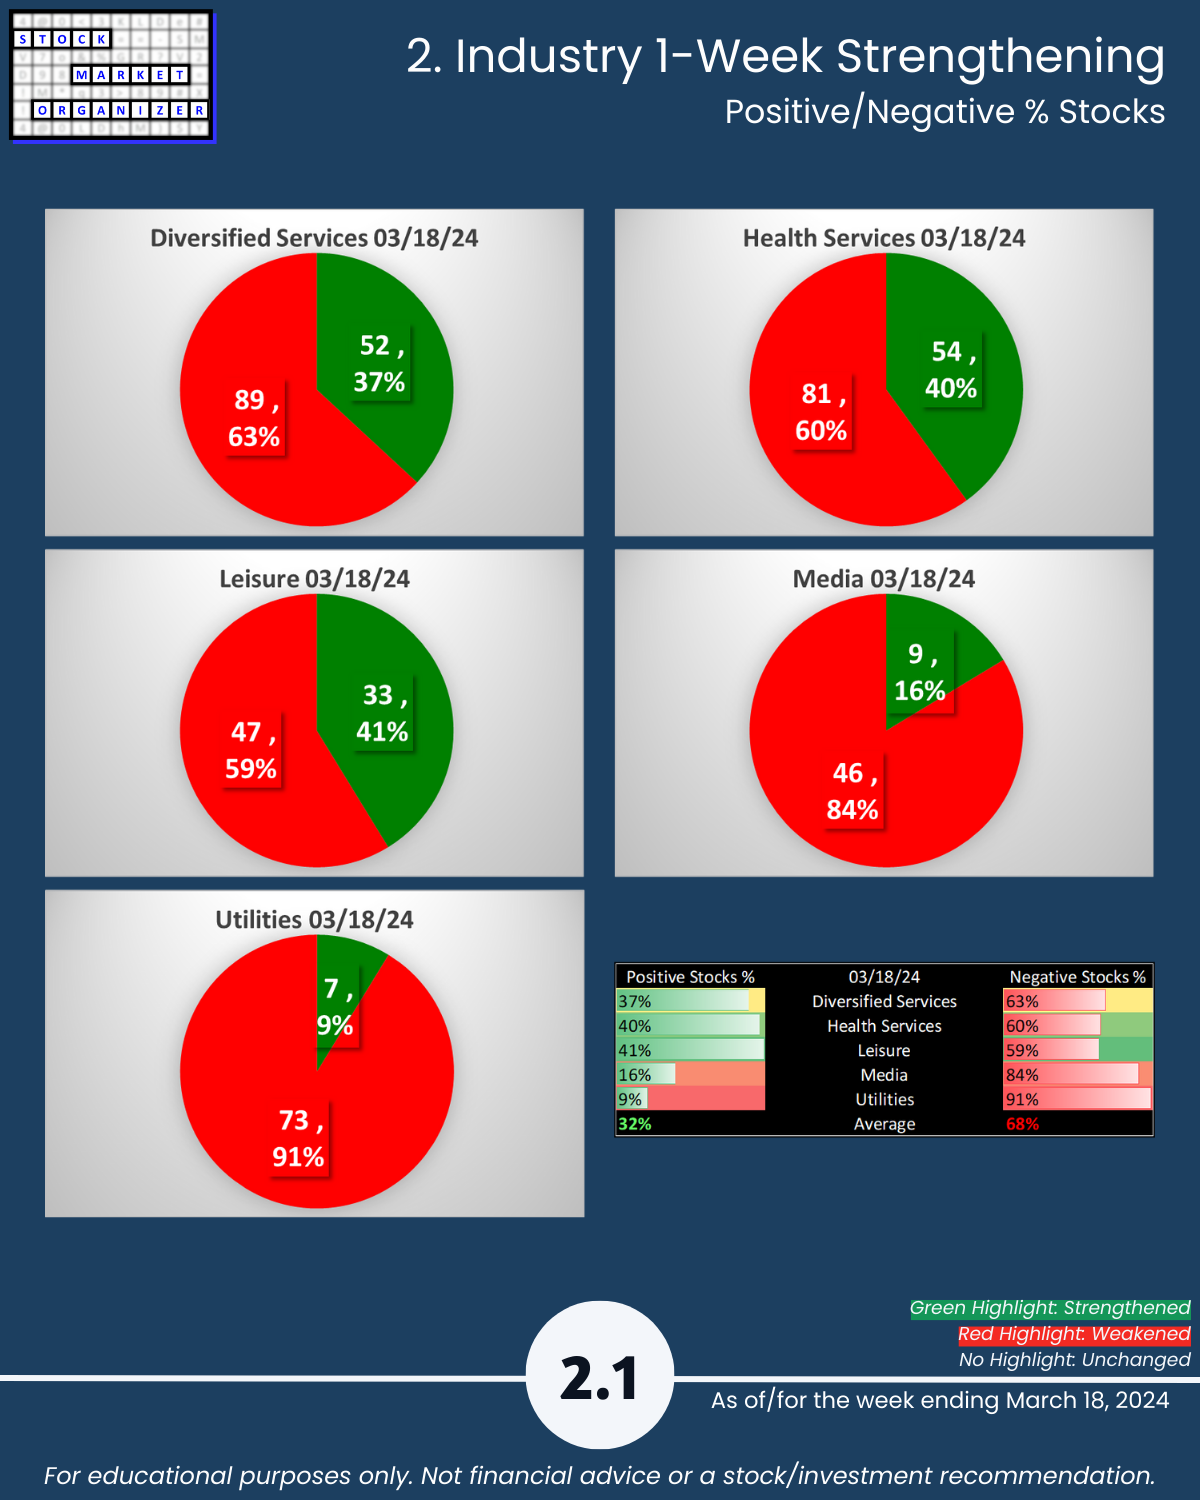
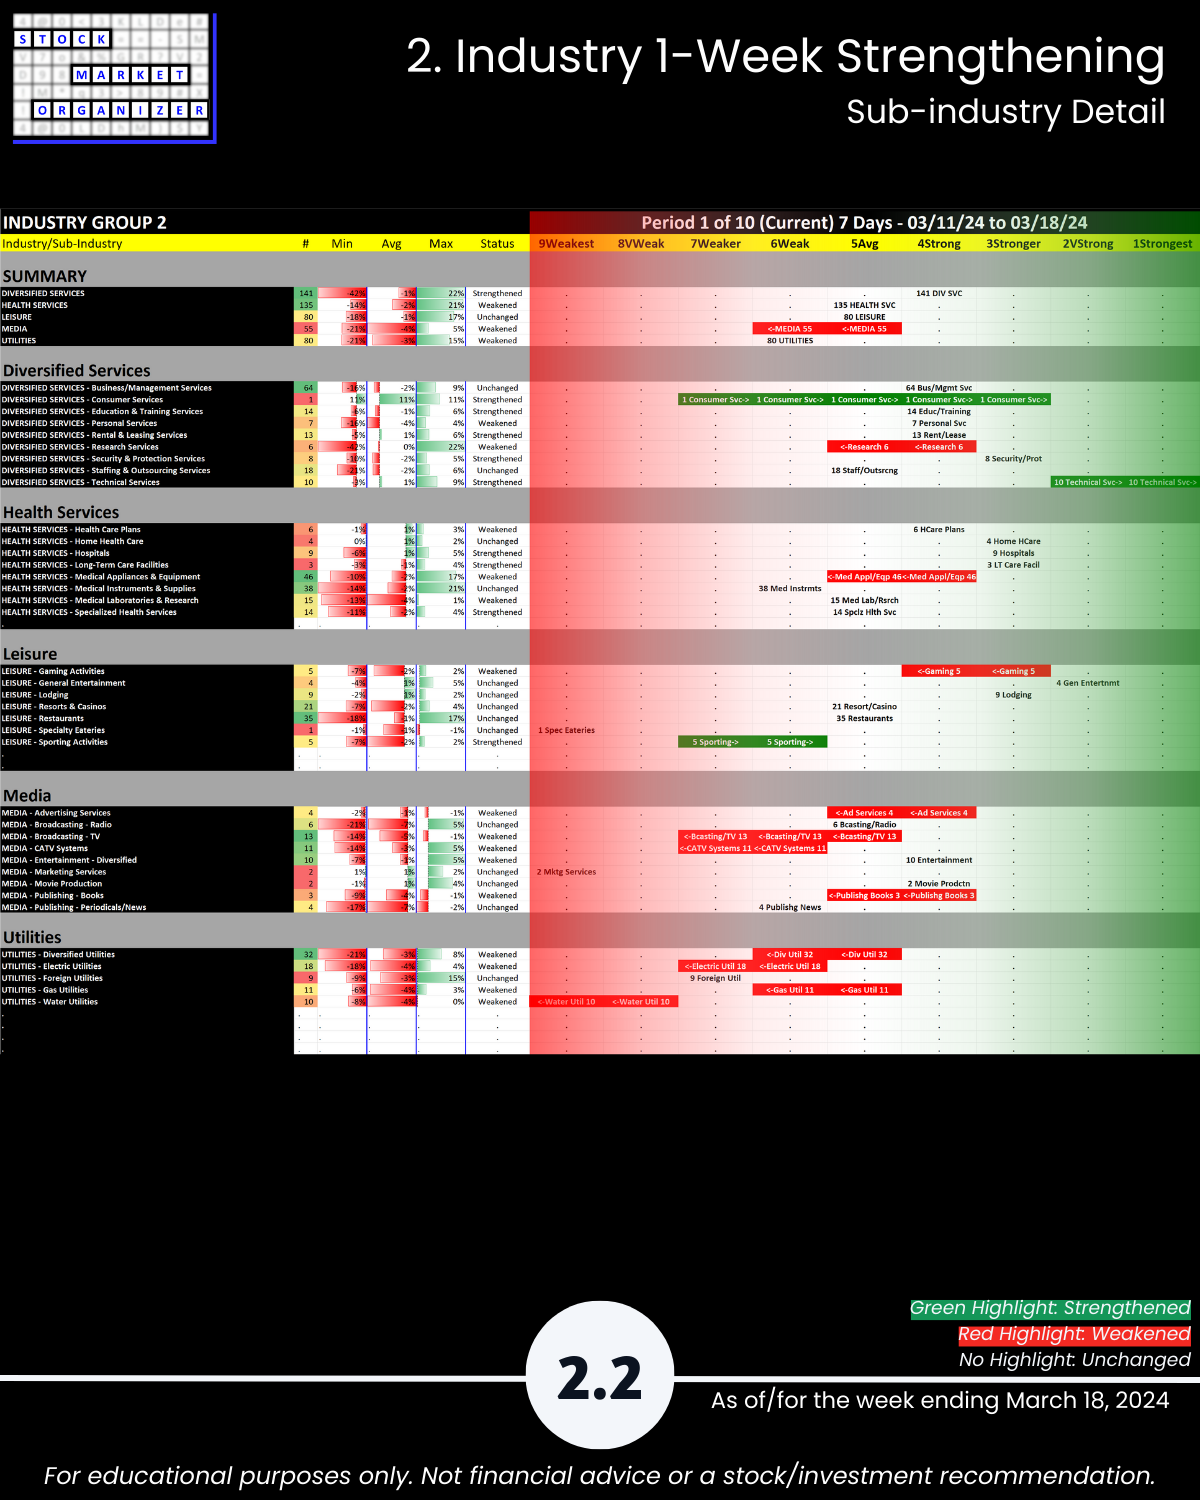
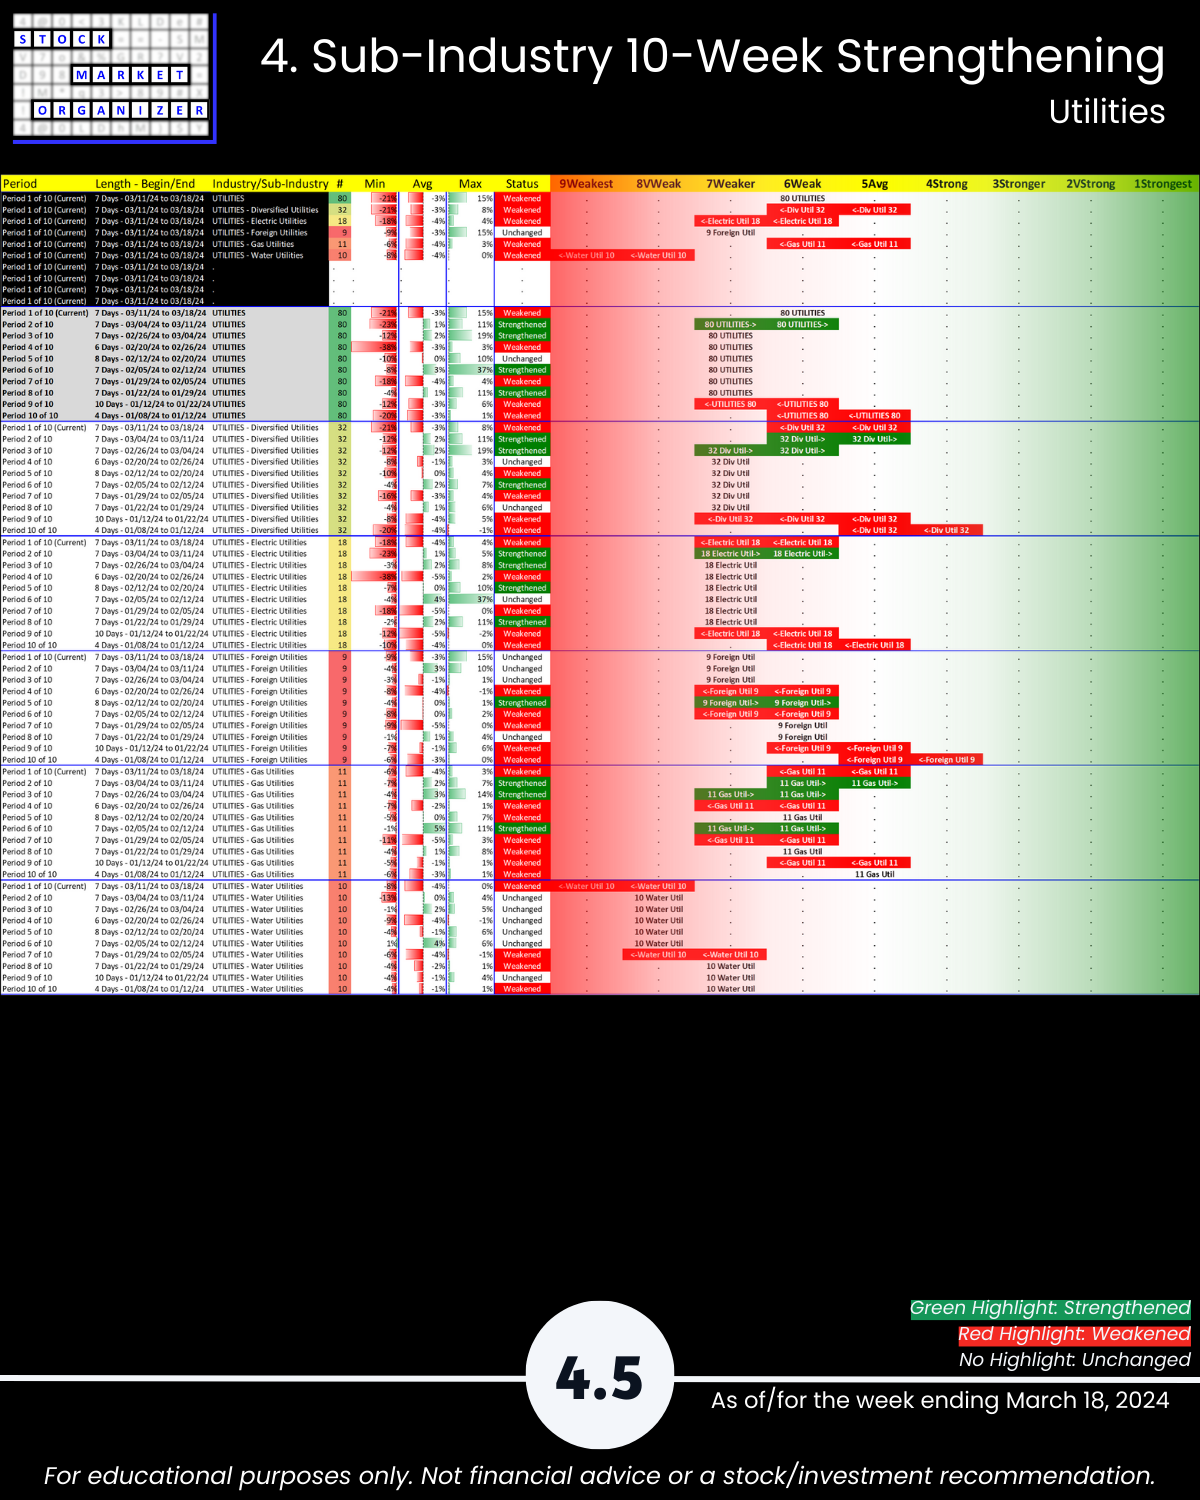
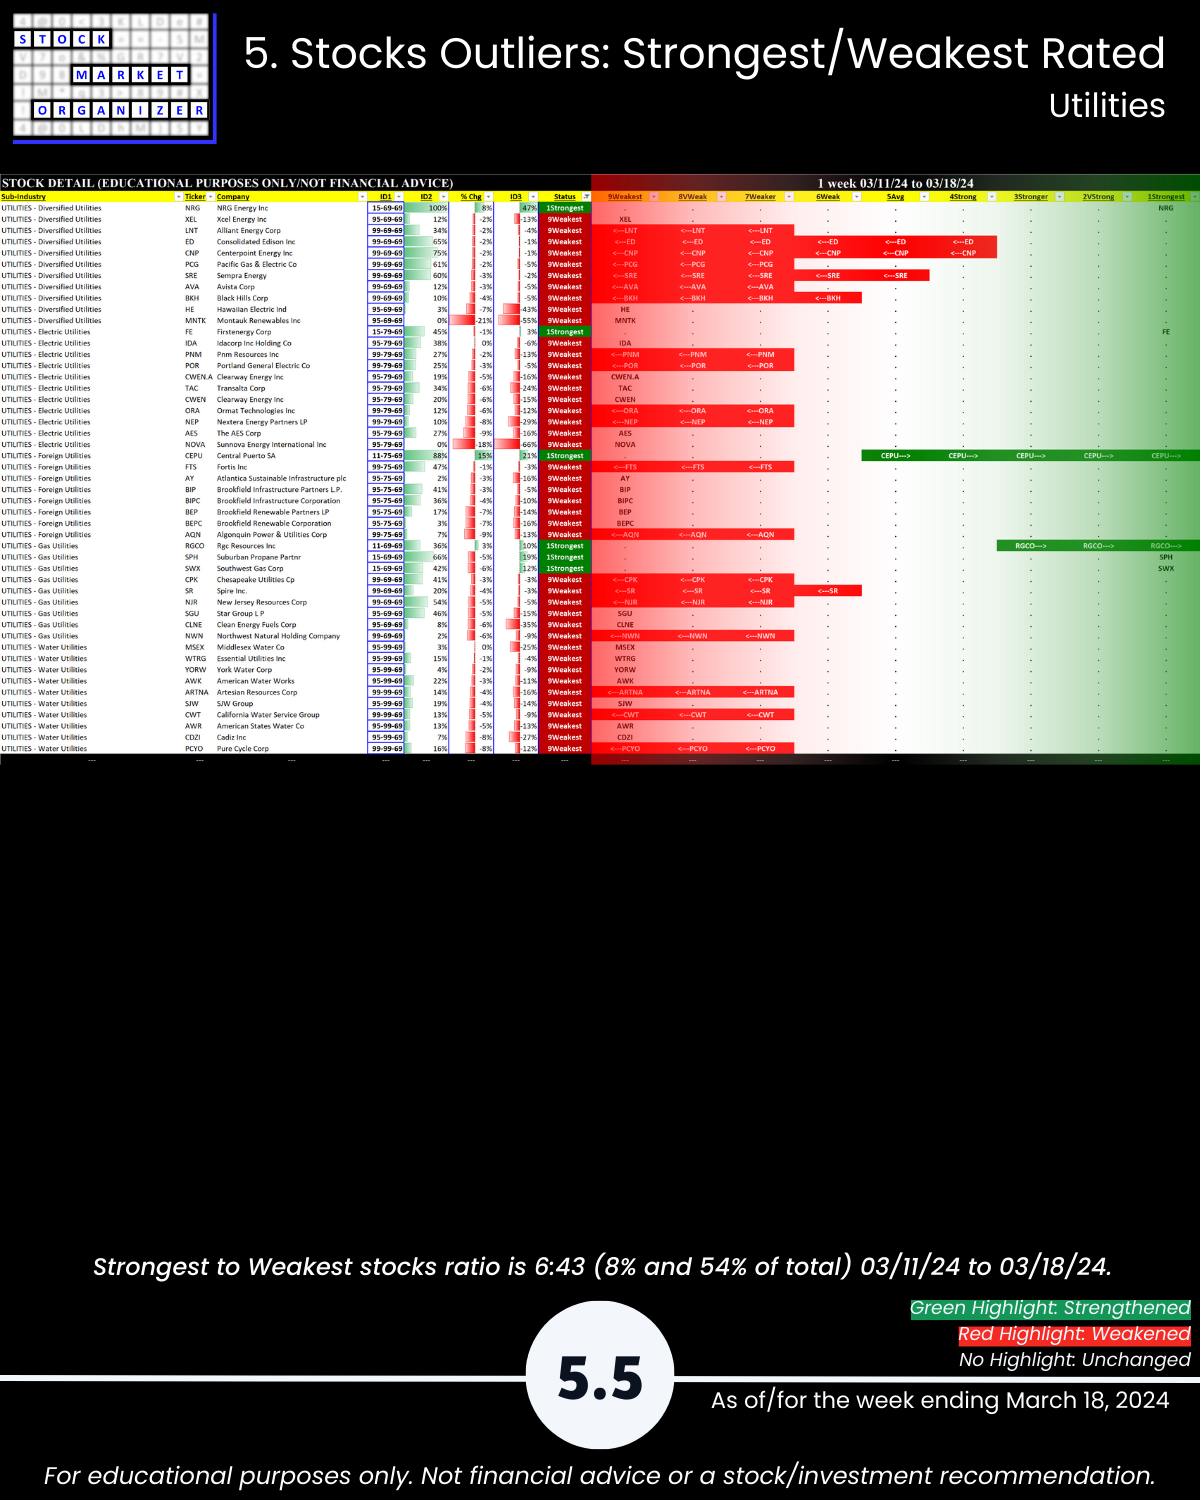
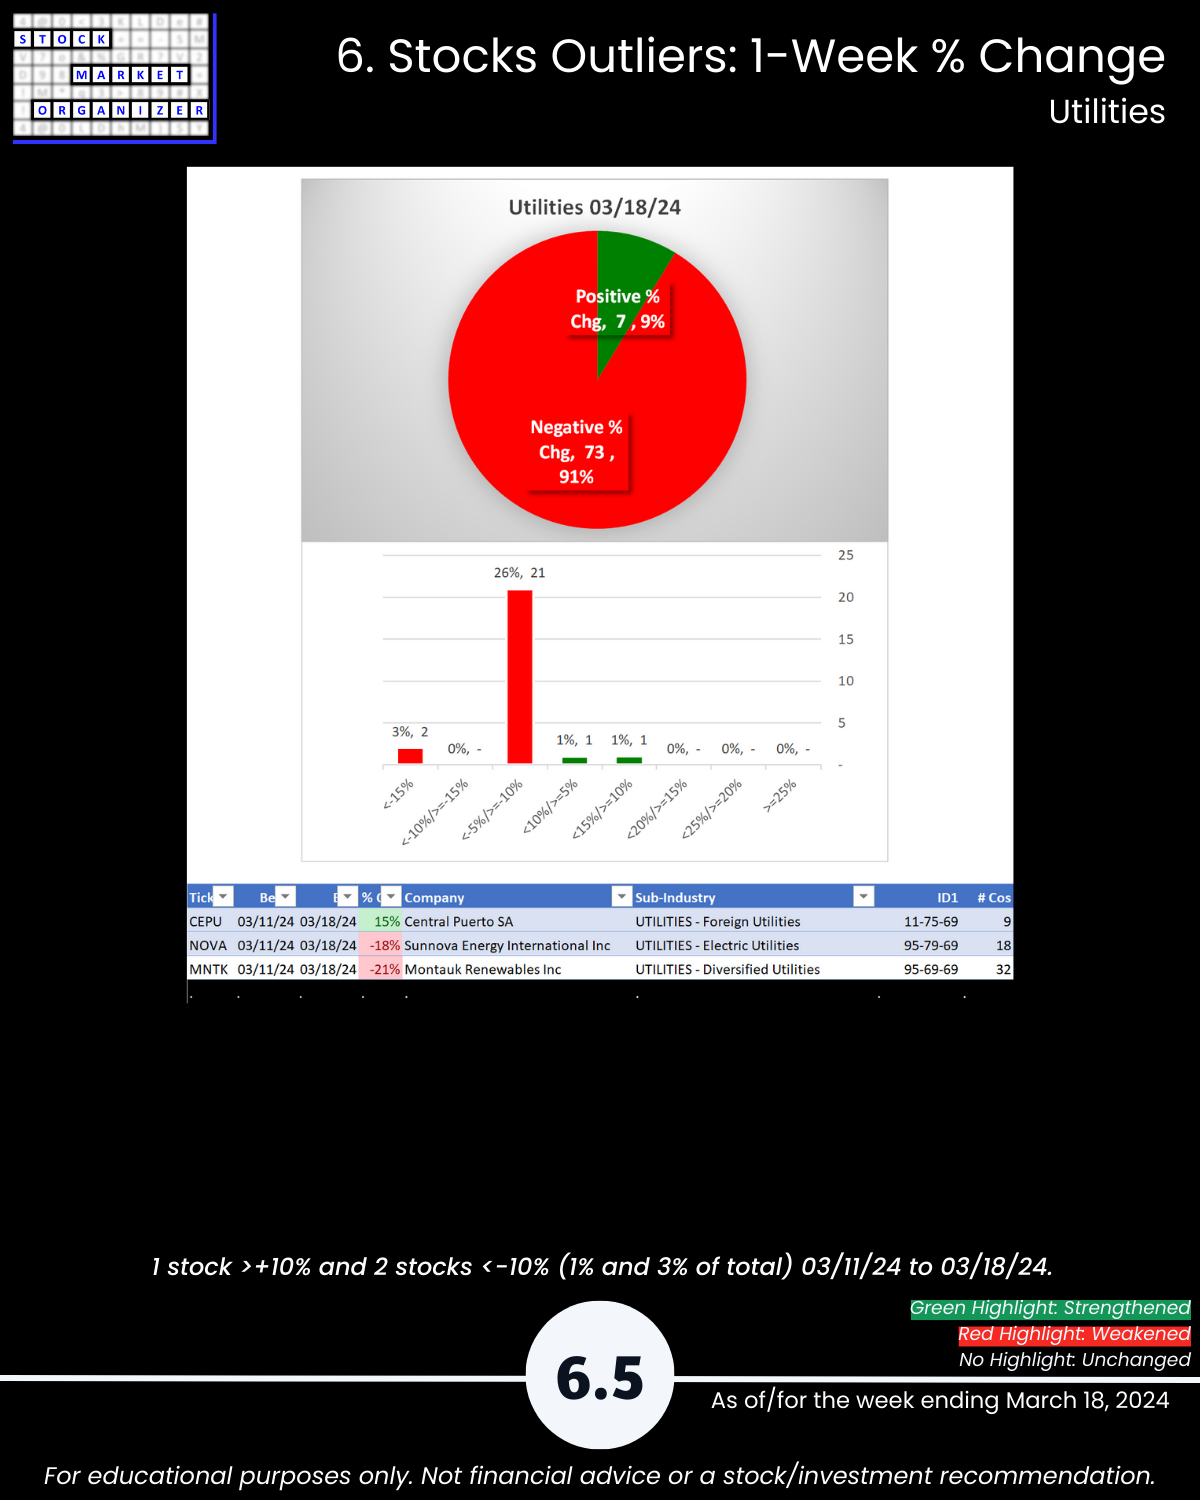
What you may not have known, U.S. stock market 3/18/24 Group 2 (loosely, Services Sector) stocks: Utilities reverted to its weakening ways. 🔹 4/5 sub-industries weakened (Water Utilities is rated Weakest, lowest of 9 strength levels), 🔹 91% negative stocks for the week, and 🔹 only 8% of stocks rated Strongest.
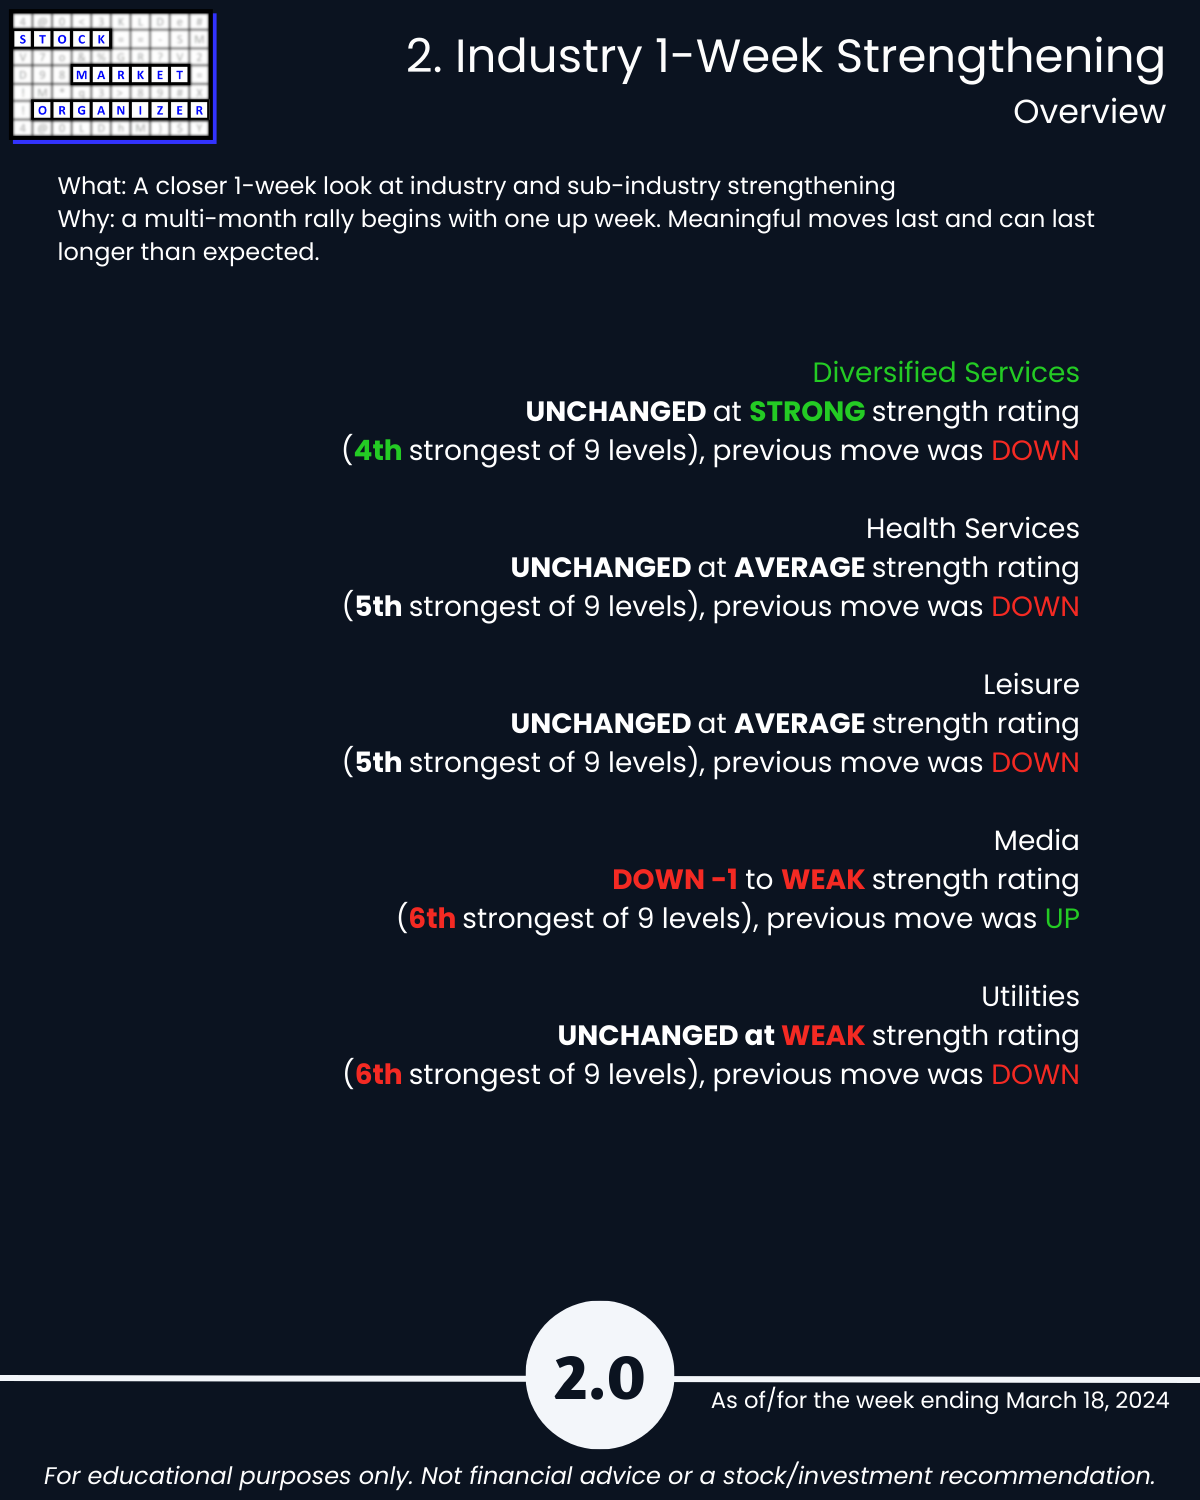
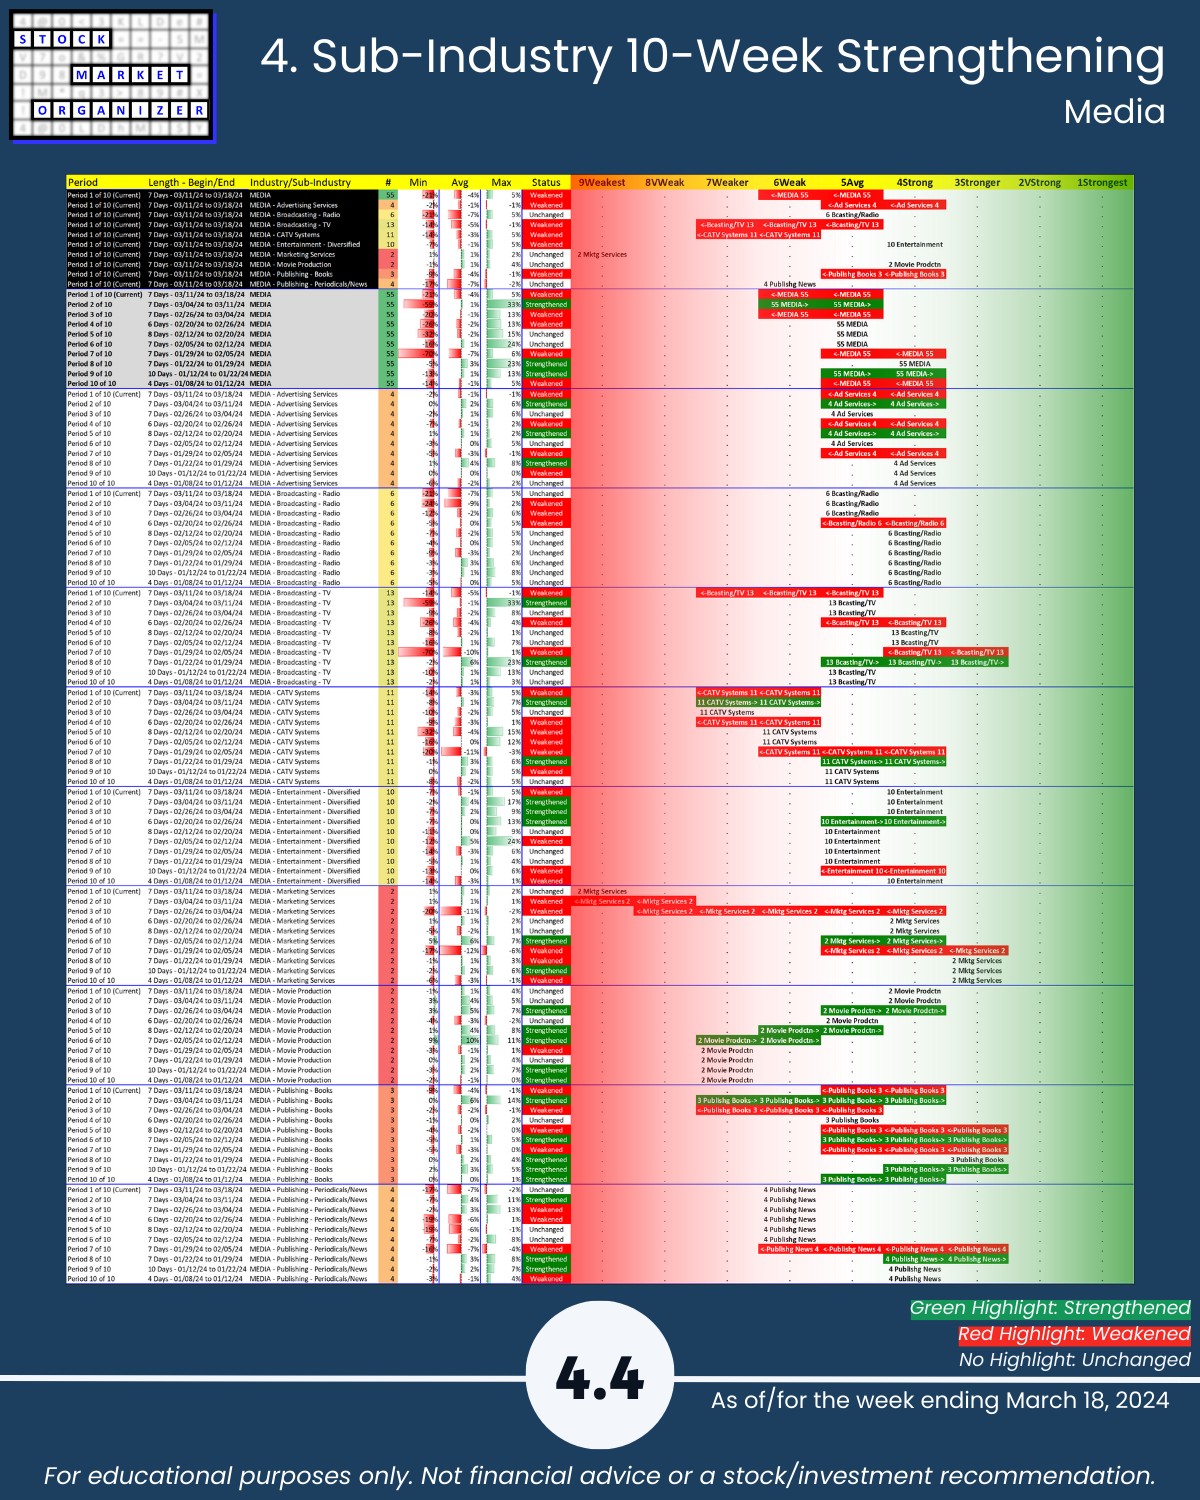
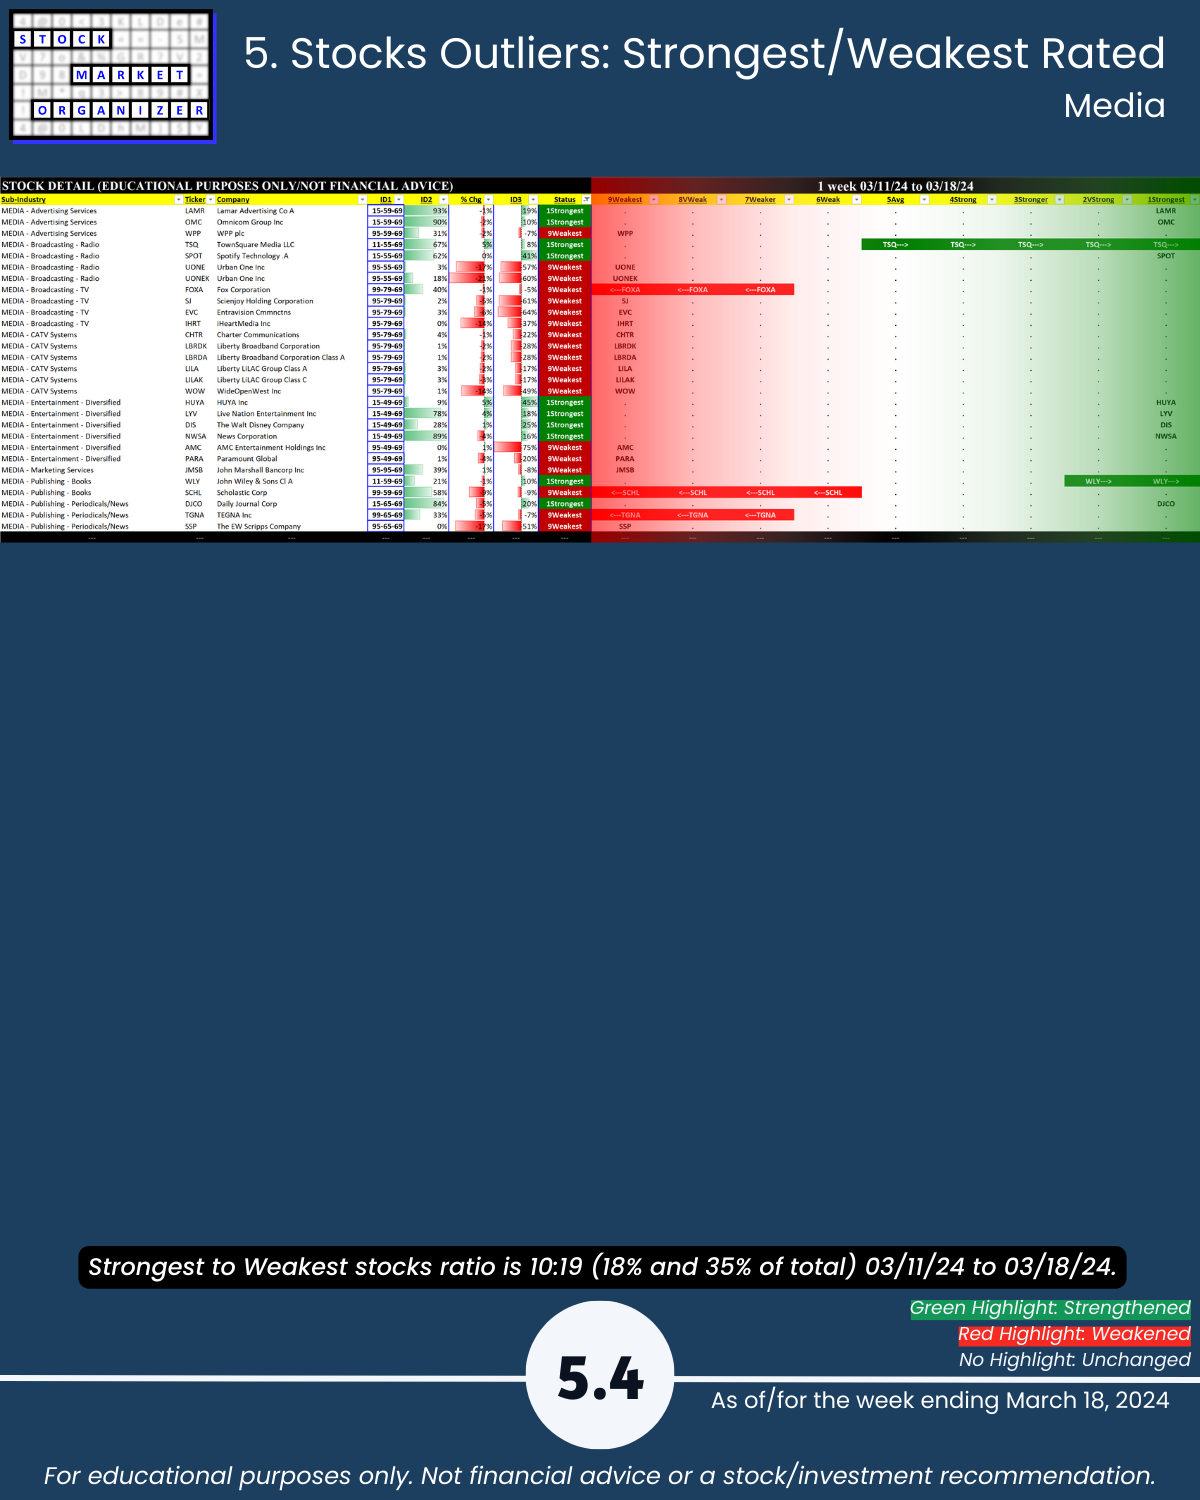
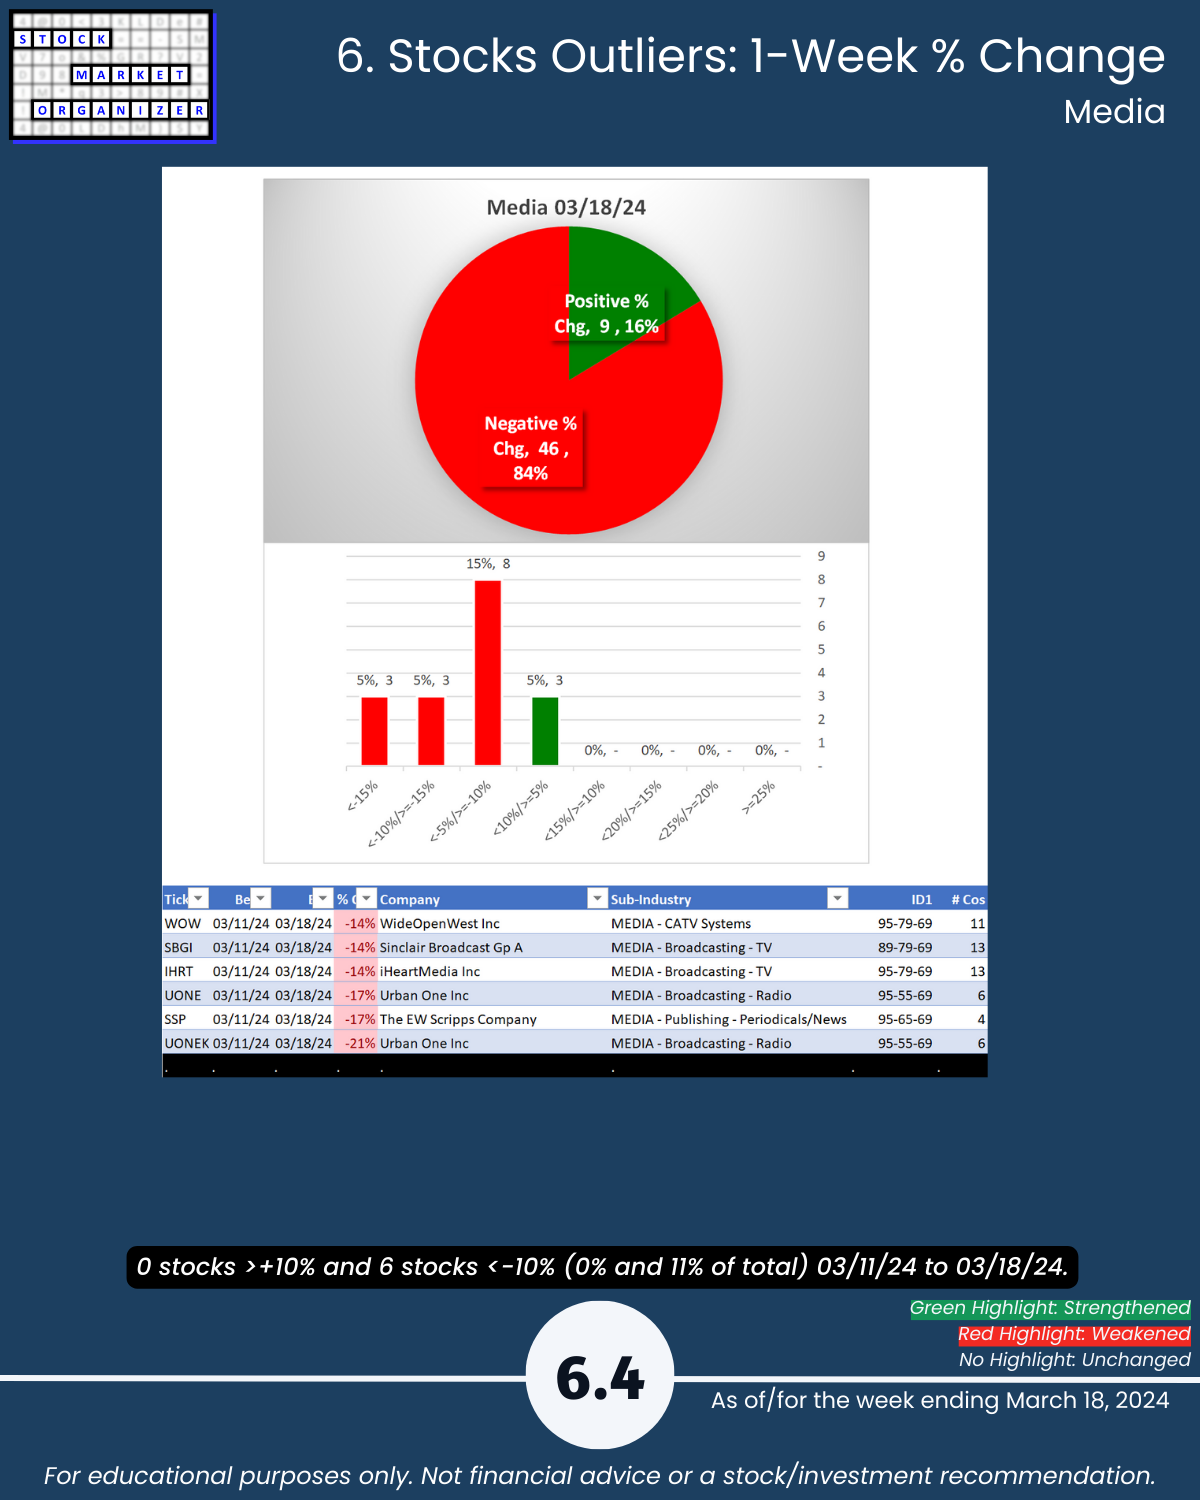
And, there was misery in the Media industry:
🔹 weakened one strength level,
🔹 4/9 sub-industries weakened,
🔹 had 84% negative stocks,
🔹 11% stocks down more than -10%, and
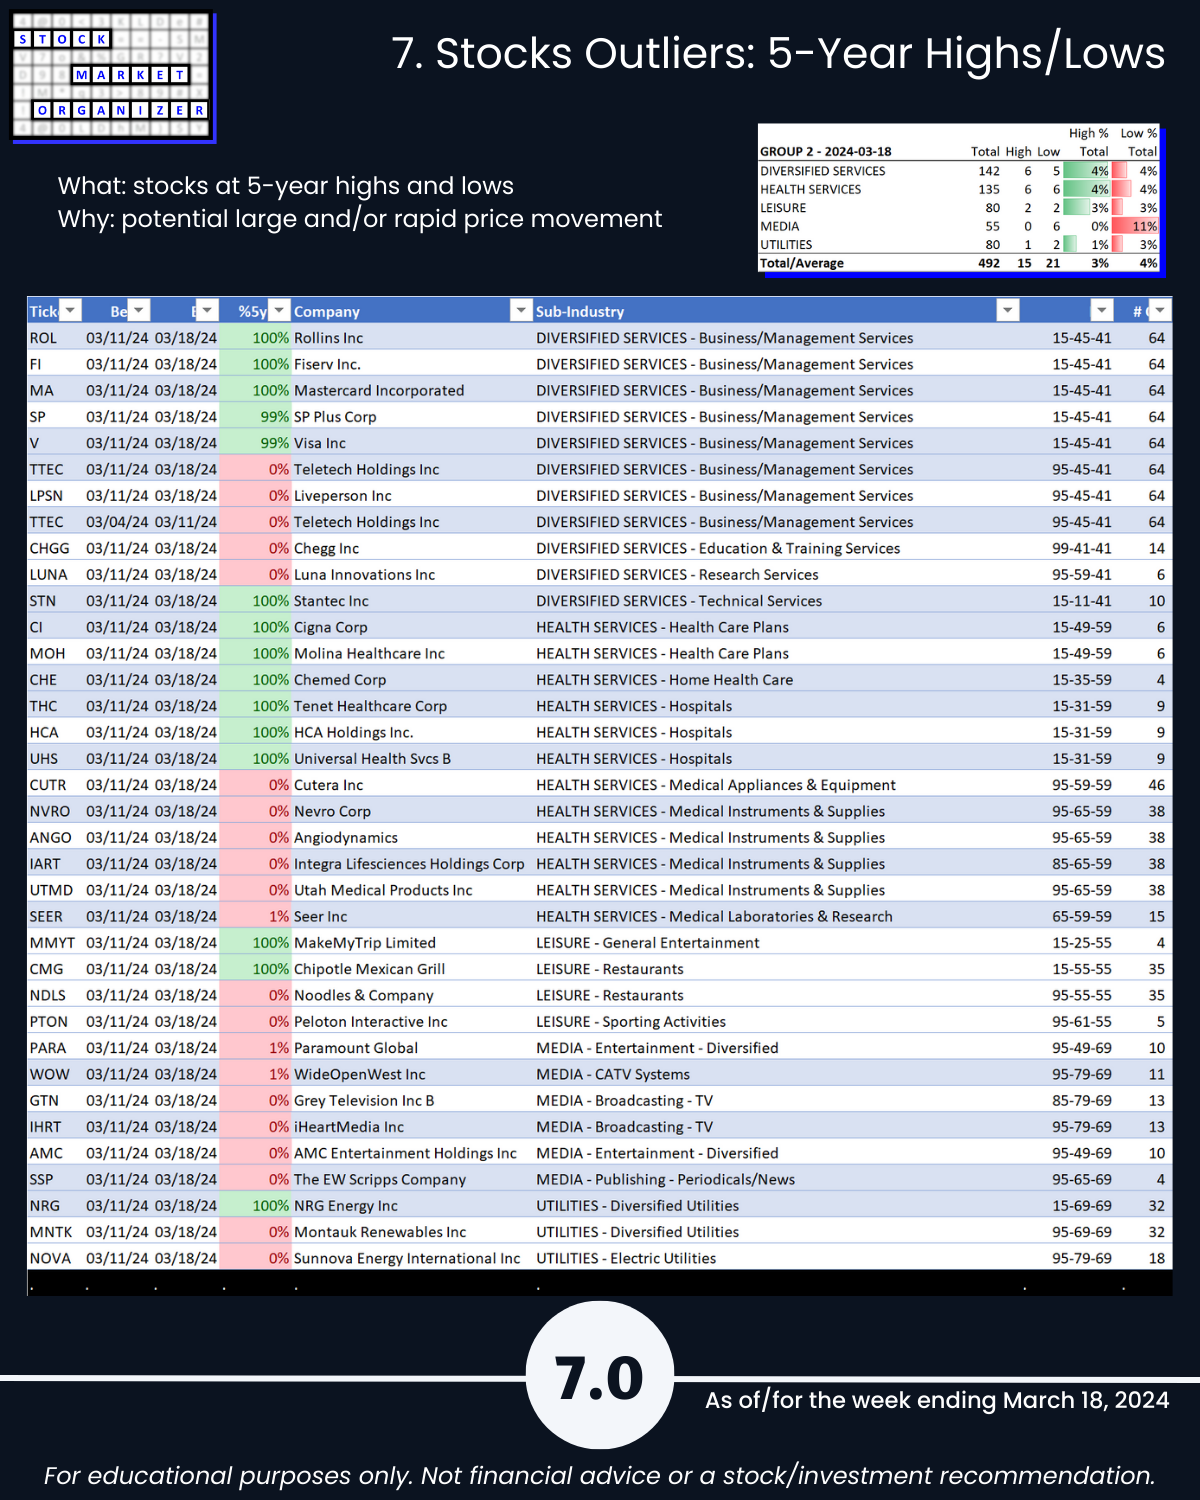
🔹 11% of stocks at 5+ year lows.
Is it mean reversion time for Utilities and Media?
Or will their weakening ways extend into this next week?
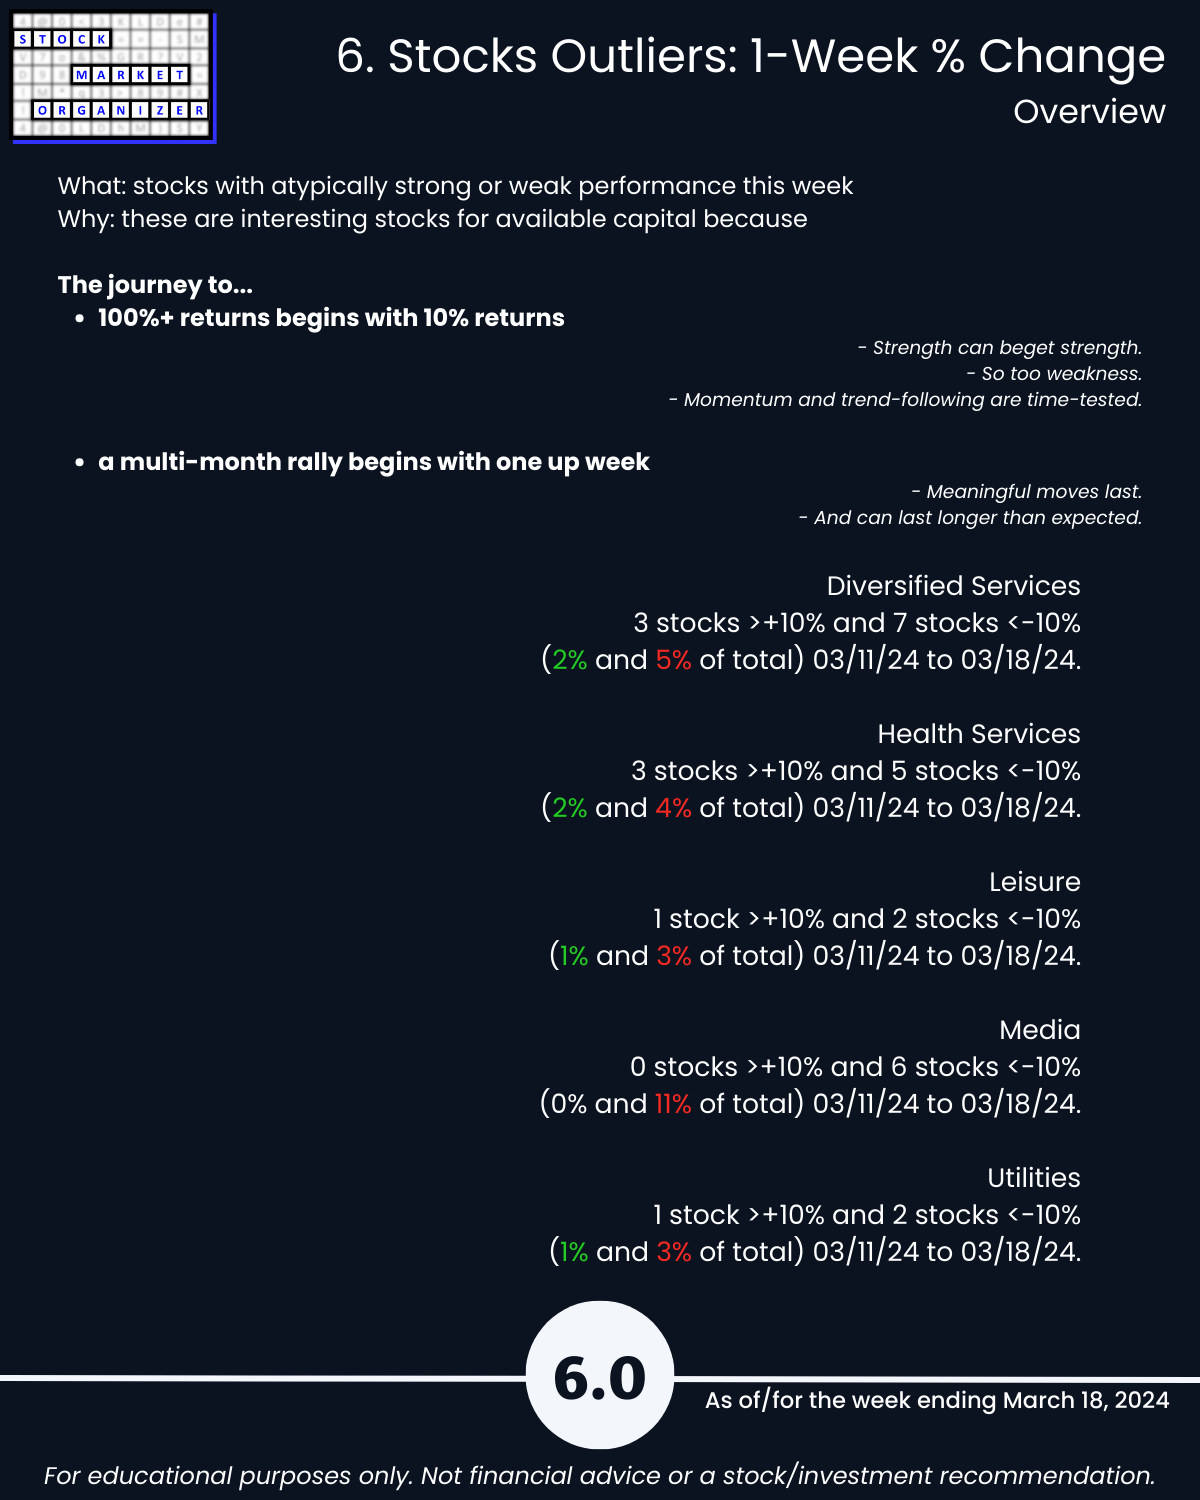
The multi-month rally (decline) begins with one up (down) week.
The journey to 100%+ returns begins with +10% returns.
The market does not have to be so complicated.
If you’re not watching everywhere for strengthening opportunities, how do you know what you are missing?
WHY THIS MATTERS
A 1-year returns comparison, Water Utilities (ranked Weakest of 9 strength levels) and Diversified Services - Technical Services (ranked Strongest), each with 10 stocks:
🔹 Average 1-year return WUtil -22%, TServ +41%
🔹 Range WUtil -38% to +6%, TServ +11% to +81%
🔹 % Positive stocks WUtil 10%, TServ 100%
I’m not saying I’d have known 1 year ago to go long TServ stocks and short WUtil stocks. But anyone paying attention to strengthening/weakening would have automatically noticed what was happening in each sub-industry and acted accordingly. They certainly wouldn’t have held onto a Water Utilities stock that fell 38% in a year.
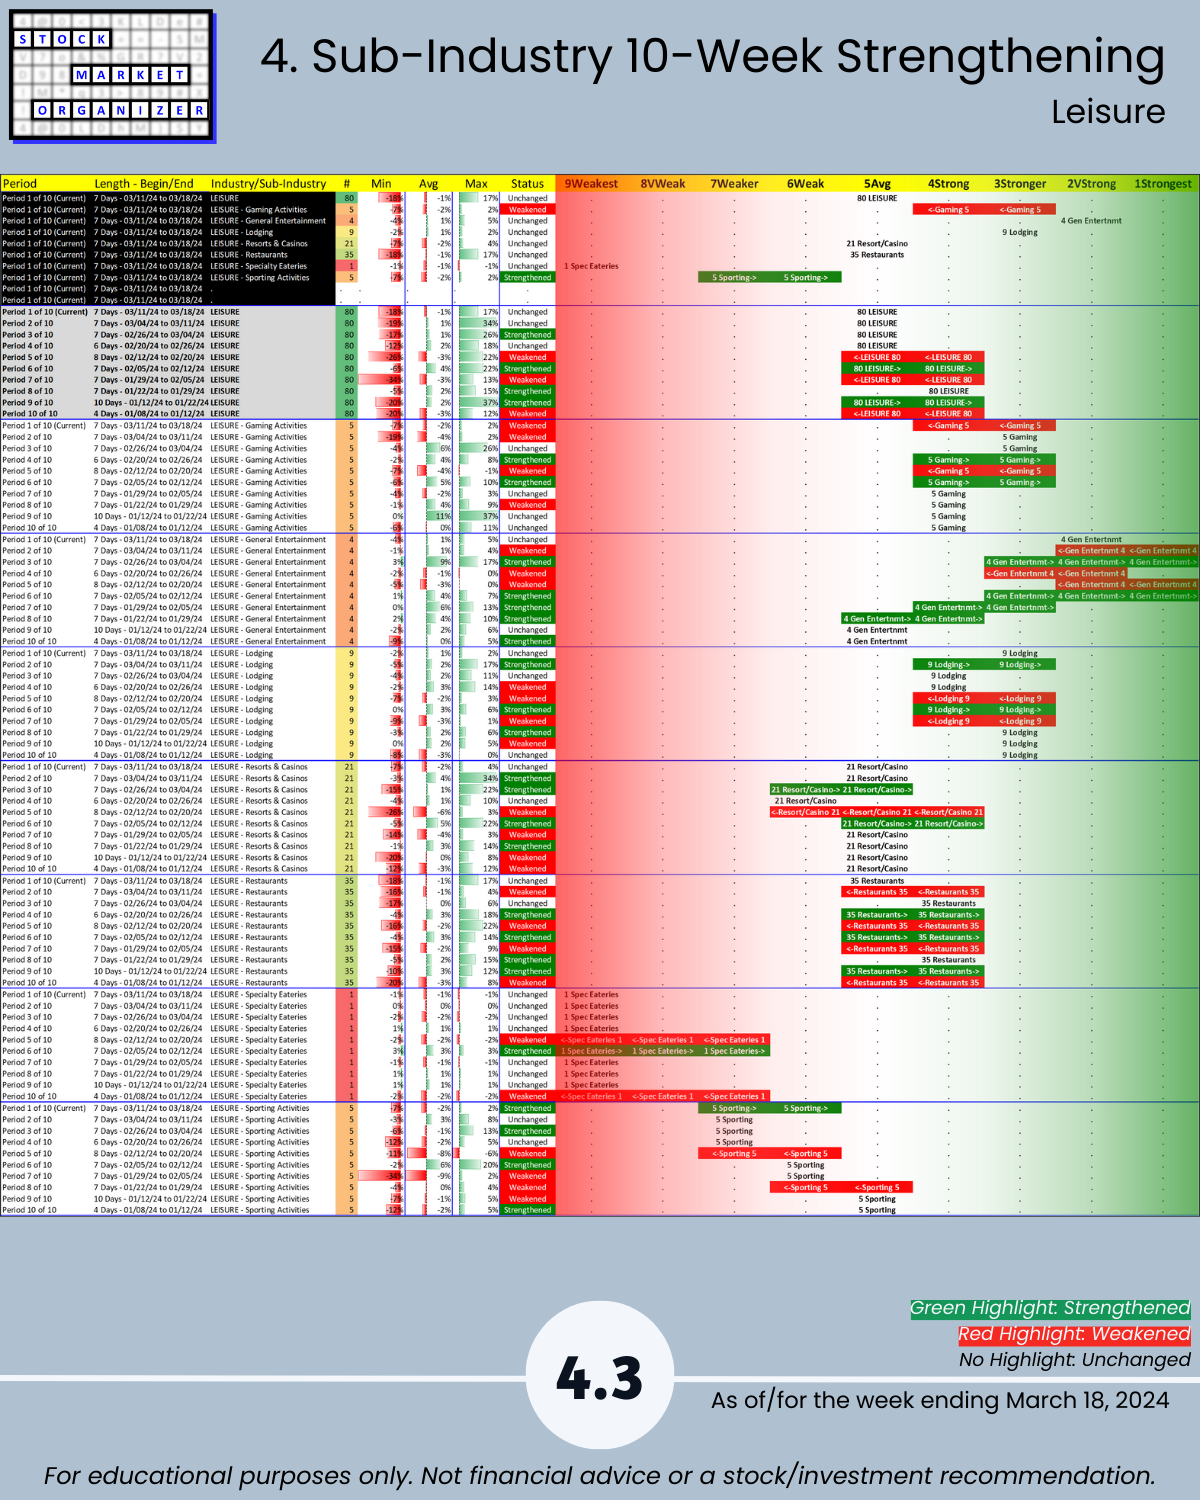
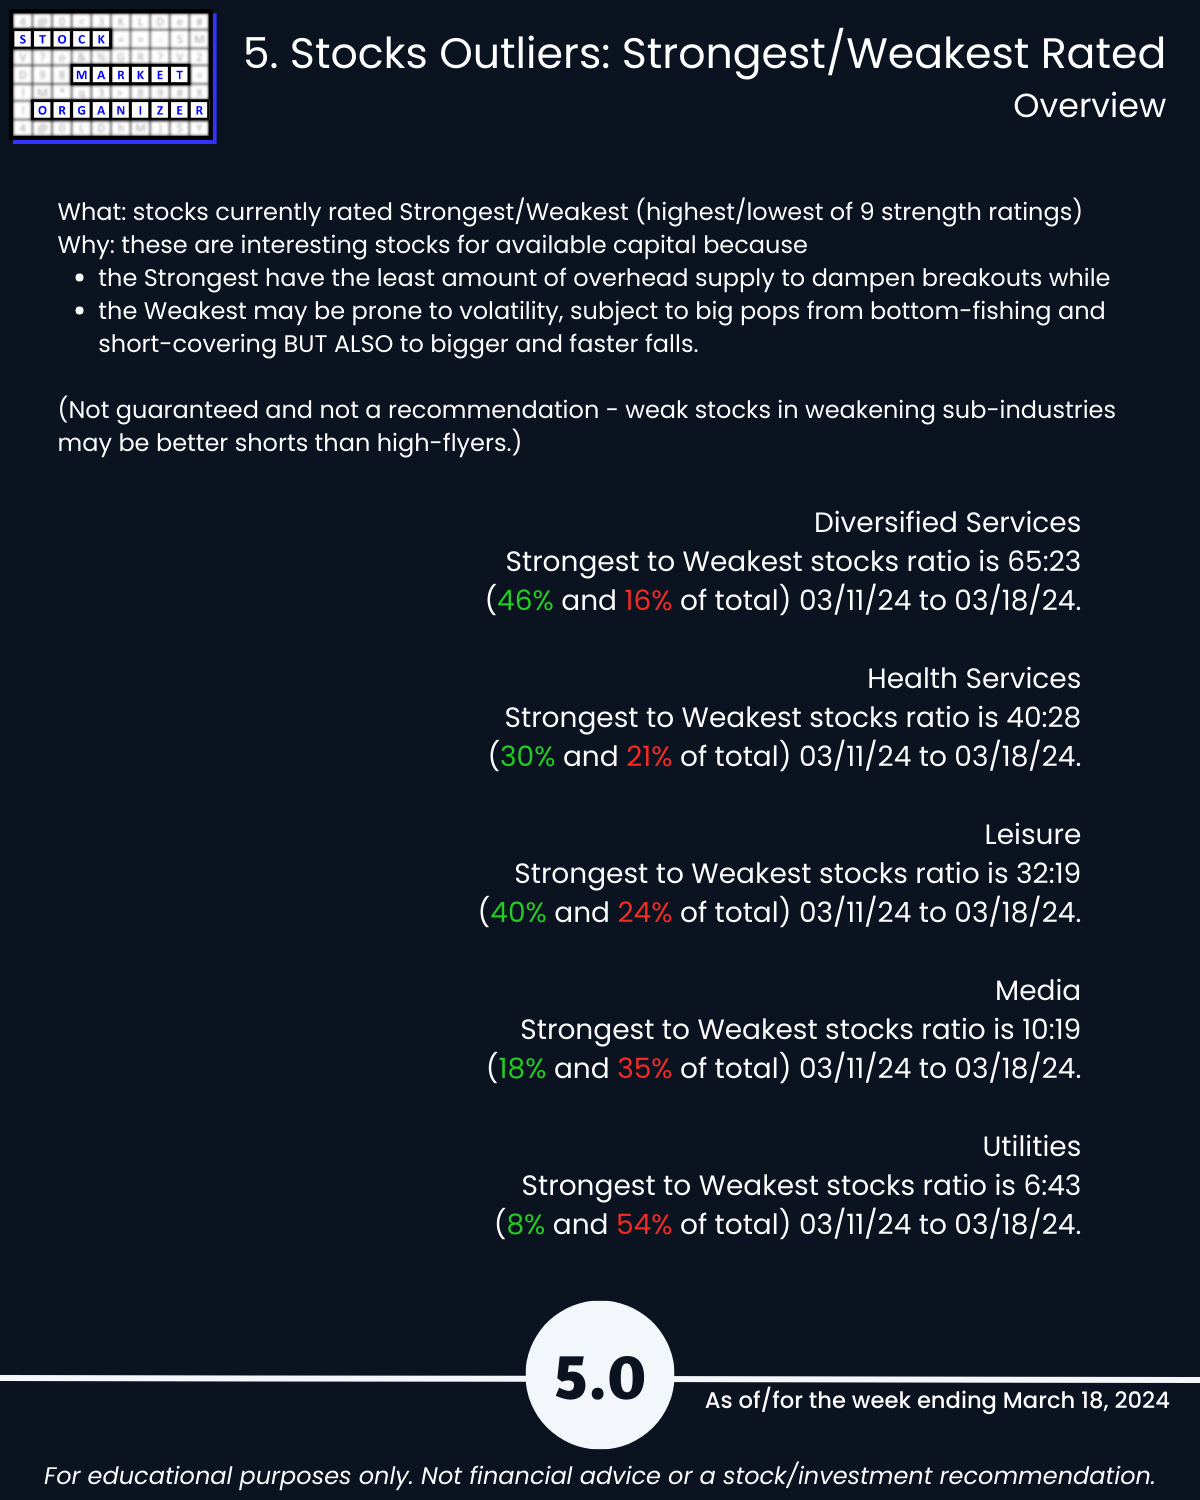
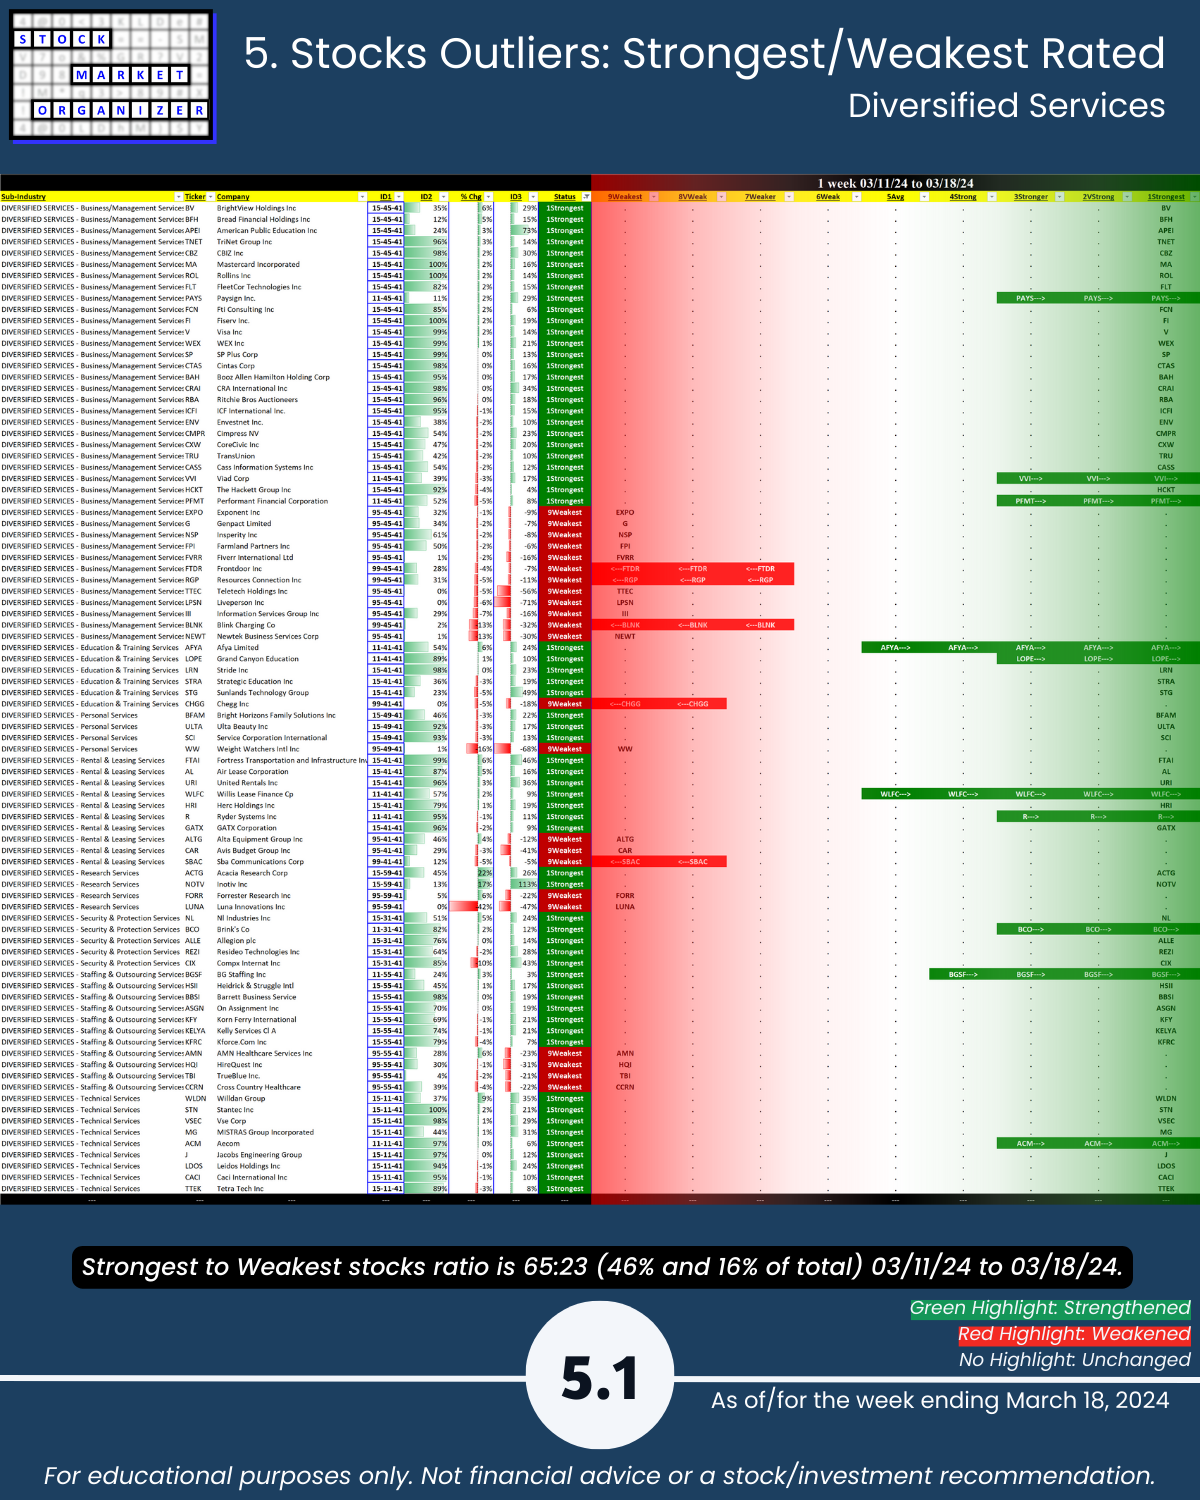
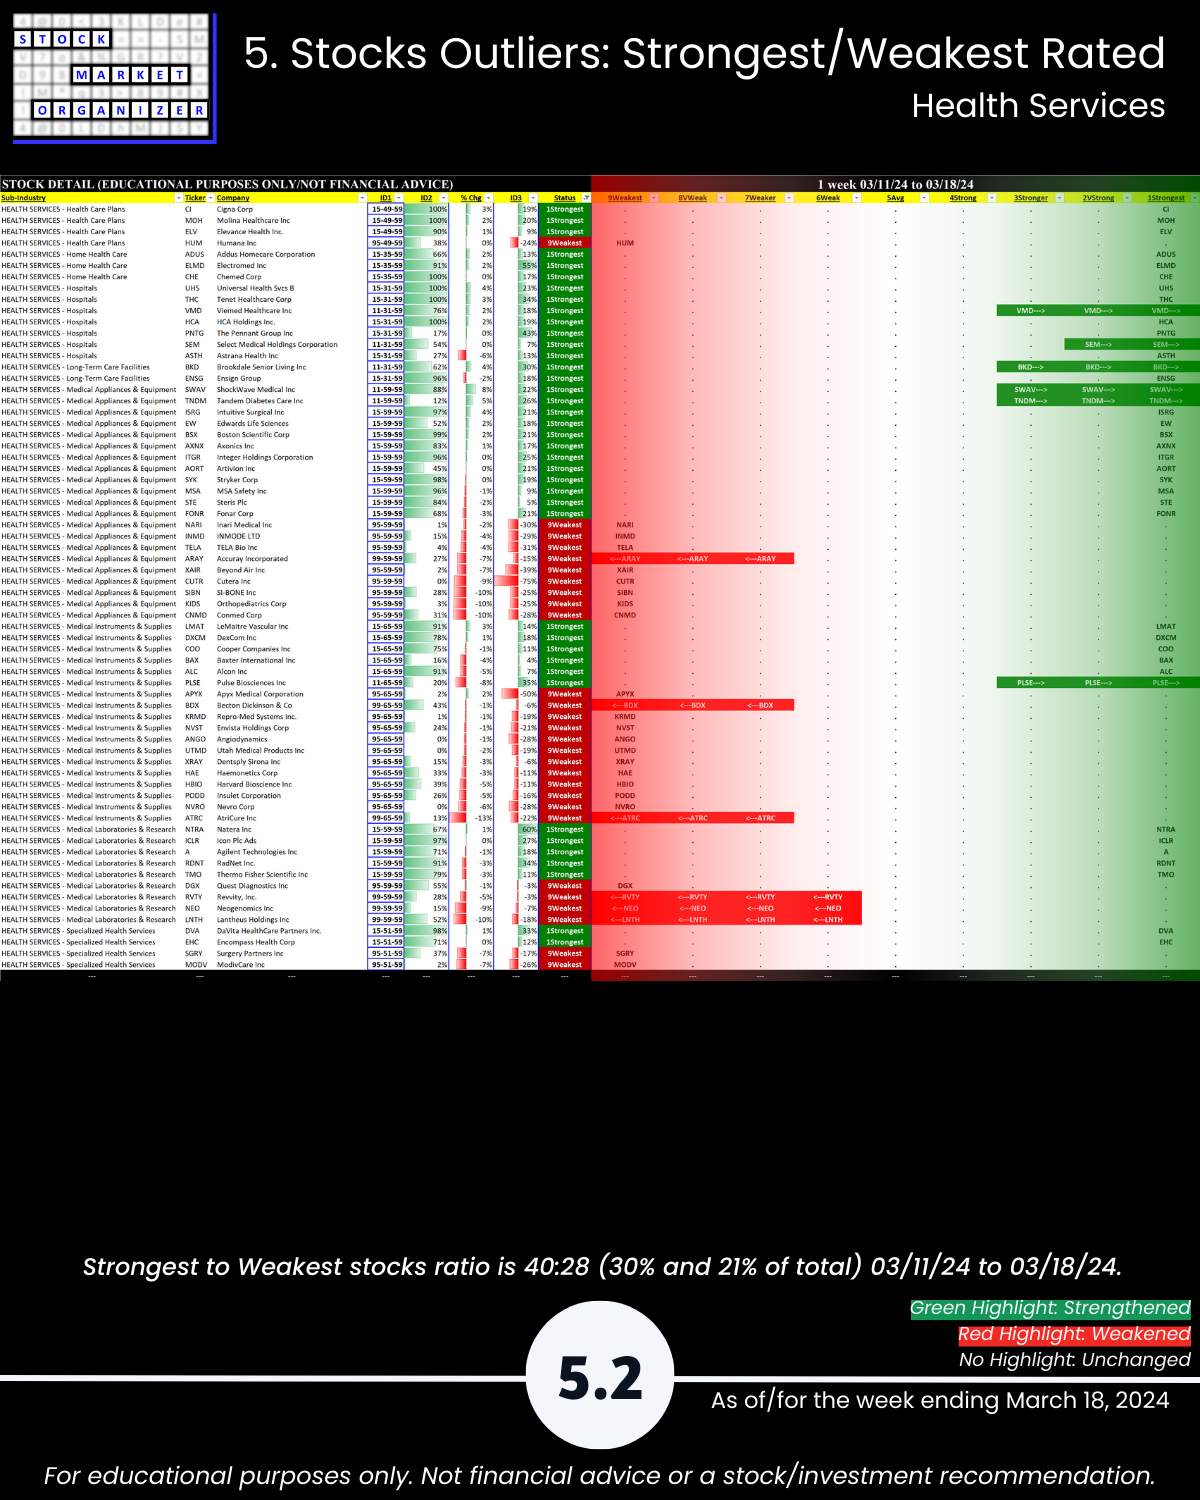
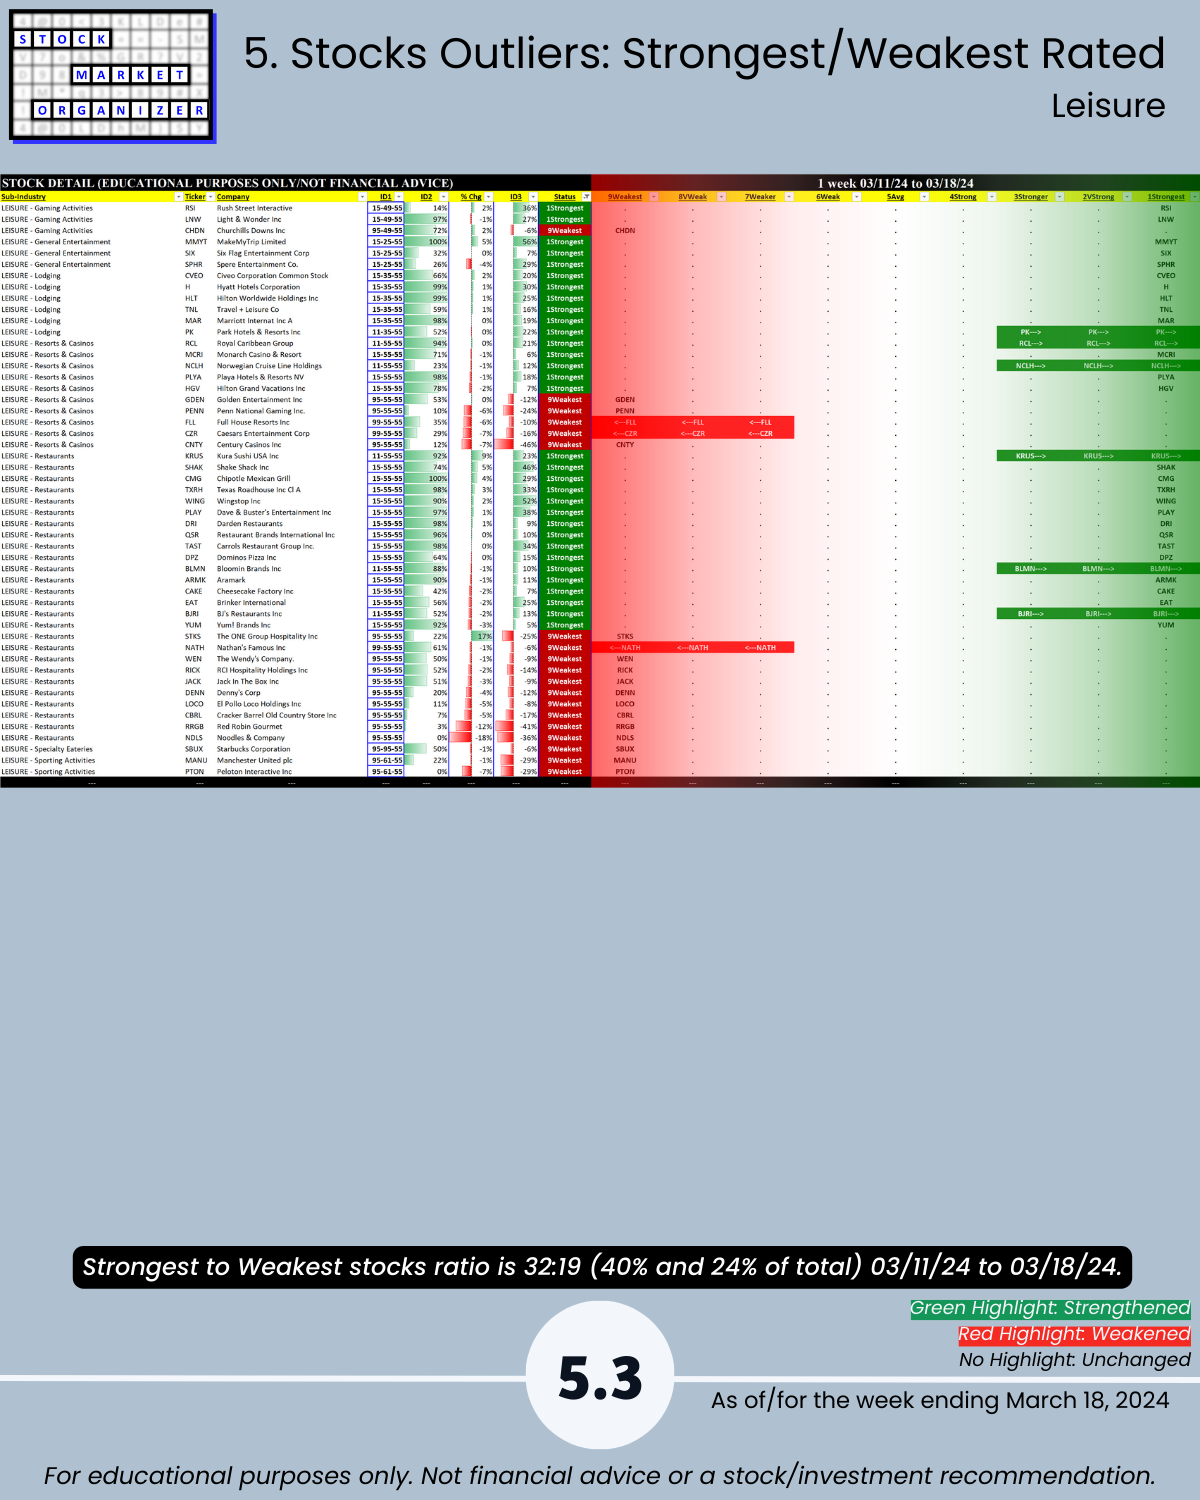
Attached: Strongest- and Weakest-rated Stock Market Organizer stocks and objective strengthening/weakening measurements in the Diversified Services, Health Services, Leisure, Media, and Utilities industries.
Takeaways:
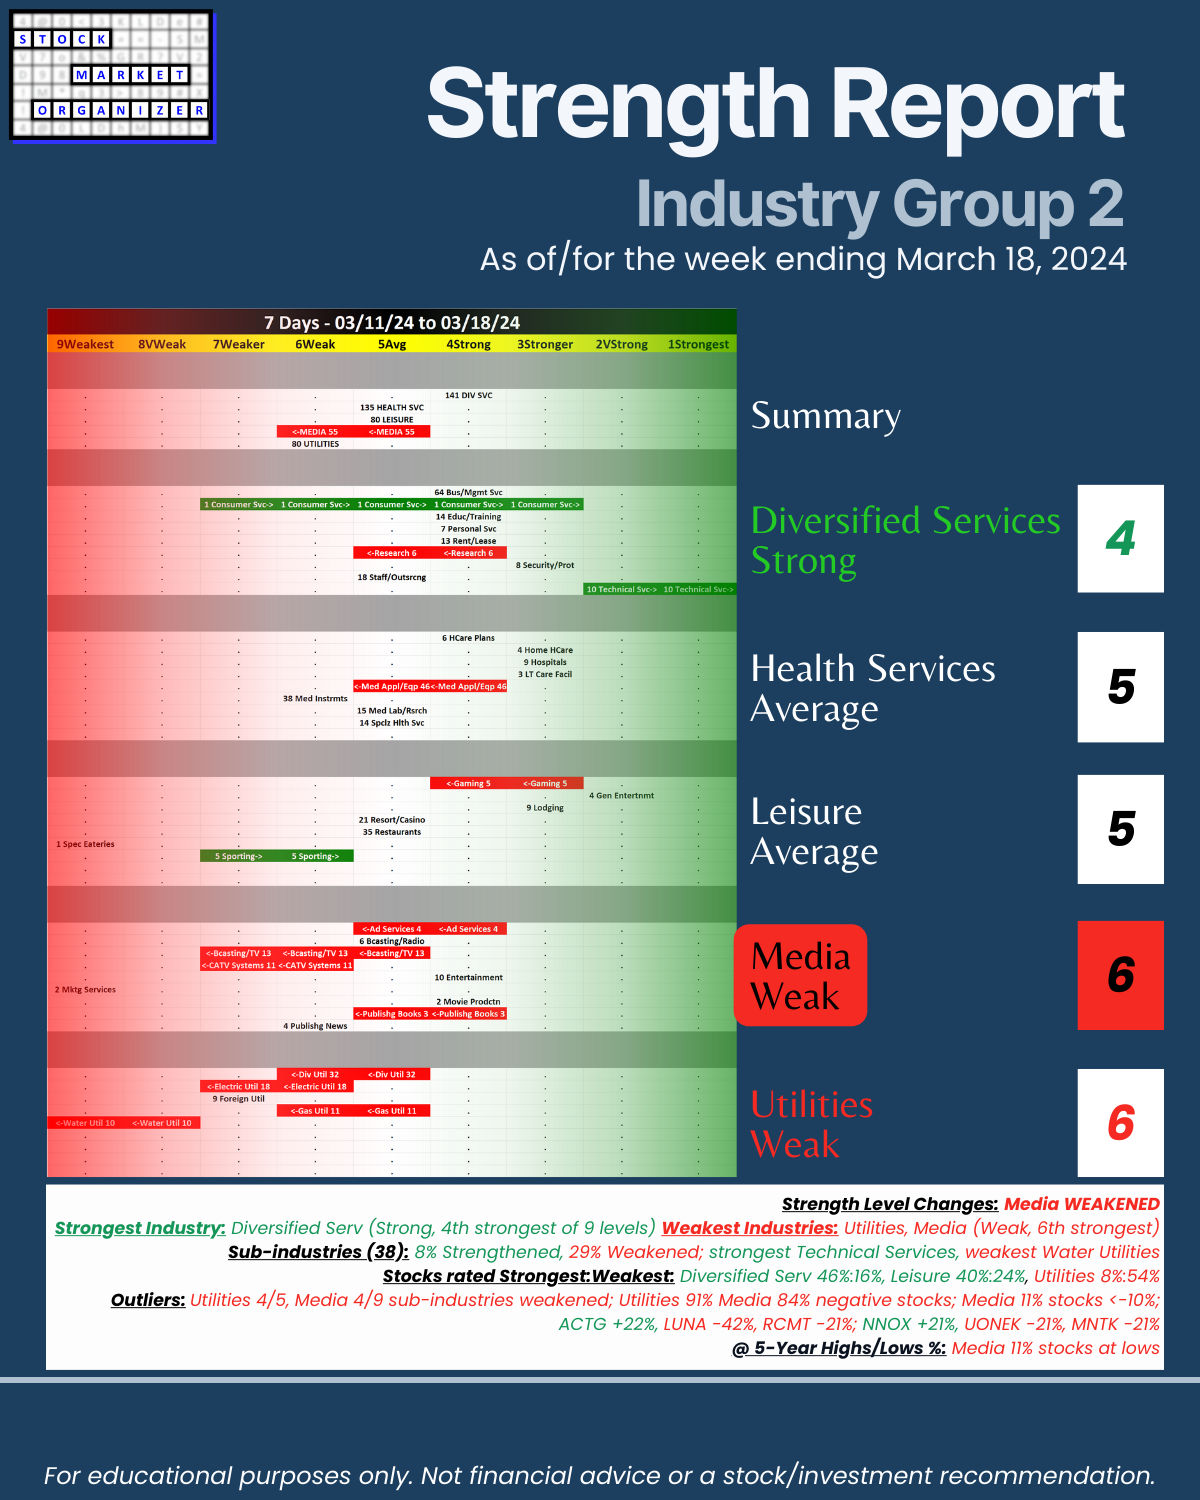
🔹 Strength Level Changes: Media WEAKENED
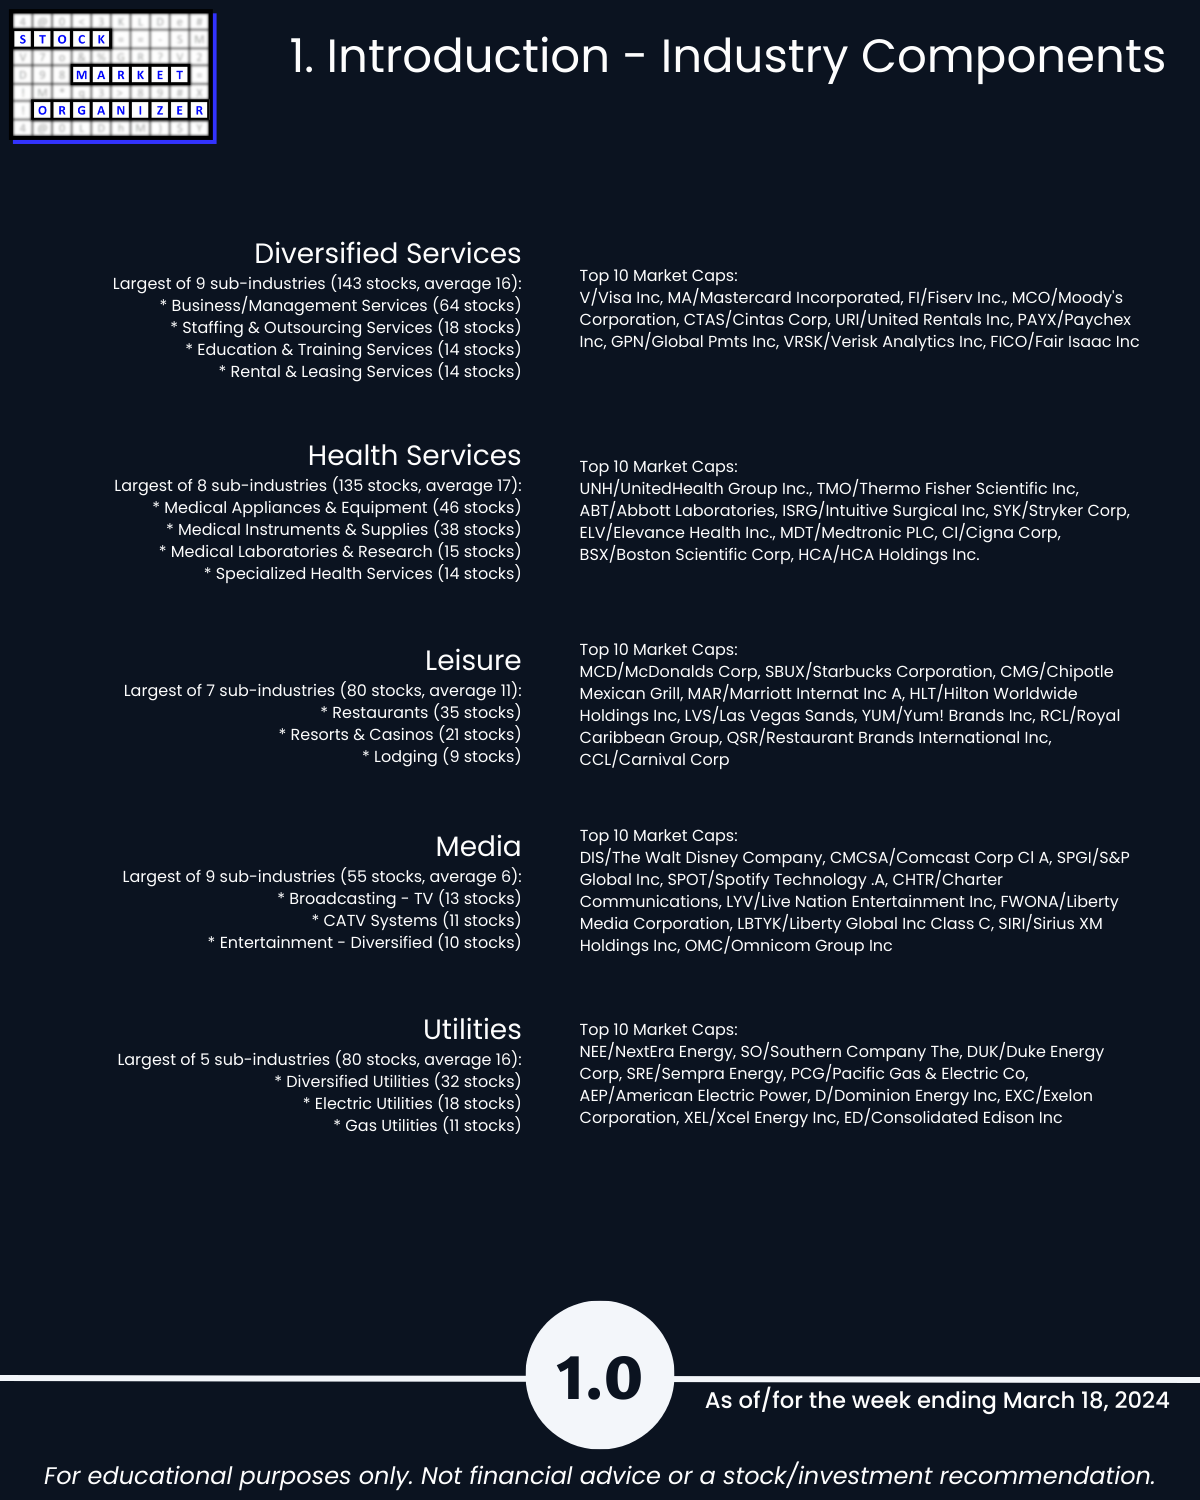
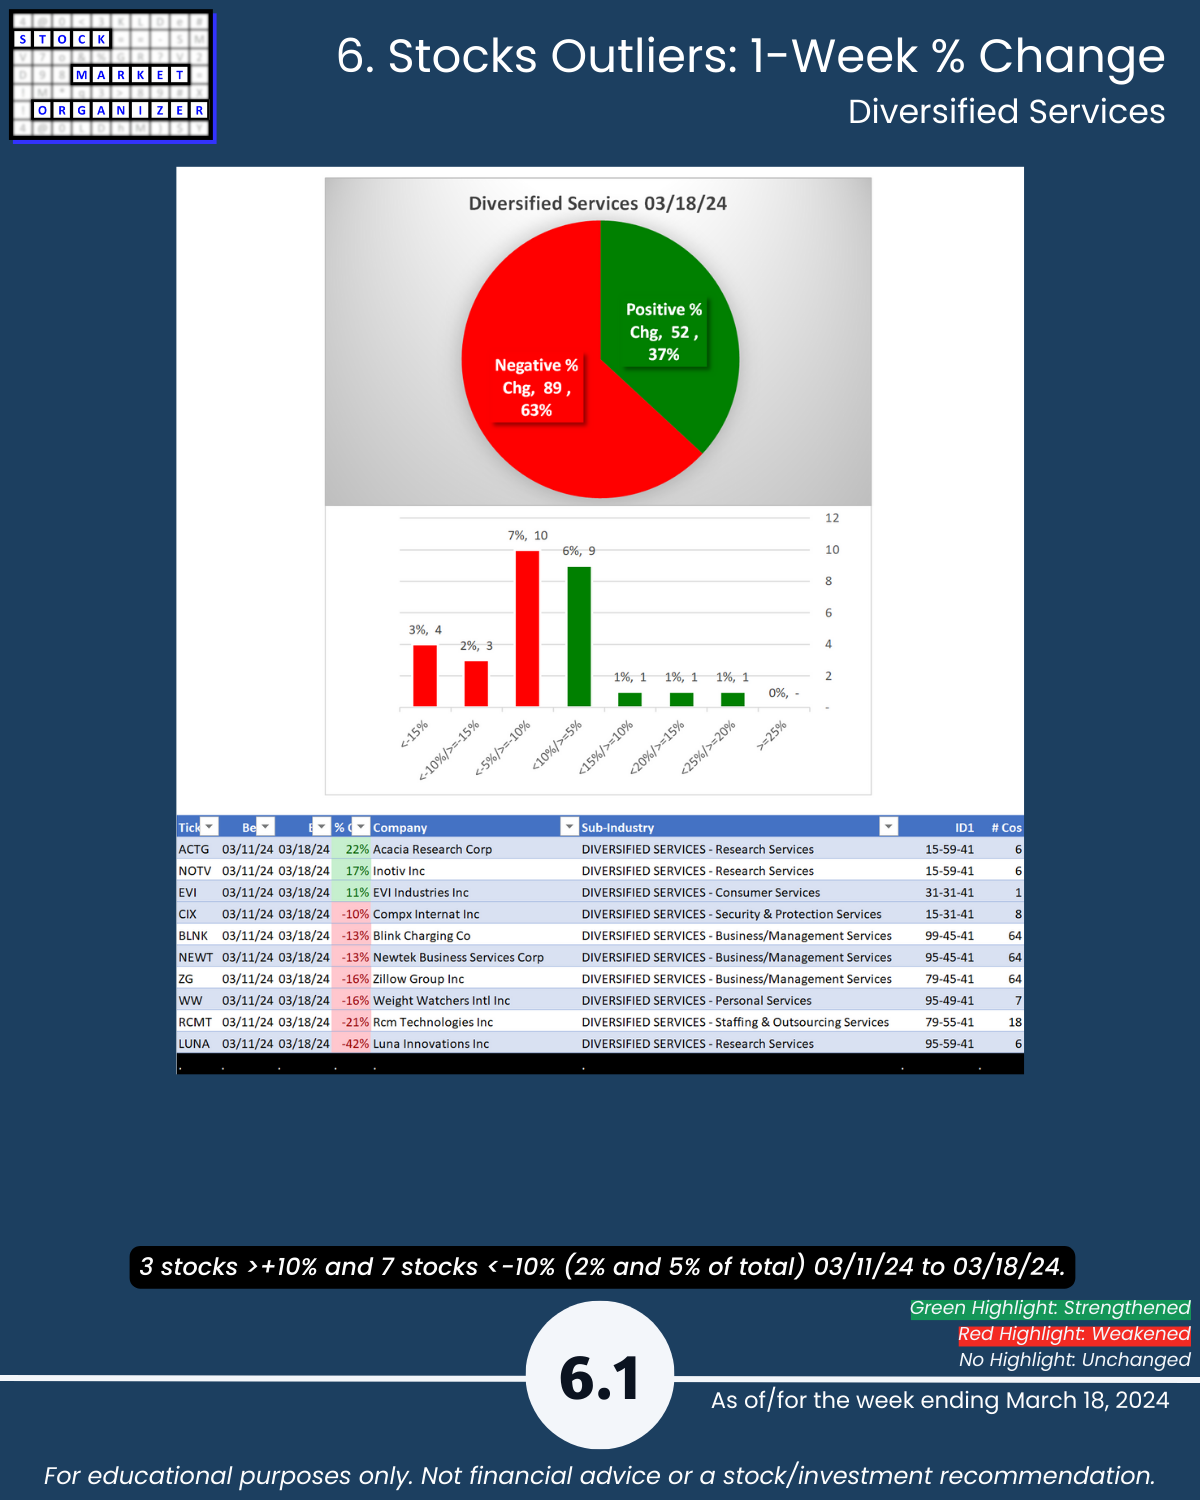
🔹 Strongest Industry: Diversified Serv (Strong, 4th strongest of 9 levels)
🔹 Weakest Industries: Utilities, Media (Weak, 6th strongest)
🔹 Sub-industries (38): 8% Strengthened, 29% Weakened; strongest Technical Services, weakest Water Utilities
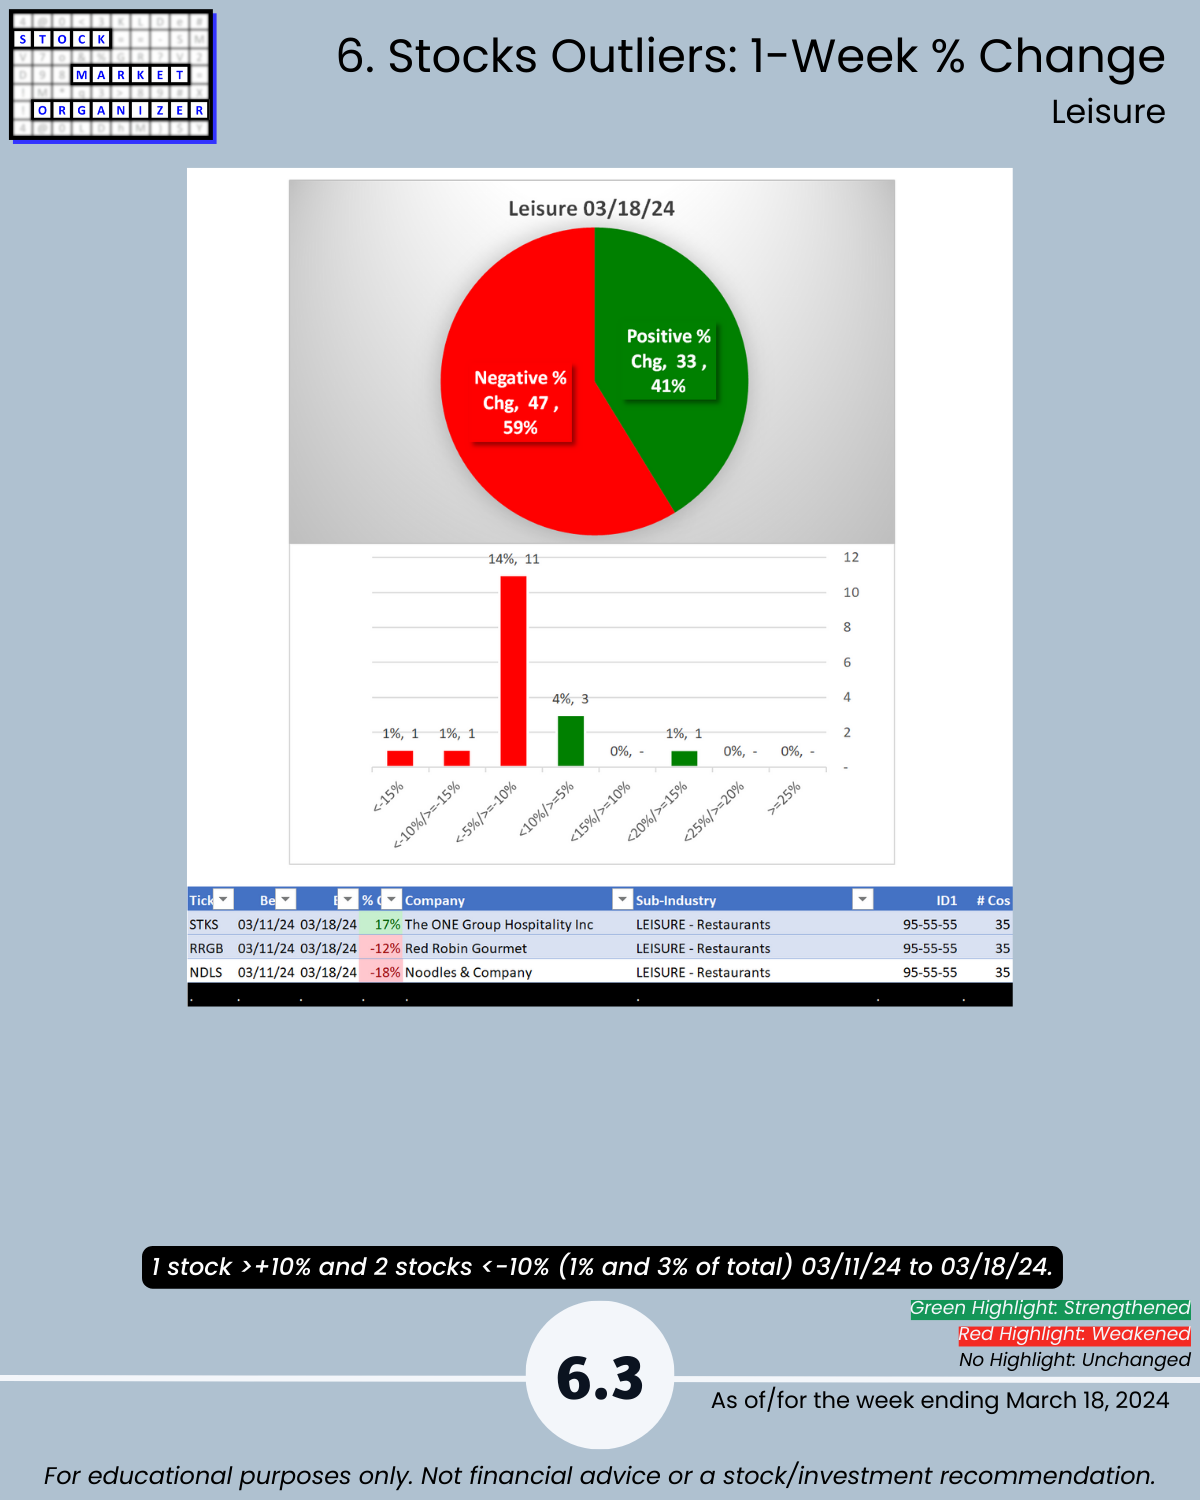
🔹 Stocks rated Strongest:Weakest: Diversified Serv 46%:16%, Leisure 40%:24%, Utilities 8%:54%
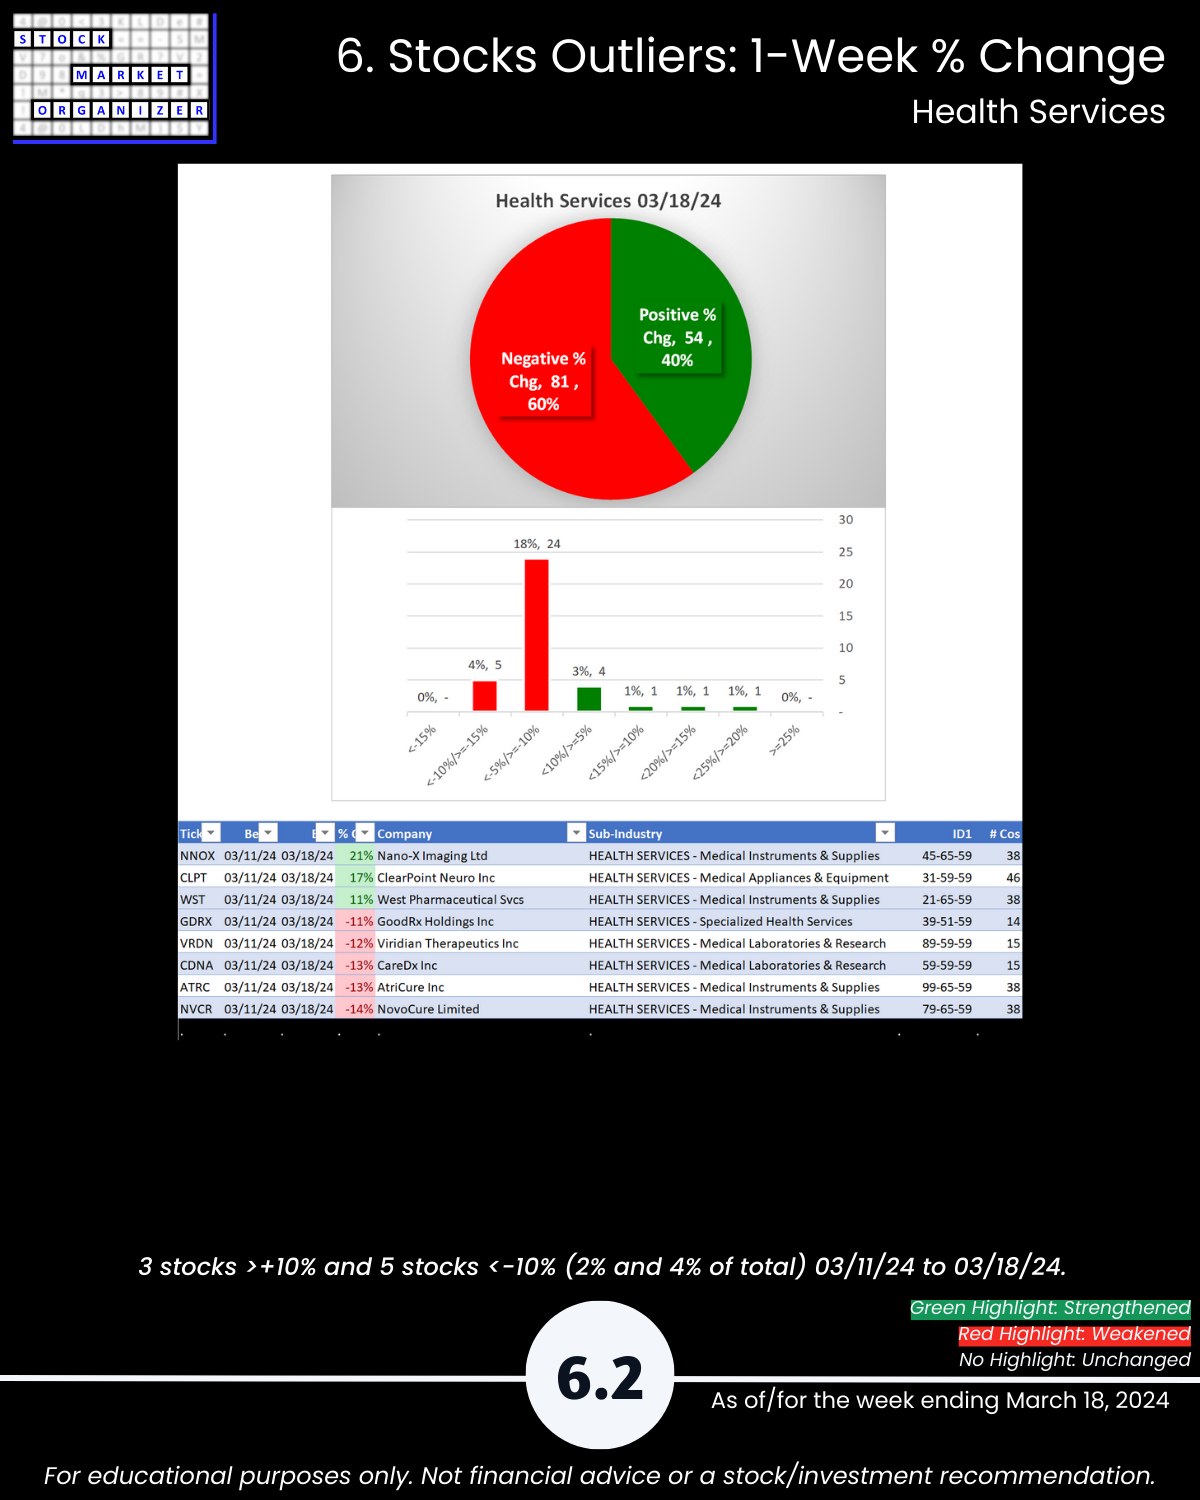
🔹 Outliers: Utilities 4/5, Media 4/9 sub-industries weakened; Utilities 91% Media 84% negative stocks; Media 11% stocks <-10%; ACTG +22%, LUNA -42%, RCMT -21%; NNOX +21%, UONEK -21%, MNTK -21%
🔹 @ 5-Year Highs/Lows %: Media 11% stocks at lows
This report may particularly be of interest if the following 5 concepts resonate with you:
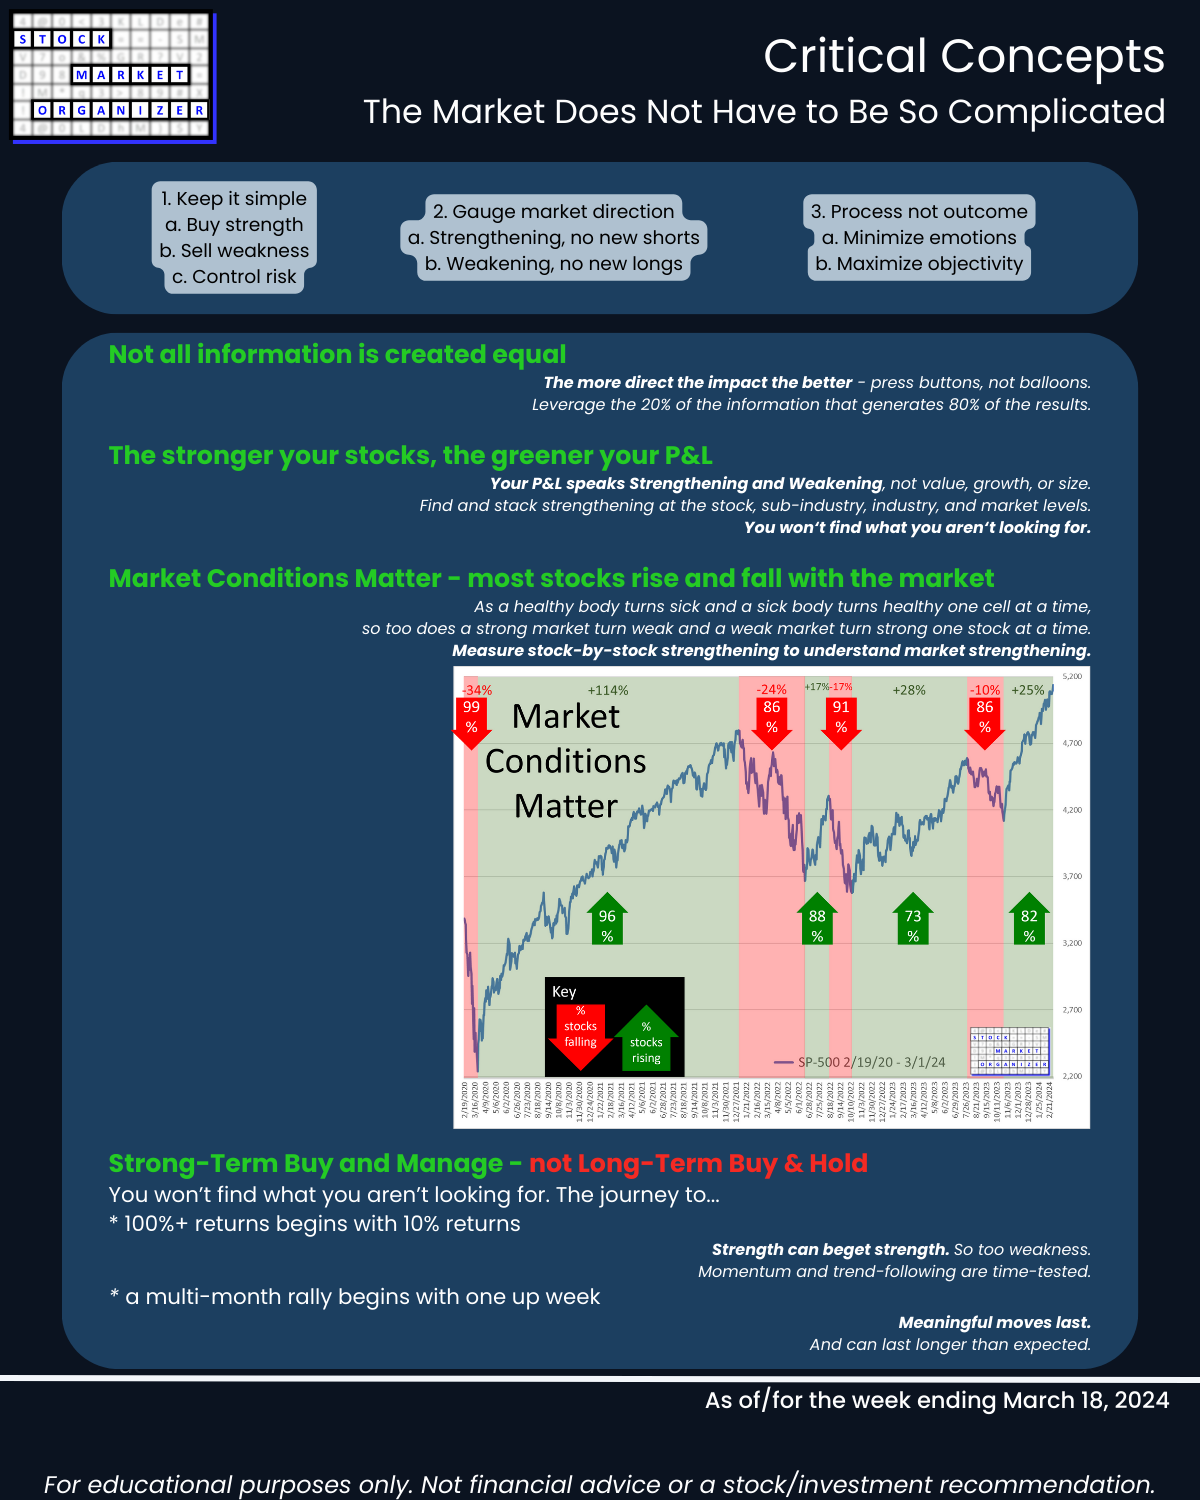
- The stronger your stocks, the greener your P&L.
- The journey to 100%+ returns begins with 10% returns.
- The journey to a multi-month rally begins with one up week.
- Most stocks do what the market does. (While the market can only do what its underlying stocks, sub-industries, and industries do.)
- 80/20: not all information is created equal. (Press buttons, not balloons.)
Following are galleries with page-by-page views of this report.
1. Introduction
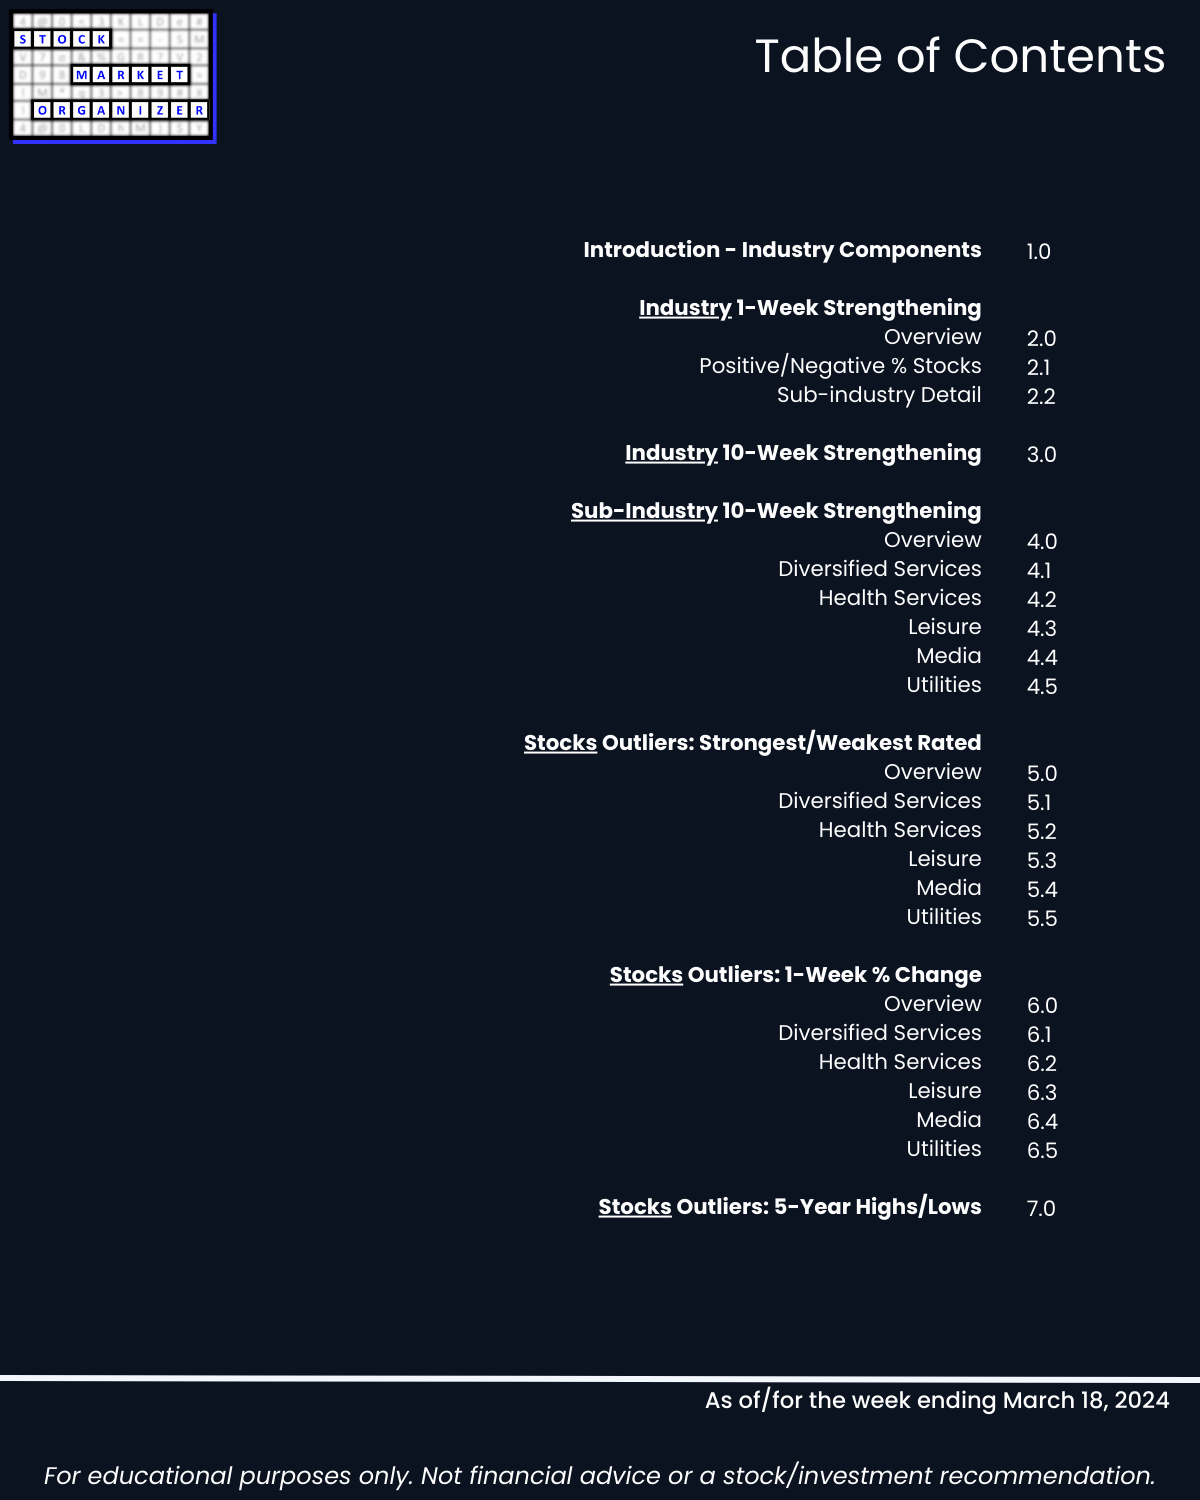
2. Industry 1-Week Strengthening
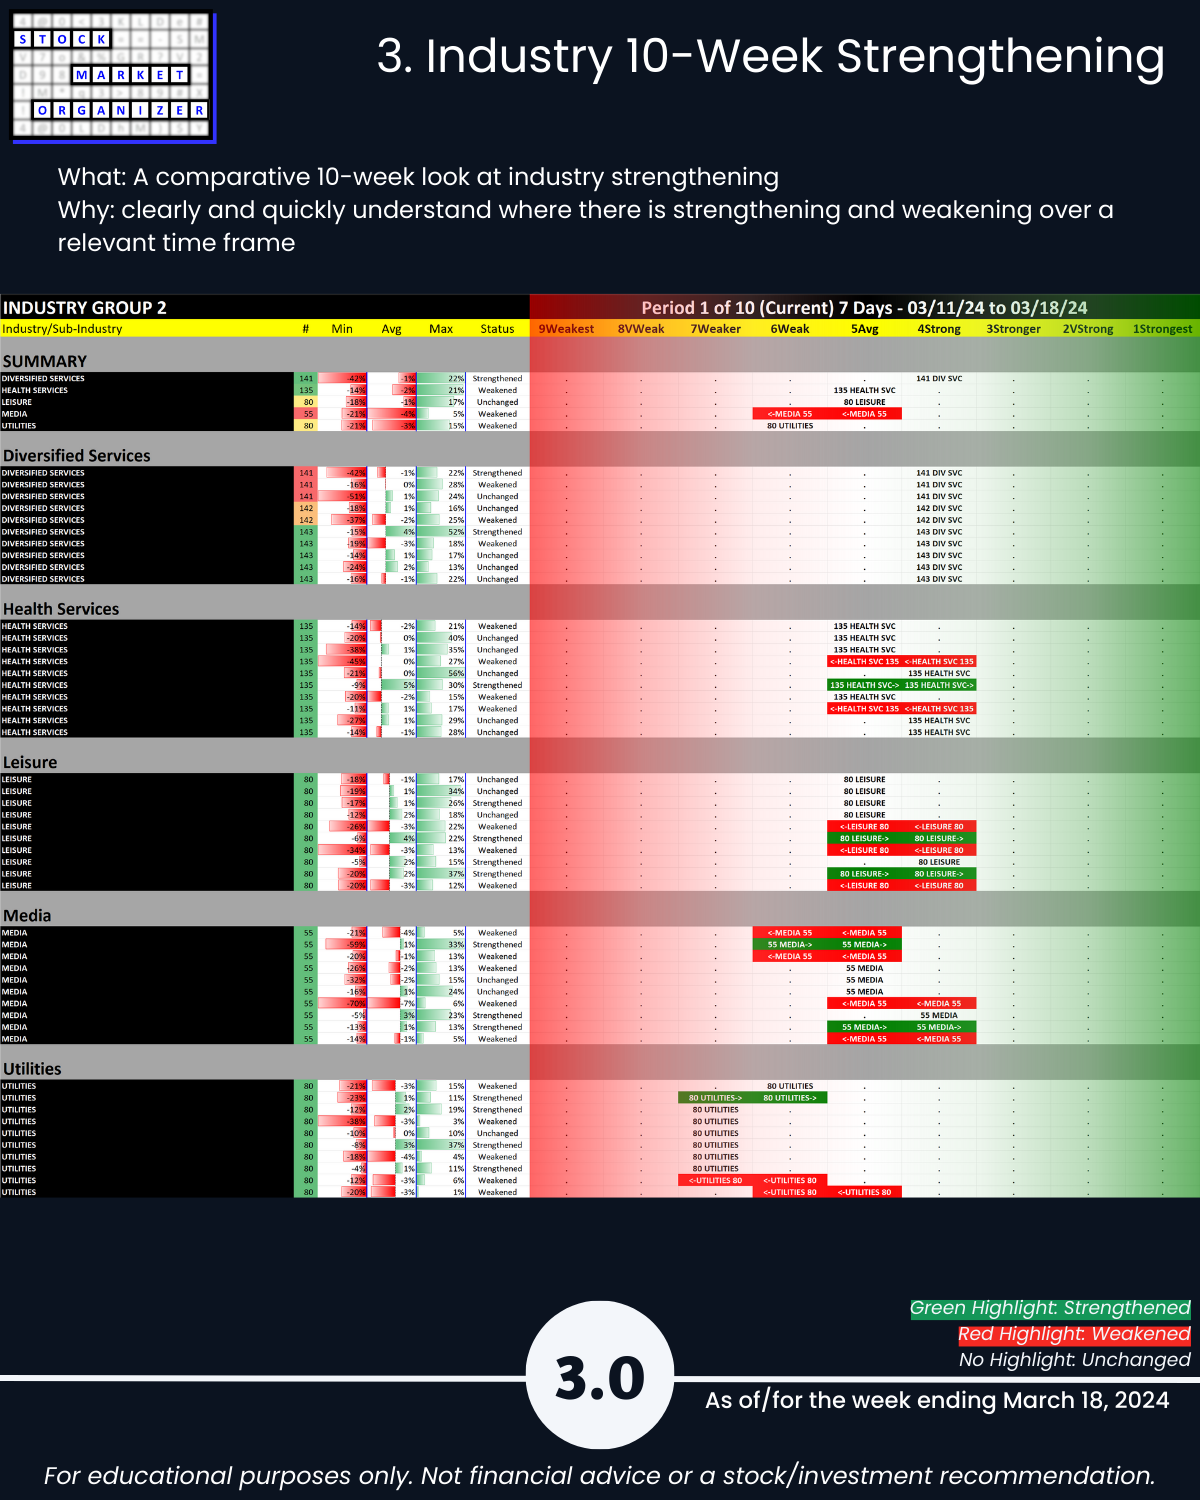
3. Industry 10-Week Strengthening
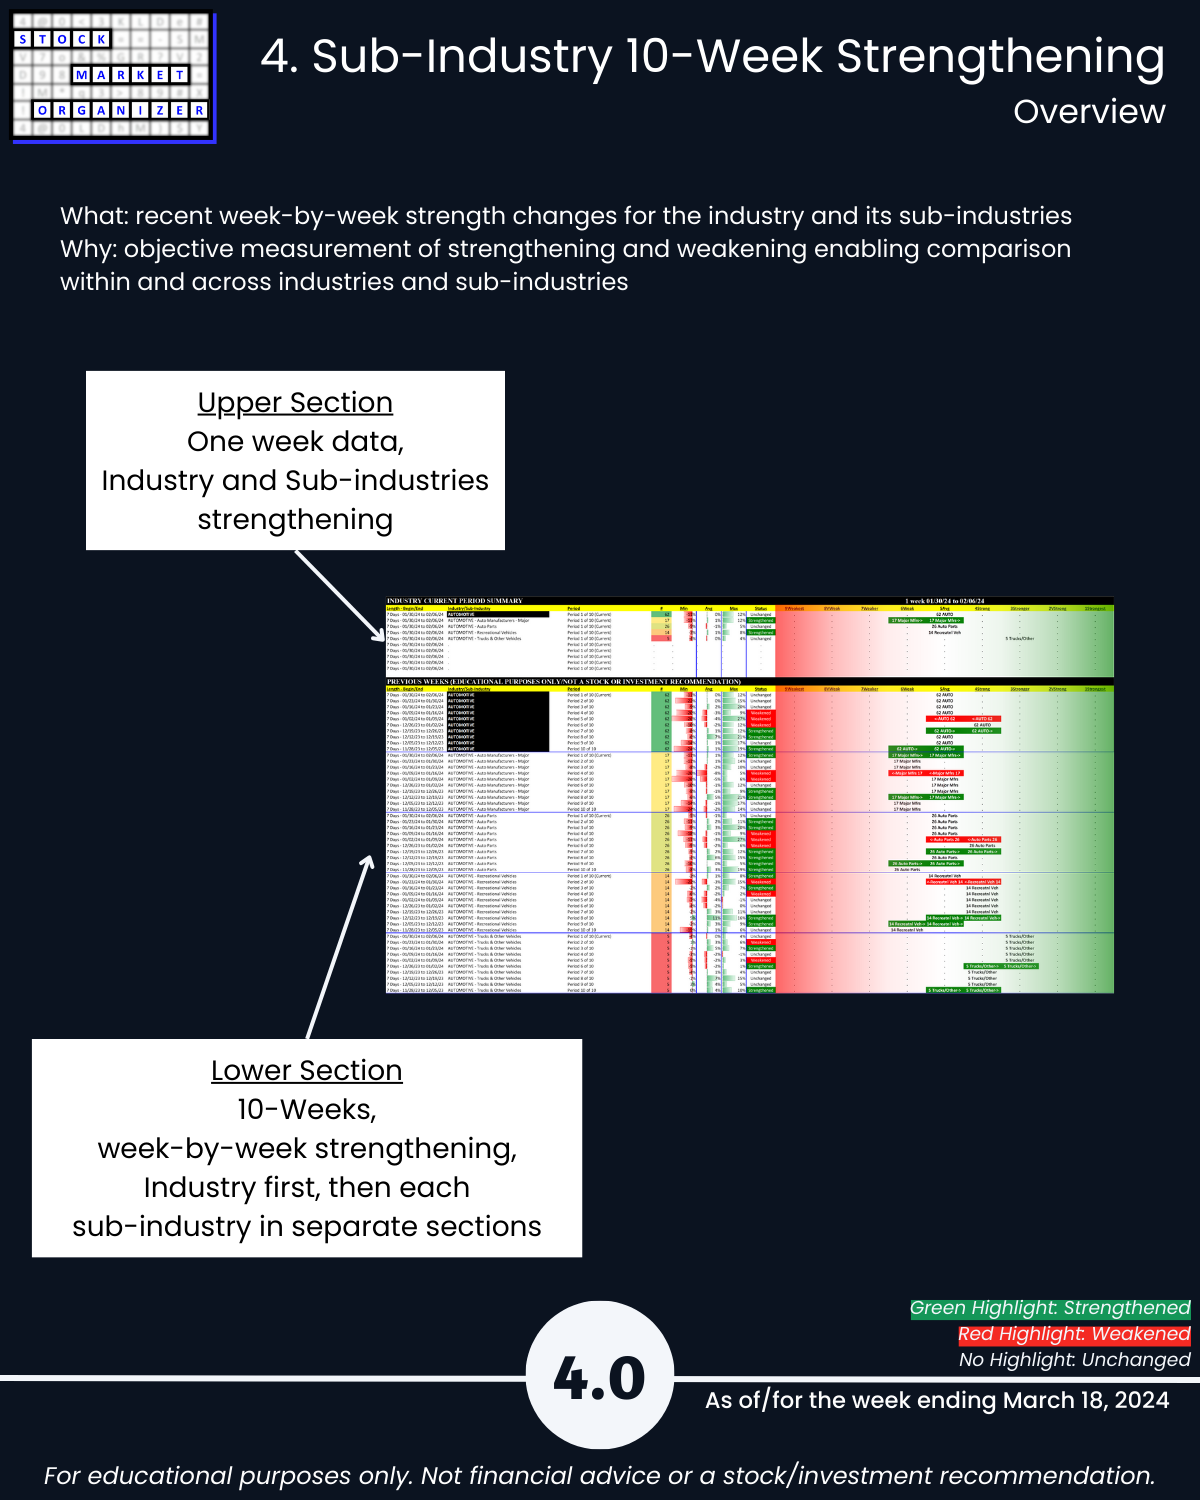
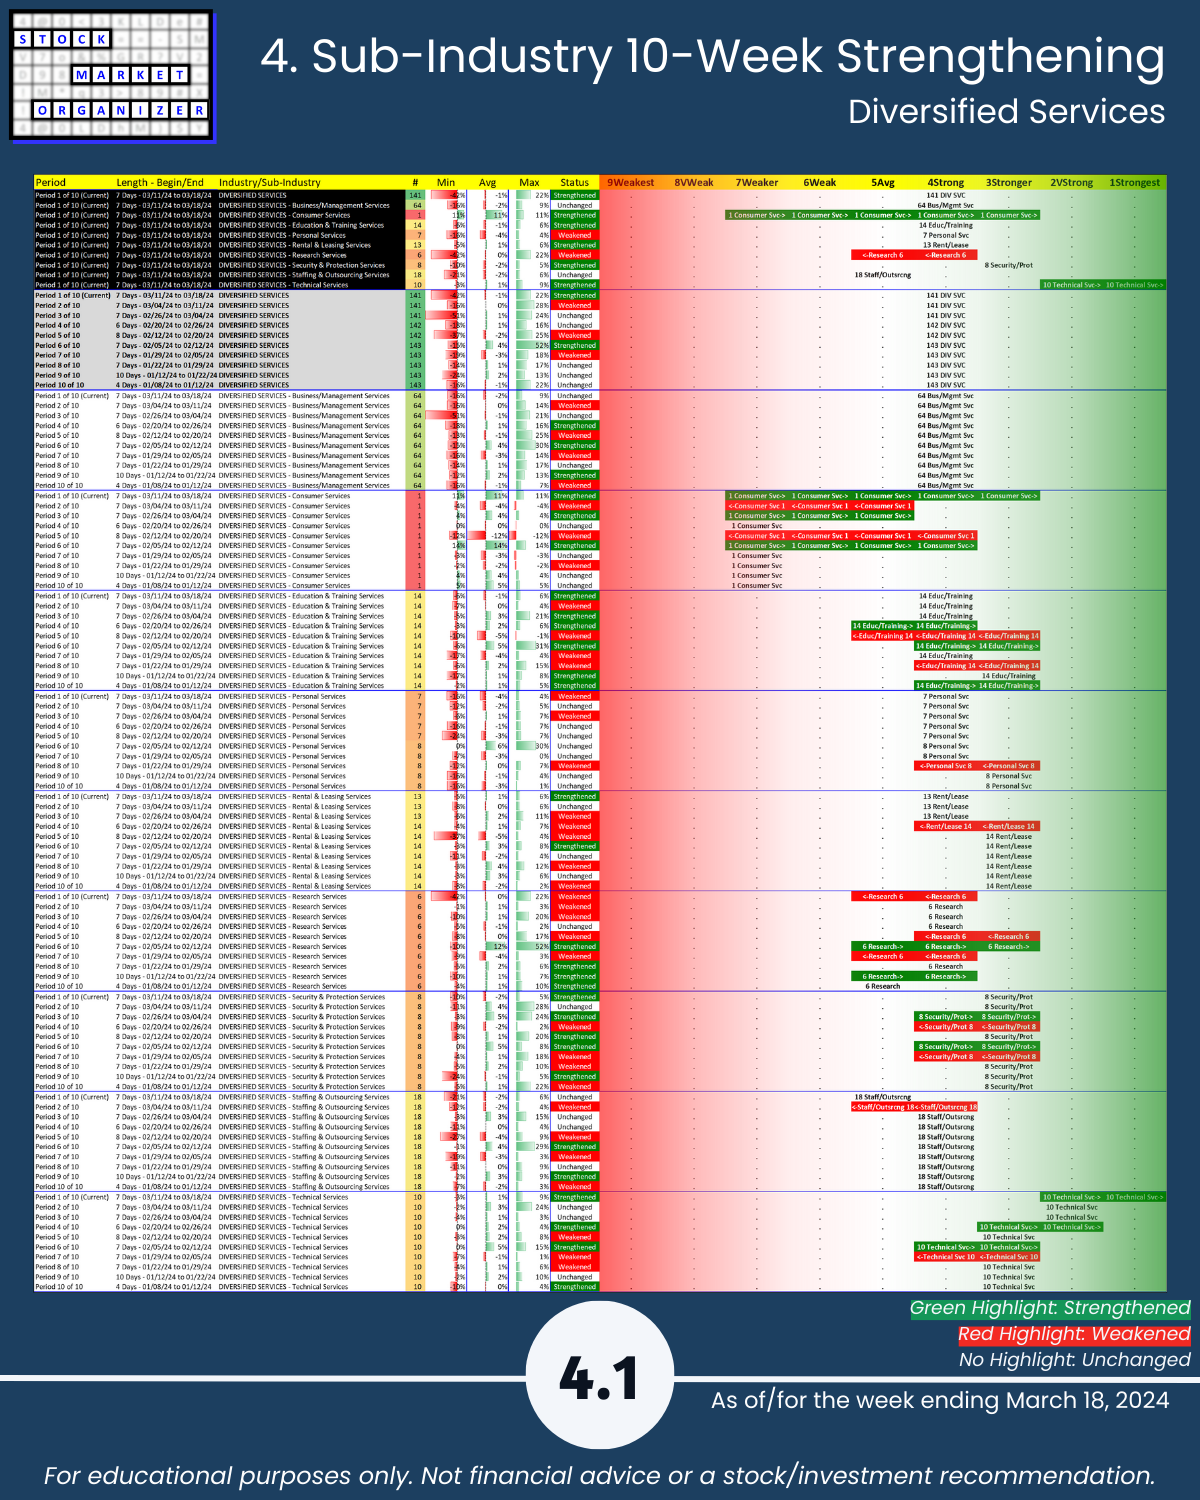
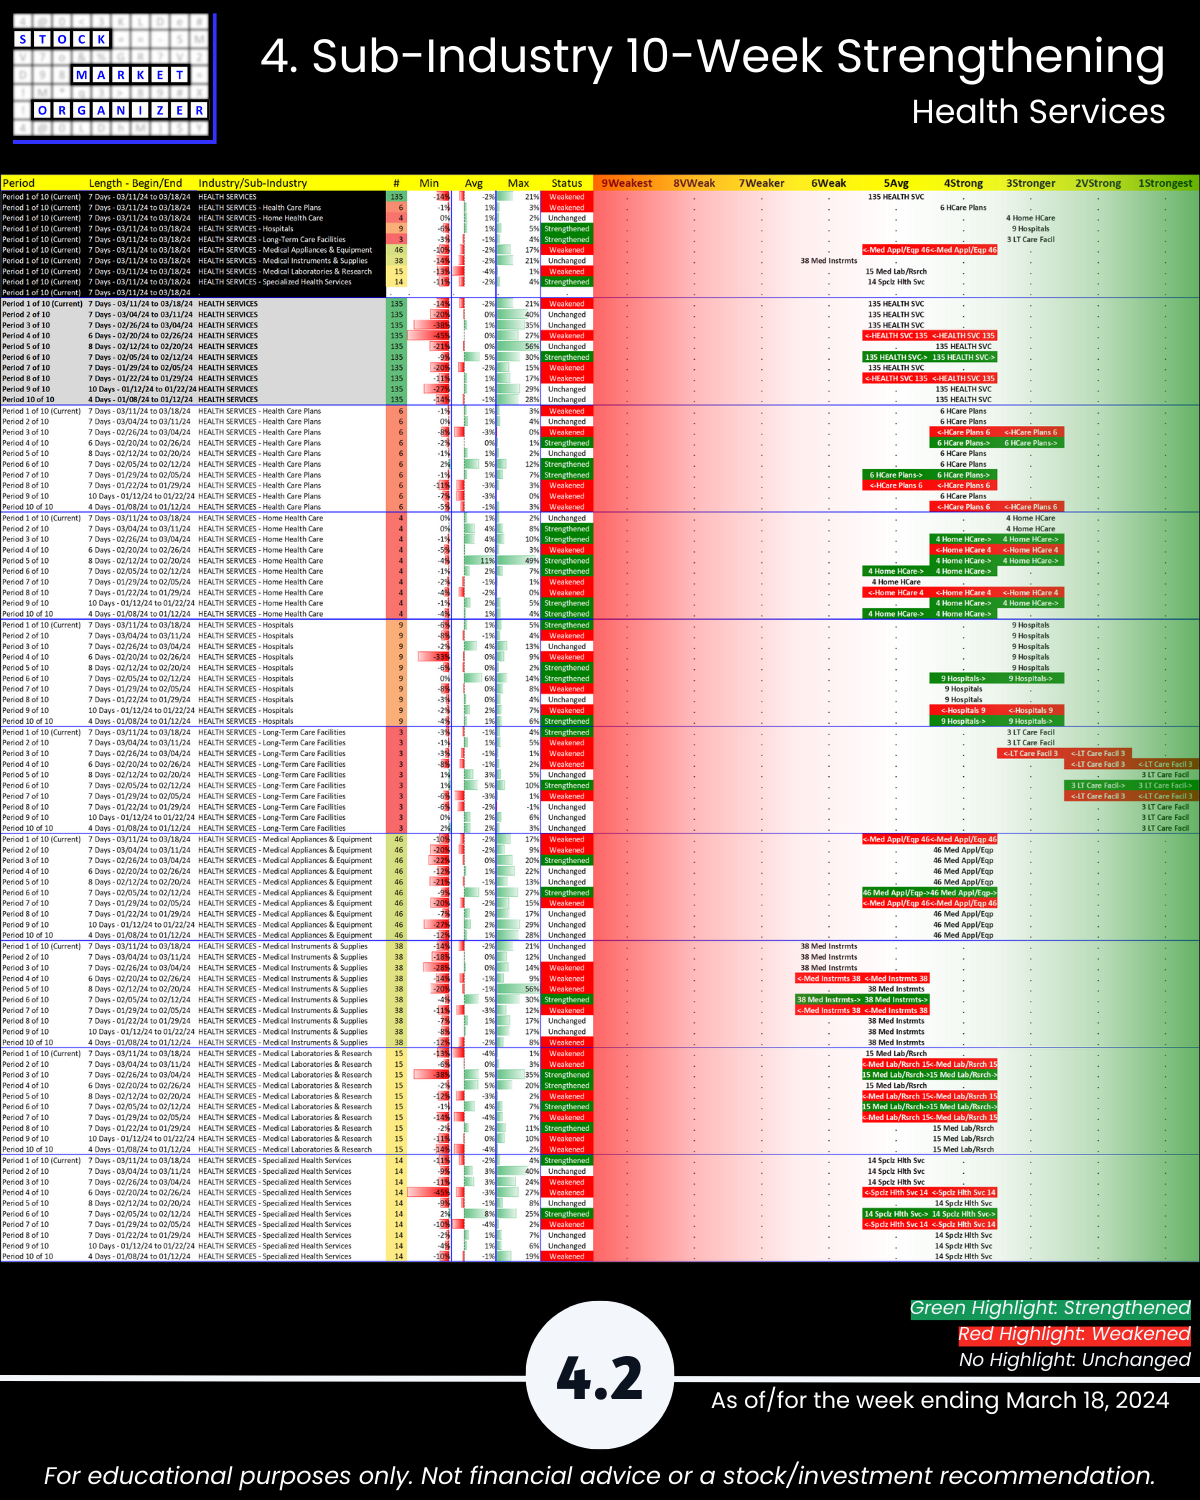
4. Sub-Industry 10-Week Strengthening
5. Stocks Outliers: Strongest/Weakest Rated
6. Stocks Outliers: 1-Week % Change
7. Stocks Outliers: 5-Year Highs/Lows