SMO Exclusive: Strength Report Group 2 2024-03-04

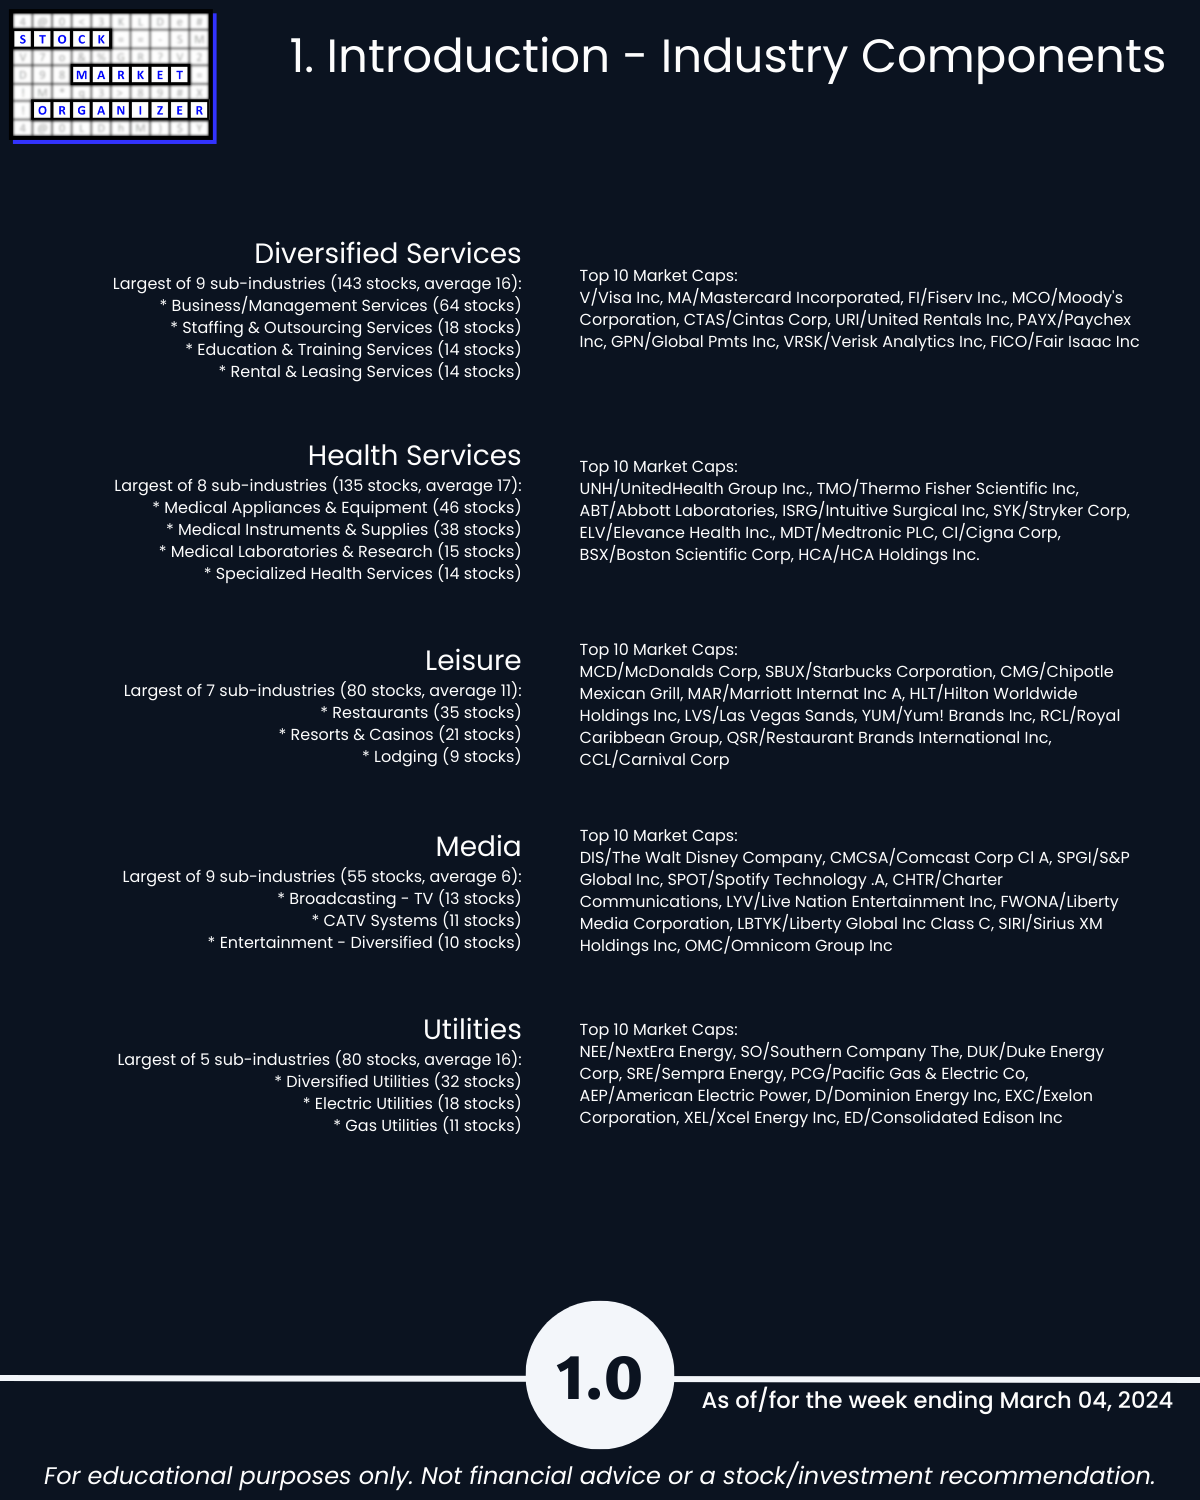
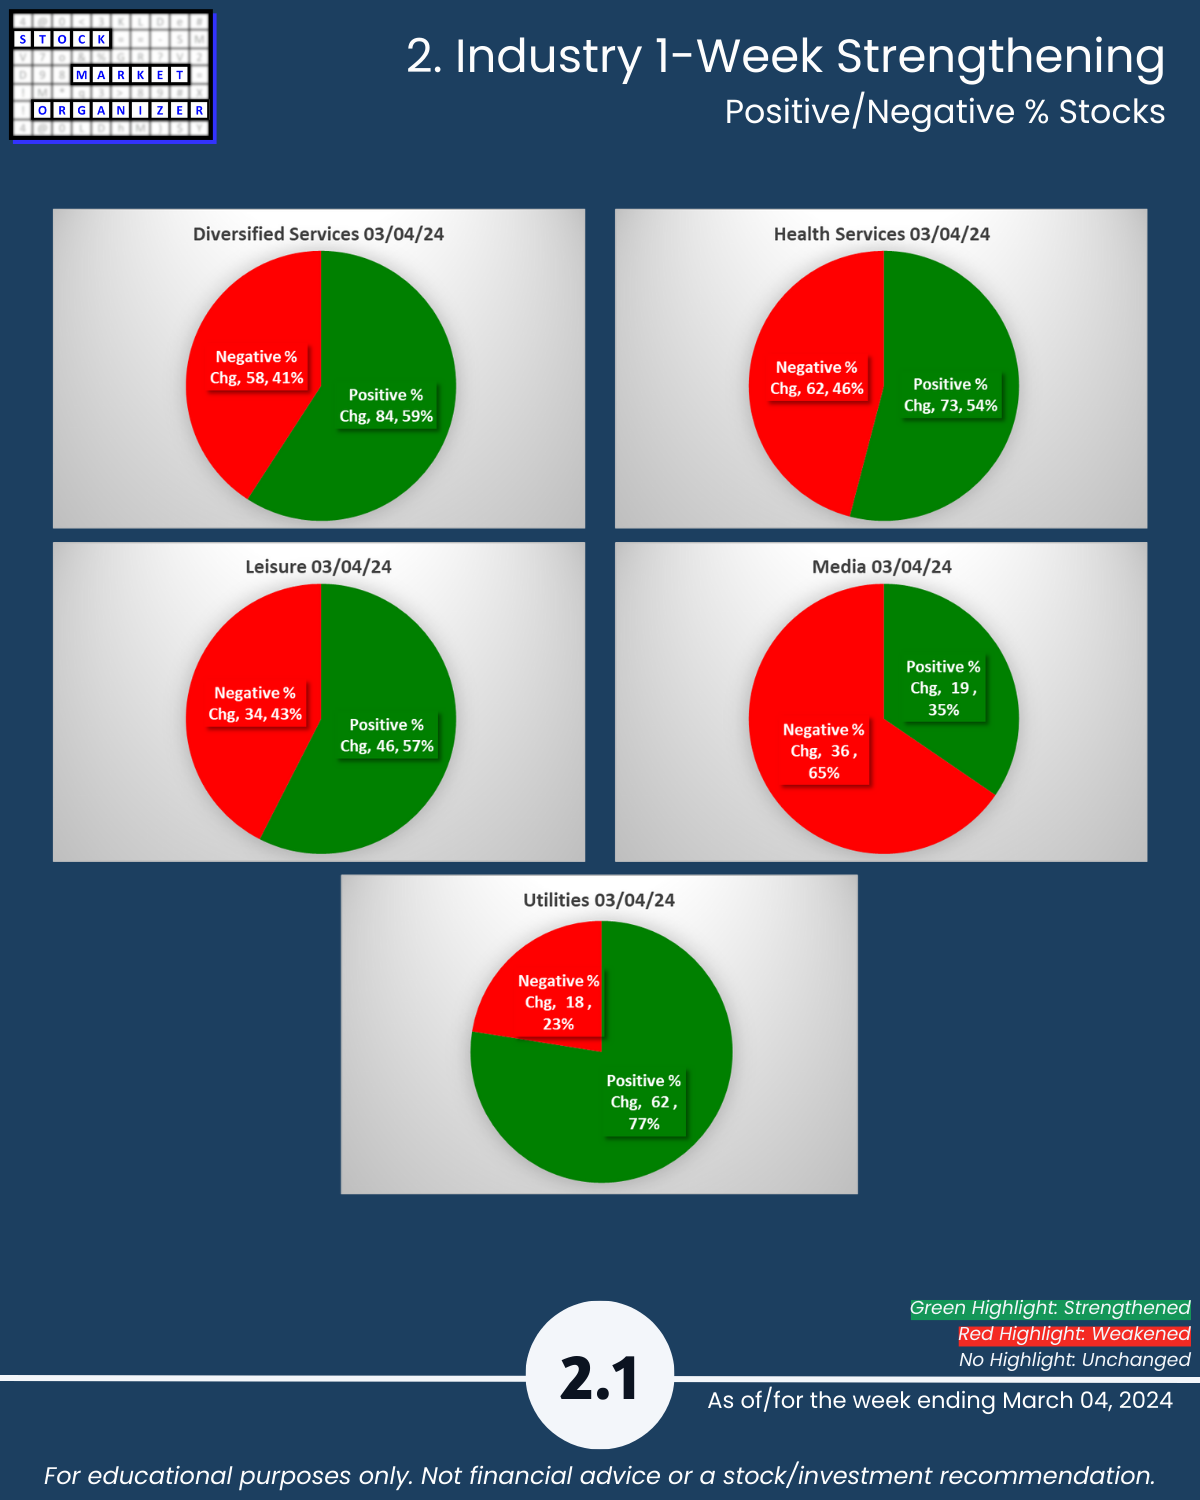
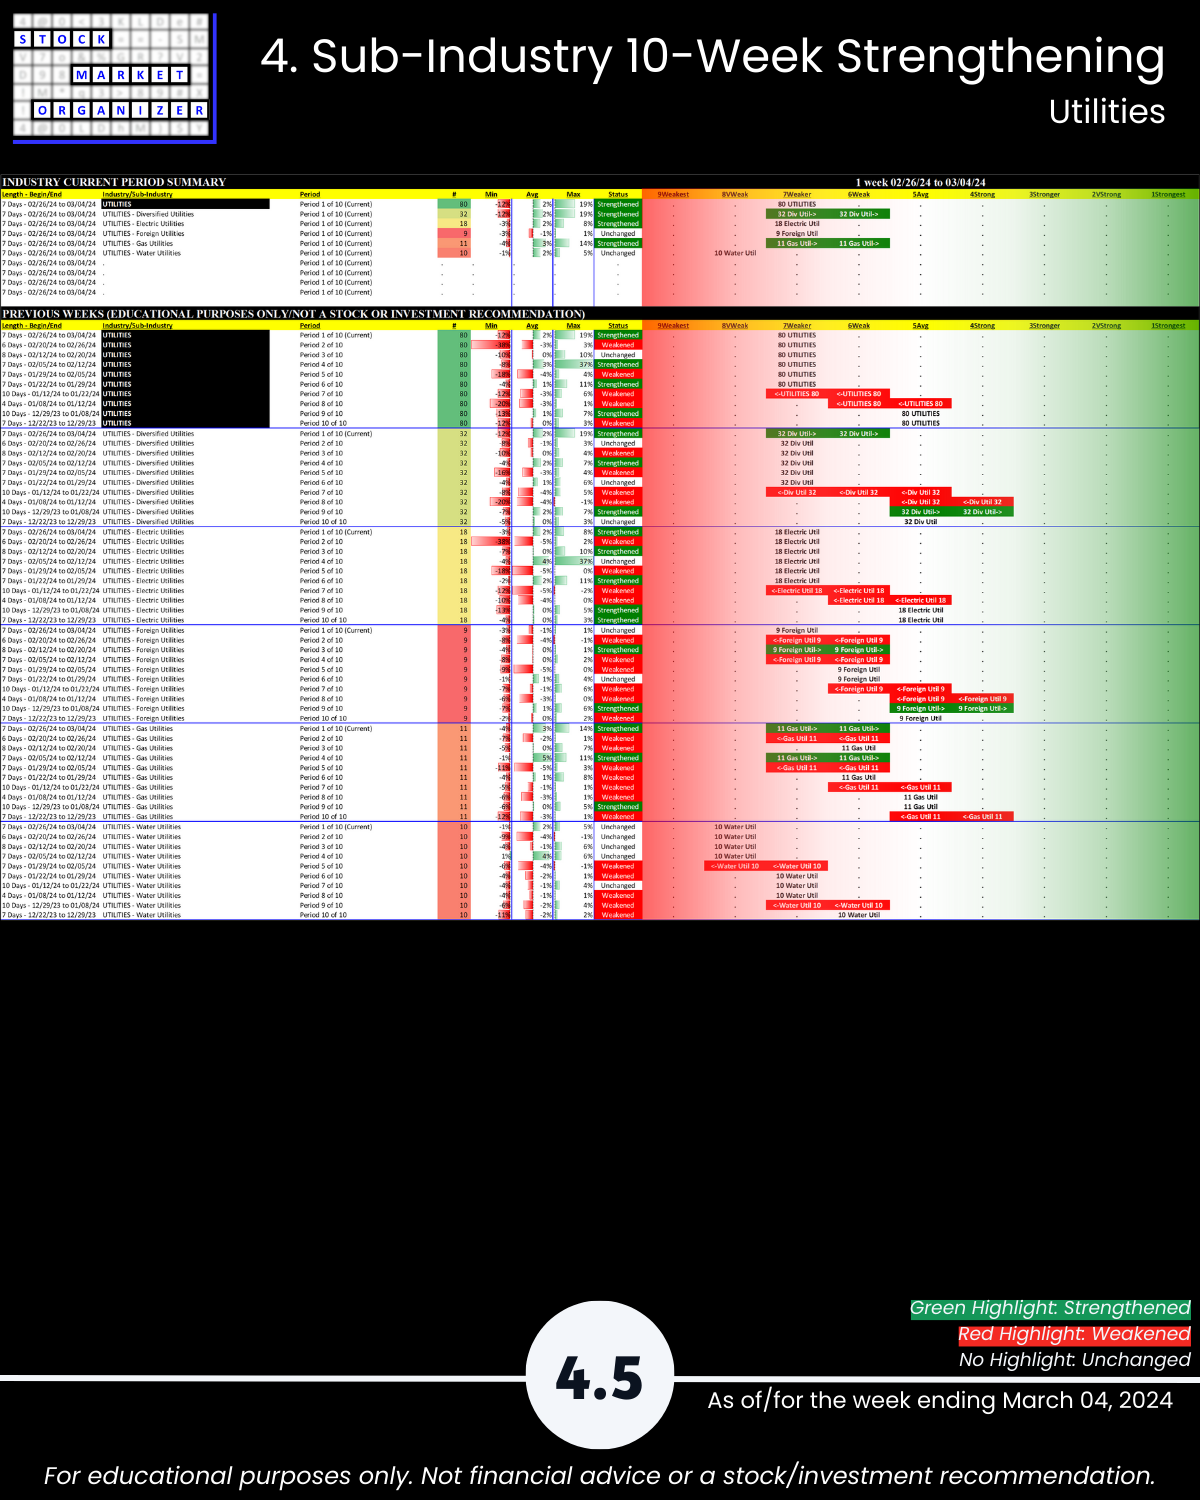
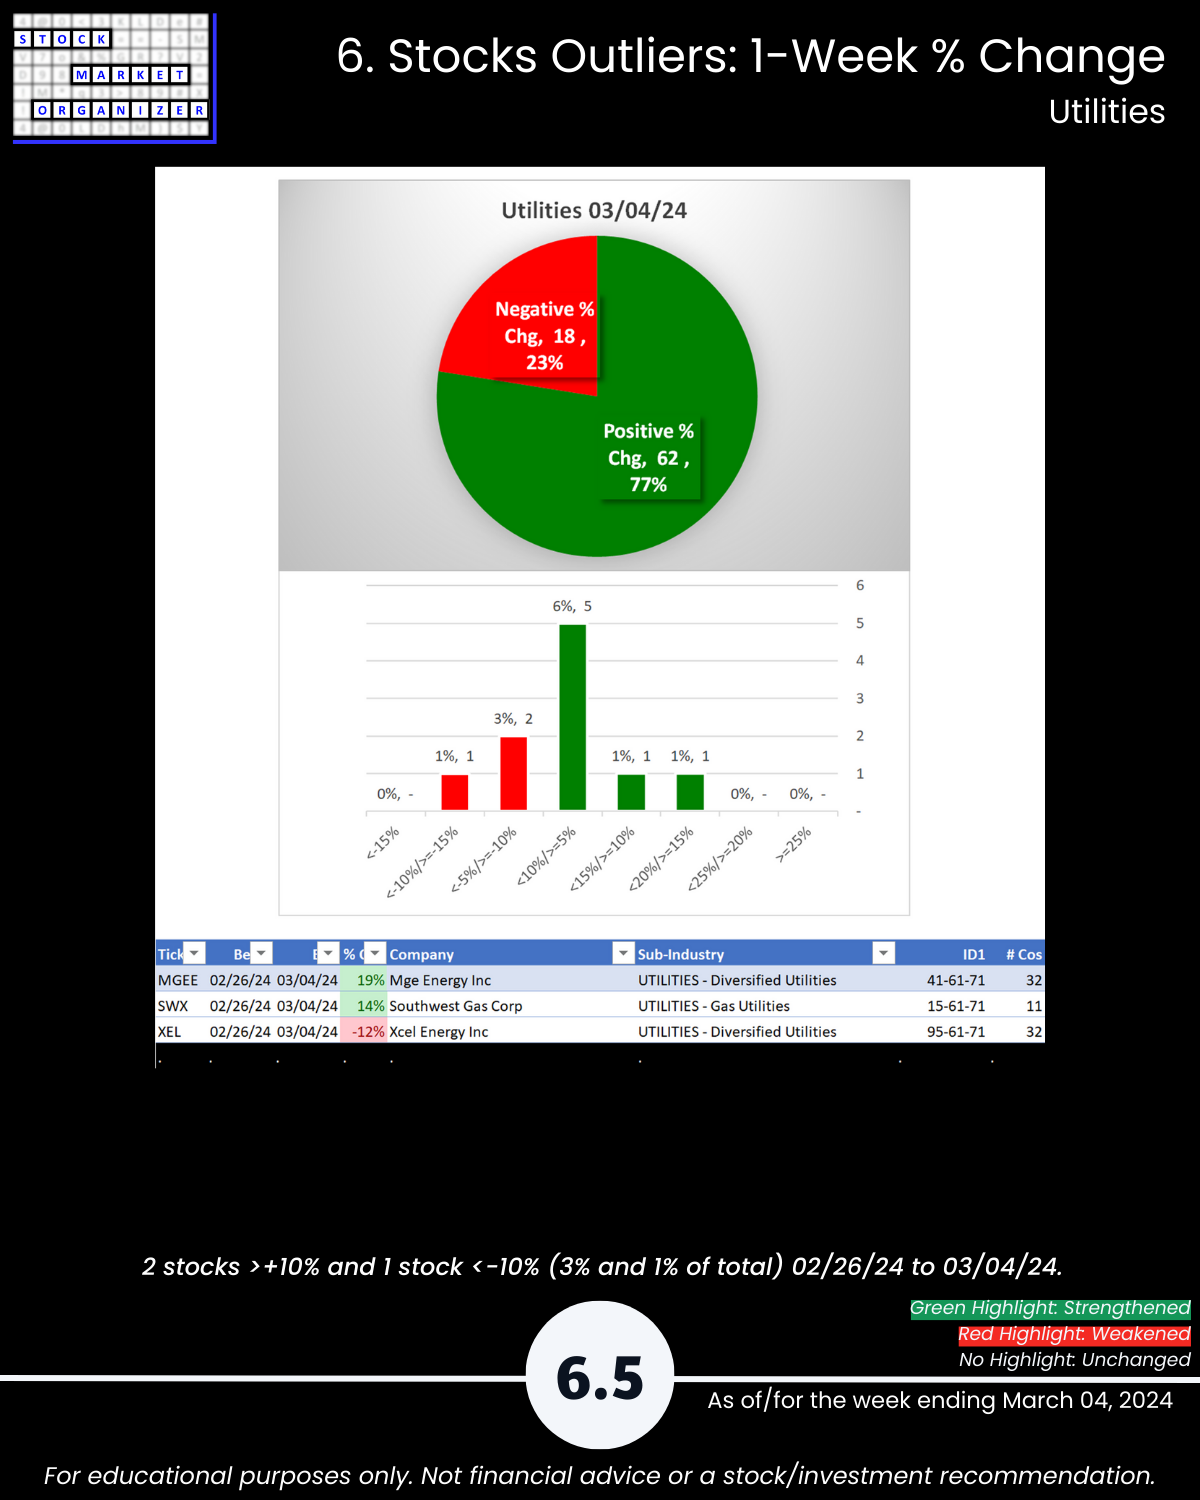
Utilities showing life, not yet enough to rise a strength level. The first step in a multi-month+ rally is one up week. Stock market 3/4/24 and every day: 🔹 The stronger your stocks, the greener your P&L. 🔹 Market conditions matter. 🔹 You won’t find what you aren’t looking for. Find strong stocks in strengthening sub-industries/industries in the attached Group 2 industries (loosely Services) analysis – Diversified Services, Health Services, Leisure, Media, and Utilities.
WHY STRENGTH MATTERS – BANKING INDUSTRY EXAMPLE
Sometimes value reigns, sometimes growth. In recent times, small caps have lagged. The common theme among top performers: strength.
Banking was the strongest-rated industry at Very Strong (2nd strongest of 9 levels) as recently as the week ending 1/26/24. It had steadily strengthened since mid-May 2023, when it finally reversed the weakening from the First Republic implosion era.
From 5/15/23 through 1/26/24 it was easy to profit in this strengthening Banking industry:
🔹 99% of banking stocks were positive
🔹 90% rose >10%
🔹 ~7 in 10 stocks rose >25%
🔹 ~1 in 4 stocks rose >50%
Different story after 1/26/24.
From 1/26/24 through 3/1/24, during which Banking has weakened 3 of 9 strength levels from Very Strong (2nd strongest) to Average (5th strongest):
🔹 Only 10% of banking stocks were positive
🔹 ~3 in 4 fell more than -5%
🔹 ~4 in 10 fell more than -10%
🔹 ~1 in 7 fell more than -15%
THE BOTTOM LINE
It really doesn’t have to be so complicated.
Track strengthening. Because
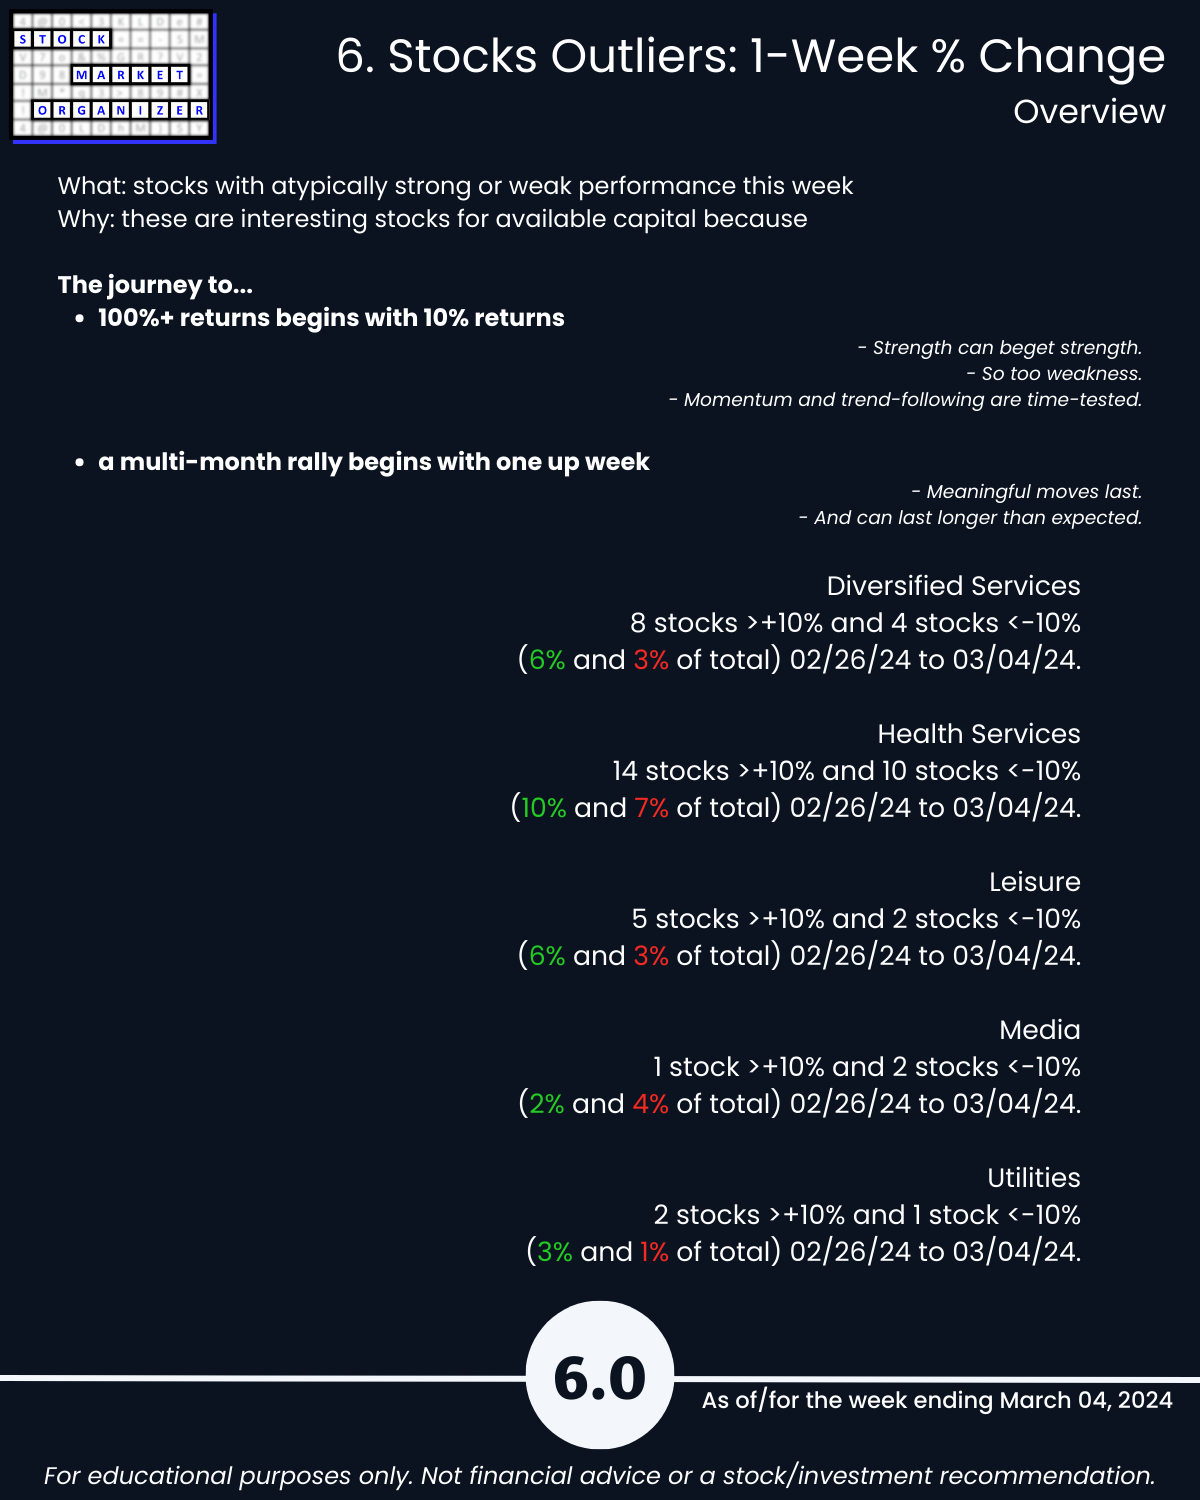
🔹 The rally of multiple months+ begins with one up week.
🔹 the journey to 100%+ returns begins with 10% returns.
REPORT TAKEWAYS
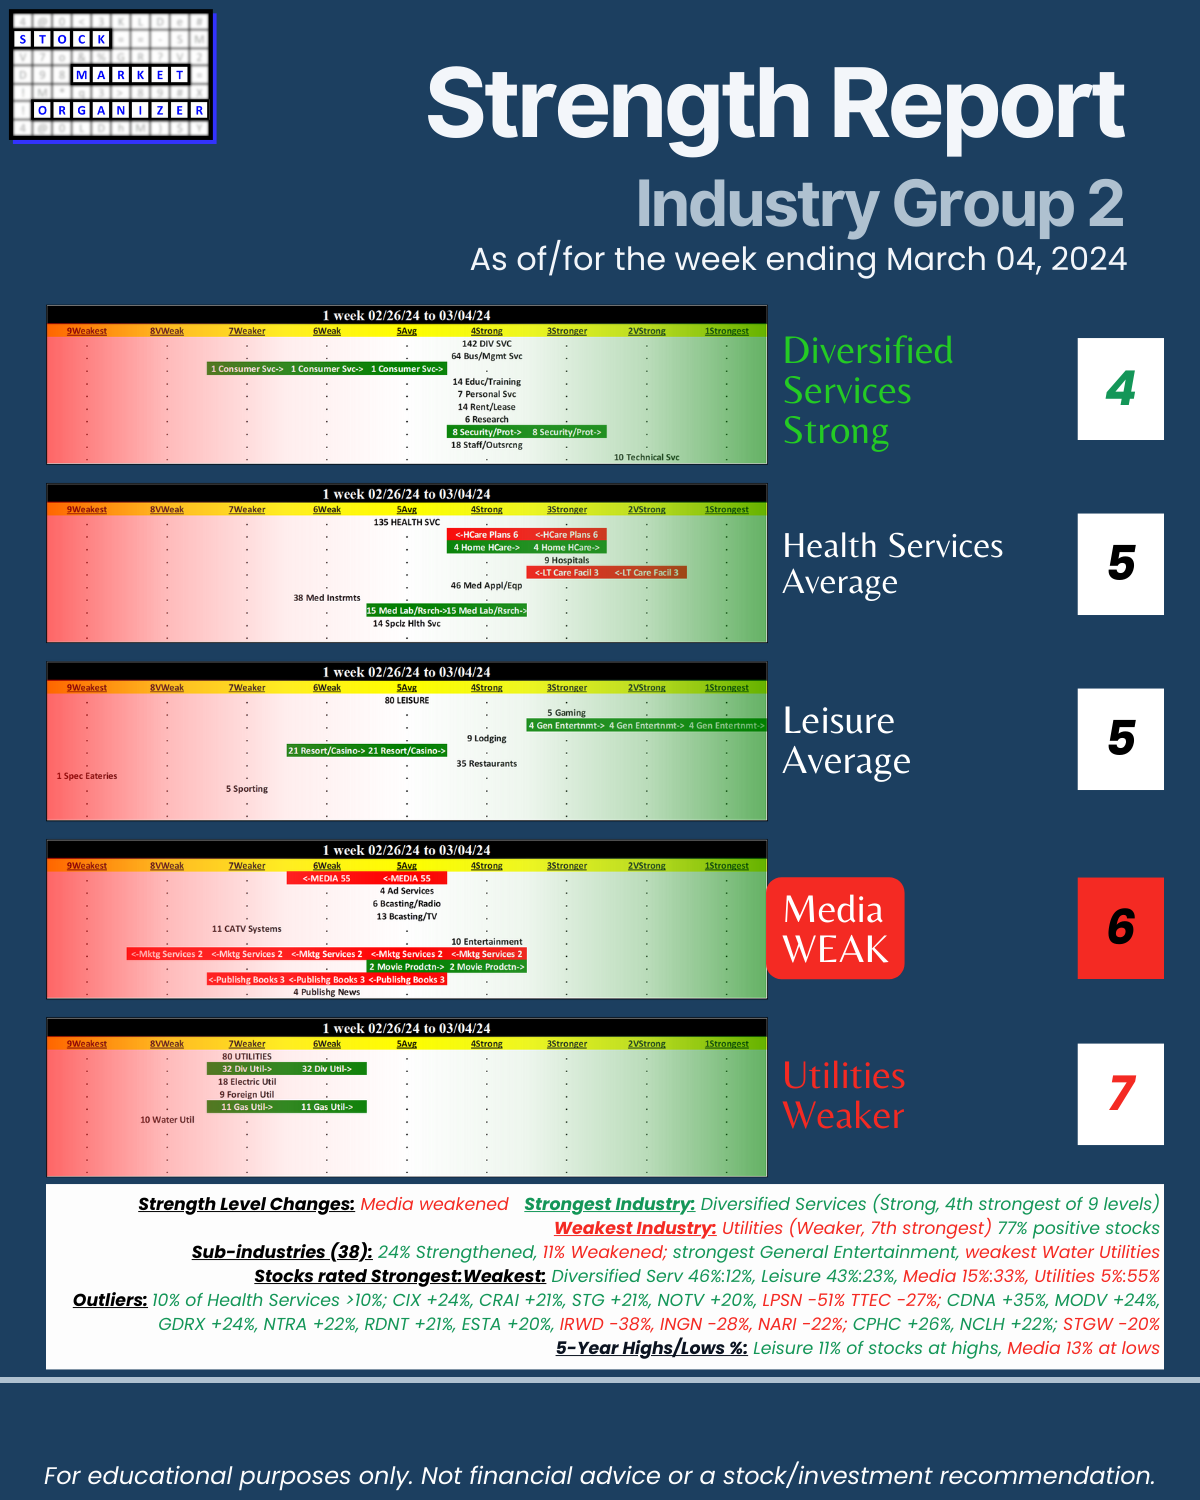
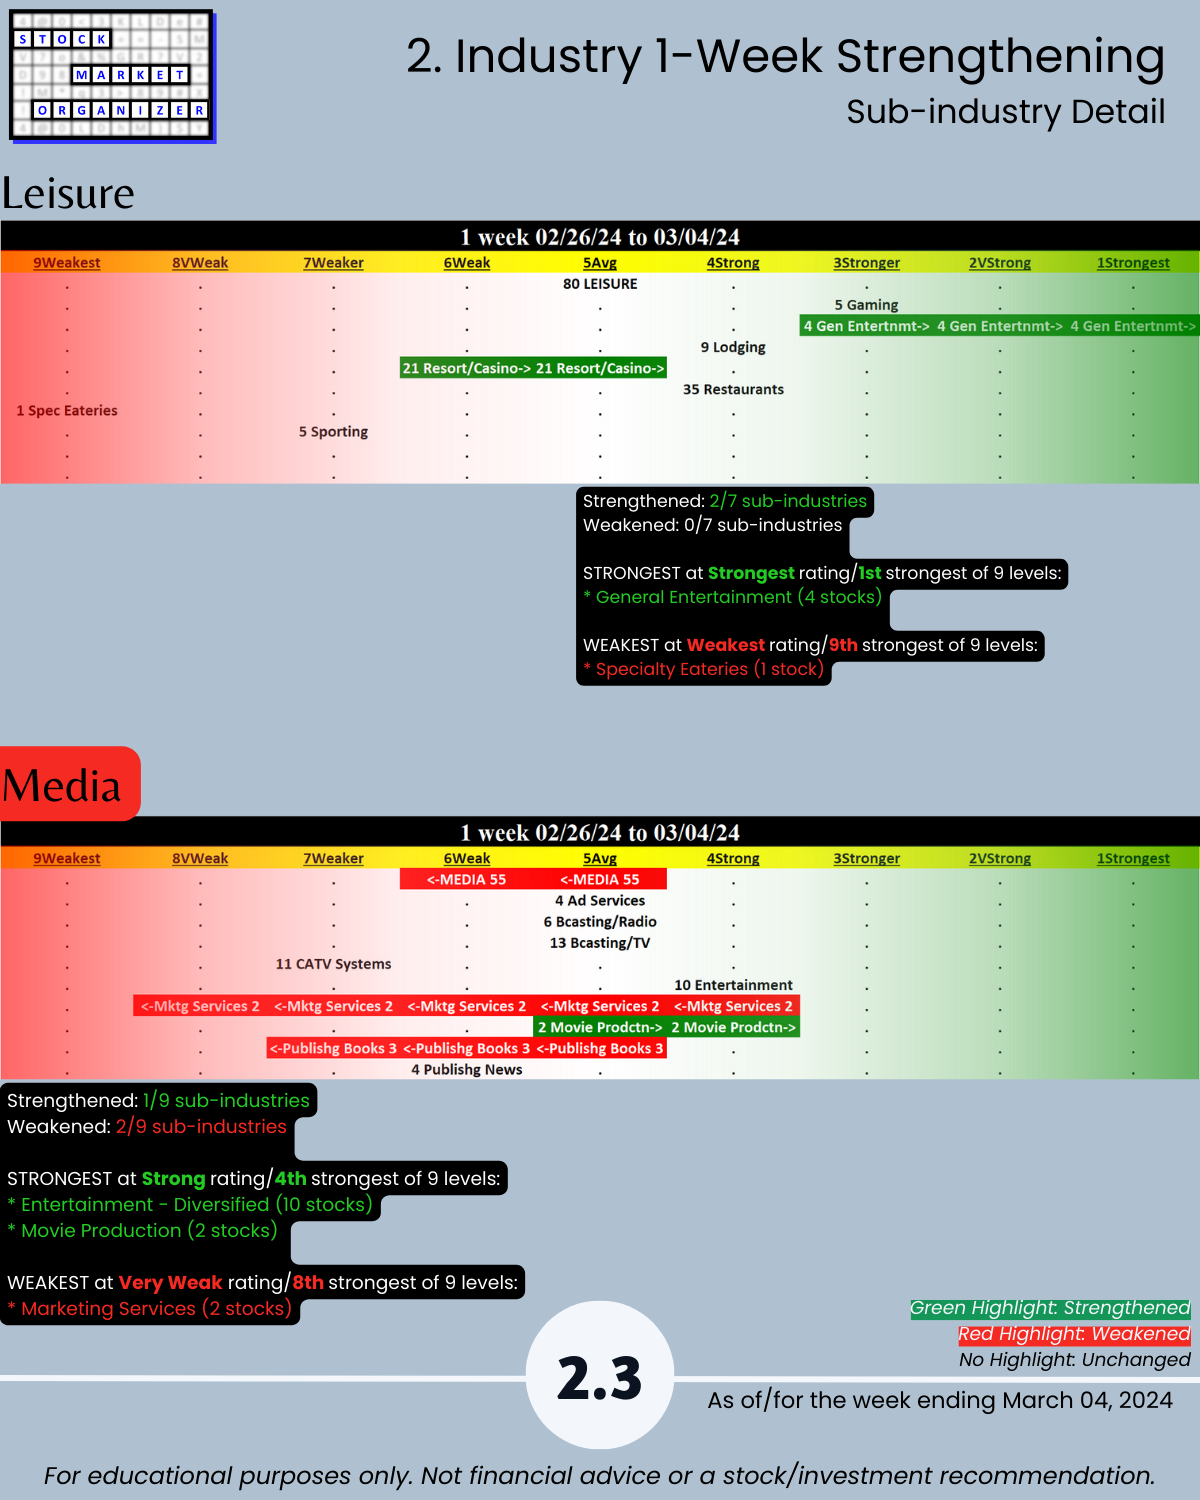
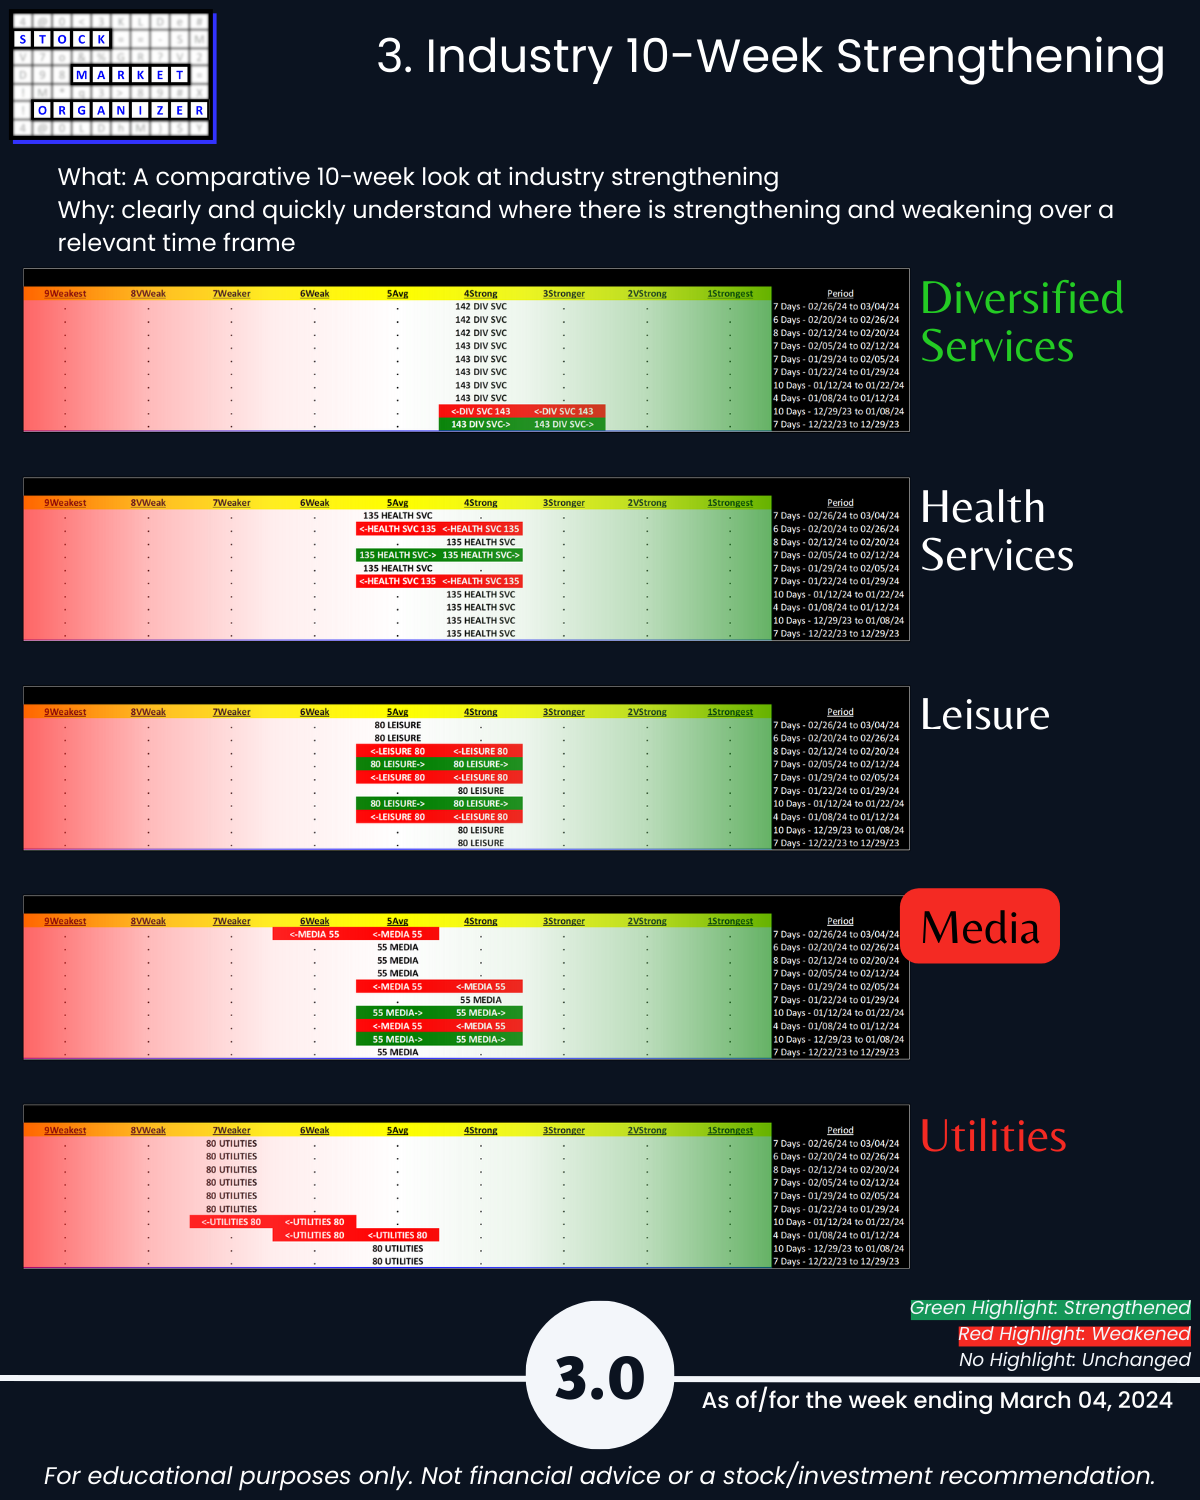
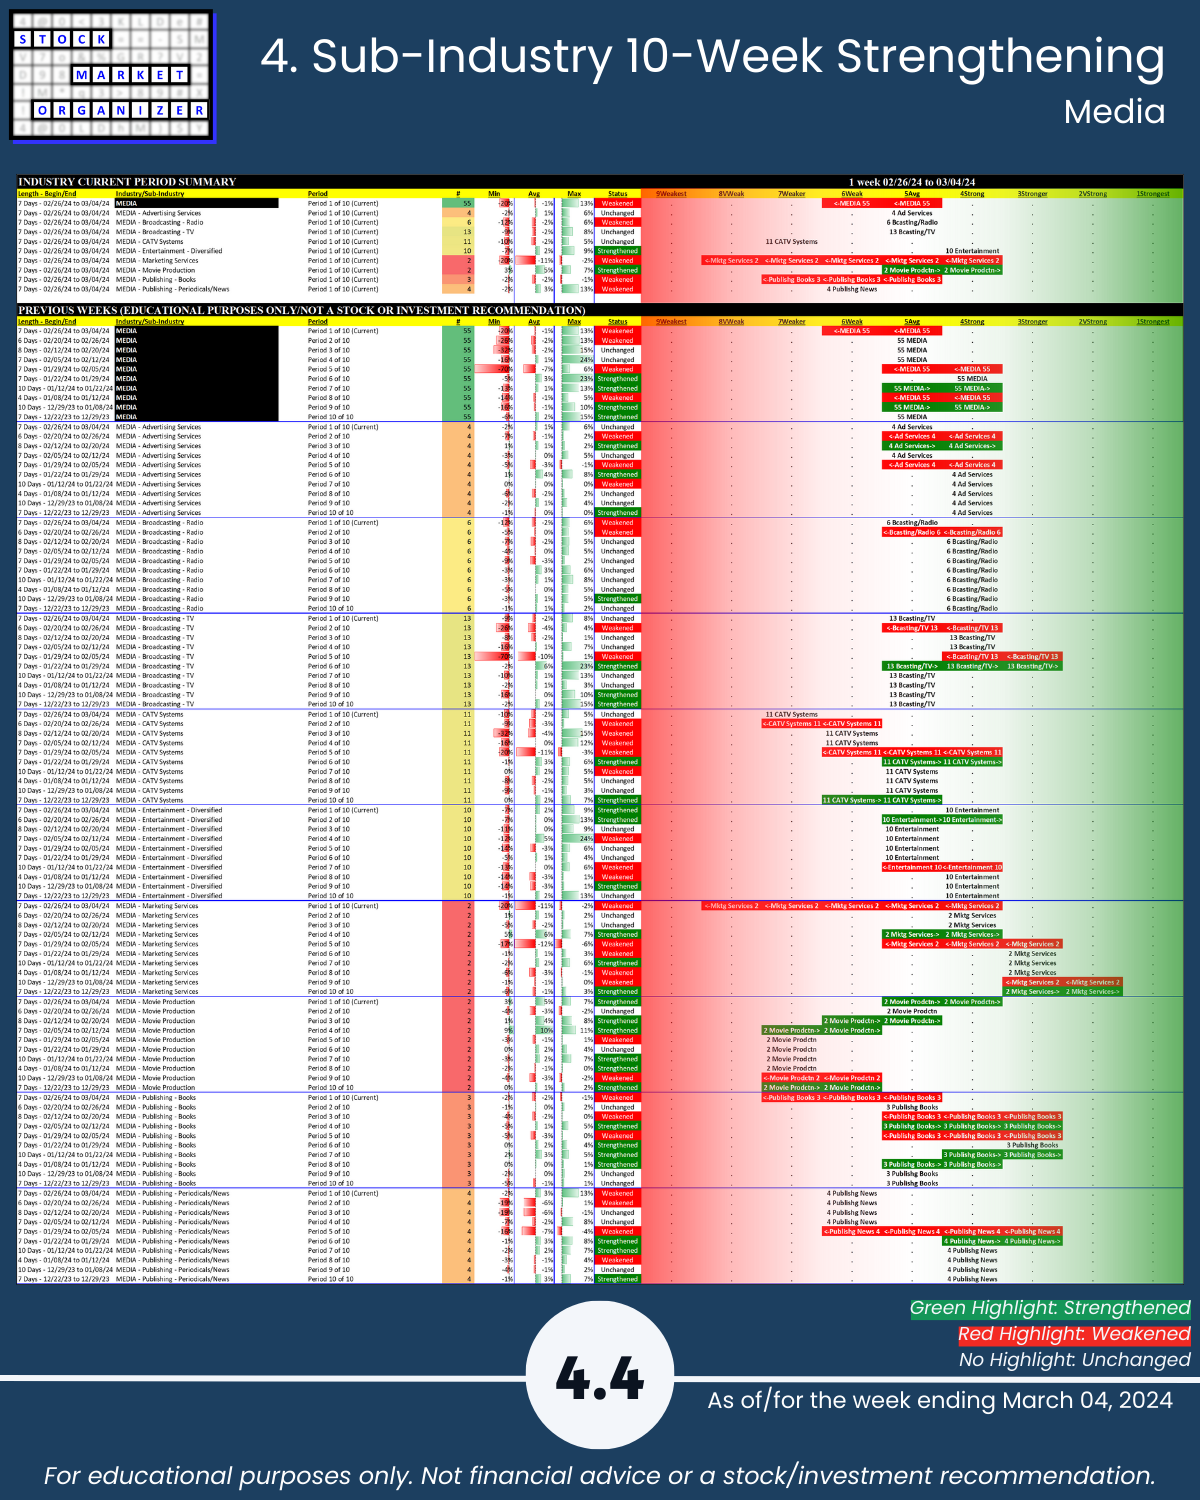
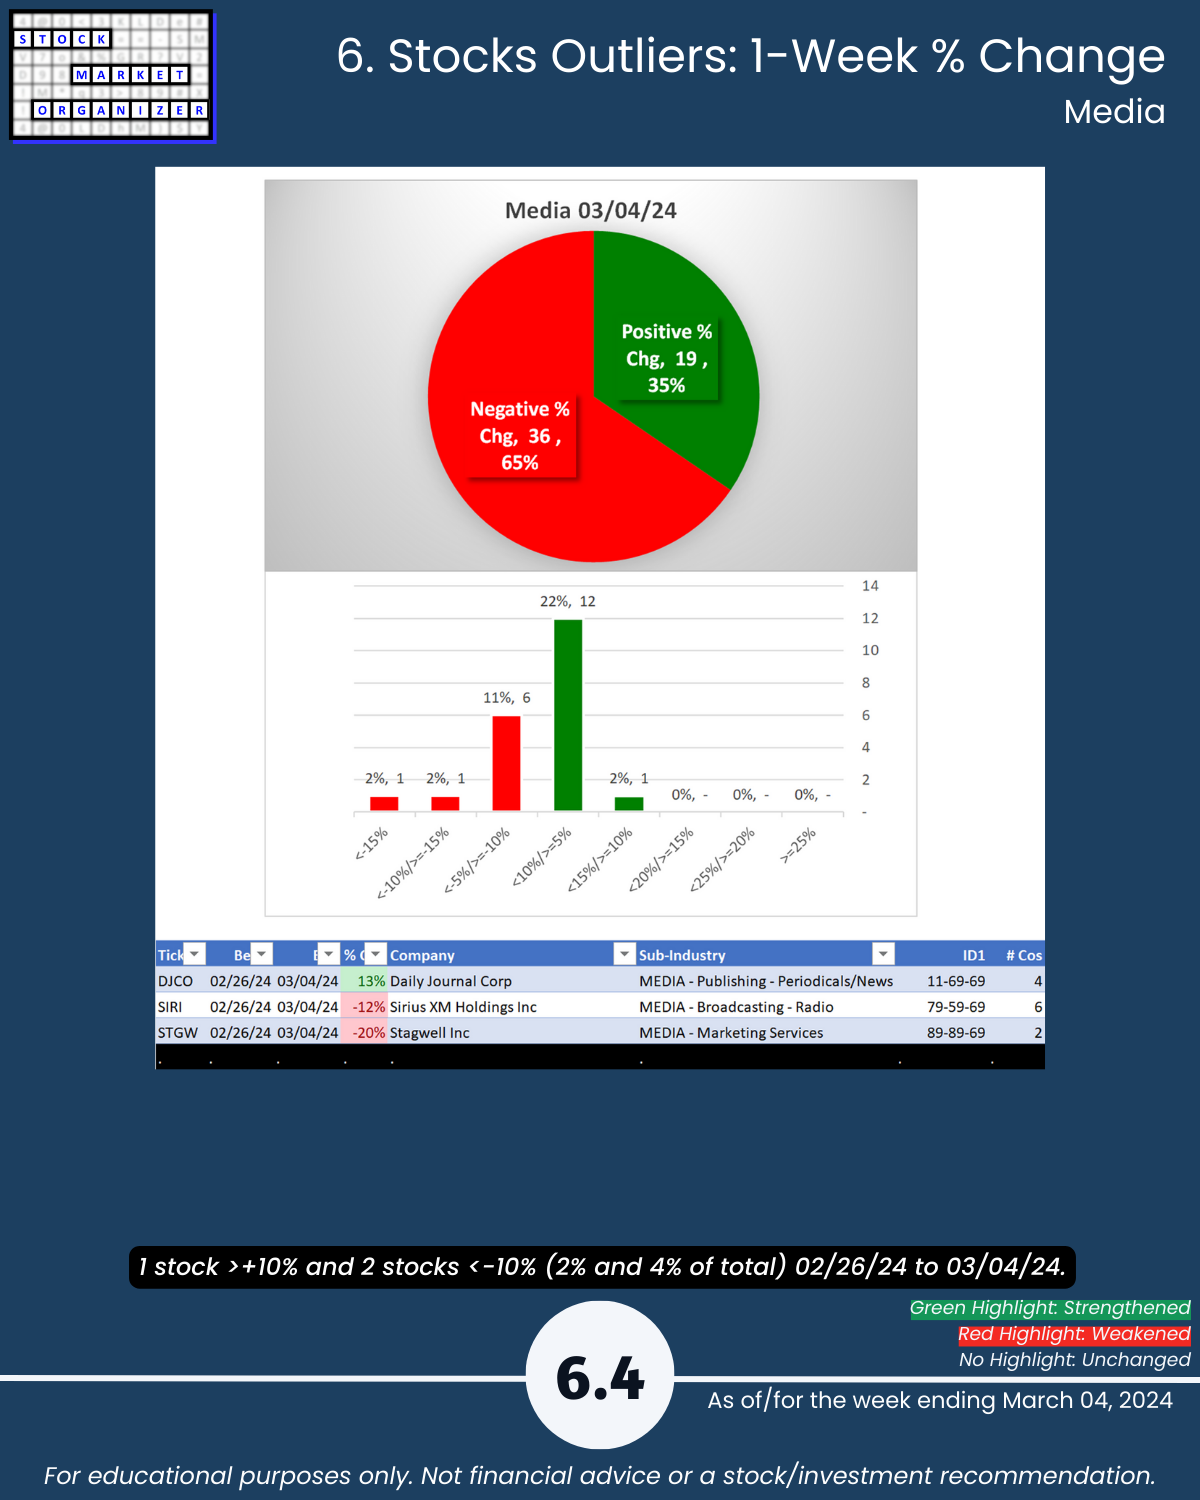
🔹 Strength Level Changes: Media weakened
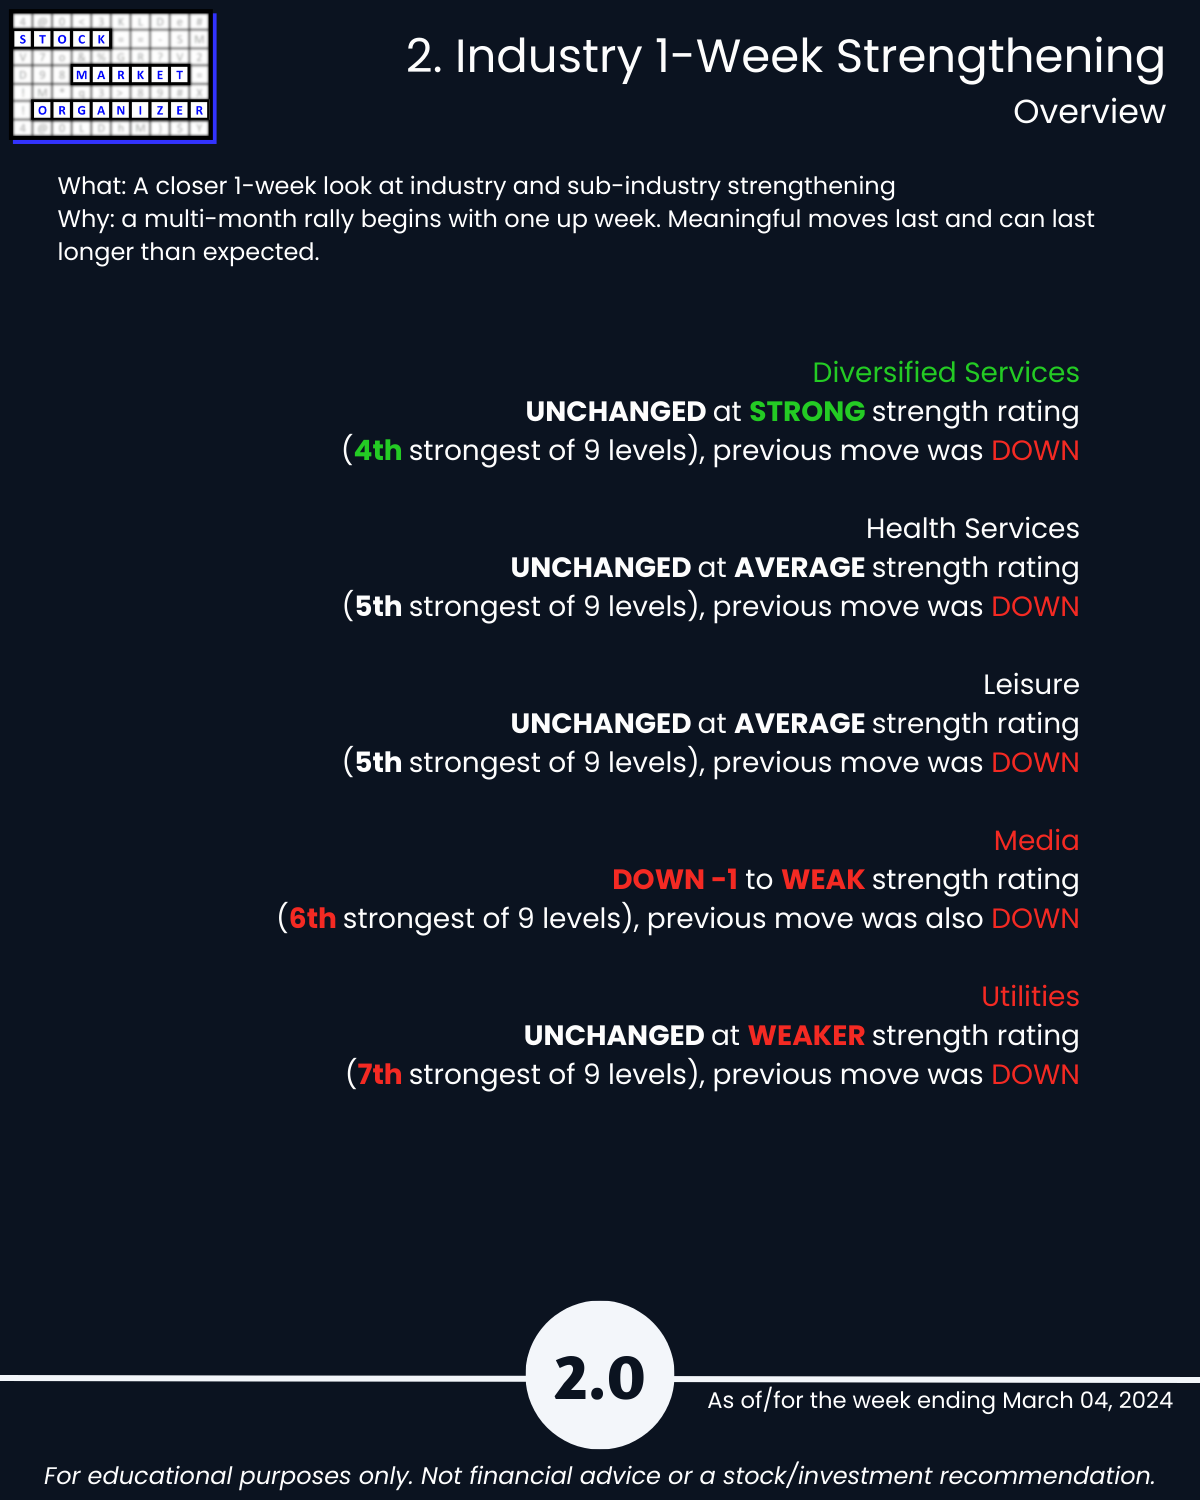
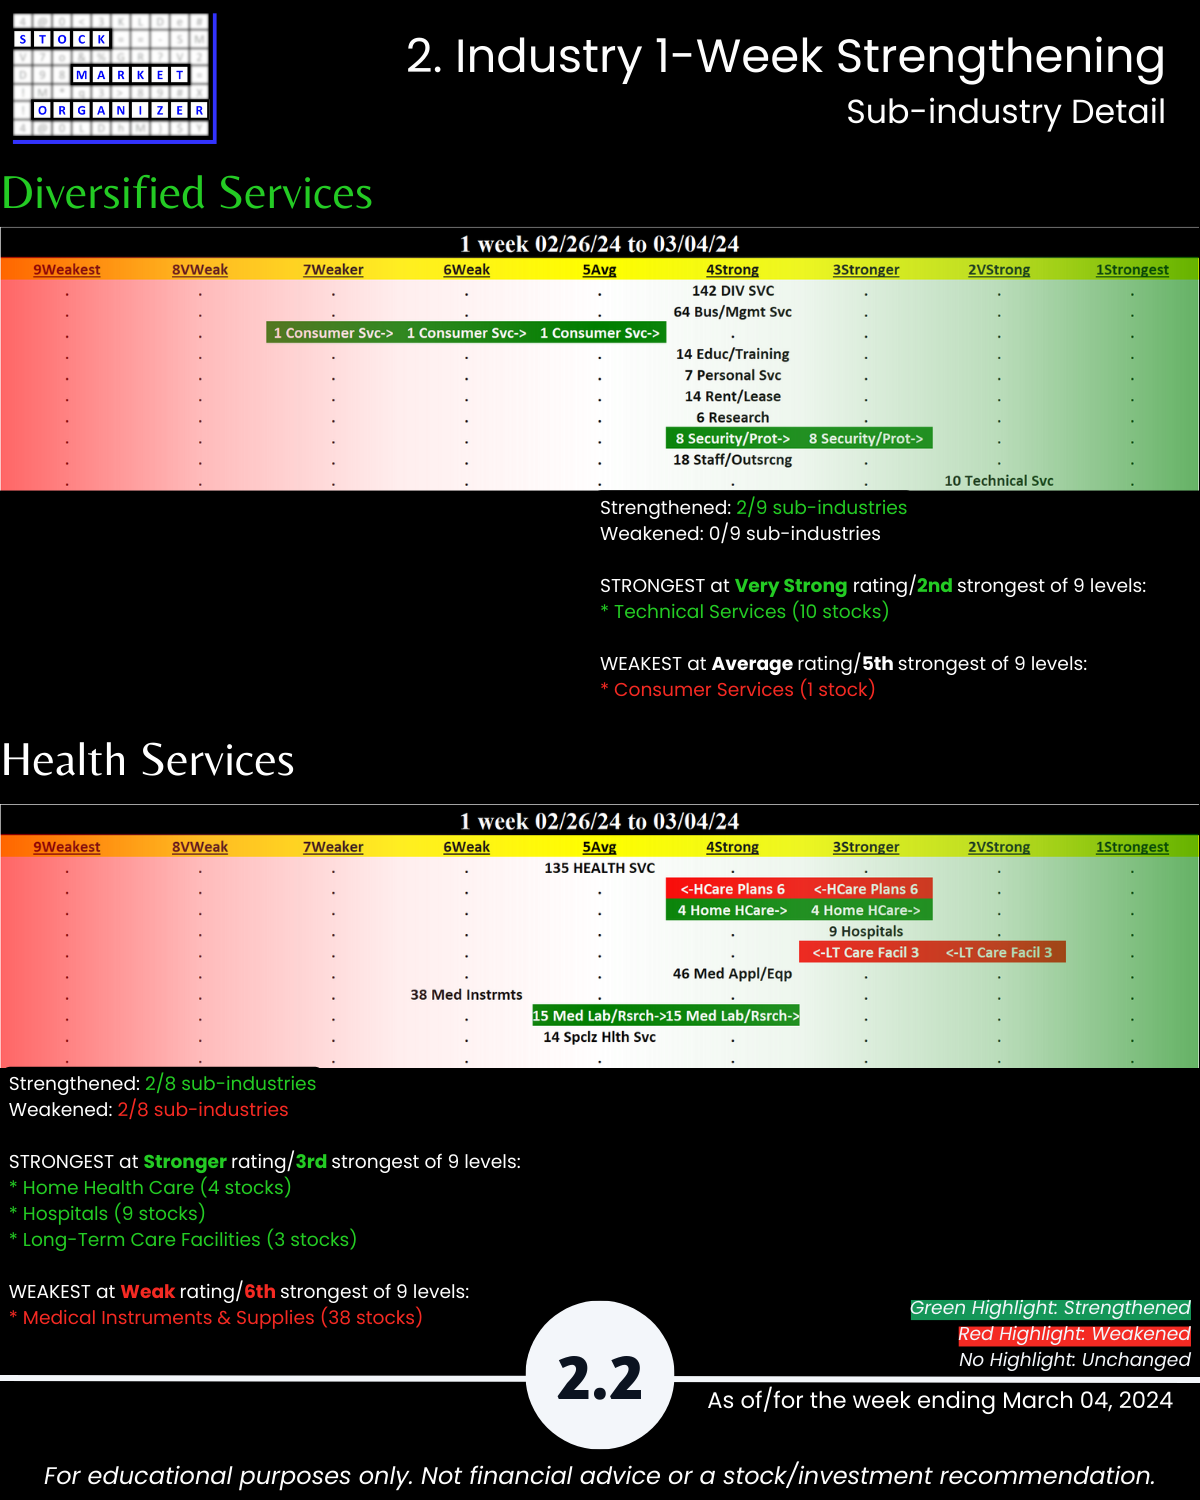
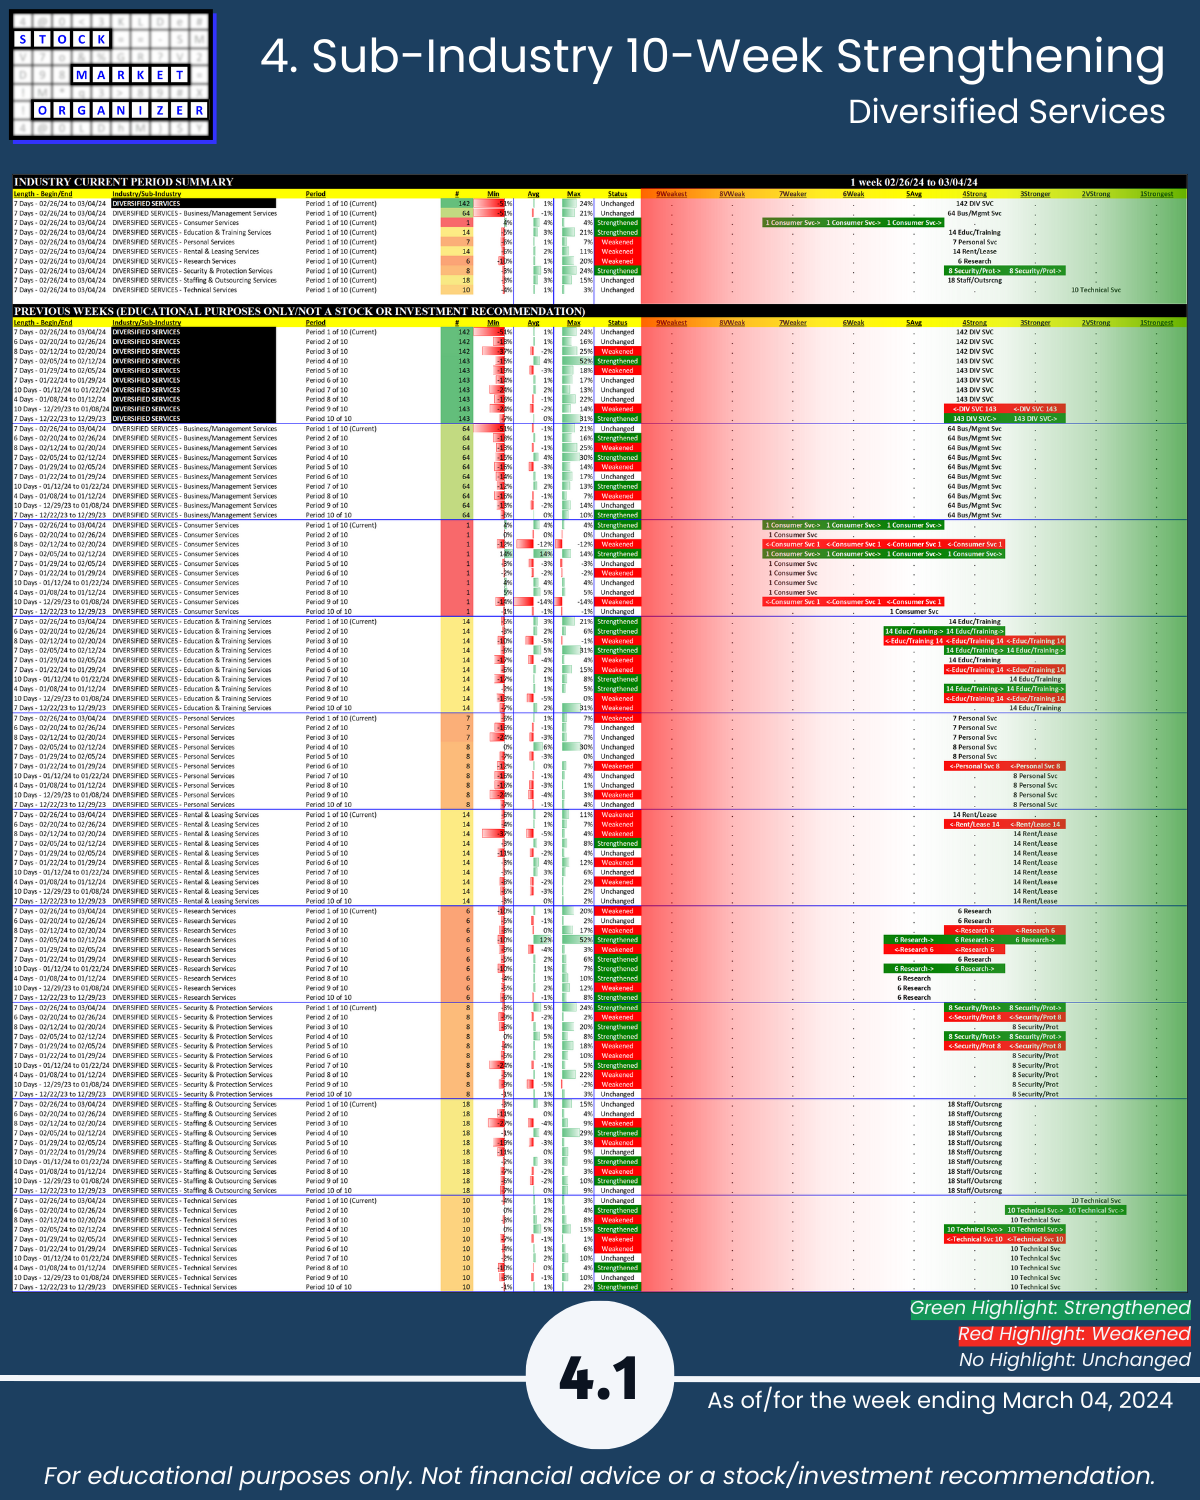
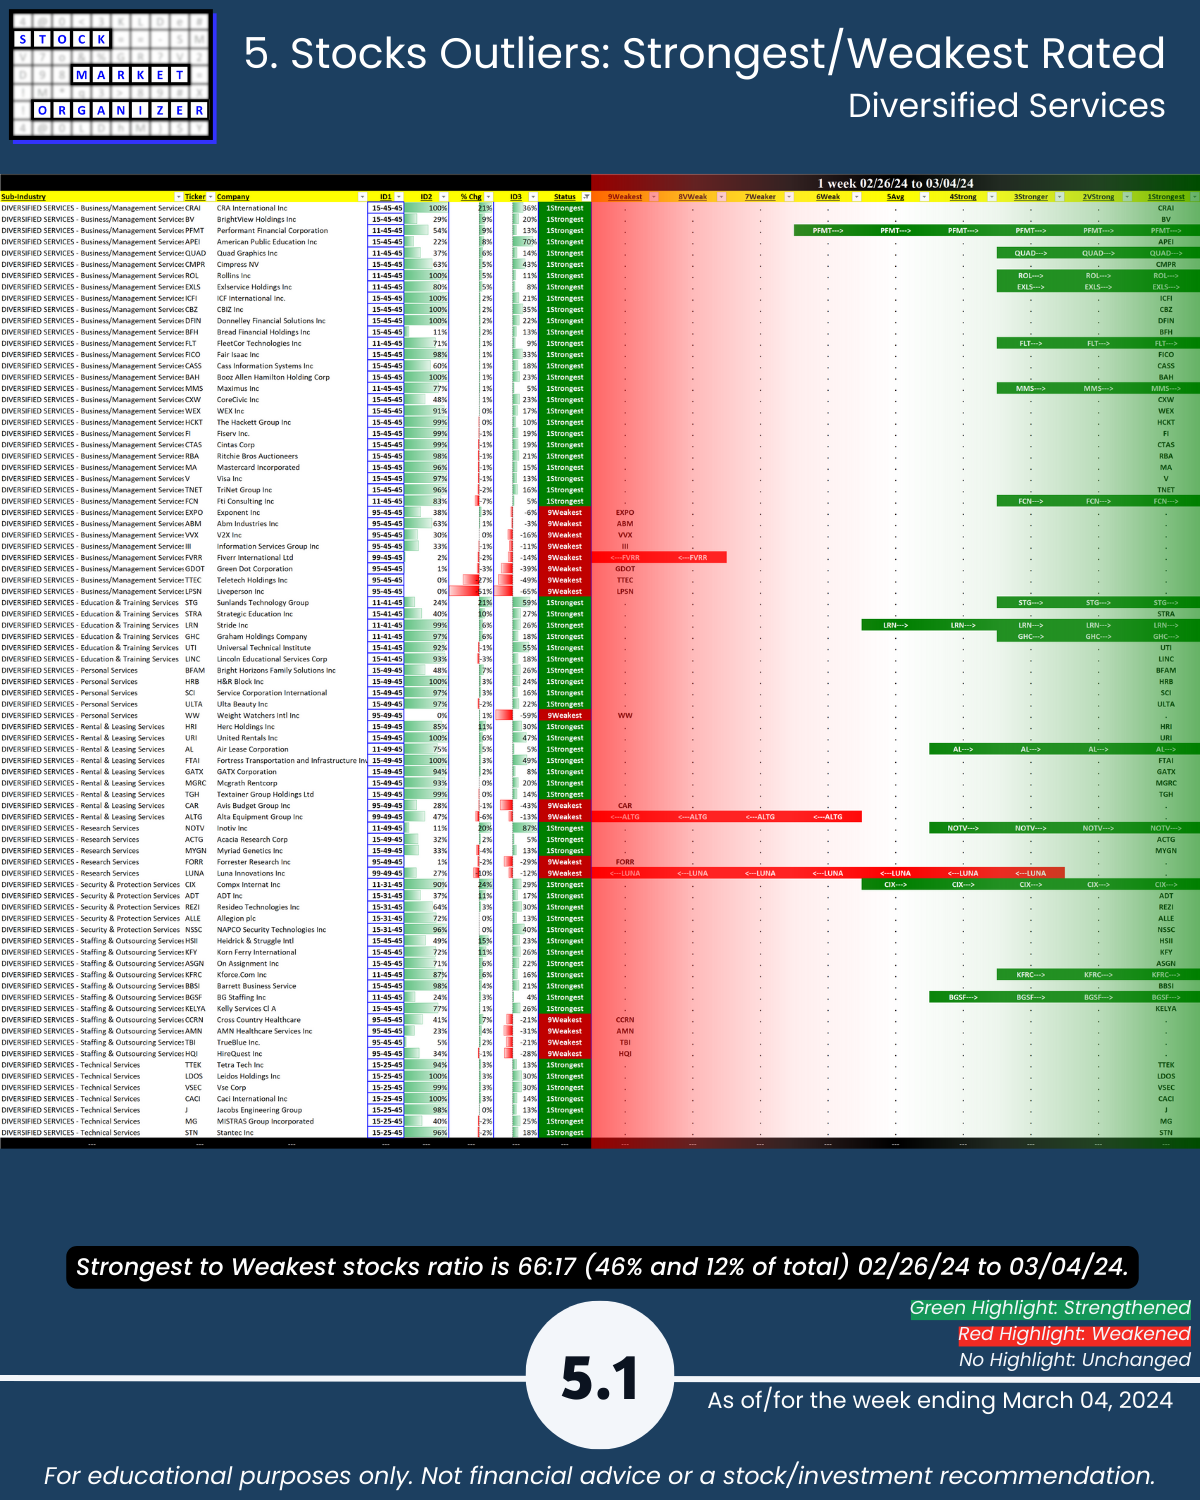
🔹 Strongest Industry: Diversified Services (Strong, 4th strongest of 9 levels)
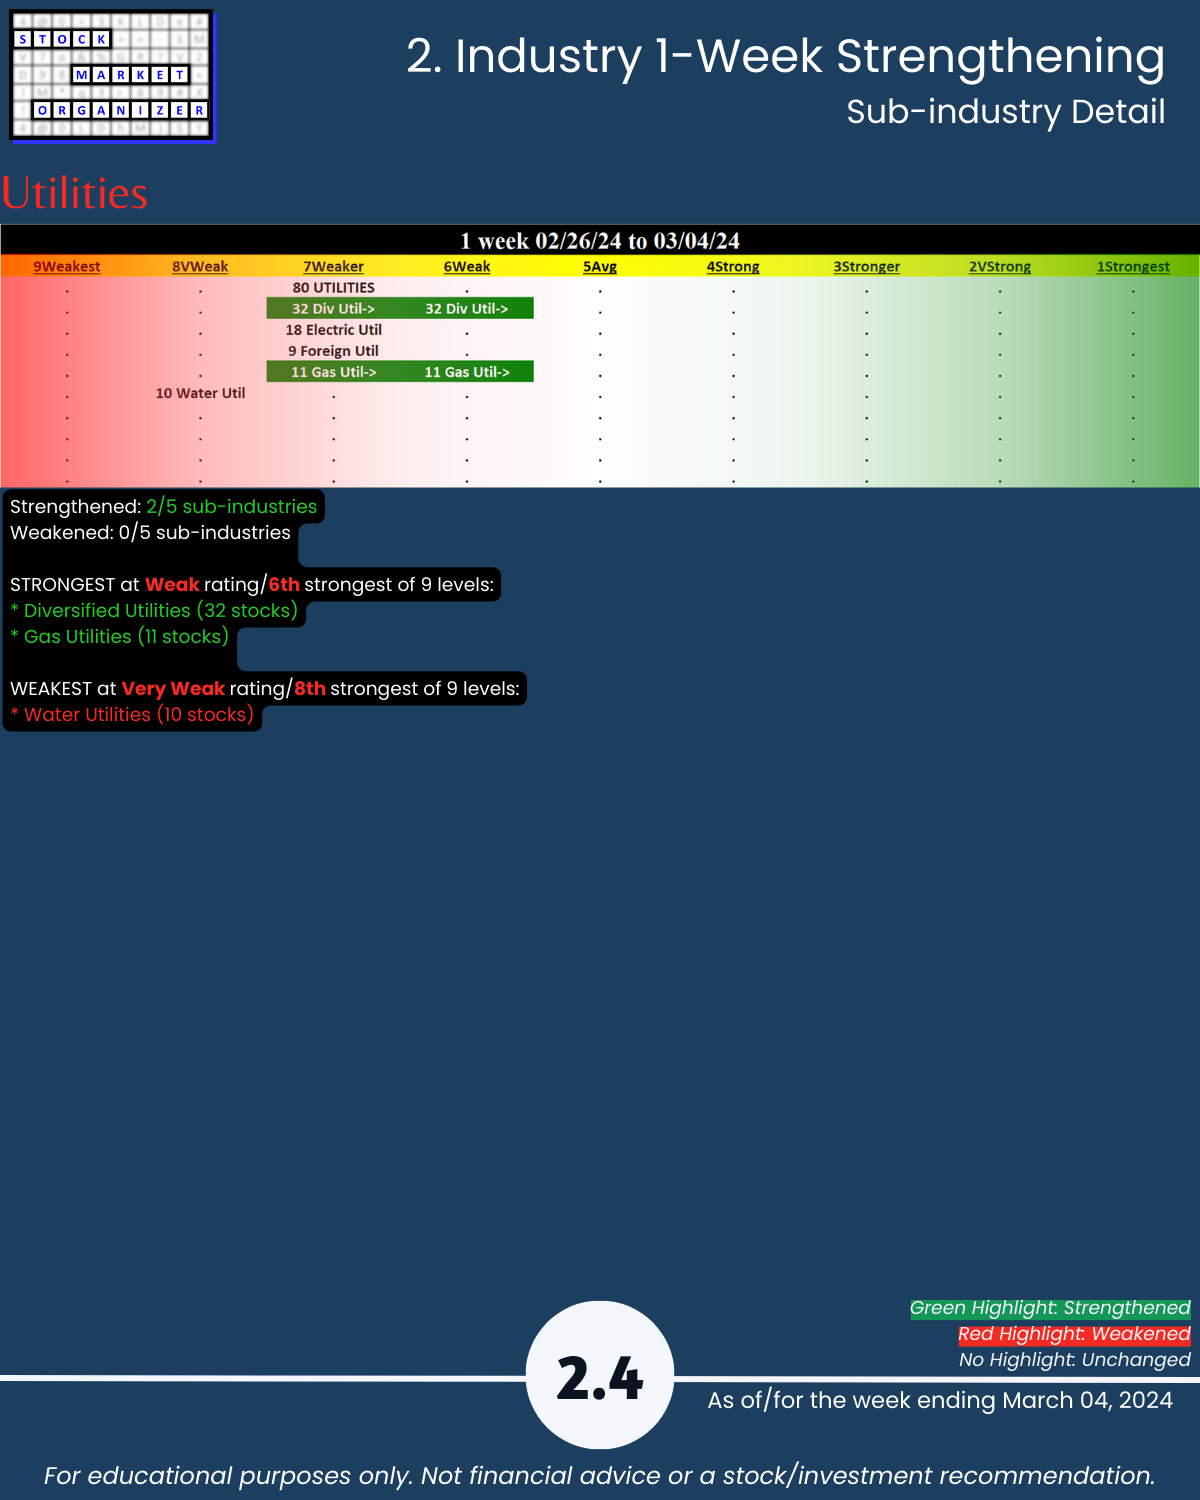
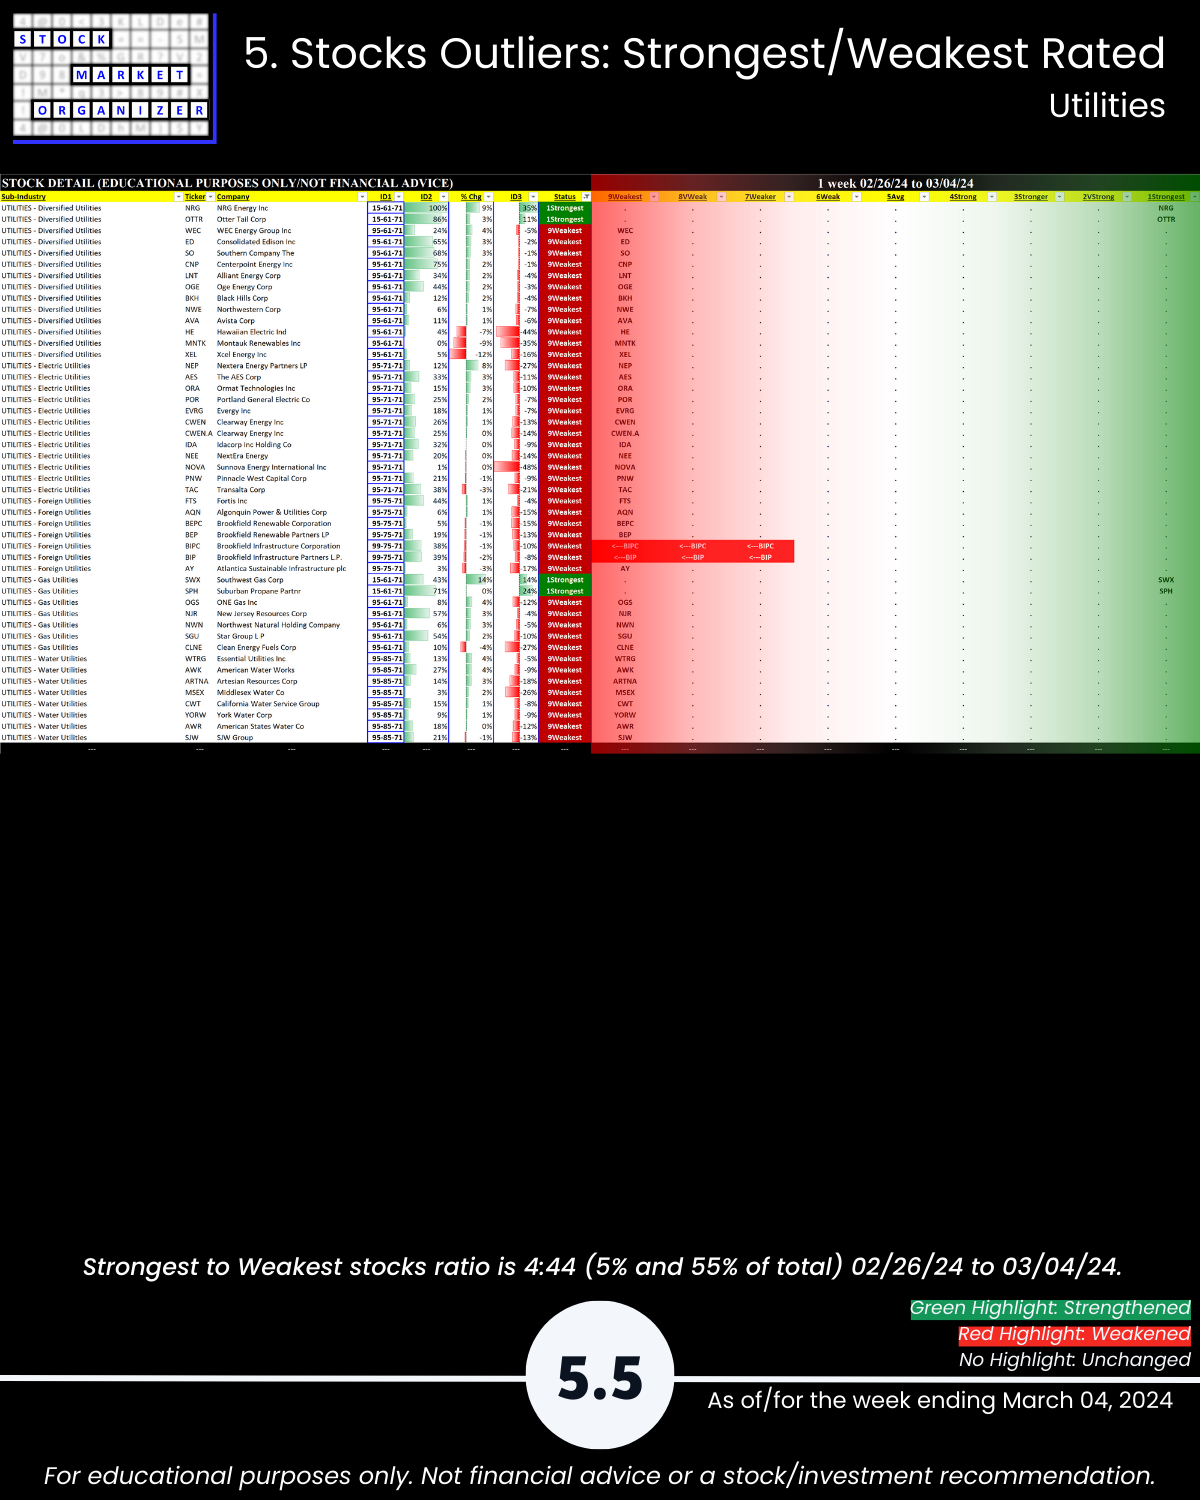
🔹 Weakest Industries: Utilities (Weaker, 7th strongest) 77% positive stocks
🔹 Sub-industries (38): 24% Strengthened, 11% Weakened; strongest General Entertainment, weakest Water Utilities
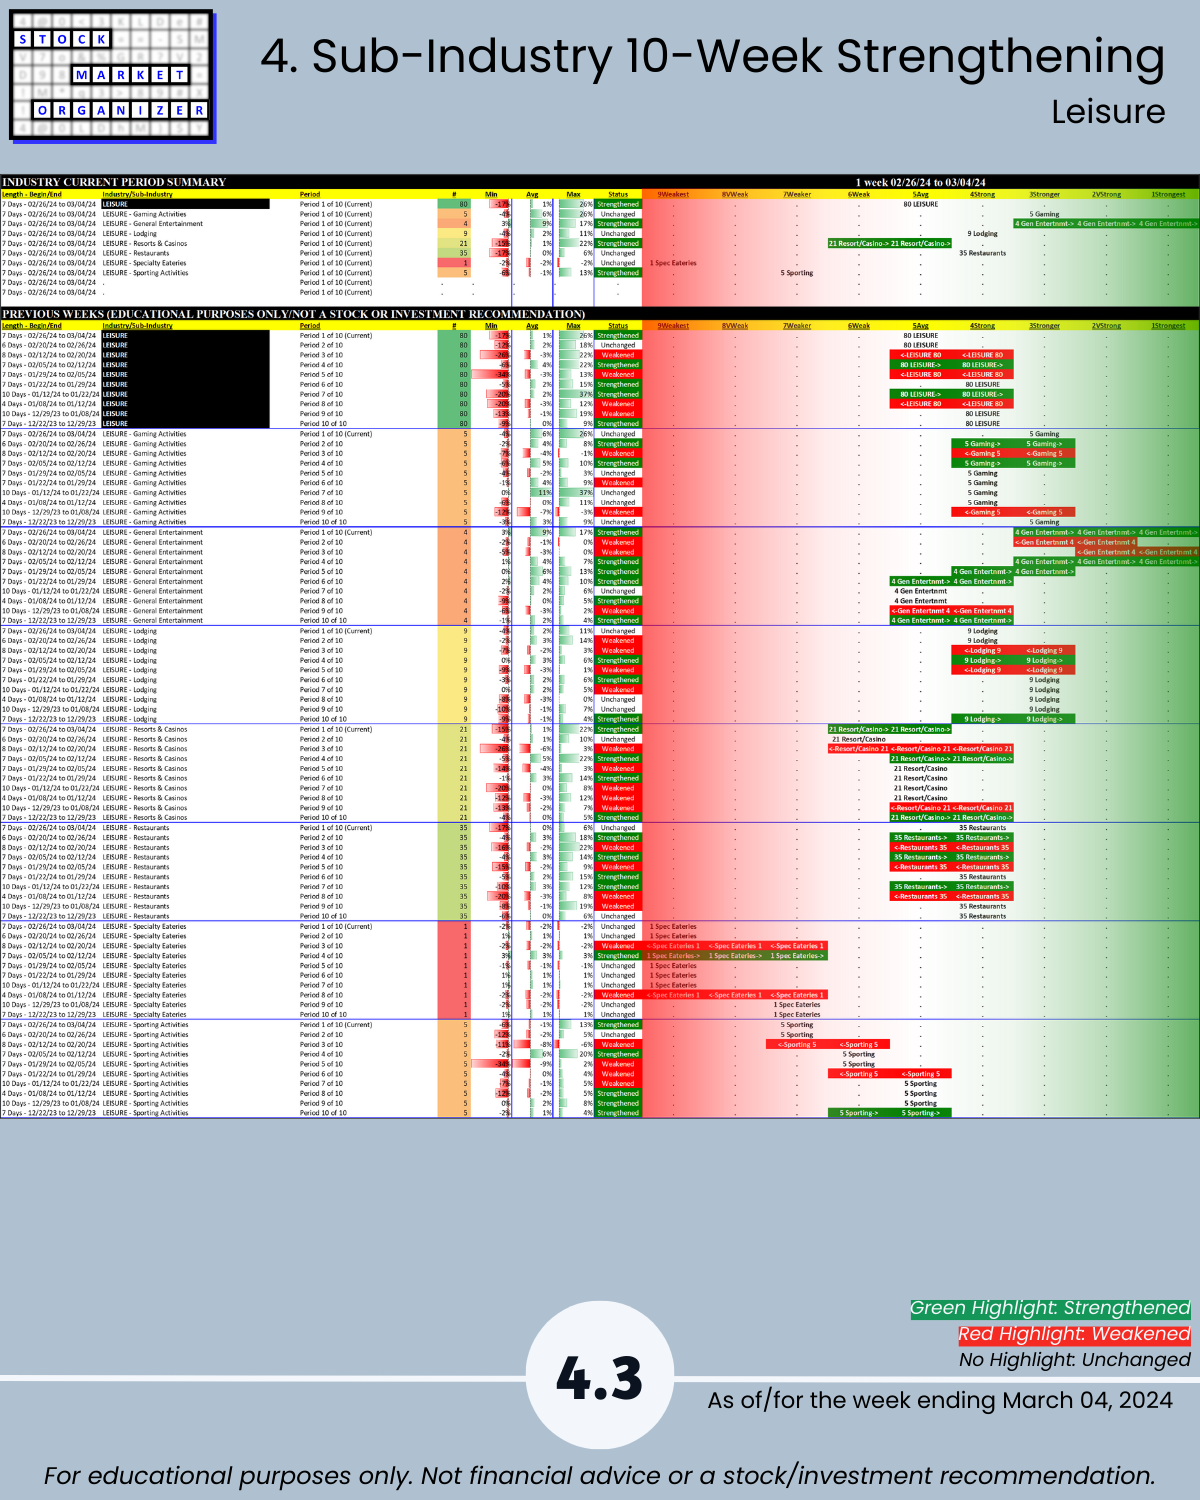
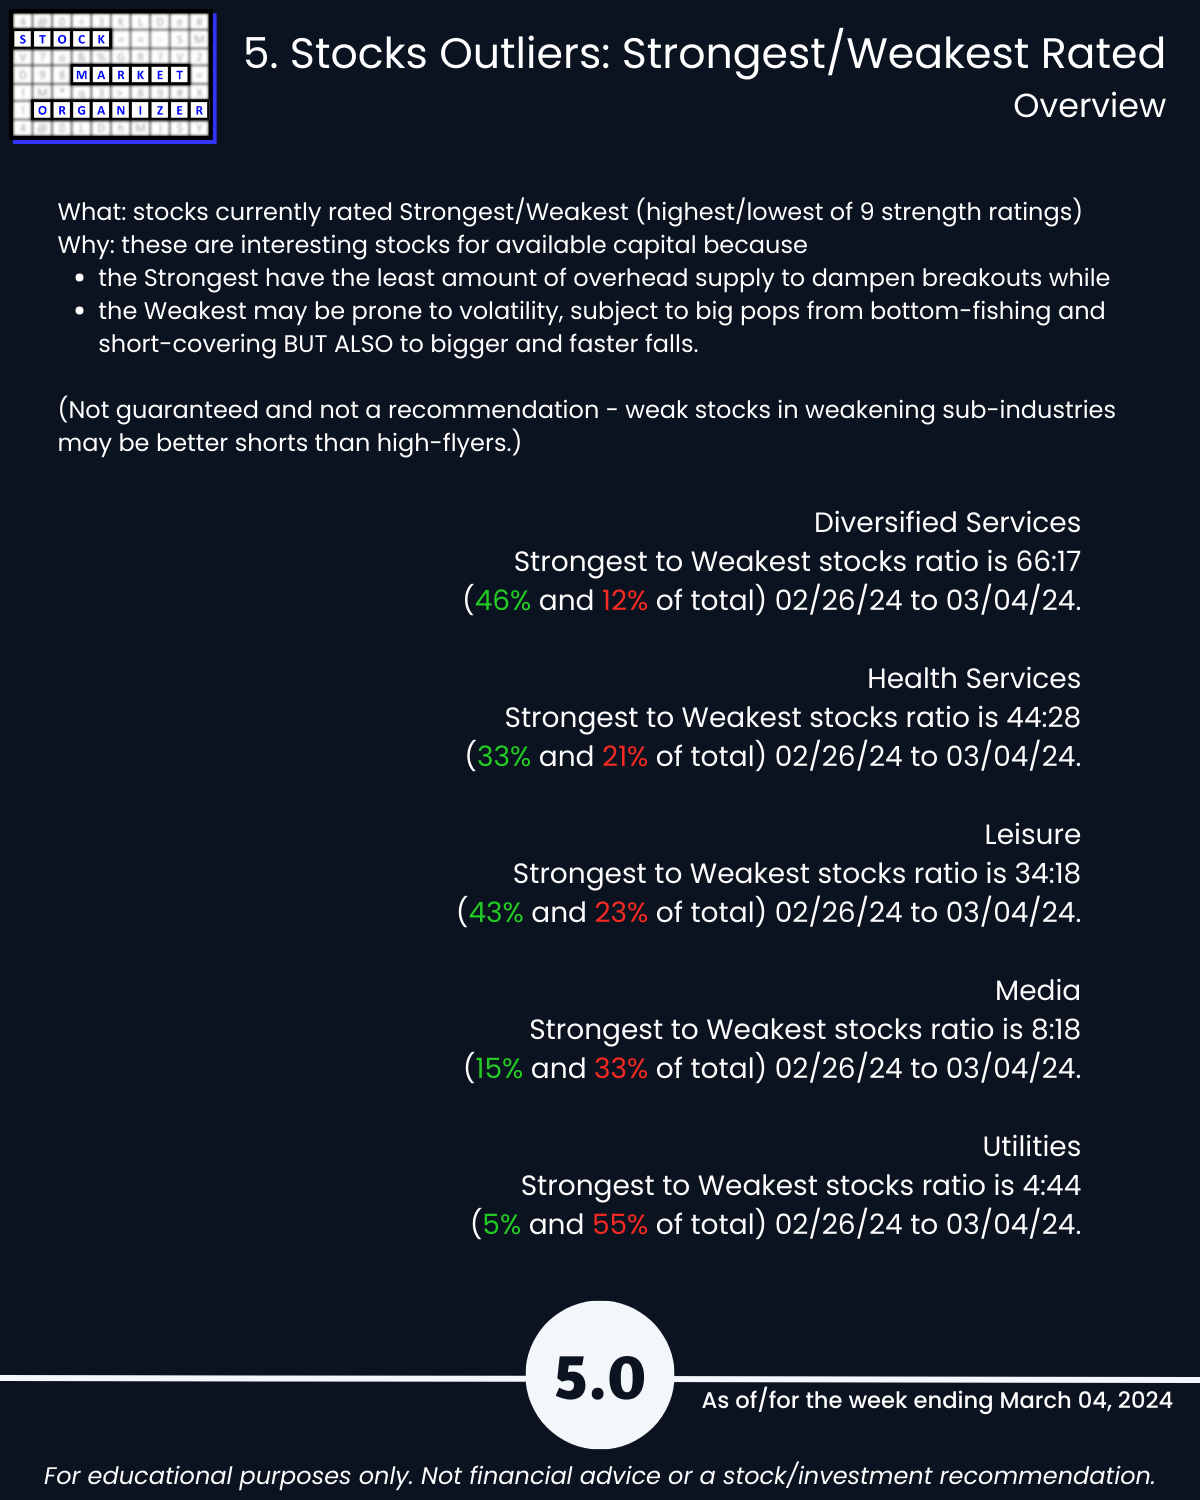
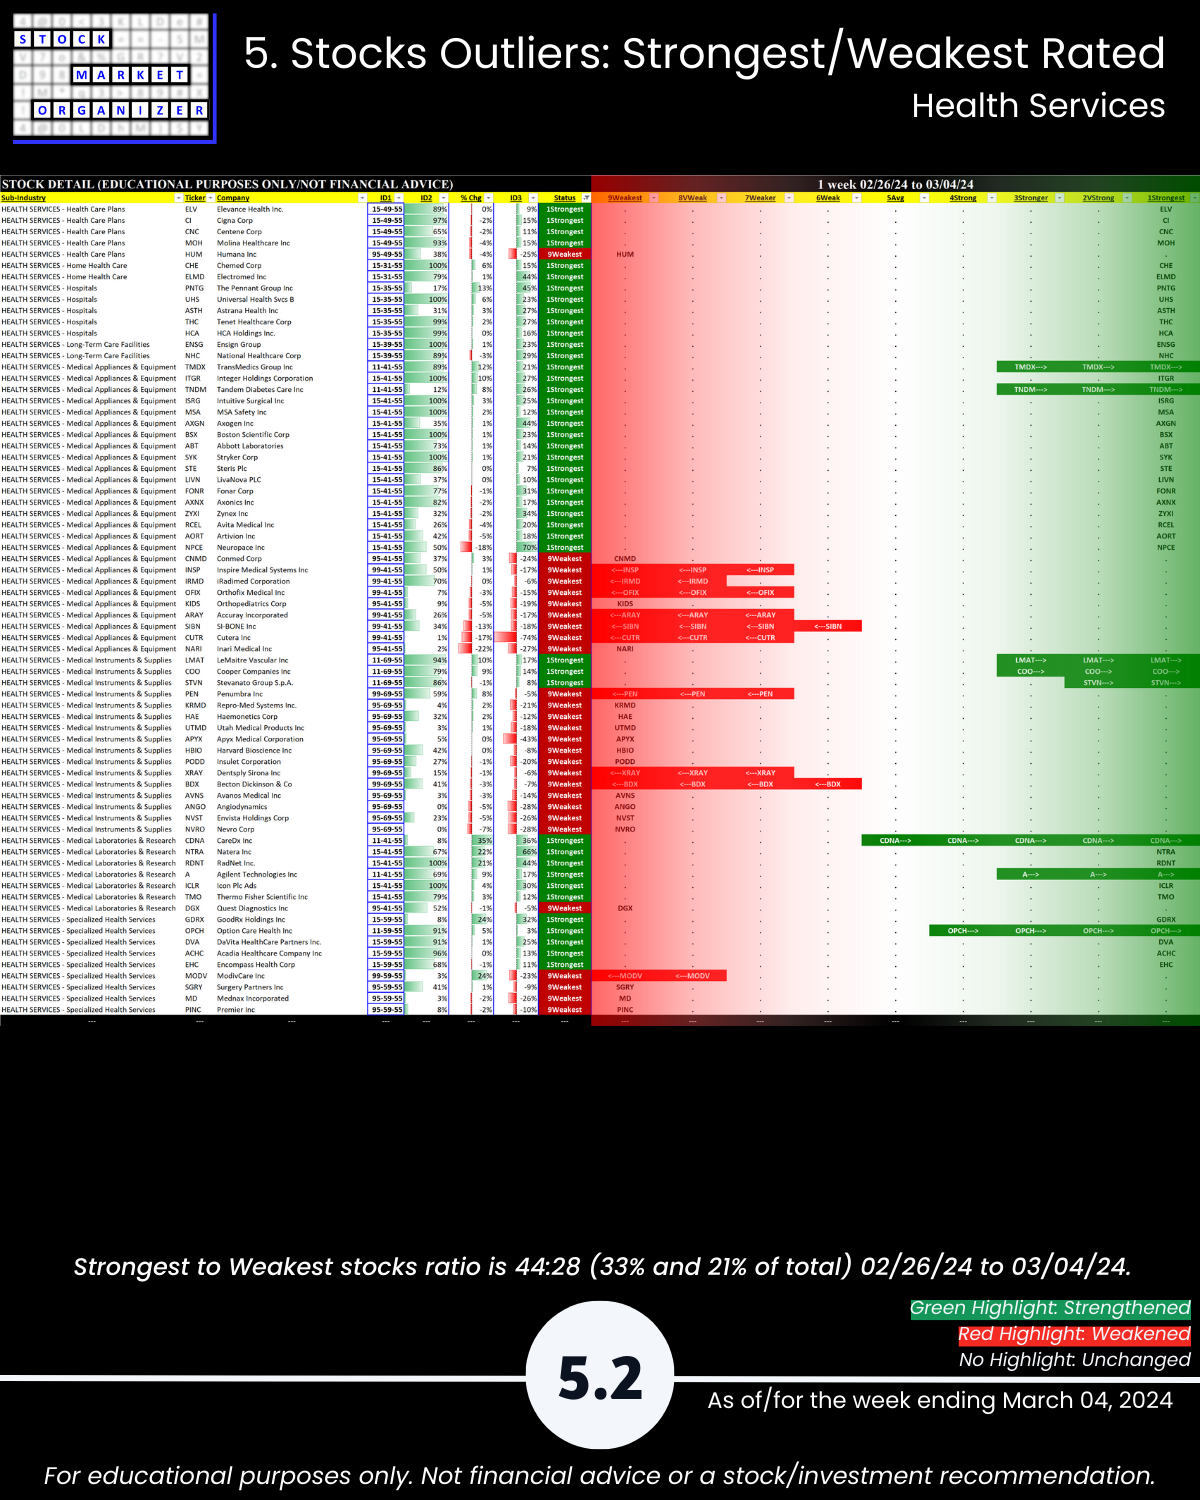
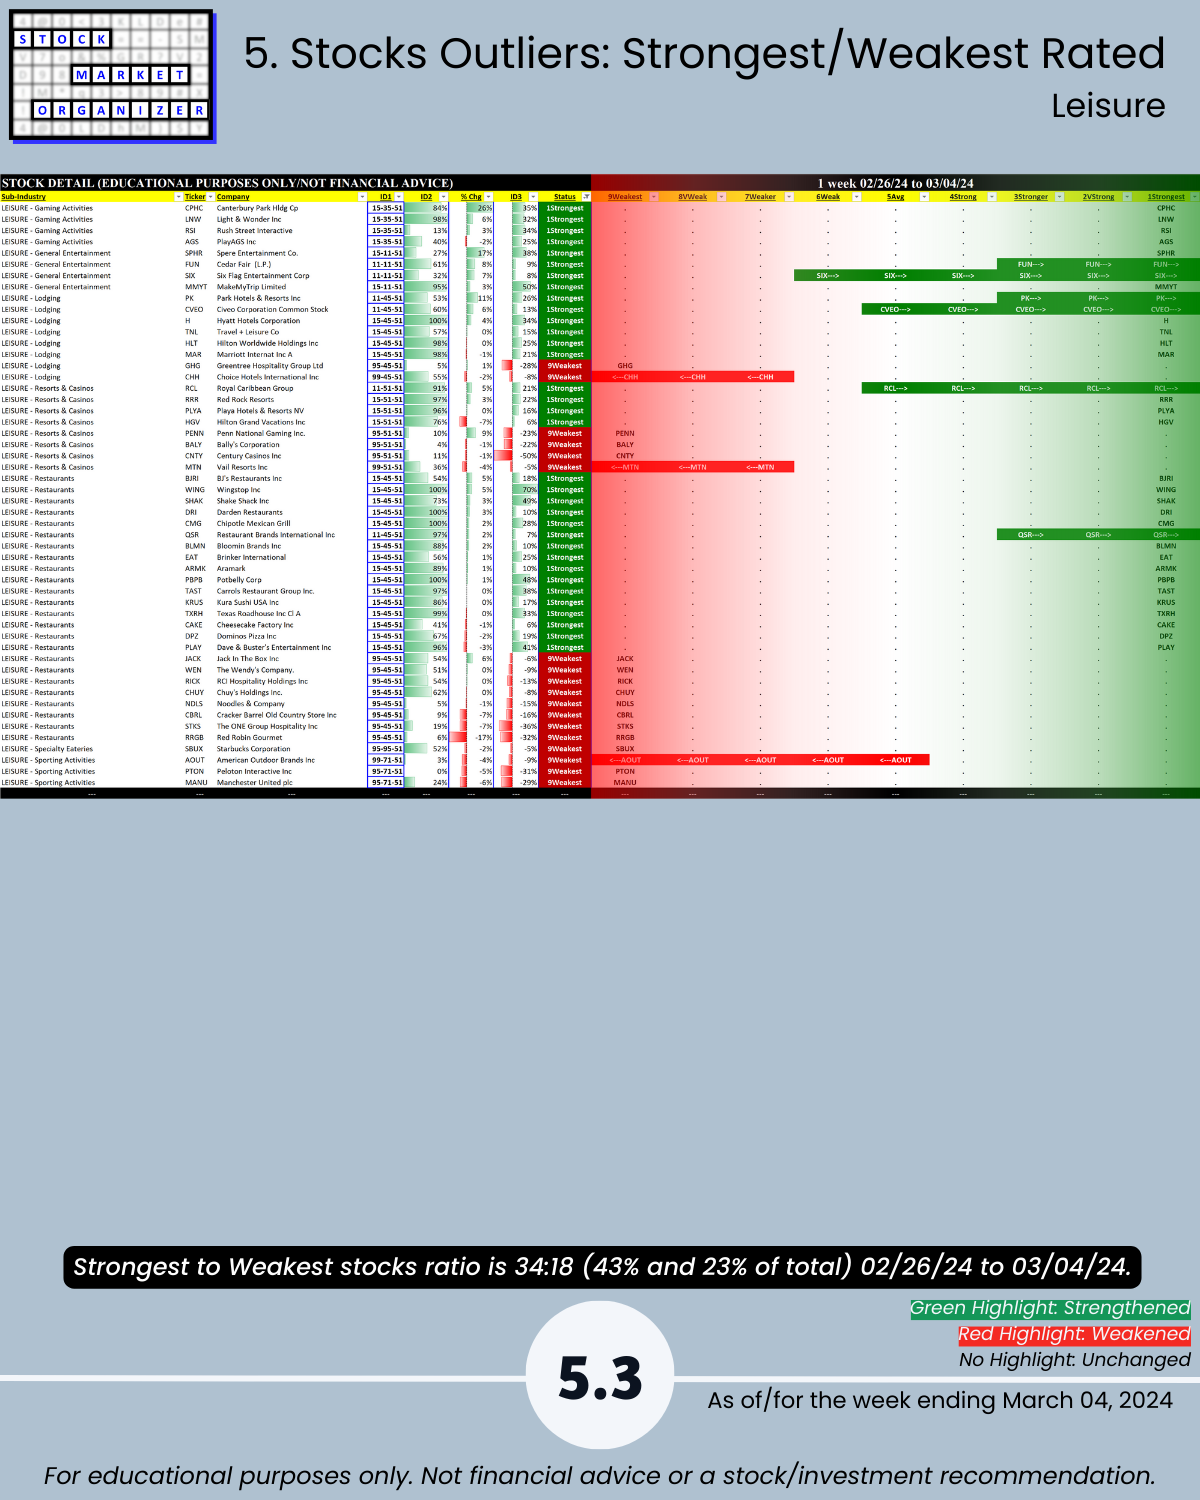
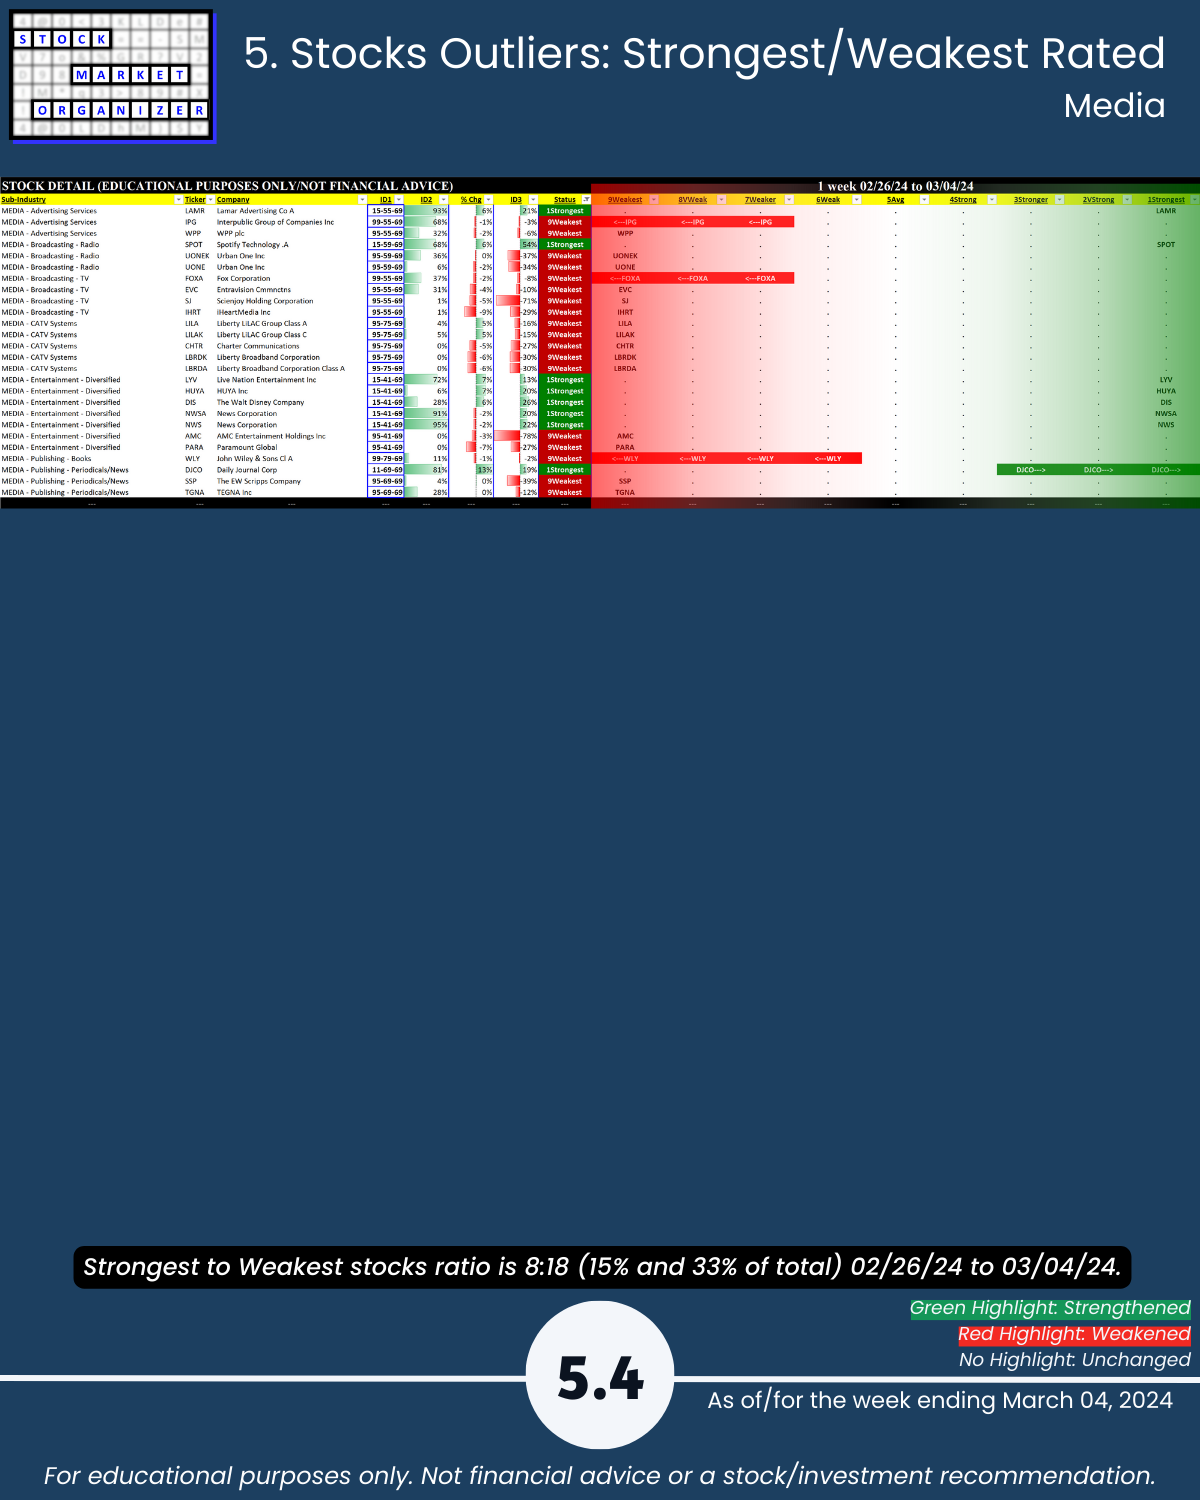
🔹 Stocks rated Strongest:Weakest: Diversified Serv 46%:12%, Leisure 43%:23%, Media 15%:33%, Utilities 5%:55%
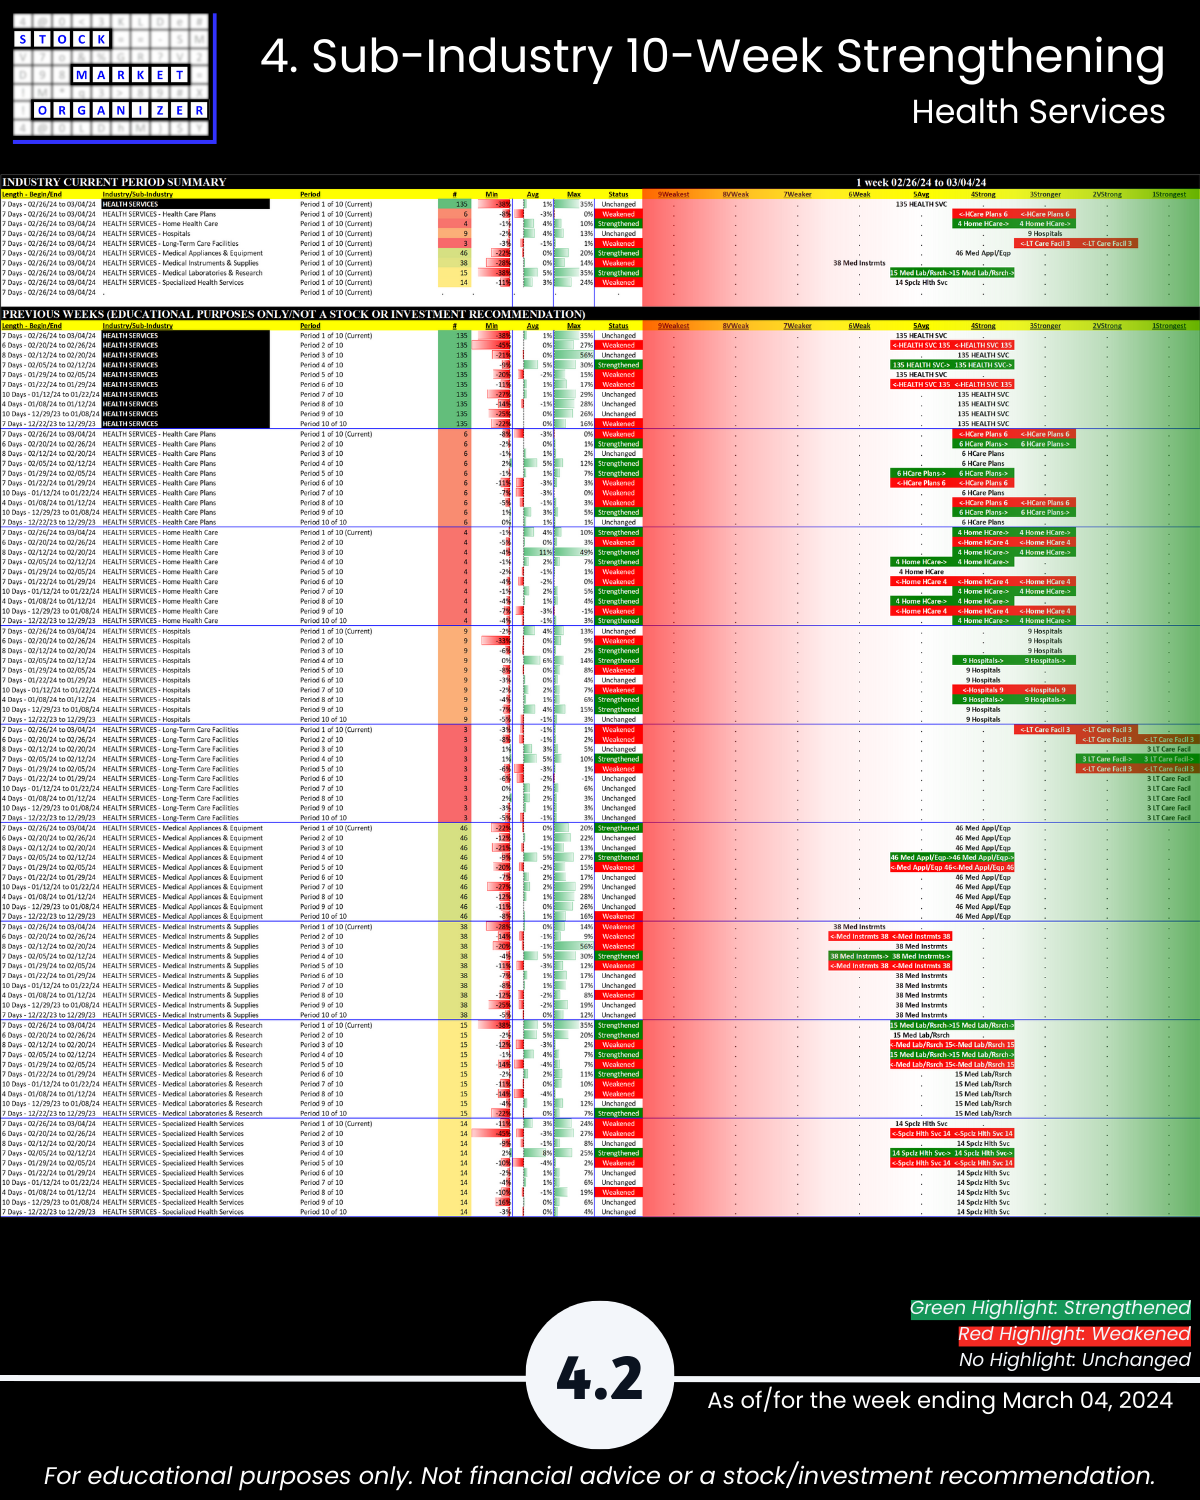
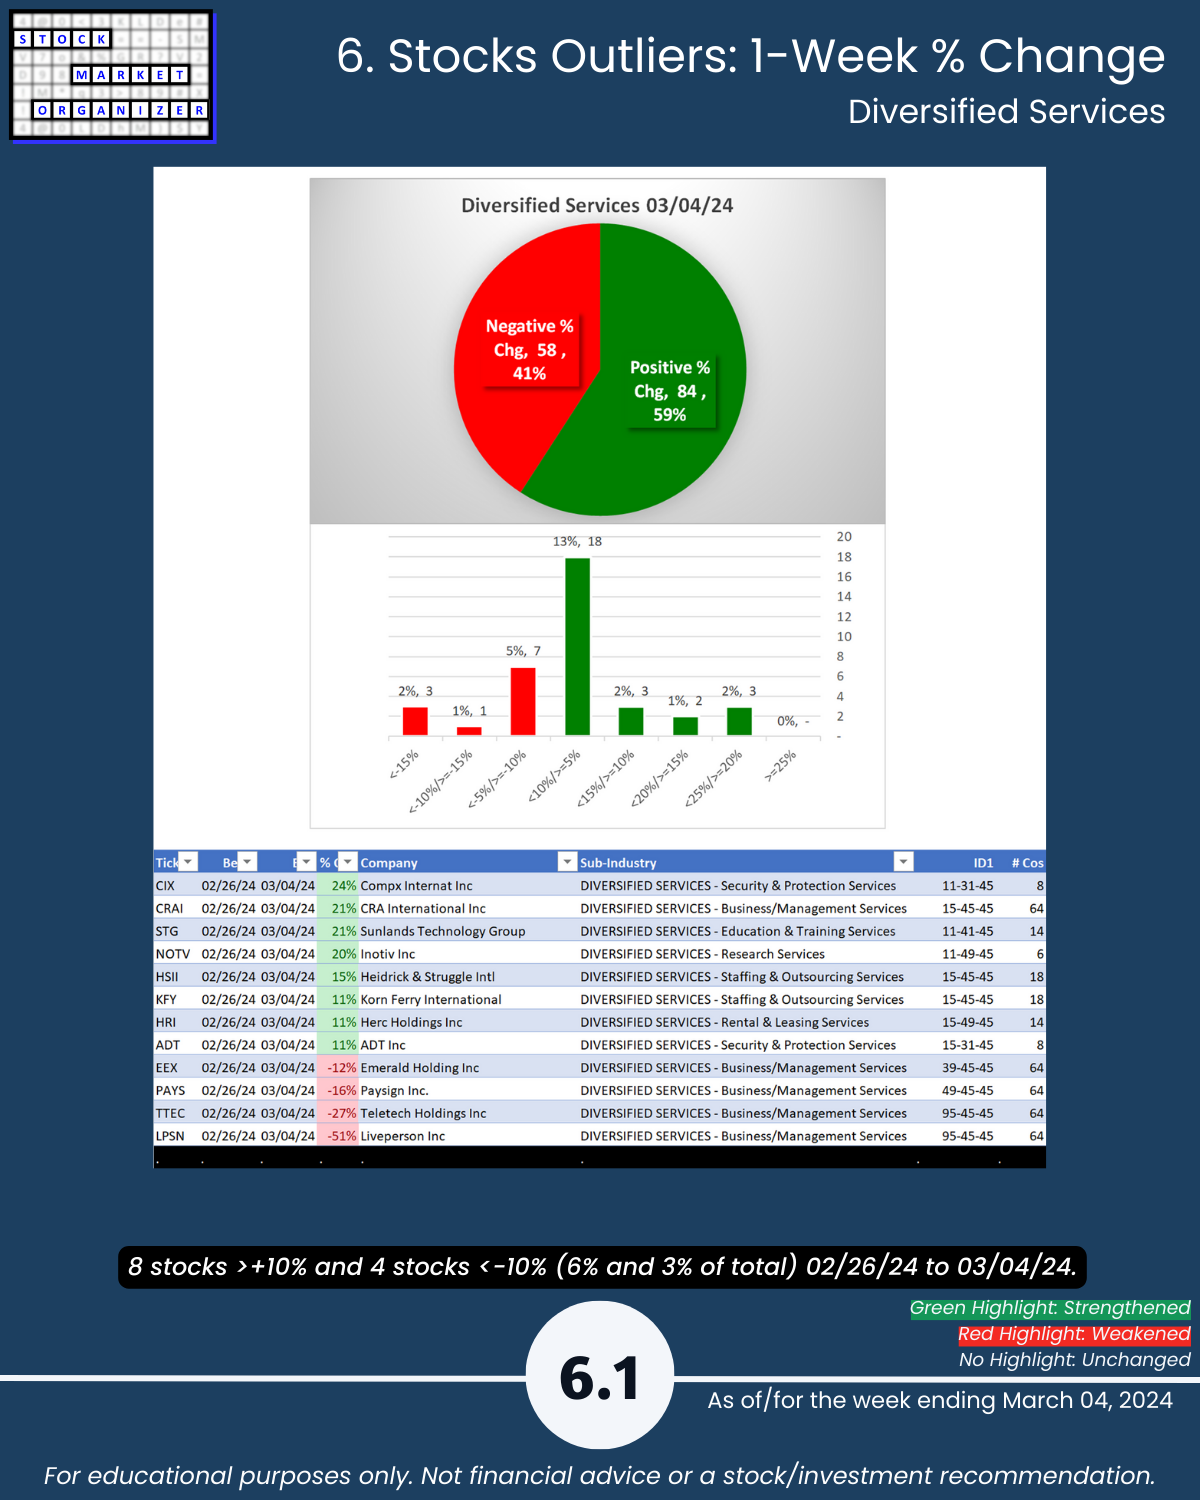
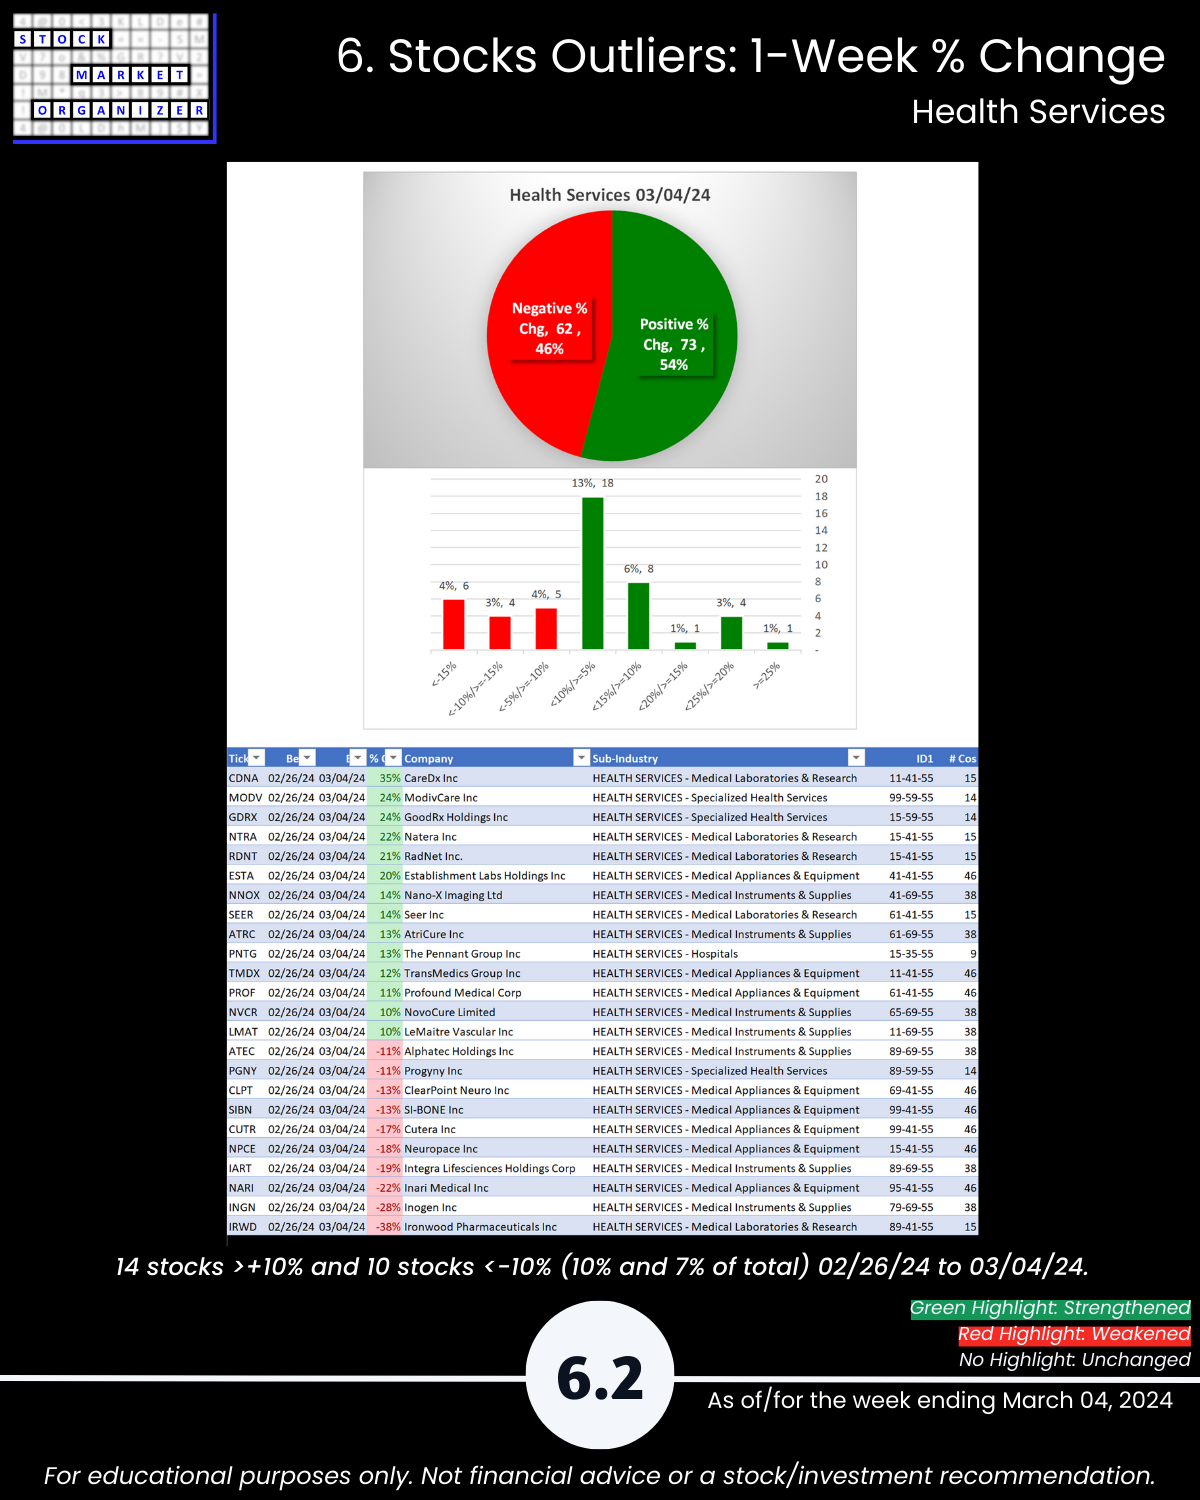
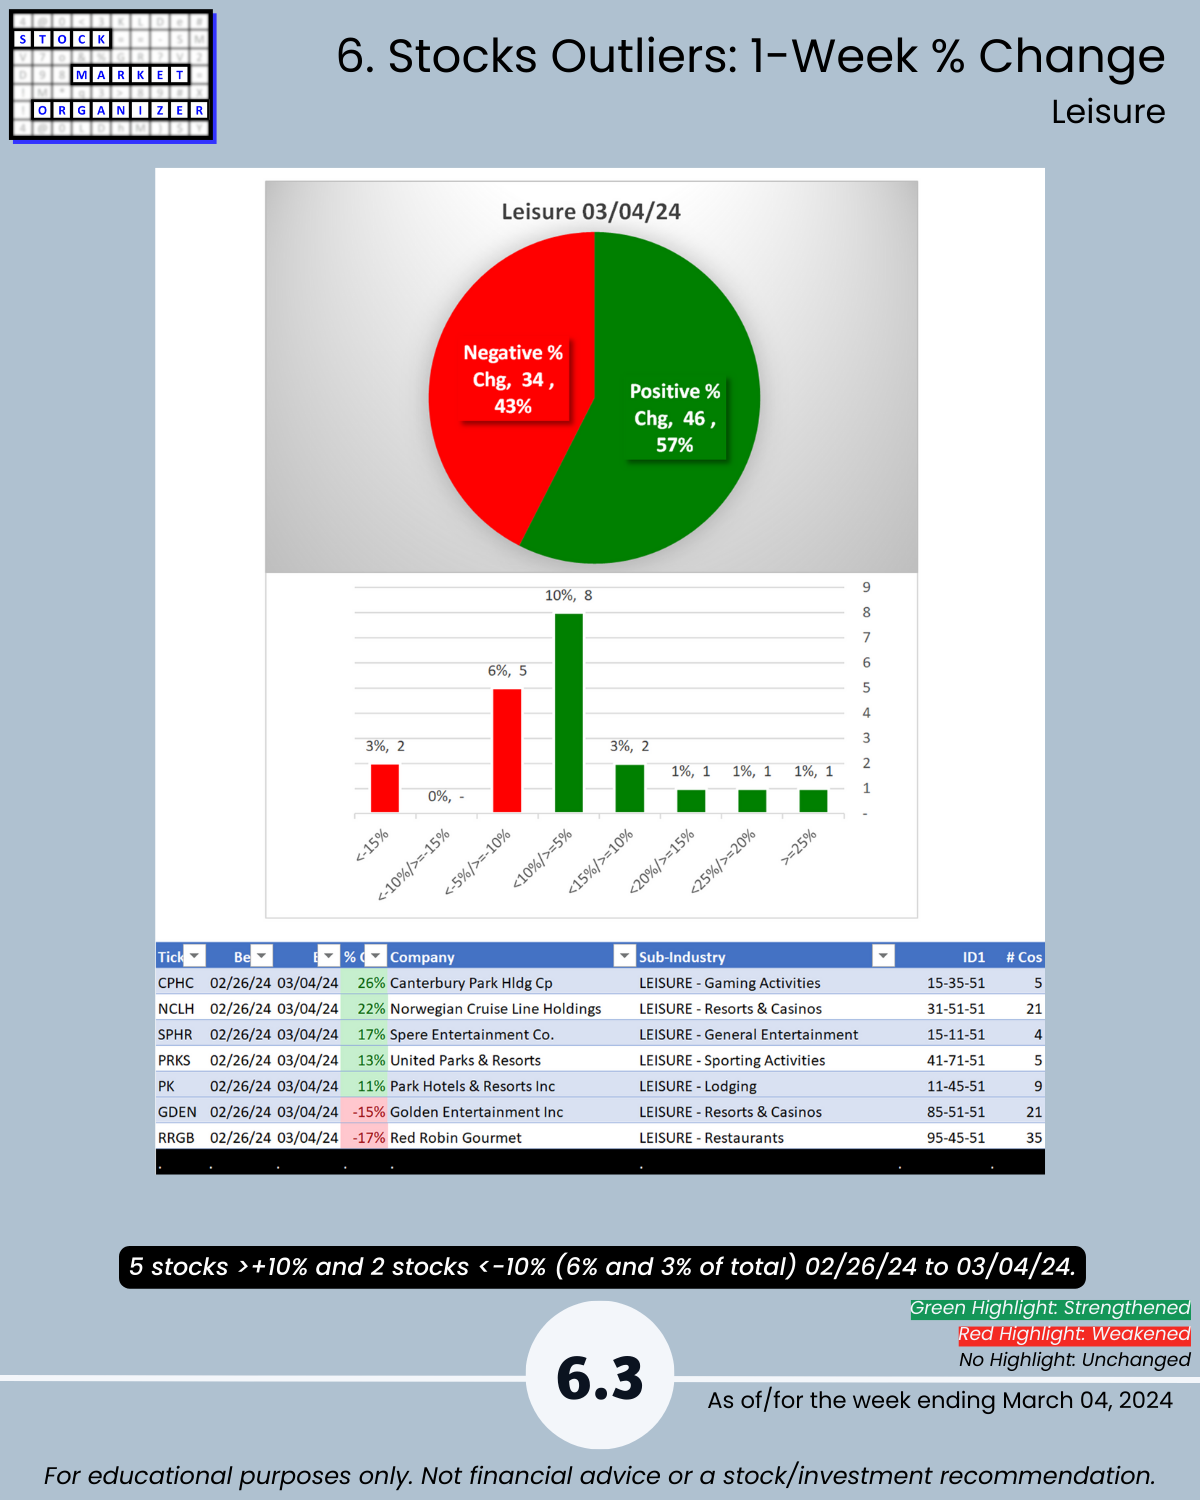
🔹 Outliers: 10% of Health Services >10%; CIX +24%, CRAI +21%, STG +21%, NOTV +20%, LPSN -51%, TTEC -27%; CDNA +35%, MODV +24%, GDRX +24%, NTRA +22%,RDNT +21%, ESTA +20%, IRWD -38%, INGN -28%, NARI -22%; CPHC +26%, NCLH +22%; STGW -20%
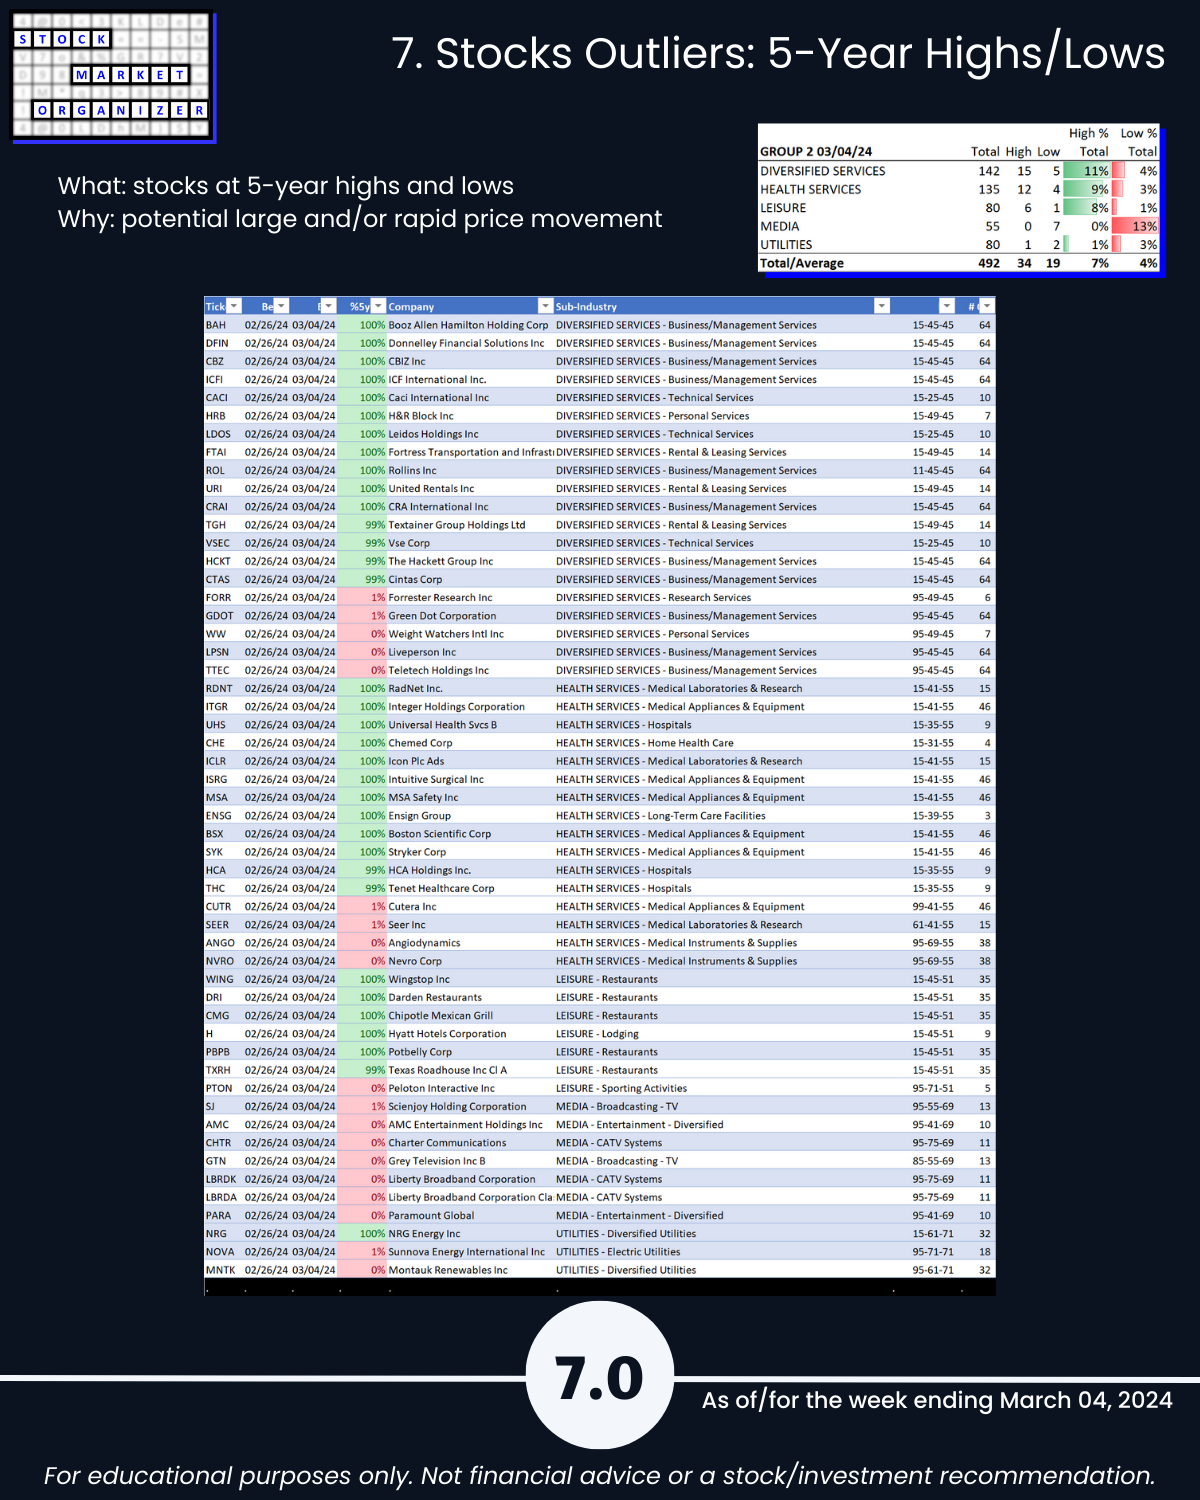
🔹 5-Year Highs/Lows %: Leisure 11% of stocks at highs, Media 13% at lows
This report may particularly be of interest if the following 5 concepts resonate with you:
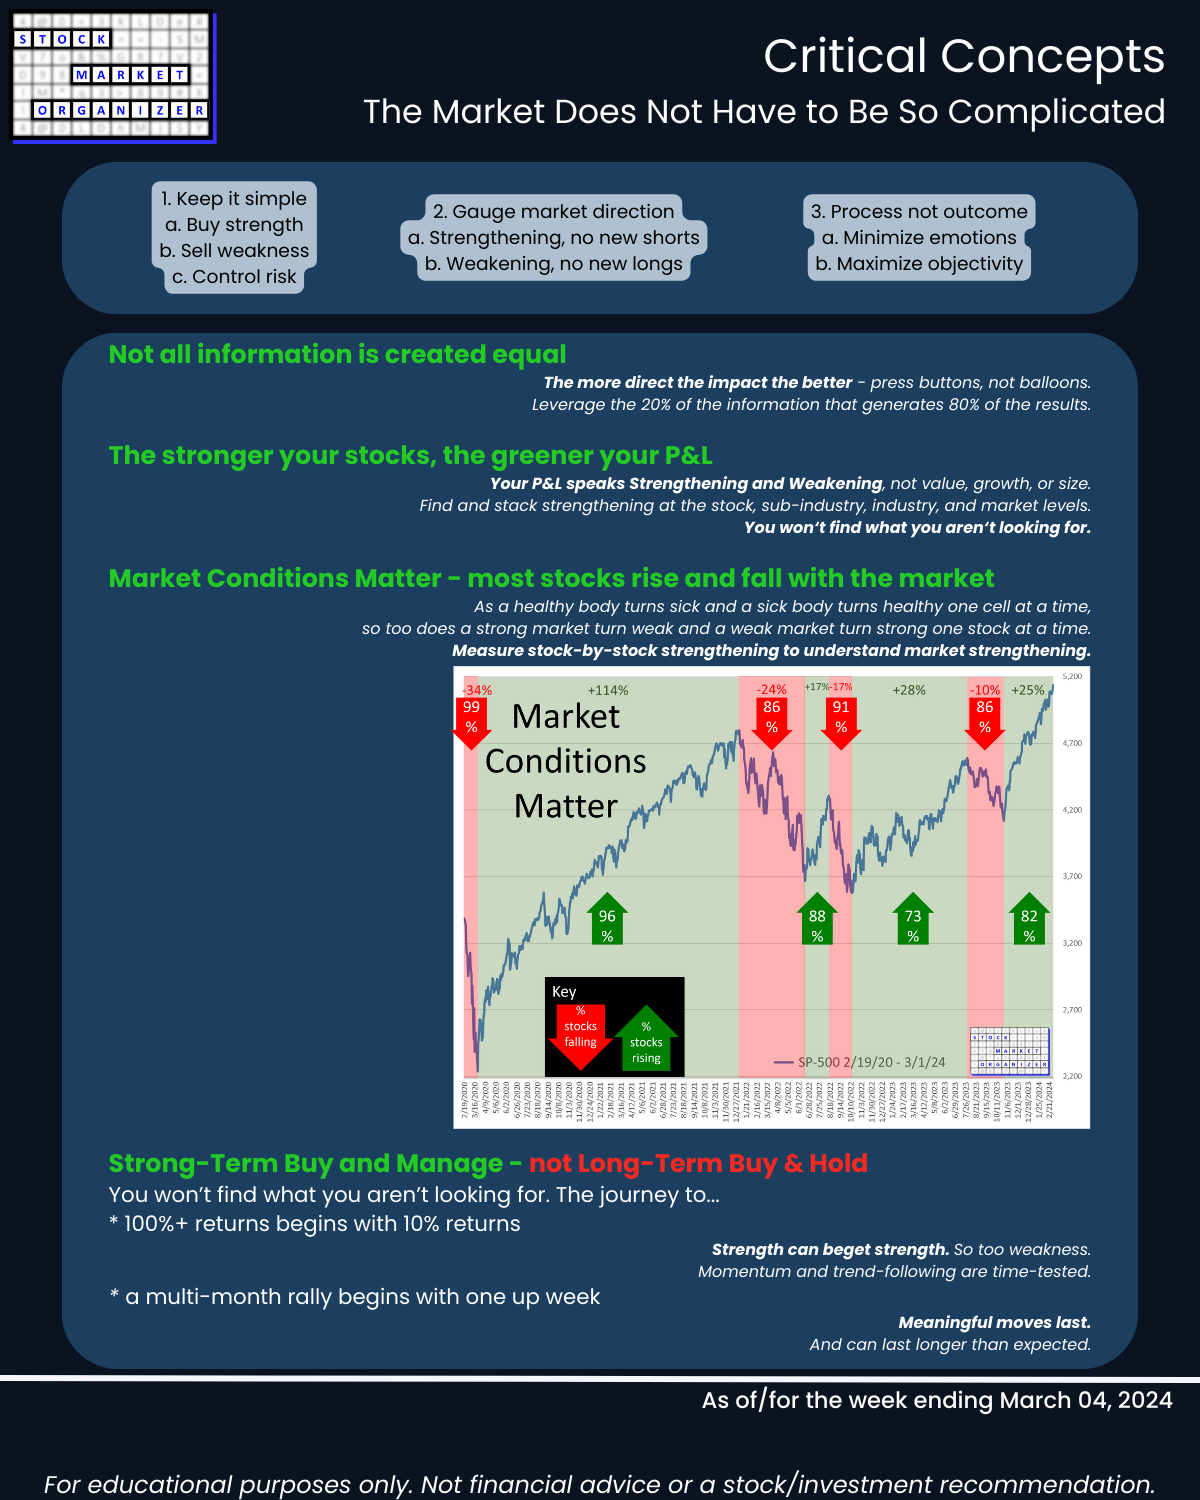
- The stronger your stocks, the greener your P&L.
- The journey to 100%+ returns begins with 10% returns.
- The journey to a multi-month rally begins with one up week.
- Most stocks do what the market does. (While the market can only do what its underlying stocks, sub-industries, and industries do.)
- 80/20: not all information is created equal. (Press buttons, not balloons.)
Following are galleries with page-by-page views of this report.
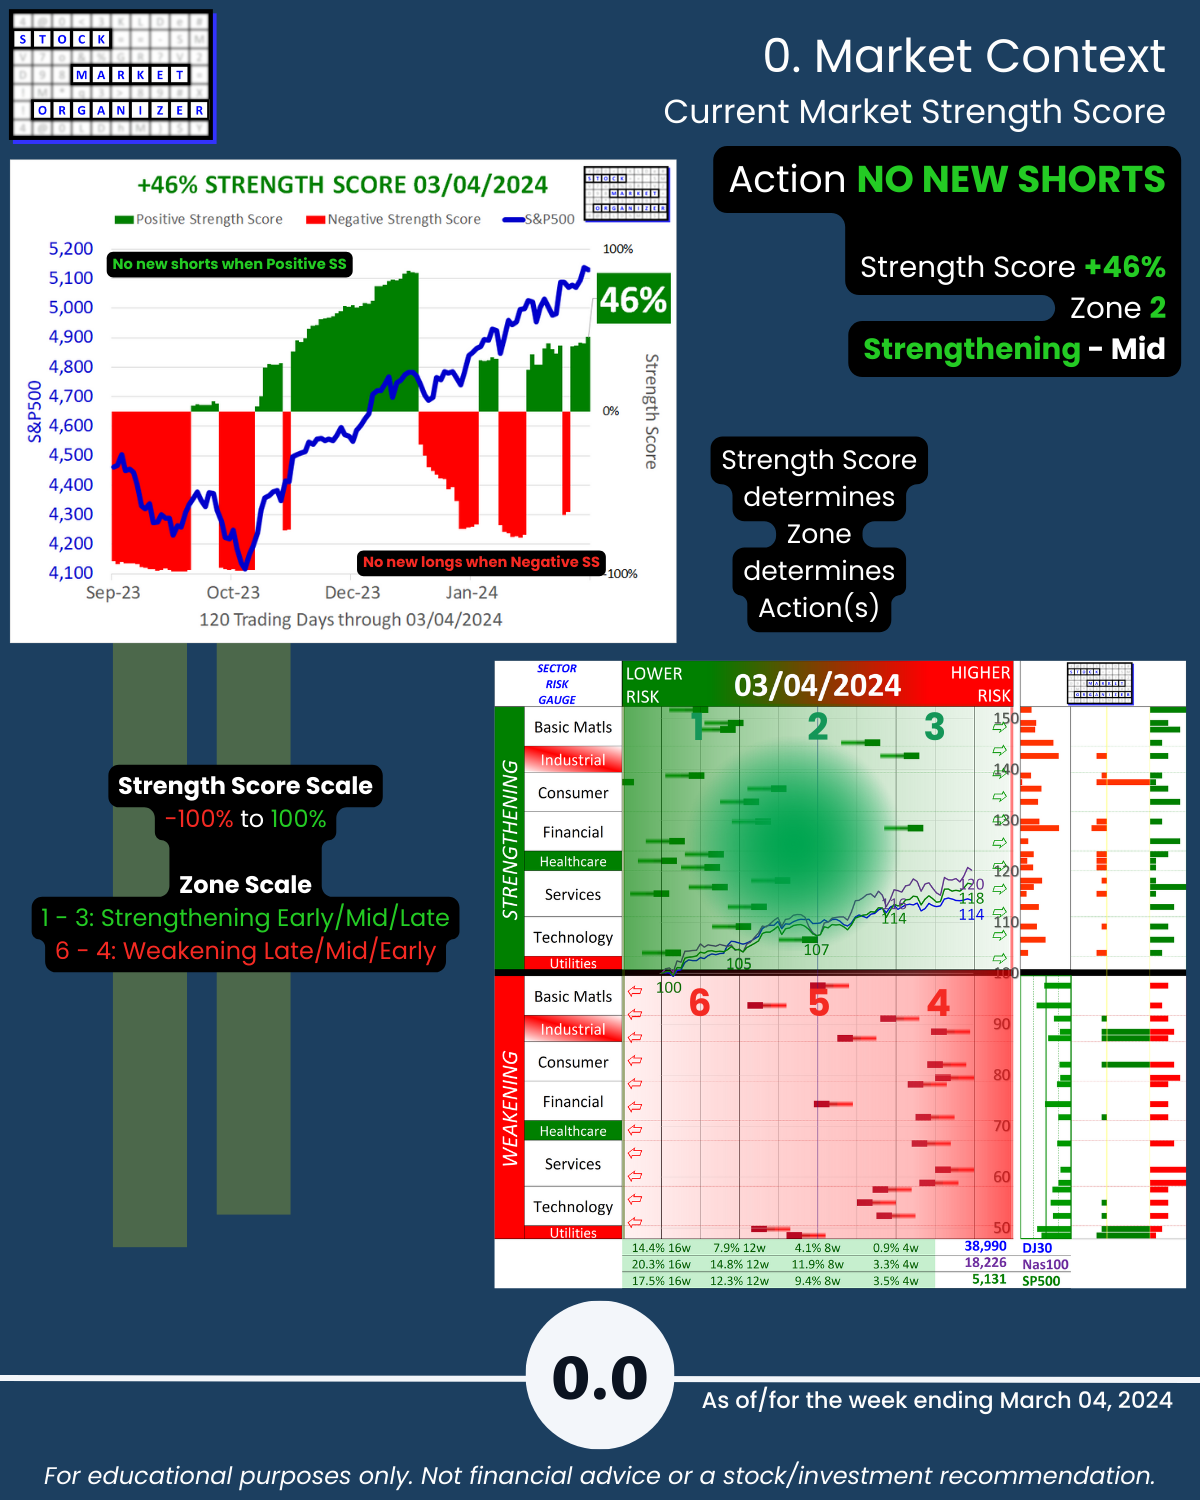
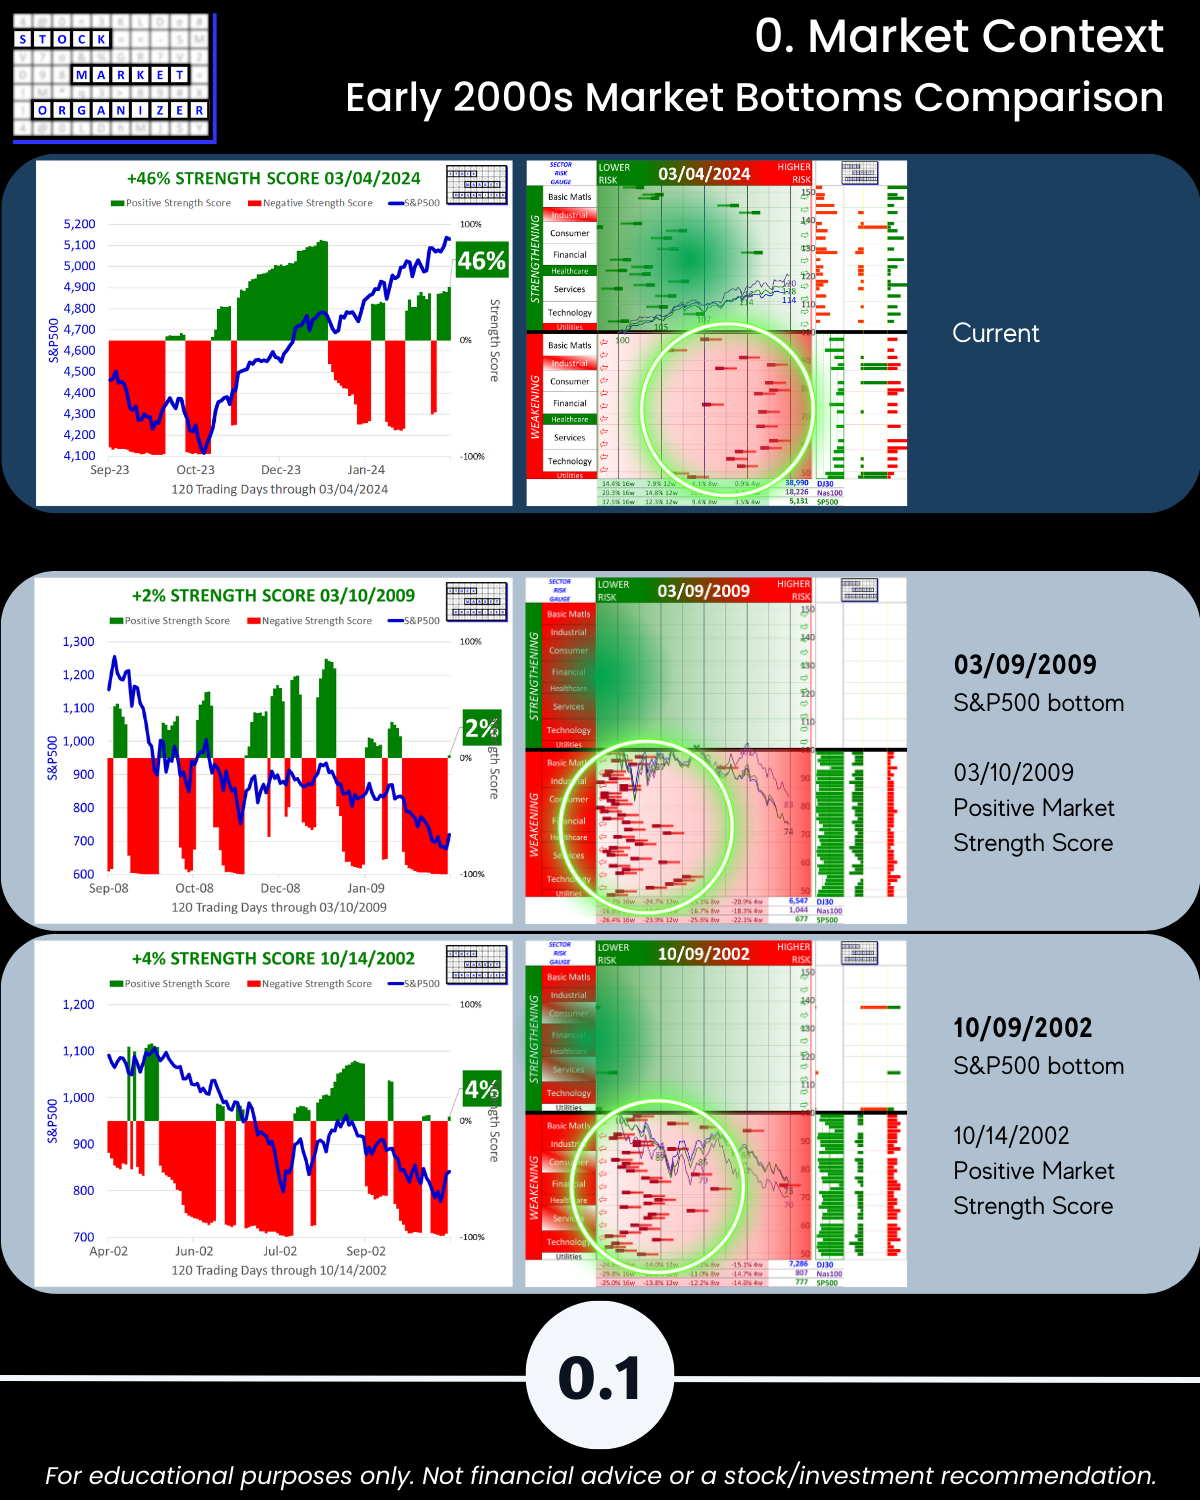
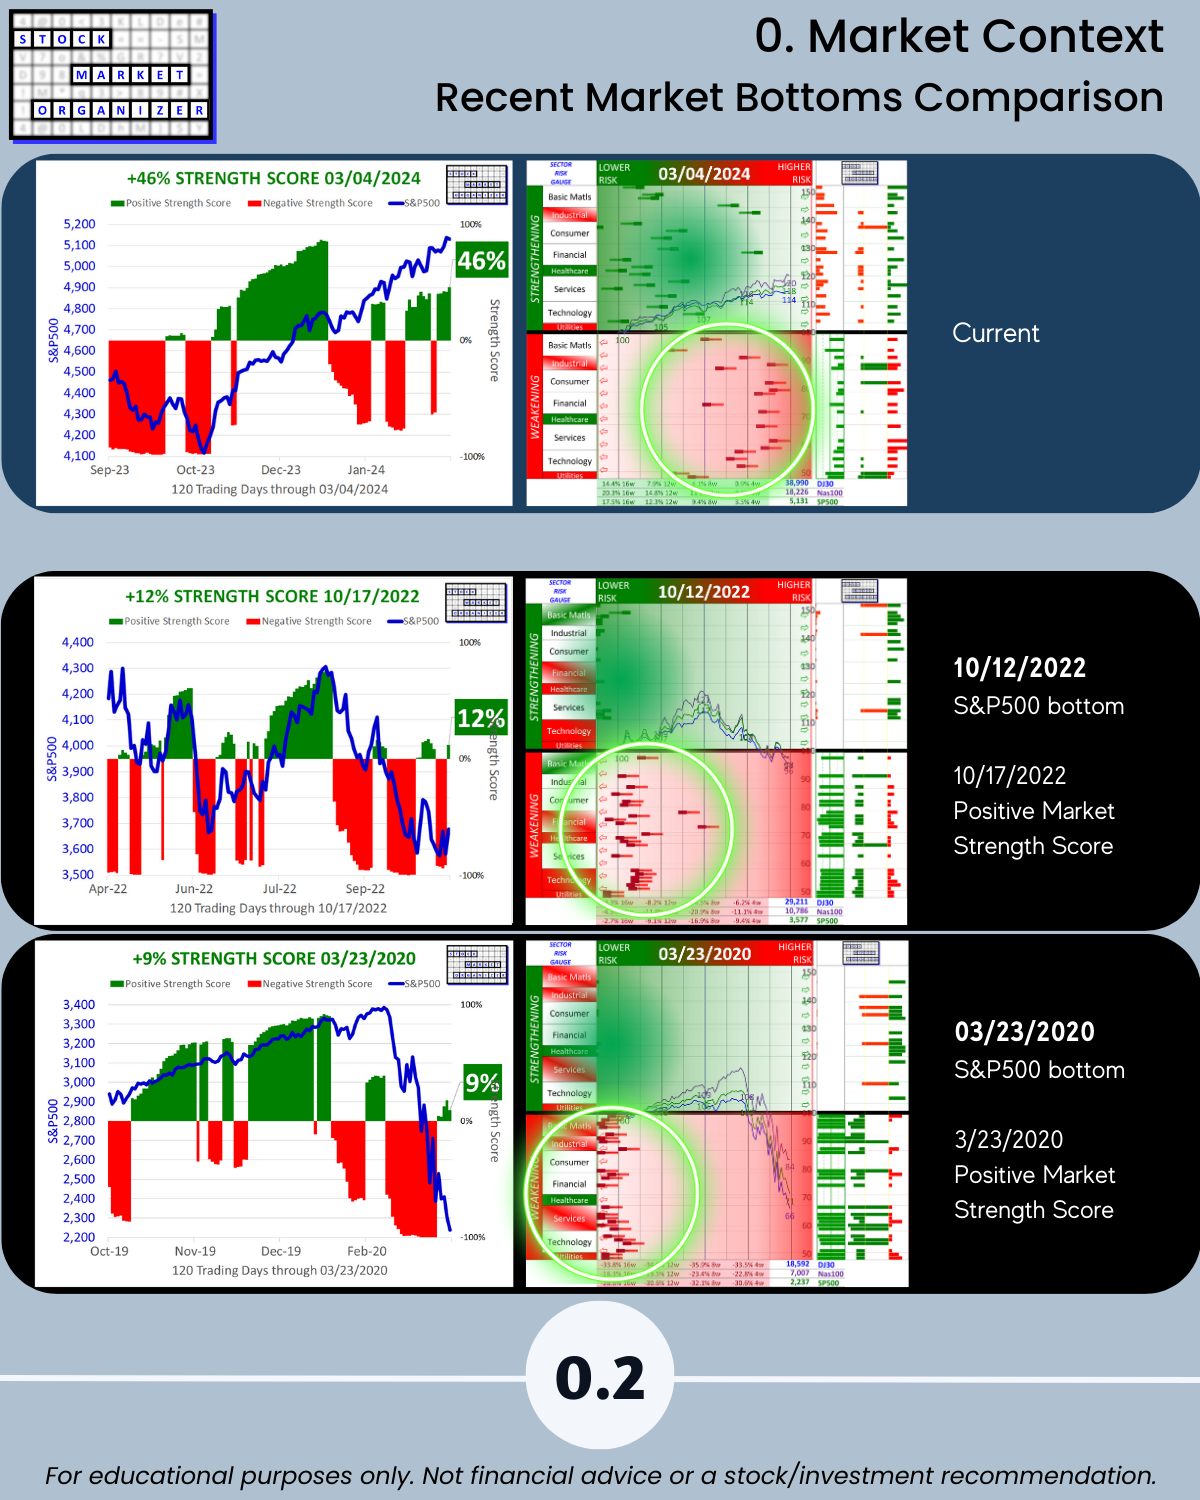
0. Market Context
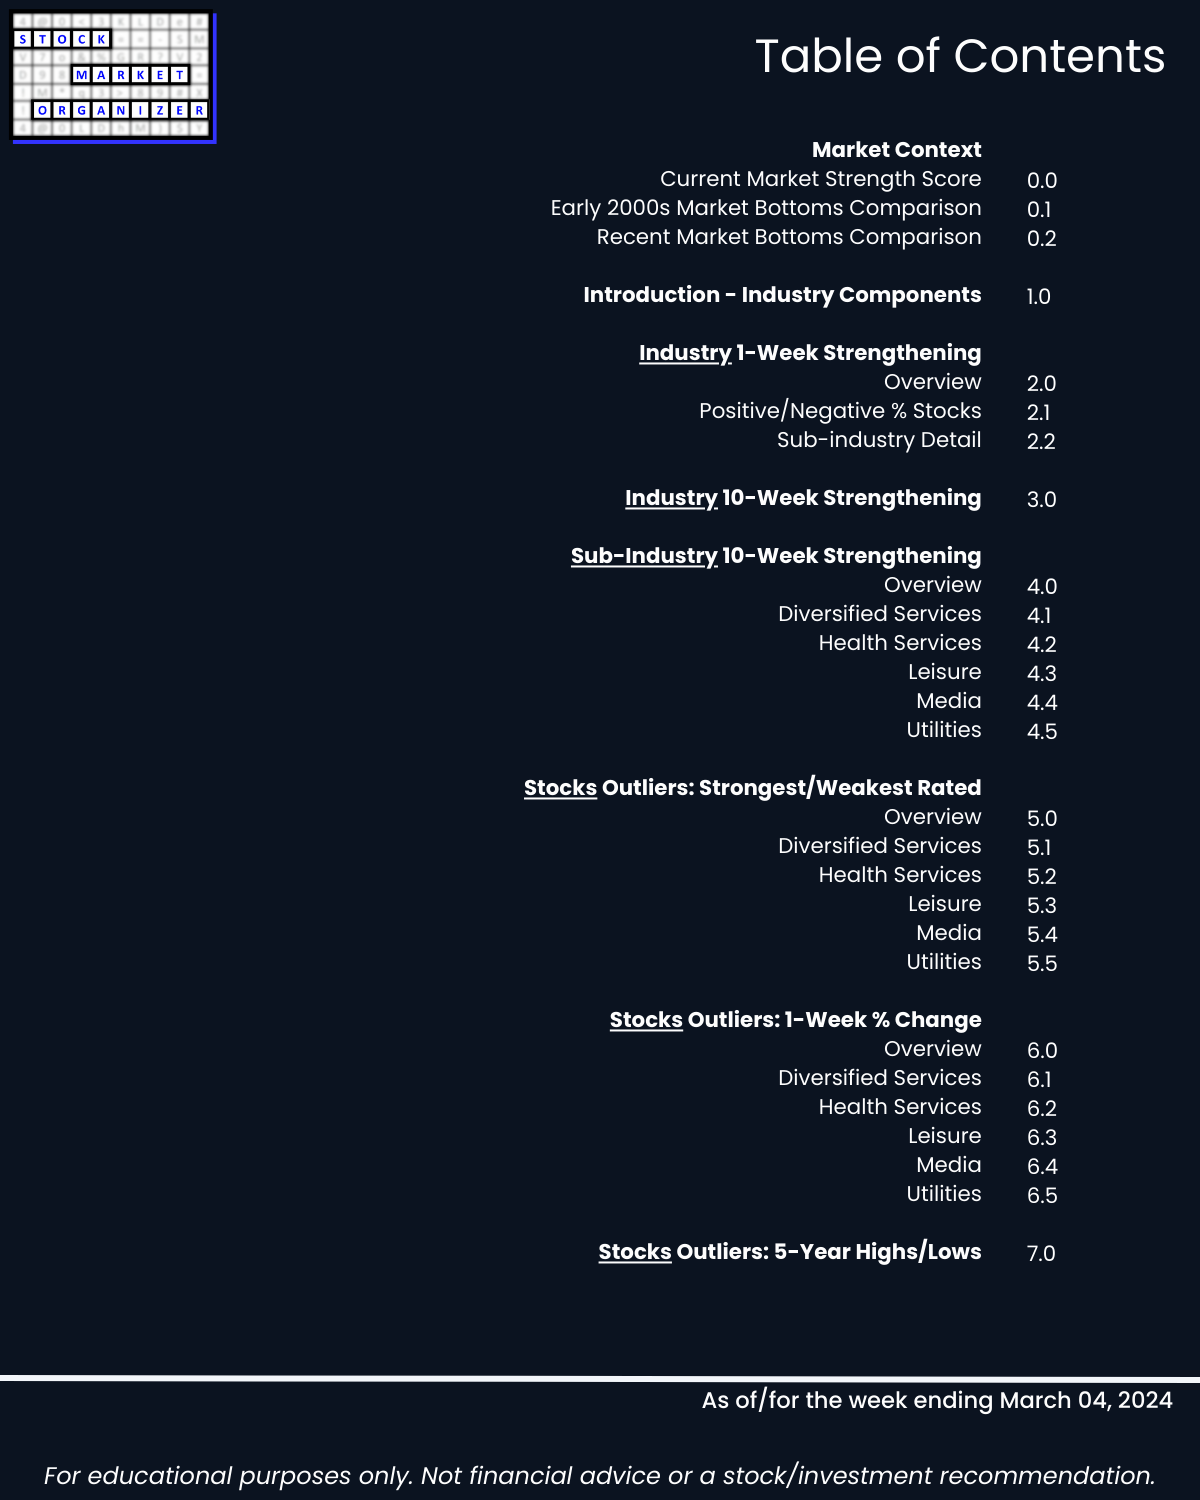
1. Introduction
2. Industry 1-Week Strengthening
3. Industry 10-Week Strengthening
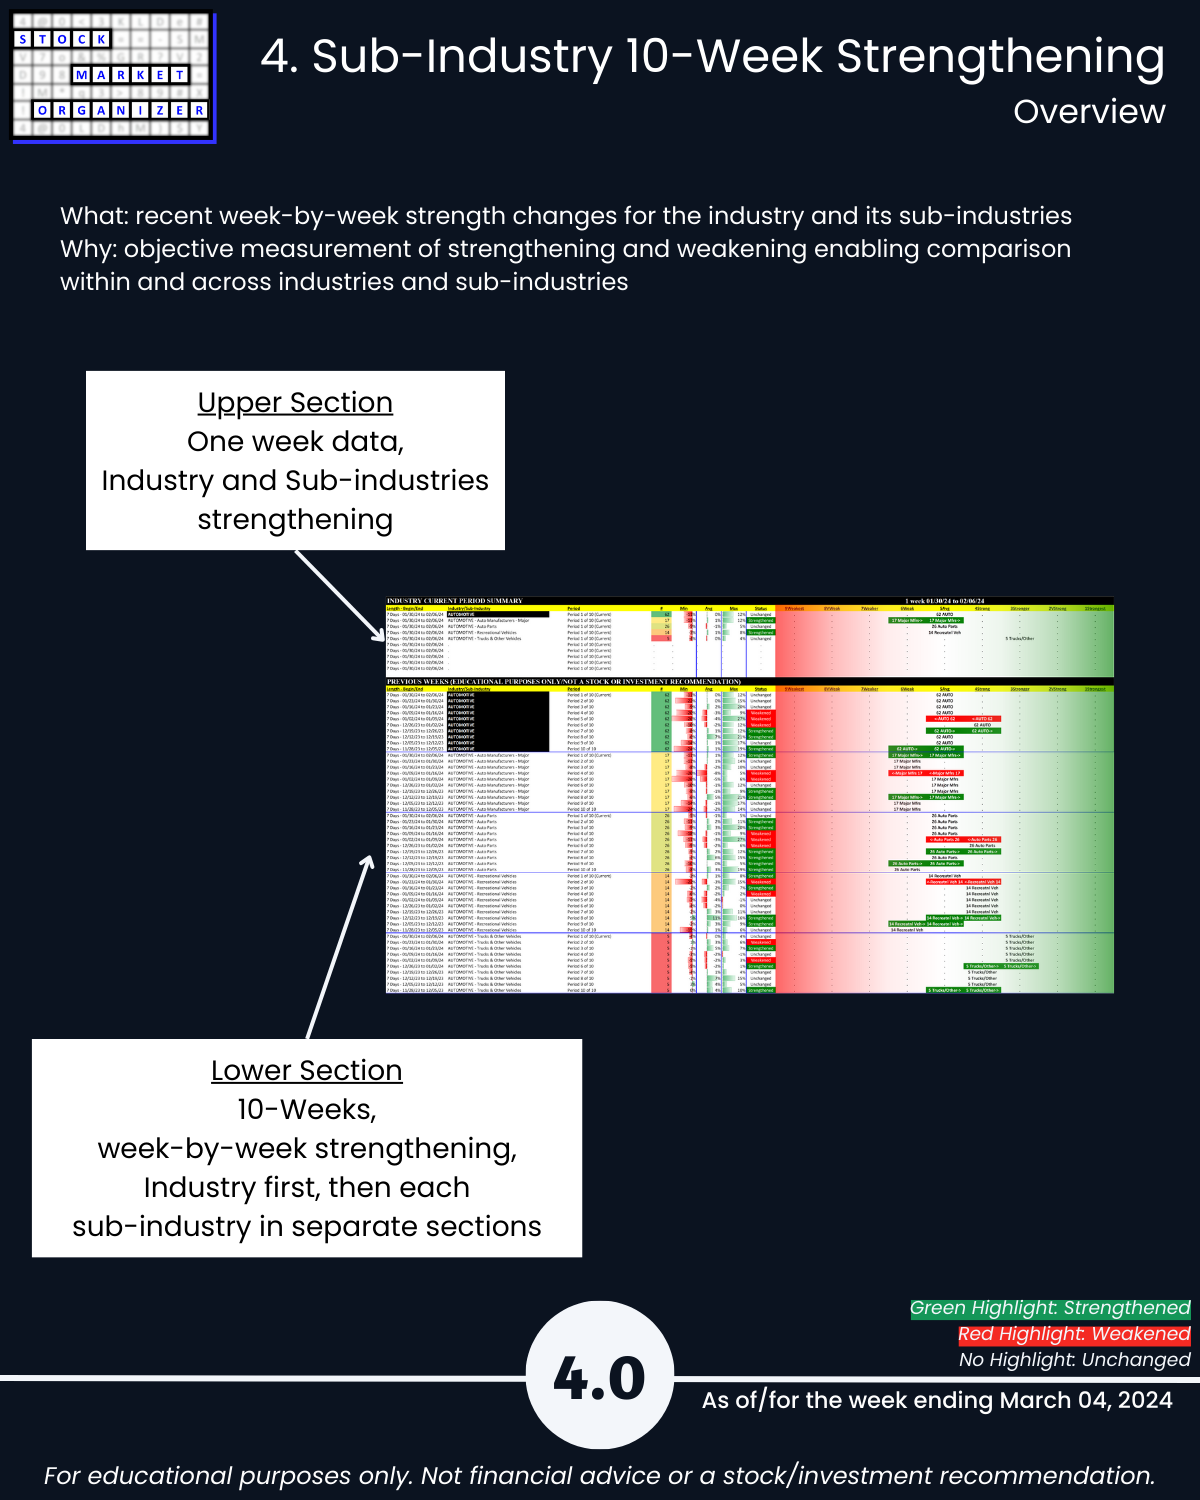
4. Sub-Industry 10-Week Strengthening
5. Stocks Outliers: Strongest/Weakest Rated
6. Stocks Outliers: 1-Week % Change
7. Stocks Outliers: 5-Year Highs/Lows