SMO Exclusive: Strength Report Group 1 2024-03-26

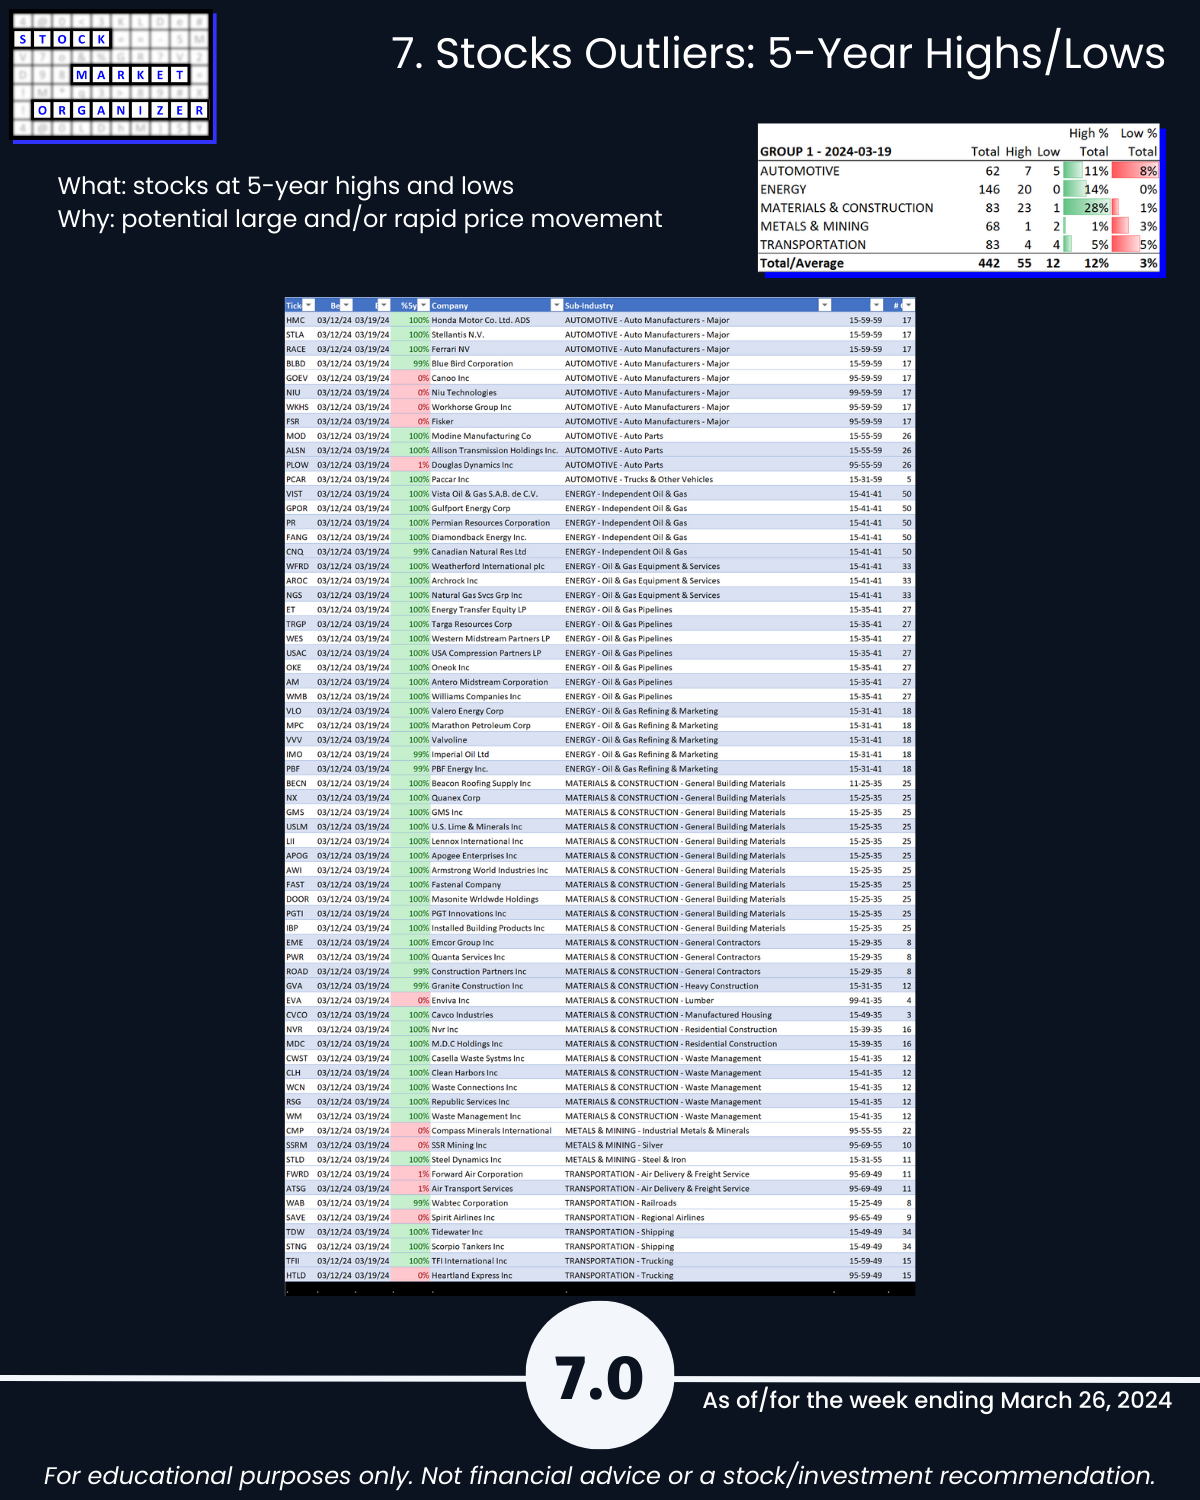
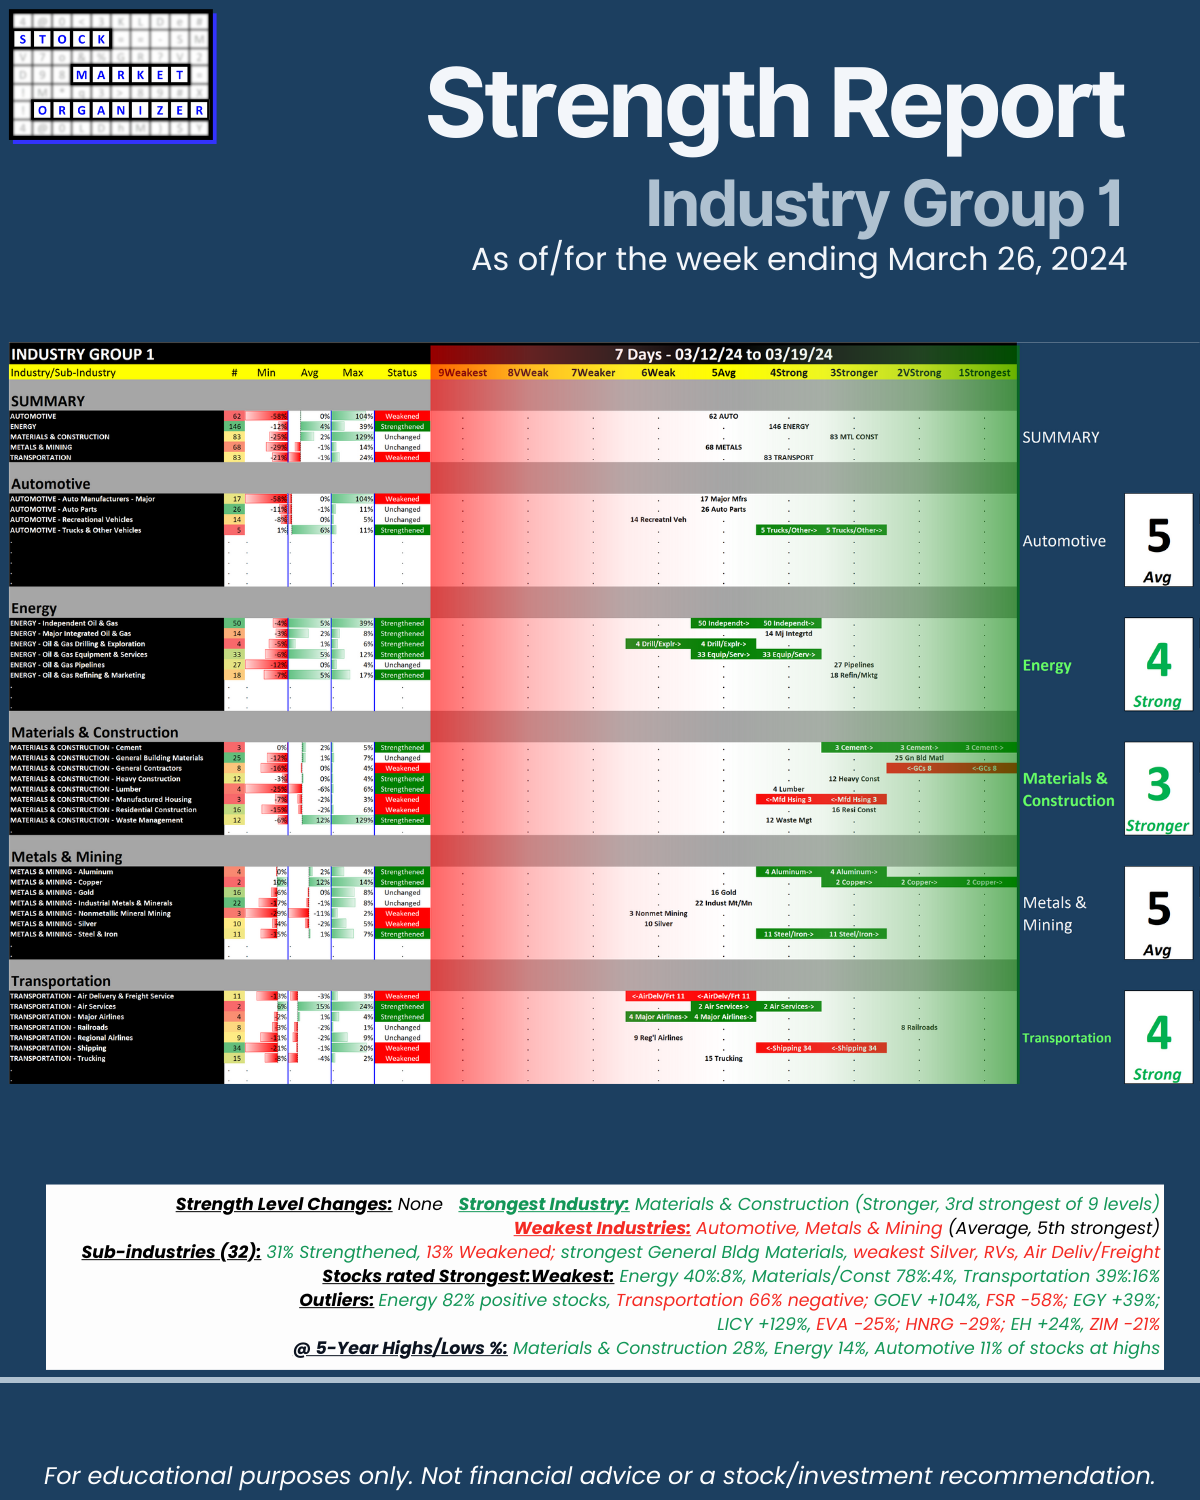
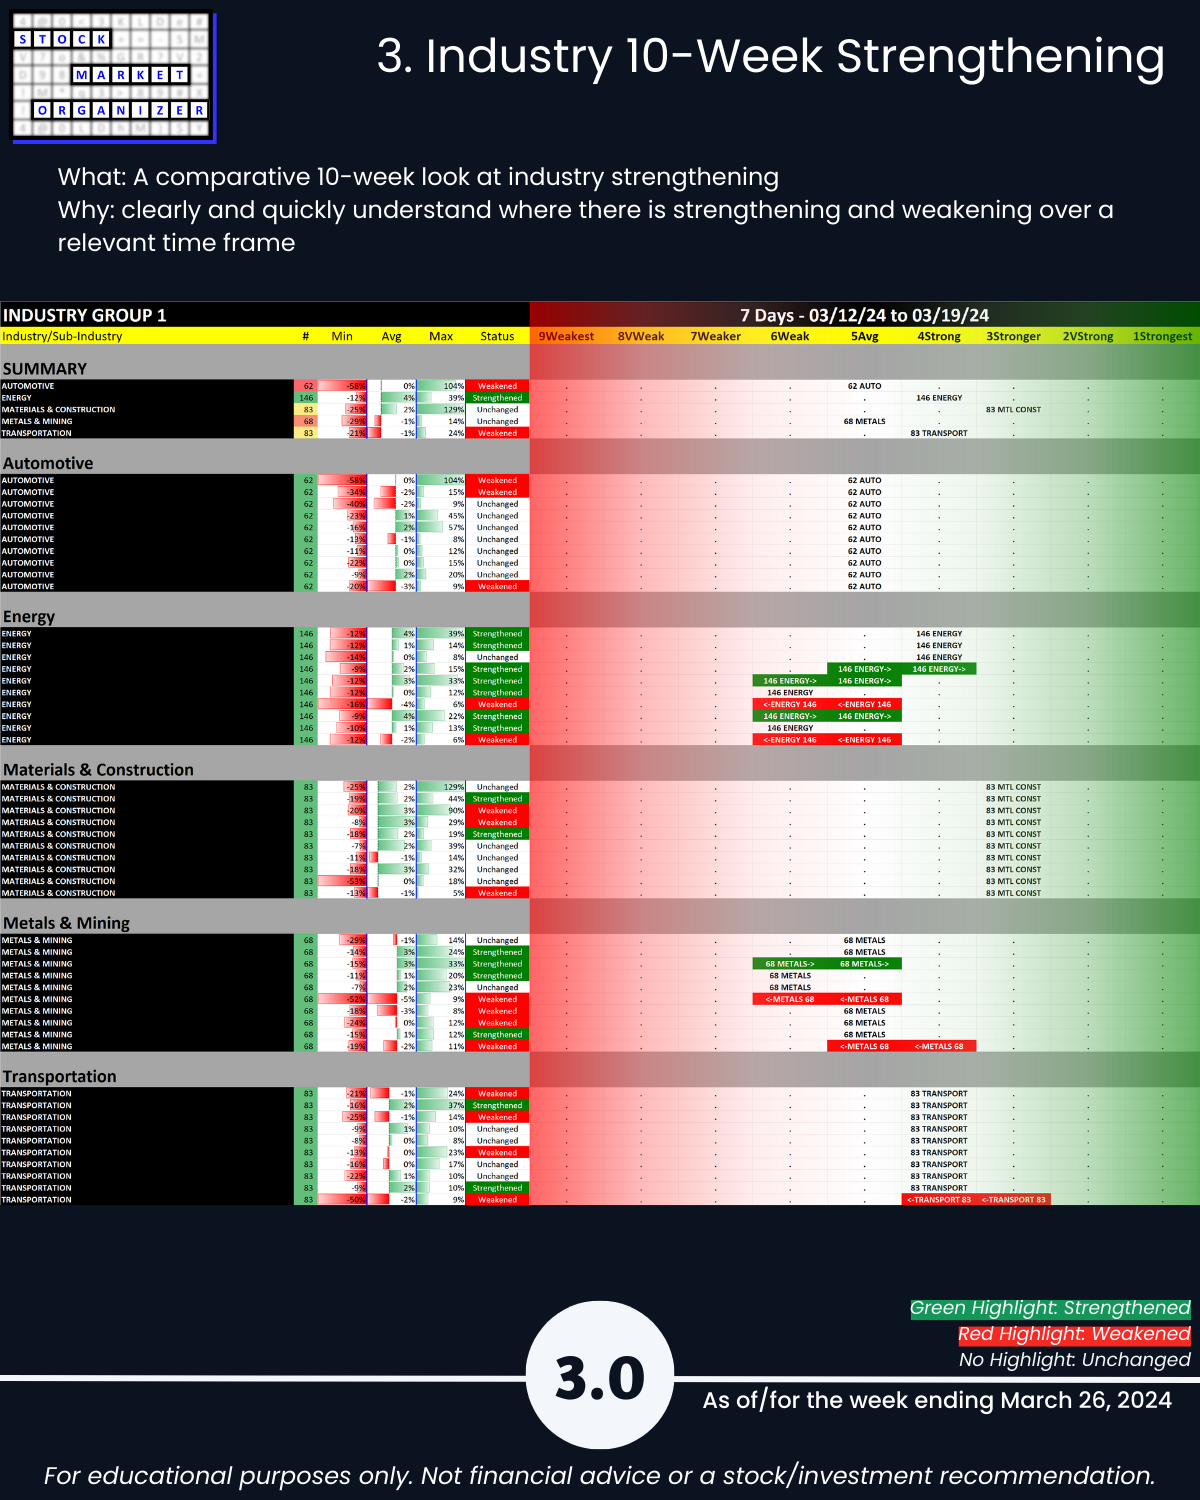
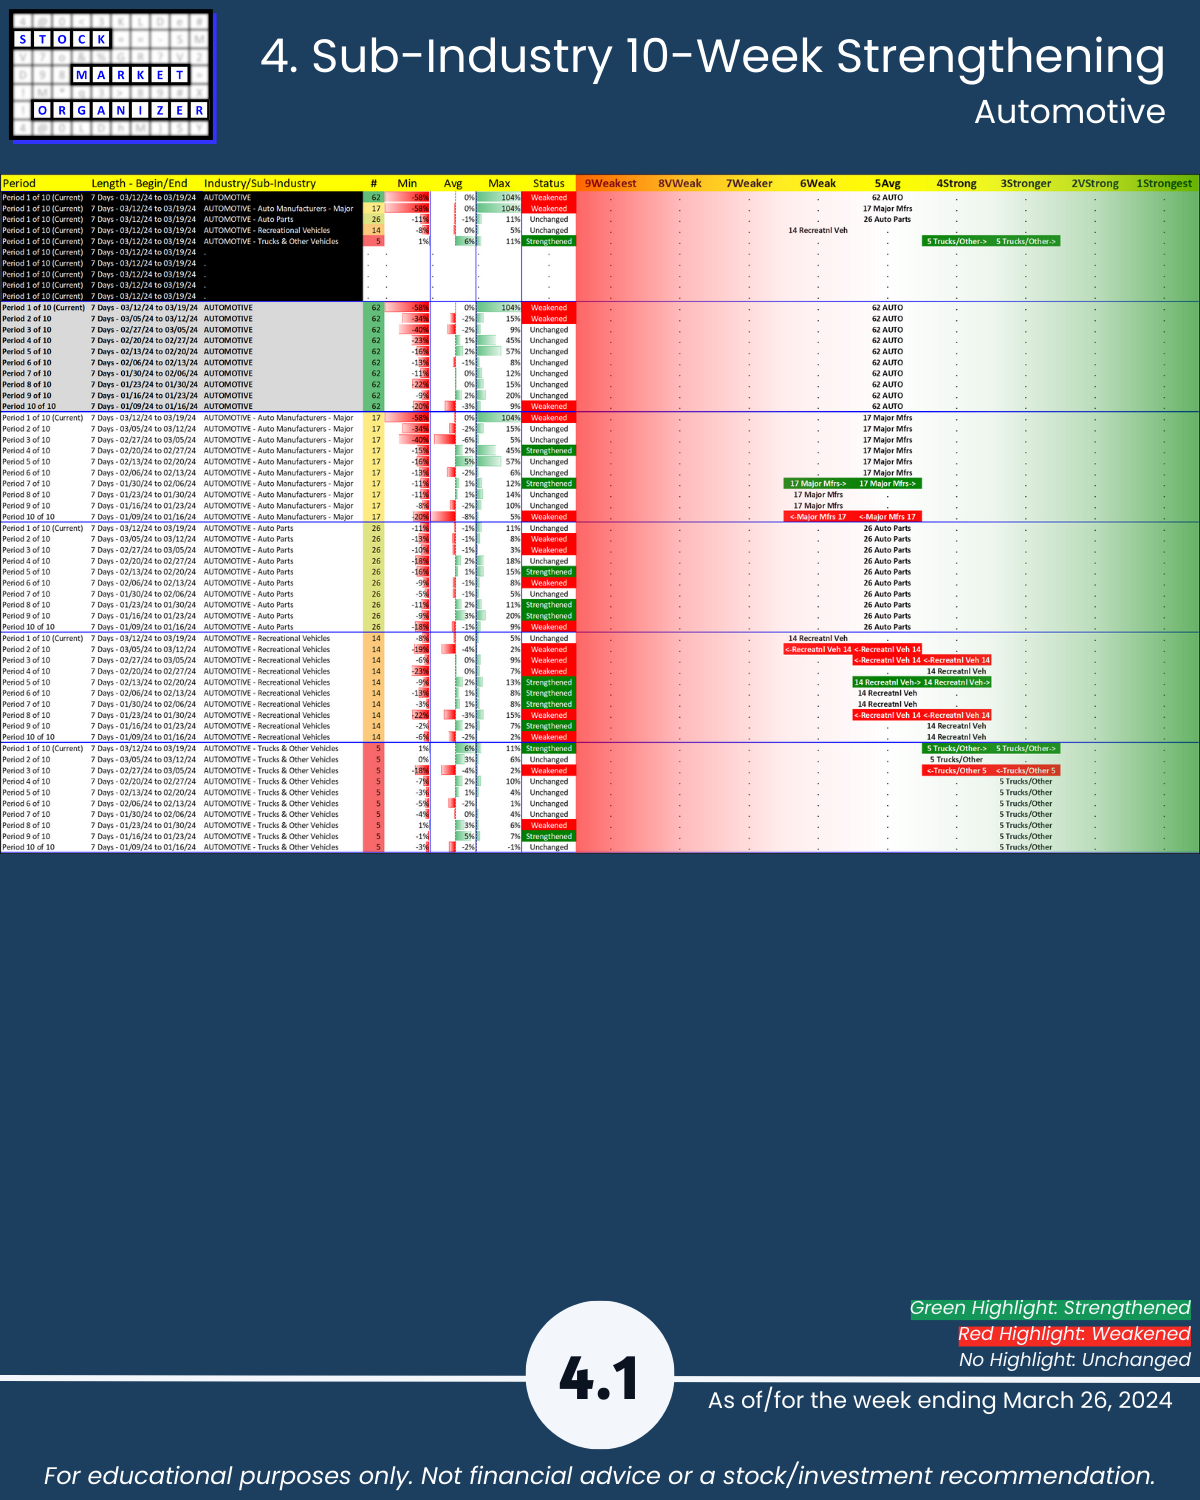
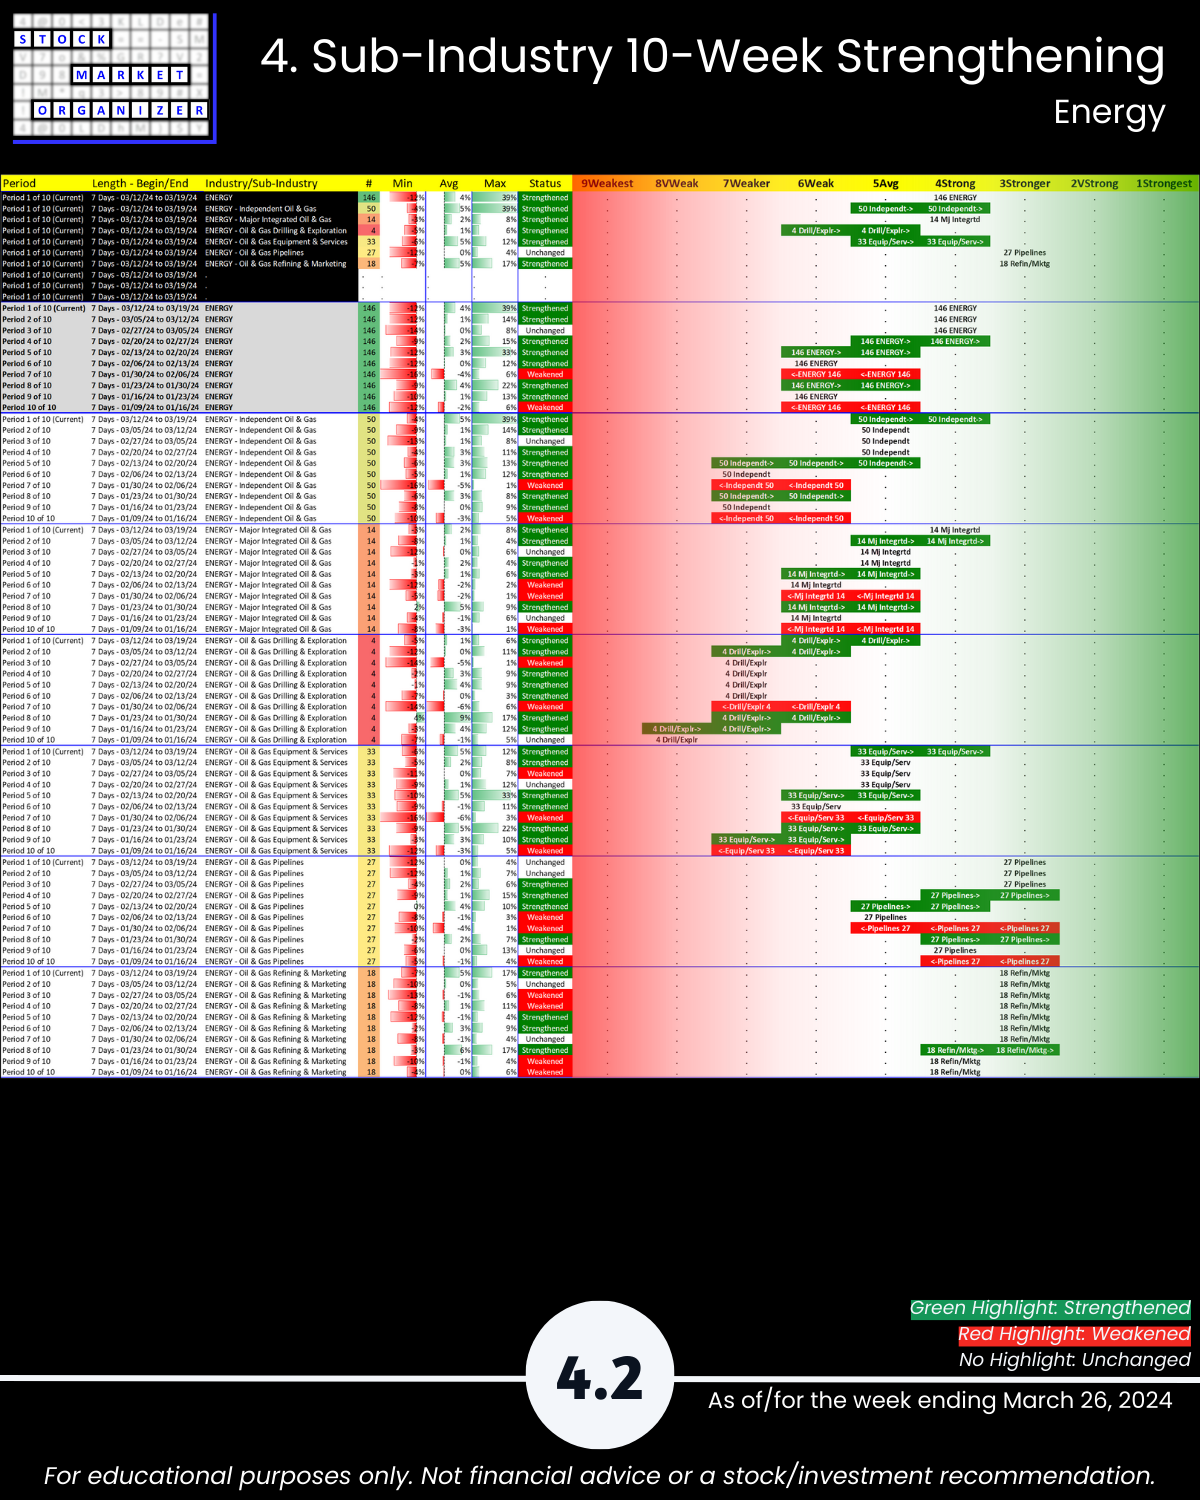
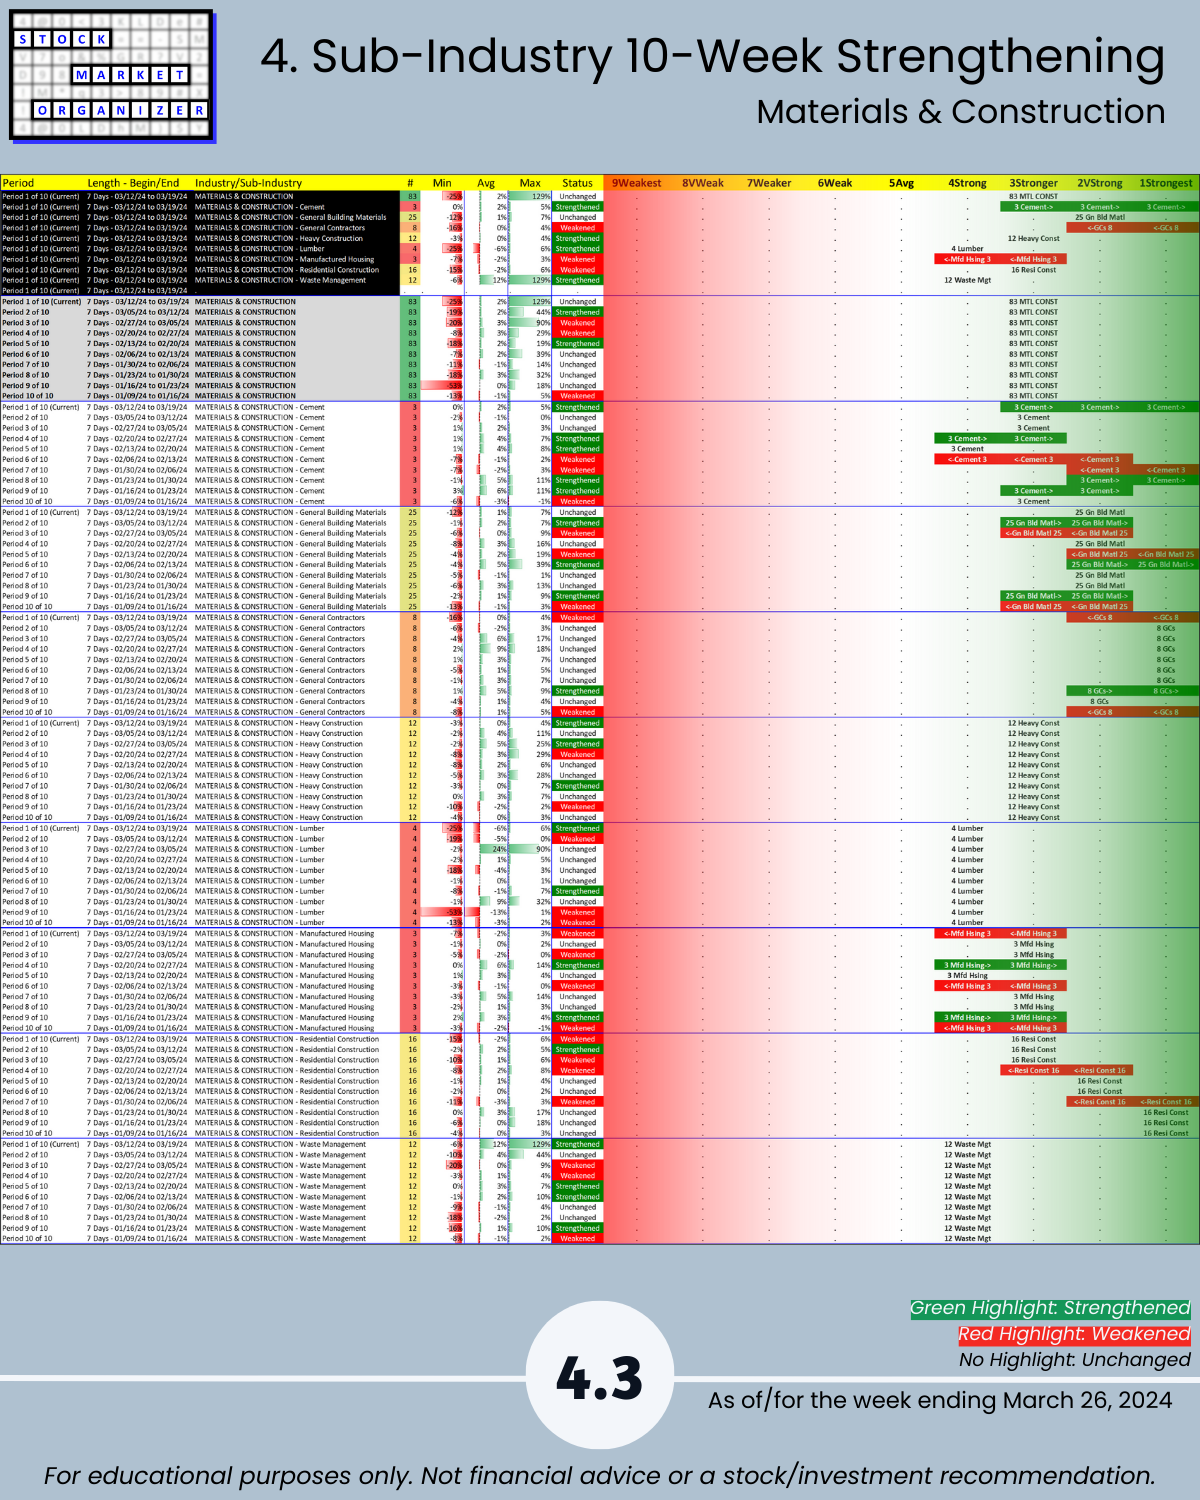
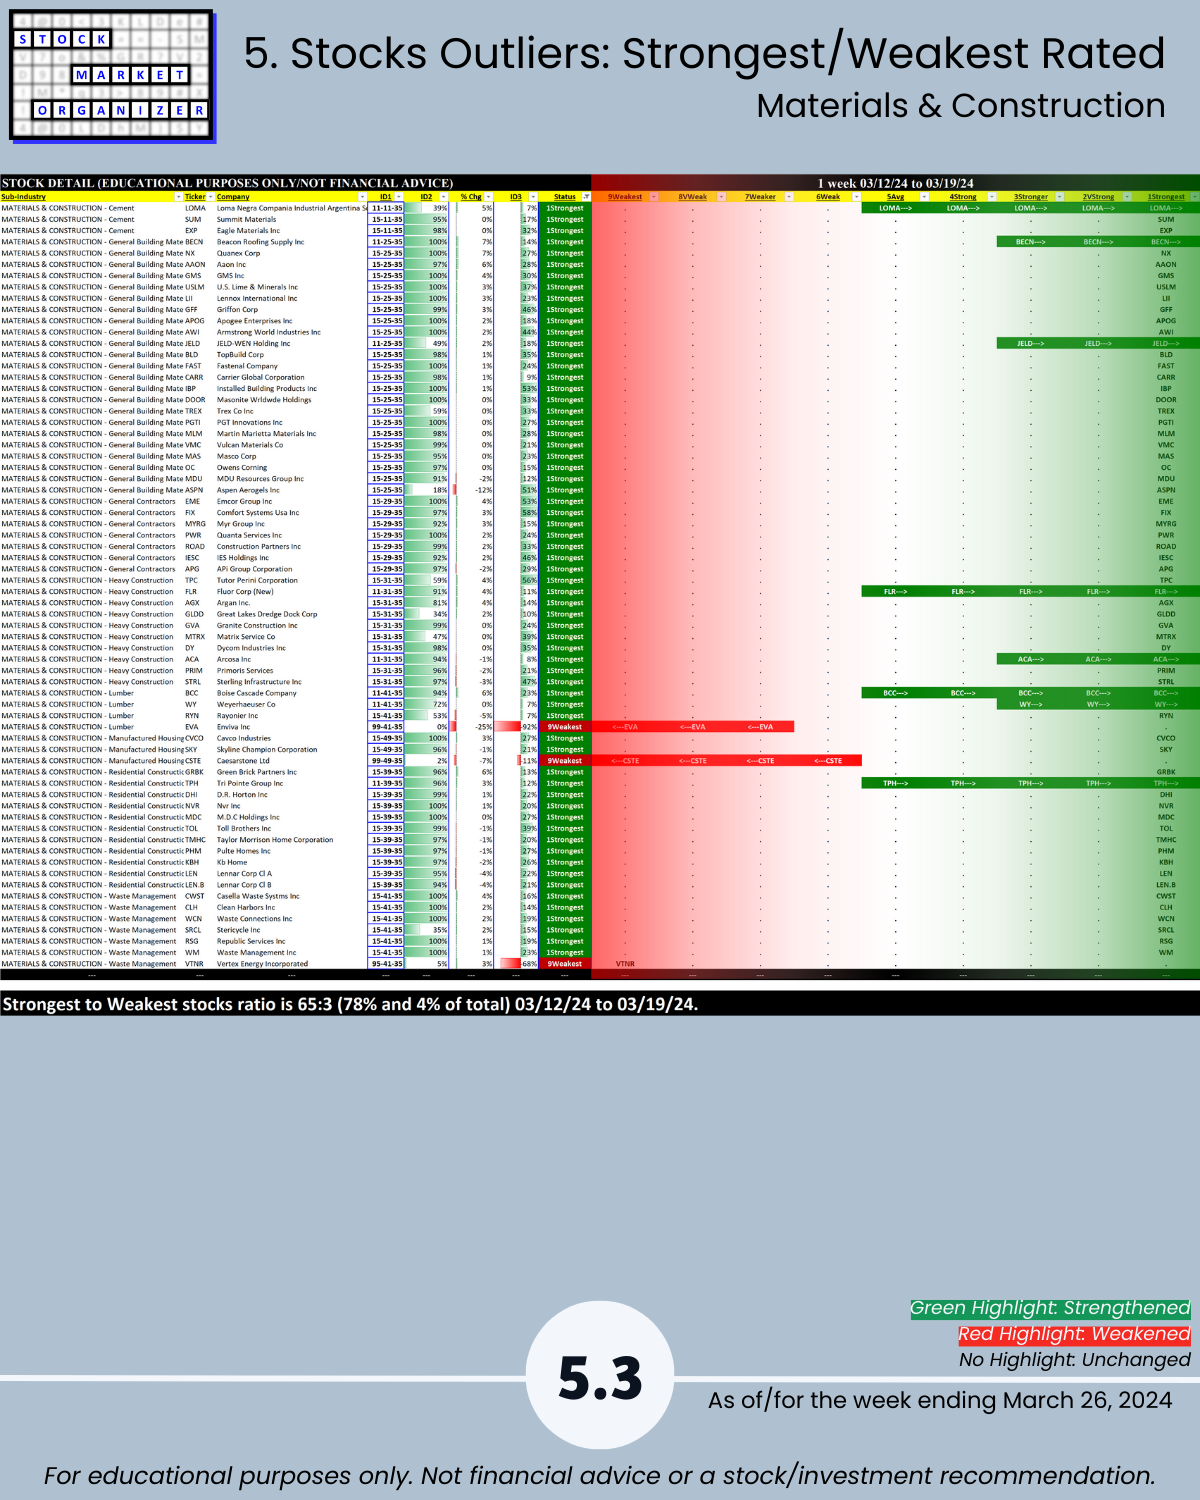
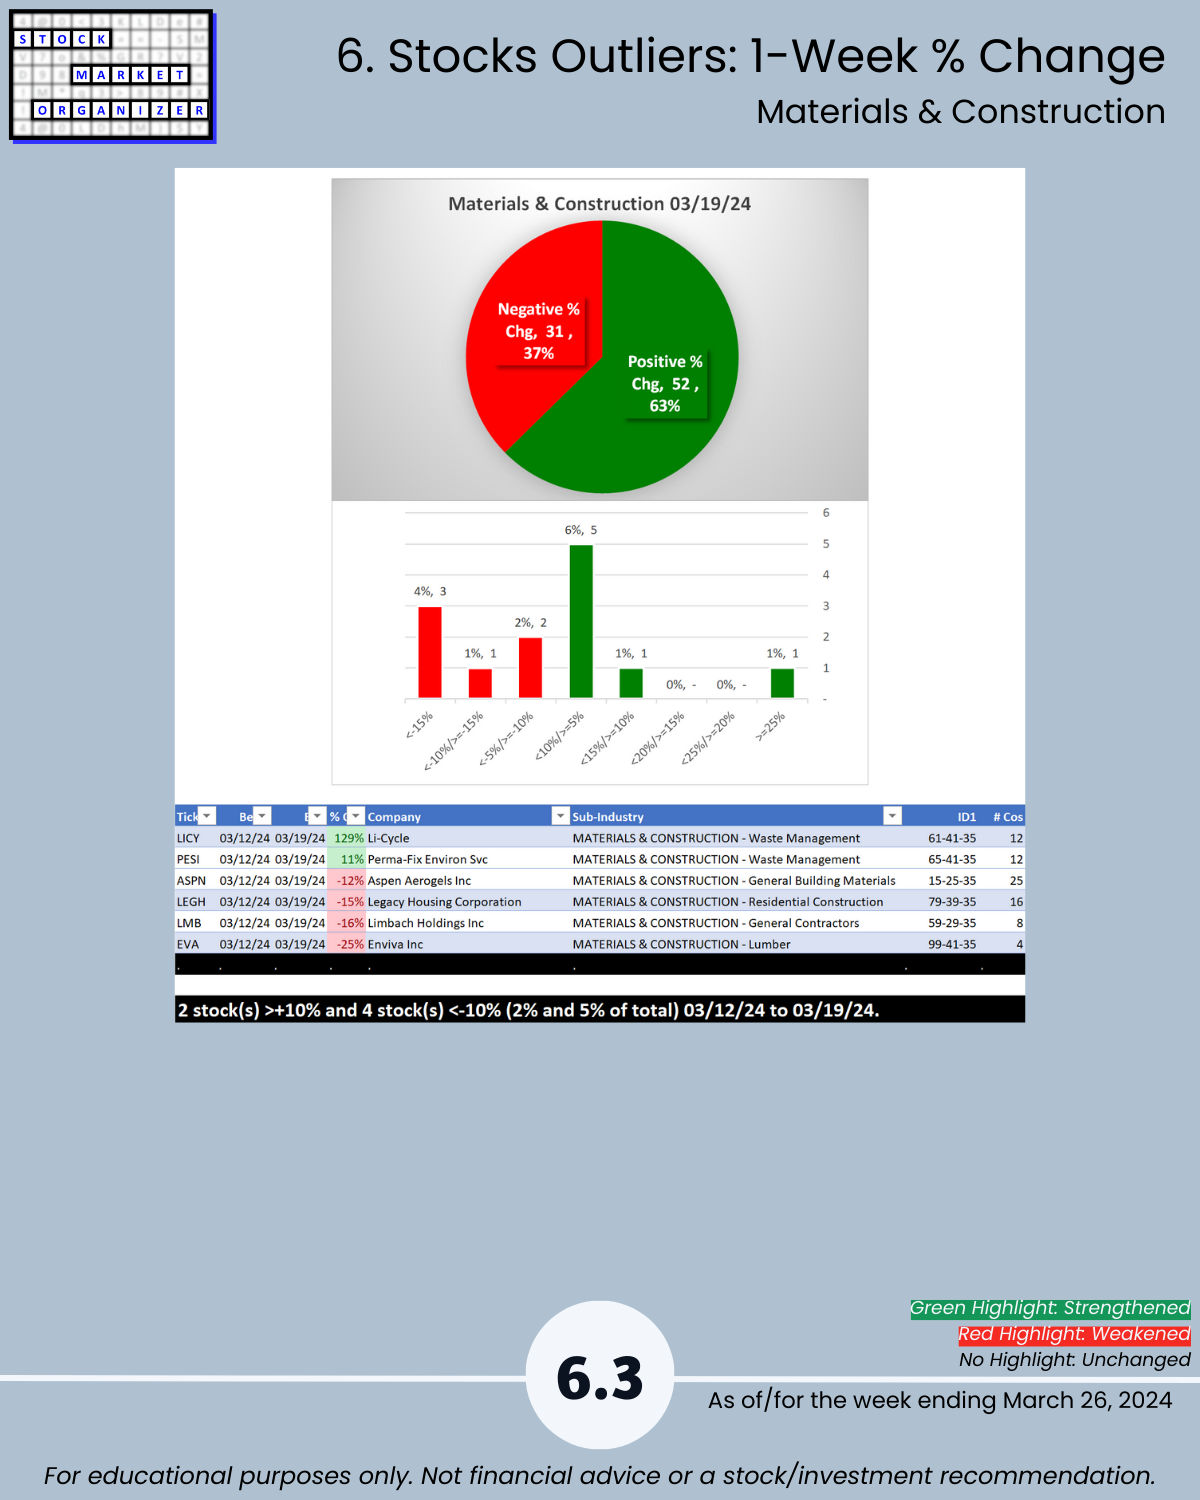
Today's report below for Group 1 industries Automotive, Energy, Materials & Construction, Metals, and Transportation. Materials & Construction remains an industry leader with a Strongest:Weakest stock ratio of 78%:4% and 28% of its stocks at 5+ year highs.
THE “WHY” BEHIND THIS METHOD (SEEKING STRENGTH MARKETWIDE)
The stronger your stocks the greener your P&L.
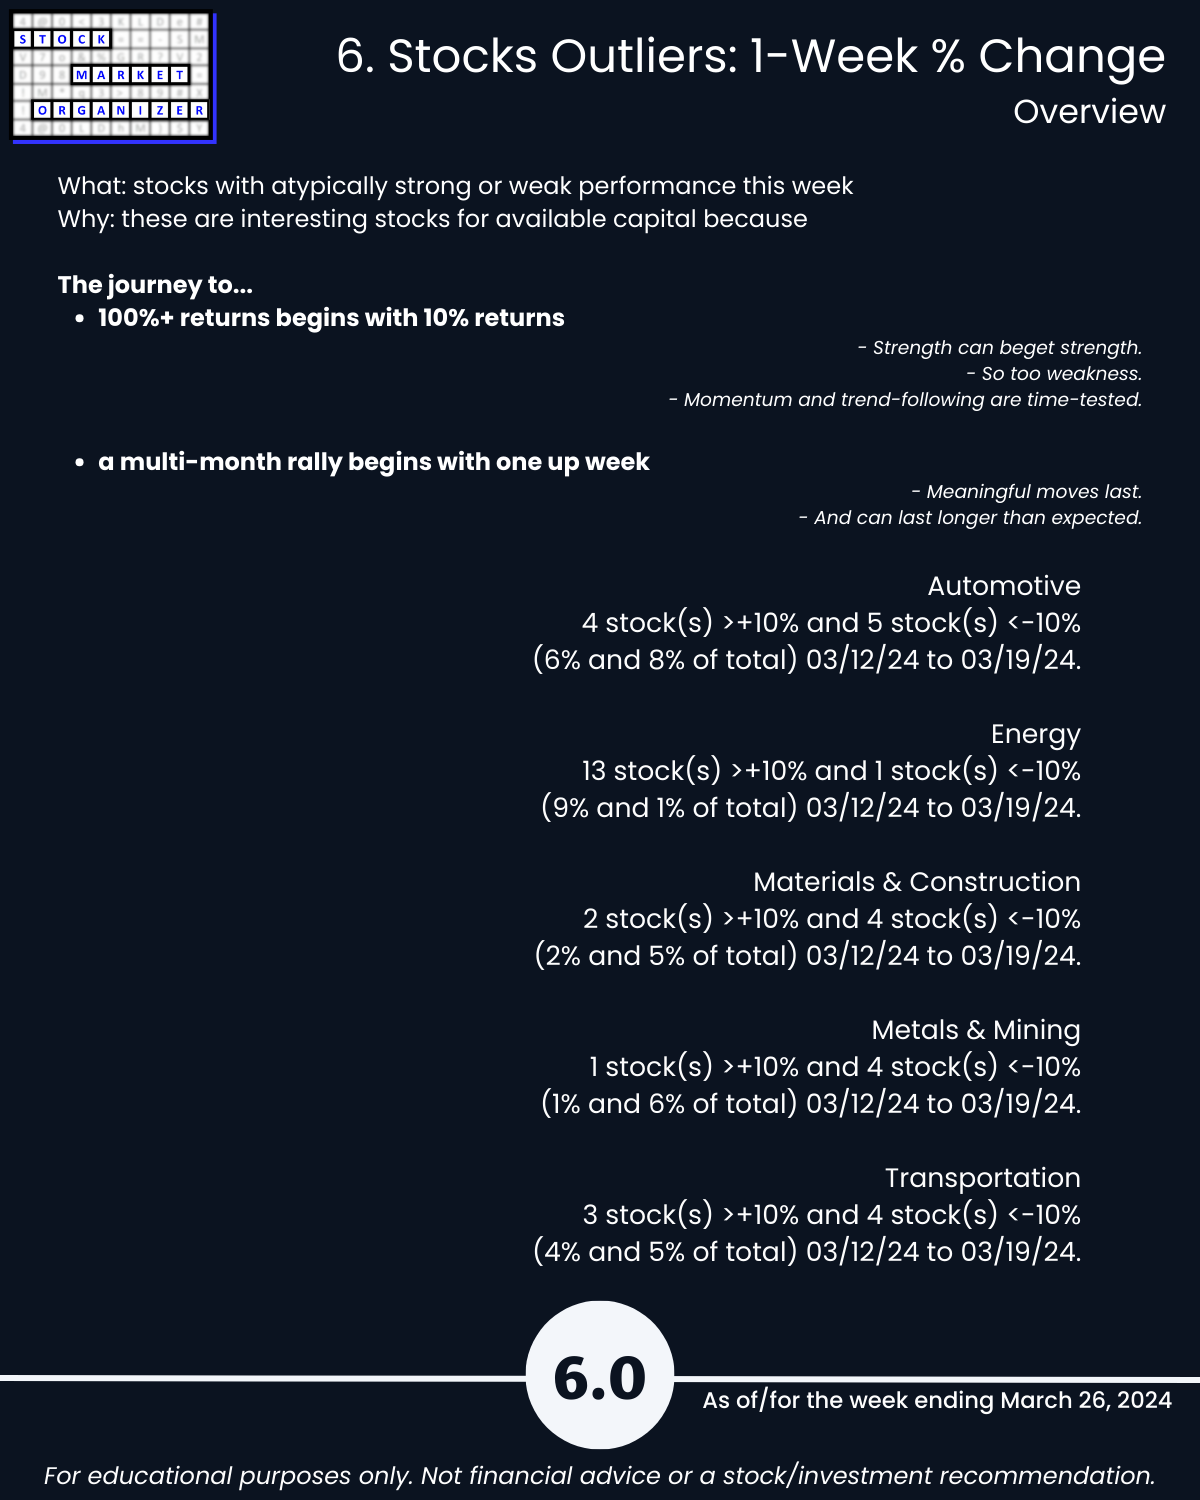
The journey to 100%+ returns begins with 10% returns.
The journey to multi-month rallies begins with one up week.
You won’t find what you aren’t looking for.
Look at any number of triple-digit gainers over the past year or less - obviously NVDA, certainly CVNA, SKYW, POWL, ANF, SMCI.
Each started with 10% gains.
Maybe 10% gainers keep going, and maybe they don’t.
But if you aren’t looking for them, and what might keep them rising (strengthening sub-industry, industry, and market), then you won’t find them.
The market does not have to be so complicated.
TAKEAWAYS:
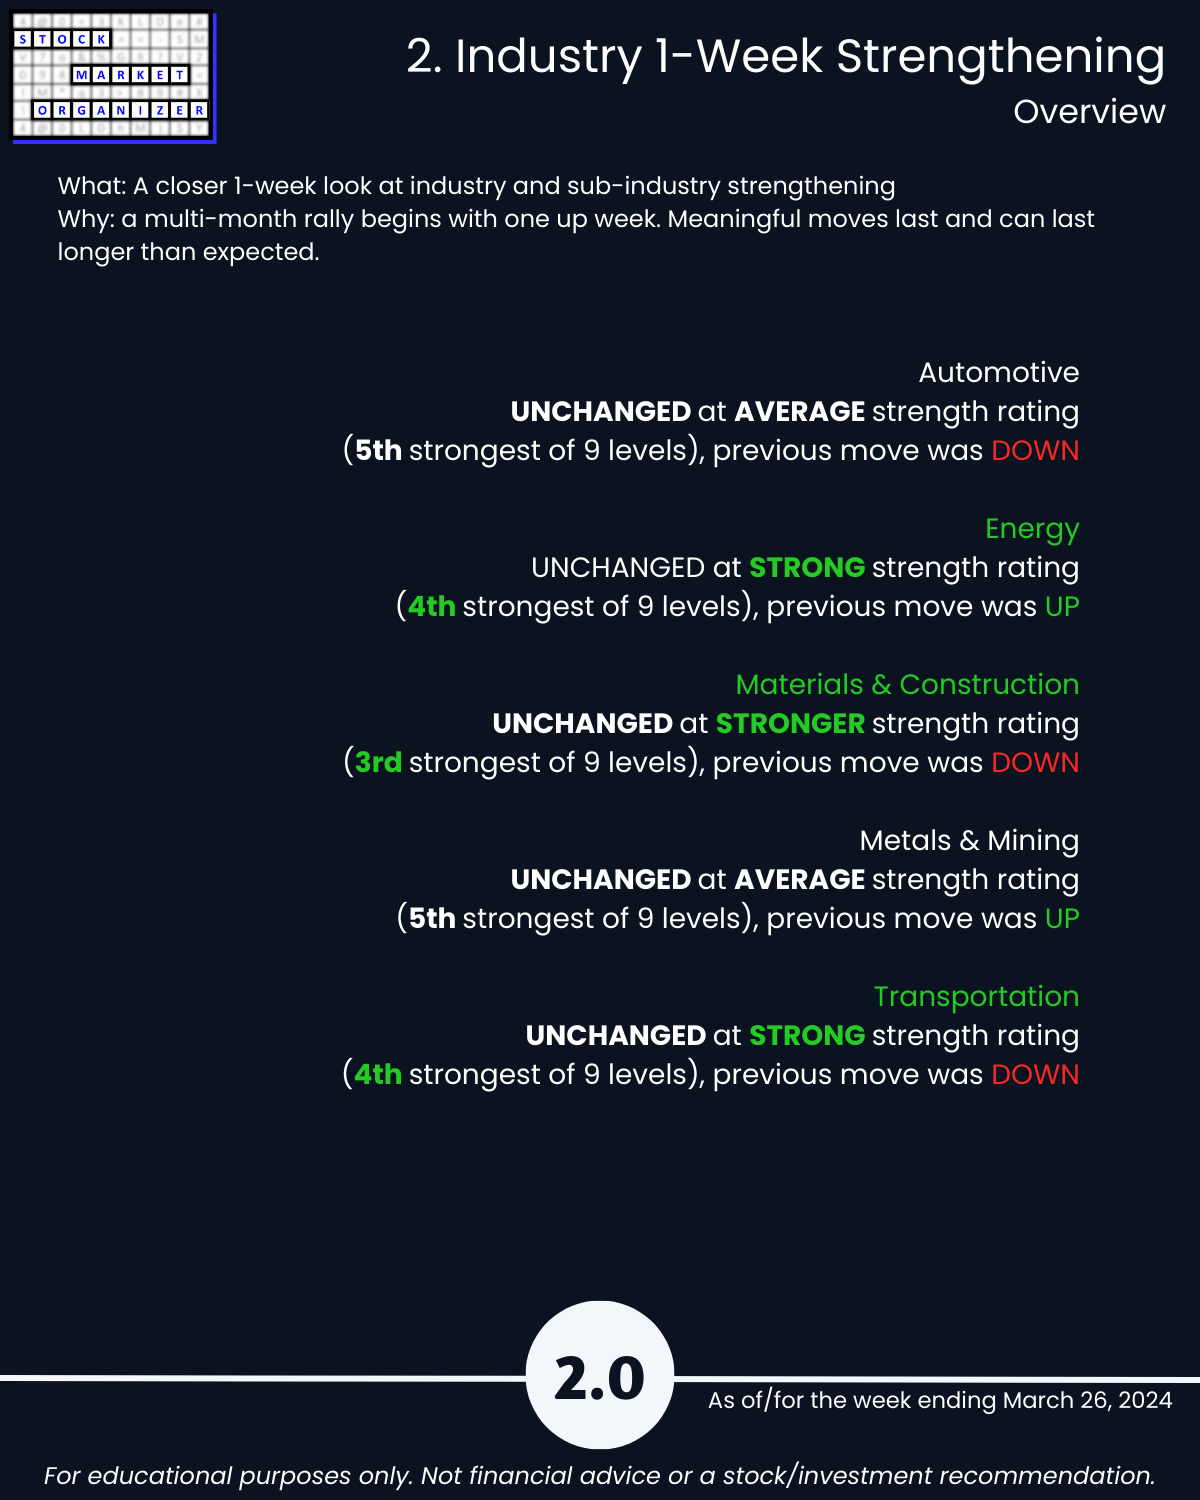
🔹 Strength Level Changes: None
- Strongest Industry: Materials & Construction (Stronger, 3rd strongest of 9 levels)
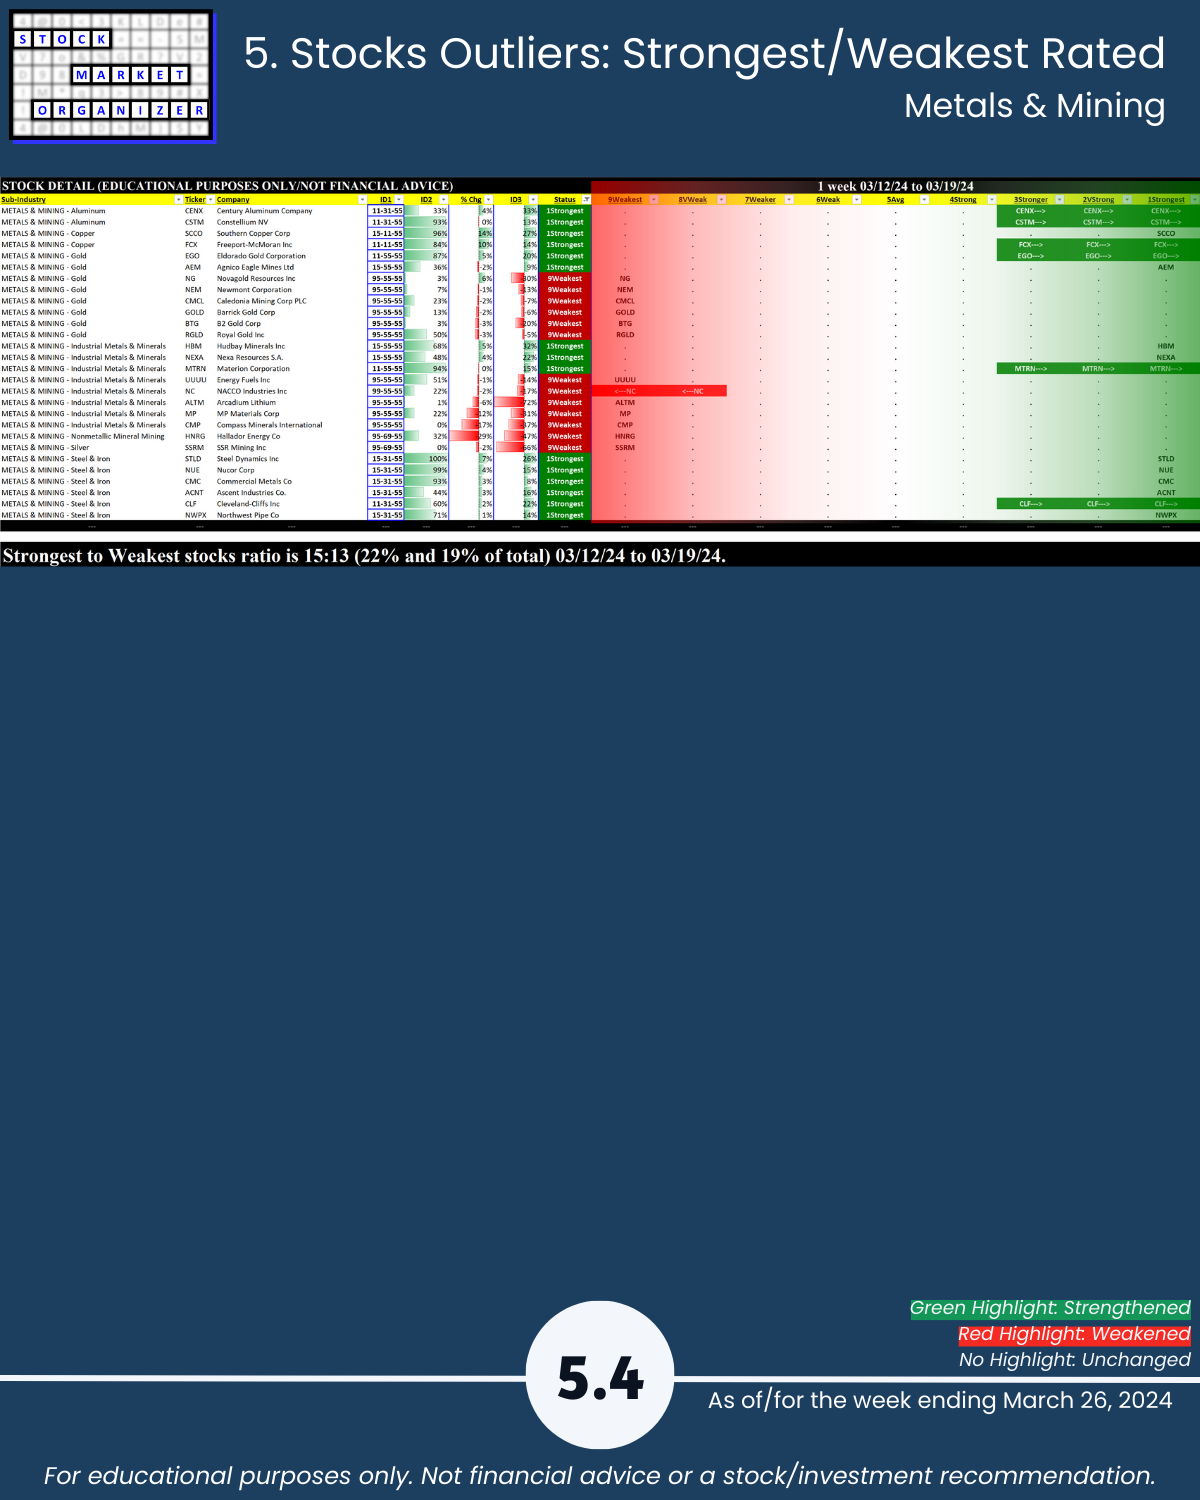
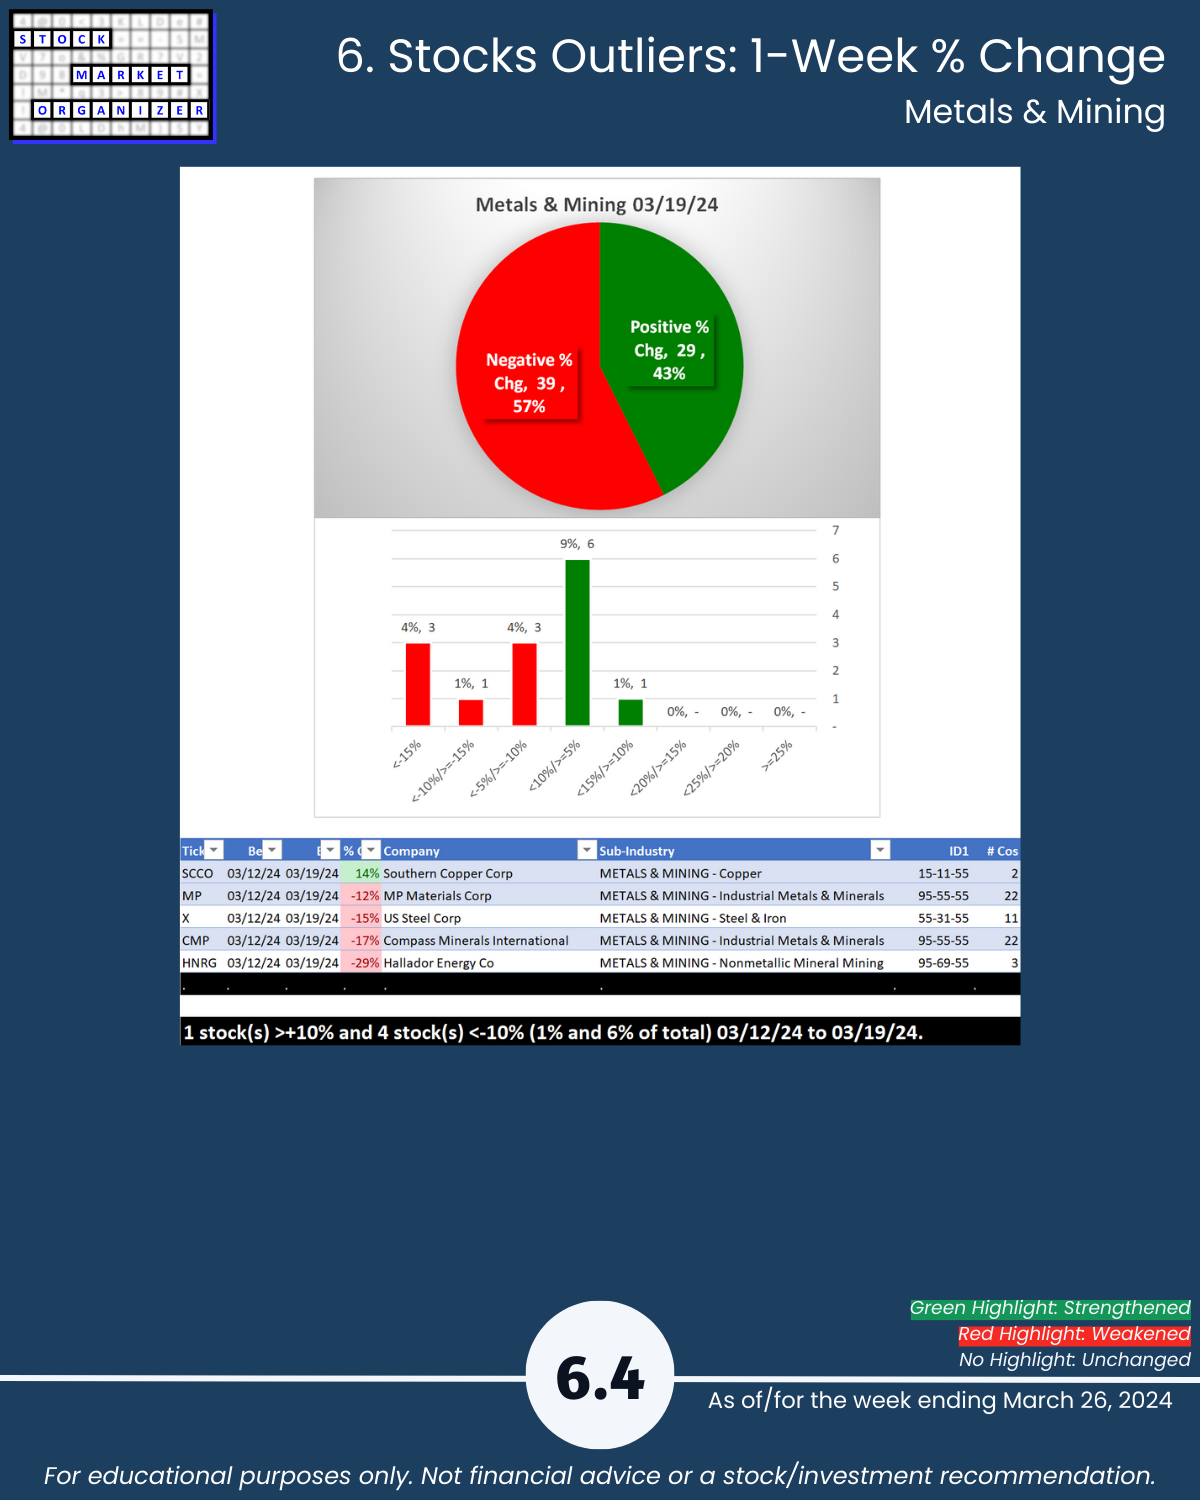
- Weakest Industries: Automotive, Metals & Mining (Average, 5th strongest)
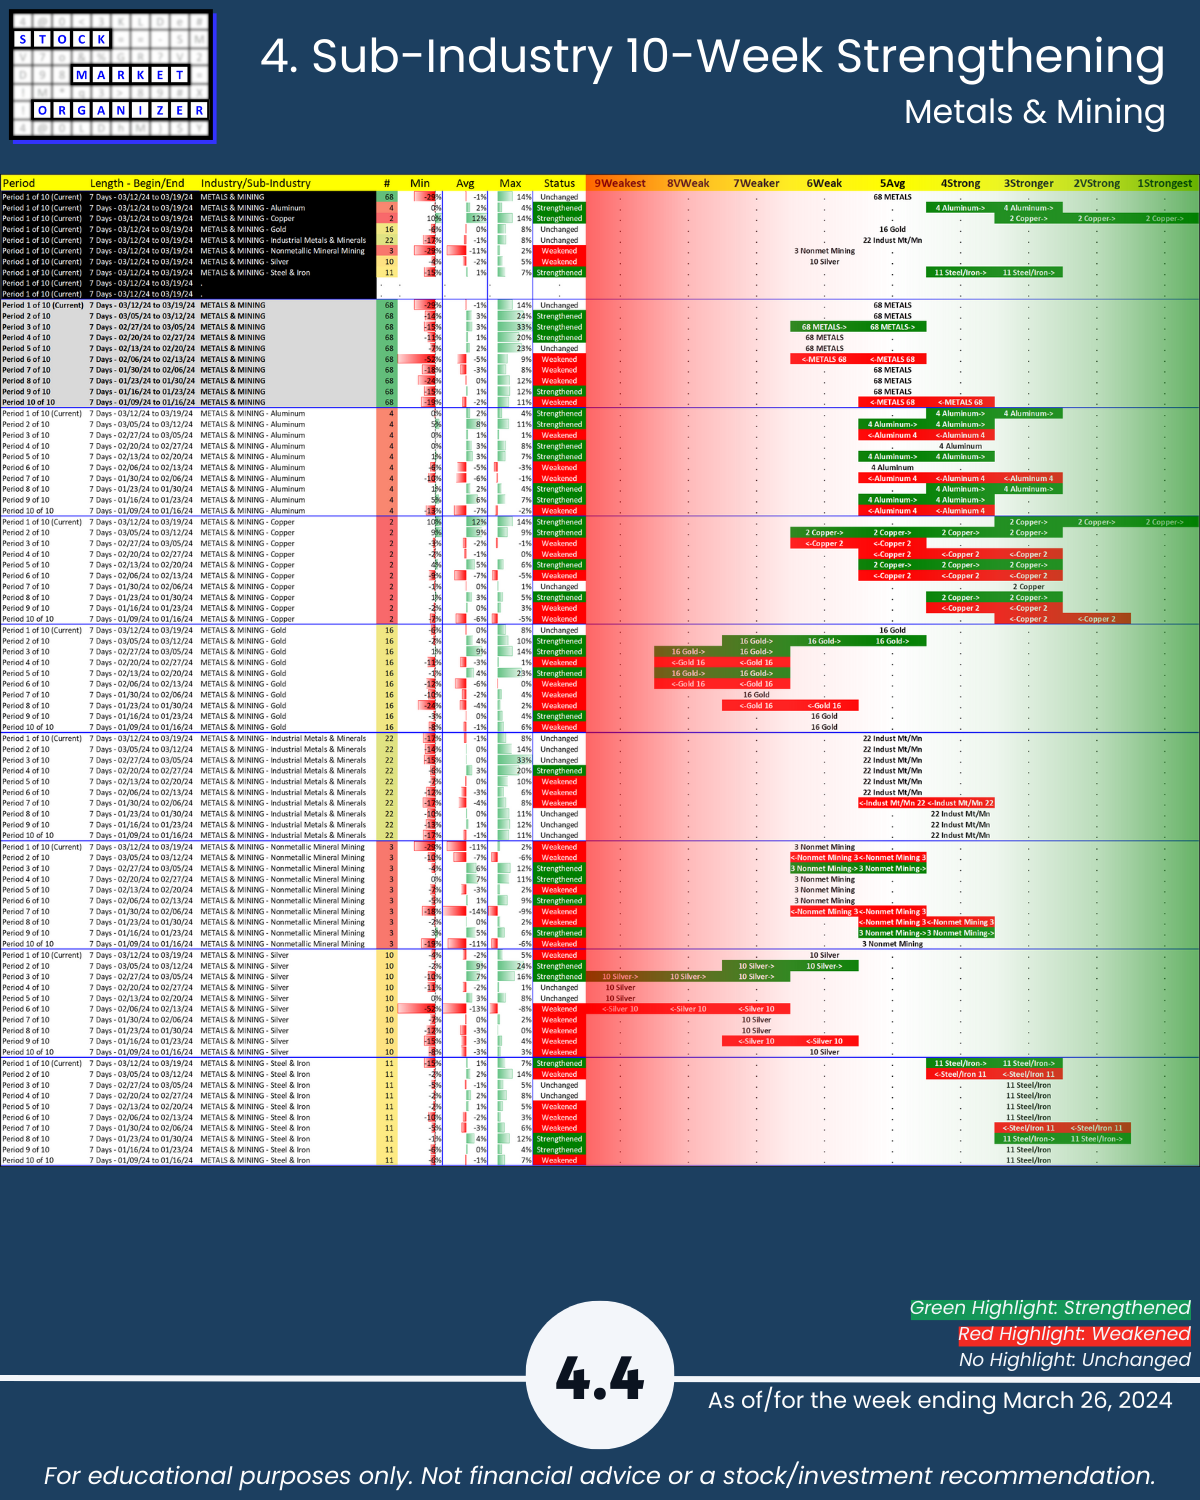
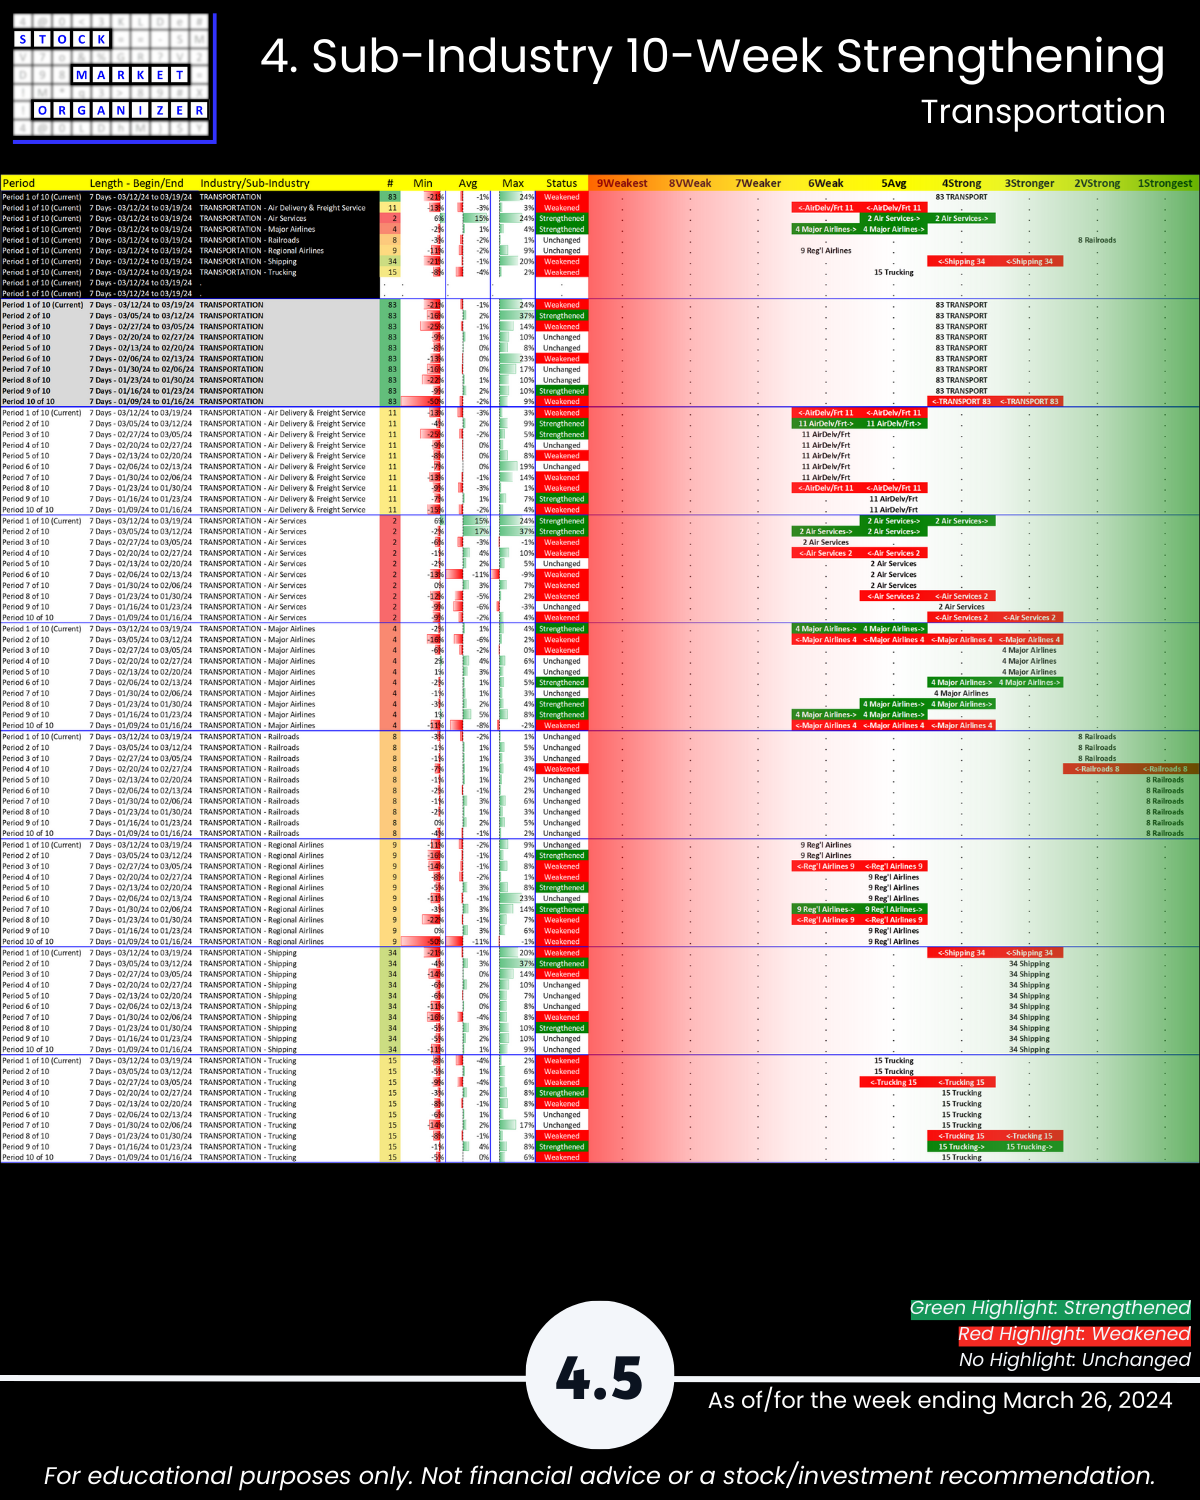
🔹 Sub-industries (32):
- 31% Strengthened, 13% Weakened;
- strongest General Bldg Materials, weakest Silver, RVs, Air Deliv/Freight
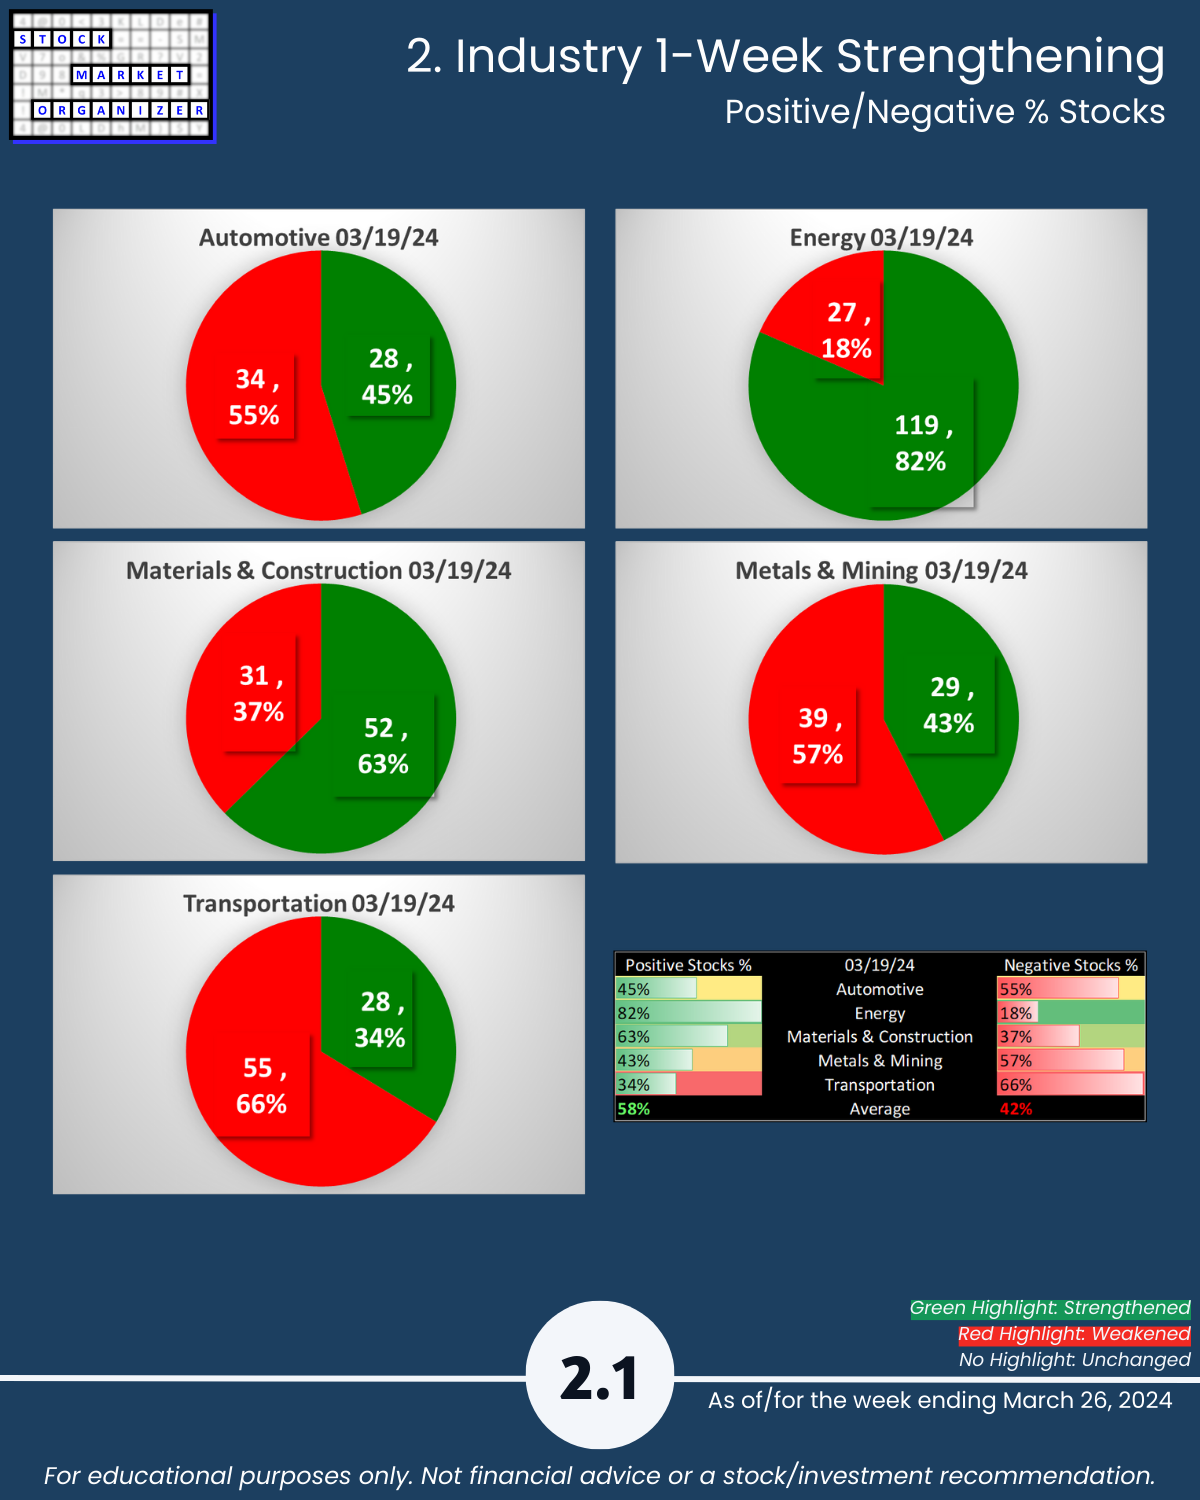
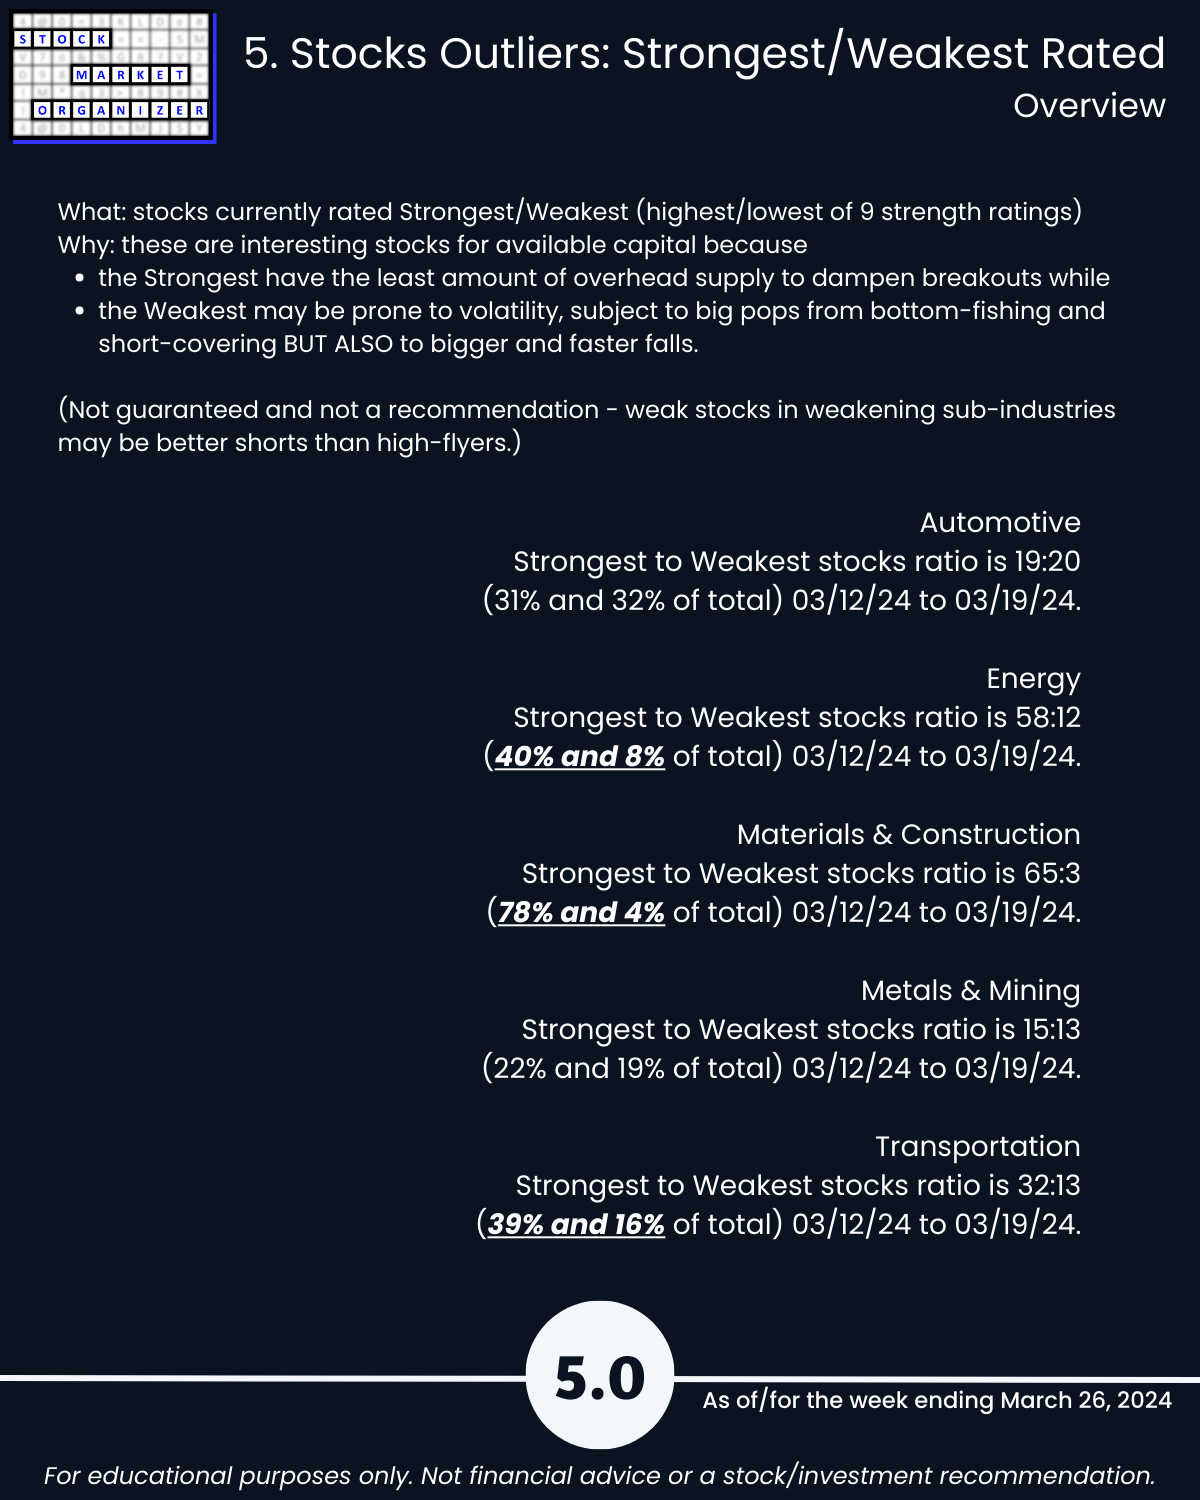
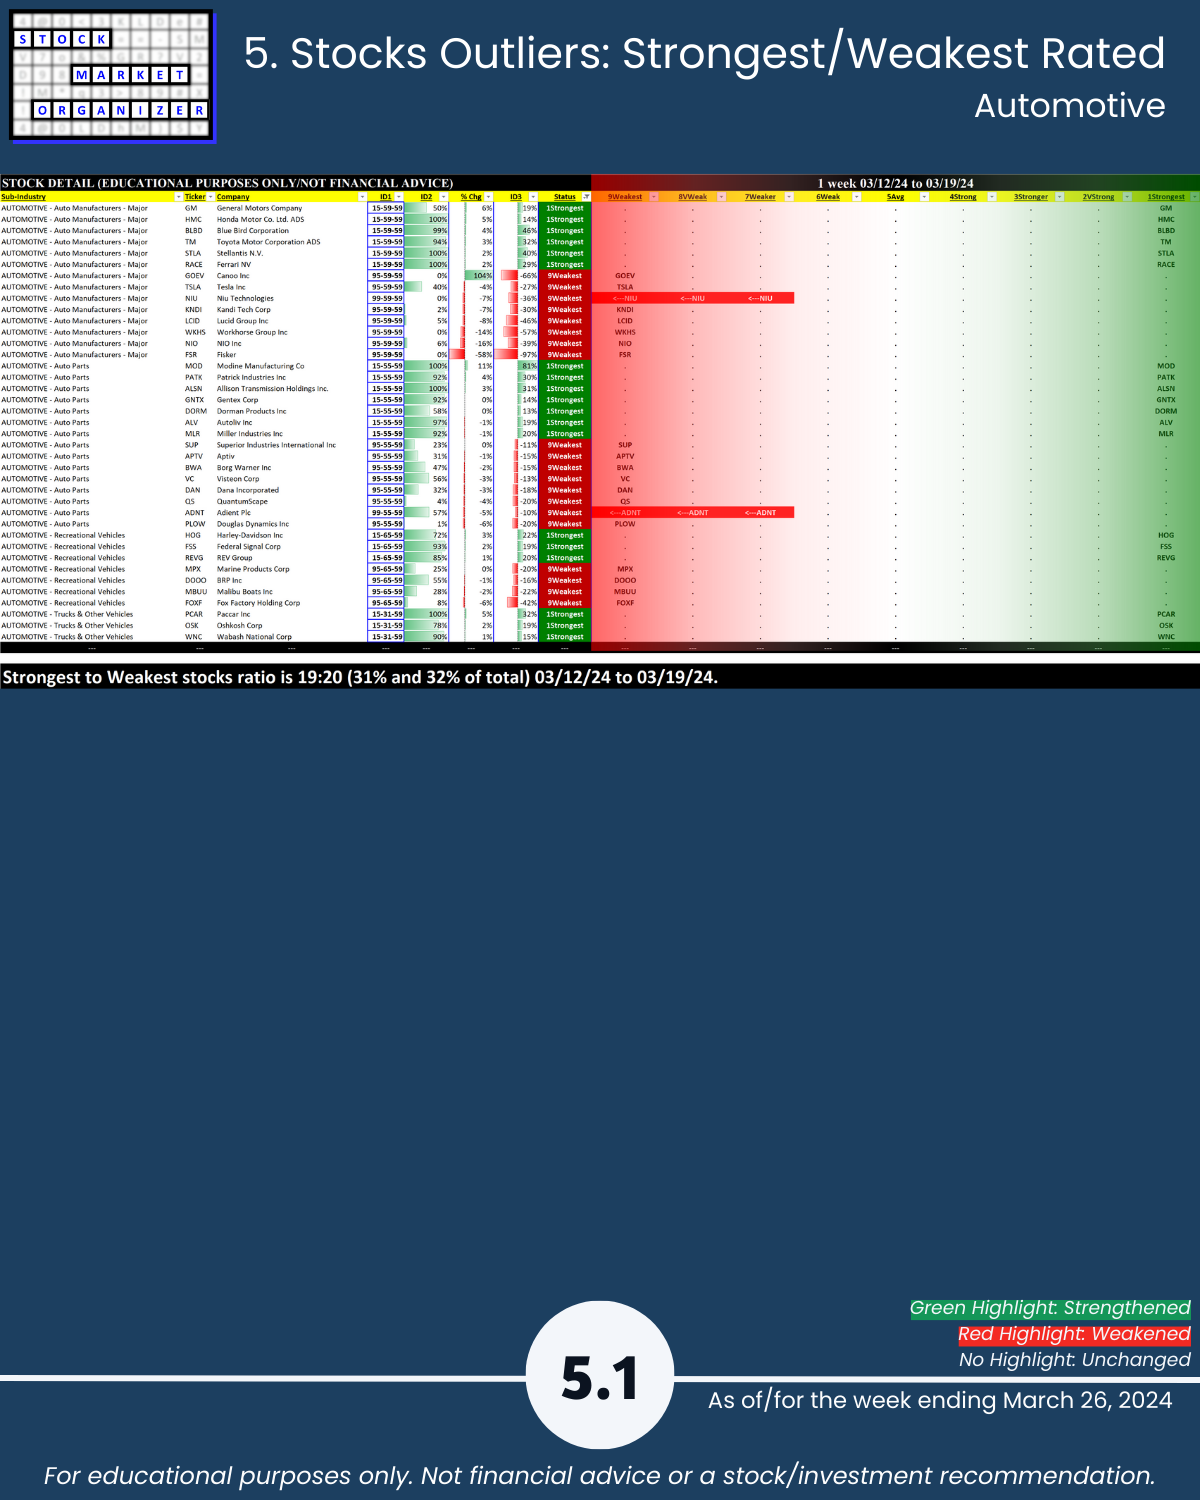
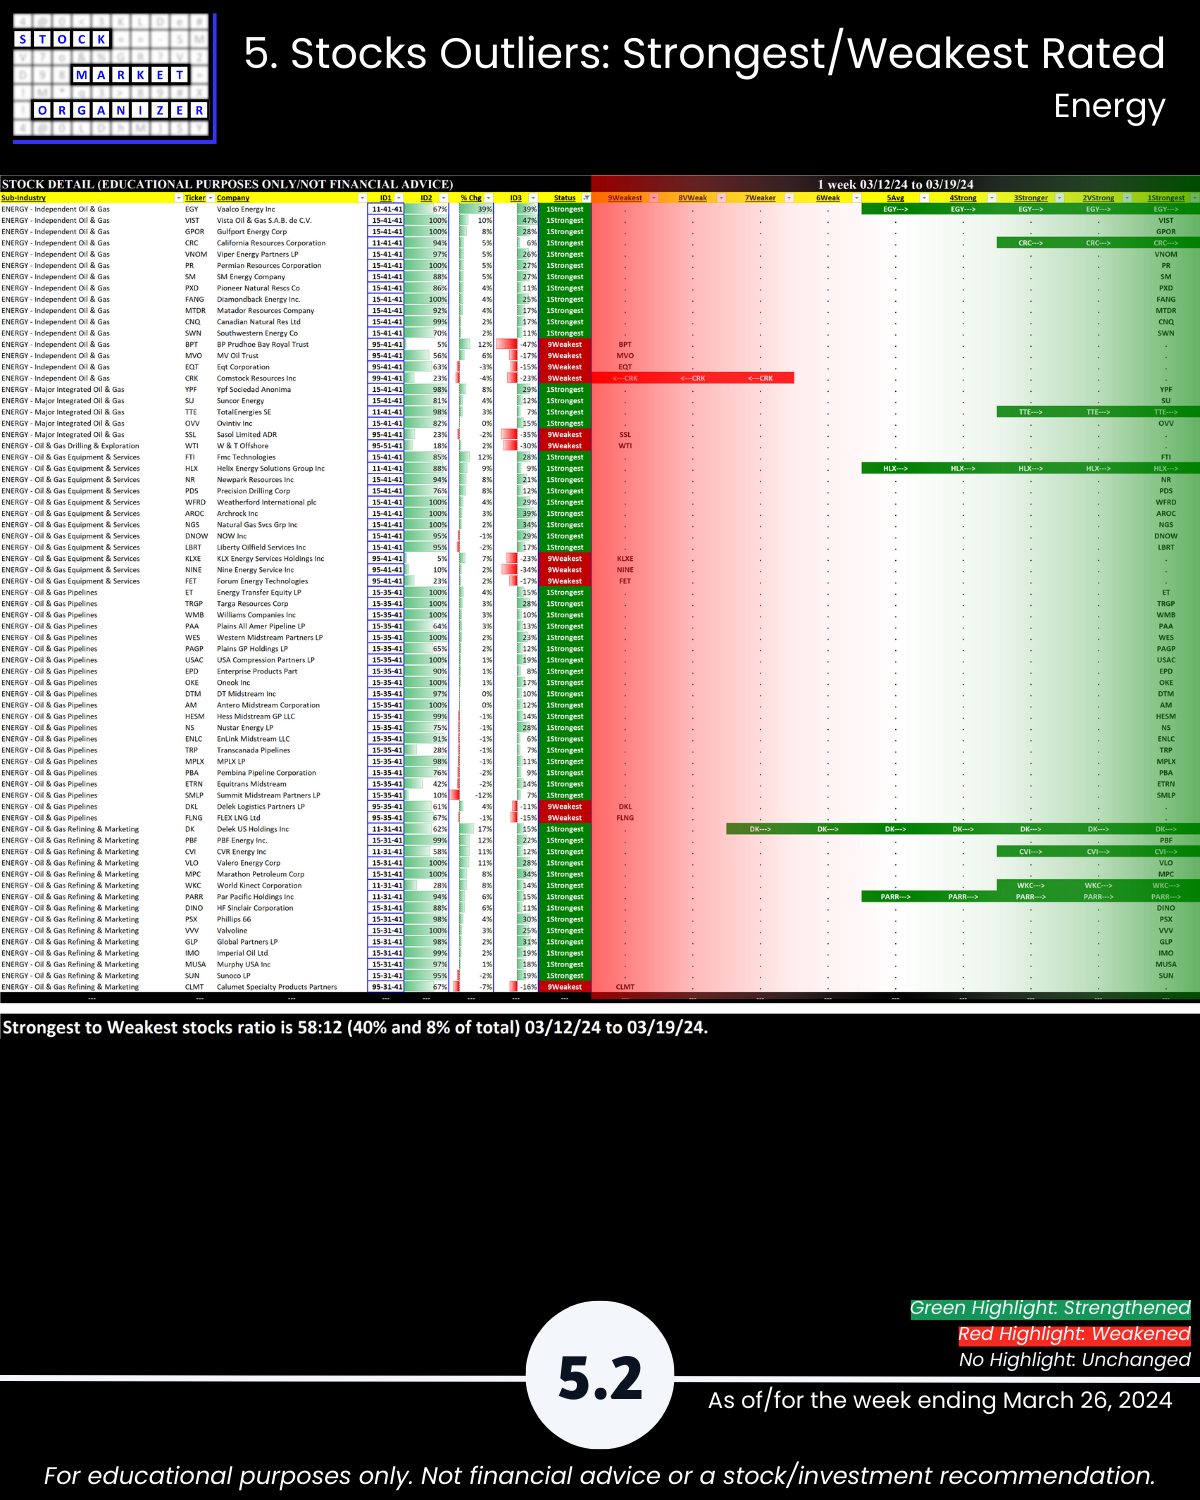
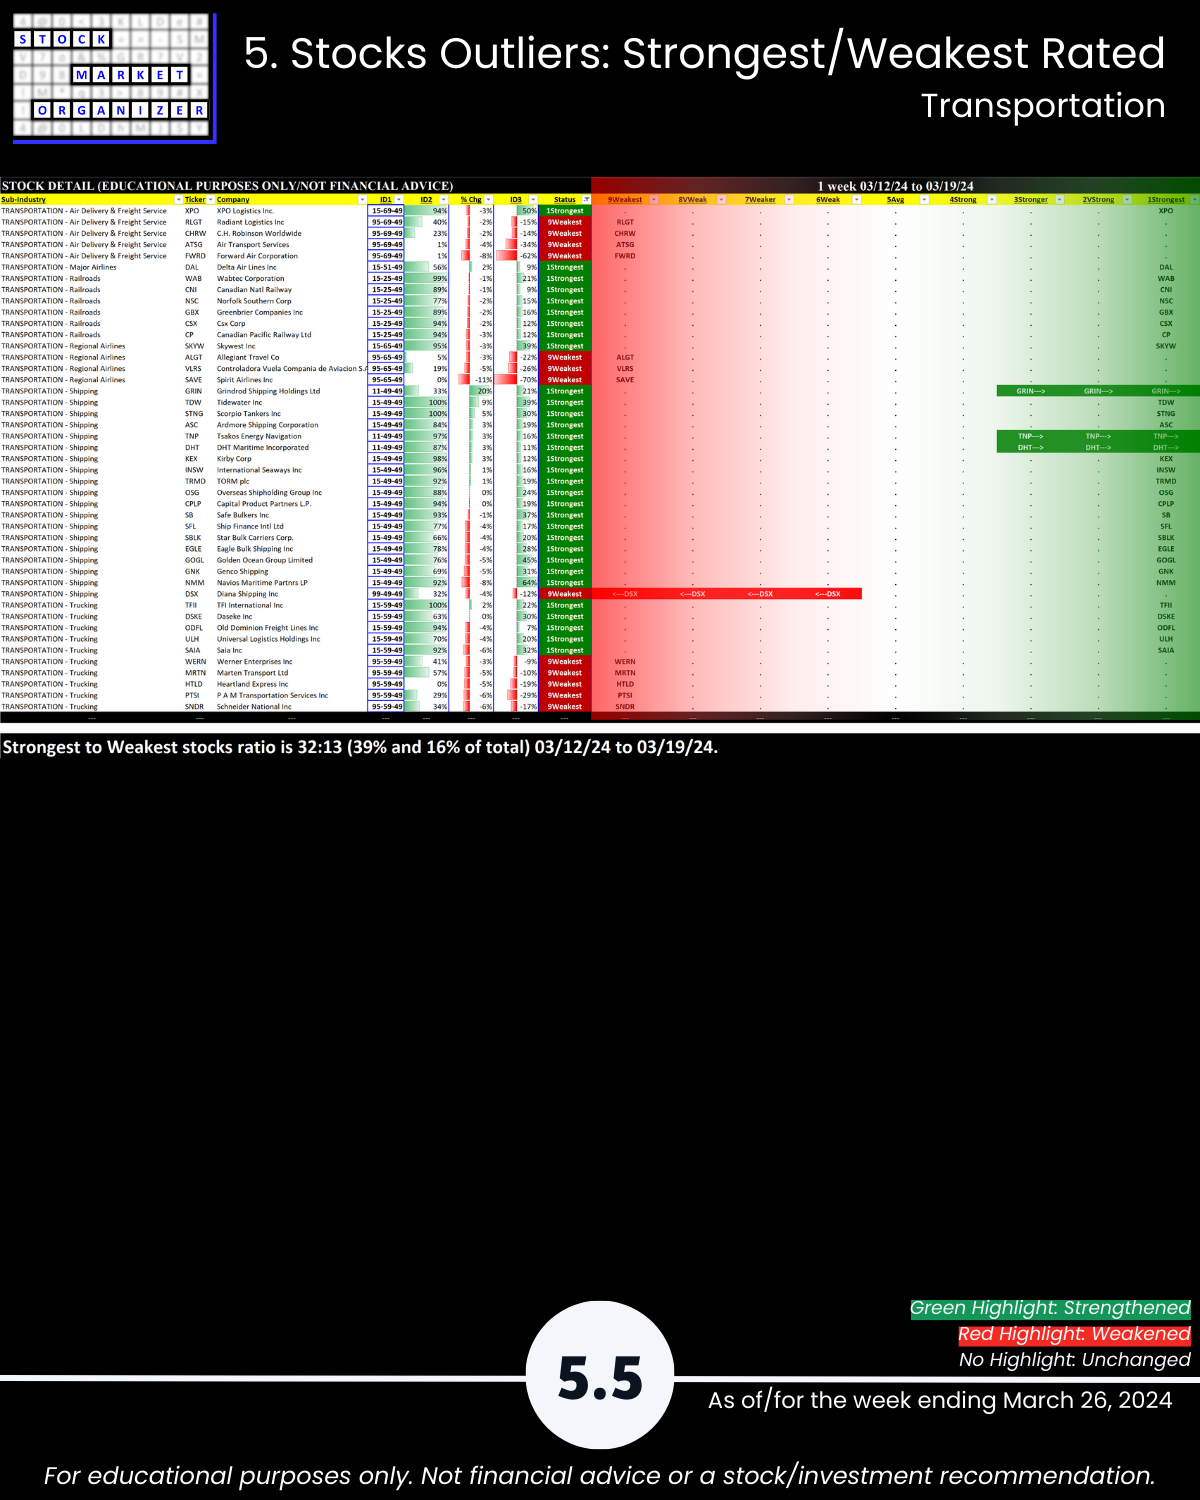
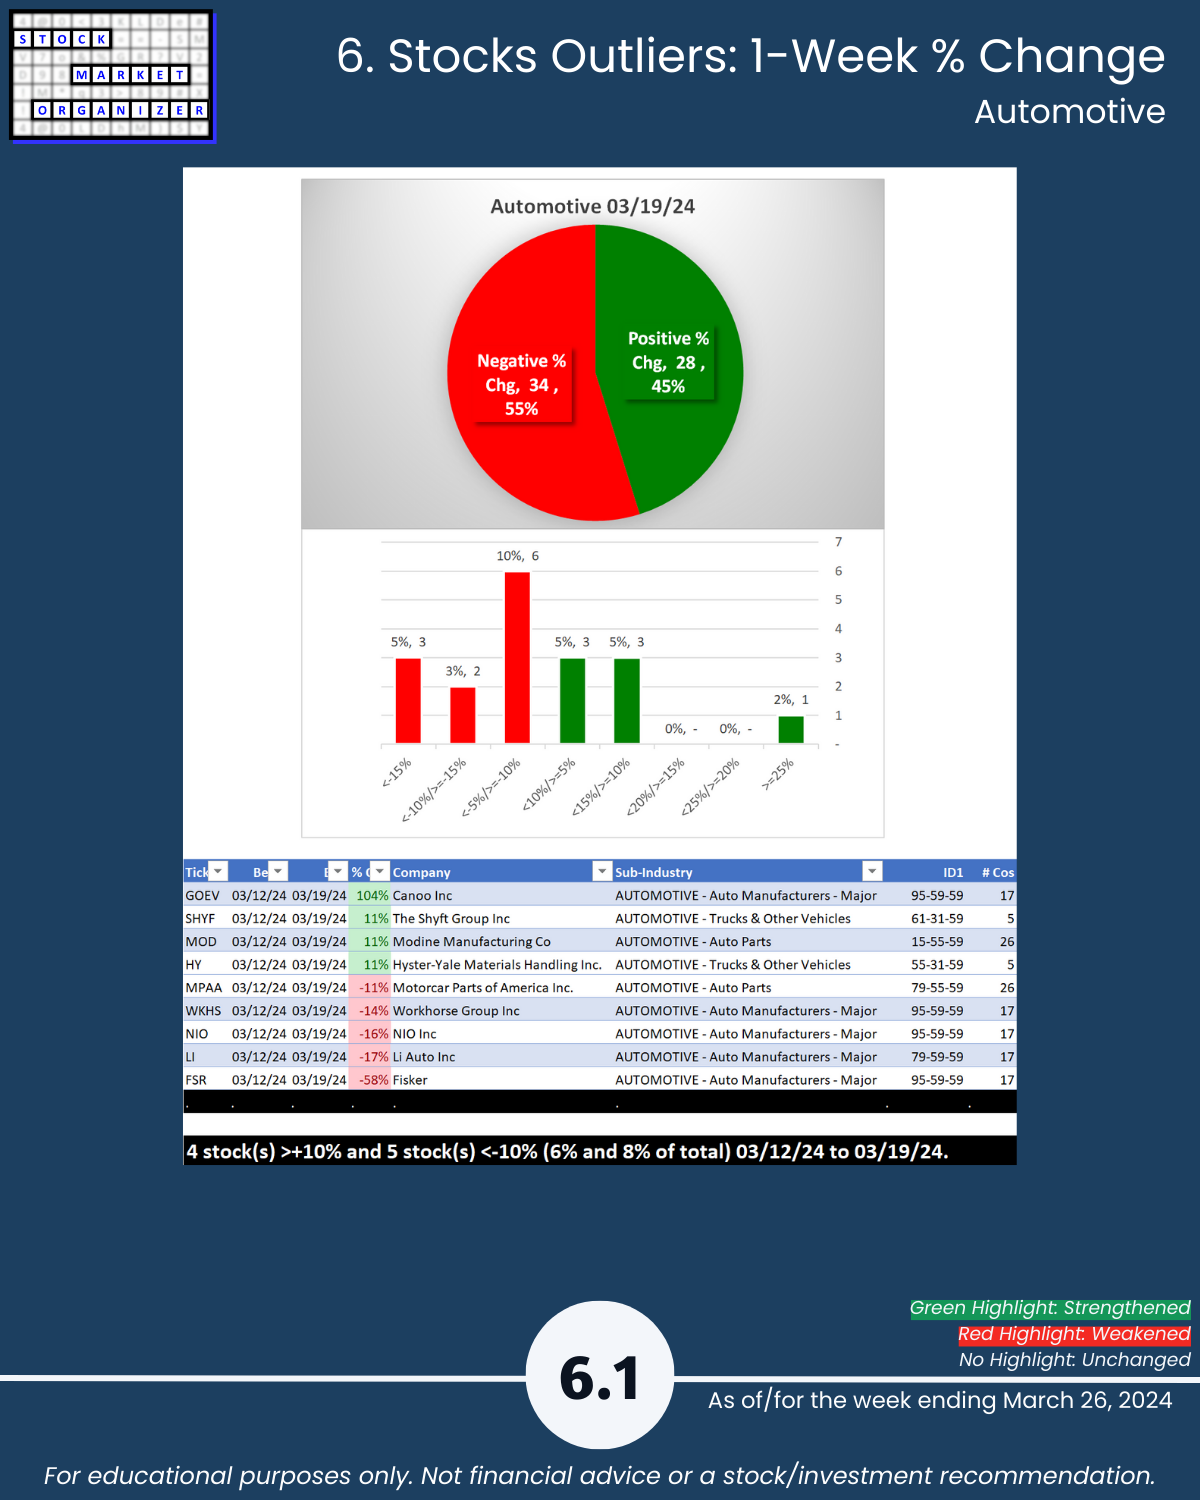
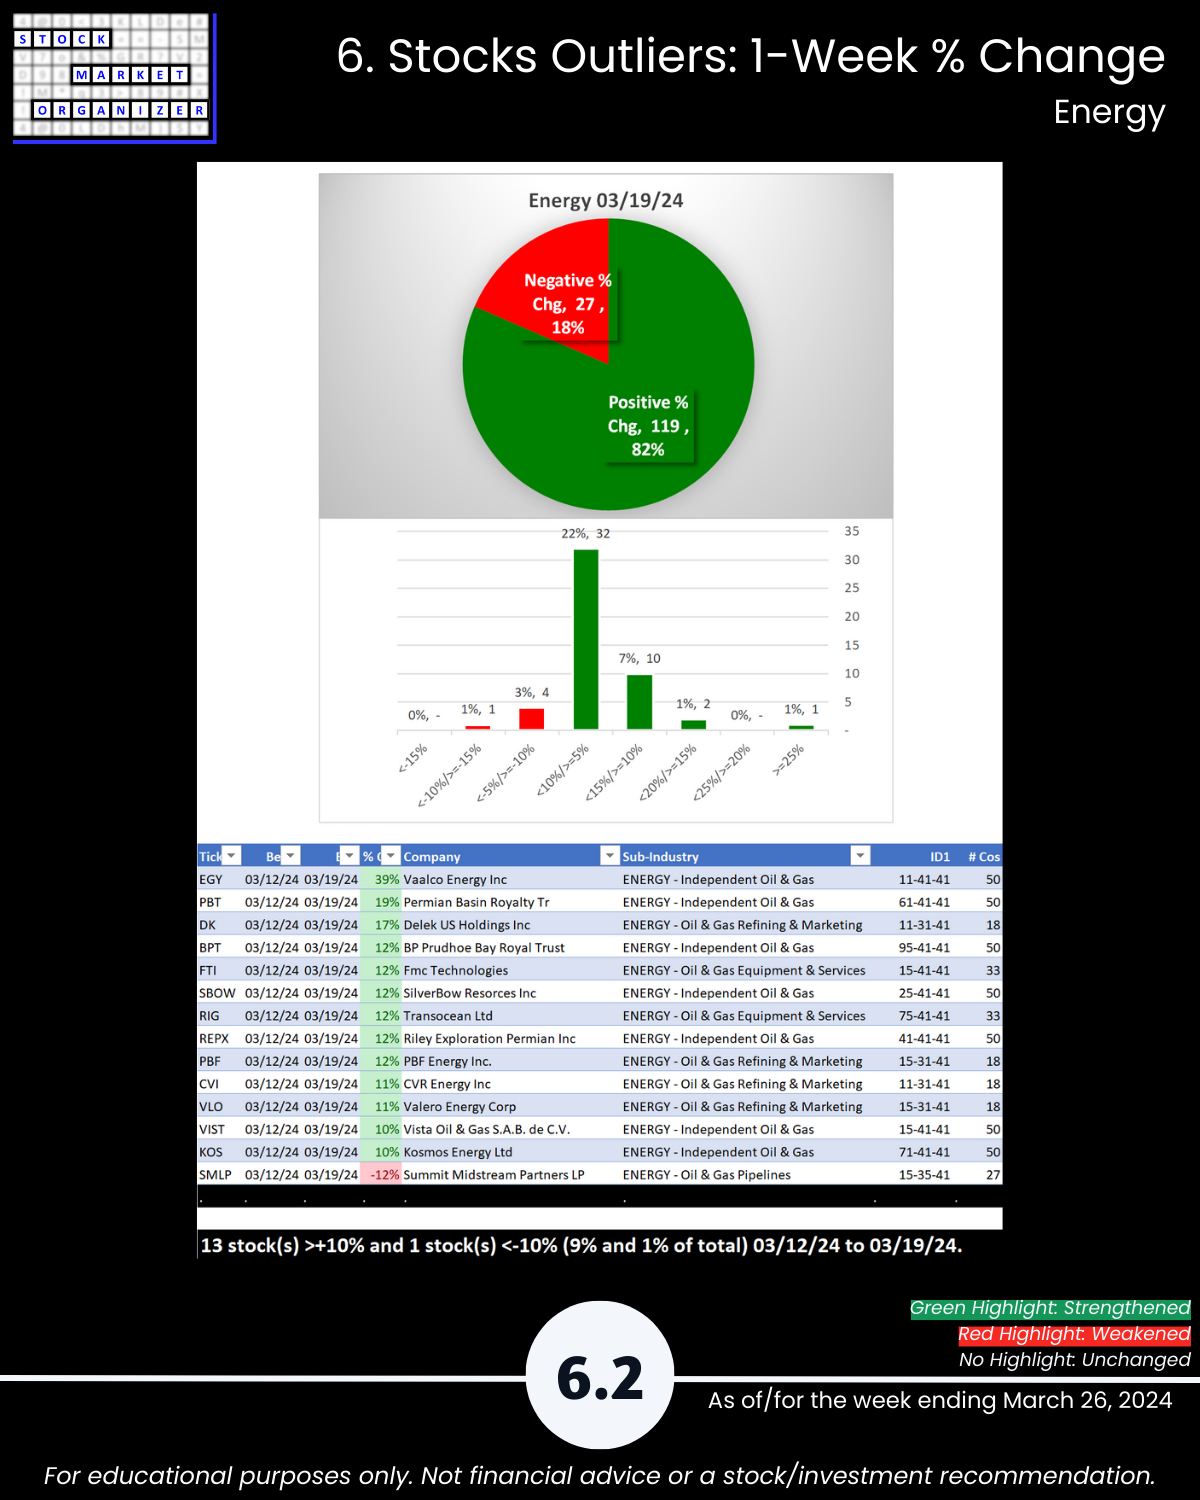
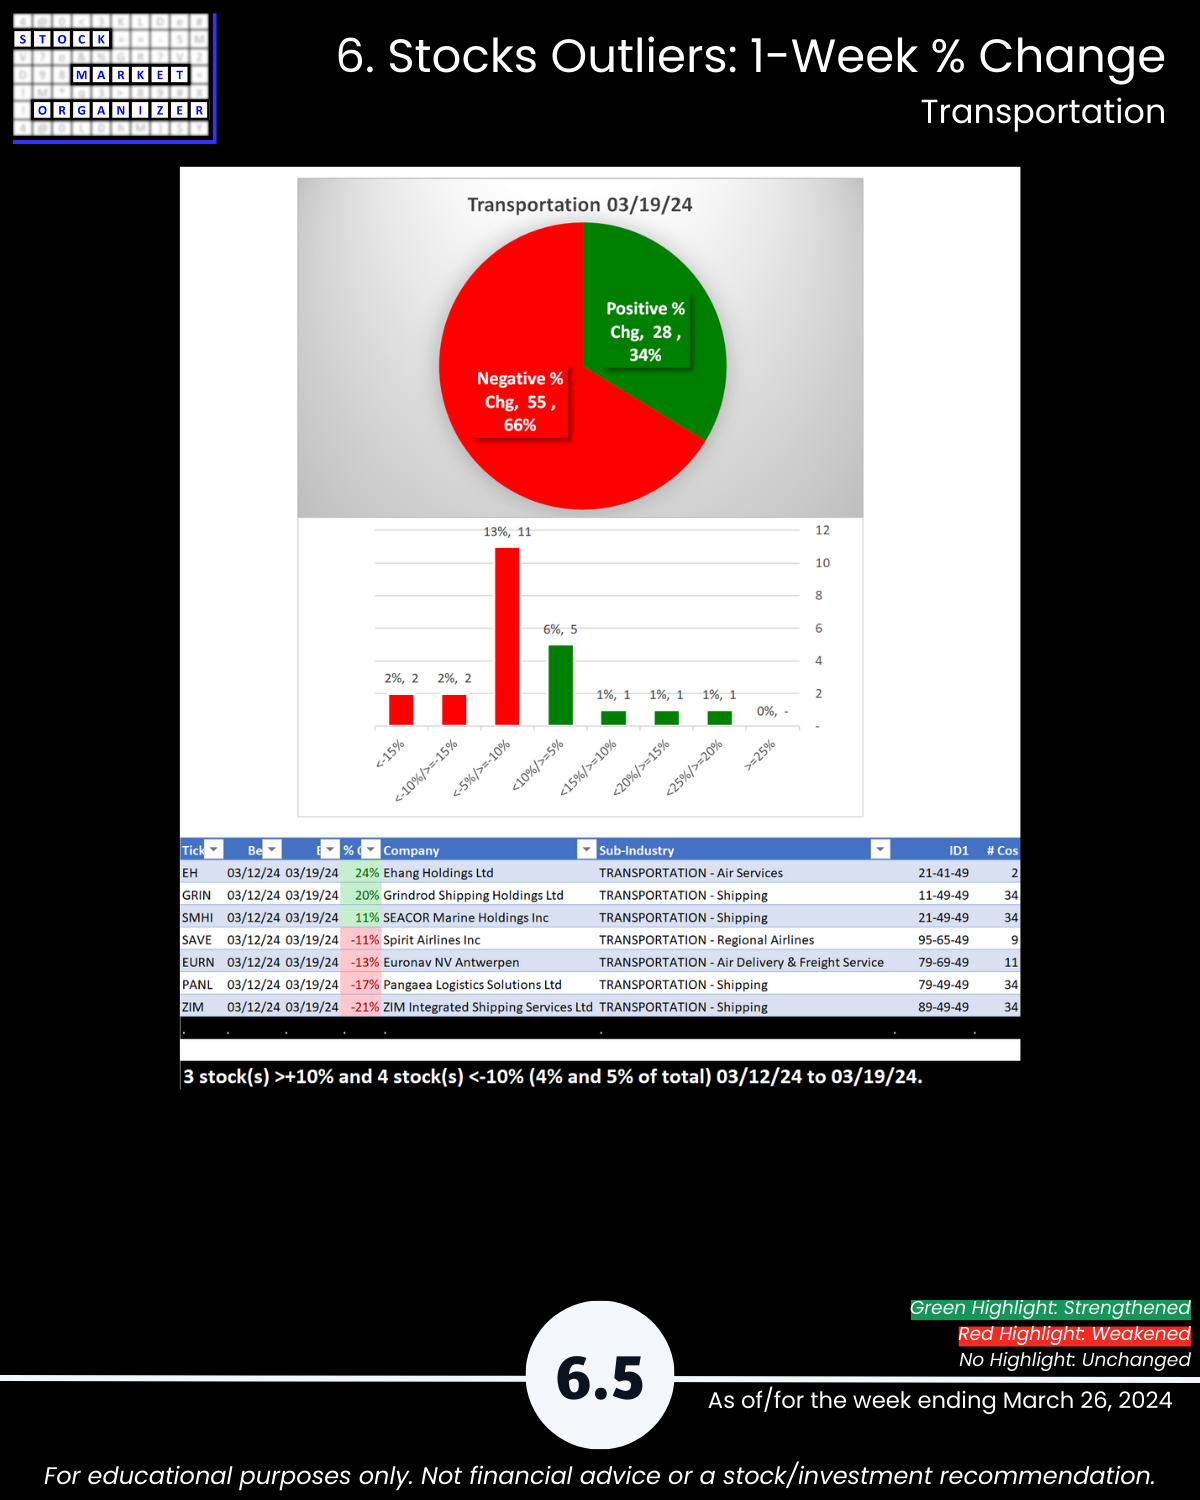
🔹 Stocks rated Strongest:Weakest: Energy 40%:8%, Materials/Const 78%:4%, Transportation 39%:16%
- Outliers: Energy 82% positive stocks, Transportation 66% negative; GOEV +104%, FSR -58%; EGY +39%; LICY +129%, EVA -25%; HNRG -29%; EH +24%, ZIM -21%
- @ 5-Year Highs/Lows %: Materials & Construction 28%, Energy 14%, Automotive 11% of stocks at highs
This report may particularly be of interest if the following 5 concepts resonate with you:
- The stronger your stocks, the greener your P&L.
- The journey to 100%+ returns begins with 10% returns.
- The journey to a multi-month rally begins with one up week.
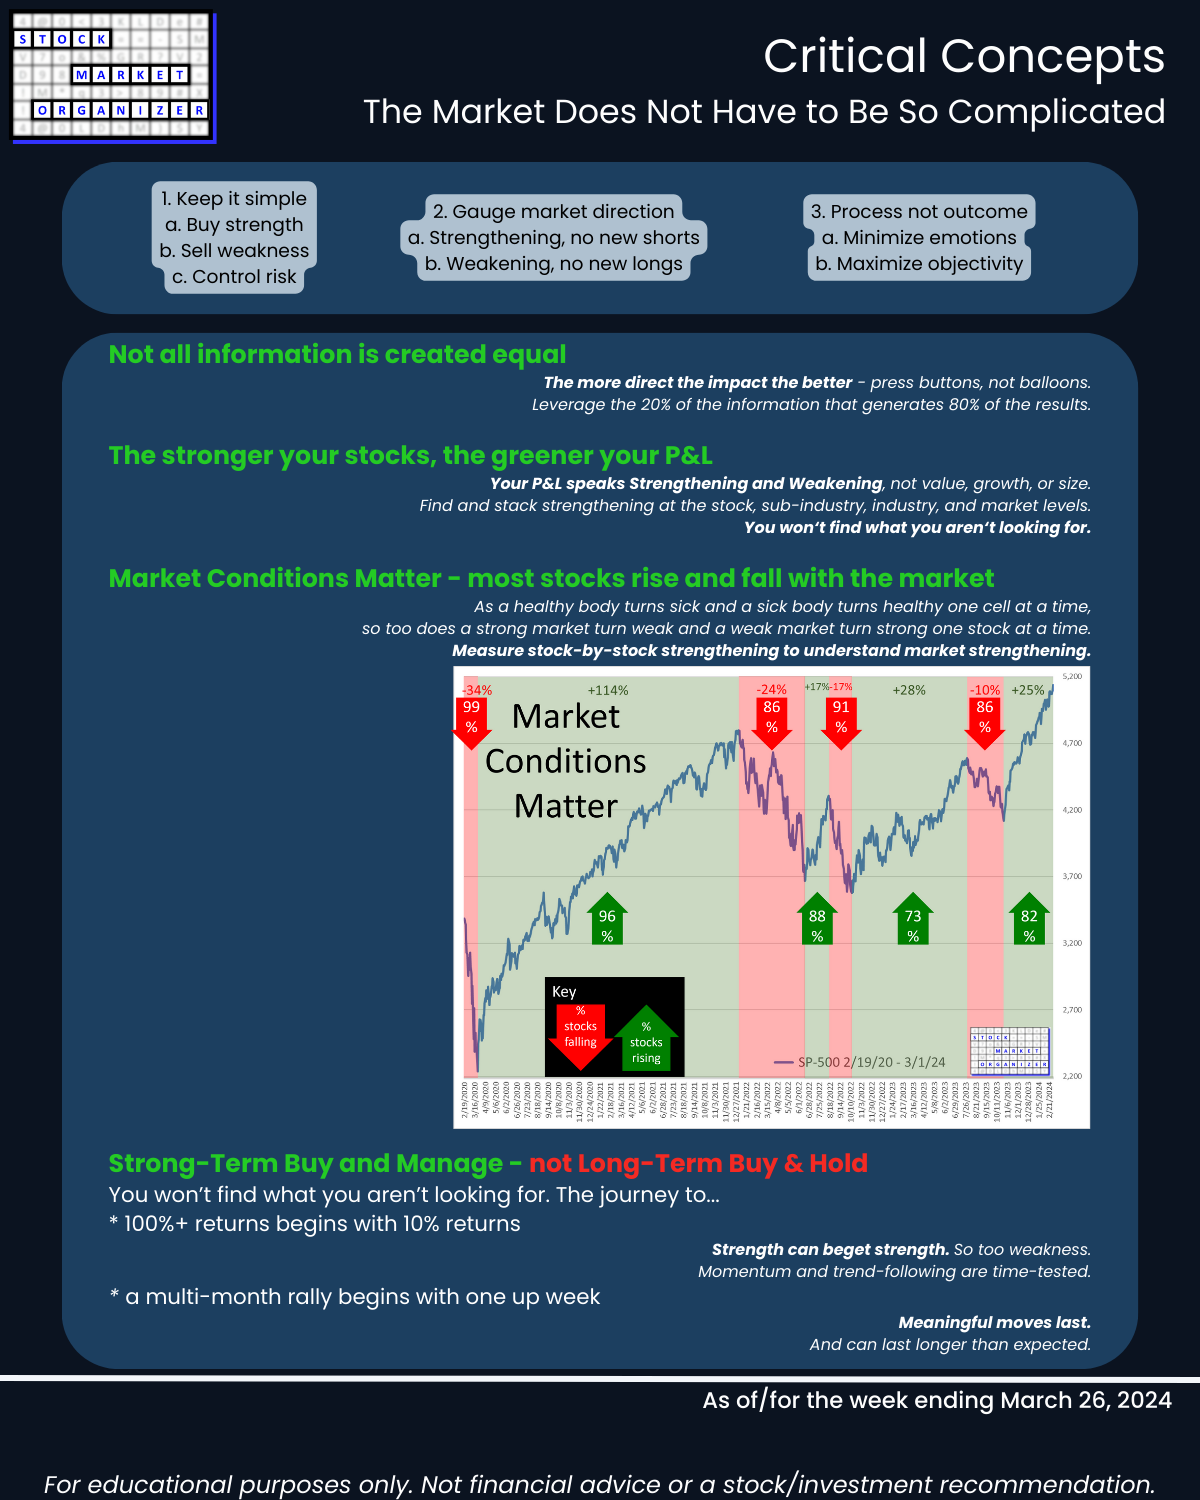
- Most stocks do what the market does. (While the market can only do what its underlying stocks, sub-industries, and industries do.)
- 80/20: not all information is created equal. (Press buttons, not balloons.)
Following are galleries with page-by-page views of this report.
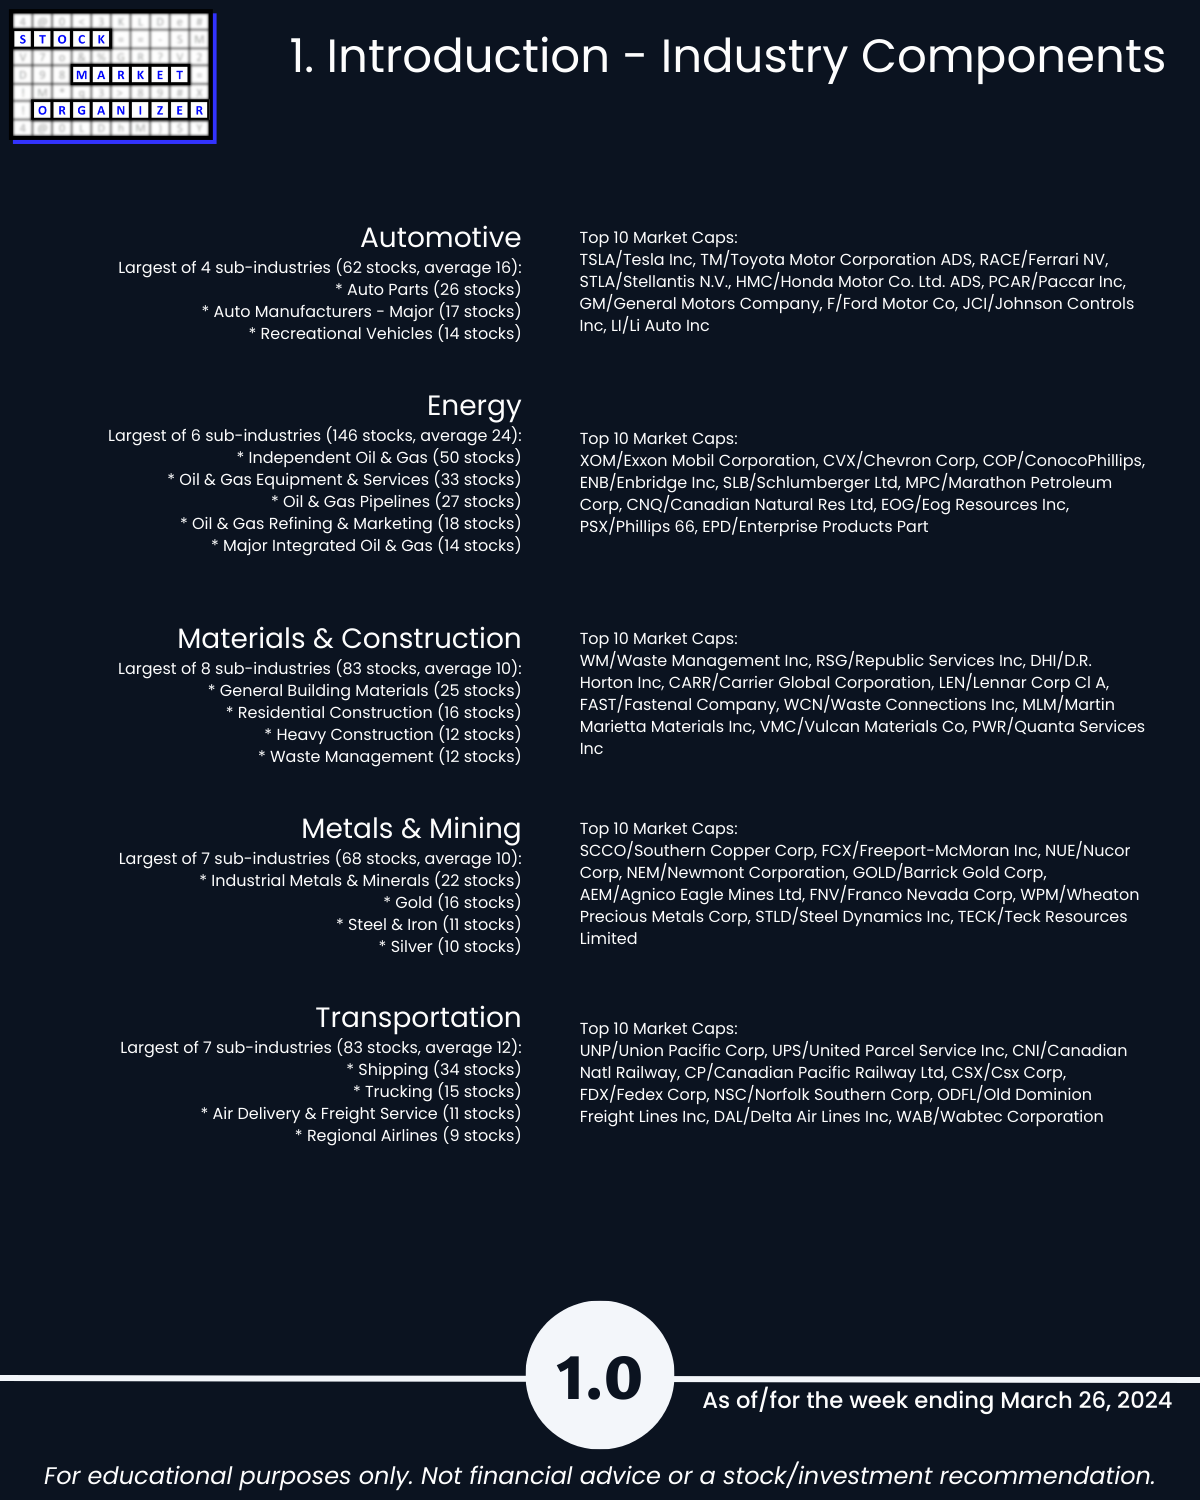
1. Introduction
2. Industry 1-Week Strengthening
3. Industry 10-Week Strengthening
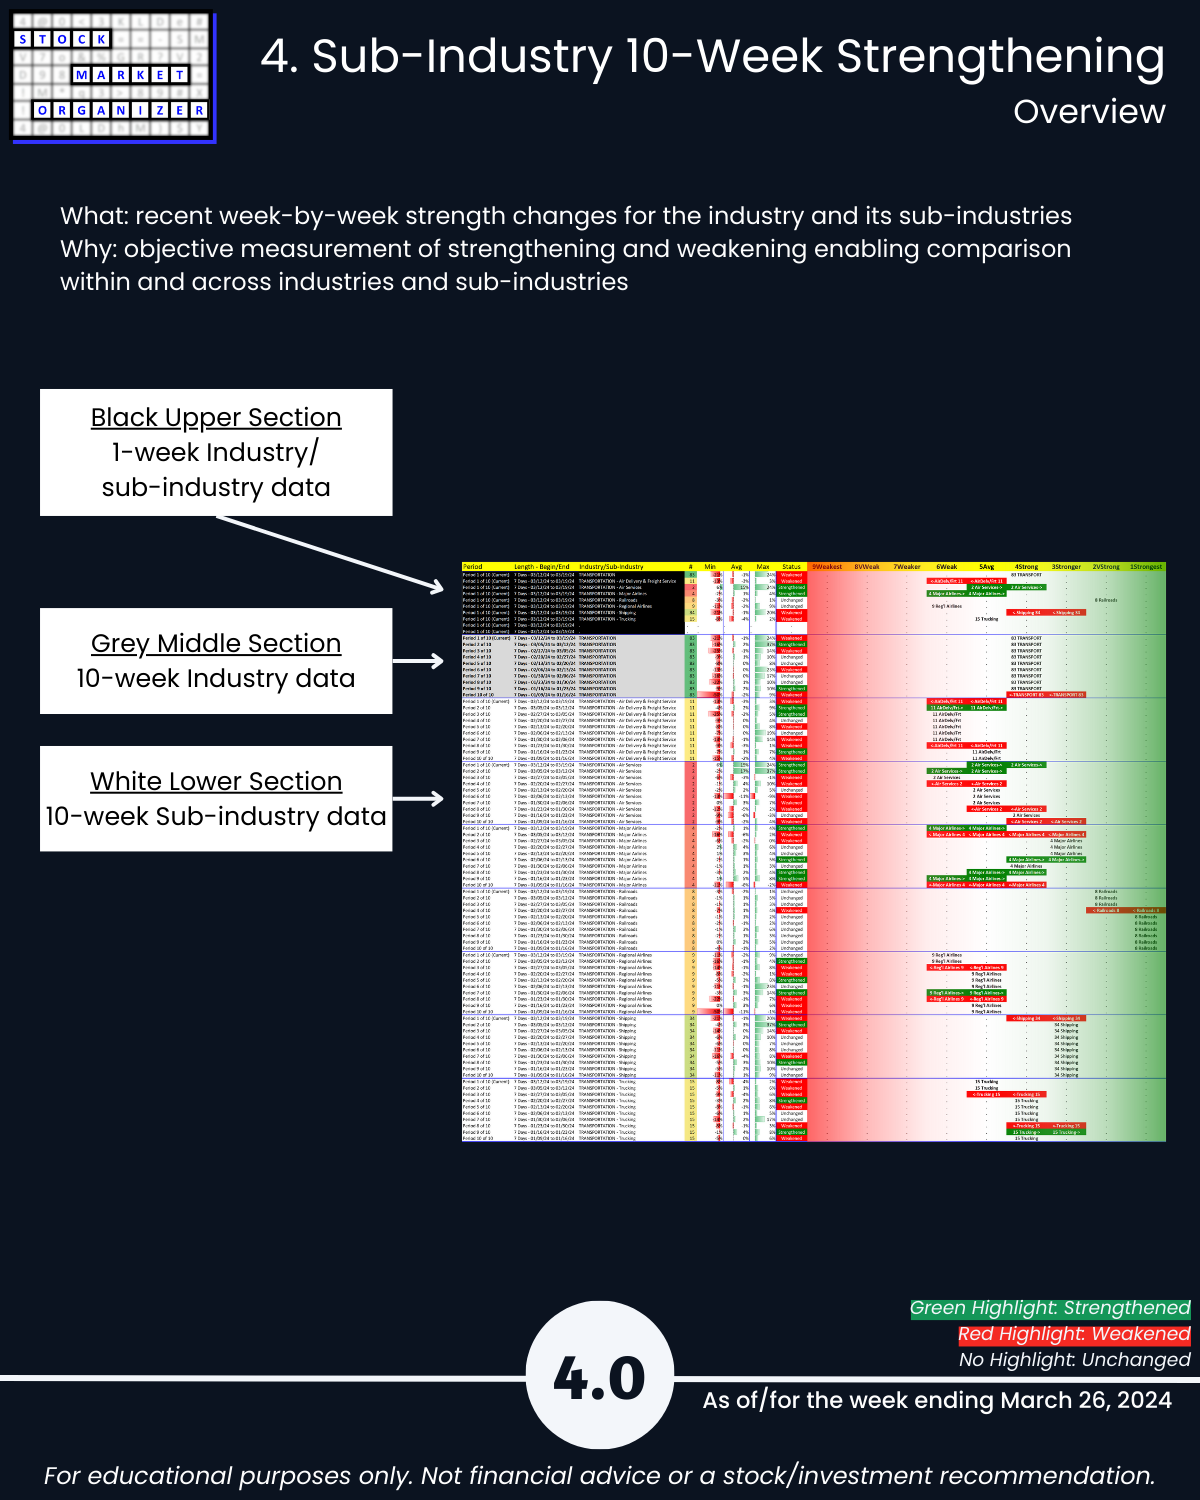
4. Sub-Industry 10-Week Strengthening
5. Stocks Outliers: Strongest/Weakest Rated
6. Stocks Outliers: 1-Week % Change
7. Stocks Outliers: 5-Year Highs/Lows