SMO Exclusive: Strength Report Group 1 2024-03-12

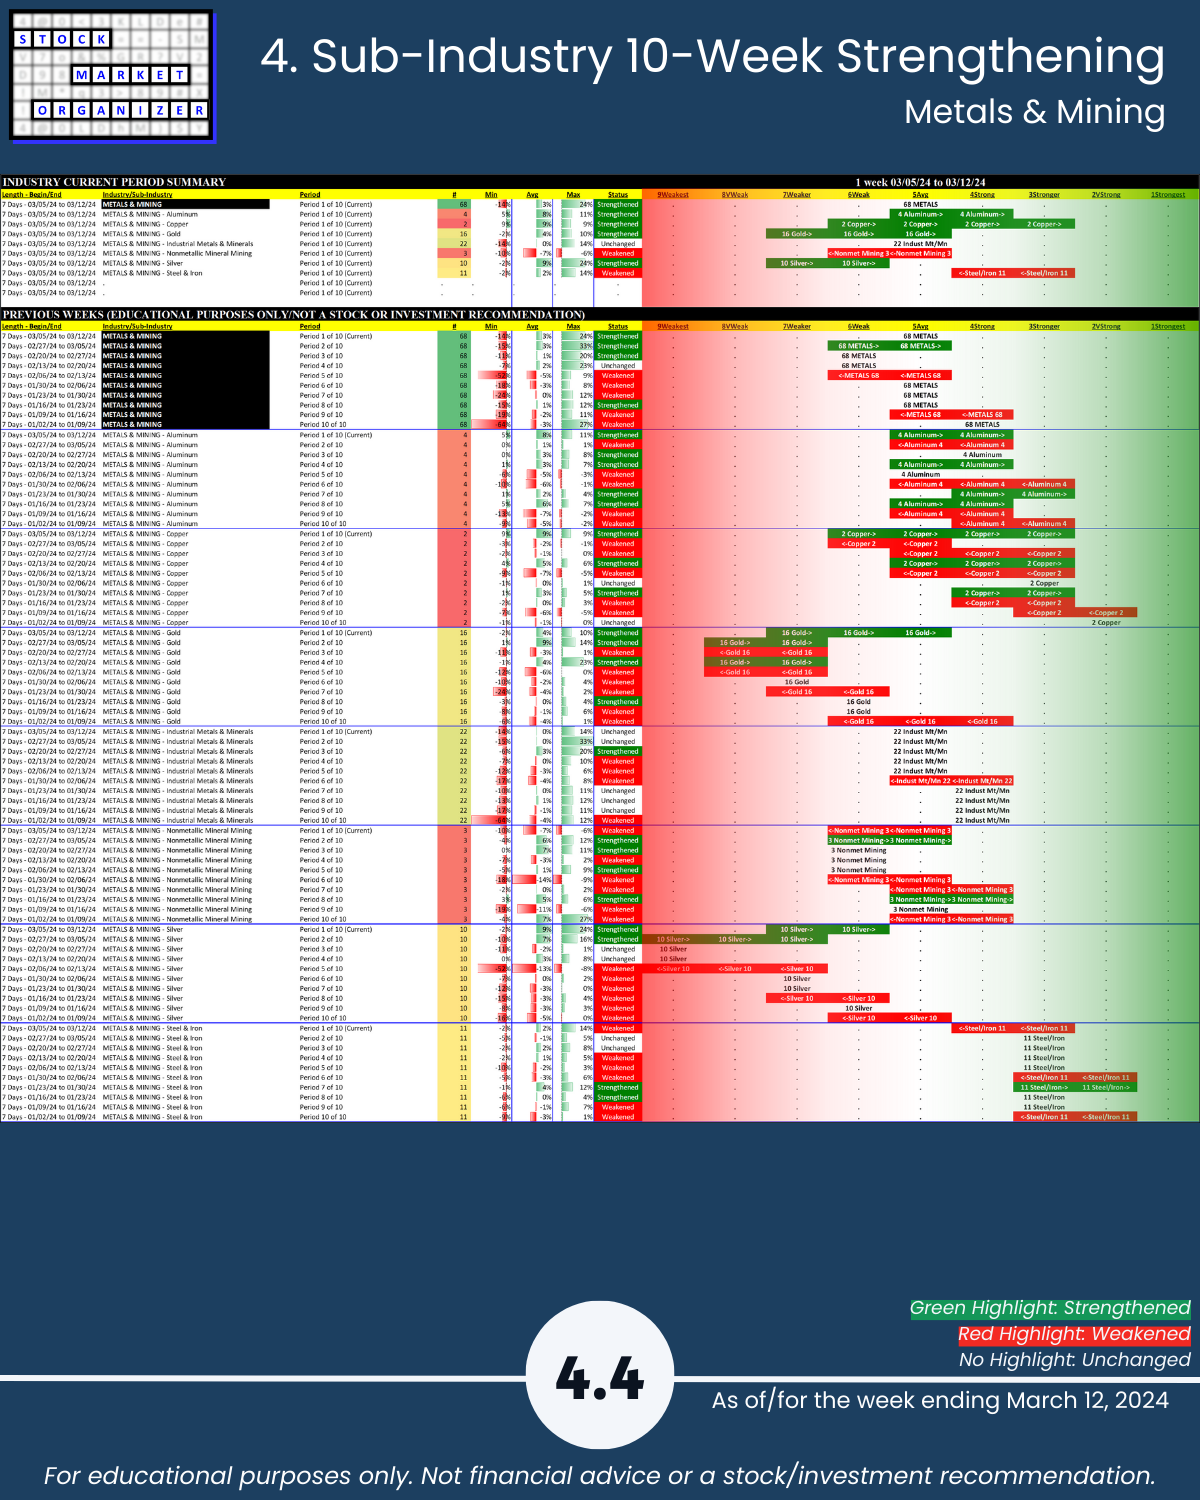
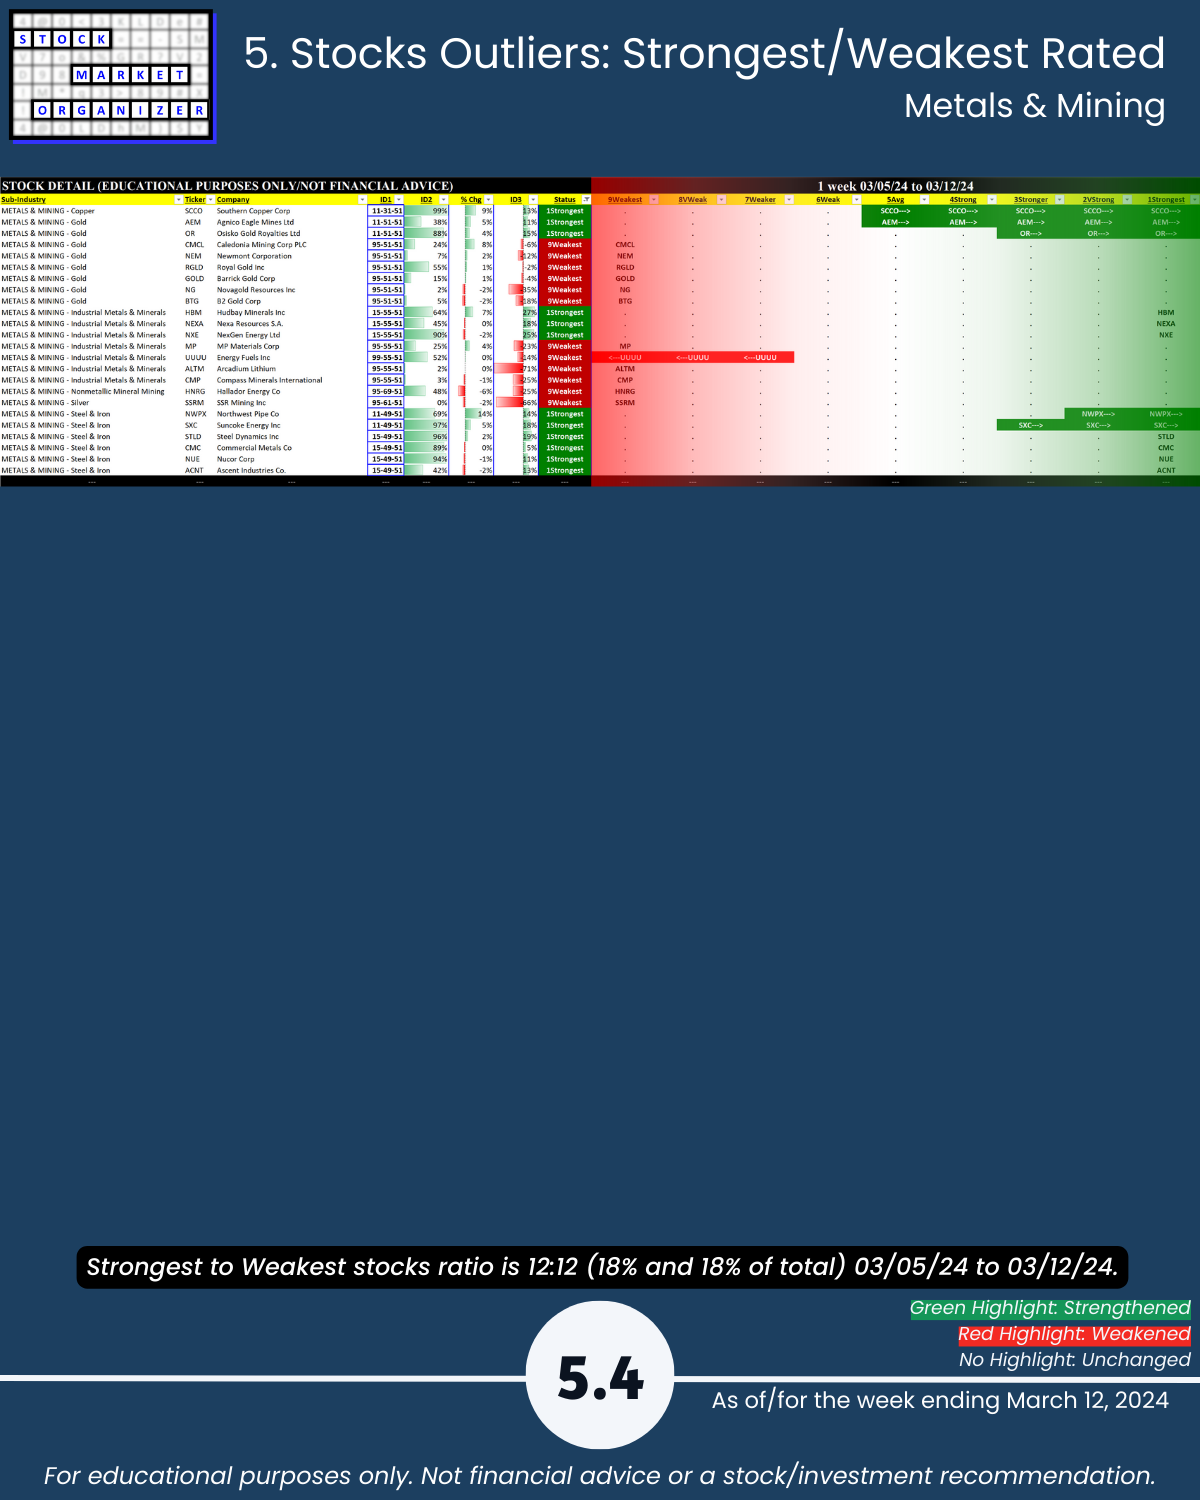
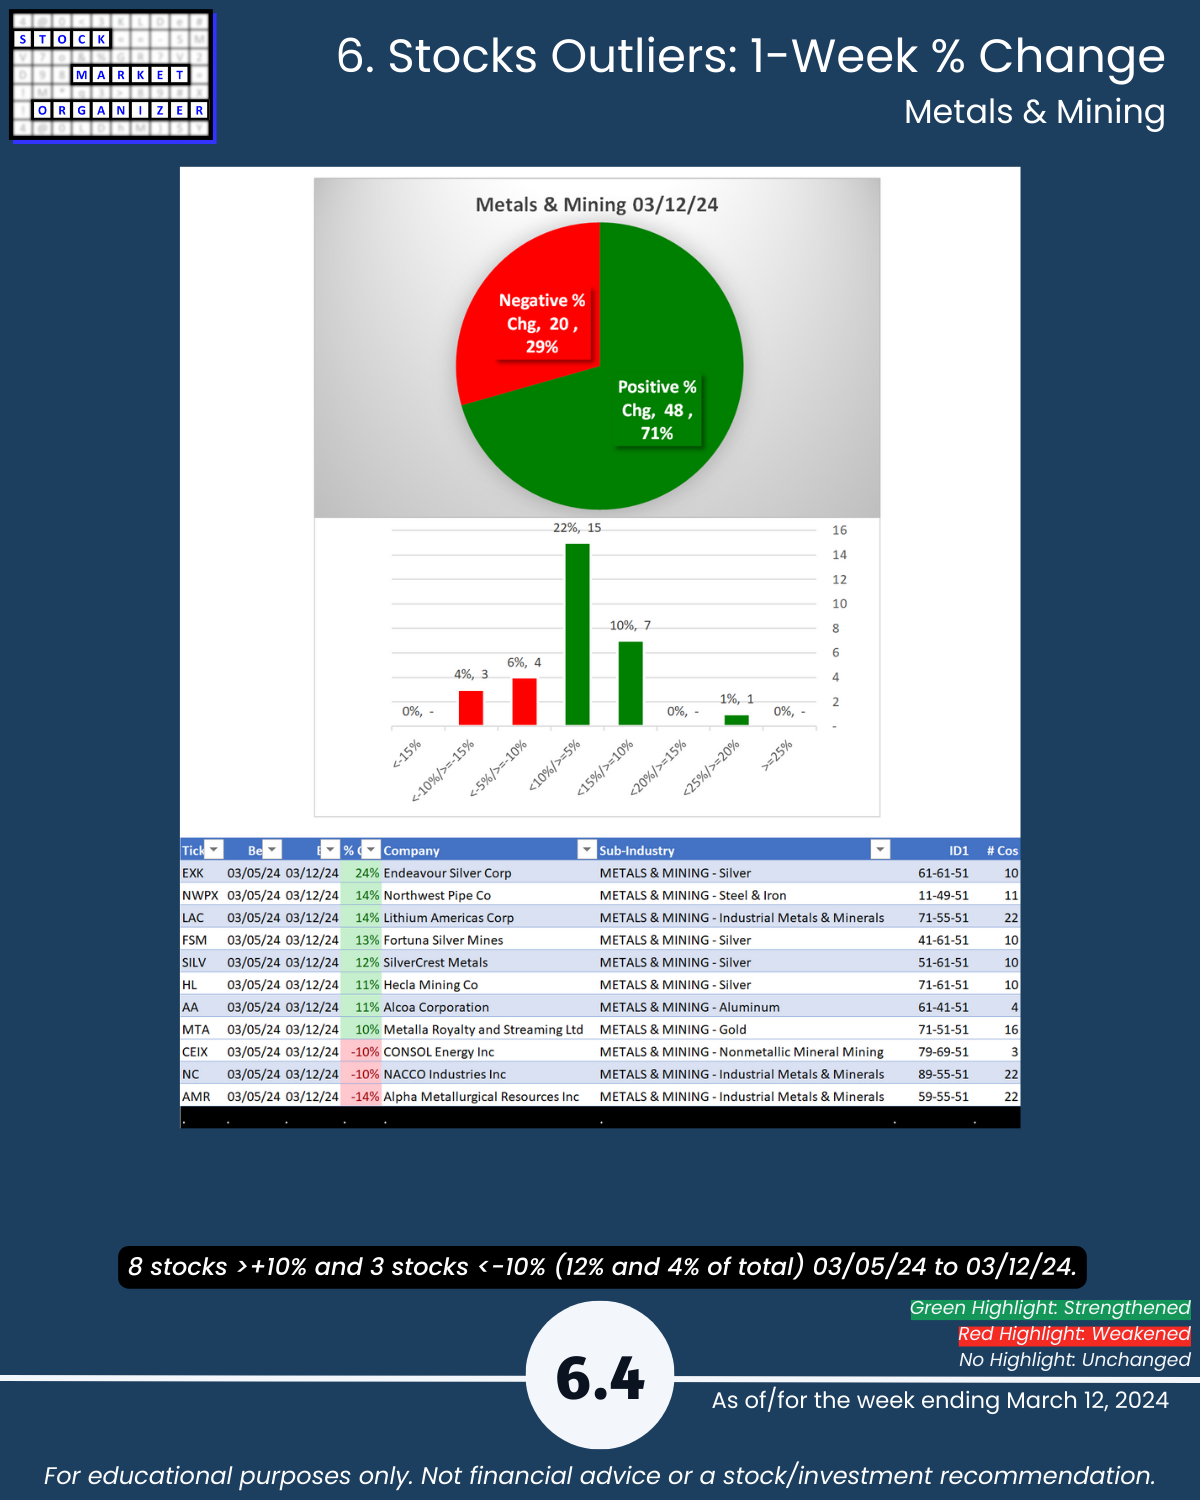
U.S. stock market 3/12/24, Gold and Silver = strengthened 3 levels in 2 weeks (4 of 10 Silver stocks >10%). If you aren’t explicitly looking everywhere in the market for strength, how will you know where and when is emerging the next pocket of strength?
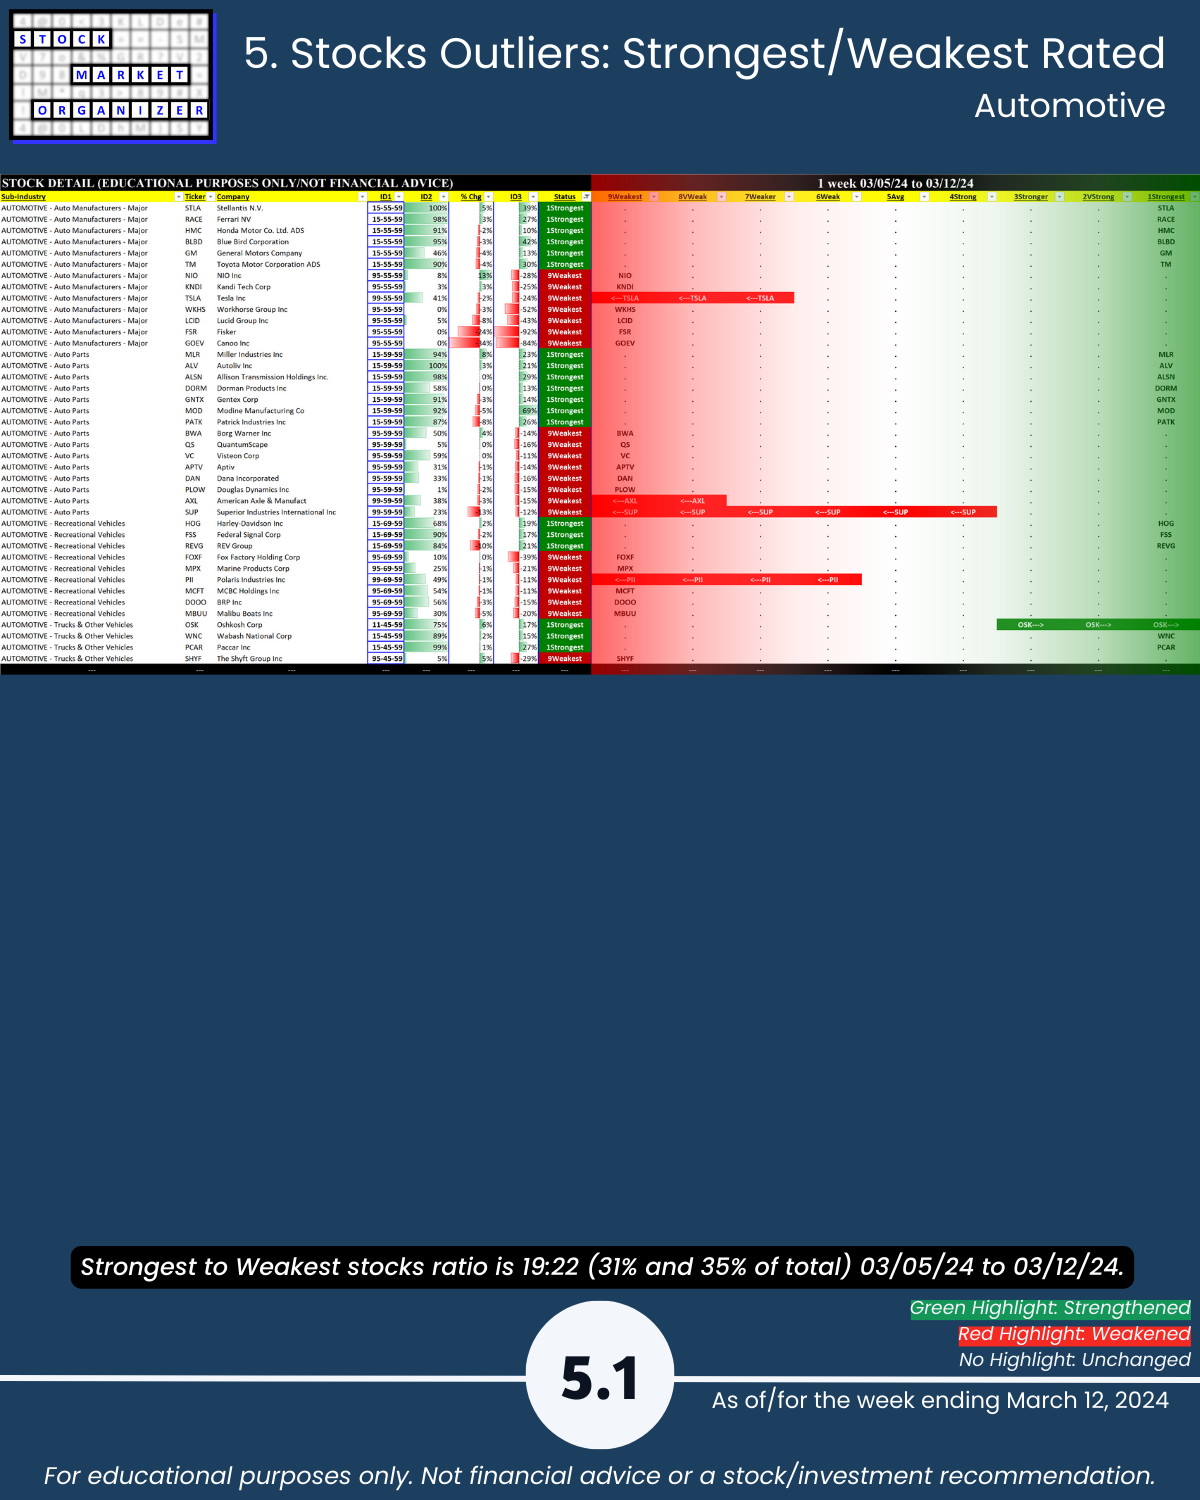
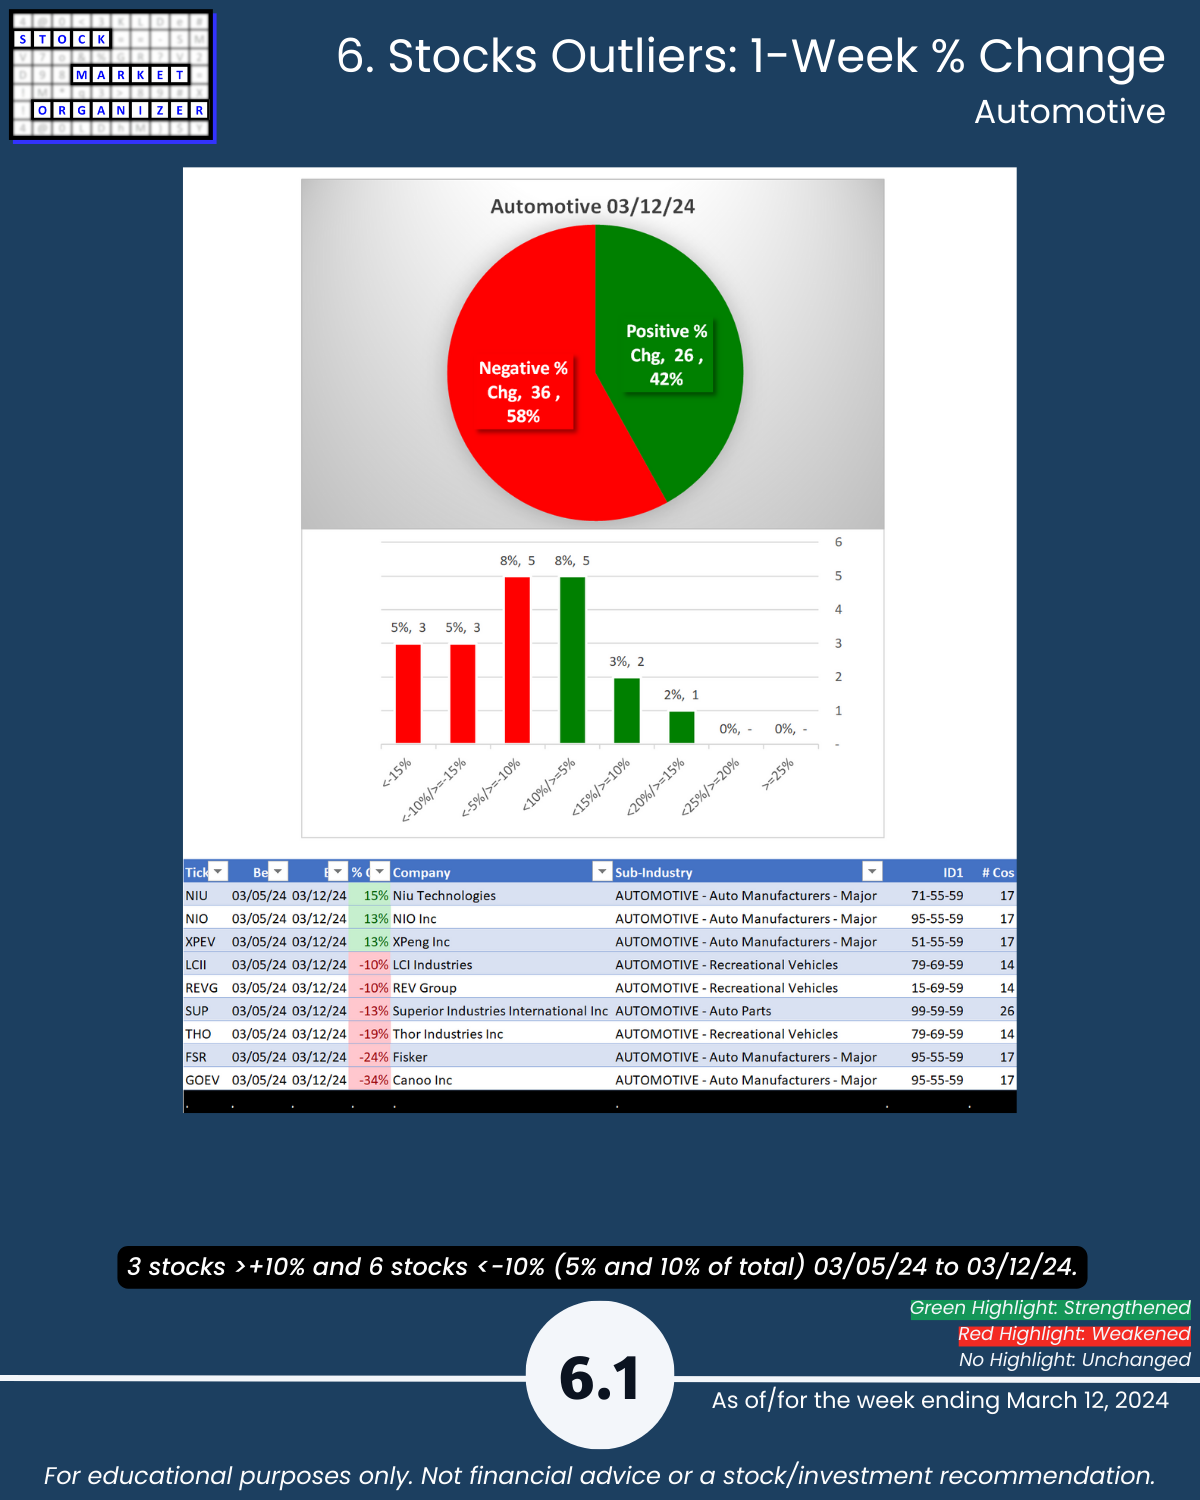
Conversely, FSR -24% after -40% previous week after -91% previous 14 months since year-end 2022. Weakness can beget weakness.
Why bottom fish when there are strengthening stocks with no overhead supply issues? The market is not dumb. Most of the time. And when it is “off” – prices are or are becoming uncoupled from fundamentals – this process provides opportunity.
Agreed the market can remain irrational longer than you can remain solvent.
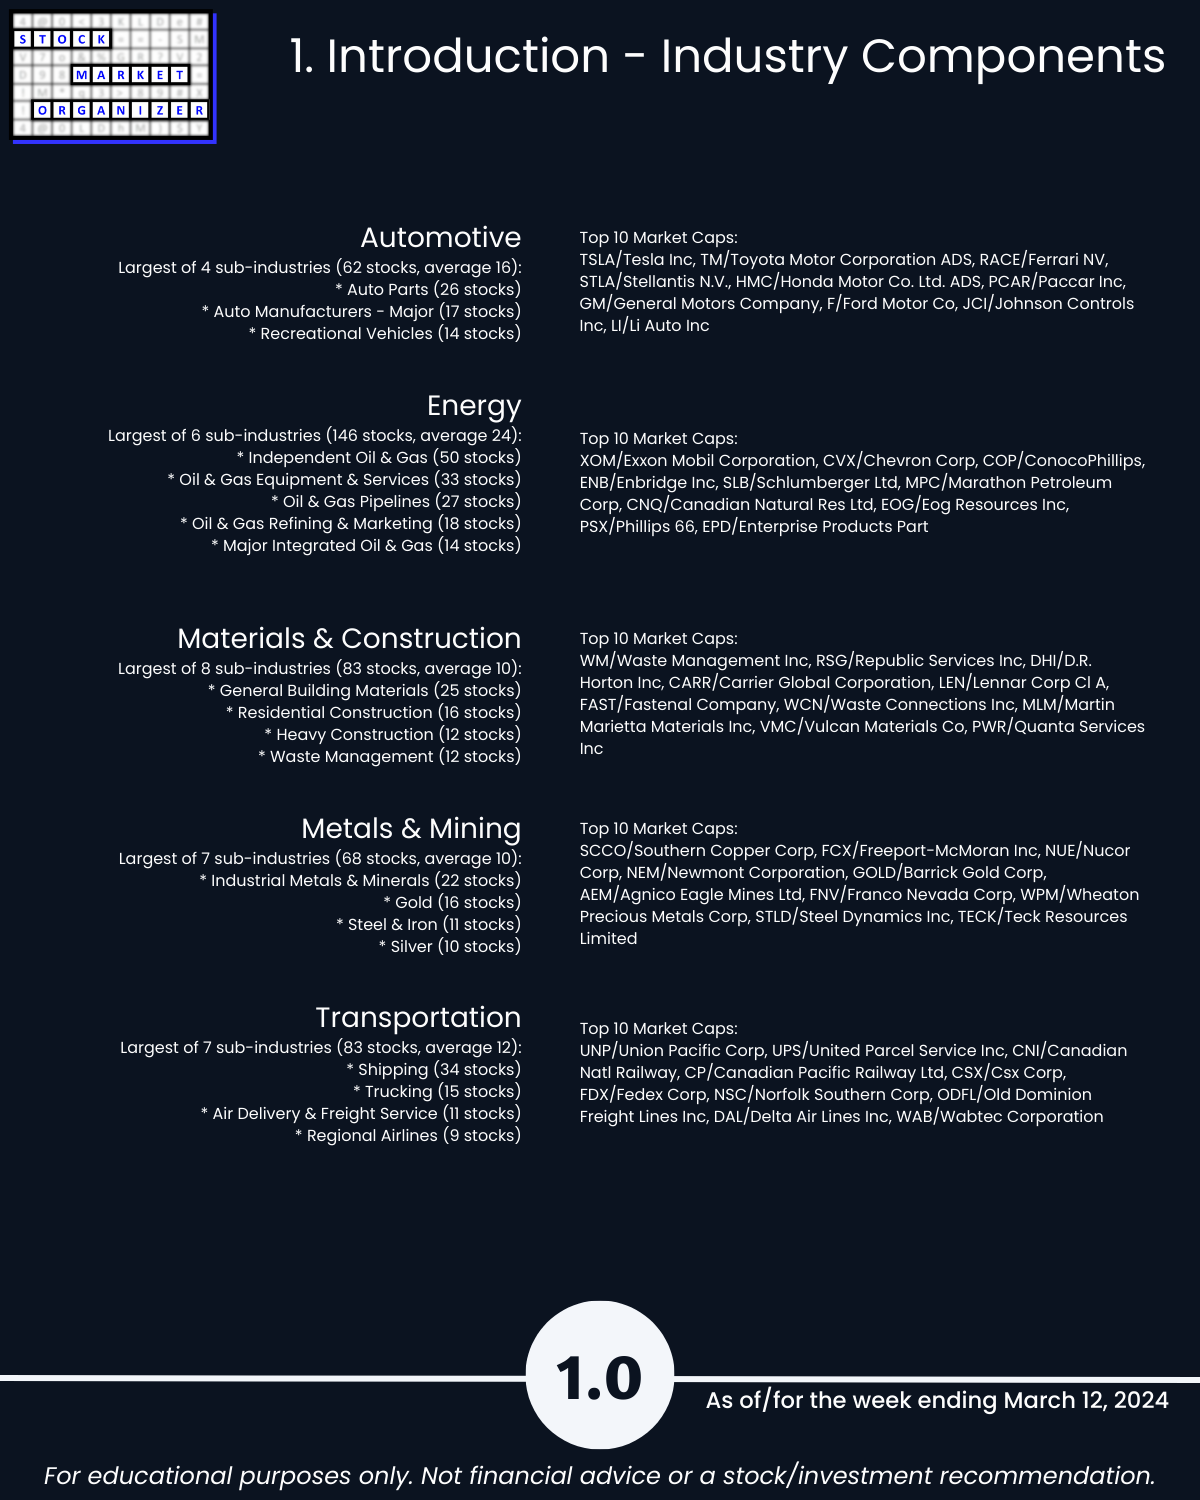
Today: Group 1 industries (Automotive, Energy, Materials & Construction, Metals & Mining, and Transportation)
Detail below/attached including Strongest-/Weakest-rated stocks and objective strengthening and weakening measurements for each of these industries.
HIGHLIGHTS
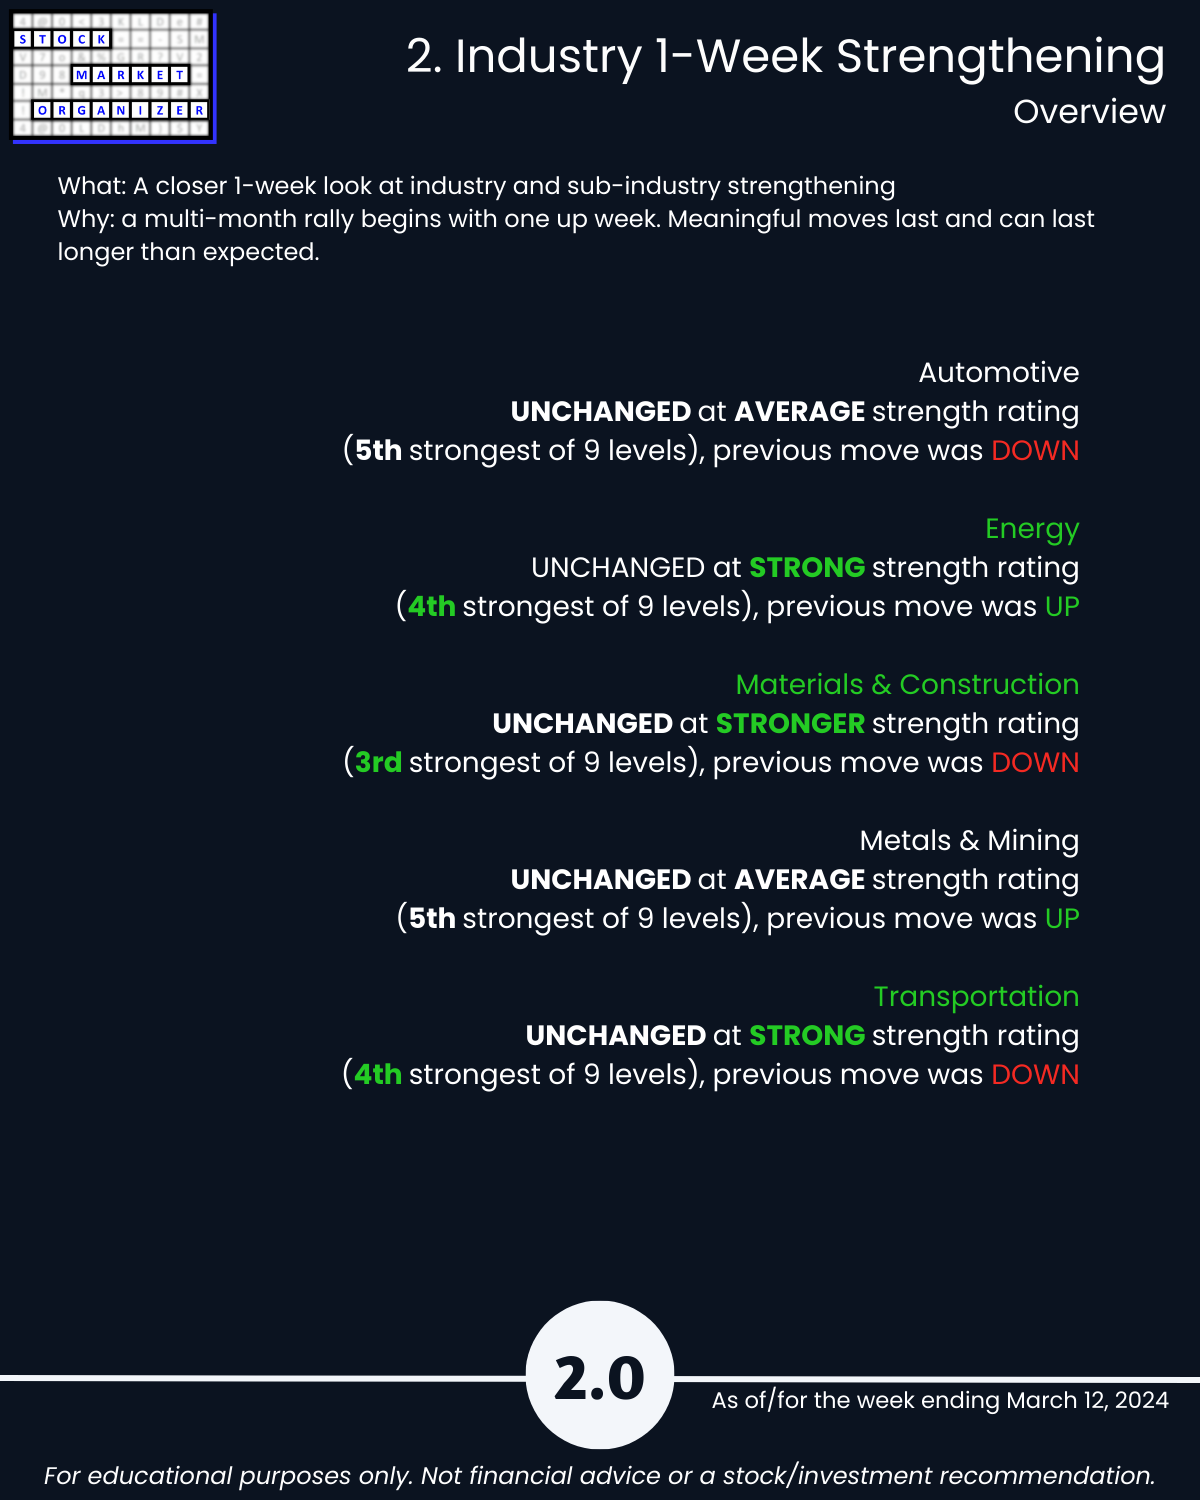
No industry strength level changes this week, but:
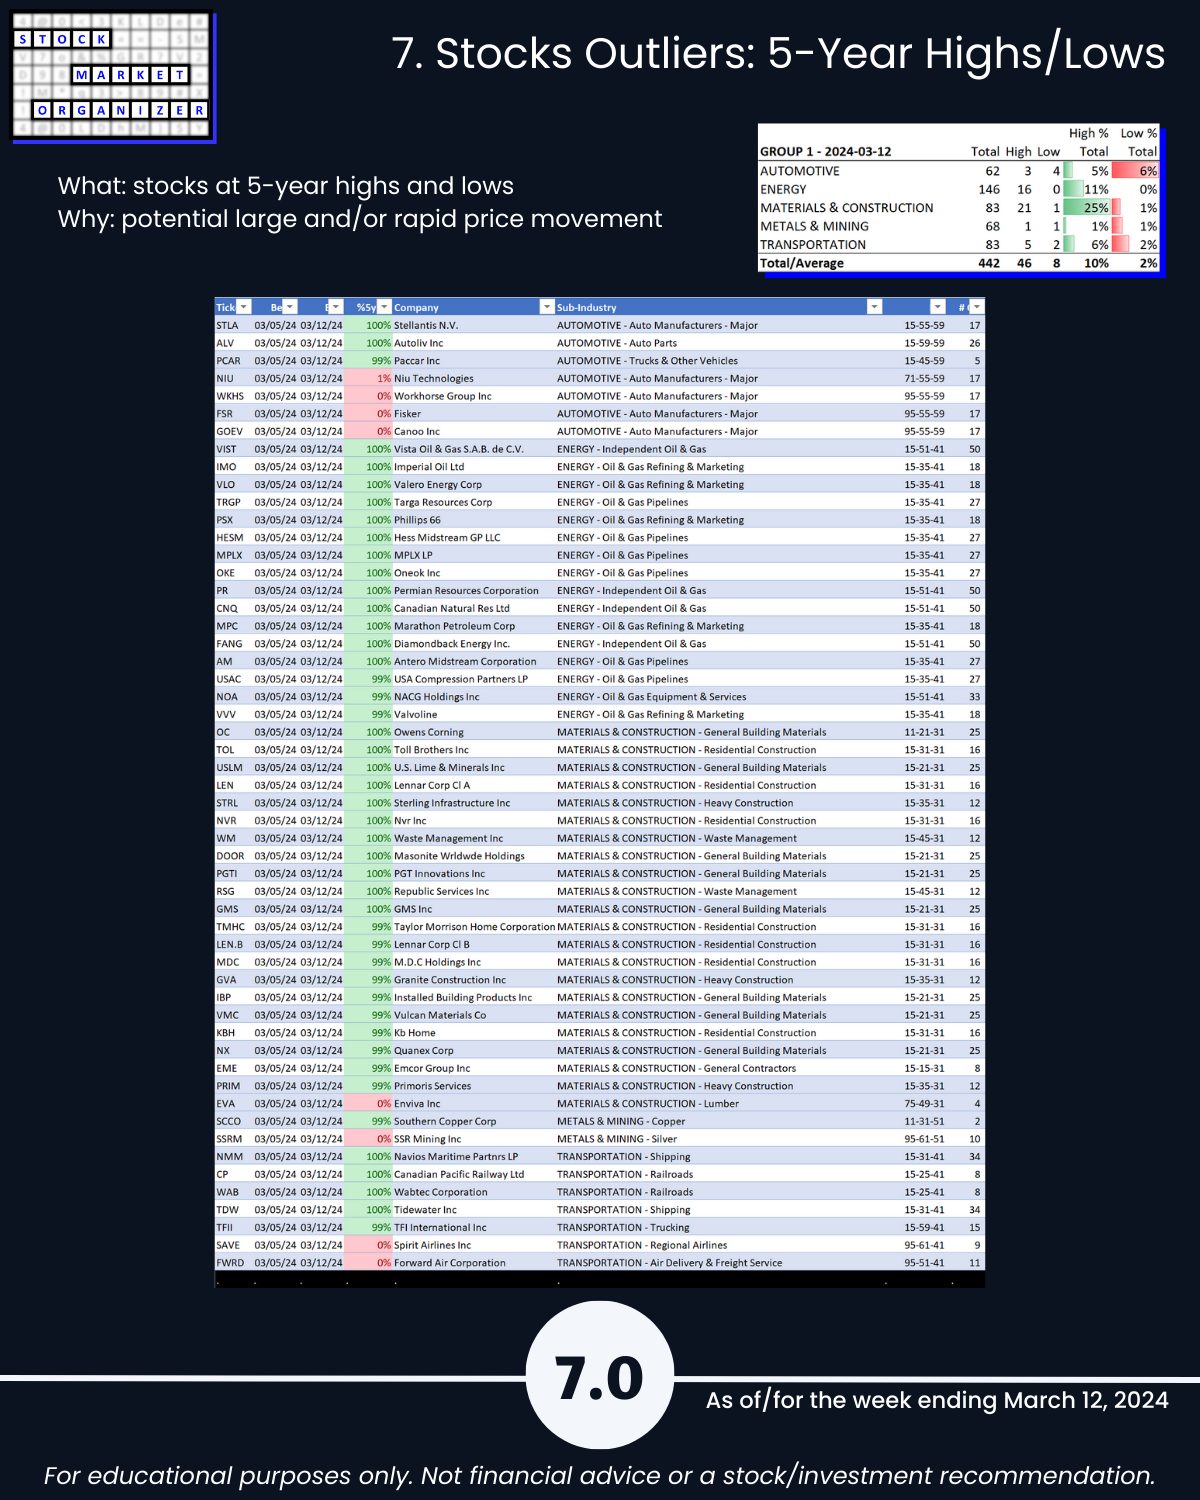
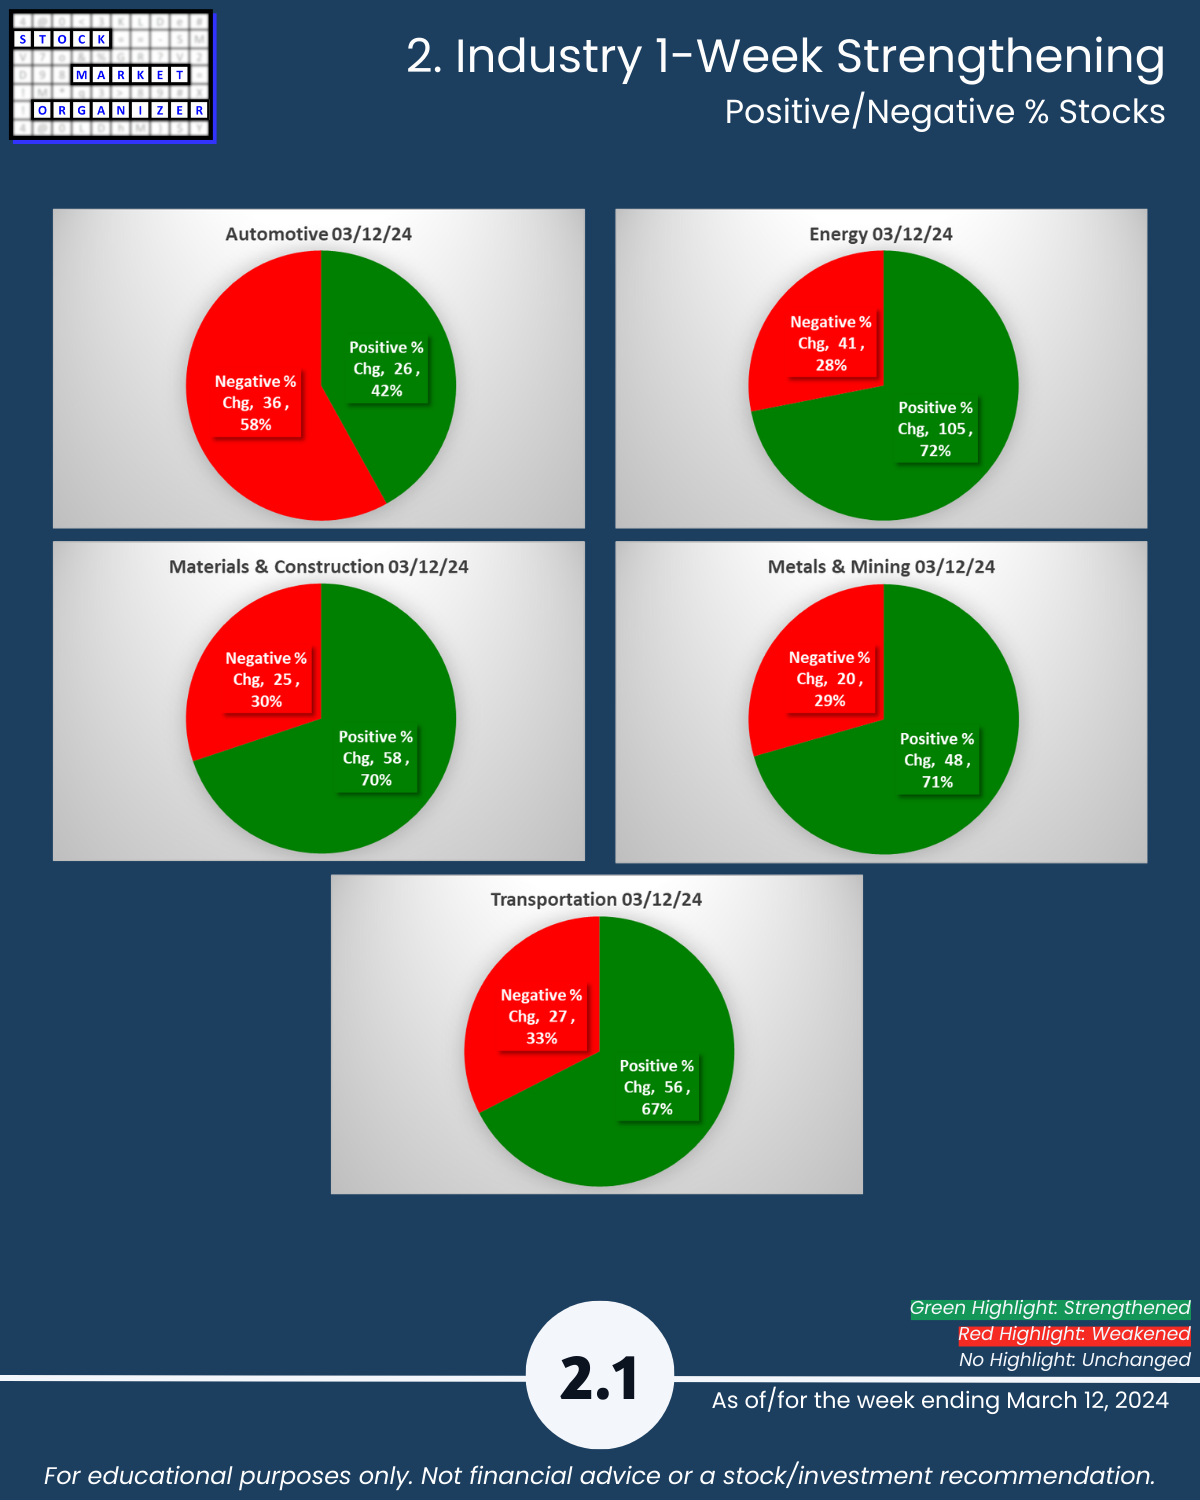
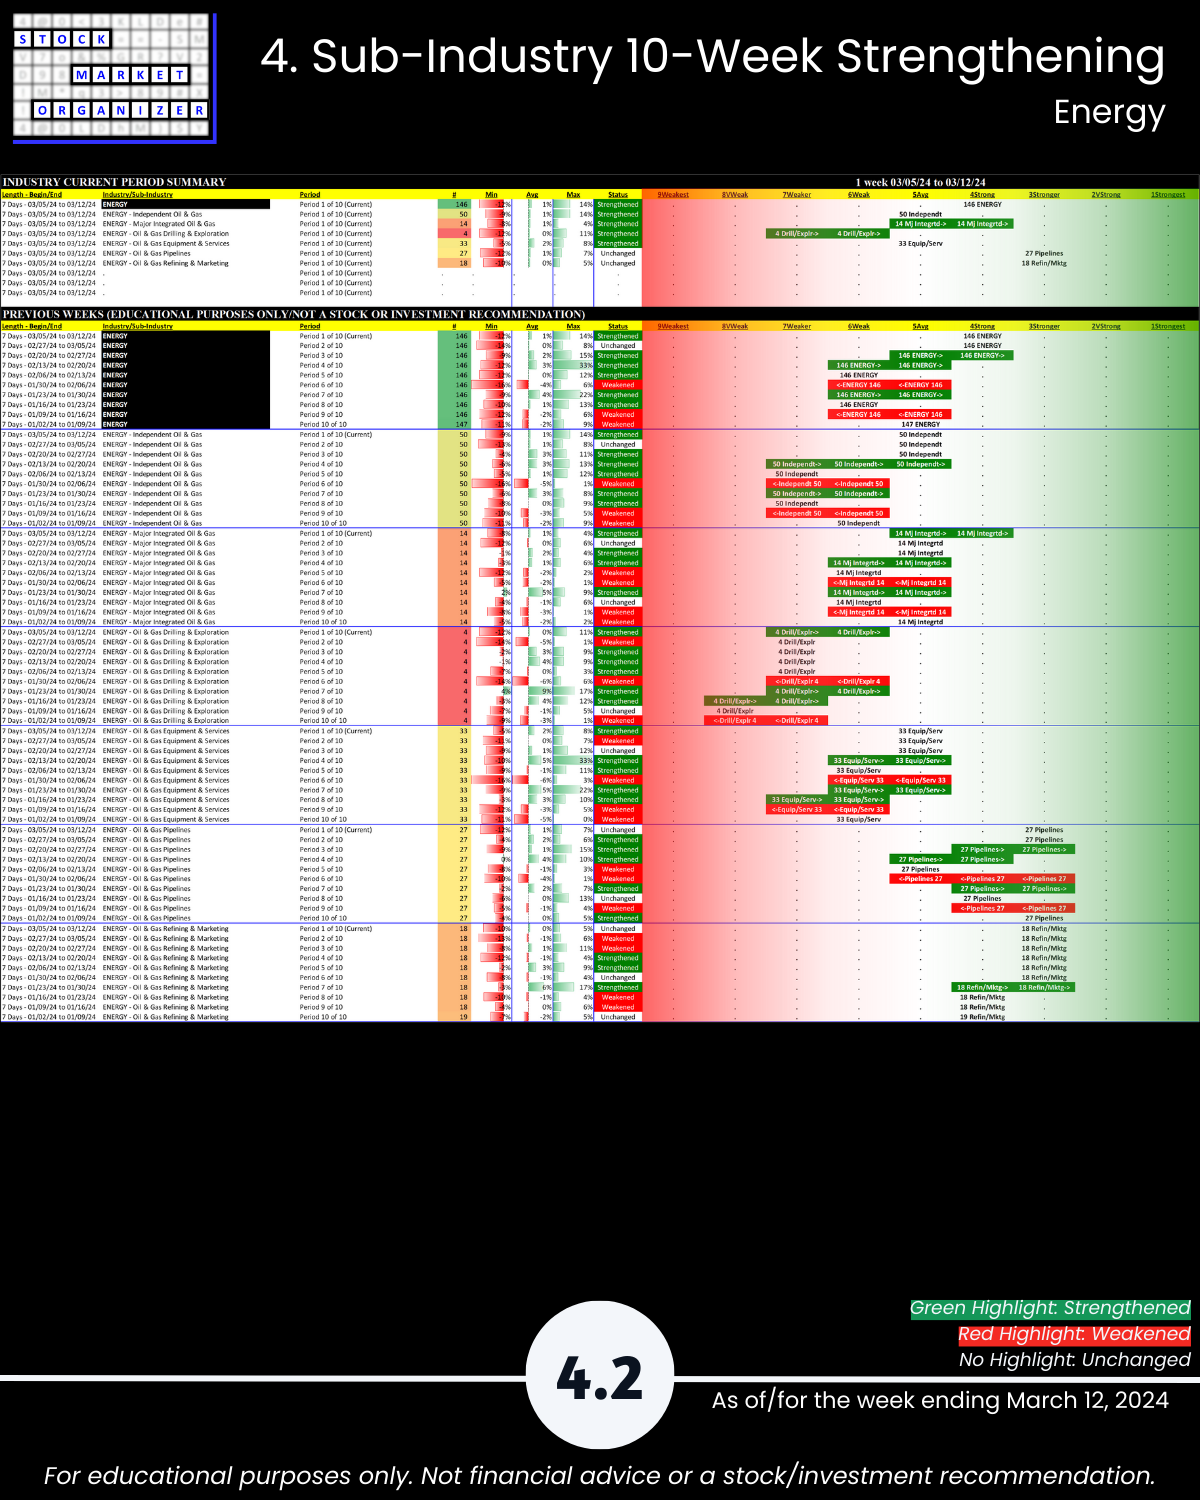
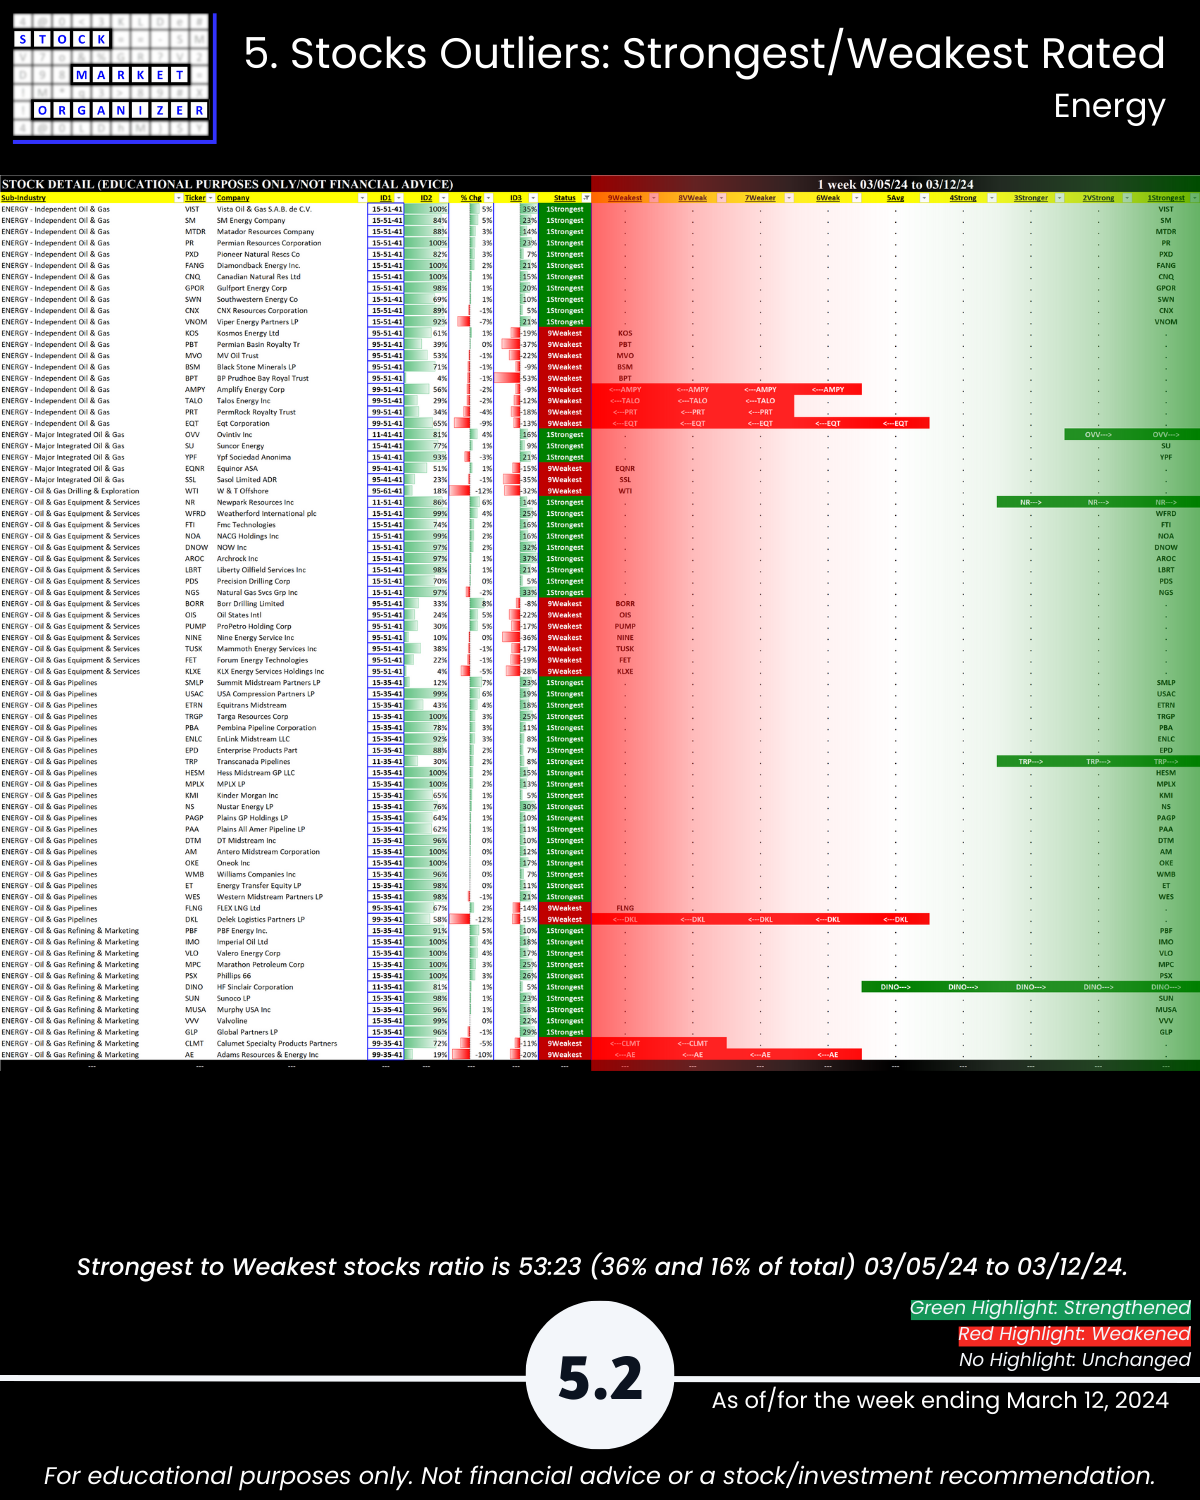
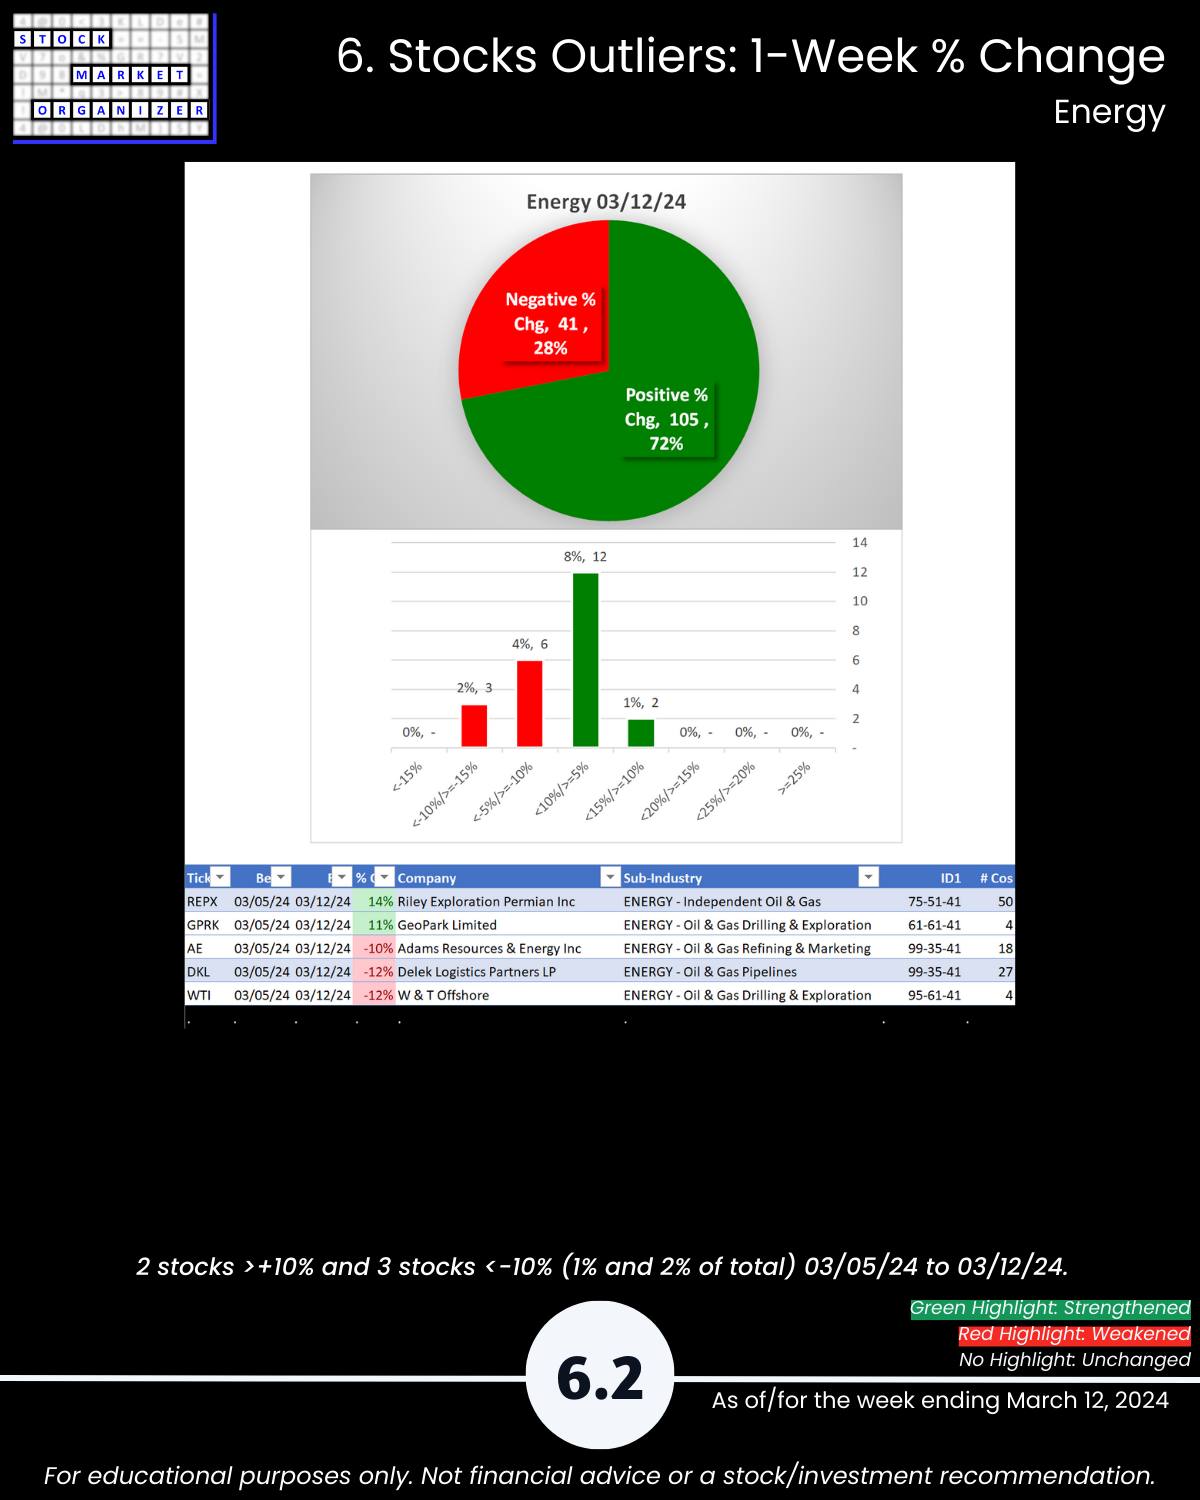
- Energy 72% positive stocks, 11% of its stocks => 5+ year highs this week
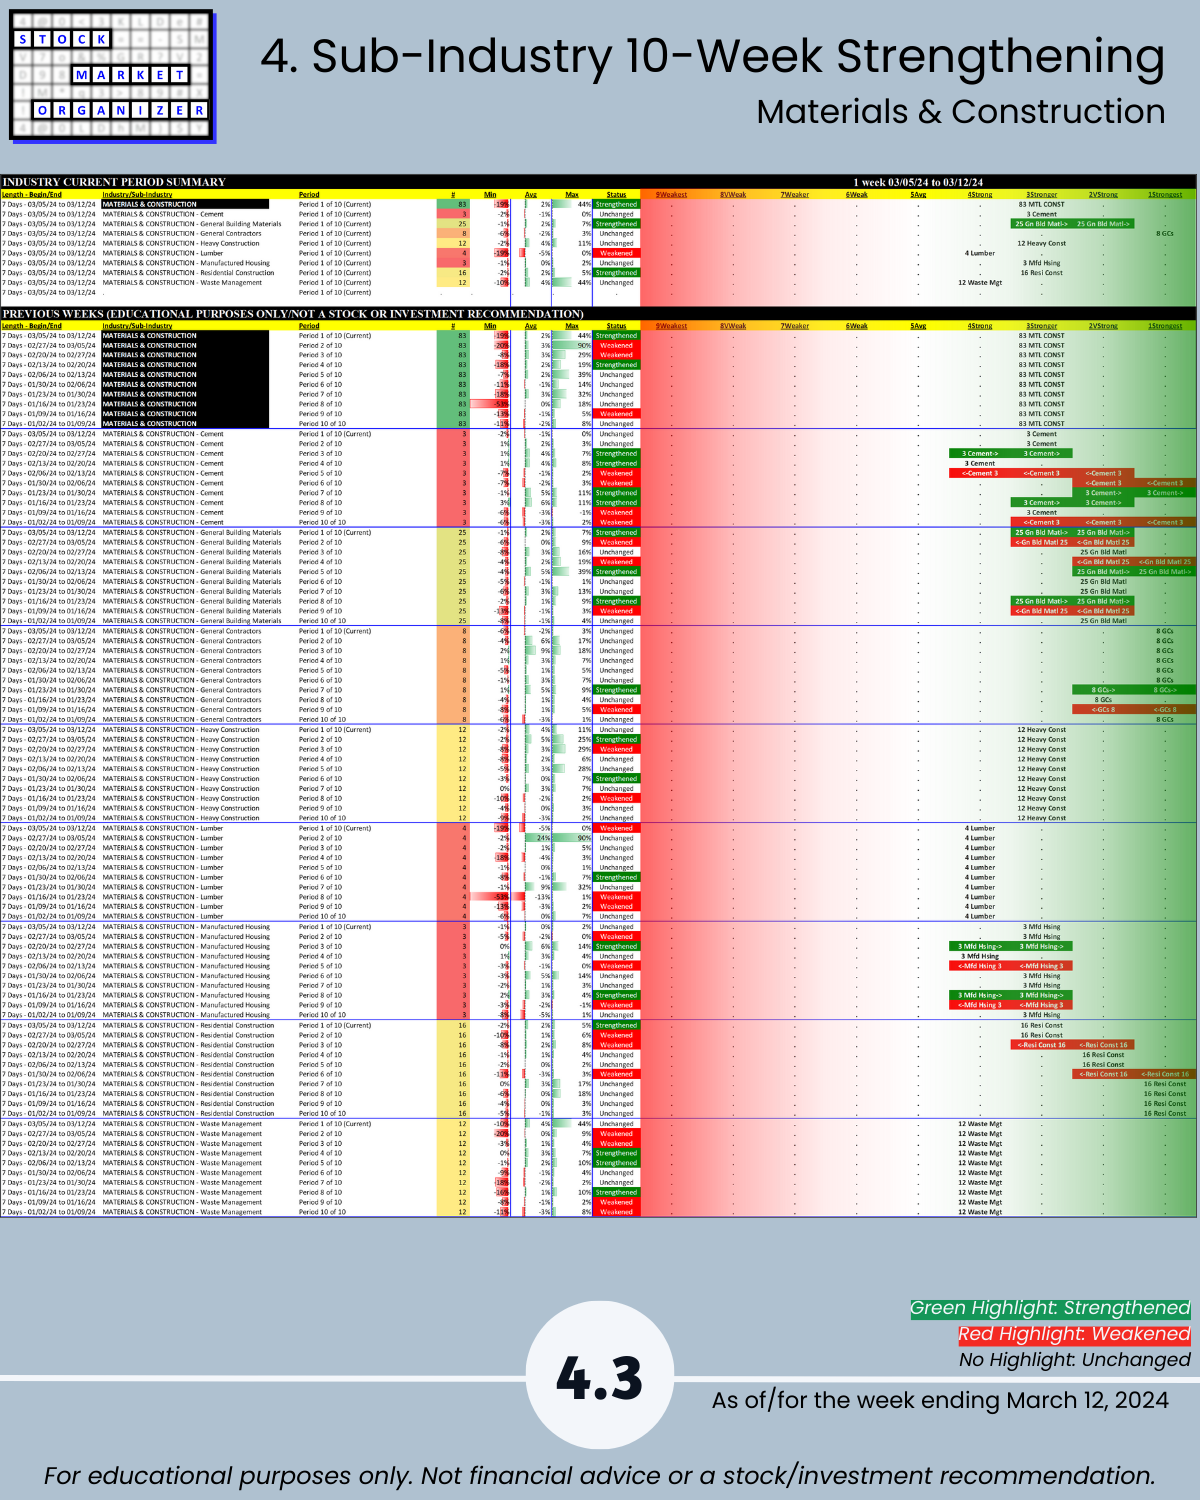
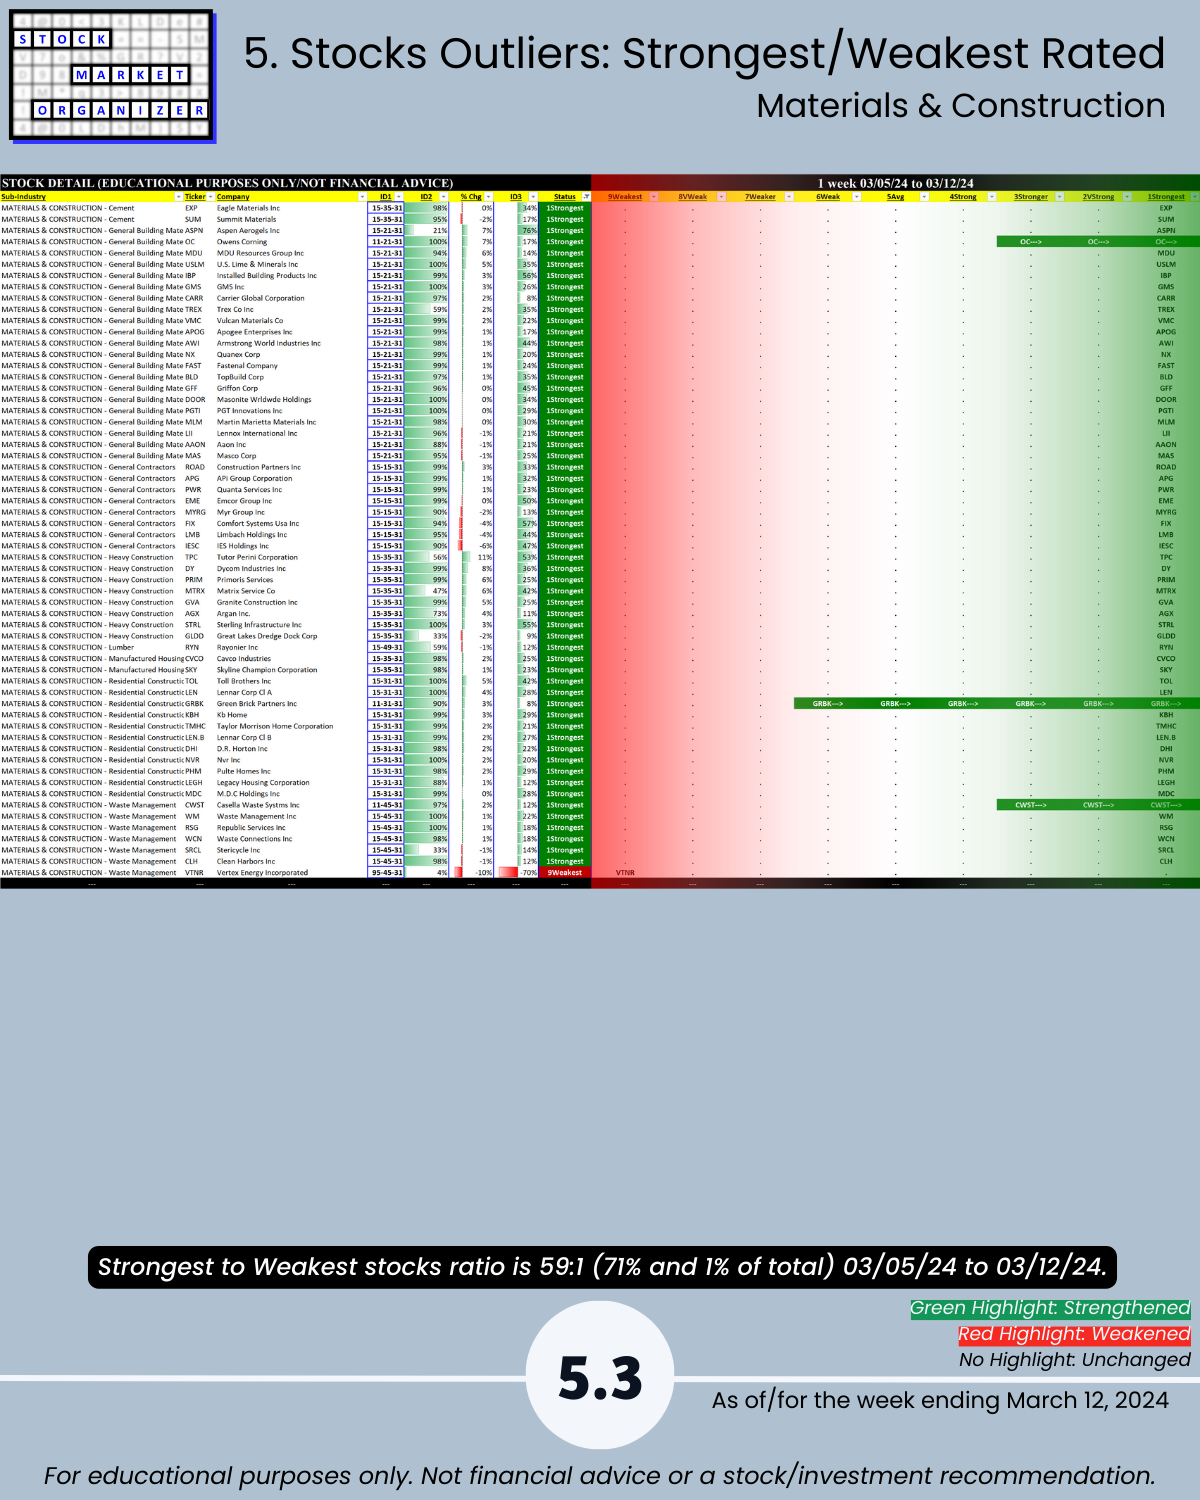
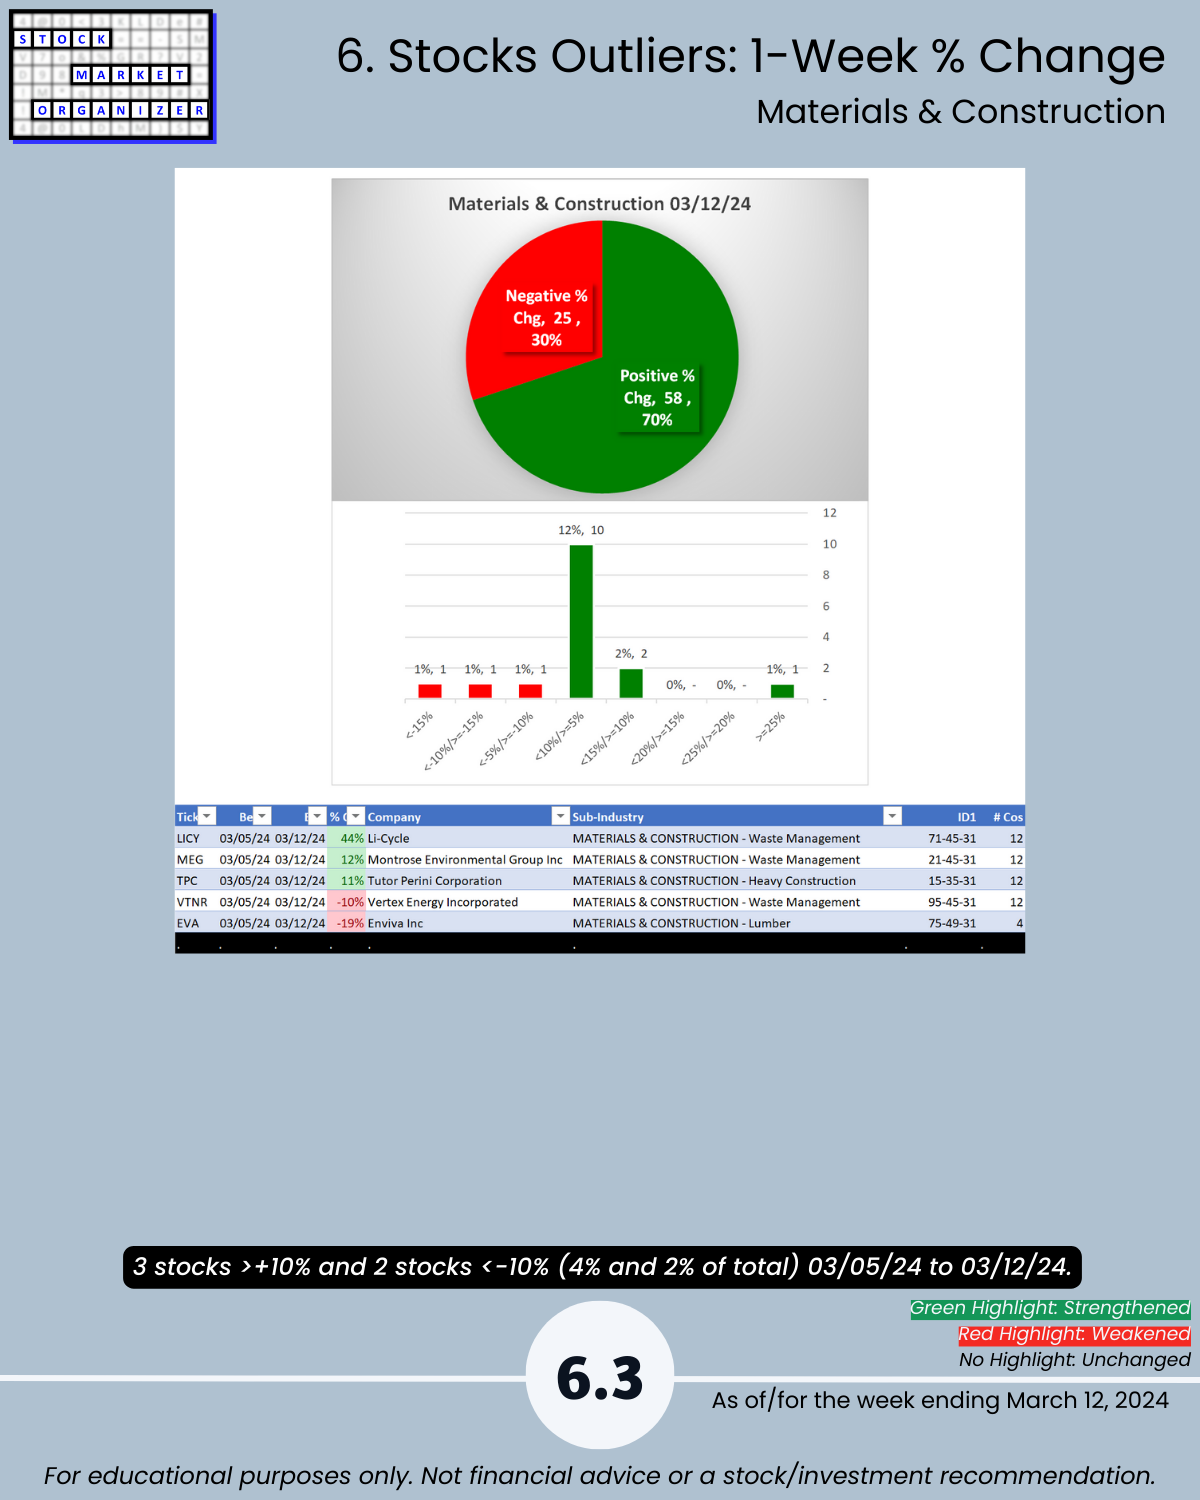
- Materials/Construction 72% of its stocks rated Strongest, 70% positive stocks, 25% of its stocks => 5+ year highs this week
- Metals 71% positive stocks, 12% of its stocks >10% this week.
More:
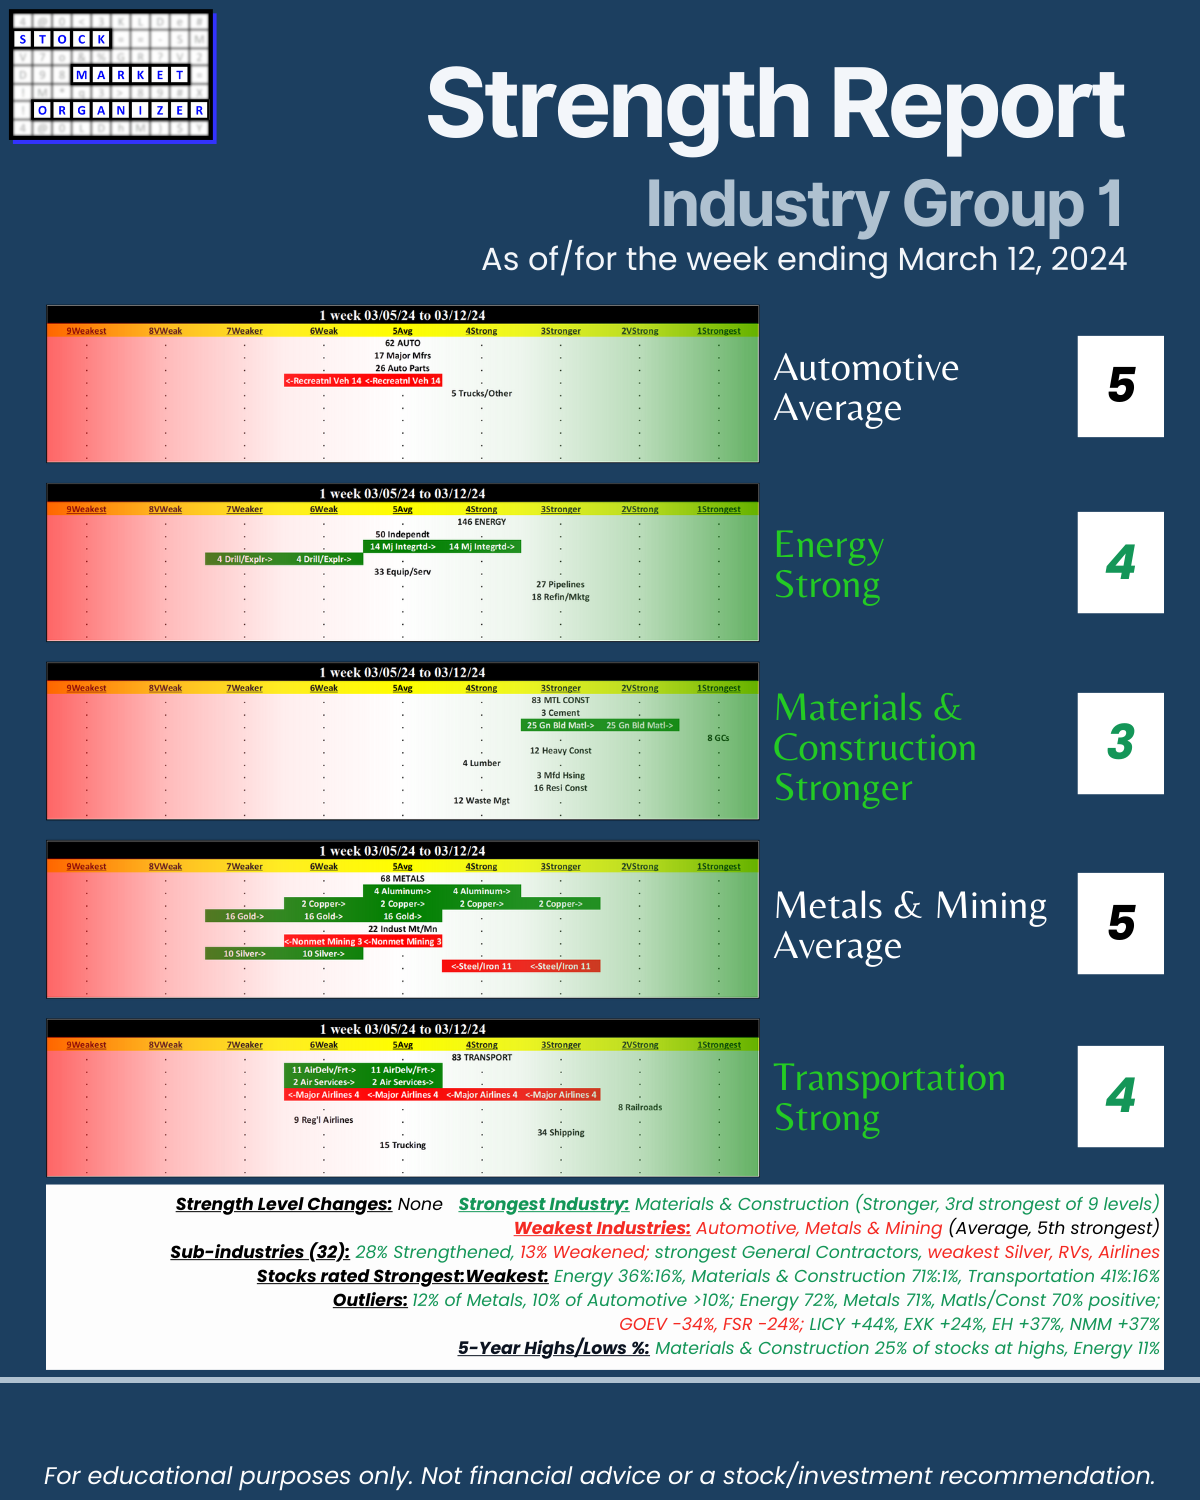
🔹 Strength Level Changes: None
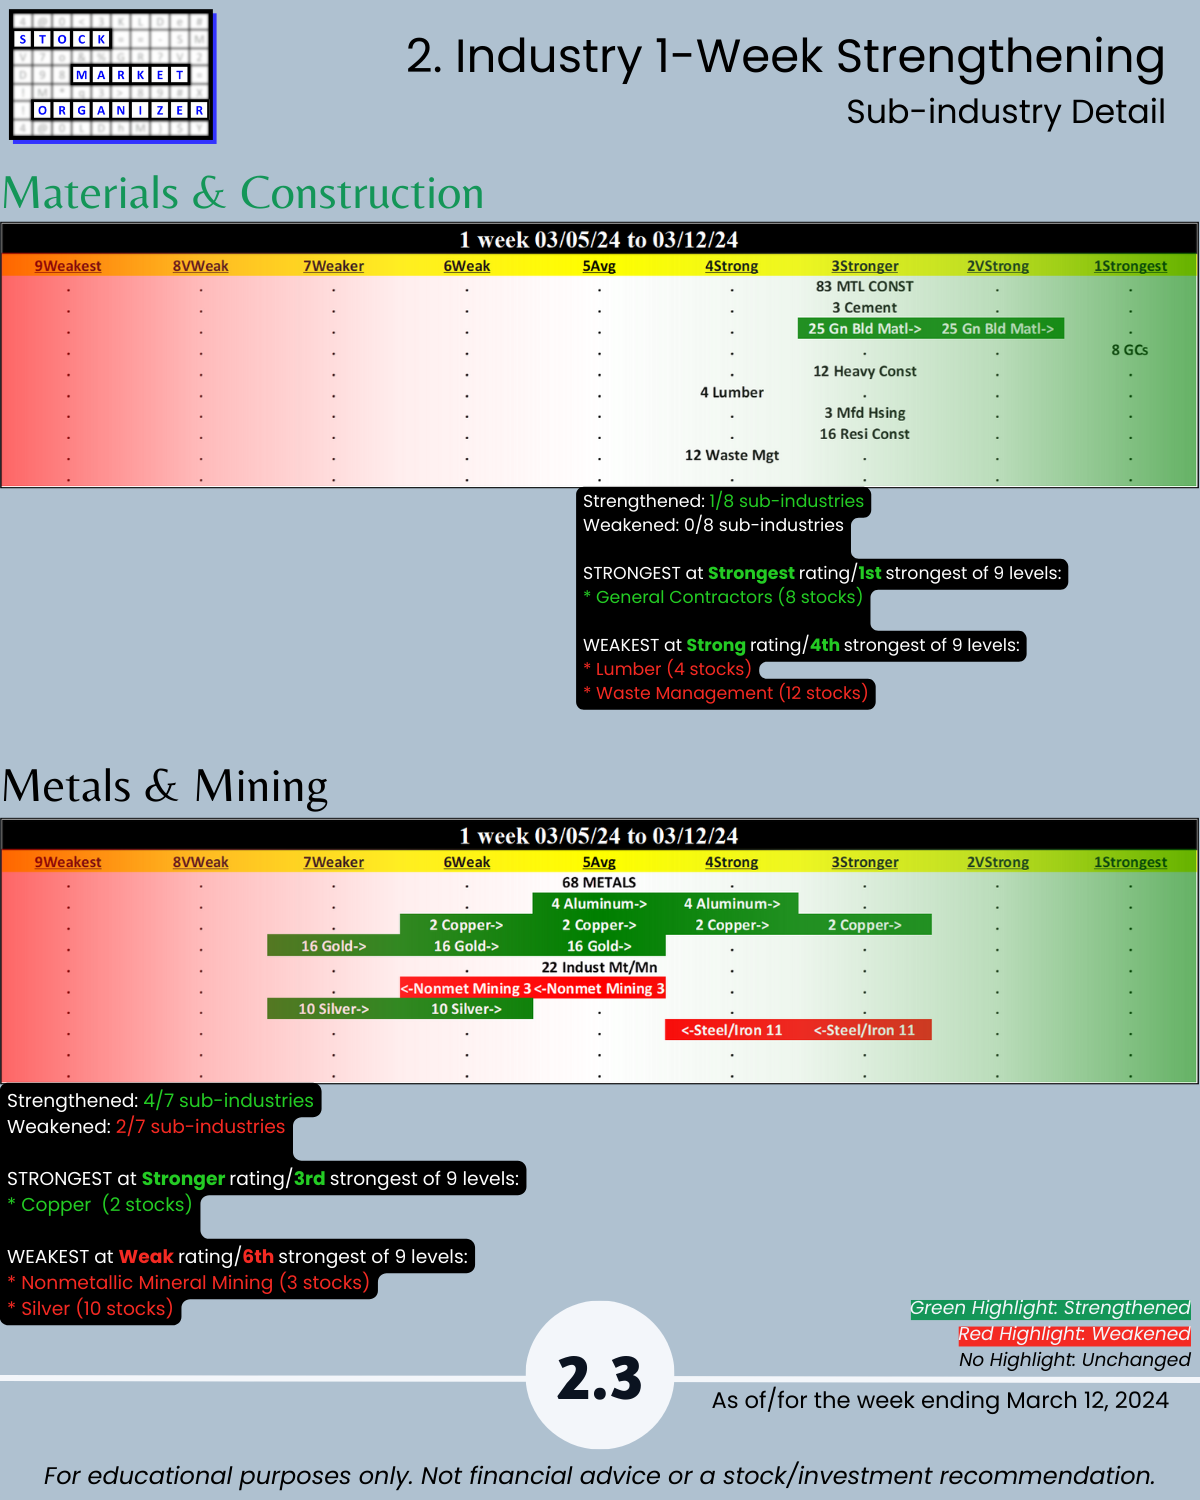
🔹 Strongest Industry: Materials & Construction (Stronger, 3rd strongest of 9 levels)
🔹 Weakest Industries: Automotive, Metals & Mining (Average, 5th strongest)
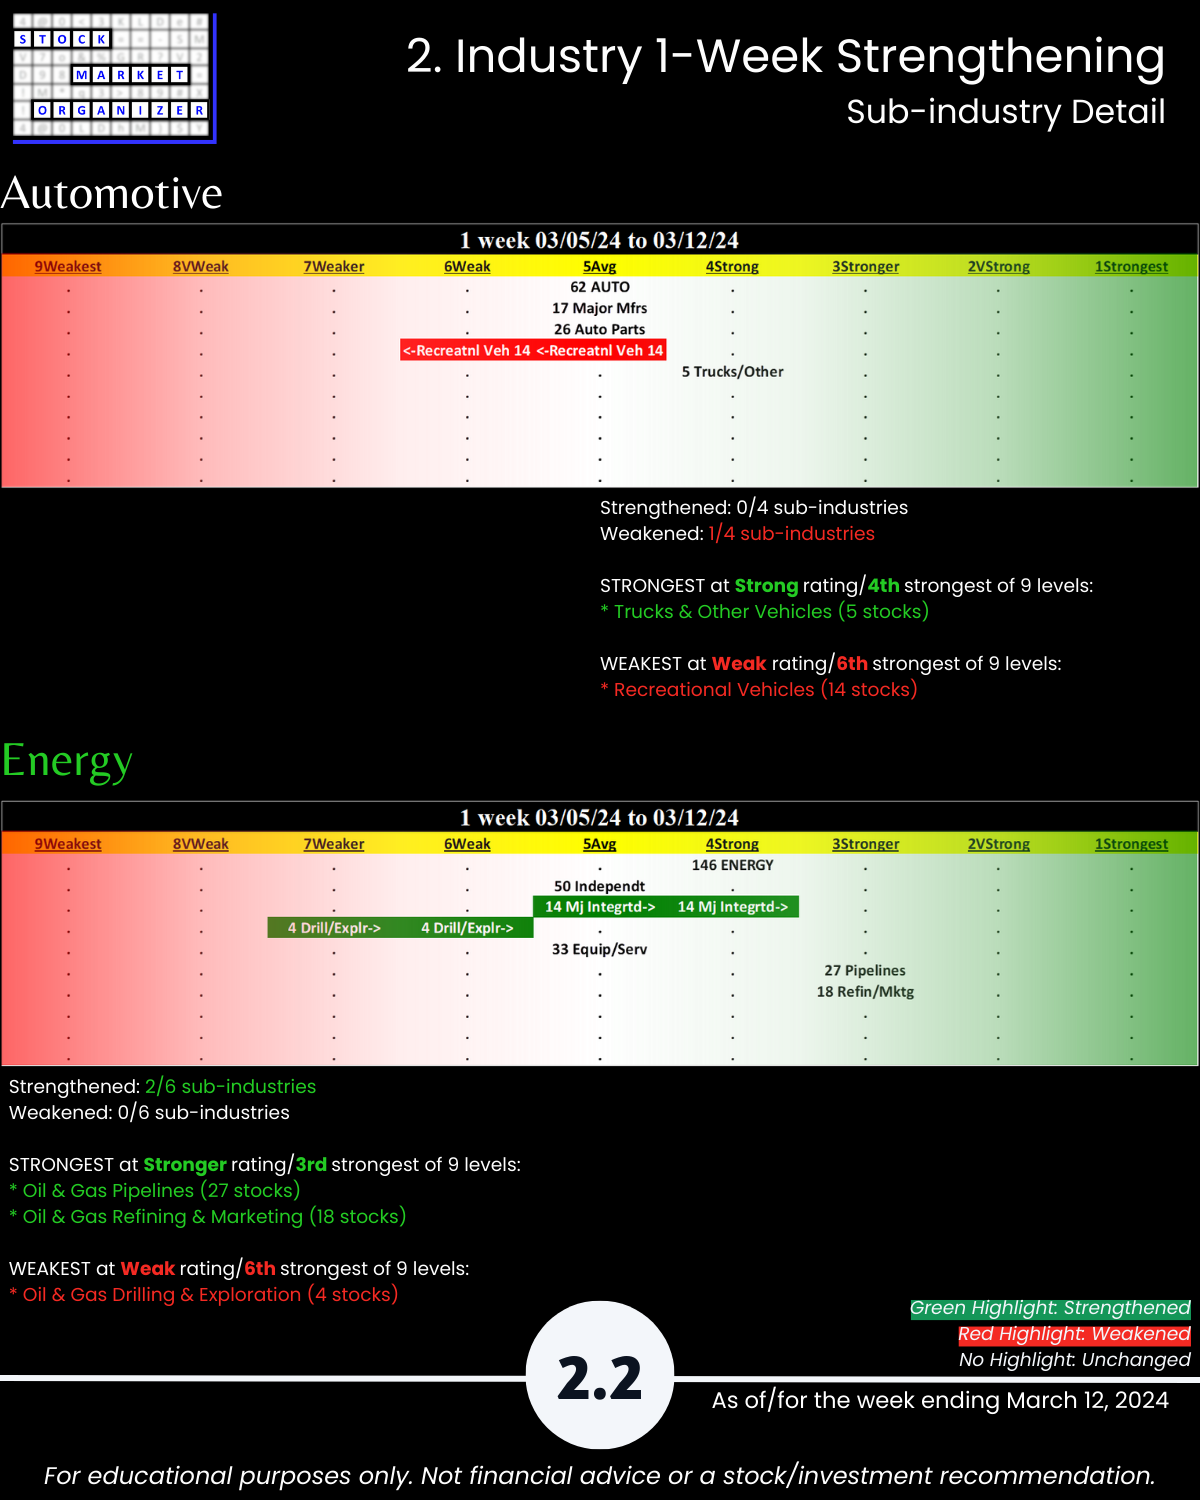
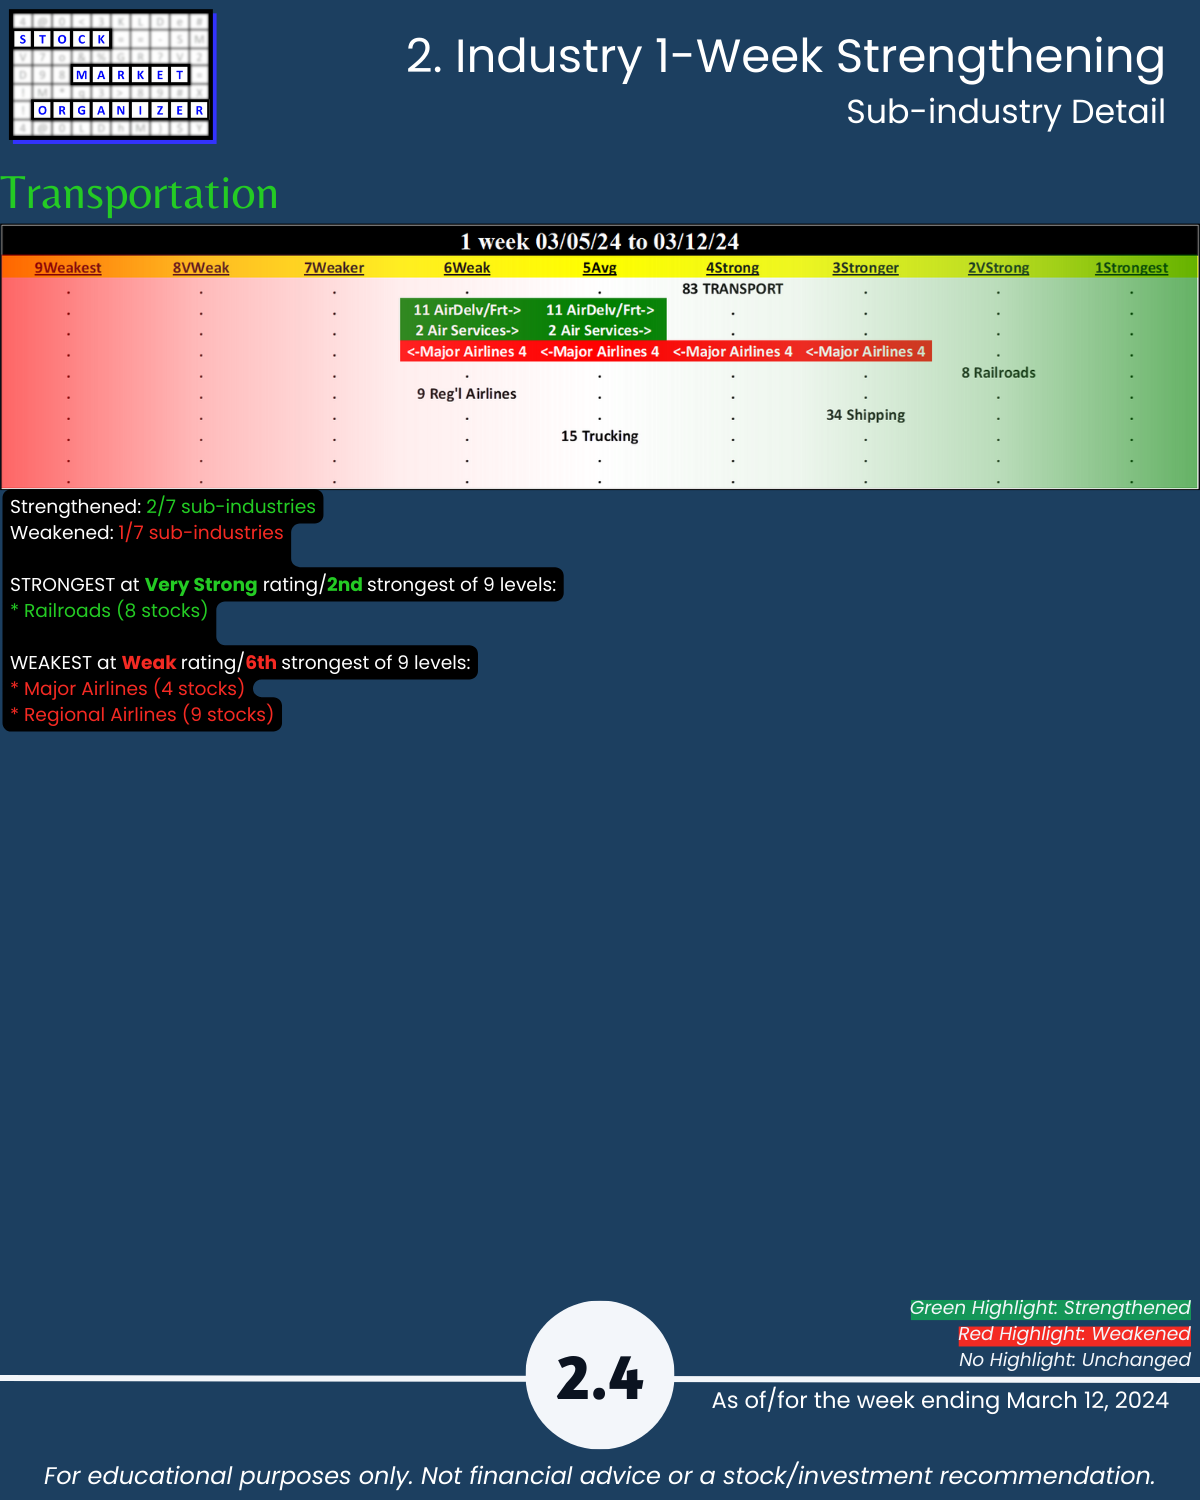
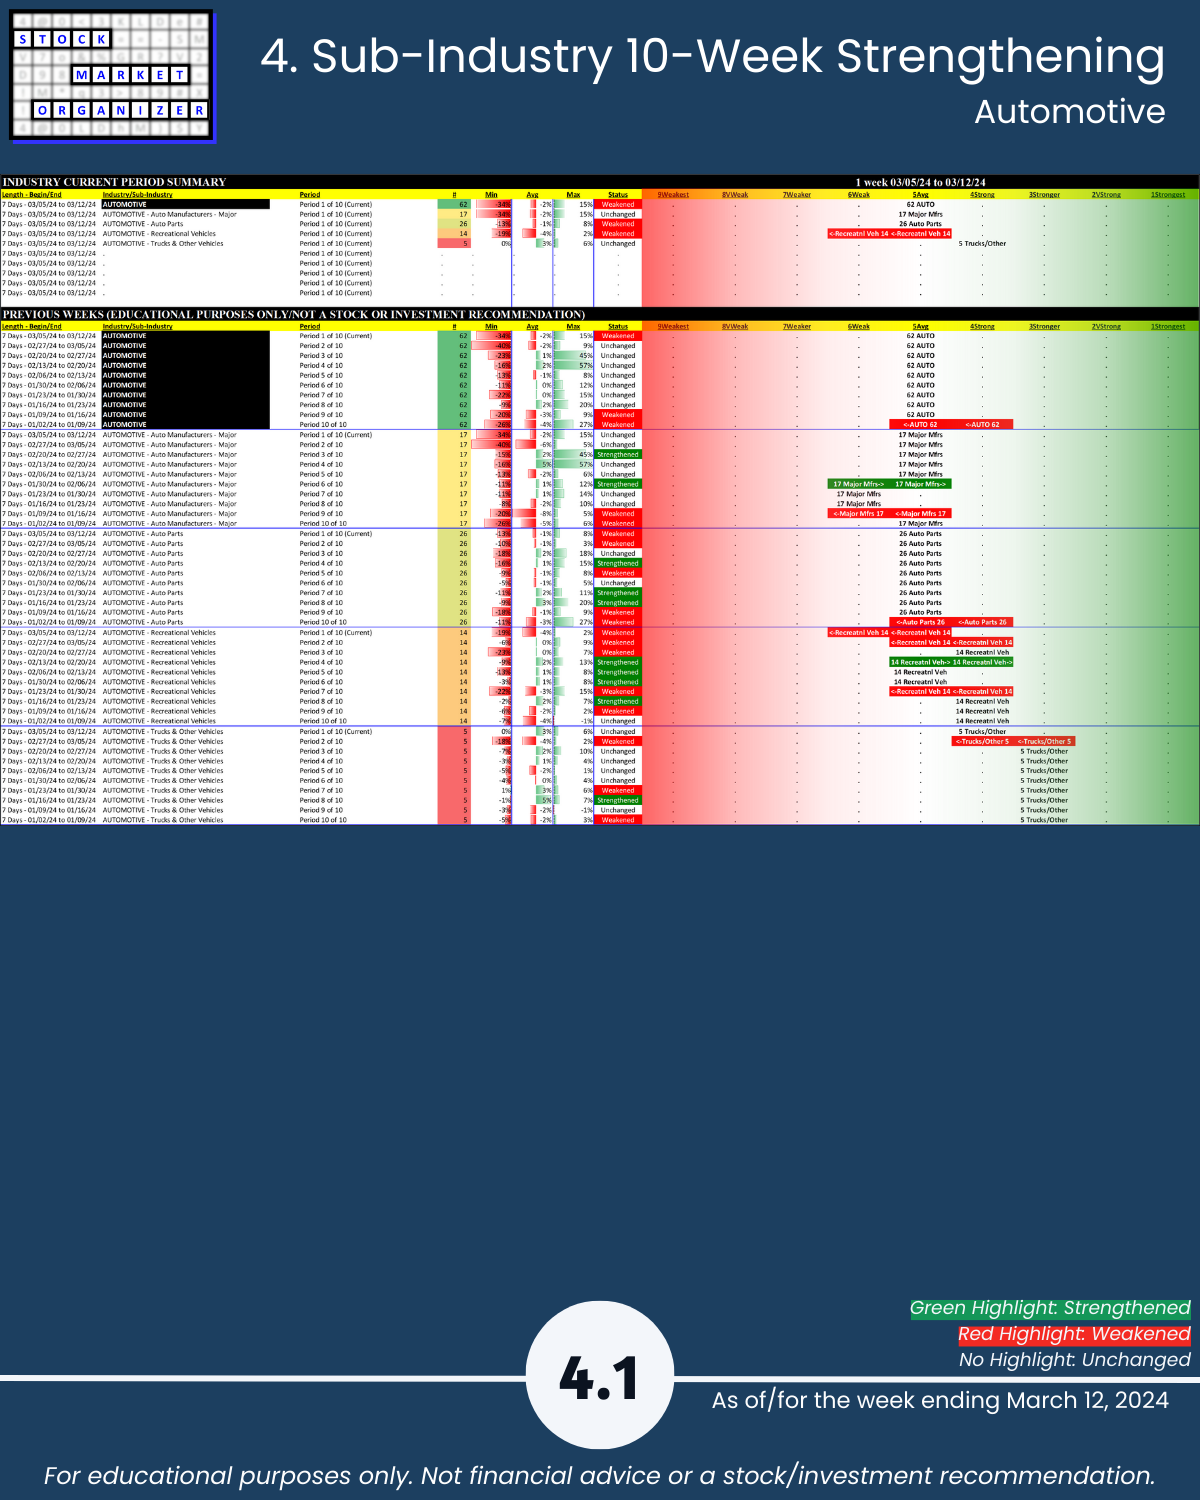
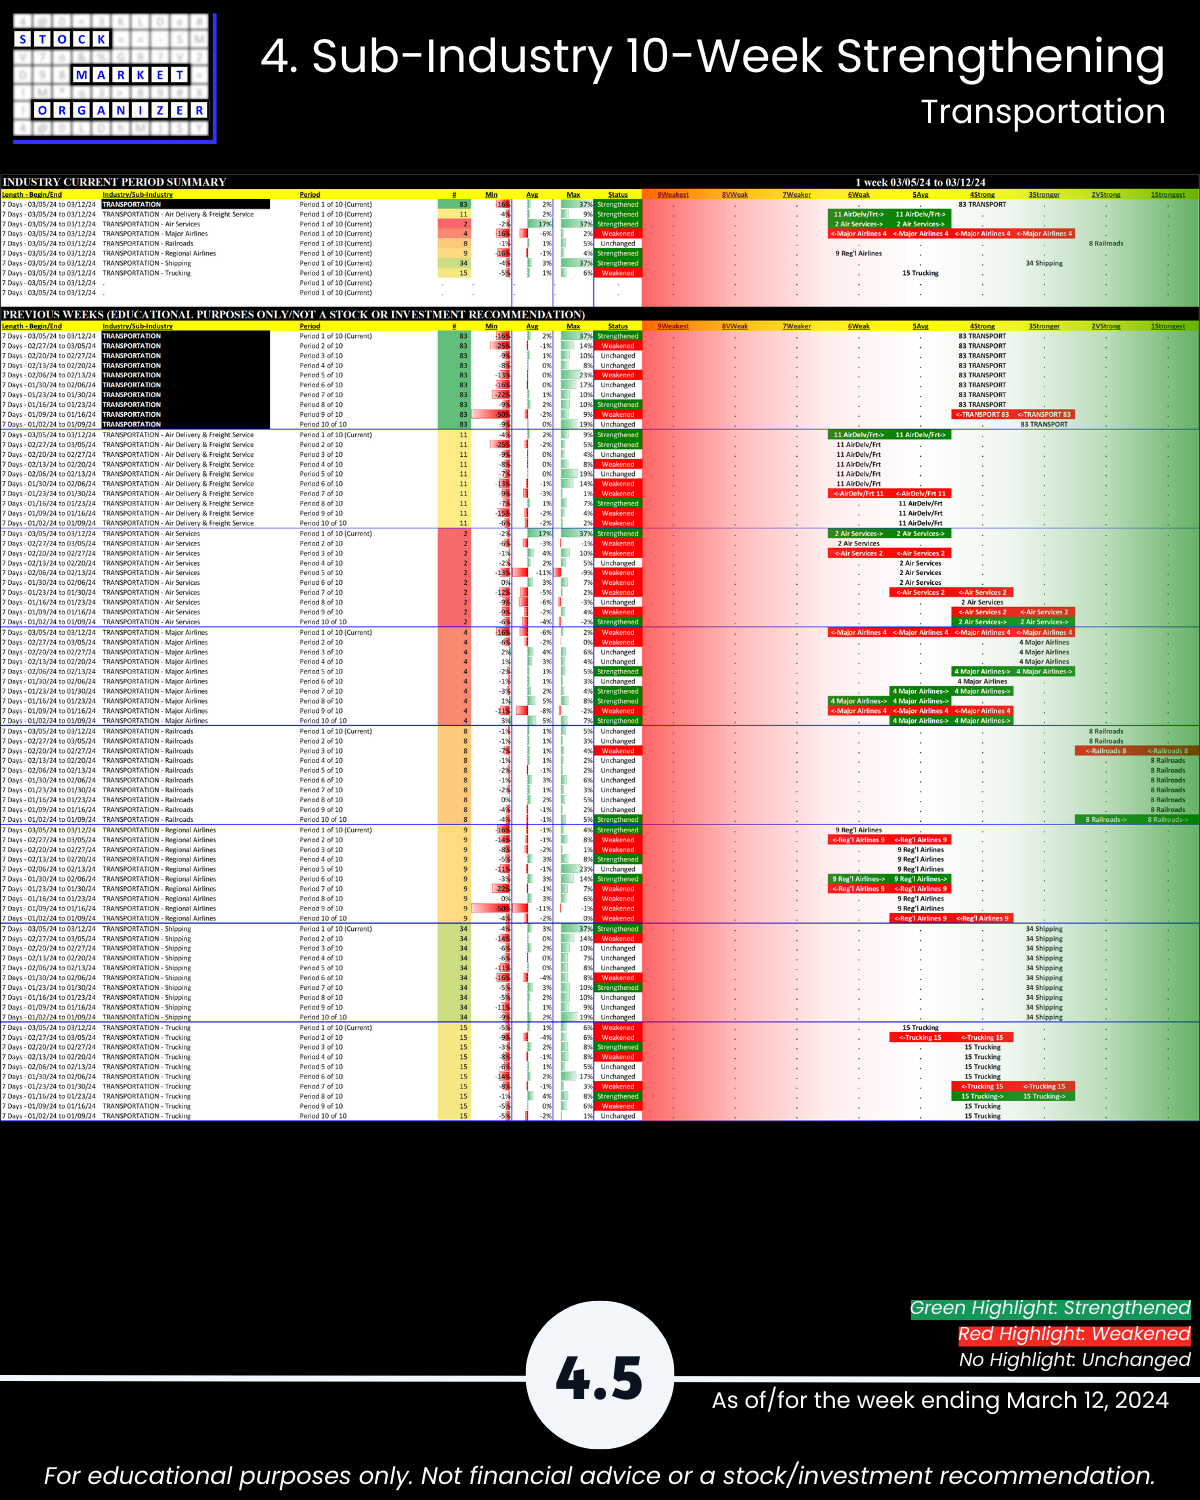
🔹 Sub-industries (32): 28% Strengthened, 13% Weakened; strongest General Contractors, weakest Silver, RVs, Airlines
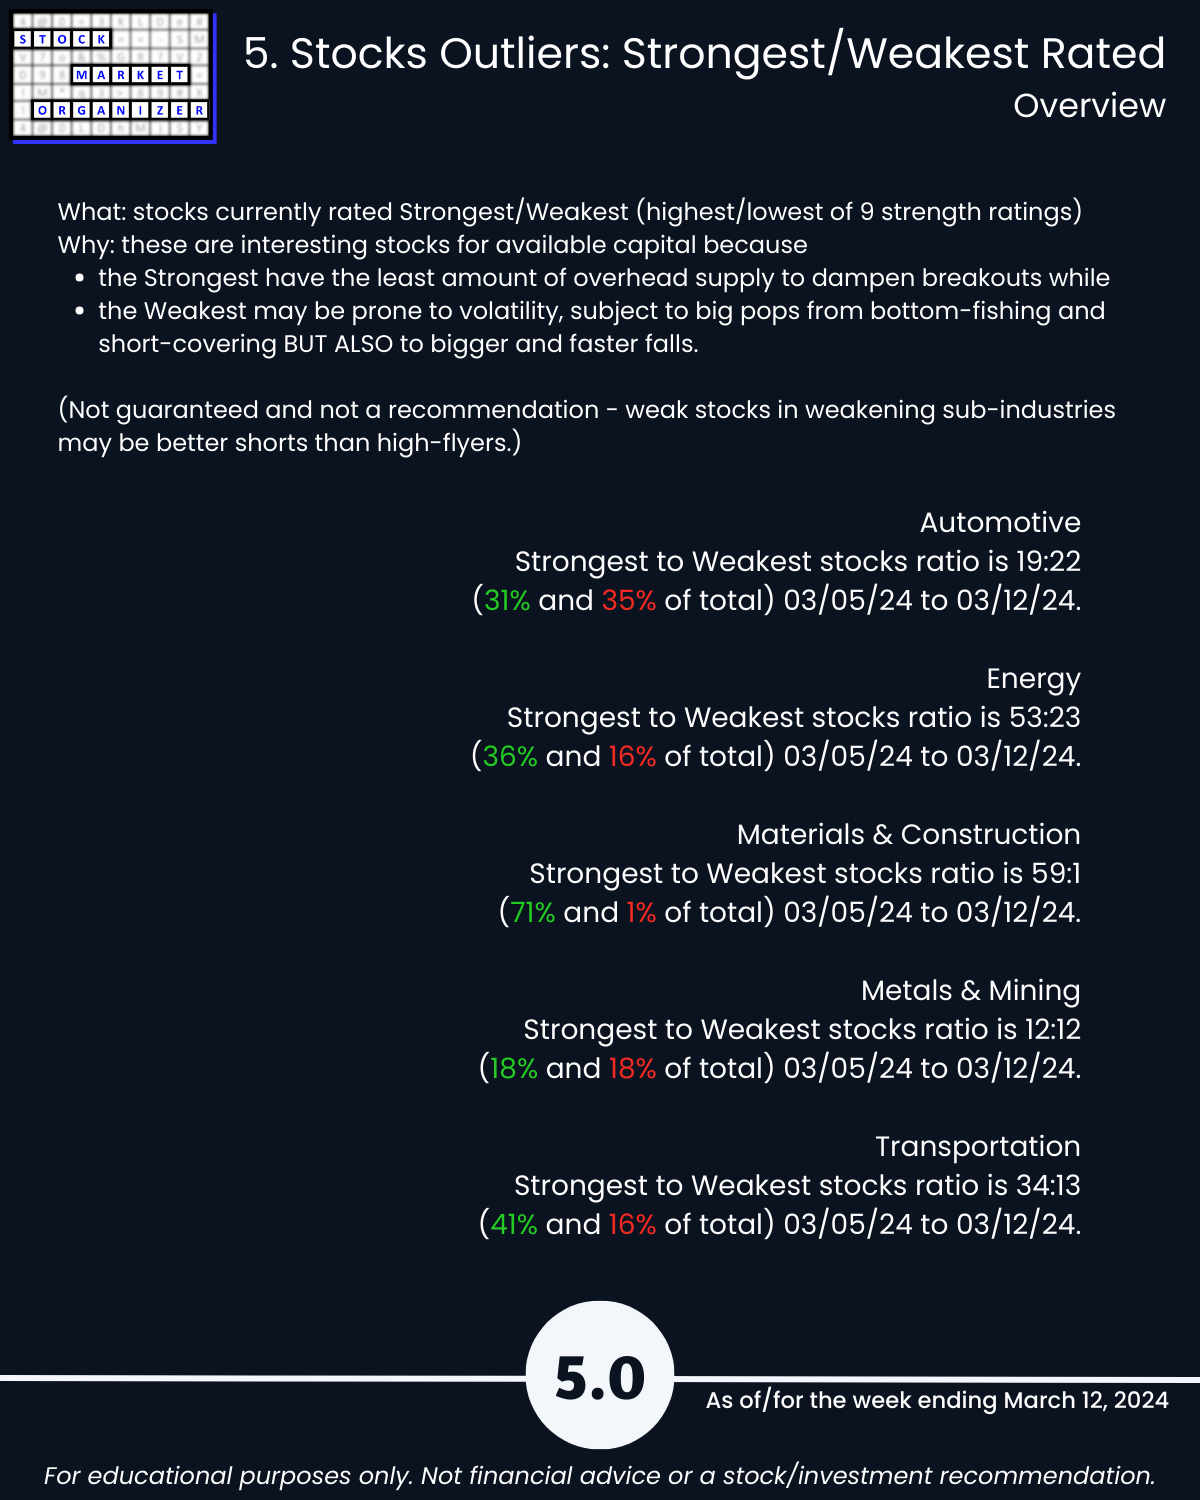
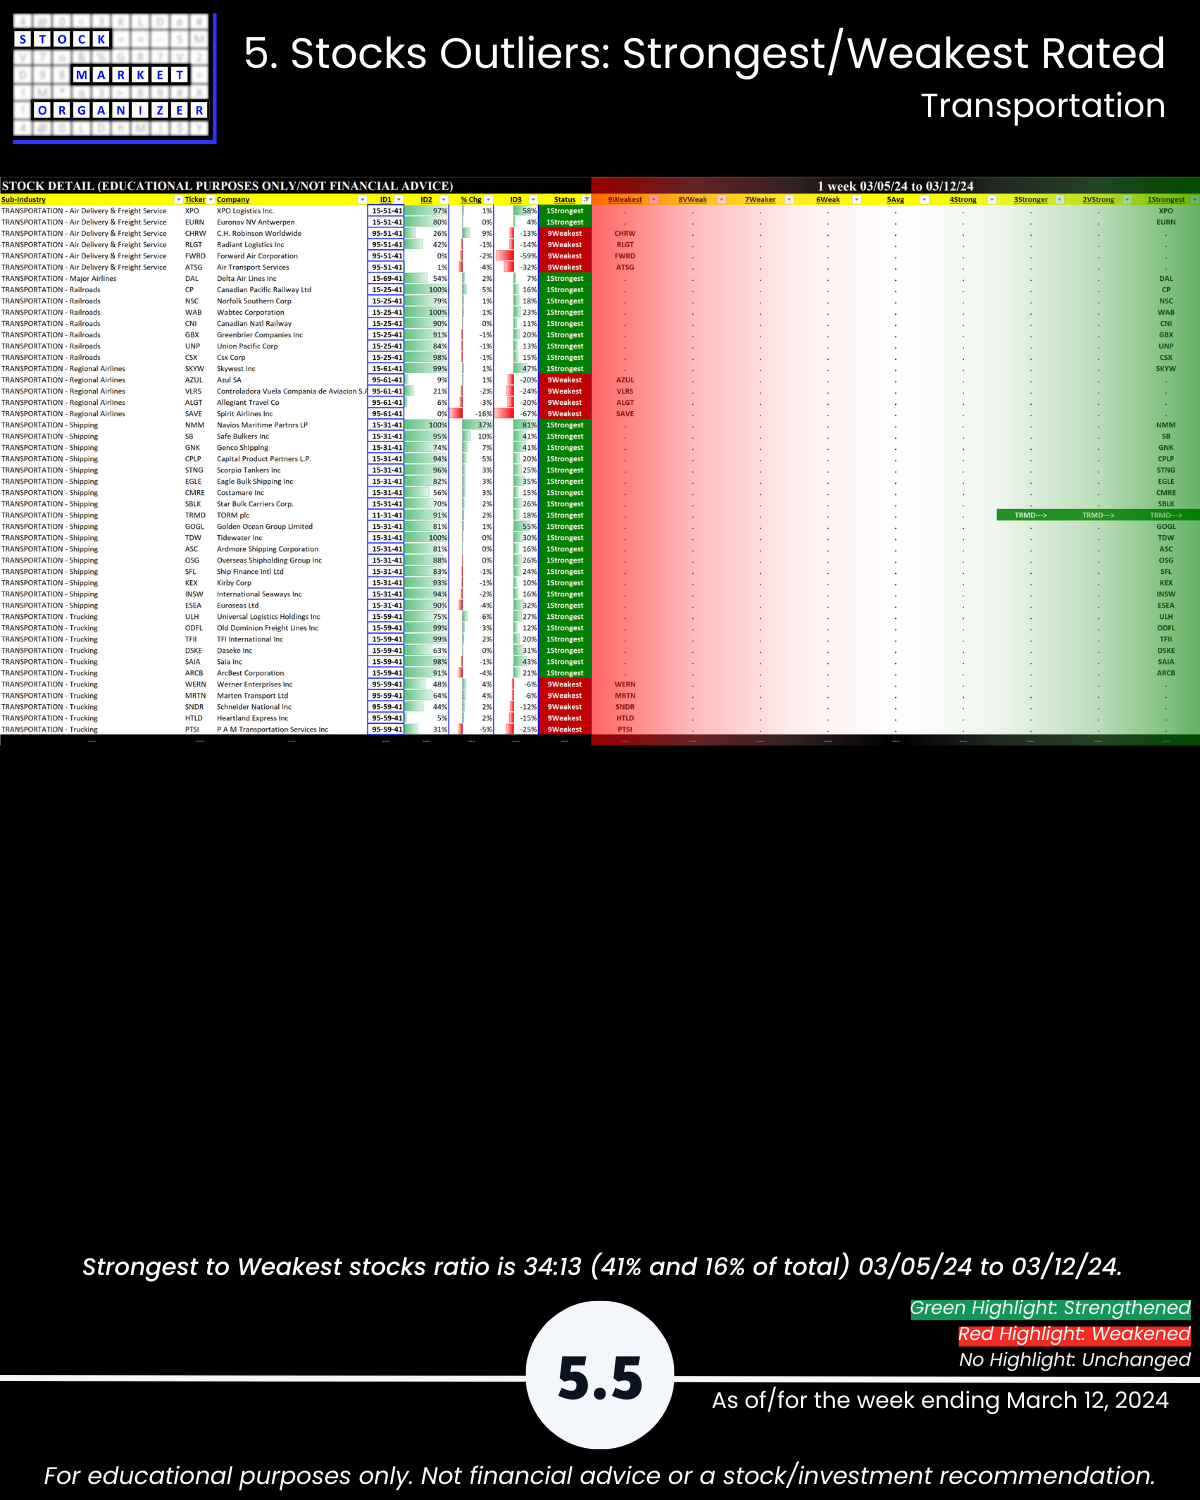
🔹 Stocks rated Strongest:Weakest: Energy 36%:16%, Materials & Construction 71%:1%, Transportation 41%:16%
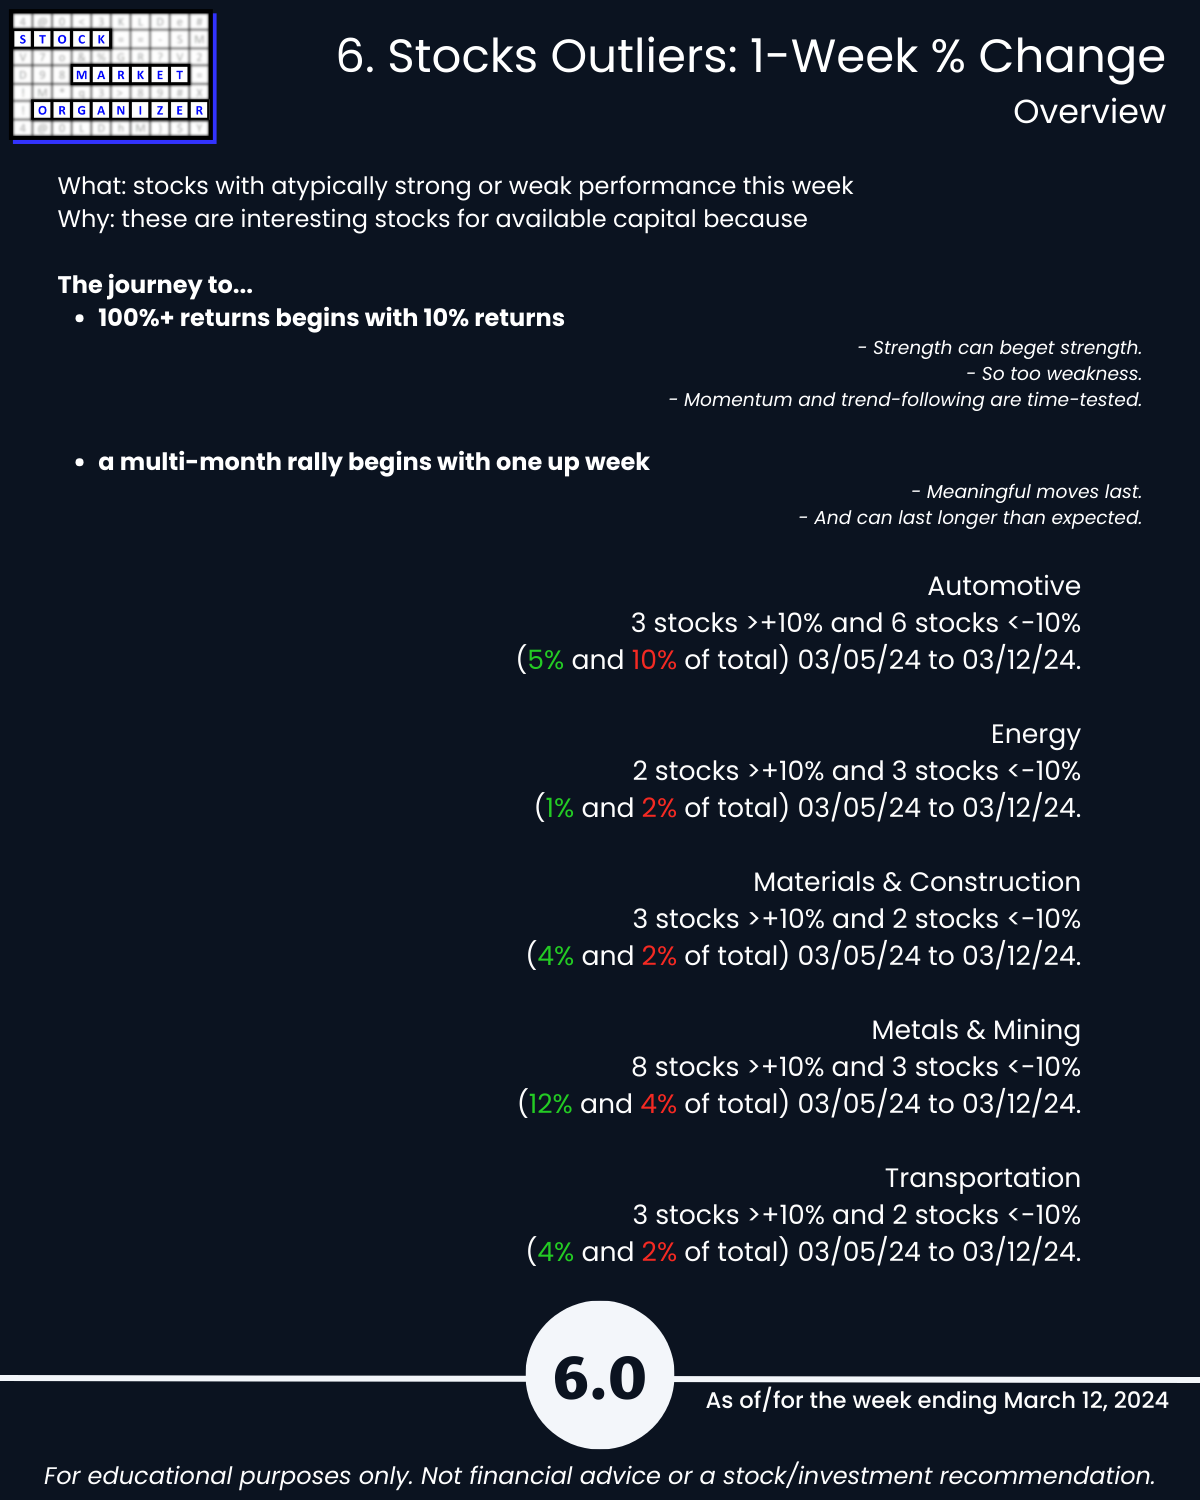
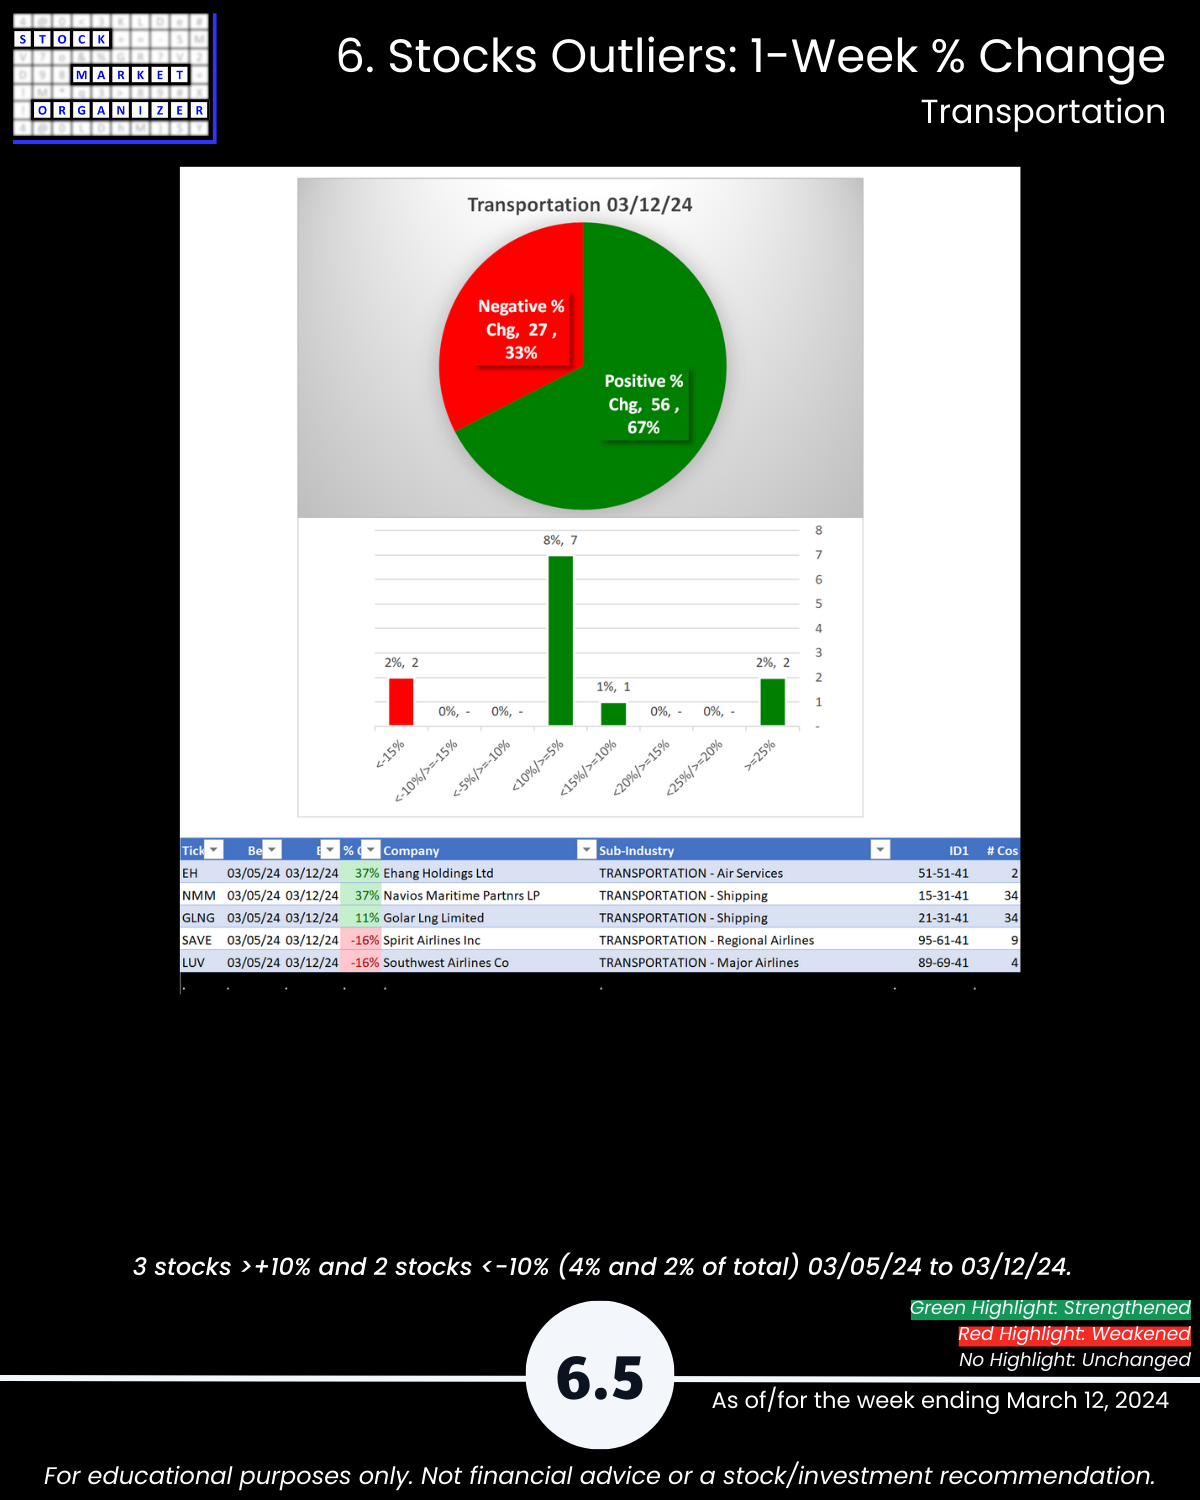
🔹 Outliers: 12% of Metals, 10% of Automotive >10%; Energy 72%, Metals 71%, Matls/Const 70% positive; GOEV -34%, FSR -24%; LICY +44%, EXK +24%; EH +37%, NMM +37%
🔹 5-Year Highs/Lows %: Materials & Construction 25% of stocks at highs, Energy 11%
WHAT’S HAPPENING HERE AND WHY?
I’m comparing the strength of everything with everything to find existing and emerging pockets of strength at all levels of the stock market.
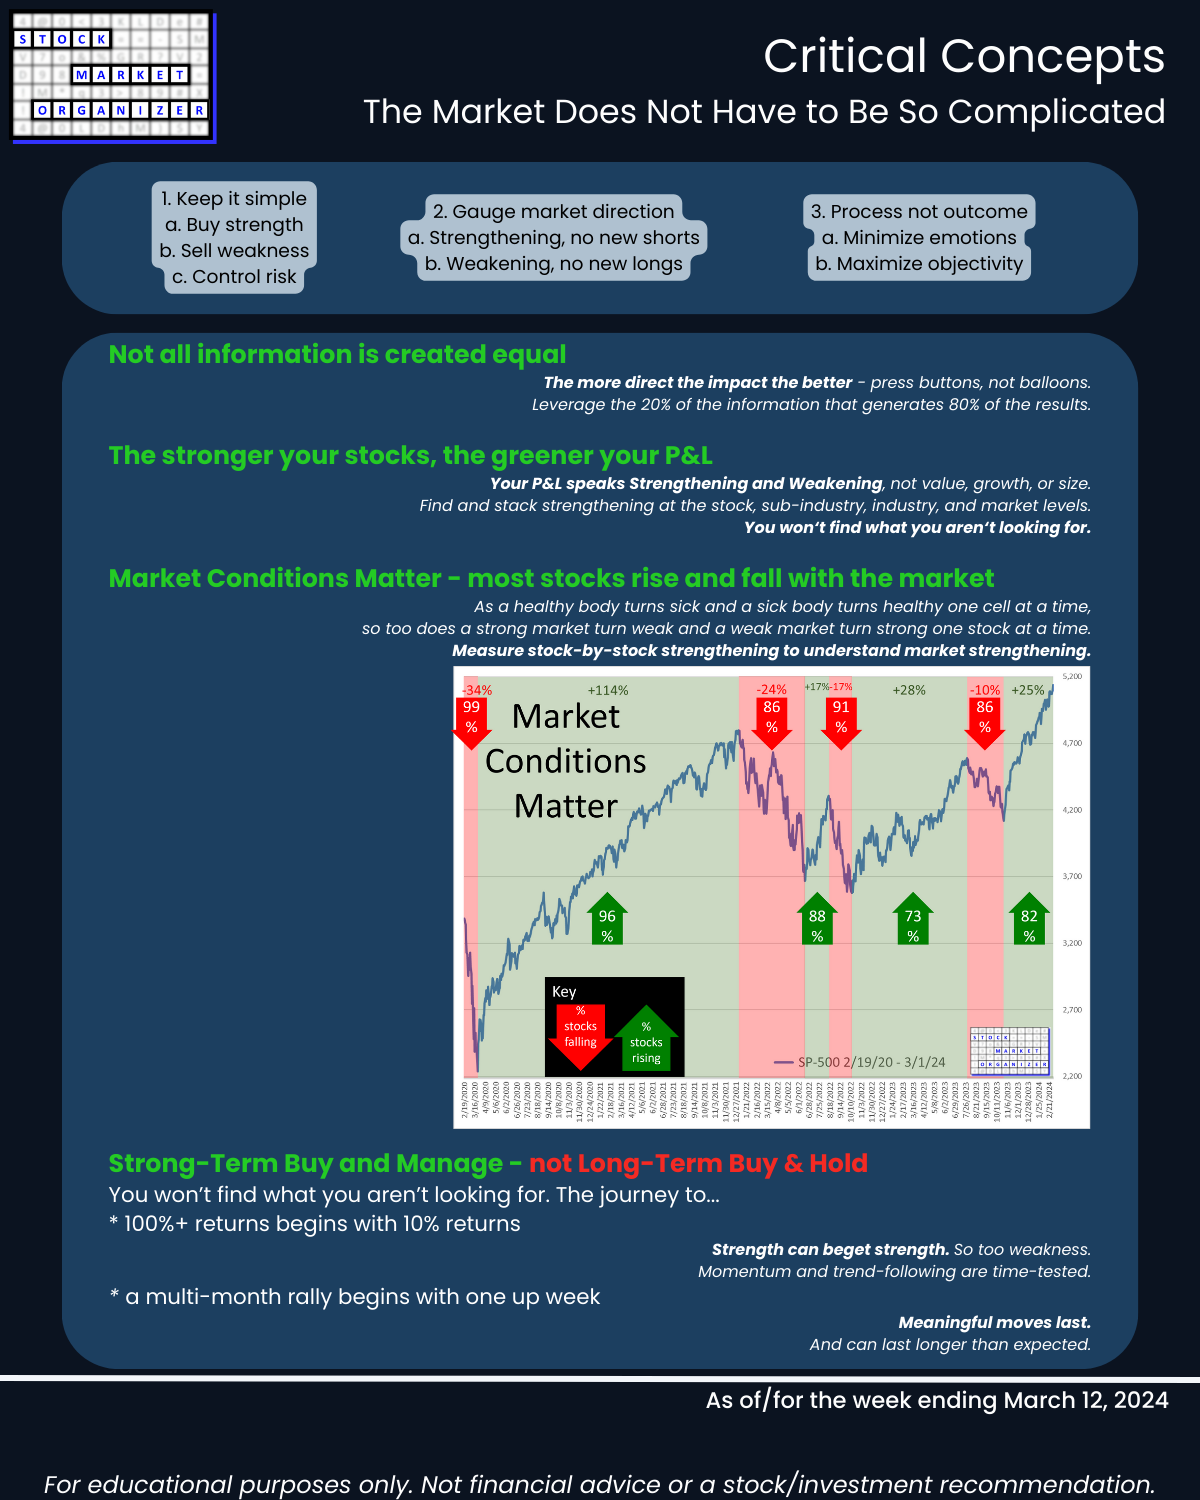
Most stocks do what the market does – Market Conditions Matter. And, stocks will tend to do what their sub-industries and industries do.
Example: Manufacturing industry, 71% positive 1 year through 3/12/24:
Best POWL +266%
Worst CHPT -81%
>10%: 62% of stocks
>25%: 38%
>50%: 22%
It’s not just about AI.
This report may particularly be of interest if the following 5 concepts resonate with you:
- The stronger your stocks, the greener your P&L.
- The journey to 100%+ returns begins with 10% returns.
- The journey to a multi-month rally begins with one up week.
- Most stocks do what the market does. (While the market can only do what its underlying stocks, sub-industries, and industries do.)
- 80/20: not all information is created equal. (Press buttons, not balloons.)
Following are galleries with page-by-page views of this report.
1. Introduction
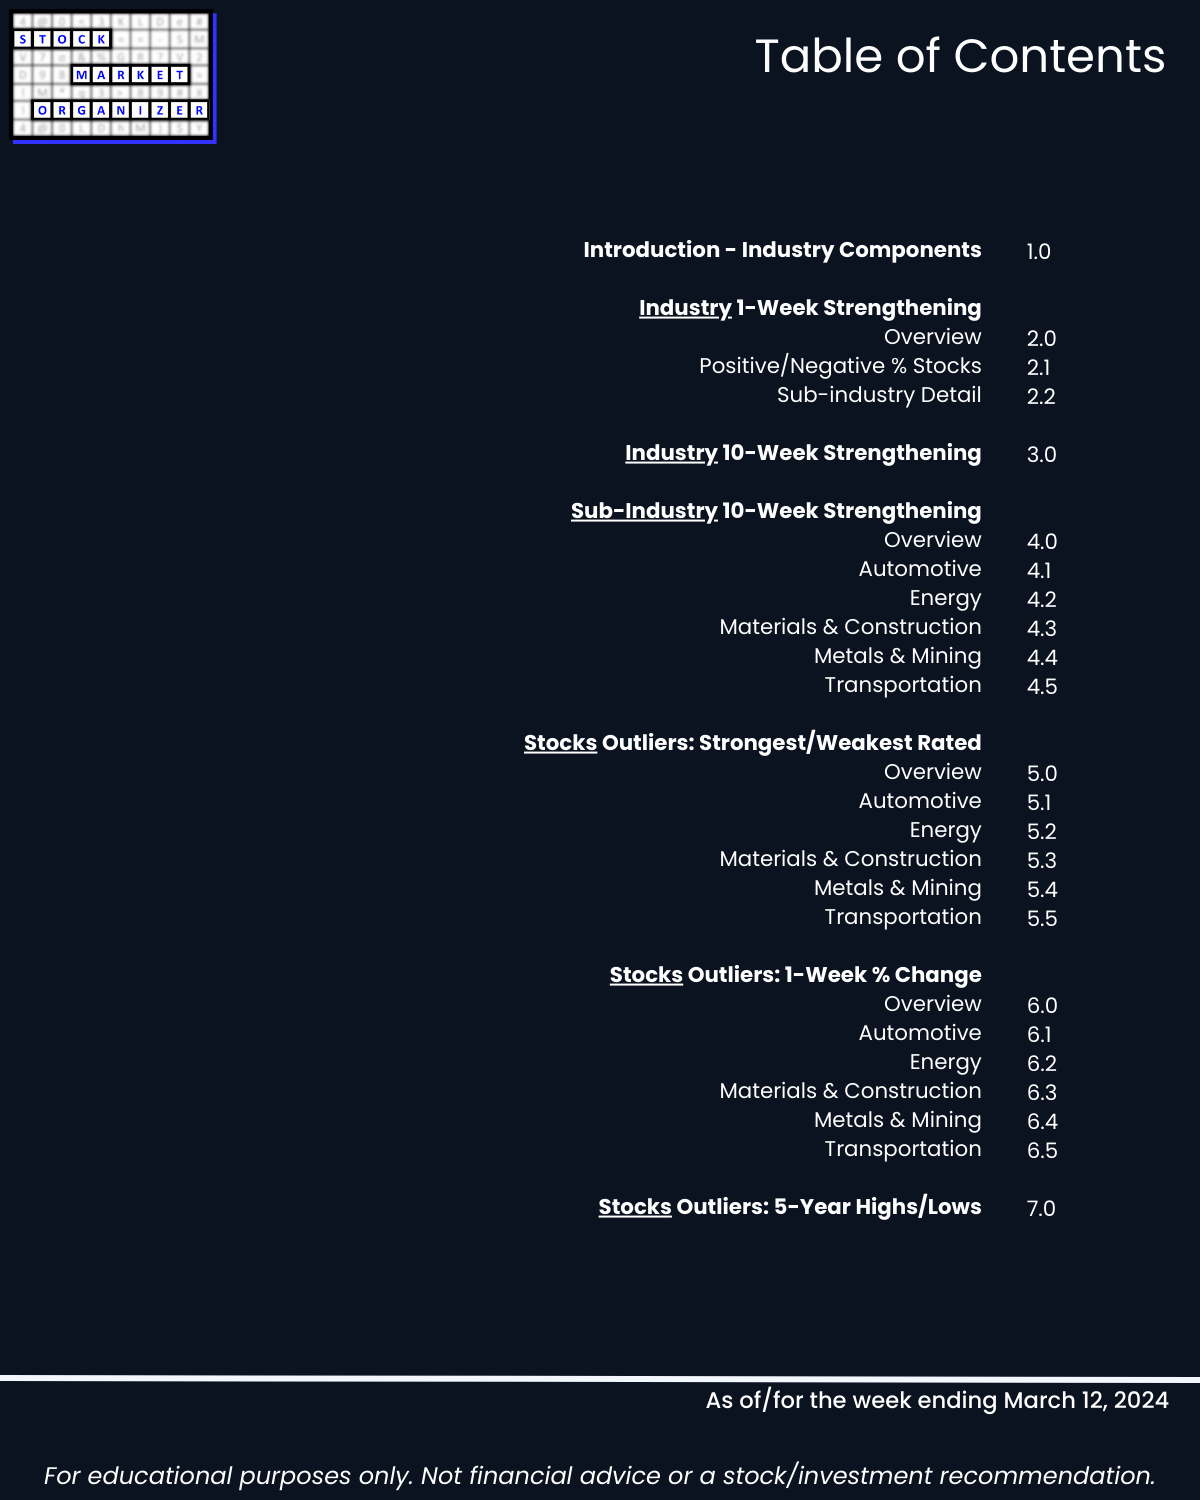
2. Industry 1-Week Strengthening
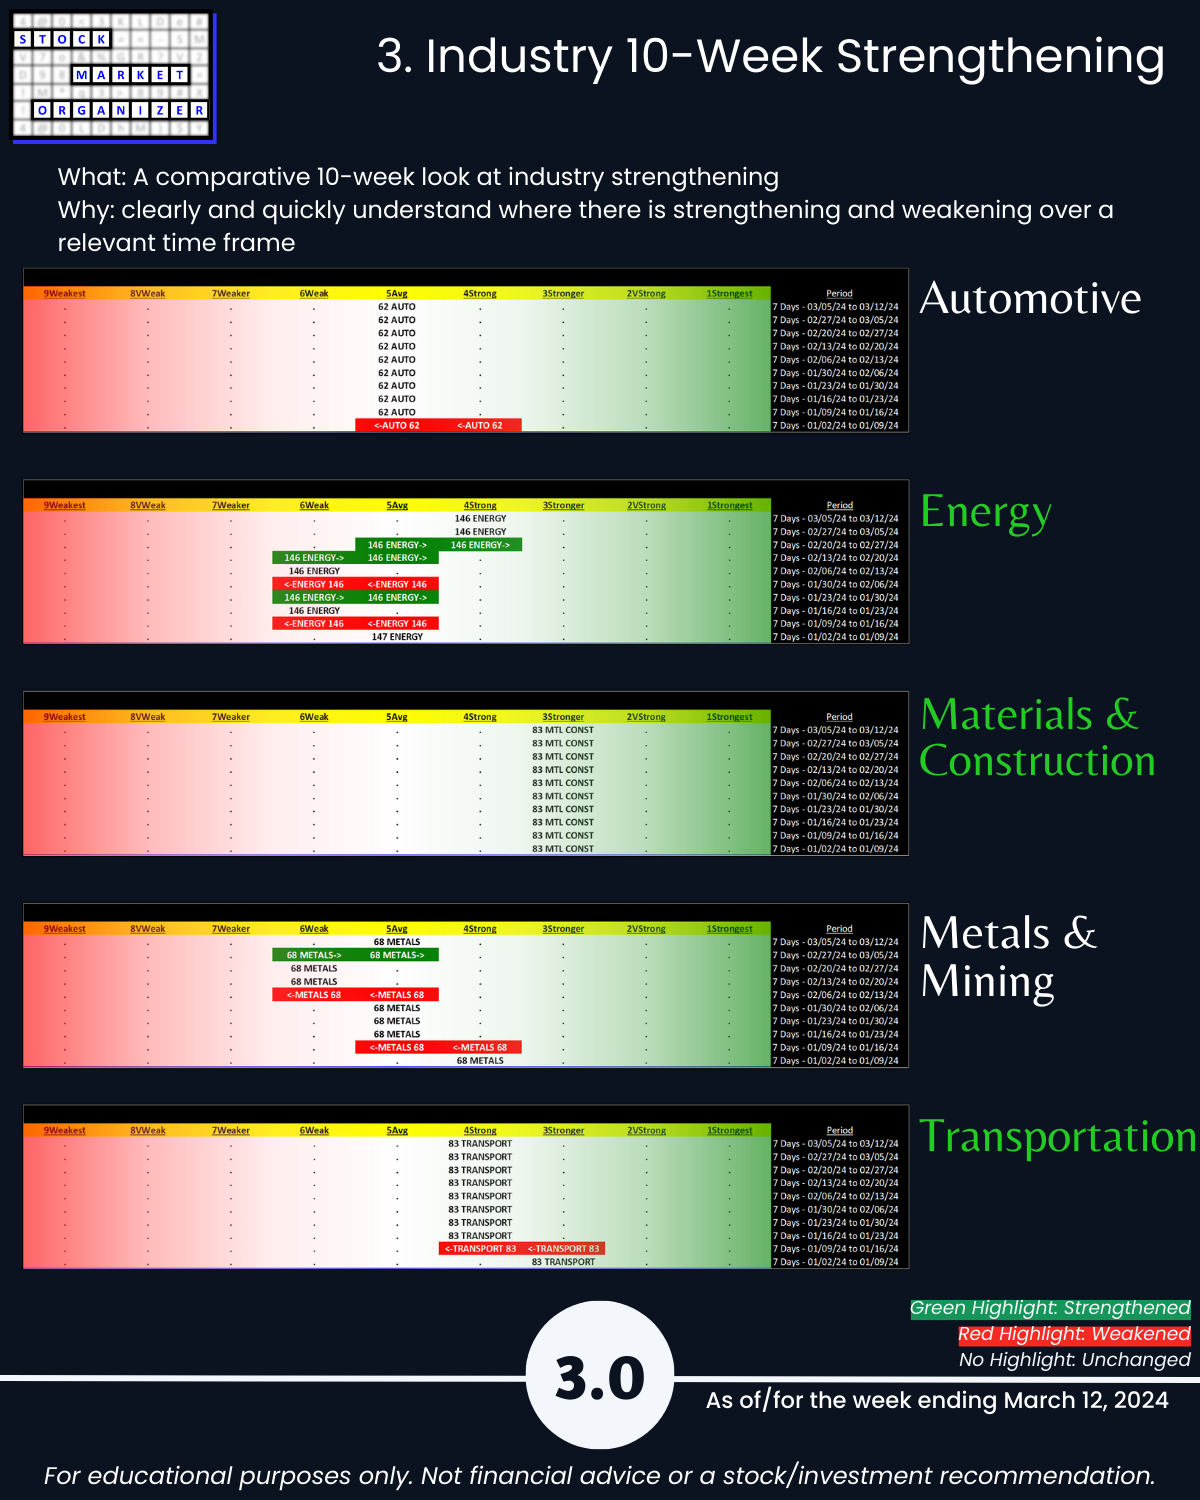
3. Industry 10-Week Strengthening
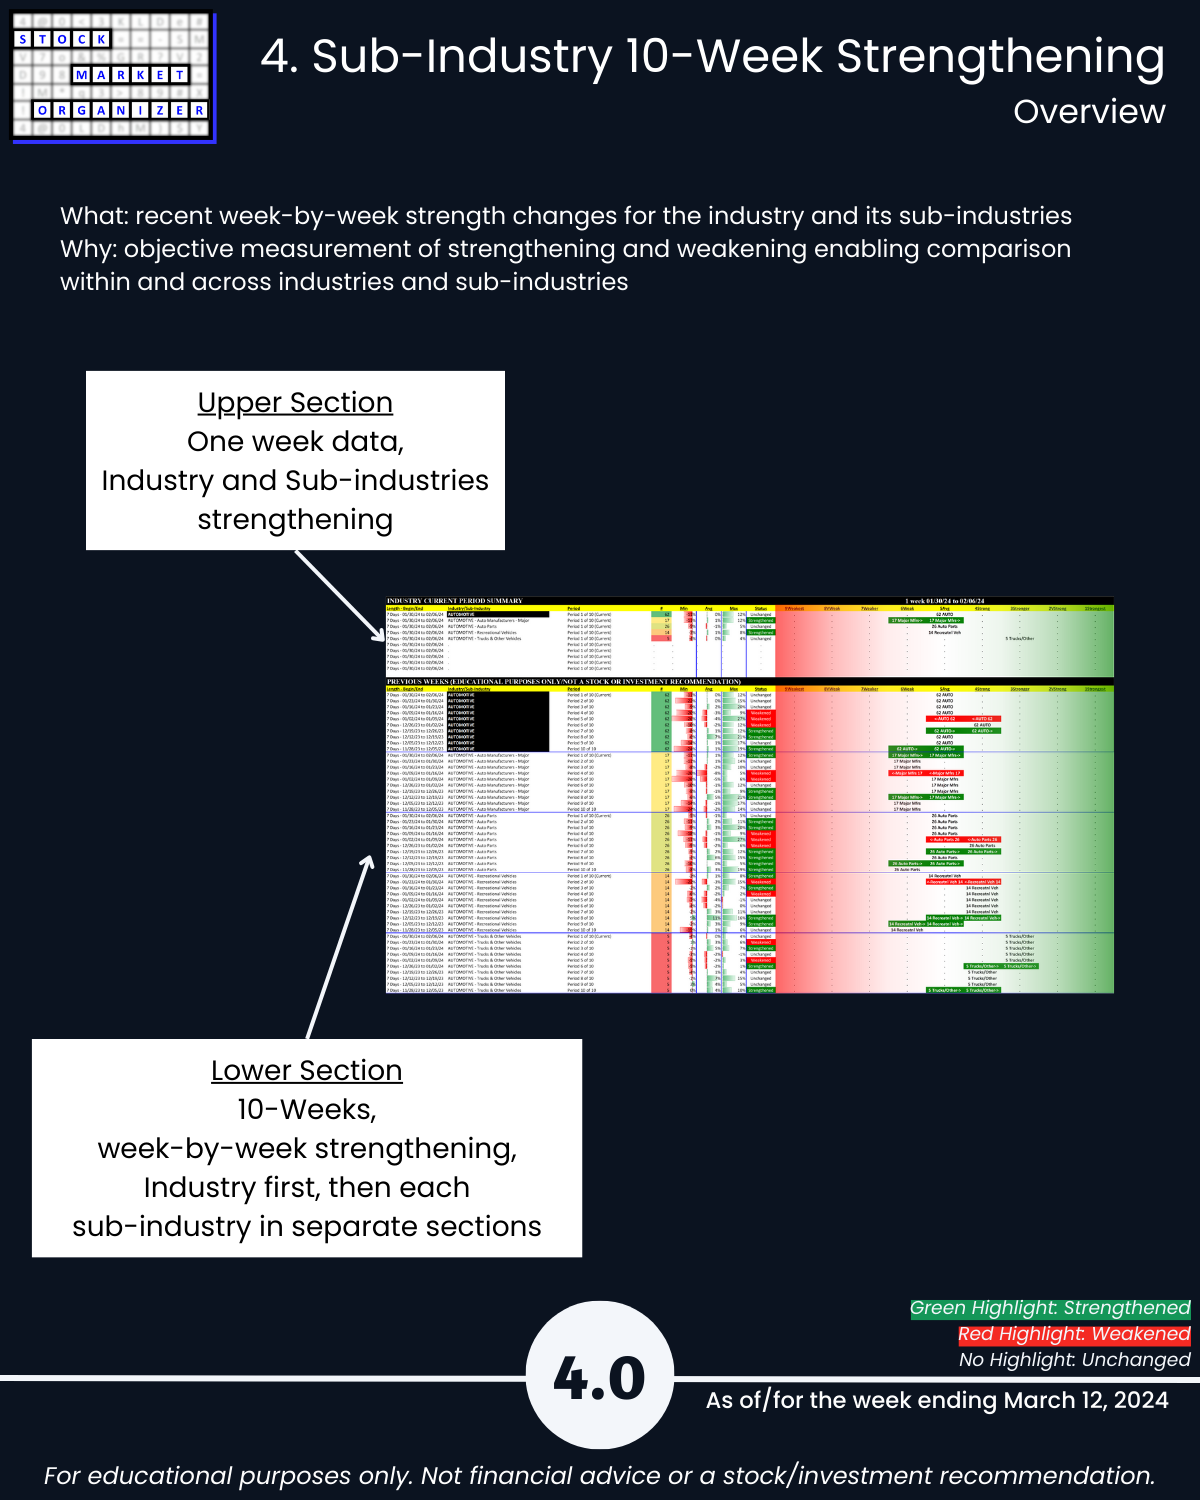
4. Sub-Industry 10-Week Strengthening
5. Stocks Outliers: Strongest/Weakest Rated
6. Stocks Outliers: 1-Week % Change
7. Stocks Outliers: 5-Year Highs/Lows