SMO Exclusive: Strength Report Group 1 2024-03-05

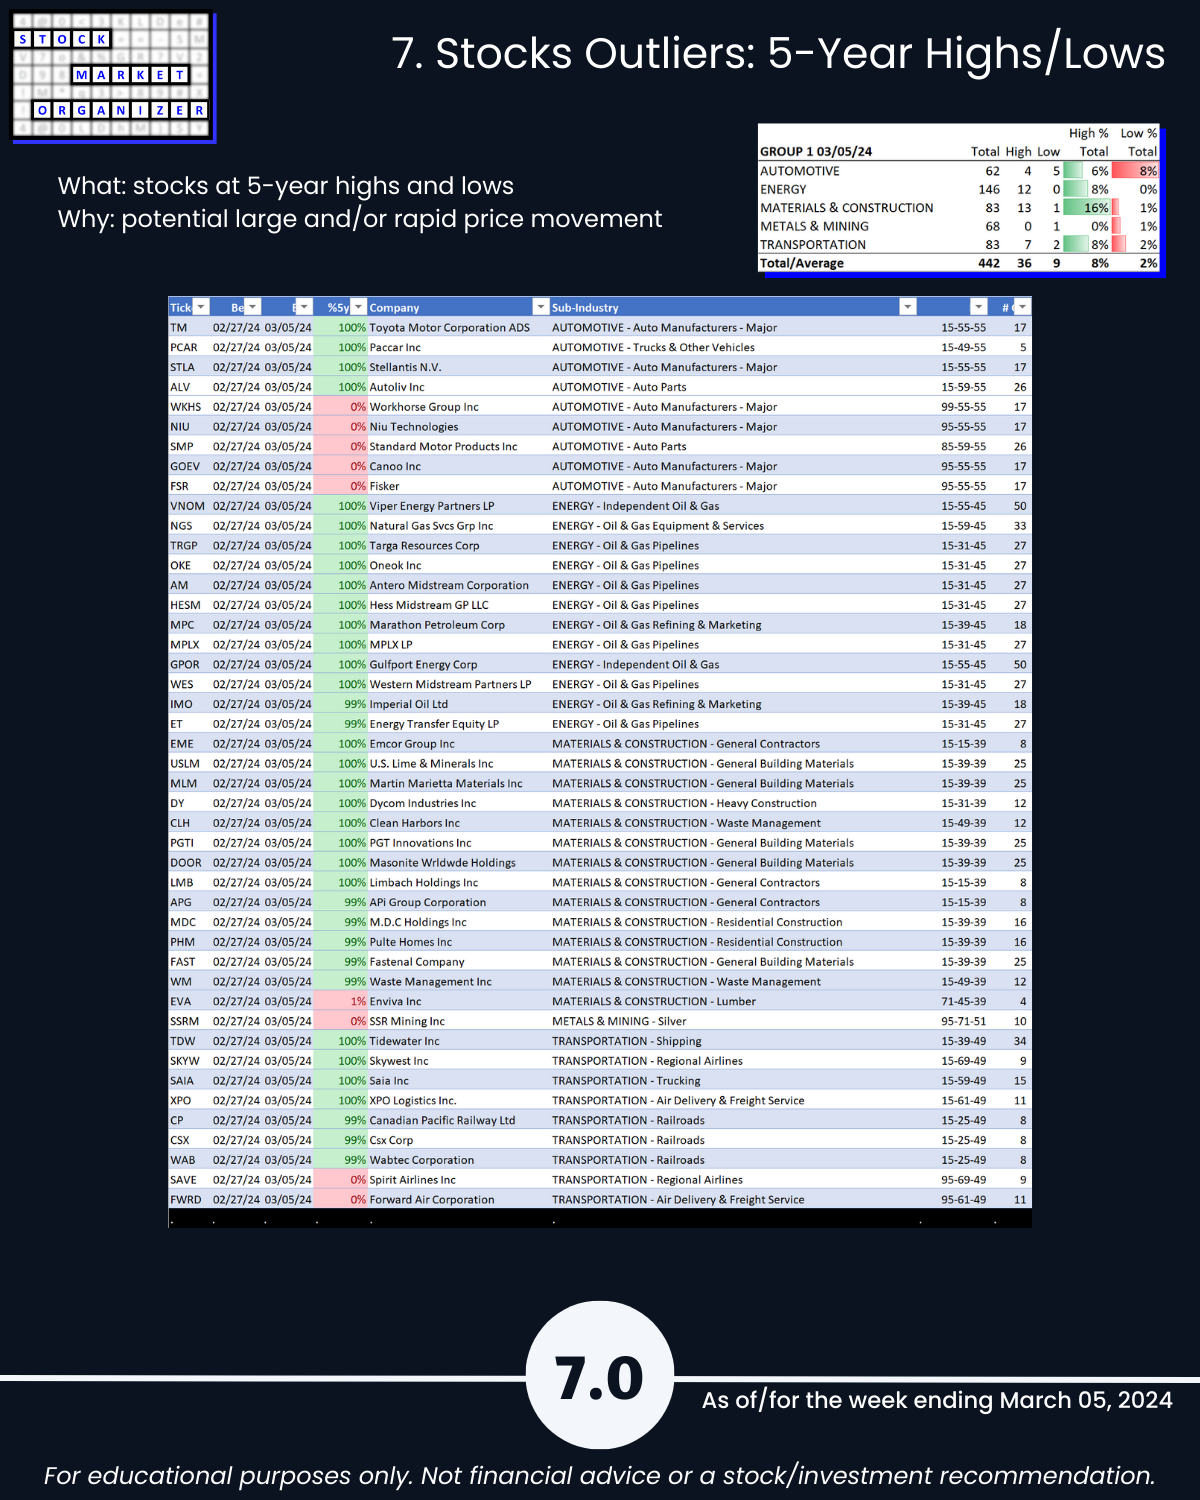
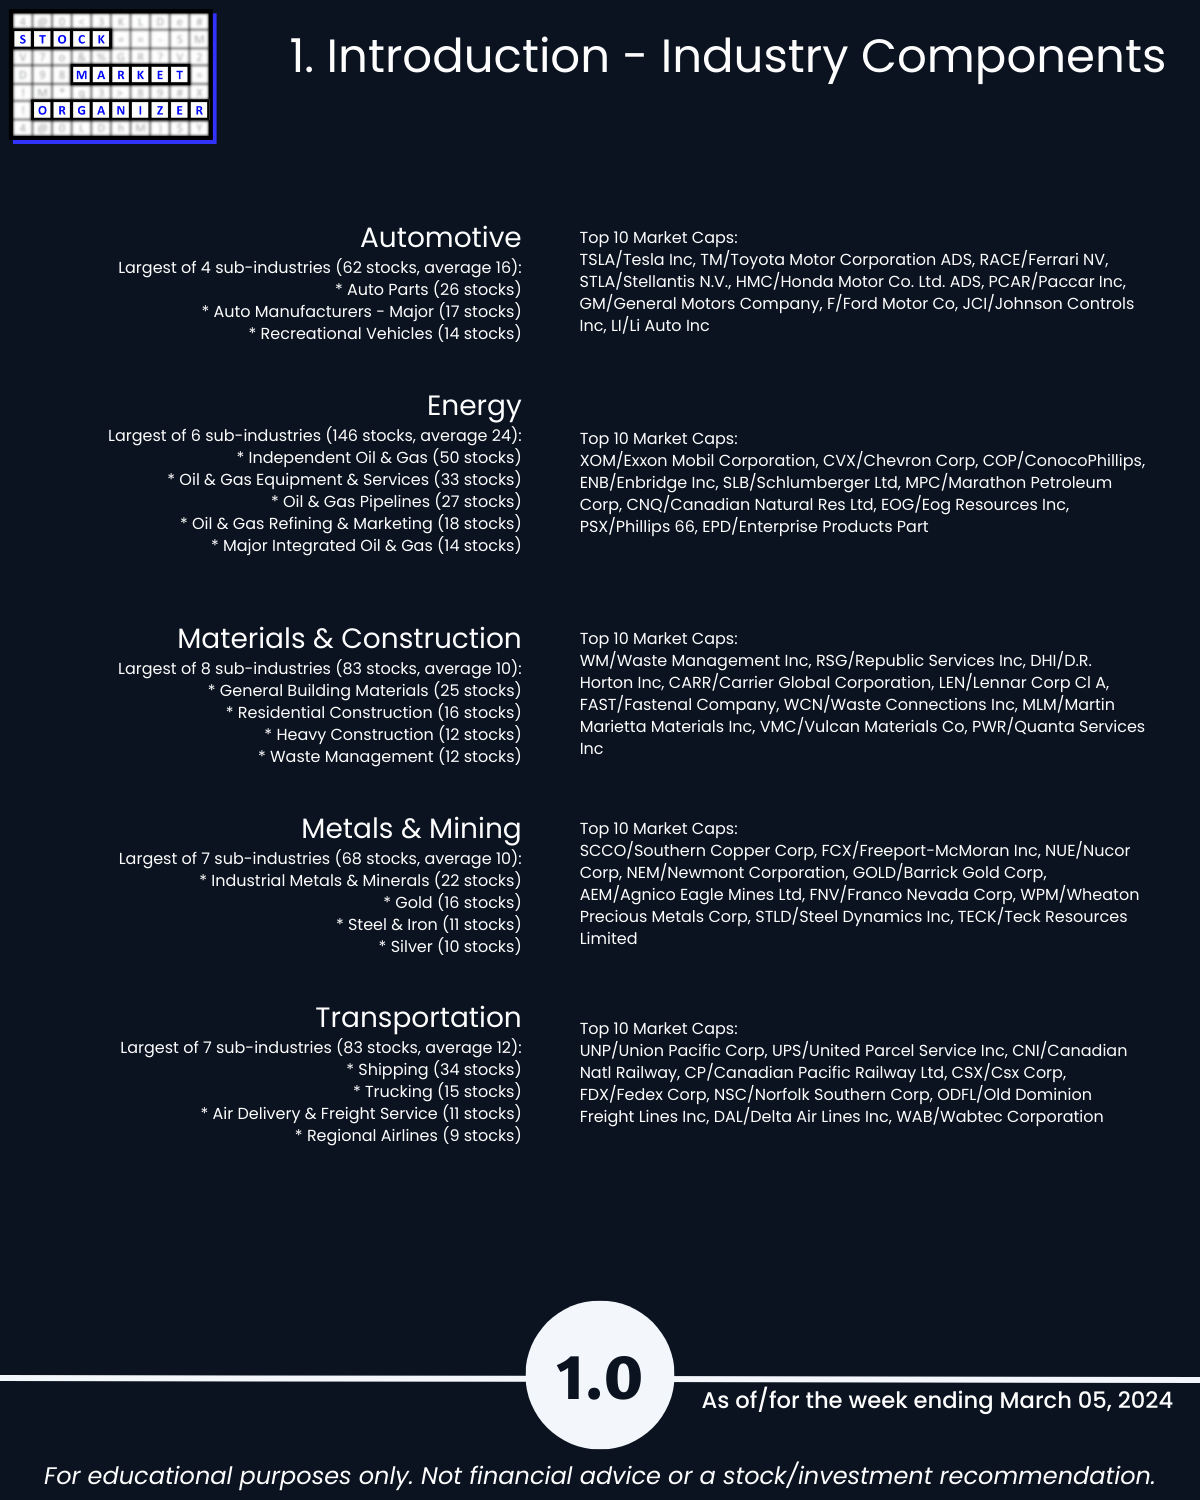
U.S. stock market 3/5/24, EV land struggling as TSLA falters and FSR (-40%) potential going concern issues. Yet TM, STLA = ATH. Metals & Mining strengthening, 18% of its stocks >10% (both Gold/Silver strengthening). Materials/Construction 70% stocks rated Strongest, 16% of its stocks at ATHs (was 36% @ highs last week). If you aren’t explicitly looking everywhere for strength, how will you know where and when the next pocket of strength is emerging? Today: analysis of Group 1 industries (Automotive, Energy, Materials & Construction, Metals & Mining, and Transportation).
Detail below/attached including Strongest-/Weakest-rated stocks and objective strengthening and weakening measurements for each of these industries.
REPORT HIGHLIGHTS
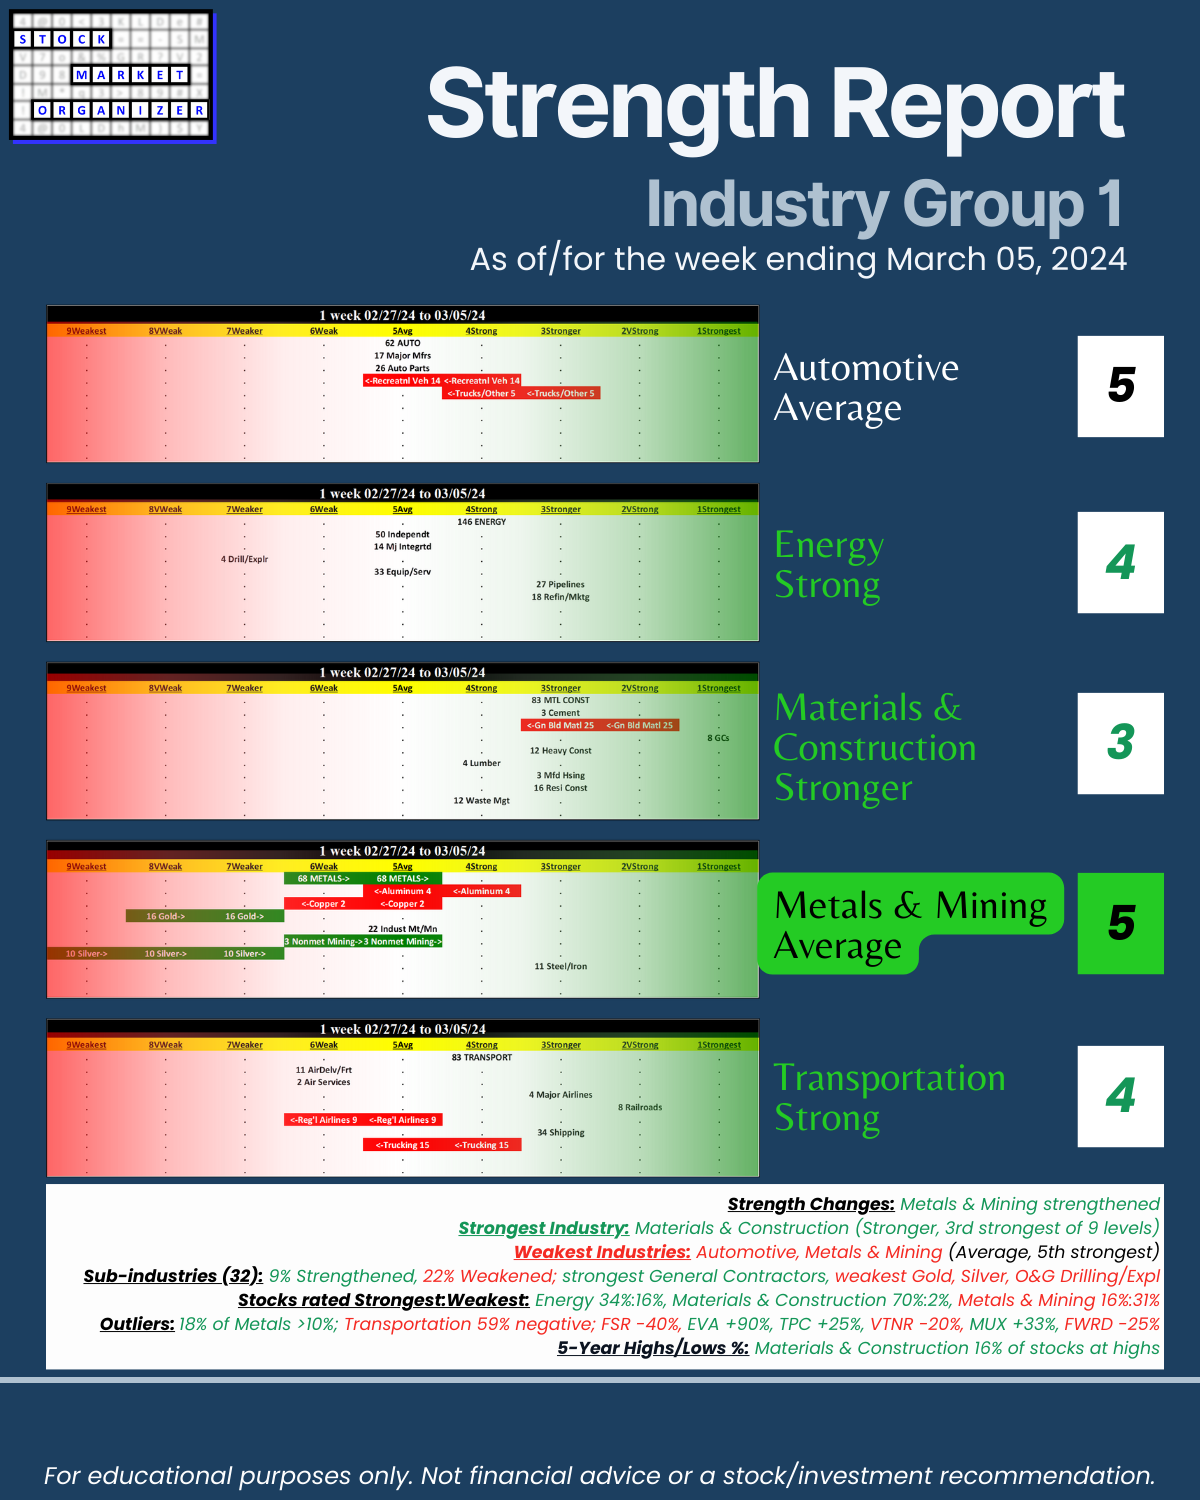
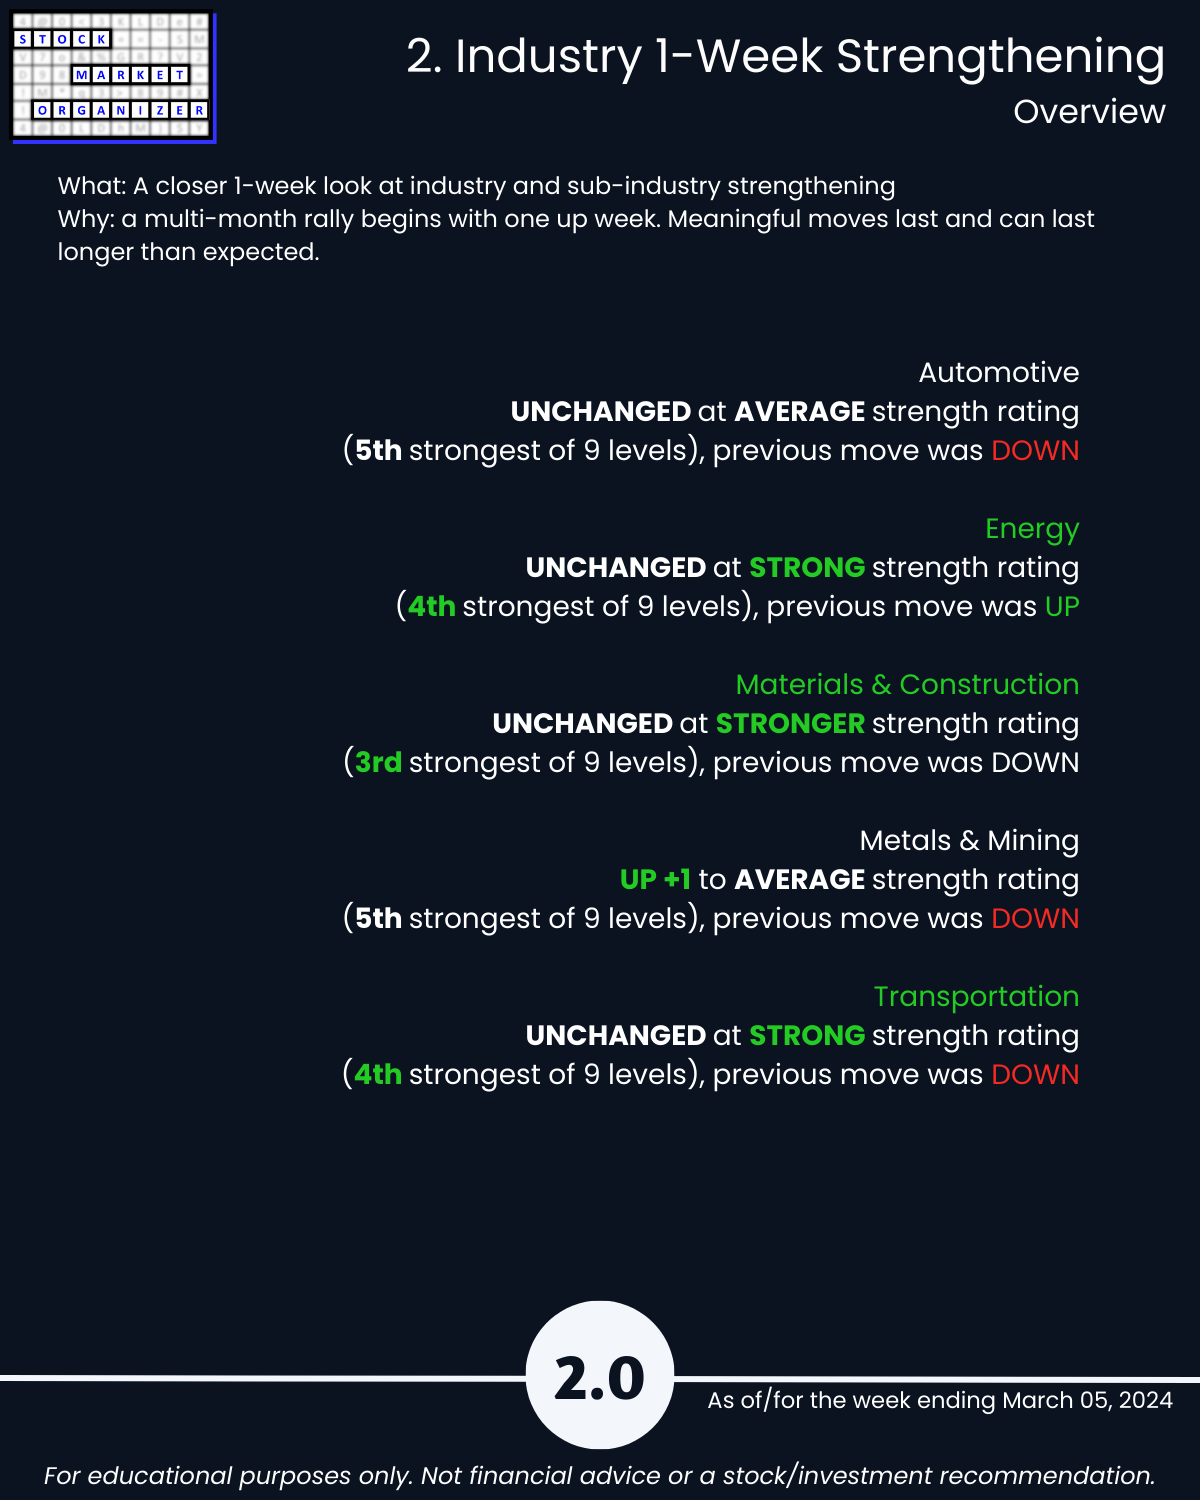
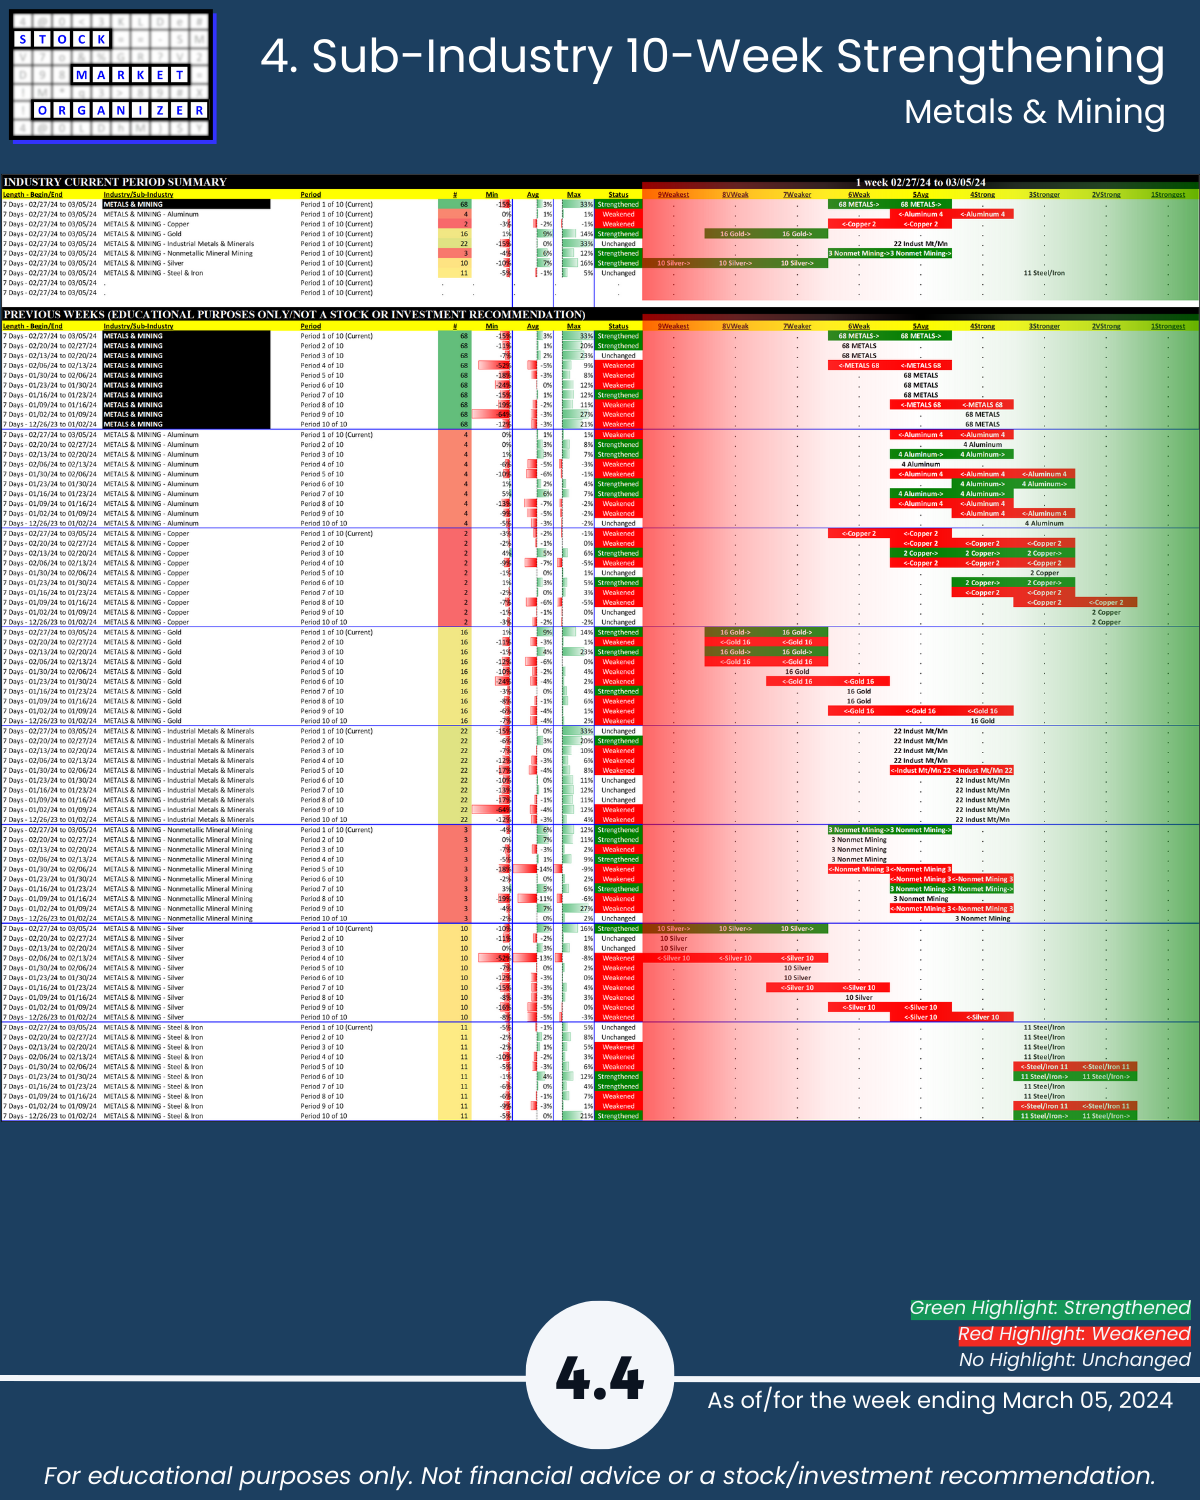
🔹 Strength Changes: Metals & Mining strengthened
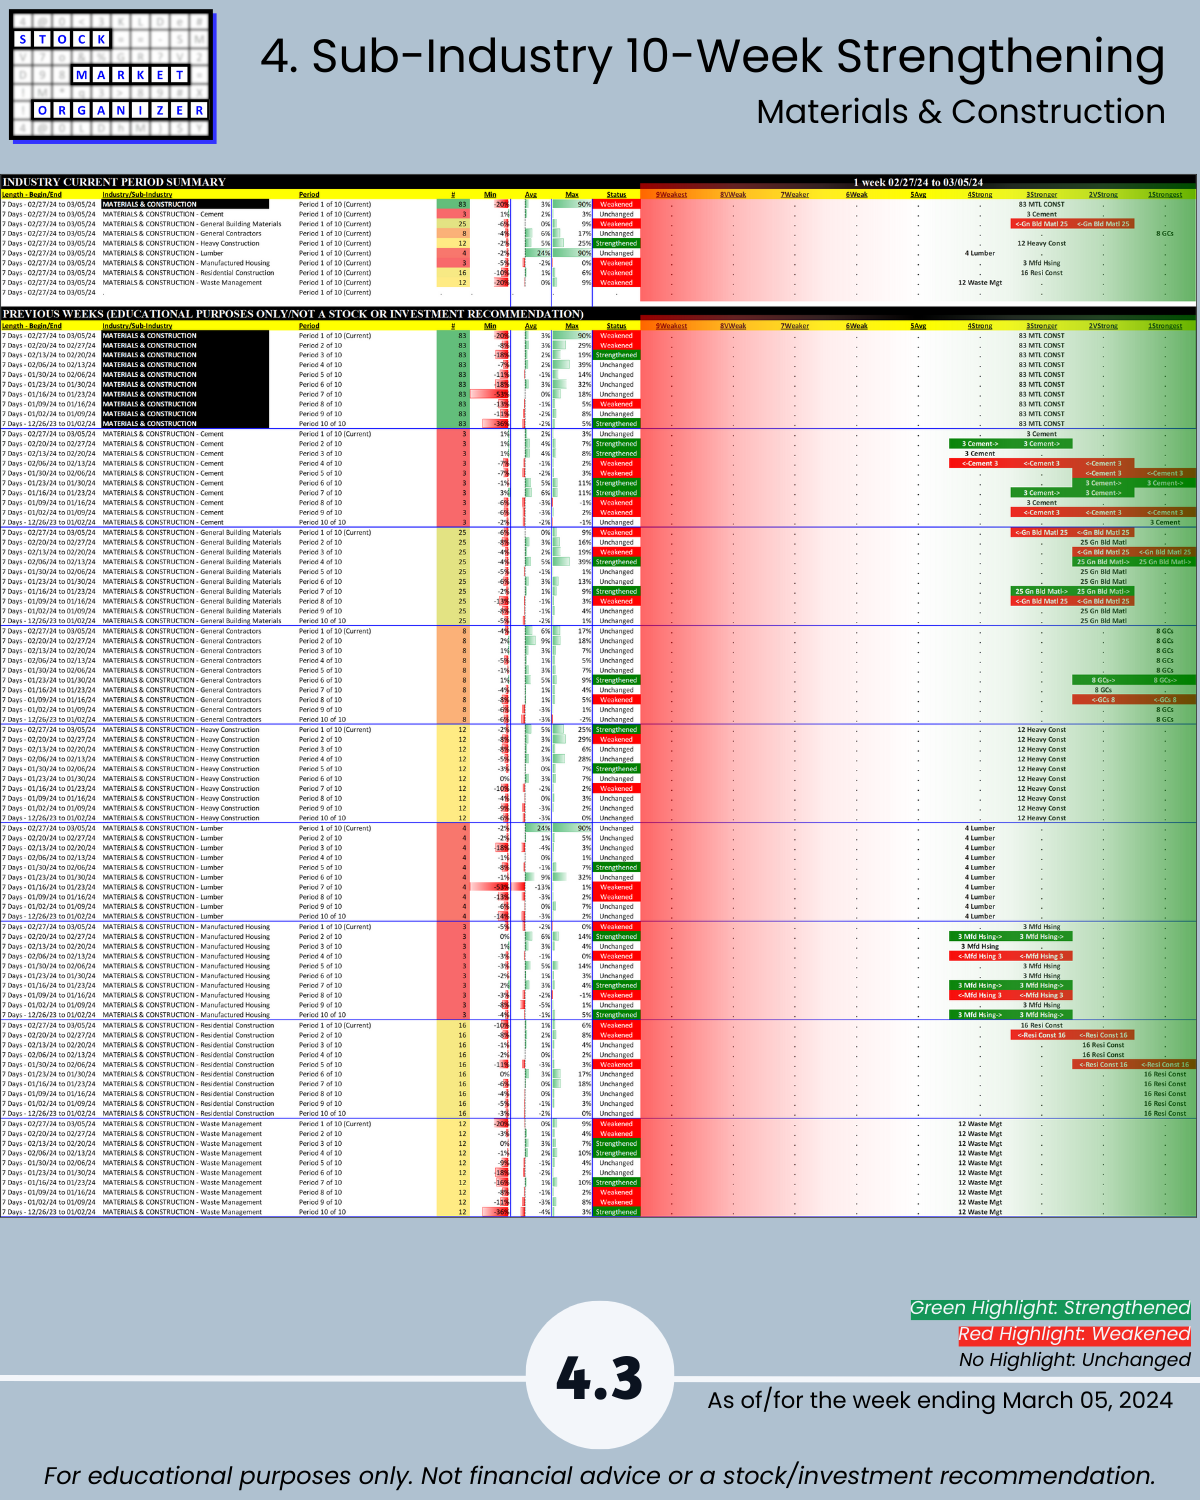
🔹 Strongest Industry: Materials & Construction (Stronger, 3rd strongest of 9 levels)
🔹 Weakest Industries: Automotive, Metals & Mining (Average, 5th strongest)
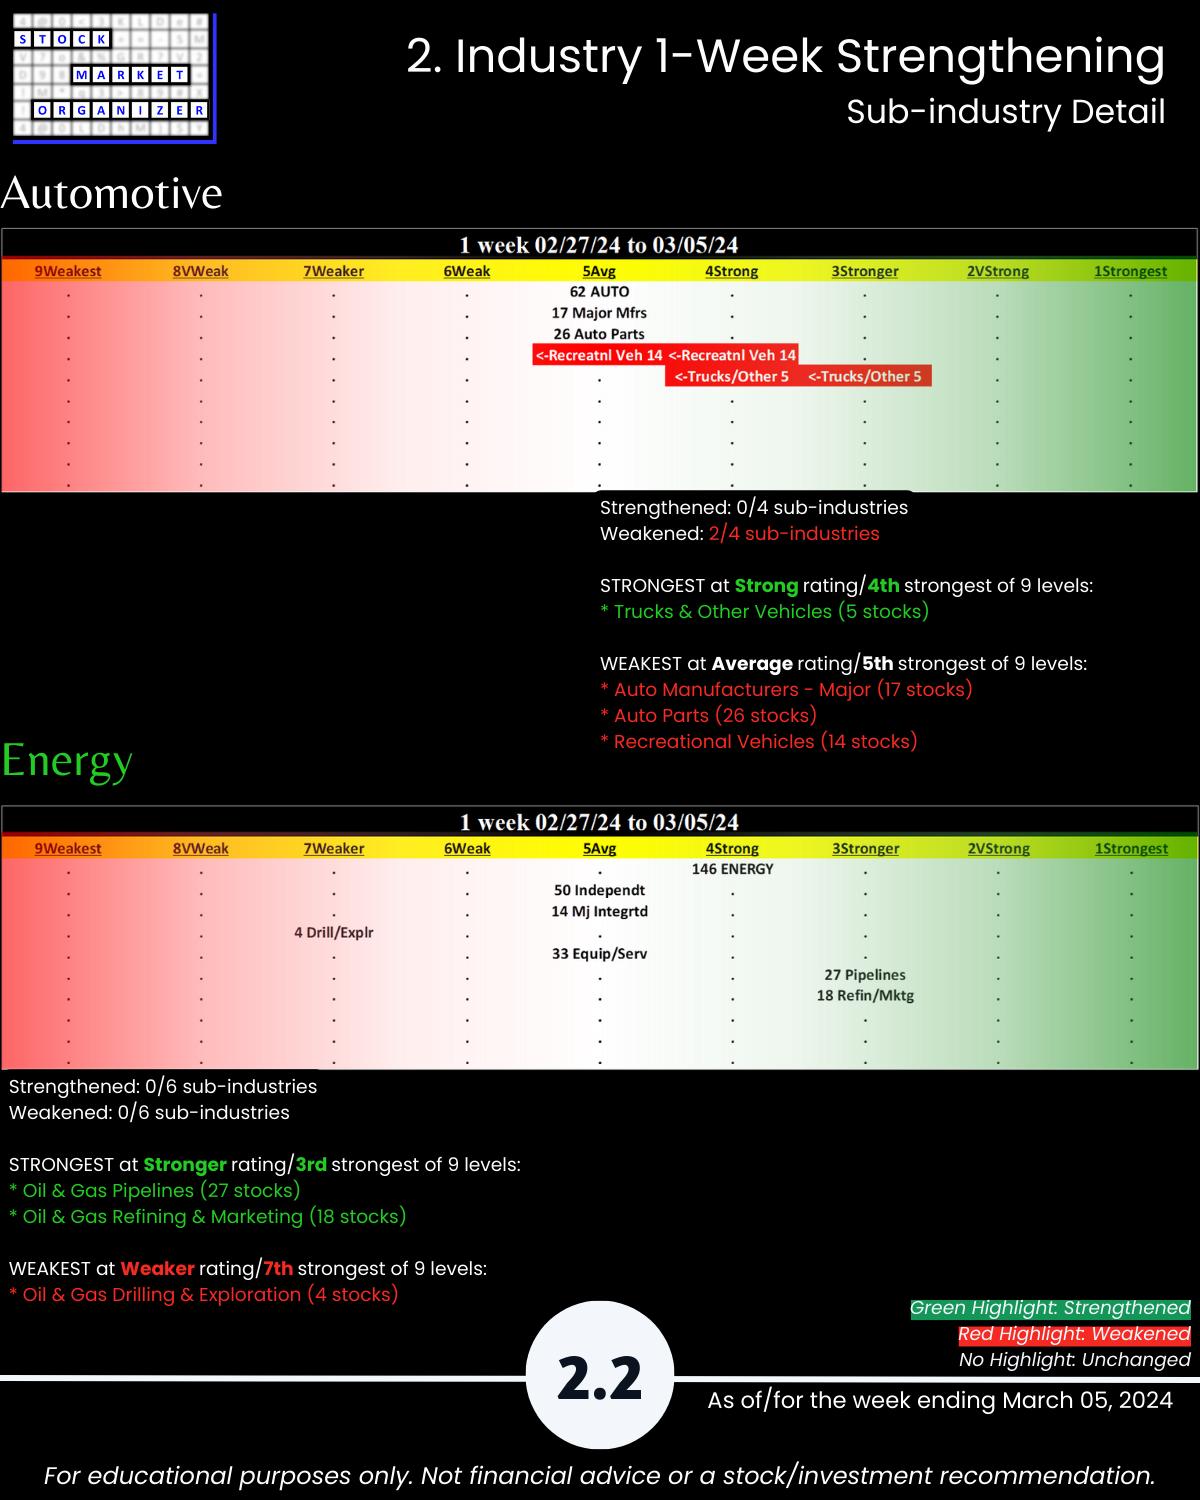
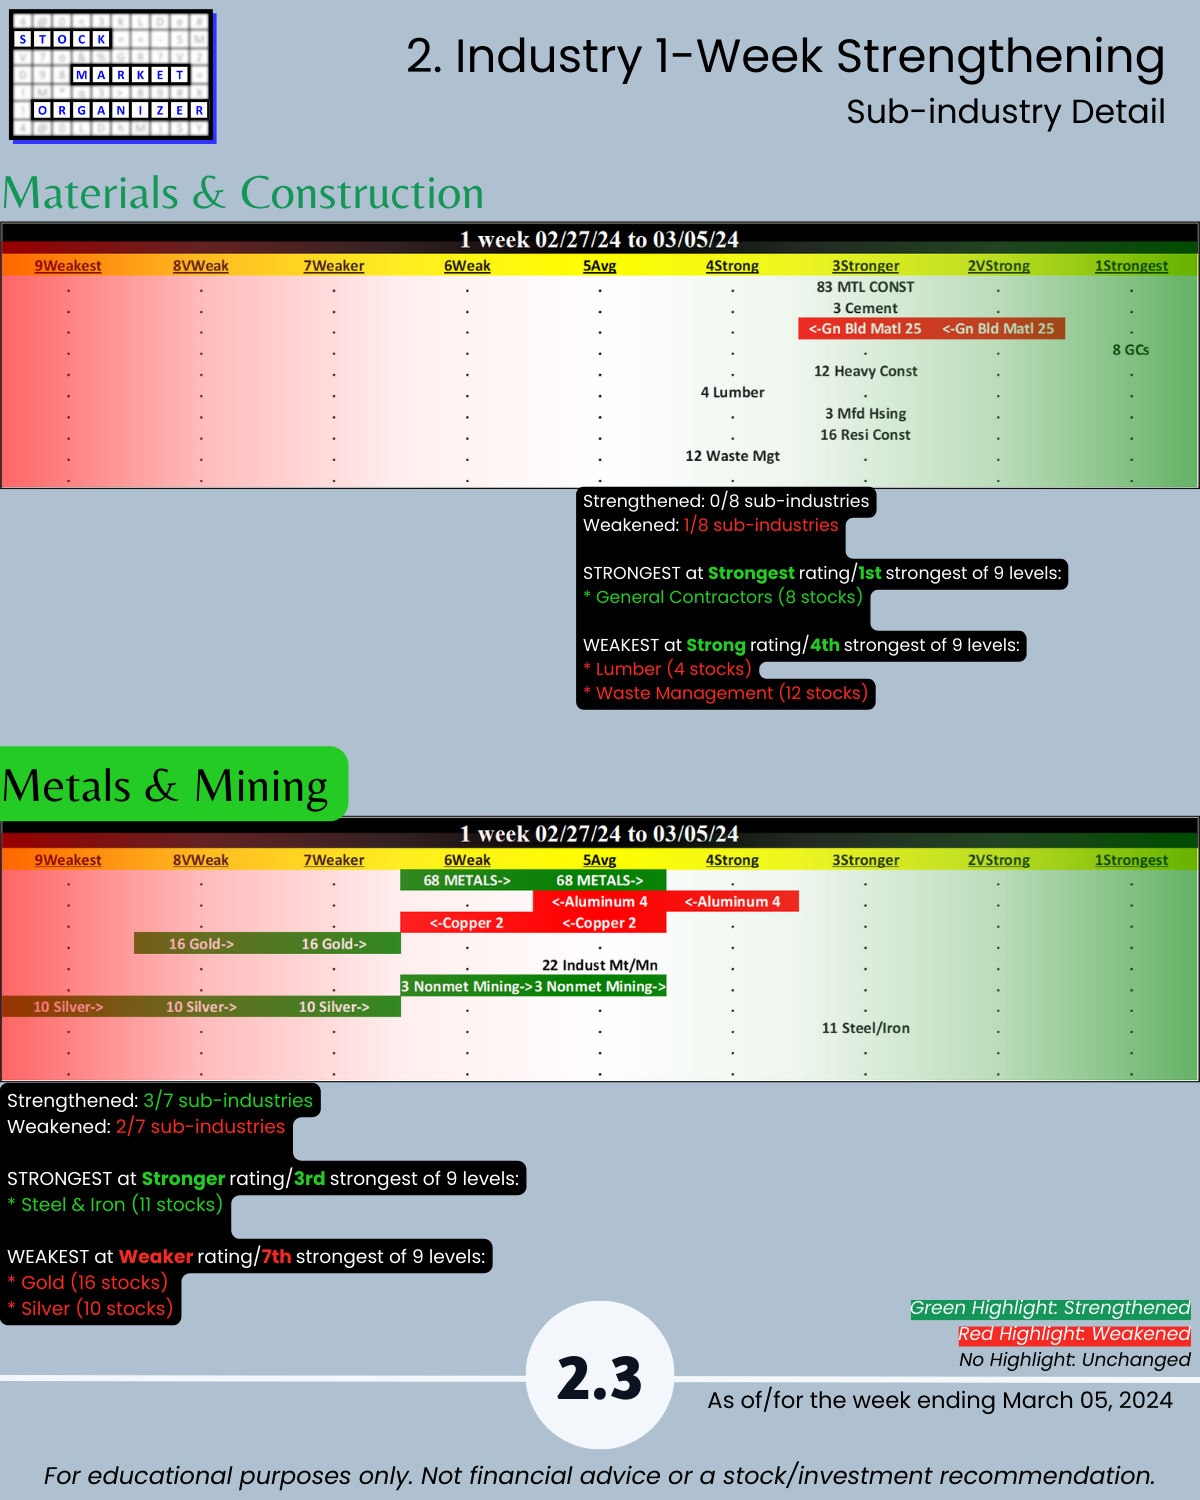
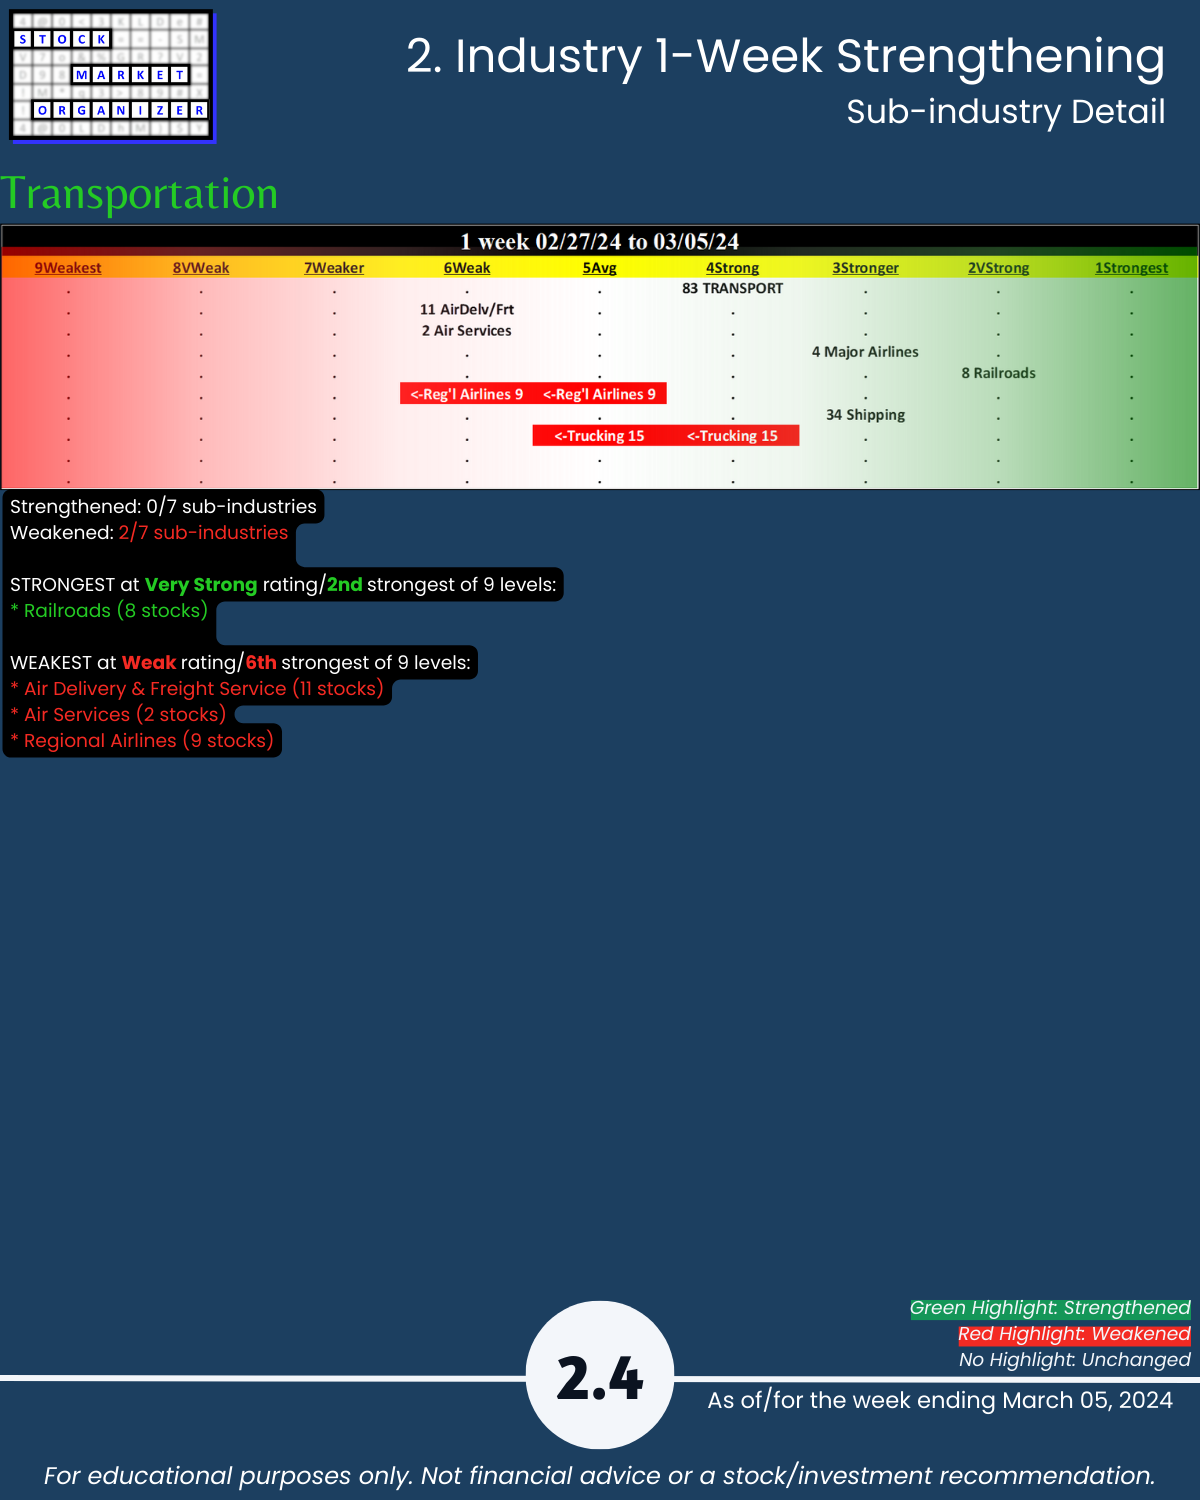
🔹 Sub-industries (32): 9% Strengthened, 22% Weakened; strongest General Contractors, weakest Gold, Silver, Oil & Gas Drilling/Exploration
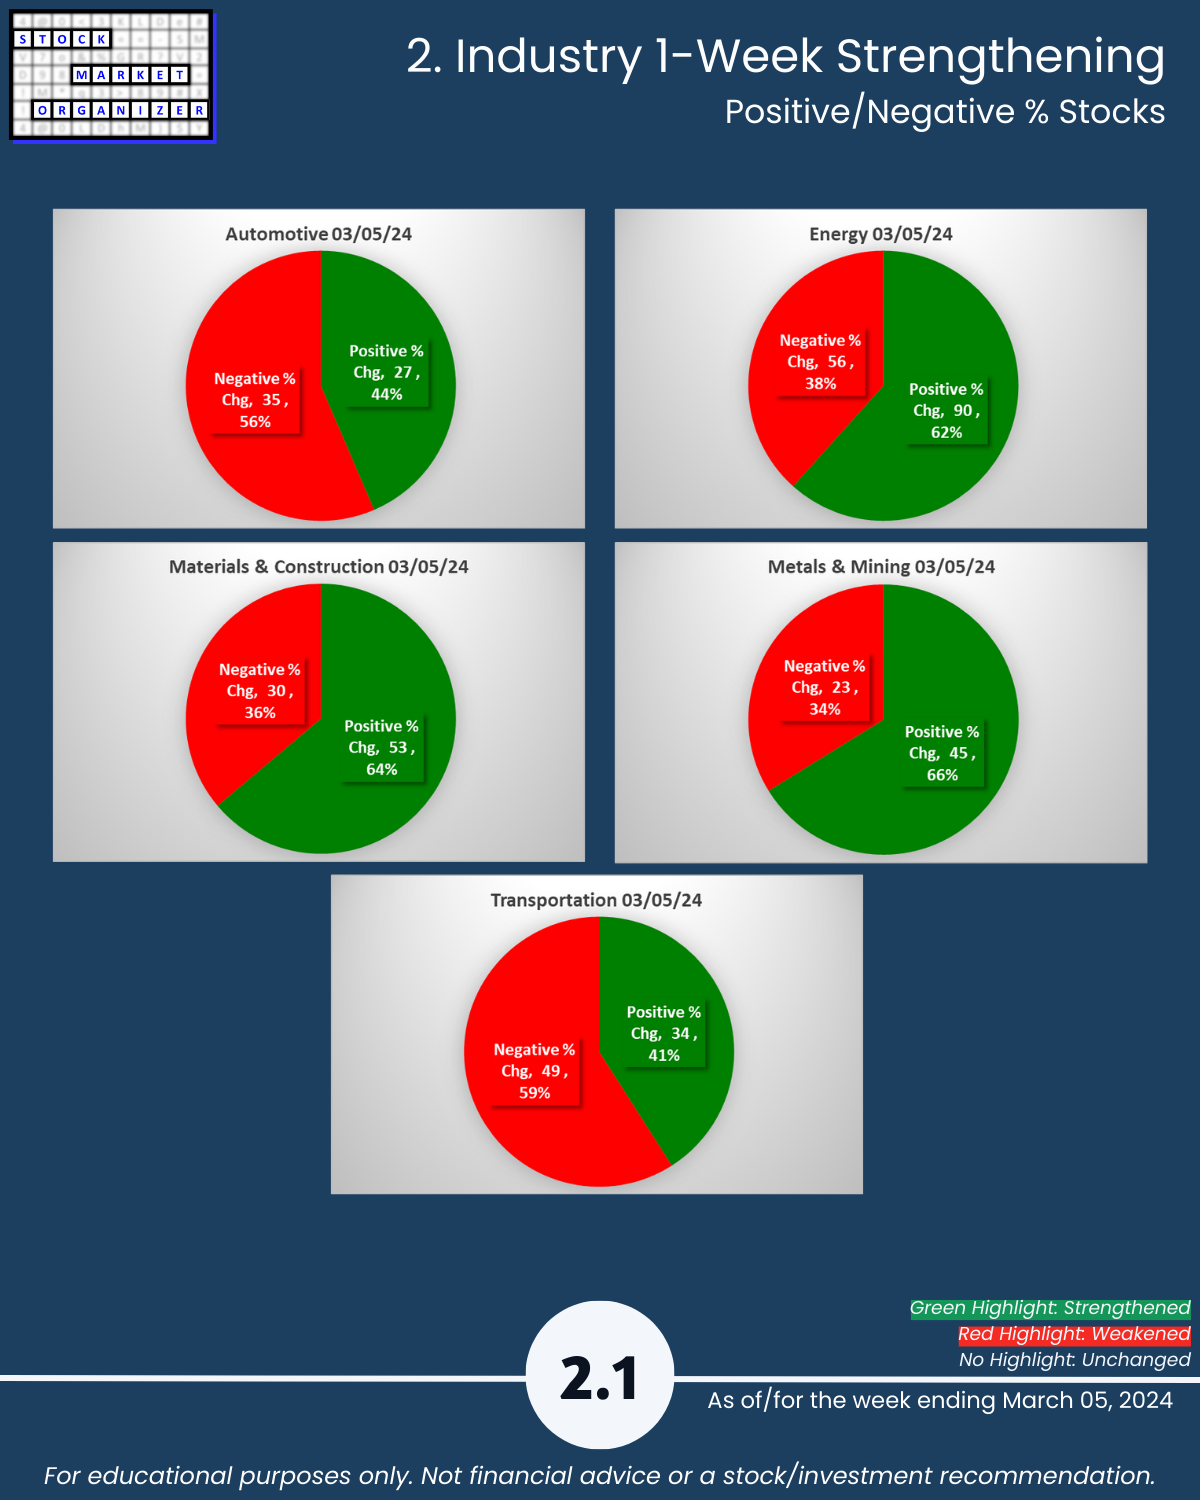
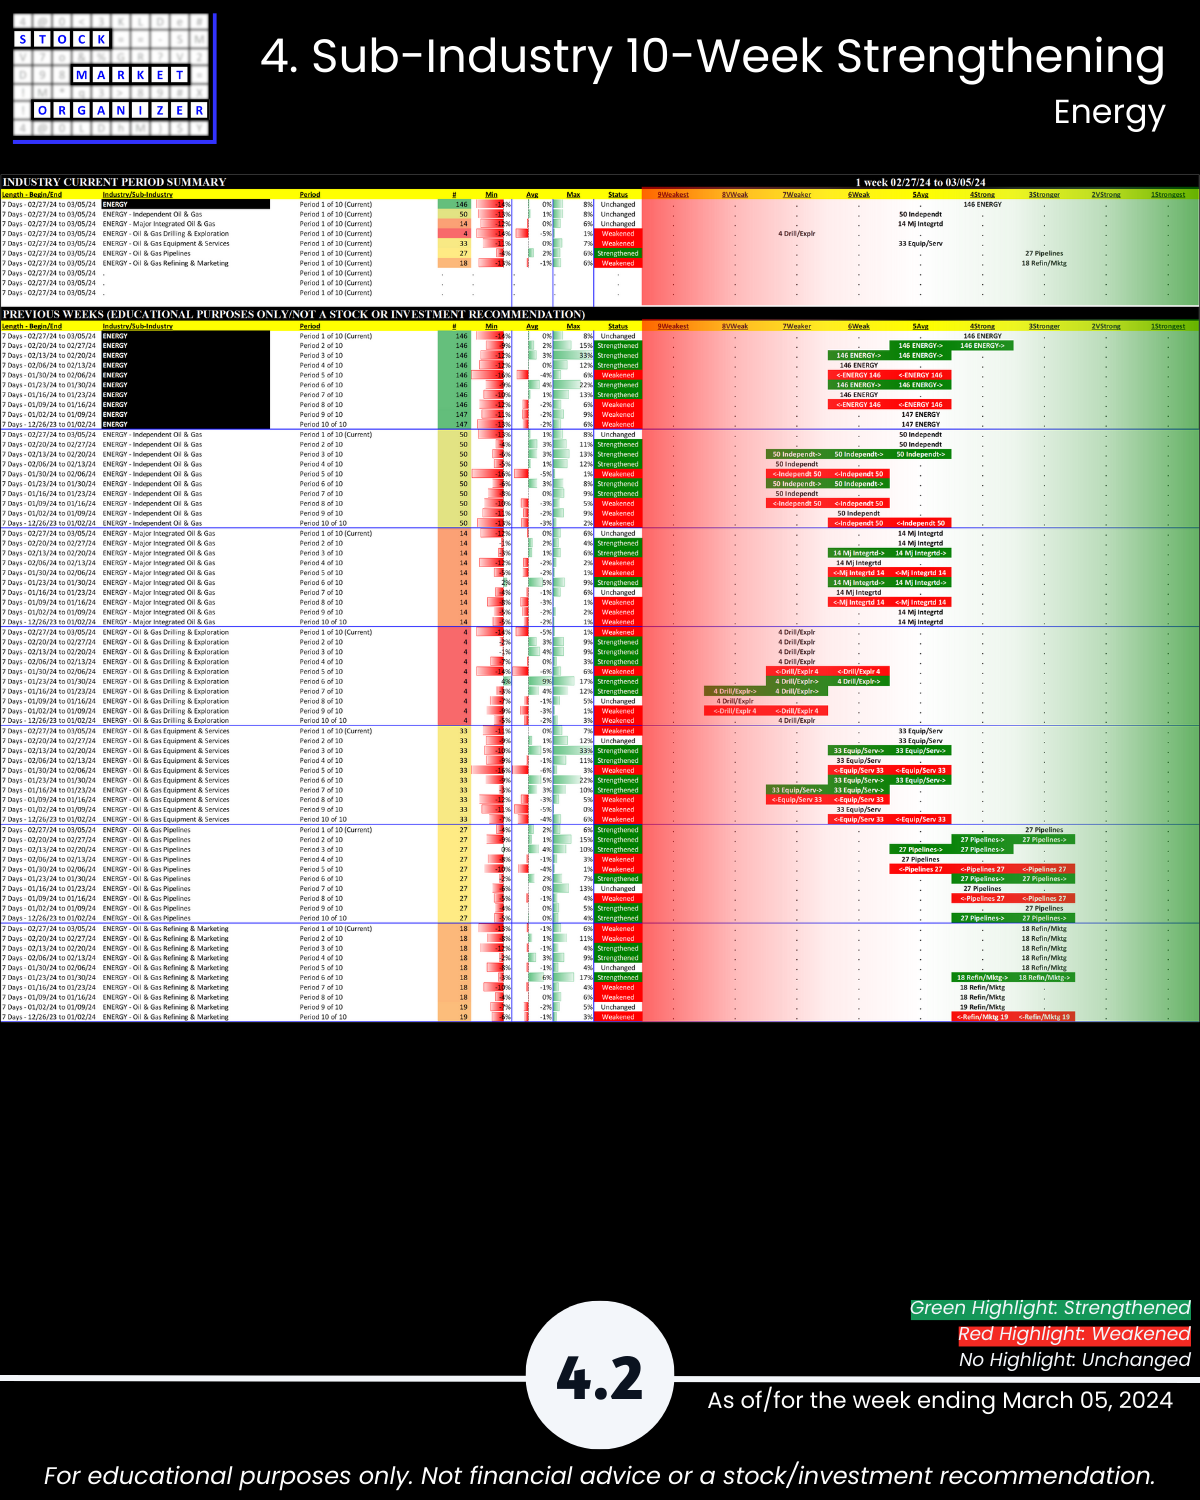
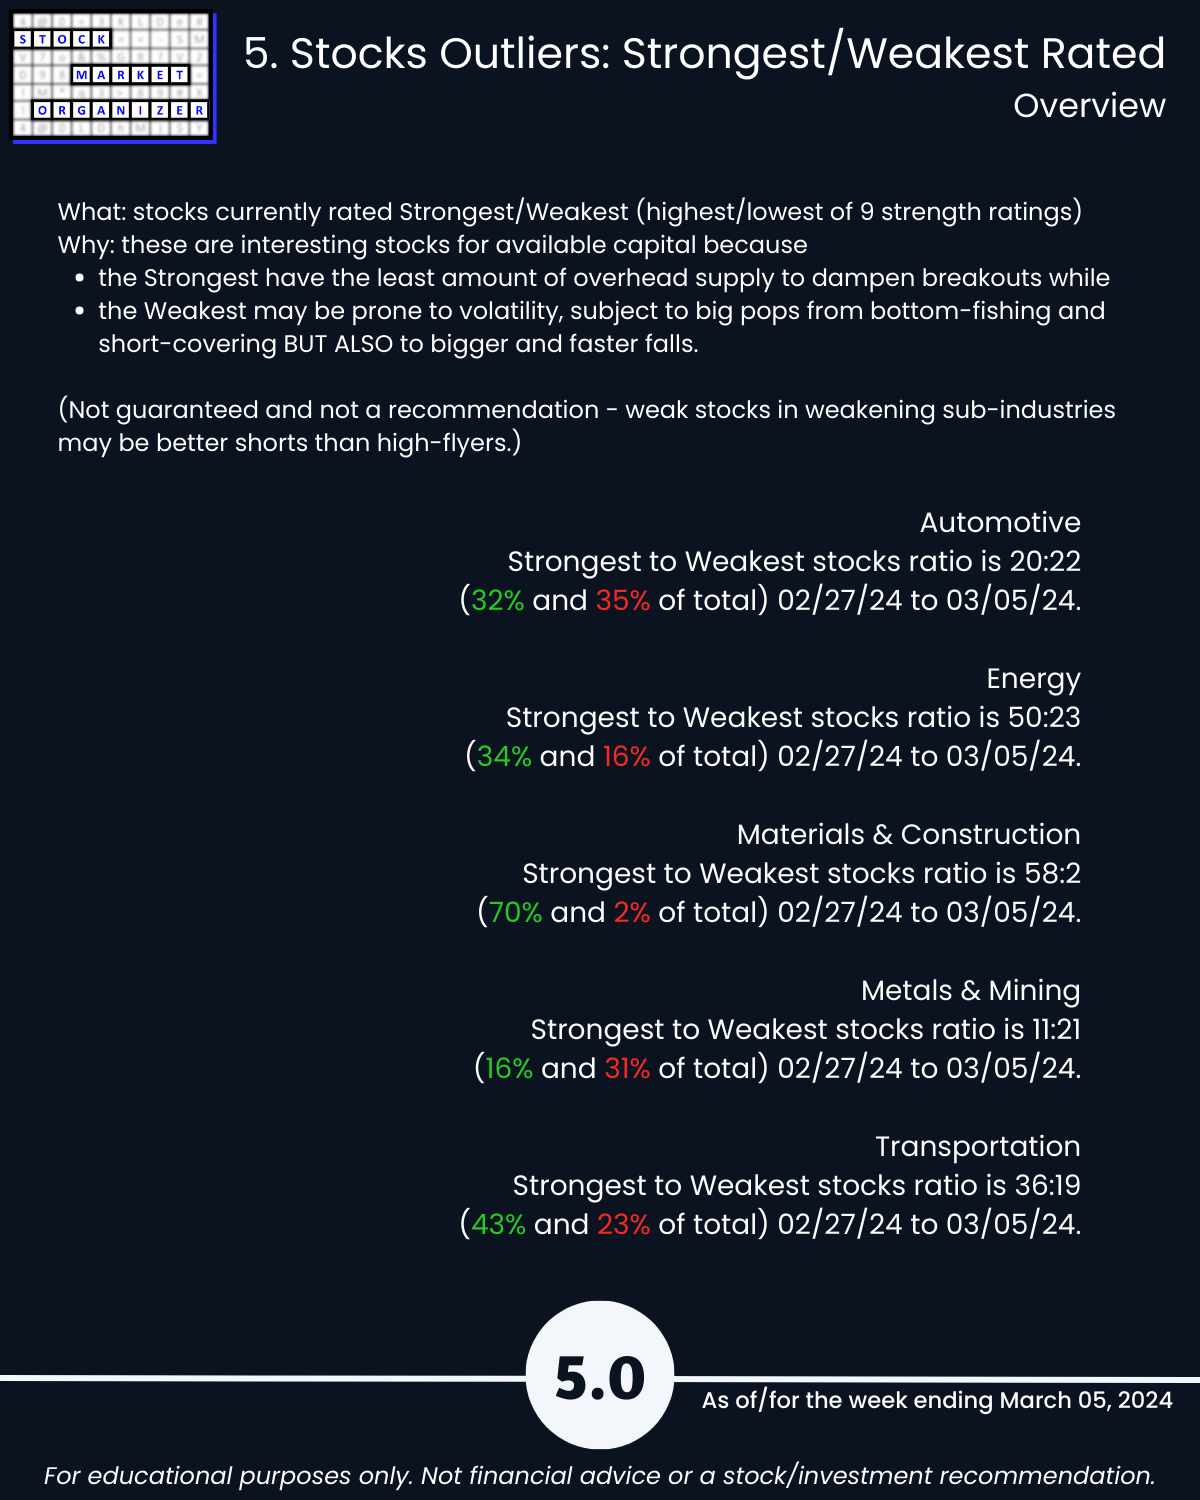
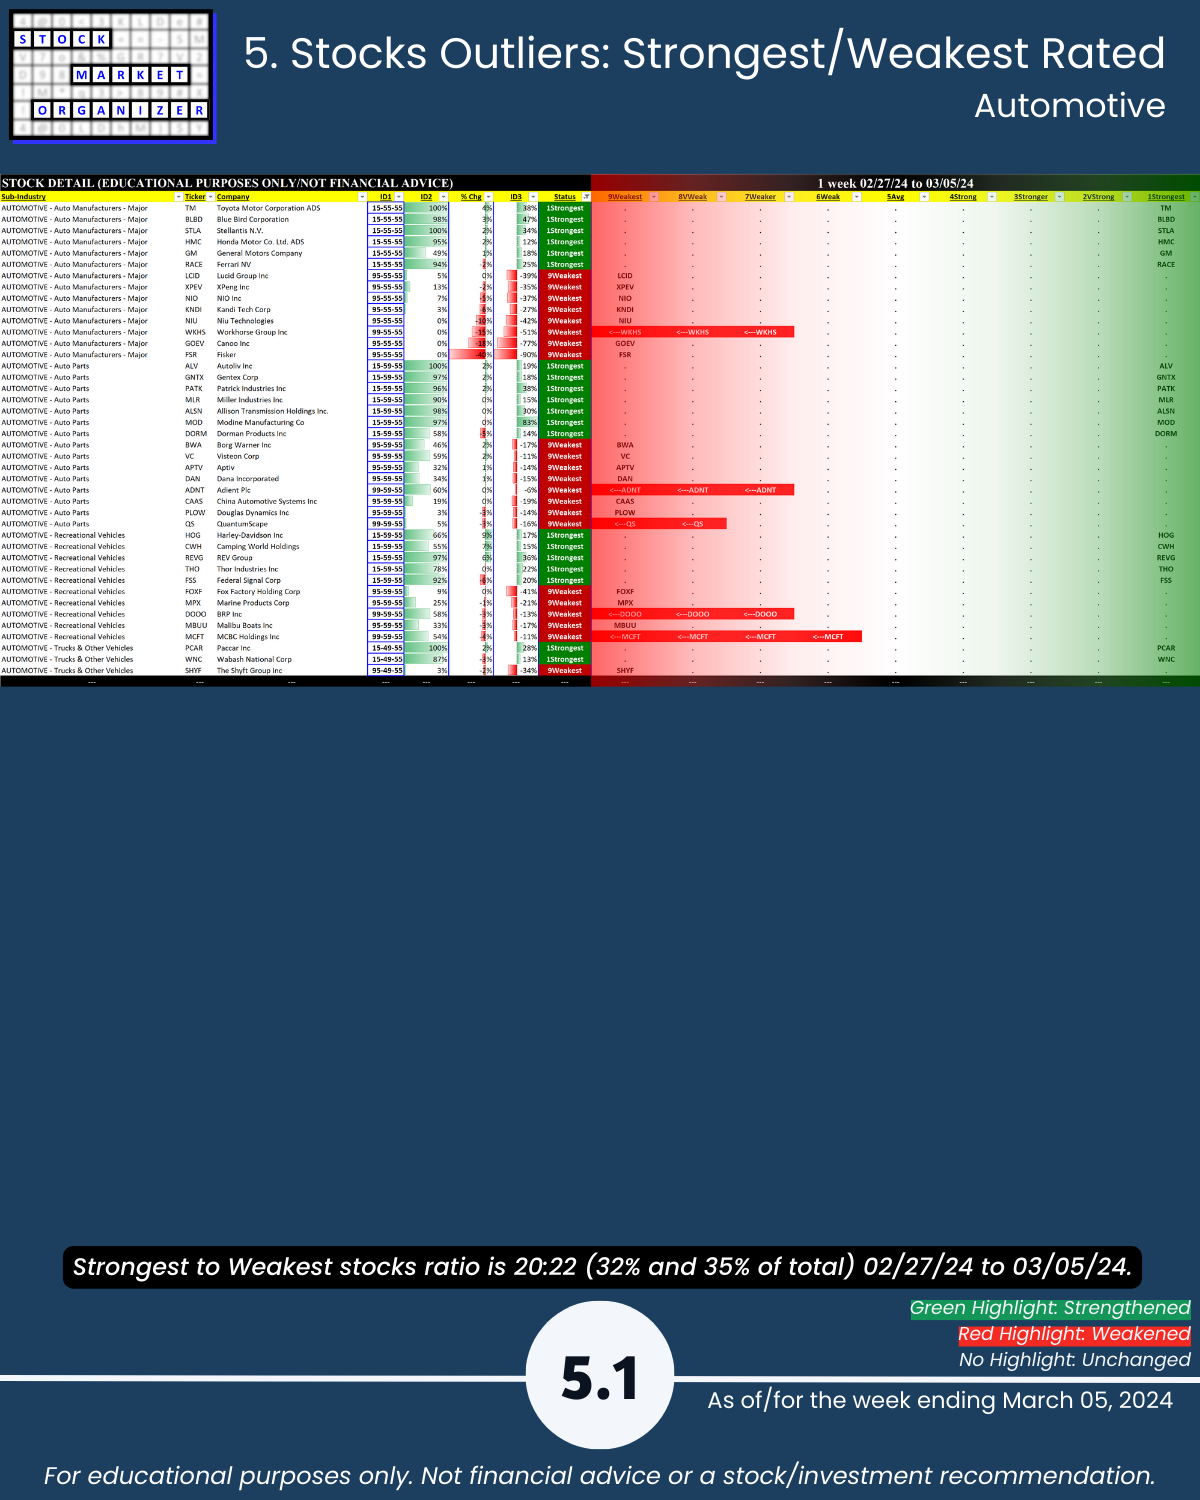
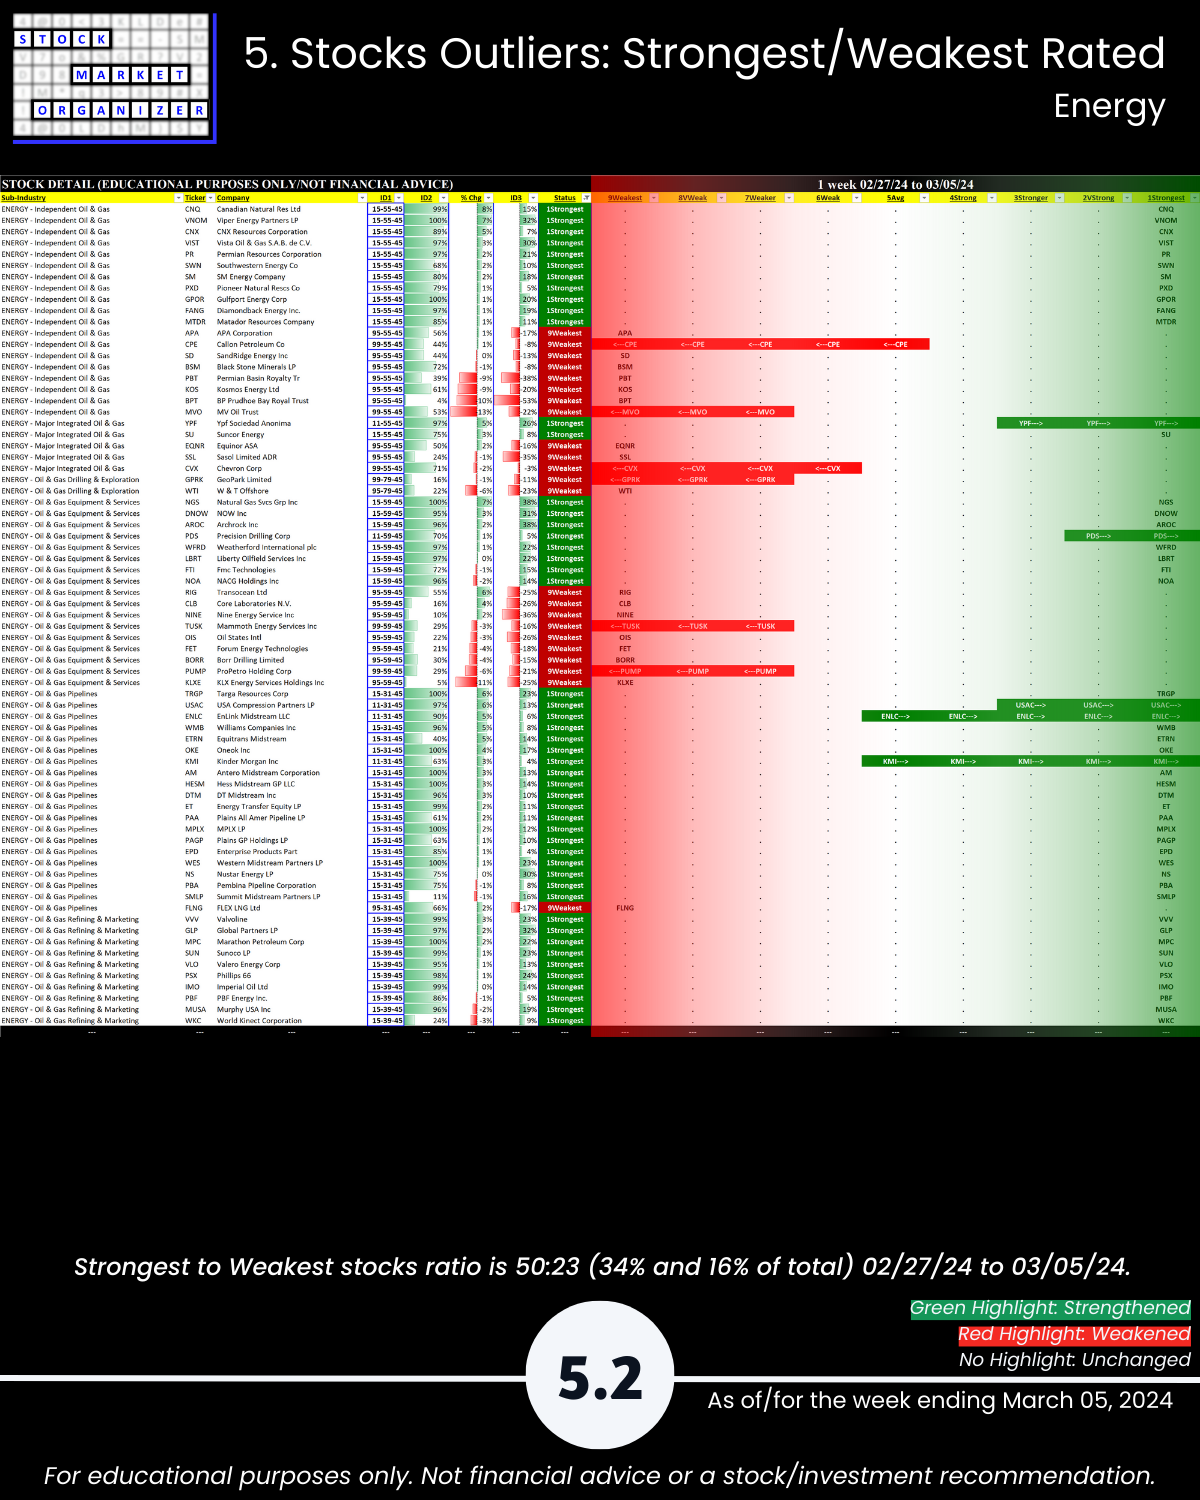
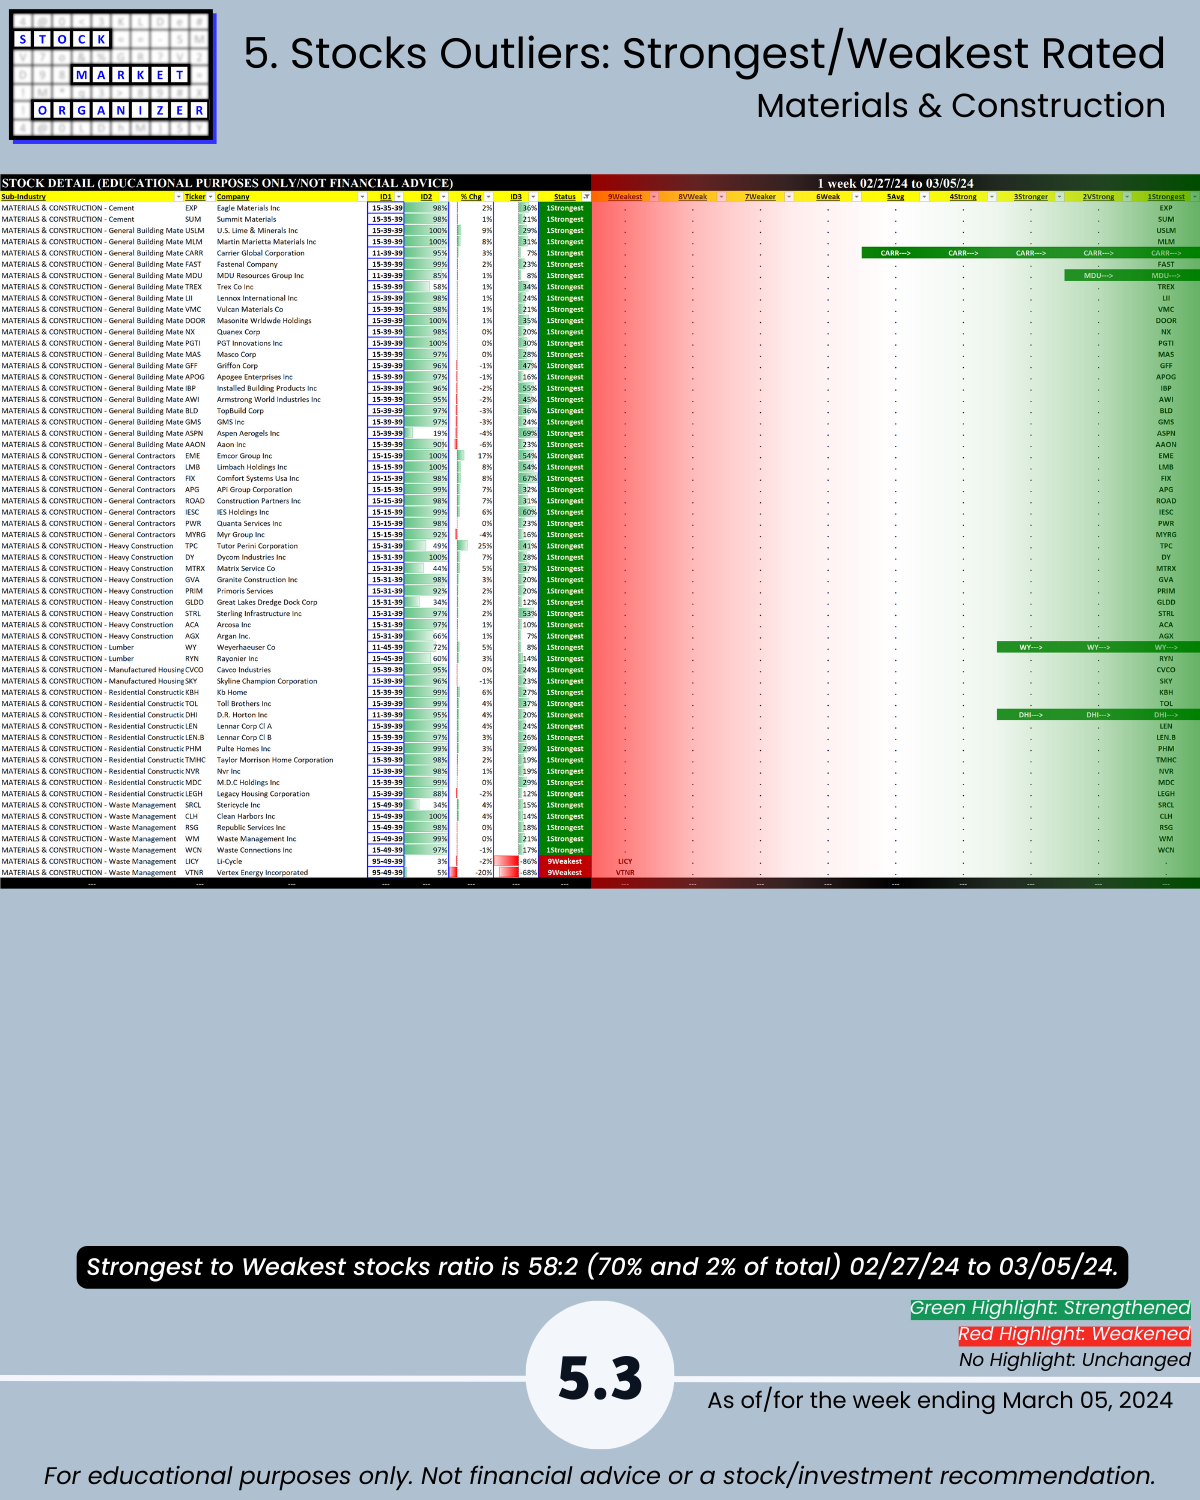
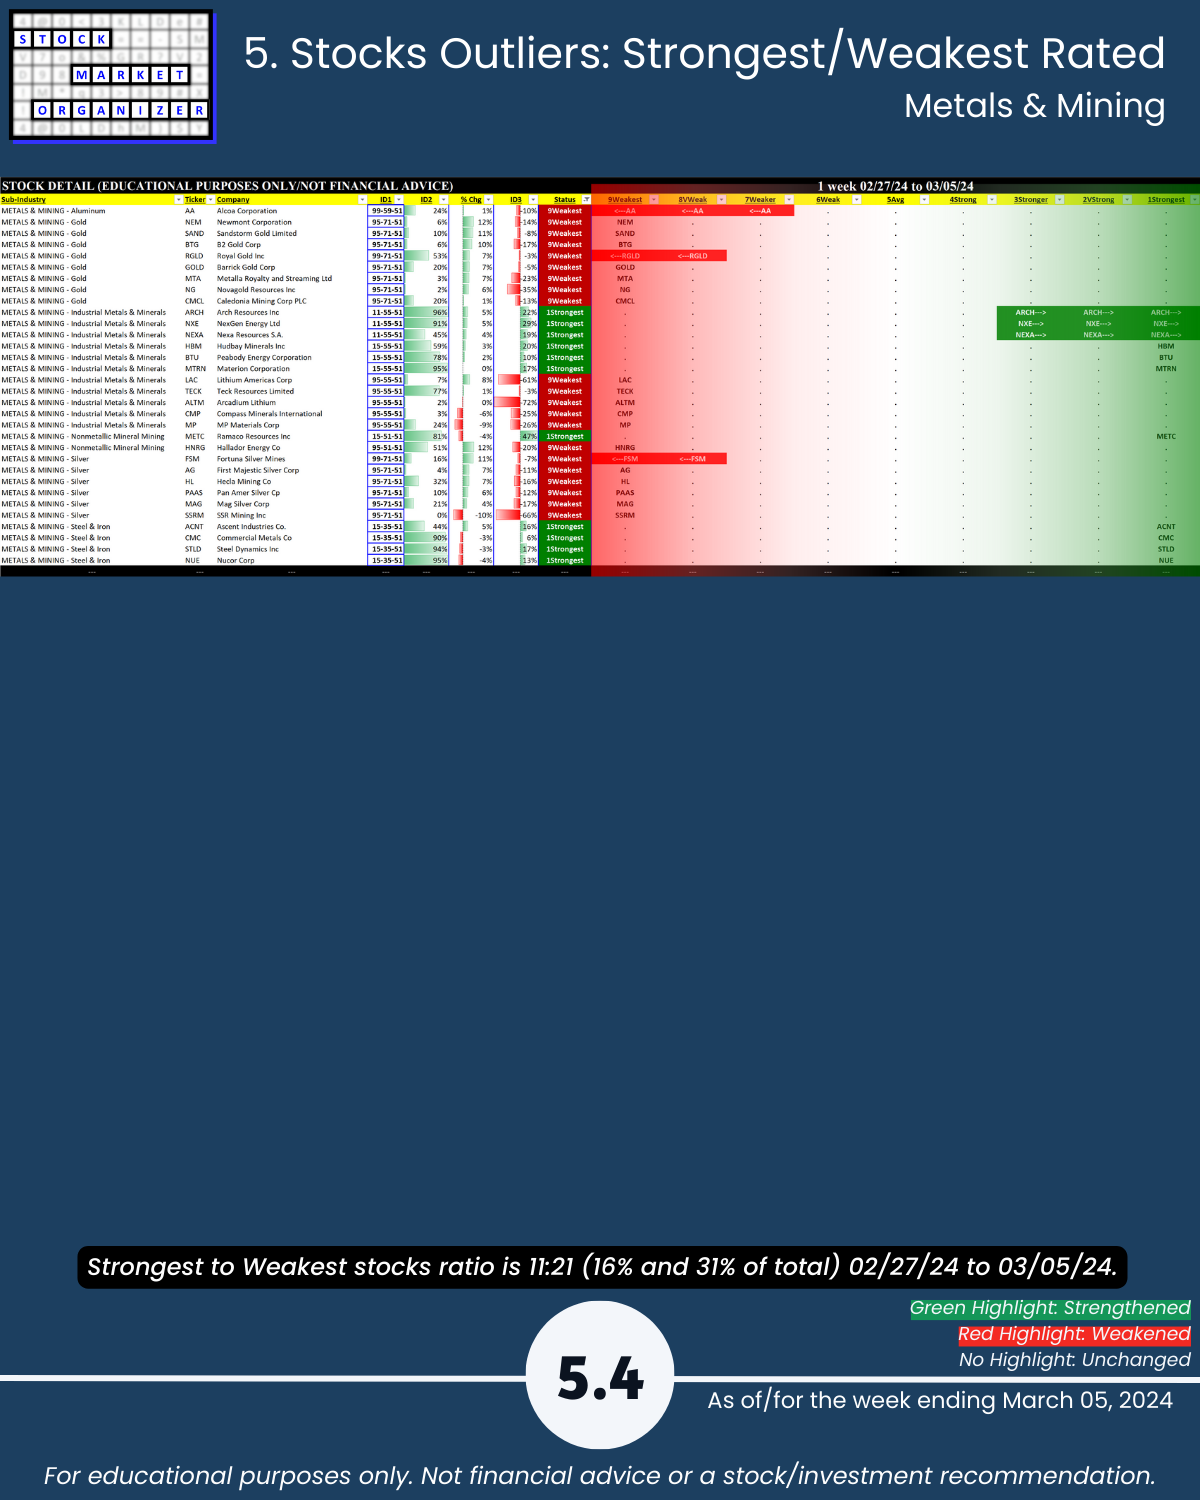
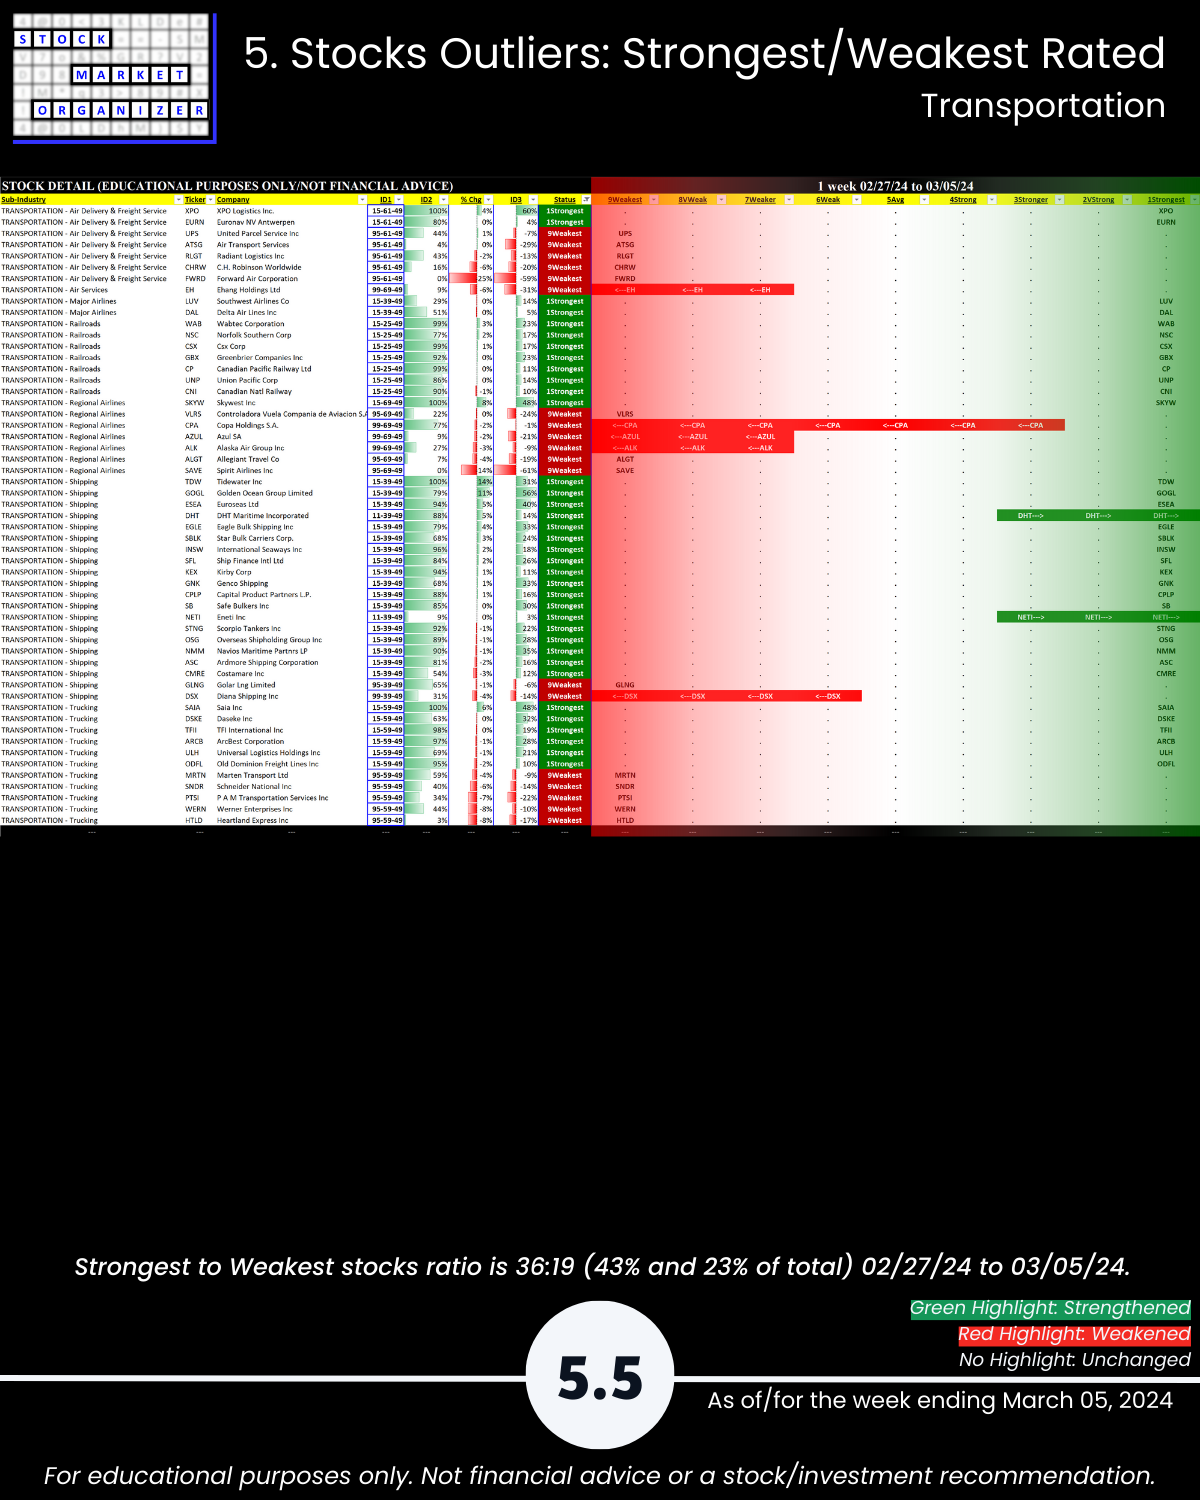
🔹 Stocks rated Strongest:Weakest: Energy 34%:16%, Materials & Construction 70%:2%, Metals & Mining 16%:31%
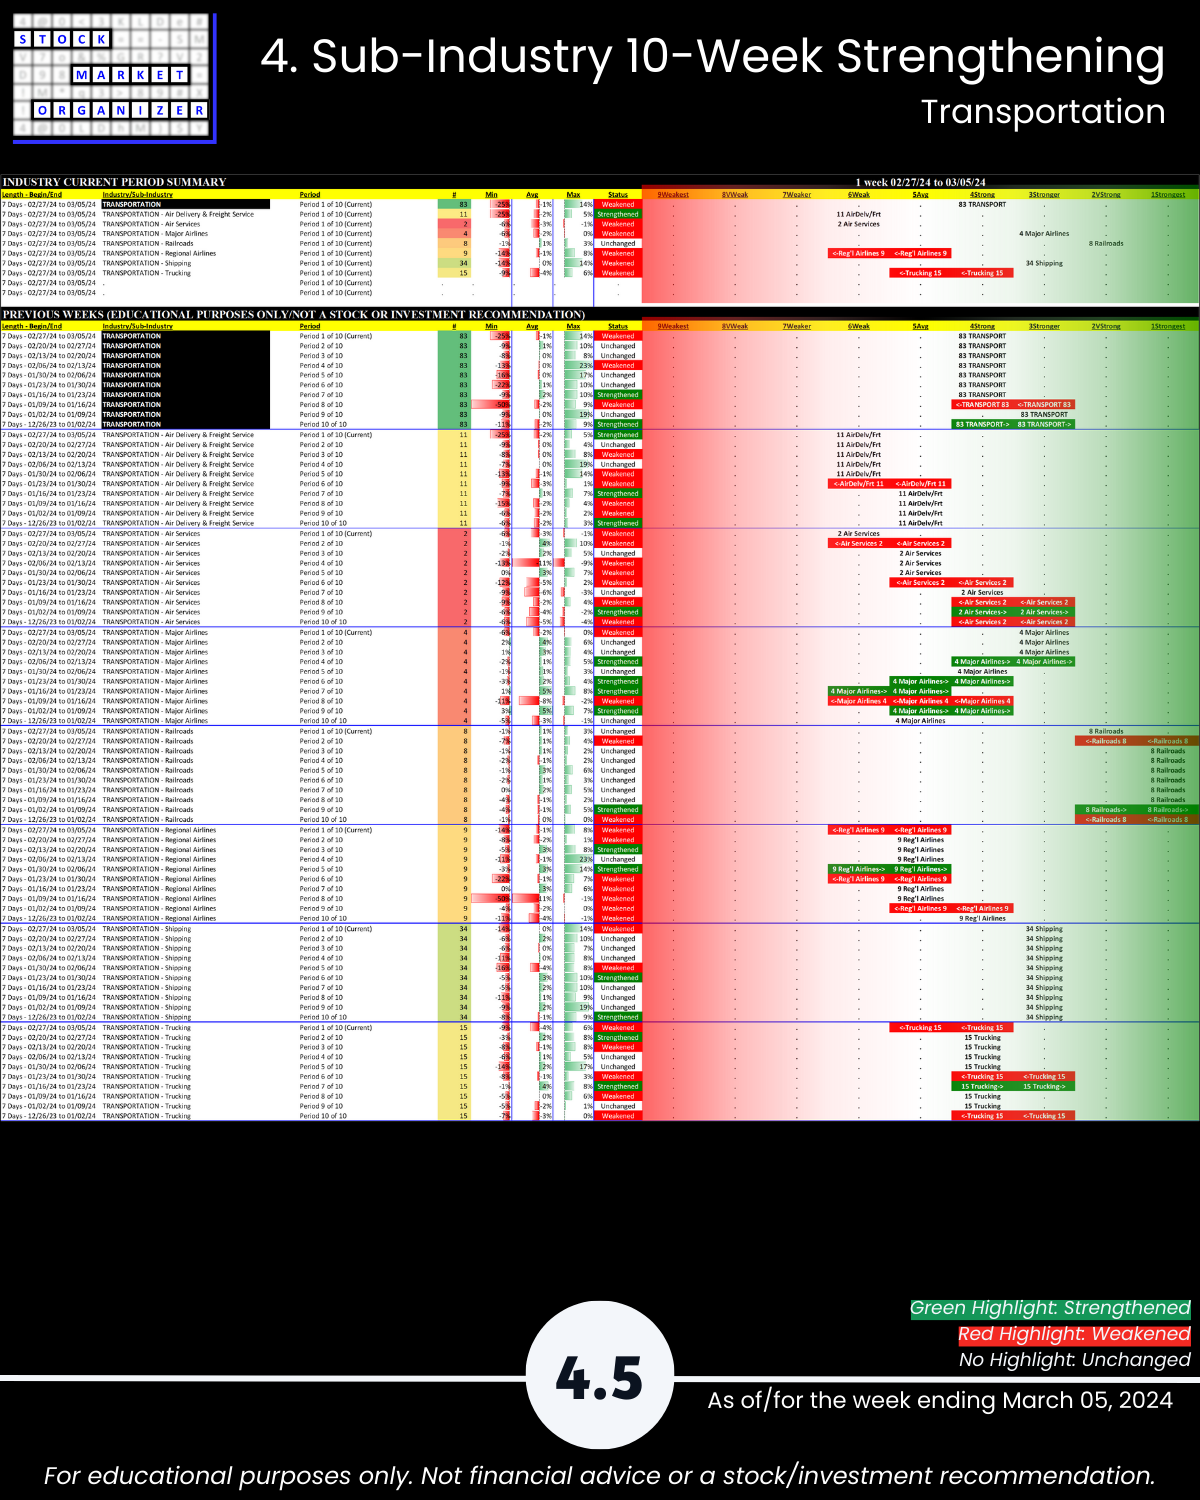
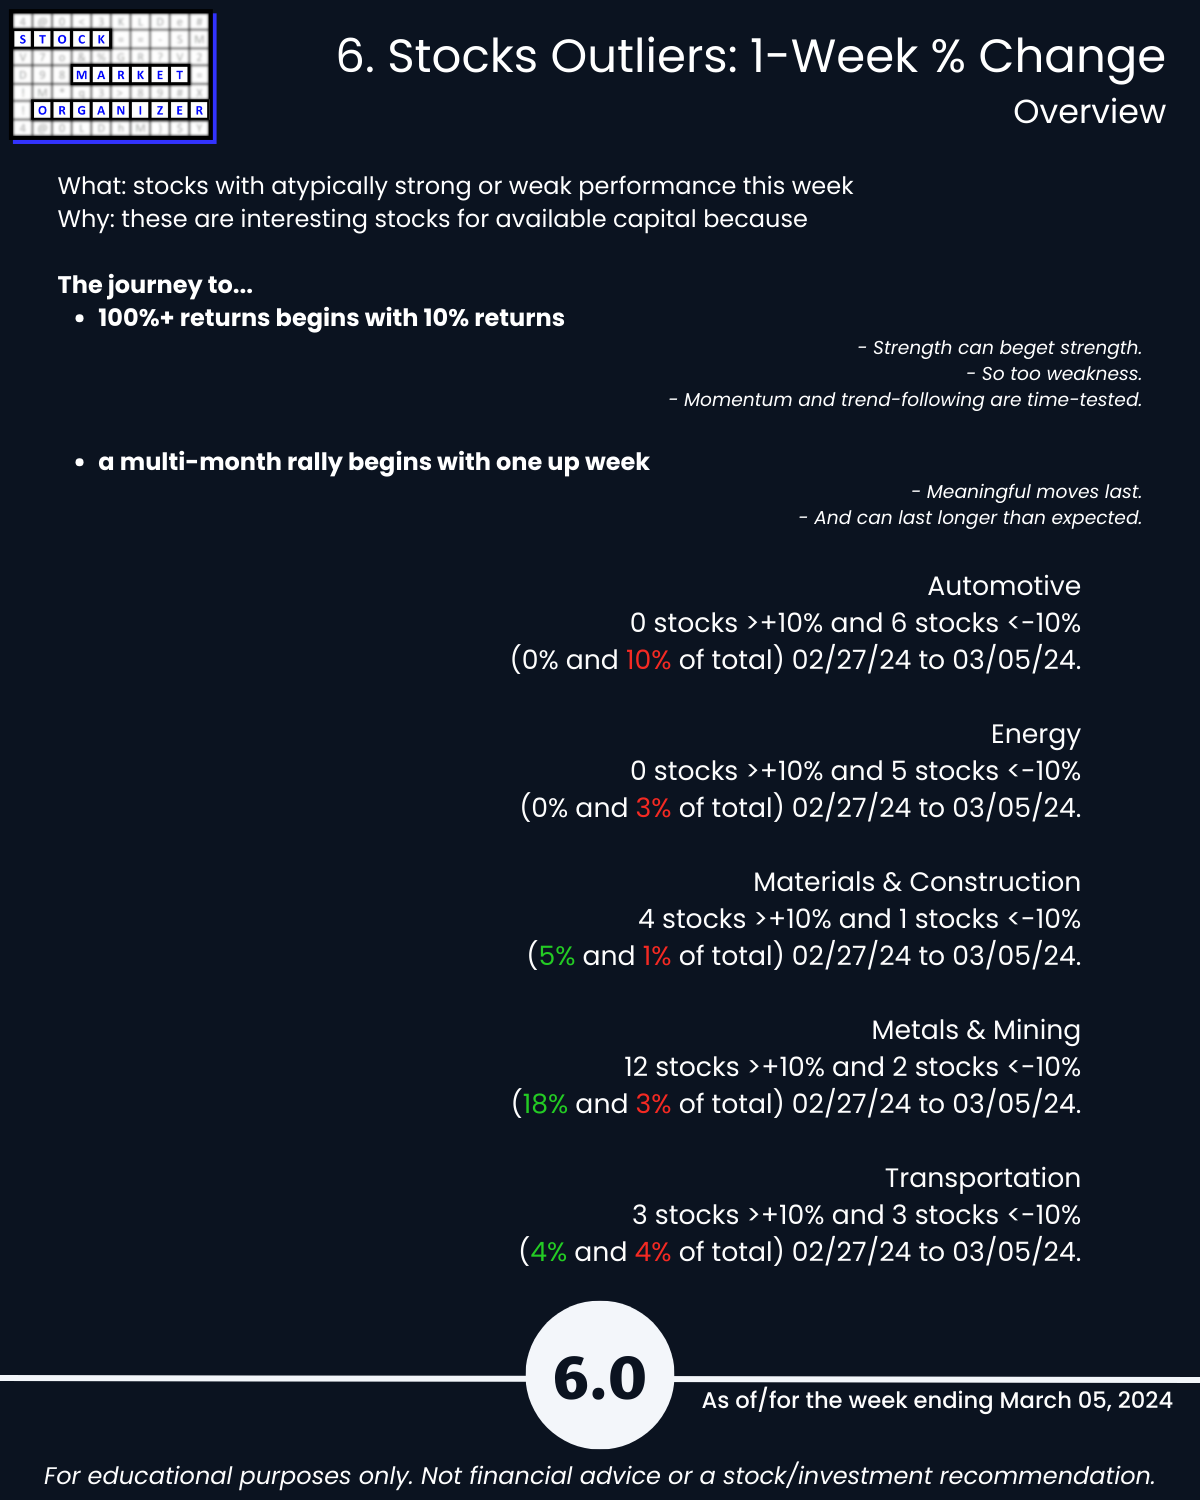
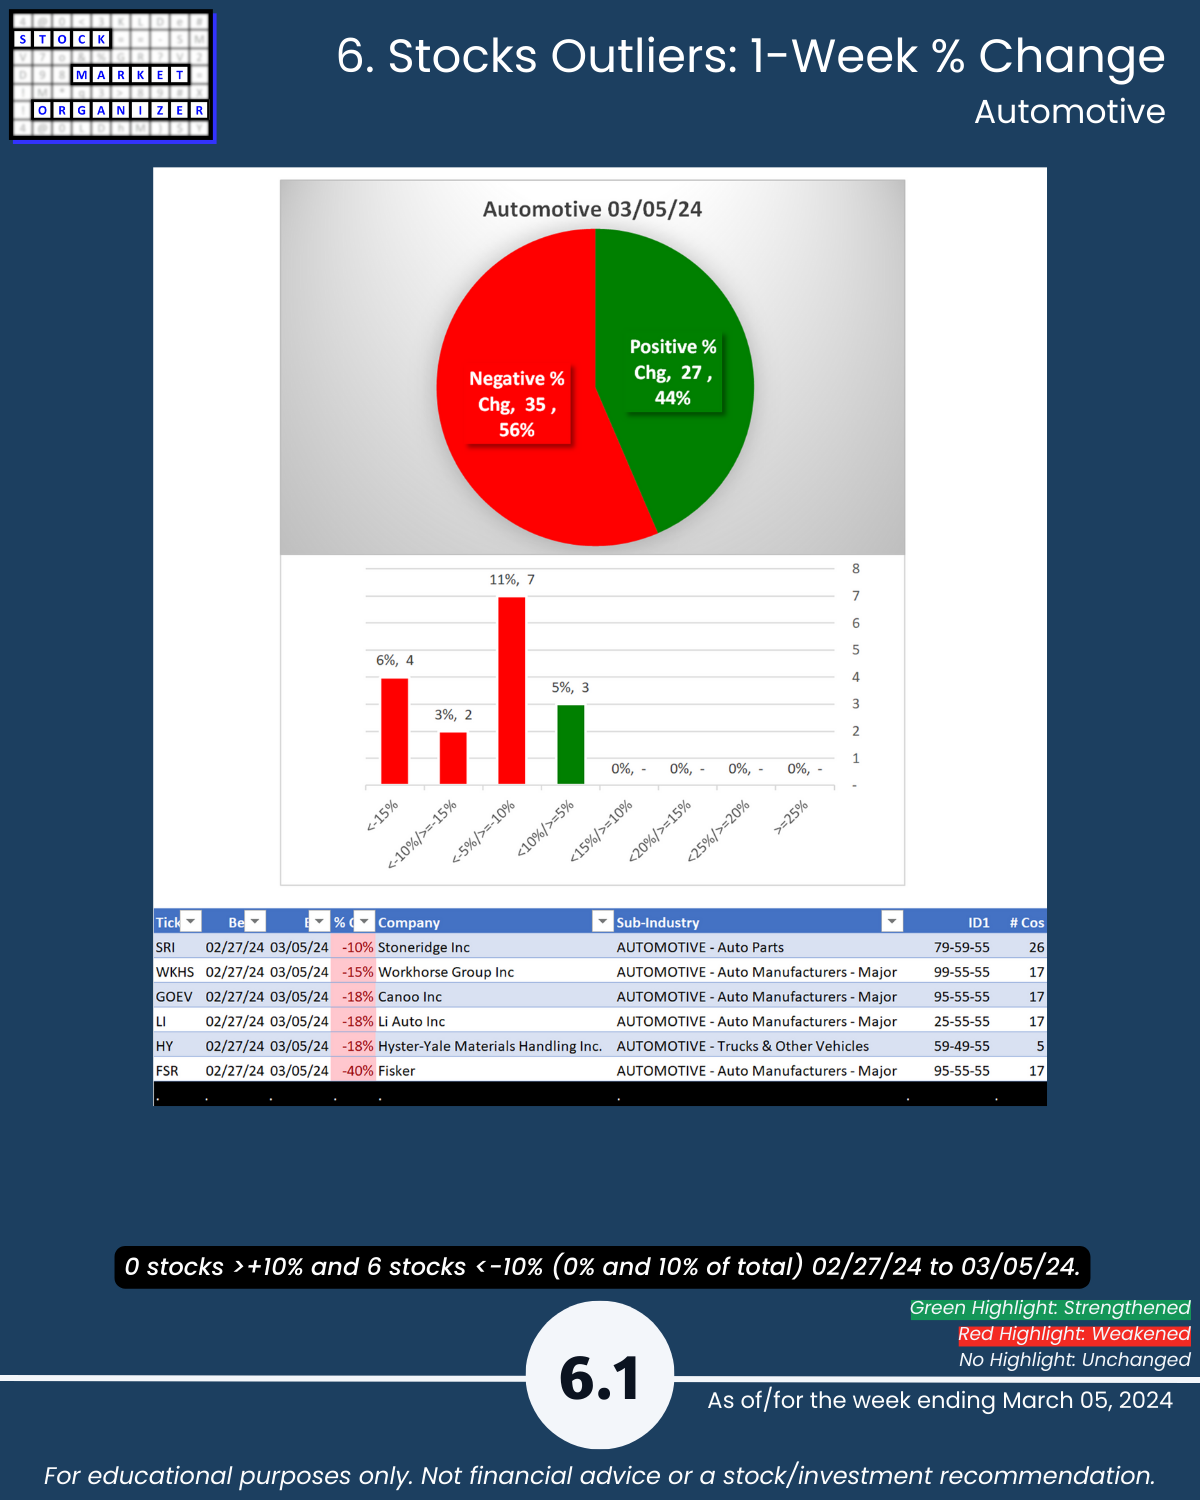
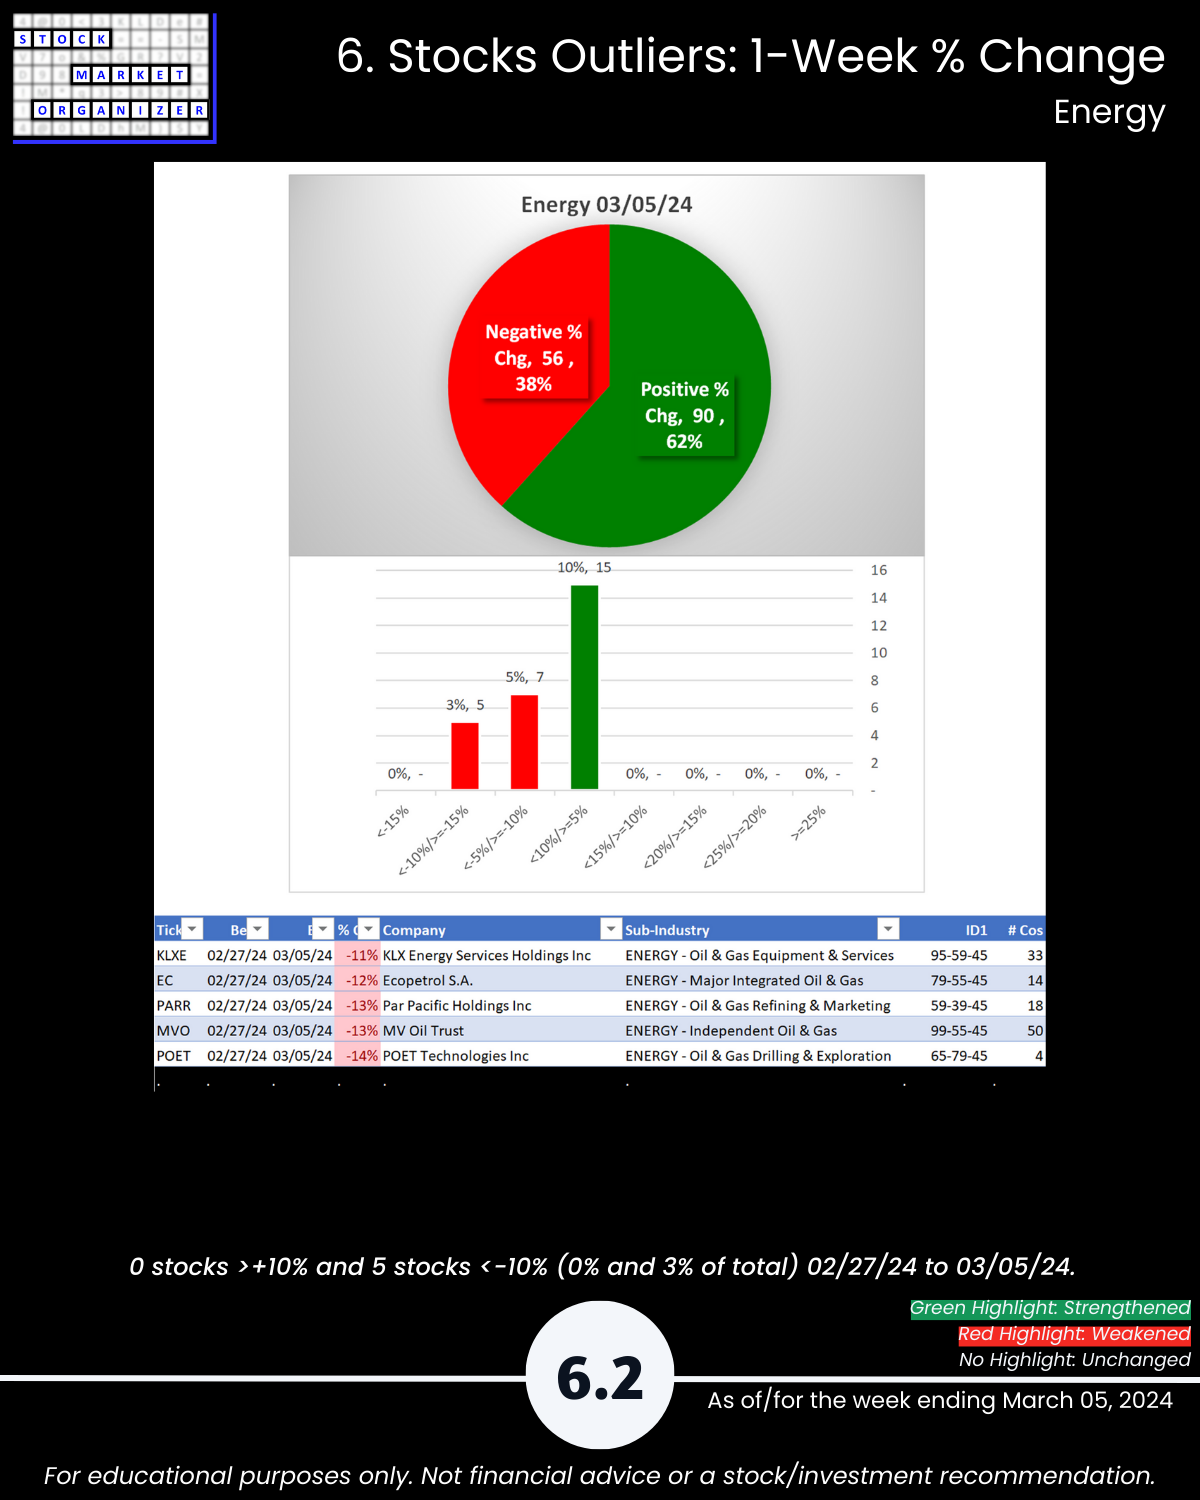
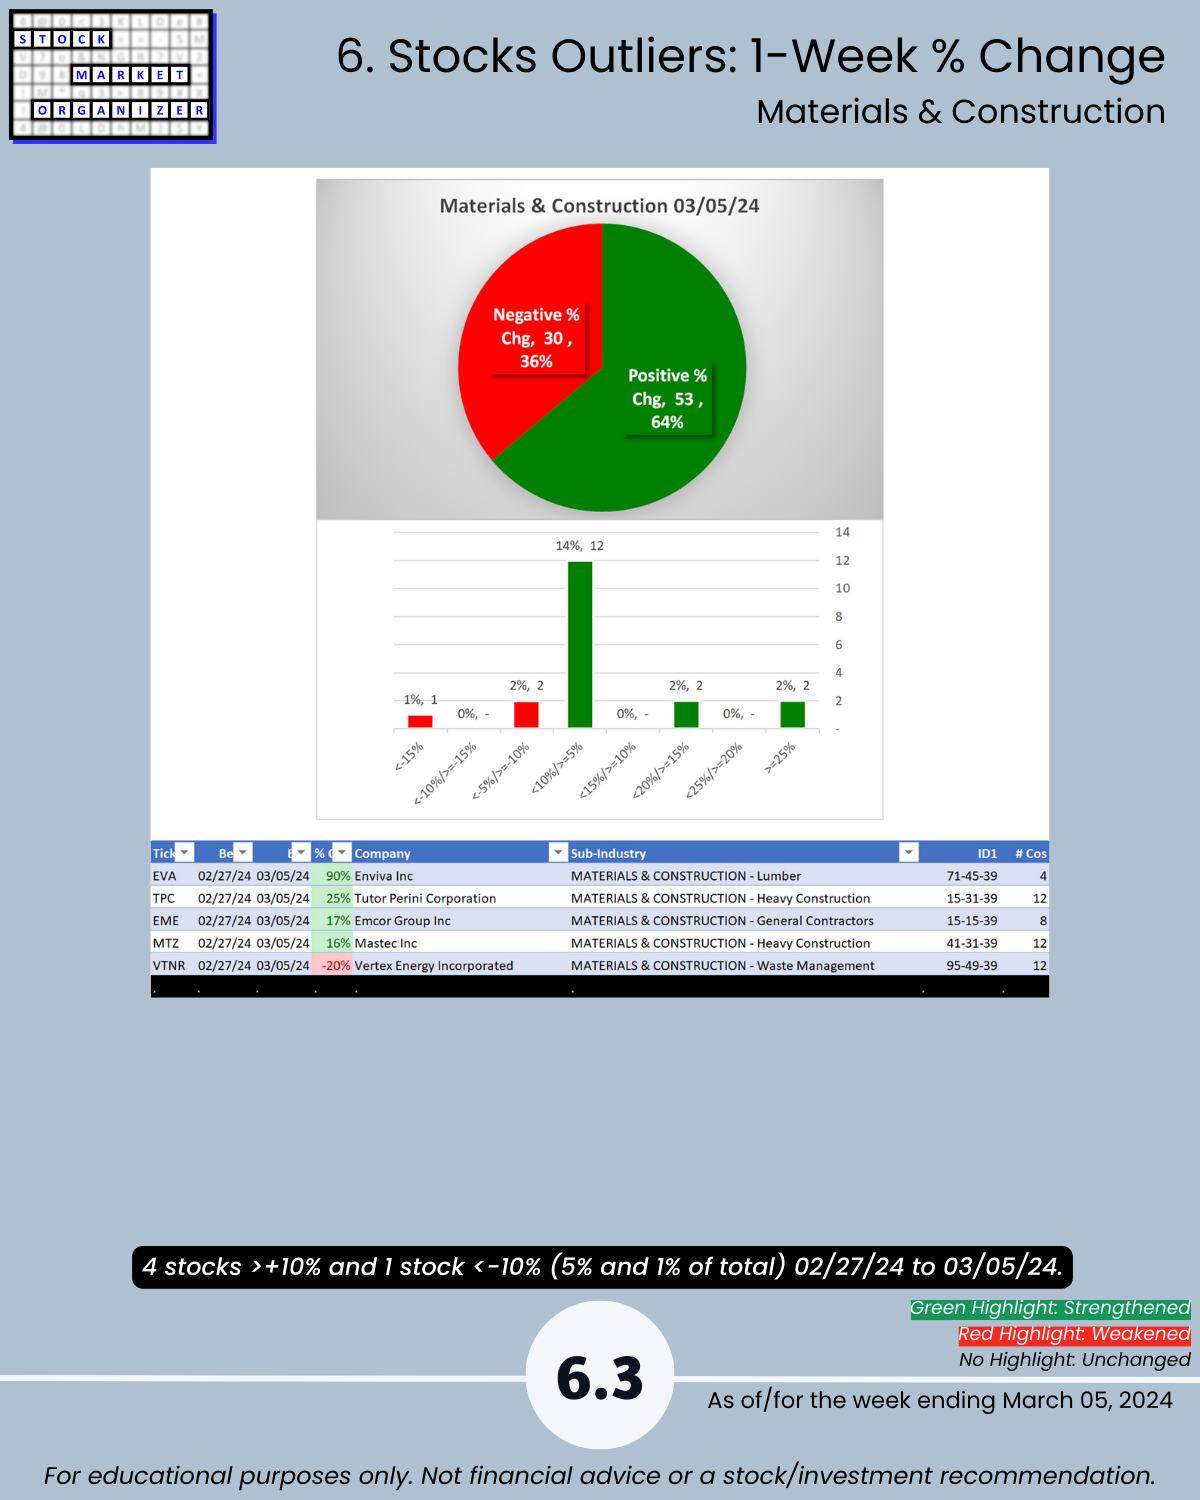
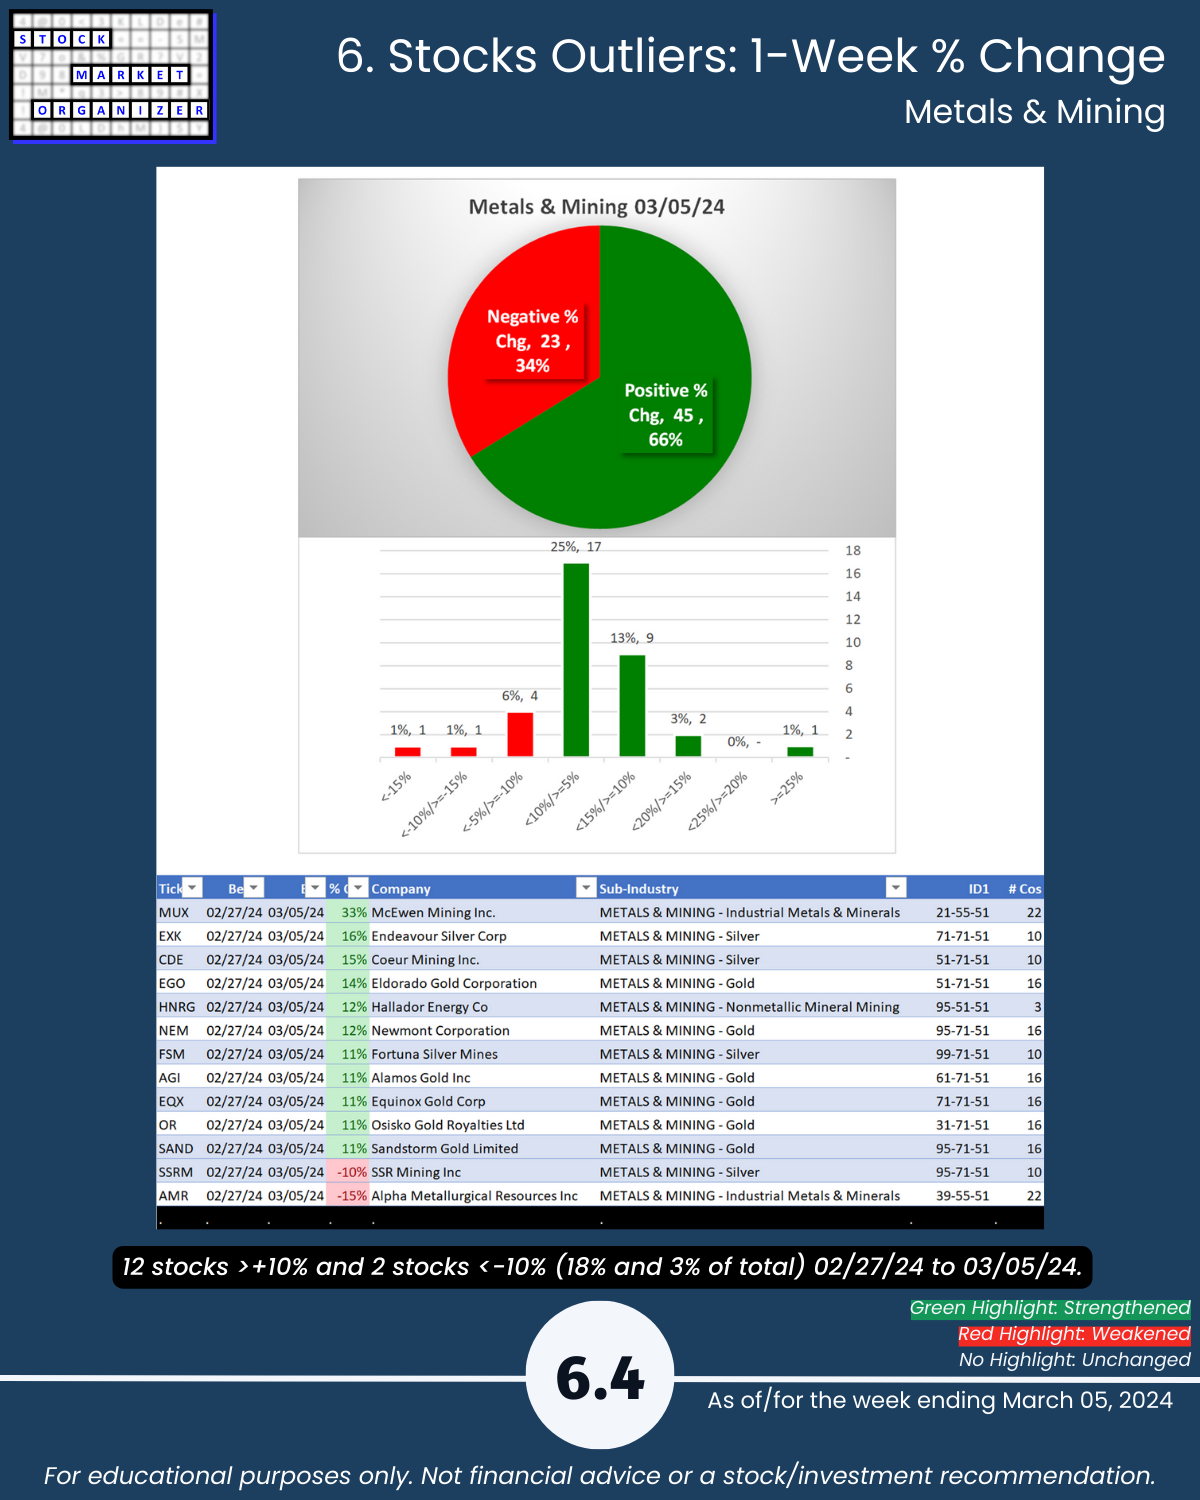
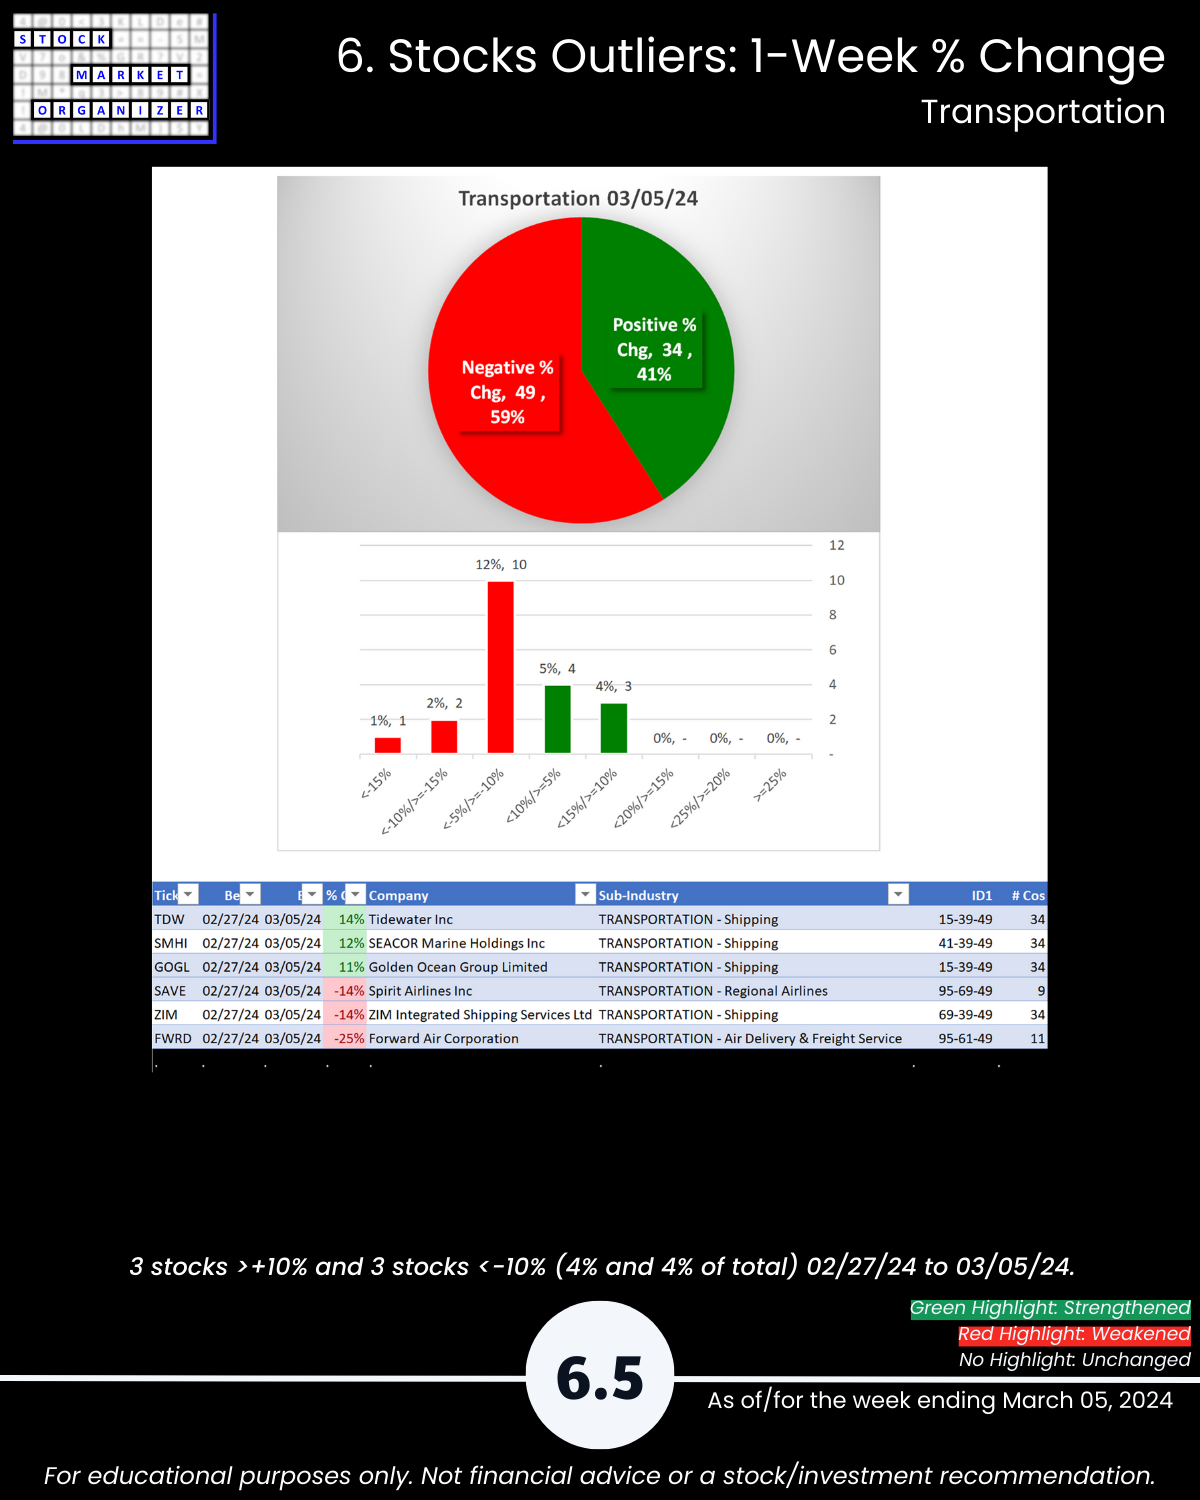
🔹 Outliers: 18% of Metals/Mining >10%; Transportation 59% negative stocks; FSR -40%, EVA +90%, TPC +25%, VTNR -20%, MUX +33%, FWRD -25%
🔹 5-Year Highs/Lows %: Materials & Construction 16% of stocks at highs
WHAT’S HAPPENING HERE AND WHY?
I’m comparing the strength of everything with everything to find existing and emerging pockets of strength at all levels of the stock market.
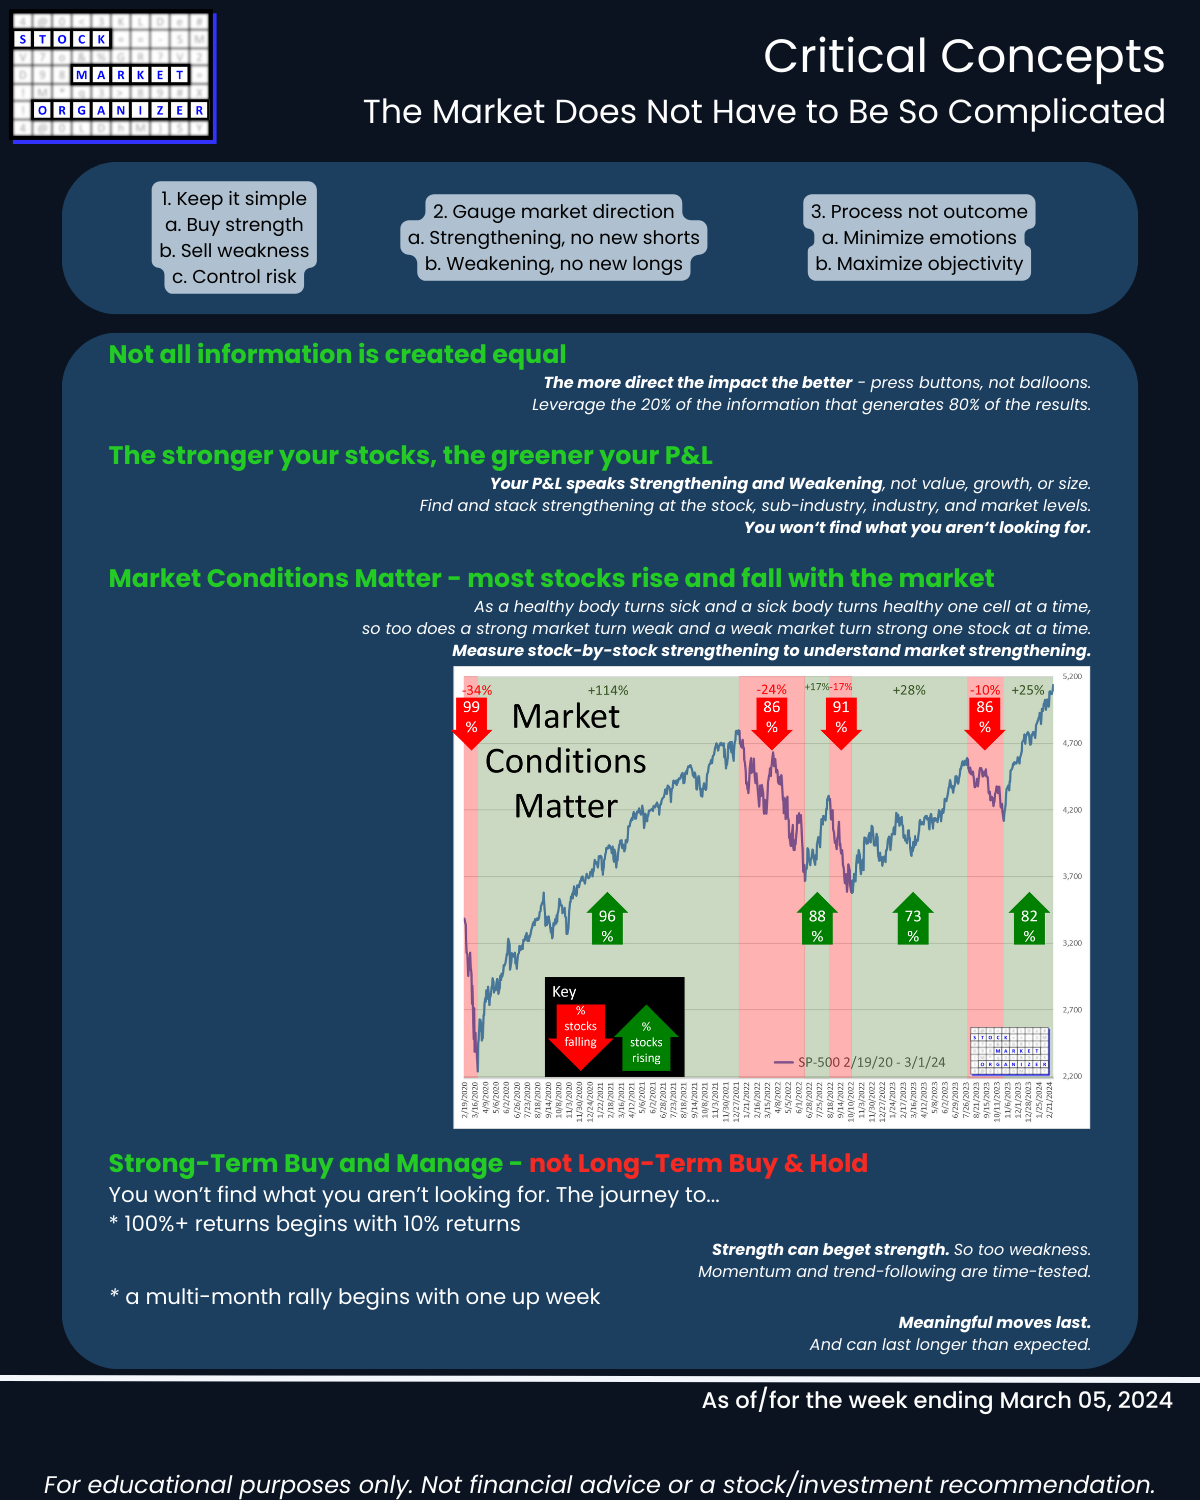
Most stocks do what the market does – Market Conditions Matter. Similarly, stocks will tend to do what their sub-industries and industries do.
Example: Manufacturing industry, 63% positive 1 year through 3/5/24:
Best POWL +265%
Worst CHPT -82%
10%: 44% of stocks
25%: 30%
50%: 13% (1 in 8)
It’s not just about AI.
SO WHAT?
Through tracking strengthening/weakening from the individual stock through overall market levels, you know:
🔹 The strongest stocks in each industry. Helpful for “the stronger your stocks, the greener your P&L” believers.
🔹 Whether sub-industries and industries are currently strengthening. “The trend is your friend” applies to sub-industries and industries too.
It really doesn’t have to be so complicated.
This report may particularly be of interest if the following 5 concepts resonate with you:
- The stronger your stocks, the greener your P&L.
- The journey to 100%+ returns begins with 10% returns.
- The journey to a multi-month rally begins with one up week.
- Most stocks do what the market does. (While the market can only do what its underlying stocks, sub-industries, and industries do.)
- 80/20: not all information is created equal. (Press buttons, not balloons.)
Following are galleries with page-by-page views of this report.
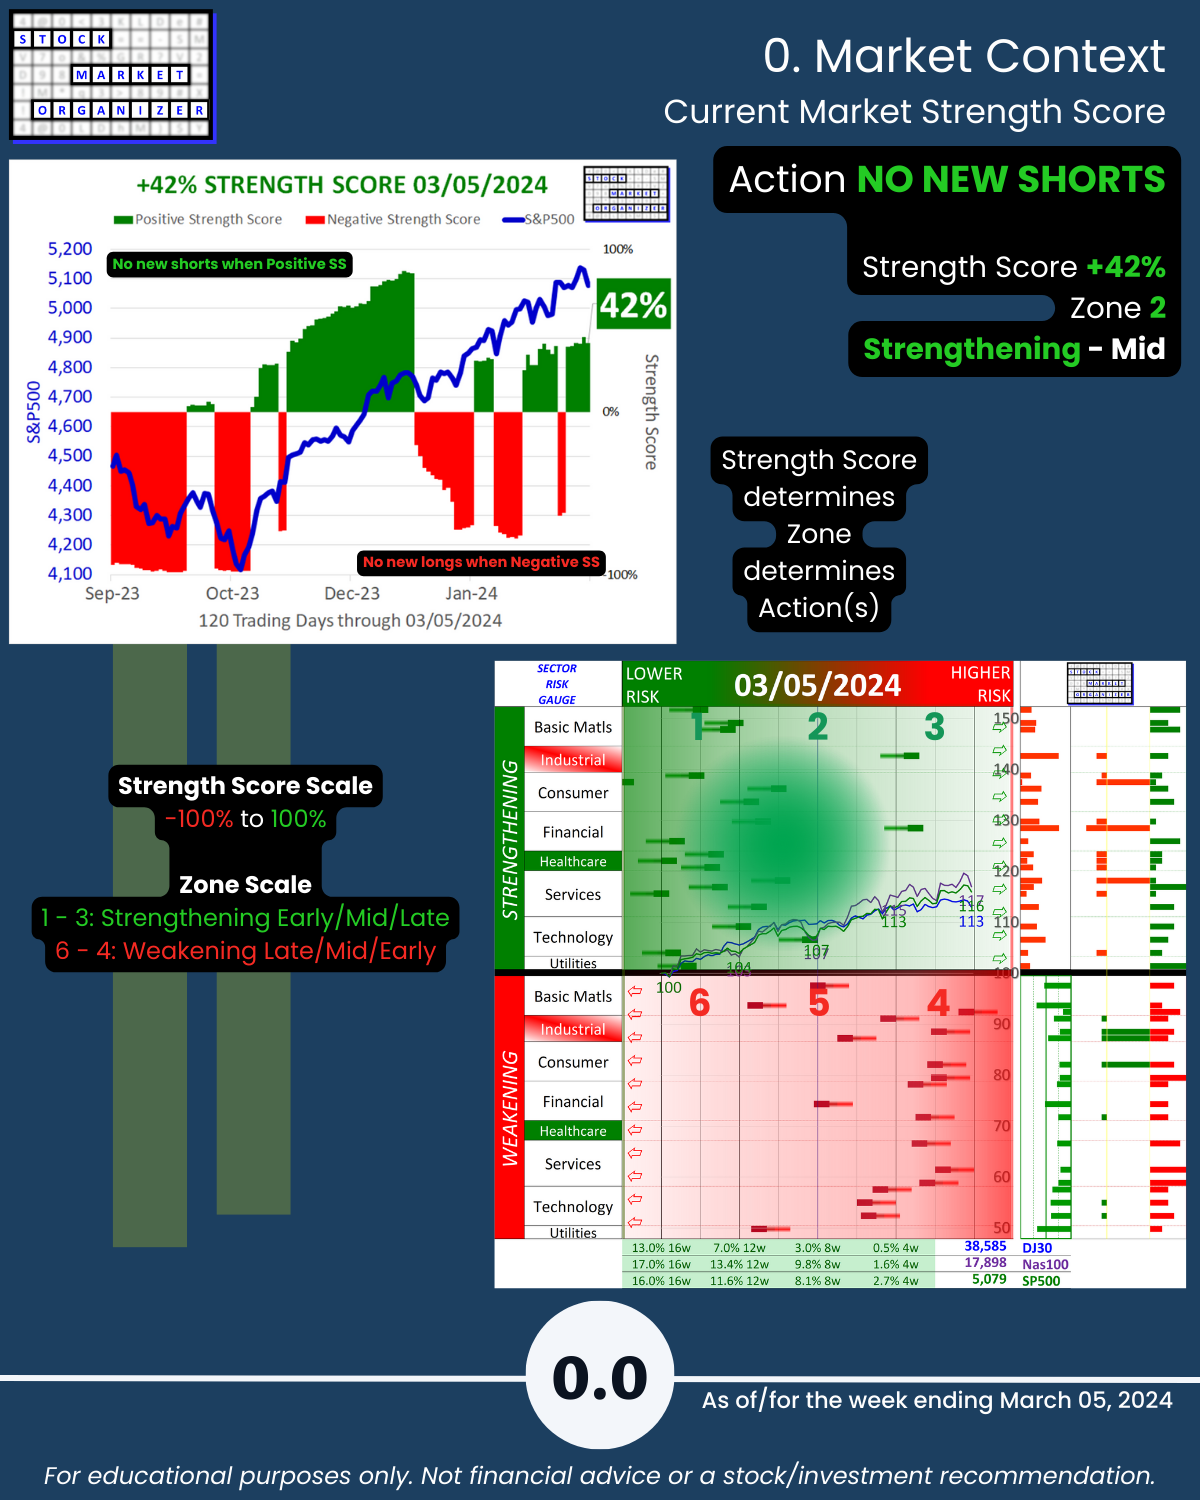
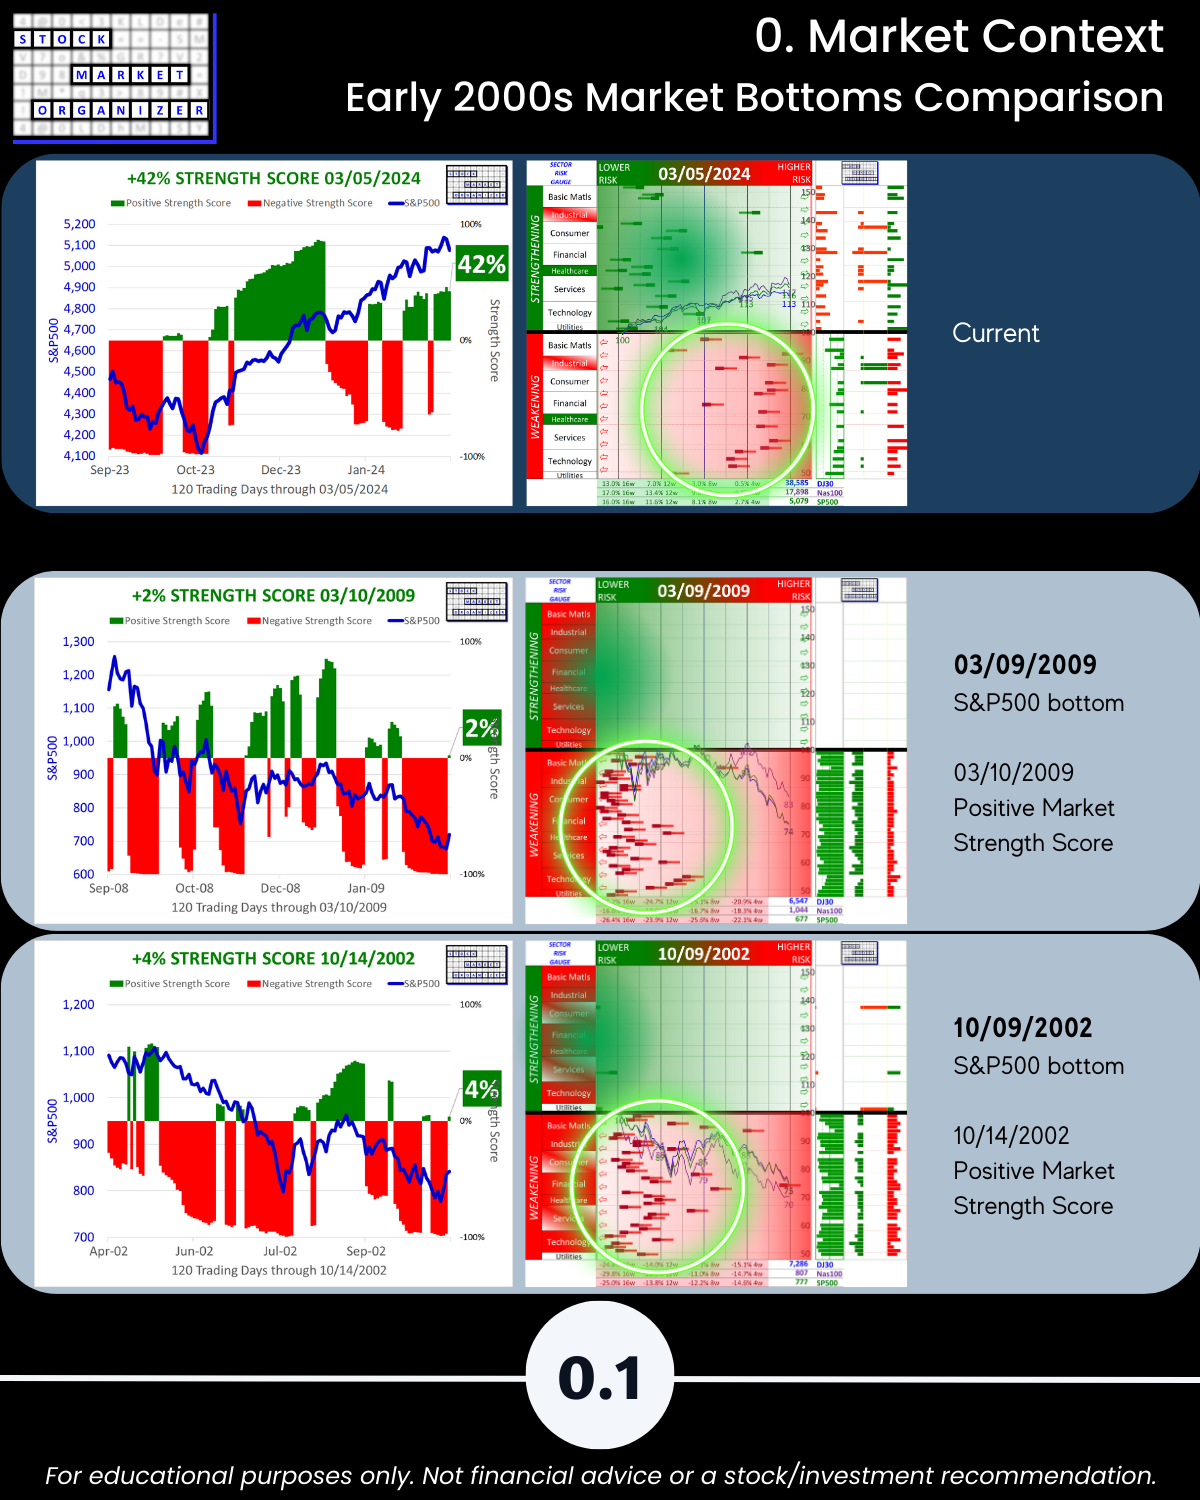
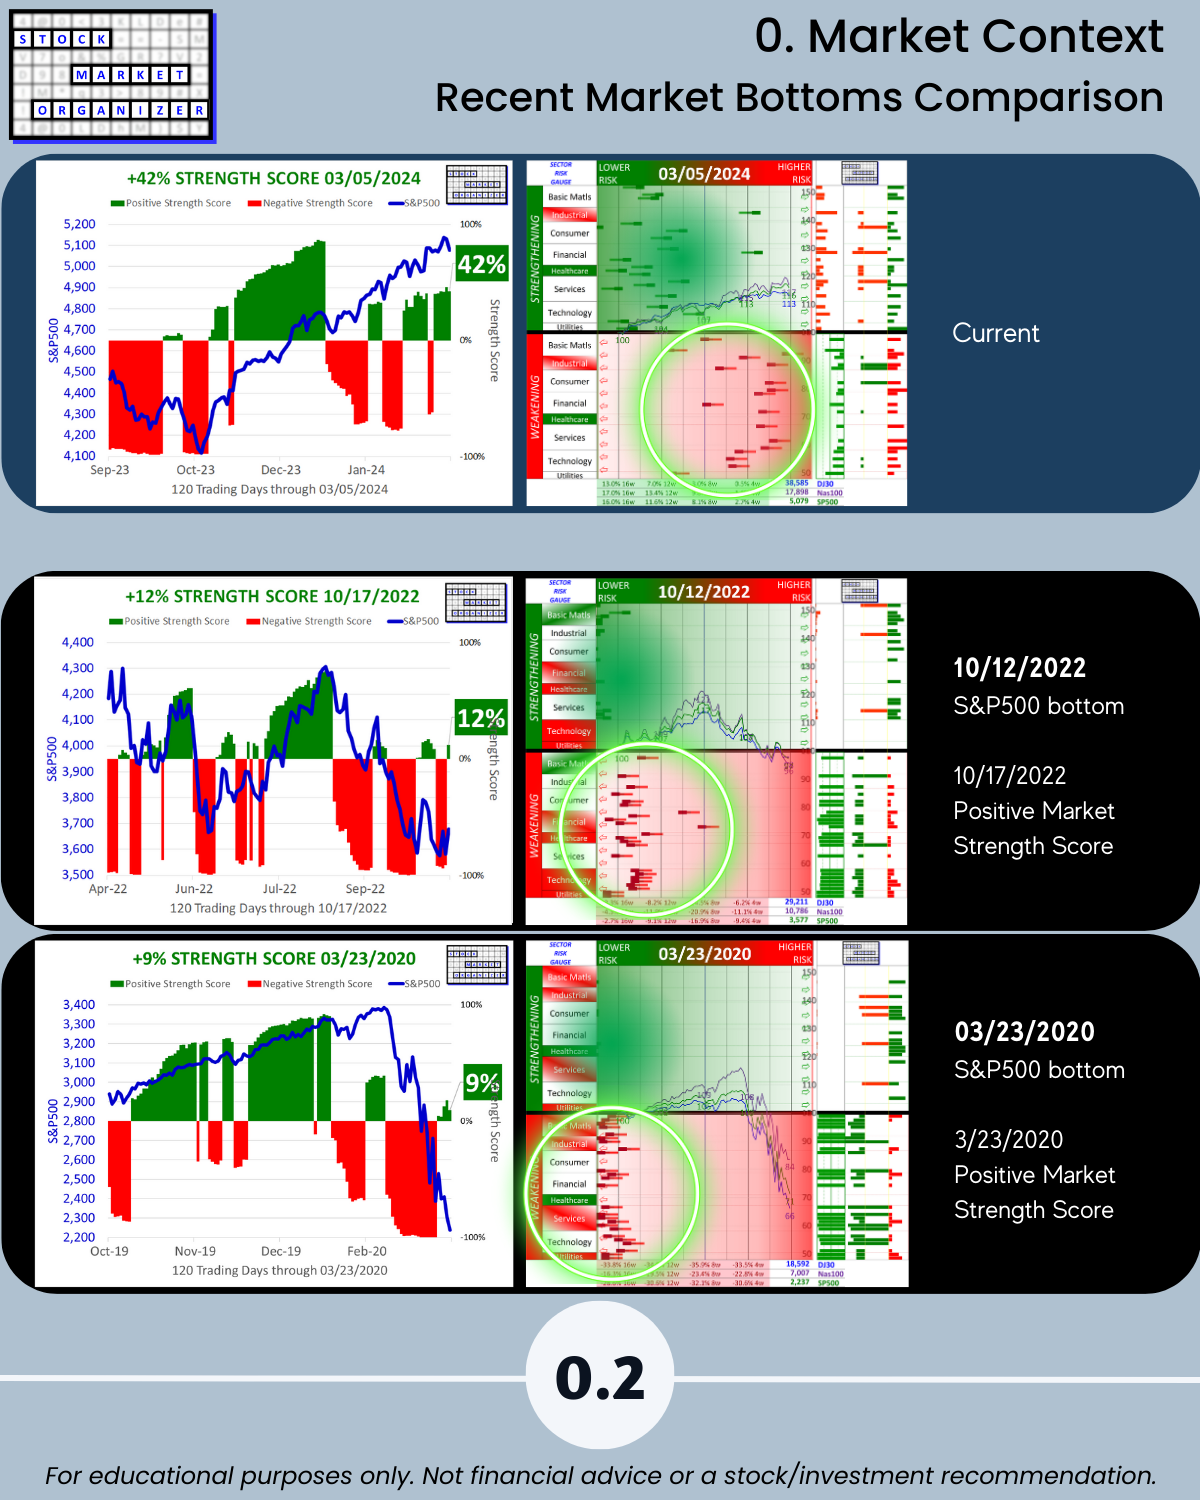
0. Market Context
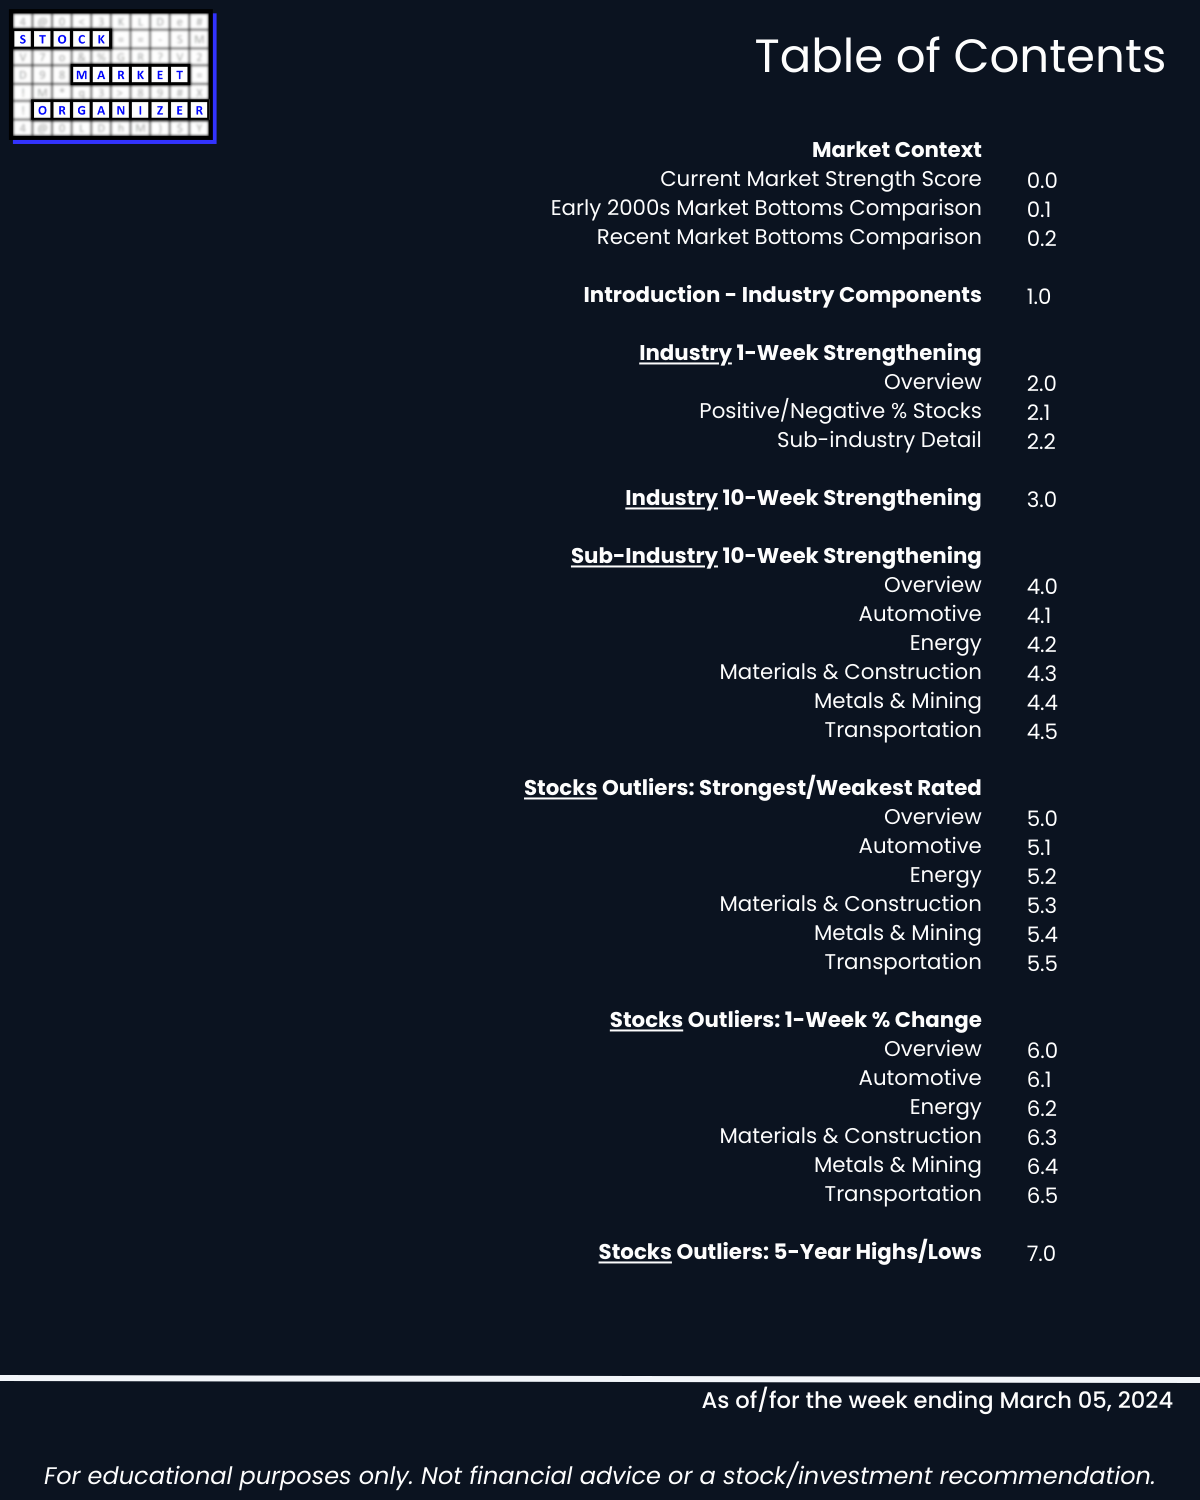
1. Introduction
2. Industry 1-Week Strengthening
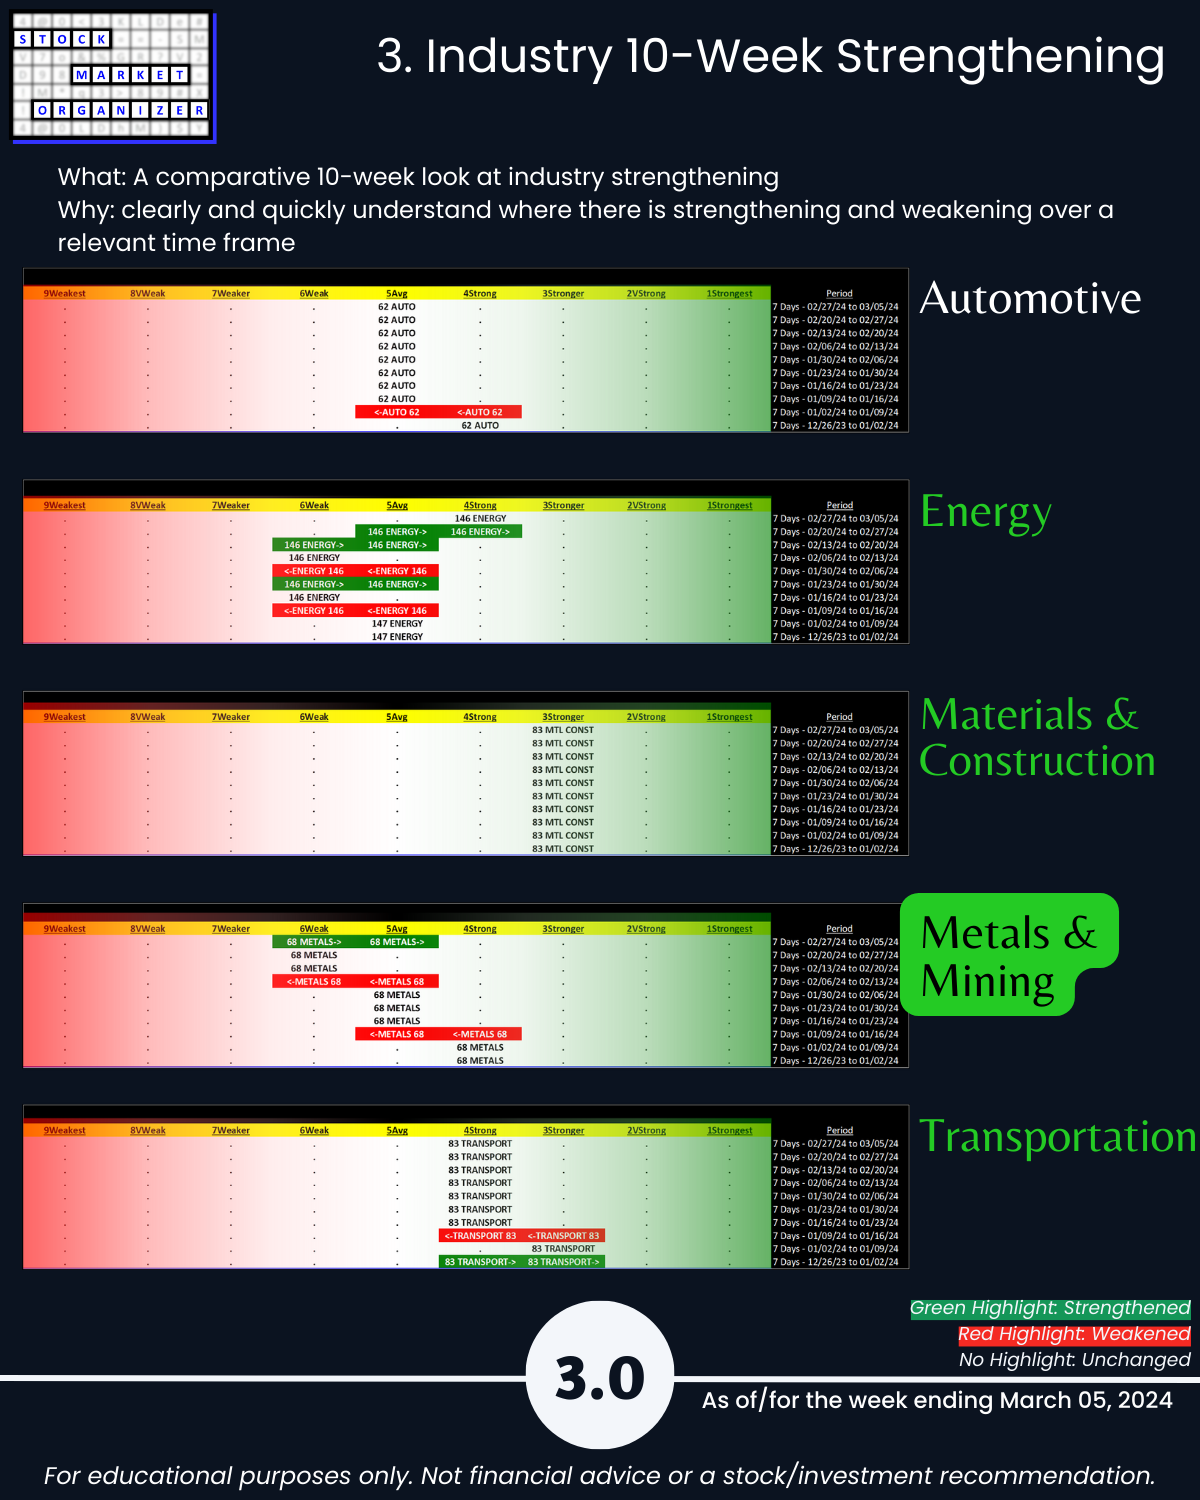
3. Industry 10-Week Strengthening
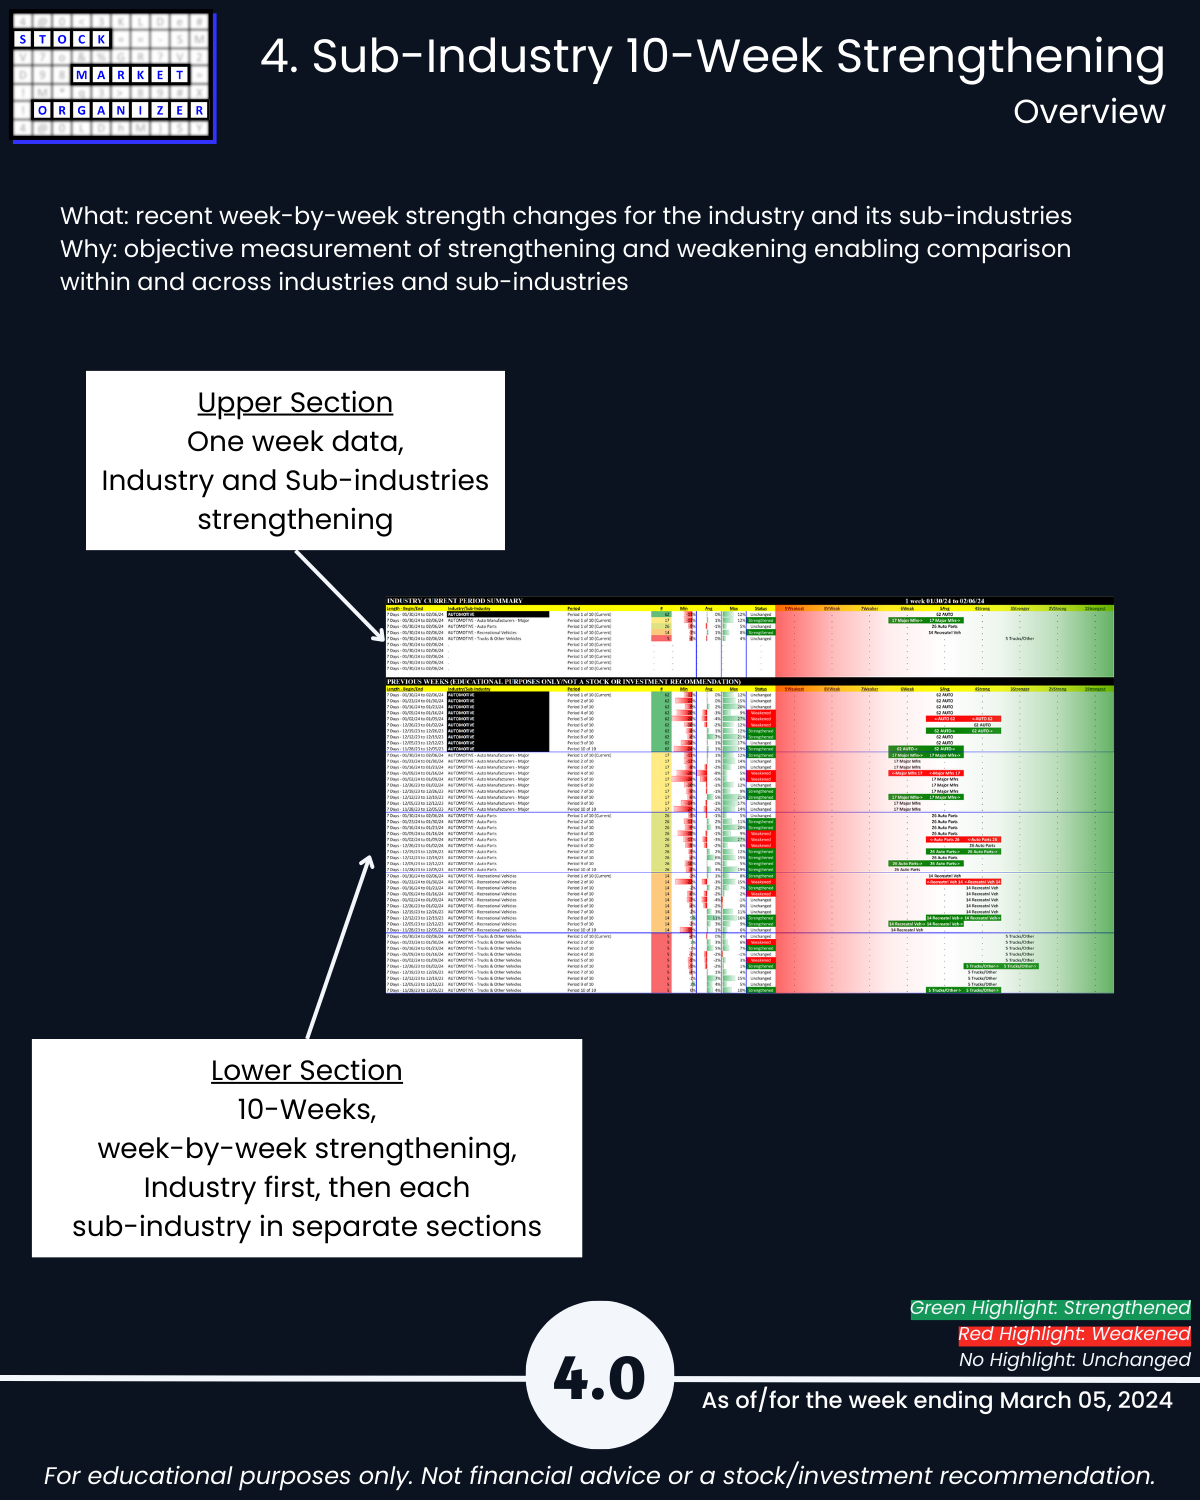
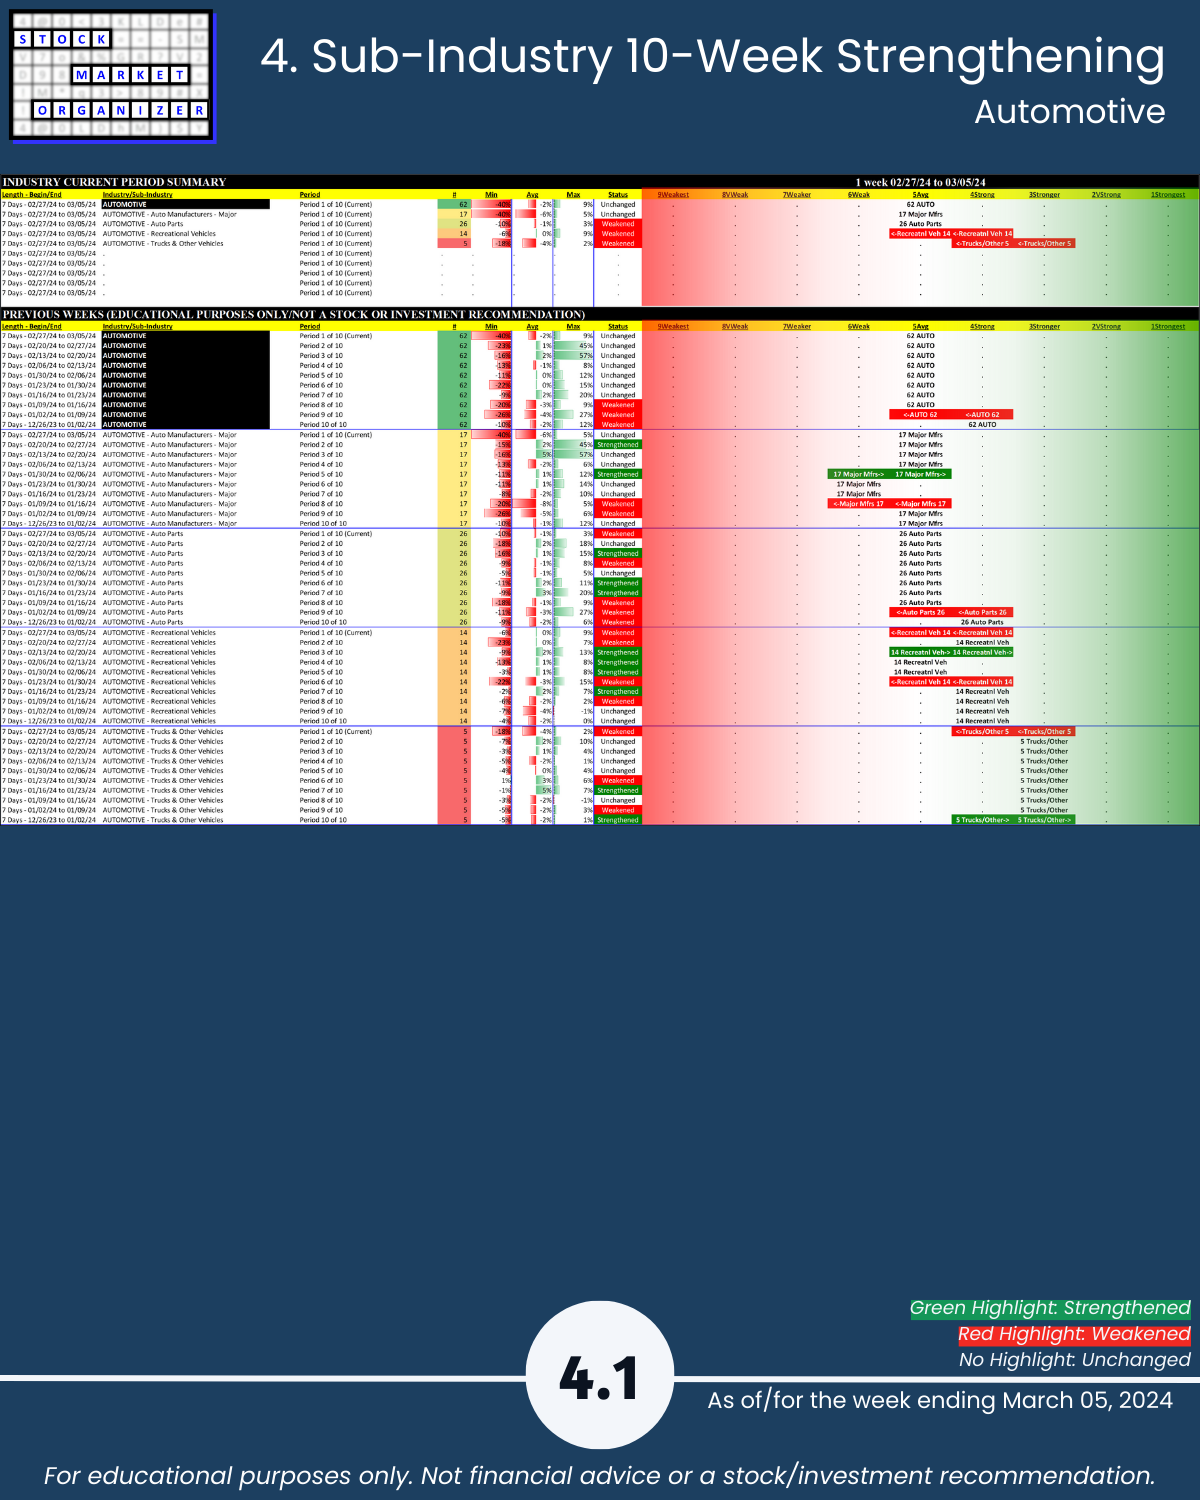
4. Sub-Industry 10-Week Strengthening
5. Stocks Outliers: Strongest/Weakest Rated
6. Stocks Outliers: 1-Week % Change
7. Stocks Outliers: 5-Year Highs/Lows