SMO Exclusive: Strength Report Group 1 2024-02-20

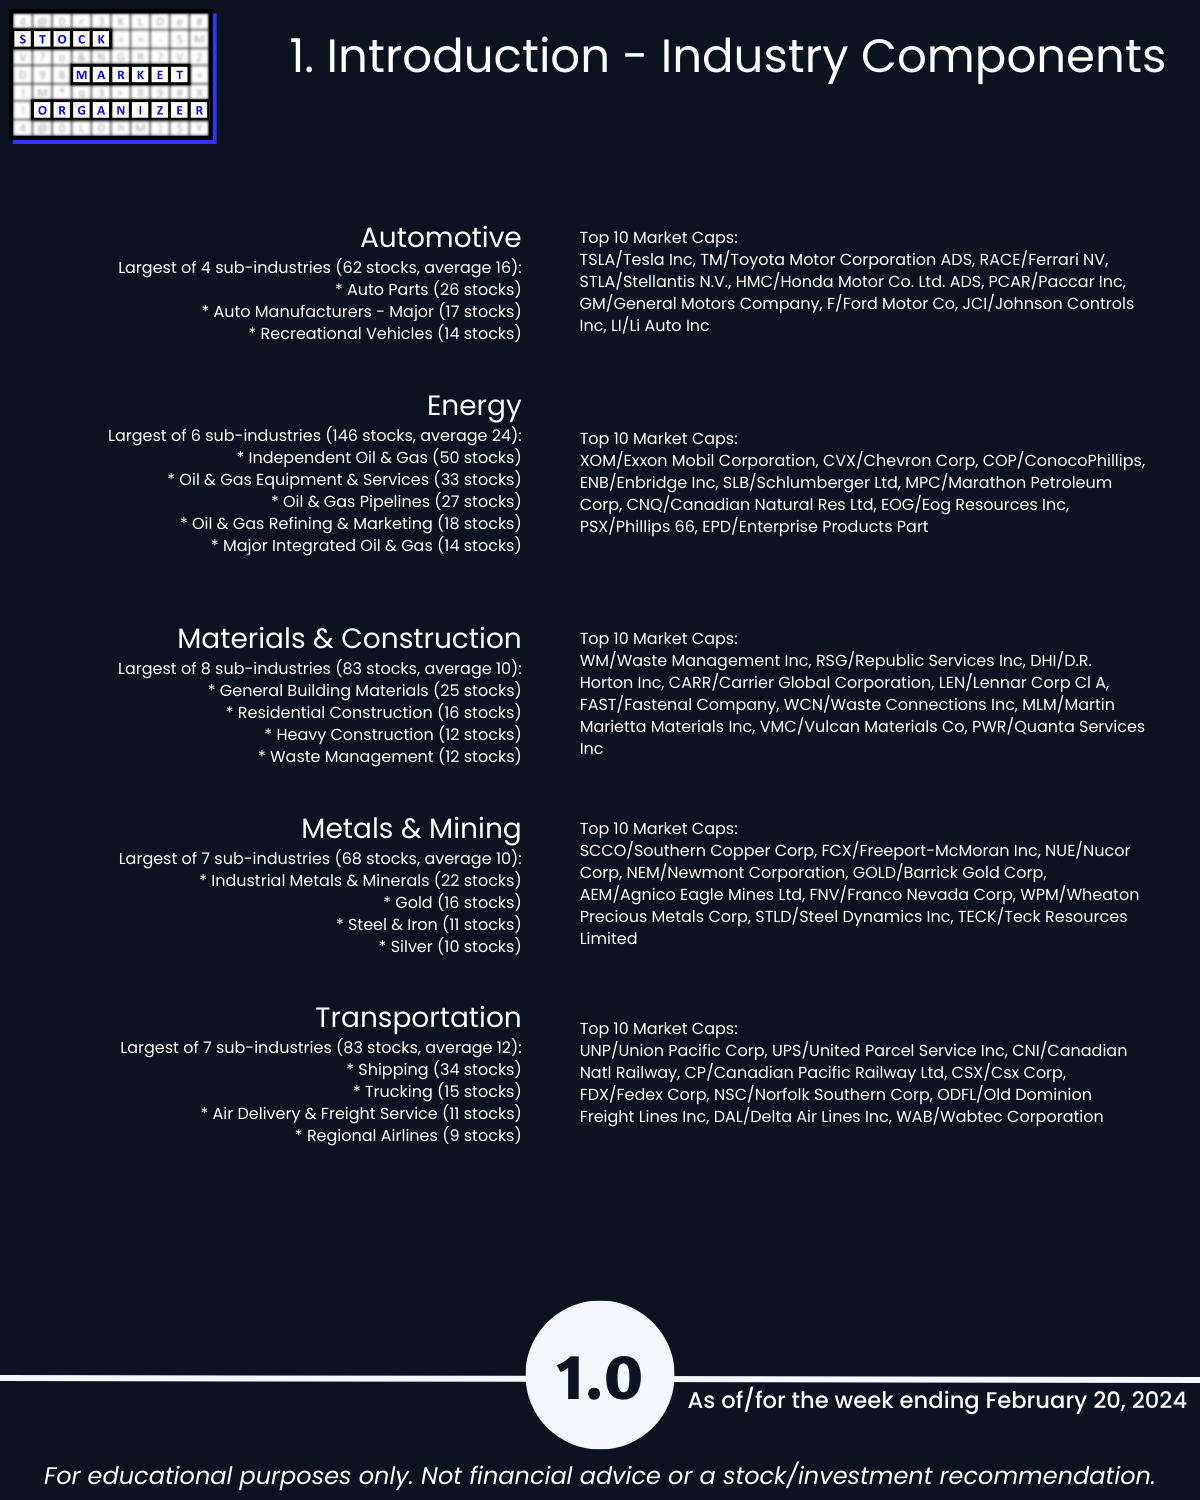
U.S. stock market… if you aren’t explicitly looking everywhere for strength, how will you know where and when the next pocket of strength is emerging? Today 2/20/24: analysis of Group 1 industries (Automotive, Energy, Materials & Construction, Metals & Mining, and Transportation).
Want strength?
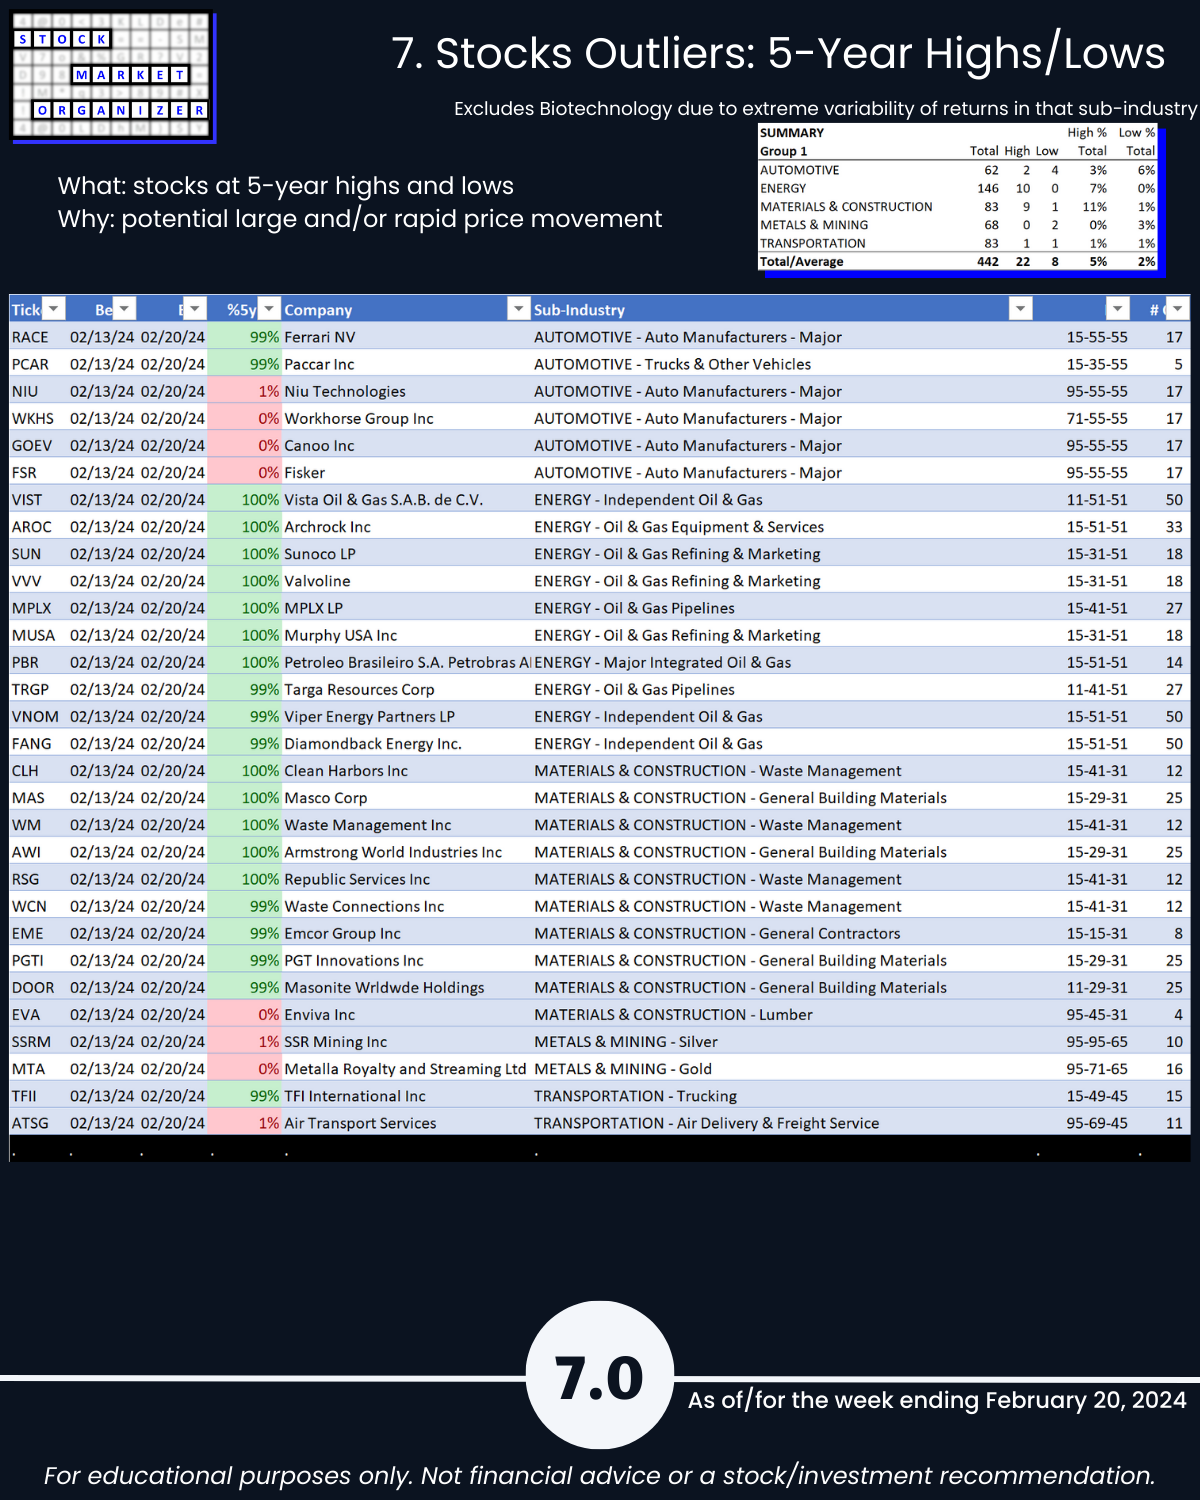
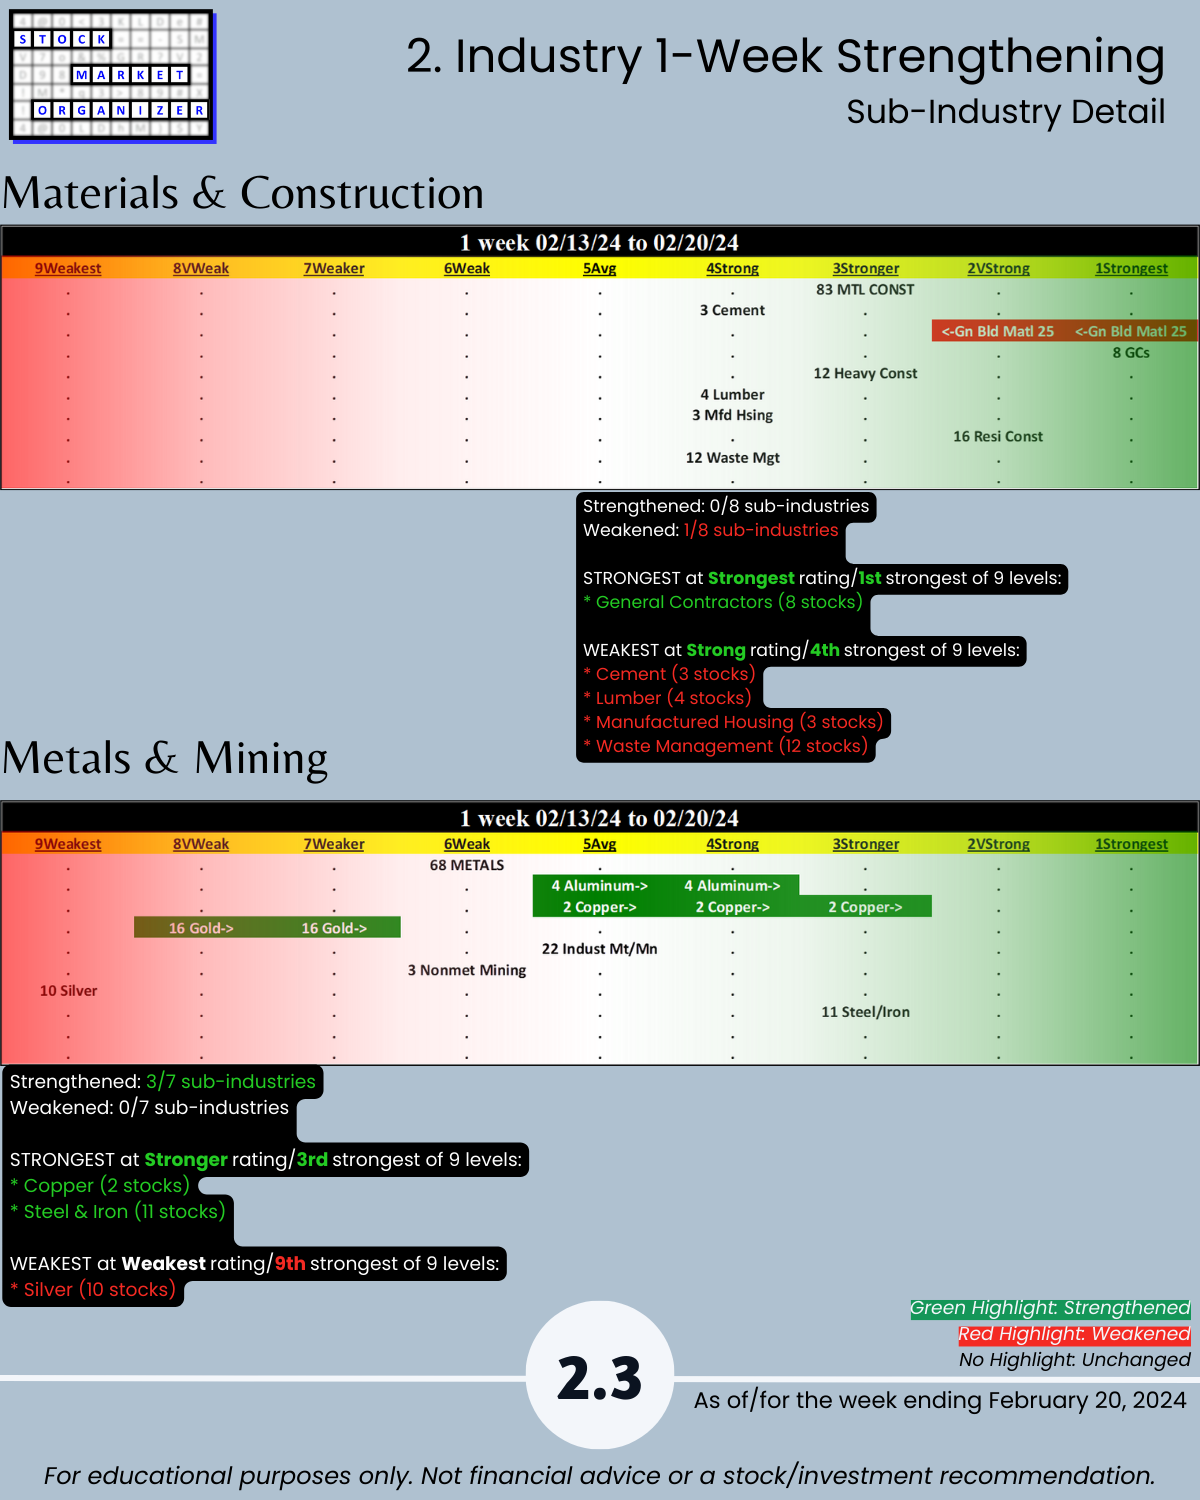
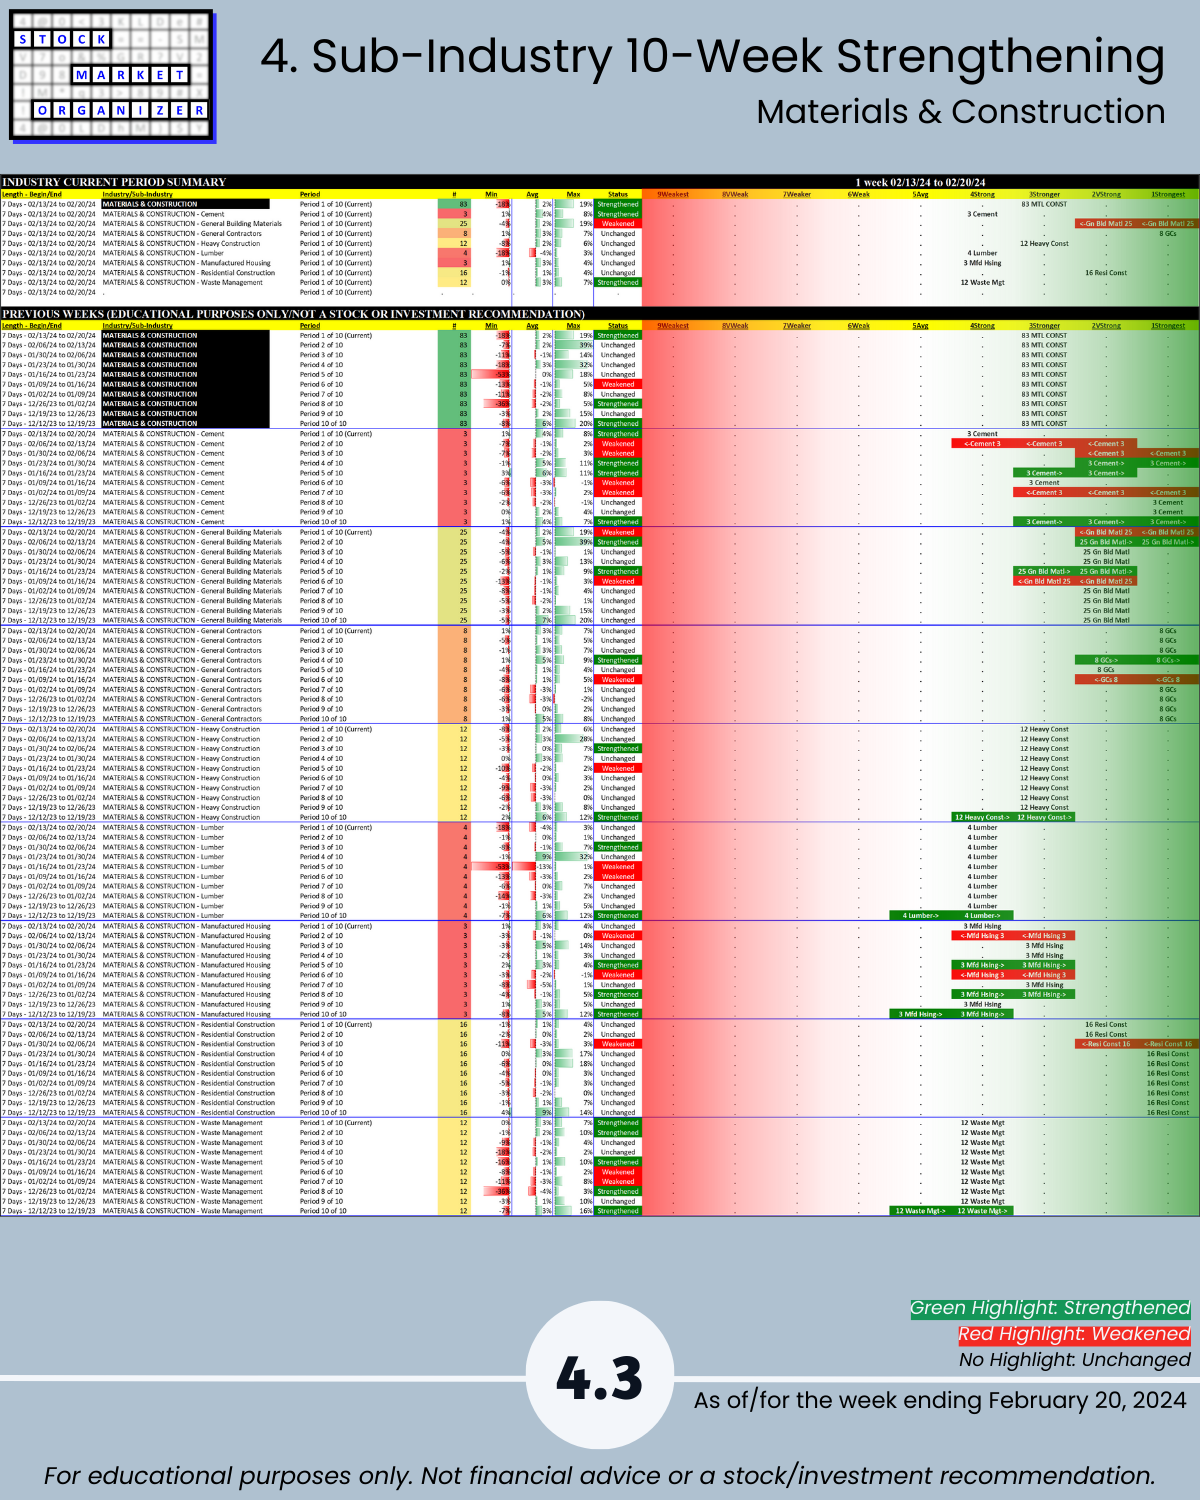
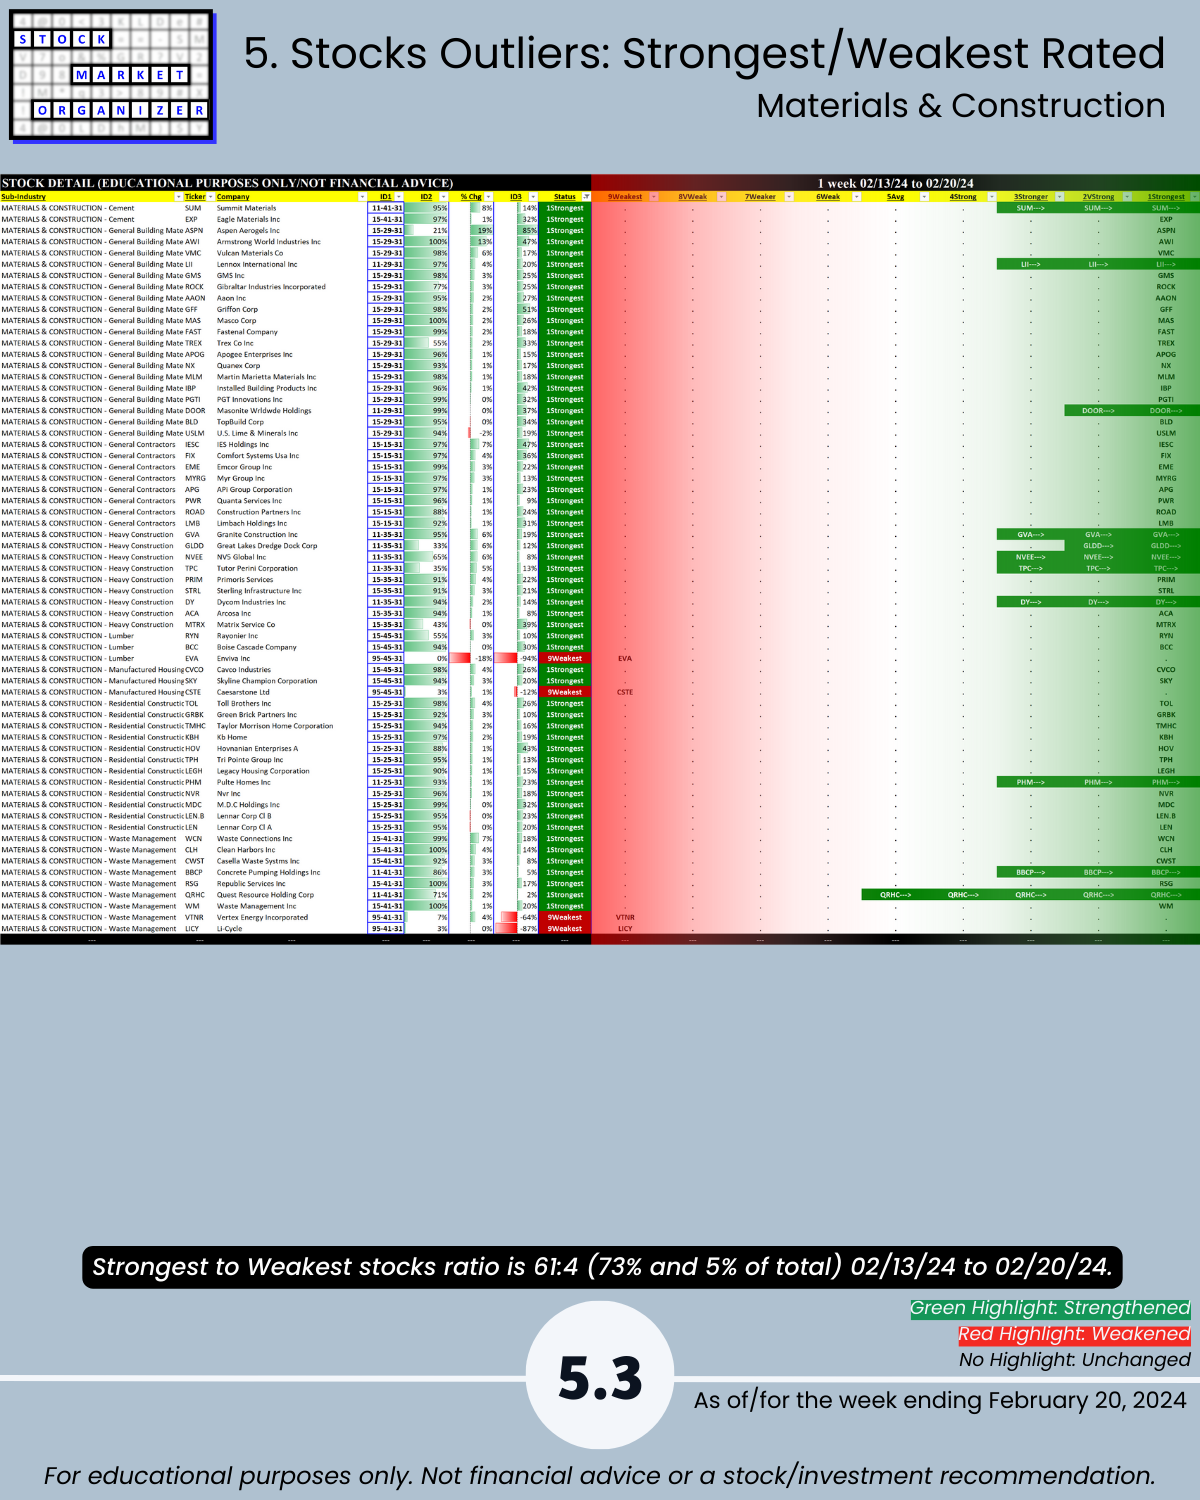
🔹 Waste Management sub-industry in Materials & Construction industry: 4 stocks at all-time highs (page 7.0, multi-year high/low stocks).
🔹 1-year returns in these industries: 100 of 442 stocks > 40%.
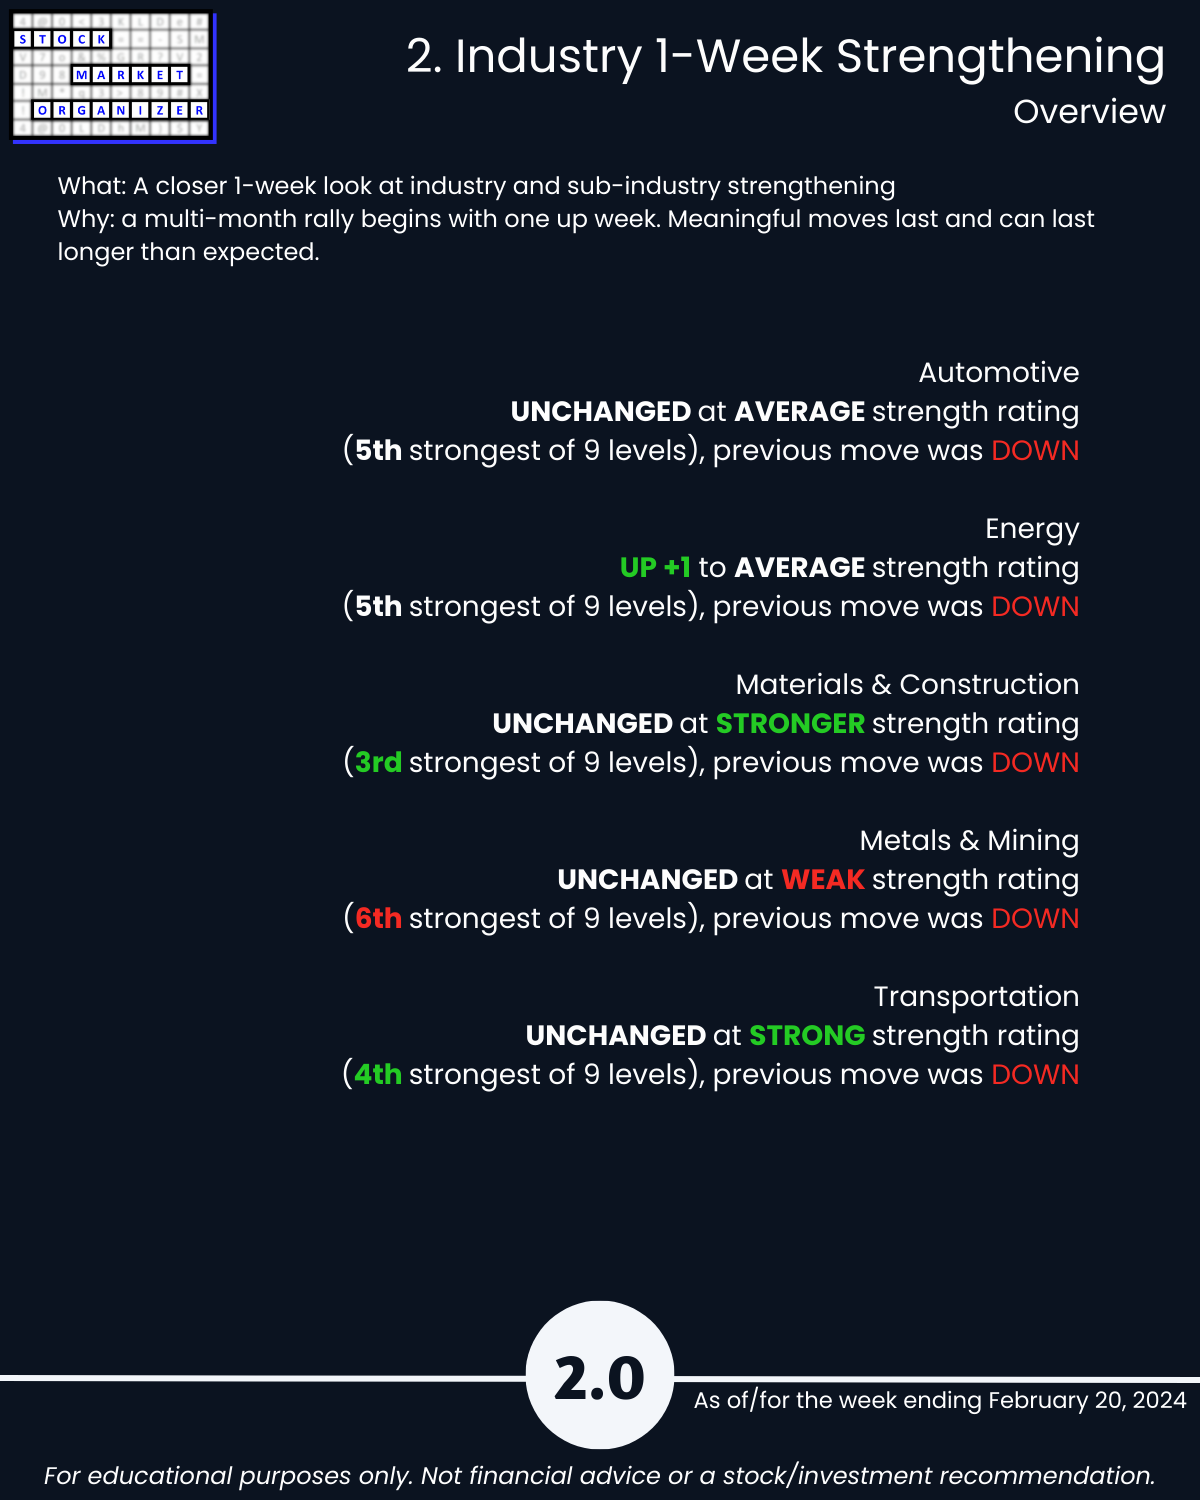
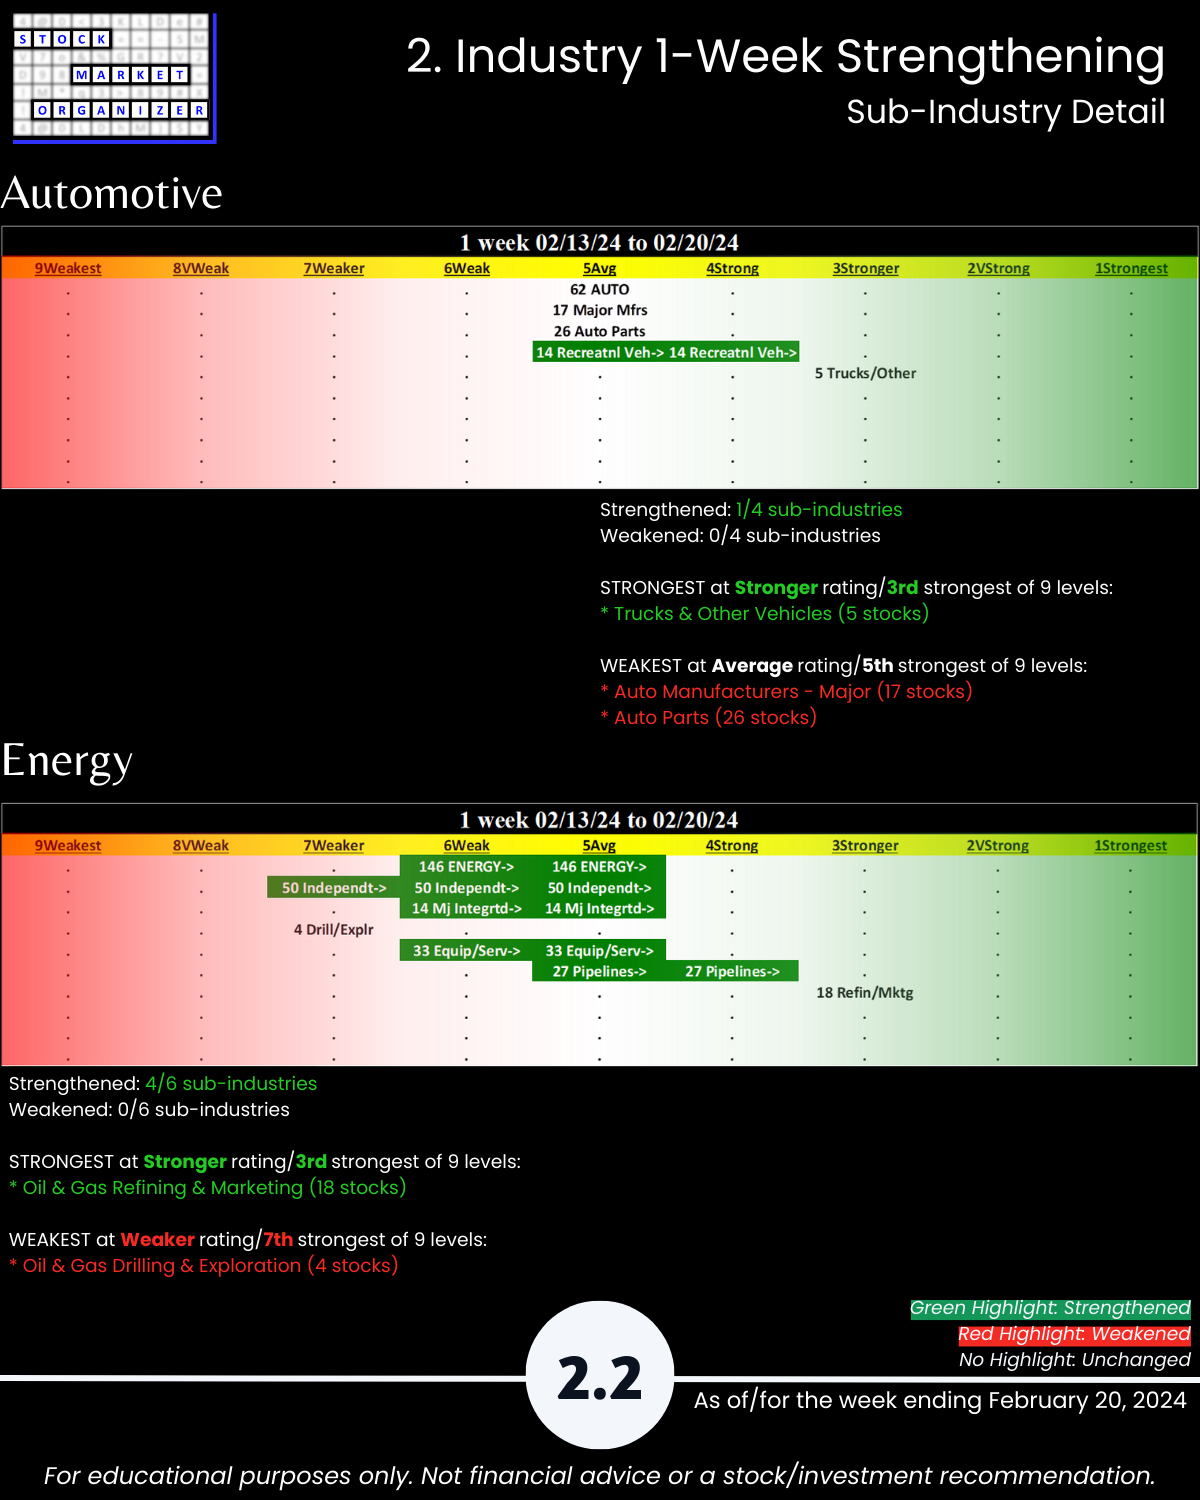
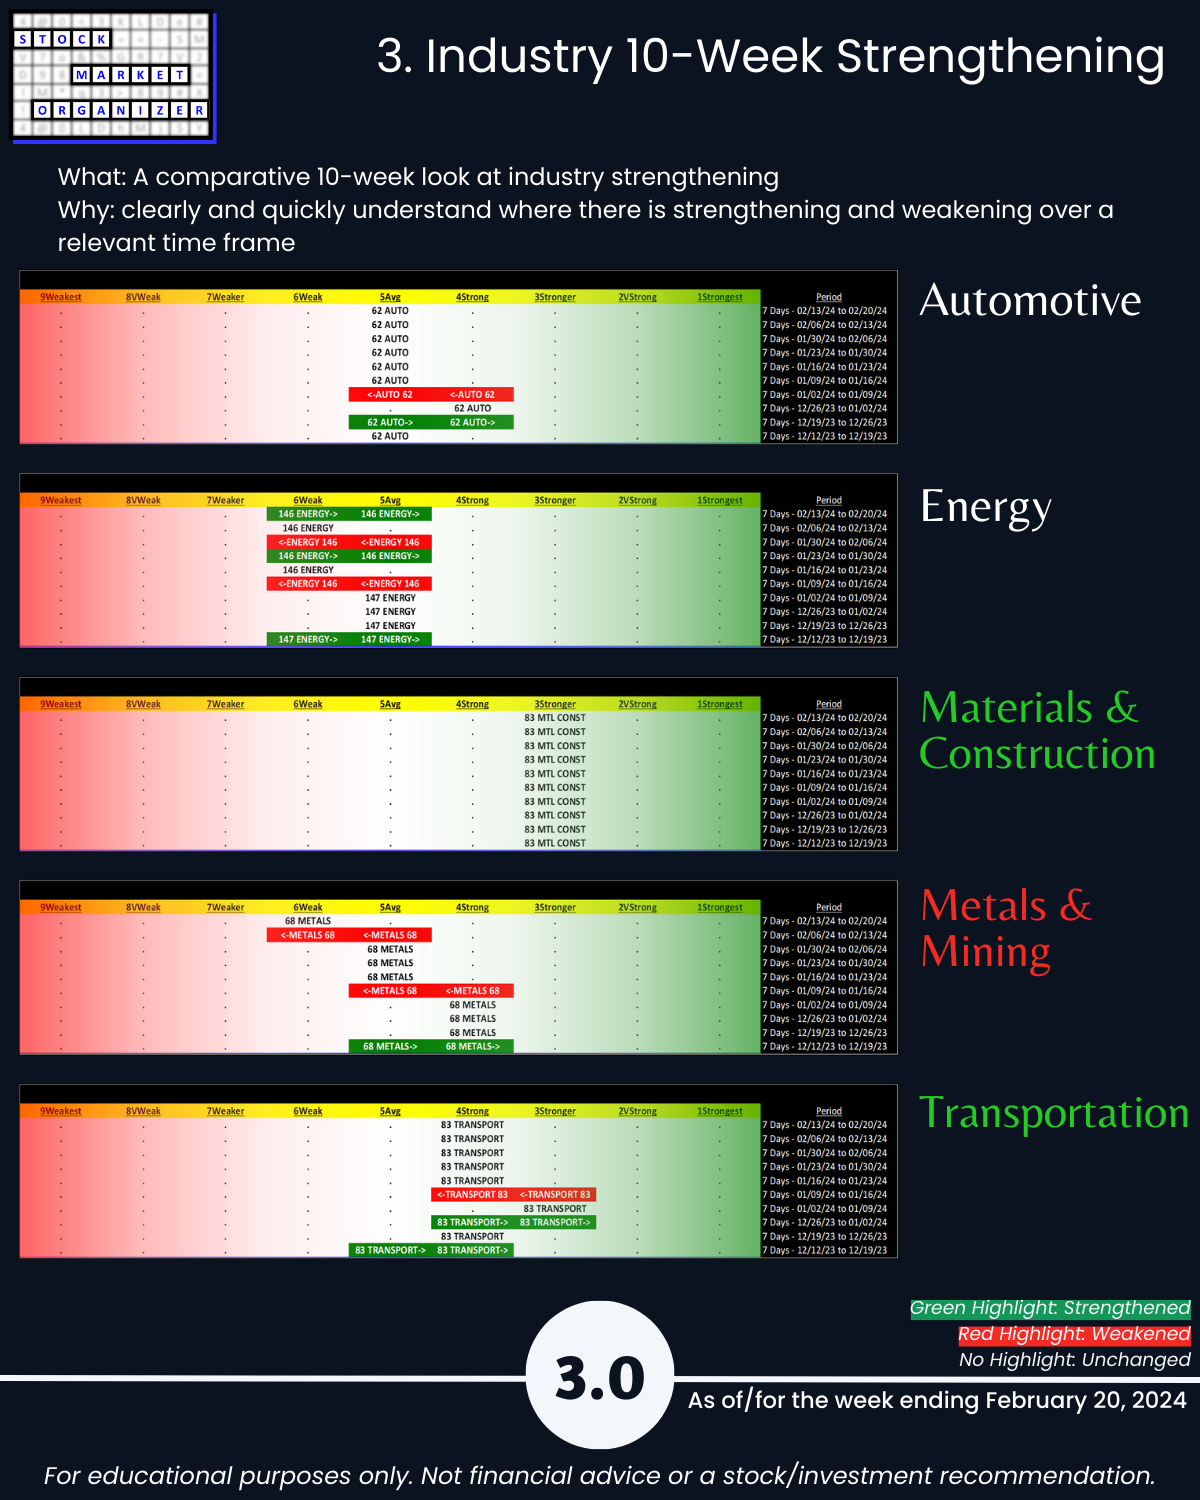
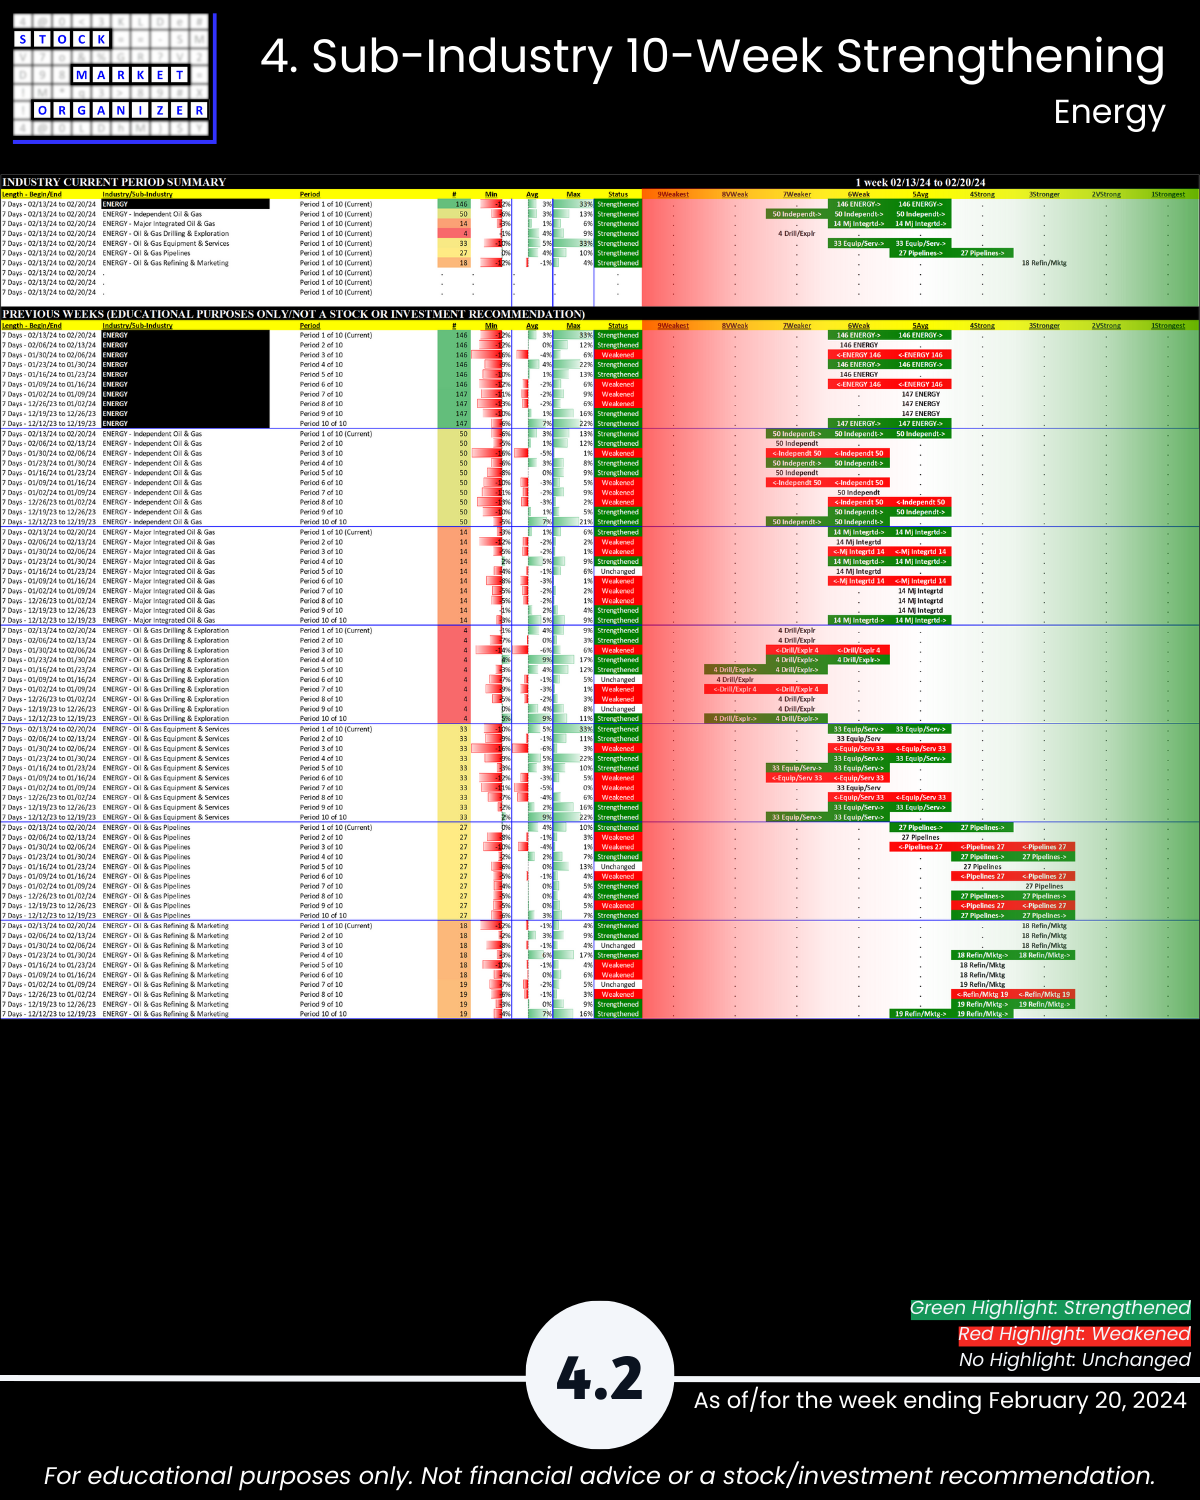
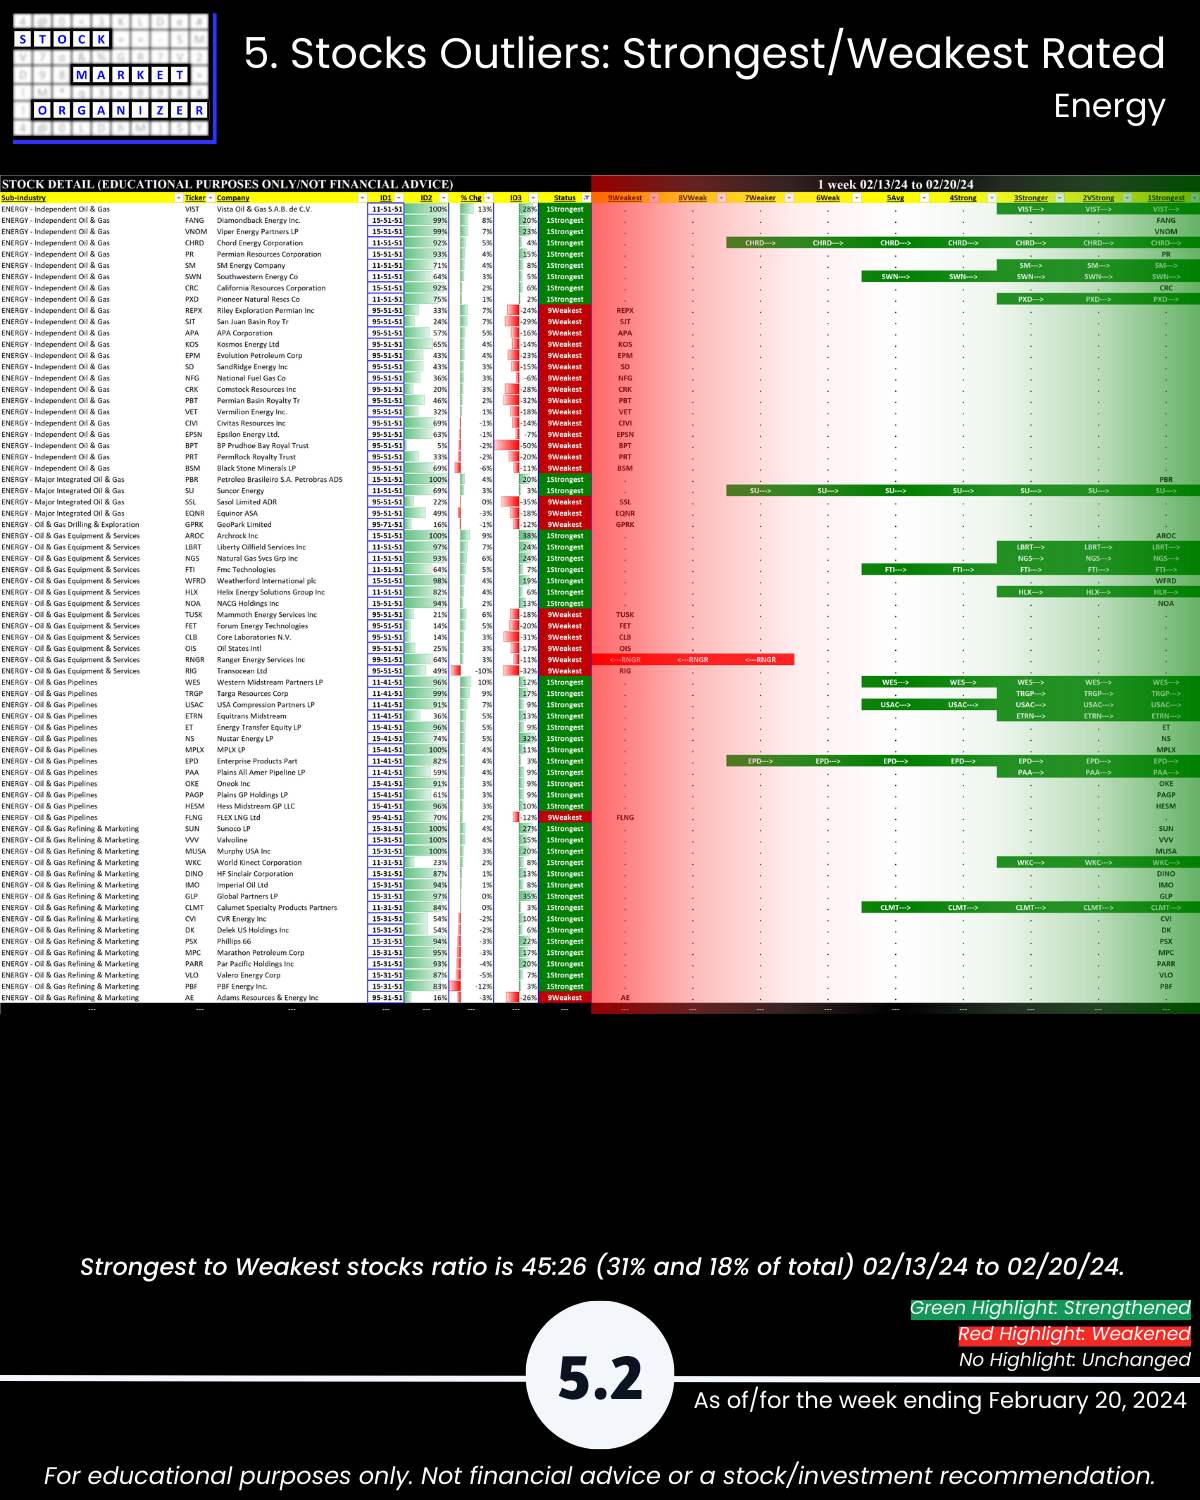
🔹 Energy industry strengthened to Average (5th strongest of 9 levels).
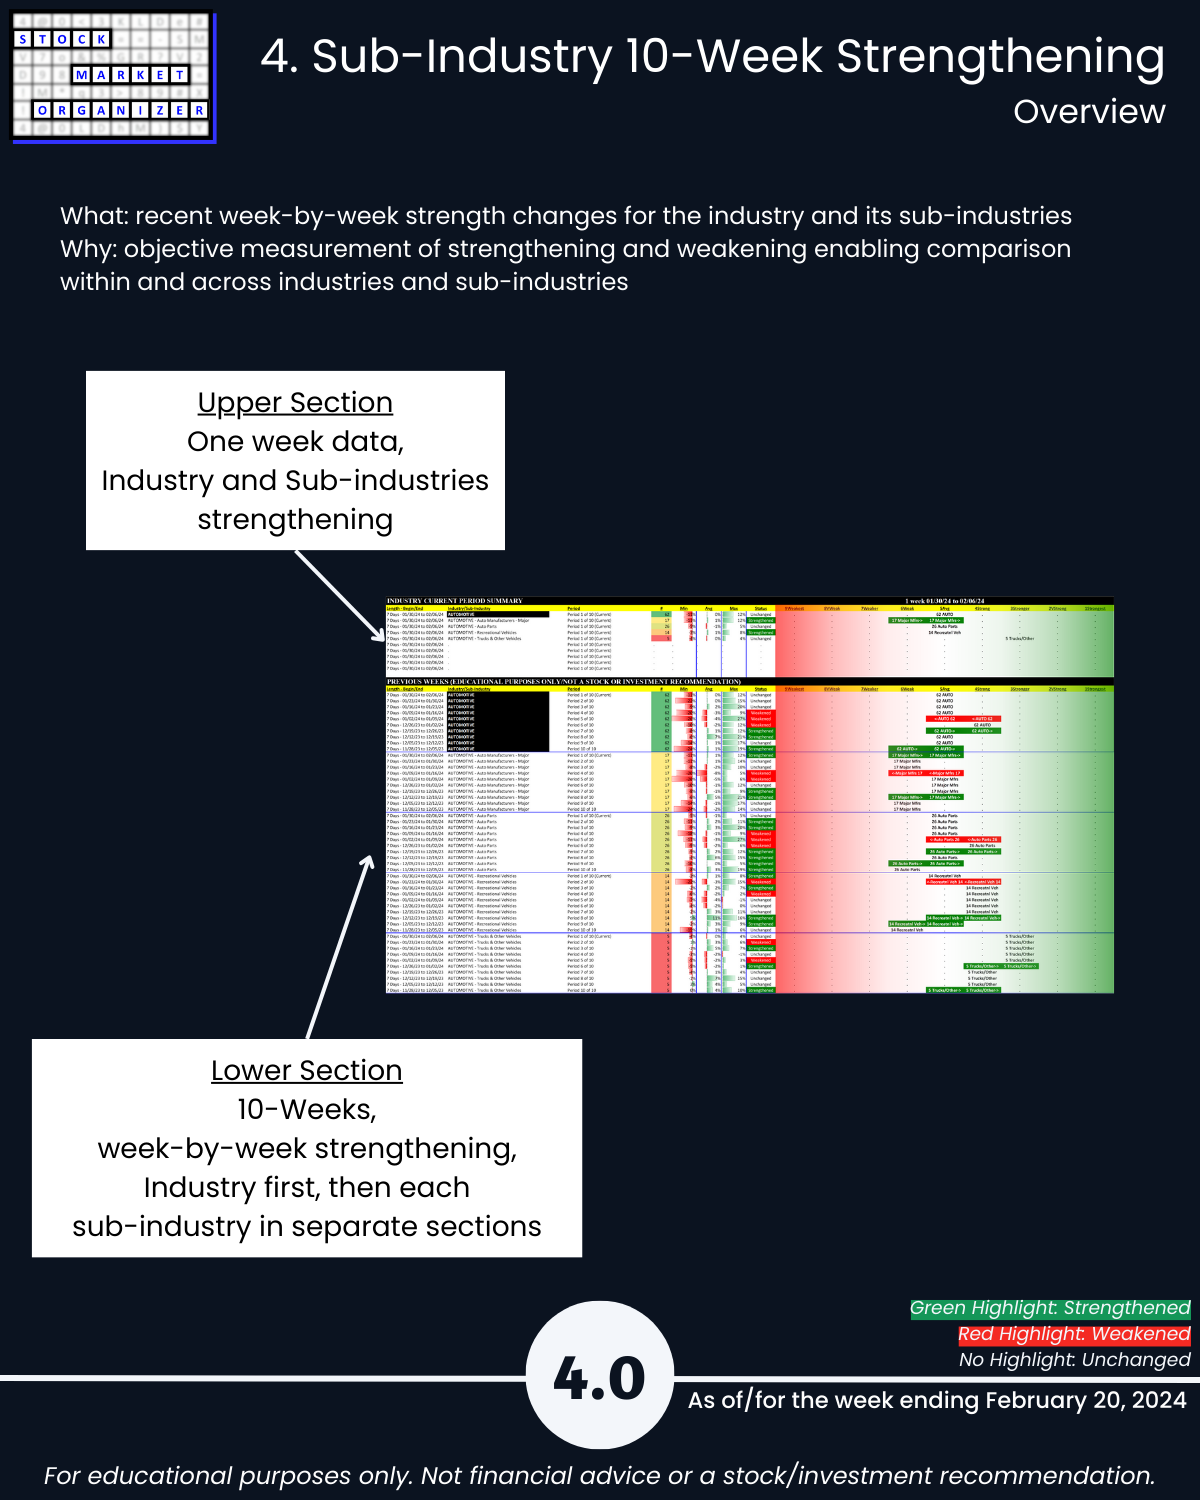
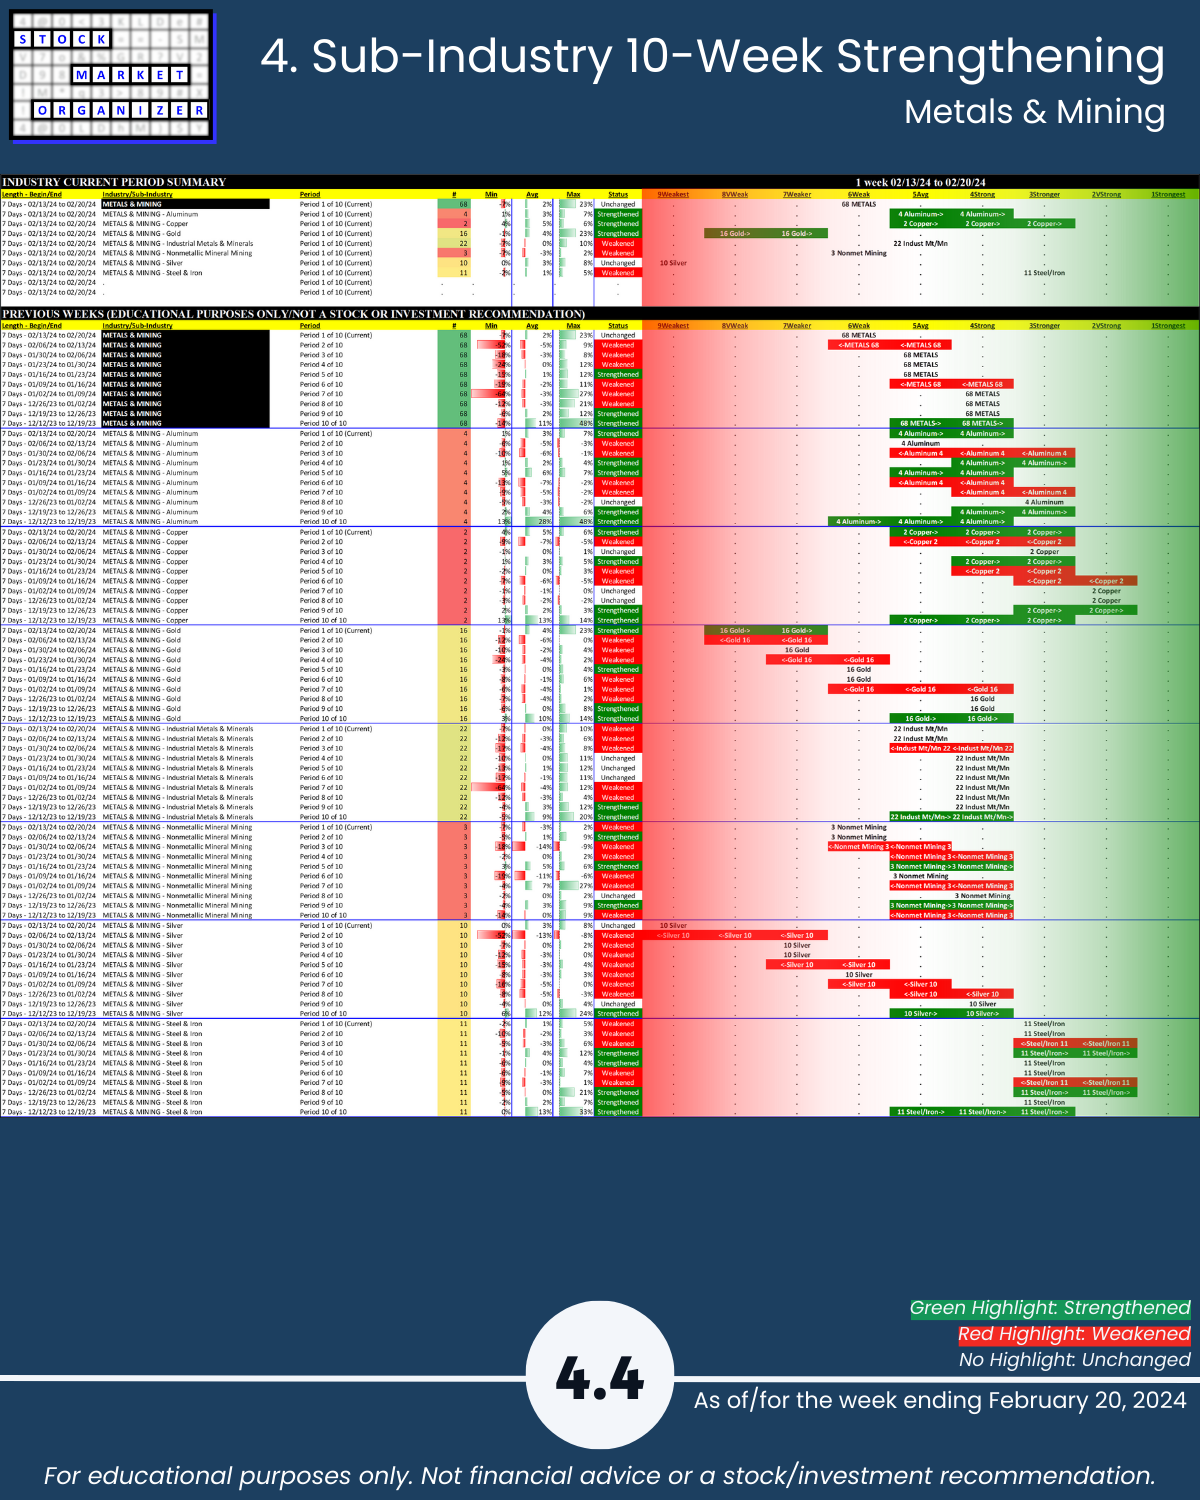
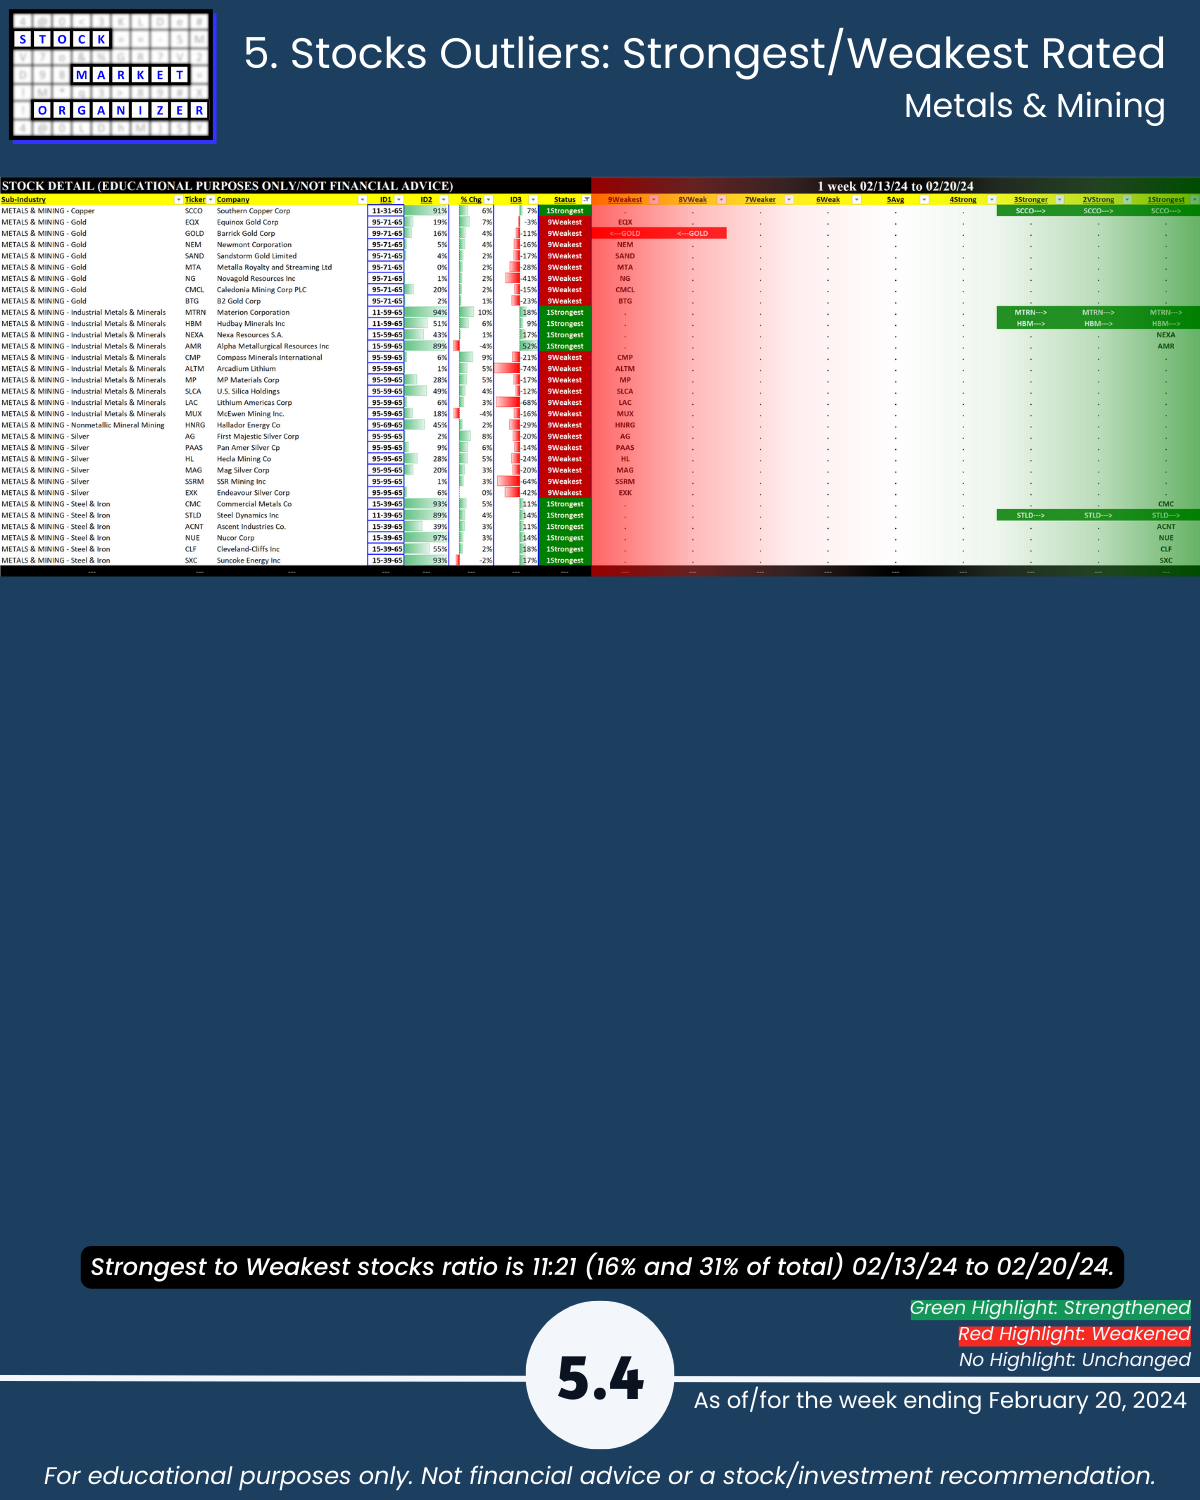
🔹 Gold sub-industry strengthened to Weaker (7th strongest), first time strengthening in 10 weeks (detail page 4.4). The start of something new? Here’s a signal to focus here.
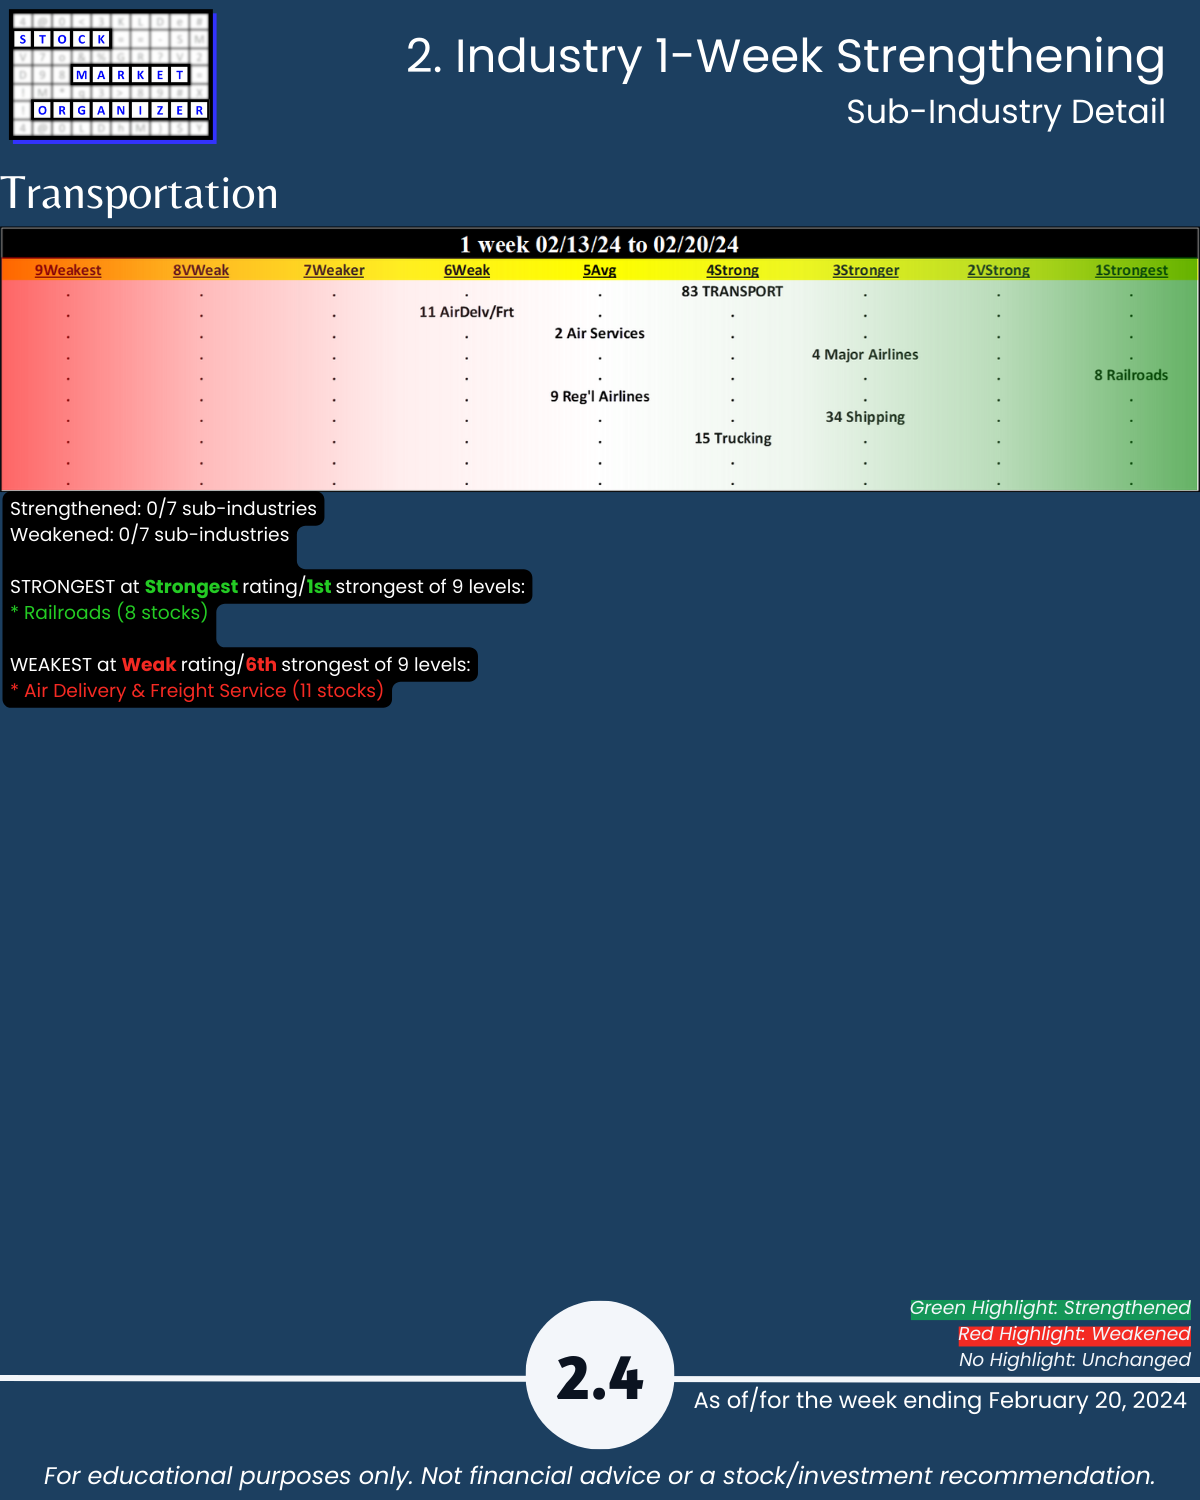
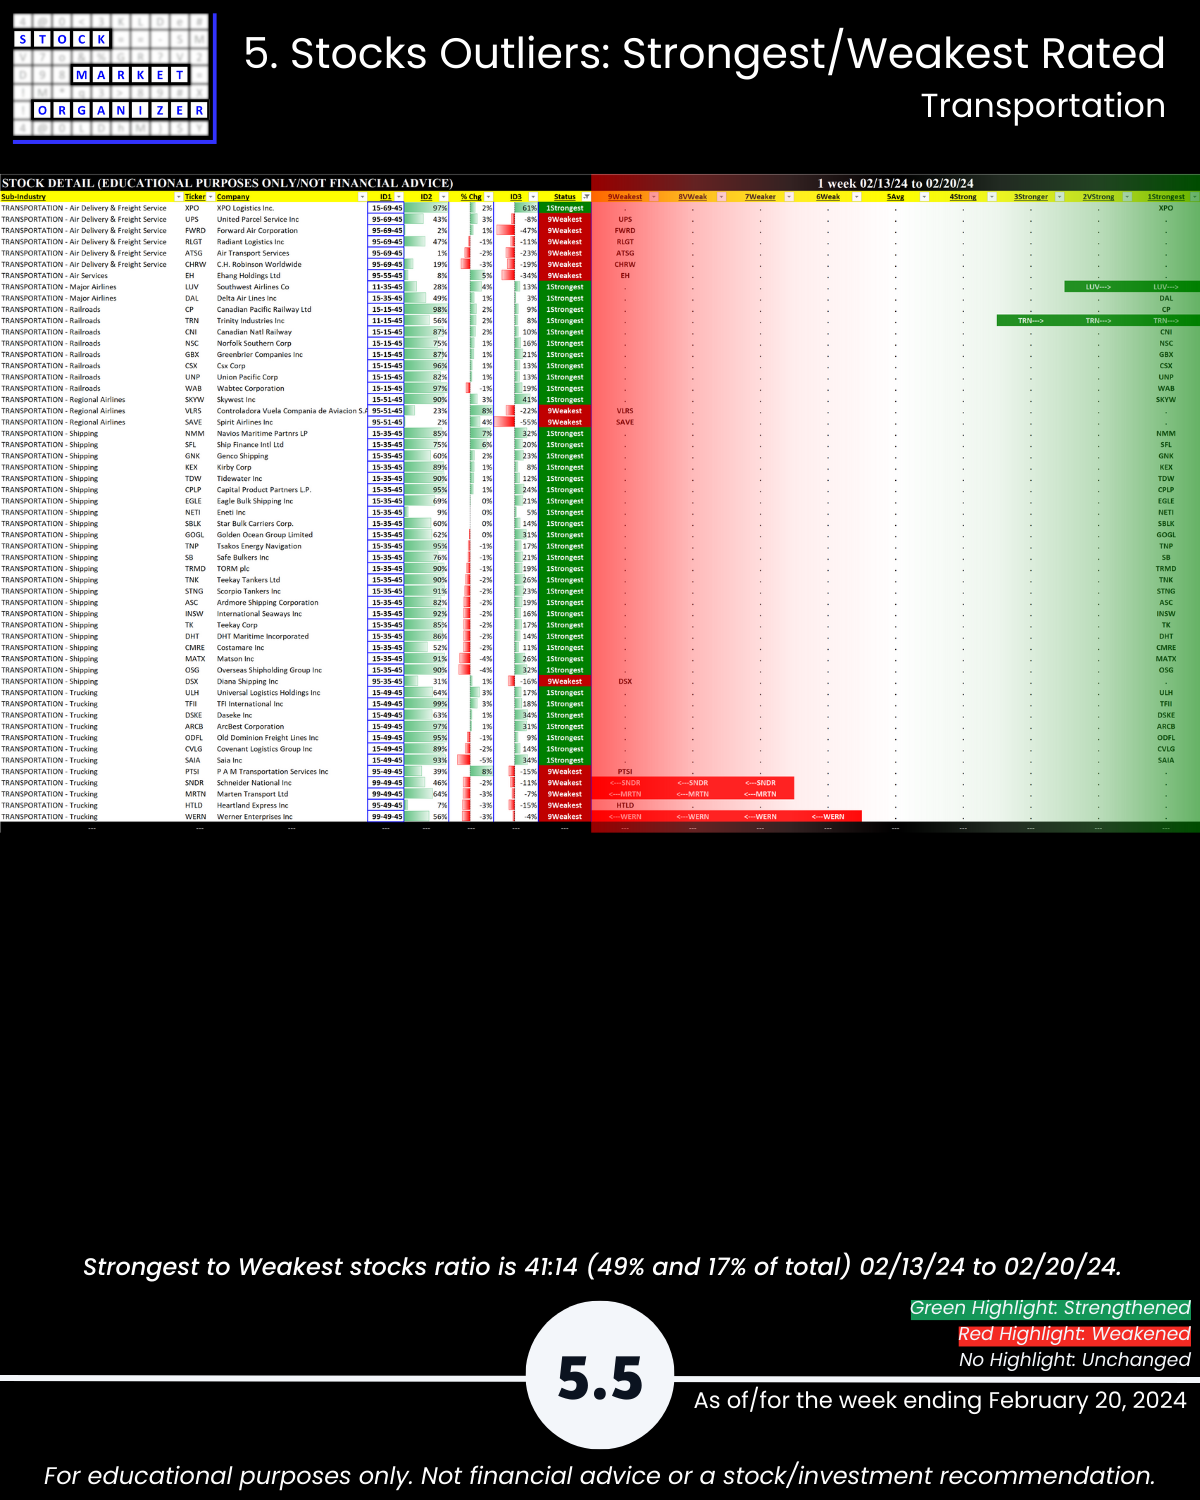
XPO is this group’s ANF: +297% since 4/5/23, nearly 2x NVDA’s +158%.
NVDA earnings on deck. What if it disappoints?
More detail below/attached including Strongest-/Weakest-rated stocks and objective strengthening/weakening measurements.
HIGHLIGHTS
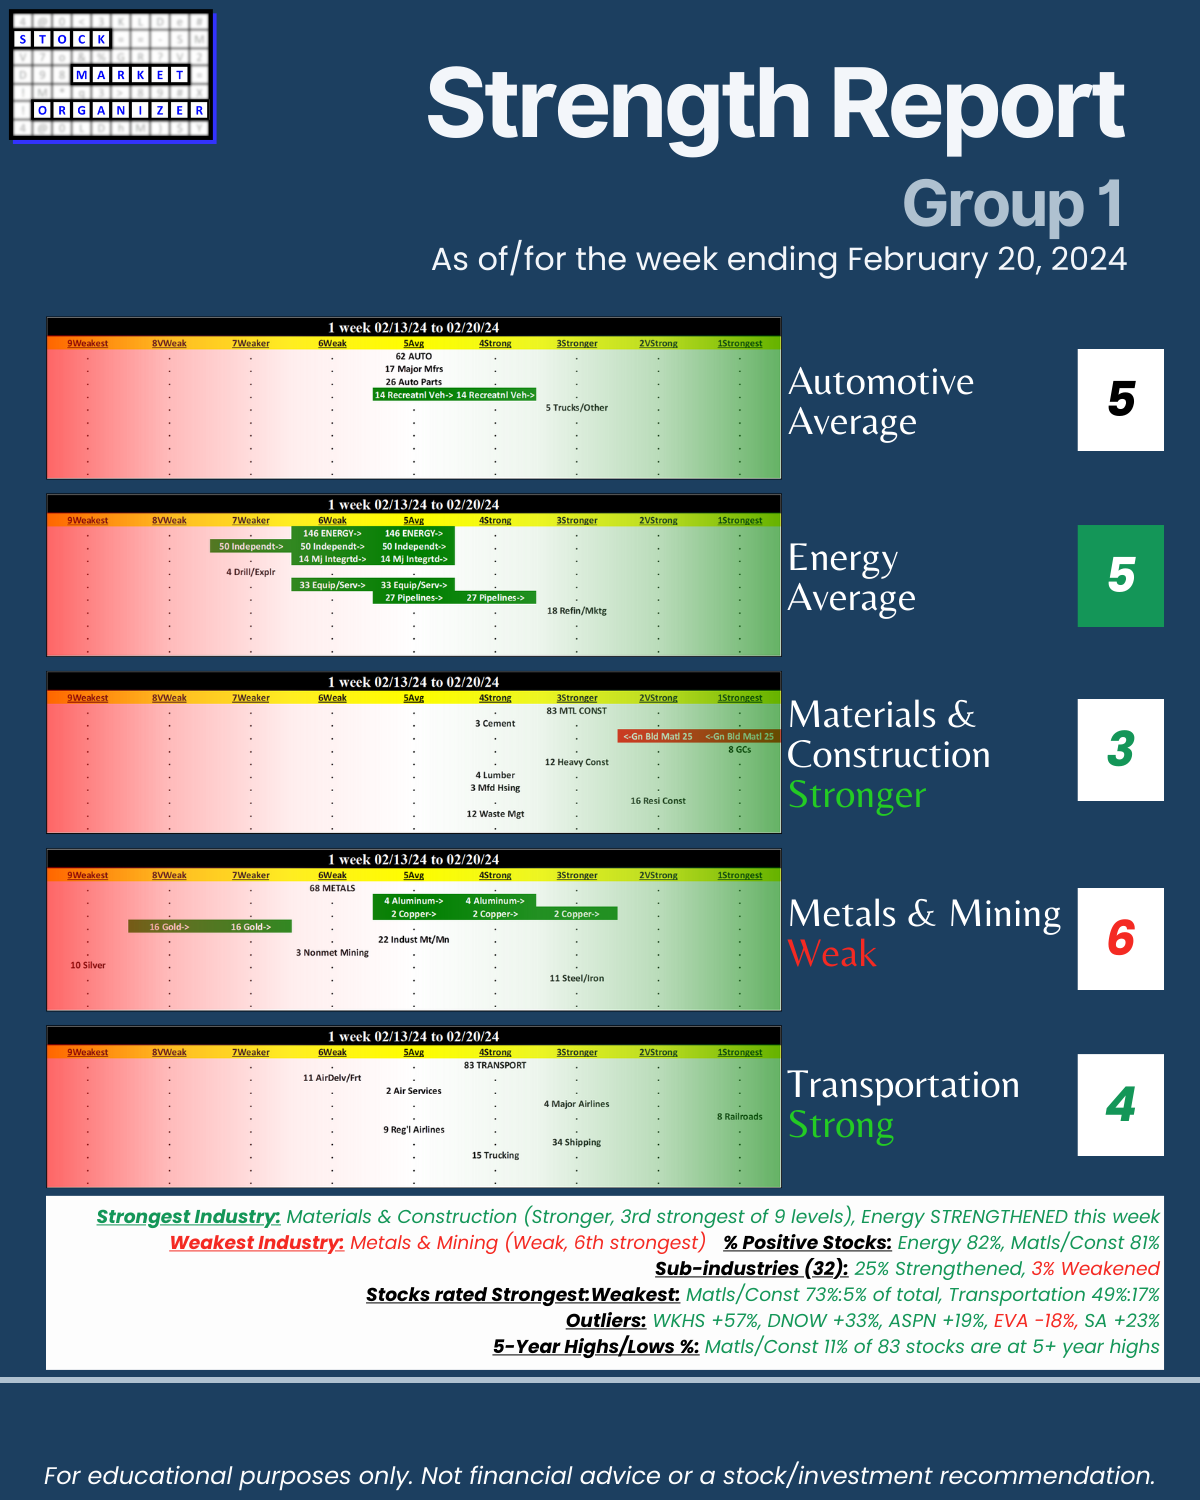
🔹 Strongest Industry: Materials & Construction (Stronger, 3rd strongest of 9 levels), Energy STRENGTHENED this week
🔹 Weakest Industry: Metals & Mining (Weak, 6th strongest)
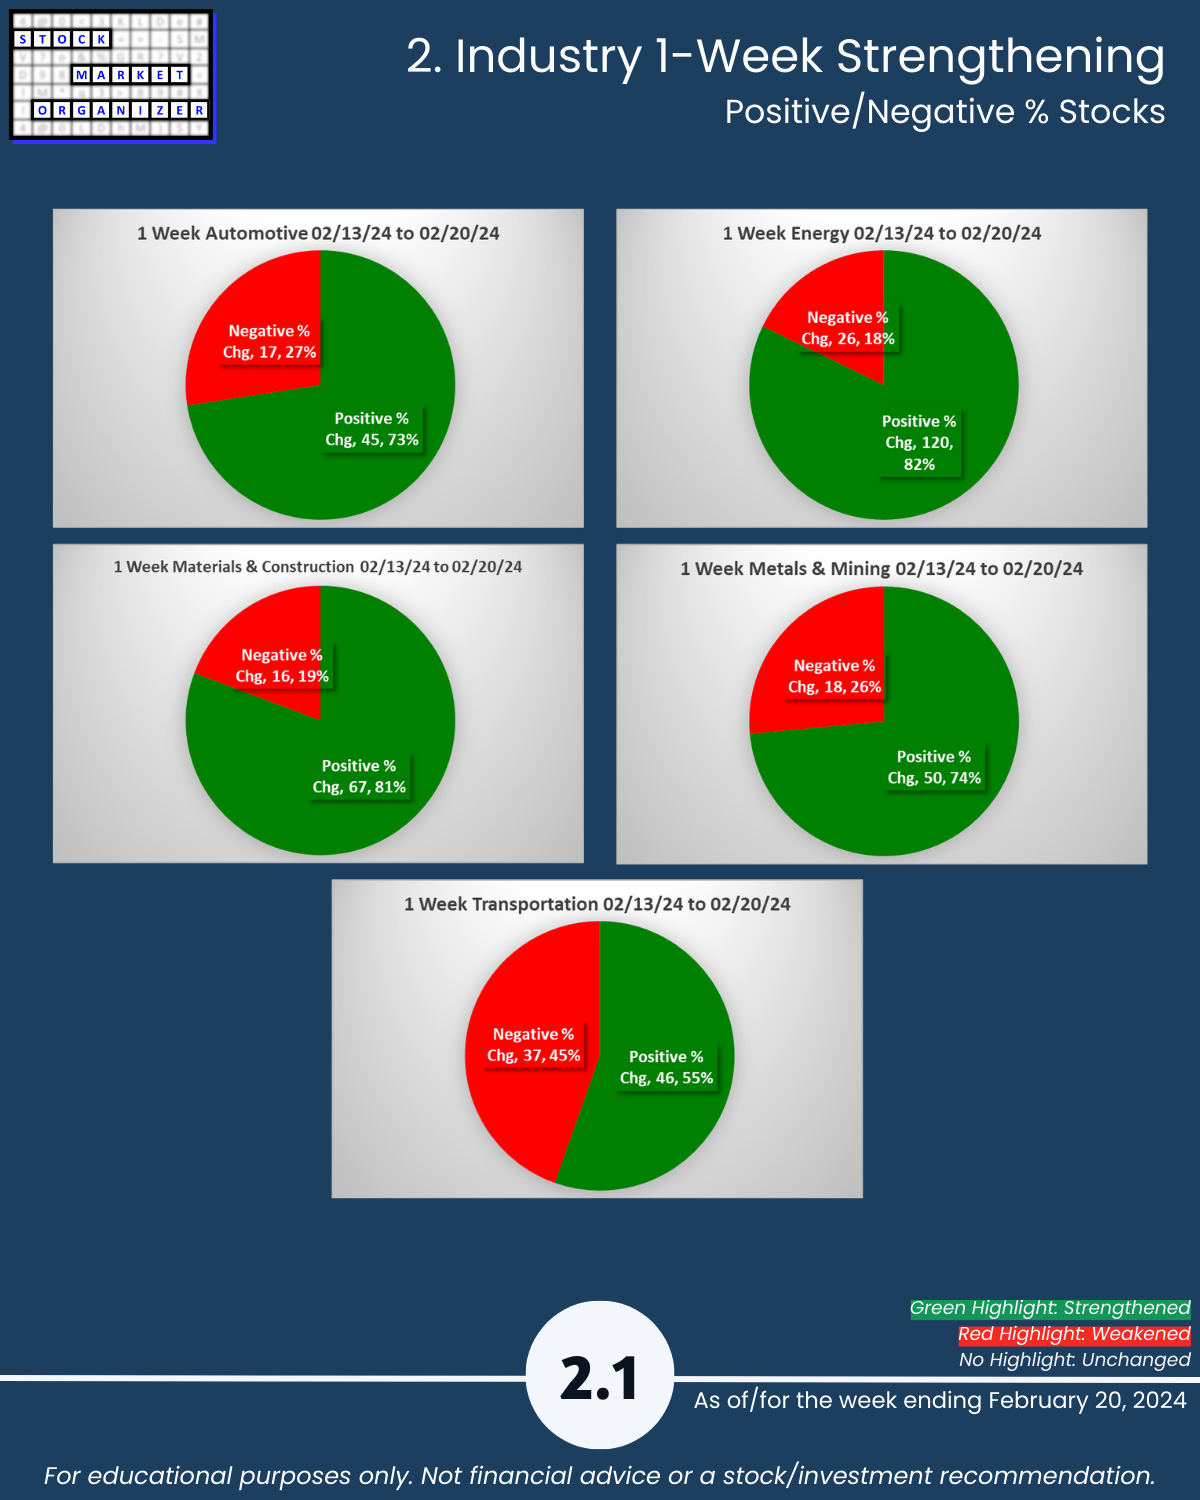
🔹 % Positive Stocks: Energy 82%, Matls/Const 81%
🔹 Sub-industries (32): 25% Strengthened, 3% Weakened; GCs, Railroads = Strongest, Silver Weakest
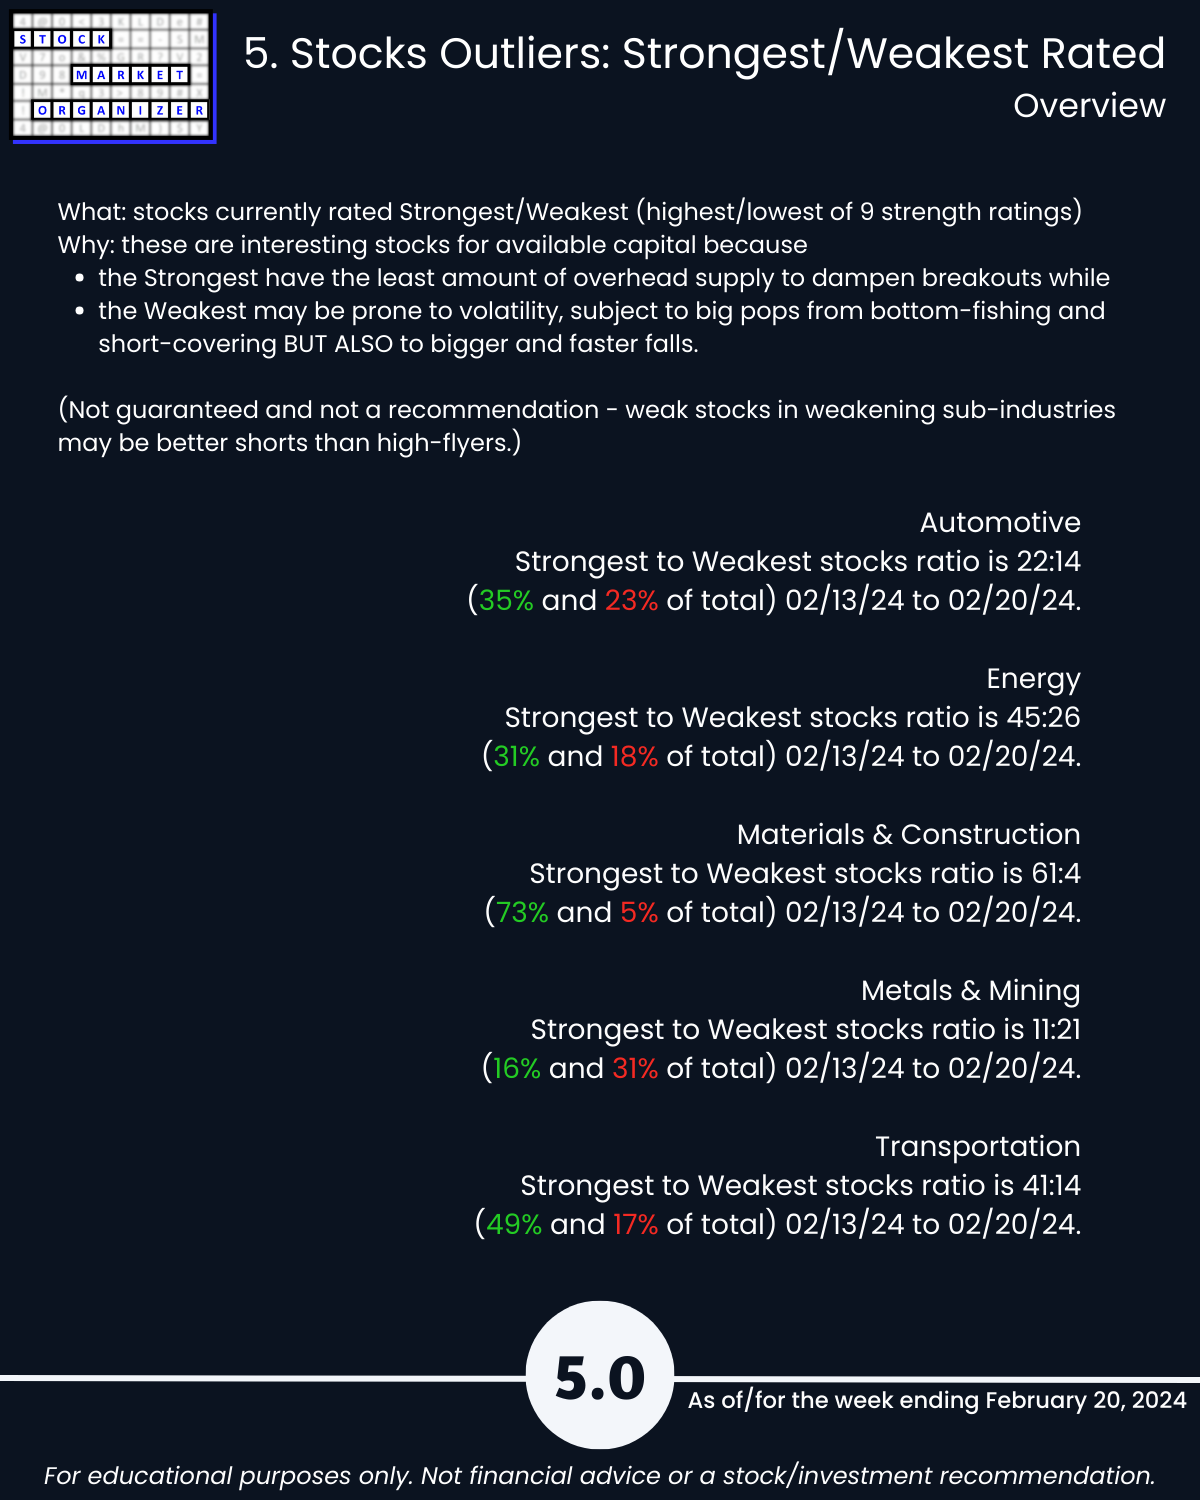
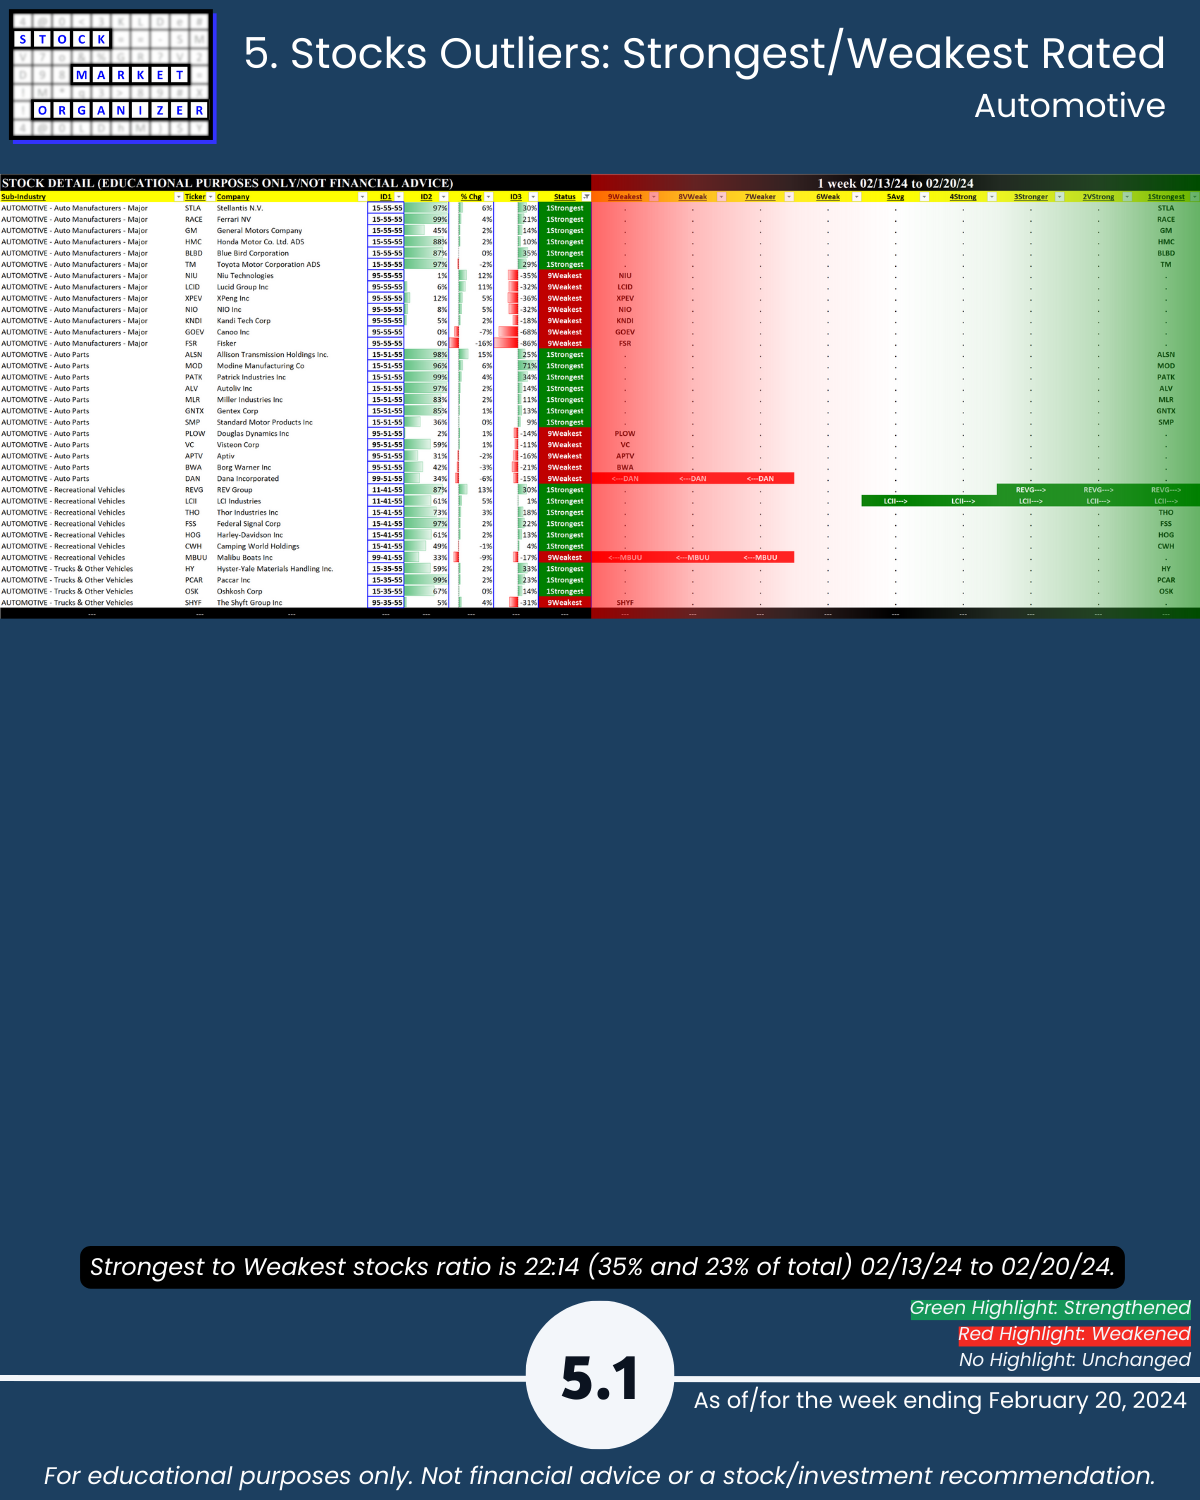
🔹 Stocks rated Strongest:Weakest: Matls/Const 73%:5% of total, Transportation 49%:17%
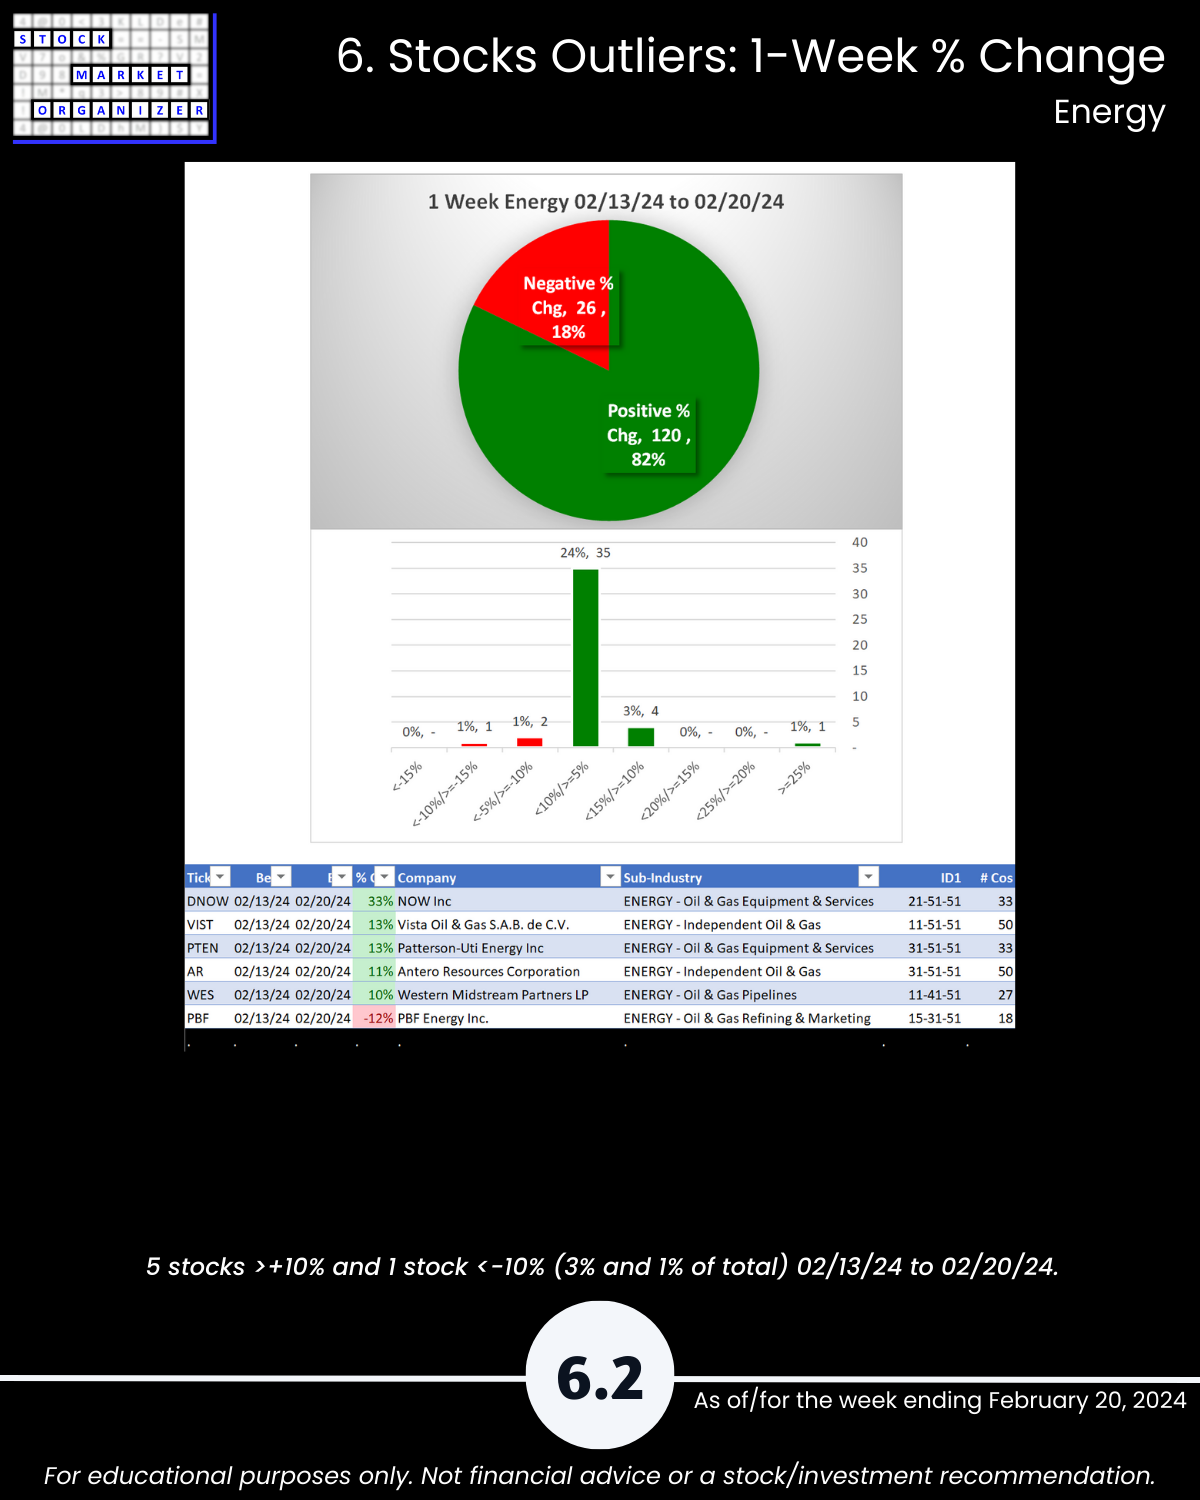
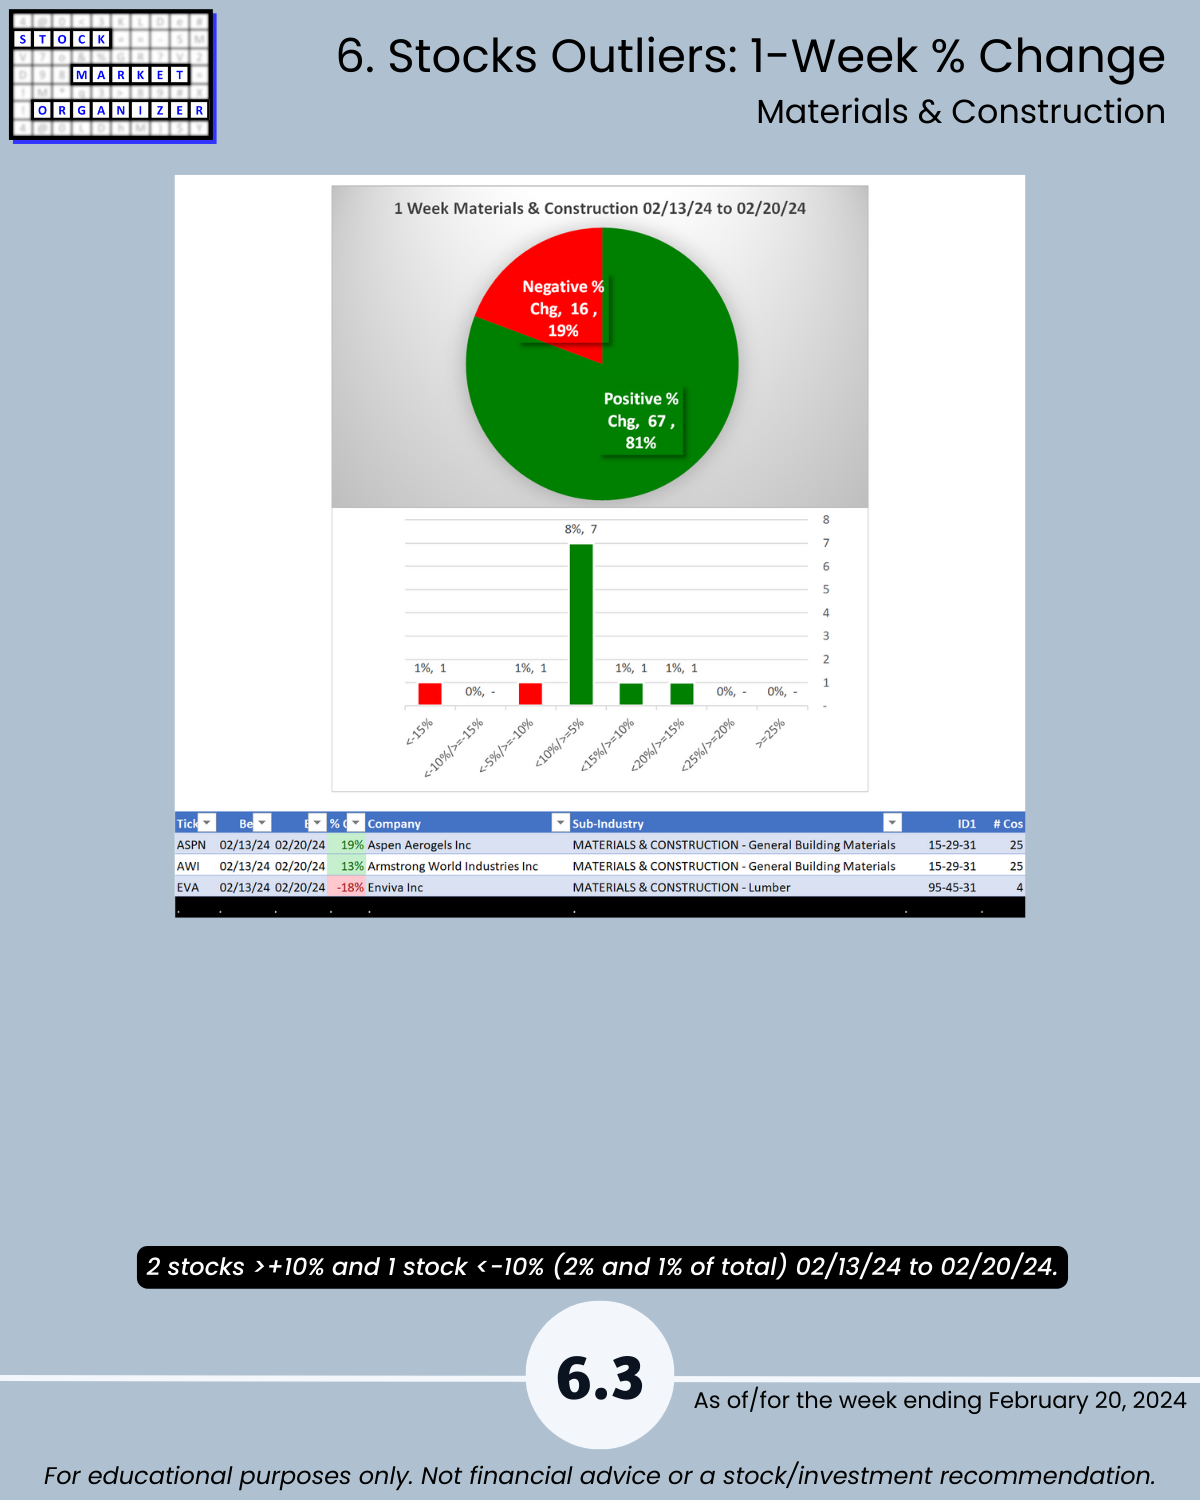
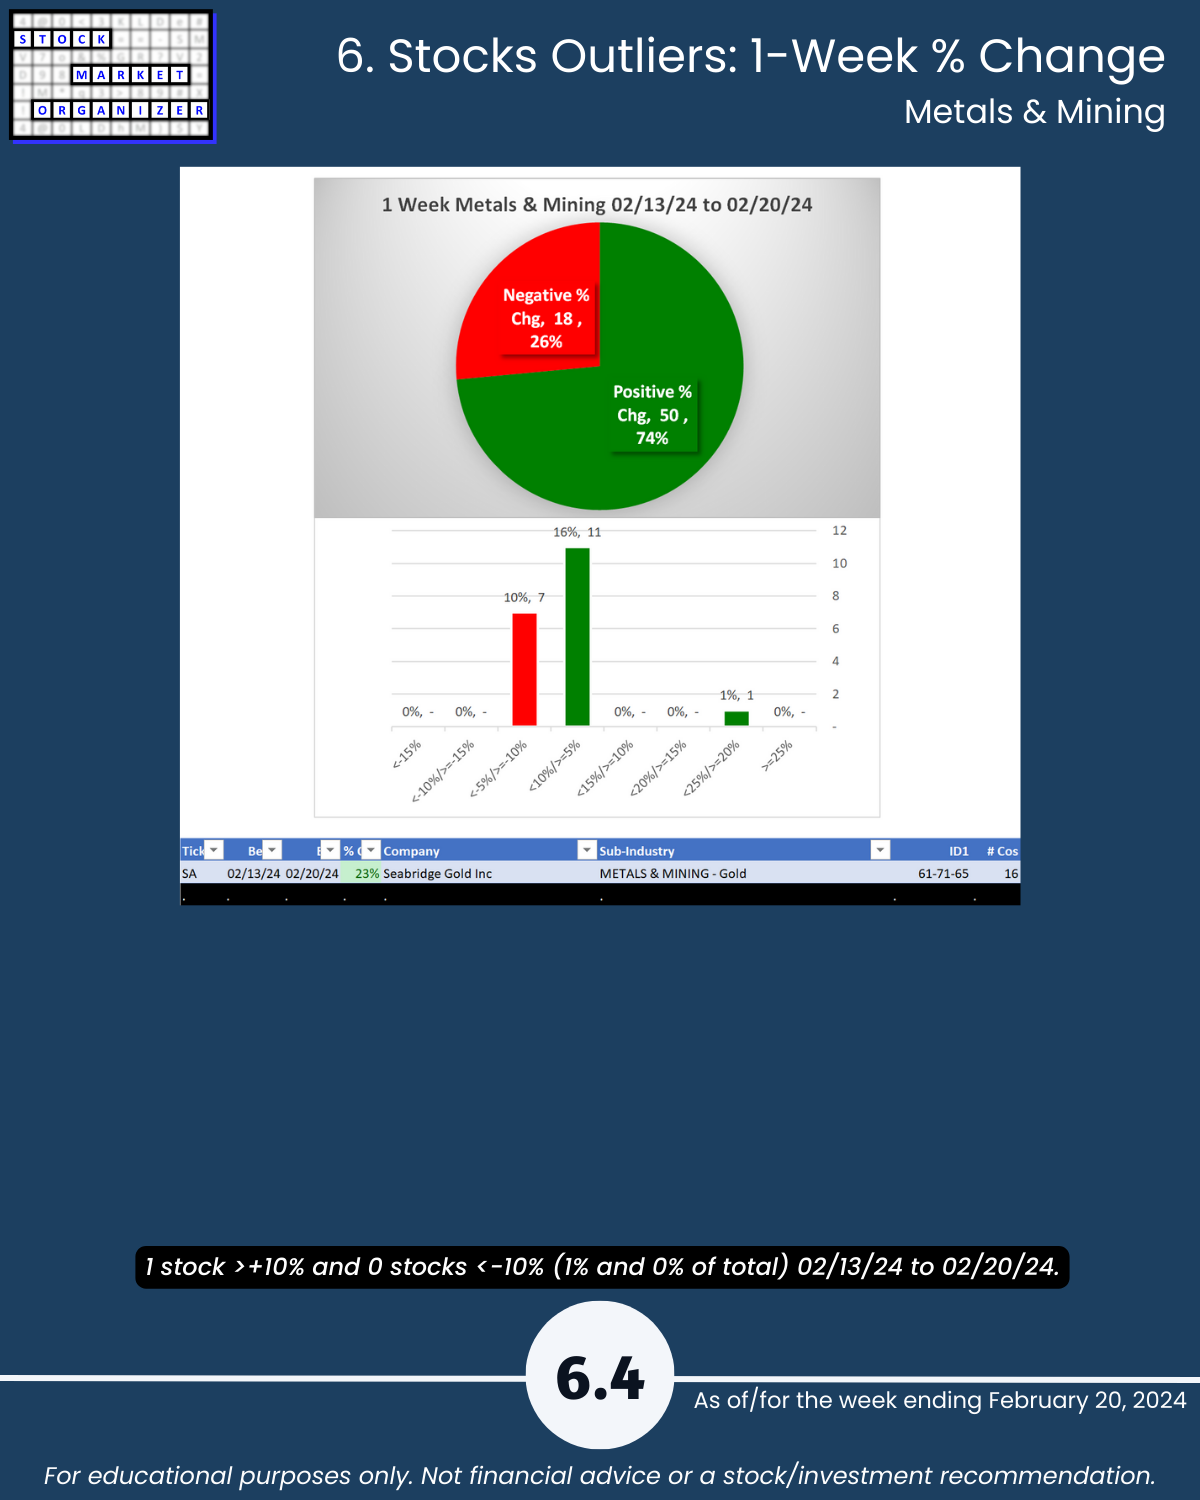
🔹 Outliers: DNOW +33%, ASPN +19%, SA +23%
🔹 5-Year Highs/Lows %: Matls/Const 11% of 83 stocks are at 5+ year highs
22 Group 1 stocks at 5+ year highs (10 Energy, 9 Materials/Construction):
AROC, AWI, CLH, DOOR, EME, FANG, MAS, MPLX, MUSA, PBR, PCAR, PGTI, RACE, RSG, SUN, TFII, TRGP, VIST, VNOM, VVV, WCN, WM
SO WHAT?
Through tracking strengthening/weakening from the individual stock through overall market levels, you know:
🔹 The strongest stocks in each industry. Helpful for “the stronger your stocks, the greener your P&L” believers. Ditch portfolio dogs until they begin strengthening.
🔹 How all stocks in each sub-industry/industry compare in current strengthening and weakening. No guarantee the relationships will continue but it’s hard to game plan where they could go if you don’t know where they are now.
🔹 Whether sub-industries and industries are currently strengthening. “The trend is your friend” applies to sub-industries and industries too.
It really doesn’t have to be so complicated.
This report may particularly be of interest if the following 5 concepts resonate with you:
- The stronger your stocks, the greener your P&L.
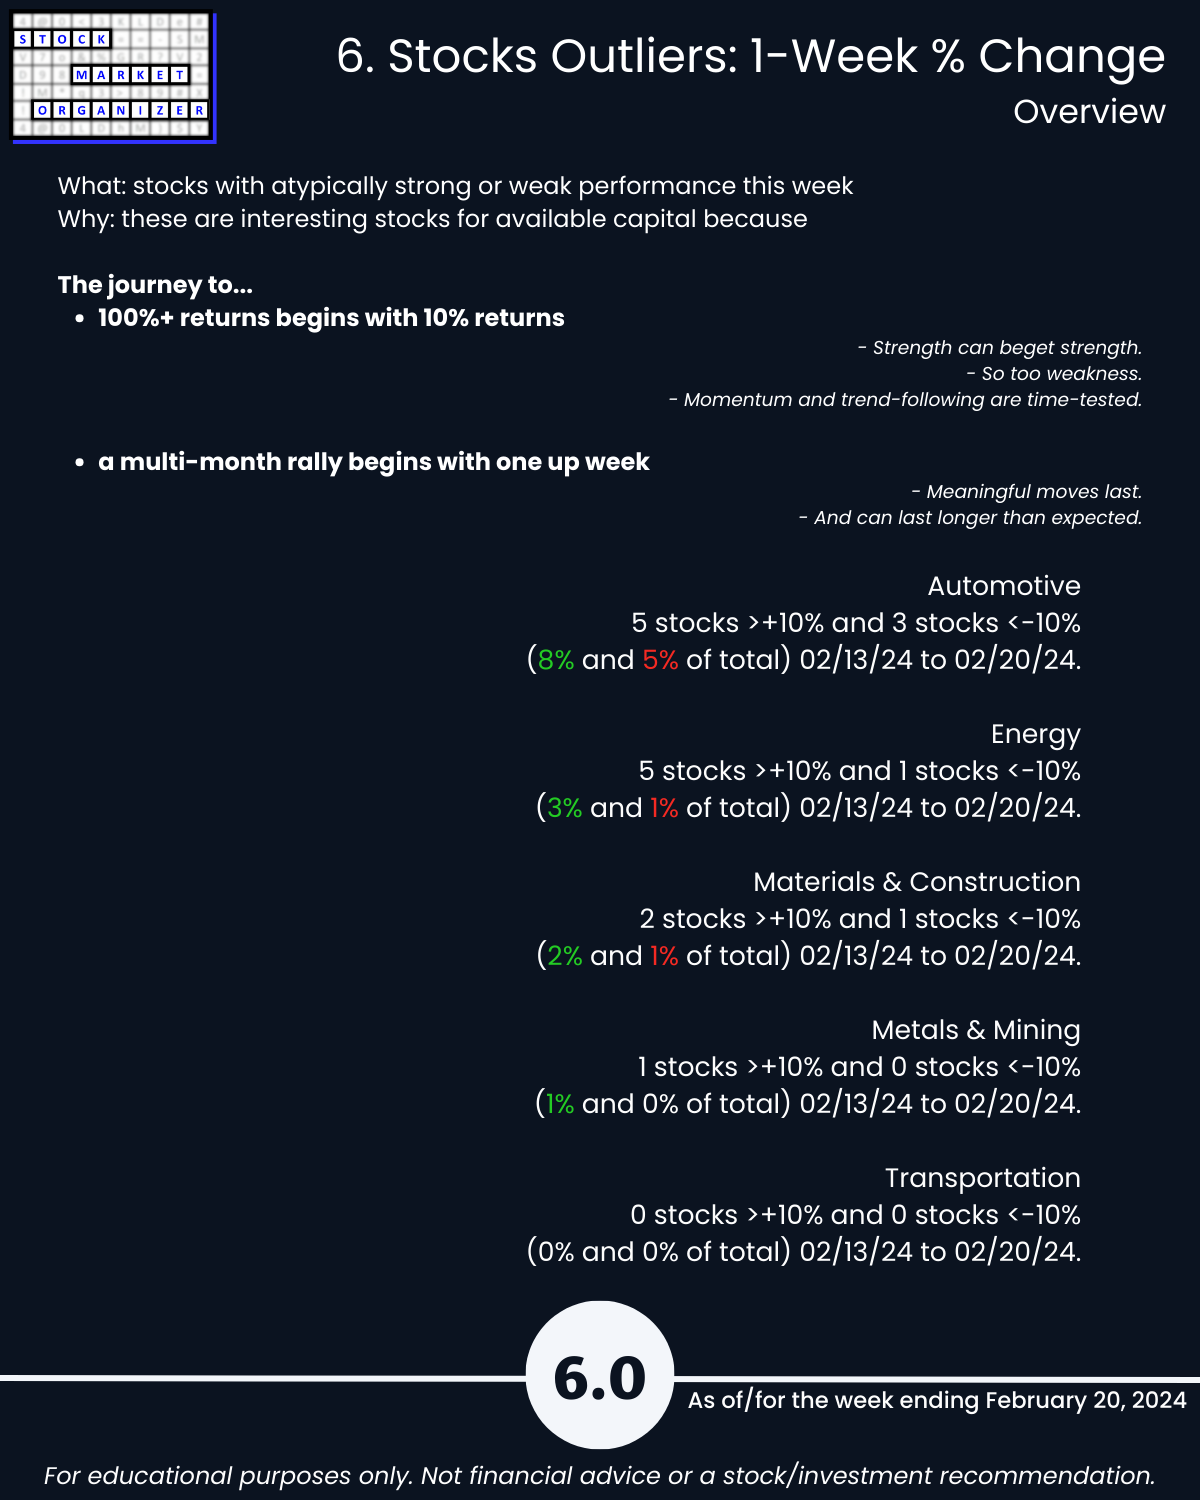
- The journey to 100%+ returns begins with 10% returns.
- The journey to a multi-month rally begins with one up week.
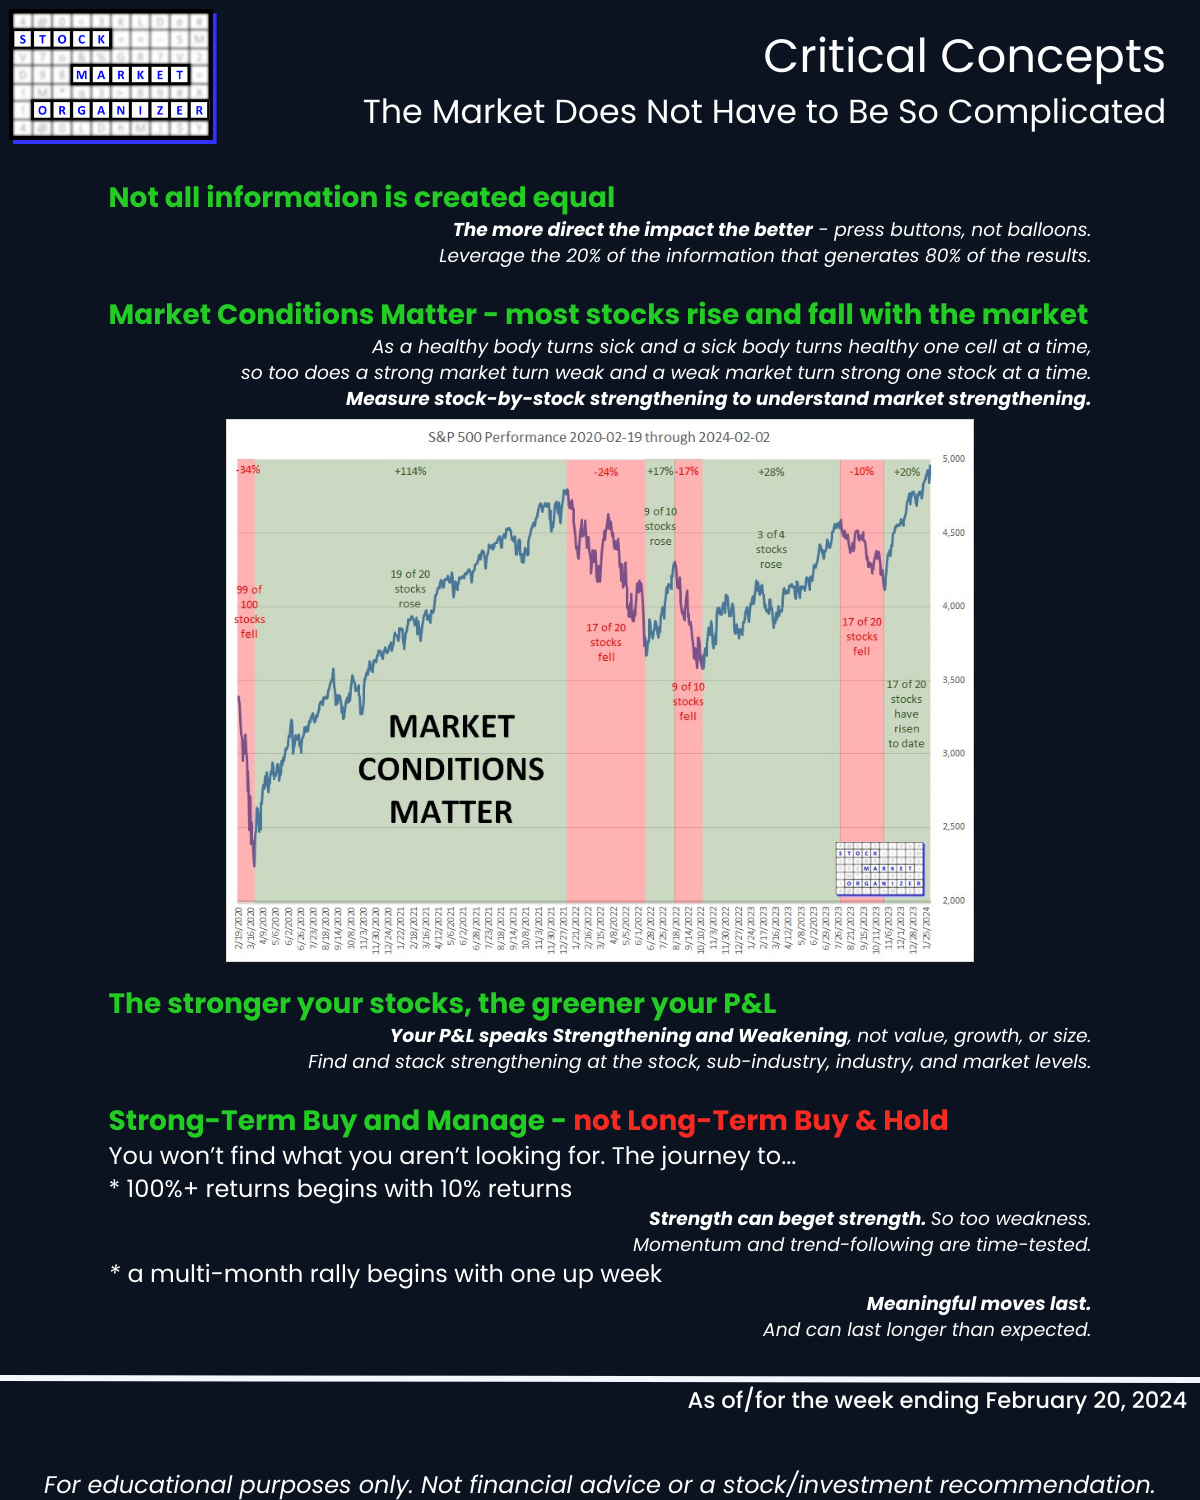
- Most stocks do what the market does. (While the market can only do what its underlying stocks, sub-industries, and industries do.)
- 80/20: not all information is created equal. (Press buttons, not balloons.)
Following are galleries with page-by-page views of this report.
1. Introduction
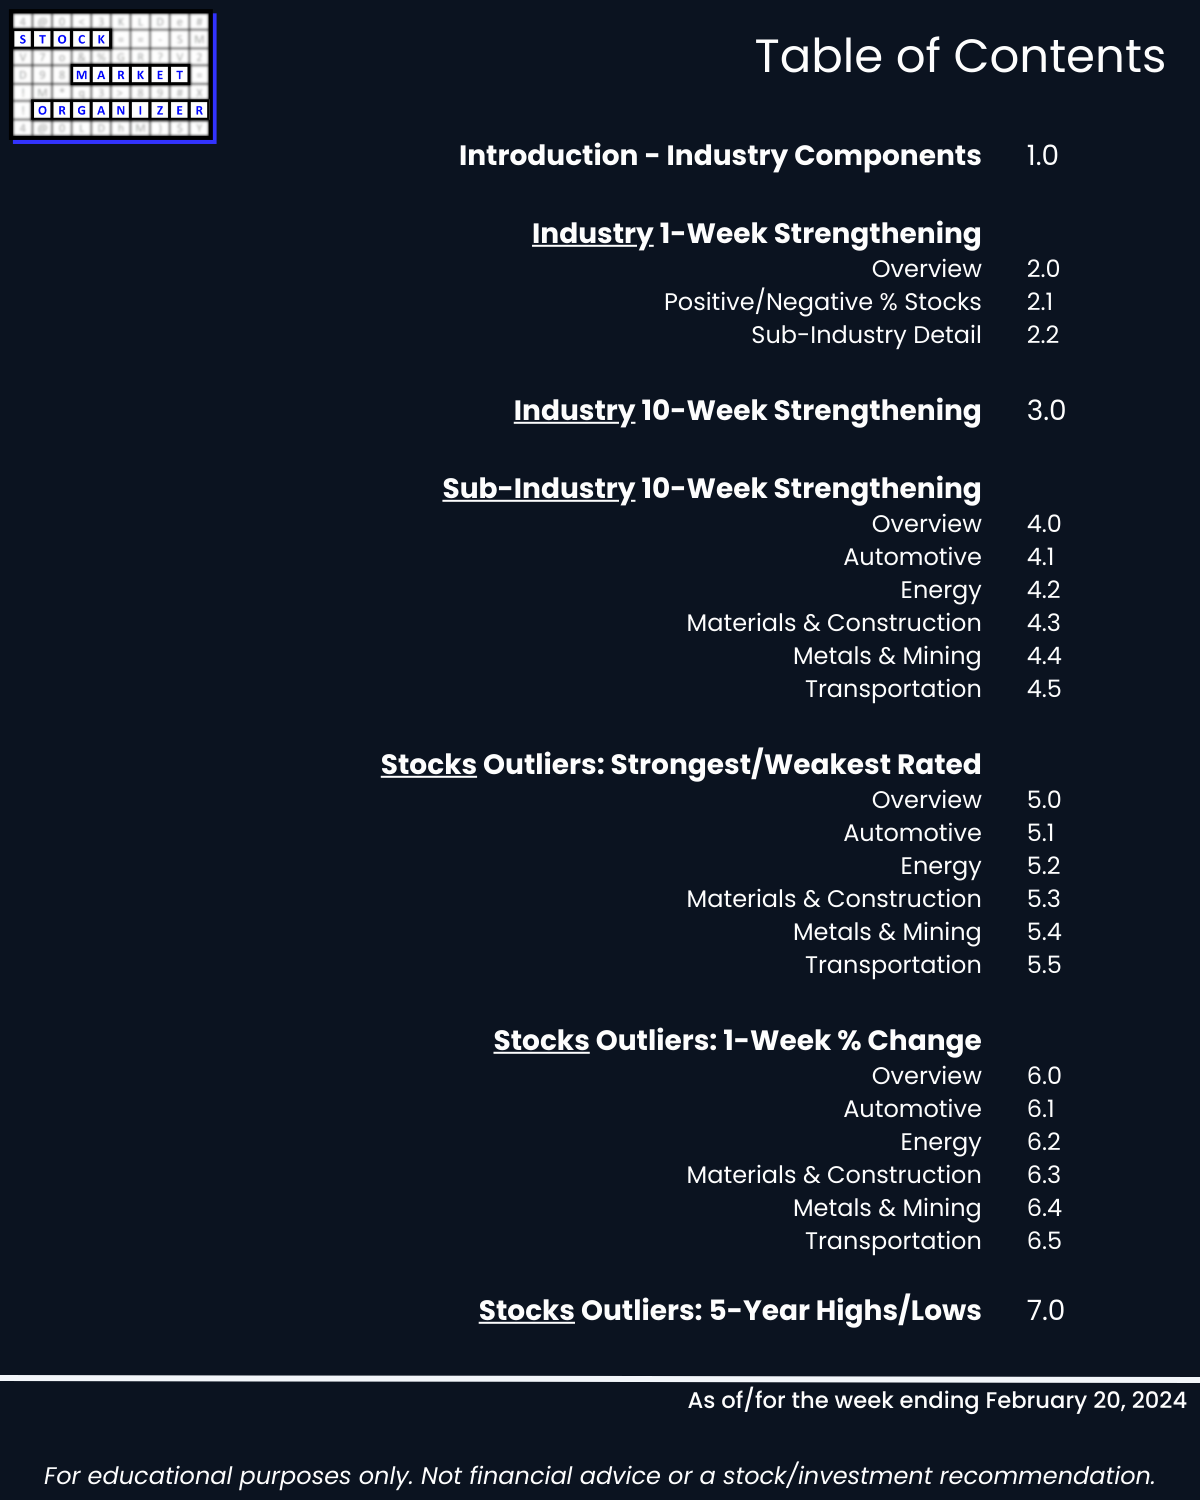
2. Industry 1-Week Strengthening
3. Industry 10-Week Strengthening
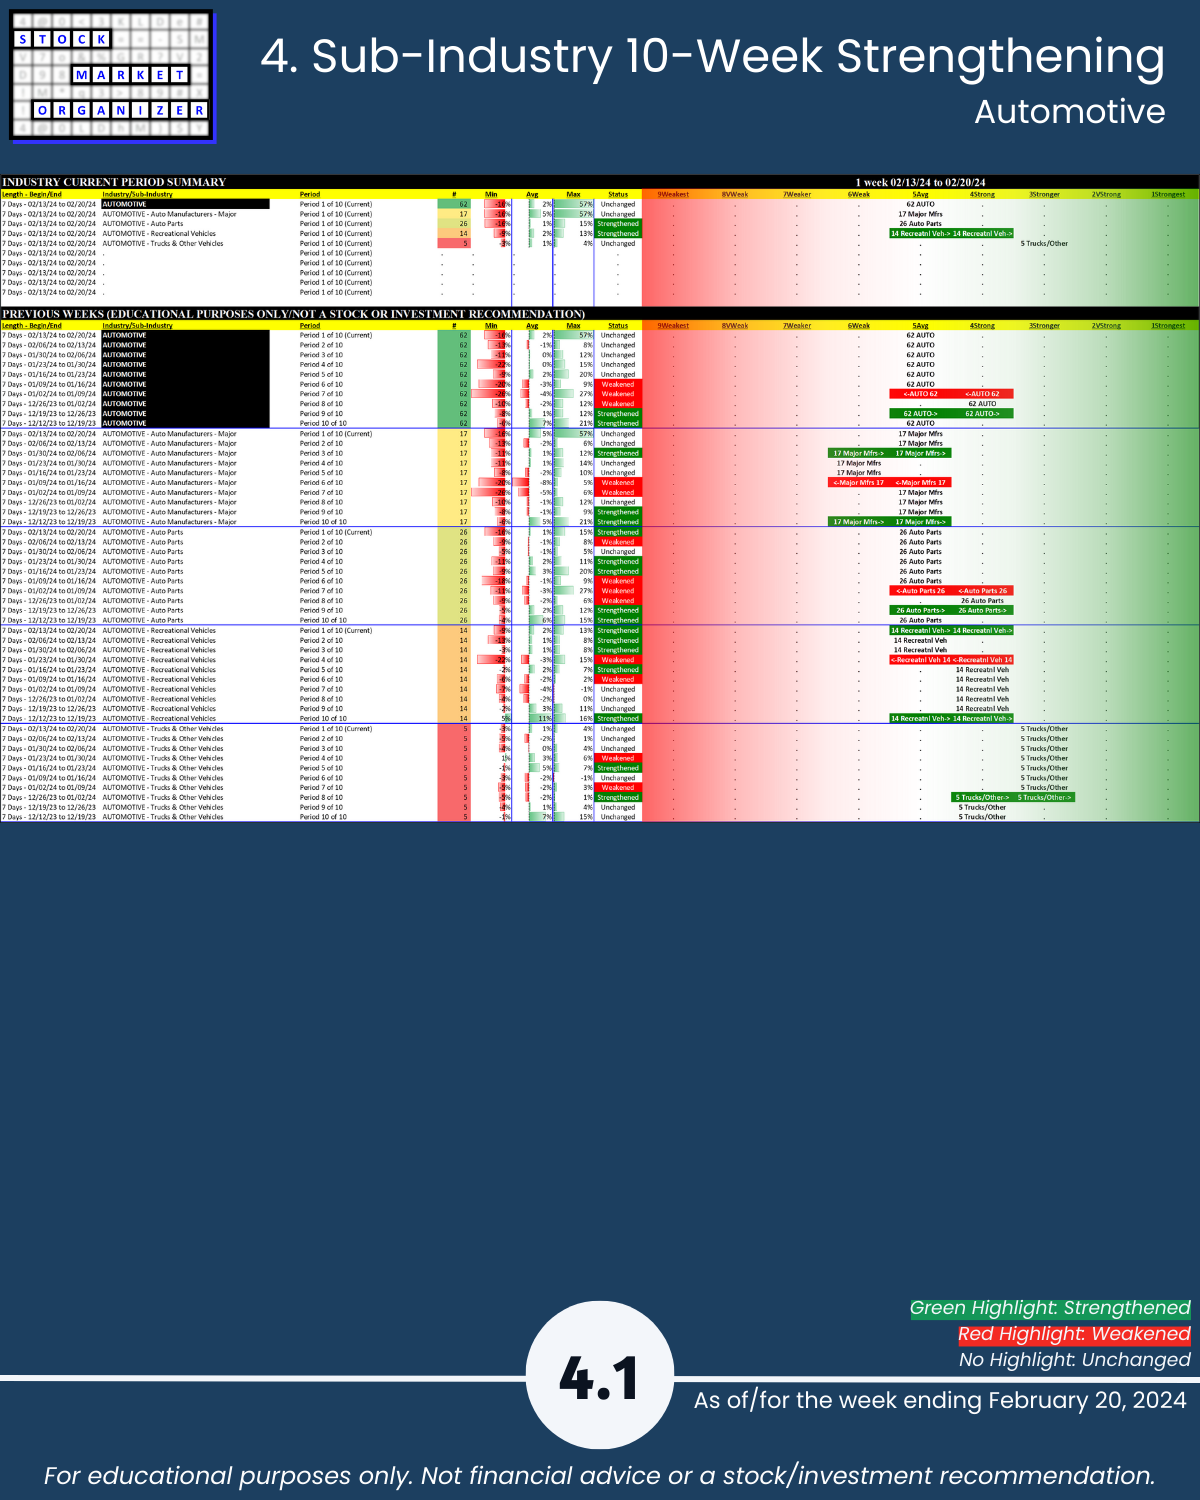
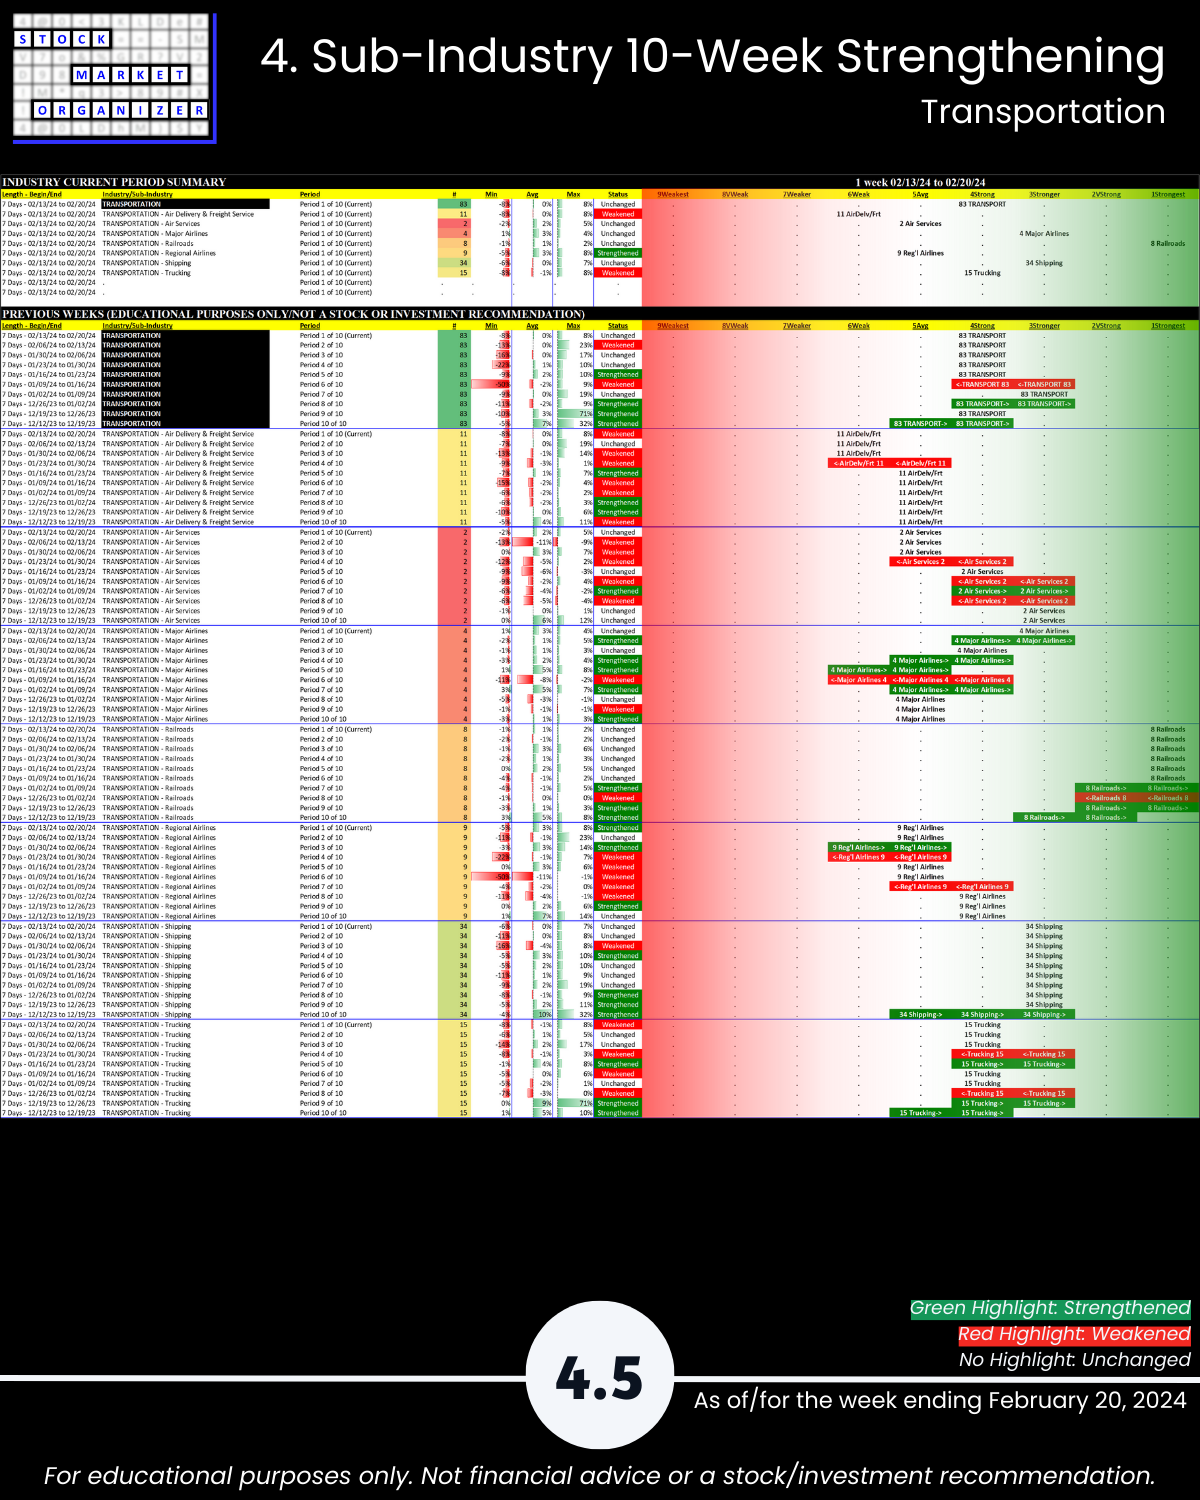
4. Sub-industry 10-Week Strengthening
5. Stocks Outliers: Strongest/Weakest Rated
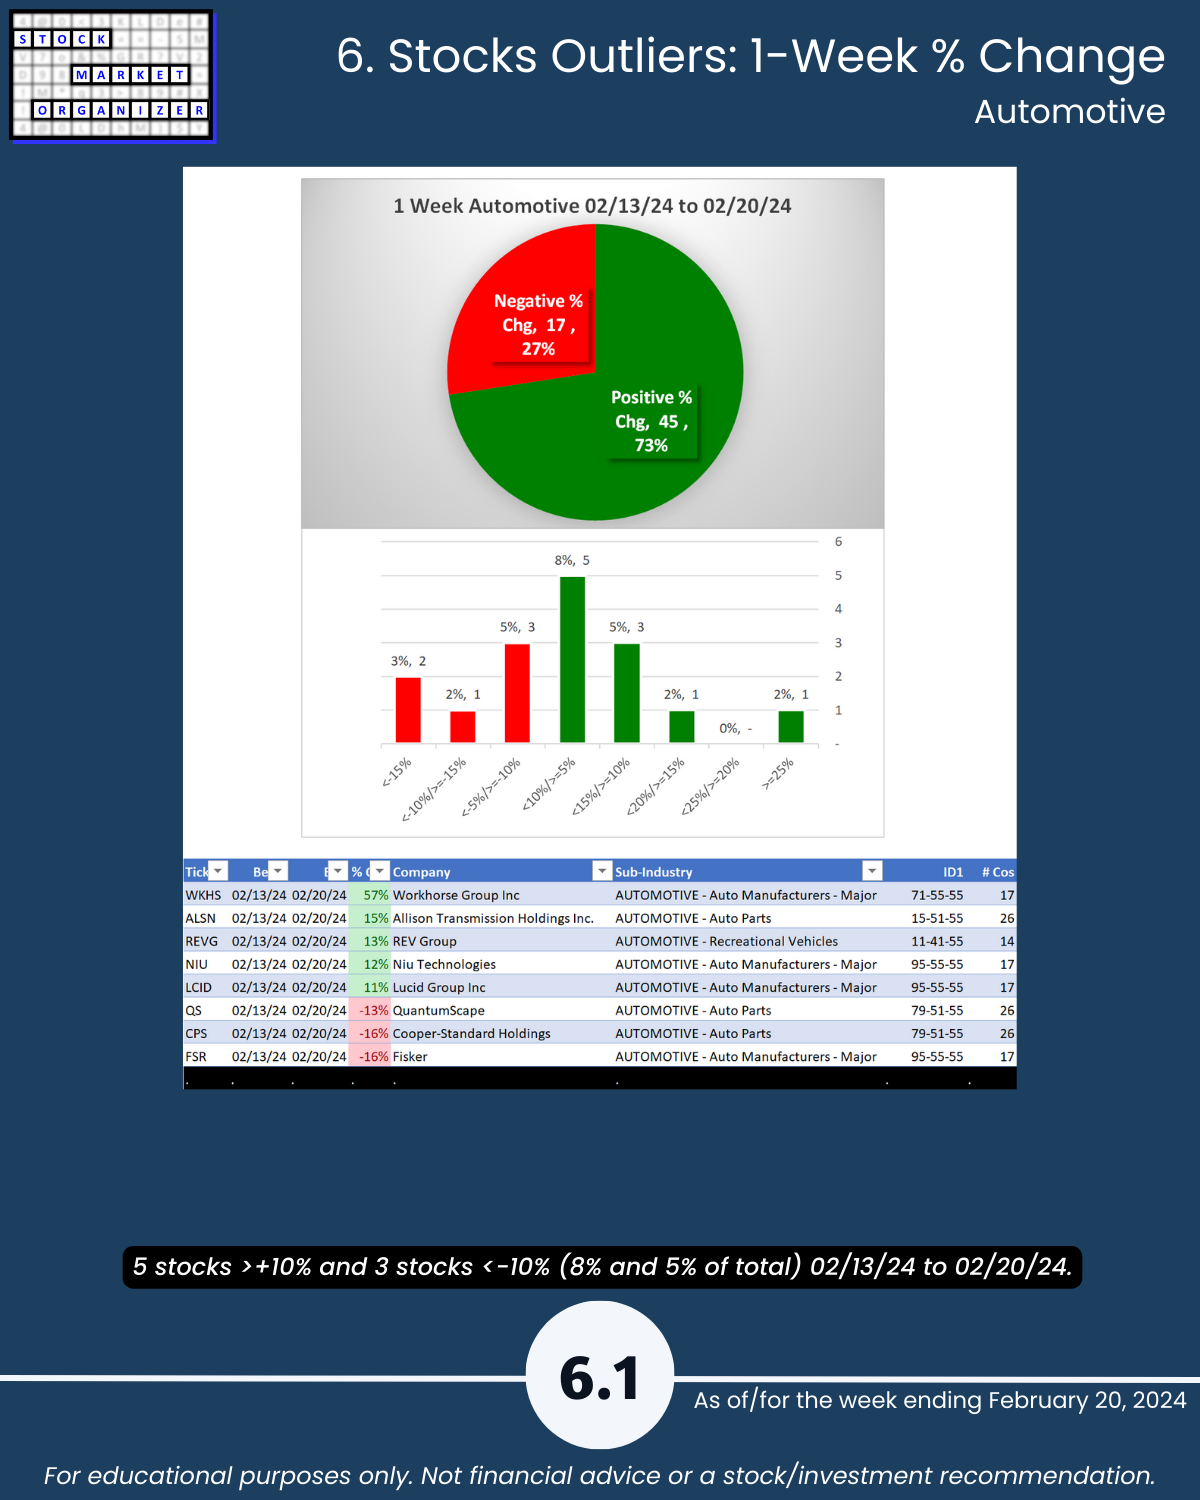
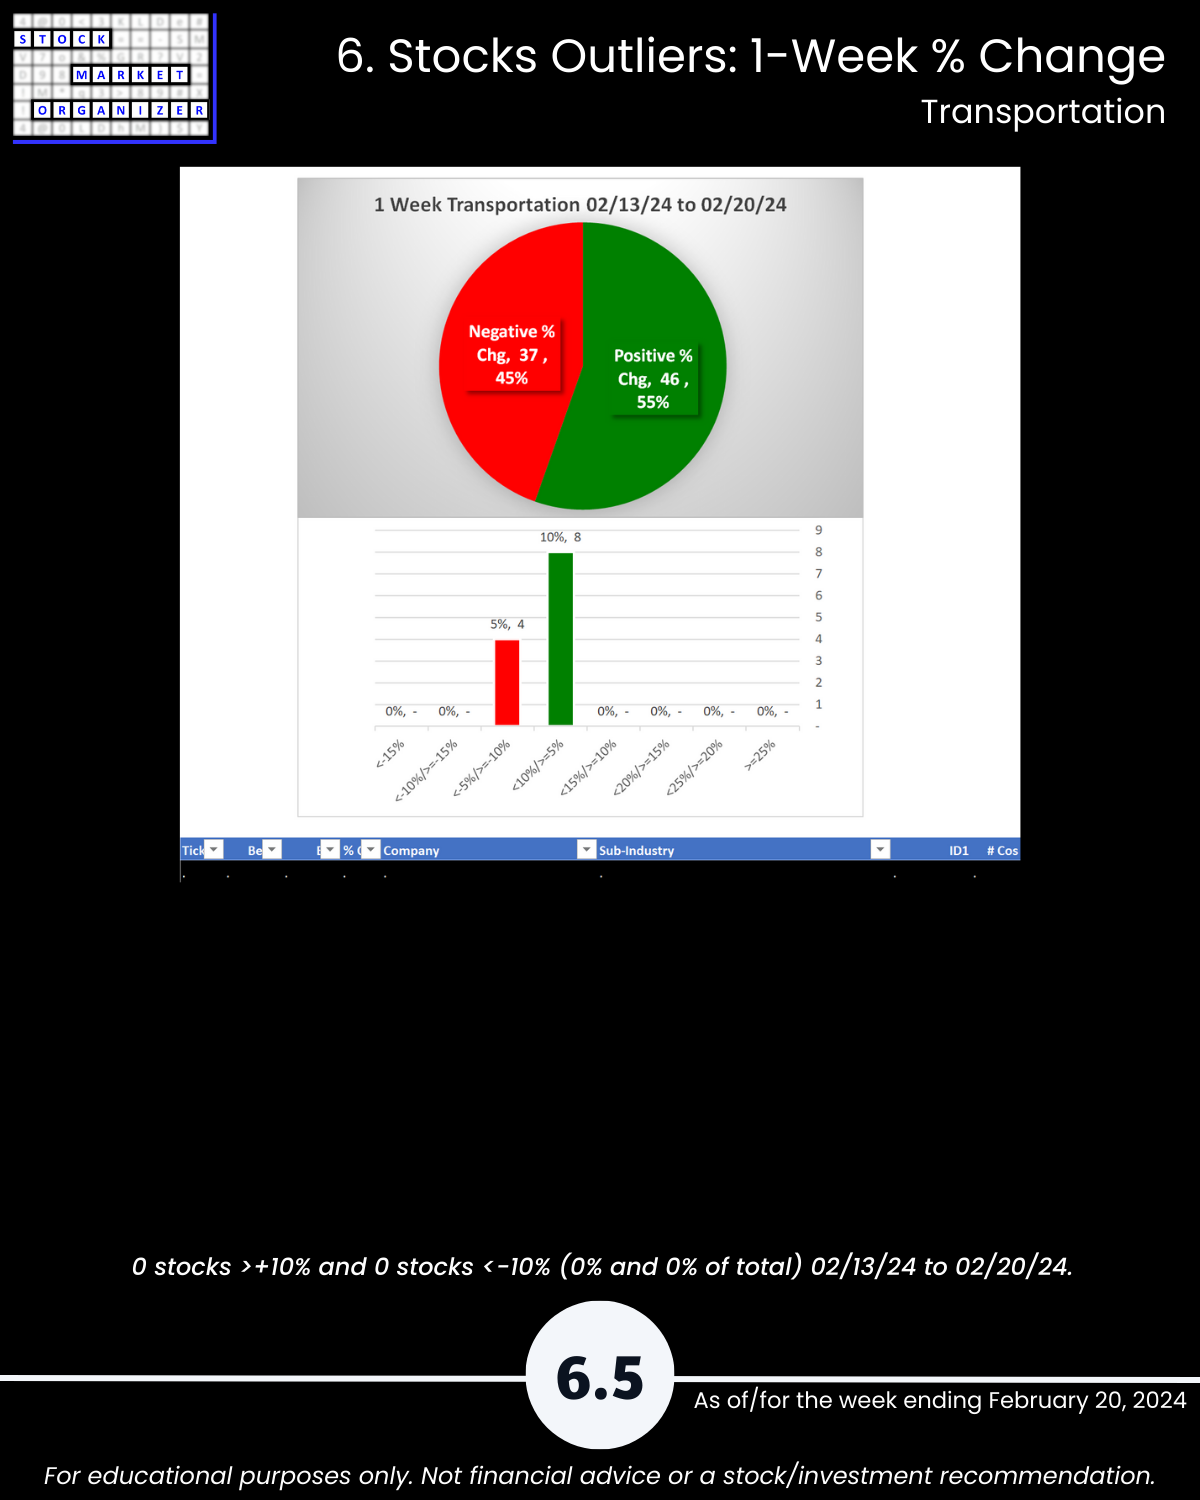
6. Stocks Outliers: 1-Week % Change
7. Stocks Outliers: 5-Year Highs/Lows