SMO Exclusive: Strength Report Financial Sector 2024-12-31 Weakened -0.4 to 4.5 Strength Score
Overview
This post consists of the following sections:
I. KEY BACKGROUND INFORMATION
II. FINANCIAL SECTOR DETAILED ANALYSIS
SECTION I: KEY BACKGROUND INFORMATION
Sector Weekly Summary
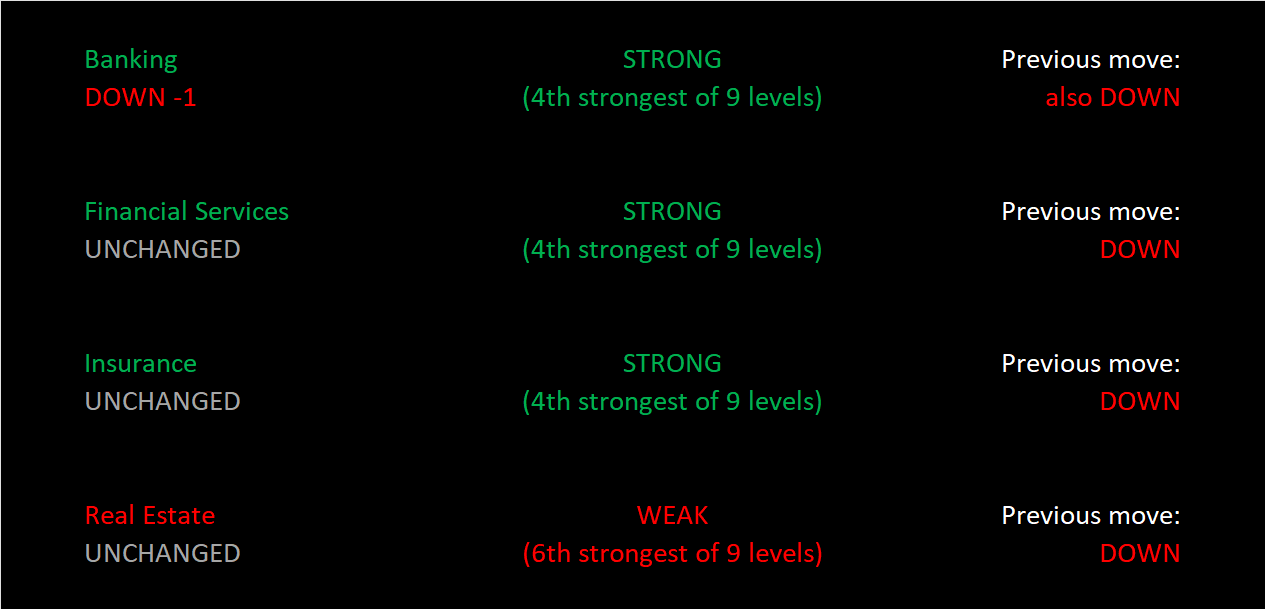
The Financial Sector weakened by 0.4 points to a 4.5 composite score this week as all four industries weakened.
Banking fell one strength rating to 4Strong, where it is tied with Financial Services and Insurance. Real Estate fell one strength rating to 6Weak and remains the sector's laggard.
Difference This vs. ETFs Analysis
Note this analysis is the same as that used for the SPDR ETFs published every Tuesday and Friday (here is yesterday's report dated December 31, 2024) but the two main differences are:
1. Universe of stocks. The ETFs are the largest capitalization stocks, 500 of them in the 11 sector ETFs. In this analysis, there are approximately 2,700 stocks.
2. Sub-categorization below the market level. The ETF analysis with 500 stocks is limited to sector strengthening and weakening. This analysis with +/-2,700 stocks can be and is segregated into 29 industry groups and in turn 189 sub-industry groups.
There is a Financials ETF (symbol XLF) which is separate from the Real Estate ETF (symbol XLRE). The Financials sector in this analysis includes Real Estate with Banking, Financial Services, and Insurance.
Per today's ETF strength analysis, XLF/Financials is rated 4Strong and XLRE/Real Estate is rated 6Weak, with Real Estate weakening one rating. This means the large cap stocks align with the mid-/small-cap stocks in these sectors.
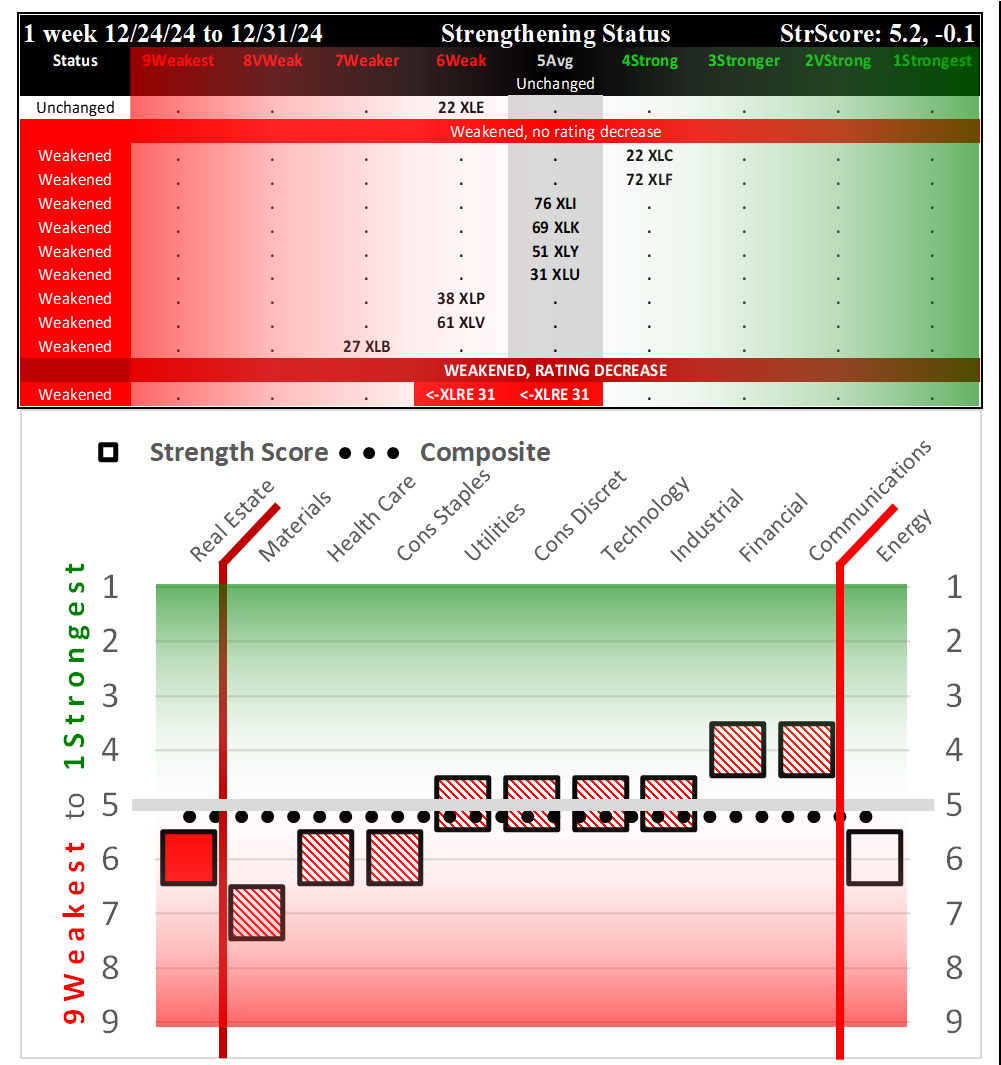
December 31, 2024 strength ratings for the 11 SPDR ETFs show the XLF/Financial ETF as tied for strongest at 4Strong and XLRE/Real Estate falling one strength level to 6Weak.
How would I interpret and use this information?
Recognizing that anything can happen at any time and I will never know the reason why until after the fact if ever, I am looking to give myself the best chances of an individual stock going my desired direction by stacking strength going long or stacking weakness going short, depending on strength/strengthening and weakness/weakening at the stock, sub-industry, industry, sector, and market levels. One quick way to discern this is to look at the differing market levels in terms of headwinds and tailwinds as noted below.
Current Market and Sector Environment: HEADWIND
- MARKET: The Market Strength Score changed to positive ("risk on") as of Friday, December 27 = HEADWIND
- SECTOR: The Financial sector weakened this week, falling 0.4 points to a 4.5 overall rating = Headwind
- If at all interested in positions in this sector, it is better to go where there is strength/strengthening - as reflected by price. This Stock Market Organizer methodology explicitly reveals this.
Current Industry/Sub-Industry Environment: Headwind
- The Banking industry weakened one rating to 4Strong = headwind
- The Financial Services industry weakened but retained a 4Strong rating = headwind/neutral
- Insurance was weakened but retained a 4Strong rating = headwind/neutral
- Real Estate weakened one rating and fell below average to 6Weak= headwind
Final Comments
There is absolutely no way of determining how long this environment will last. All one can do is find an objective way of measuring whether any given environment offers headwinds or tailwinds and then act accordingly based on these measurements.
Details are below shown in a manner not available elsewhere because I created it from scratch to continually answer this question: “Where is there strengthening and weakening in the market at the stock, sub-industry, industry, and sector levels?” Combine this with the top-down Market Strength Score and Sector Risk Gauge to get a key competitive advantage of understanding strength at every level. Why? Because the market does not have to be so complicated.
SECTION II: FINANCIAL SECTOR DETAILED ANALYSIS
Section Table of Contents
- Introduction - Industry Components
- INDUSTRY 1-Week Strengthening, Positive/Negative % Stocks
- INDUSTRY 10-Week Strengthening
- SUB-INDUSTRY 10-Week Strengthening
- STOCKS Outliers: Strongest/Weakest Rated
- STOCKS Outliers: 1-Week % Change
- STOCKS Outliers: 5-Year Highs/Lows
1. Introduction - Industry Components
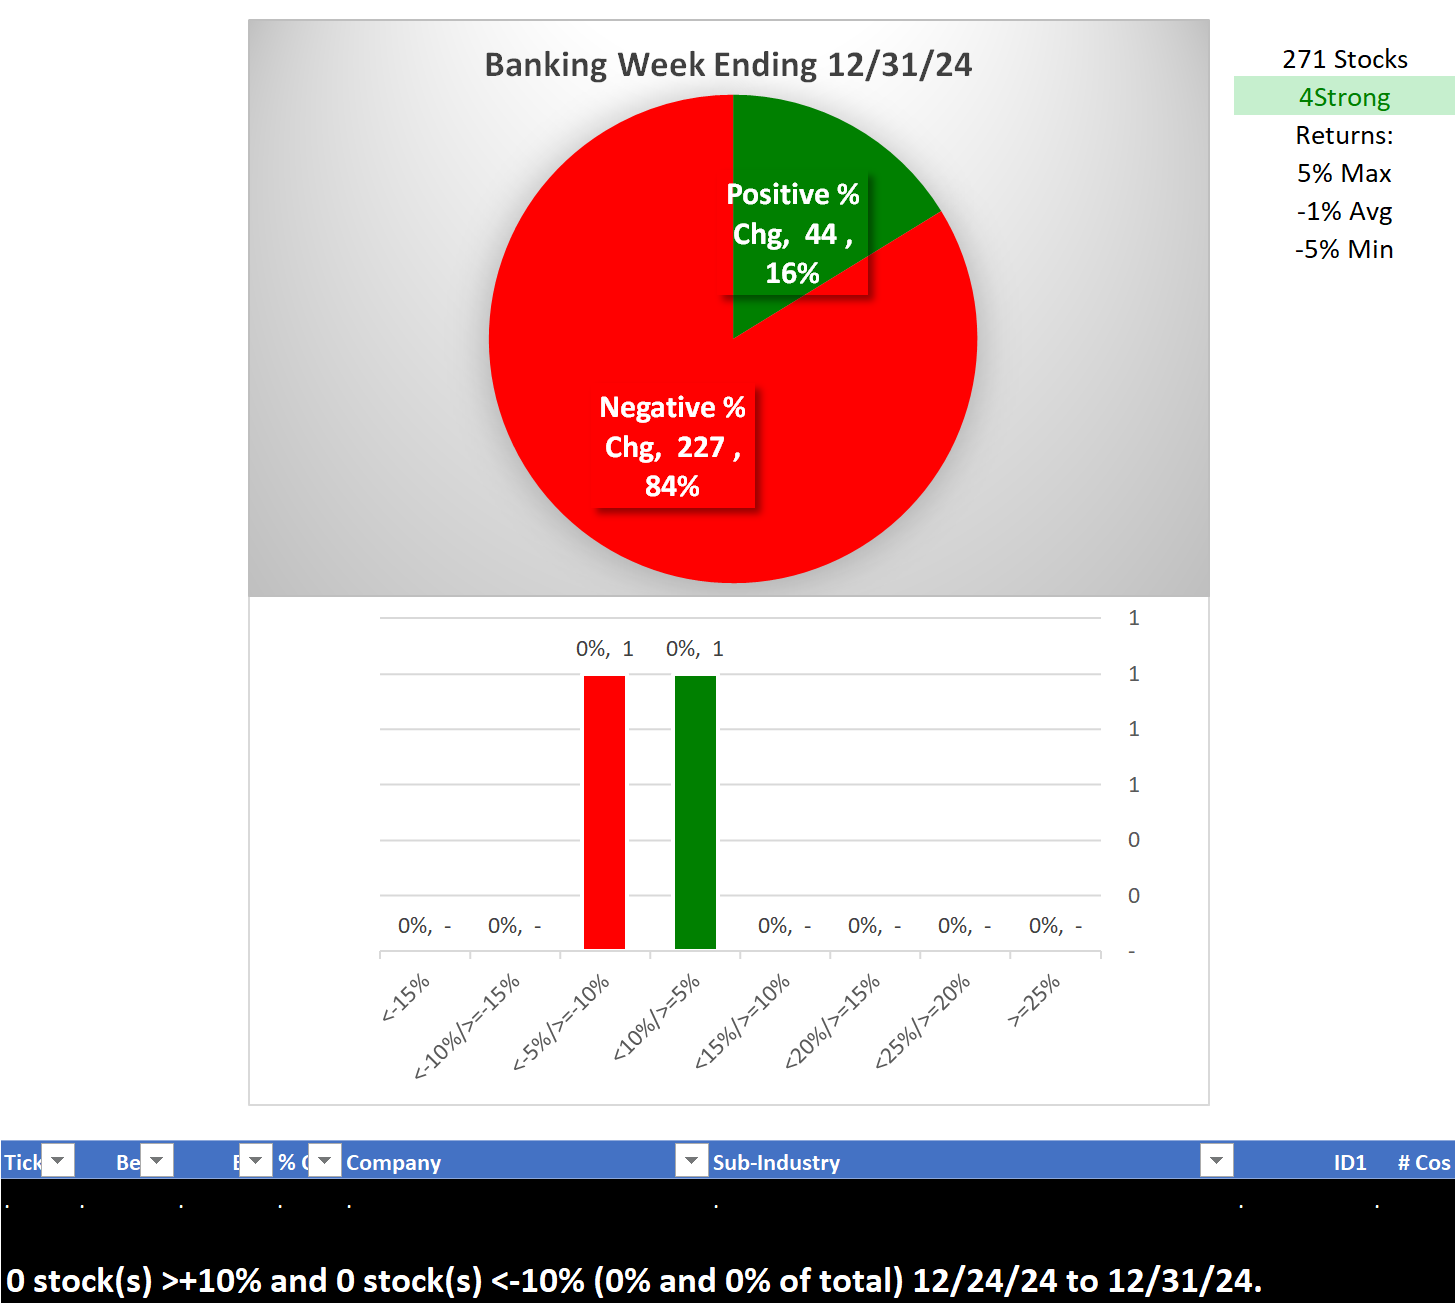
Banking
Largest of 9 sub-industries (271 stocks, average 30)
- Regional - Northeast Banks (90 stocks)
- Regional - Mid-Atlantic Banks (32 stocks)
- Regional - Pacific Banks (32 stocks)
- Savings & Loans (31 stocks)
- Regional - Midwest Banks (29 stocks)
Top 10 Market Caps: JPM/JPMorgan Chase and Co, BAC/Bank Of America Corp, WFC/Wells Fargo & Company, RY/Royal Bank Of Canada, HSBC/HSBC Holdings Plc, C/Citigroup, TD/Toronto Dominion Bank (The), MUFG/Mitsubishi UFJ Financial Group Inc. ADS, SAN/Banco Santander SA, USB/US Bancorp
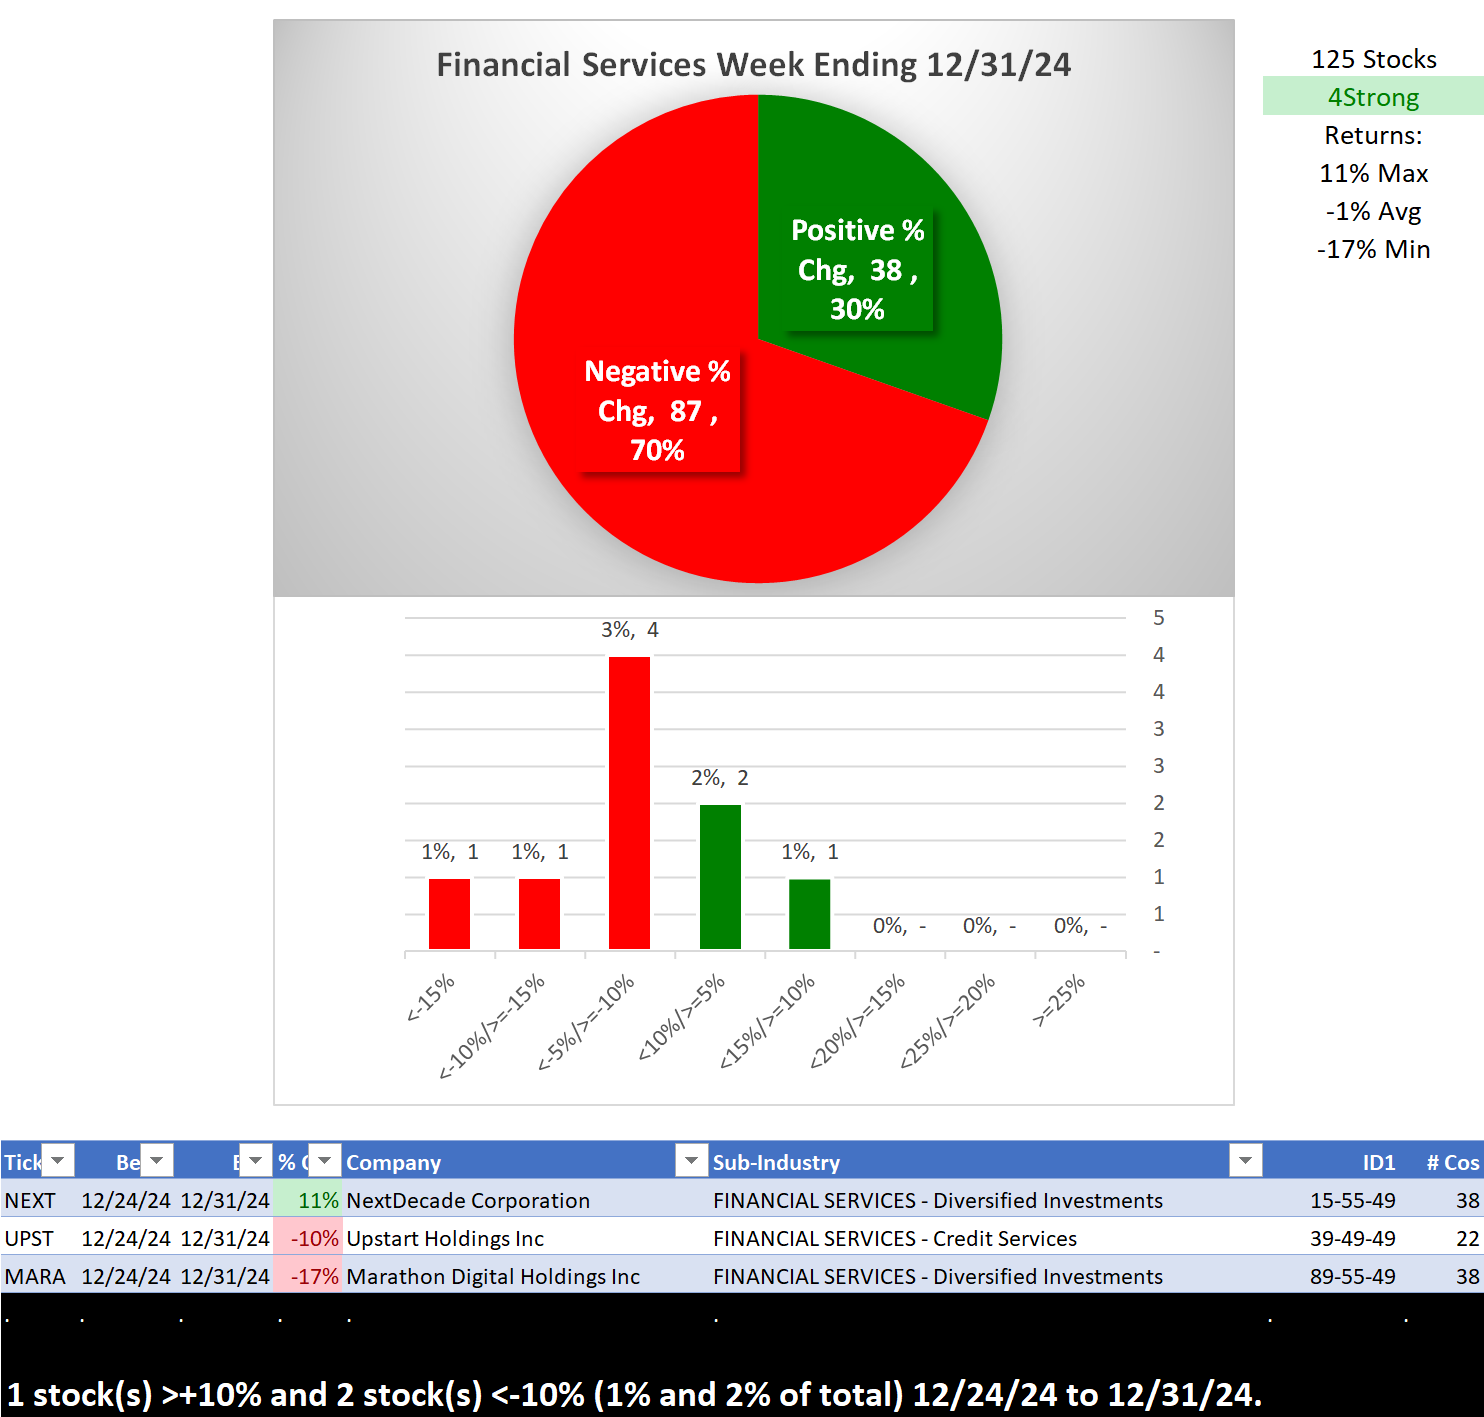
Financial Services
Largest of 5 sub-industries (125 stocks, average 25):
- Asset Management (46 stocks)
- Diversified Investments (38 stocks)
- Credit Services (22 stocks)
Top 10 Market Caps: MS/Morgan Stanley, AXP/American Express Co, GS/Goldman Sachs Group Inc, BLK/Blackrock Incorporated, SCHW/Charles Schwab Corp, KKR/KKR & Co. L.P., BX/Blackstone Inc, ICE/Intercontinental Exchange Inc, APO/Apollo Asset Management, PYPL/PayPal Holdings Inc
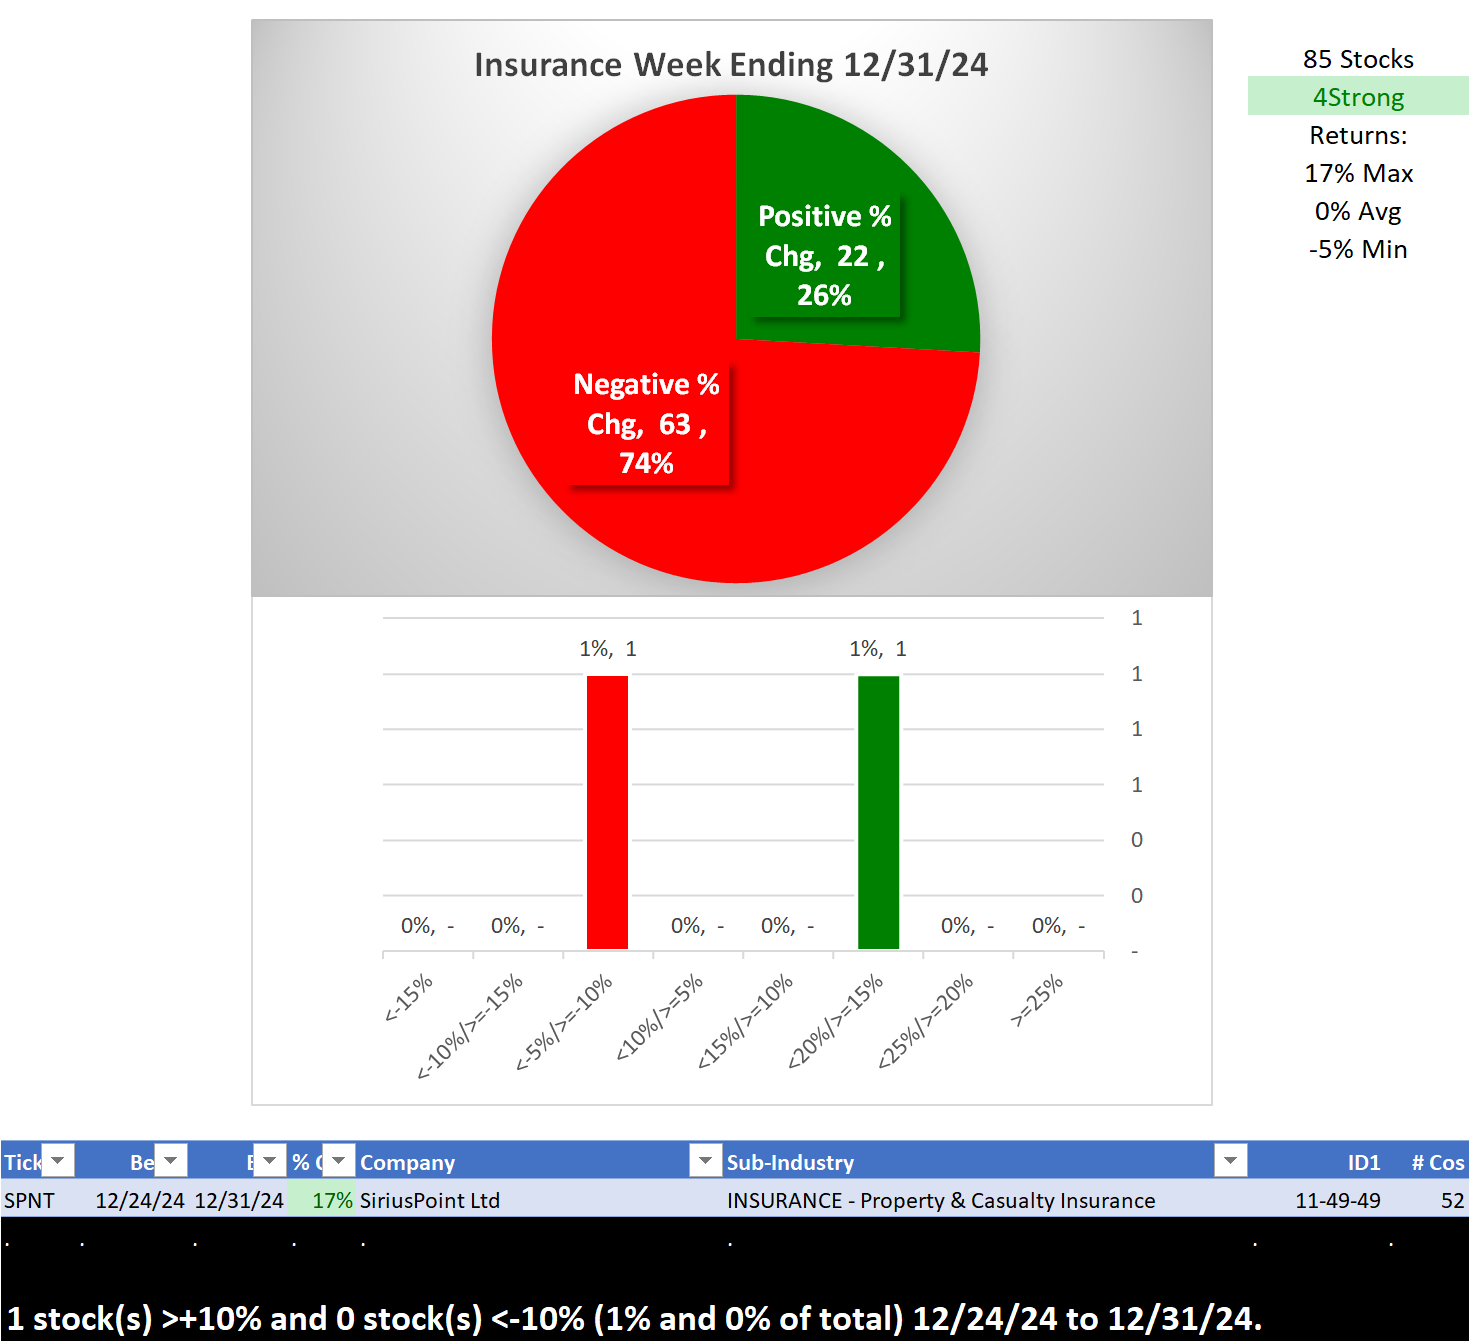
Insurance
Largest of 5 sub-industries (85 stocks, average 17):
- Property & Casualty Insurance (52 stocks)
- Insurance Brokers (12 stocks)
- Life Insurance (12 stocks)
Top 10 Market Caps: BRKA/Berkshire Hathaway Cl A, PGR/Progressive Corp, CB/Chubb Corp, MMC/Marsh & McLennan Cos Inc, AON/Aon PLC, AFL/Aflac Inc, AJG/Arthur J Gallagher & Co, MET/MetLife Inc, TRV/The Travelers Companies Inc, MFC/Manulife Financial Corp.
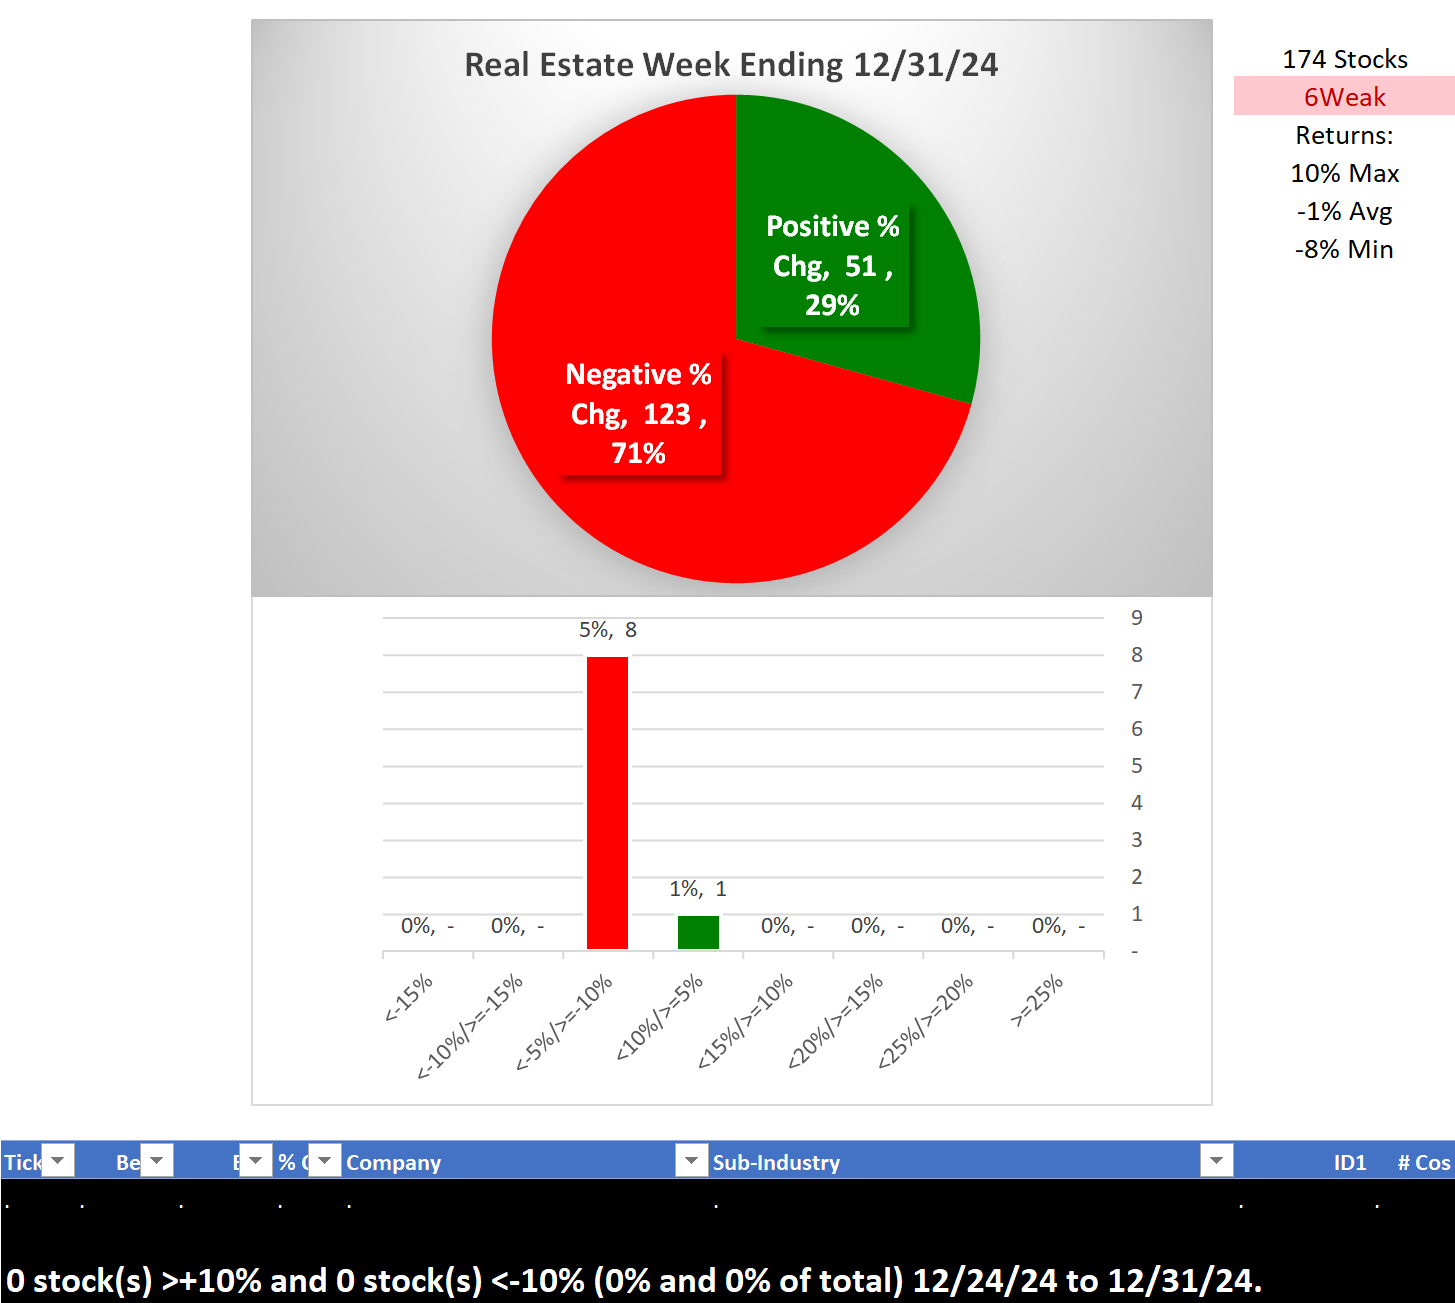
Real Estate
Largest of 8 sub-industries (174 stocks, average 22):
- REIT - Diversified/Industrial (49 stocks)
- Property Management/Development (33 stocks)
- REIT - Residential (24 stocks)
- REIT - Retail (17 stocks)
Top 10 Market Caps: PLD/ProLogis Inc, AMT/American Tower Corp, WELL/Welltower Inc, BN/Brookfield Corporation, PSA/Public Storage, DLR/Digital Realty Trust Inc, SPG/Simon Property Group, O/Realty Income Corp, CBRE/CBRE Group, Inc., EXR/Extra Space Storage Inc
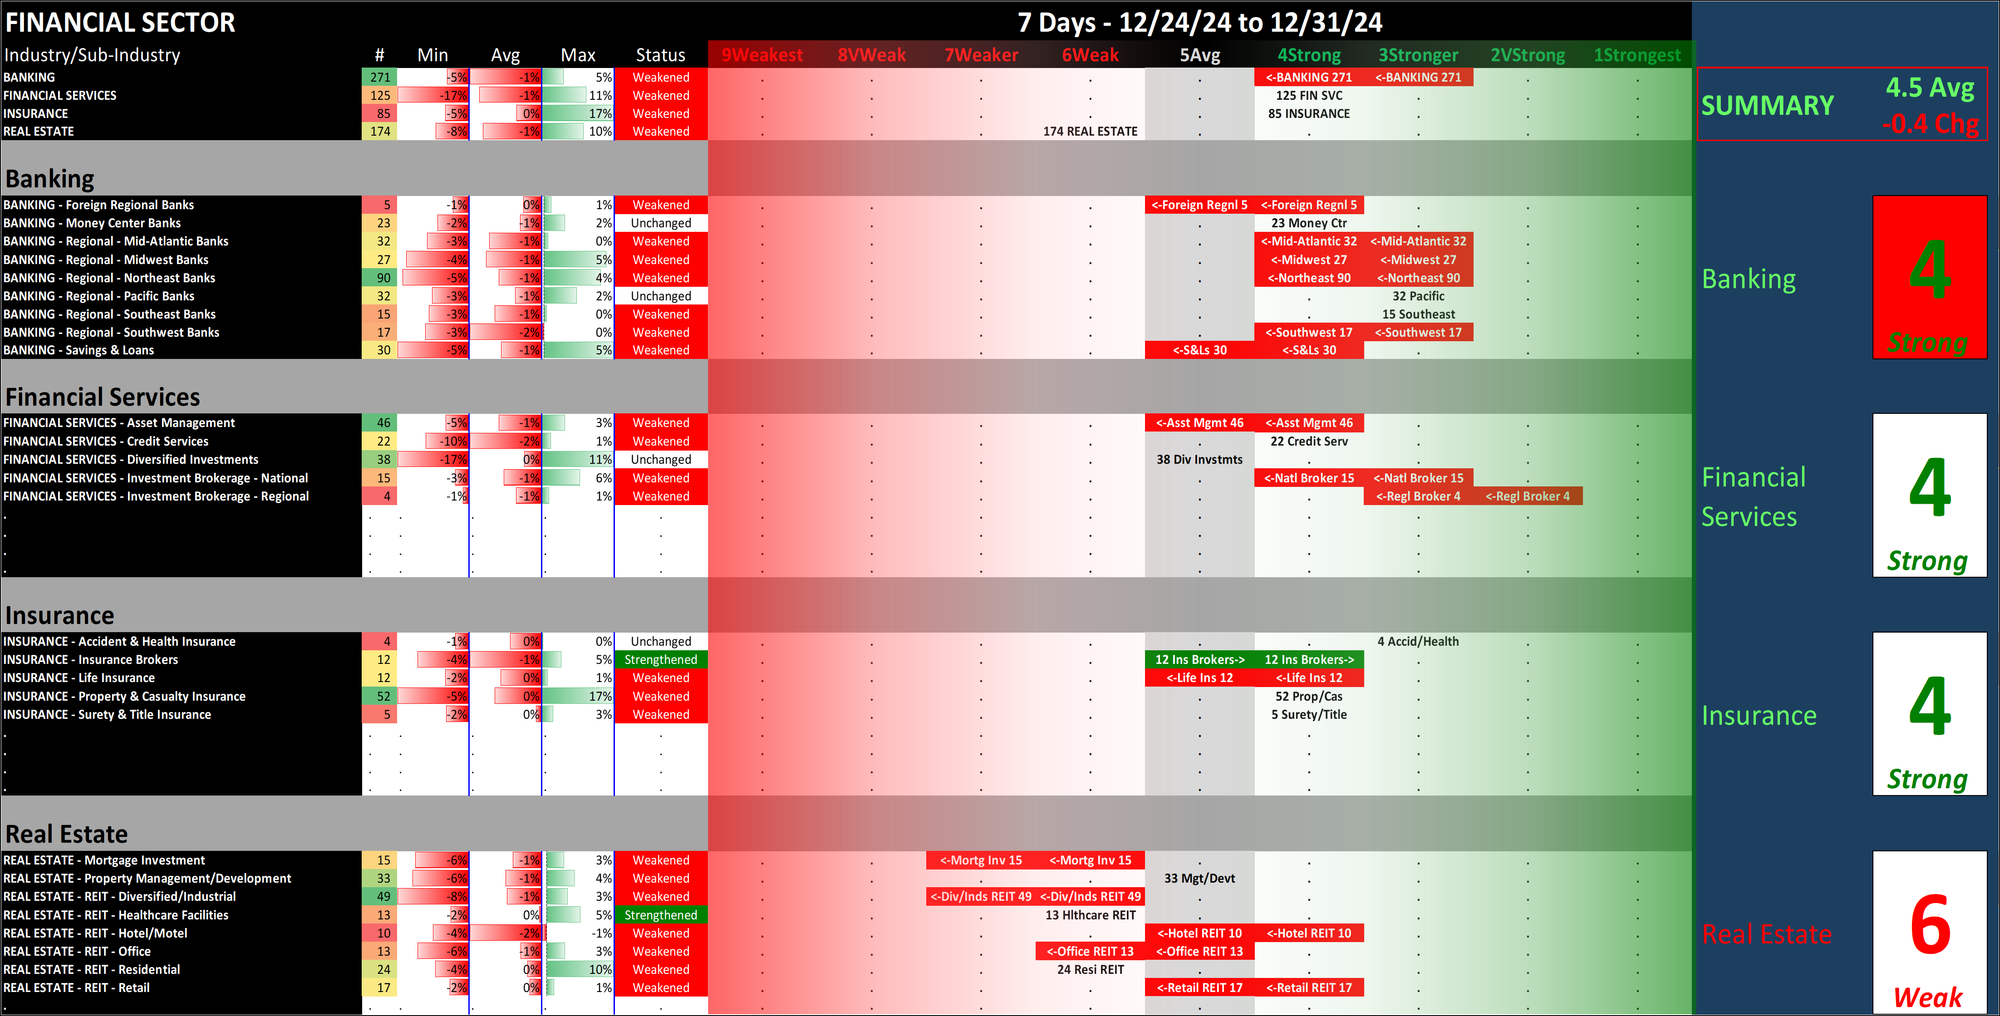
2. INDUSTRY 1-Week Strengthening
Overview
What: A closer 1-week look at industry and sub-industry strengthening
Why: a multi-month rally begins with one up week. Meaningful moves last and can last longer than expected.
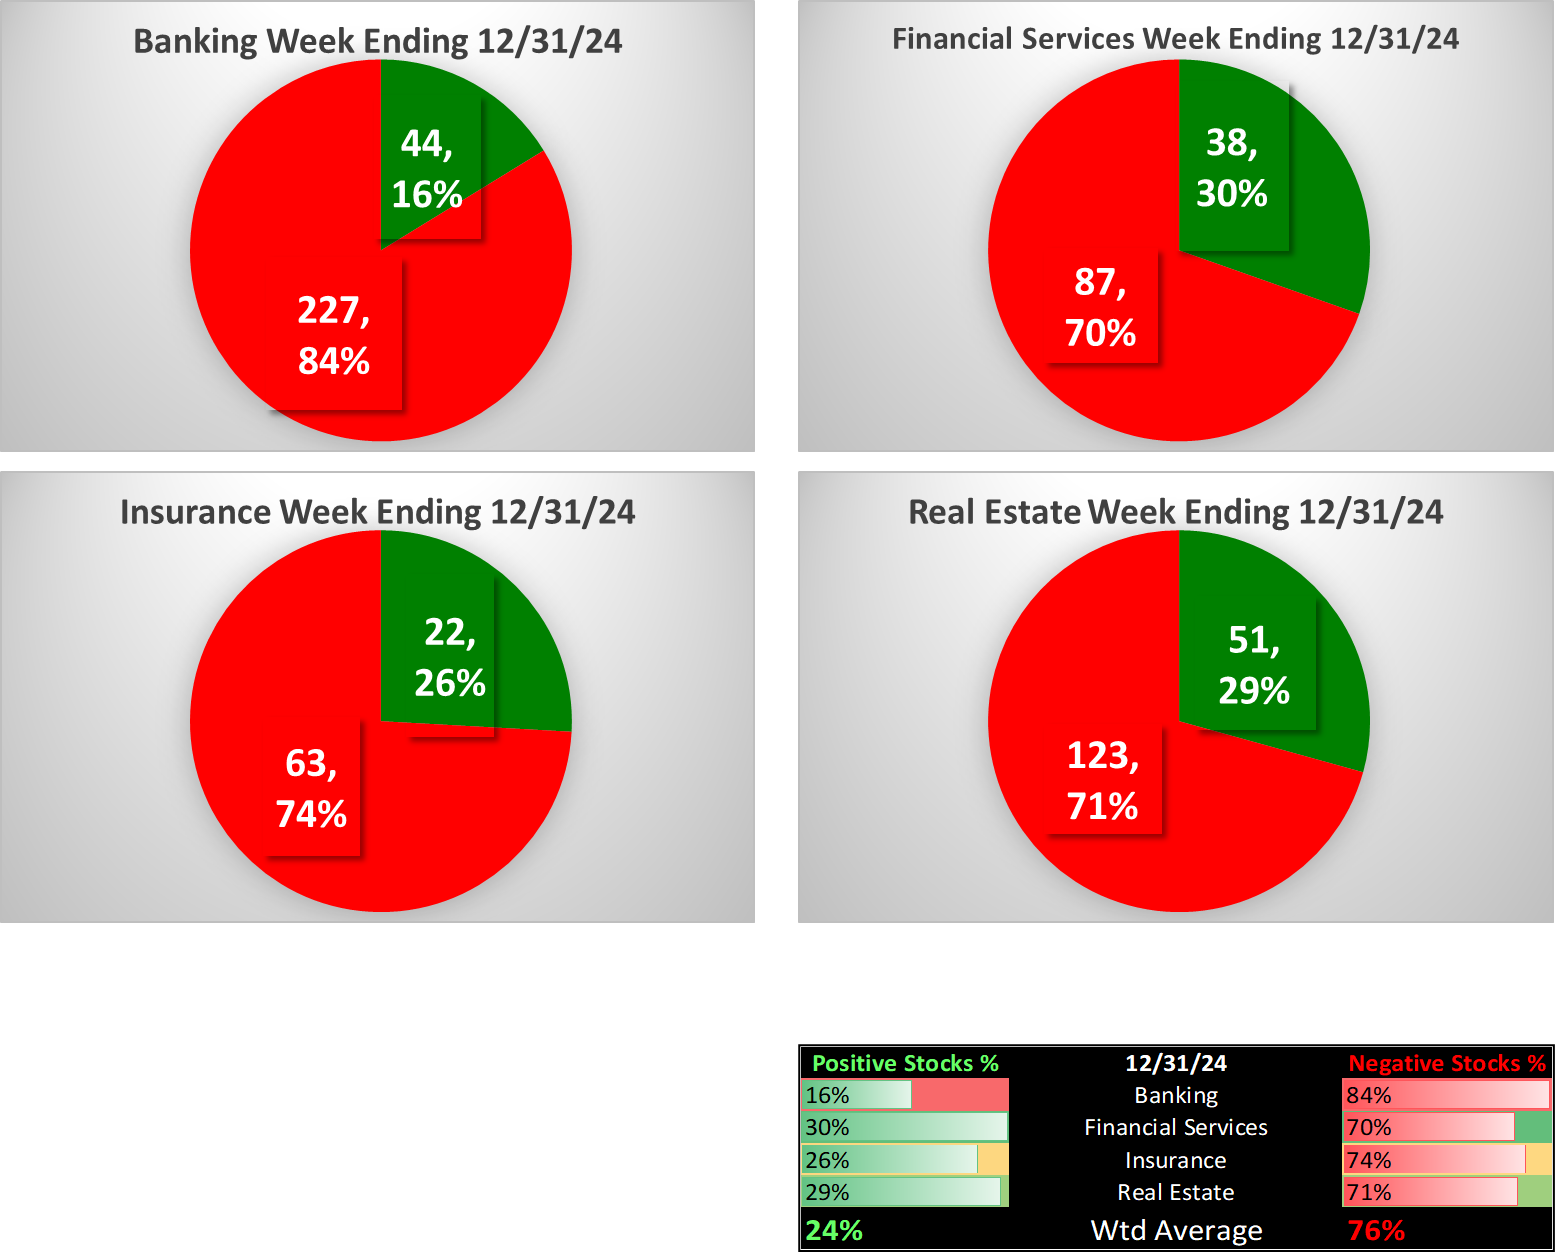
Positive/Negative % Stocks
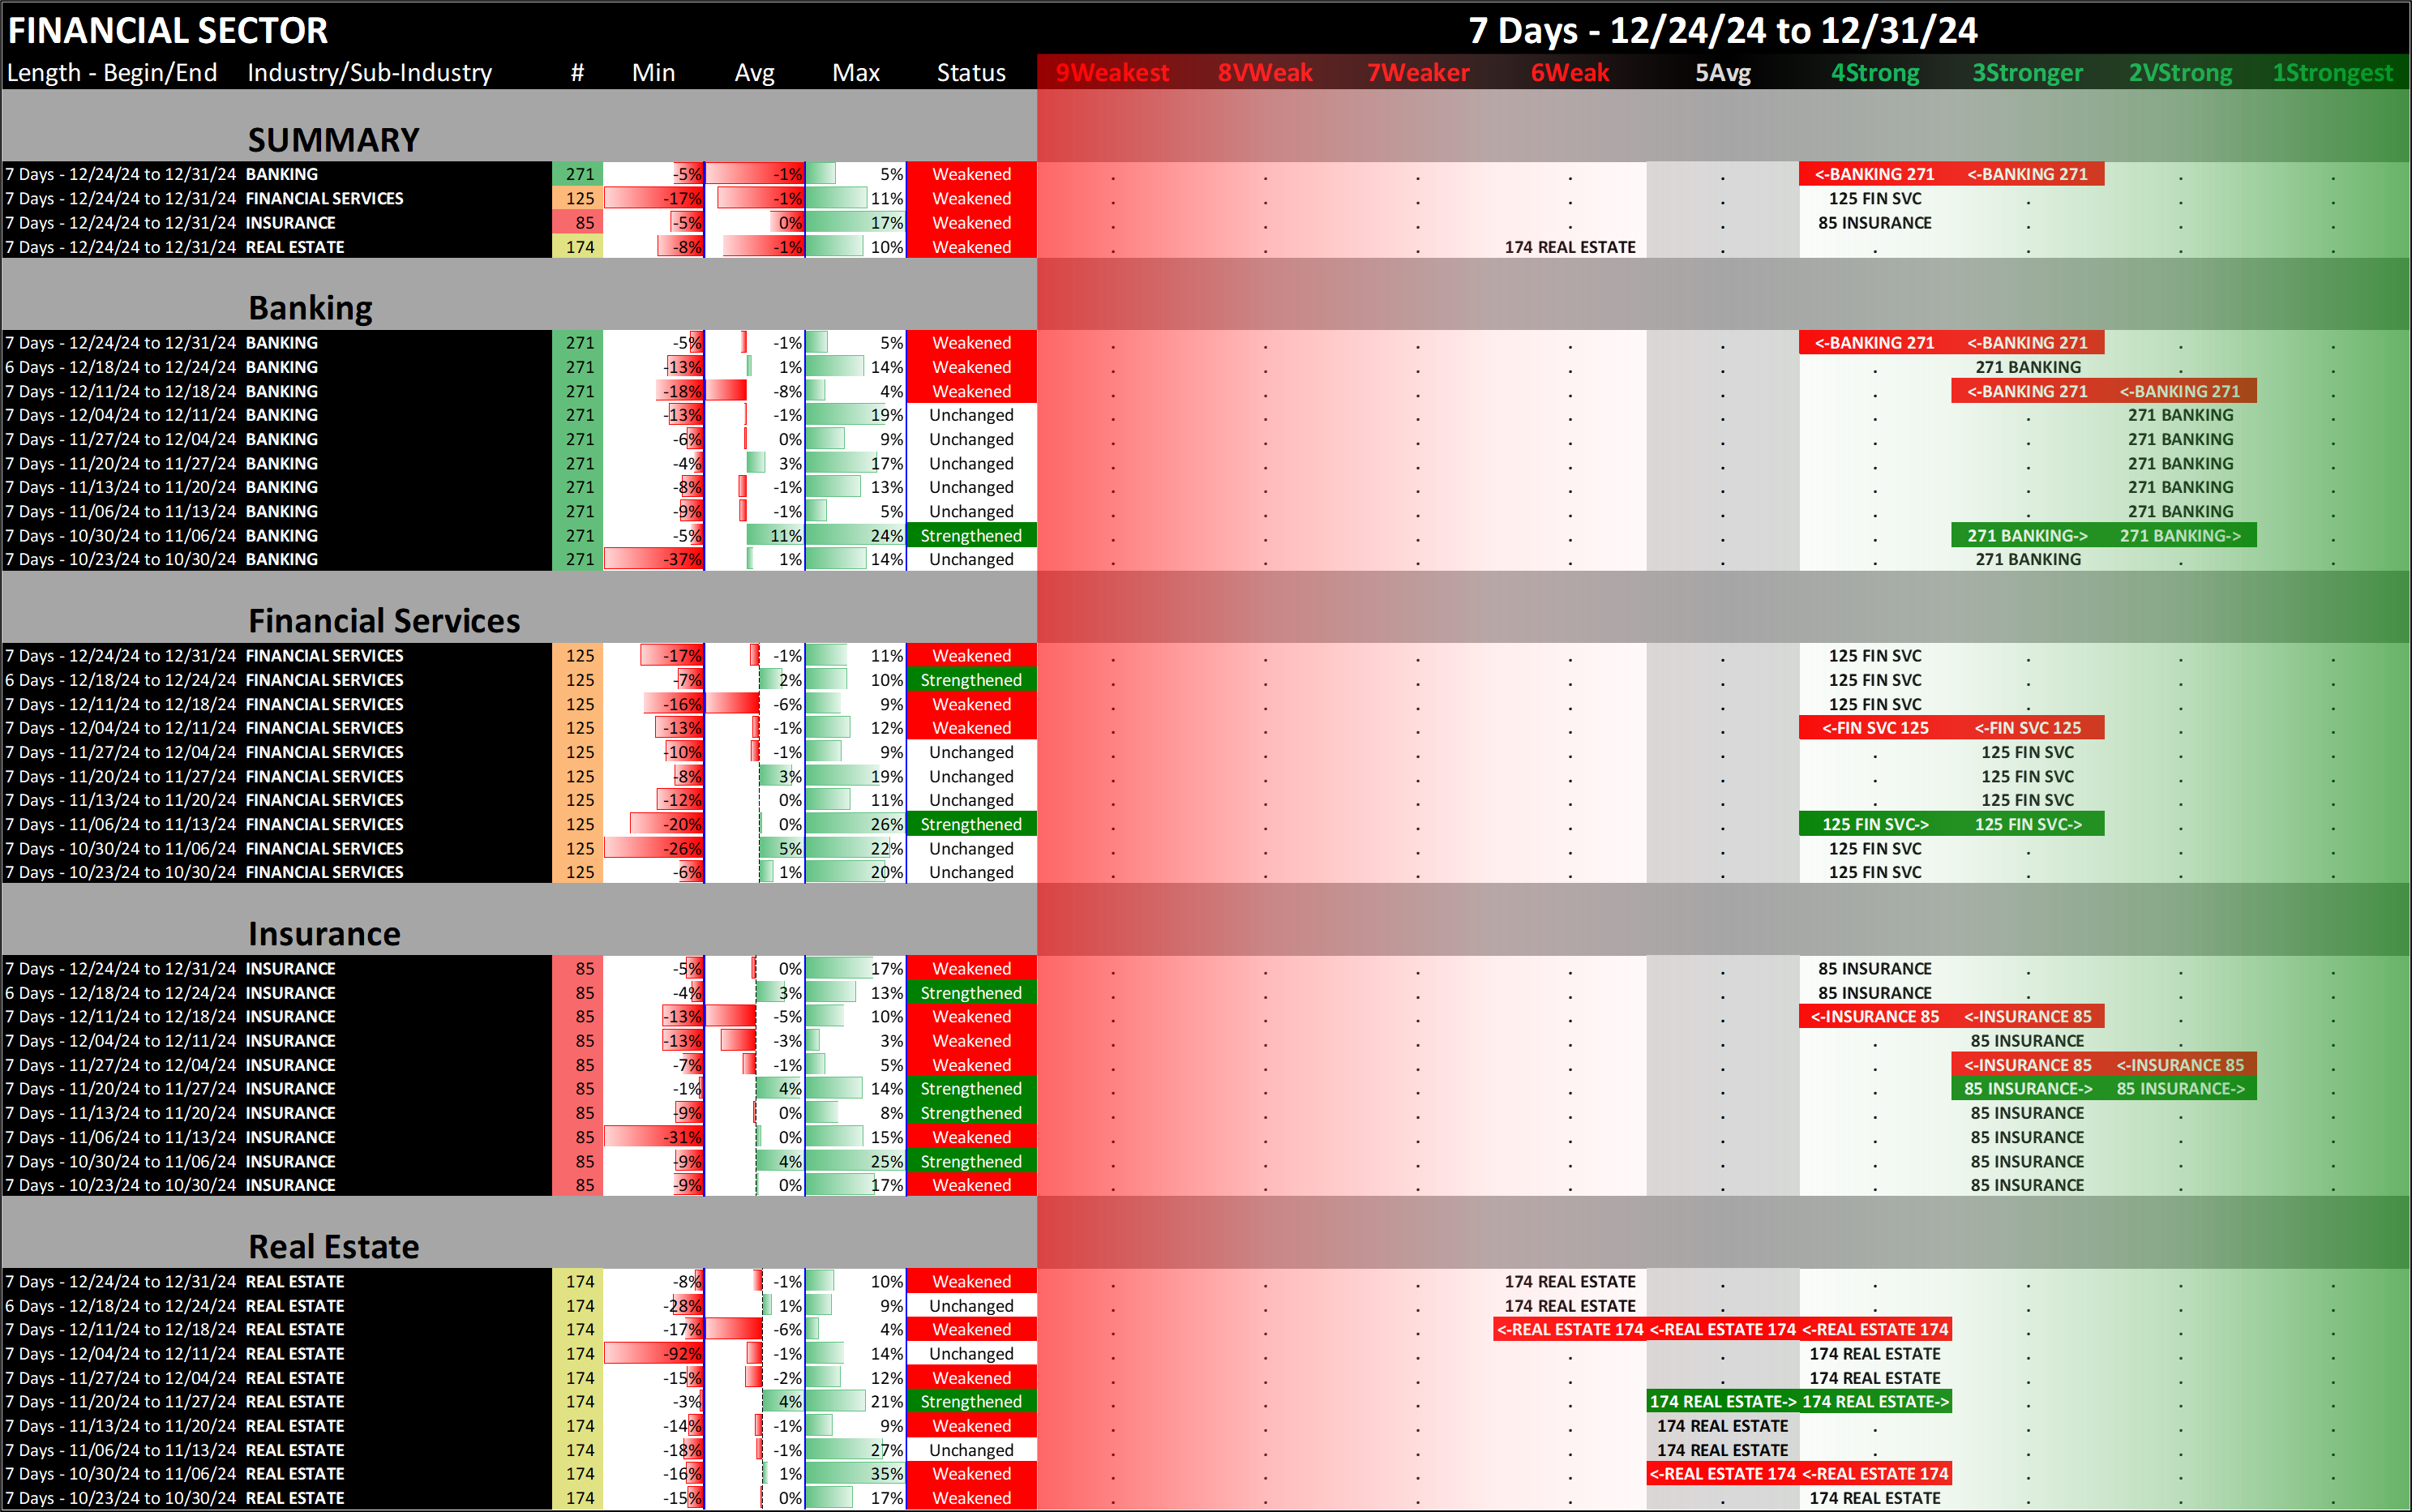
3. INDUSTRY 10-Week Strengthening
Overview
What: A comparative 10-week look at industry strengthening
Why: clearly and quickly understand where there is strengthening and weakening over a relevant time frame
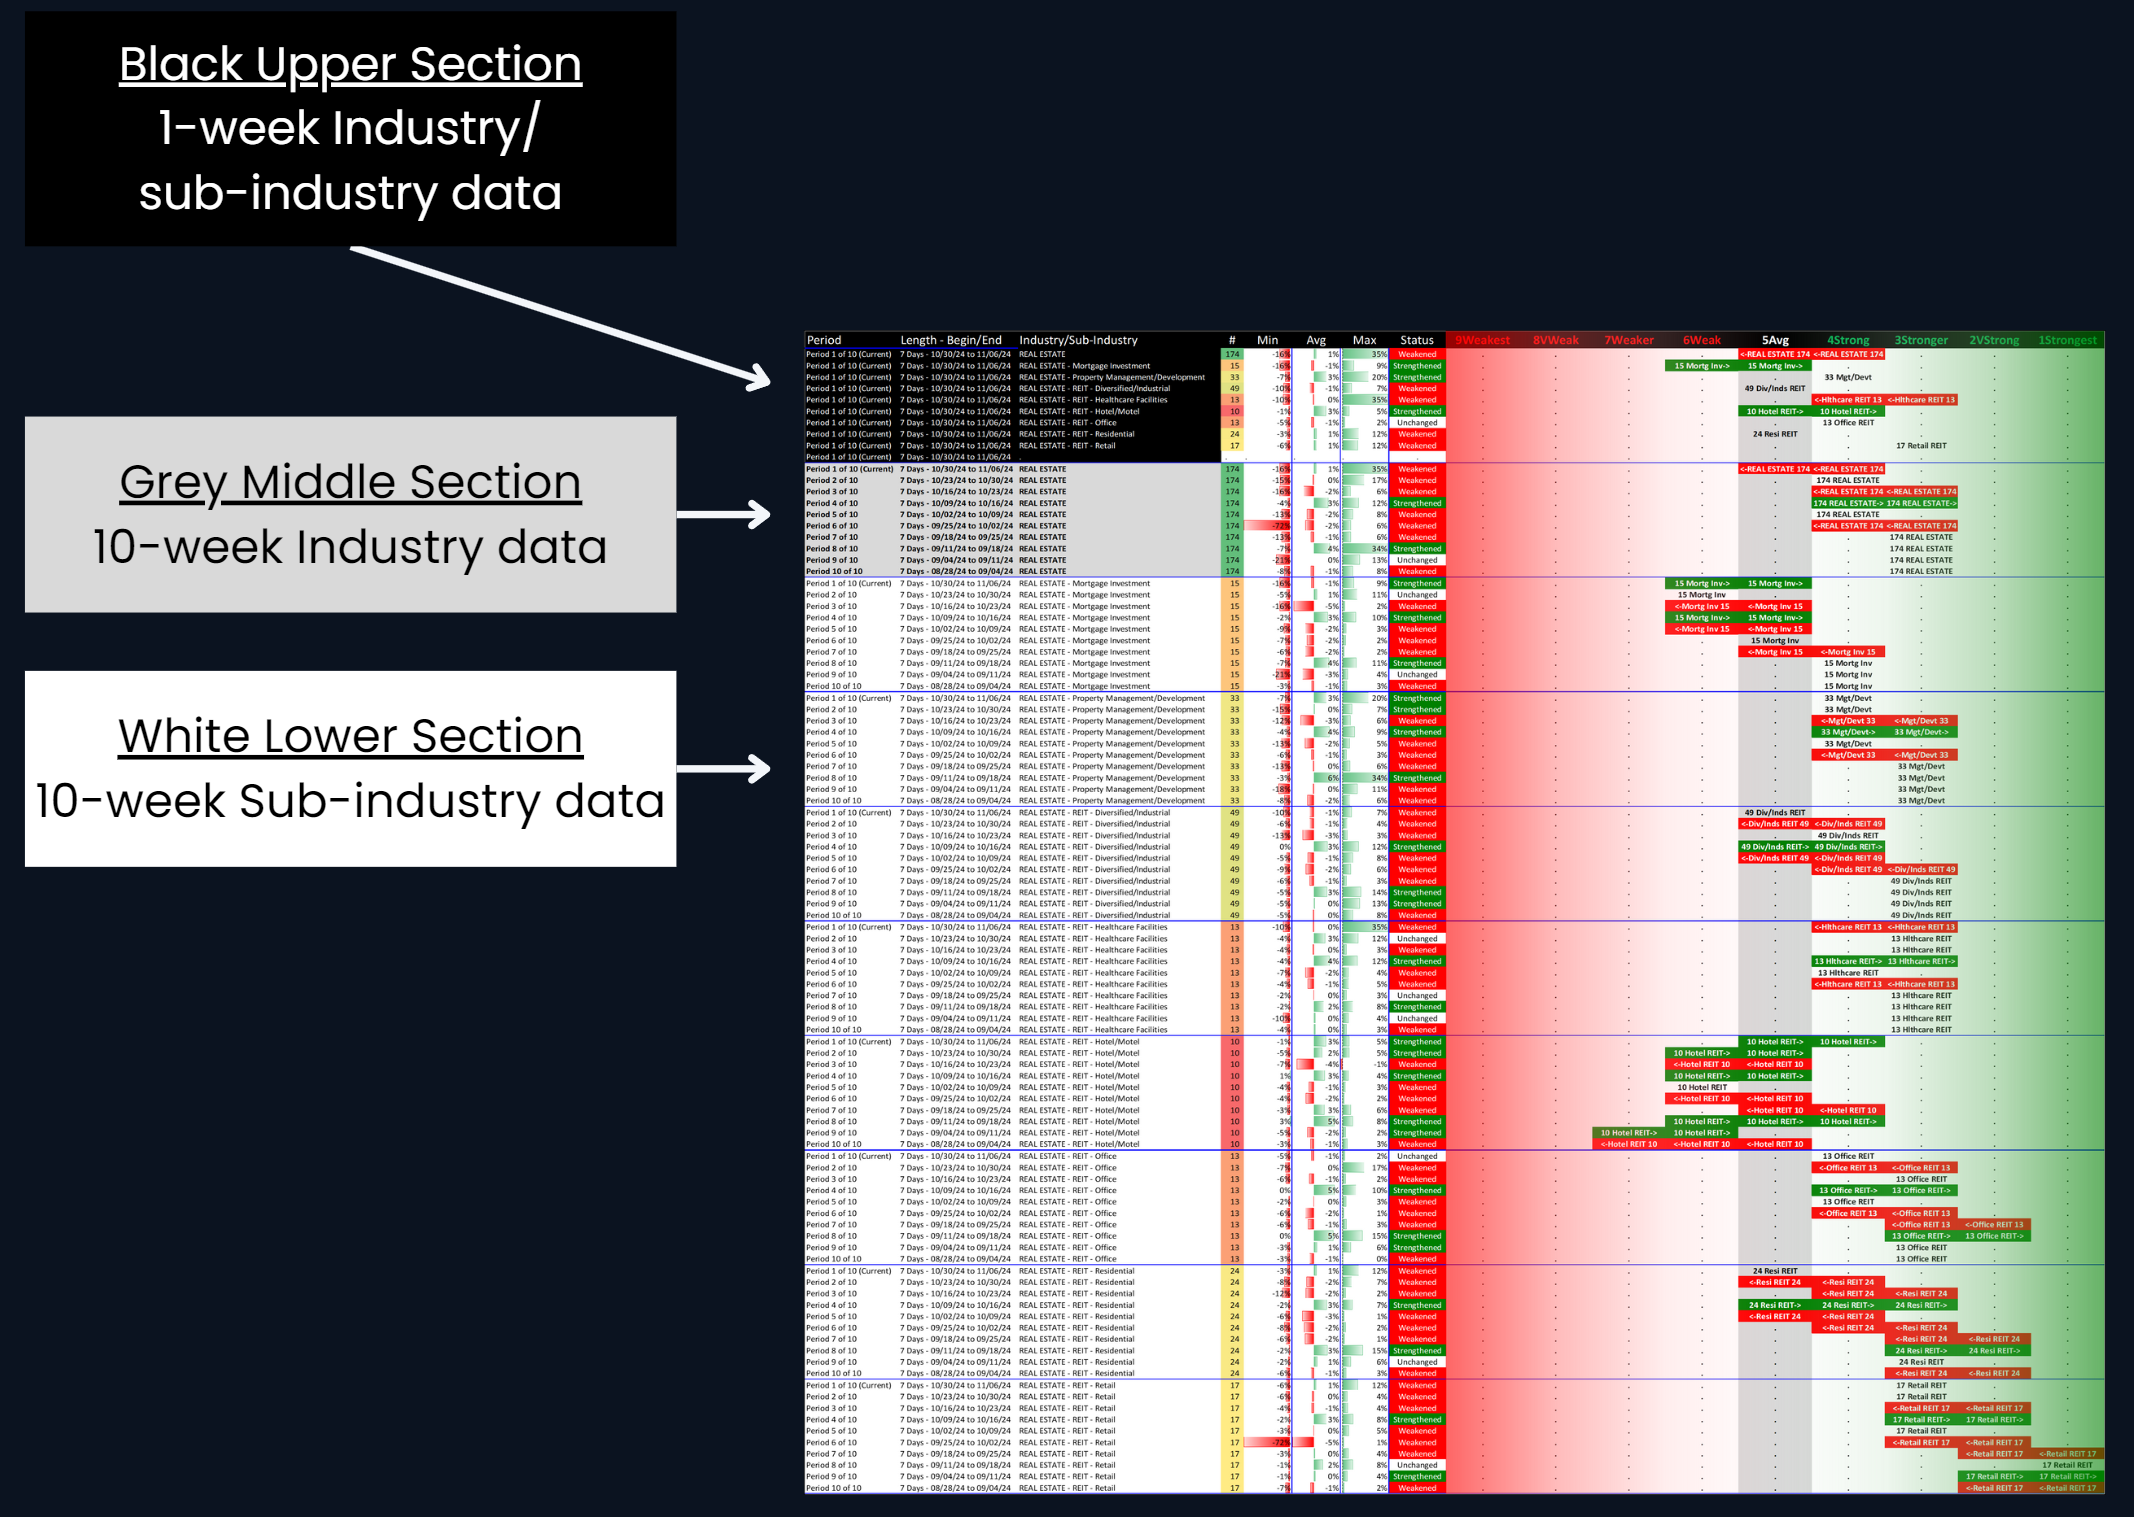
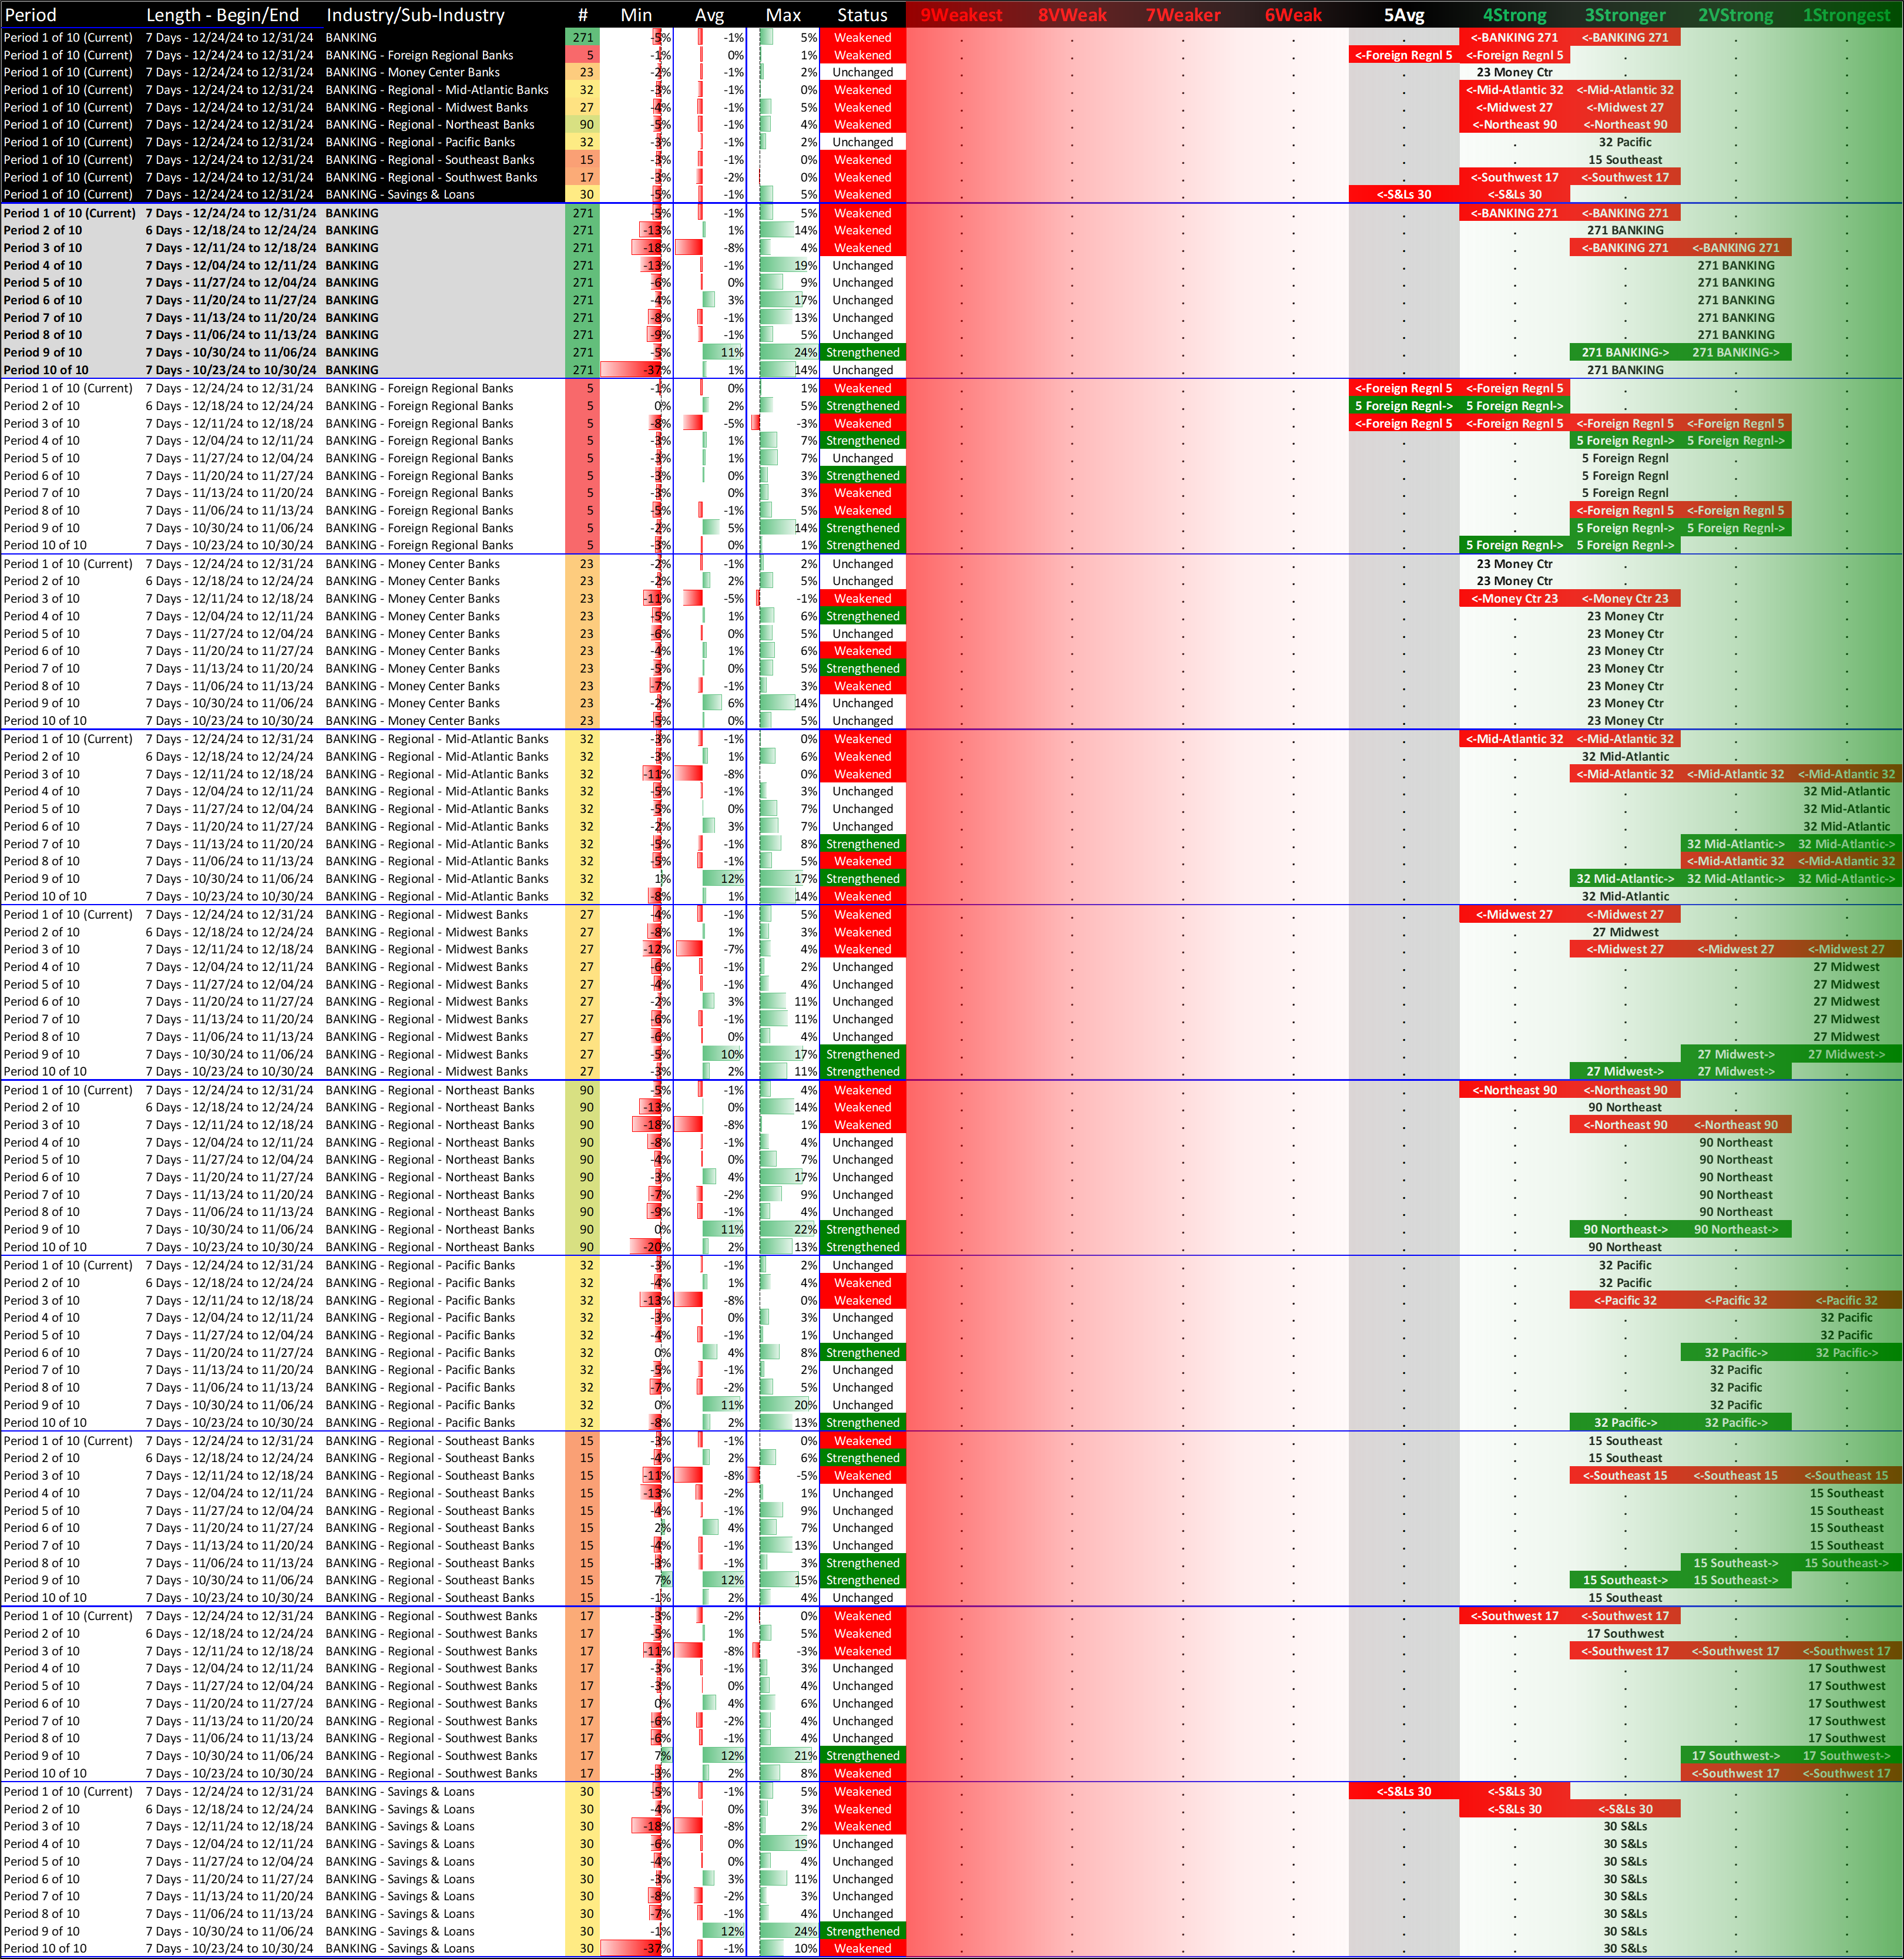
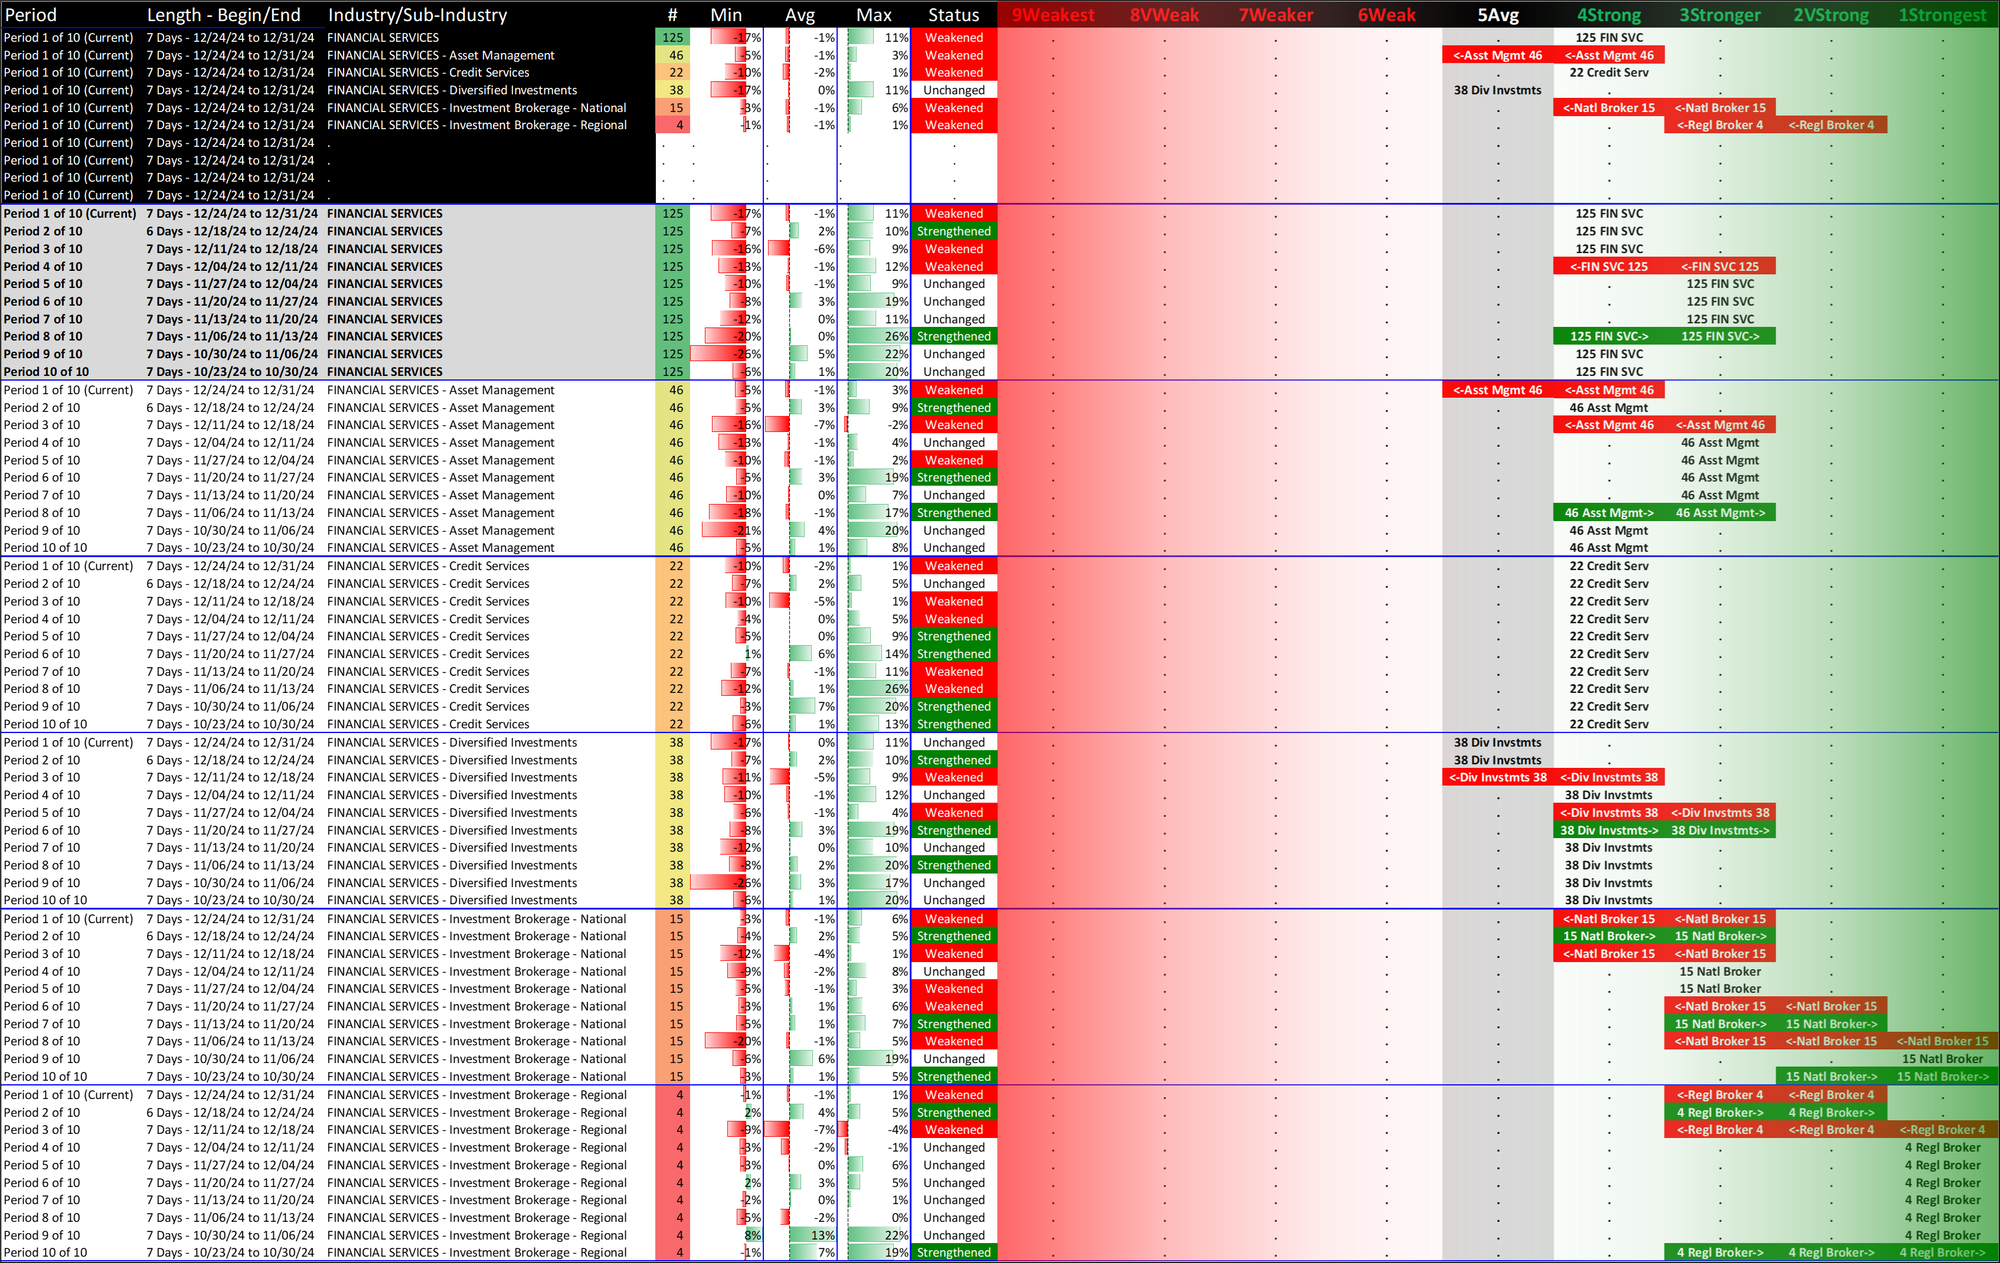
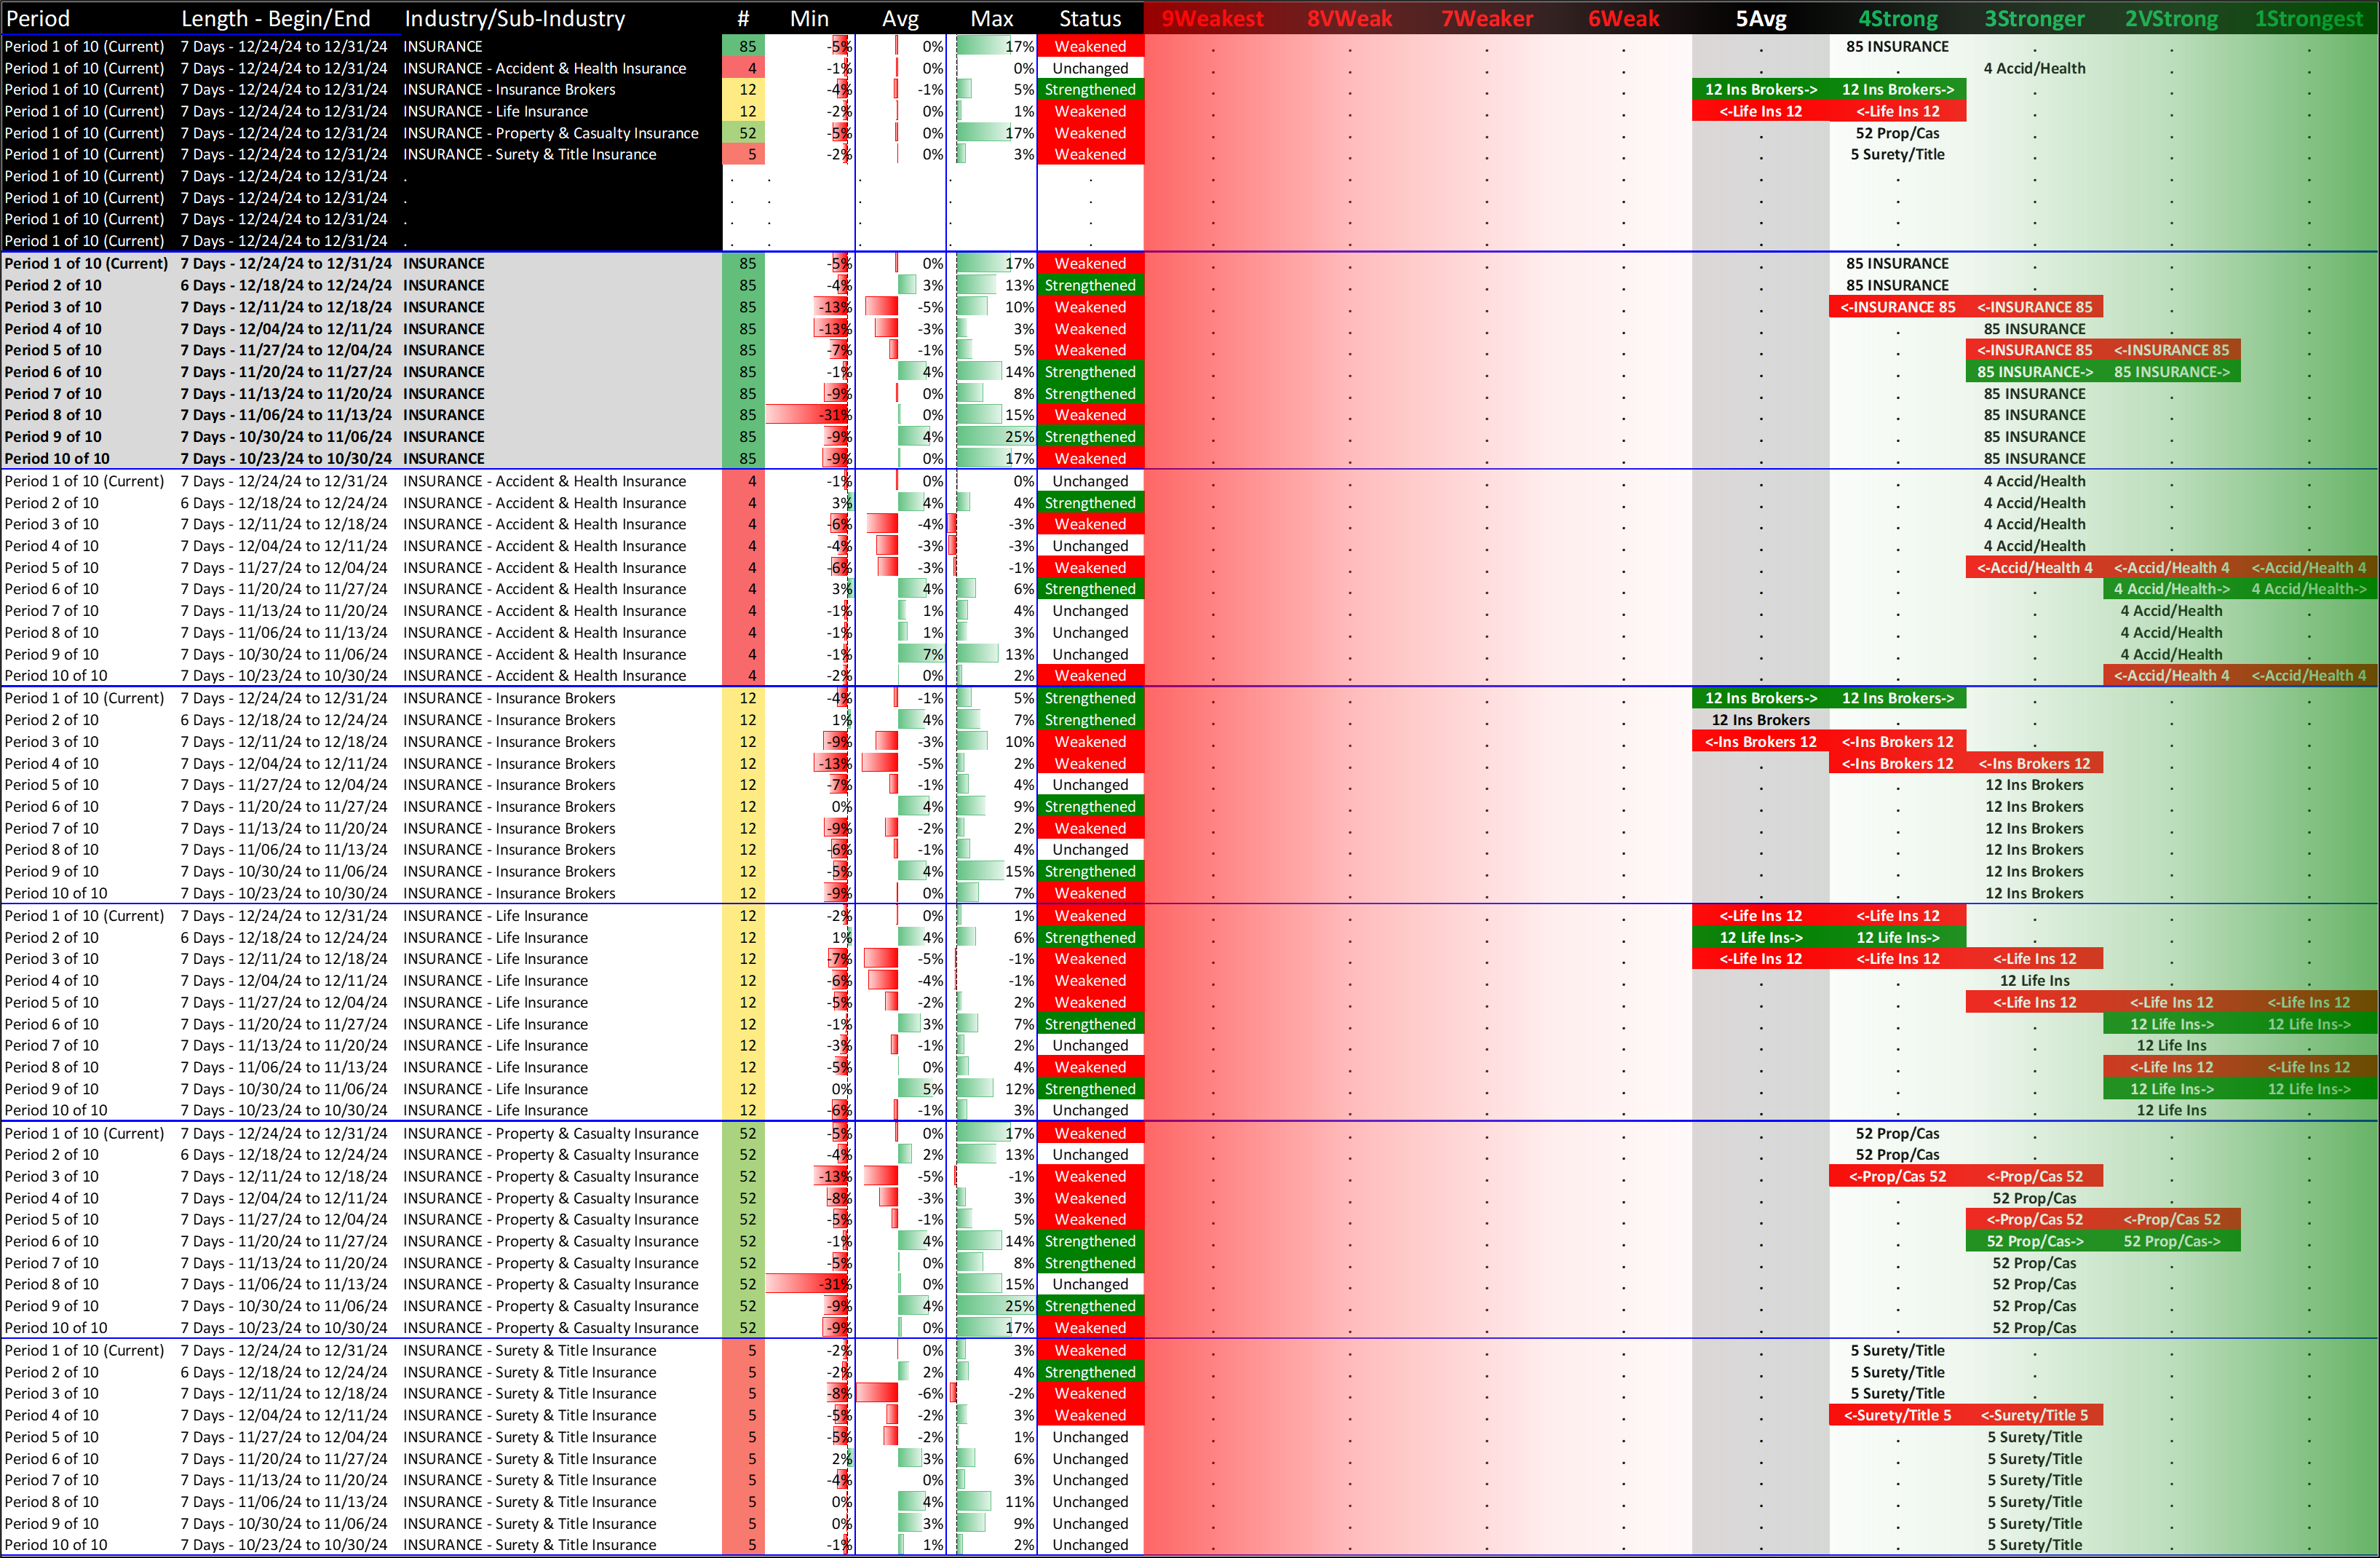
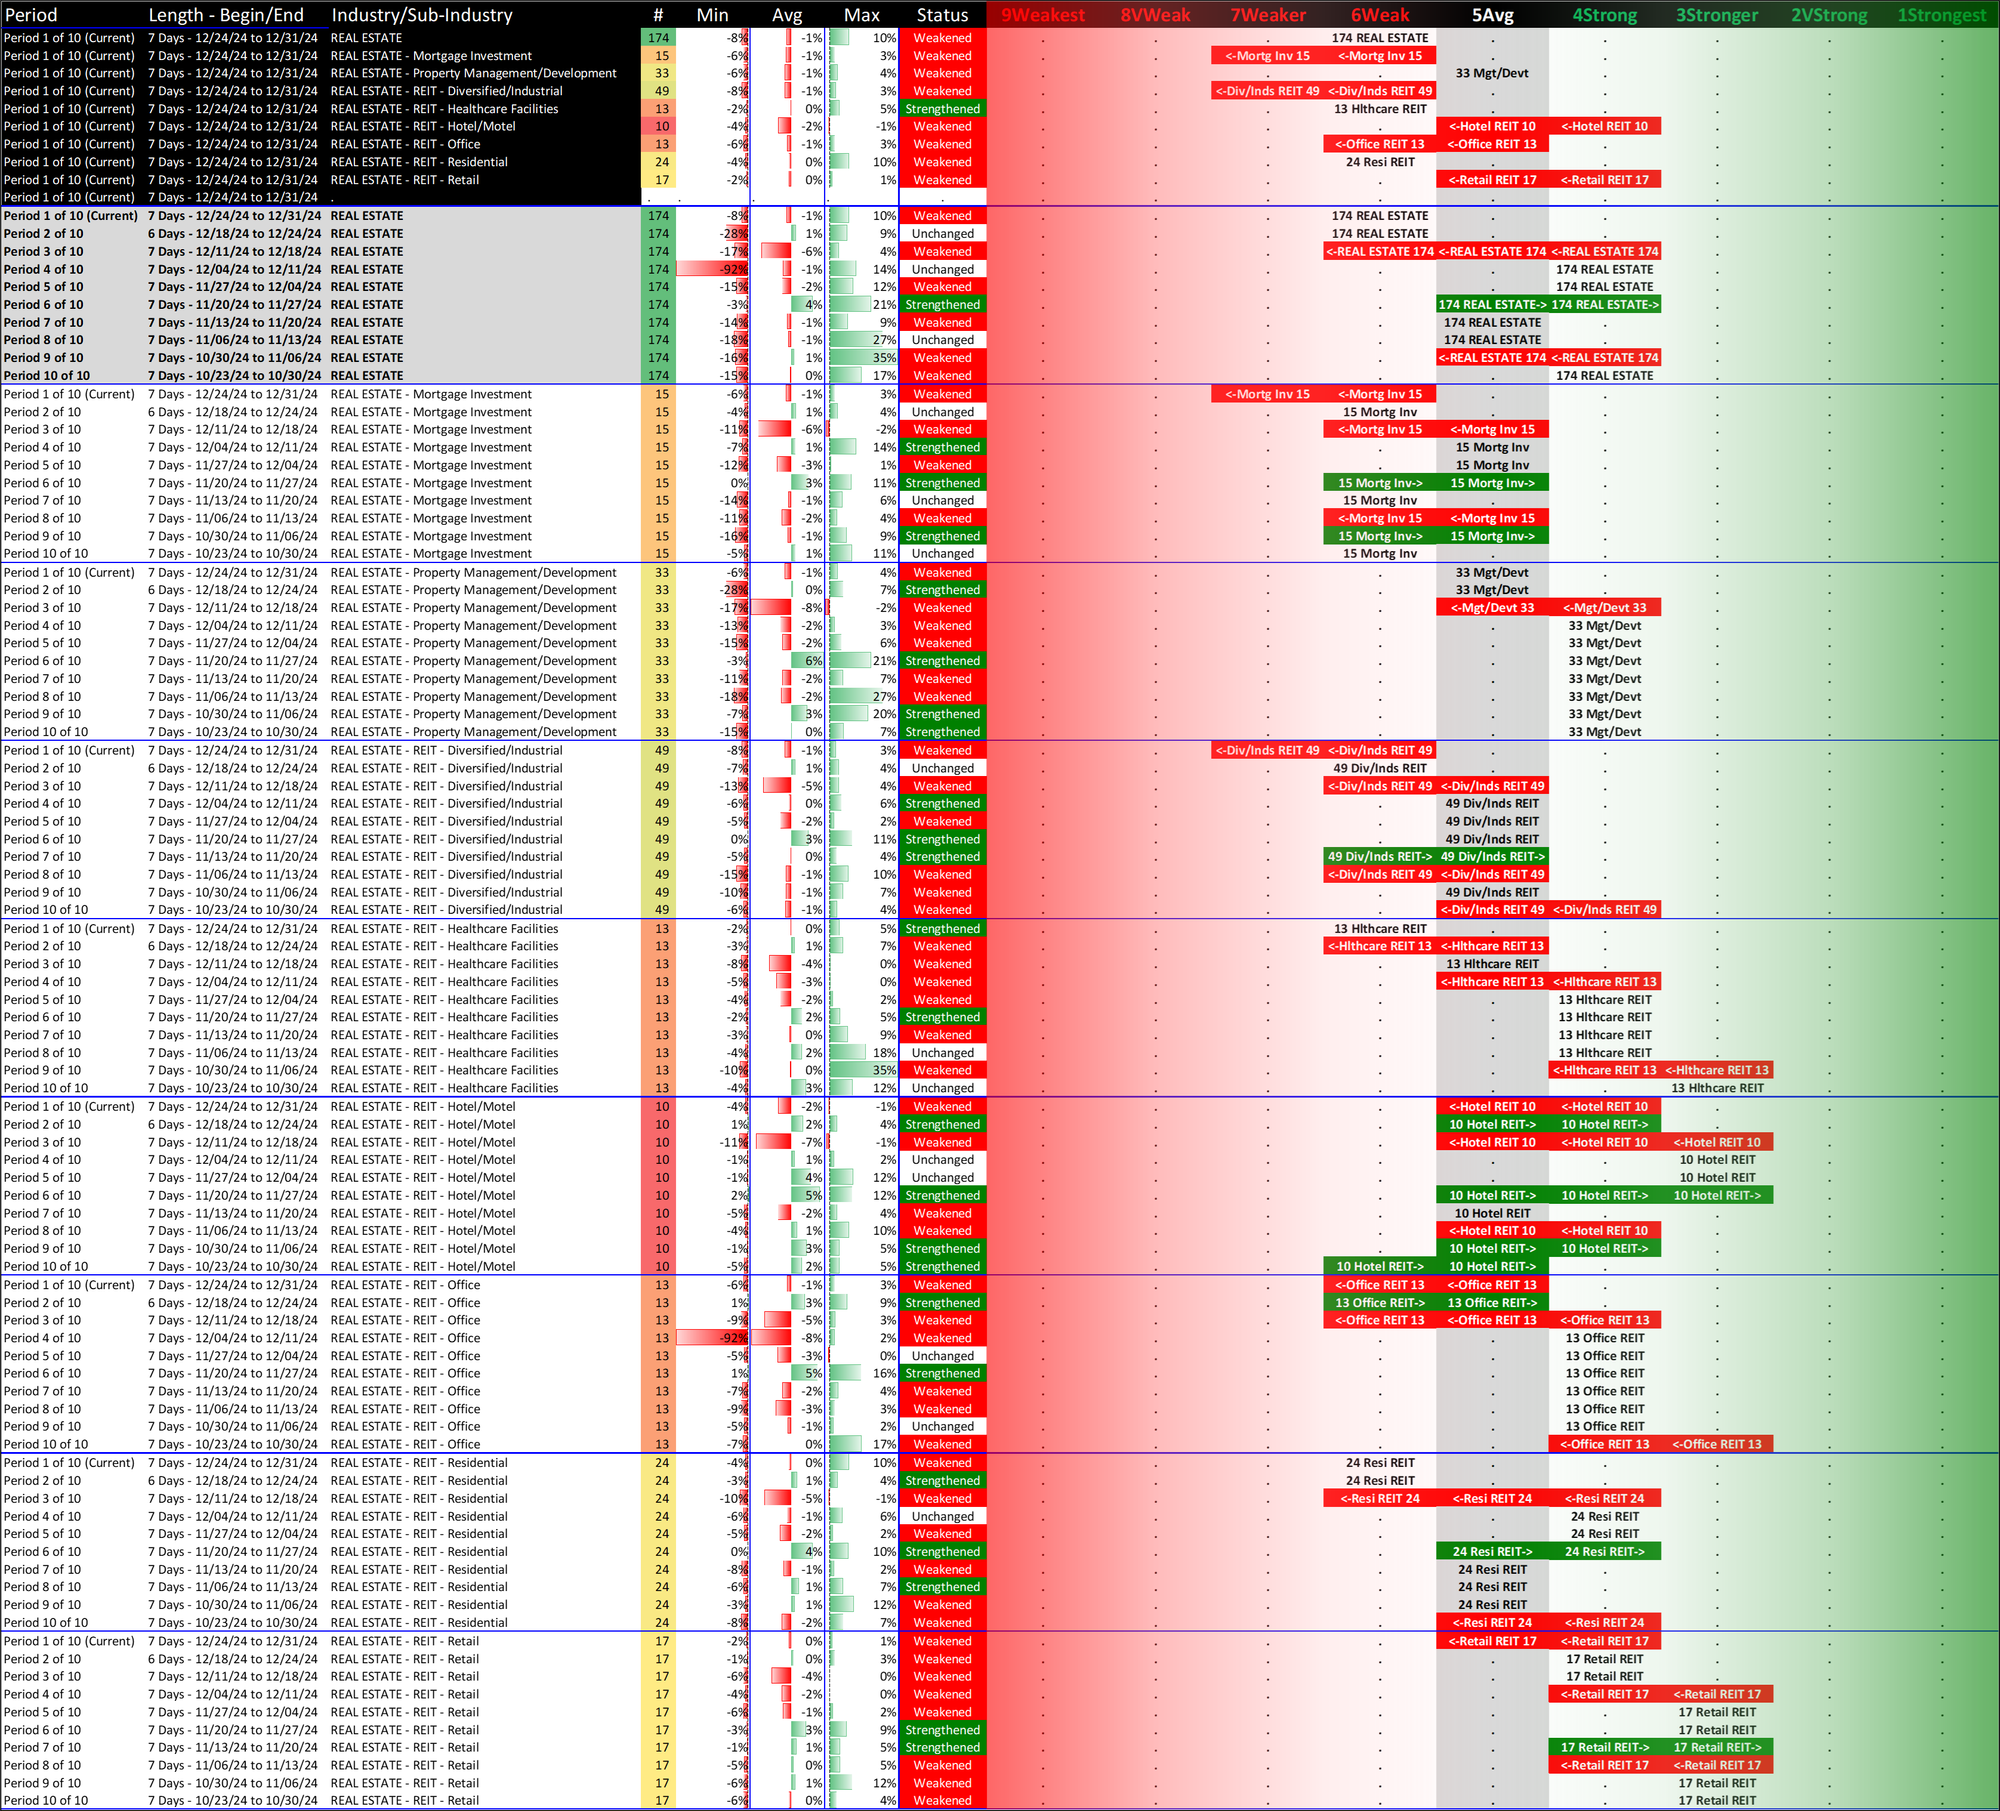
4. SUB-INDUSTRY 10-Week Strengthening
Overview
What: recent week-by-week strength changes for the industry and its sub-industries
Why: objective measurement of strengthening and weakening enabling comparison within and across industries and sub-industries
Banking
Financial Services
Insurance
Real Estate
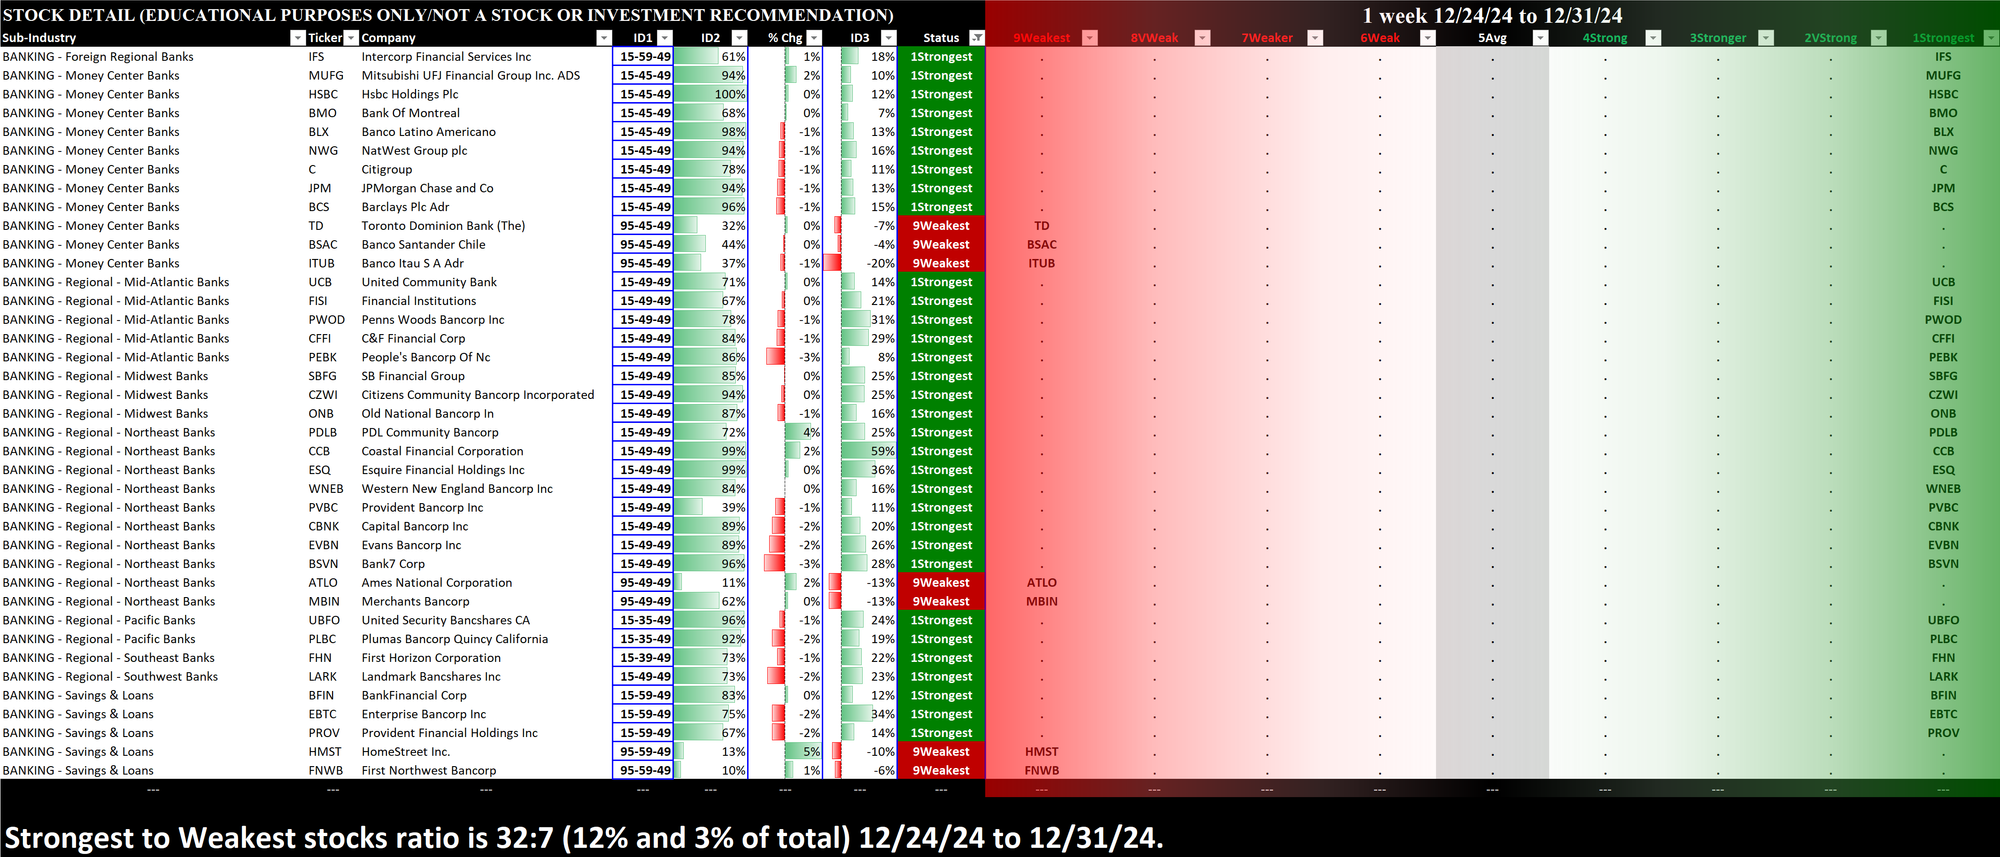
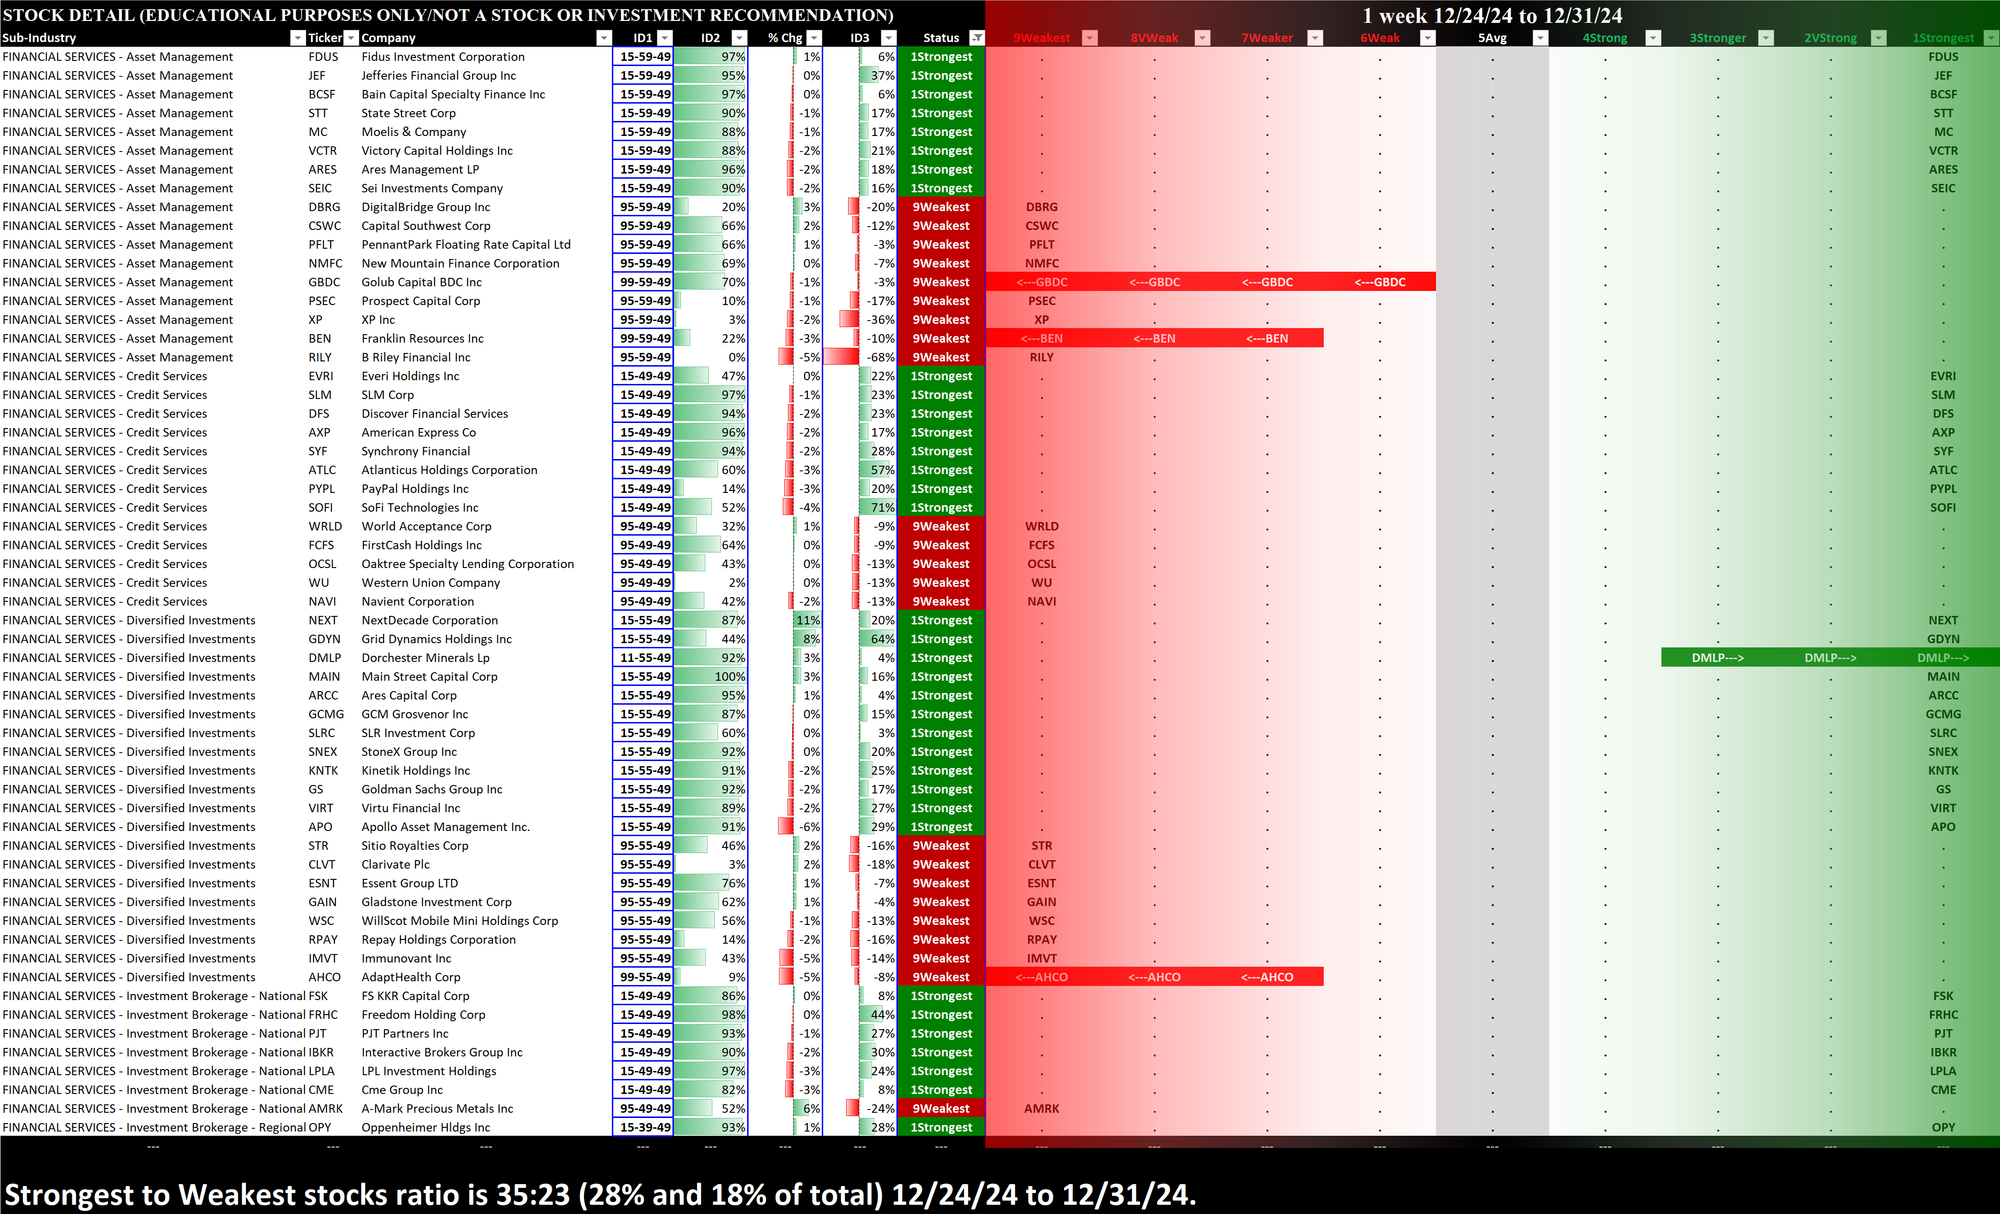
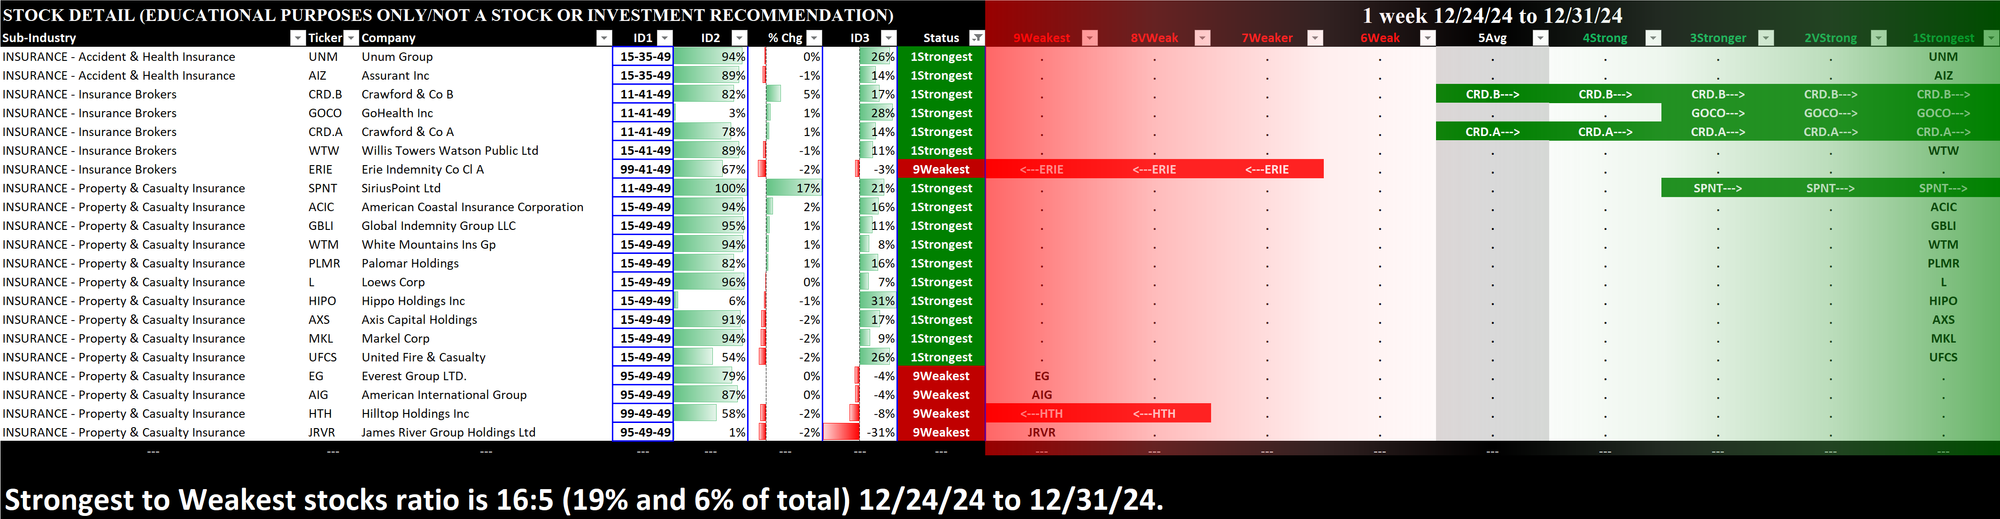
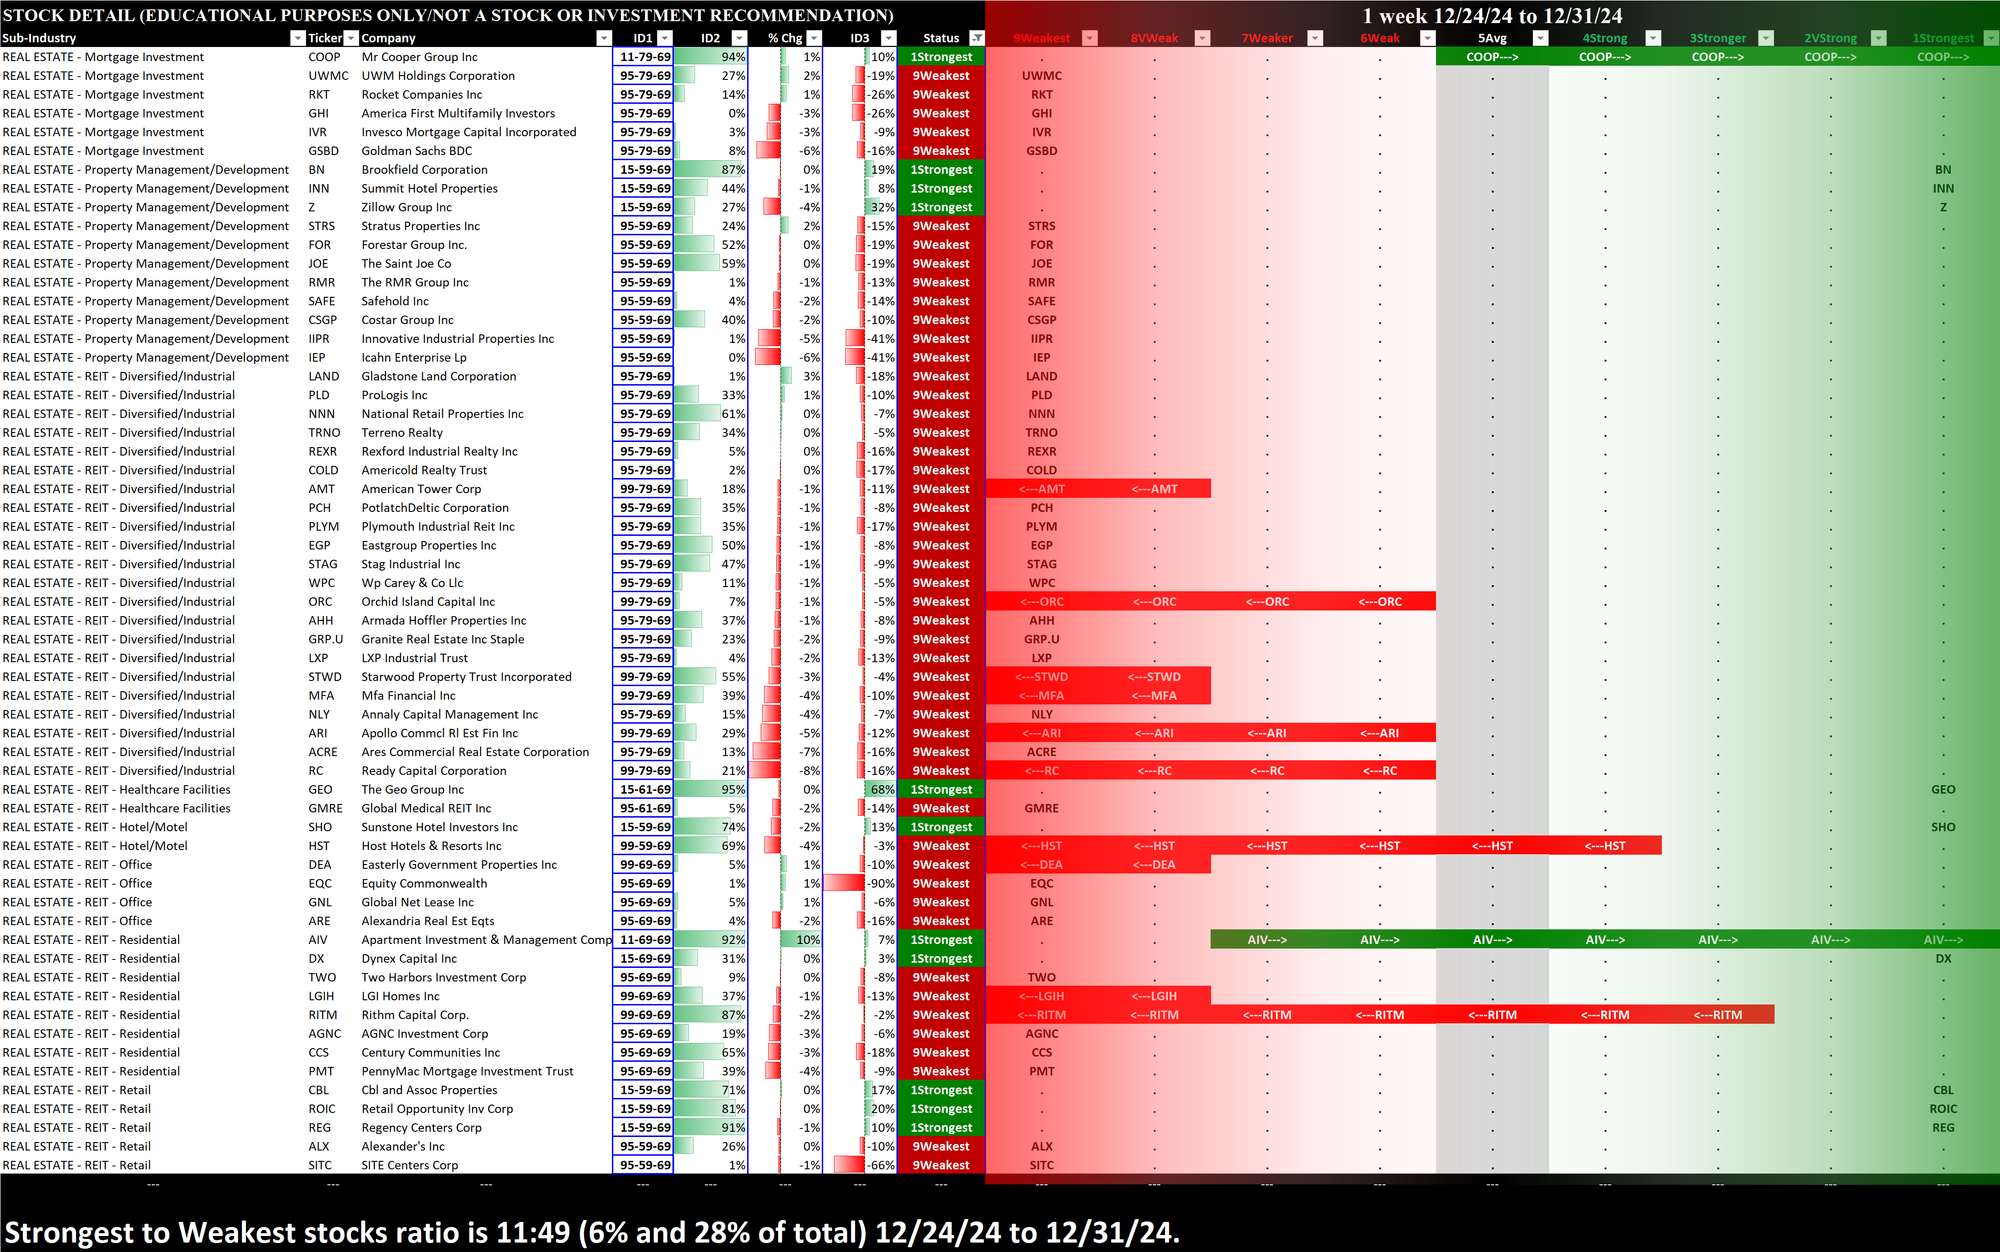
5. STOCKS Outliers: Strongest/Weakest Rated
Overview
What: stocks currently rated Strongest/Weakest (highest/lowest of 9 strength ratings)
Why: these are interesting stocks for available capital because
- The Strongest have the least amount of overhead supply to dampen breakouts while
- the Weakest may be prone to volatility, subject to big pops from bottom-fishing and short-covering BUT ALSO to bigger and faster falls.
- (Not guaranteed and not a recommendation - weak stocks in weakening sub-industries may be better shorts than high-flyers.)
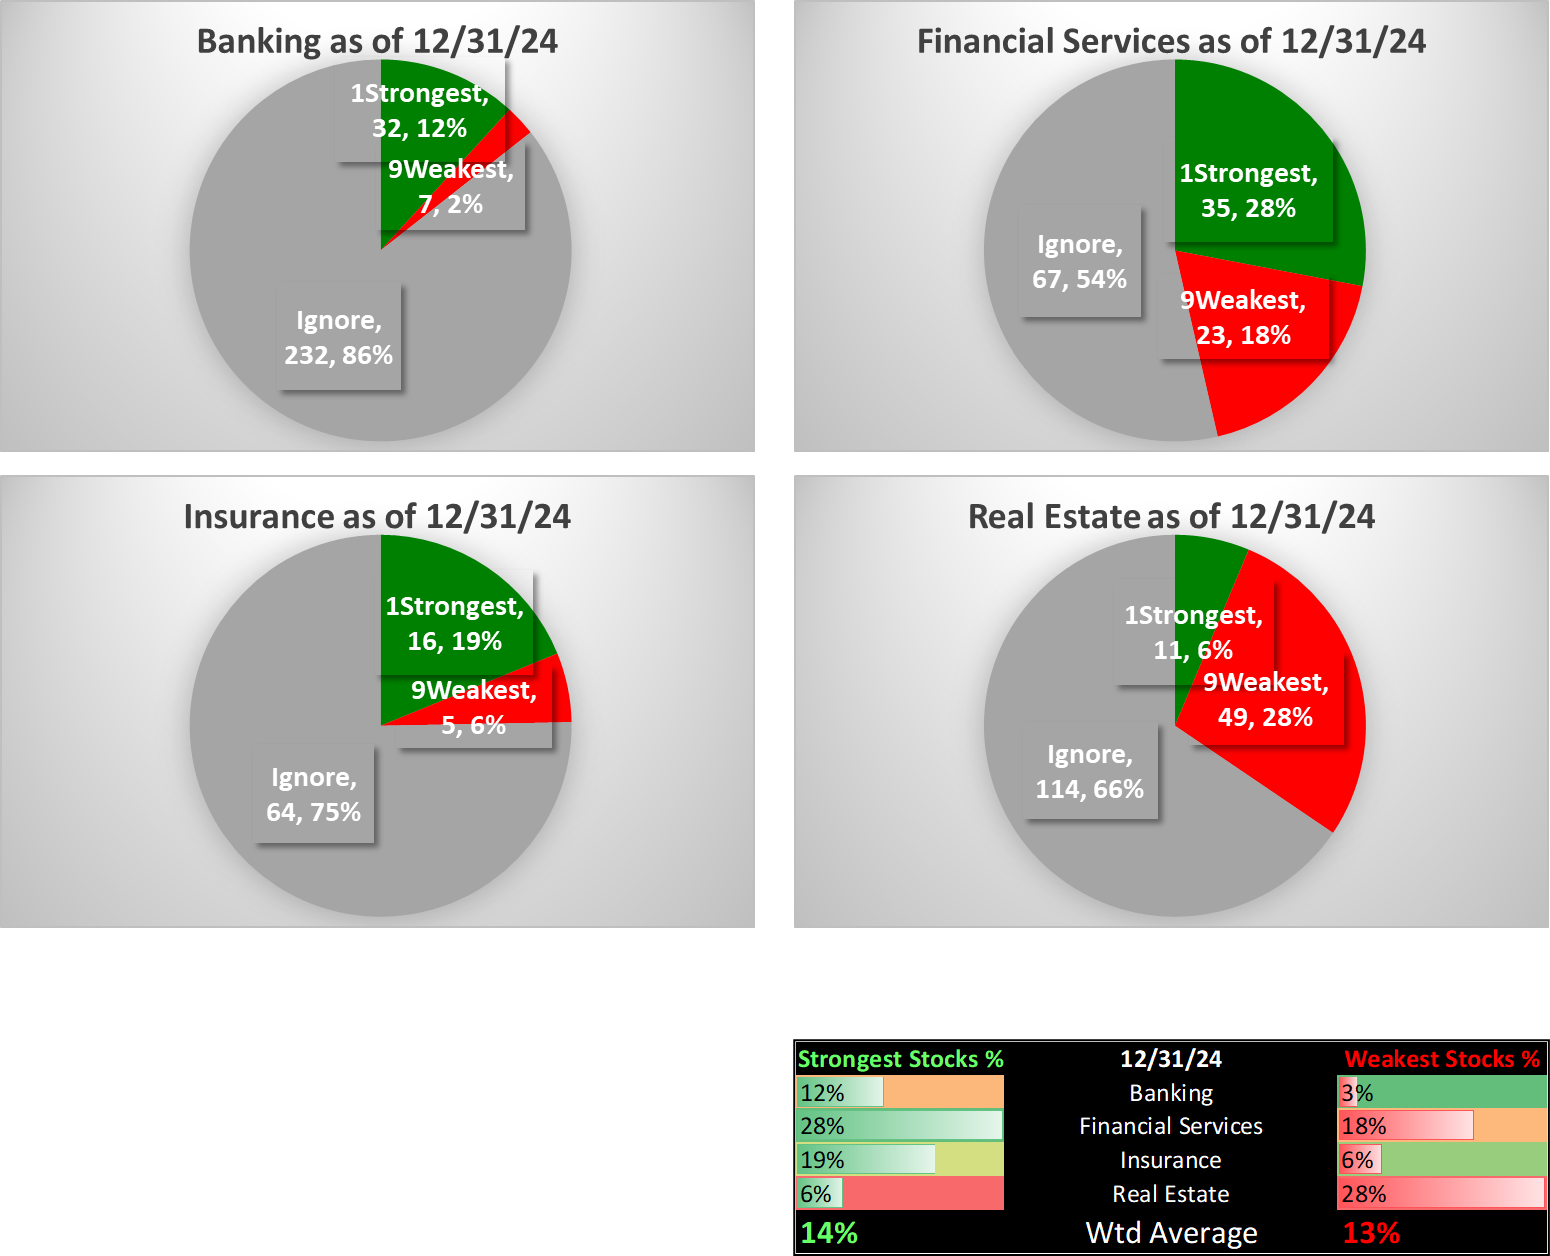
Banking
Financial Services
Insurance
Real Estate
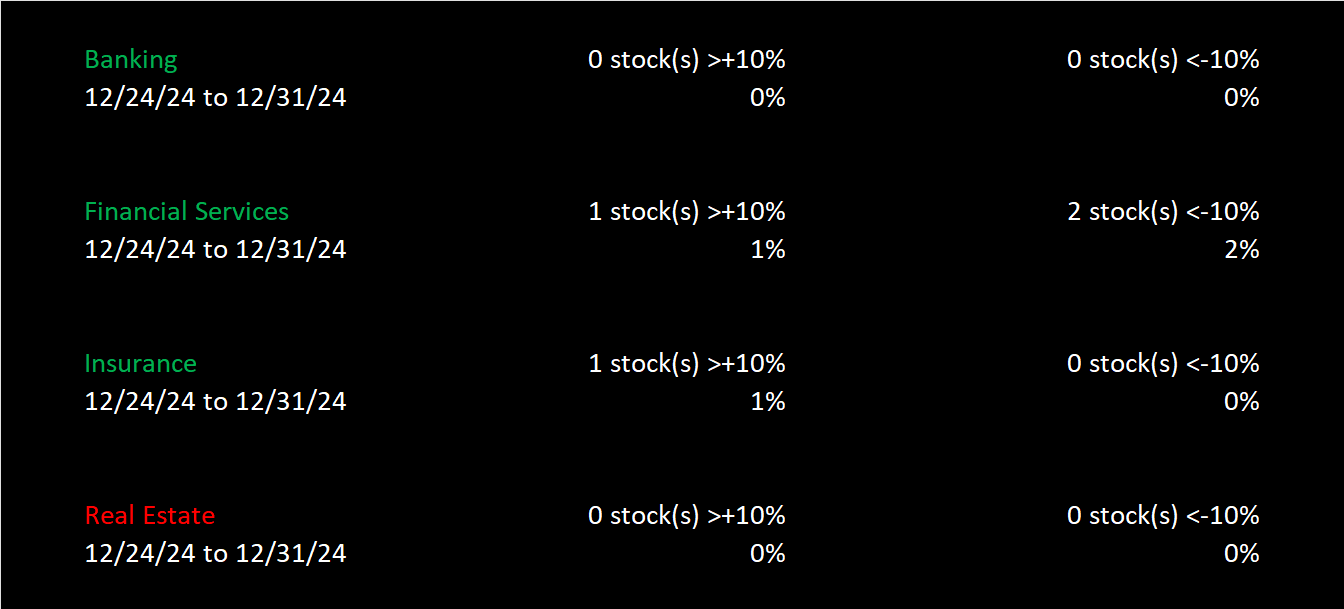
6. STOCKS Outliers: 1-Week % Change
Overview
What: stocks with atypically strong or weak performance this week
Why: these are interesting stocks for available capital because
- The journey to 100%+ returns begins with 10% returns...
- Strength can beget strength
- So too weakness
- Momentum and trend-following are time-tested. - A multi-month rally begins with one up week...
- Meaningful moves last
- And can last longer than expected.
Banking
Financial Services
Insurance
Real Estate
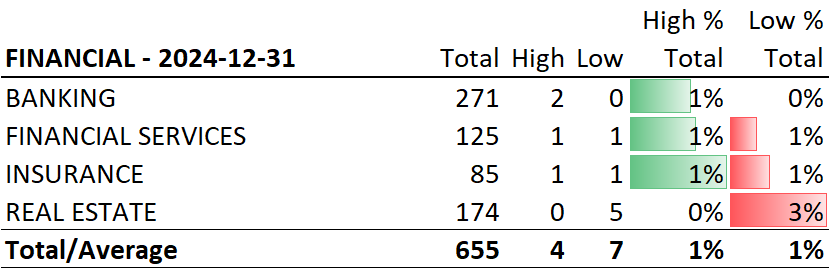
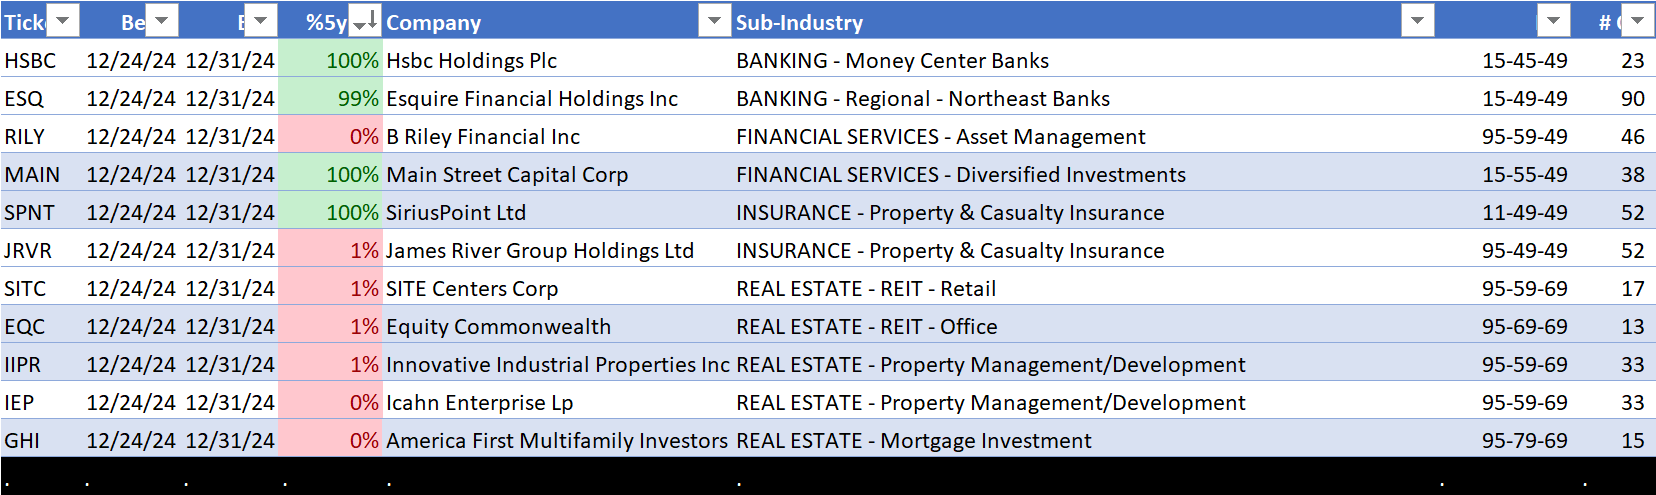
7. STOCKS Outliers: 5-Year Highs/Lows
Overview
What: stocks at 5-year highs and lows
Why: potential large and/or rapid price movement
This section shows the strongest of the strong and the weakest of the weak, hitting 5-year highs and lows, respectively. The strongest are the leaders of the market that, until today, had been regularly hitting new highs. Meanwhile, there is no rational reason to hold weak stocks that are at multi-year lows. There are far too many other attractive choices to waste time or capital on such candidates.