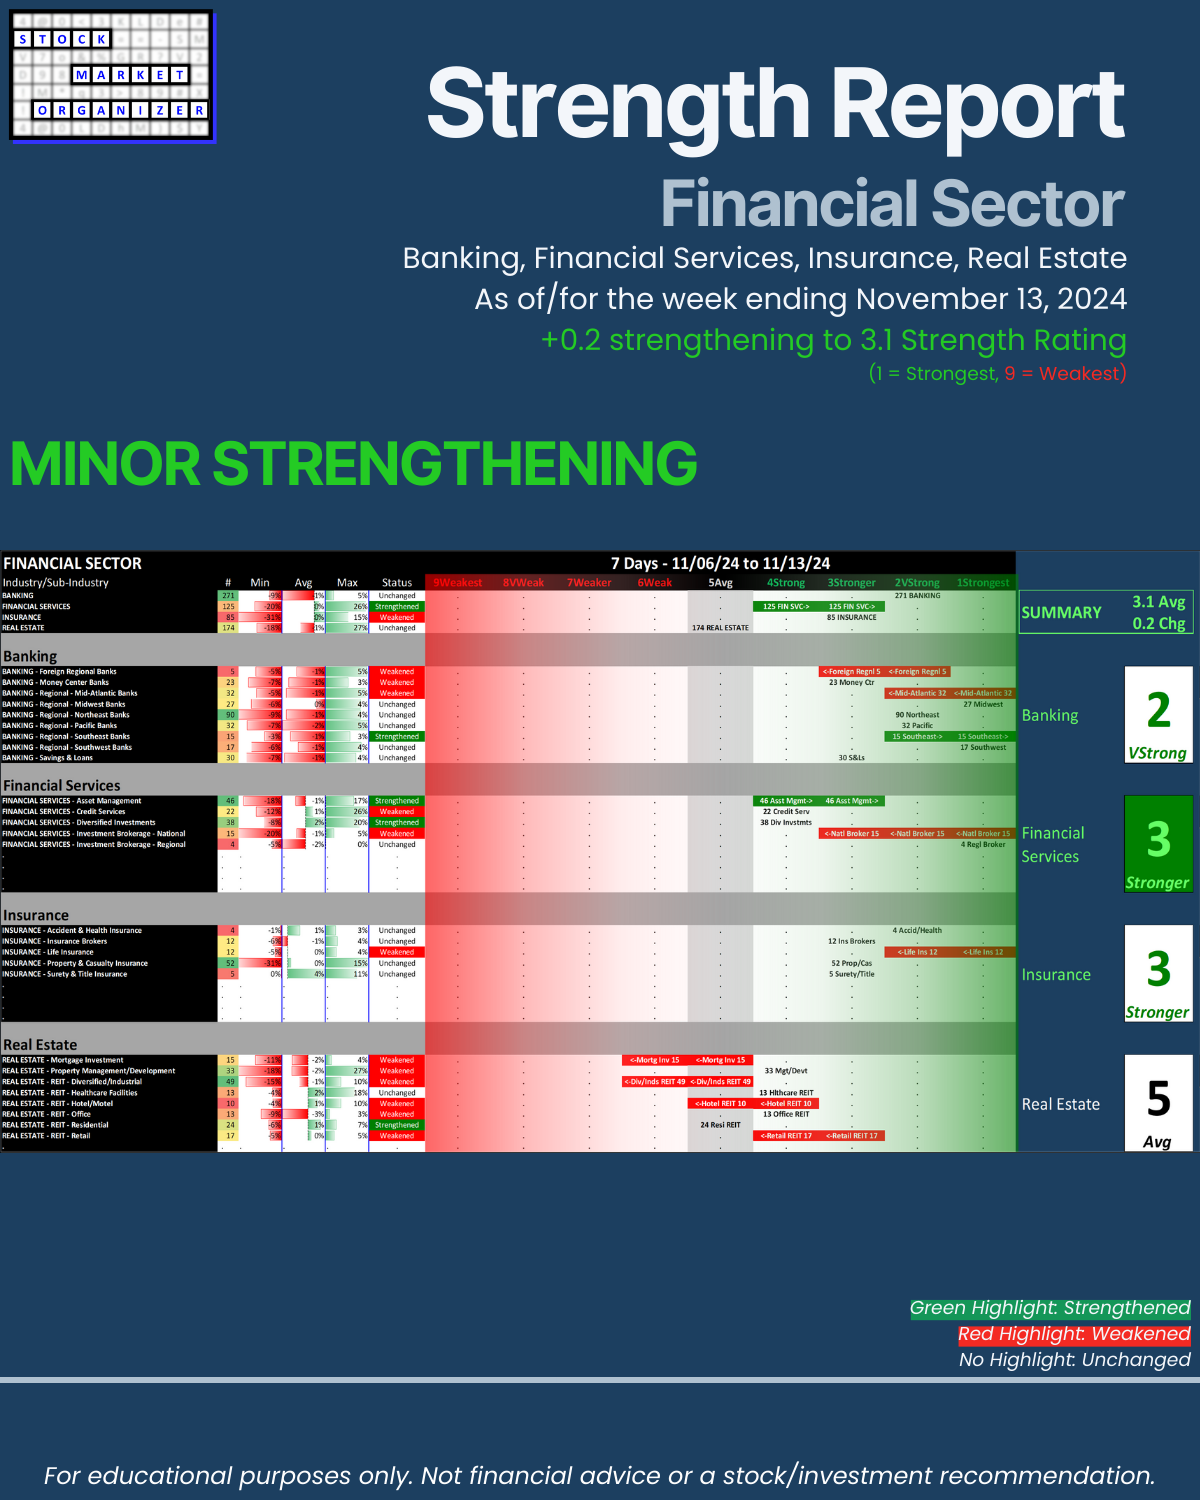
SMO Exclusive: Strength Report Financial Sector 2024-11-13 Strengthened +0.2 to 3.1 Strength Score
Summary
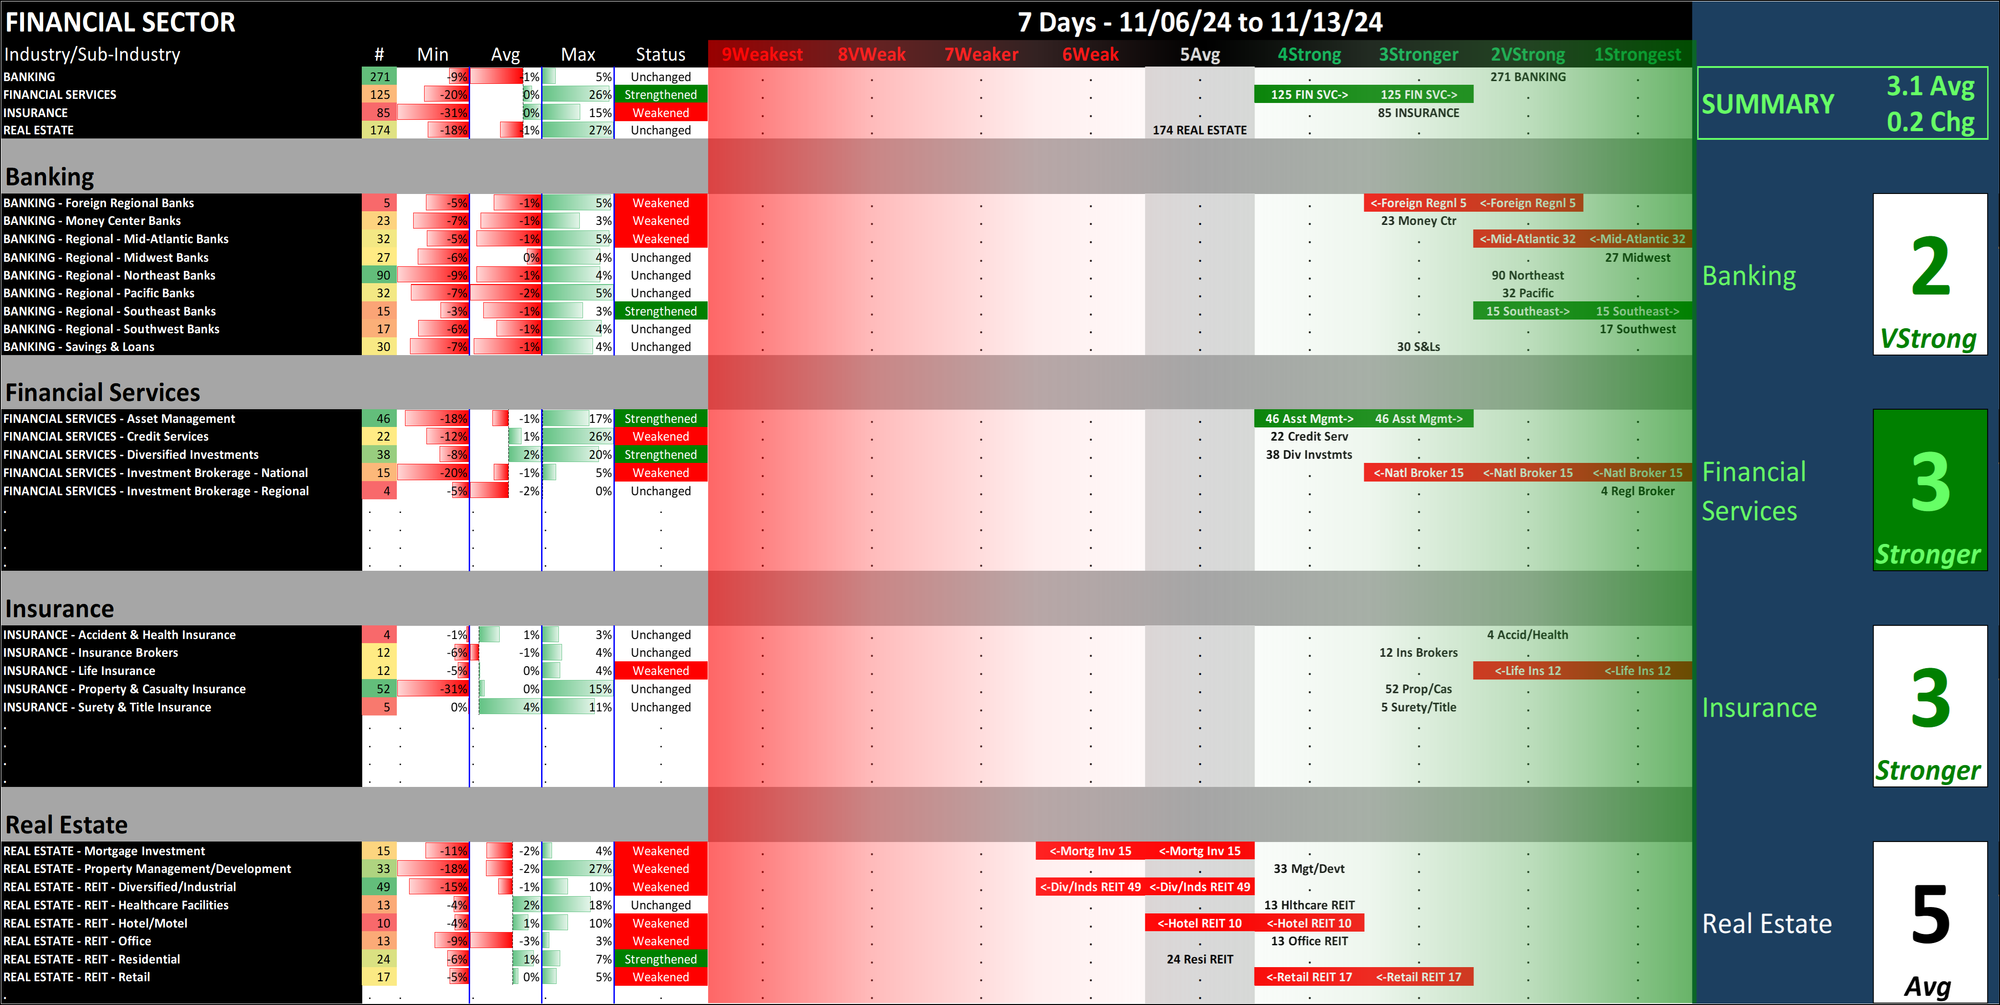
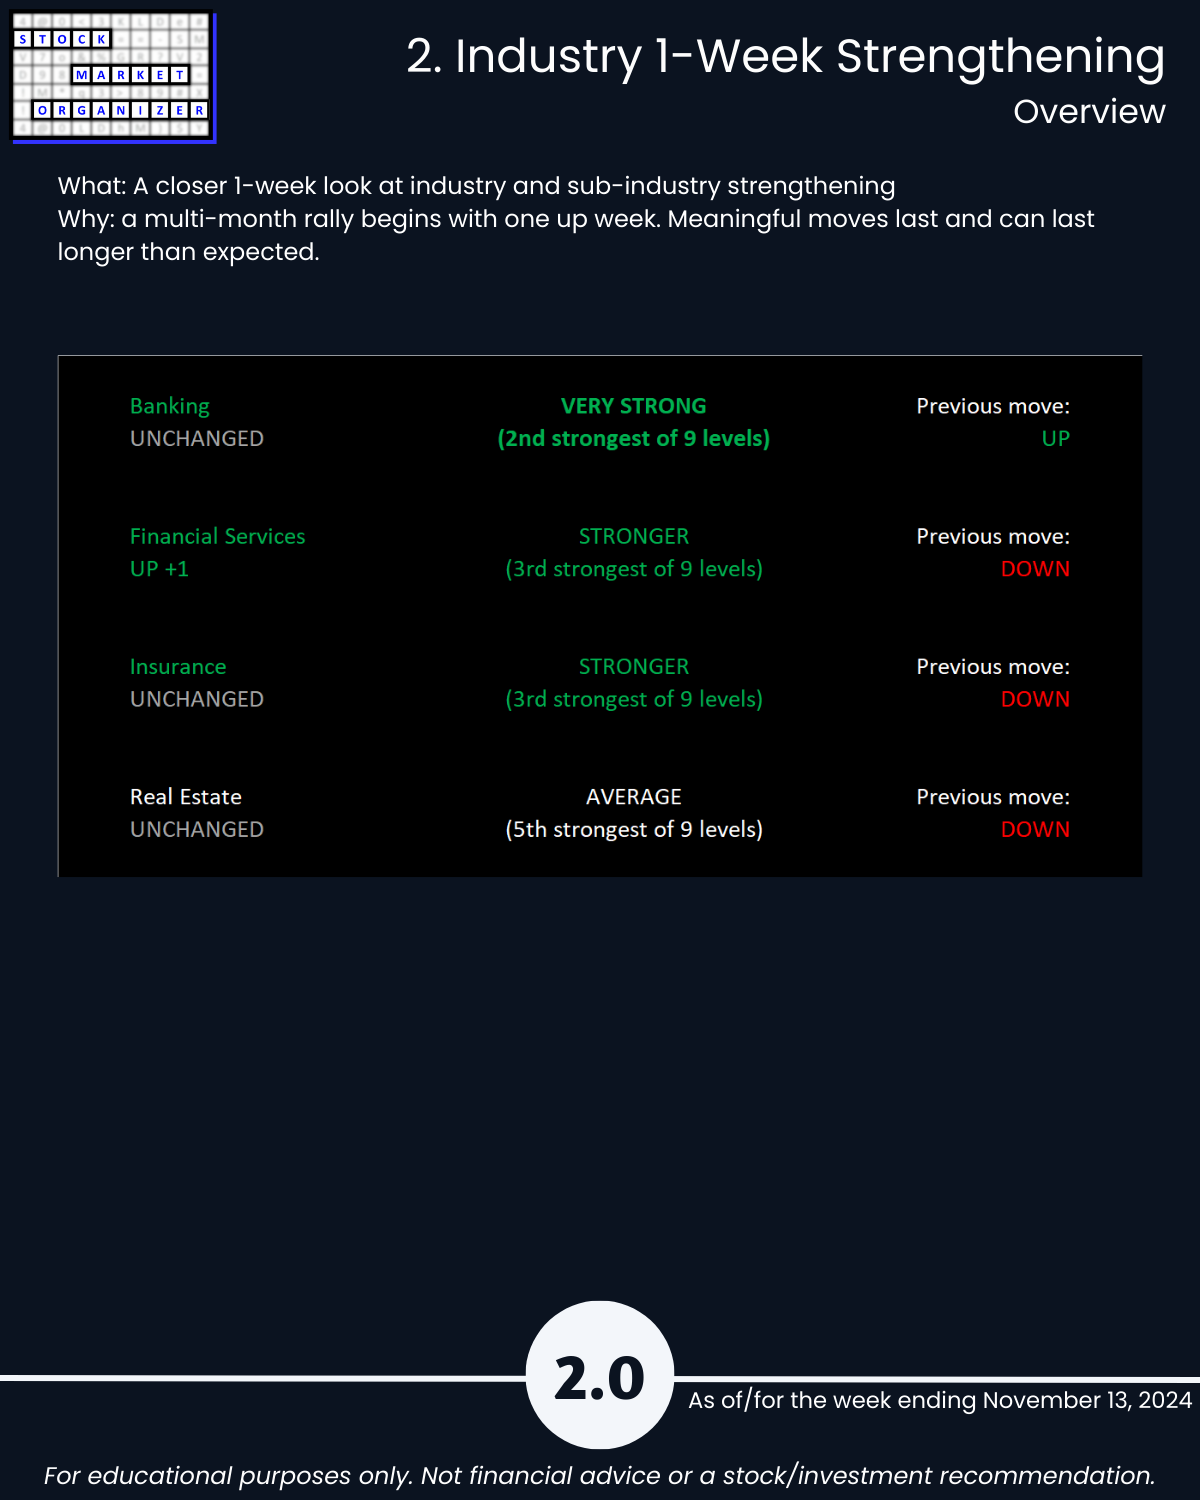
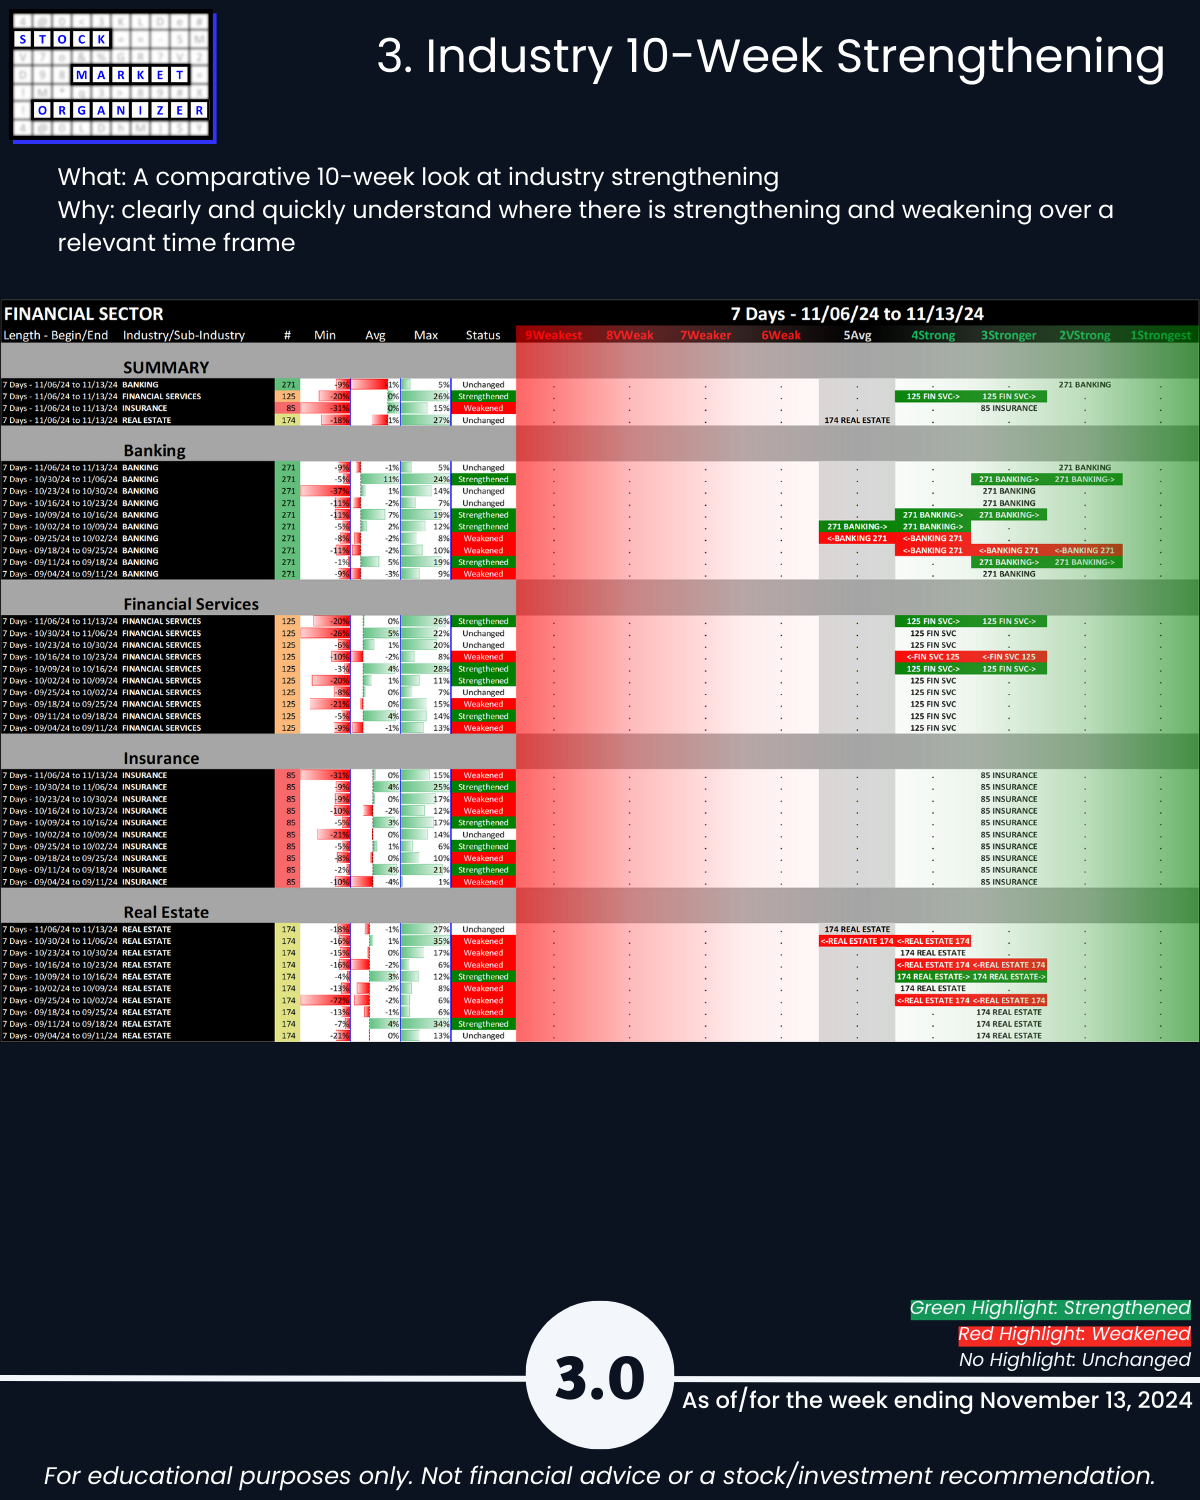
Financial Sector slightly STRENGTHENED with a 3.1 composite score this week, +0.2 as Financial Services strengthened one level to 3Stronger, tied with Insurance but behind the strongest industry Banking which is at 2VeryStrong. Real Estate remains the sector's laggard with a 5Average rating.
Difference This vs. ETFs Analysis
Note this analysis is the same as that used for the SPDR ETFs but the two main differences are:
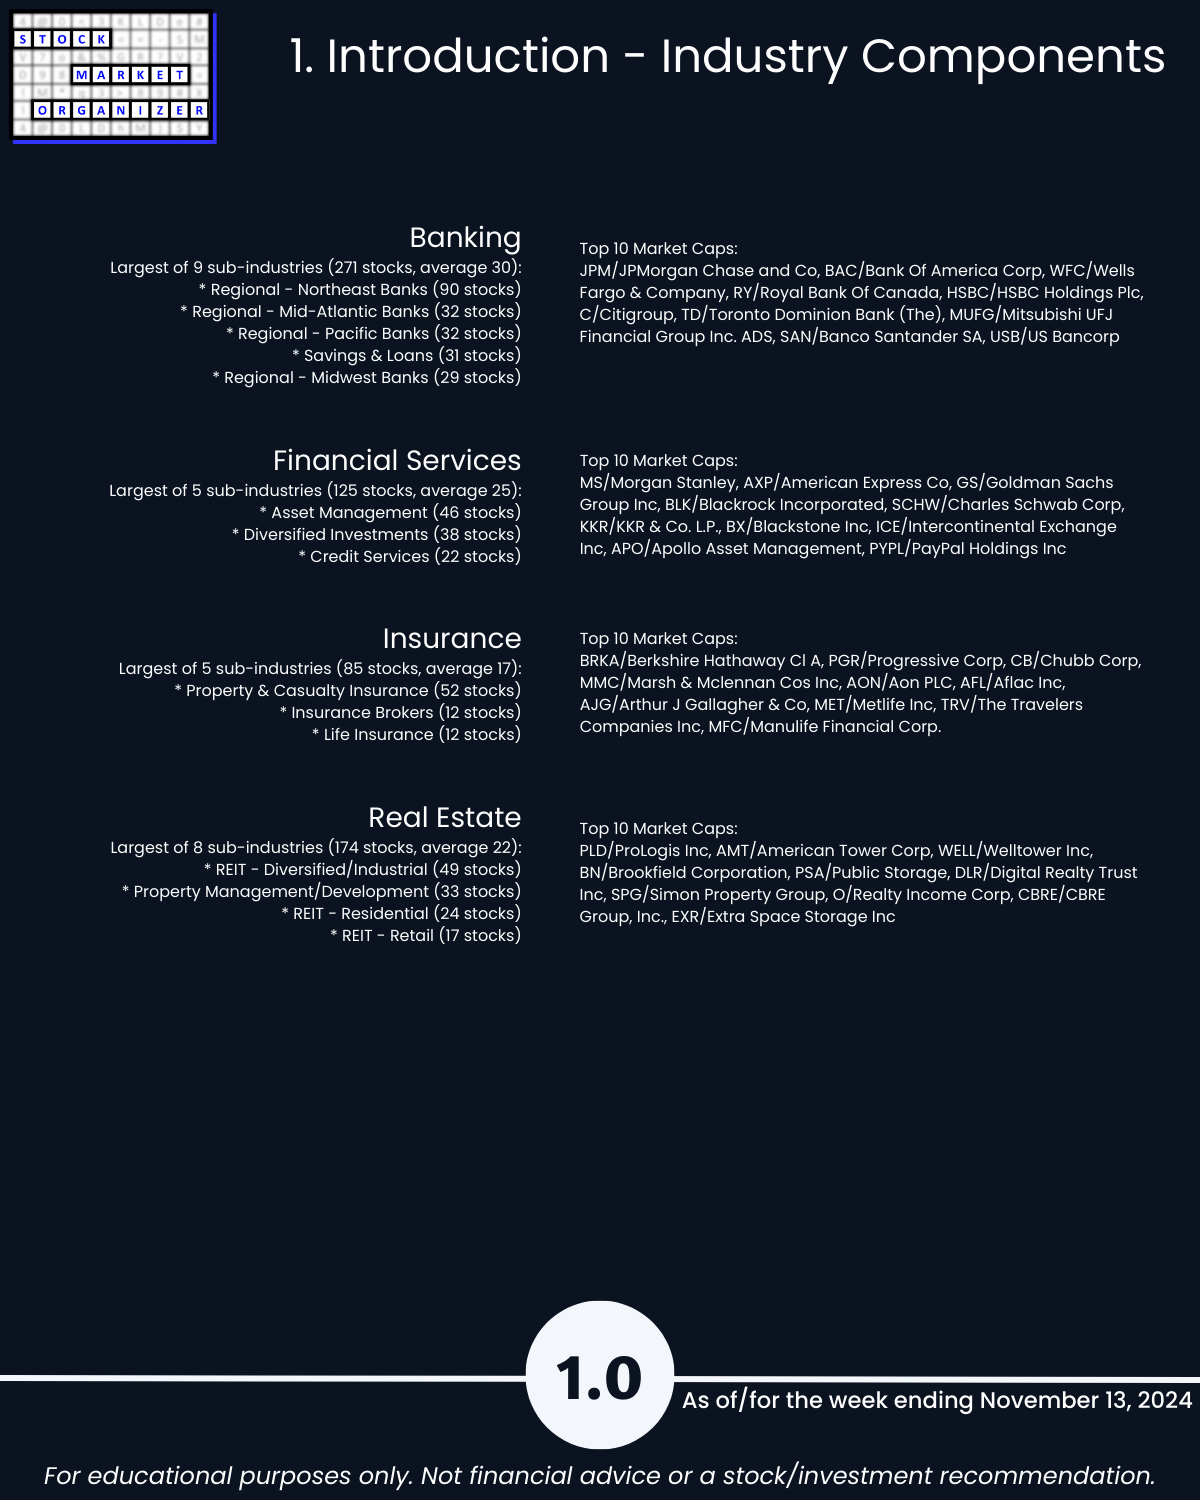
1. Universe of stocks. The ETFs are the largest capitalization stocks, 500 of them in the 11 sector ETFs. In this analysis, there are approximately 2,700 stocks.
2. Sub-categorization below the market level. The ETF analysis with 500 stocks is limited to sector strengthening and weakening. This analysis with +/-2,700 stocks can be and is segregated into 29 industry groups and in turn 189 sub-industry groups.
There is a Financials ETF (symbol XLF) which is separate from the Real Estate ETF (symbol XLRE). The Financials sector in this analysis includes Real Estate with Banking, Financial Services, and Insurance.
Per yesterday's ETF strength analysis, XLF/Financials is rated 3Stronger and XLRE/Real Estate is rated 4Strong. This is generally a match for the Banking, Financial Services, and Insurance readings from today, and is slightly stronger than the Real Estate Industry 5Average rating from today's analysis which covers more stocks. This means the larger cap Real Estate stocks are stronger than the small caps.
How would I interpret and use this information?
Recognizing that anything can happen at any time and I will never know the reason why until after the fact if ever, I am looking to give myself the best chances of an individual stock going my desired direction by stacking strength going long or stacking weakness going short, depending on strength/strengthening and weakness/weakening at the stock, sub-industry, industry, sector, and market levels.
Following are summary statements regarding the current environment:
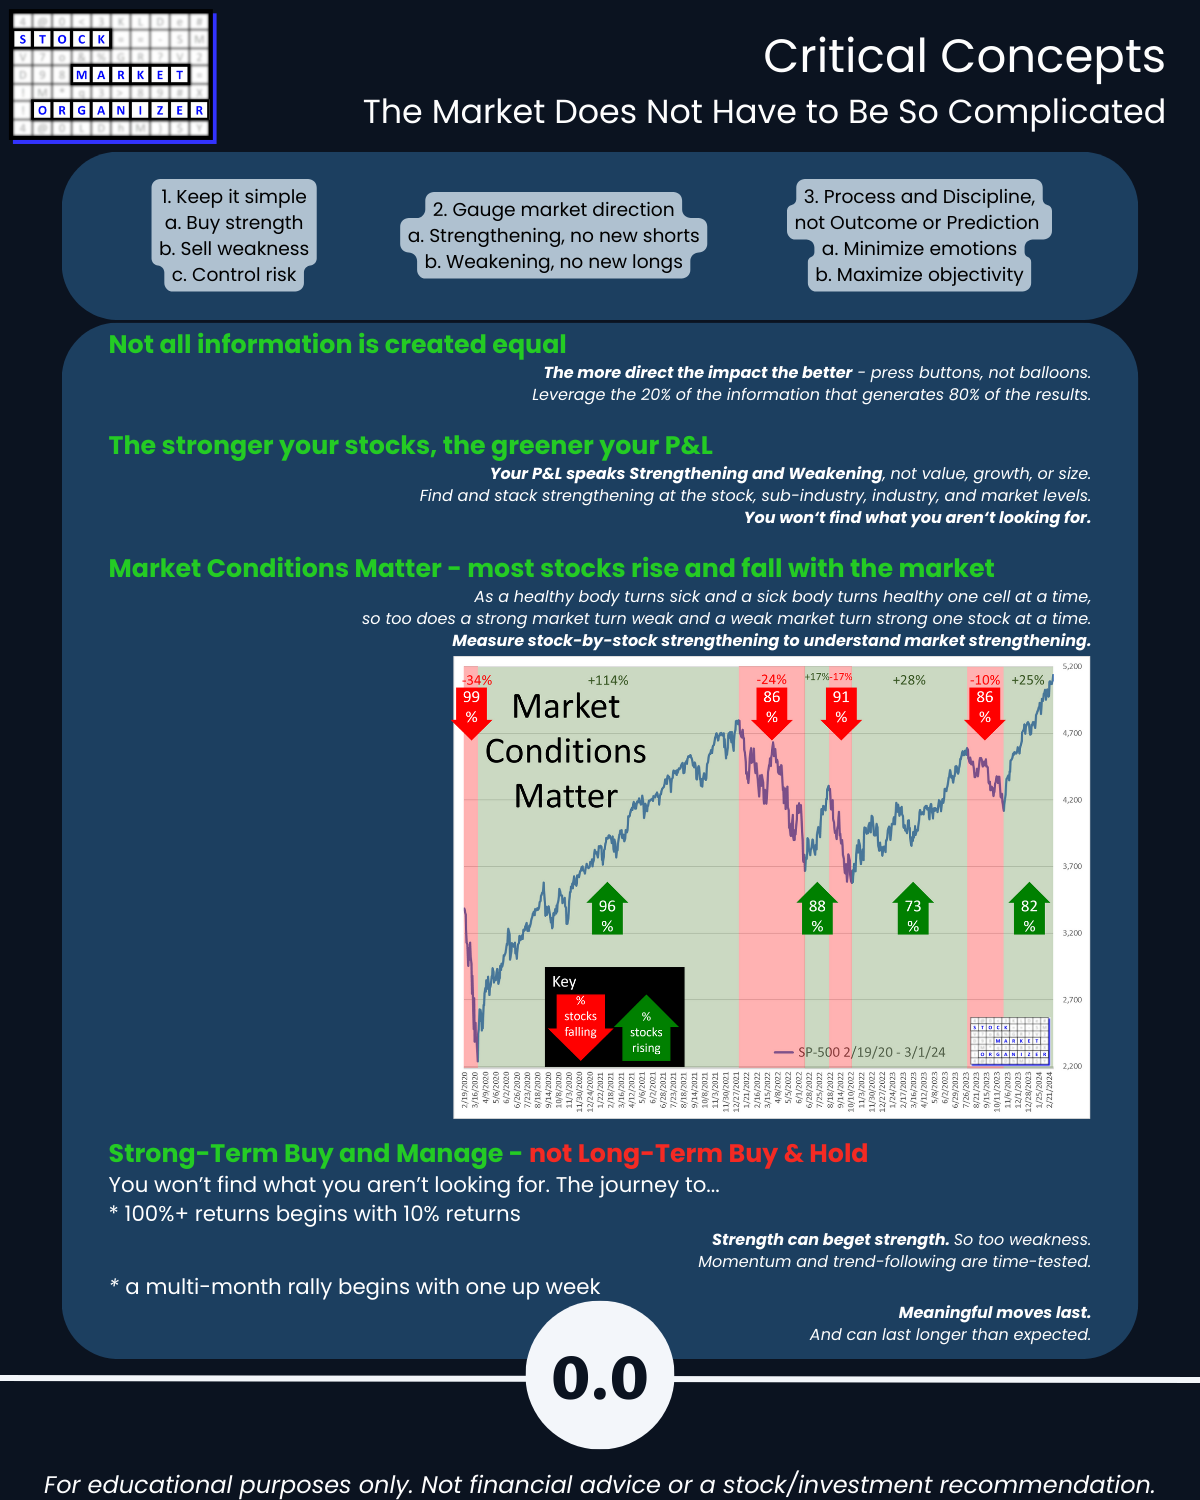
- The Market Strength Score is now positive = tailwind
- Financial sector slightly strengthened = tailwind
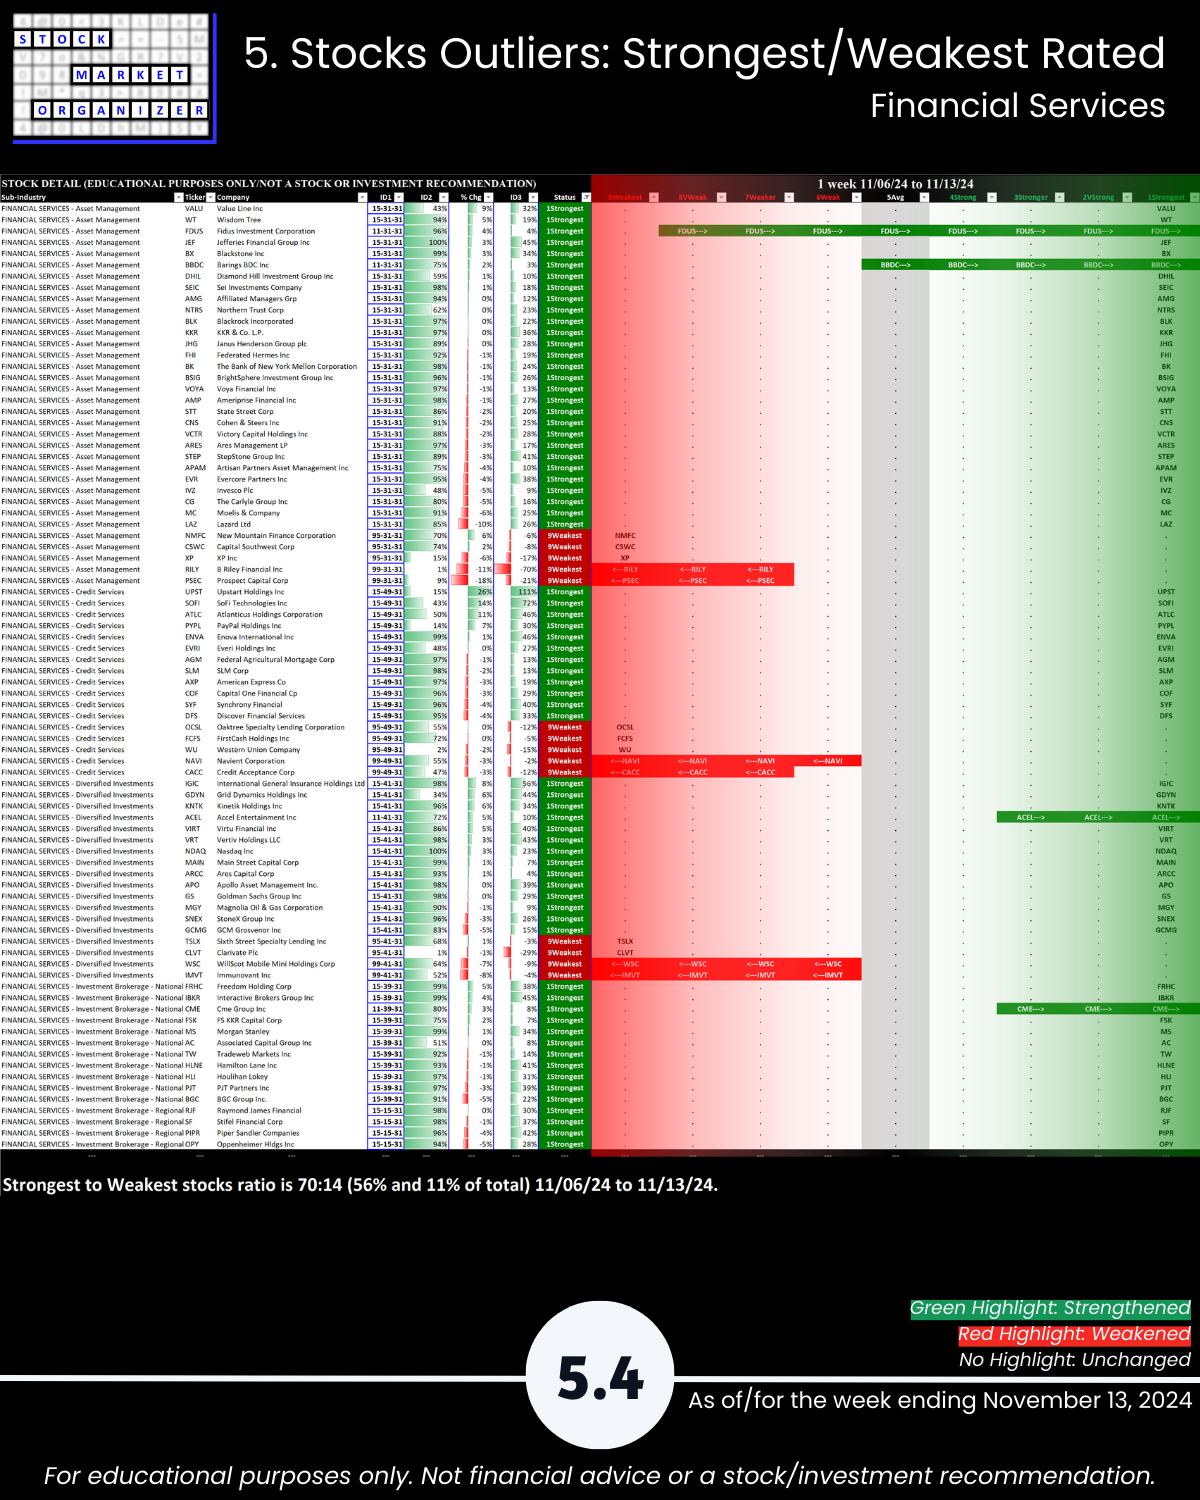
- Financial Services industry strengthened rating to 3Stronger = tailwind
- Asset Management strengthened rating by one level = tailwind
- National Brokerages weakened rating by two levels = headwind
- Banking industry was unchanged while still retaining a 2VeryStrong rating = tailwind/neutral
- Southeast Banks strengthened rating by one level = tailwind
- Foreign Regional and Mid-Atlantic Banks weakened ratings by one level = headwind
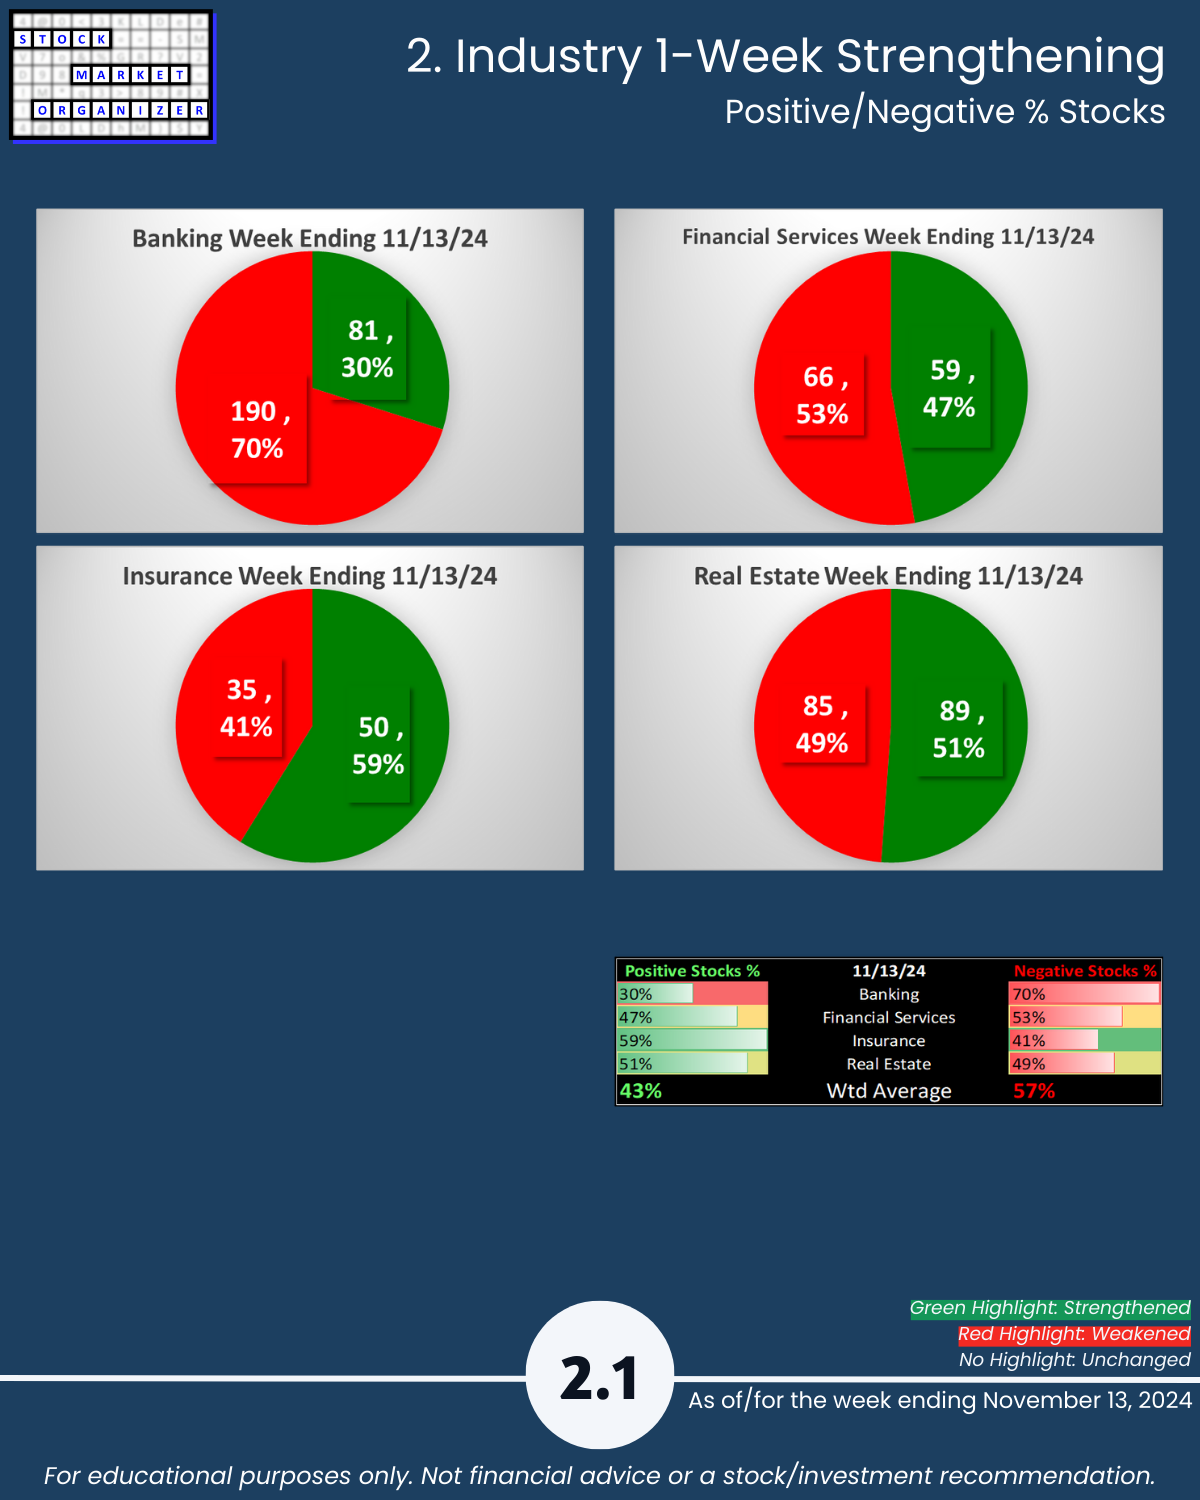
- Interestingly, Banking suffered this week from a 30% positive vs. 70% negative stock ratio - no predictions, but this reflects an unexpected weakness = headwind
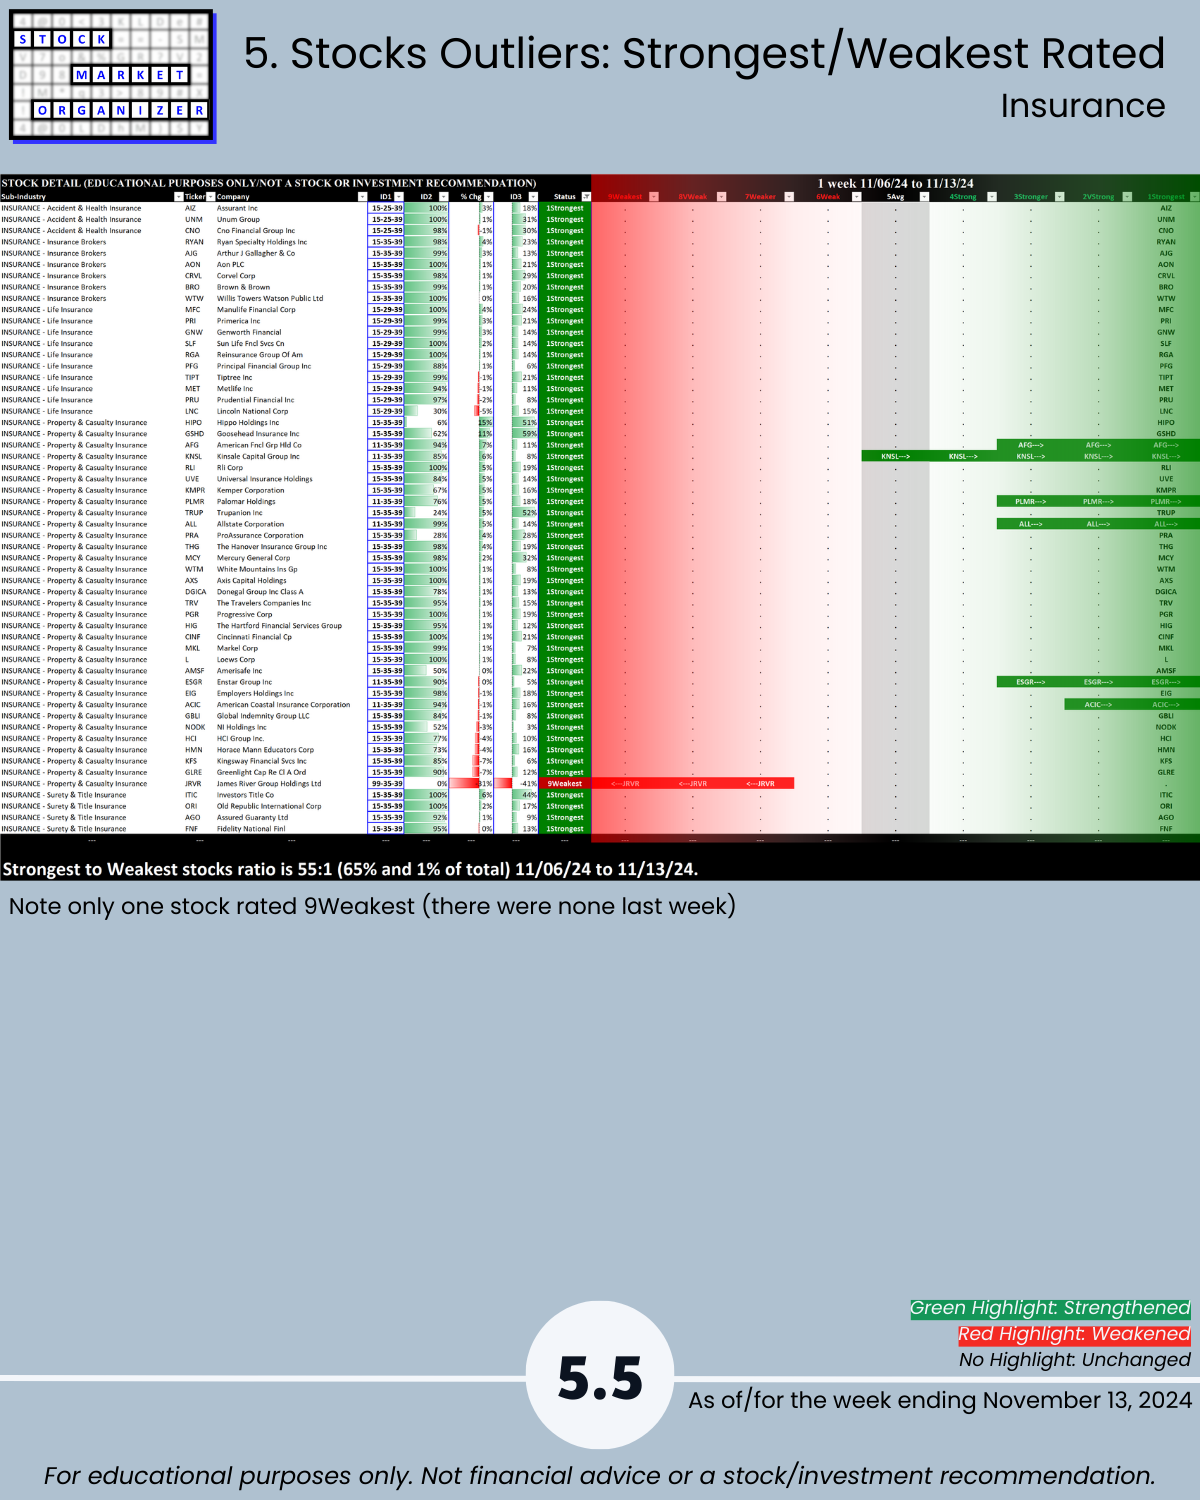
- Insurance weakened but not enough to change rating while still retaining a 4Strong rating = neutral
- Life Insurance weakened rating by one level = headwind
- Real Estate like Banking was unchanged but it is only at a 5Average rating, there are better industry choices = neutral
- Mortgage Investment and Diversified/Industrial, Hotel, and Retail REITs all weakened rating by one level = headwind
Final Comments
There is absolutely no way of determining how long this environment will last. All one can do is find an objective way of measuring whether any given environment offers headwinds or tailwinds and then act accordingly based on these measurements.
Details are below shown in a manner not available elsewhere because I created it from scratch to continually answer this question: “Where is there strengthening and weakening in the market at the stock, sub-industry, industry, and sector levels?” Combine this with the top-down Market Strength Score and Sector Risk Gauge to get a key competitive advantage of understanding strength at every level.
1. Introduction
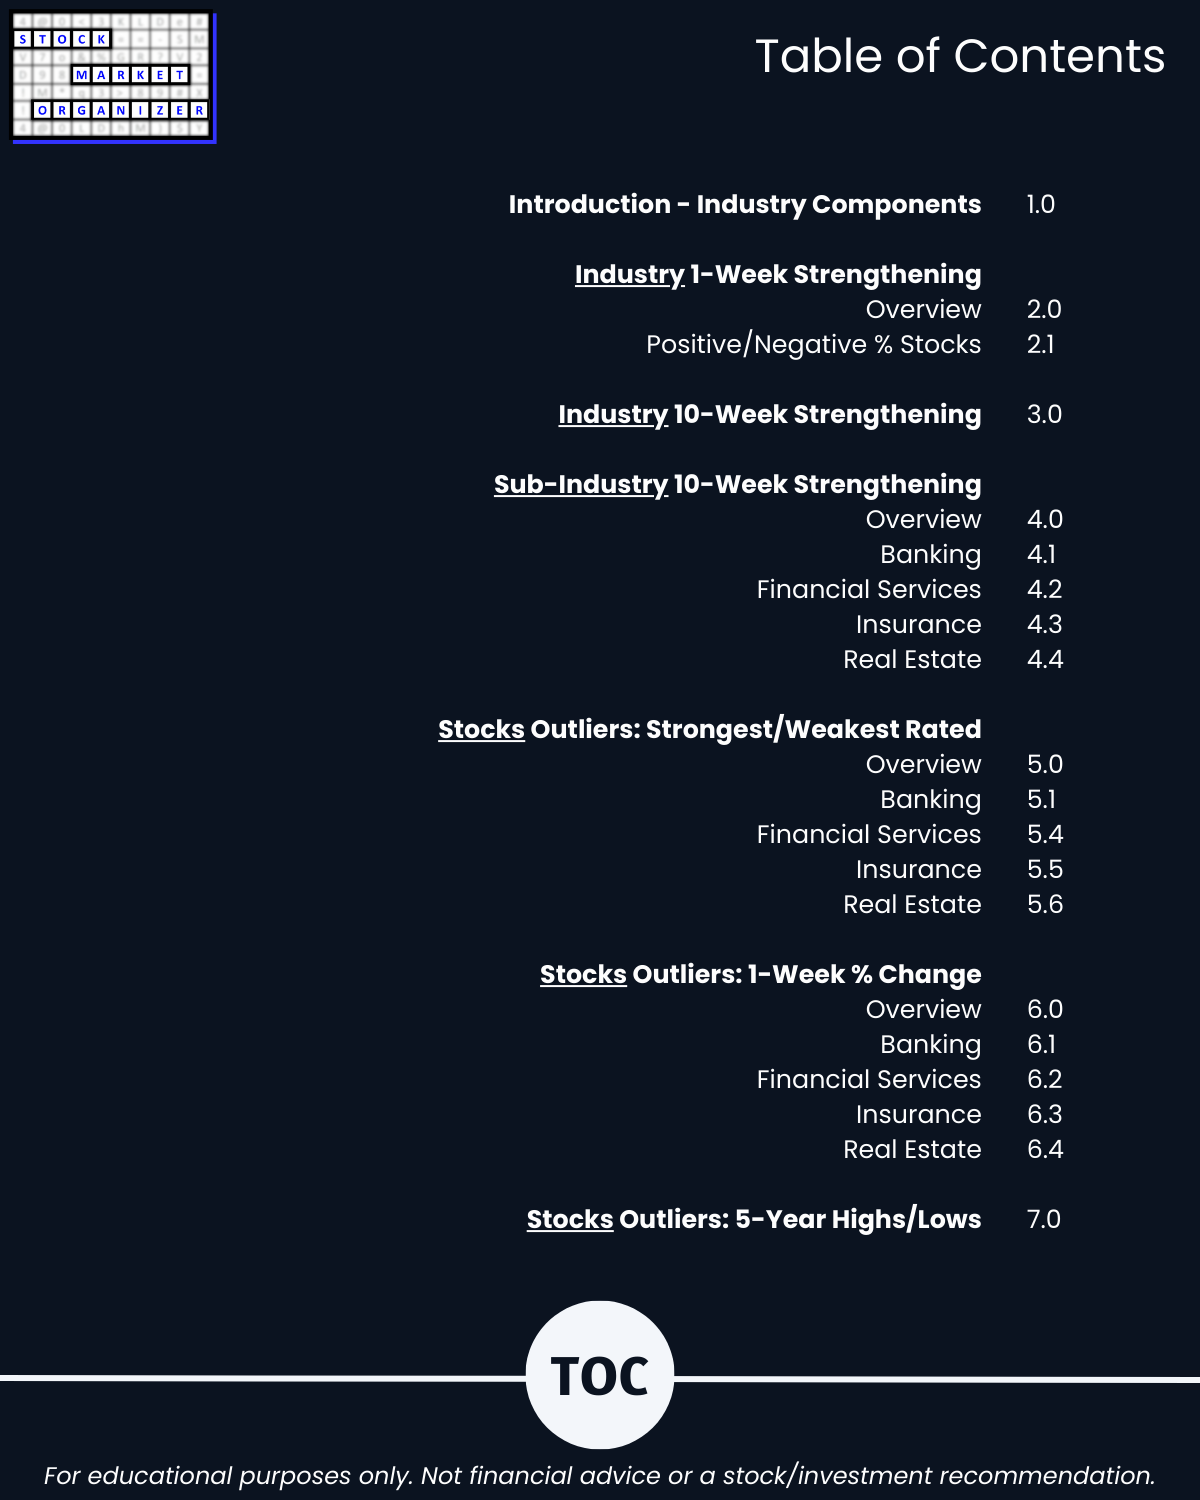
2. Industry 1-Week Strengthening
3. Industry 10-Week Strengthening
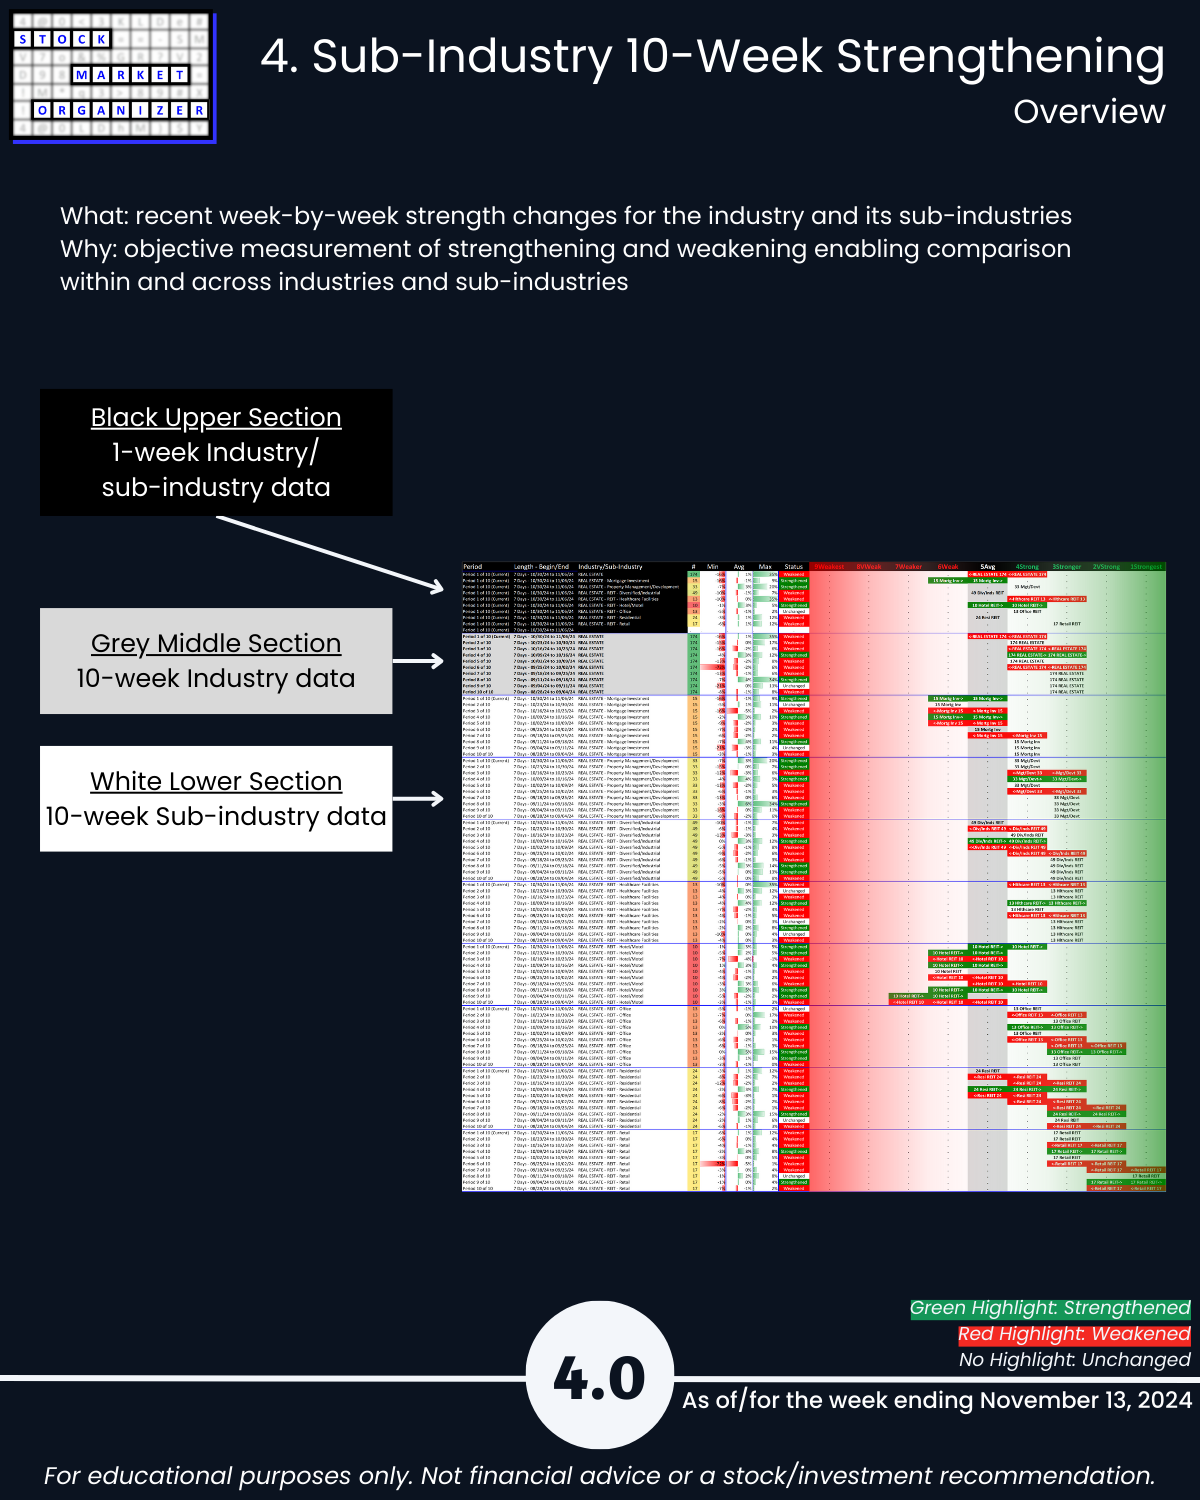
4. Sub-Industry 10-Week Strengthening
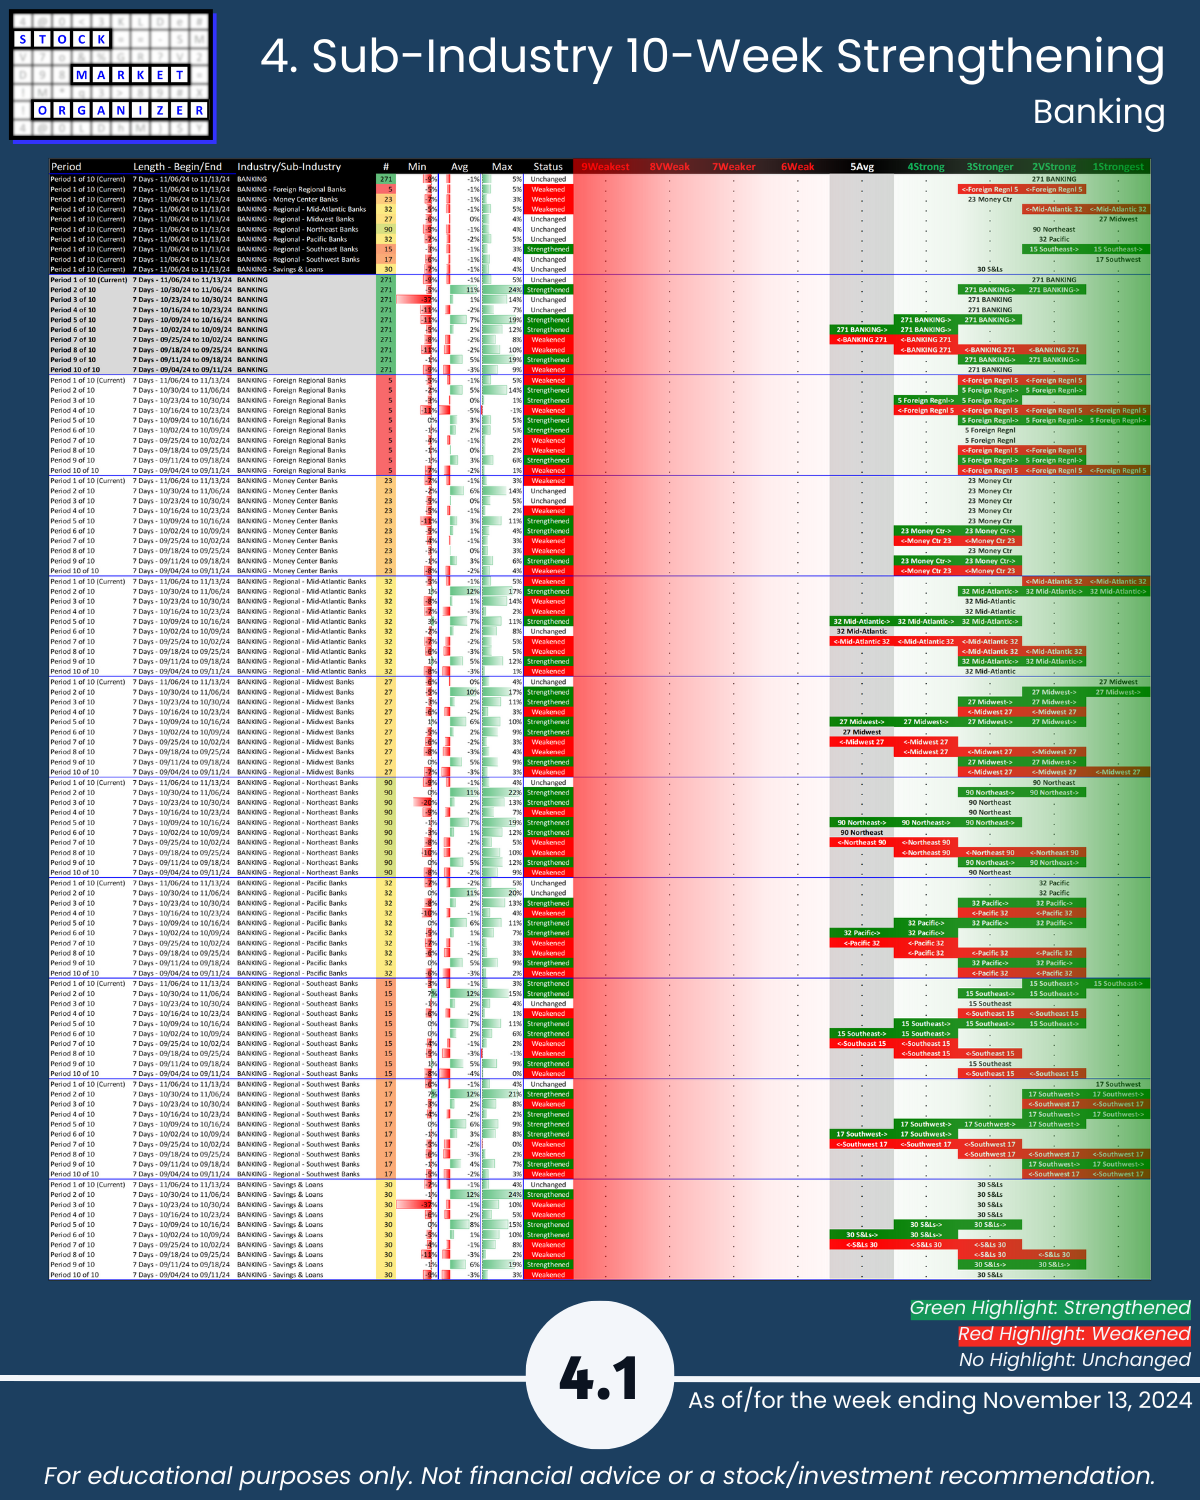
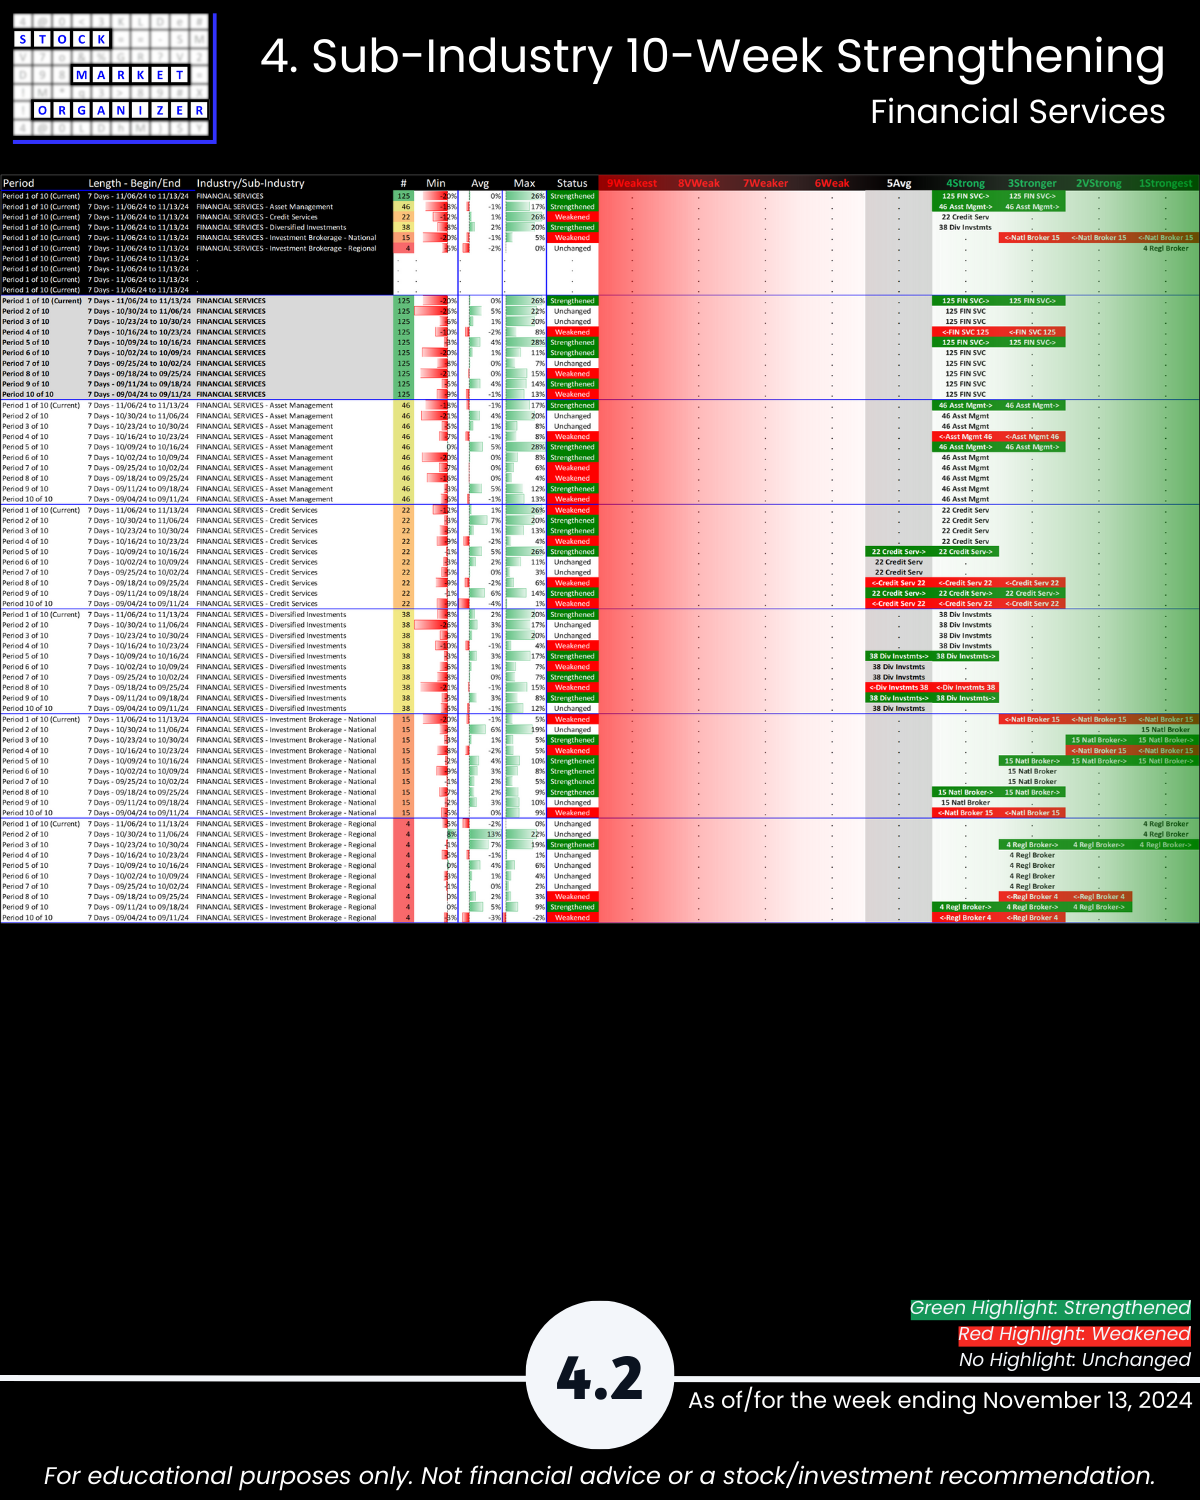
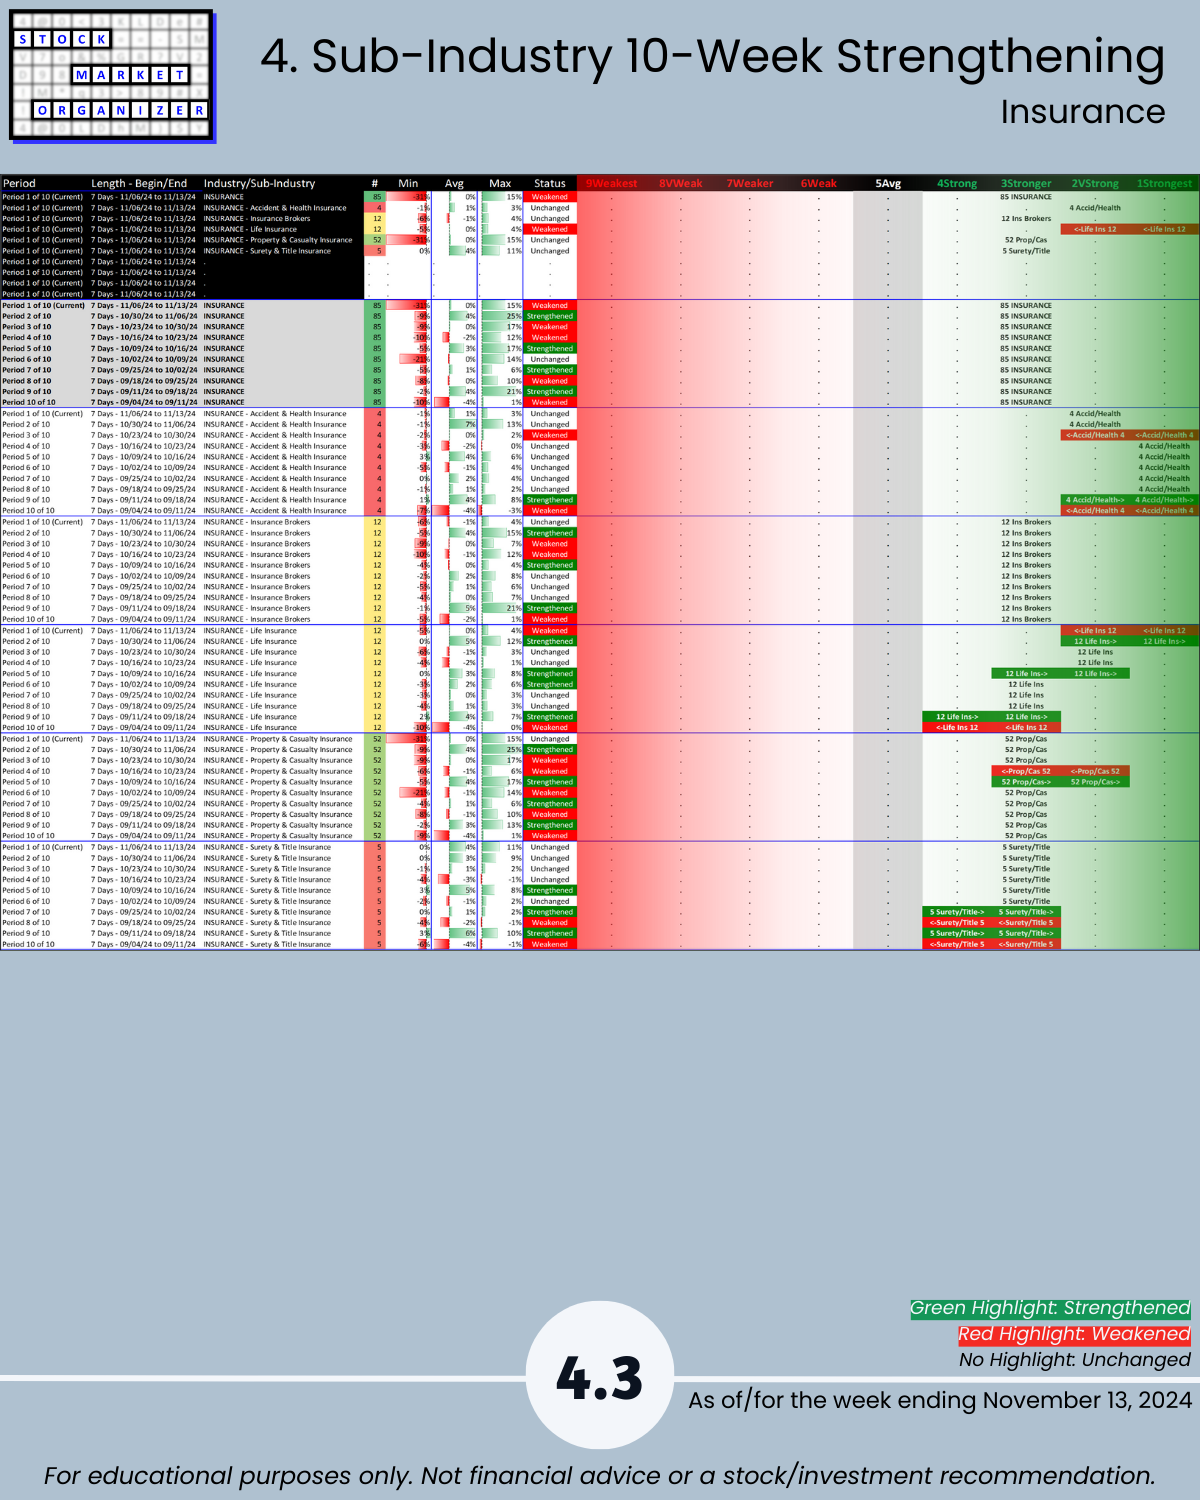
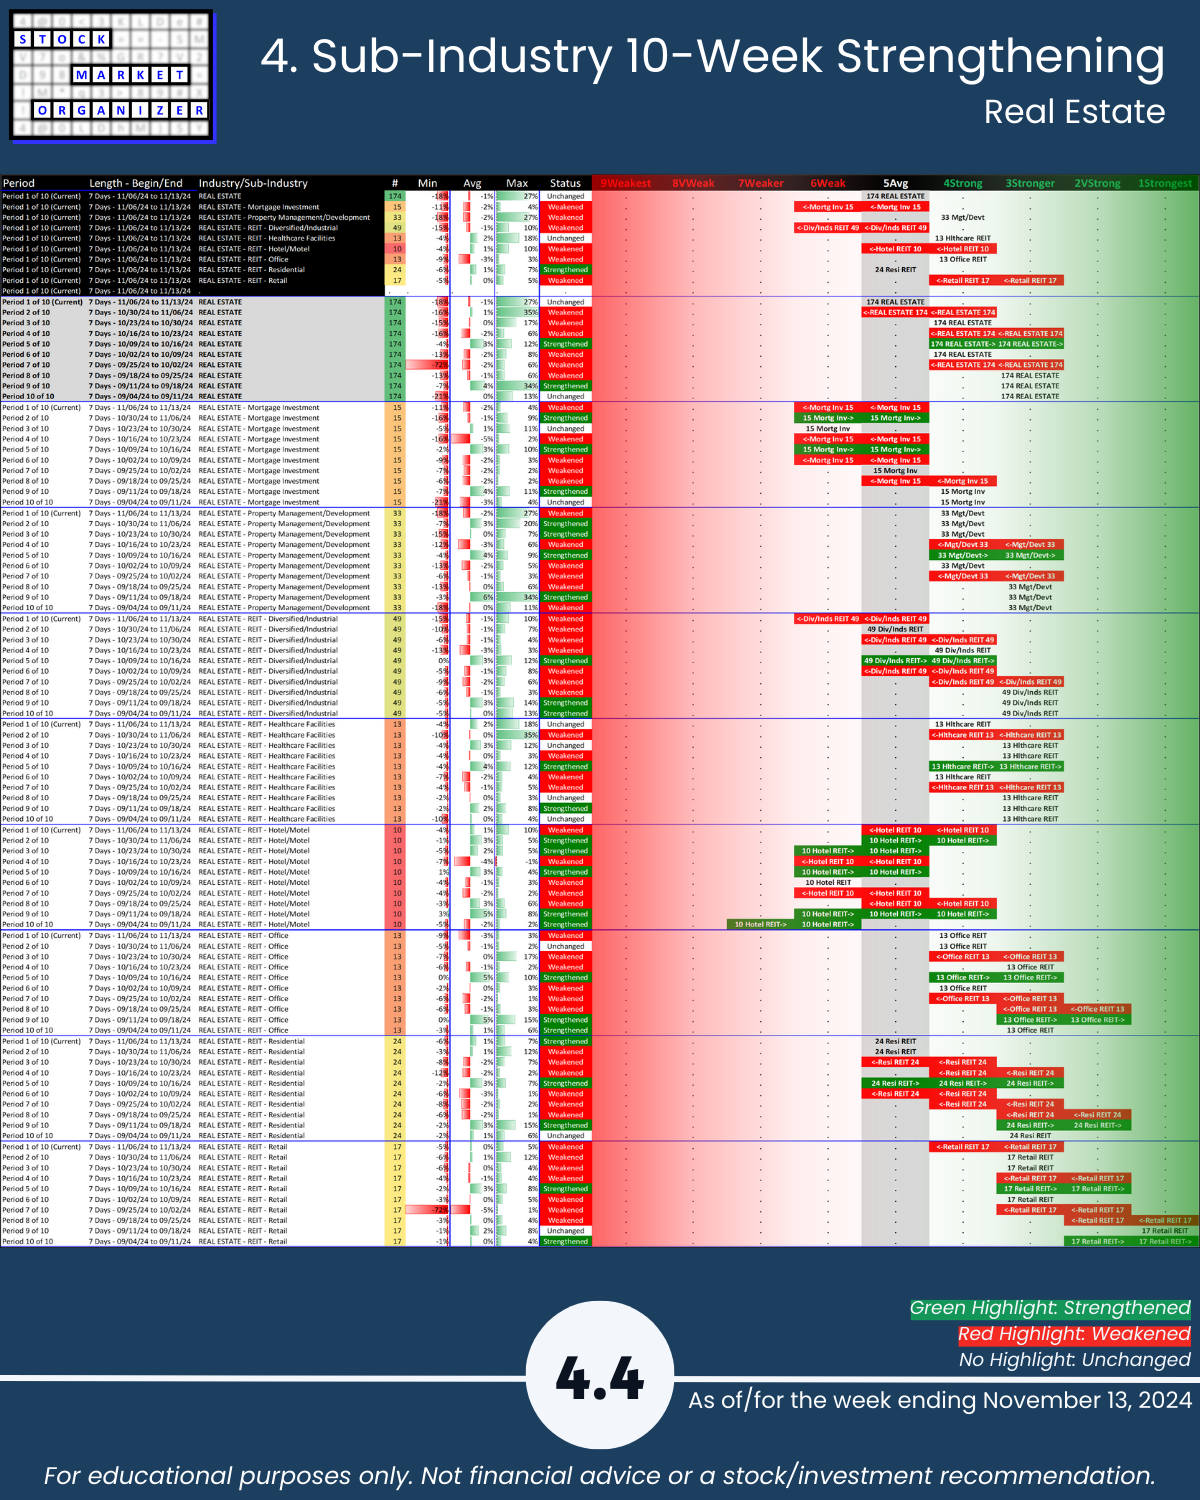
Note that Banking, Financial Services, and Insurance sub-industries for the past 10 weeks have all remained primarily on the Strong side of the ledger - that is, to the right of 5Average (see pages 4.1 through 4.3). In comparison, during this period some of the Real Estate sub-industries have fallen into the Weak side of the ledger, to the left of 5Average (see page 4.4). In fact, now two Real Estate sub-industries are rated 6Weak, the only ones out of 27 Financial Sector sub-industries.
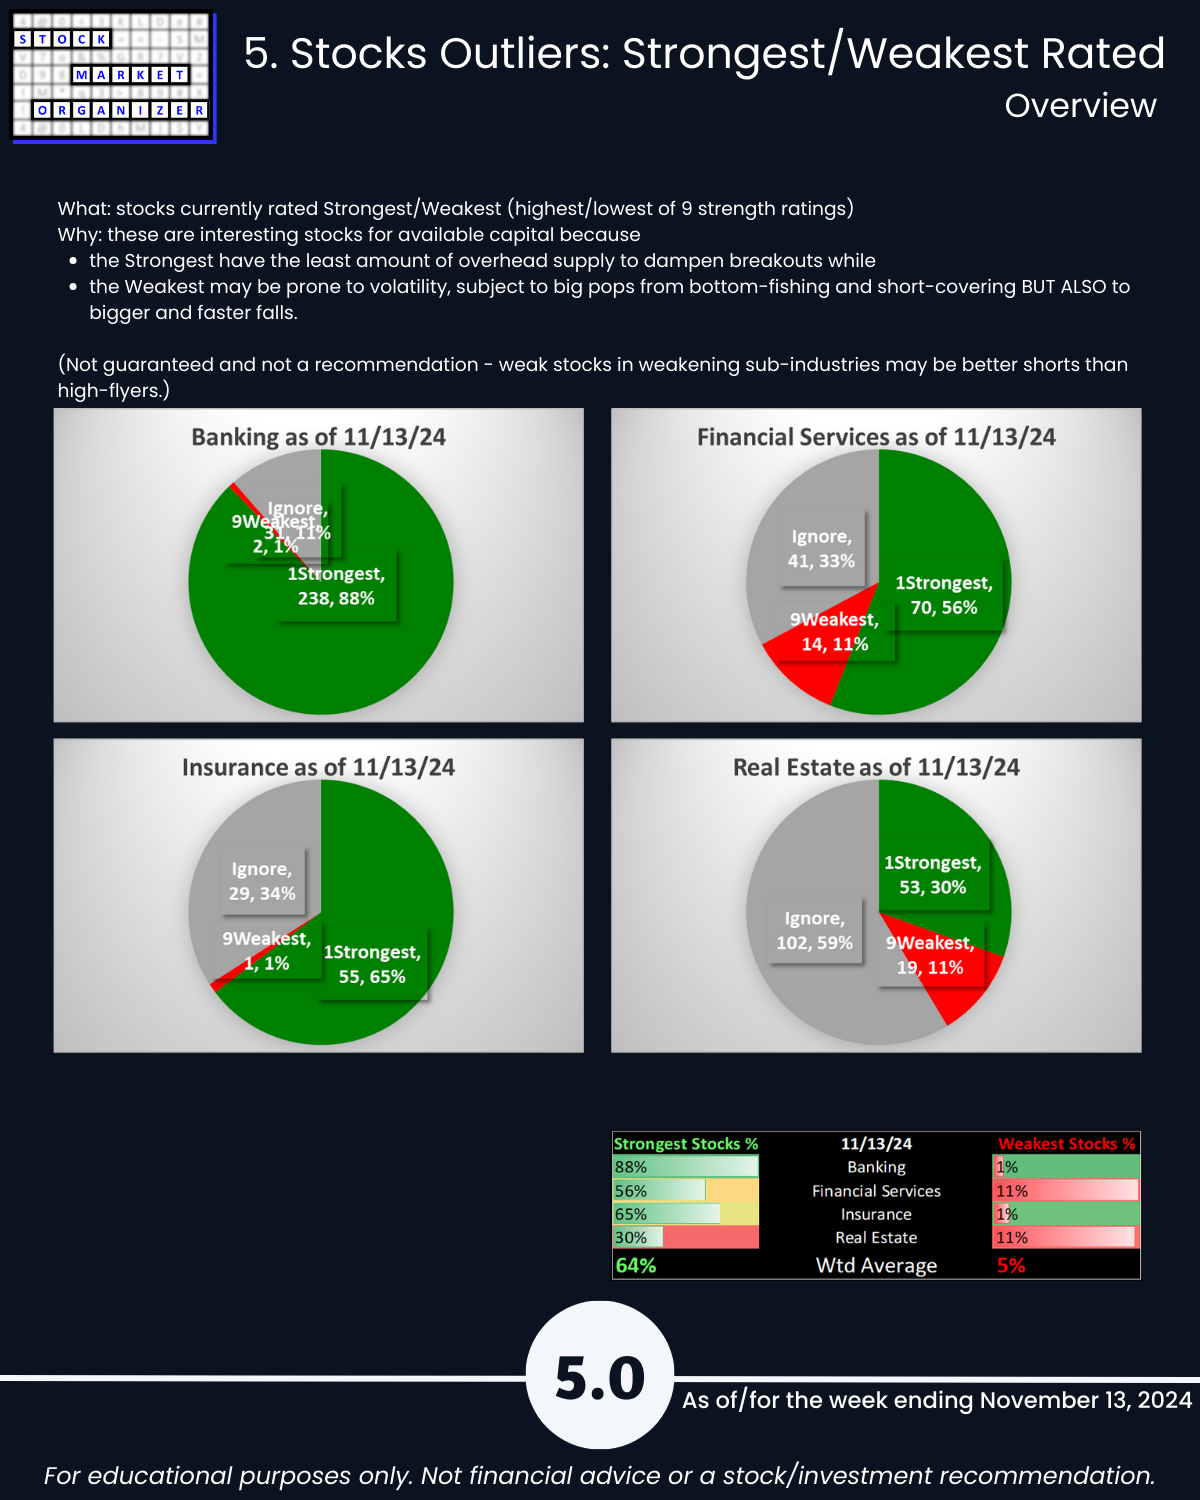
5. Stocks Outliers: Strongest/Weakest Rated
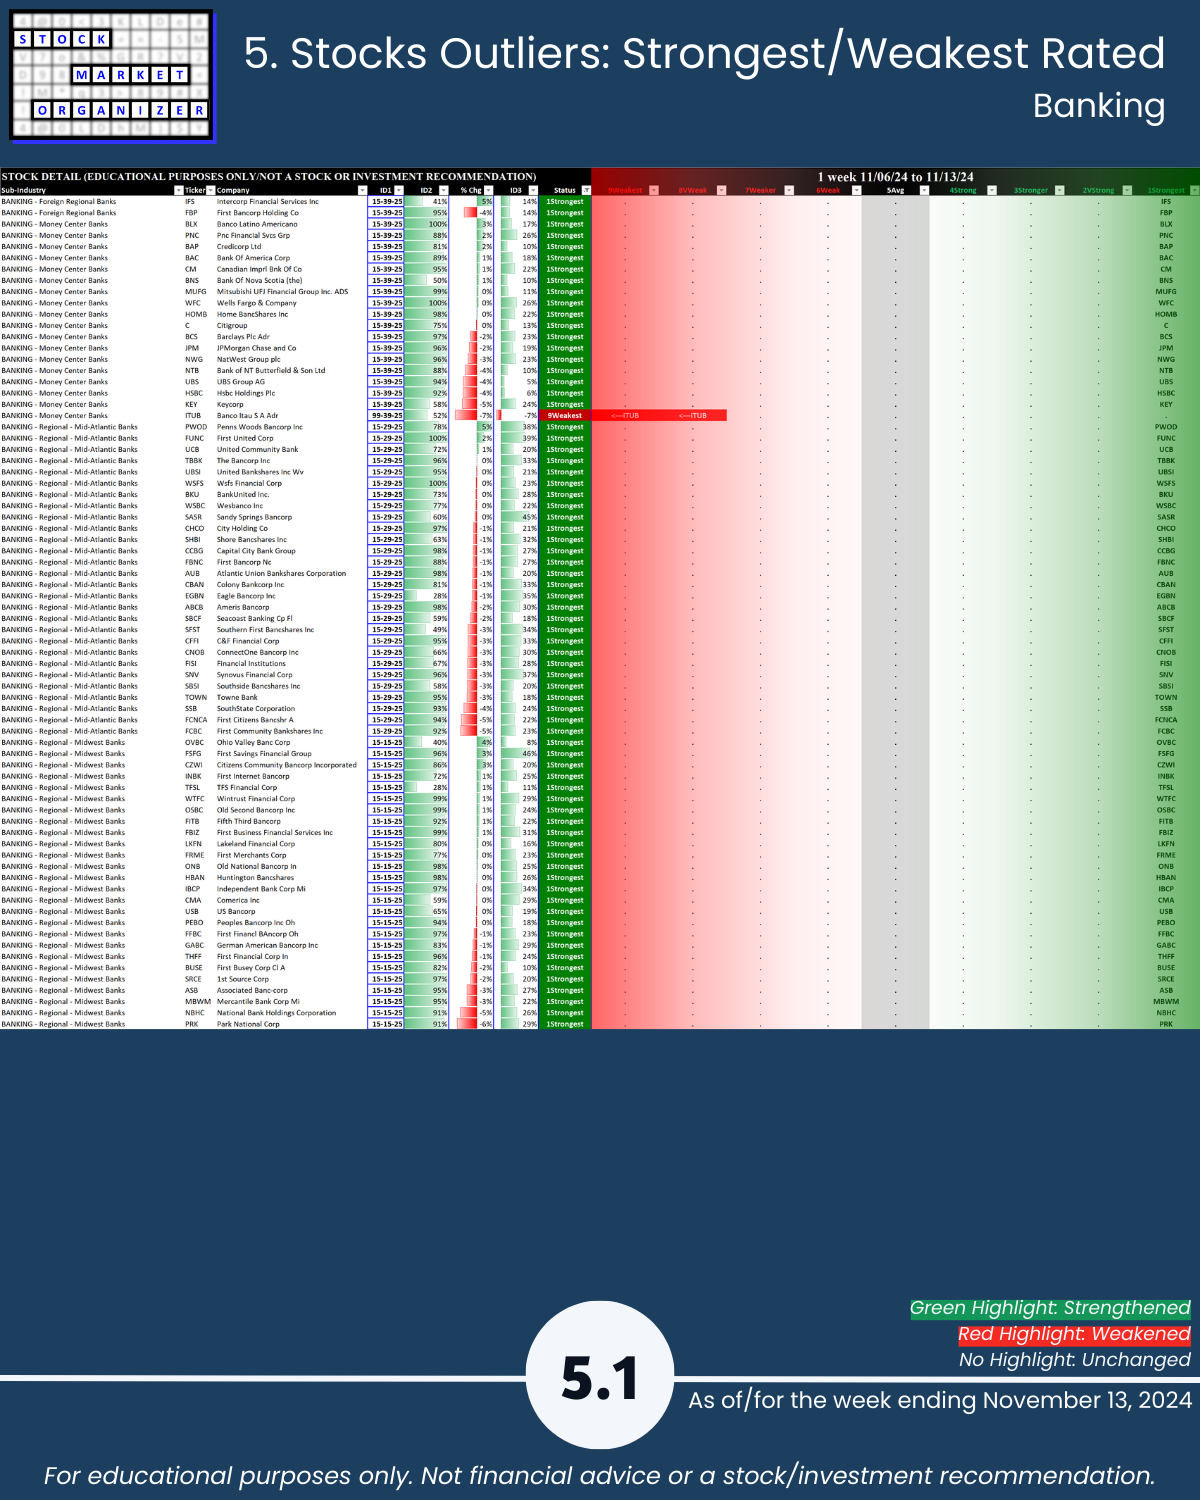
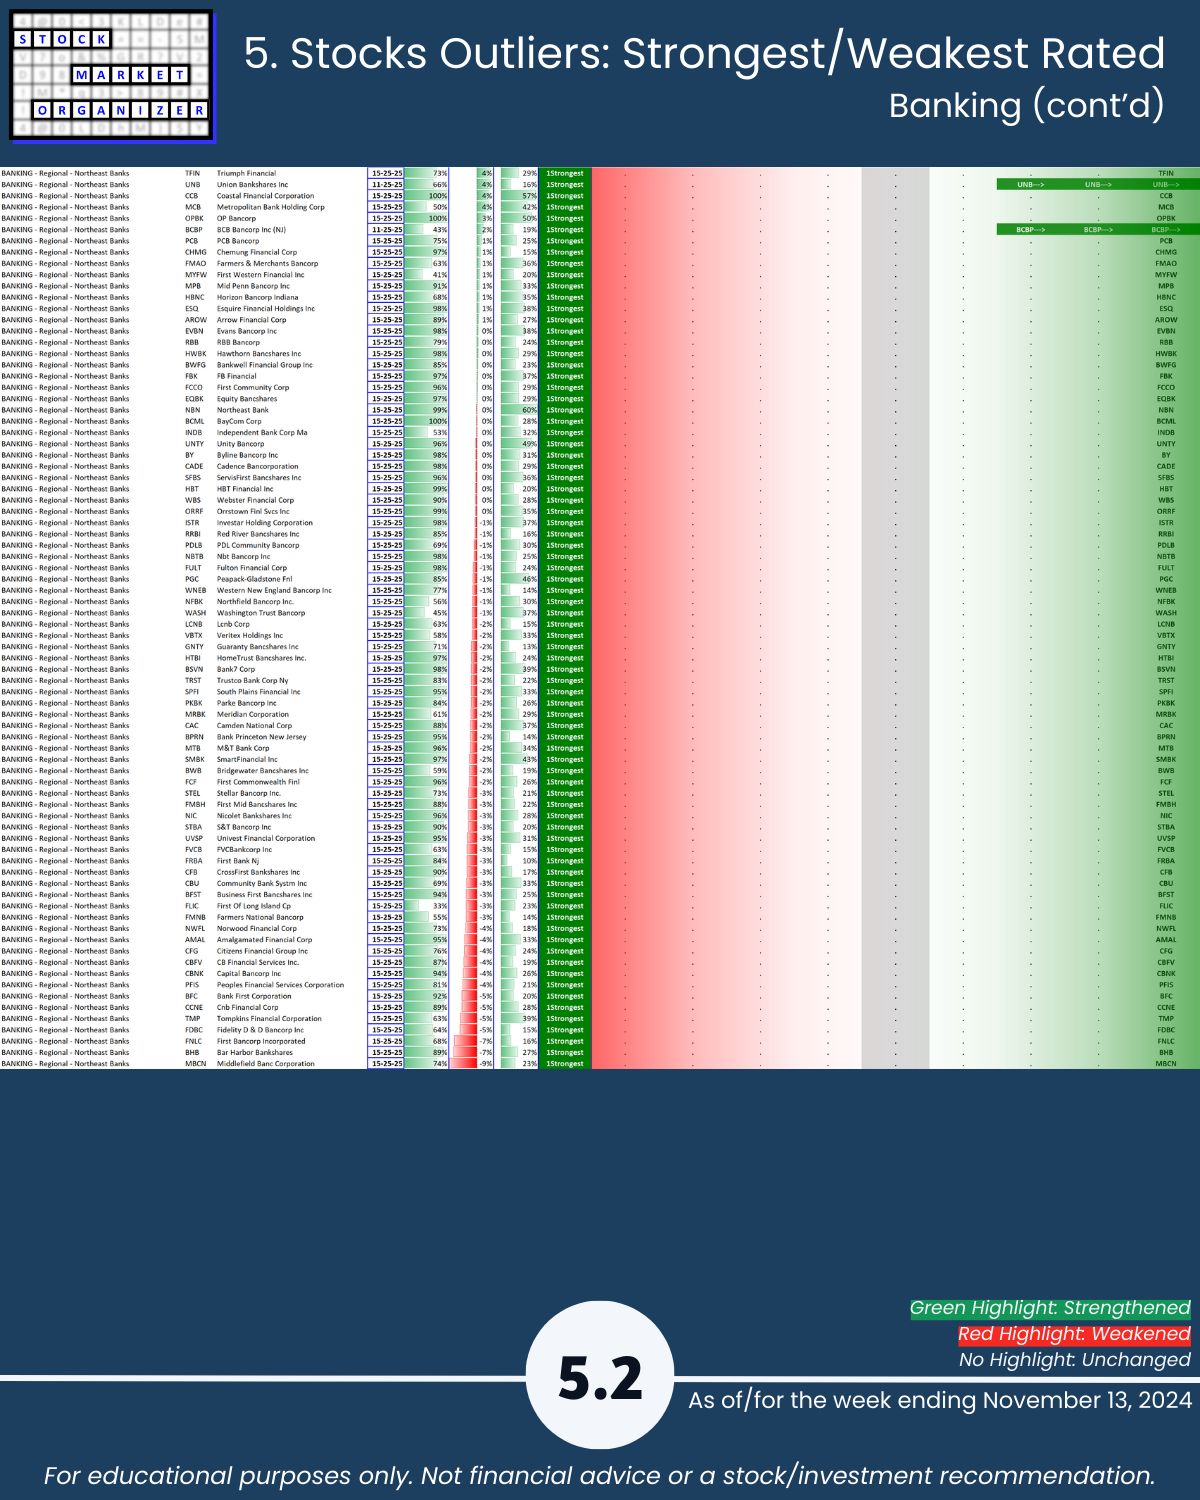
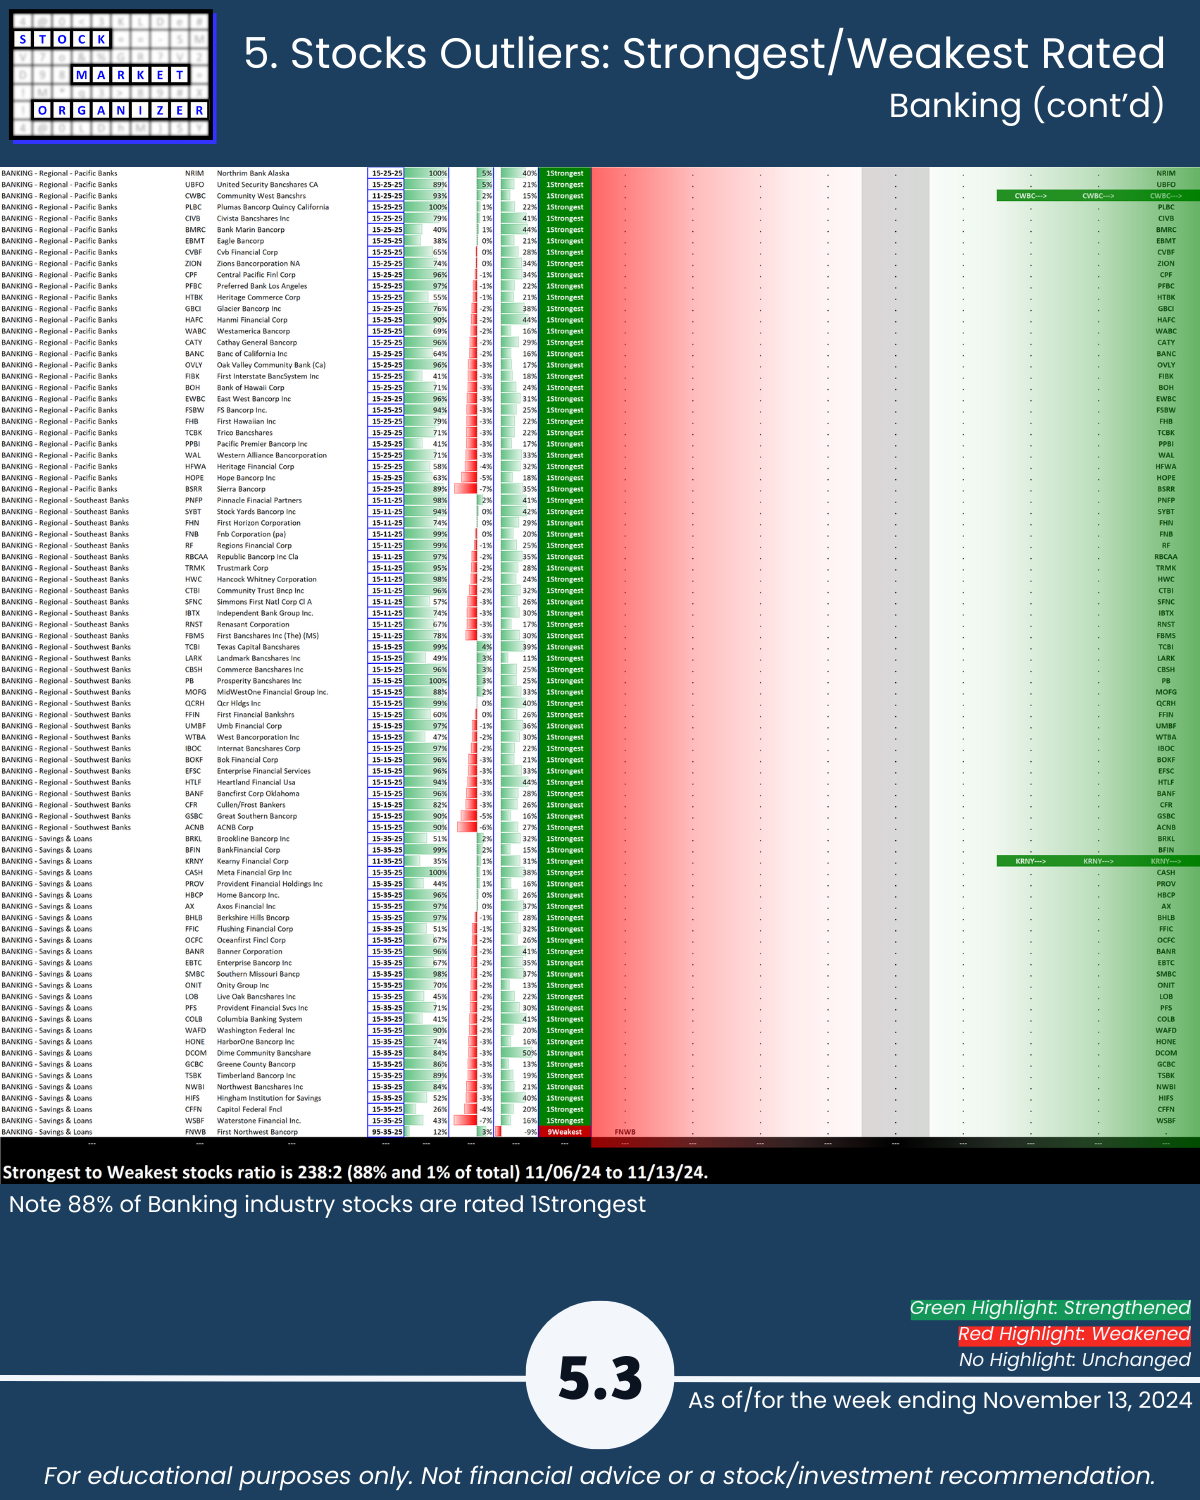
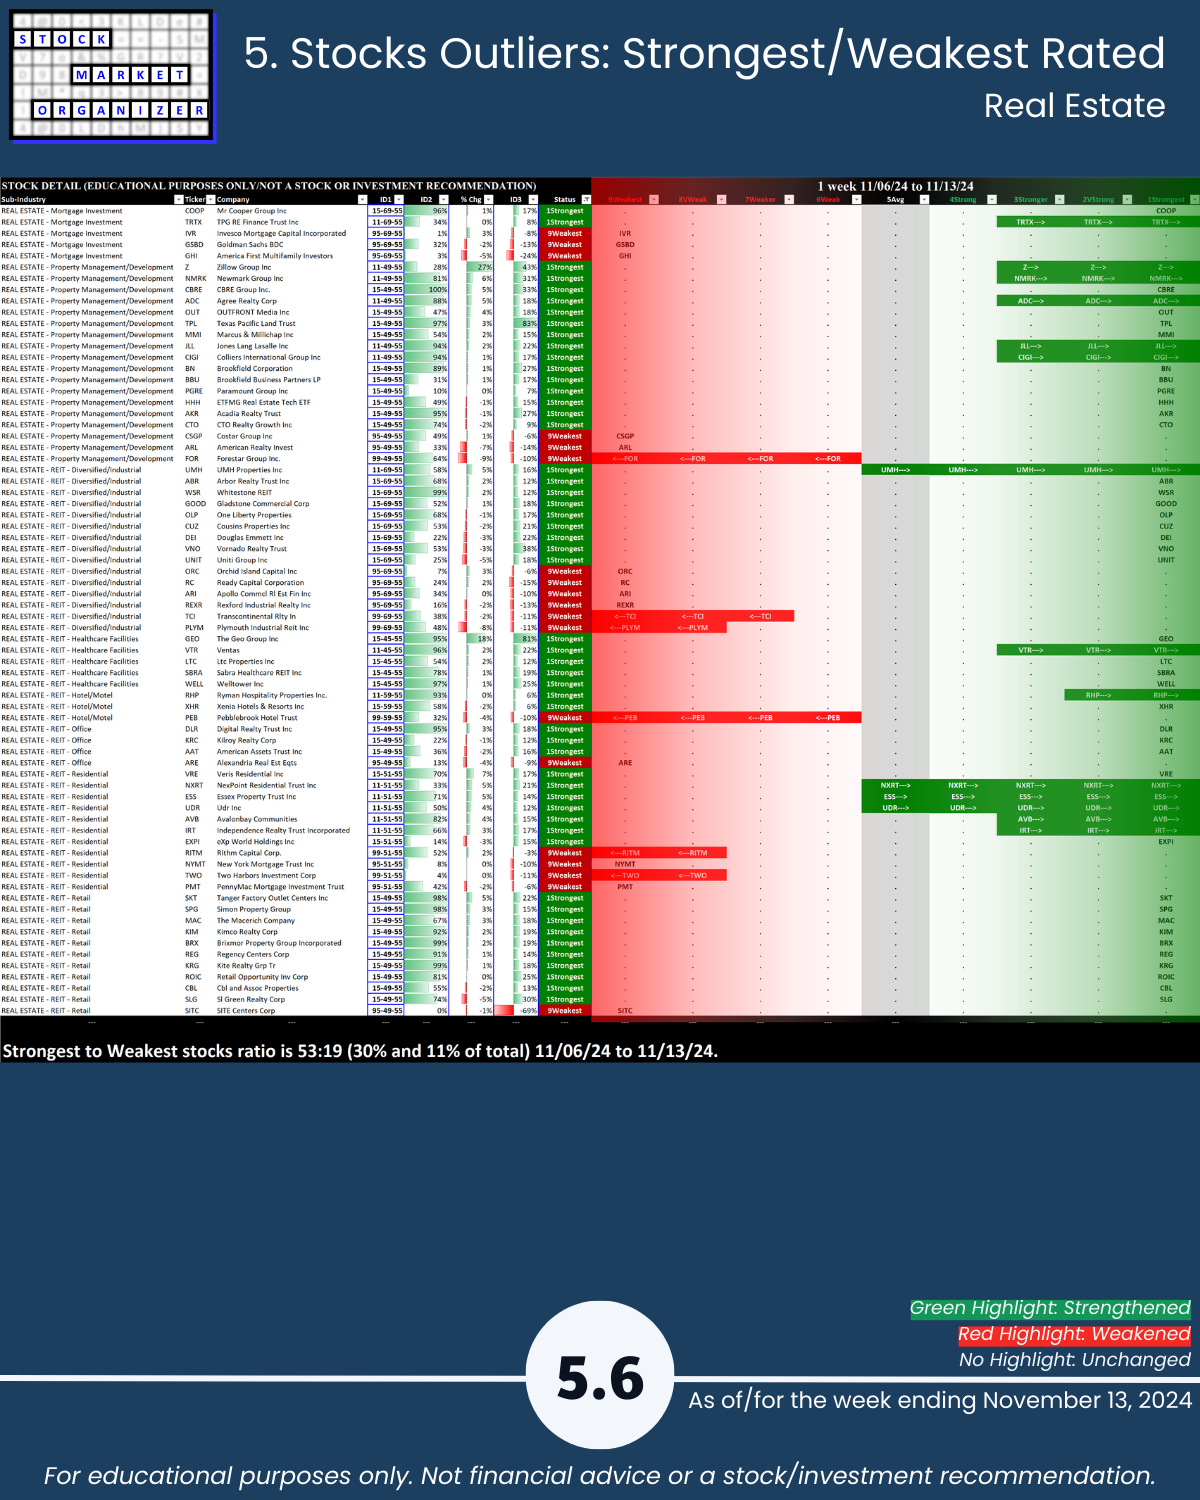
Note Banking pages 5.1 through 5.3 shows minimal changes in ratings for any individual stocks. Meanwhile, Real Estate page 5.6 shows a fair number of both strengthening and weakening stocks that changed ratings during the week.
6. Stocks Outliers: 1-Week % Change
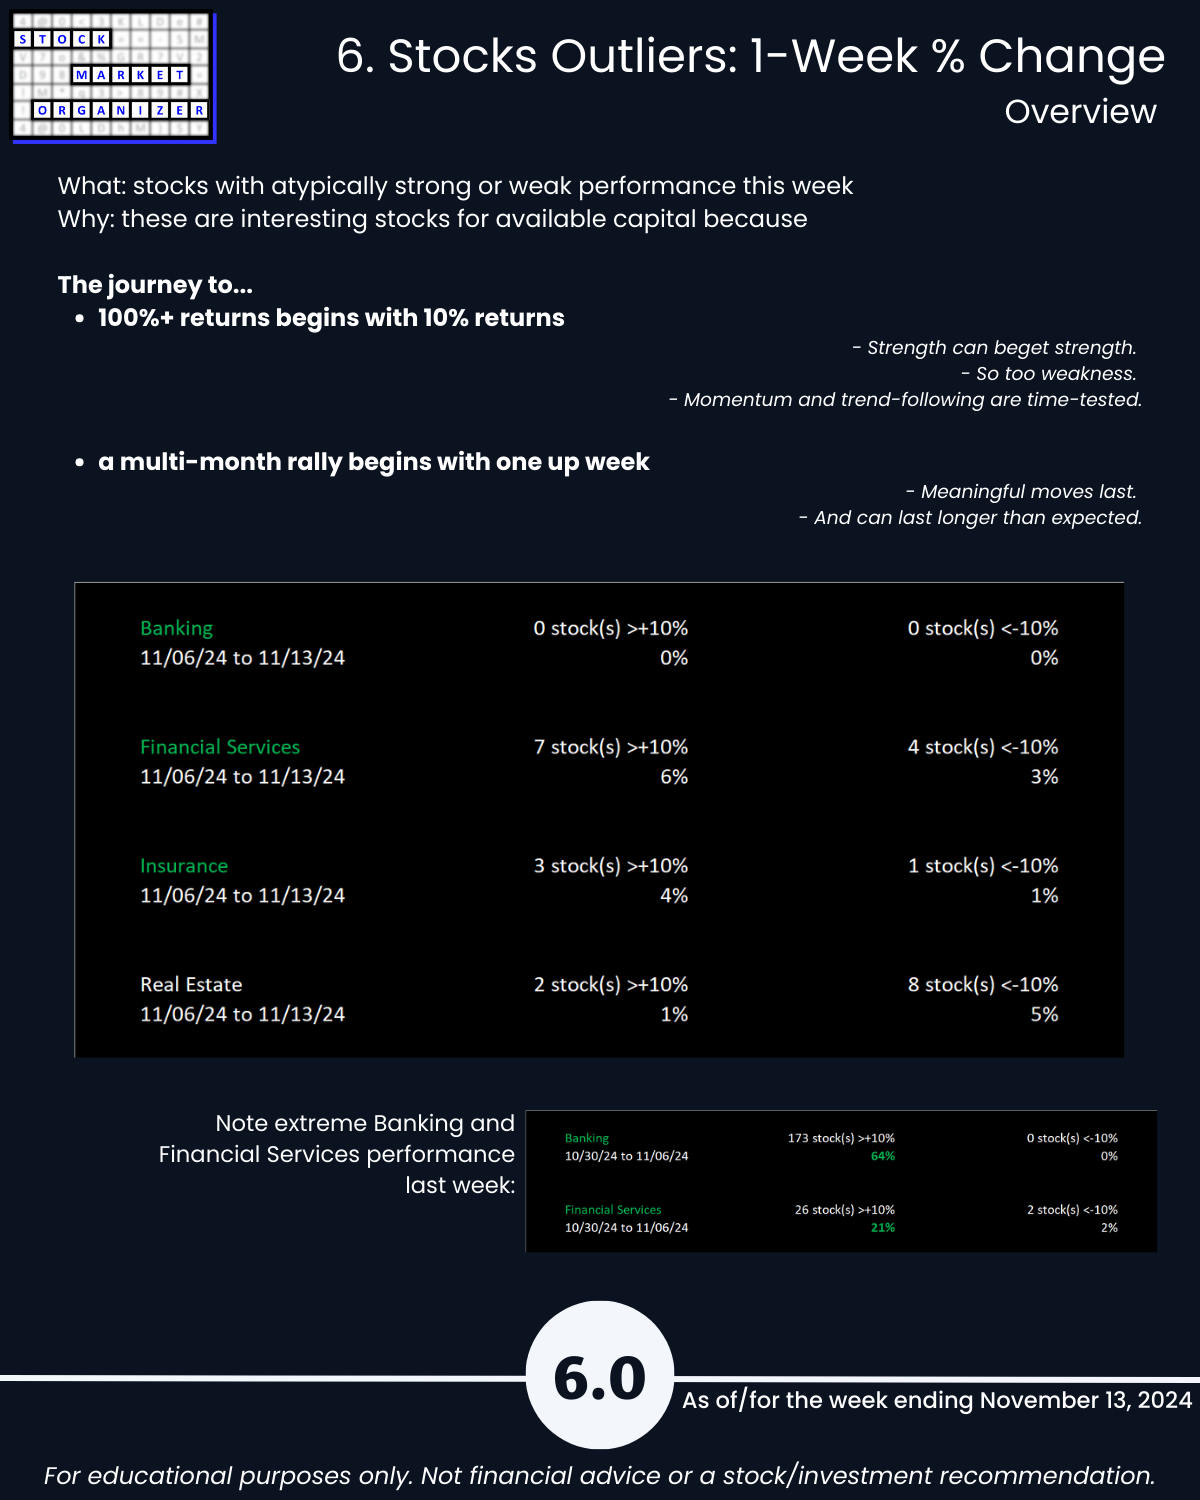
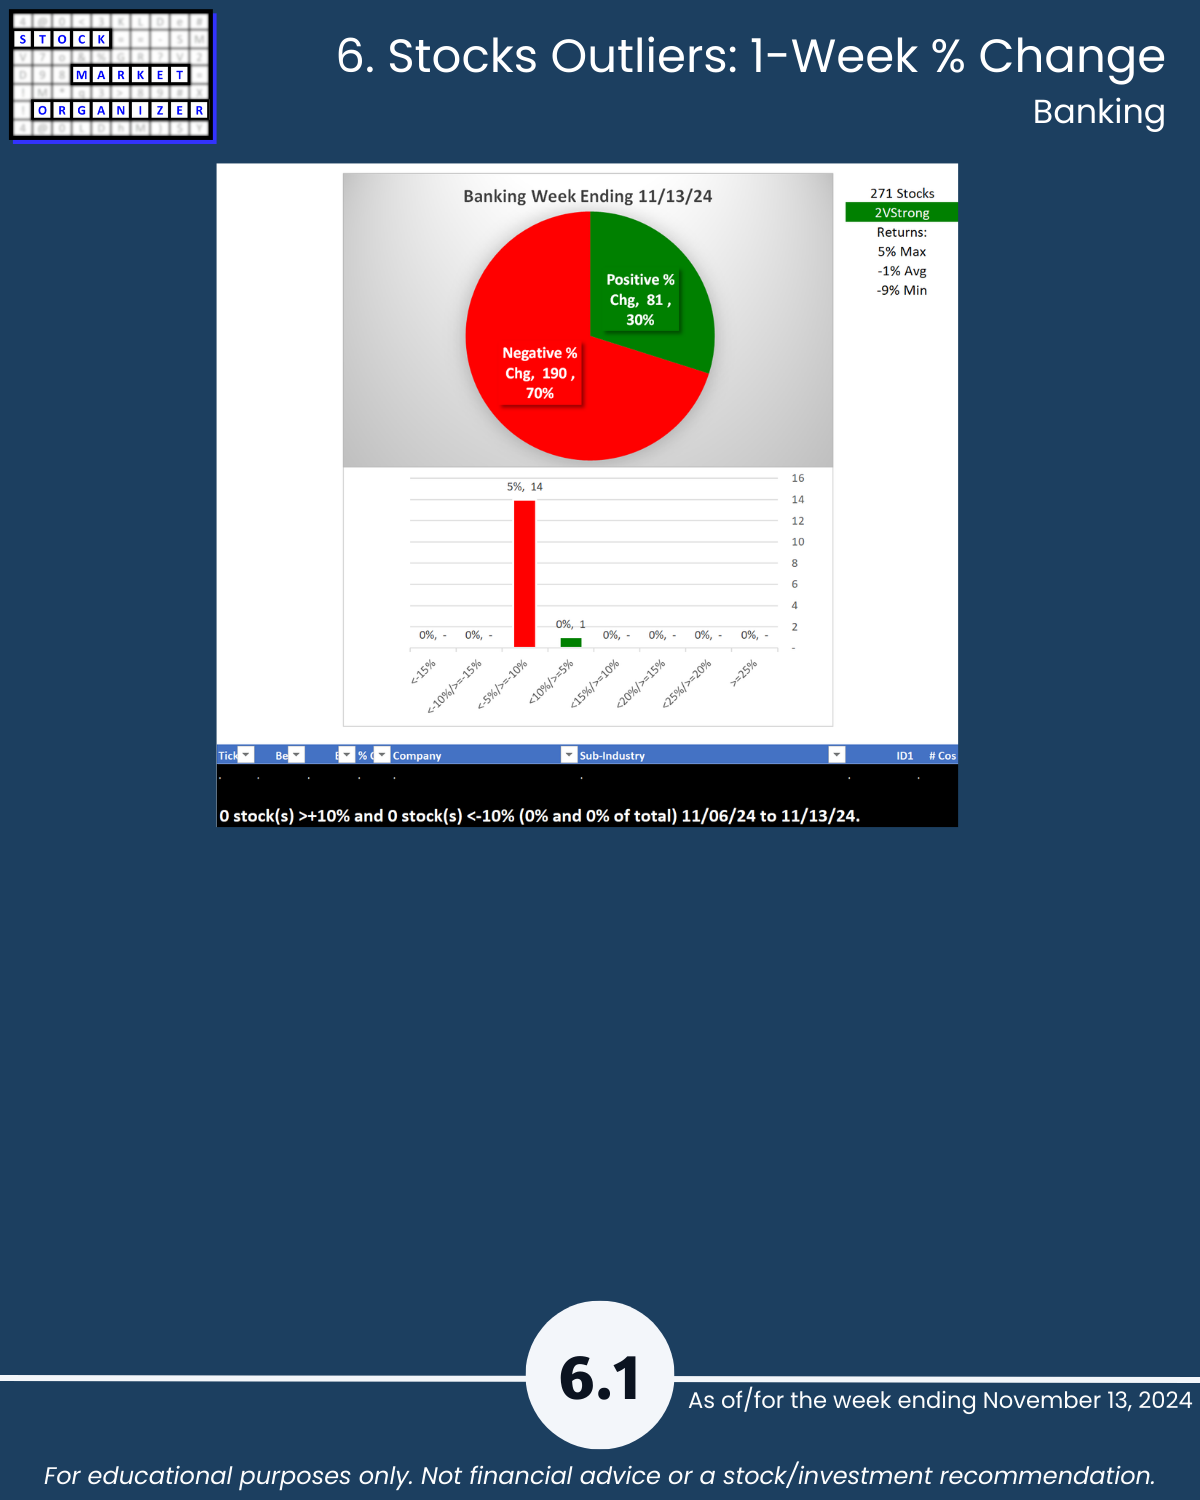
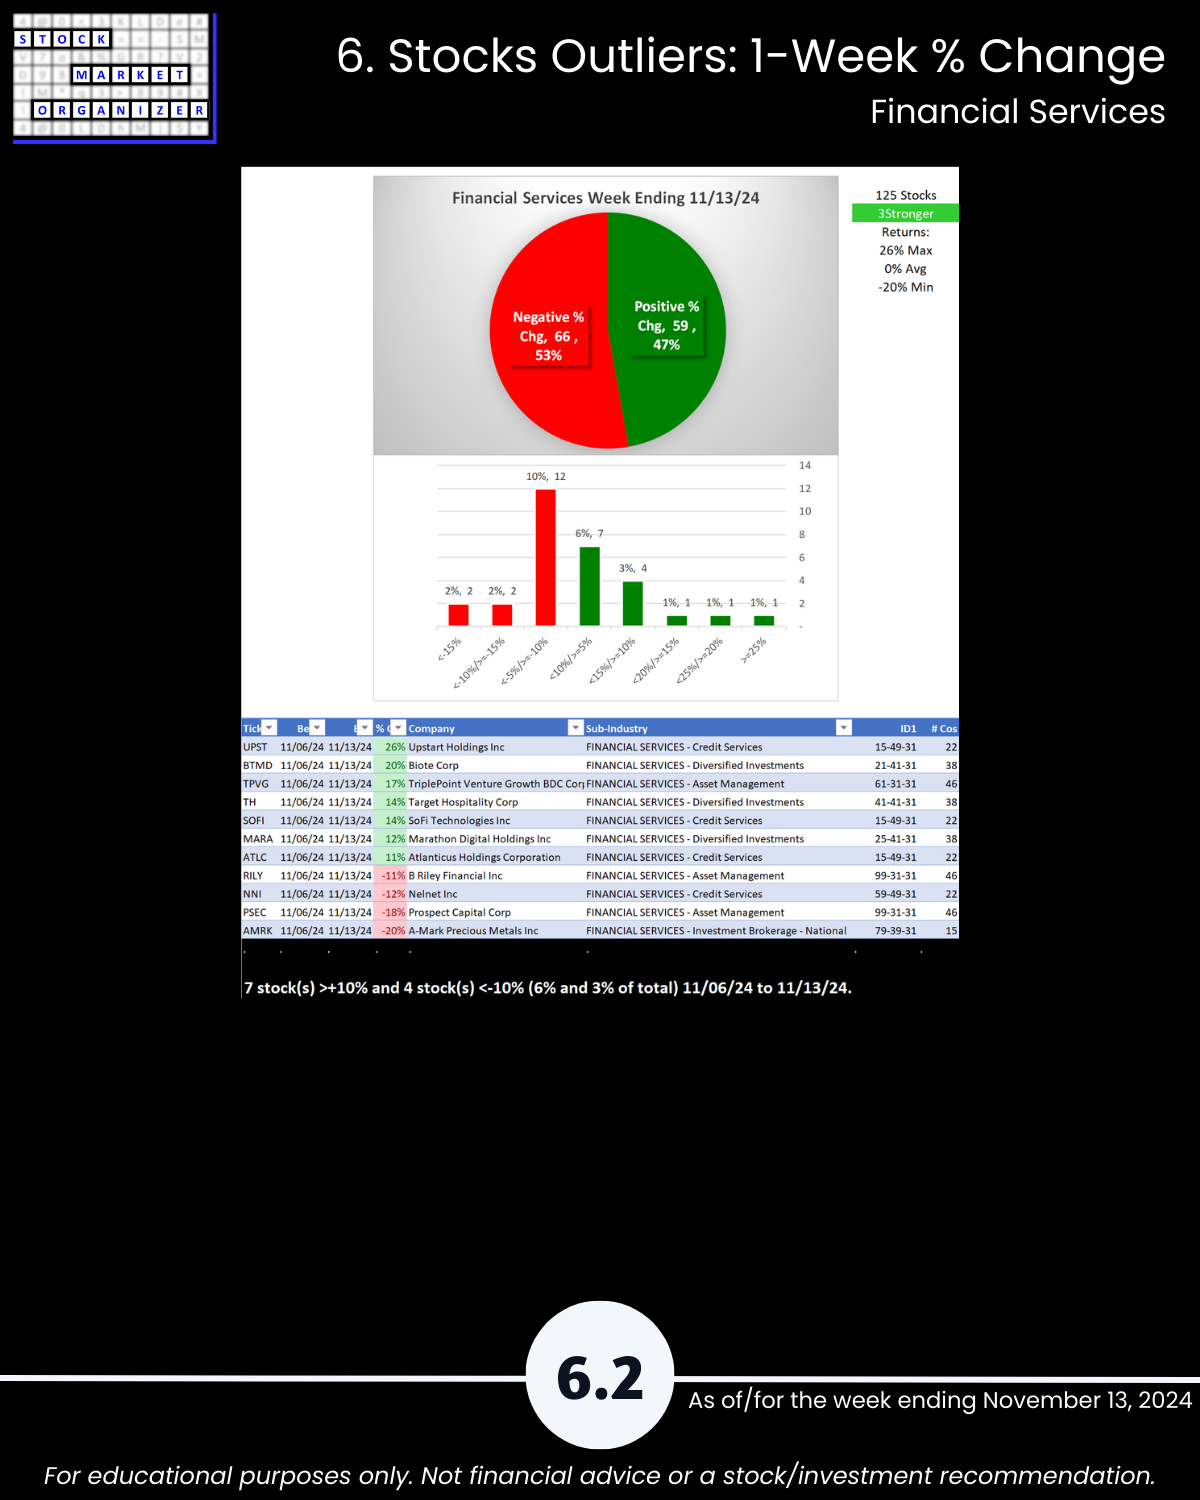
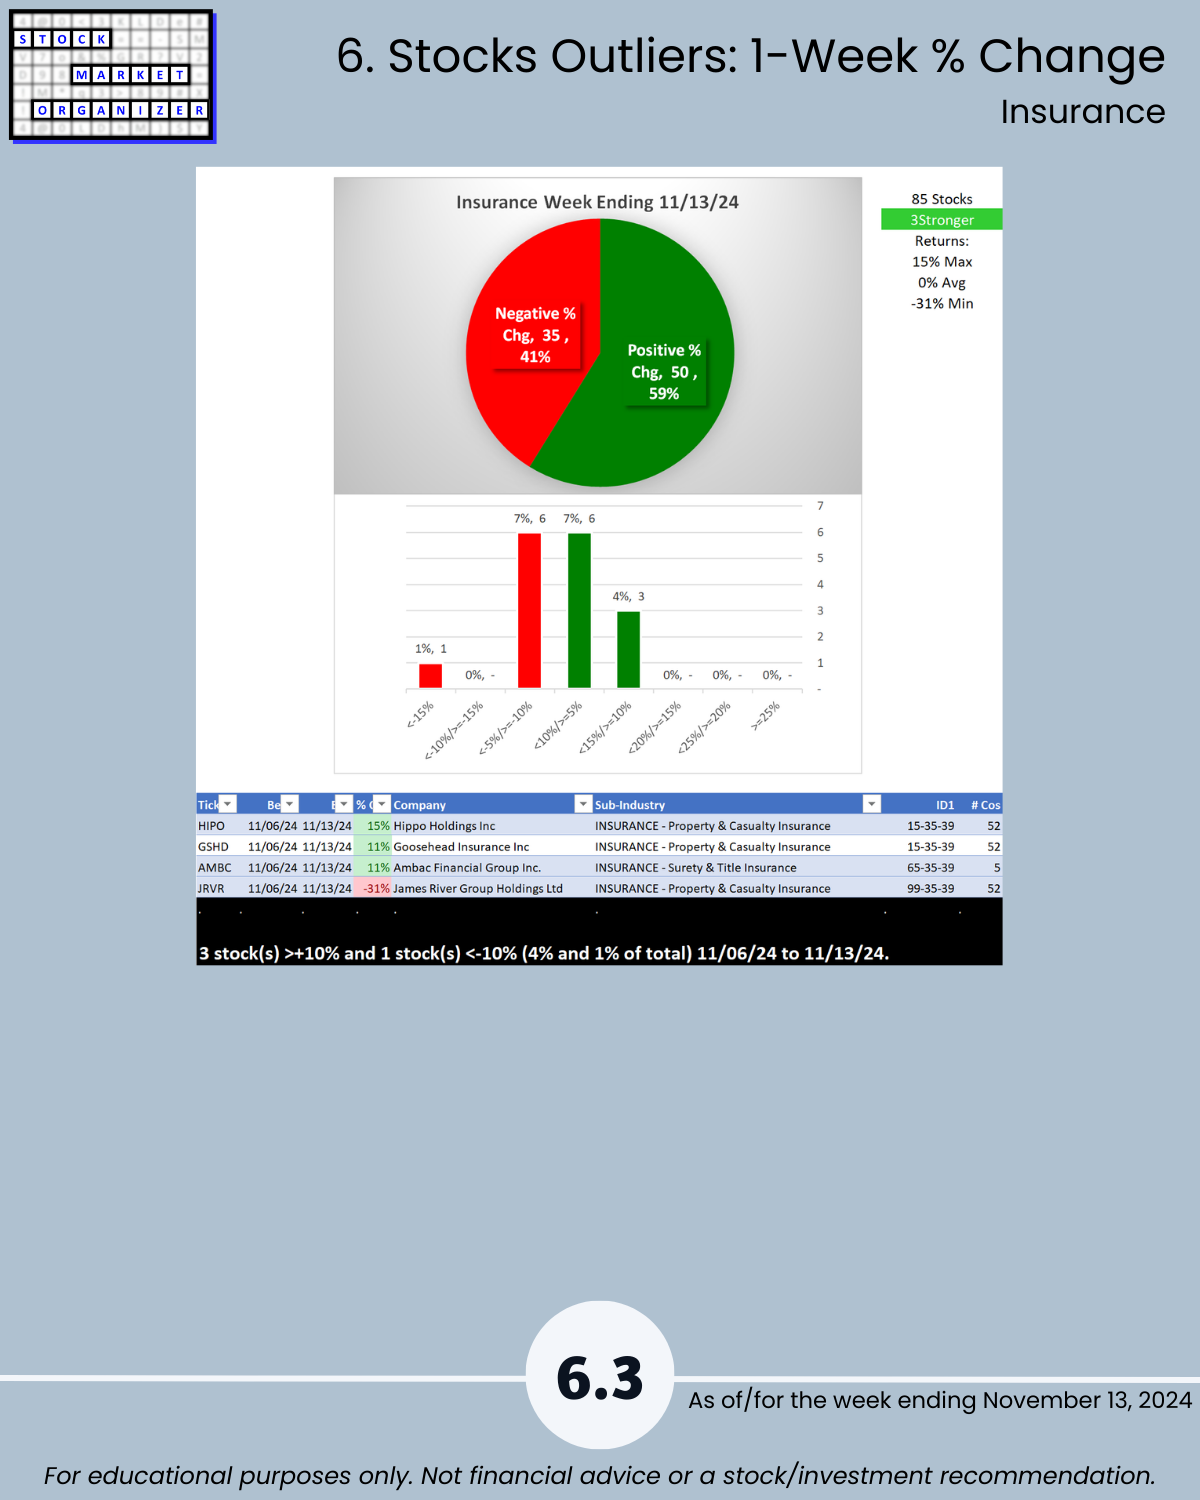
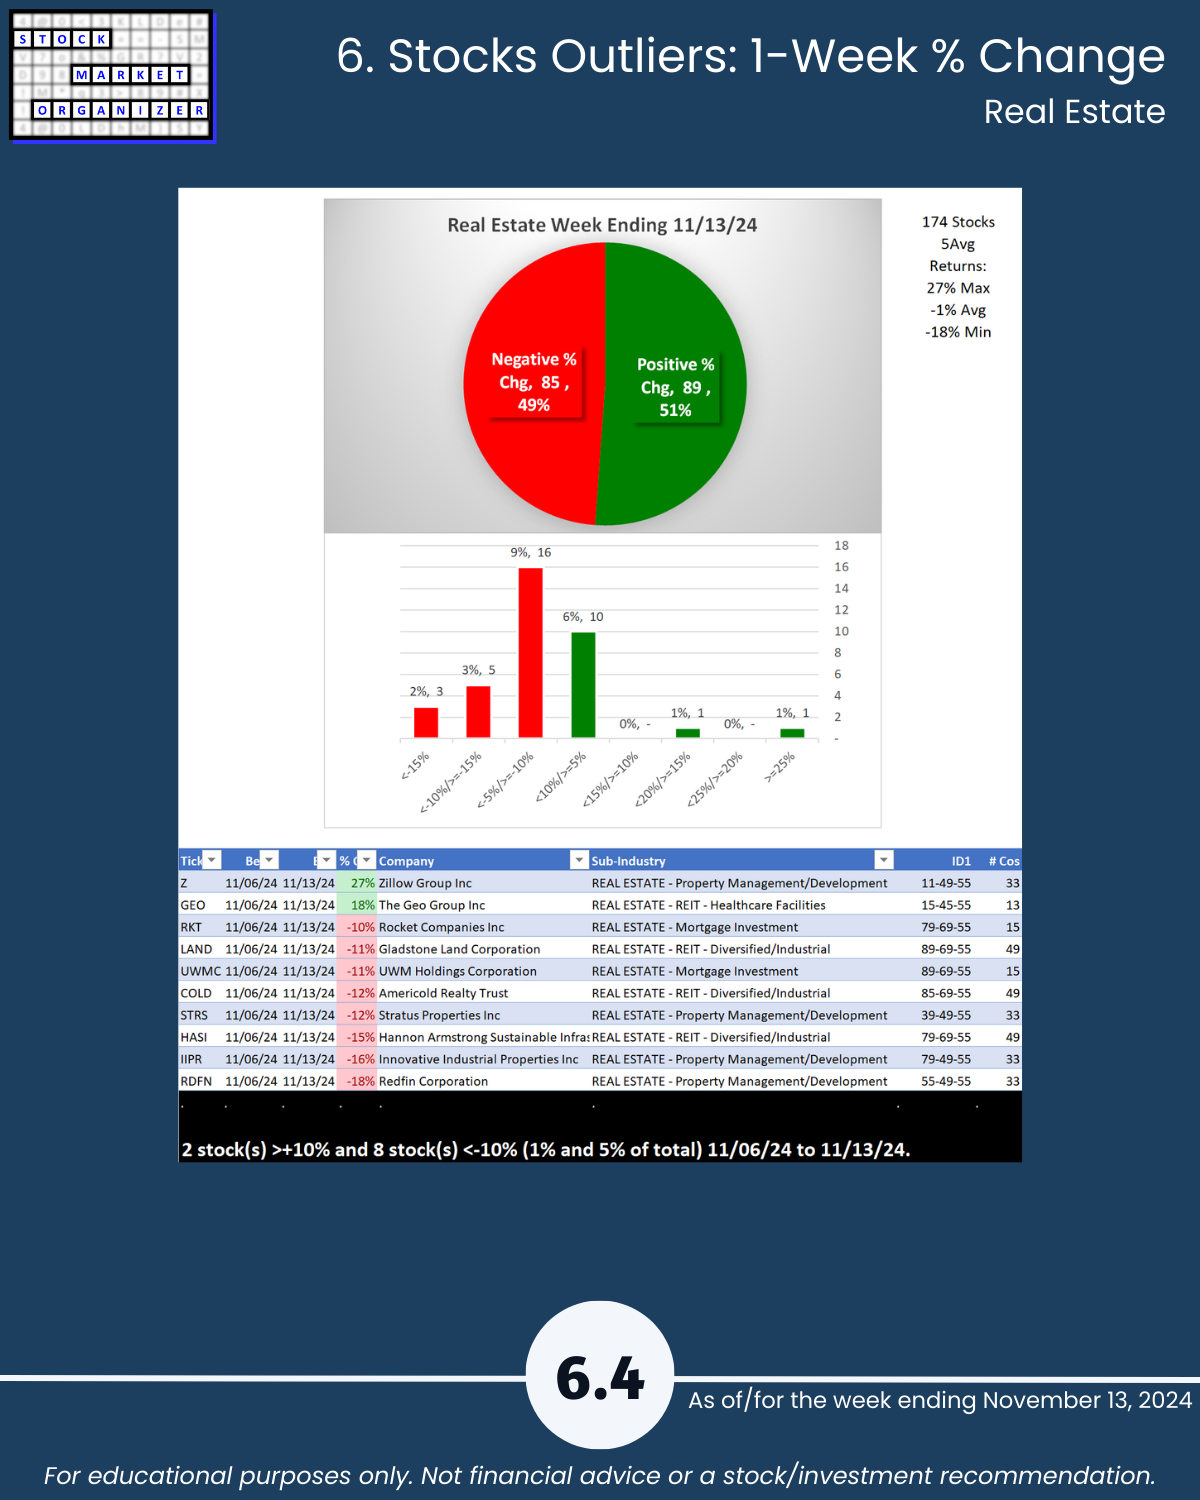
Banking Page 6.1 shows a 30/70 split of positive vs. negative stocks for the week but had no major outliers greater than +10% or less than -10% in terms of return for the week. Note the detail revealing large outliers on each industry page - these can flag newly "in-play" stocks.
7. Stocks Outliers: 5-Year Highs/Lows
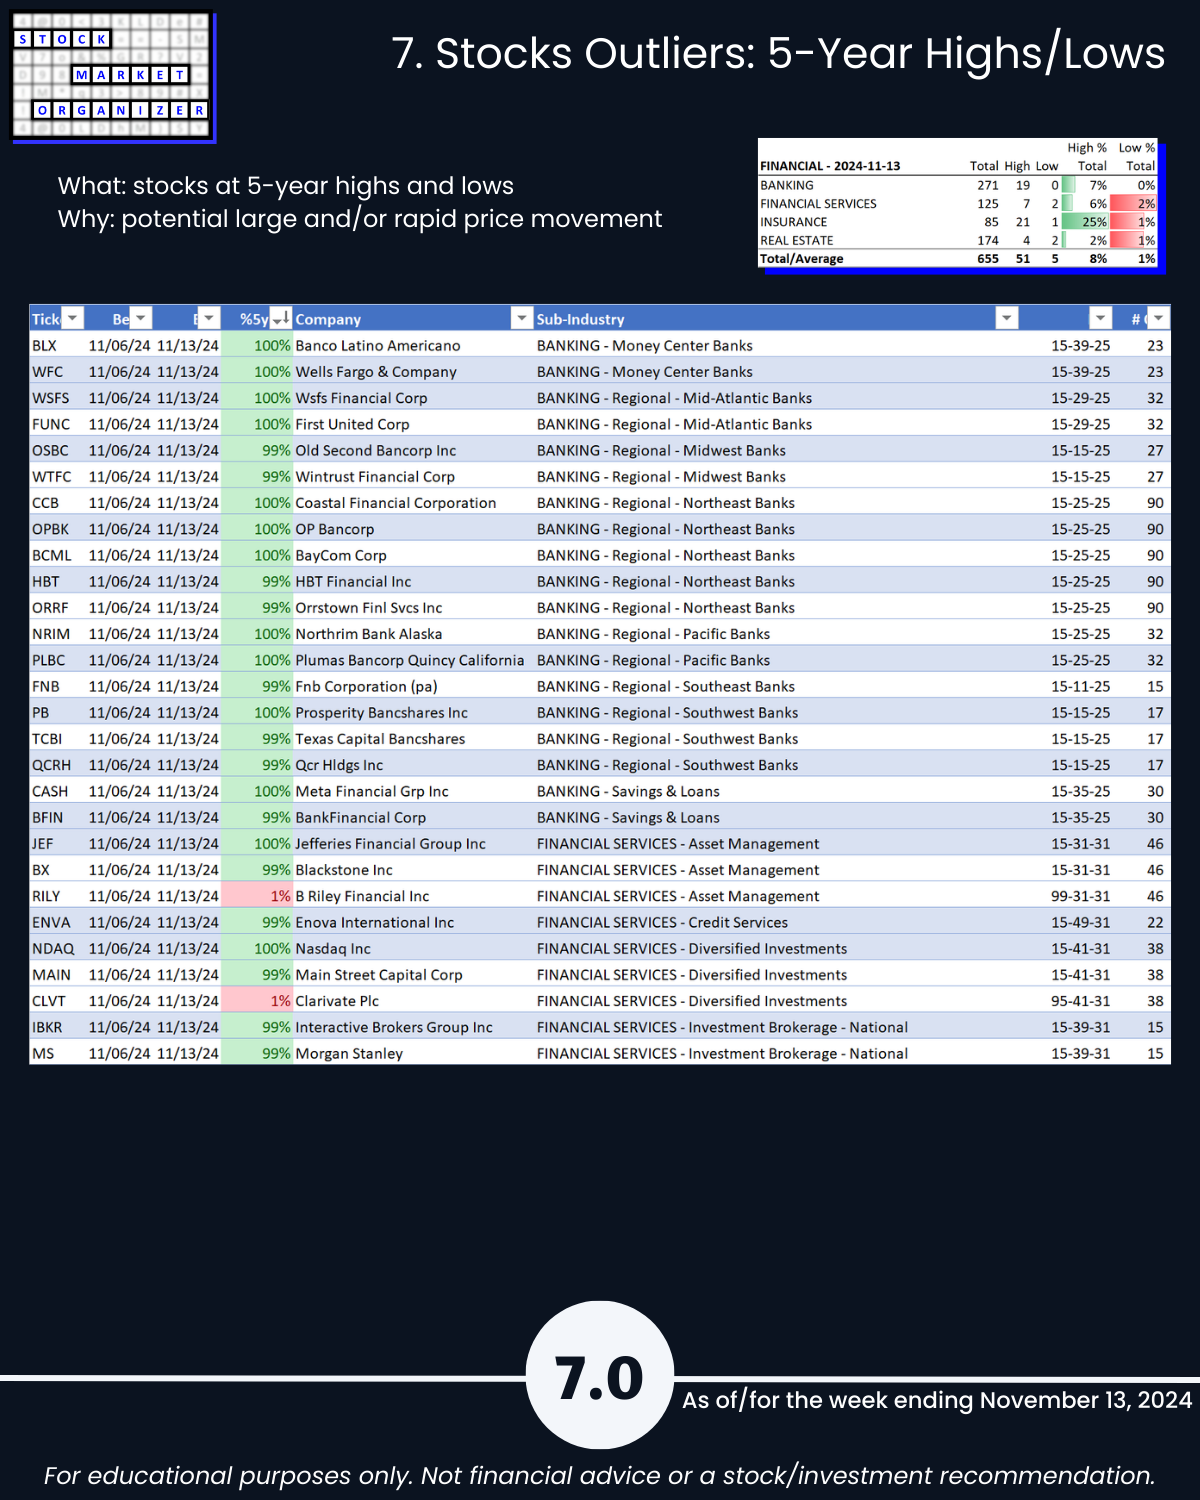
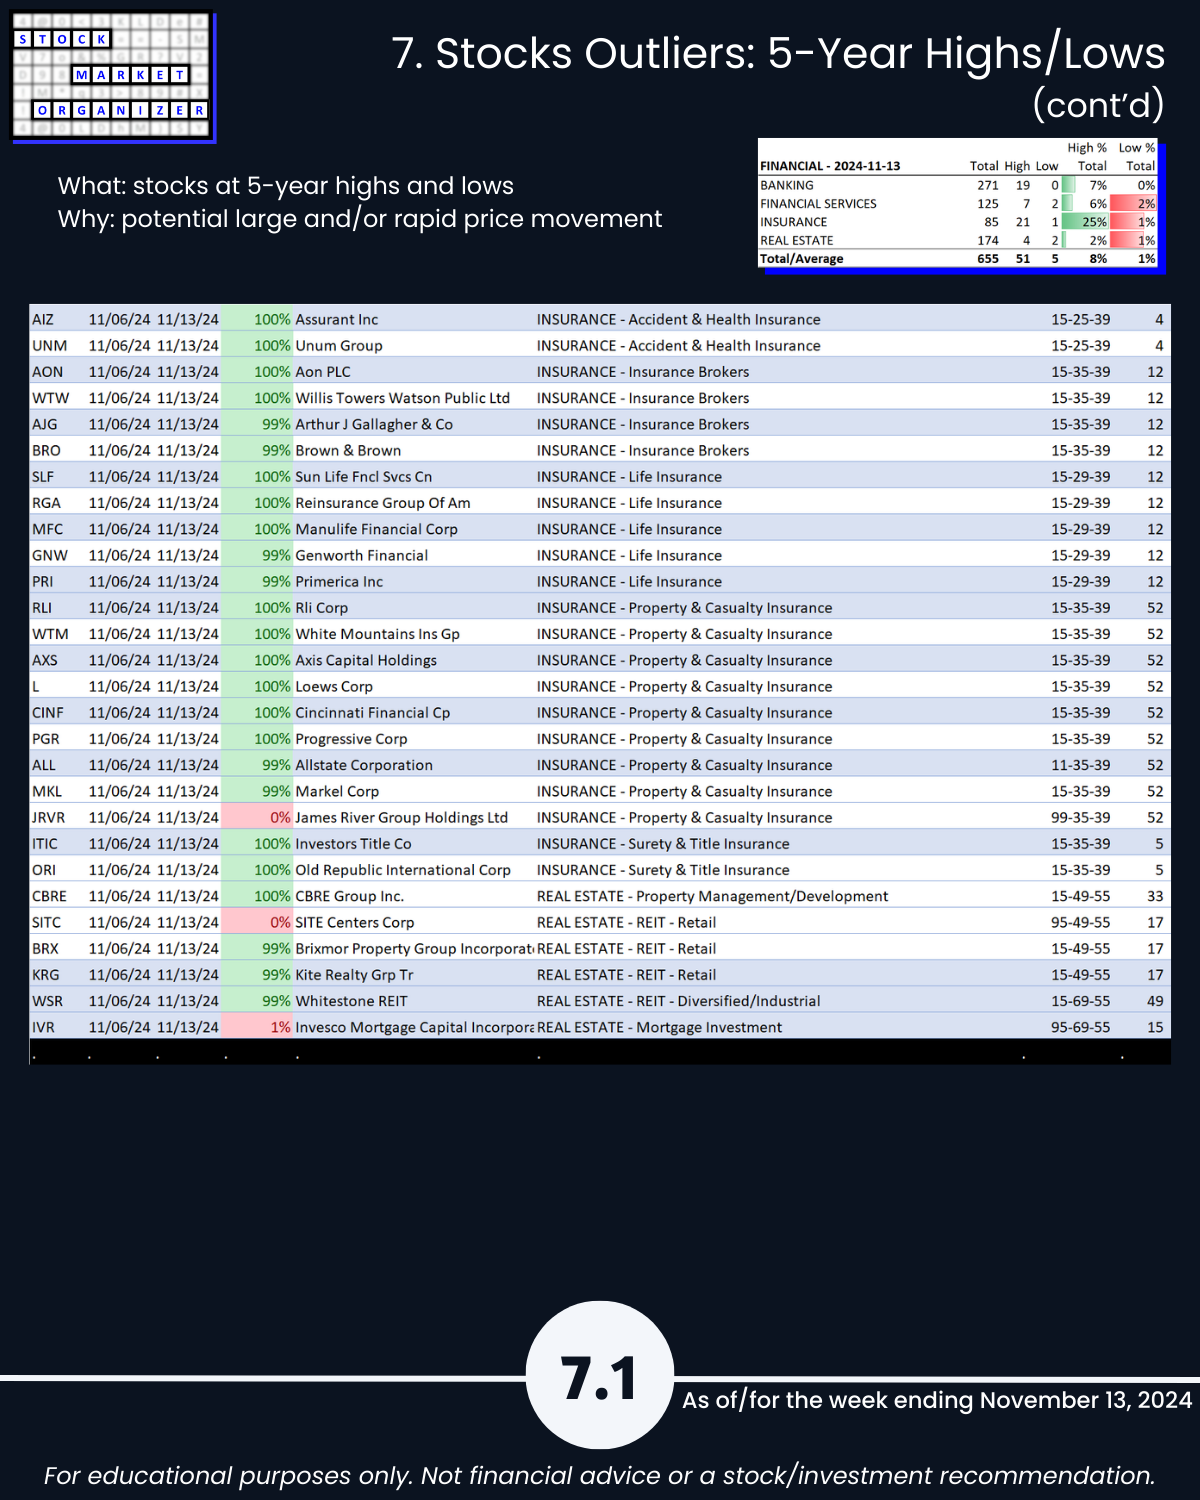
This section shows the strongest of the strong and the weakest of the weak, hitting 5-year highs and lows, respectively. The strongest are the leaders of the market that is hitting new highs. Meanwhile, there appears to be no rational reason to hold weak stocks that are at multi-year lows despite massive market tailwinds.