SMO Exclusive: Strength Report Financial Sector 2024-11-06 Strengthened +0.1 to 3.3 Strength Score
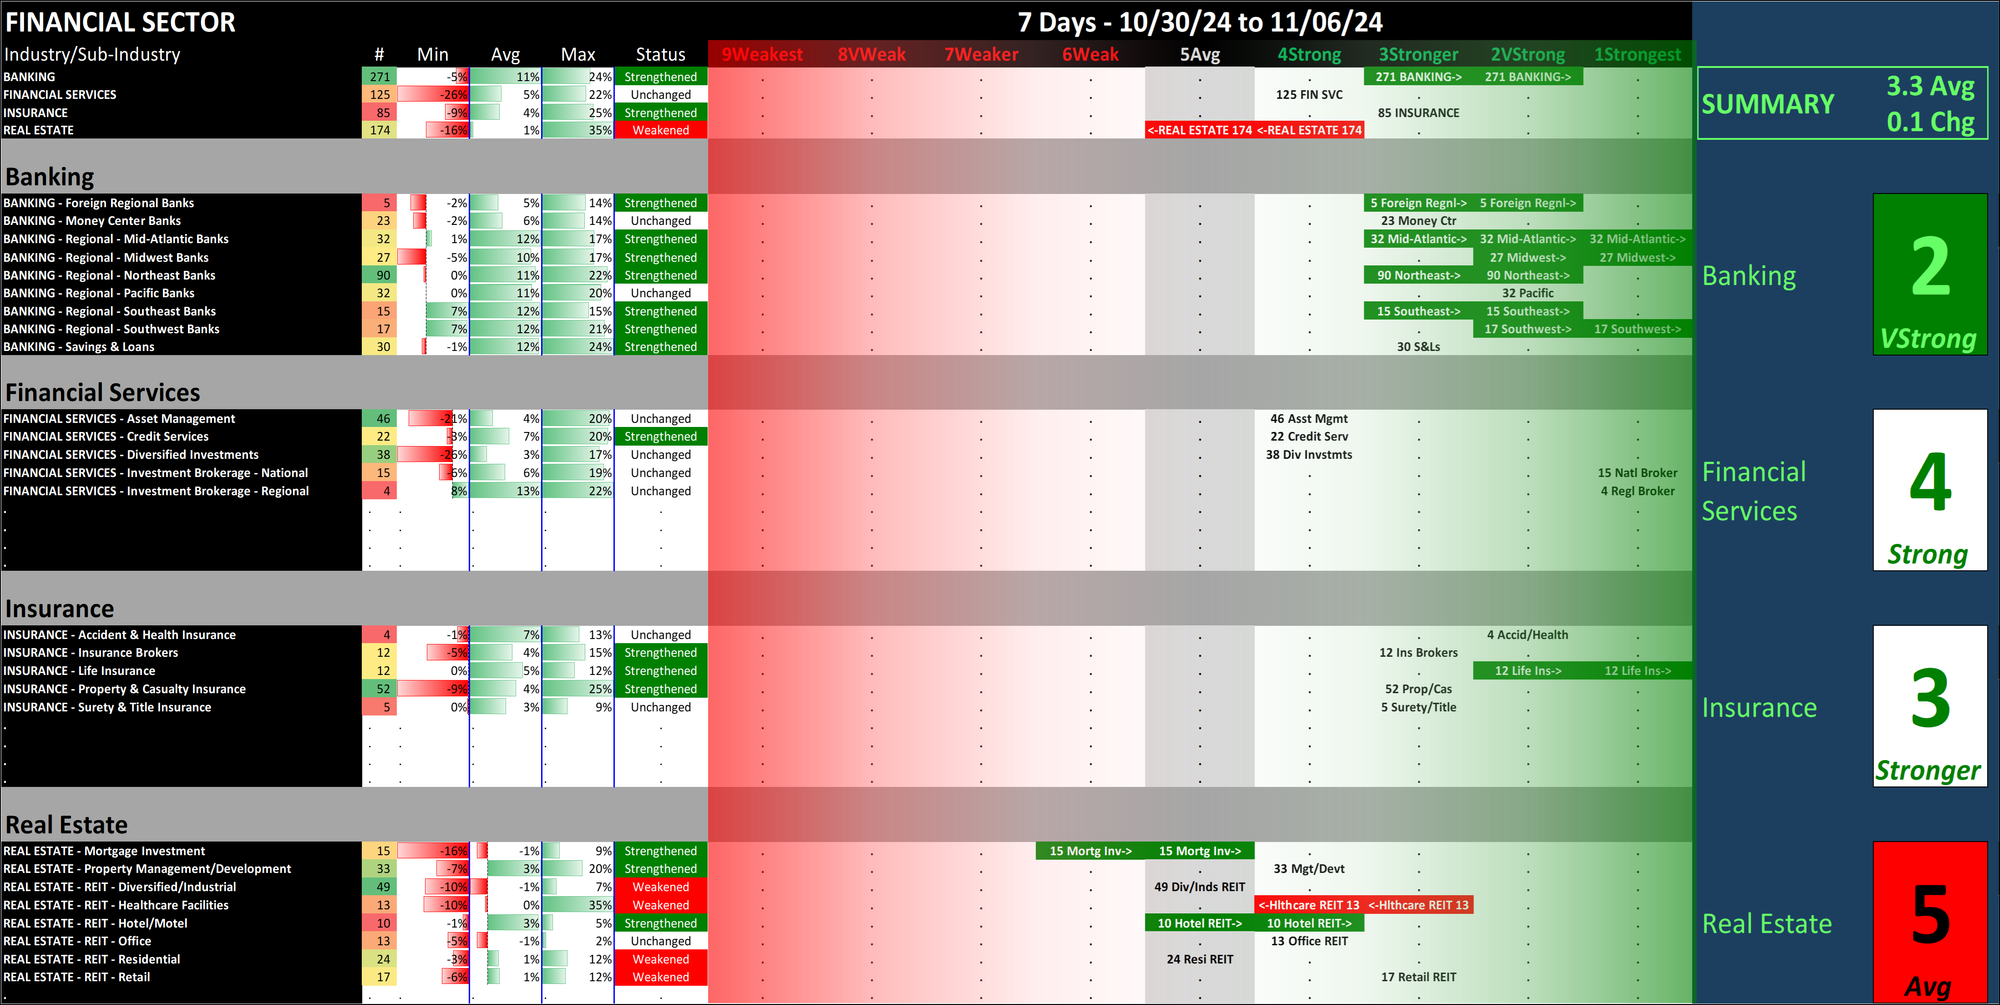
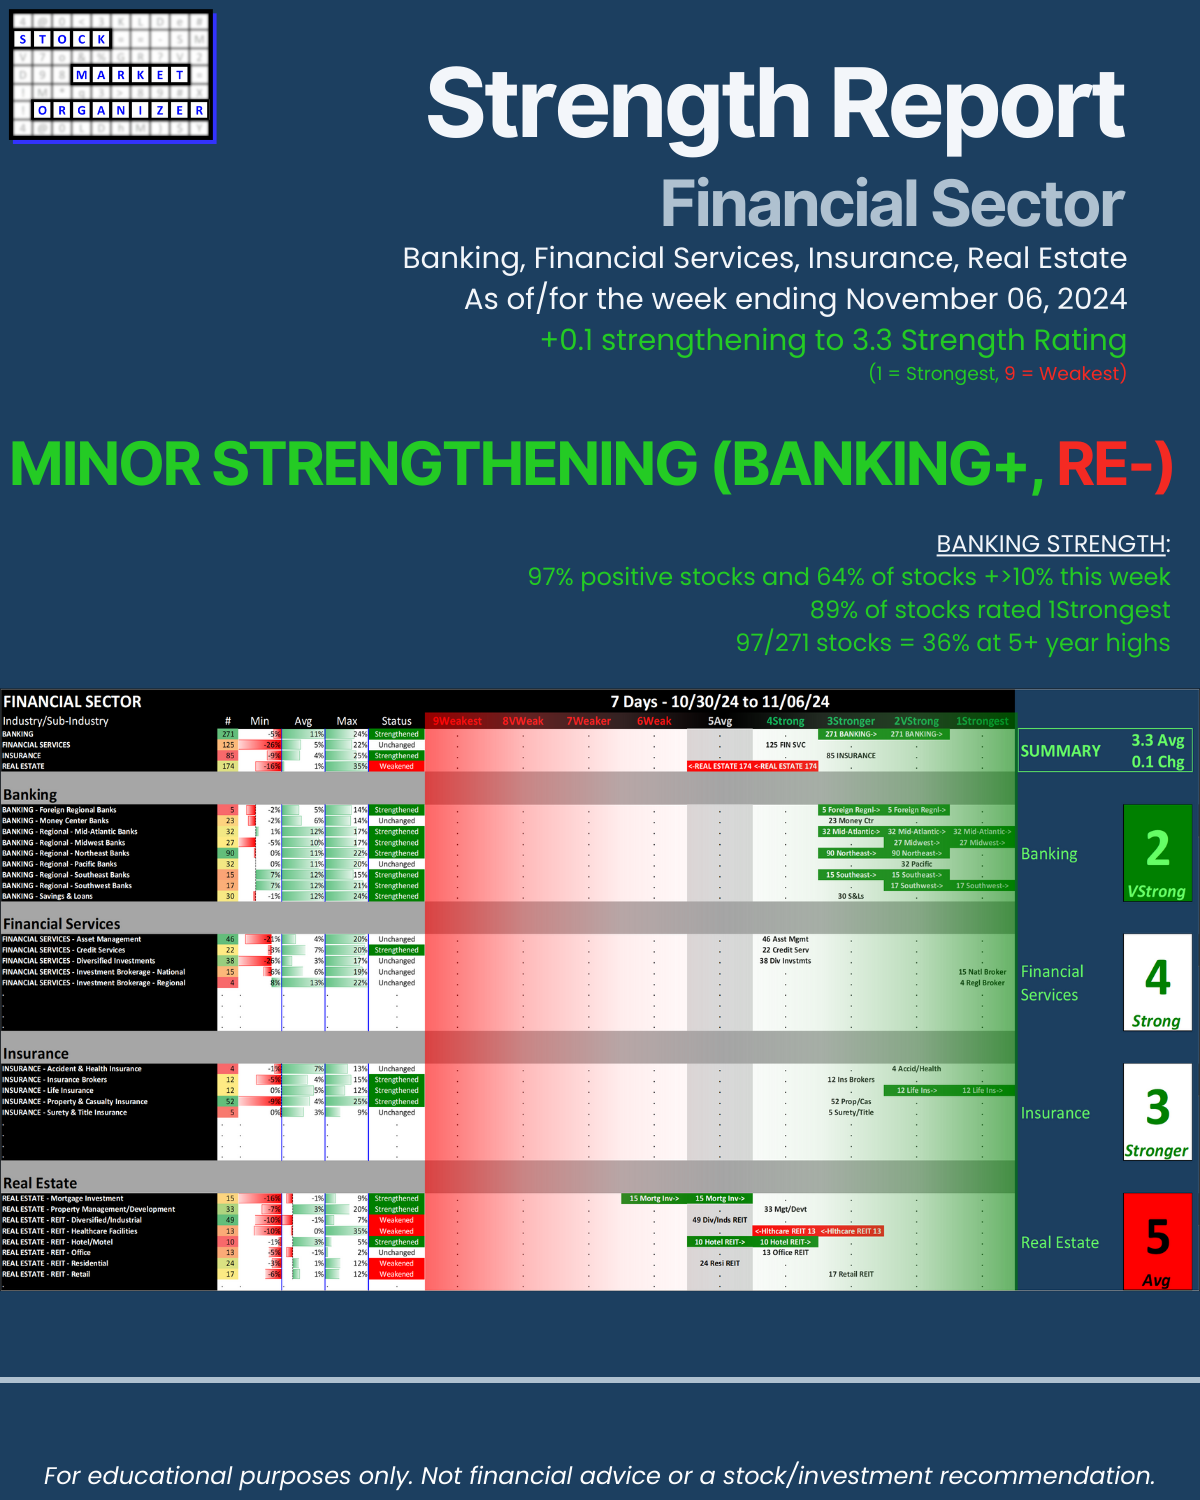
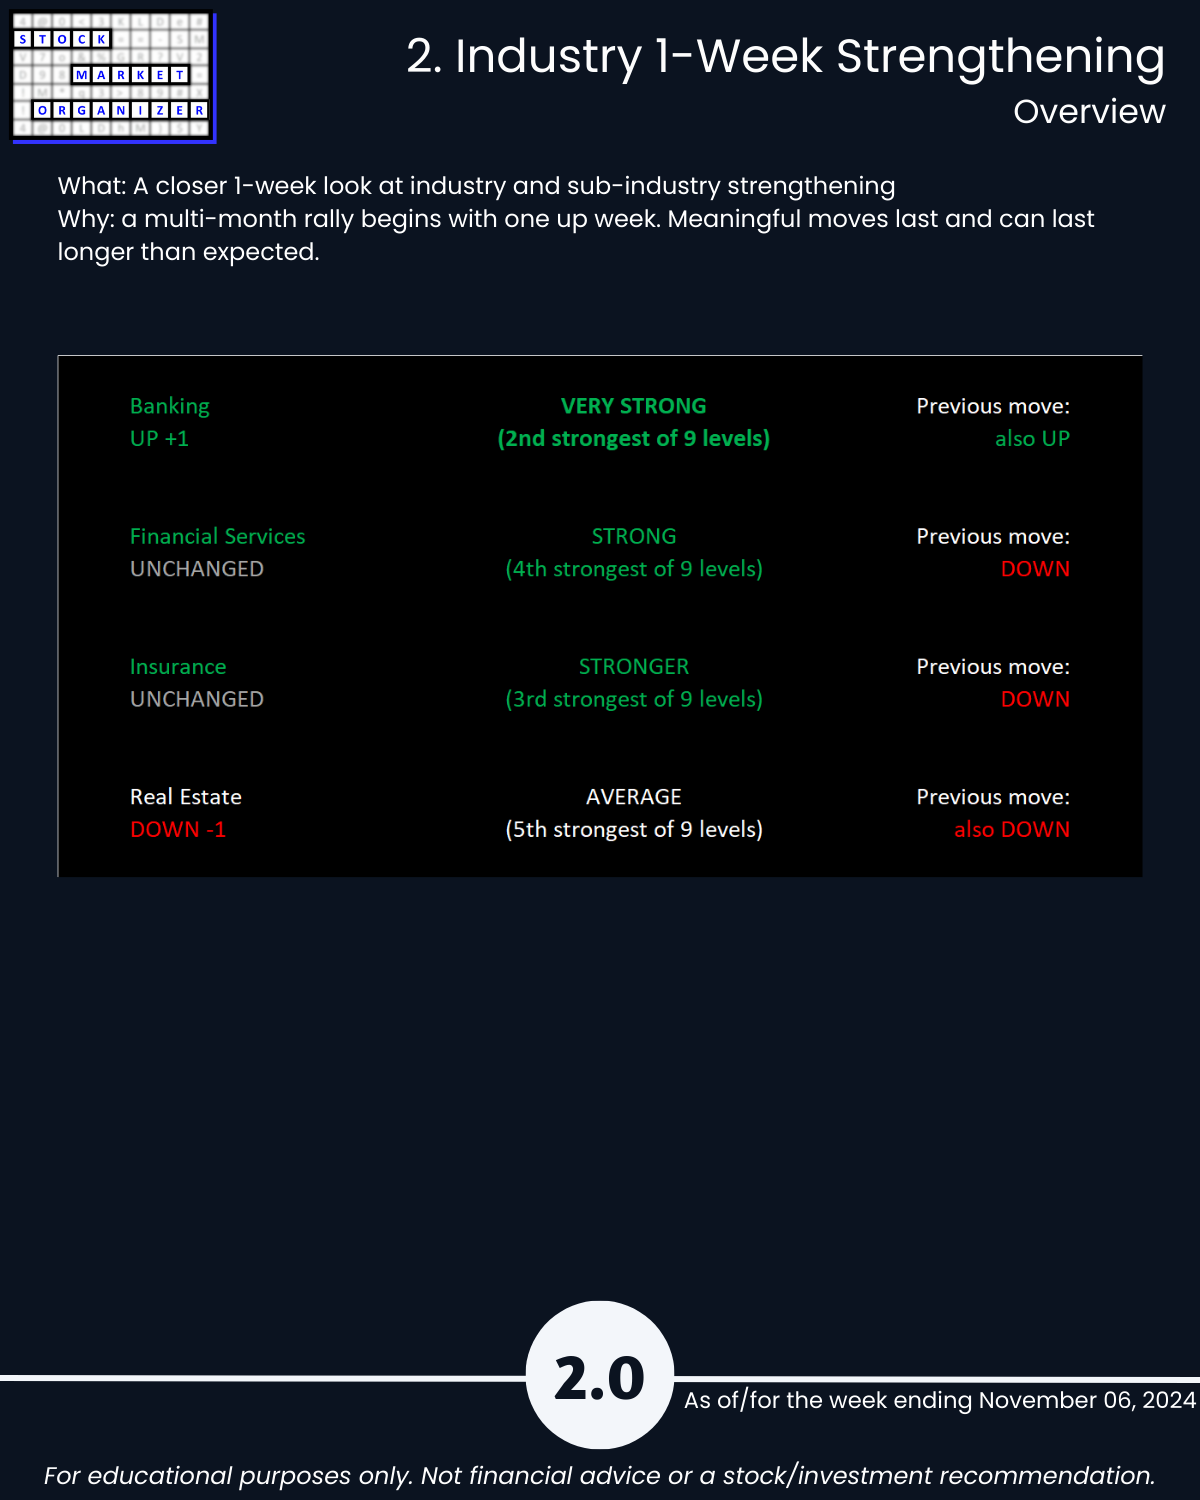
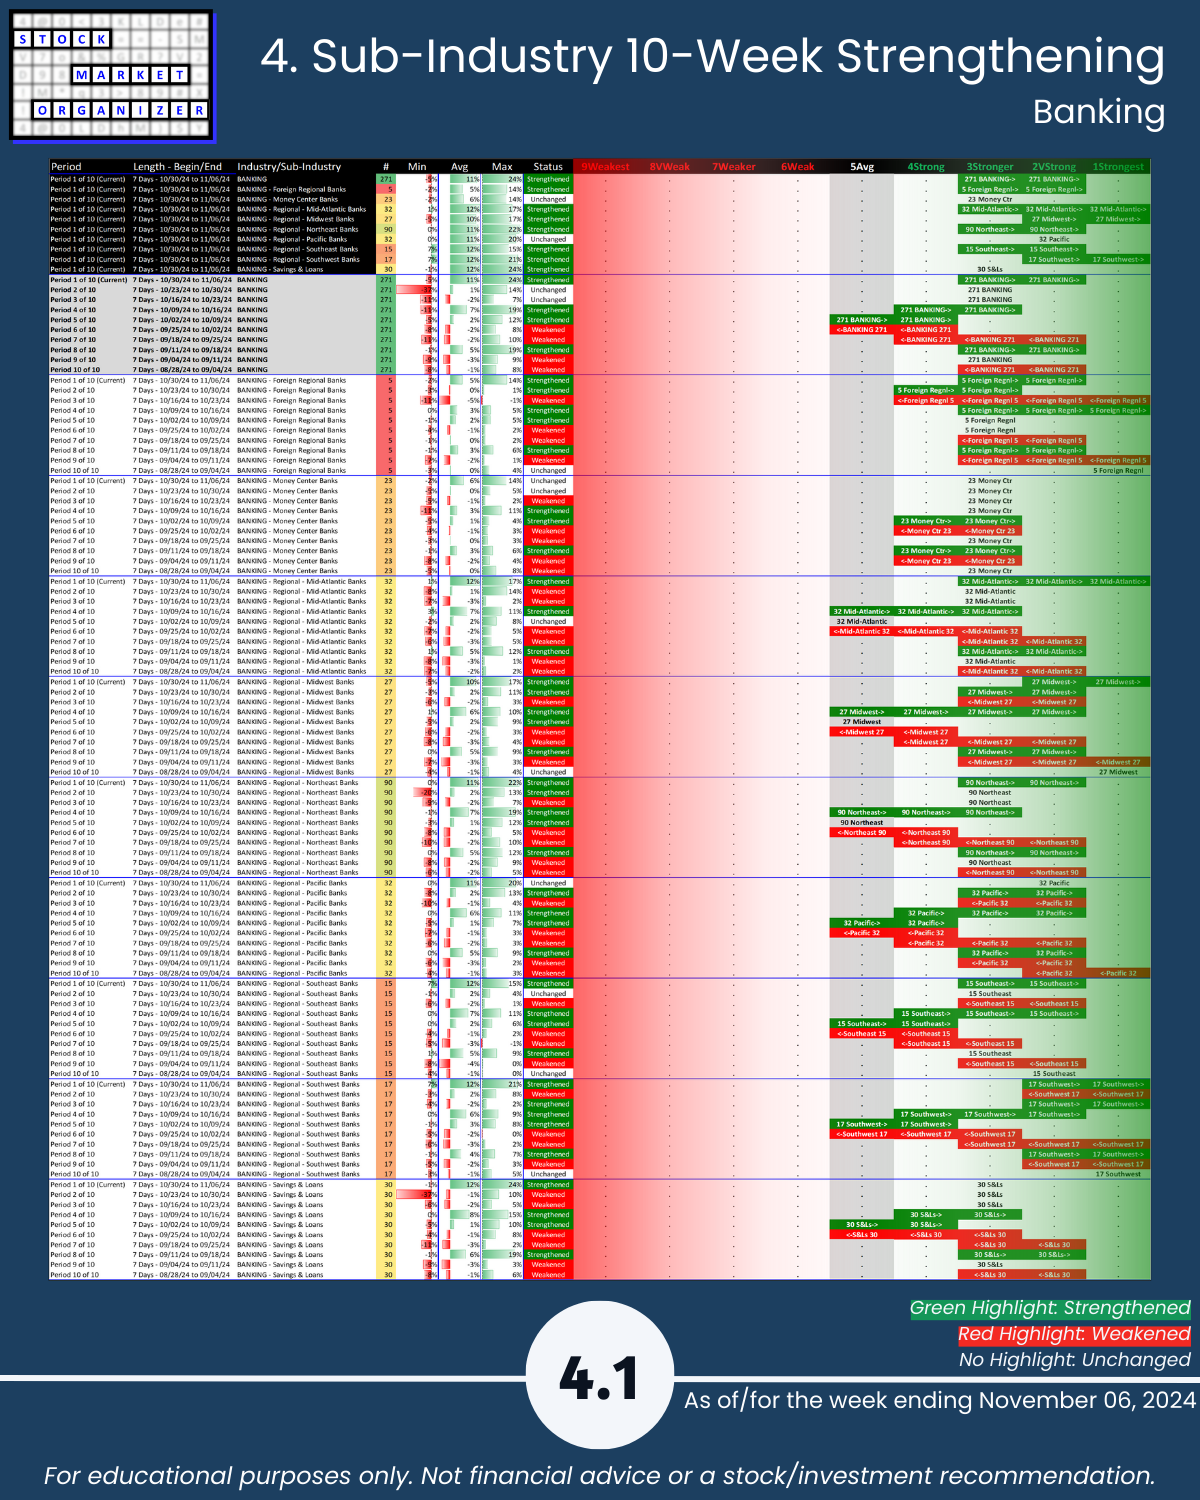
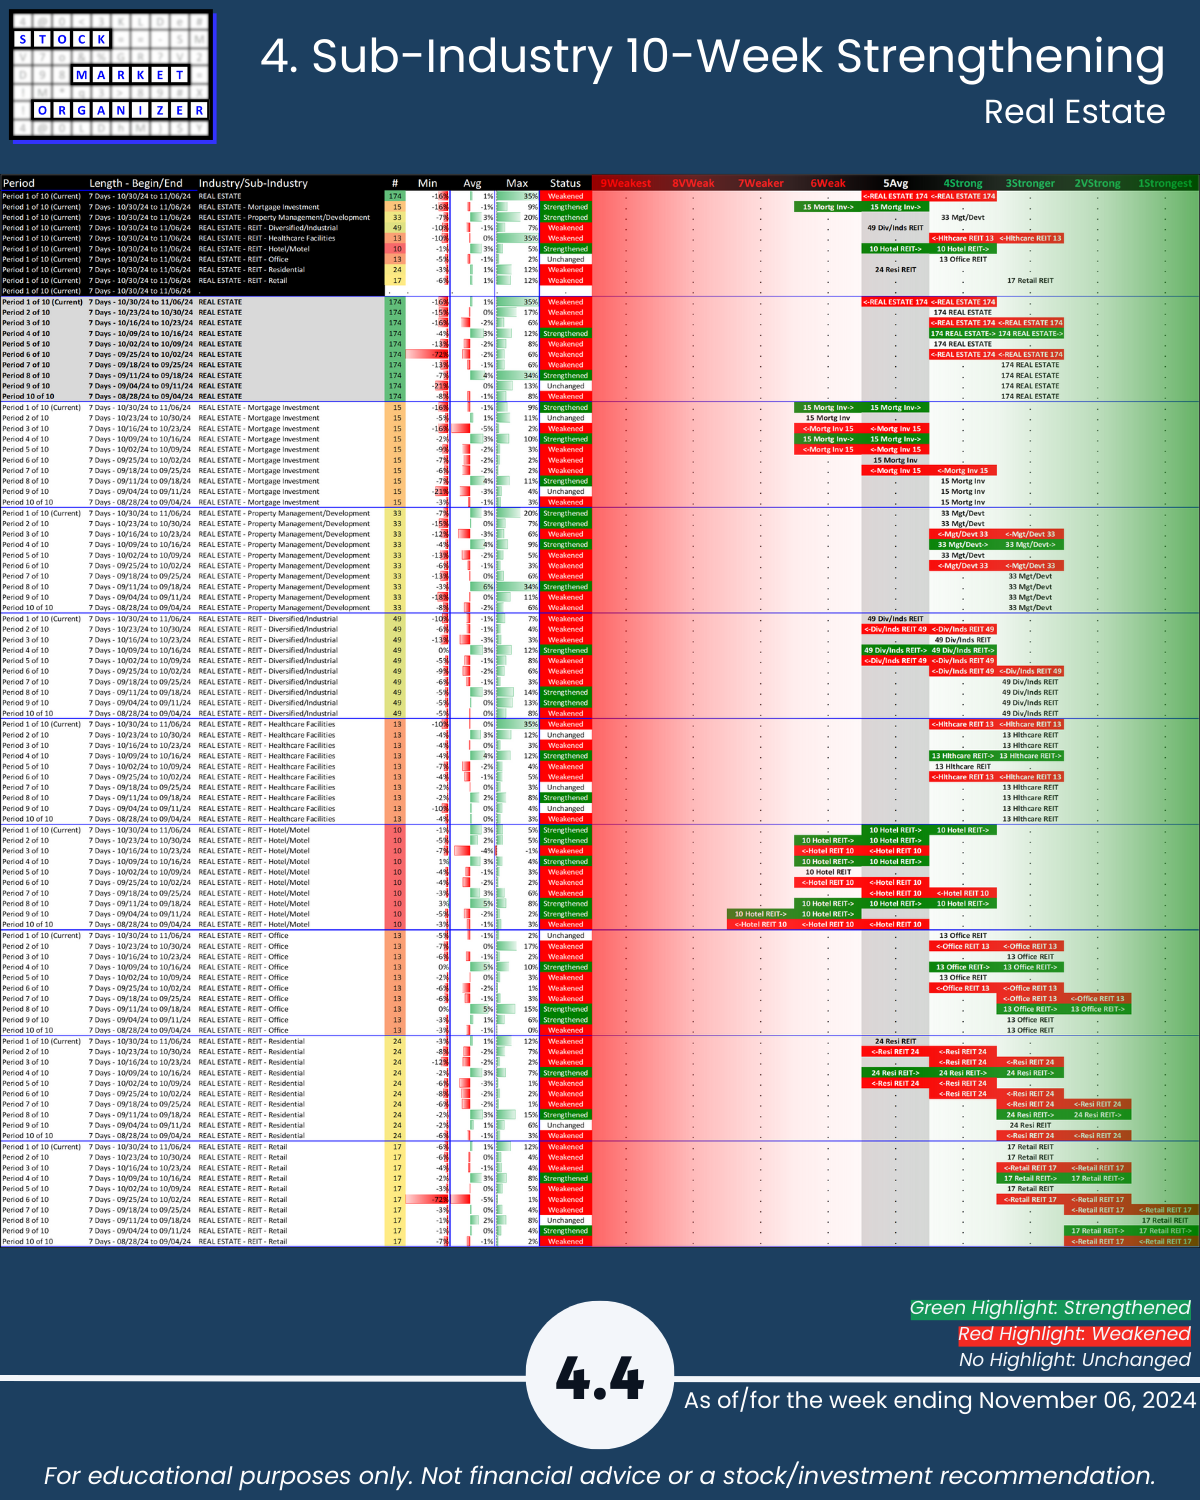
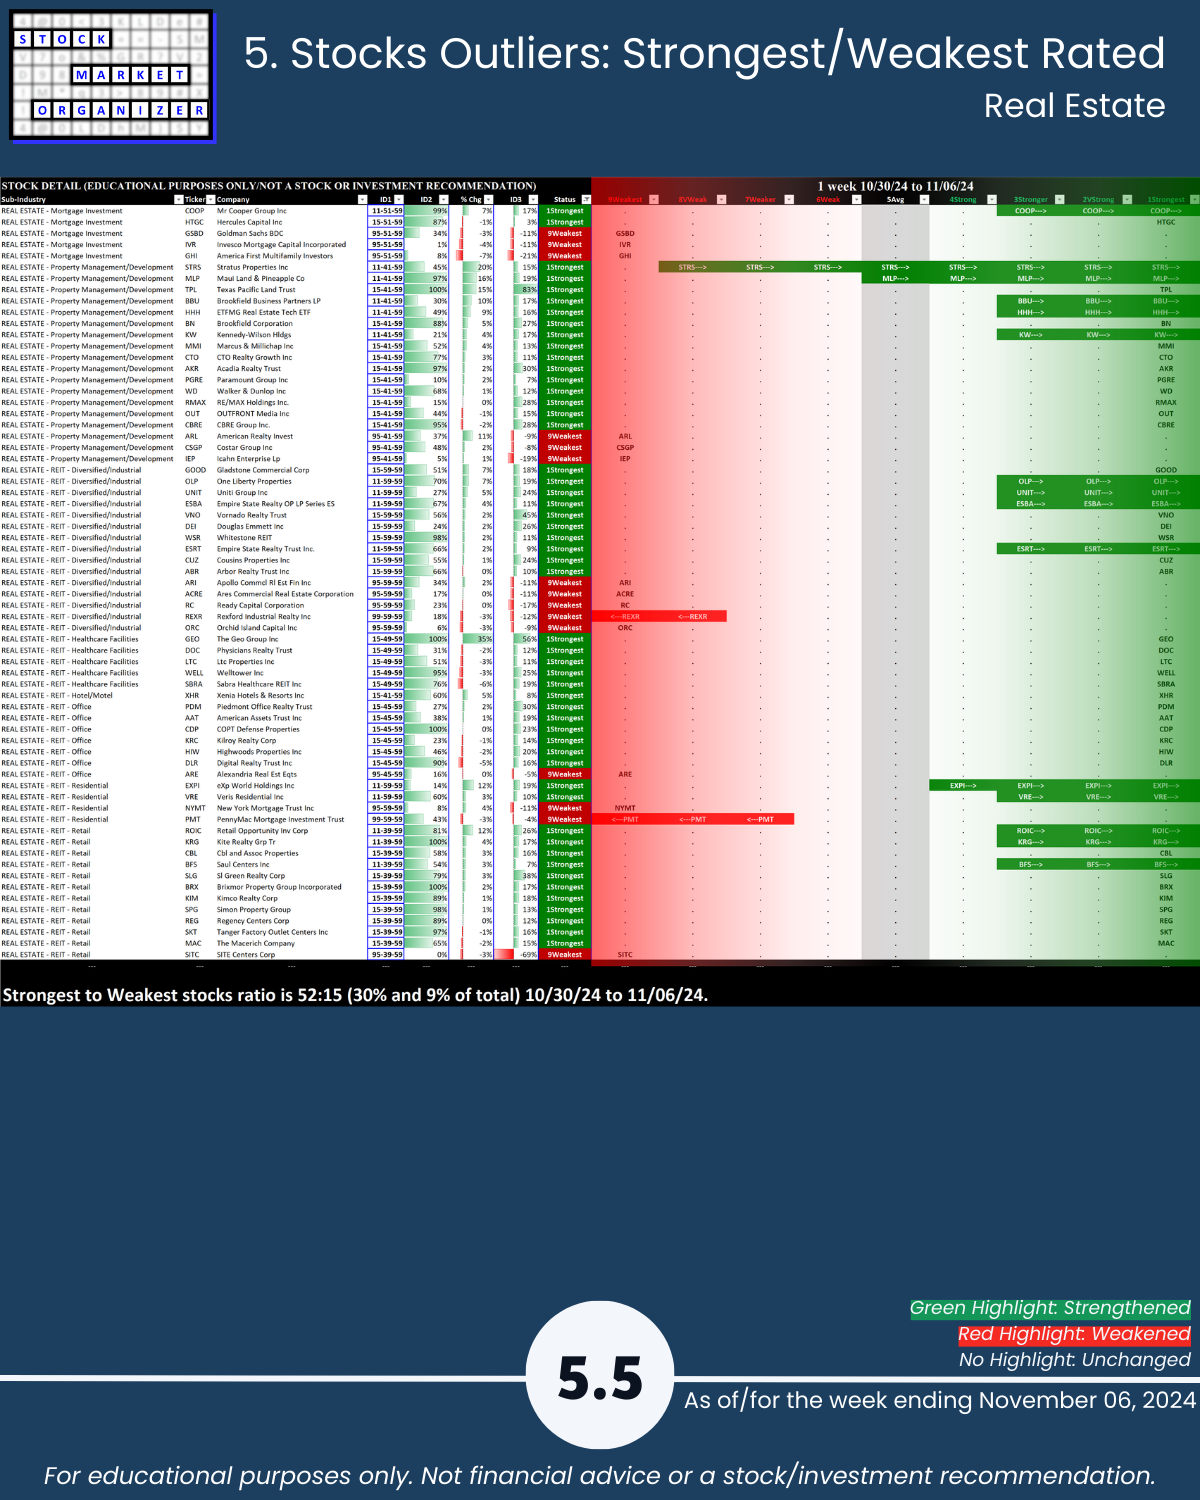
Financial Sector STRENGTHENED with a 3.3 composite score this week, +0.1 with a divergence between Banking which STRENGTHENED one level to 2VeryStrong as Real Estate WEAKENED one level to 5Average.
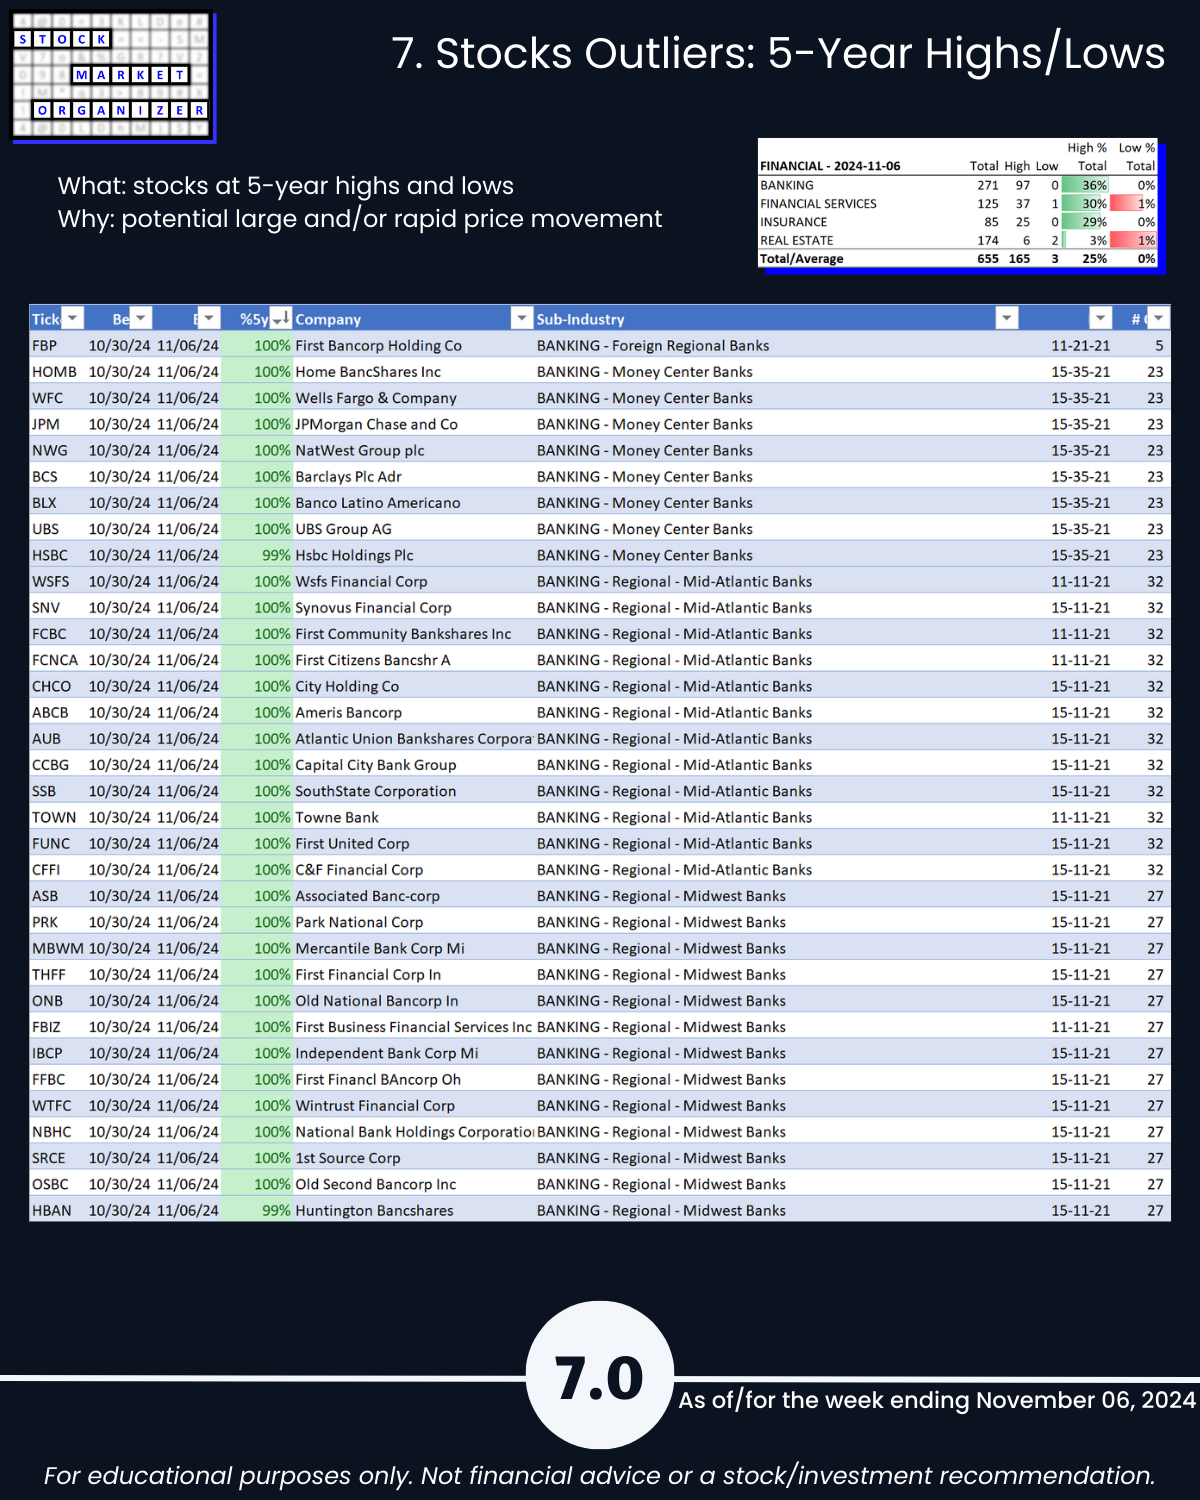
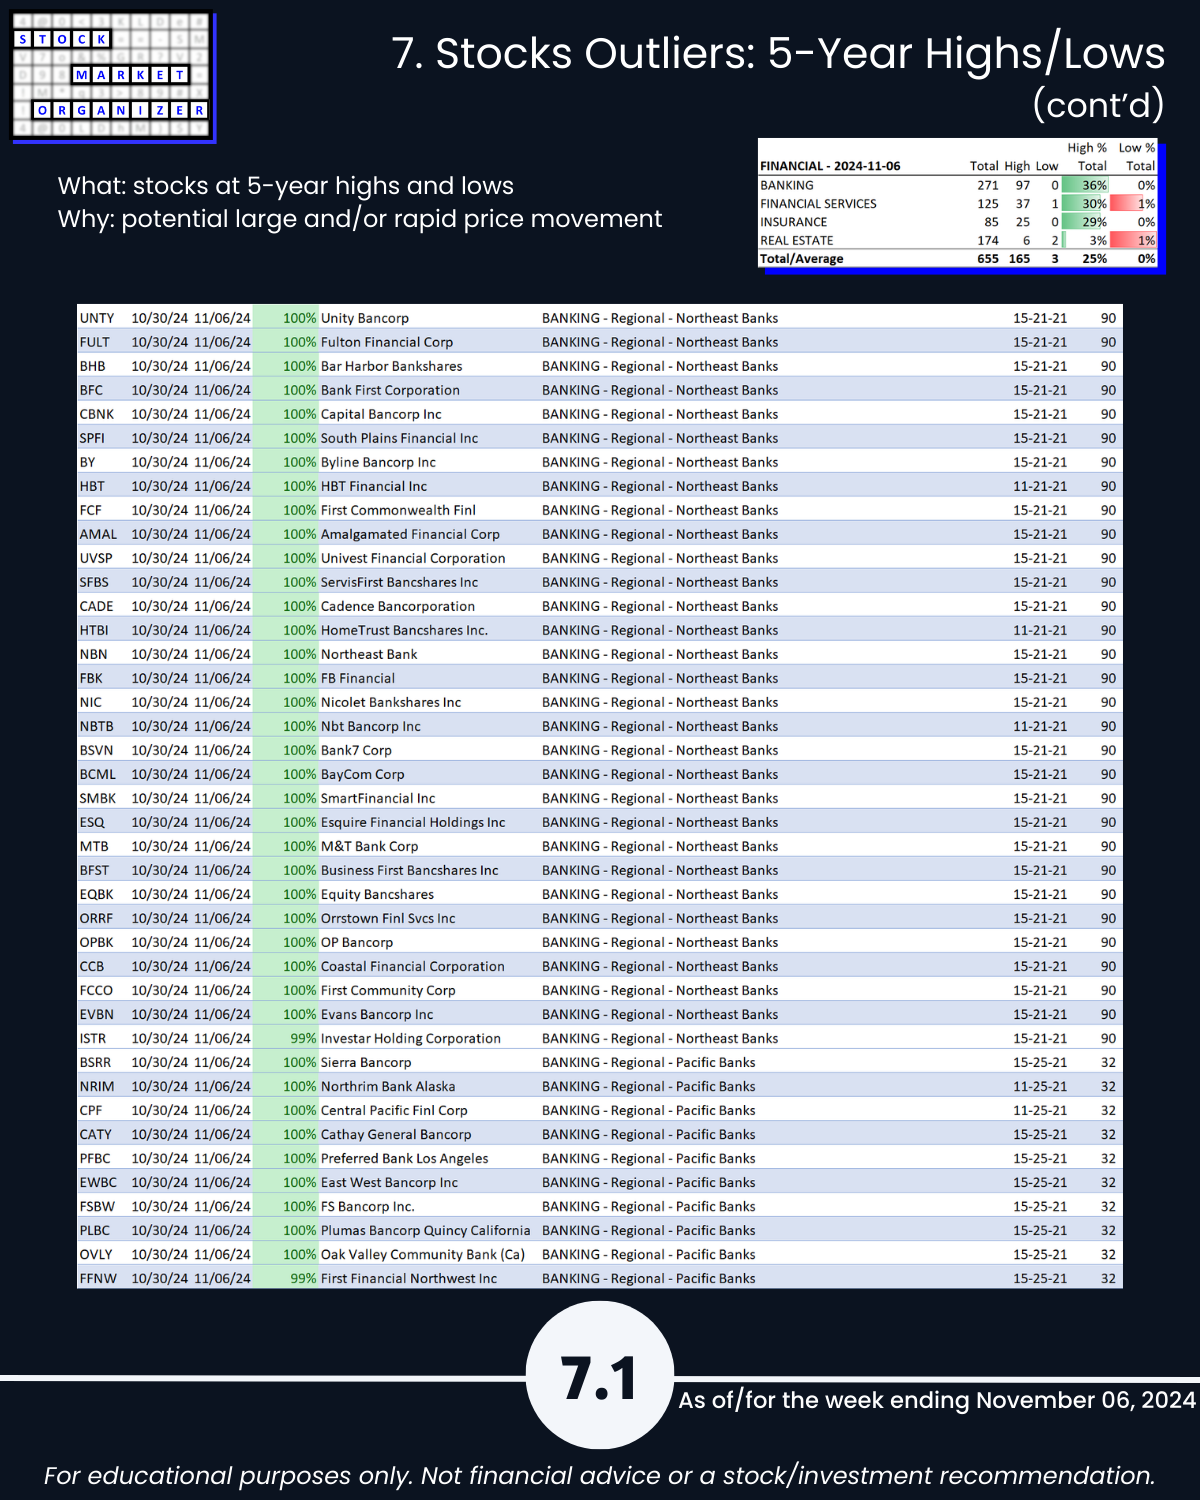
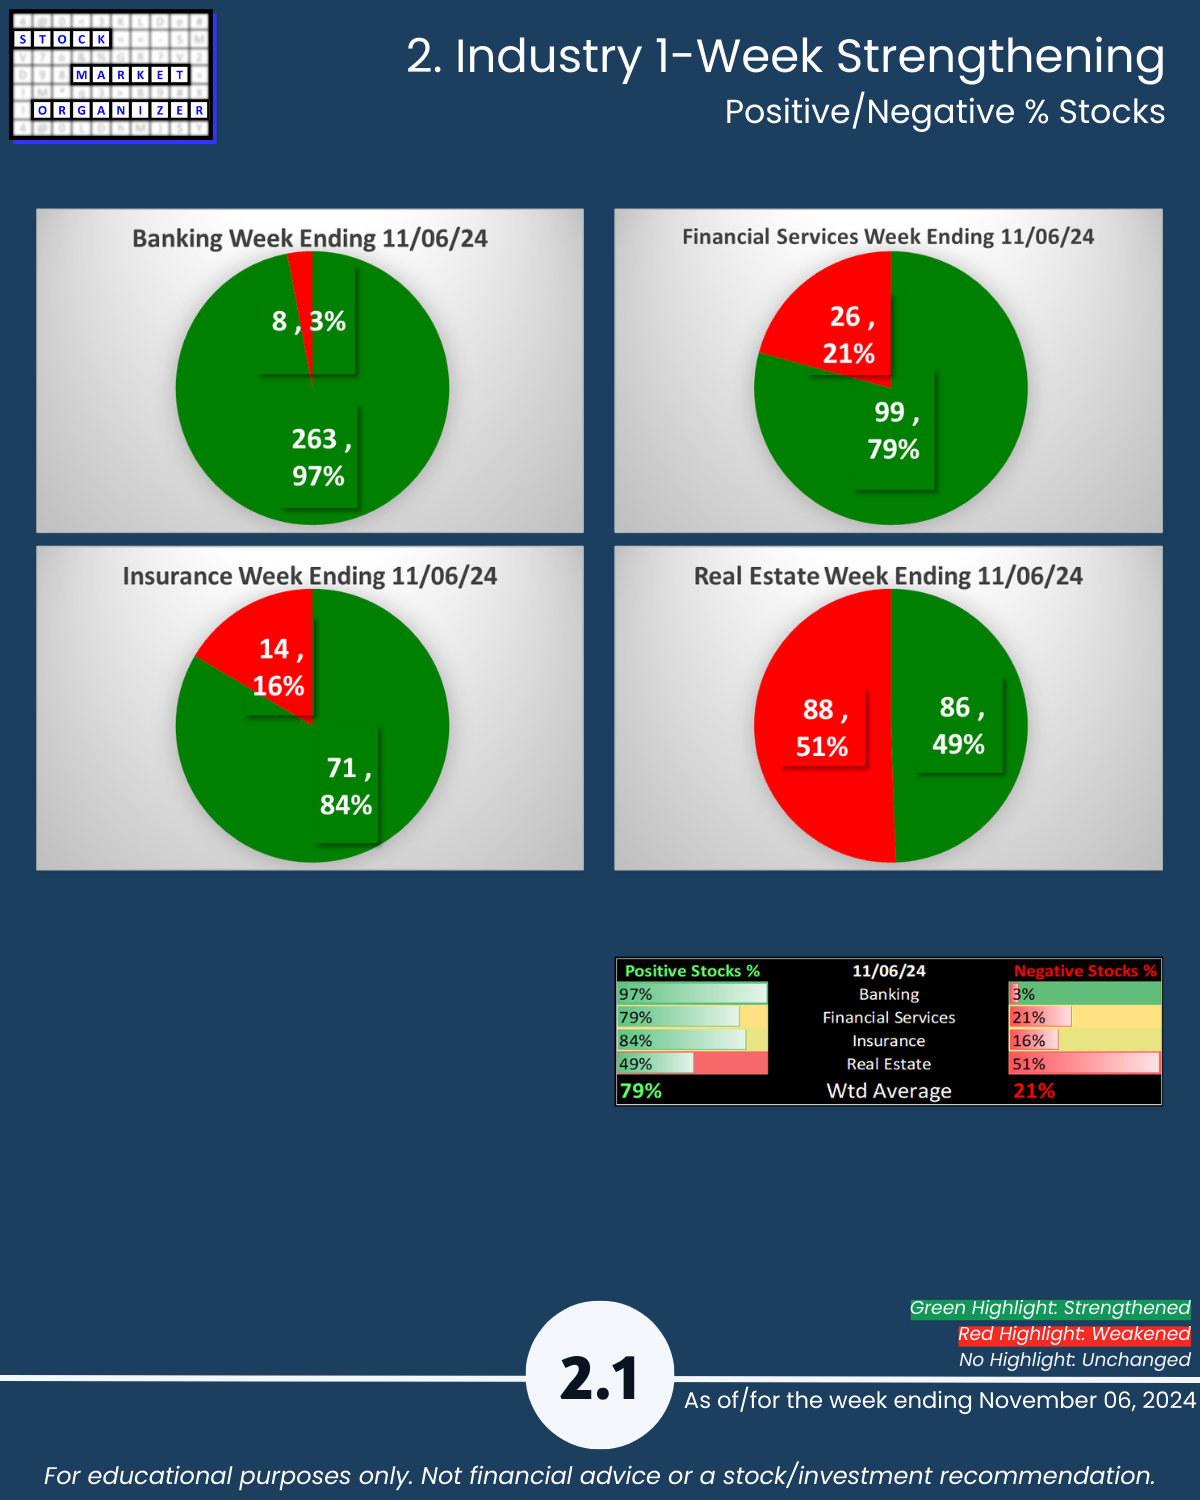
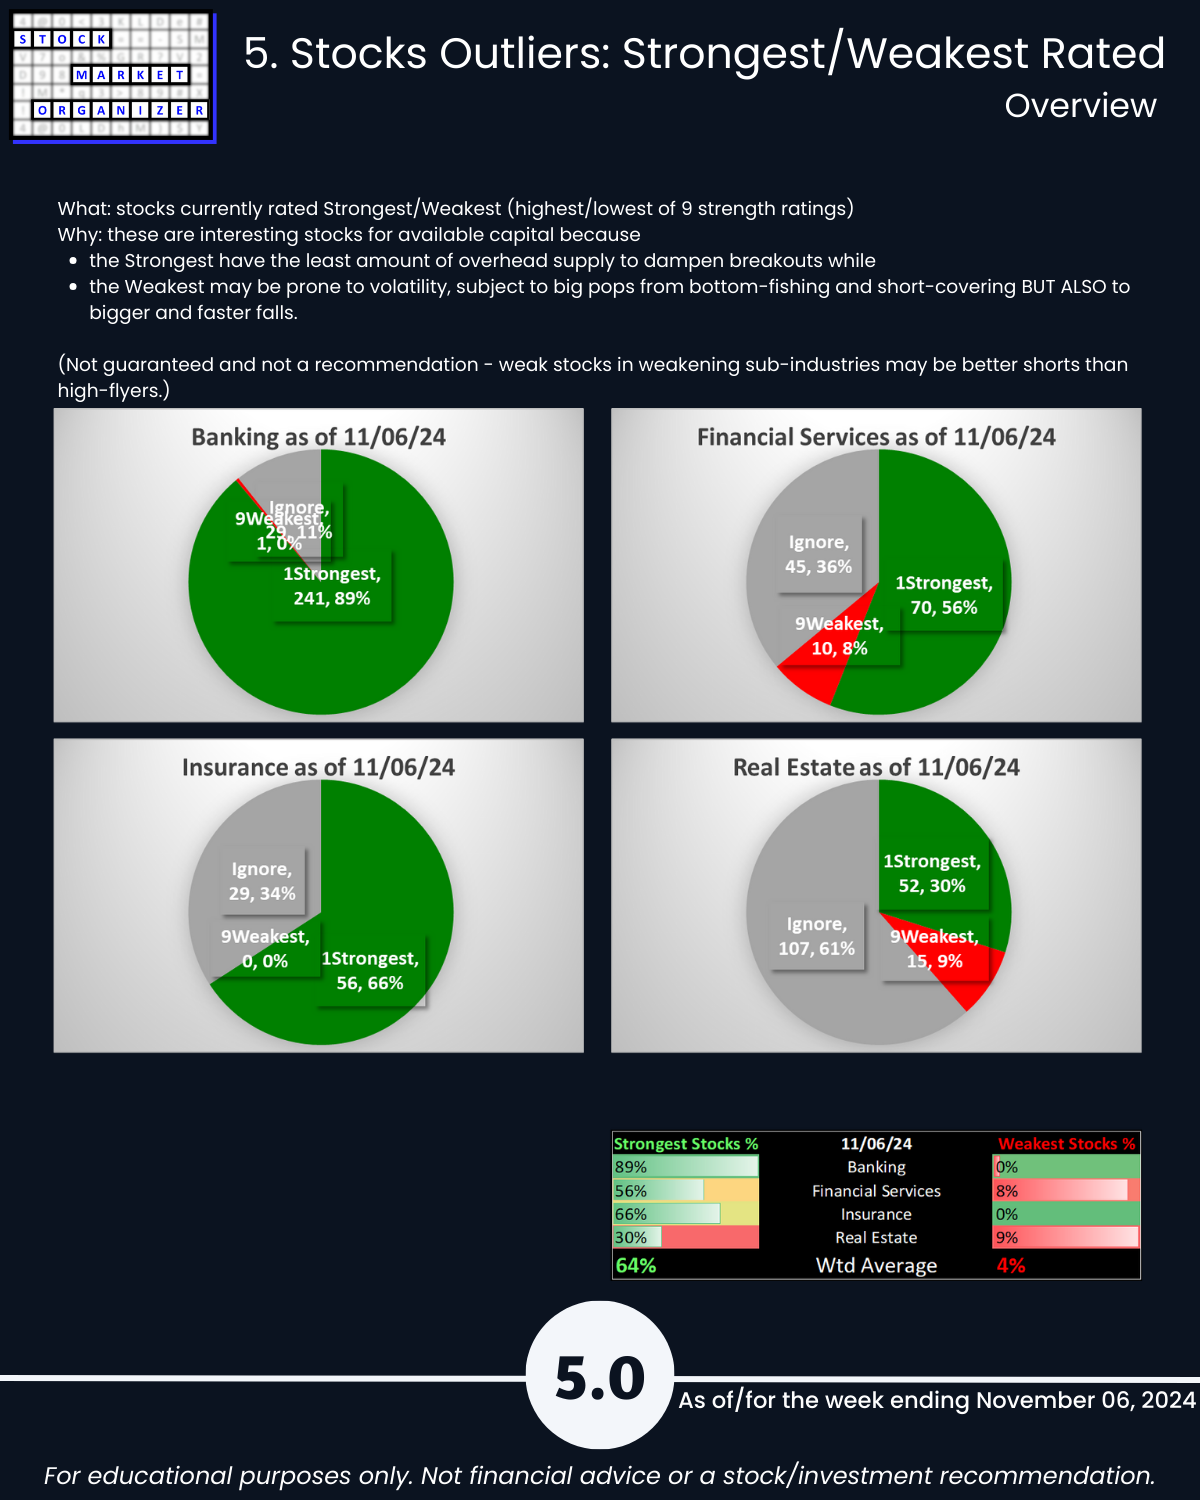
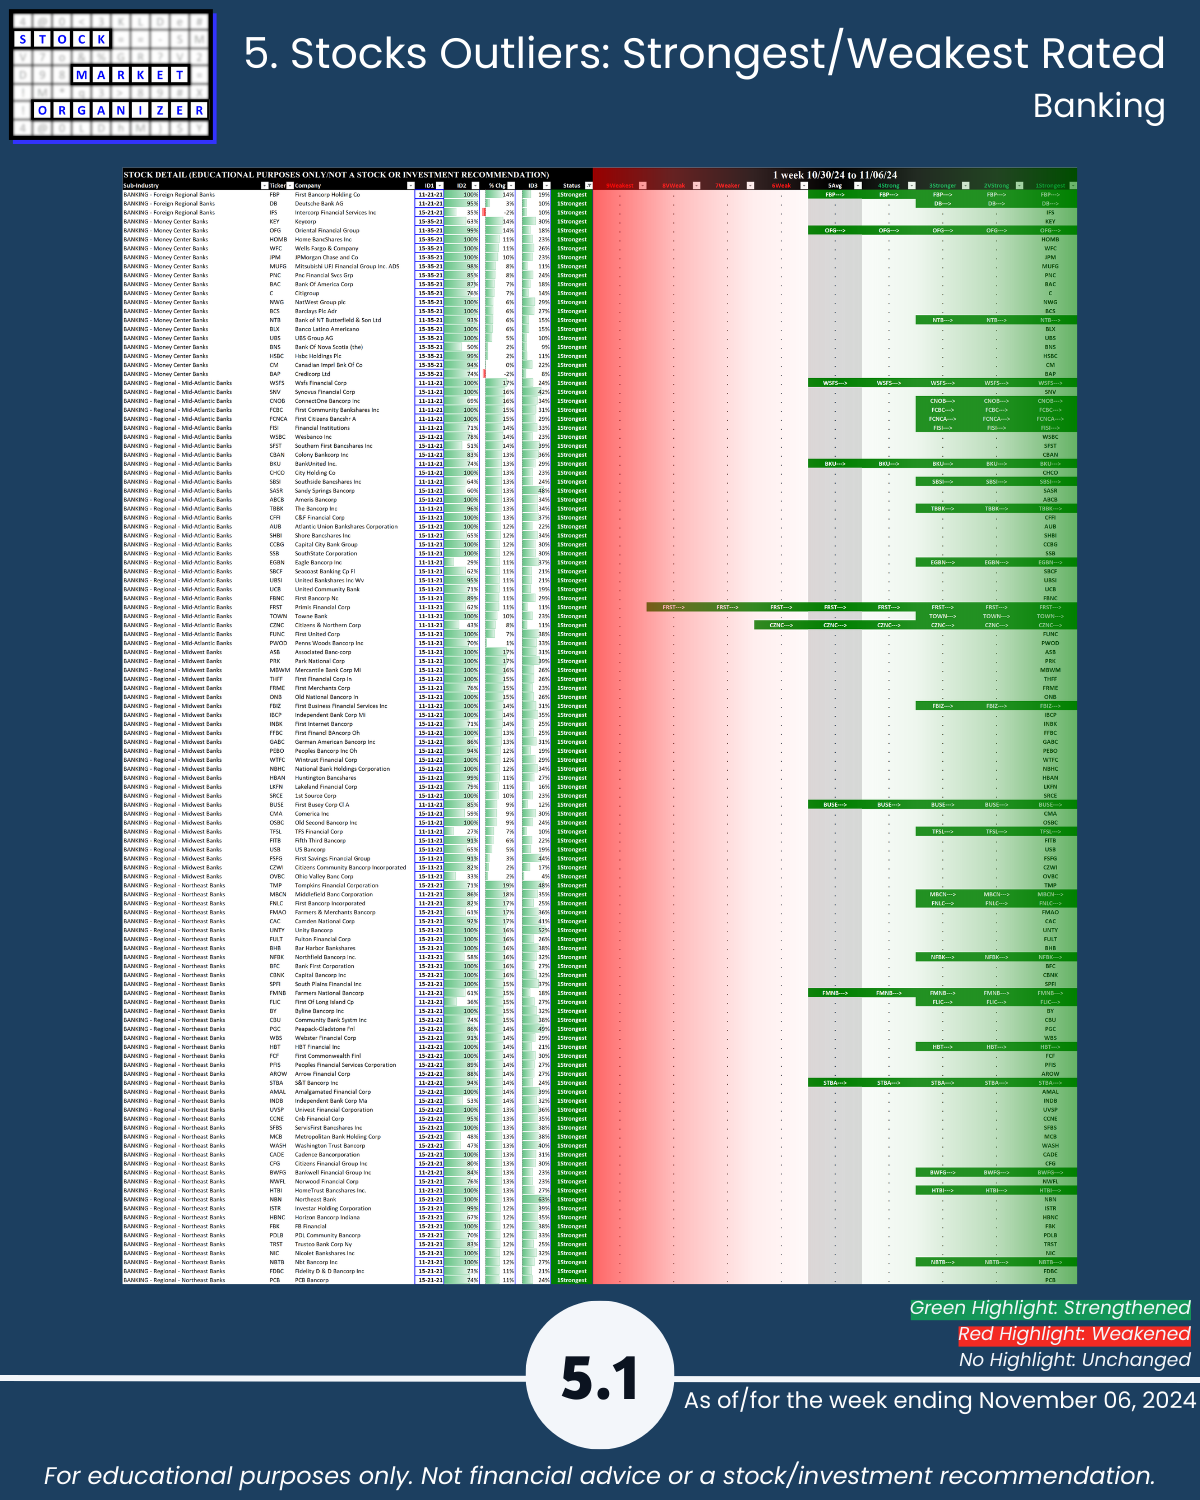
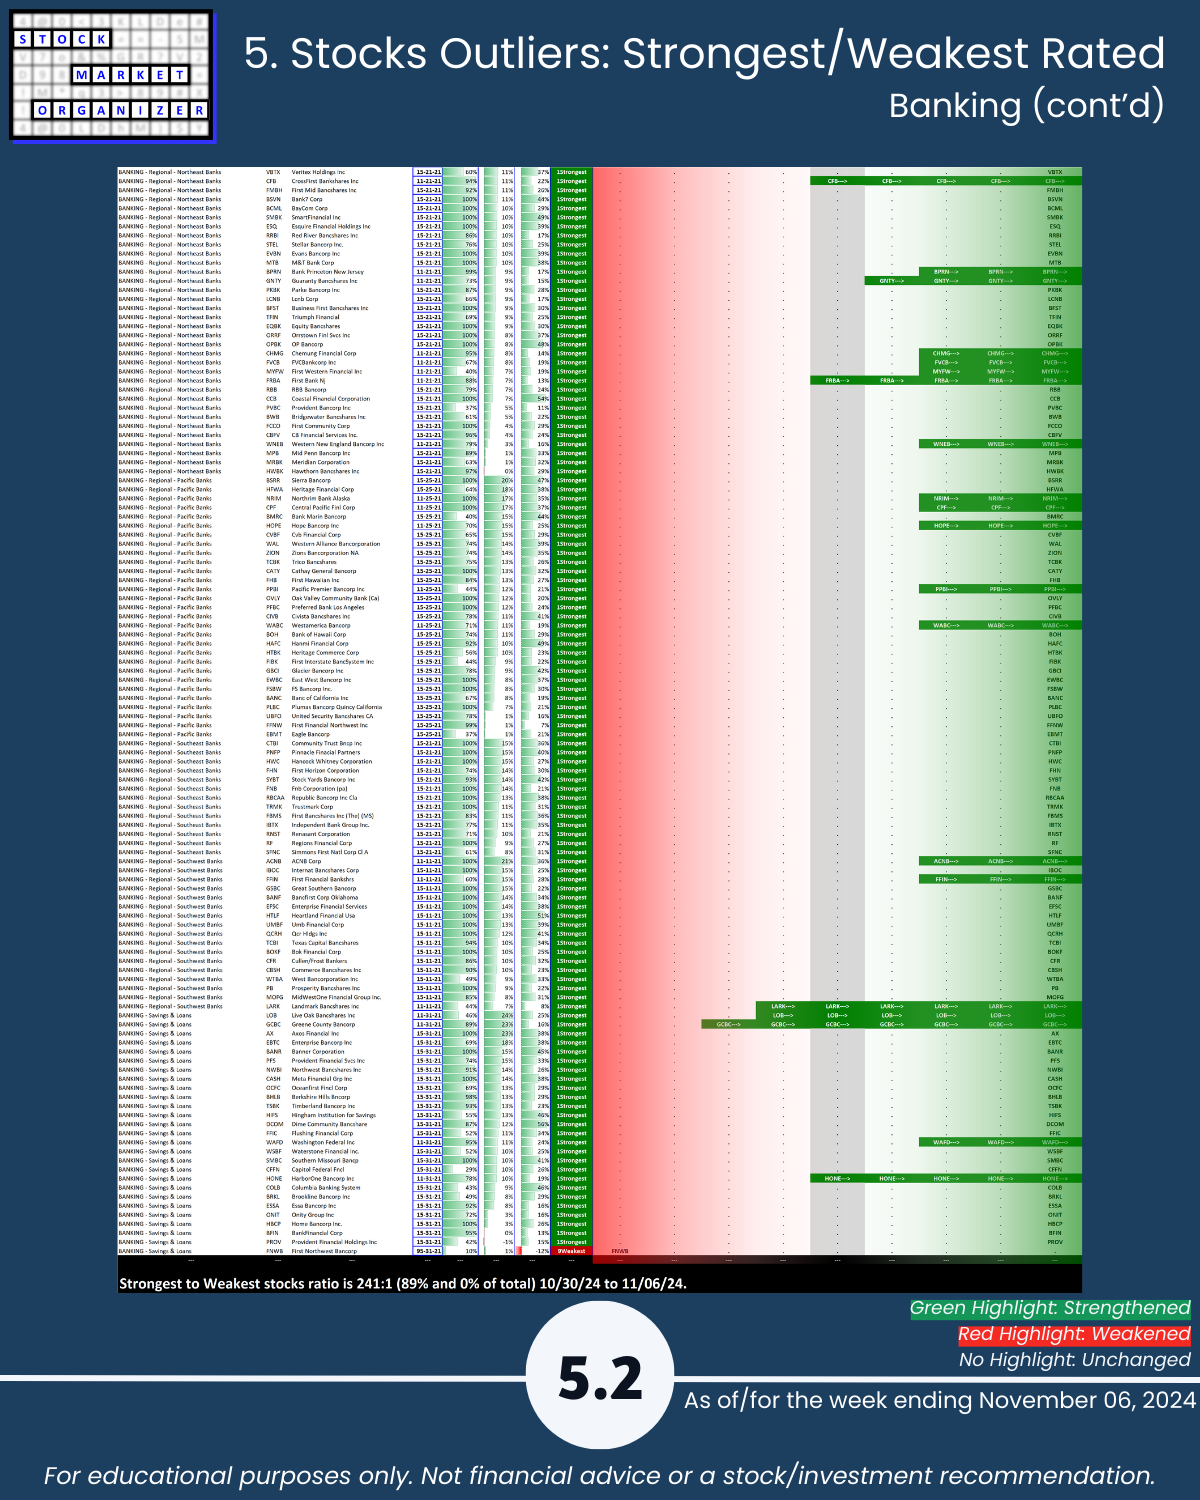
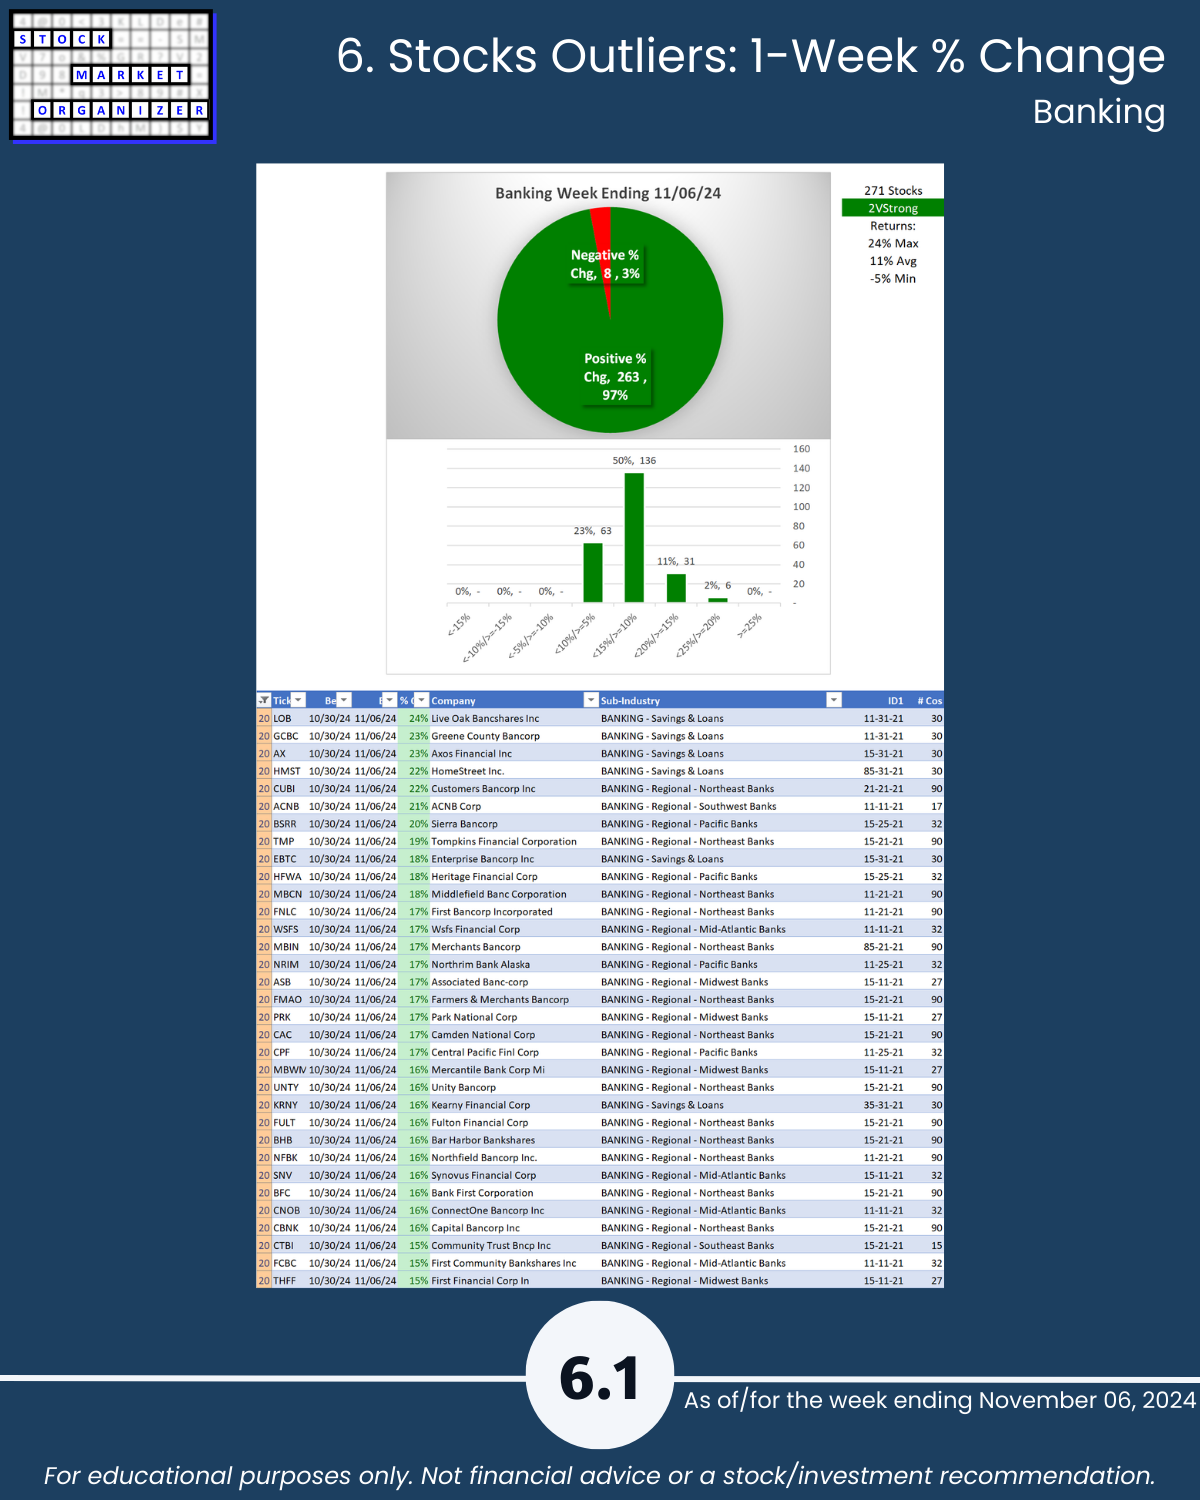
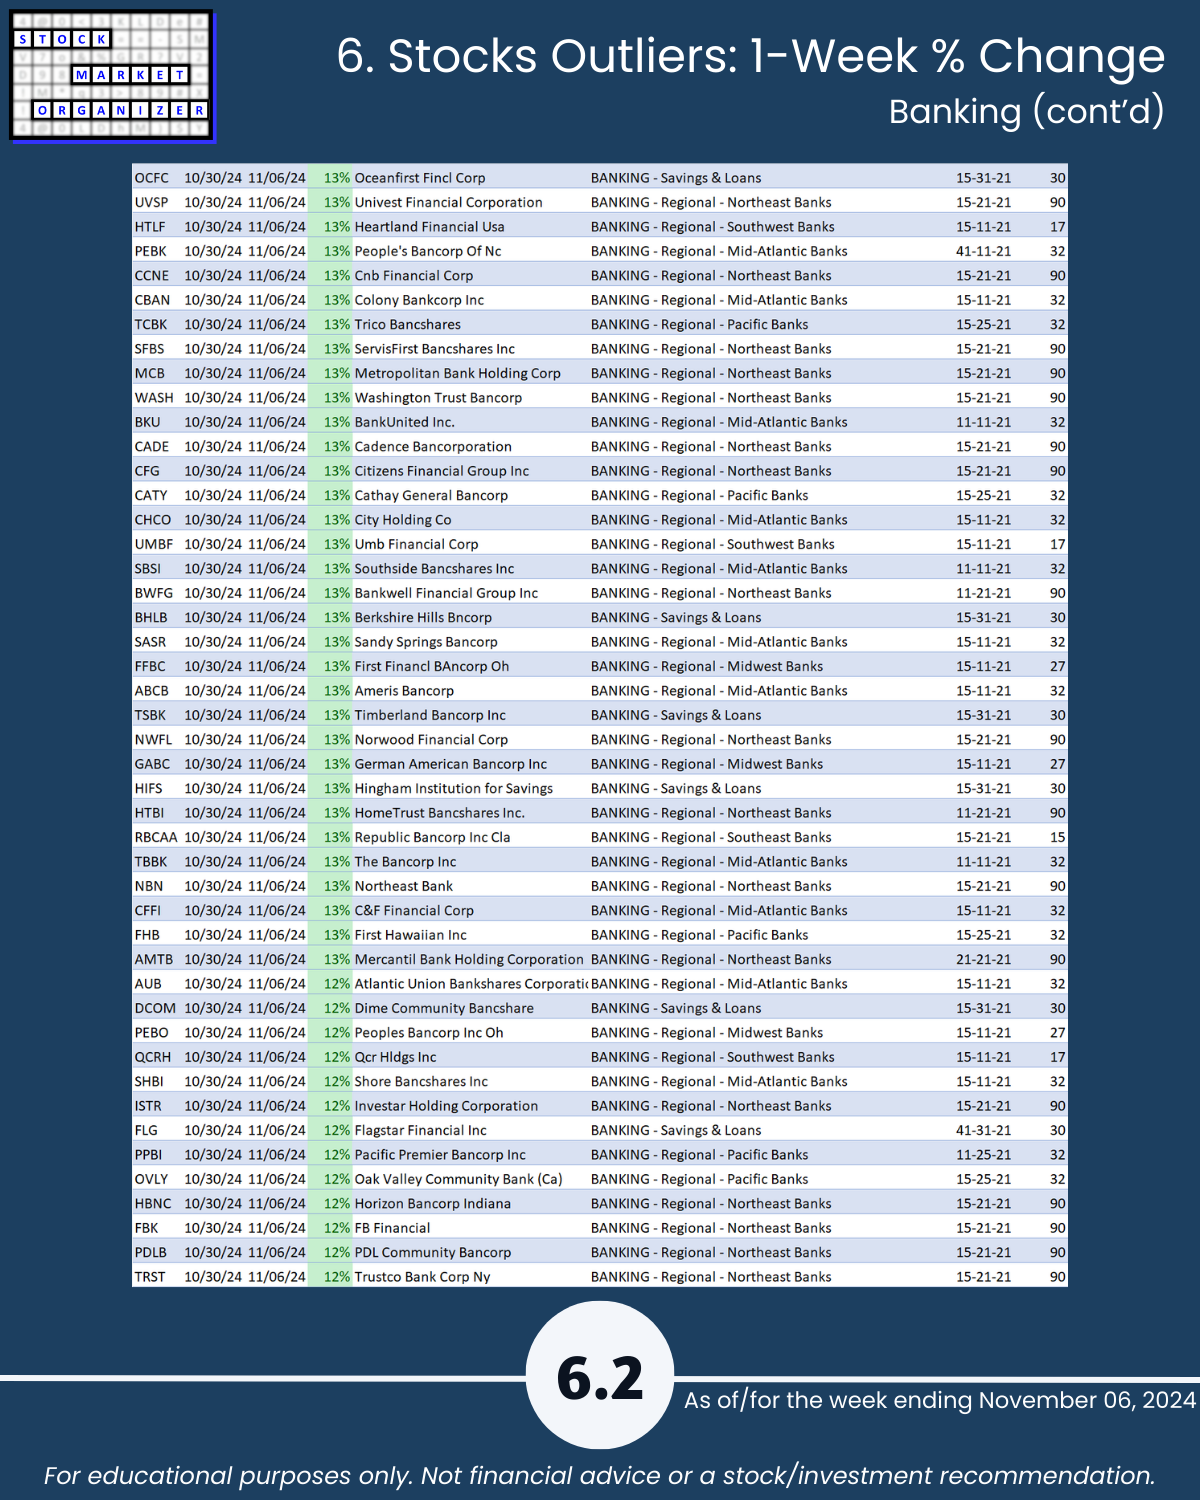
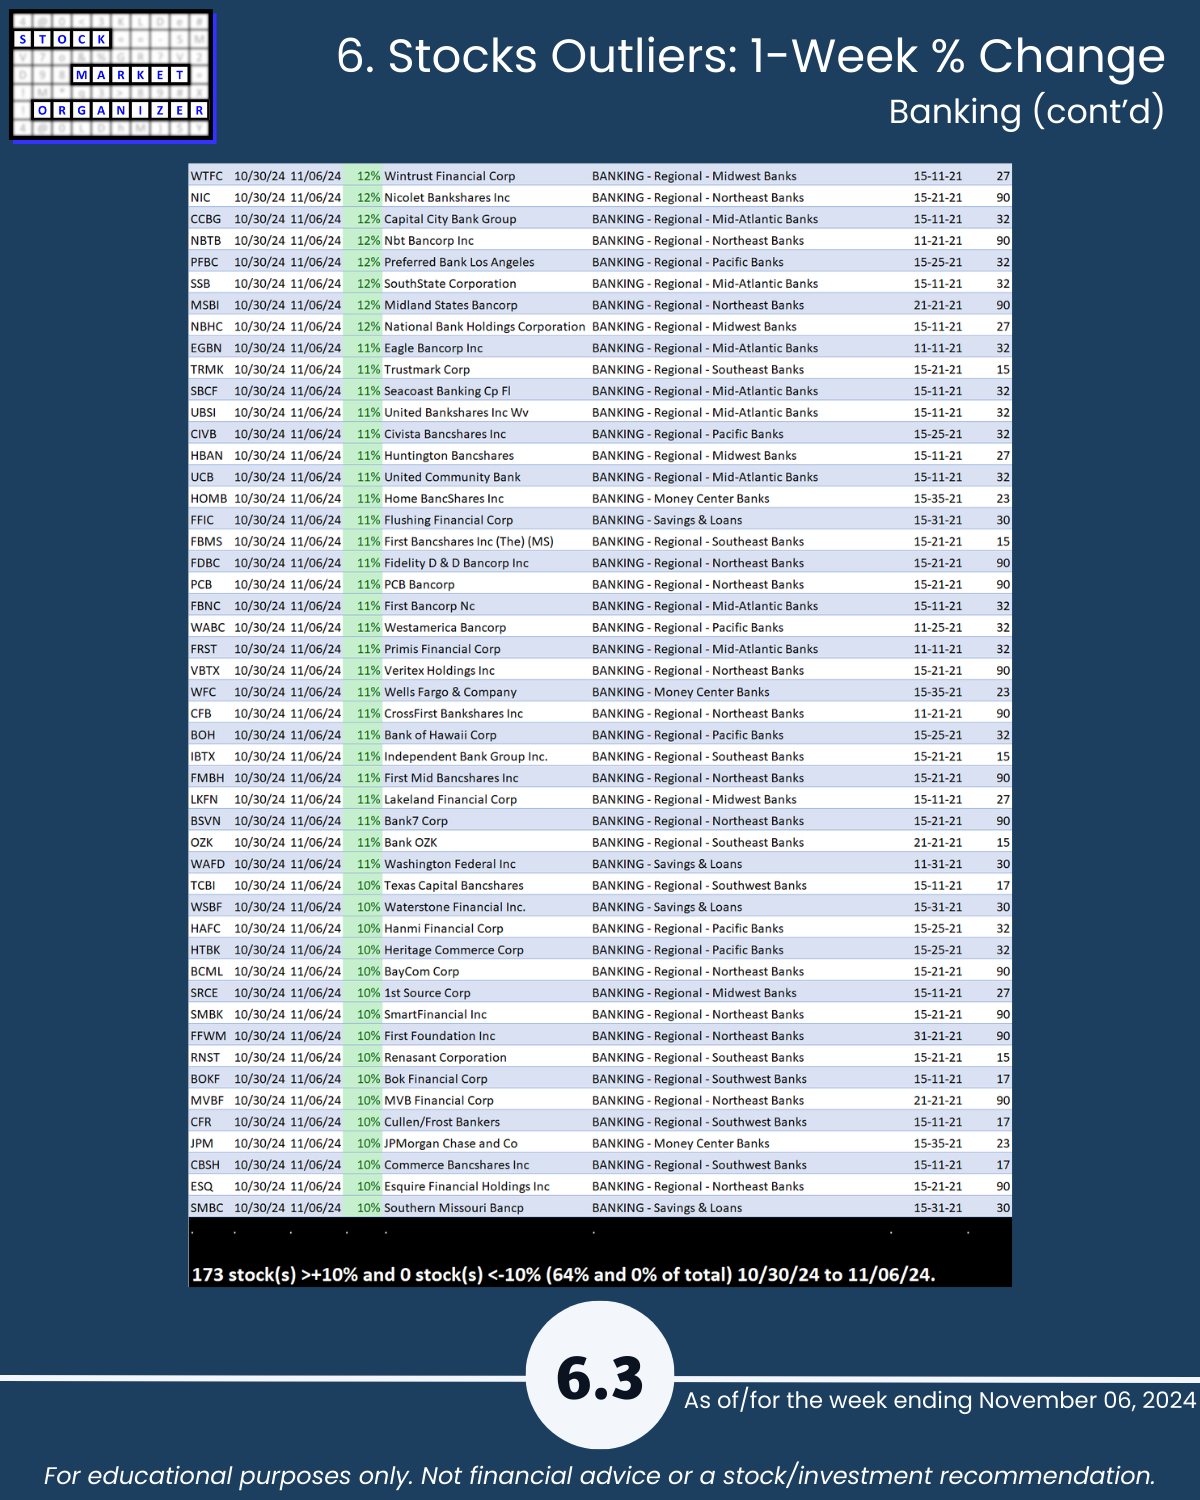
Phenomenal strength in Banking:
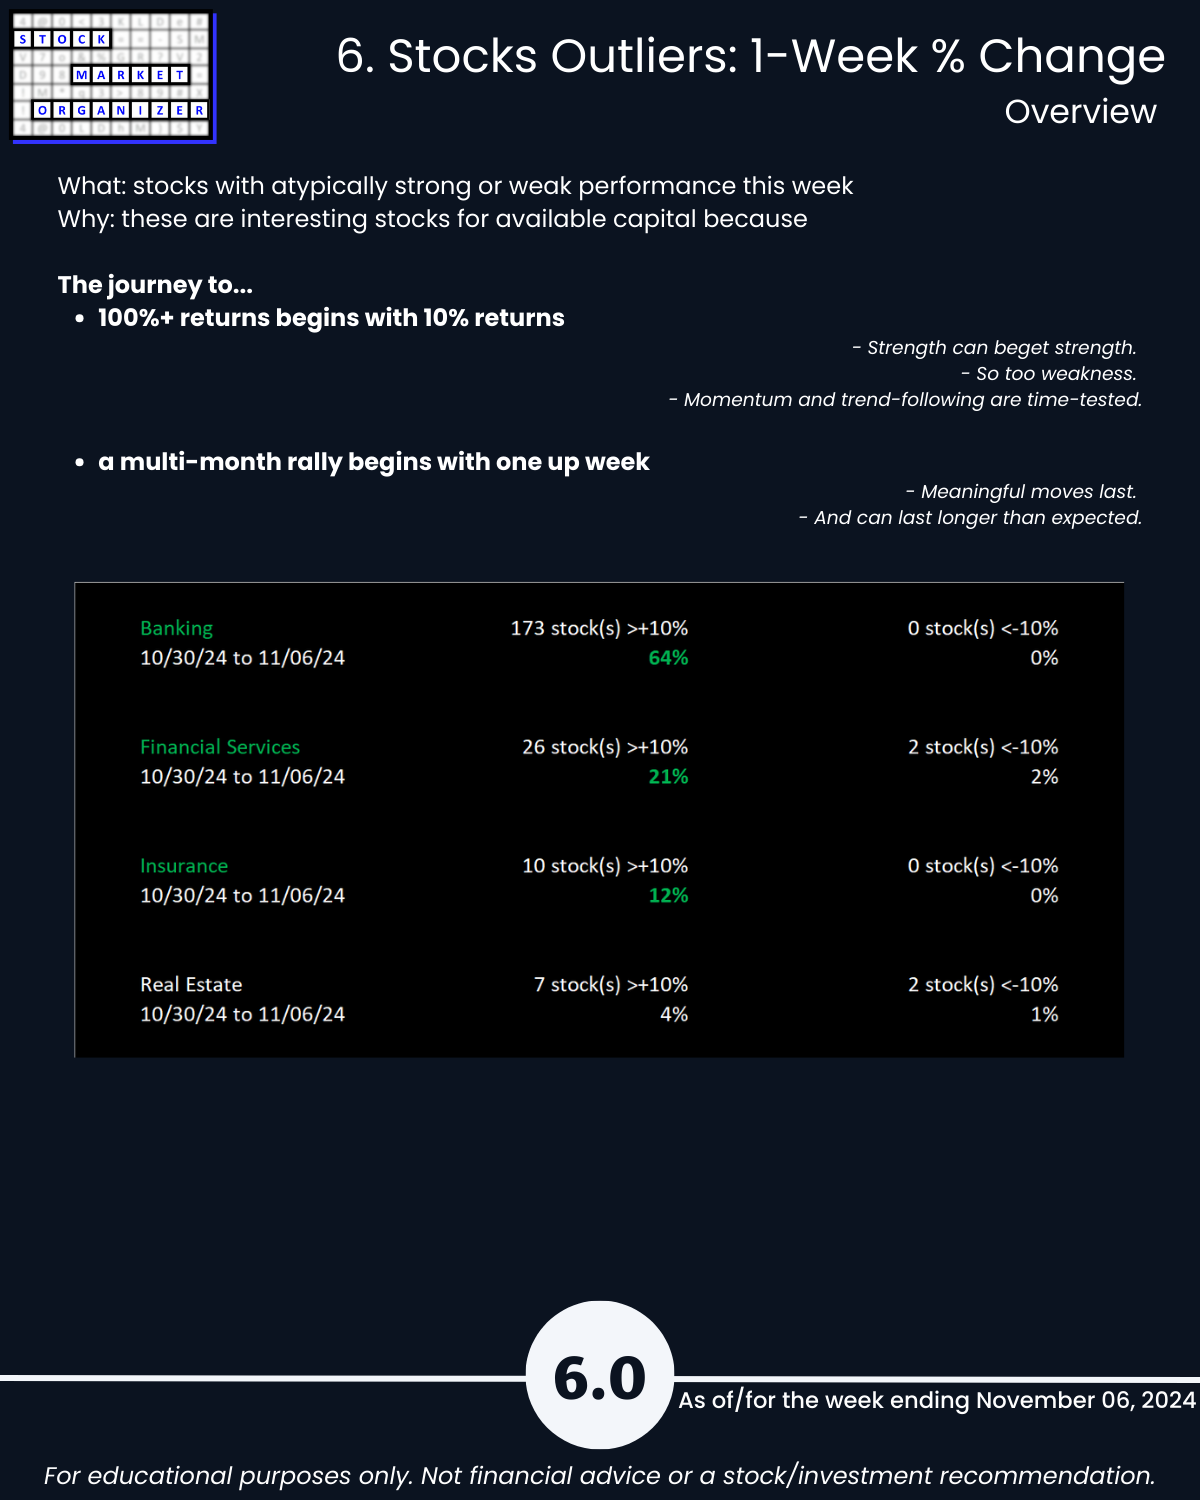
- 97% positive stocks and 64% of stocks +>10% this week
- 89% of stocks rated 1Strongest
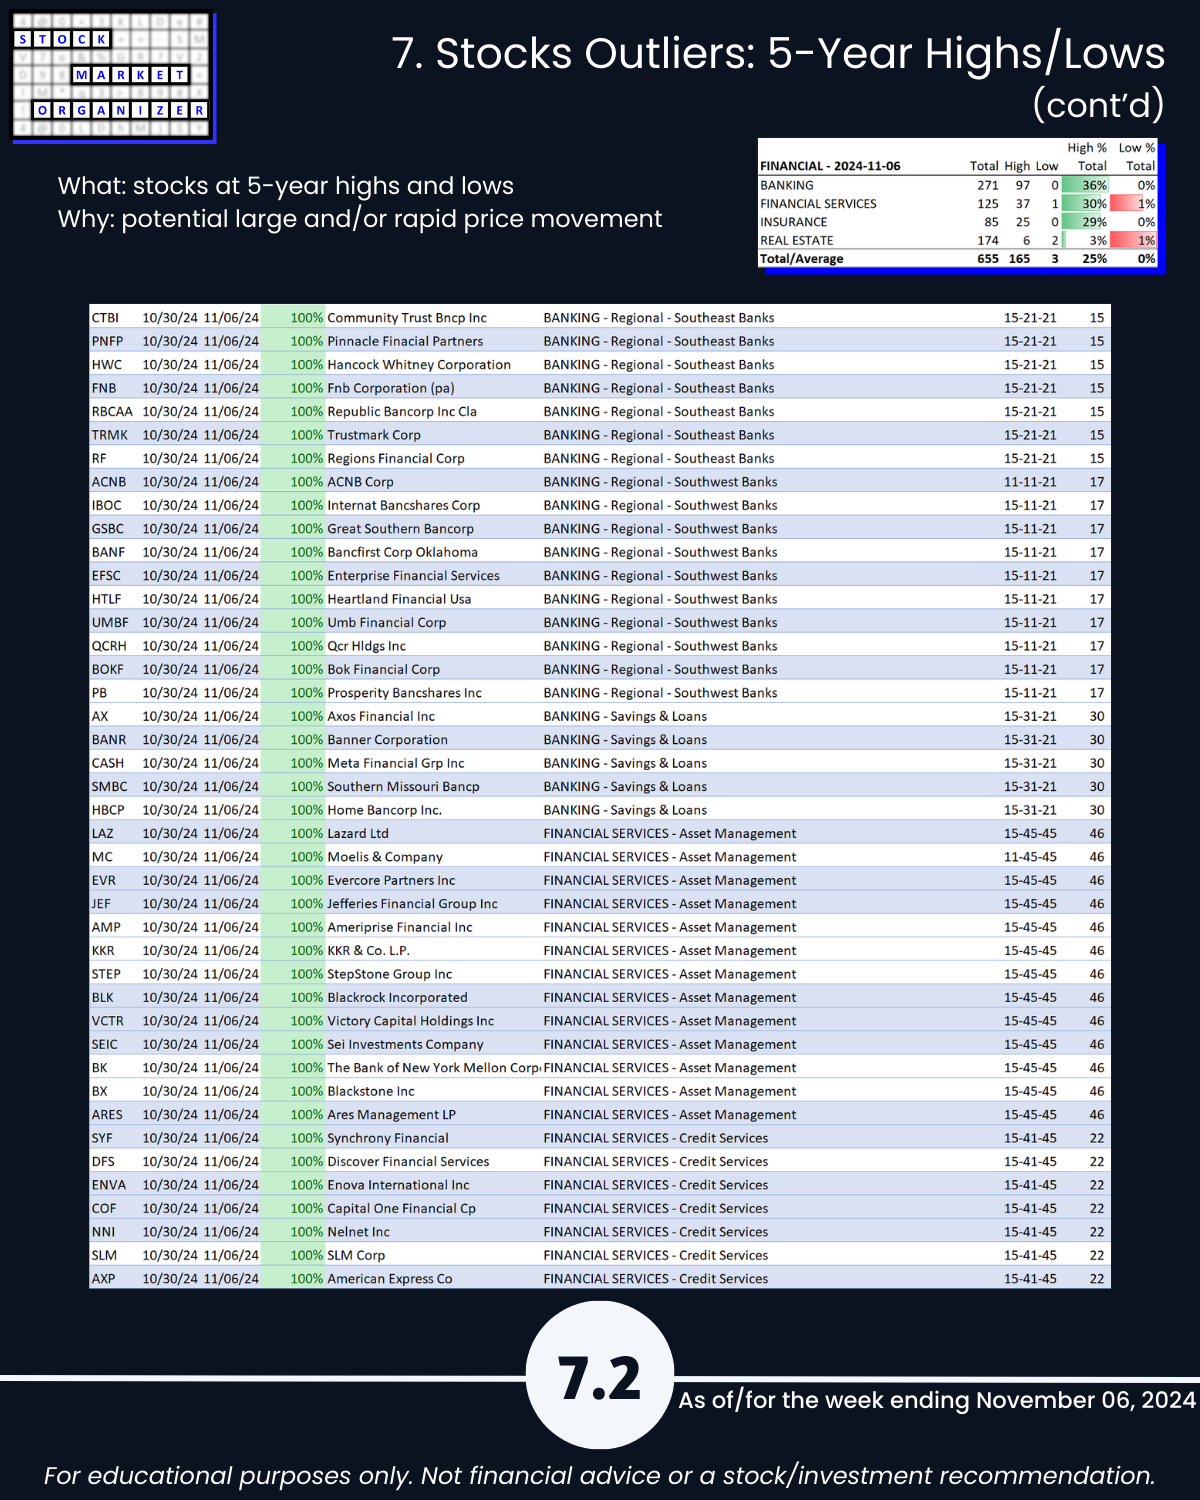
- 97/271 stocks = 36% at 5+ year highs
How far will this strength go and for how long? I have no idea. I'm just objectively tracking this and acting appropriately based on pre-set rules.
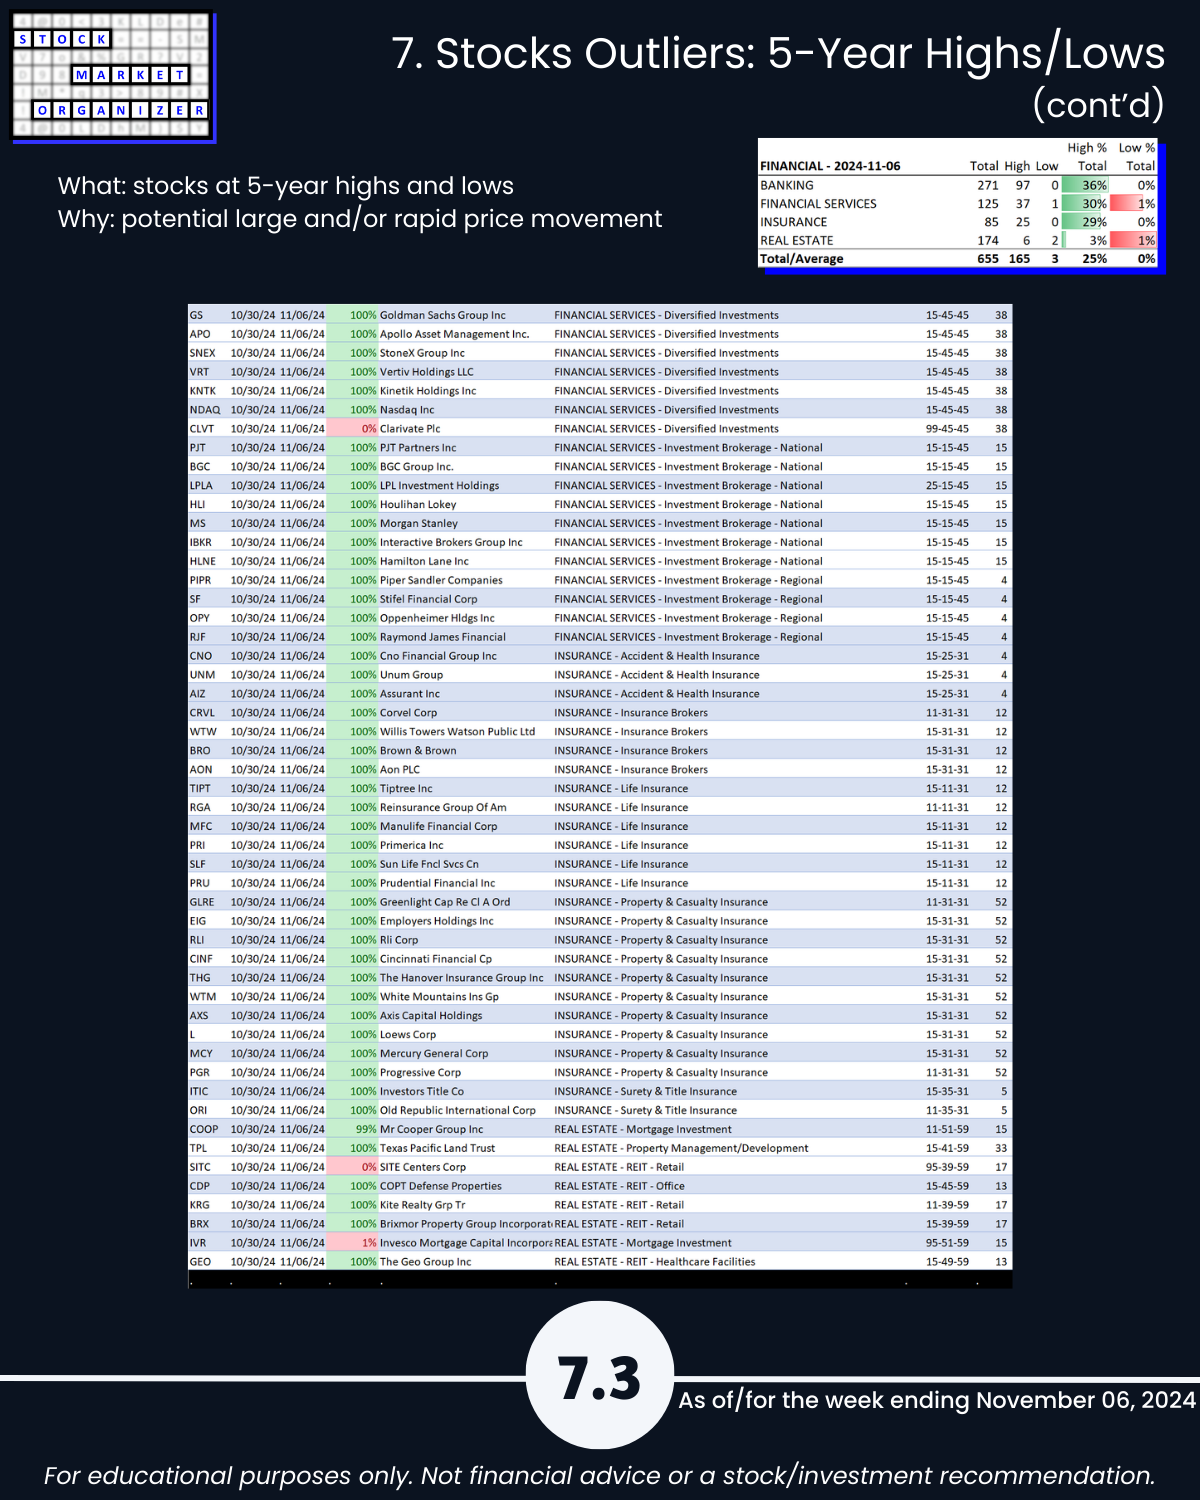
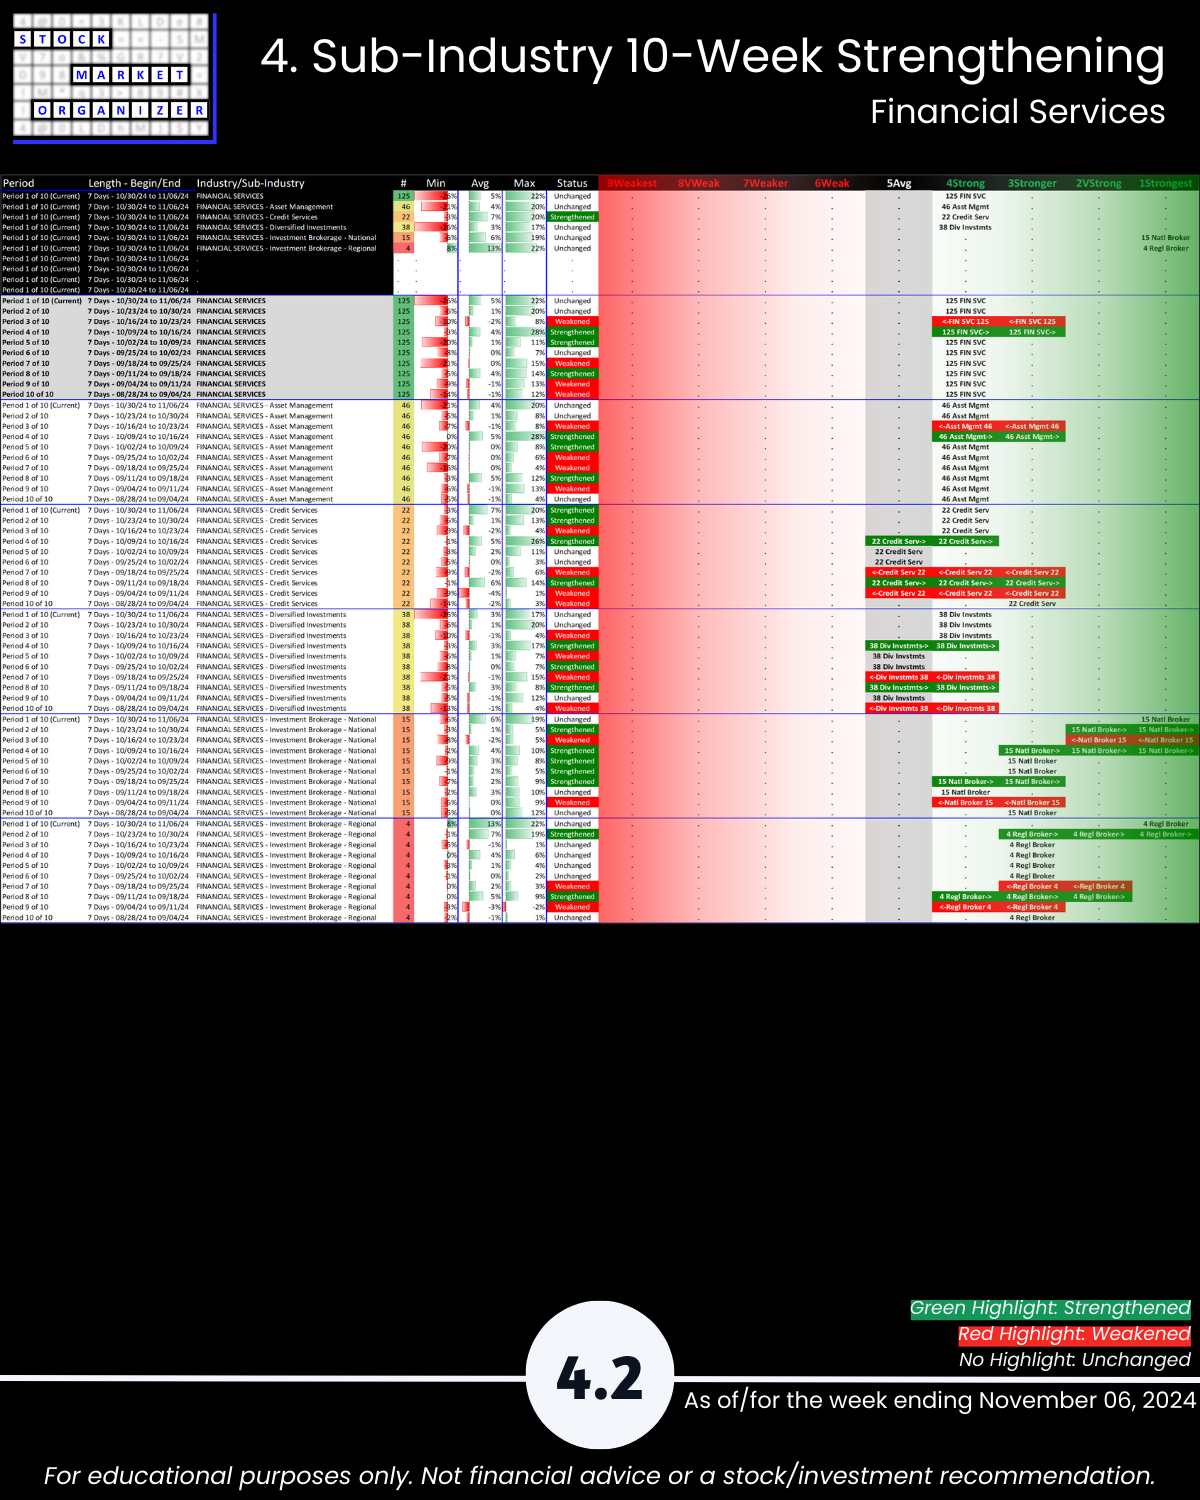
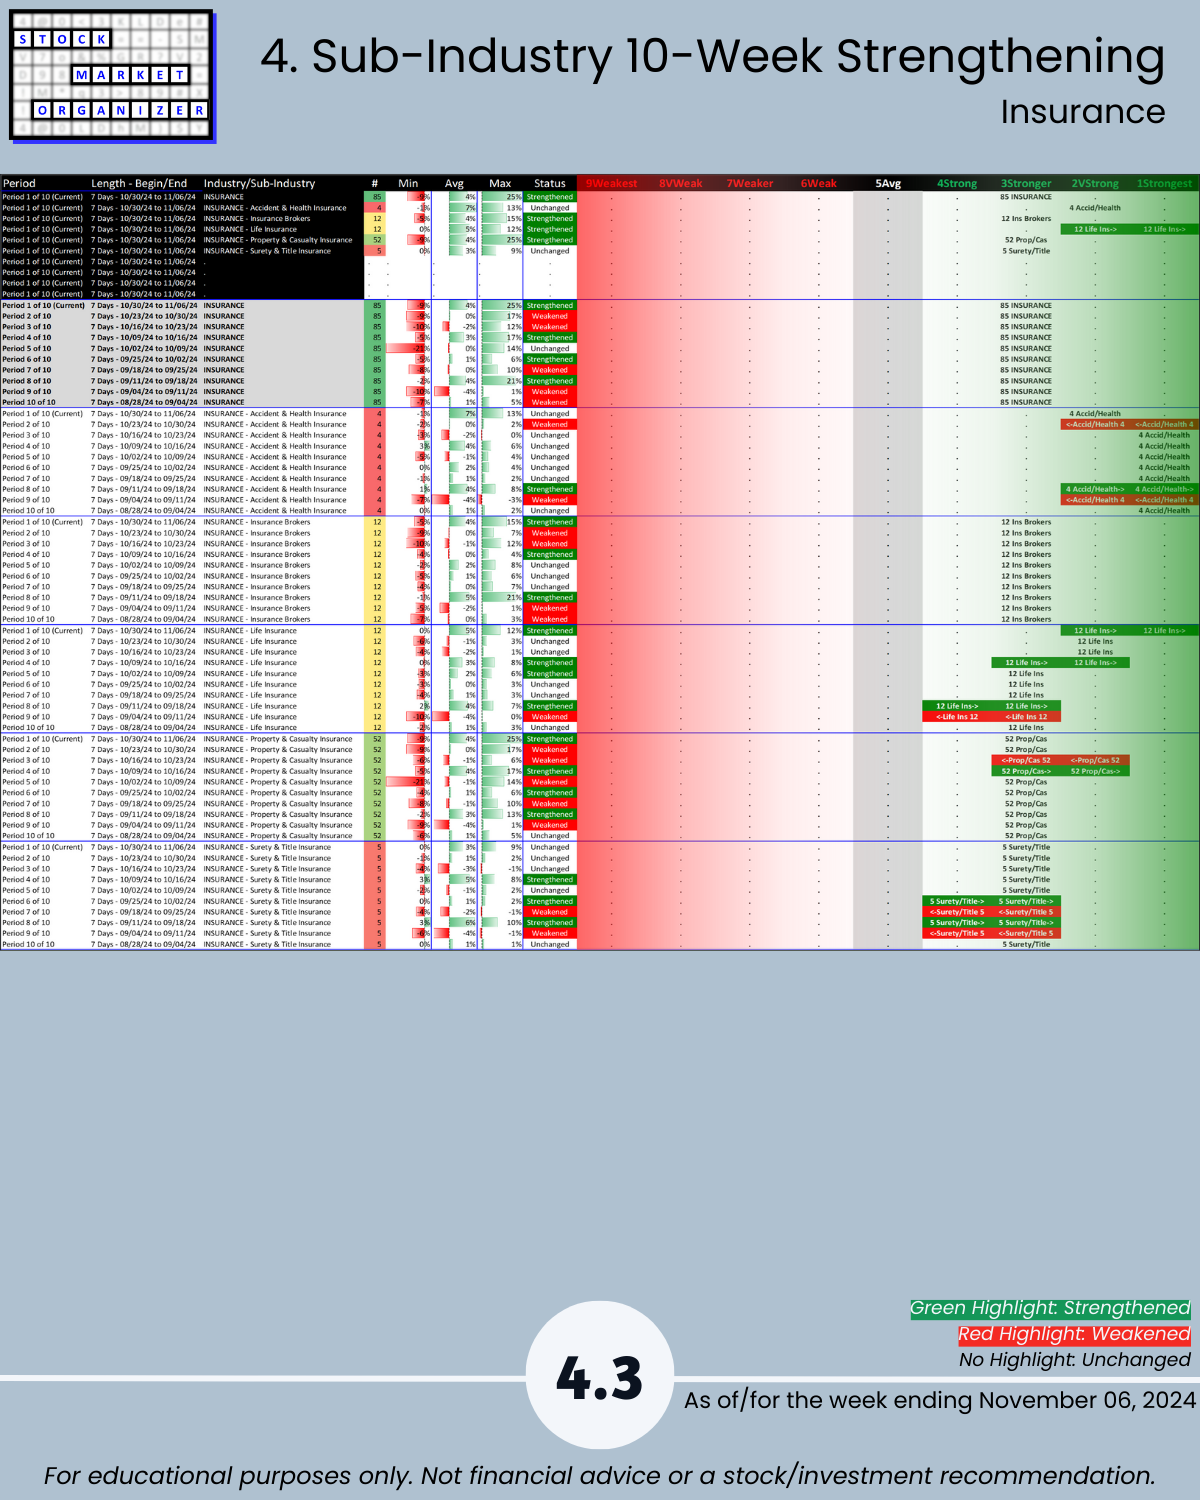
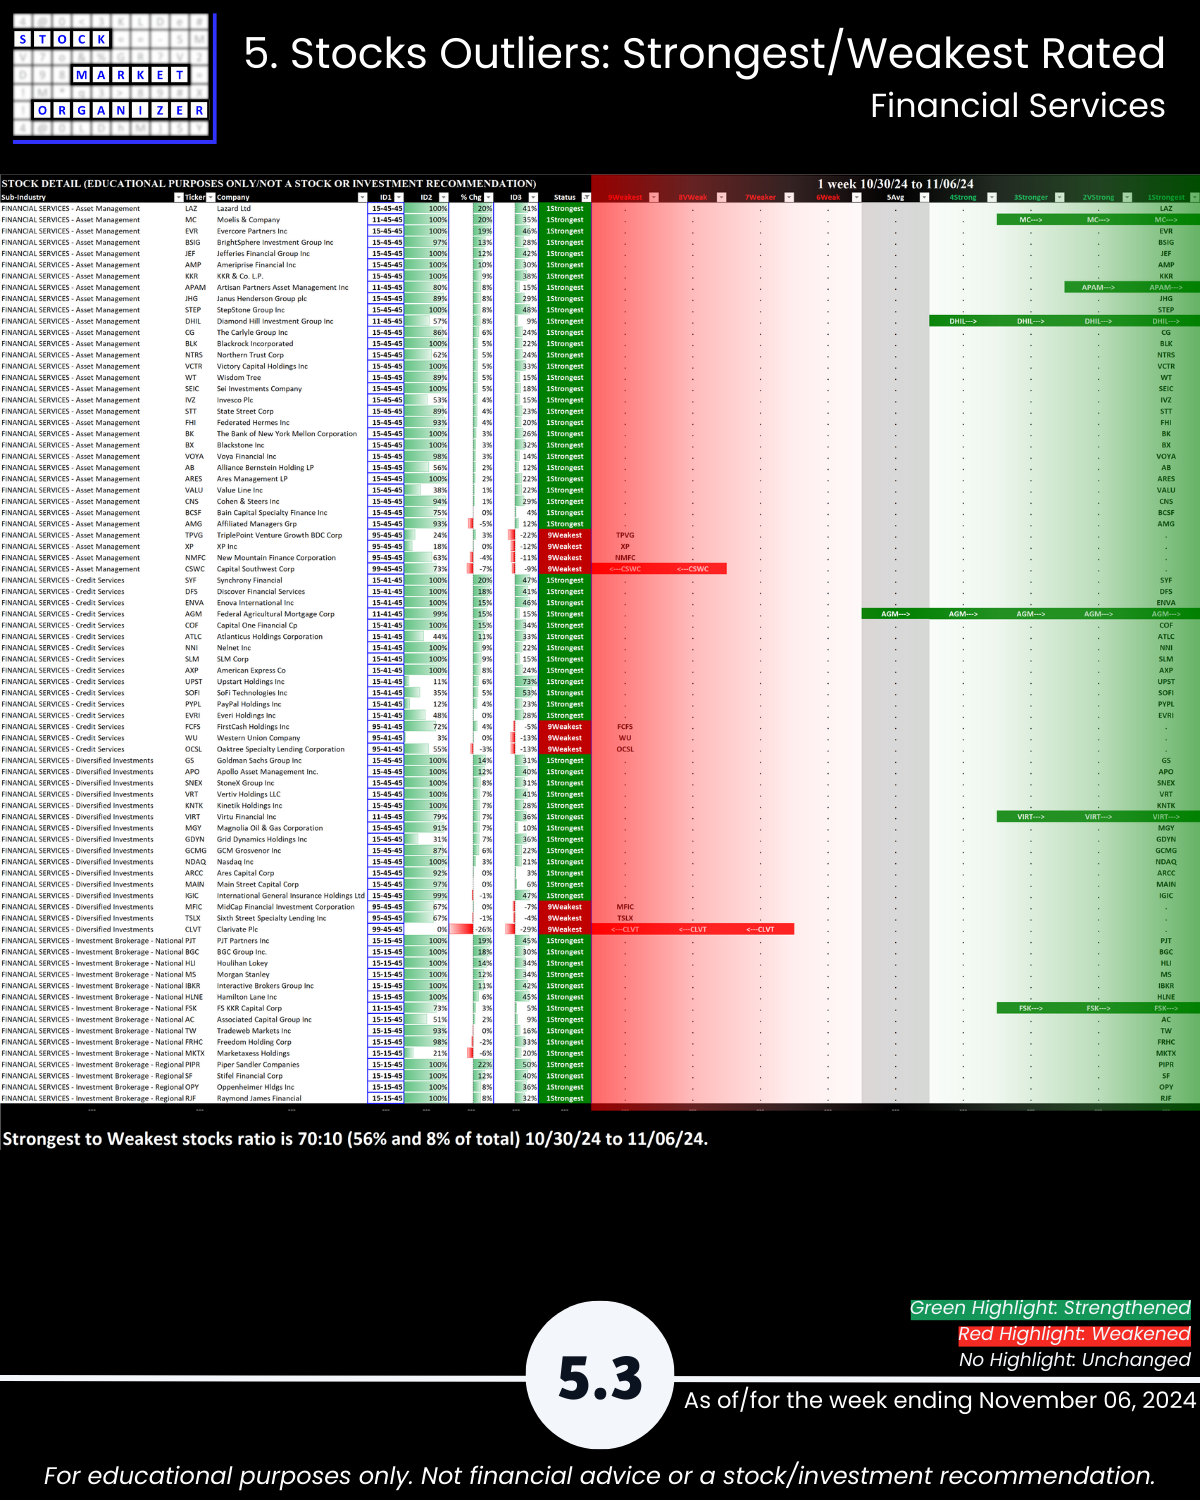
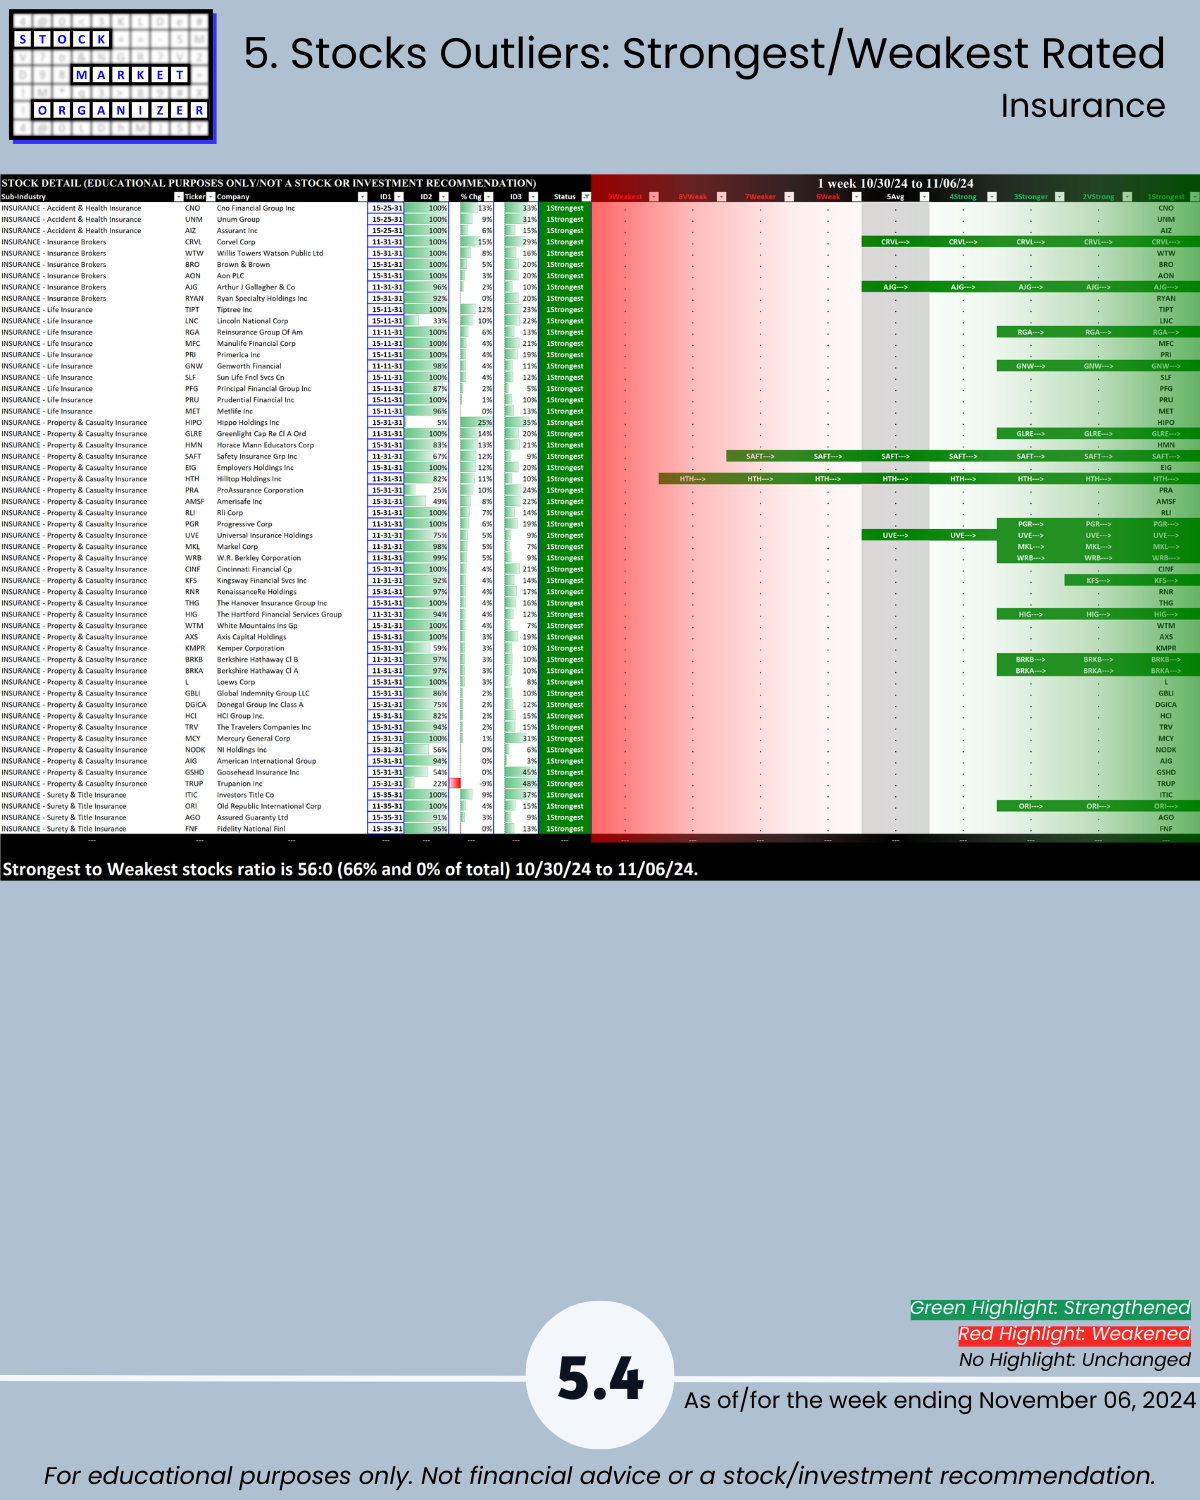
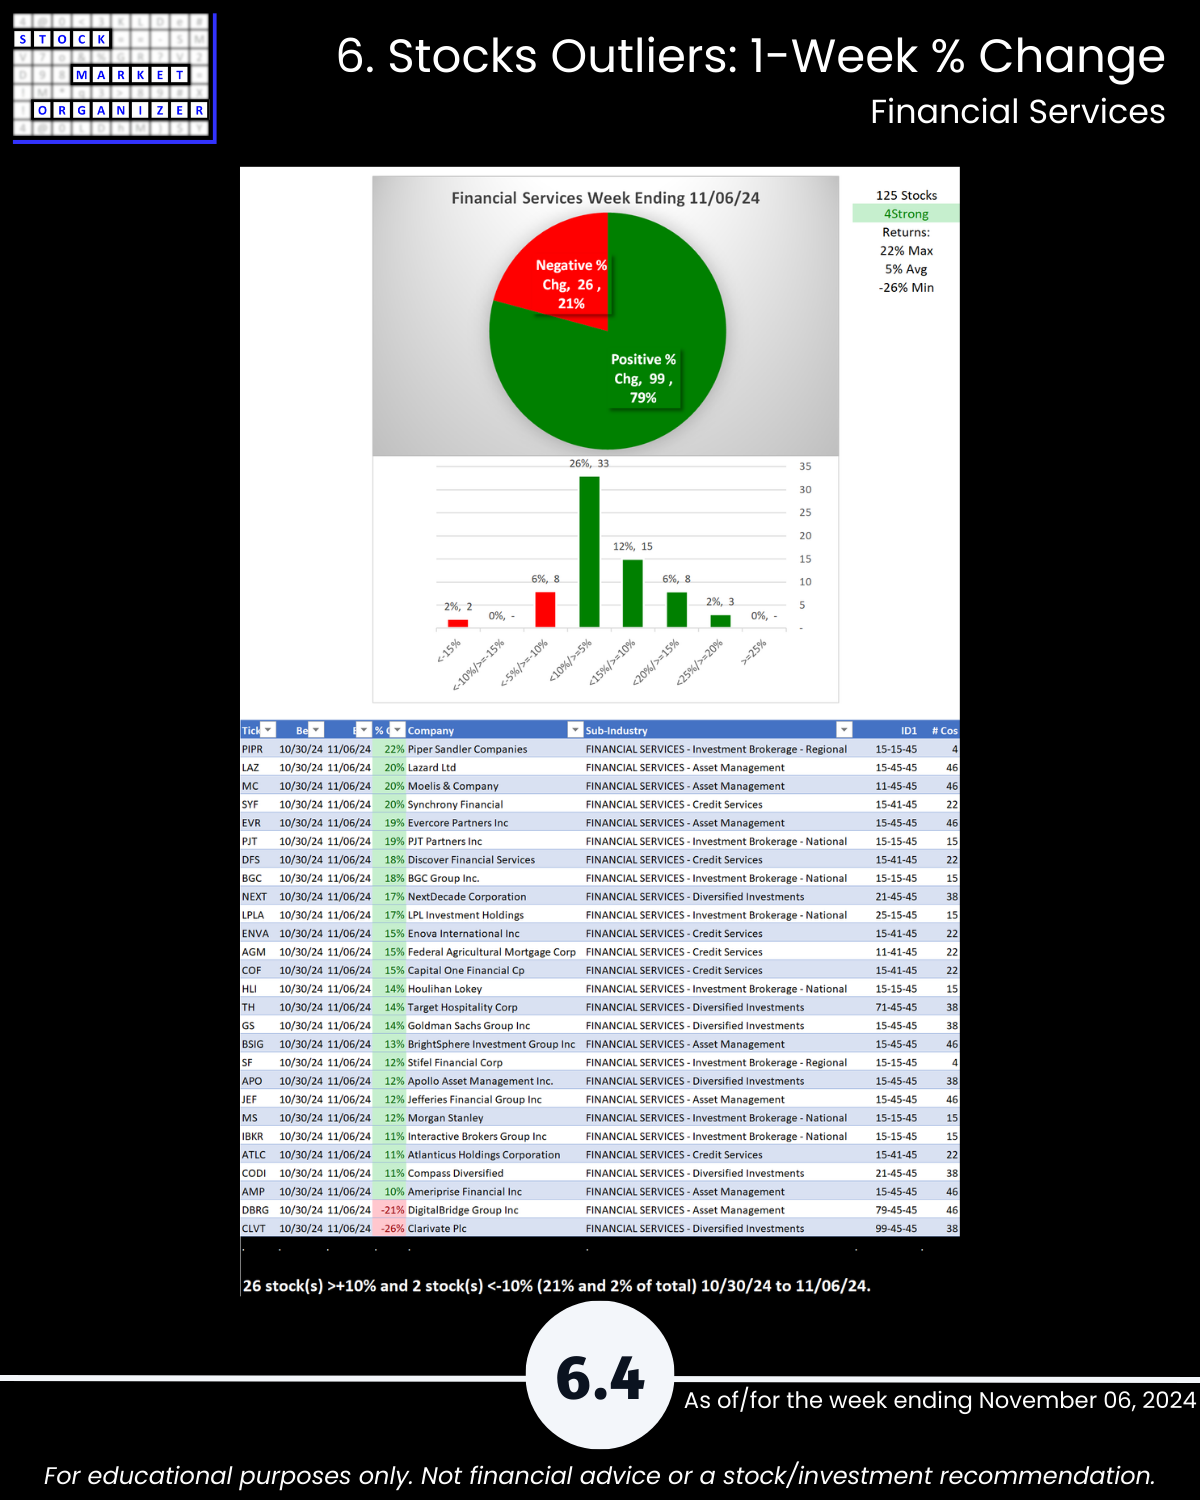
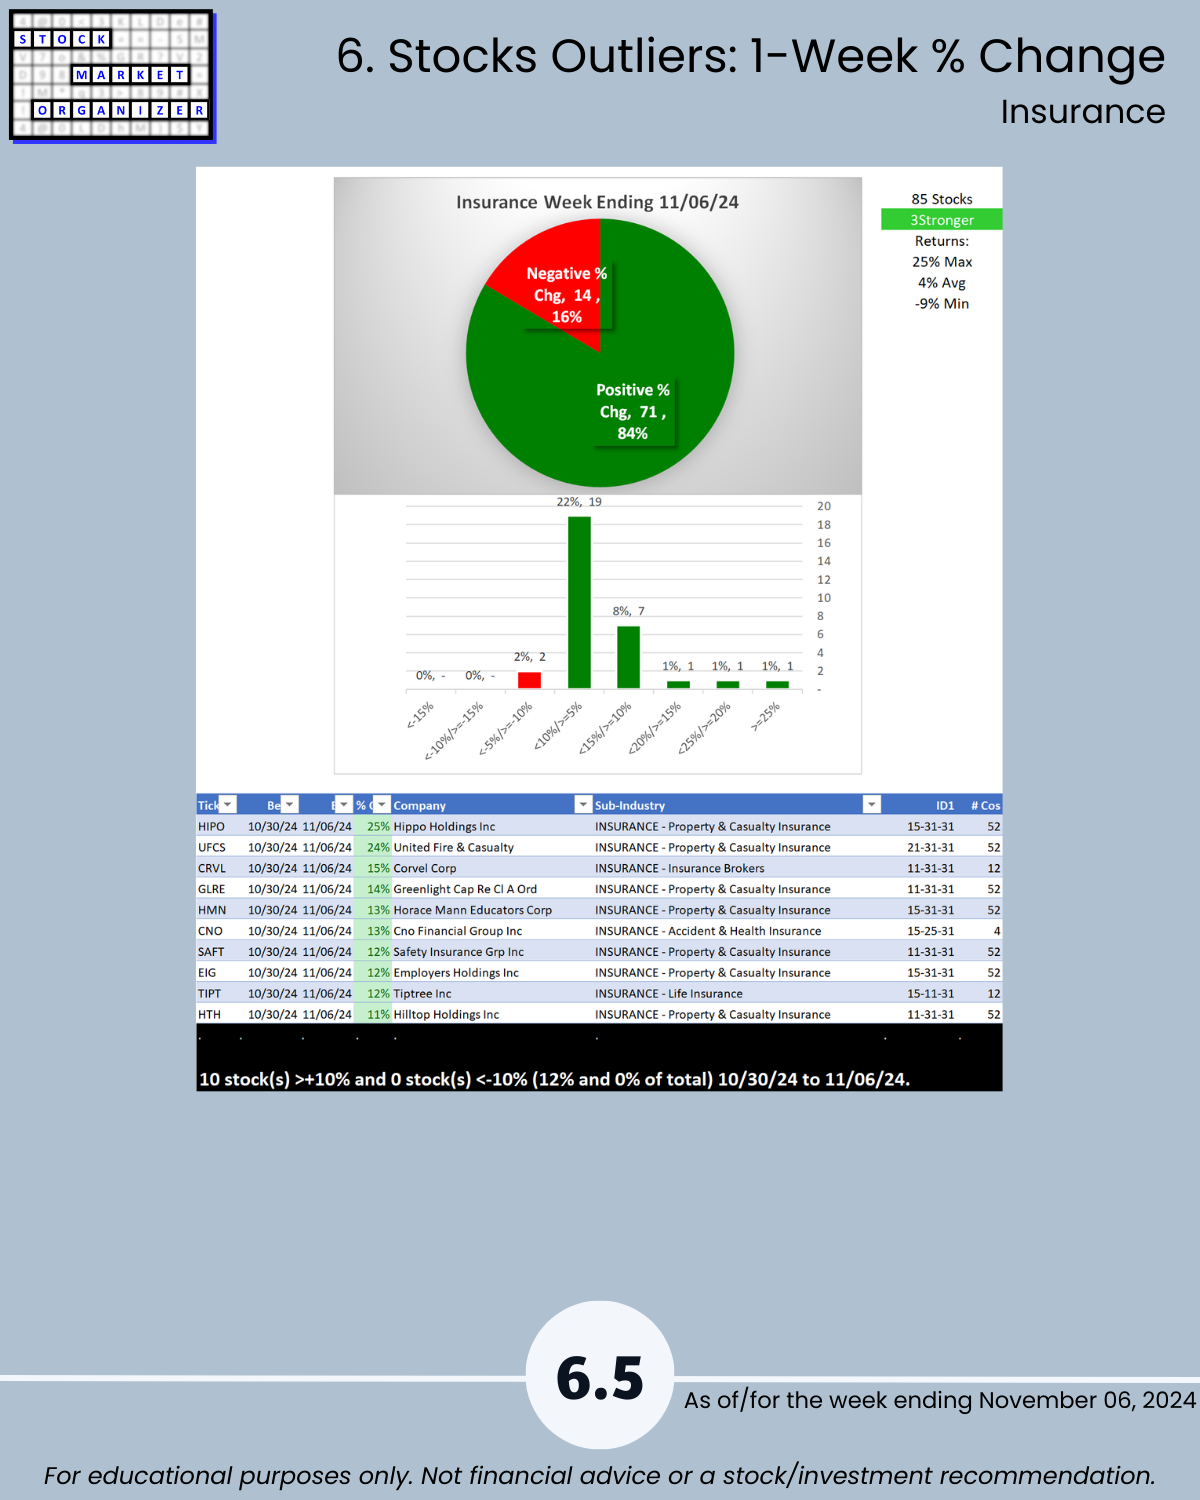
Insurance strengthened but not enough to change its strength rating, while Financial Services was unchanged for the week.
Difference This vs. ETFs Analysis
Note this analysis is the same as that used for the SPDR ETFs but the two main differences are:
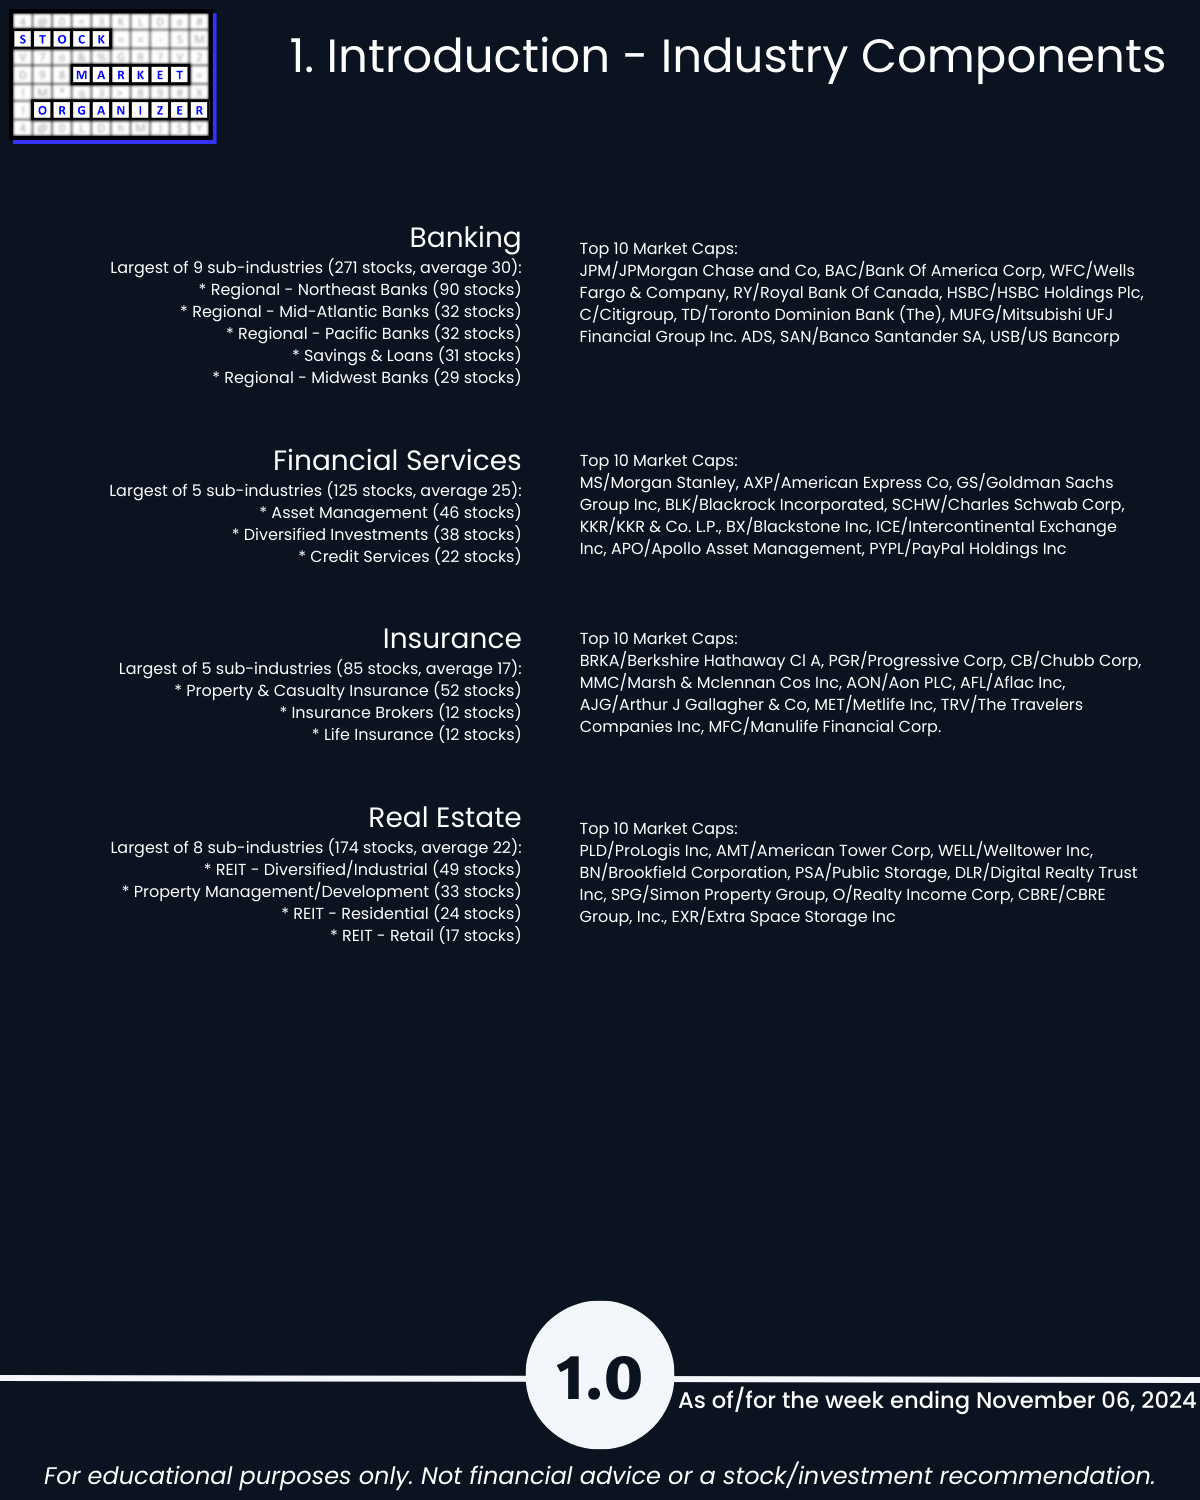
1. Universe of stocks. The ETFs are the largest capitalization stocks, 500 of them in the 11 sector ETFs. In this analysis, there are approximately 2,700 stocks.
2. Sub-categorization below the market level. The ETF analysis with 500 stocks is limited to sector strengthening and weakening. This analysis with +/-2,700 stocks can be and is segregated into 29 industry groups and in turn 189 sub-industry groups.
There is a Financials ETF (symbol XLF) which is separate from the Real Estate ETF (symbol XLRE). The Financials sector in this analysis includes Real Estate with Banking, Financial Services, and Insurance.
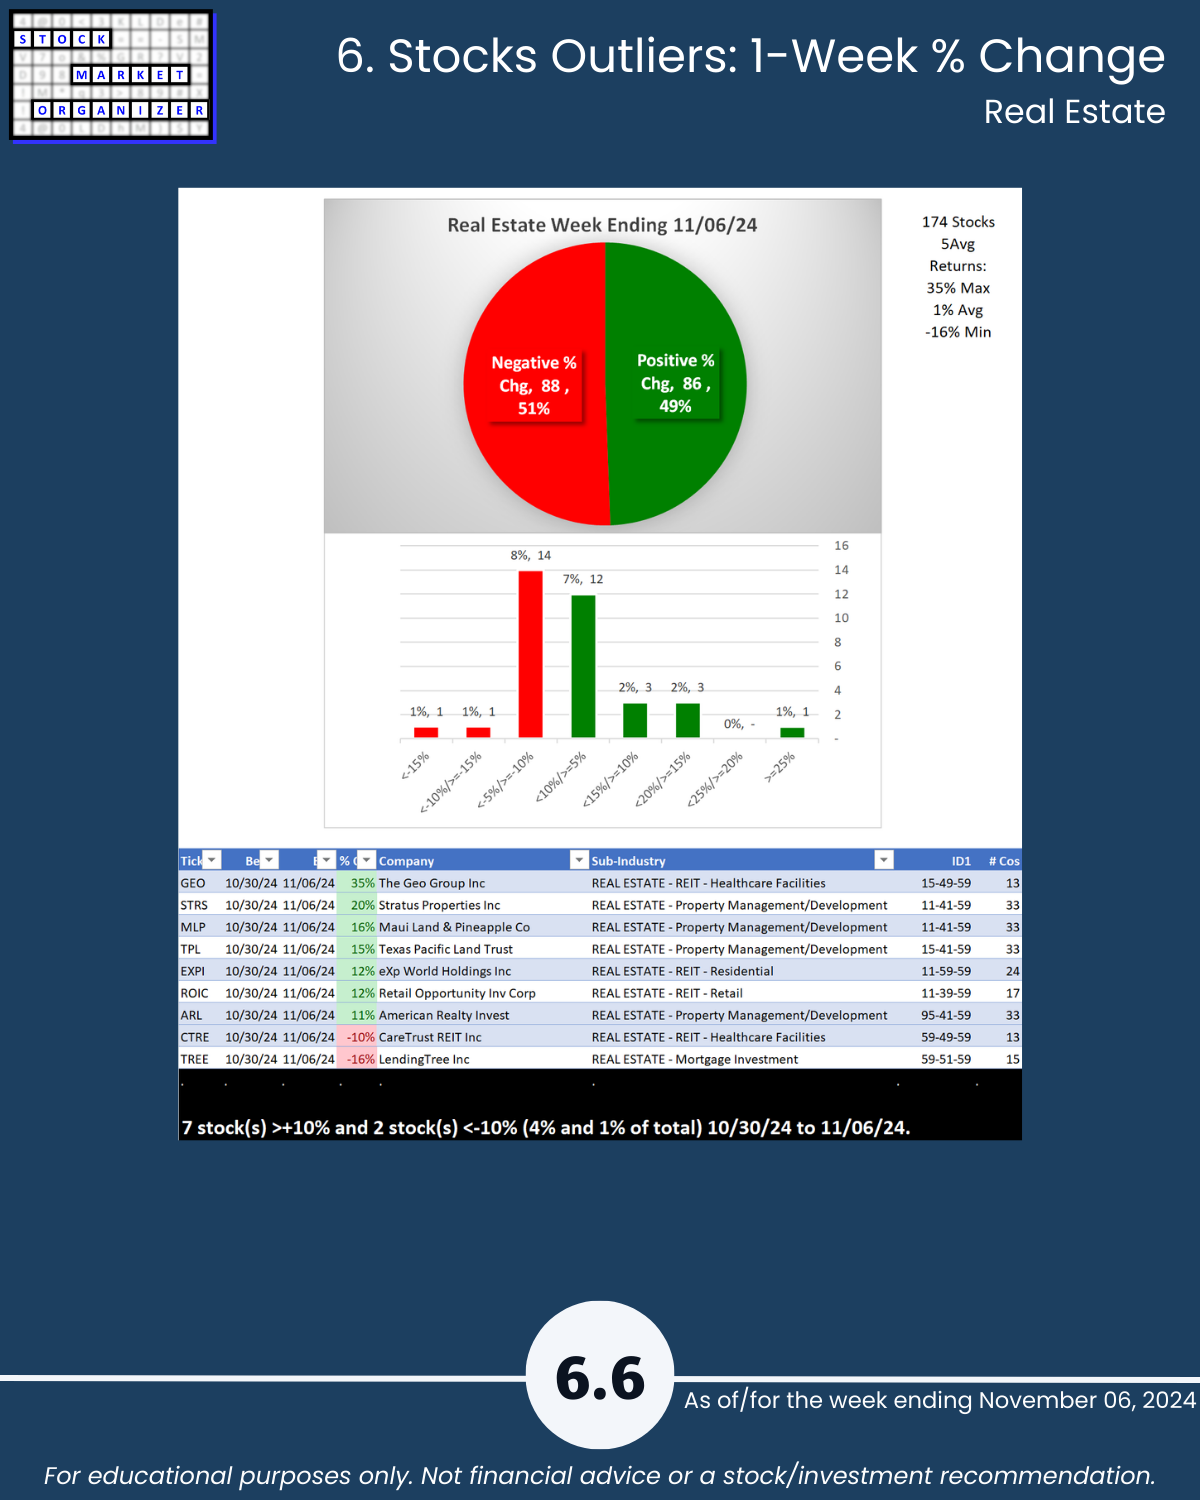
Per yesterday's ETF strength analysis, XLF/Financials is rated 3Stronger and XLRE/Real Estate is rated 4Strong. This is generally a match for the Banking, Financial Services, and Insurance readings from today, and is slightly stronger than the Real Estate Industry 5Average rating from today's analysis which covers more stocks. This means the larger cap Real Estate stocks are stronger than the small caps.
How would I use this information?
The Market Strength Score is now positive and, while the Financial Sector is flat over the past week per this analysis, Banking strengthened one level and Insurance strengthened but not enough to increase its strength rating.
Meanwhile, the two relevant sector ETFs (XLF/Financials and XLRE/Real Estate) weakened for the week ending yesterday but not enough to change strength rating.
Clearly, today's soaring market broke the Banks out of the weakness that colored the XLF/Financials through yesterday. The same cannot be said about Real Estate.
Longs would come from Banking. Shorts, if any, would be stopped into in weak stocks in Real Estate and only in 9Weakest stocks.
There is absolutely no way of determining how long this environment will last. All one can do is find an objective way of measuring whether any given environment offers headwinds or tailwinds and then act accordingly based on these measurements.
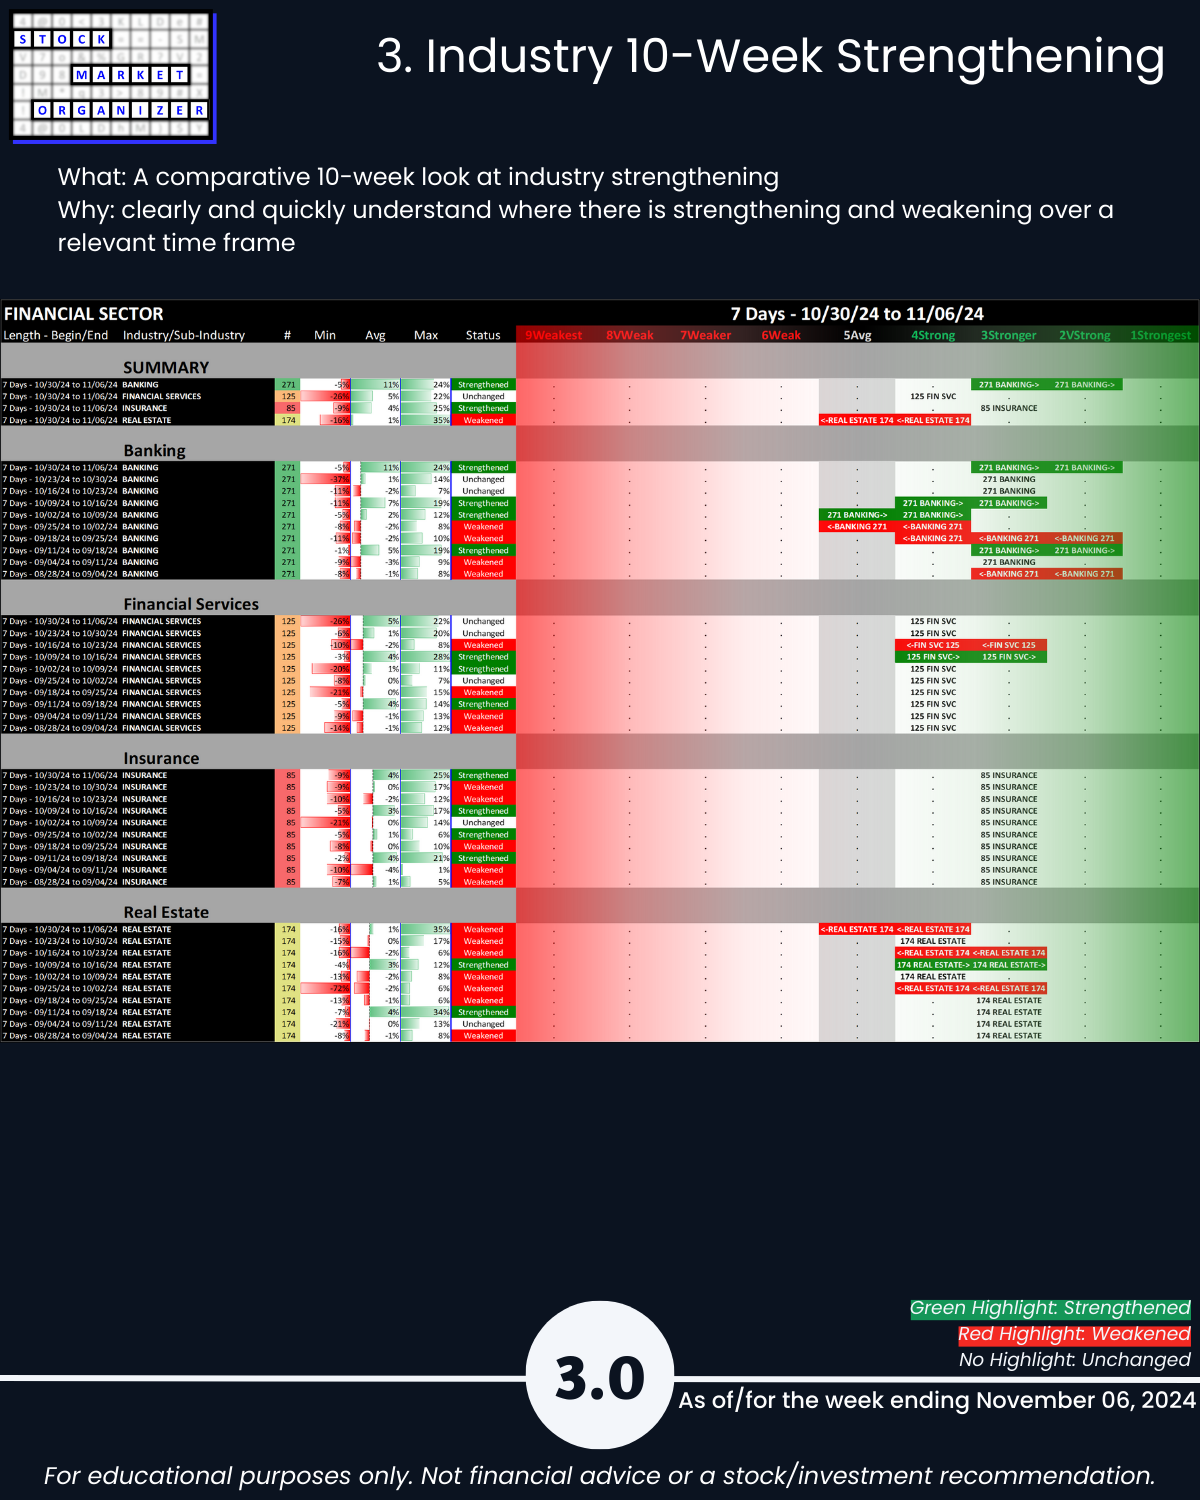
Details are below shown in a manner not available elsewhere because I created it from scratch to continually answer this question: “Where is there strengthening and weakening in the market at the stock, sub-industry, industry, and sector levels?” Combine this with the top-down Market Strength Score and Sector Risk Gauge to get a key competitive advantage of understanding strength at every level.
1. Introduction
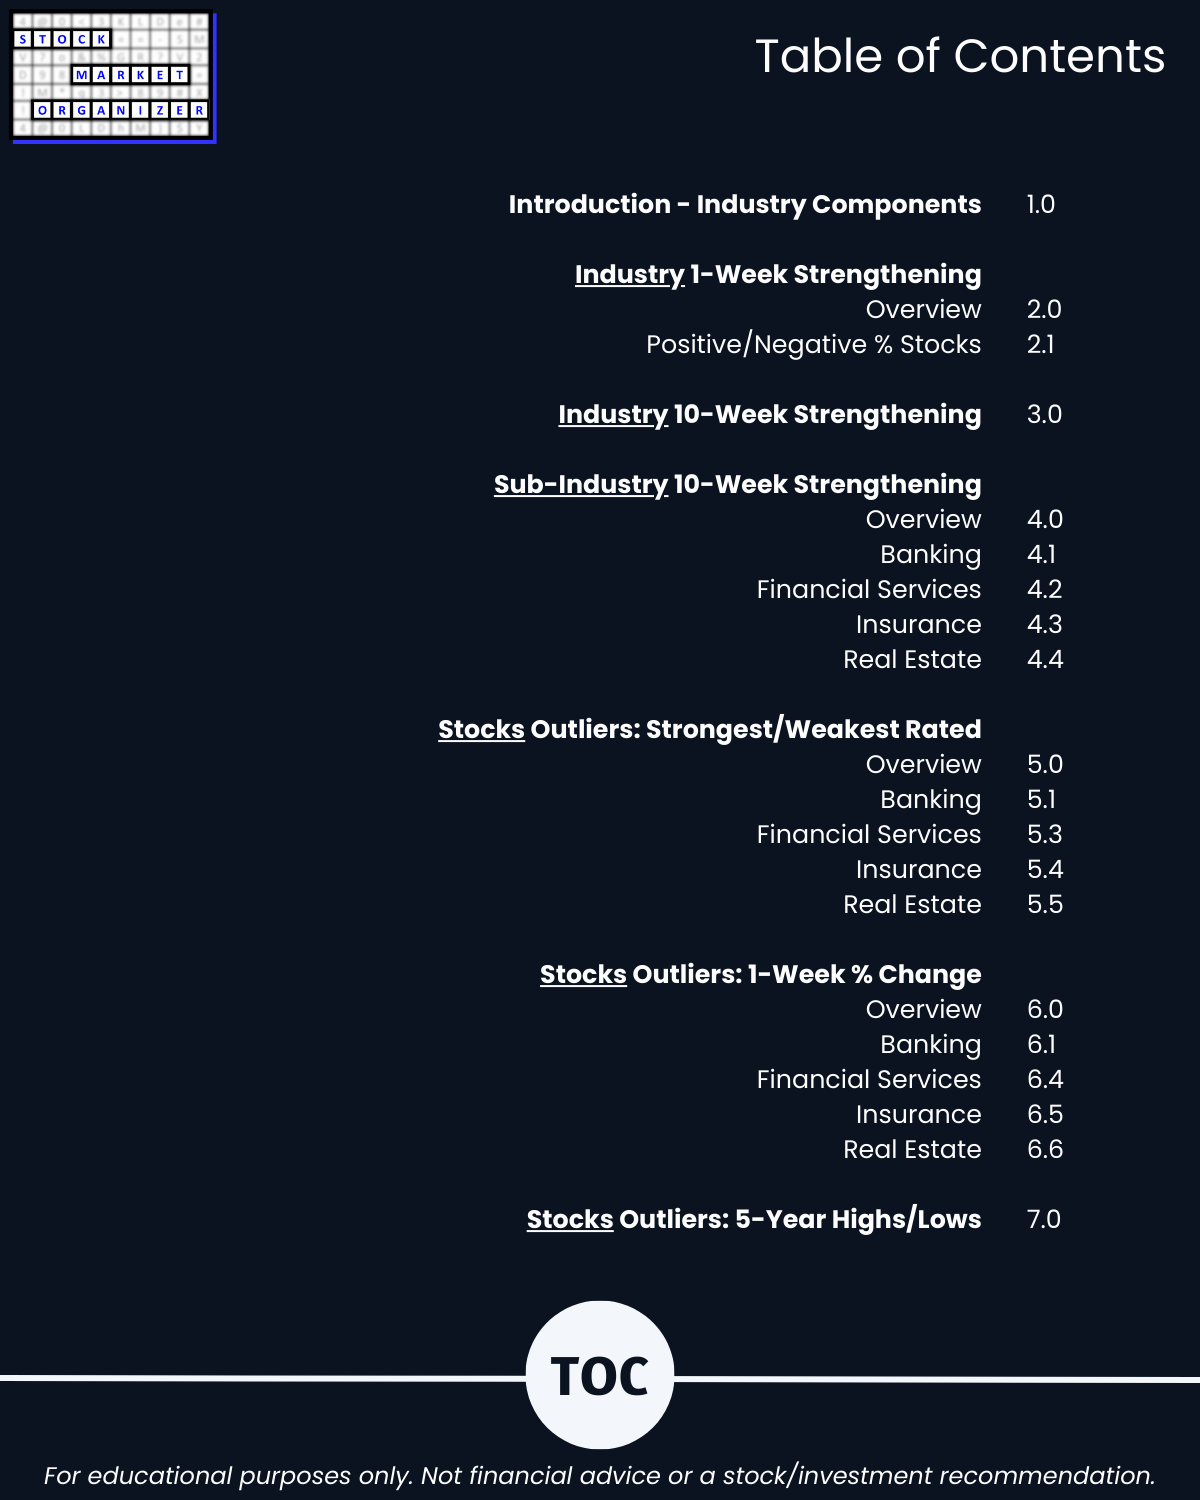
2. Industry 1-Week Strengthening
3. Industry 10-Week Strengthening
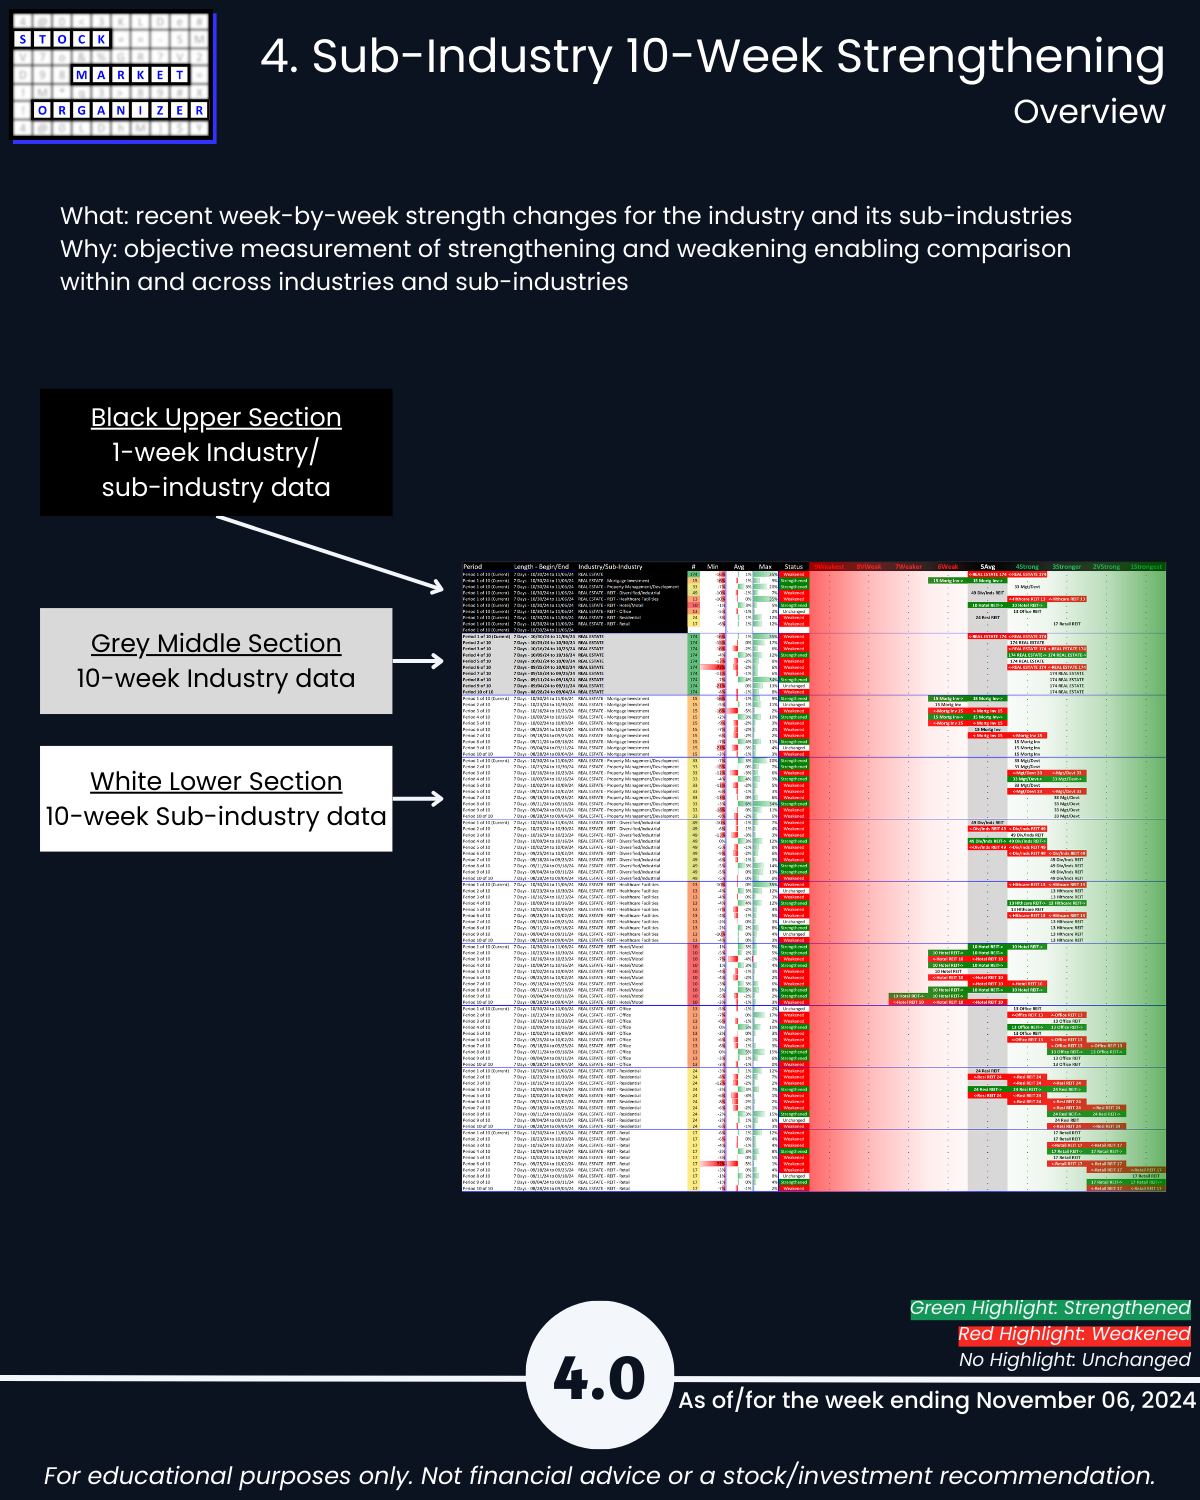
4. Sub-Industry 10-Week Strengthening
5. Stocks Outliers: Strongest/Weakest Rated
6. Stocks Outliers: 1-Week % Change
7. Stocks Outliers: 5-Year Highs/Lows