SMO Exclusive: Strength Report Financial Sector 2024-10-30
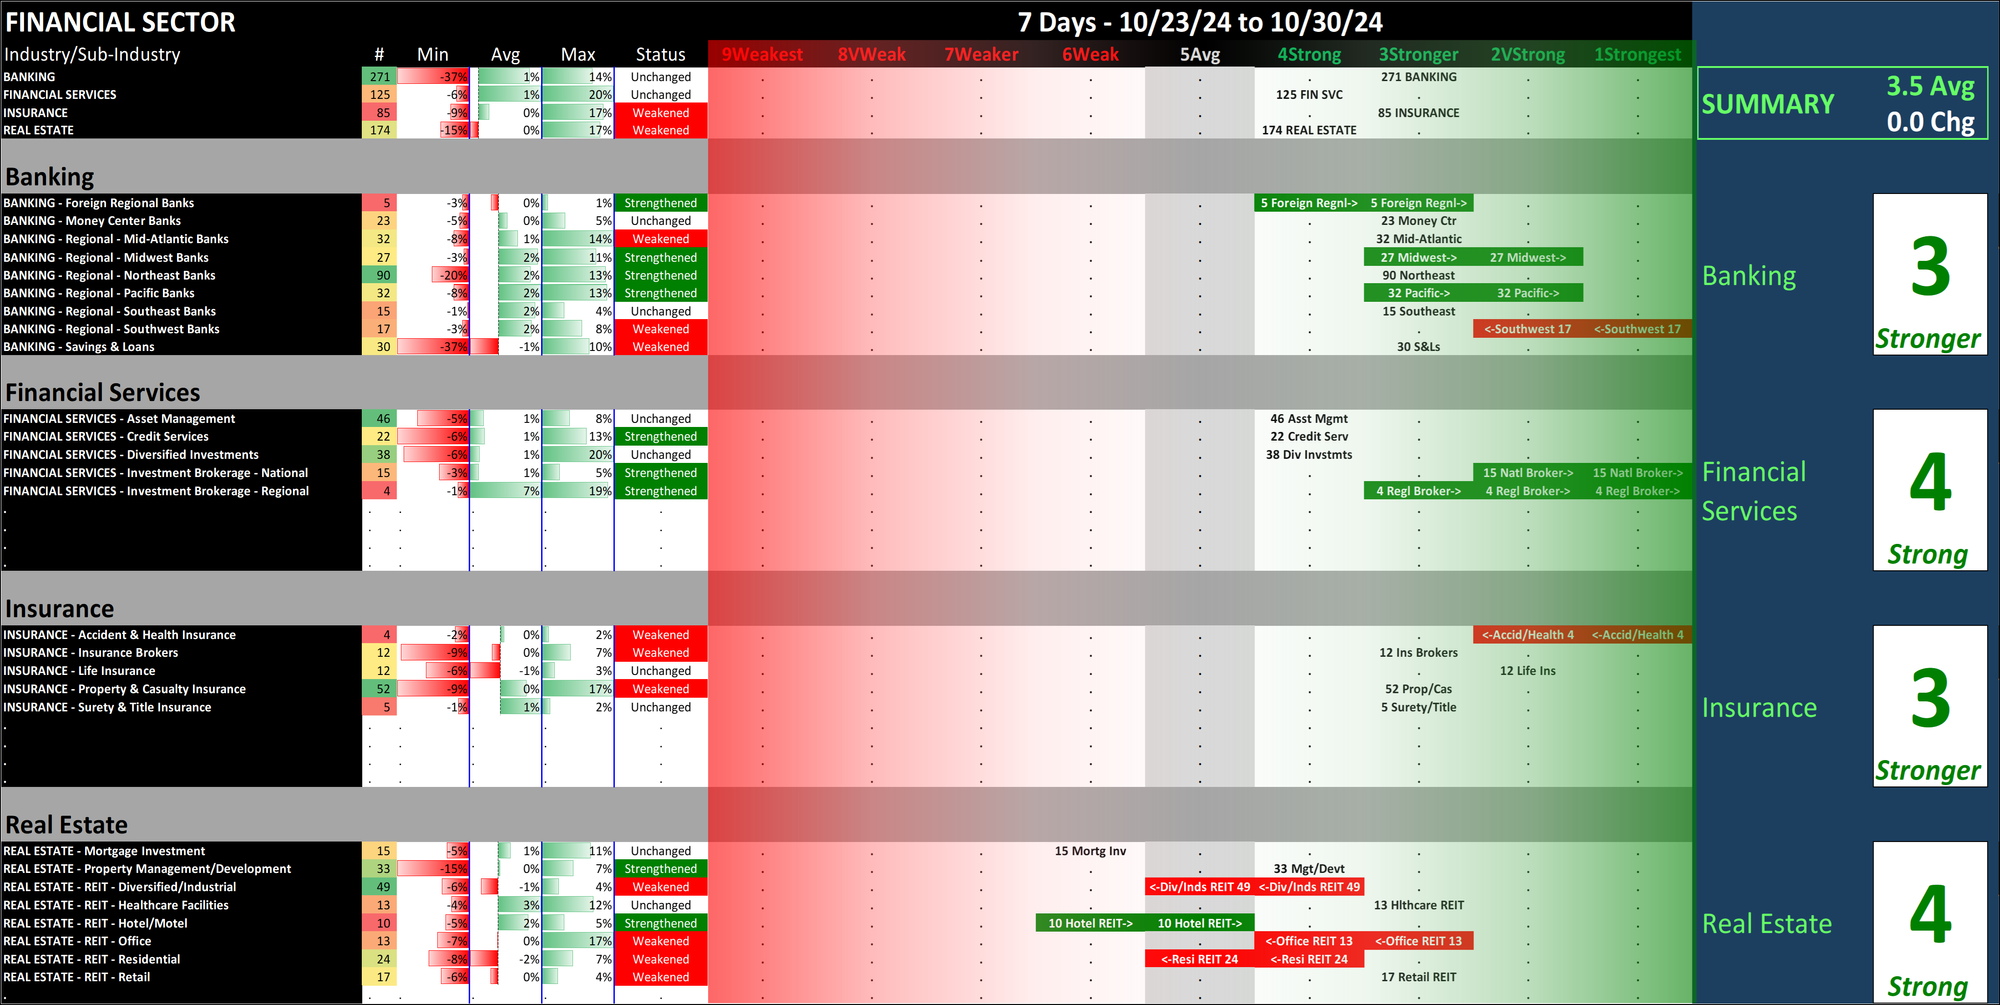
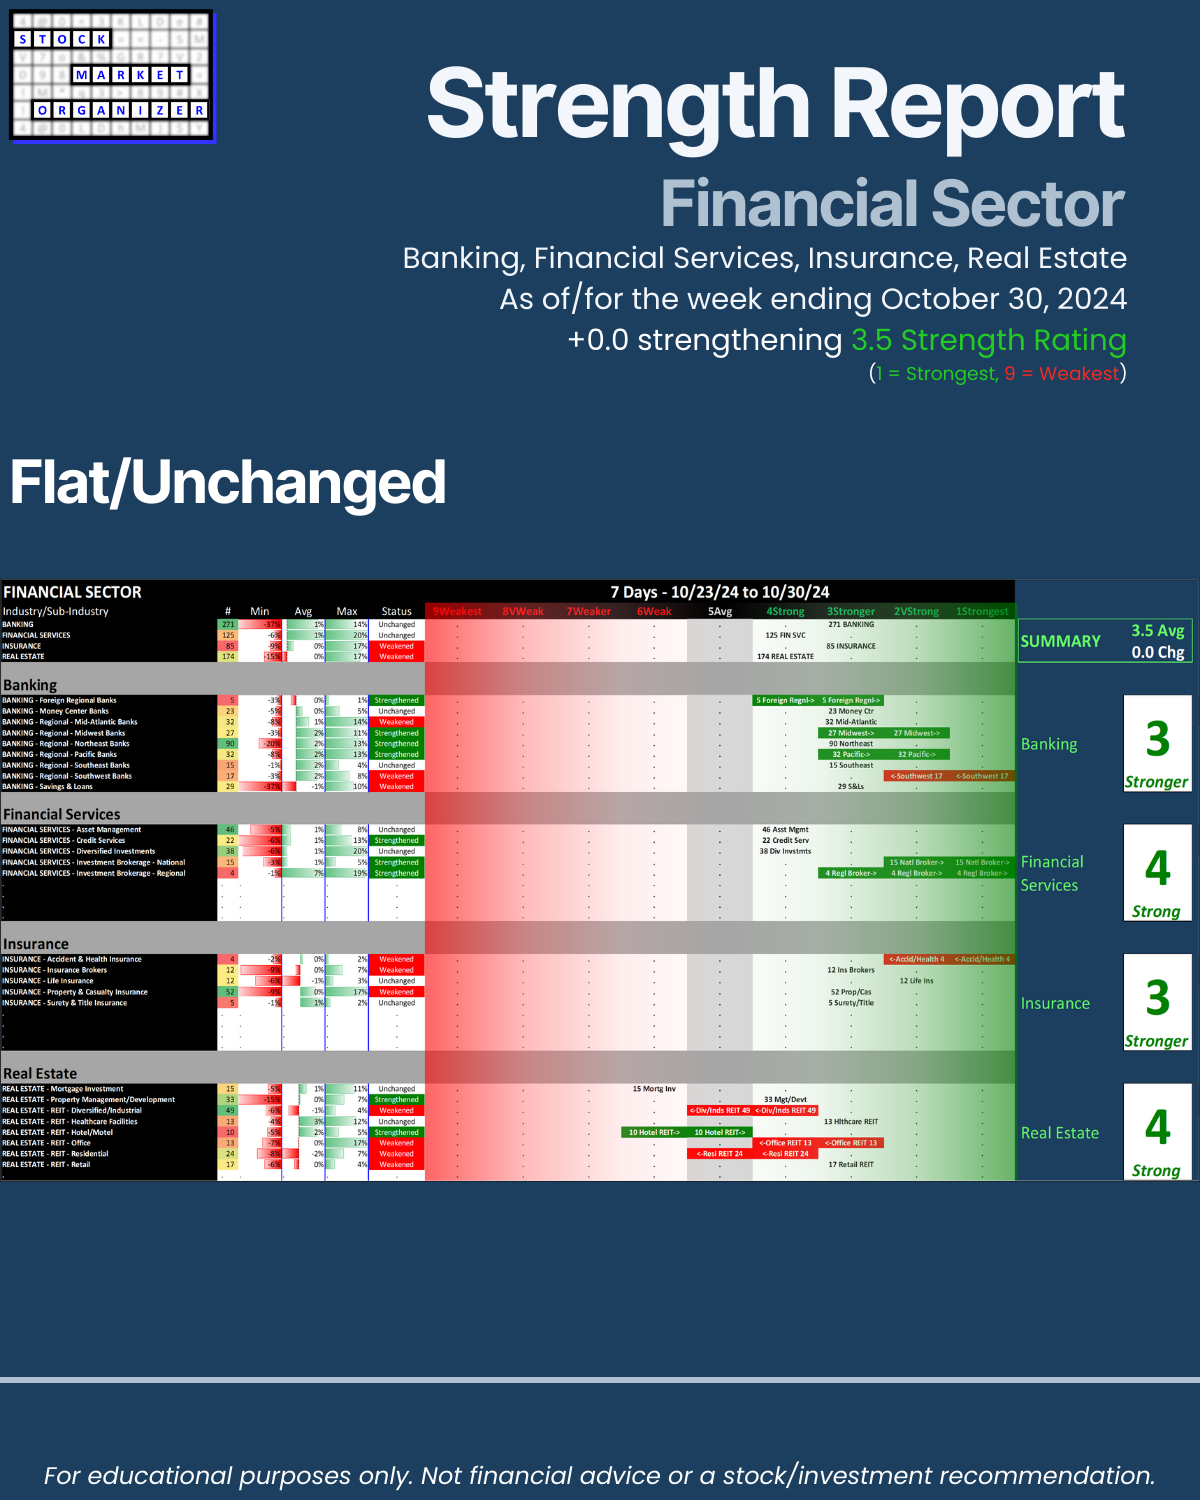
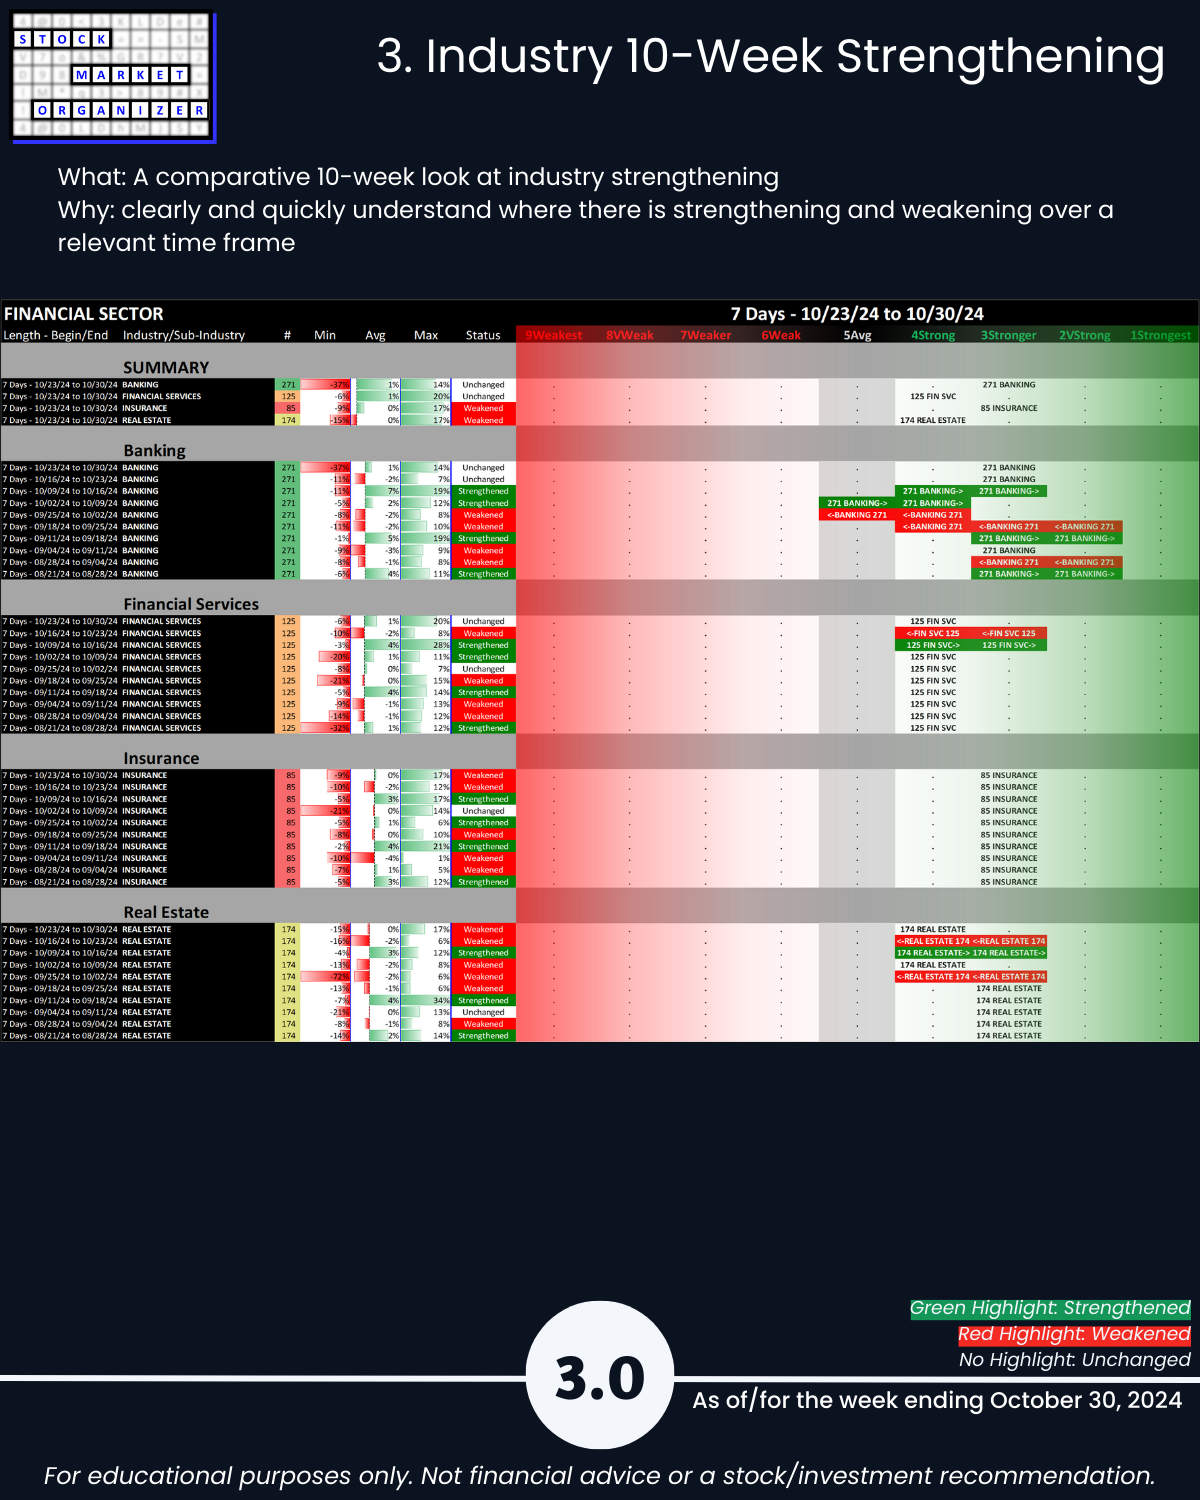
Banking, Financial Services, Insurance, and Real Estate were flat this week but overall are doing well with a 3.5 composite rating, halfway between 3Stronger and 4Strong. Until data comes in that states otherwise, the financial sector is the home of strength and potential long trades.
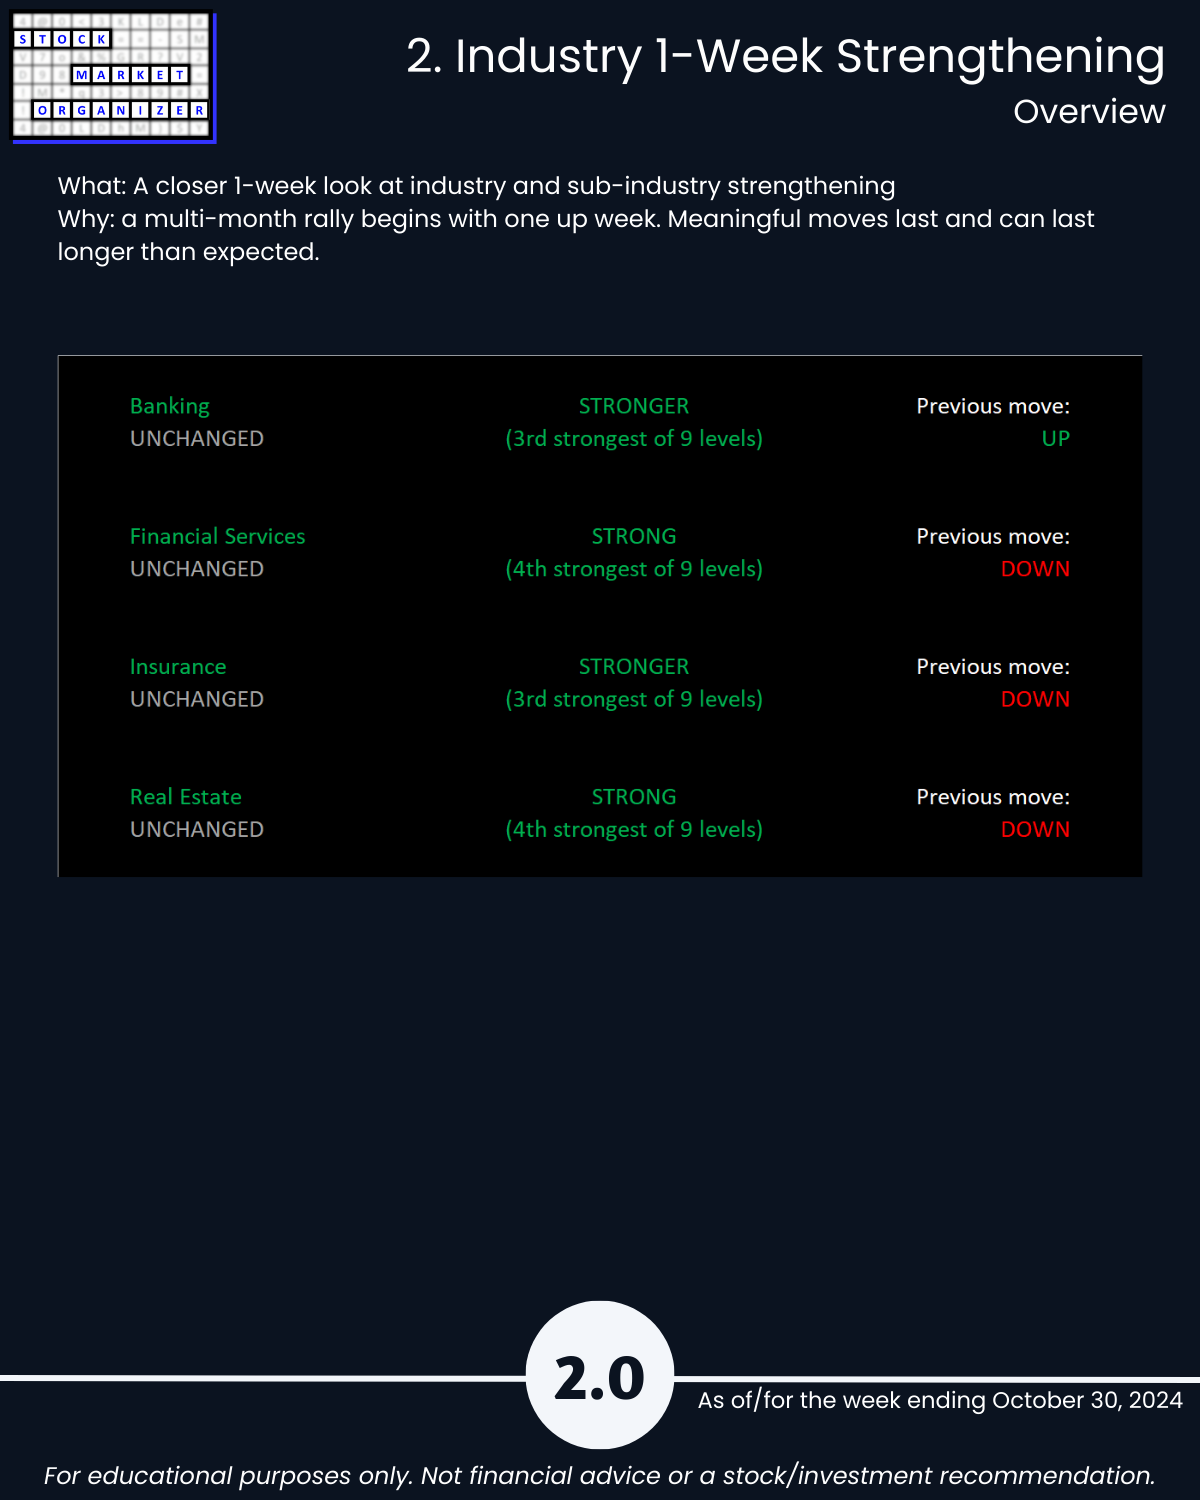
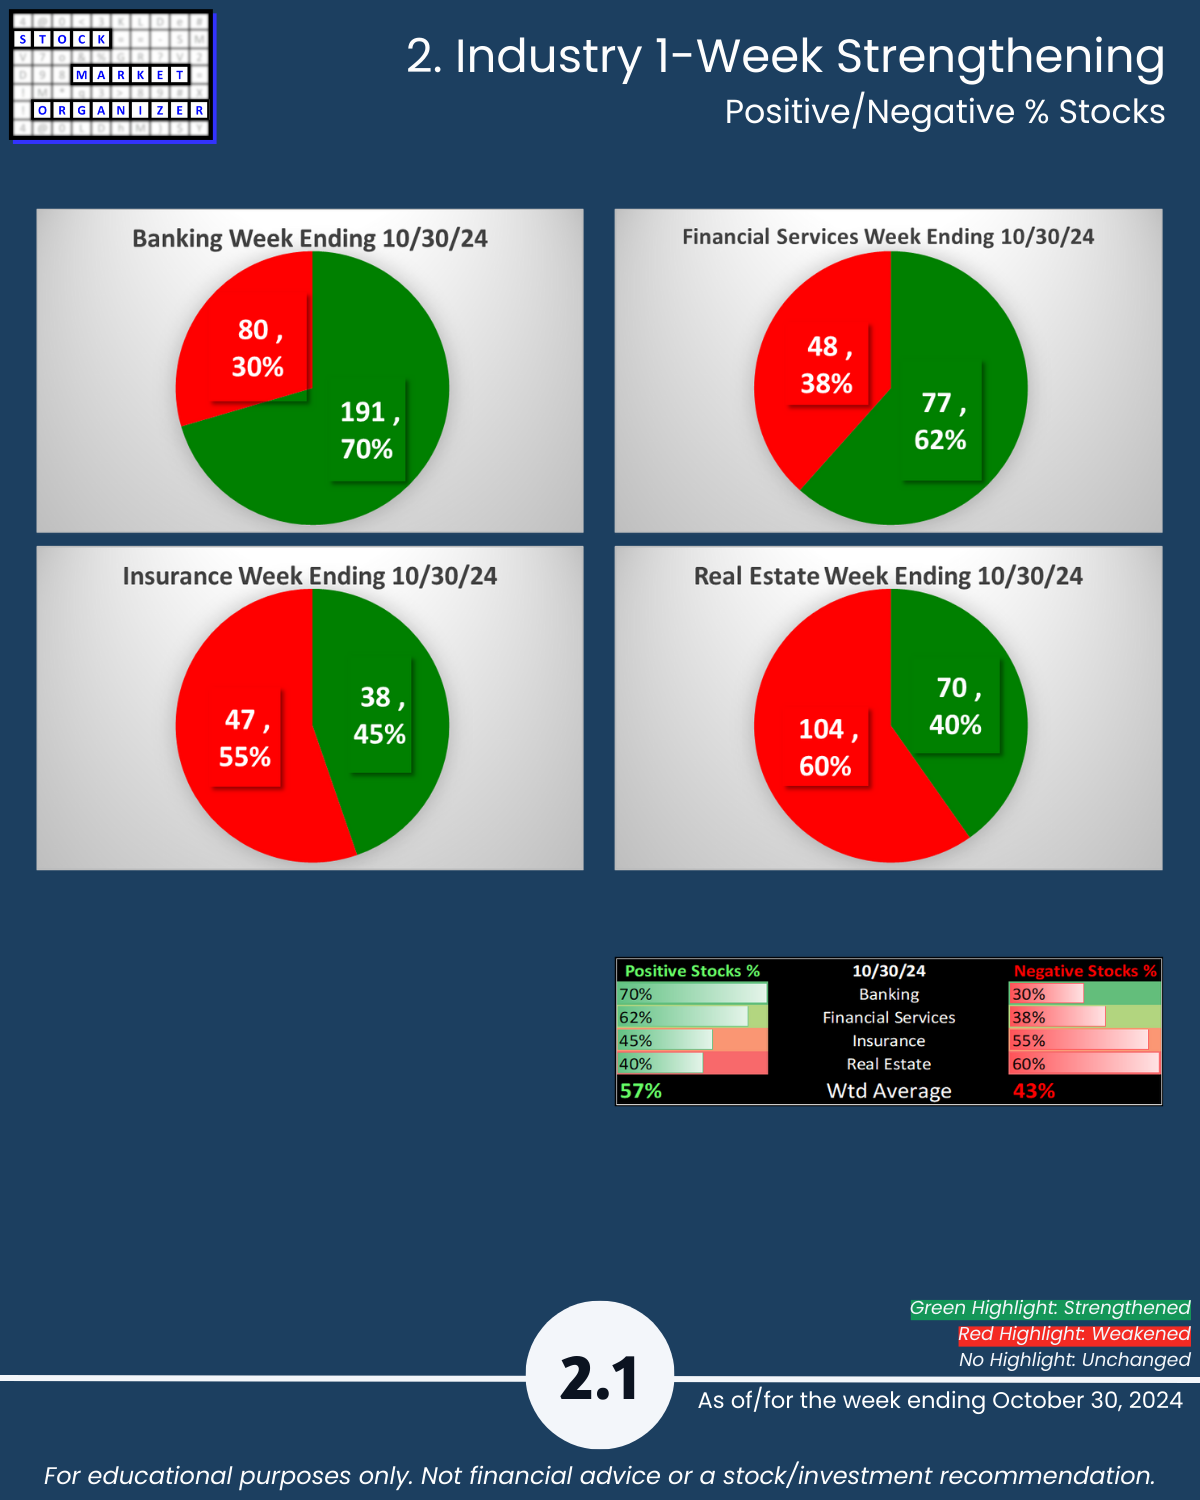
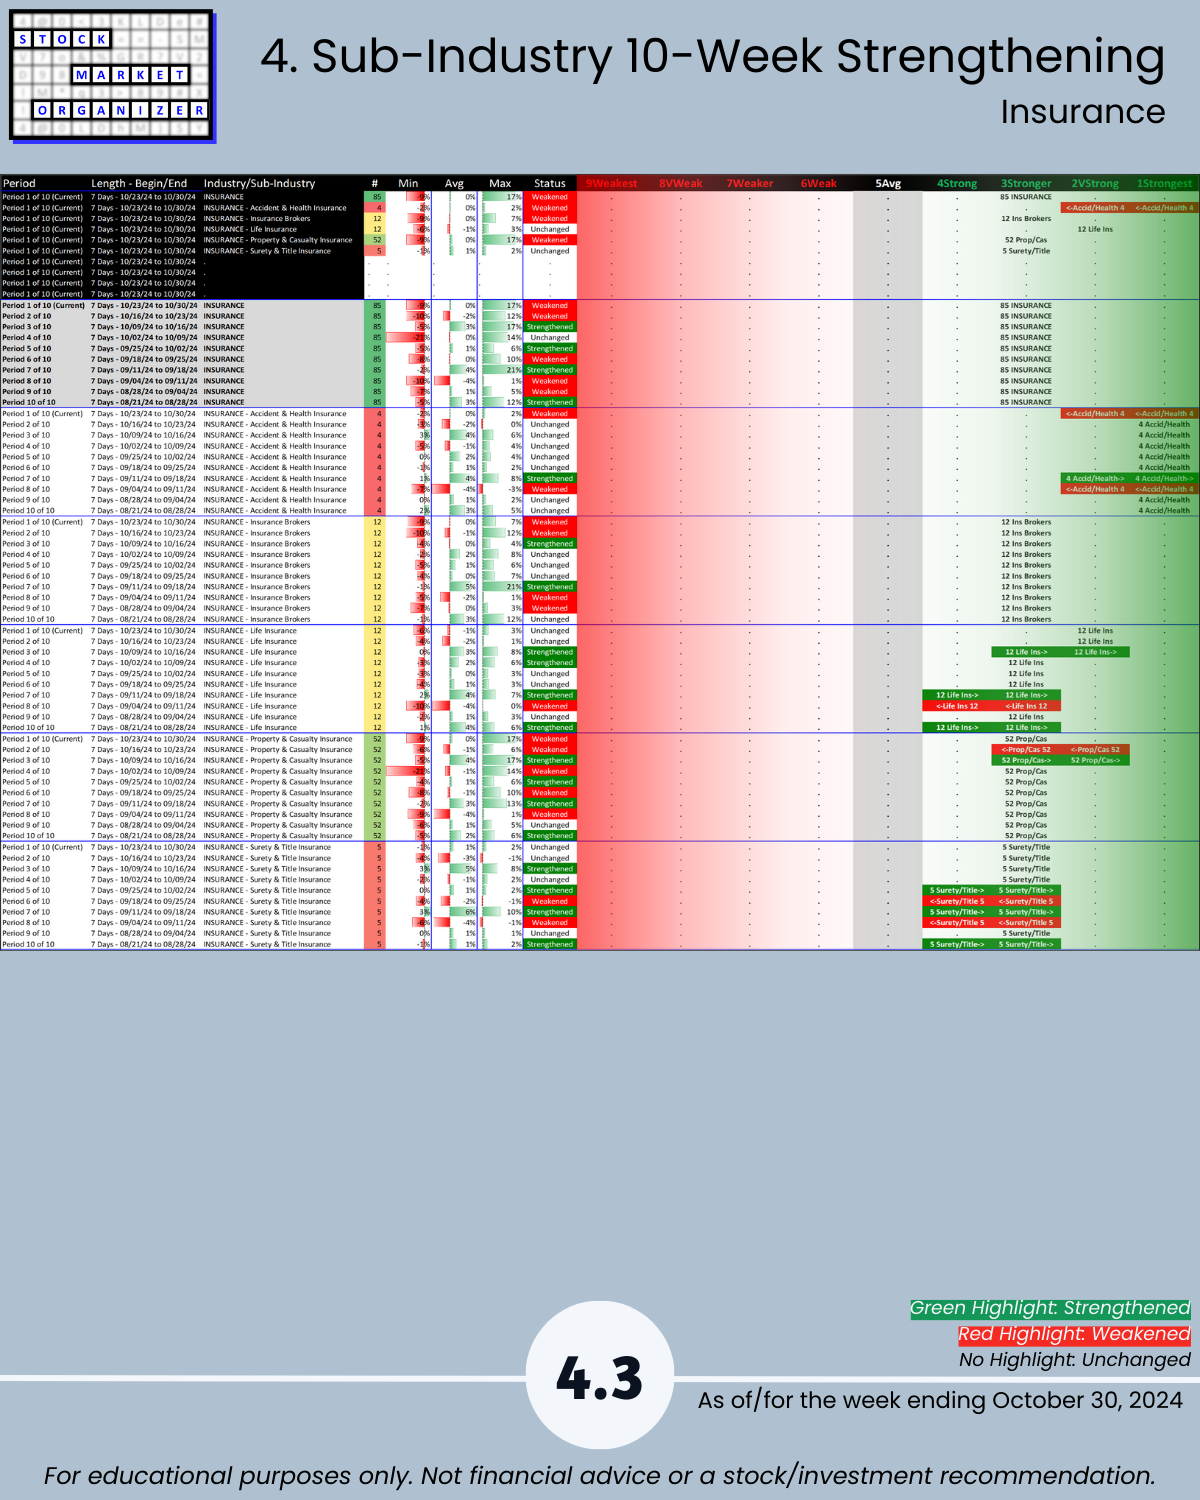
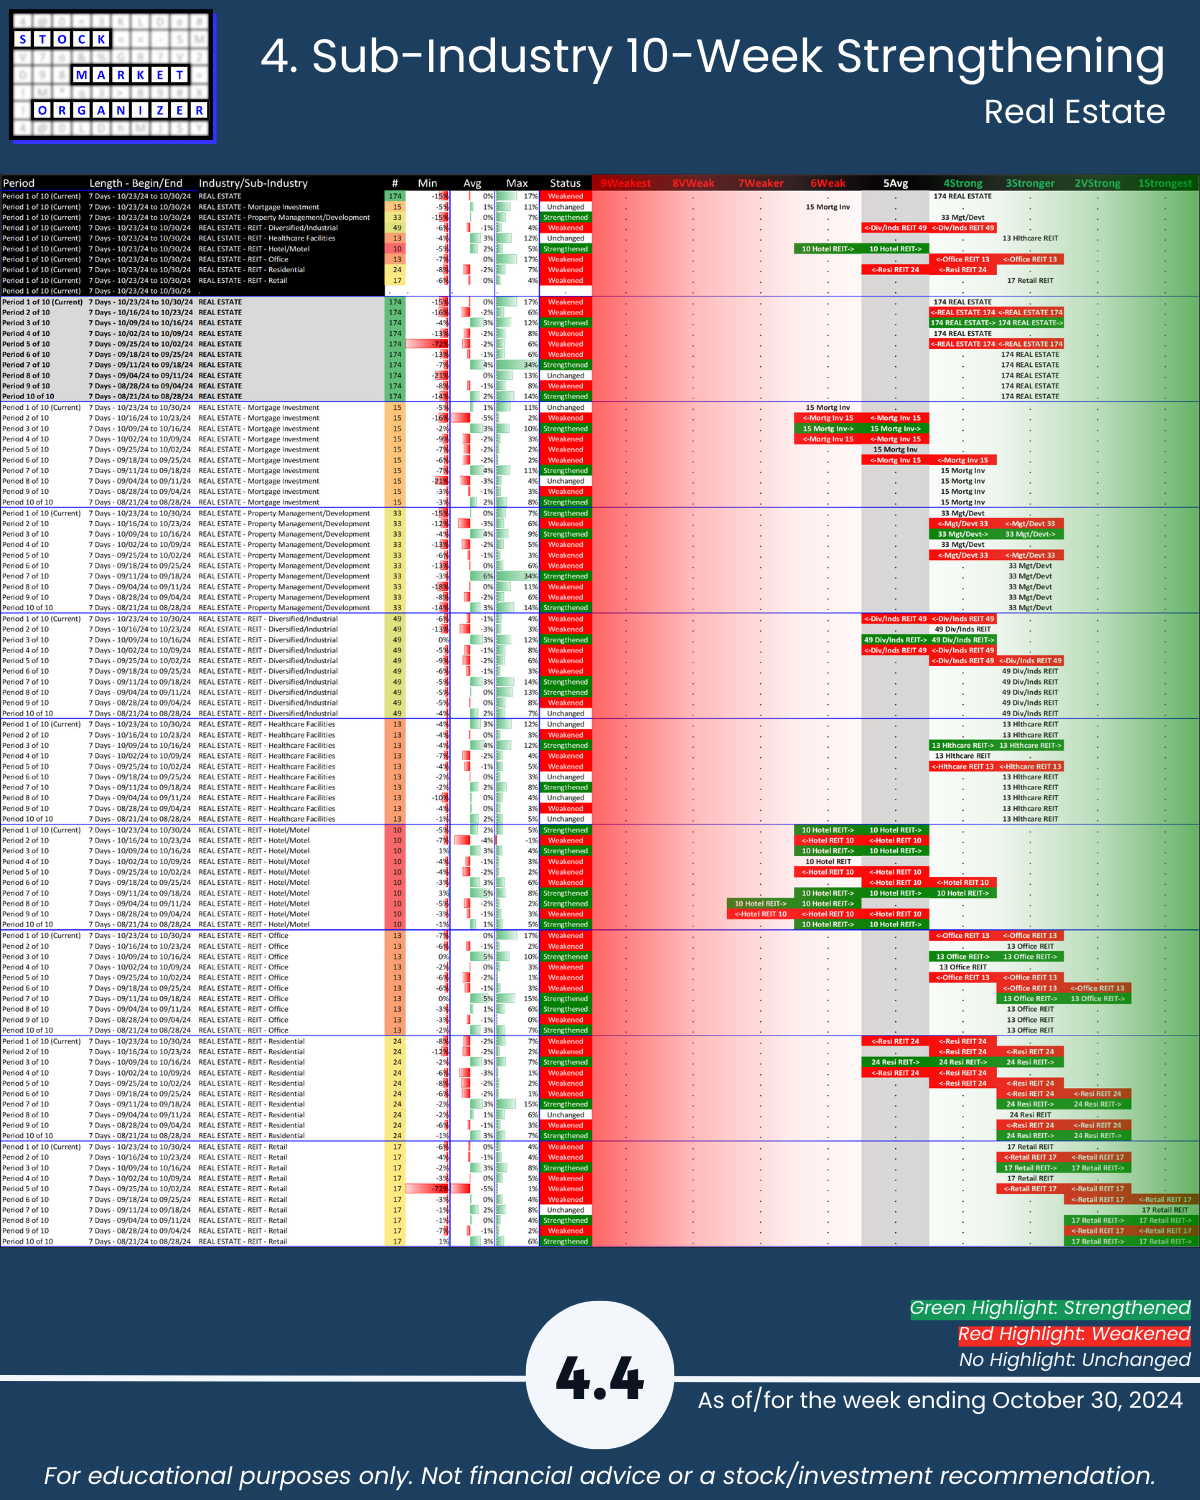
For the week ending Wednesday, October 30, 2024, all four industries were unchanged in terms of strength rating, though both Insurance and Real Estate did weaken (just not enough to affect the industry strength rating).
Strengthening/Weakening With/Without Strength Rating Changes
Note in the graphic that it is possible for an industry to NOT change strength rating yet still "strengthen" or "weaken" for the week. The reason for this is that underneath the surface there can be movement that is directional but not considered material enough to change the strength rating. Taken in the aggregate over the sub-industries that make up industries and then sectors, this can provide helpful insight into the underlying currents at each level.
Difference This vs. ETFs Analysis
Note this analysis is the same as that used for the SPDR ETFs (here's the most recent example from yesterday) but the two main differences are
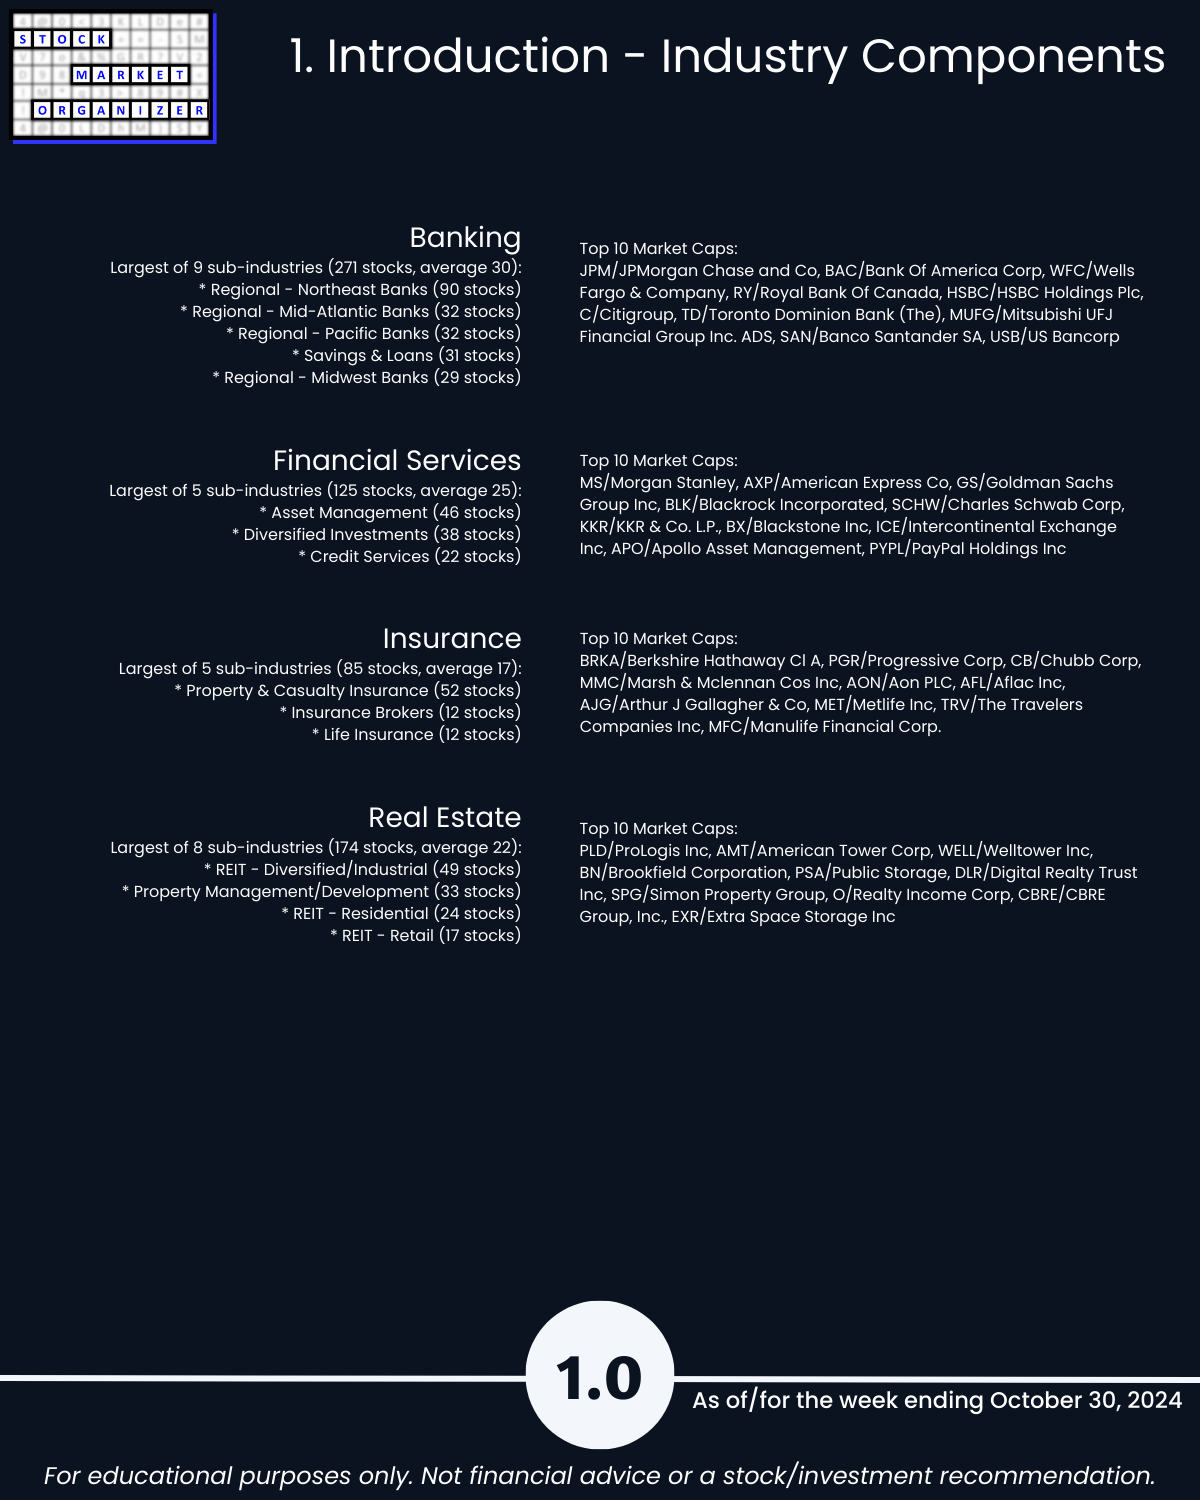
1. Universe of stocks. The ETFs are the largest capitalization stocks, 500 of them in the 11 sector ETFs. In this analysis, there are approximately 2,700 stocks.
2. Sub-categorization below the market level. The ETF analysis with 500 stocks is limited to sector strengthening and weakening. This analysis with +/-2,700 stocks can be and is segregated into 29 industry groups and in turn 189 sub-industry groups.
There is a Financials ETF (symbol XLF) which is separate from the Real Estate ETF (symbol XLRE). The Financials sector in this analysis includes Real Estate with Banking, Financial Services, and Insurance.
Per yesterday's ETF strength analysis, XLF/Financials is rated 3Stronger and XLRE/Real Estate is rated 4Strong. This matches the ratings from today's analysis which covers more stocks.
How would I use this information?
The Market Strength Score is now negative and the Financial Sector is flat over the past week (per this analysis) while the two relevant sector ETFs (XLF/Financials and XLRE/Real Estate) weakened for the week ending yesterday.
That said, financials remain 4Strong or better - there are better shorting candidates out there, in industries and sectors that are 6Weak or lower and either flat/unchanged or weakening.
With regard to long candidates, I'd be wary of opening new longs given the overall Market Strength Score being negative and the weakness in the financial-related ETFs, XLF/Financials and XLRE/Real Estate.
In sum, I see no clarity in either direction and would be neutral given the circumstances.
There is absolutely no way of determining how long this environment will last. All one can do is find an objective way of measuring whether any given environment offers headwinds or tailwinds and then act accordingly based on these measurements.
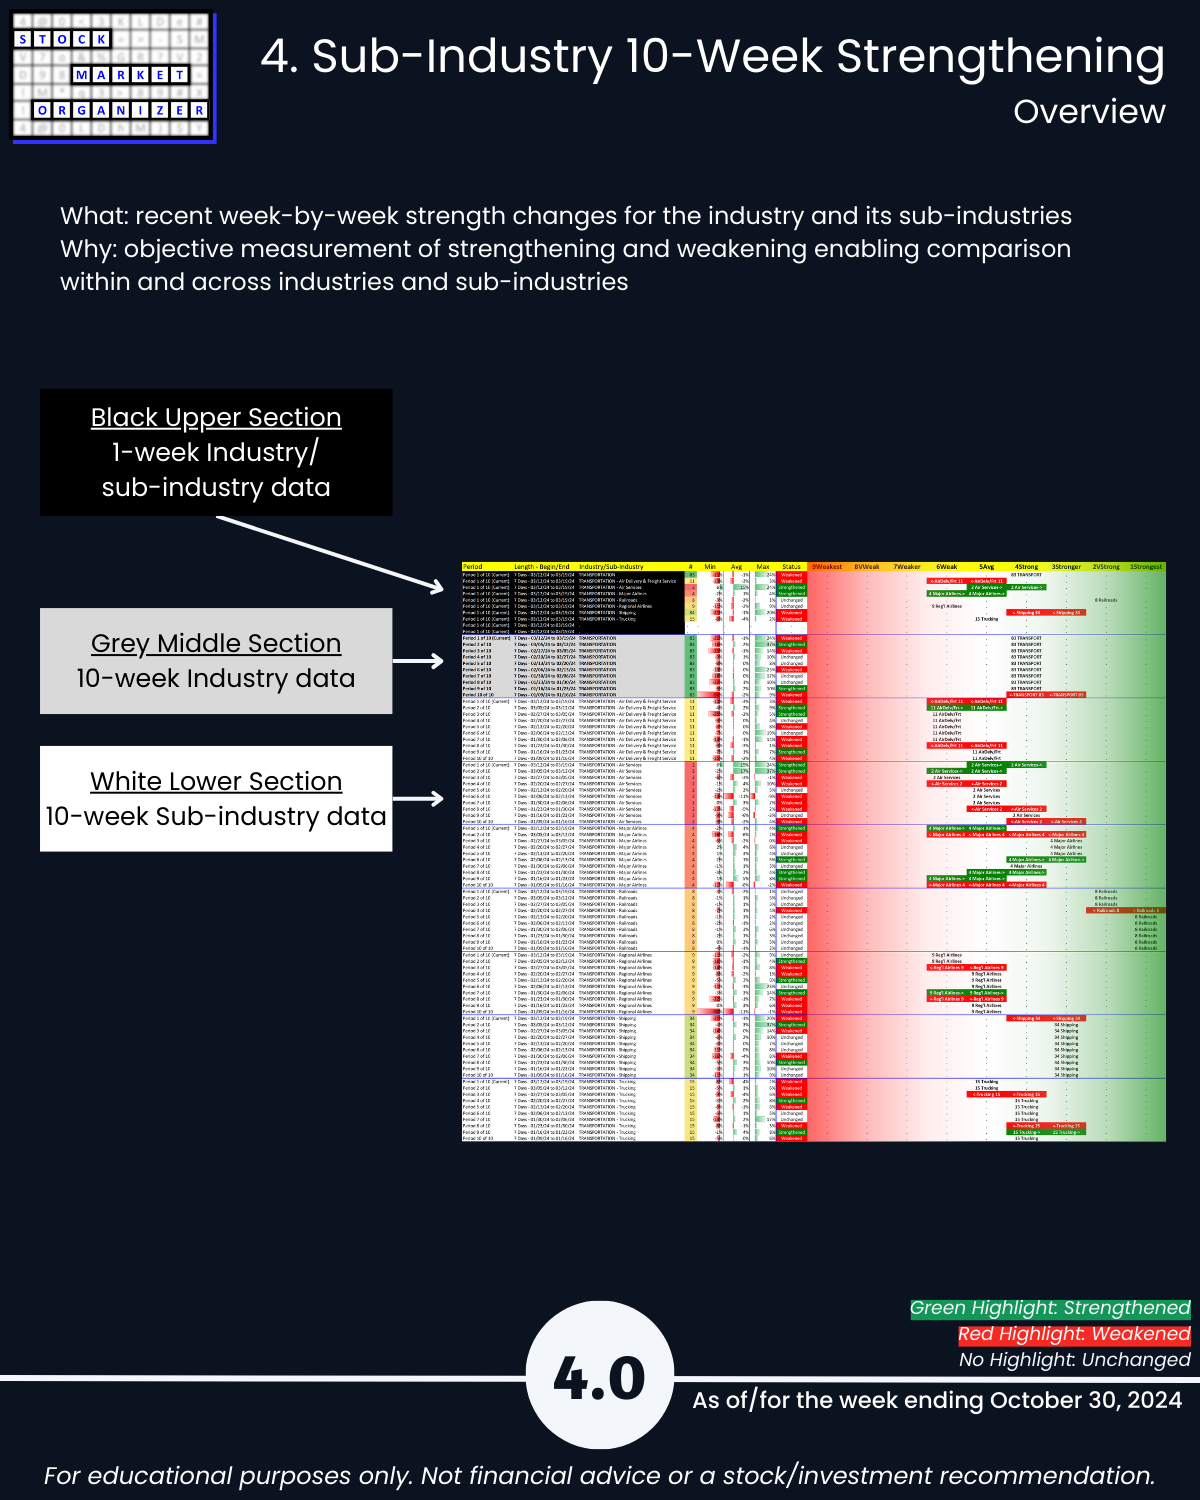
Details are below shown in a manner not available elsewhere because I created it from scratch to continually answer this question: “Where is there strengthening and weakening in the market at the stock, sub-industry, industry, and sector levels?” Combine this with the top-down Market Strength Score and Sector Risk Gauge to get a key competitive advantage of understanding strength at every level.
1. Introduction
2. Industry 1-Week Strengthening
3. Industry 10-Week Strengthening
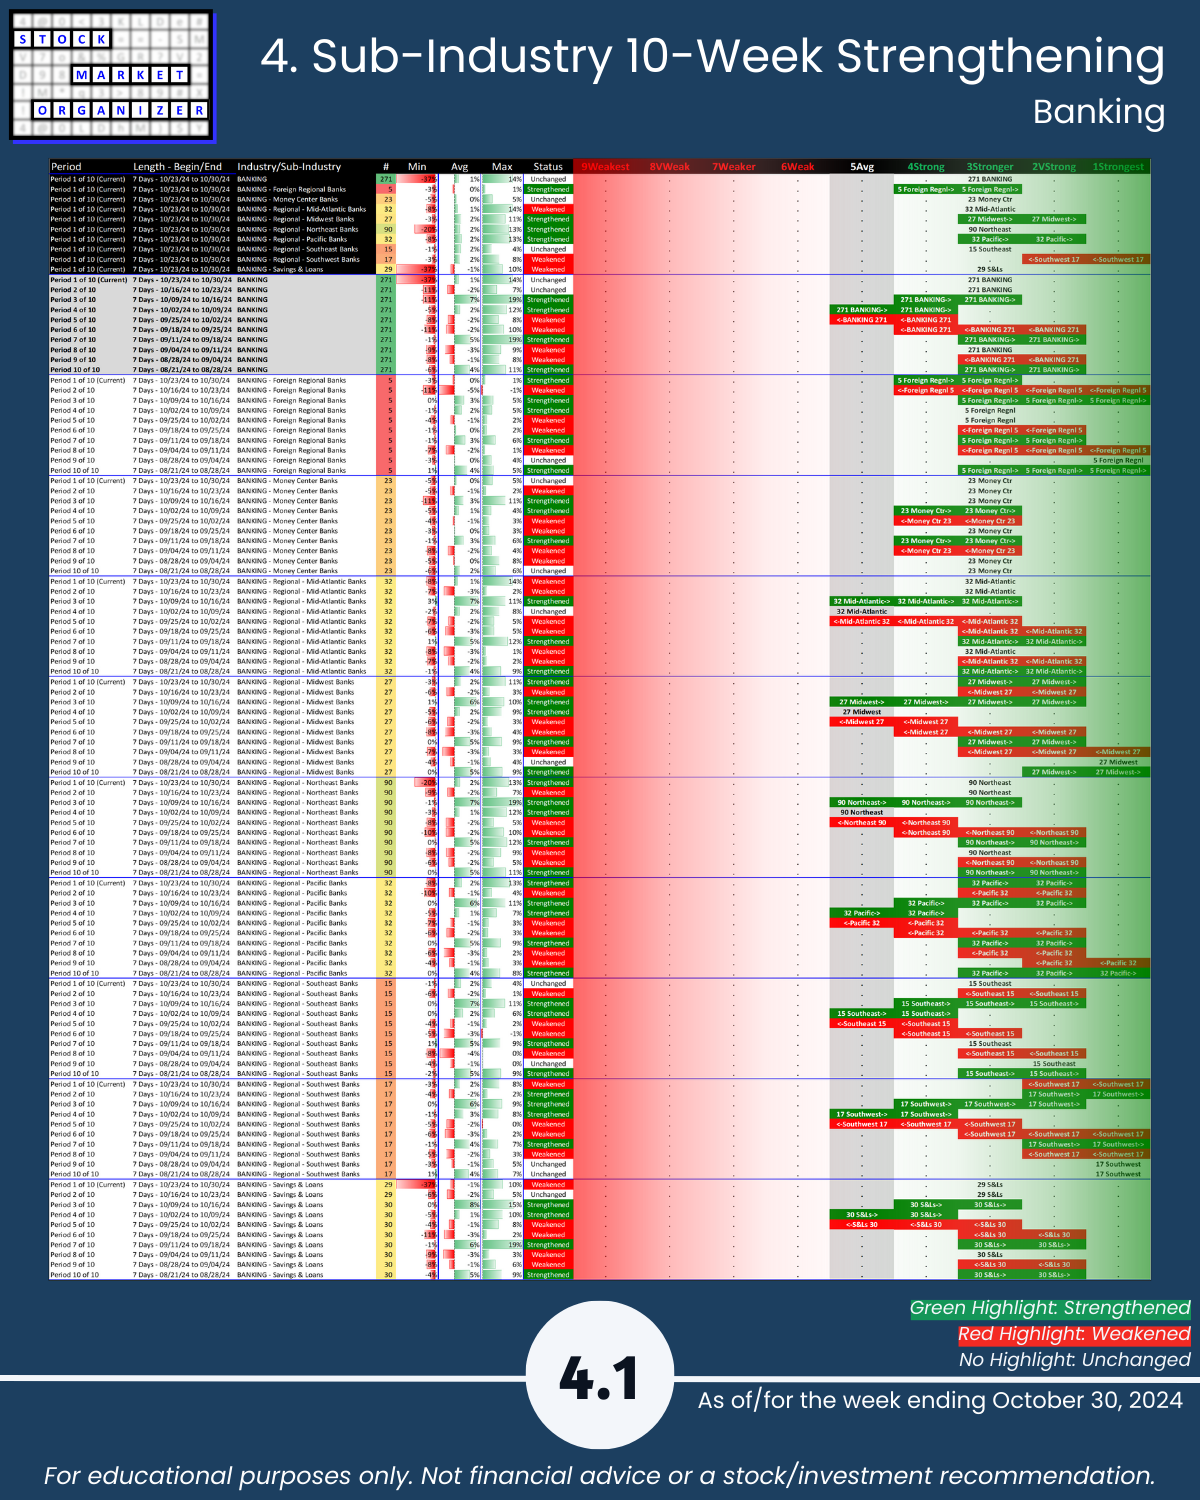
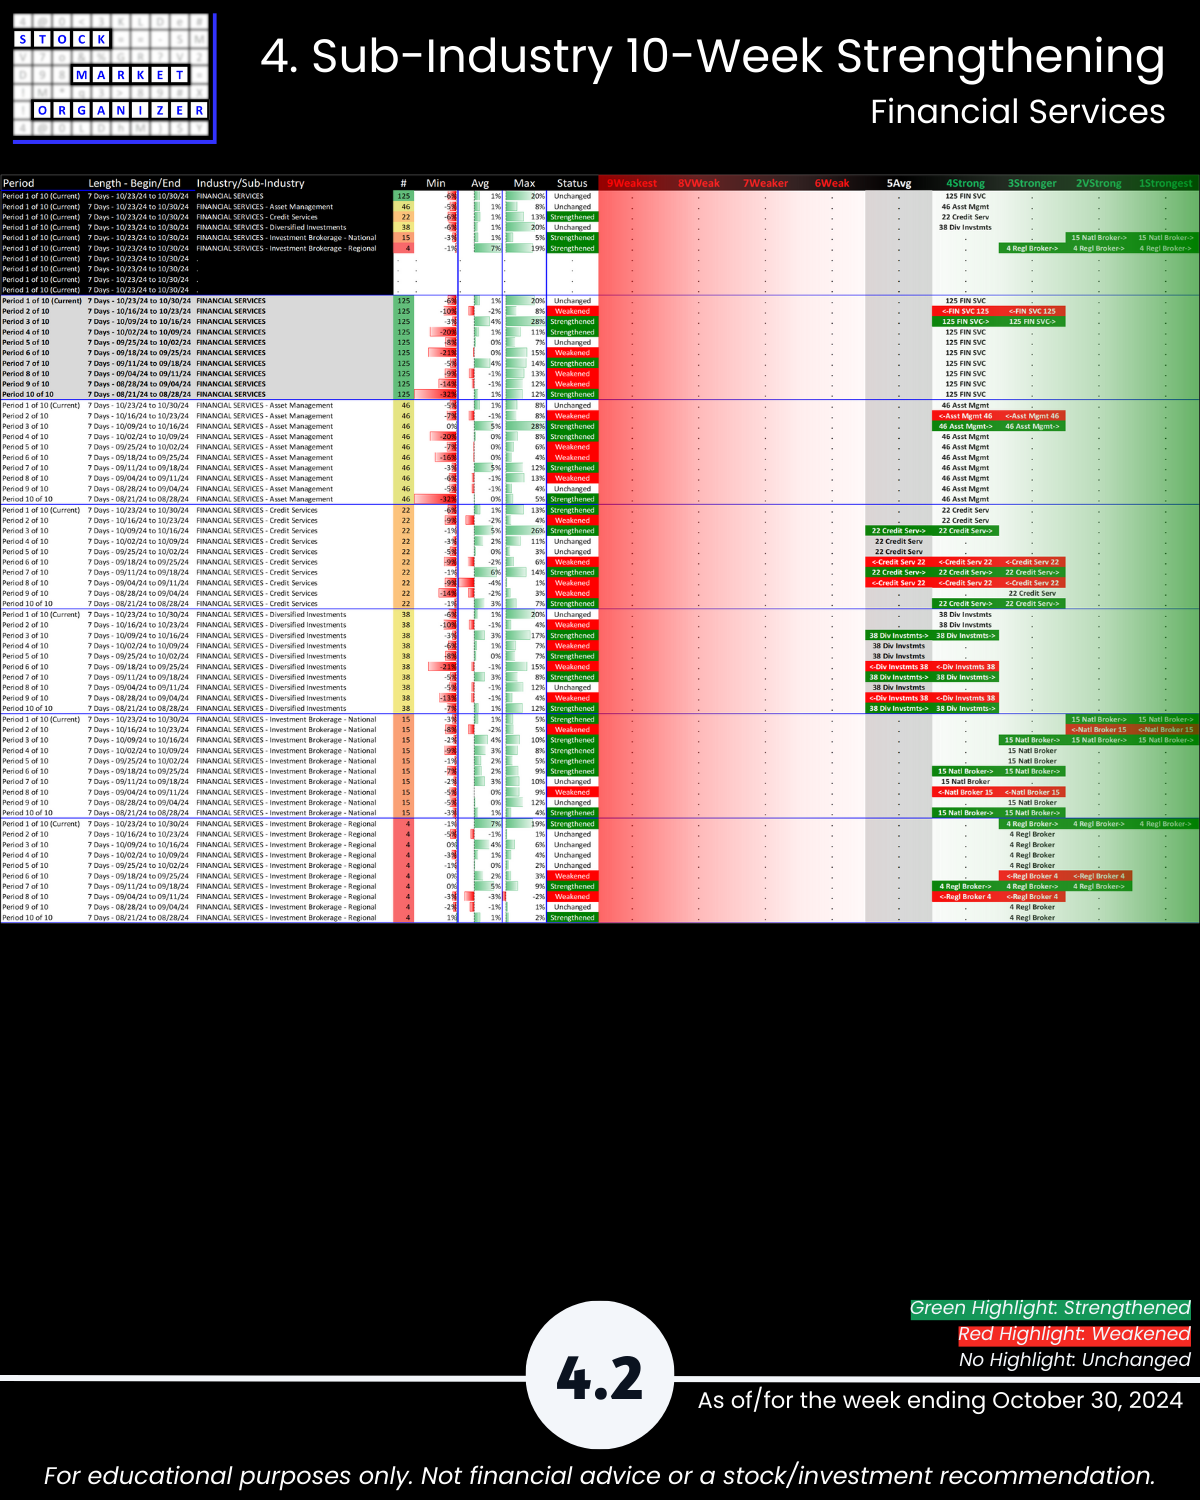
4. Sub-Industry 10-Week Strengthening
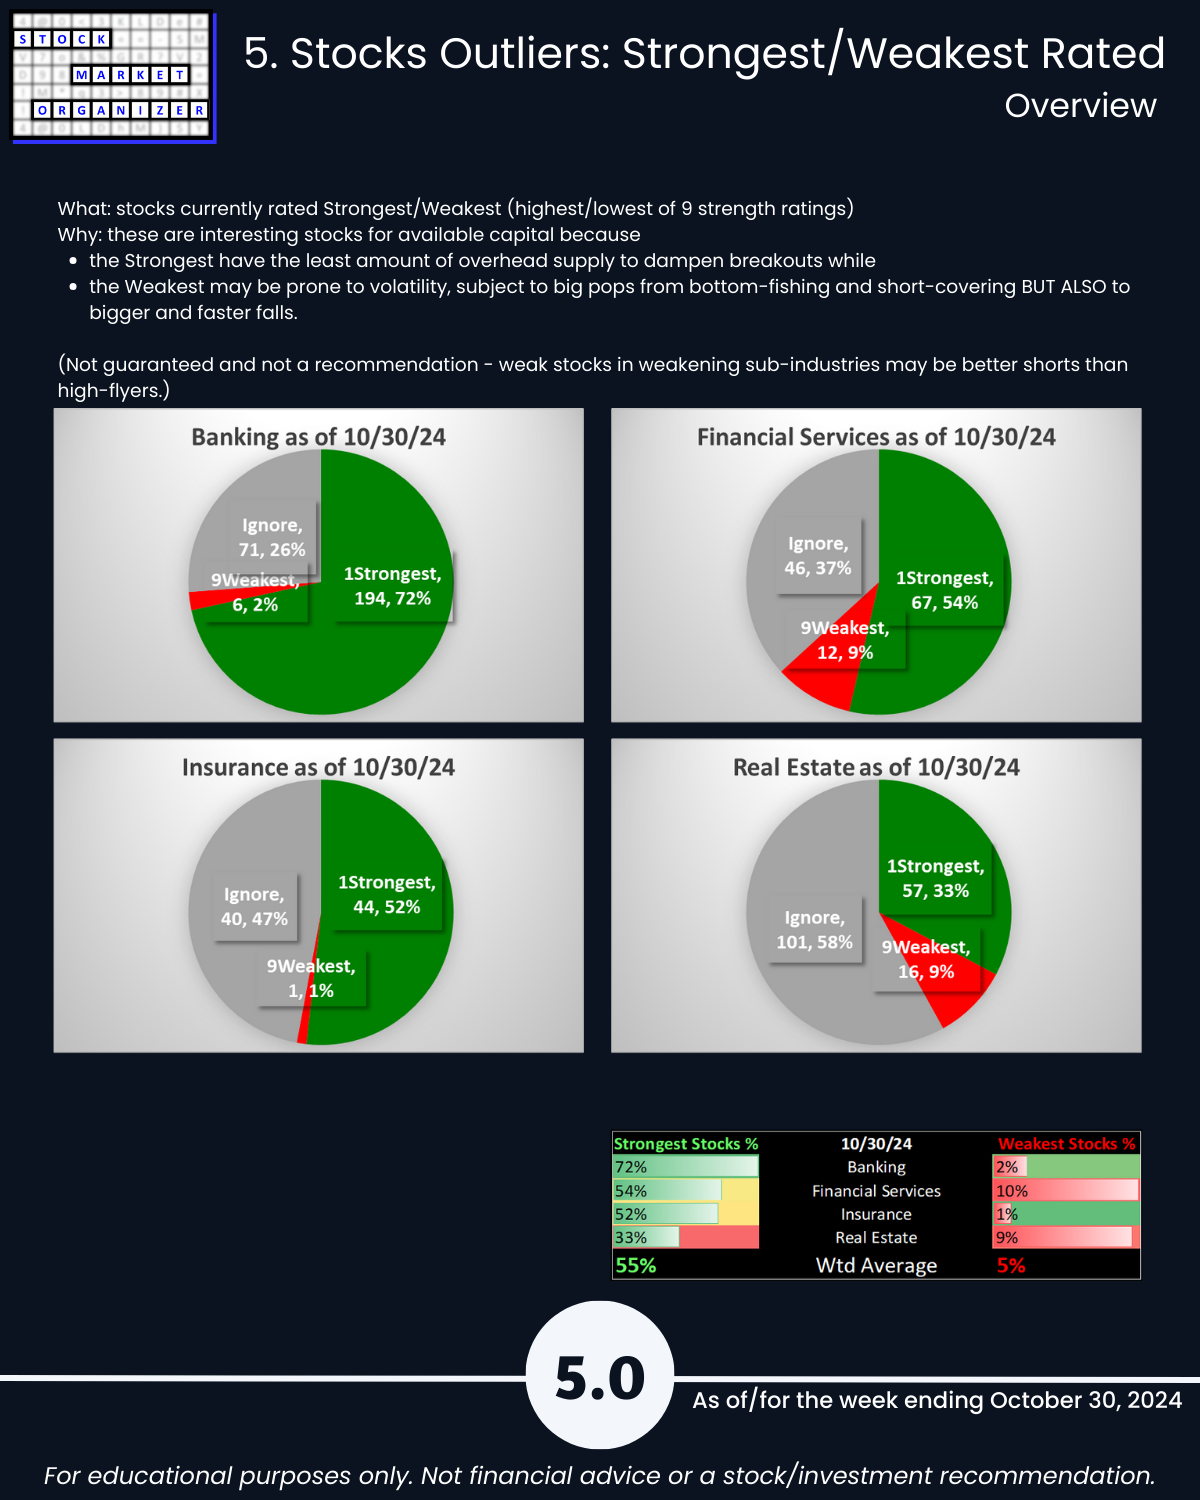
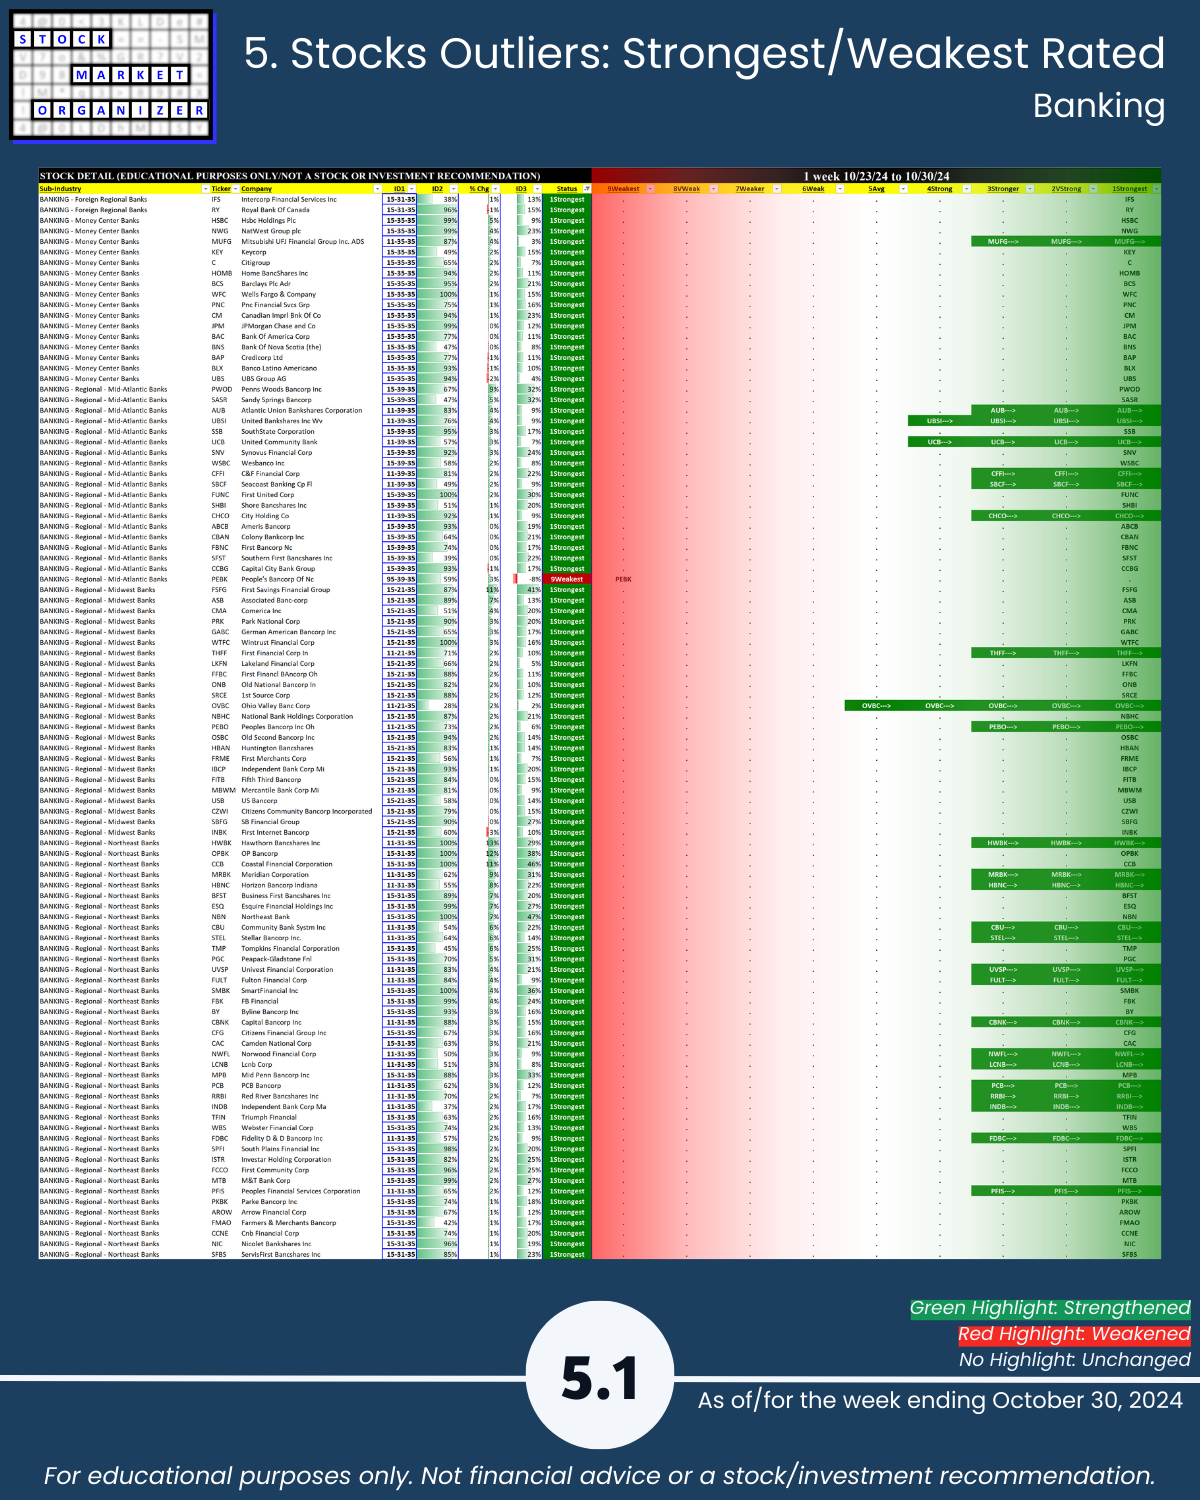
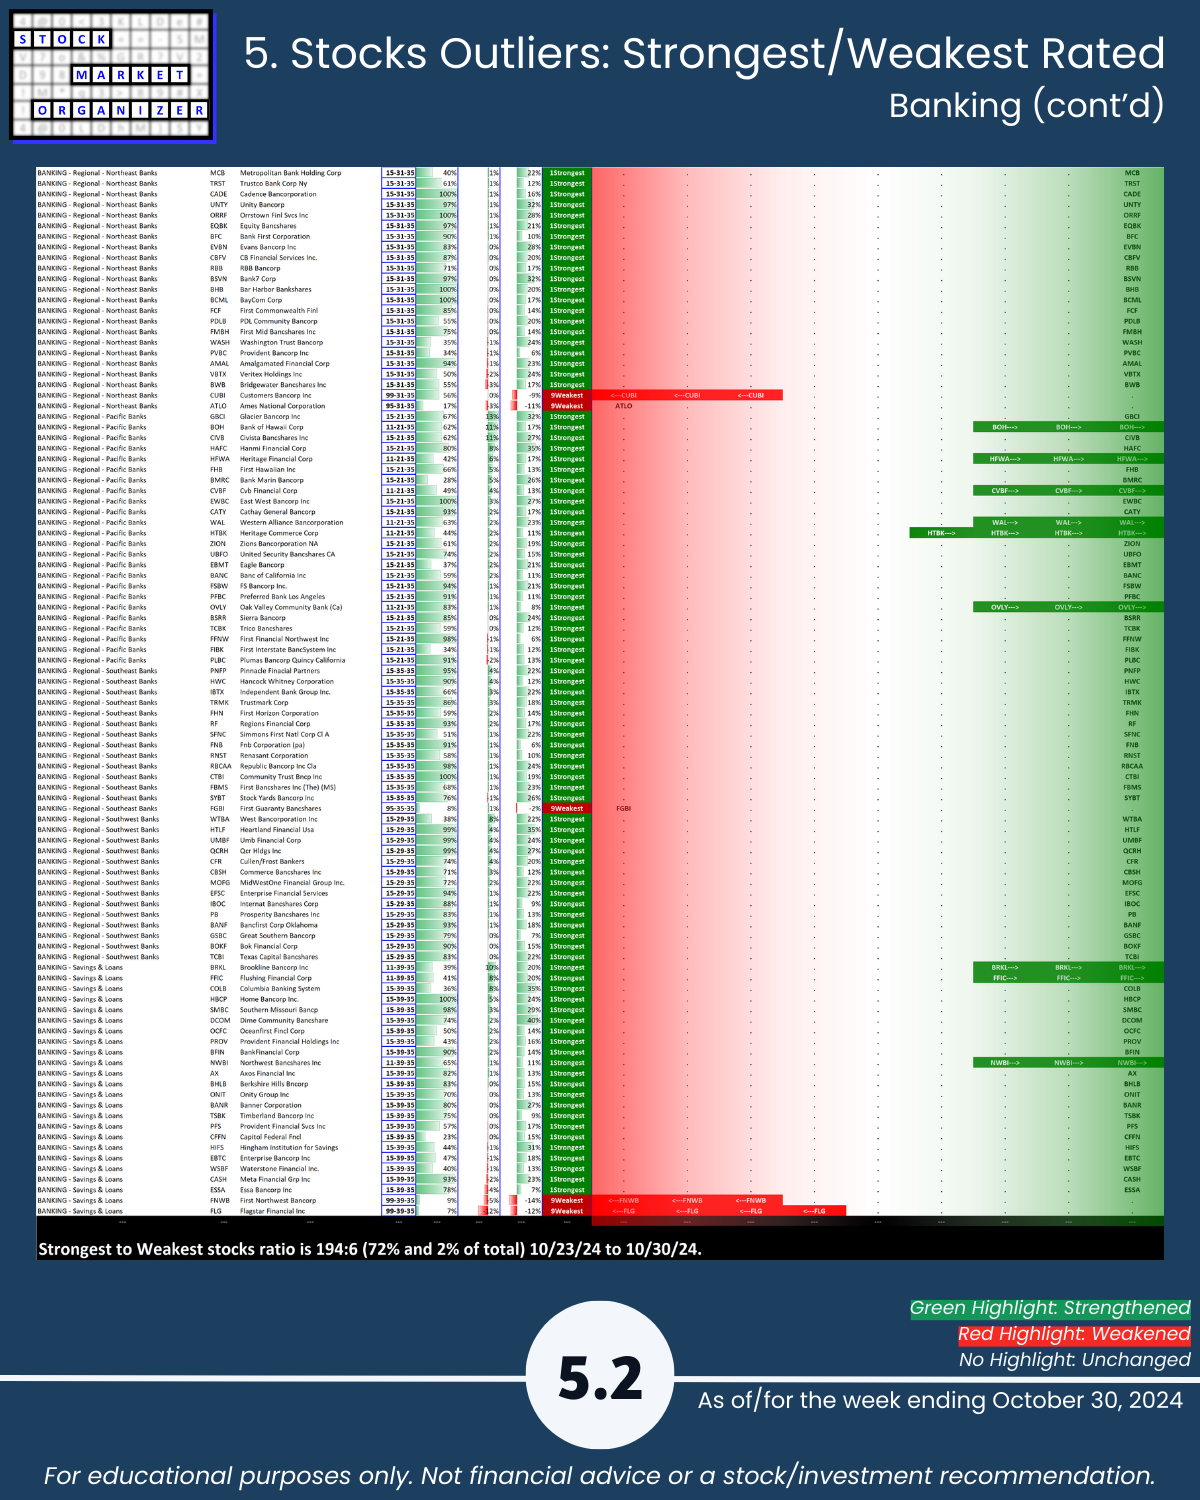
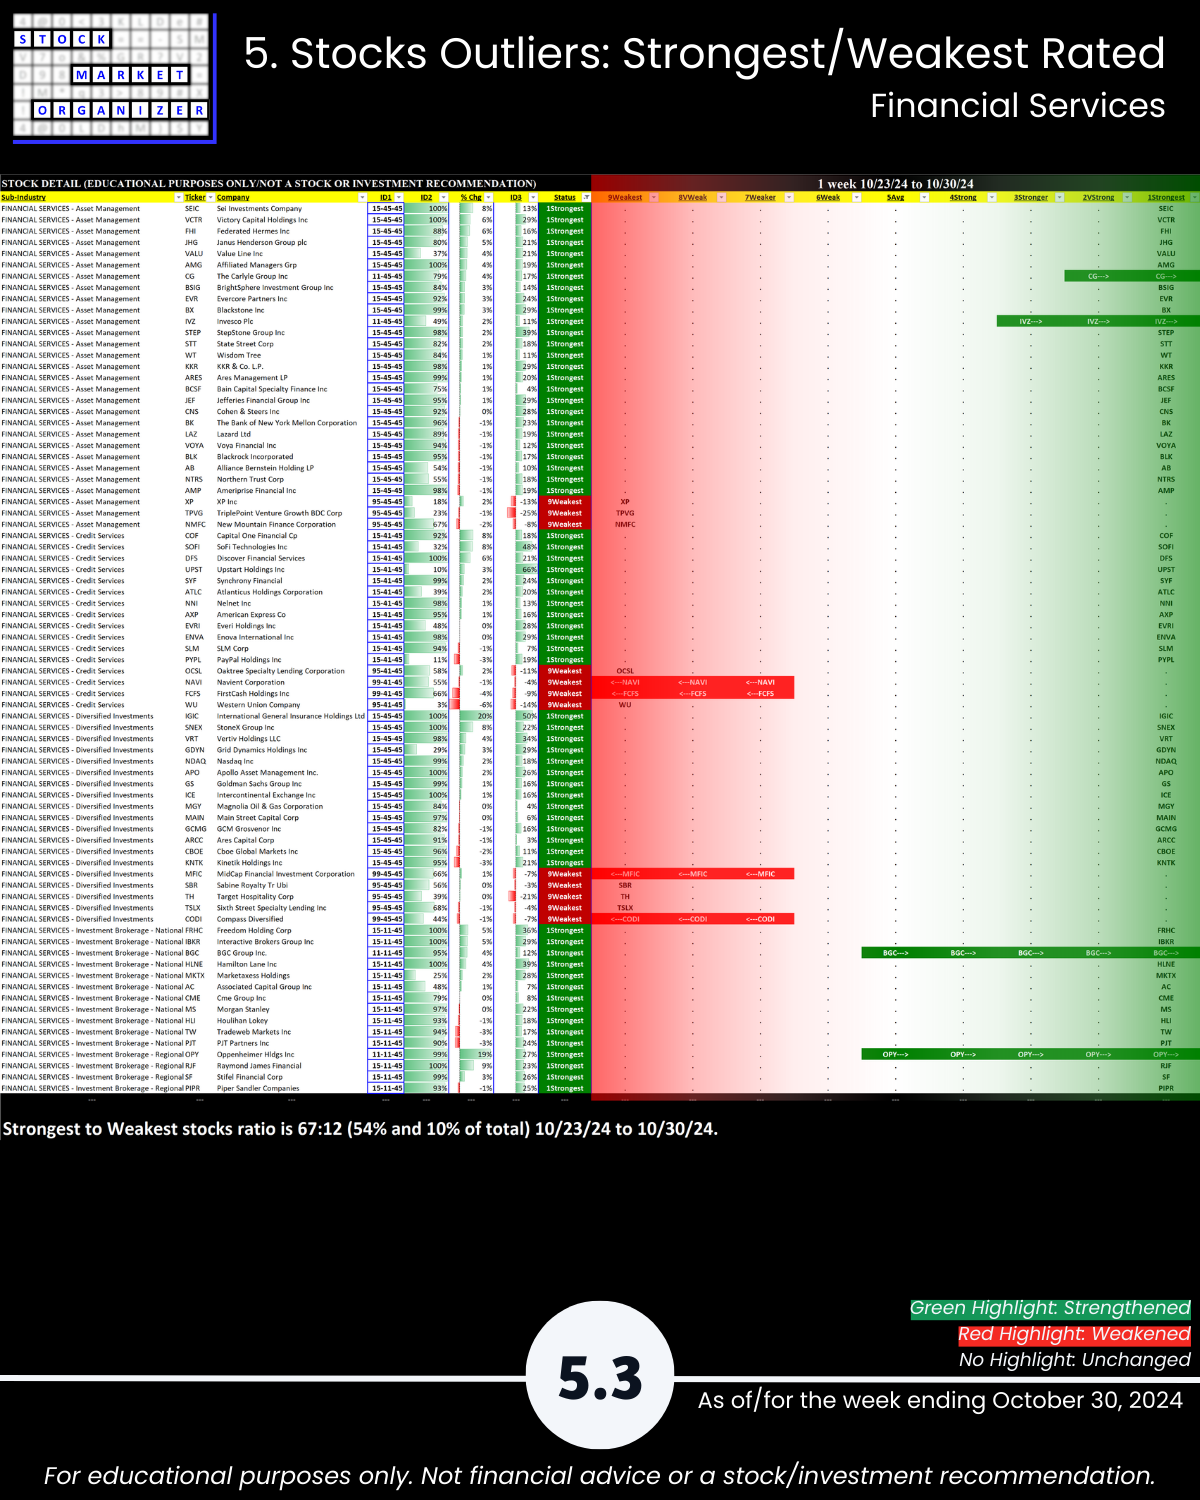
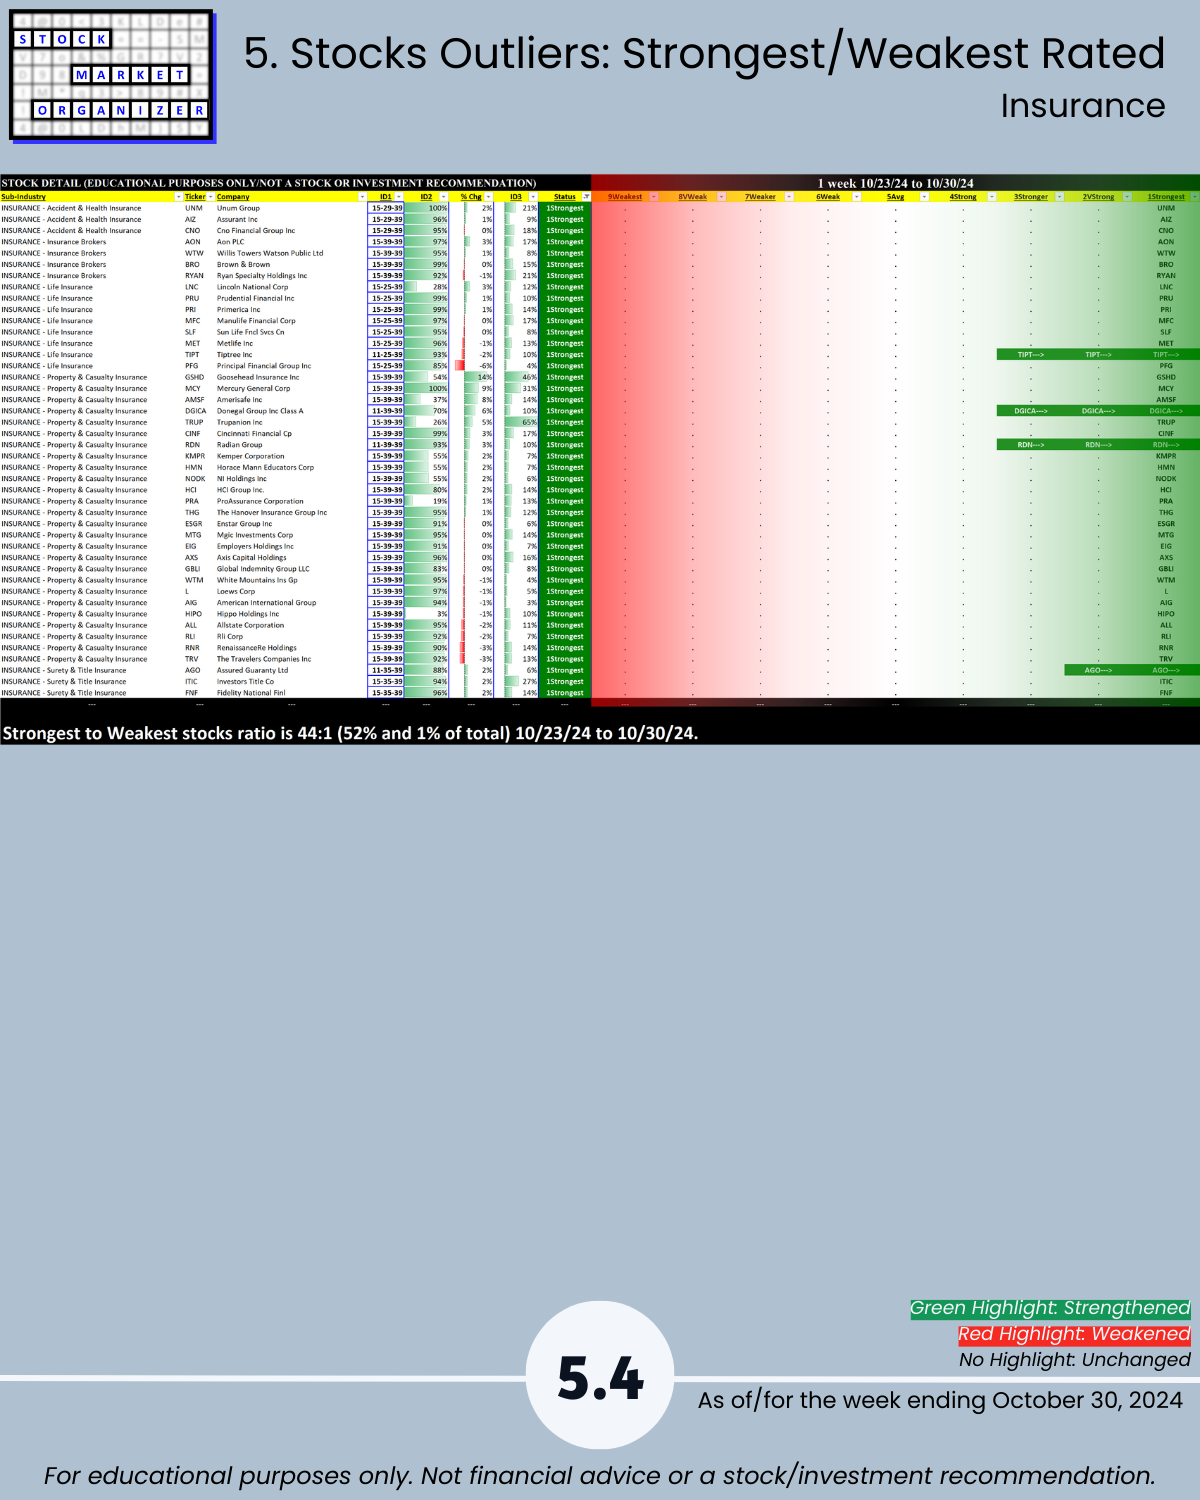
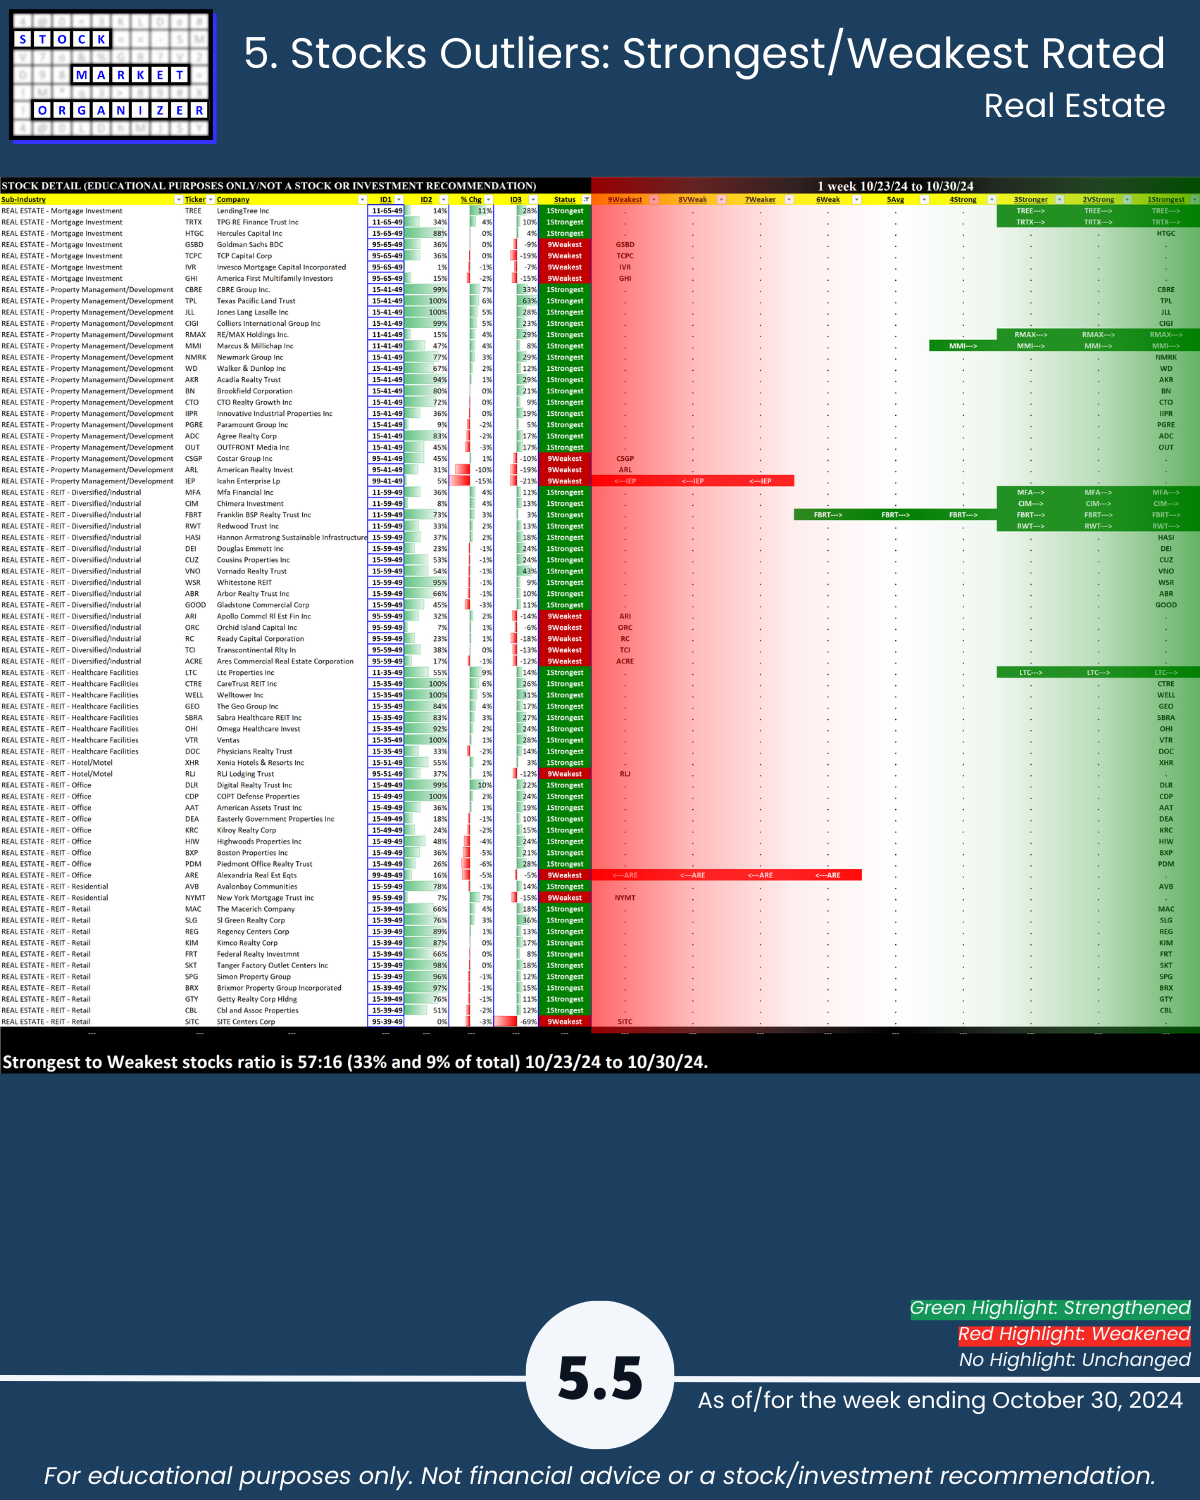
5. Stocks Outliers: Strongest/Weakest Rated
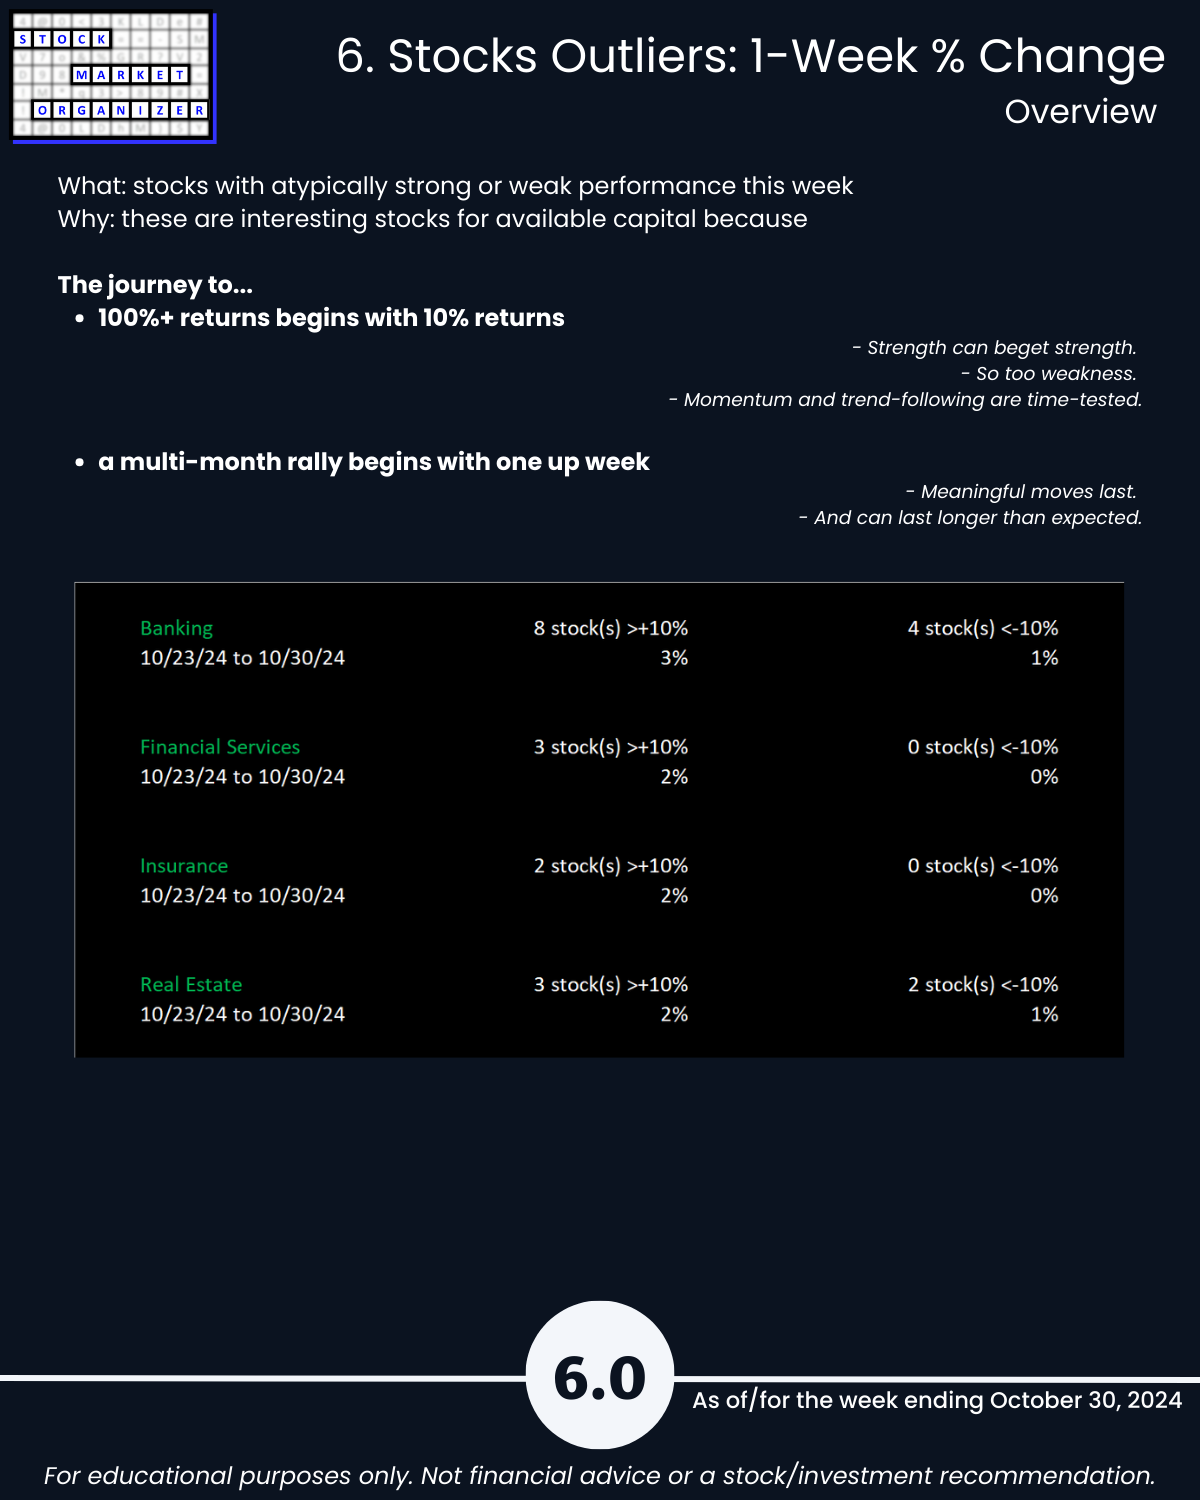
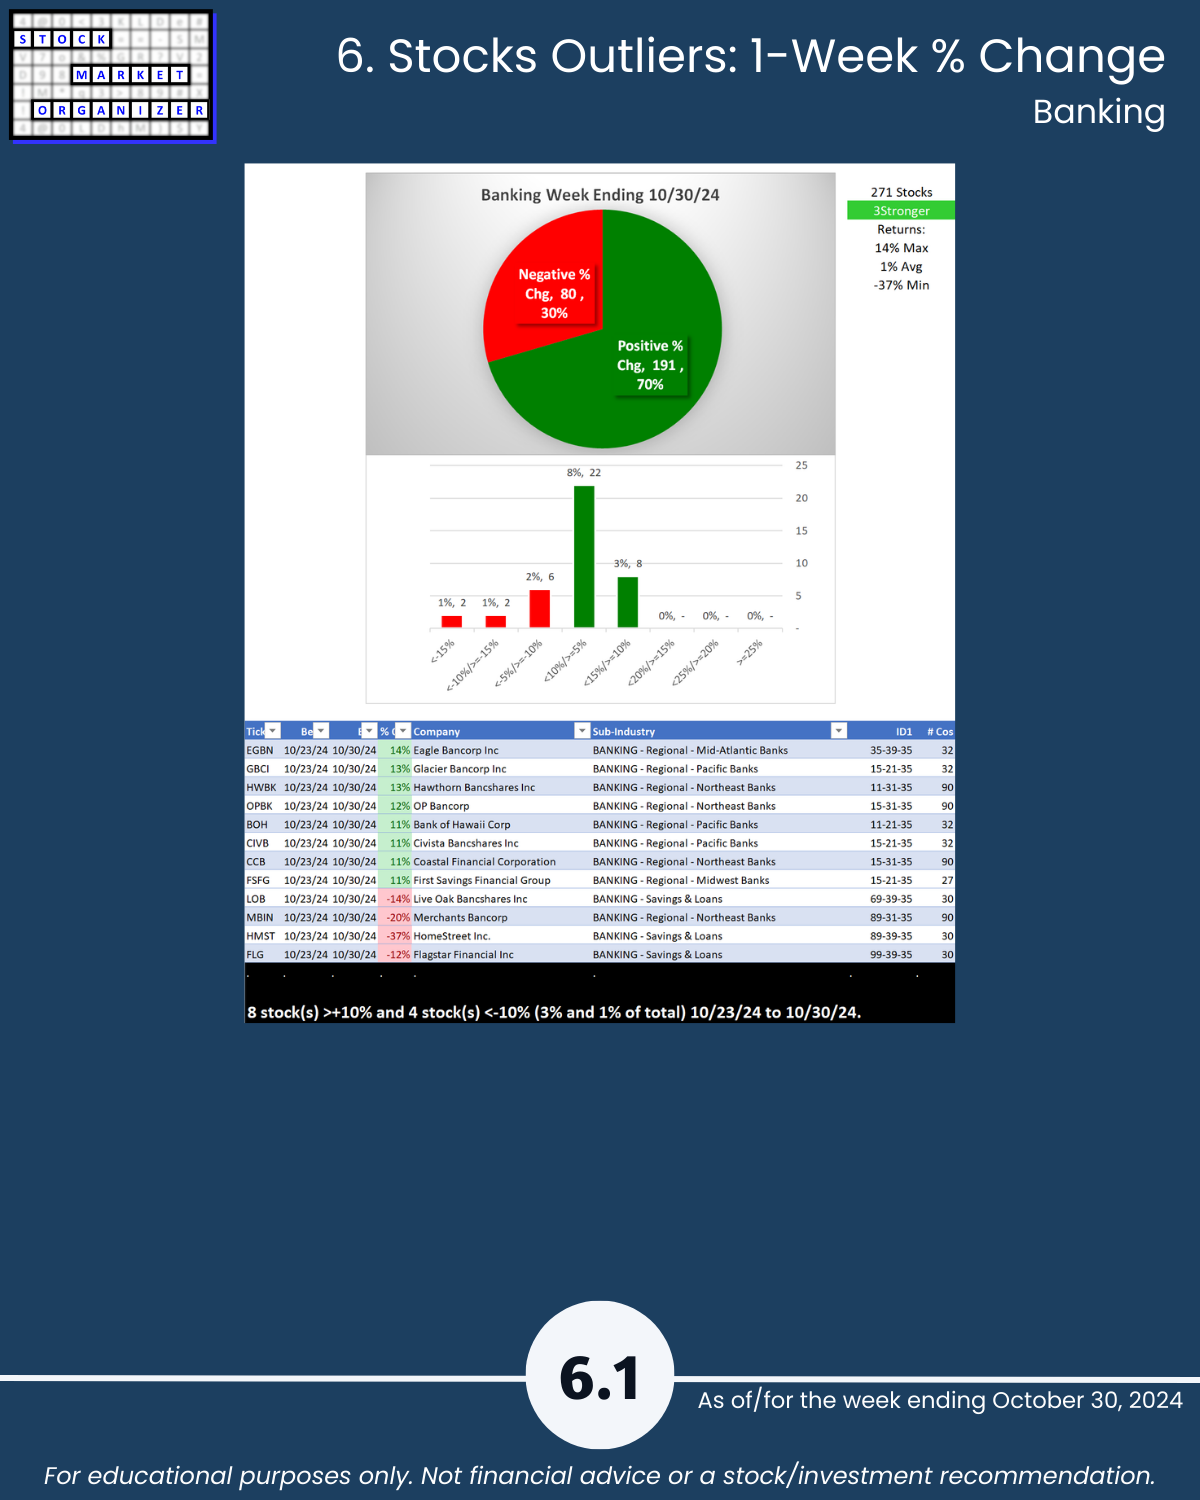
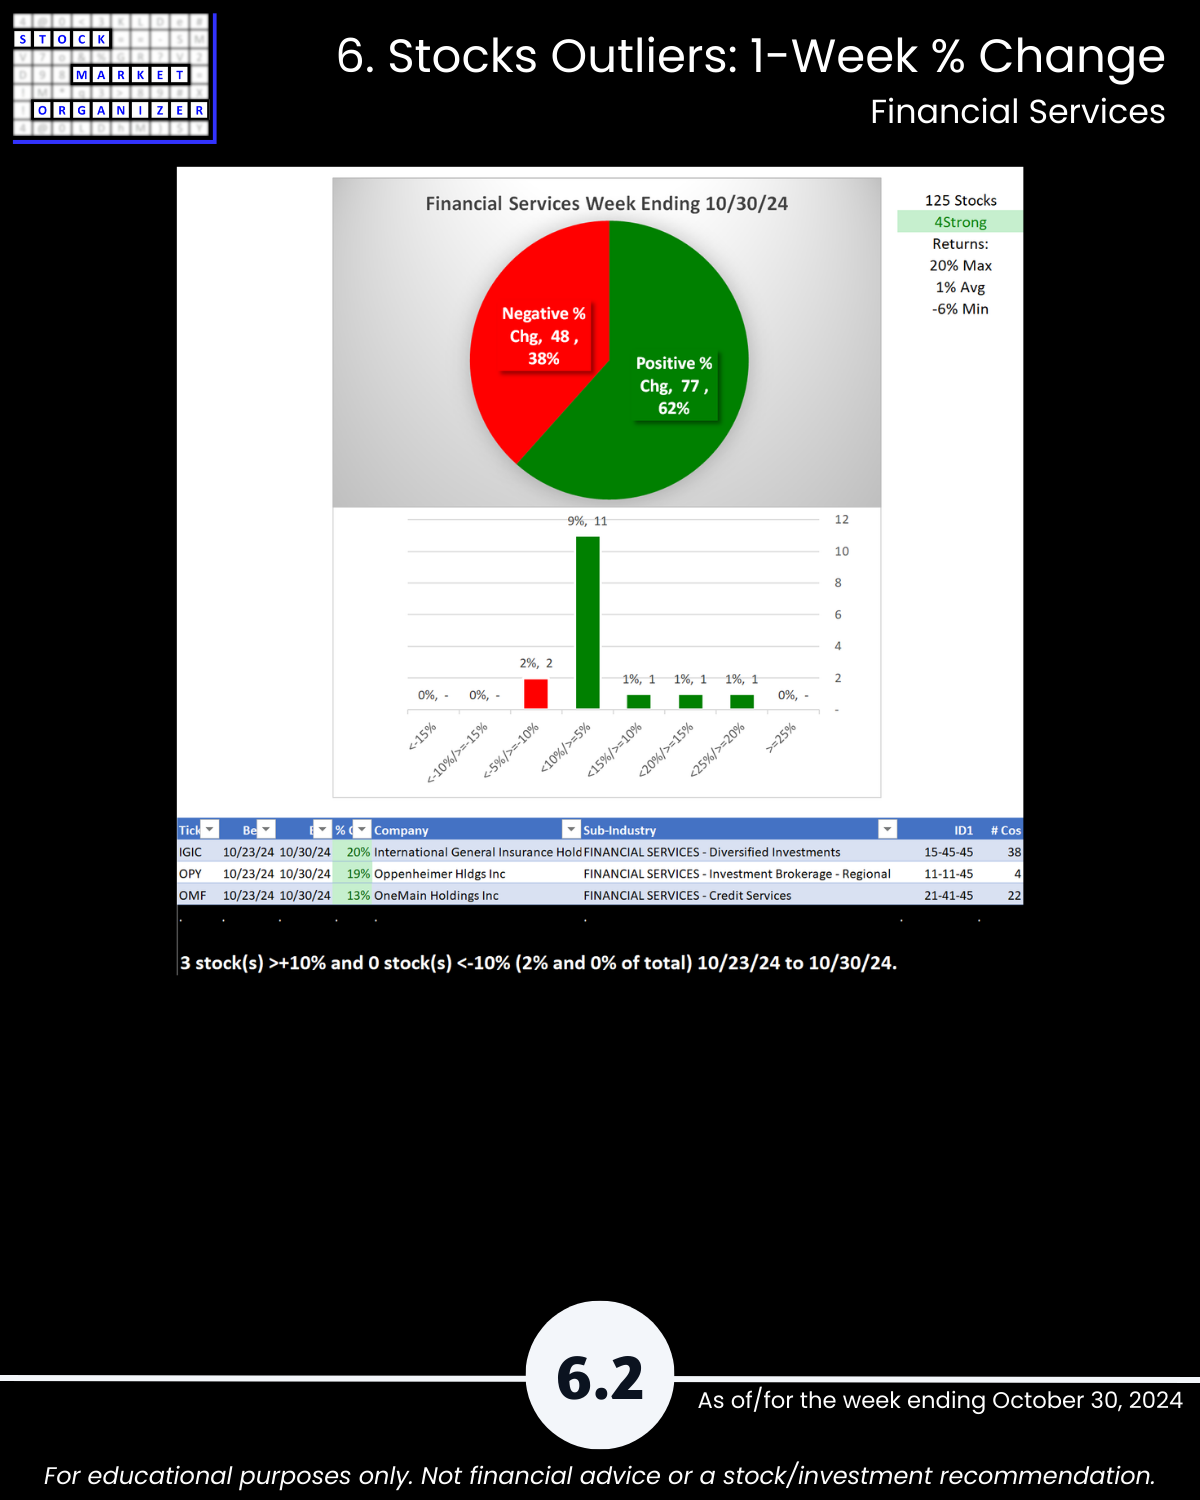
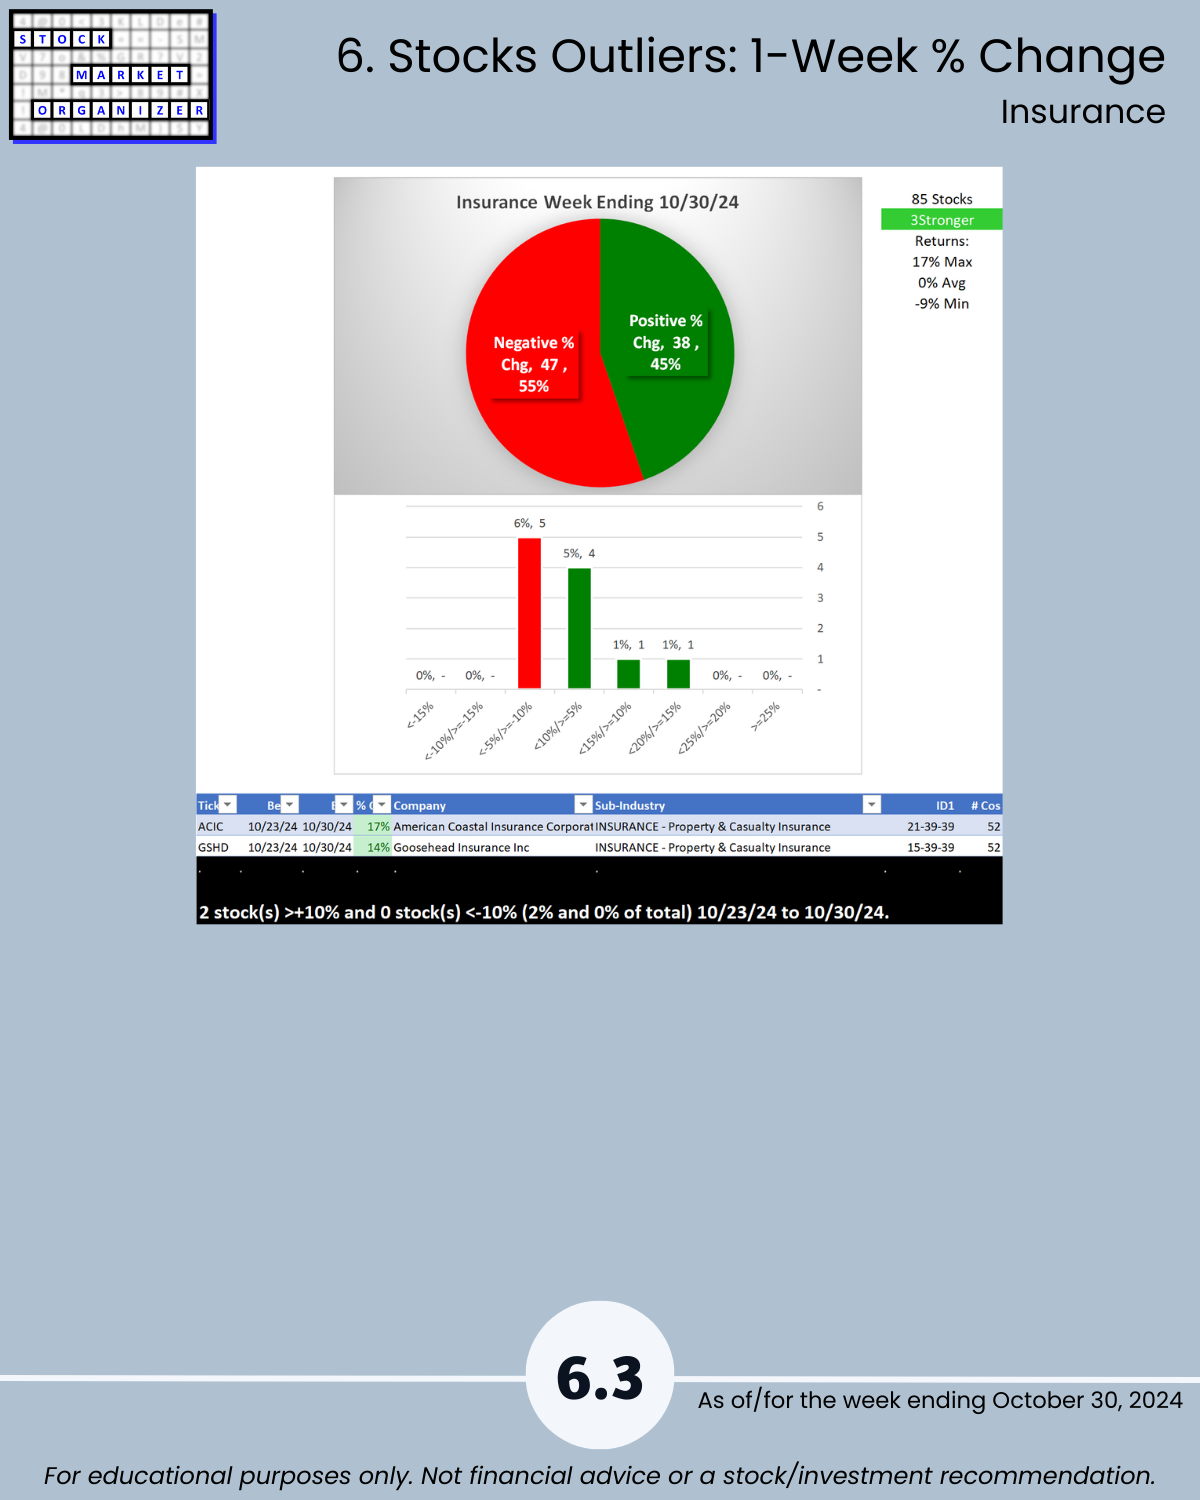
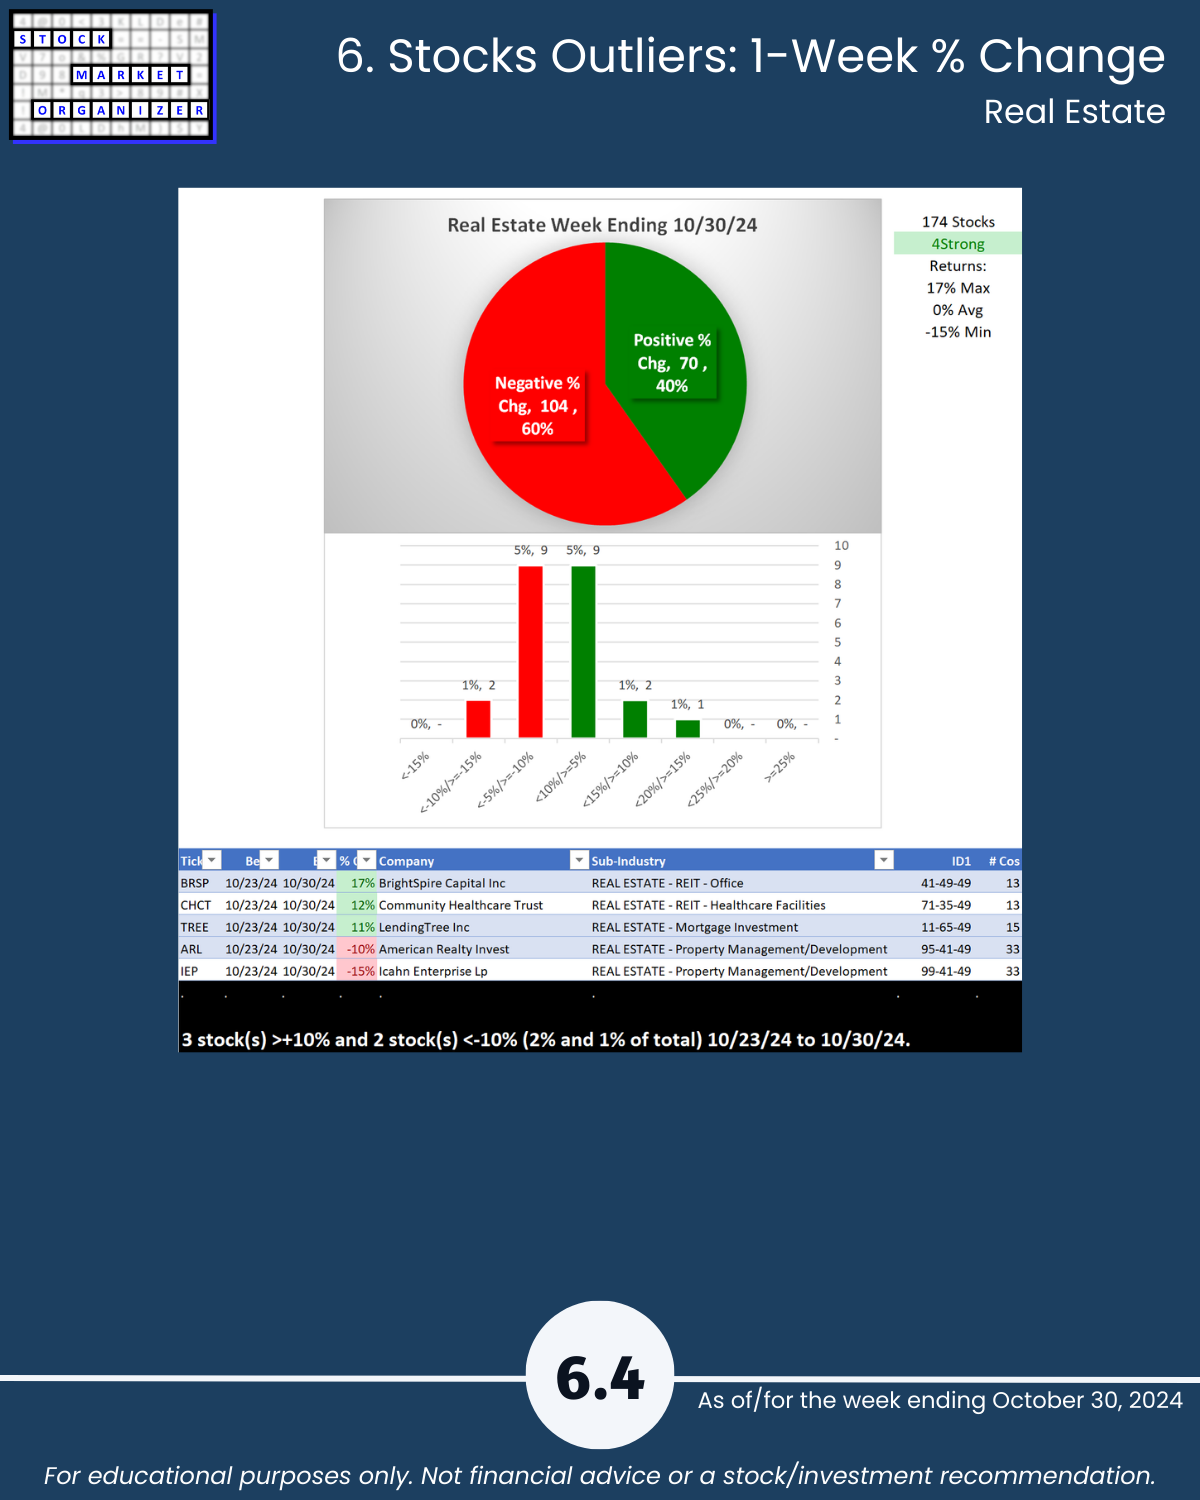
6. Stocks Outliers: 1-Week % Change
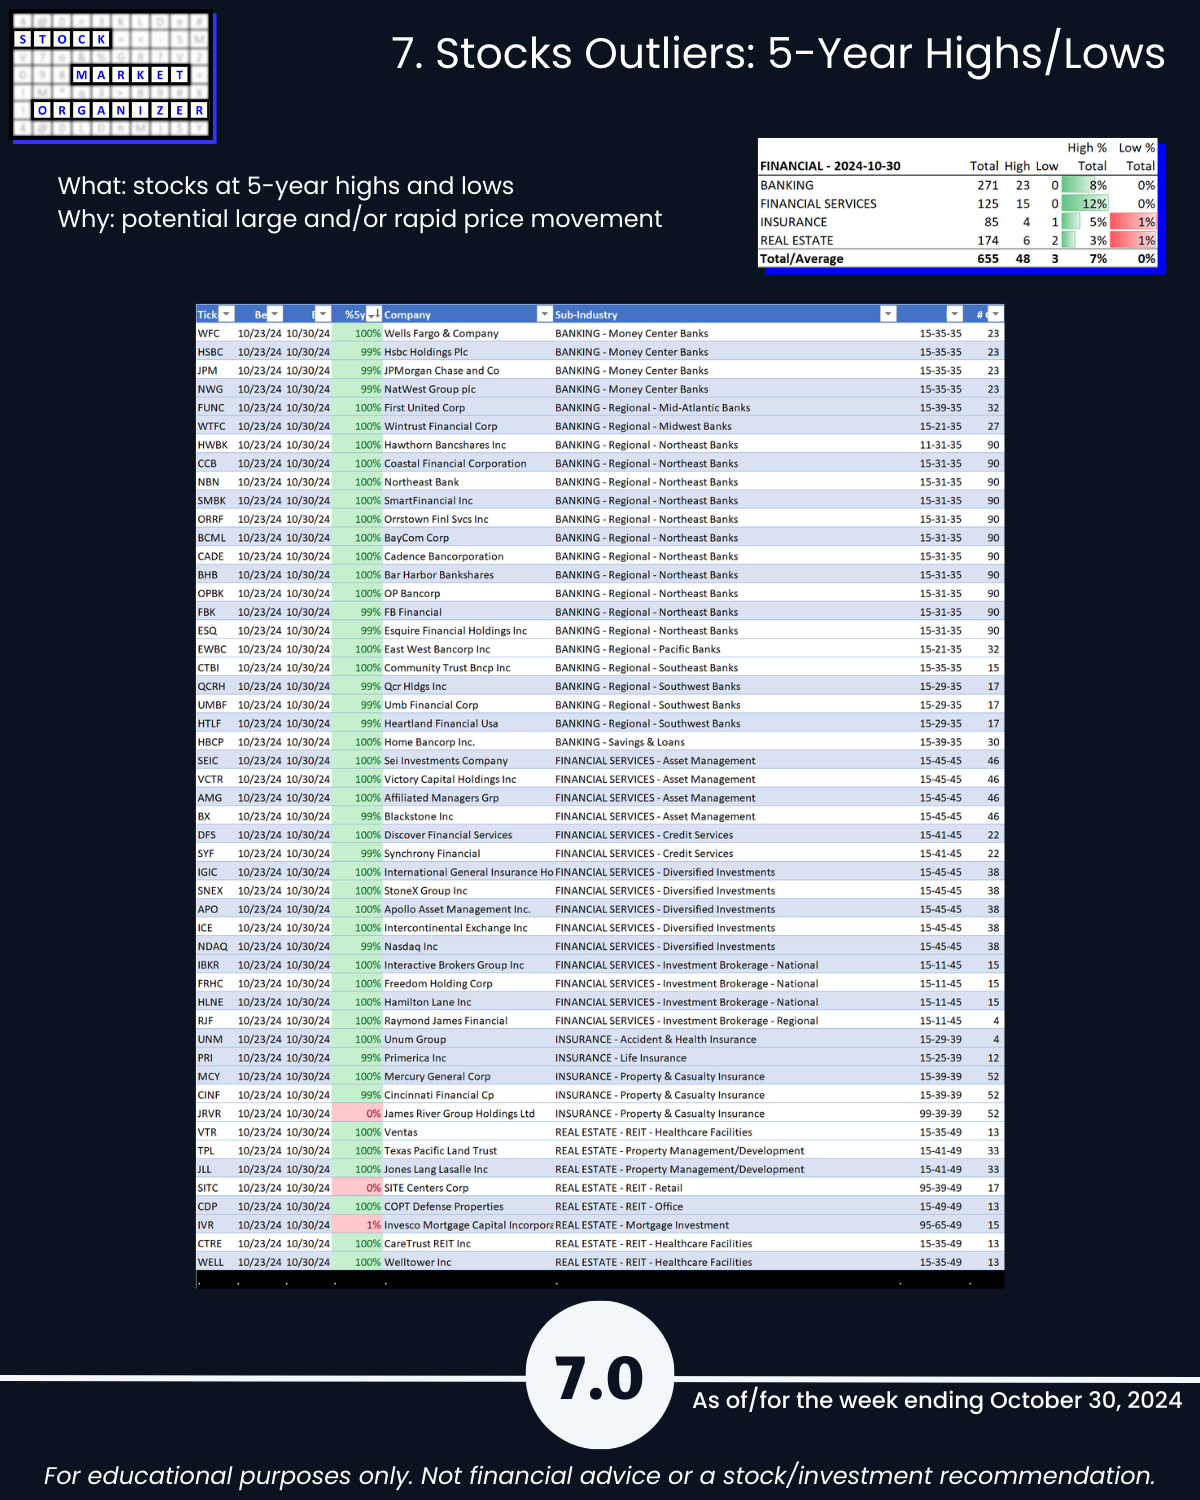
7. Stocks Outliers: 5-Year Highs/Lows