SMO Exclusive: Strength Report Financial Sector 2024-10-09

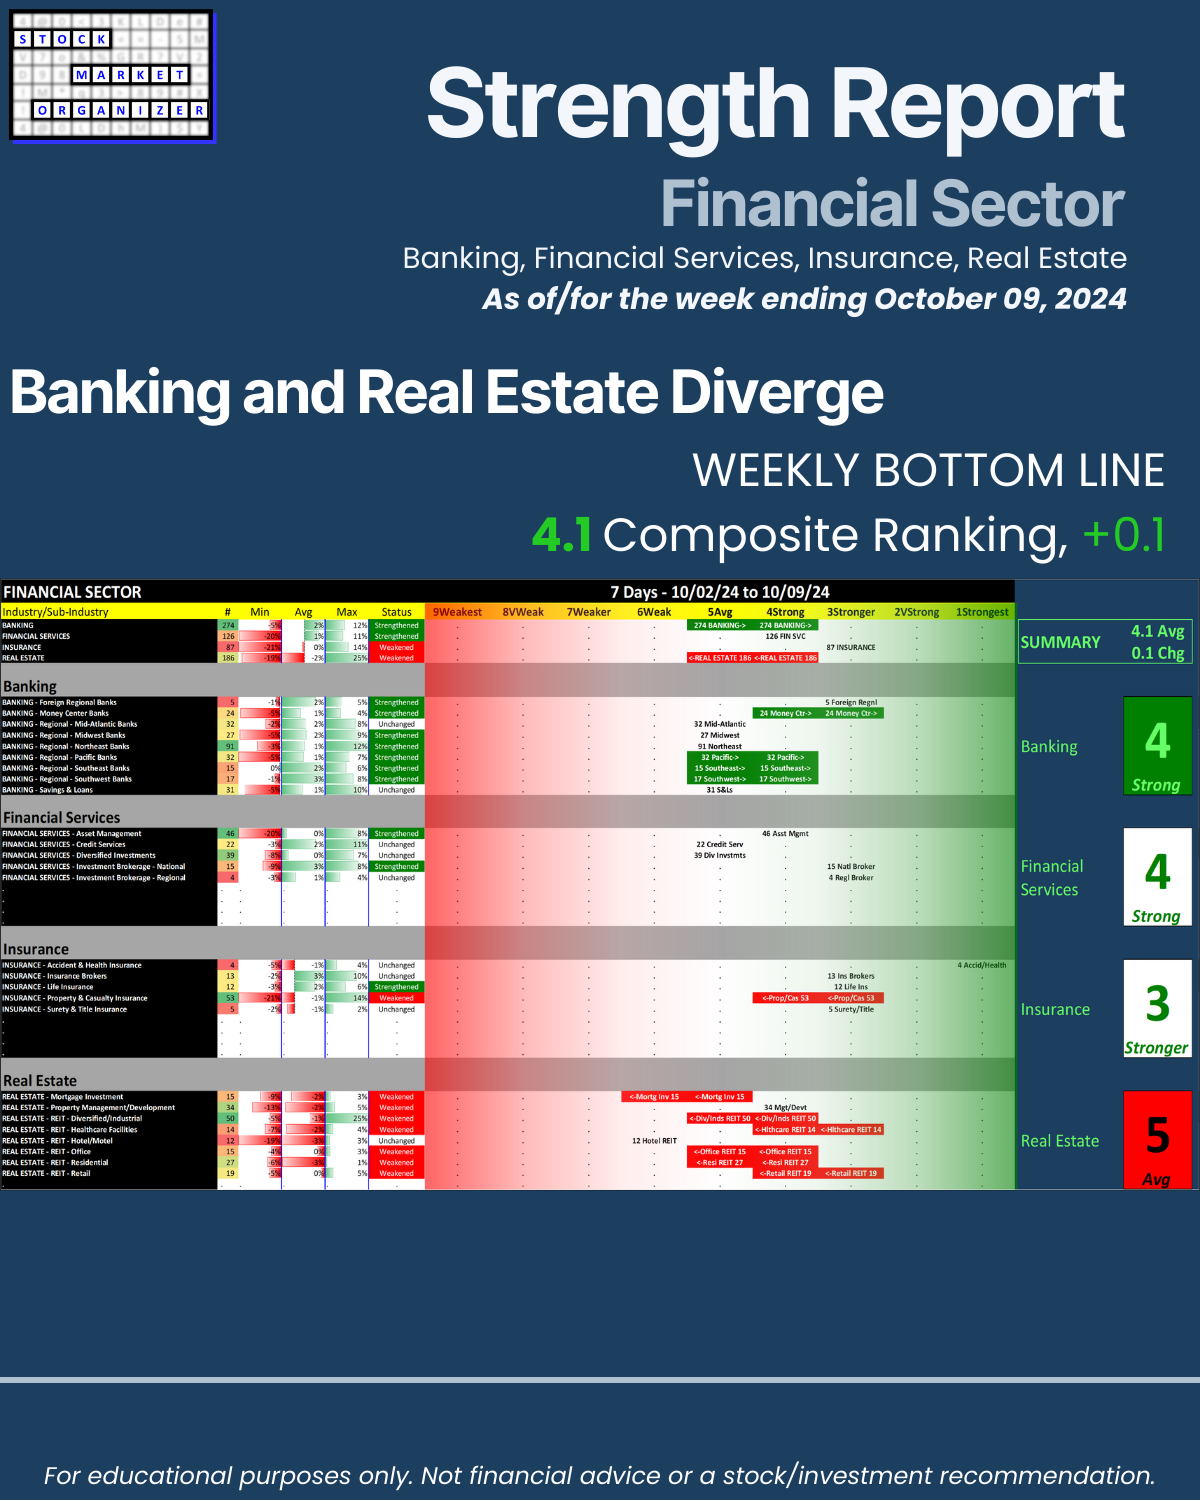
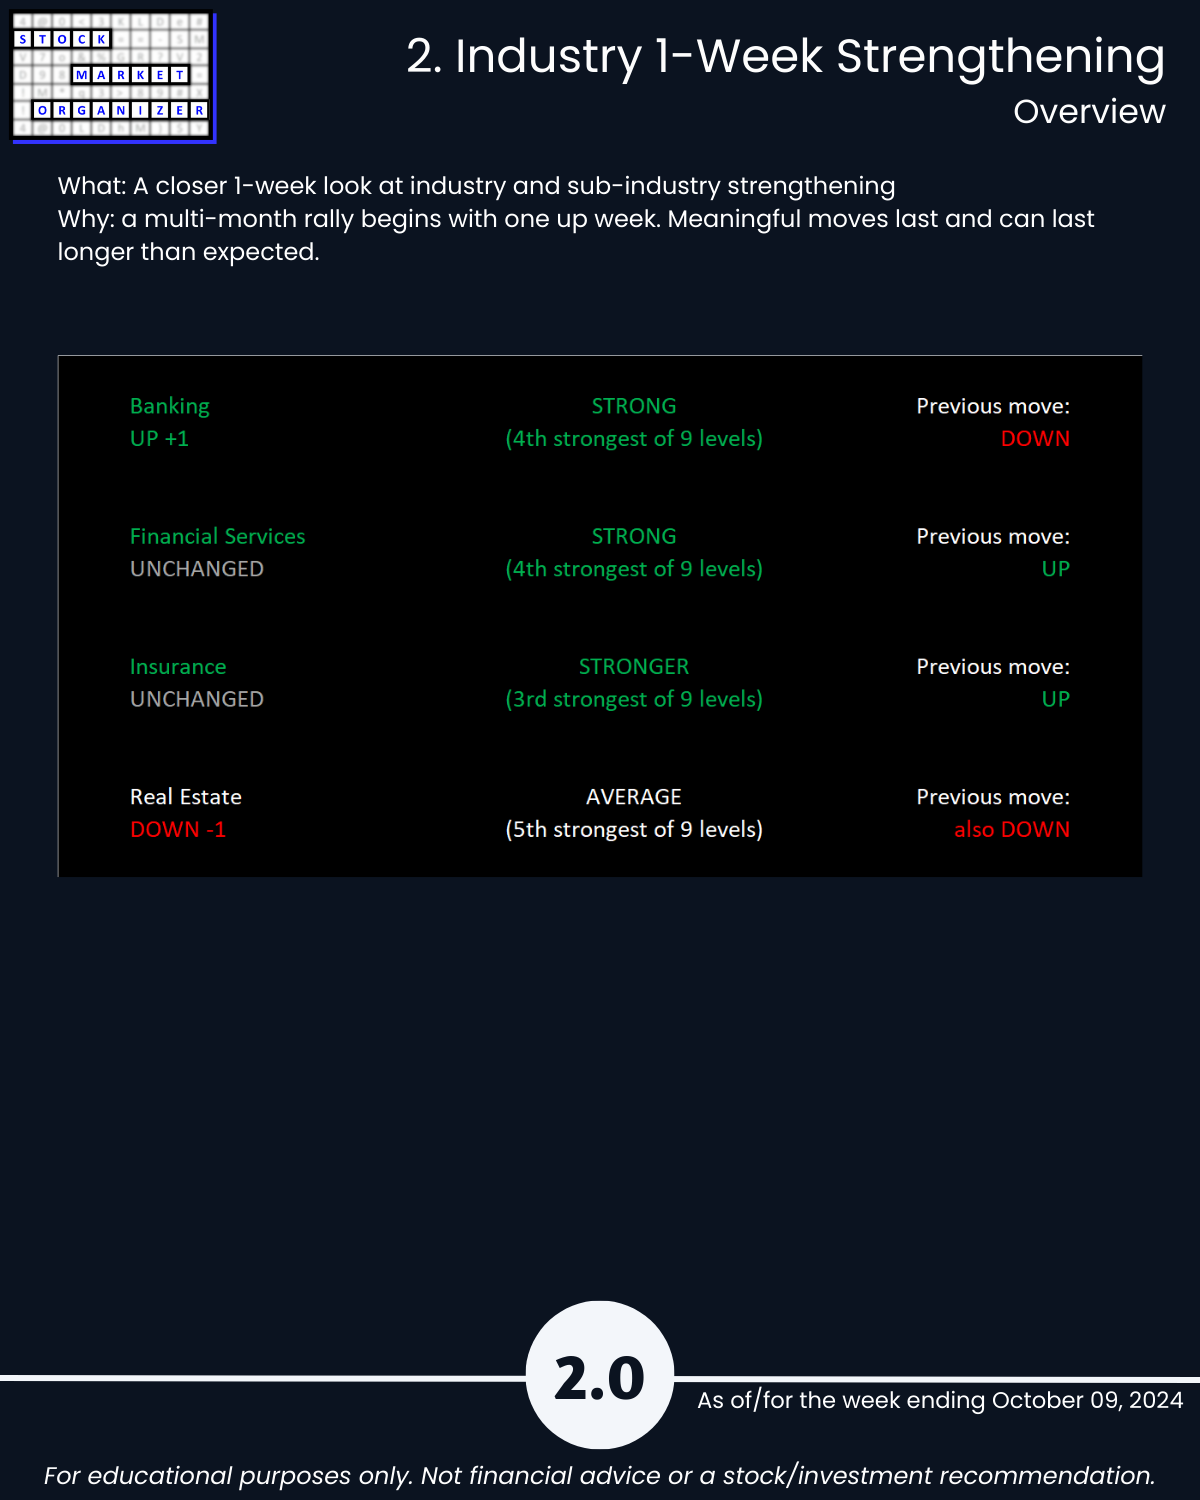
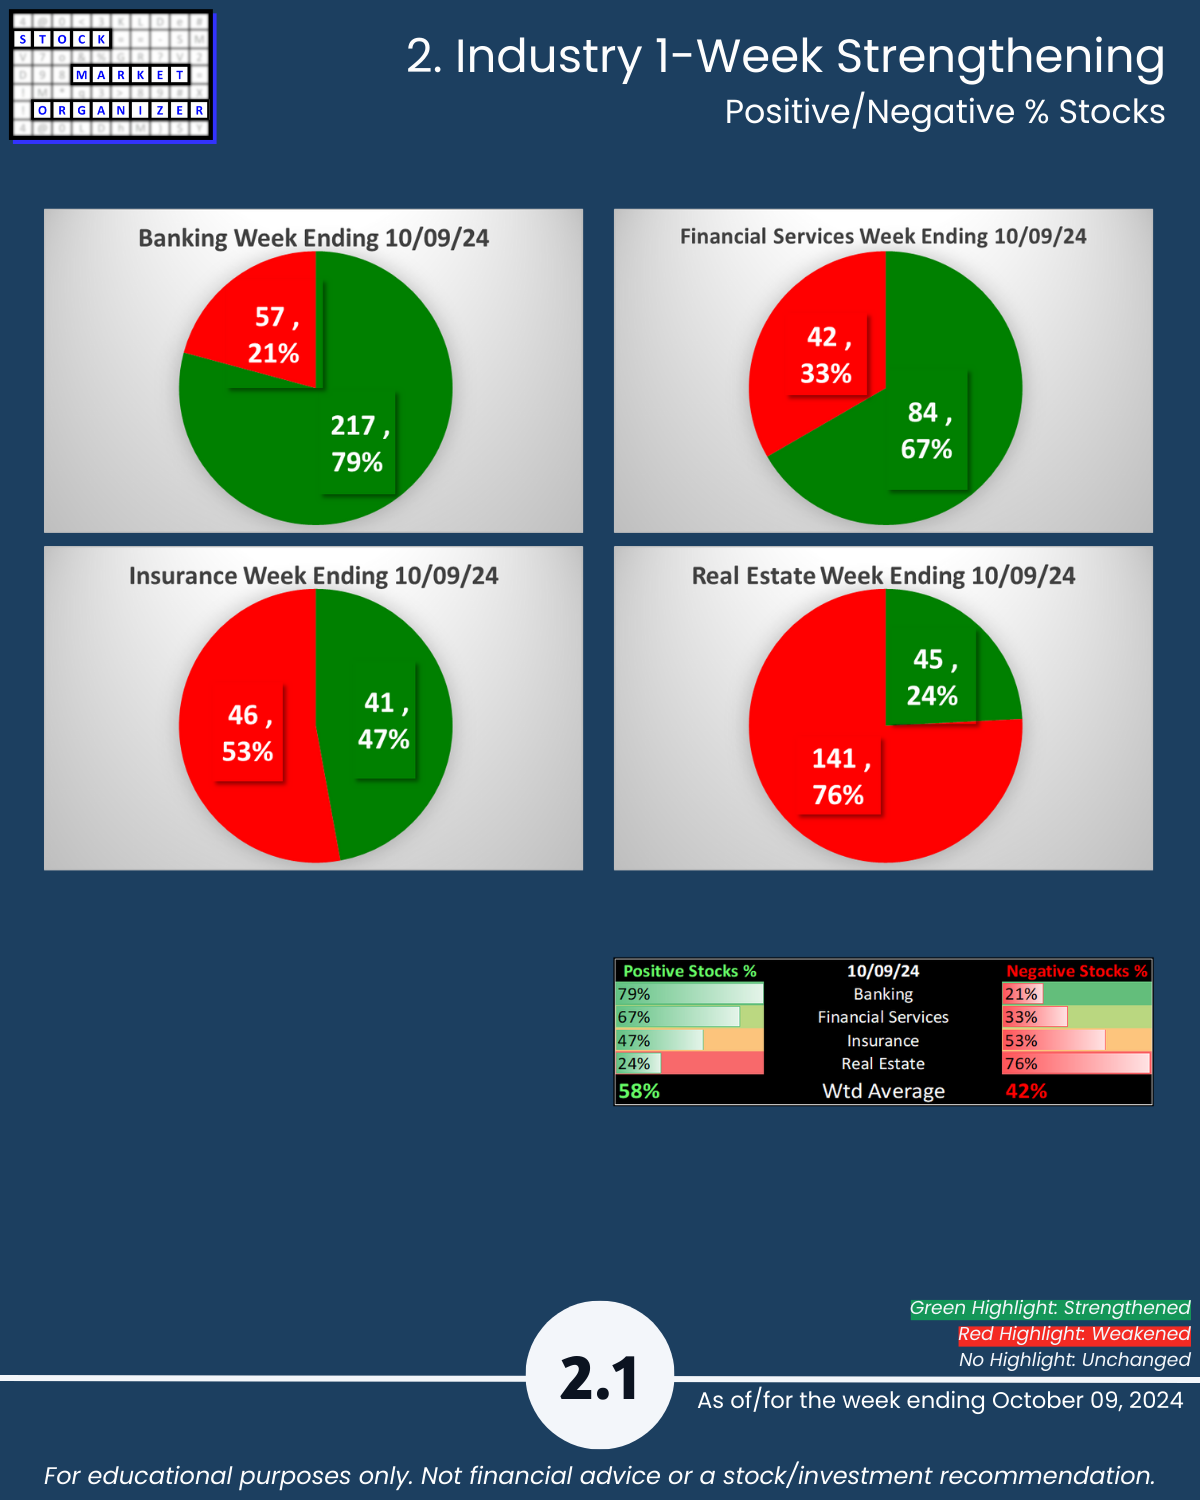
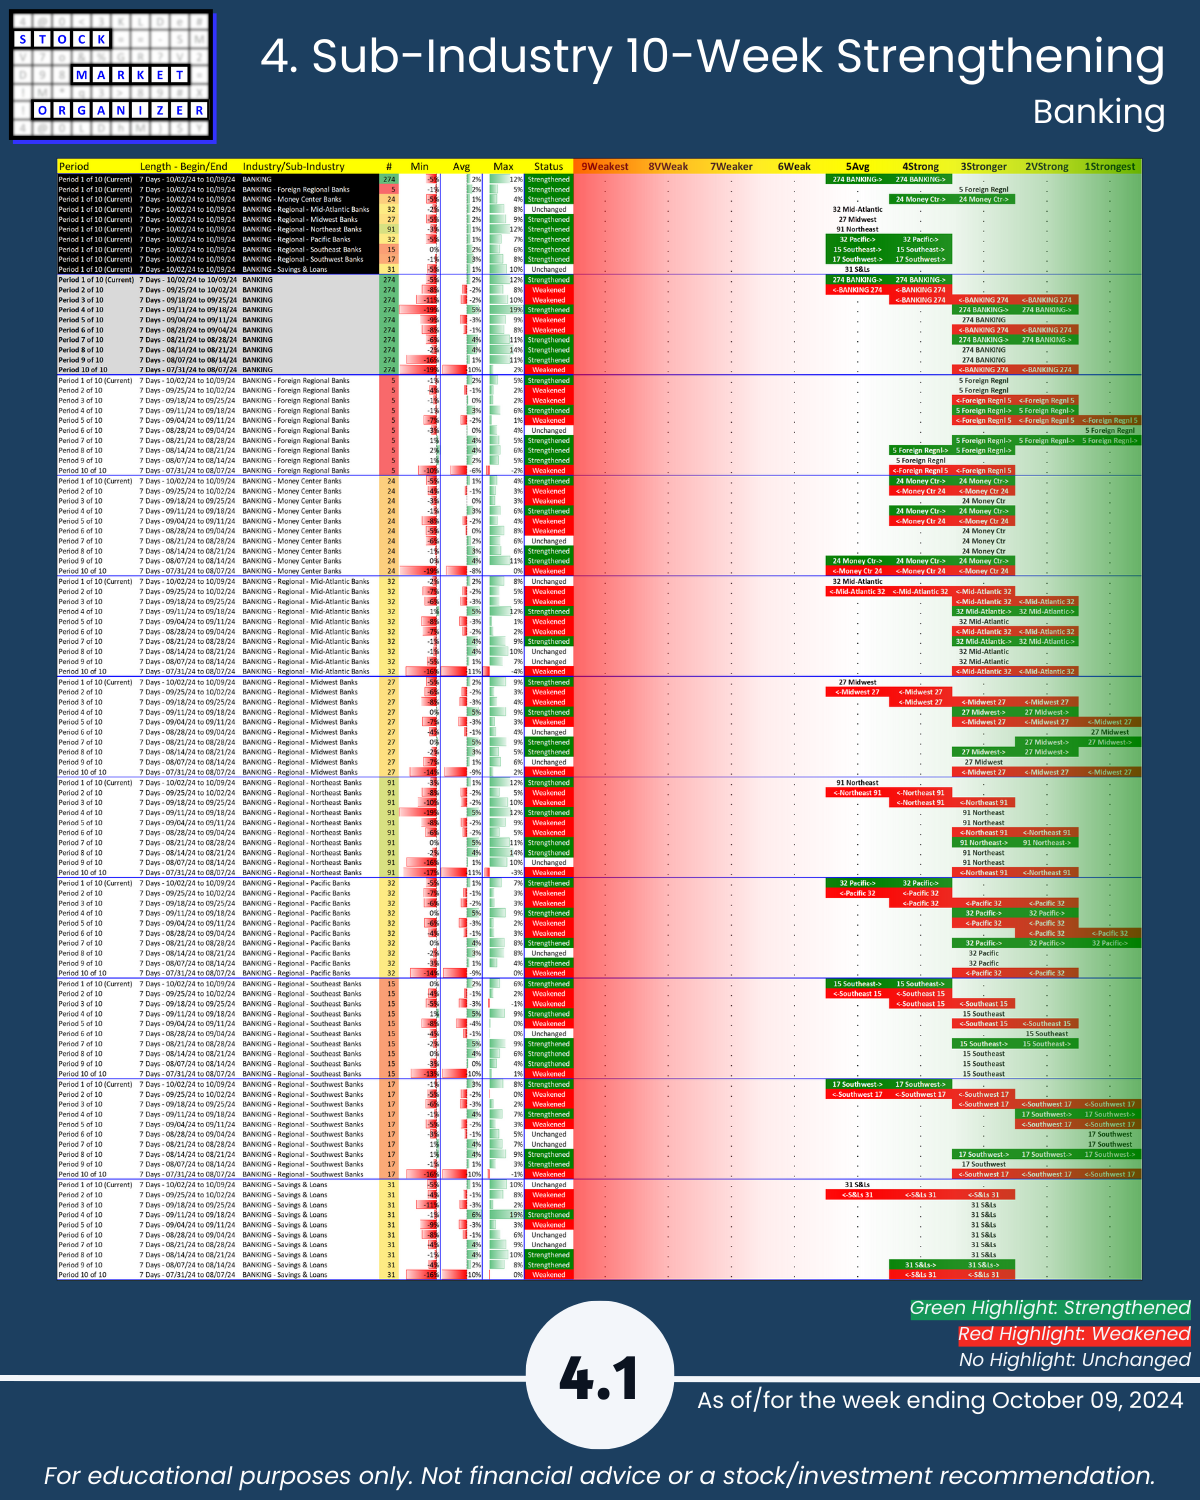
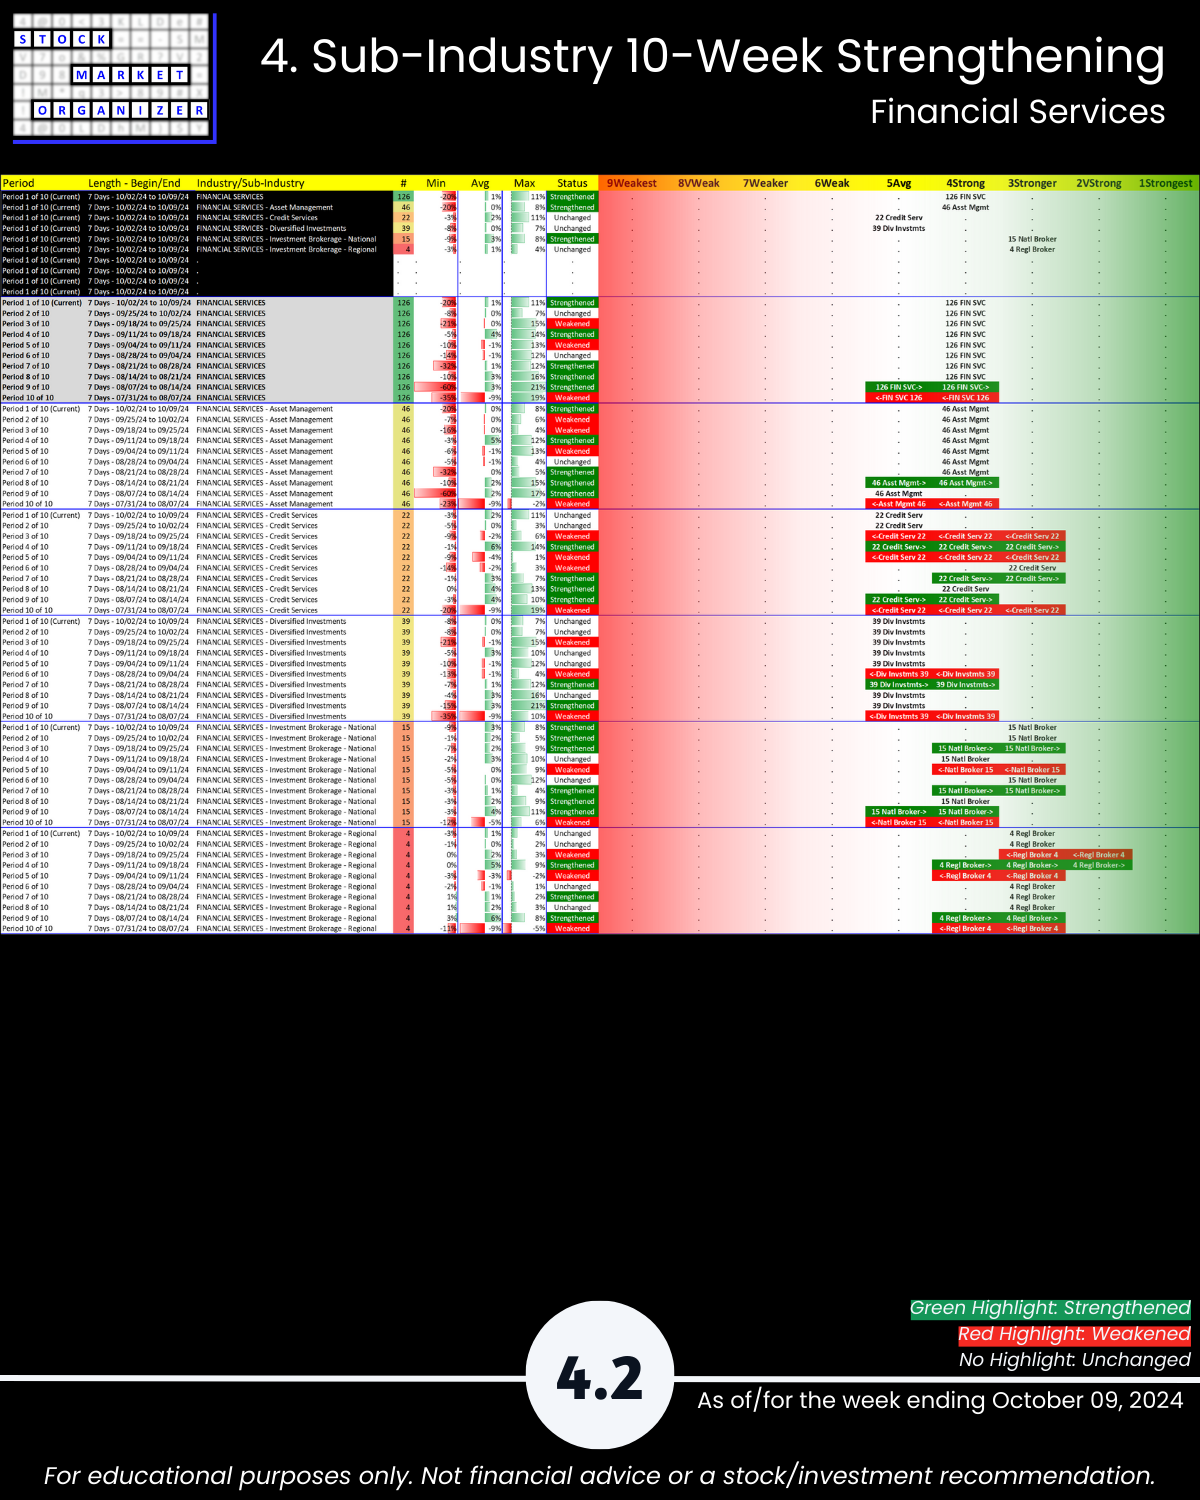
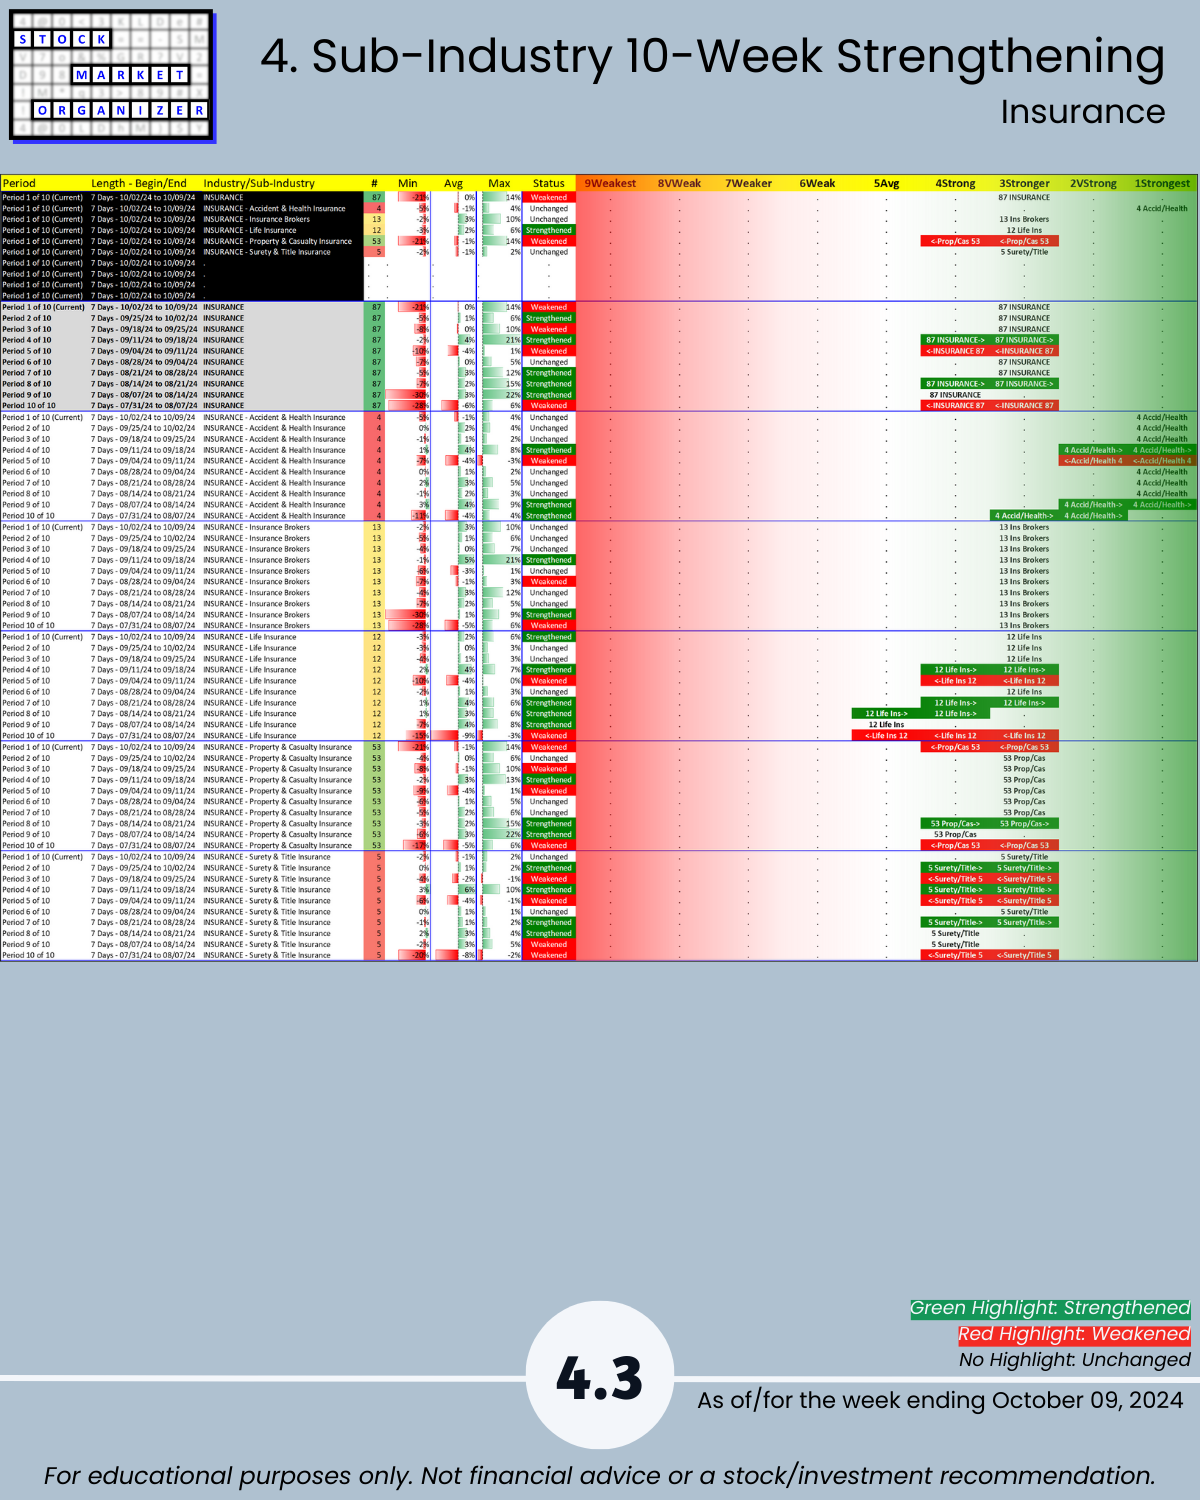
For the week ending Wednesday, October 9, 2024, Real Estate decoupled from Banking as the former weakened to 5Average and the latter strengthened to 4Strong. Meanwhile Financial Services and Insurance both remained flat (no strength rating changes) at 4Strong and 3Stronger.
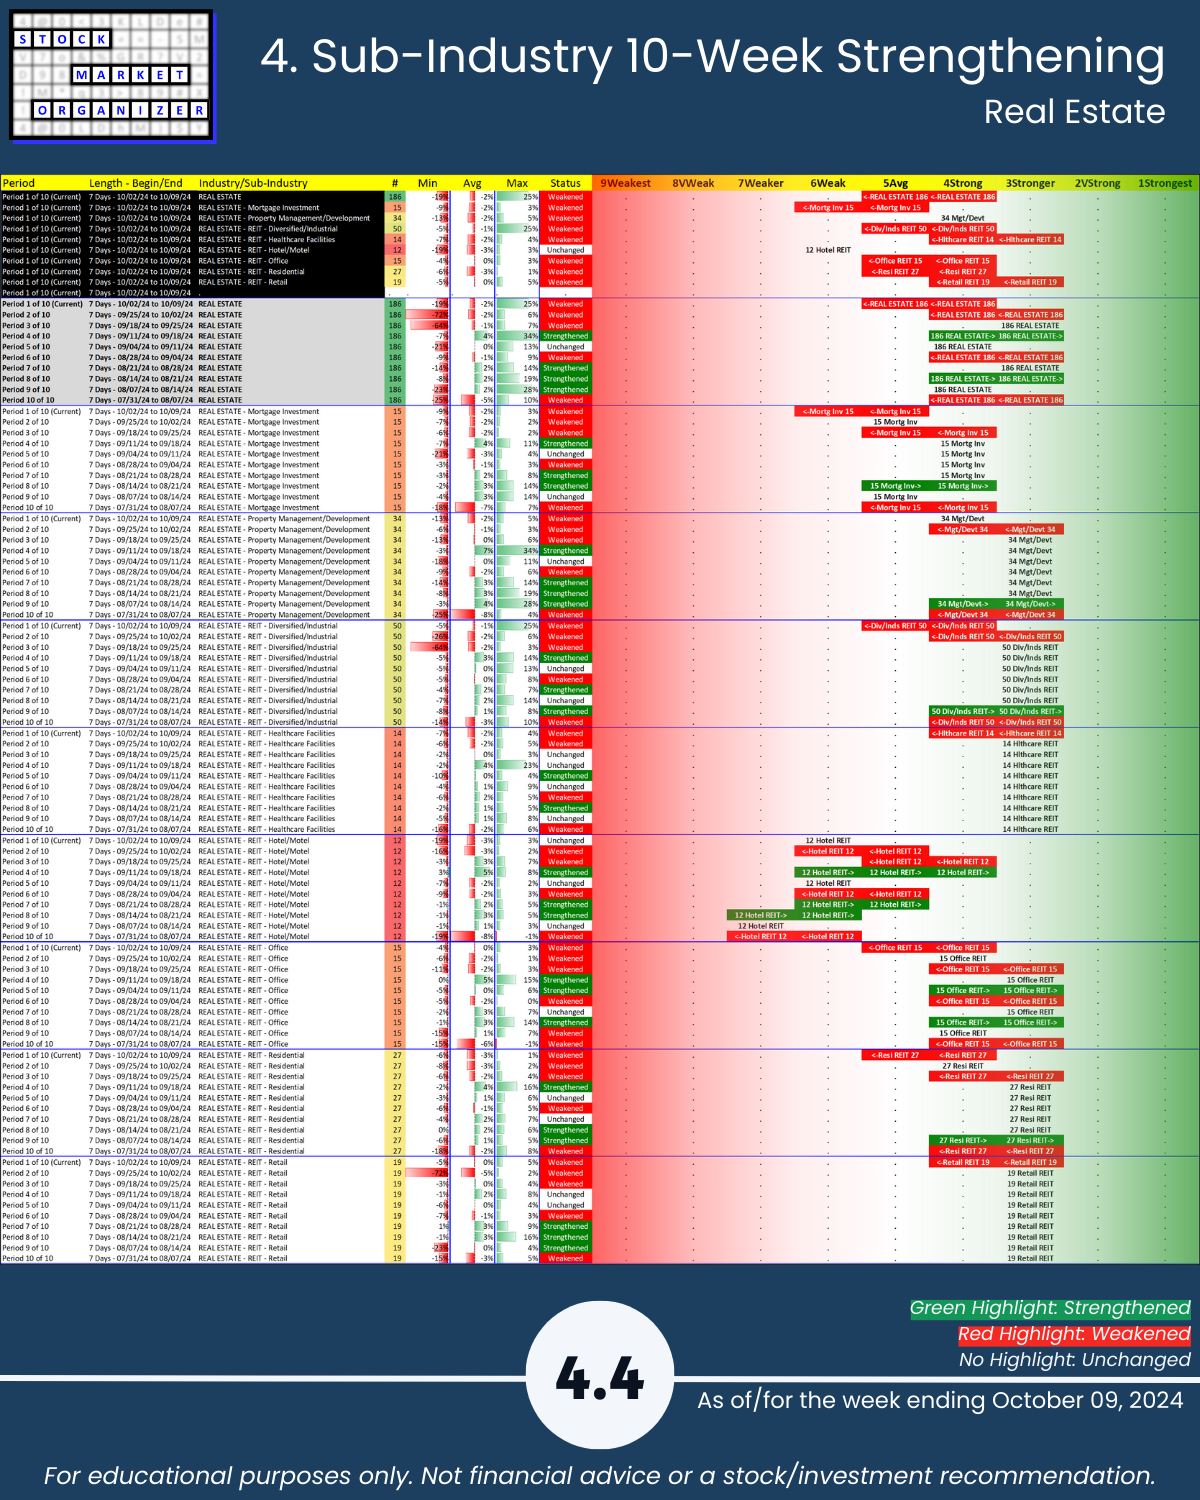
Real Estate - A More In-depth Look
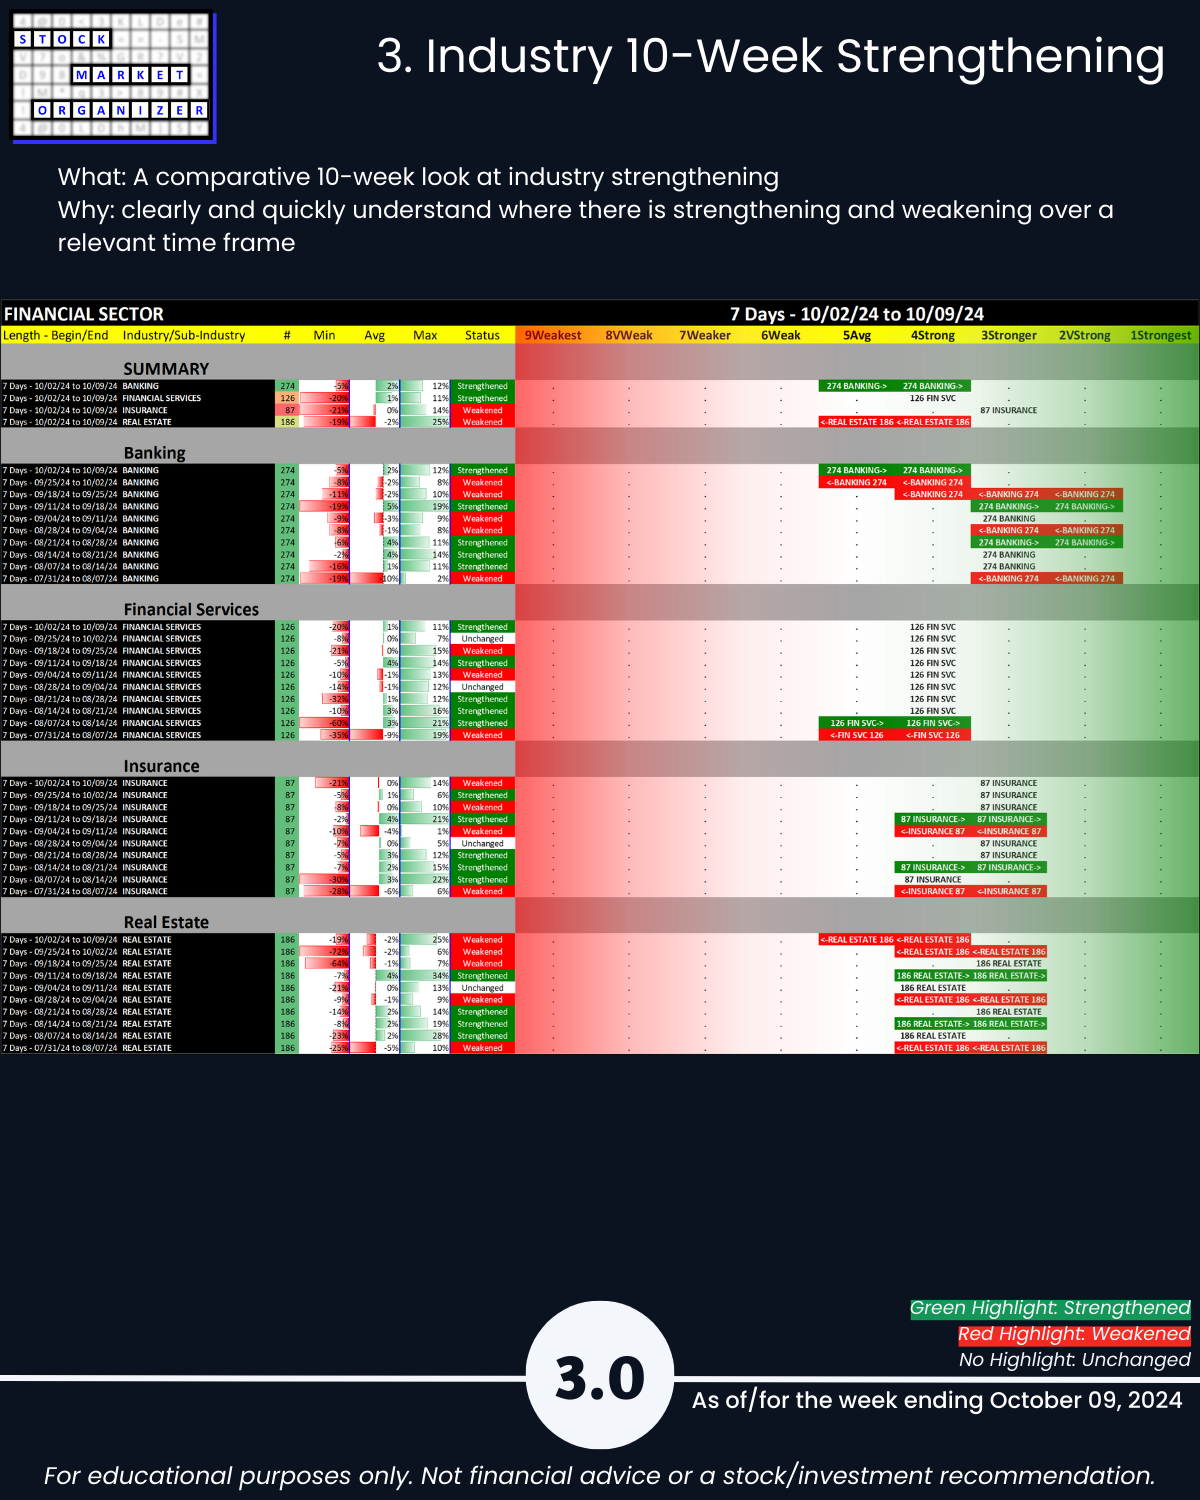
There are 8 sub-industries. Over the past 10 weeks the Real Estate industry has flipped back and forth from 4Strong to 3Stronger. This is the first week in 10 that it has fallen below 4Strong, to a new recent low of 5Average.
Is this a case of sell the news, with regard to the recent 50 basis point rate cut?
- 7 sub-industries weakened, with 6 weakening enough to fall in strength rating
- One unchanged: Hotel REITs, at 6Weak
- One weakened, but not enough to fall in strength rating: Property Management/Development
- Six weakened enough to fall in strength rating: Mortgage Investment, Diversified/Industrial REITs, Healthcare Facilities REITs, Office REITs, Residential/Multifamily REITs, and Retail REITs. - Along with the Real Estate Industry, each of the above six sub-industries that fell in strength rating fell to new 10-week low ratings.
Difference This vs. ETFs Analysis
Note this analysis is the same as that used for the SPDR ETFs but the two main differences are
1. Universe of stocks. The ETFs are the largest capitalization stocks, 500 of them in the 11 sector ETFs. In this analysis, there are approximately 2,700 stocks.
2. Sub-categorization below the market level. The ETF analysis with 500 stocks is limited to sector strengthening and weakening. This analysis with +/-2,700 stocks can be and is segregated into 29 industry groups and in turn 189 sub-industry groups.
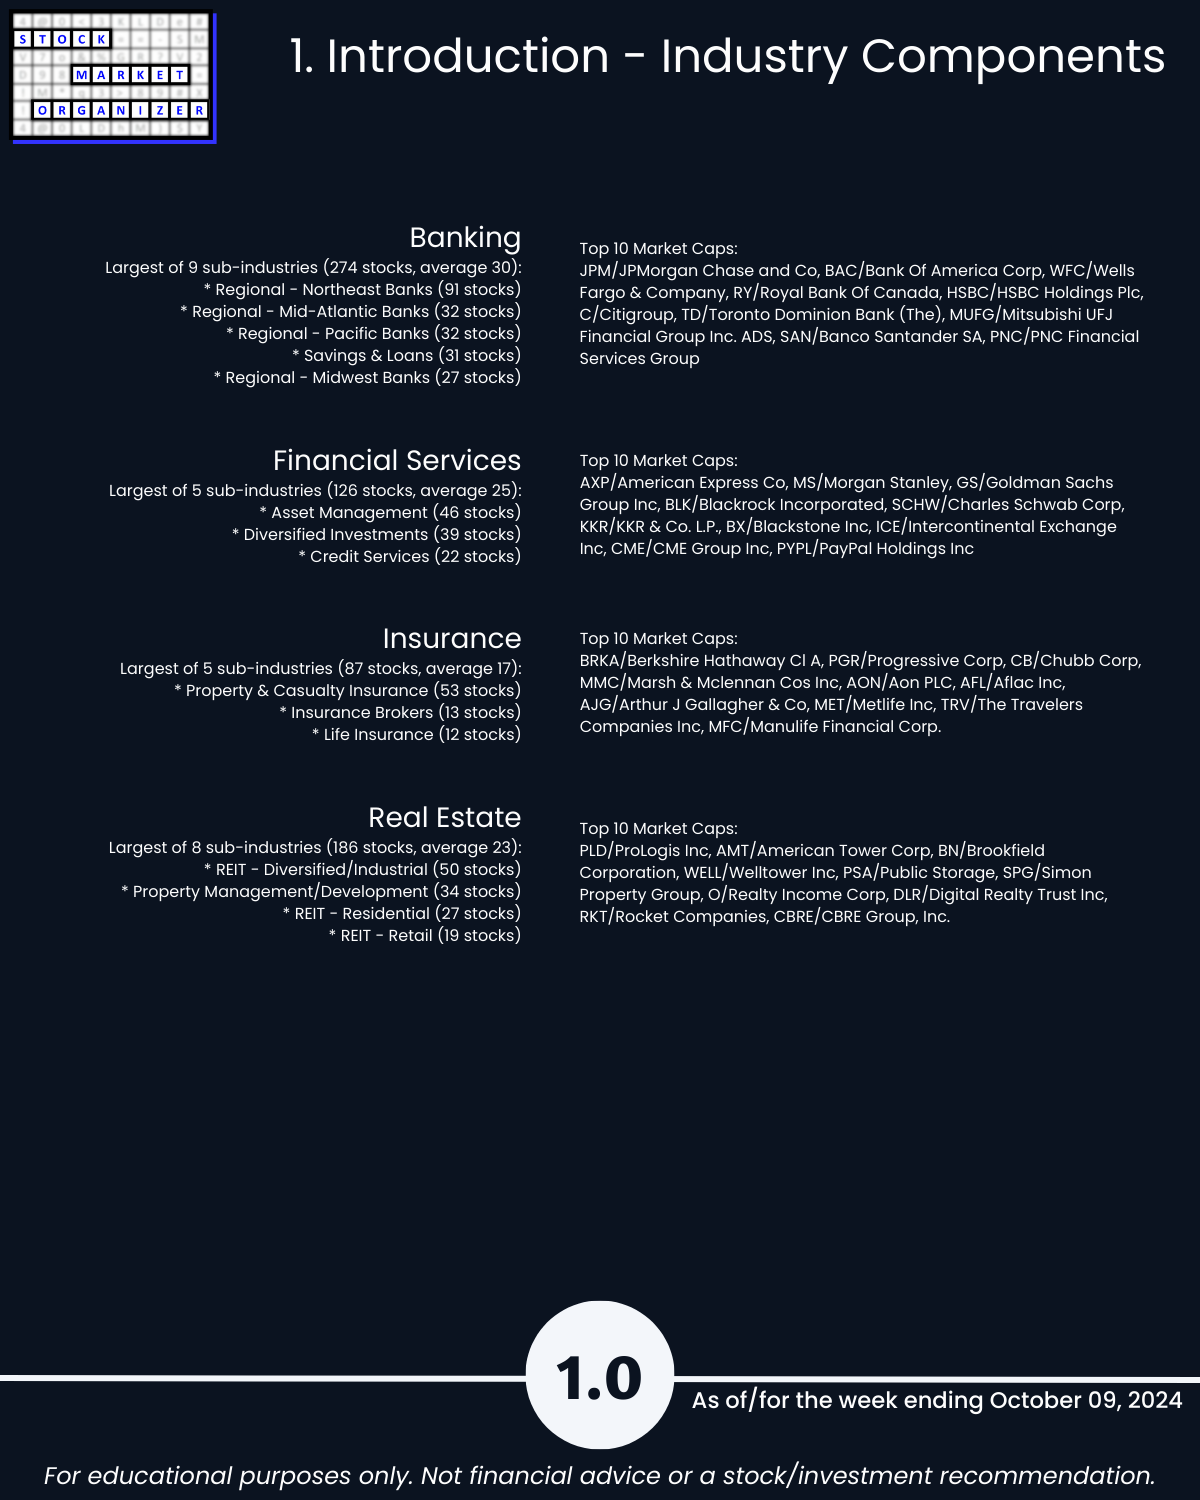
Note there is a Financials ETF (symbol XLF) which is separate from the Real Estate ETF (symbol XLRE). The Financials sector in this analysis includes Real Estate with Banking, Financial Services, and Insurance.
Per yesterday's ETF strength analysis, both XLF/Financials and XLRE/Real Estate are rated 3Stronger. These are comprised of the larger capitalization stocks in these sectors and this means there are many smaller capitalization Real Estate stocks that are weak/weakening, as compared to the large cap Real Estate stocks.
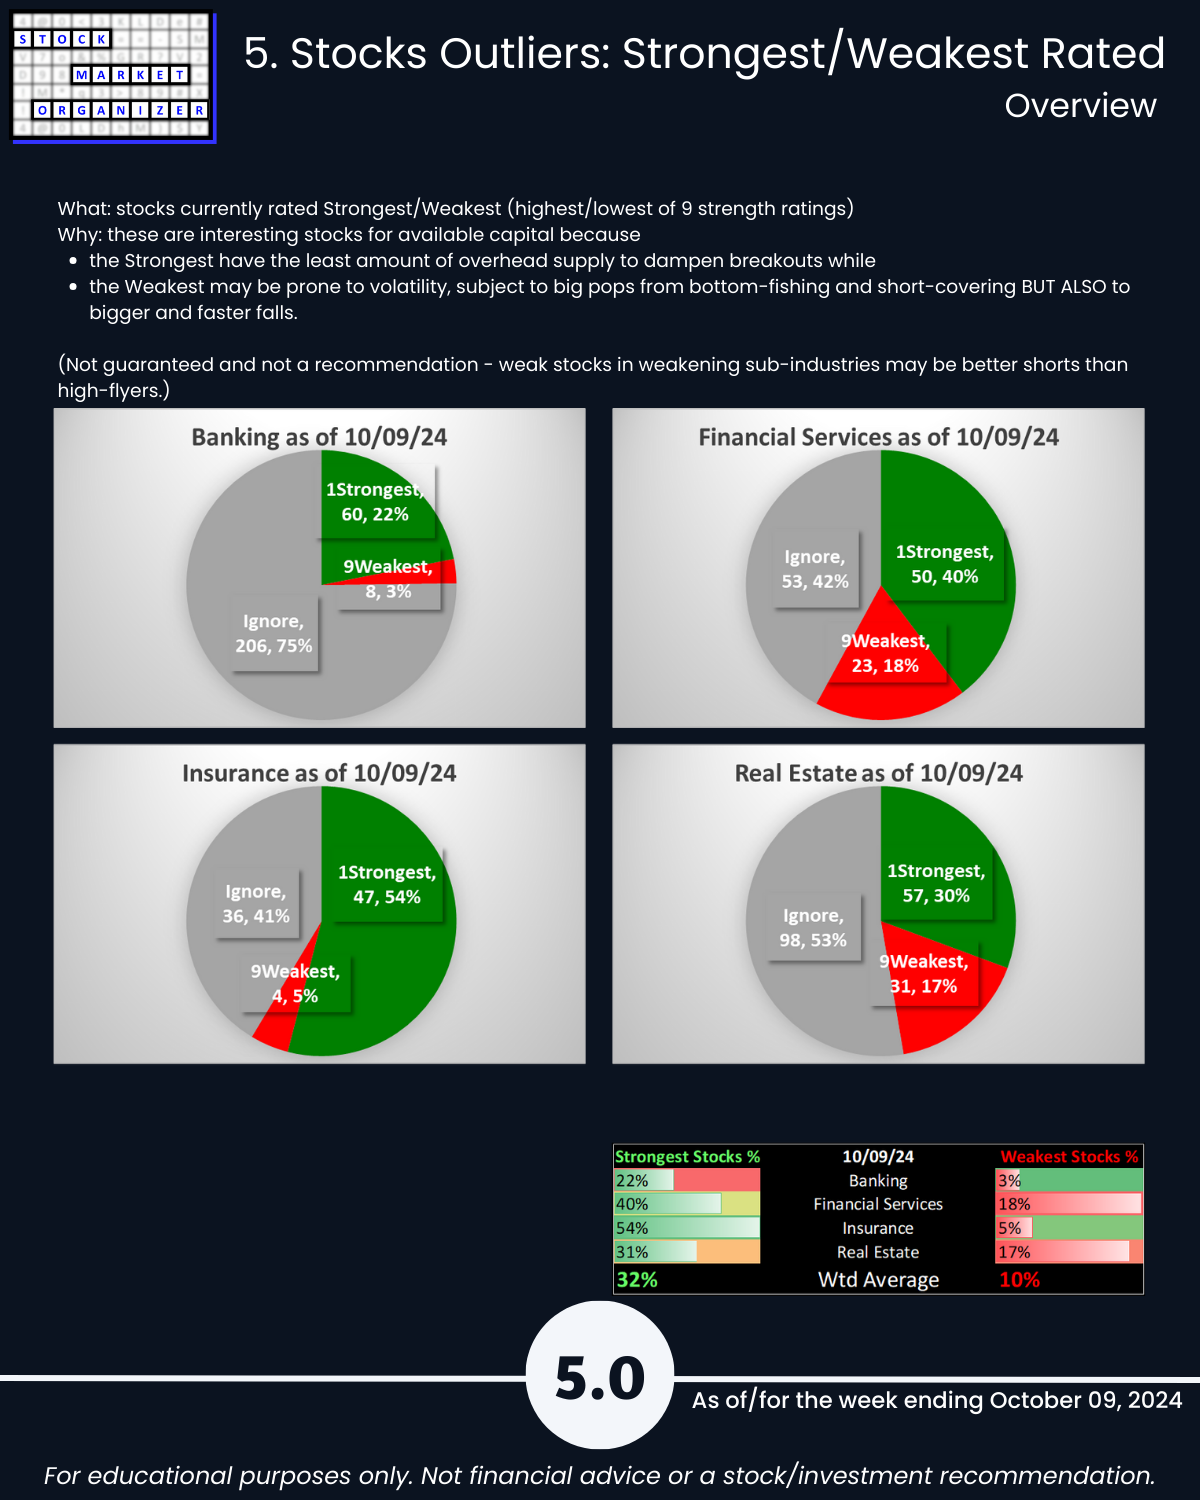
How would I use this information?
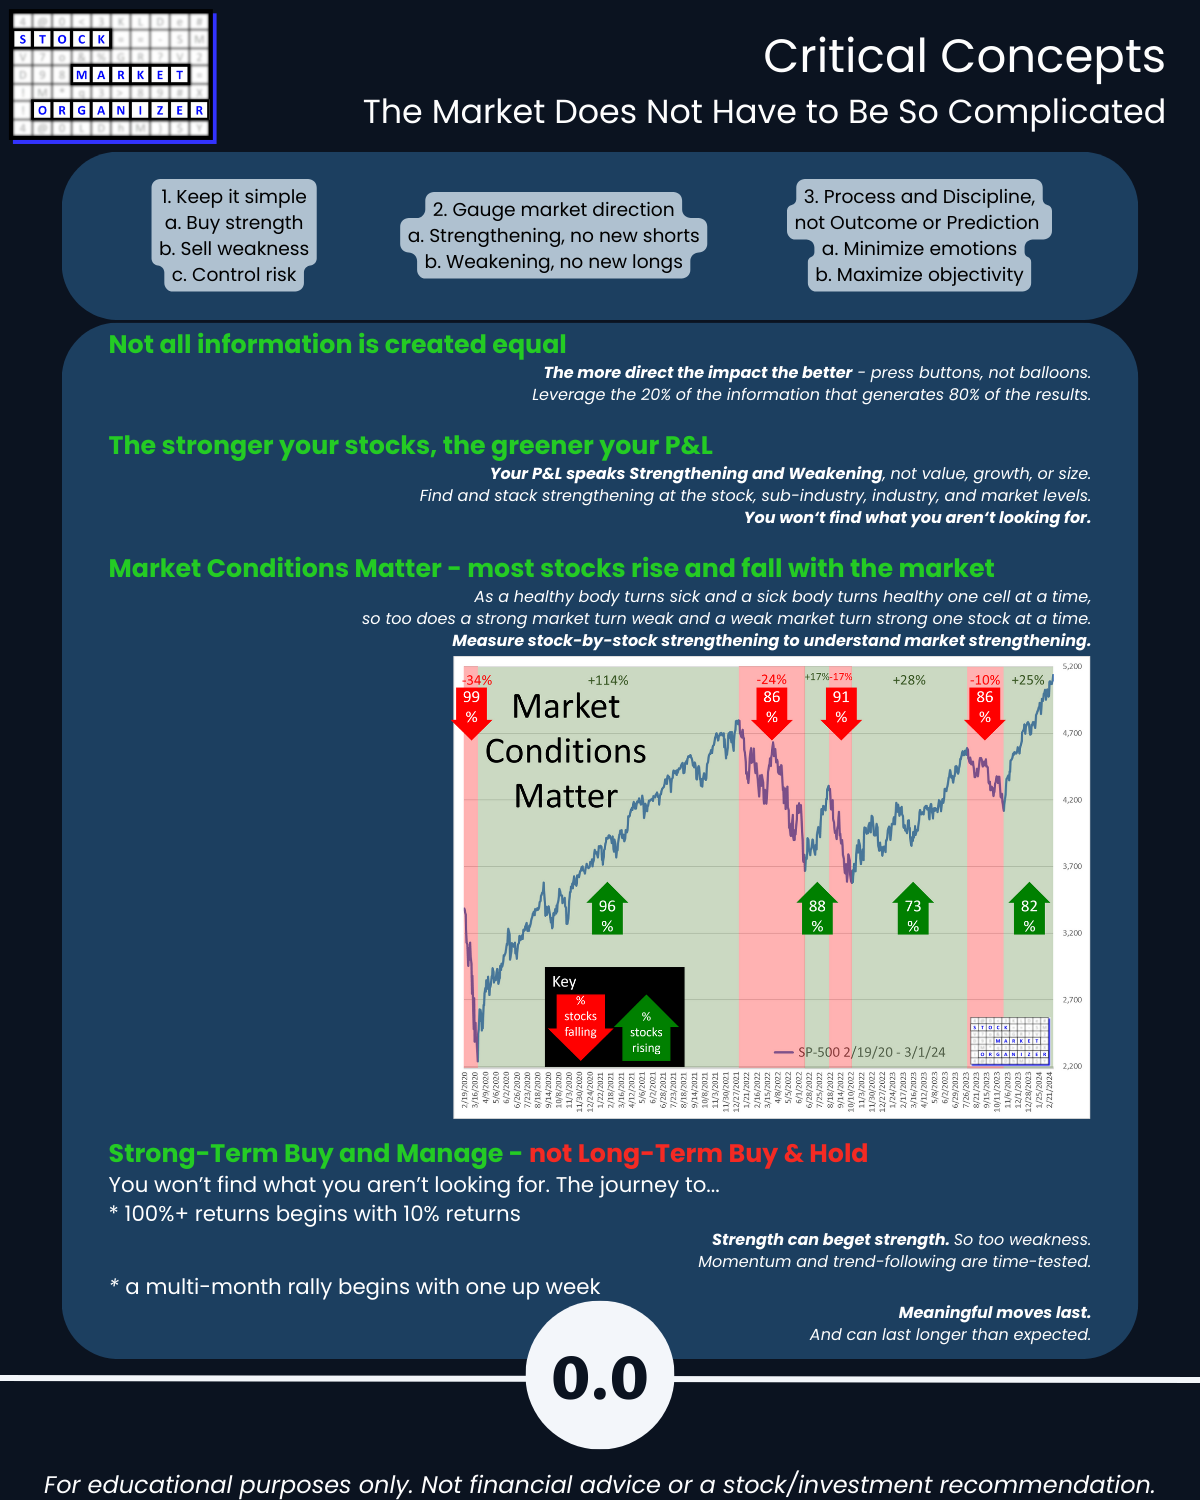
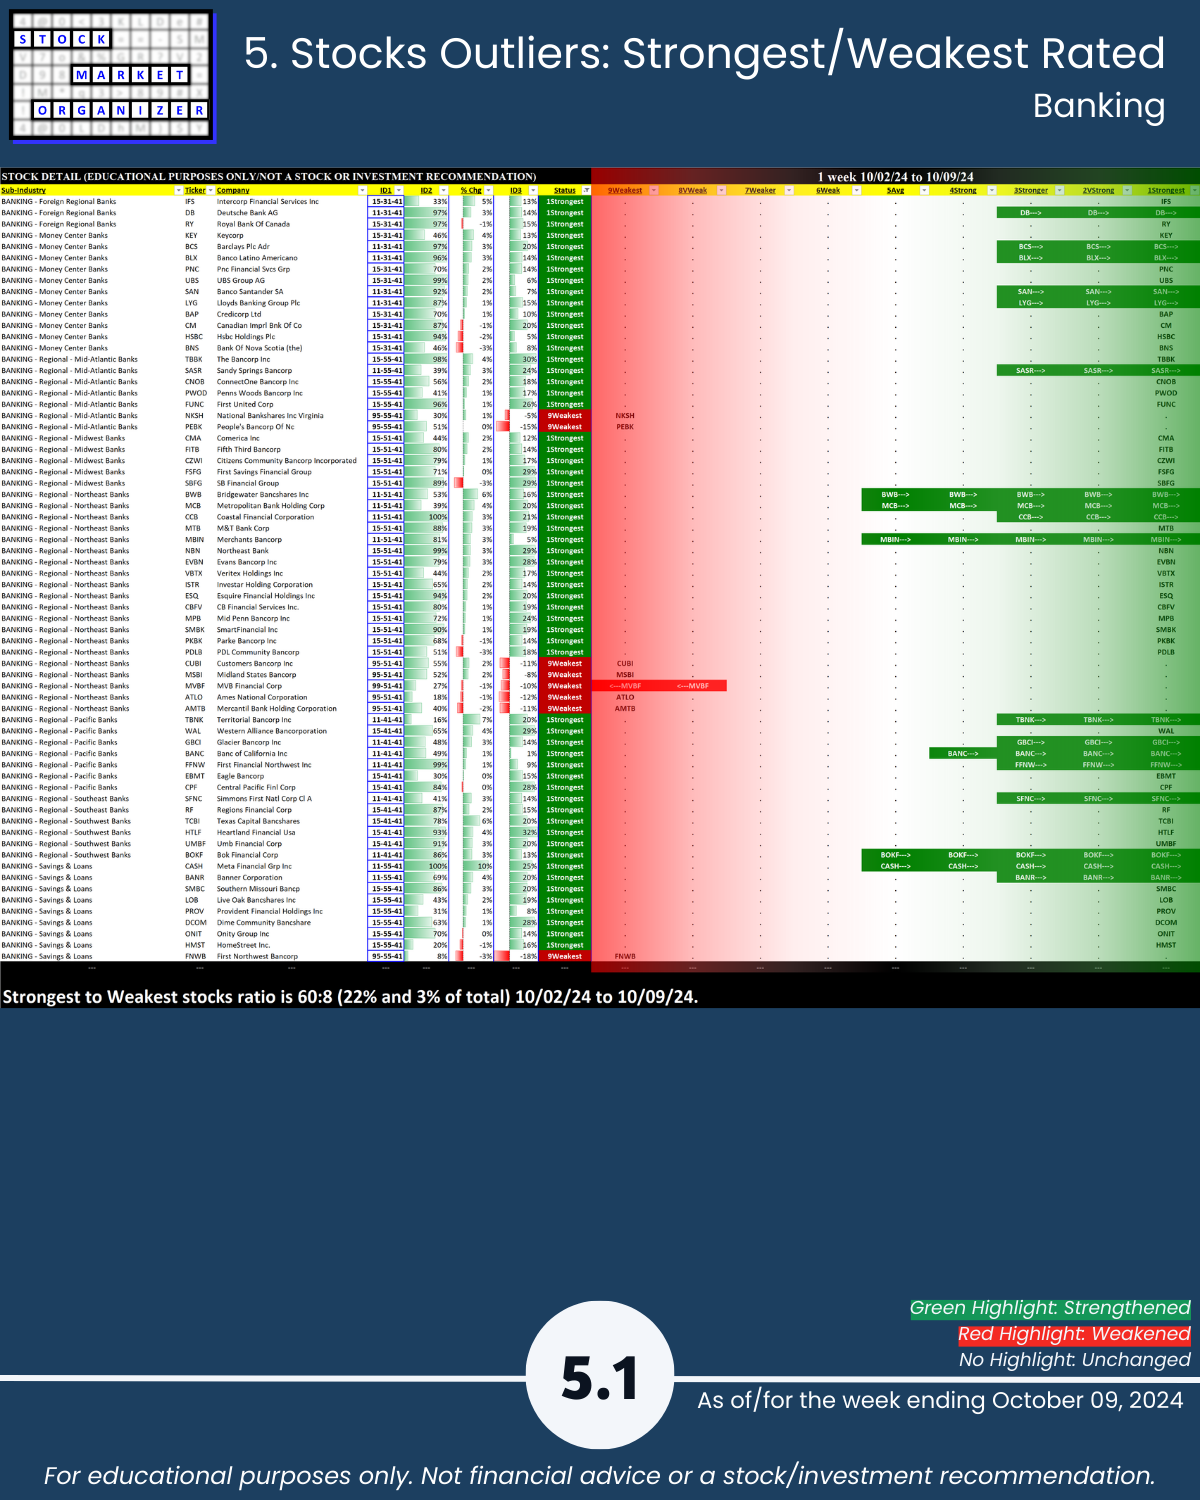
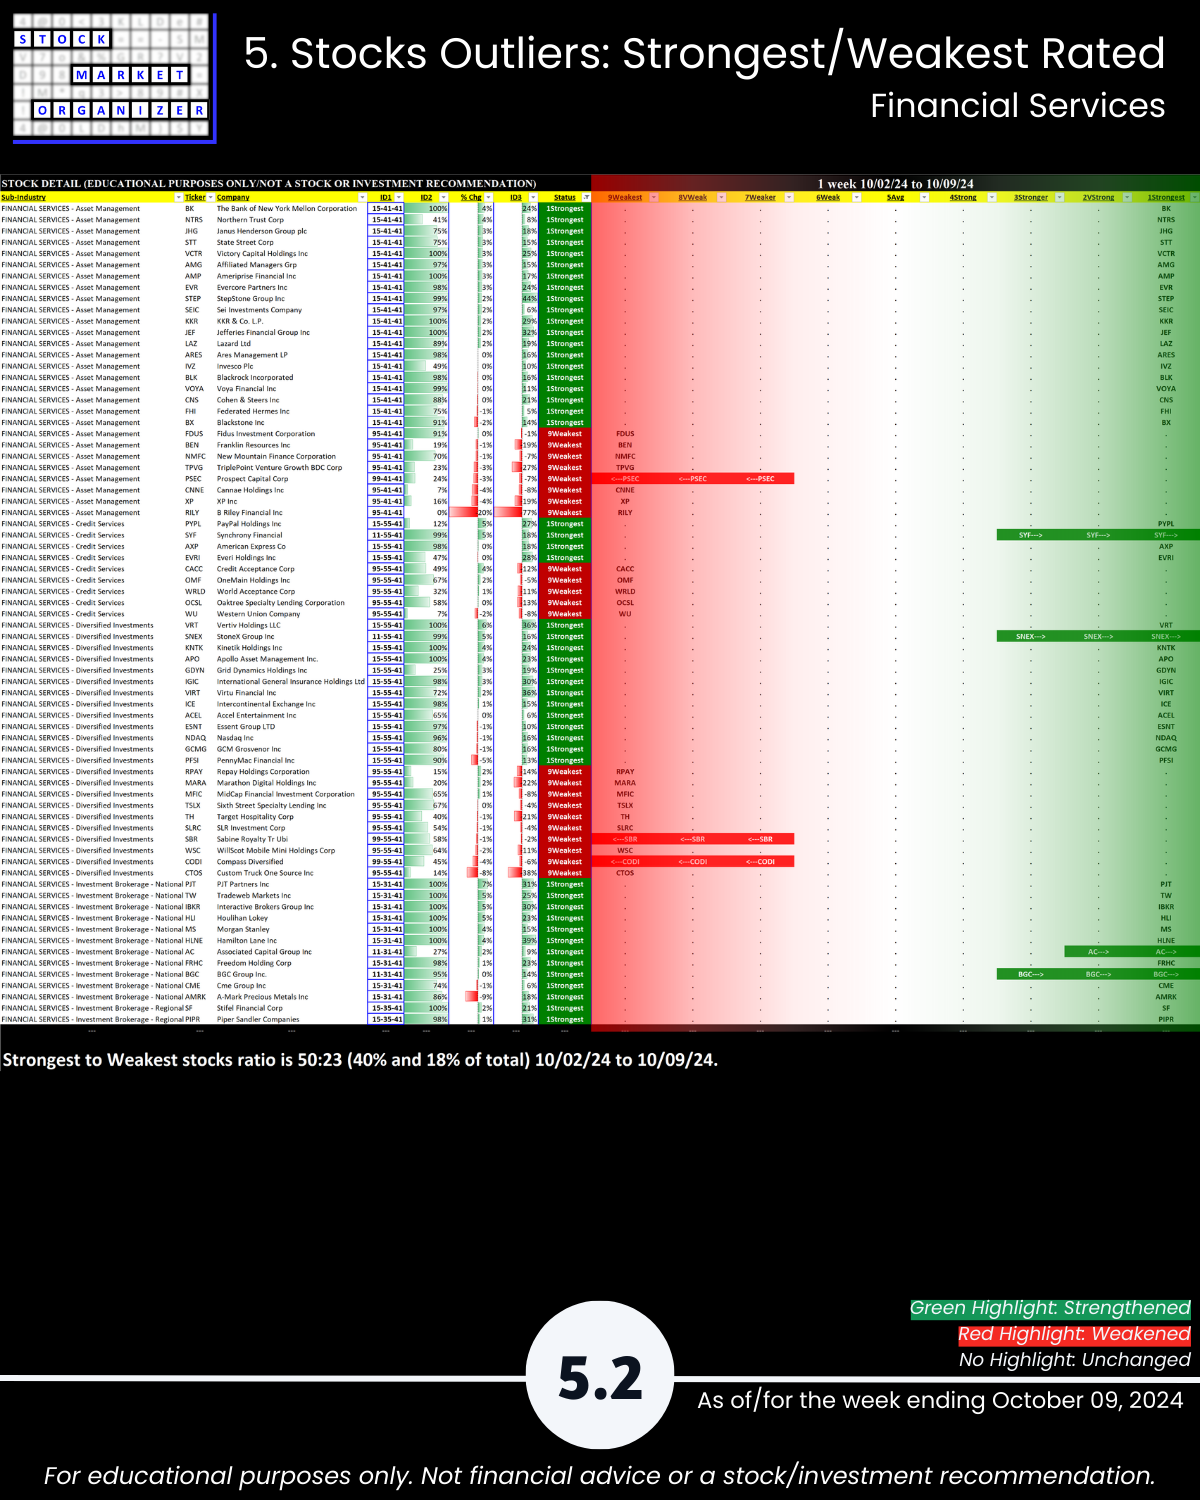
For new longs I would find 1Strongest candidates in Banking (because it strengthened one level) along with Financial Services and Insurance (because both are stronger than 5Average). I want the strongest stocks in the strongest sectors, industries, and sub-industries.* Why? Because there must be reasons for this strength at these levels. As I will be the last person to know why, I will trust that those with the power to move prices have done their homework and they are supporting these sub-groupings and these stocks for solid reasons. In turn, should these stocks begin to falter, these stocks will enjoy support from those happy to purchase more stock at favorable prices.
For new shorts I would find 9Weakest candidates in Real Estate, because it weakened one level. I want the weakest stocks in the weakest sectors, industries, and sub-industries. If a market is making new highs but there are weak stocks in weak sub-categories, it seems logical these have underlying fundamental reasons for this weakness and will be the first dead weight trimmed from portfolios if for no reason other than window-dressing.
*Since this analysis uses the larger +/-2,700 stock universe and therefore can be meaningfully segregated into industry and sub-industry groupings, the strength and weakness stacking can go even deeper than the ETF strength/weakness stacking. That is, if desired for longs one can find 1Strongest candidates only in strong/strengthening sub-industries in strong/strengthening industries, while the sector grouping is strengthening and the market has a positive strength score.
Details are below shown in a manner not available elsewhere because I created it from scratch to continually answer this question: “Where is there strengthening and weakening in the market at the stock, sub-industry, industry, and sector levels?” Combine this with the top-down Market Strength Score and Sector Risk Gauge to get a key competitive advantage of understanding strength at every level.
1. Introduction
2. Industry 1-Week Strengthening
3. Industry 10-Week Strengthening
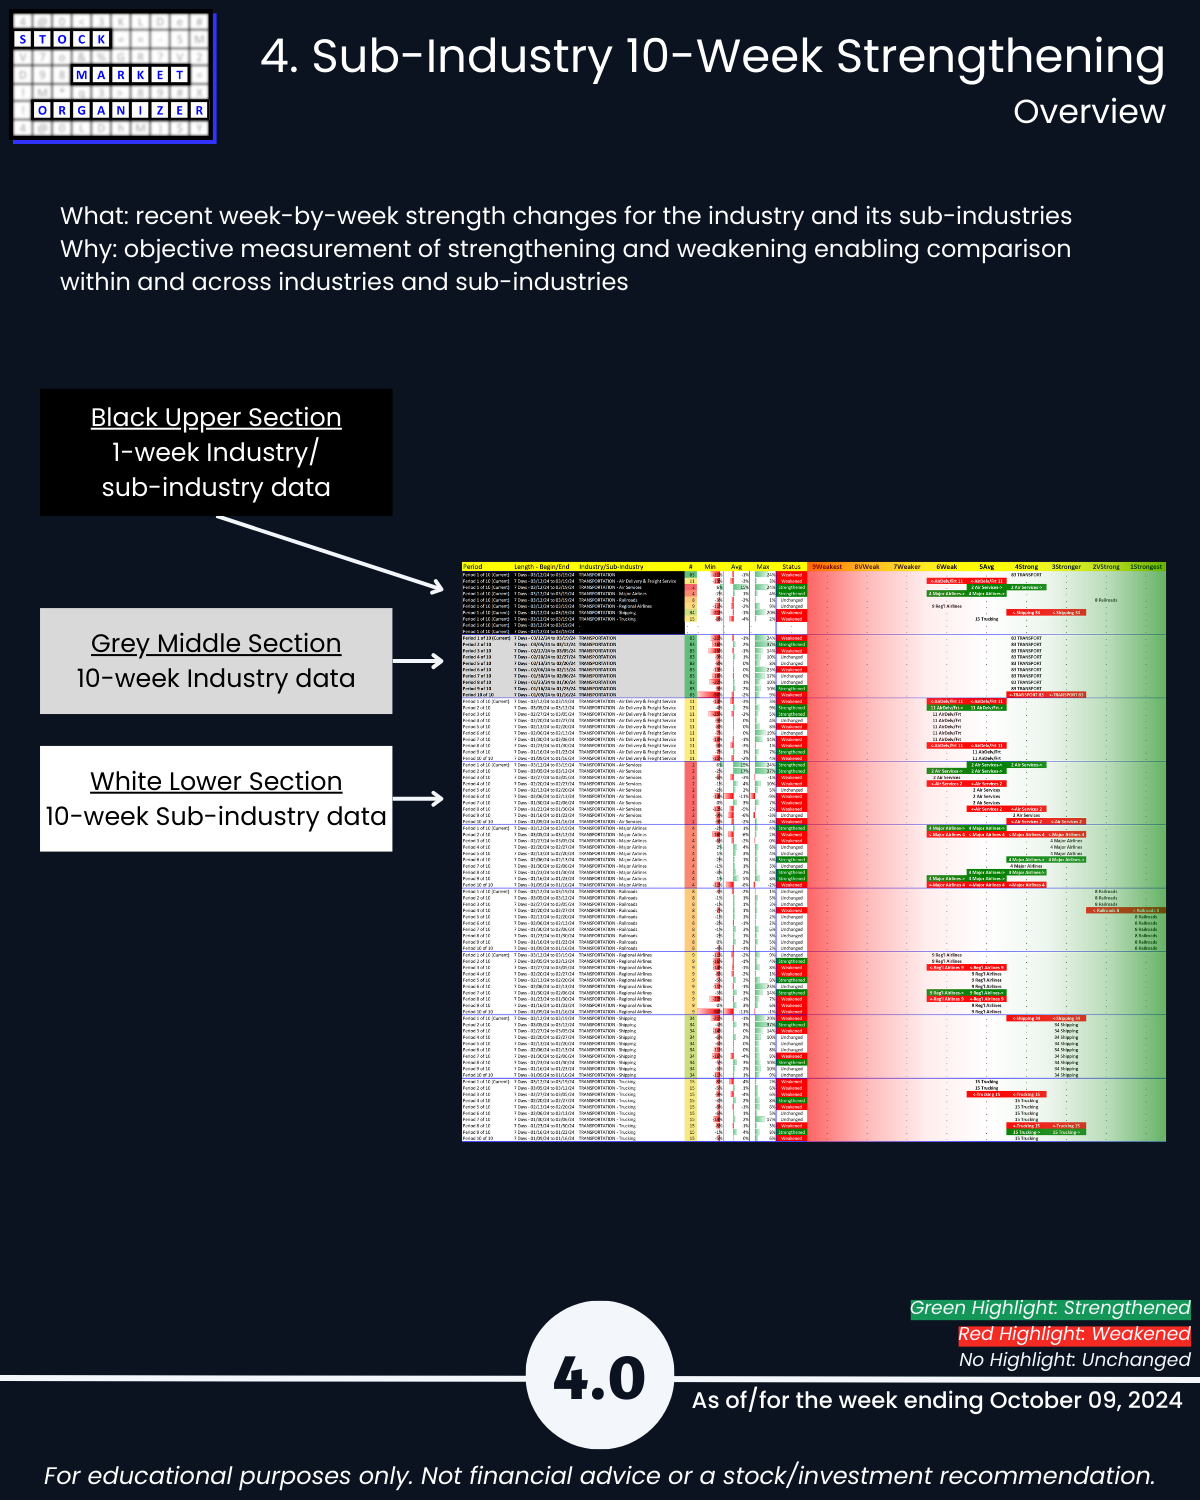
4. Sub-Industry 10-Week Strengthening
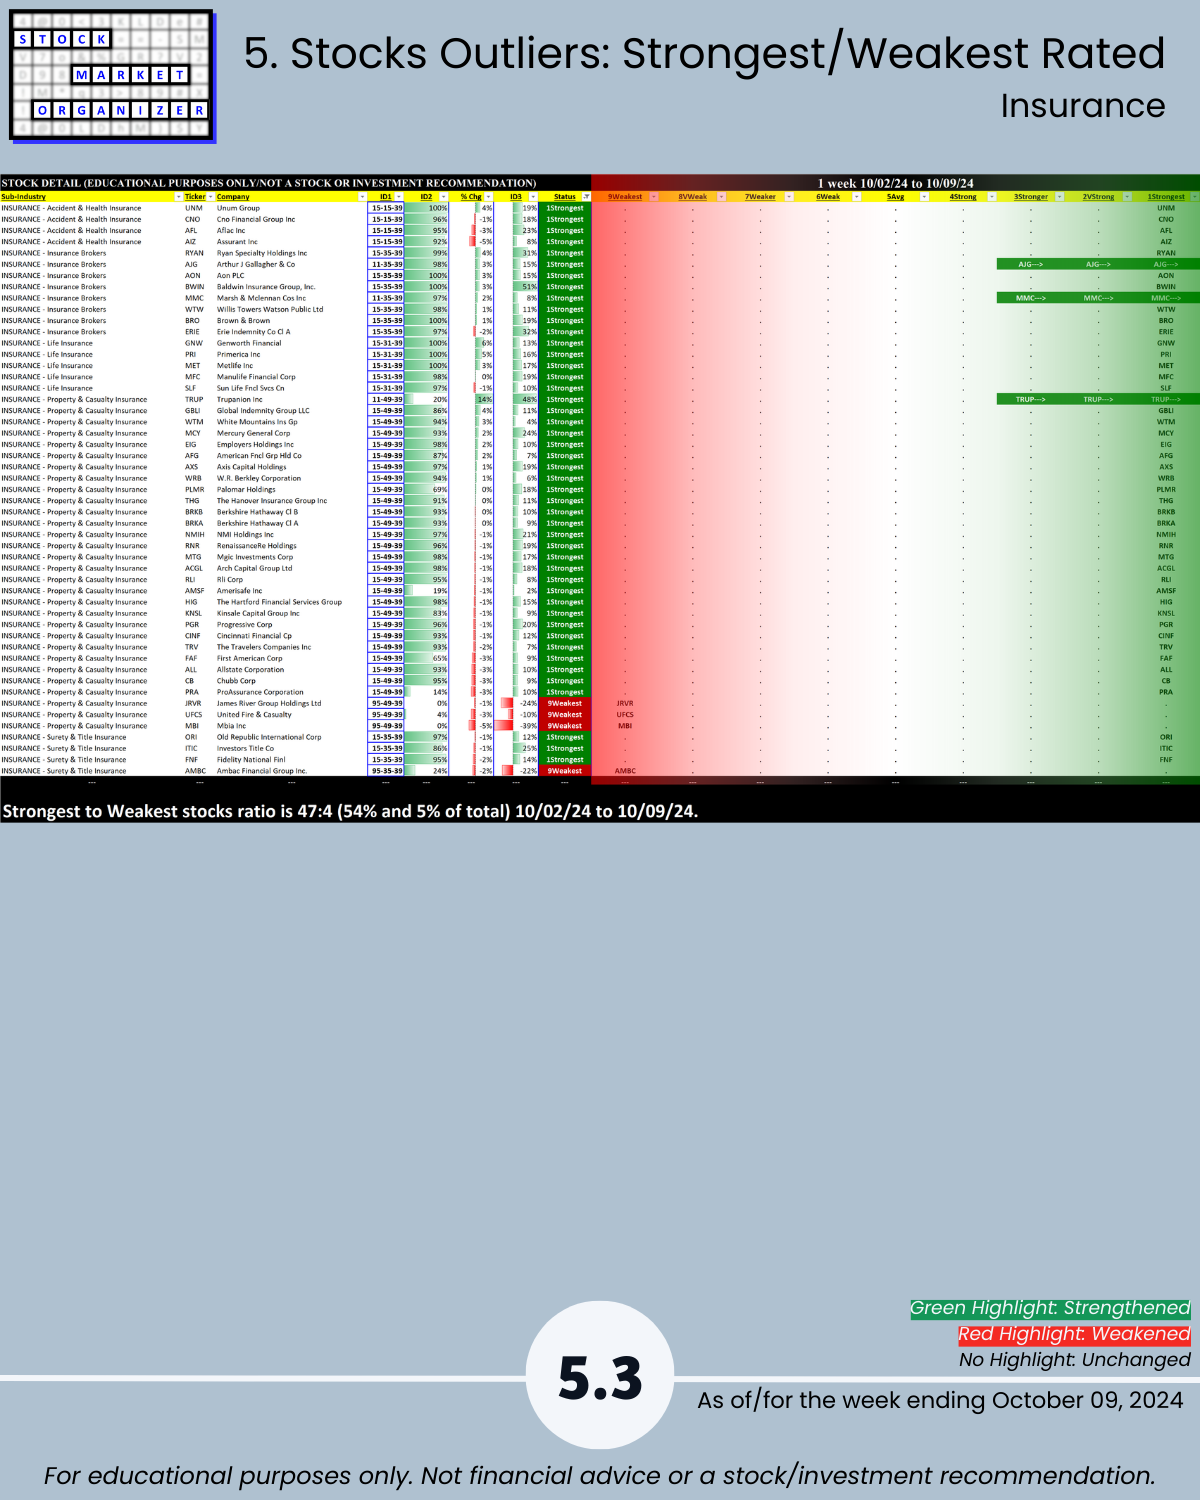
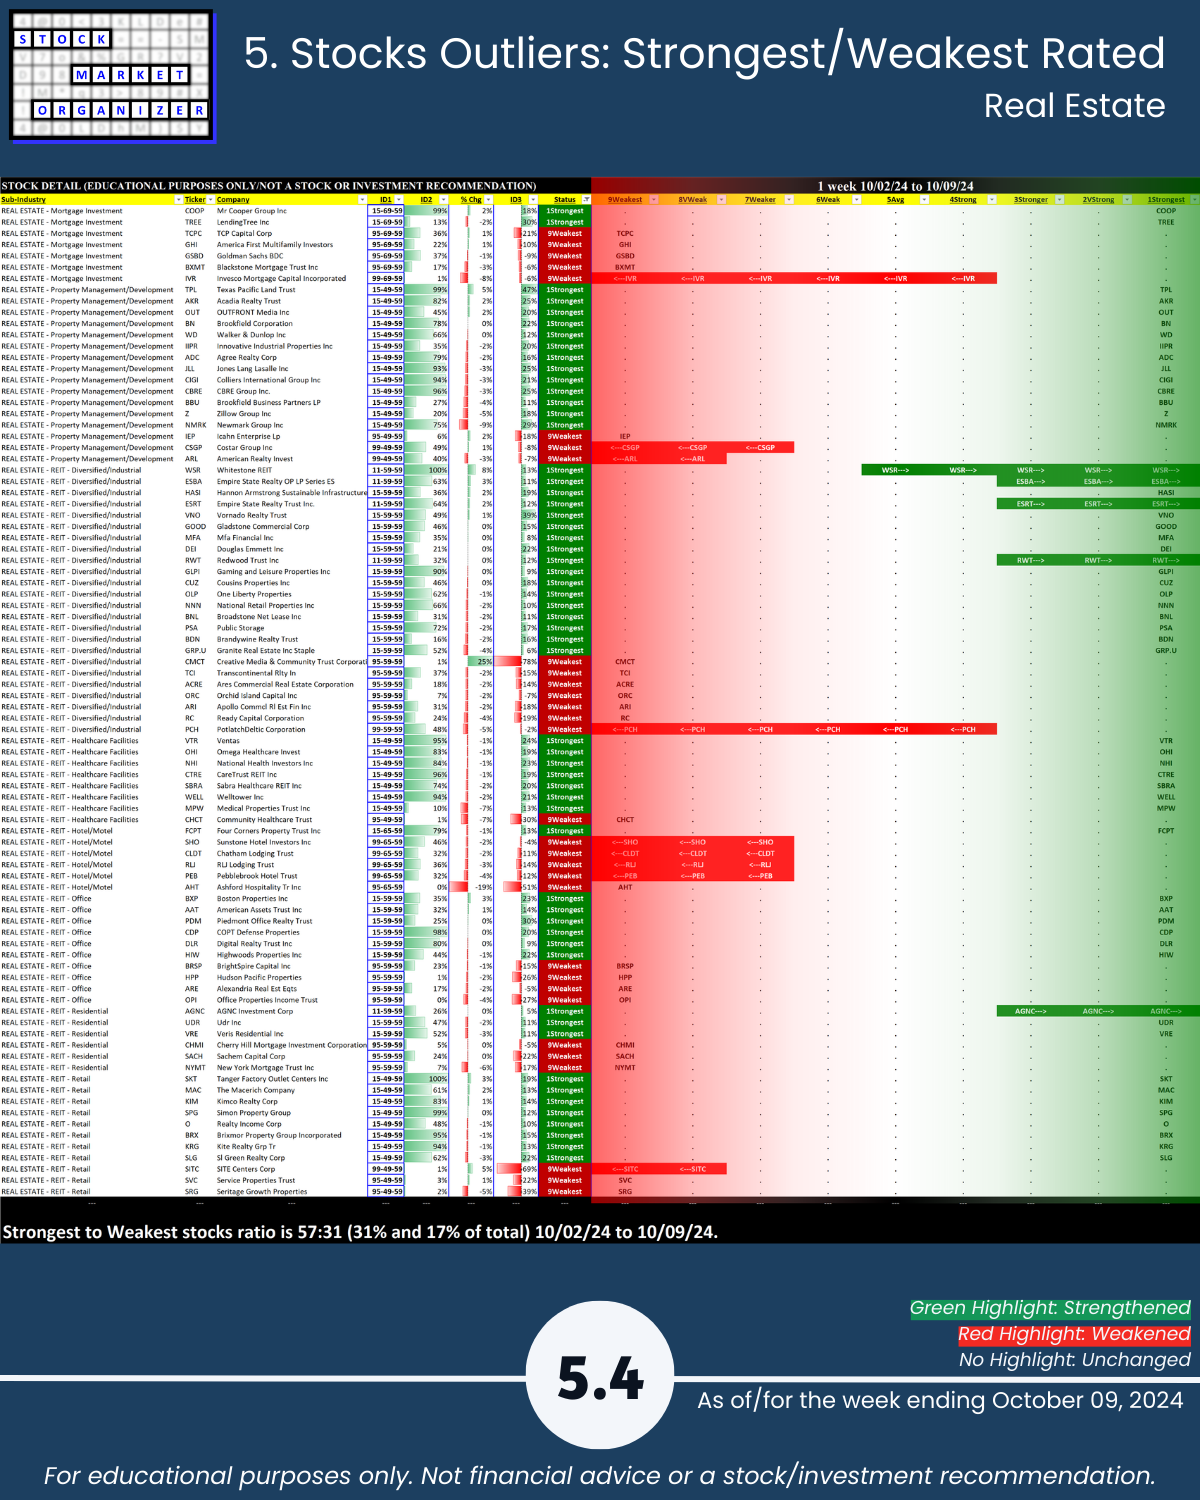
5. Stocks Outliers: Strongest/Weakest Rated
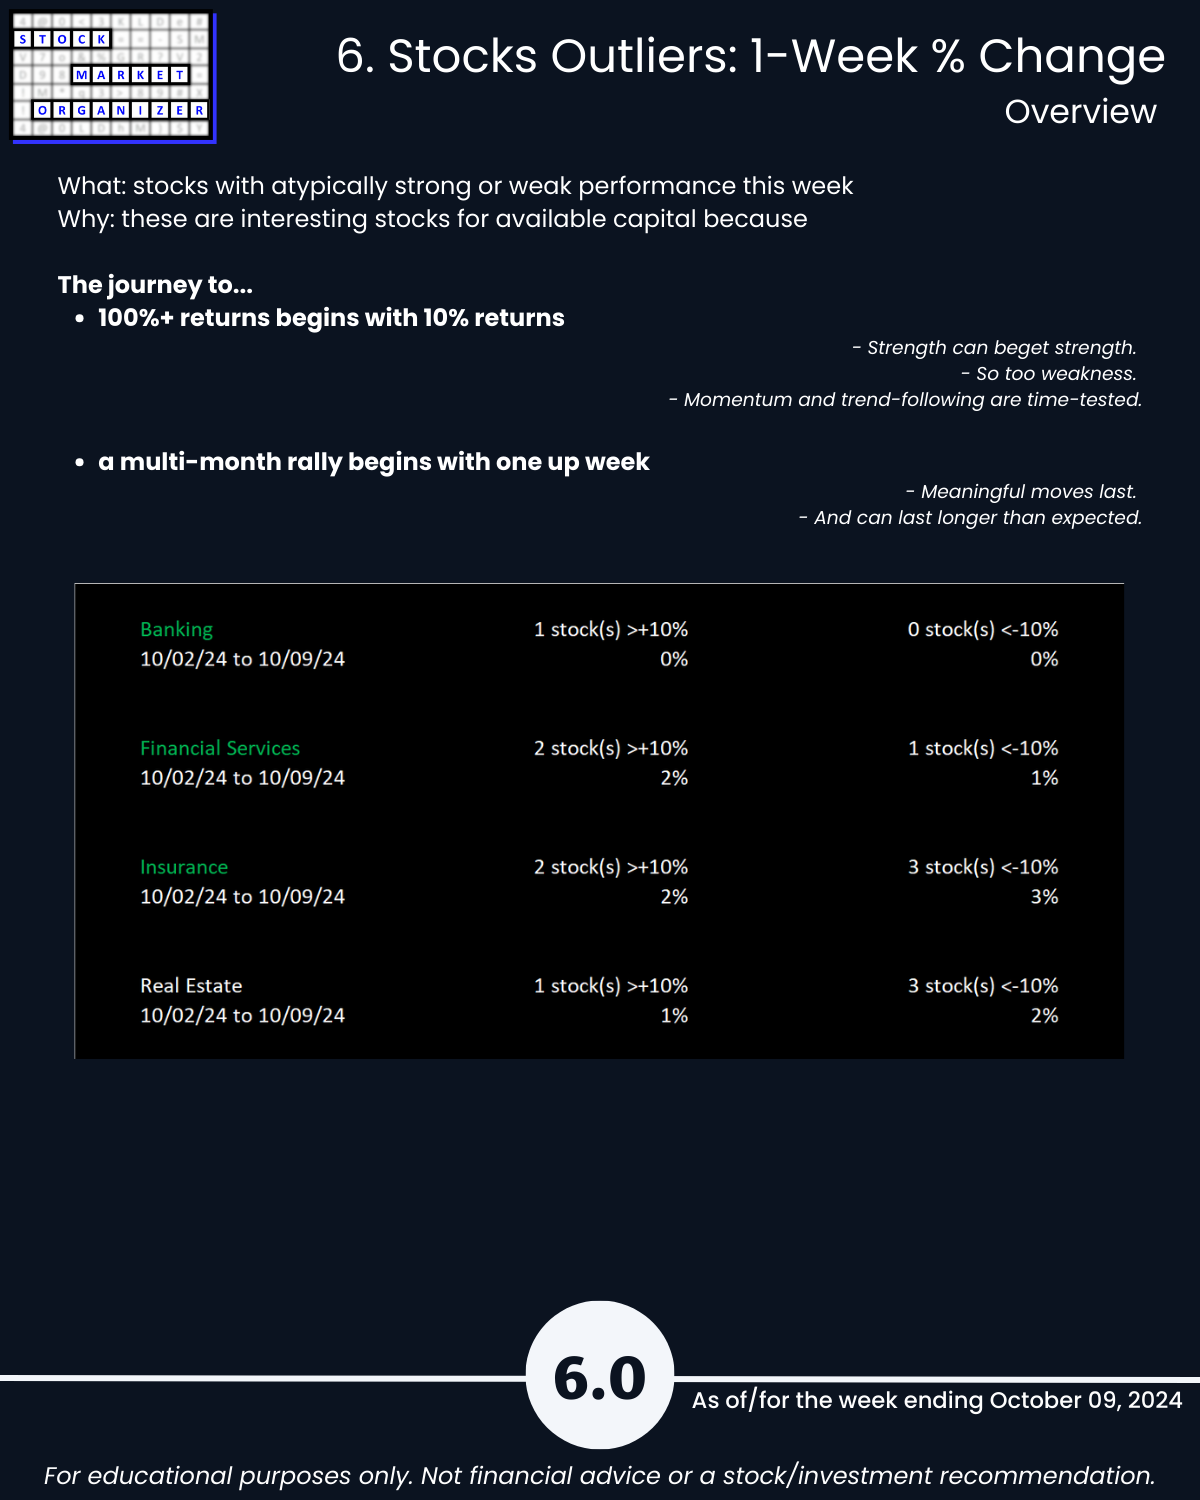
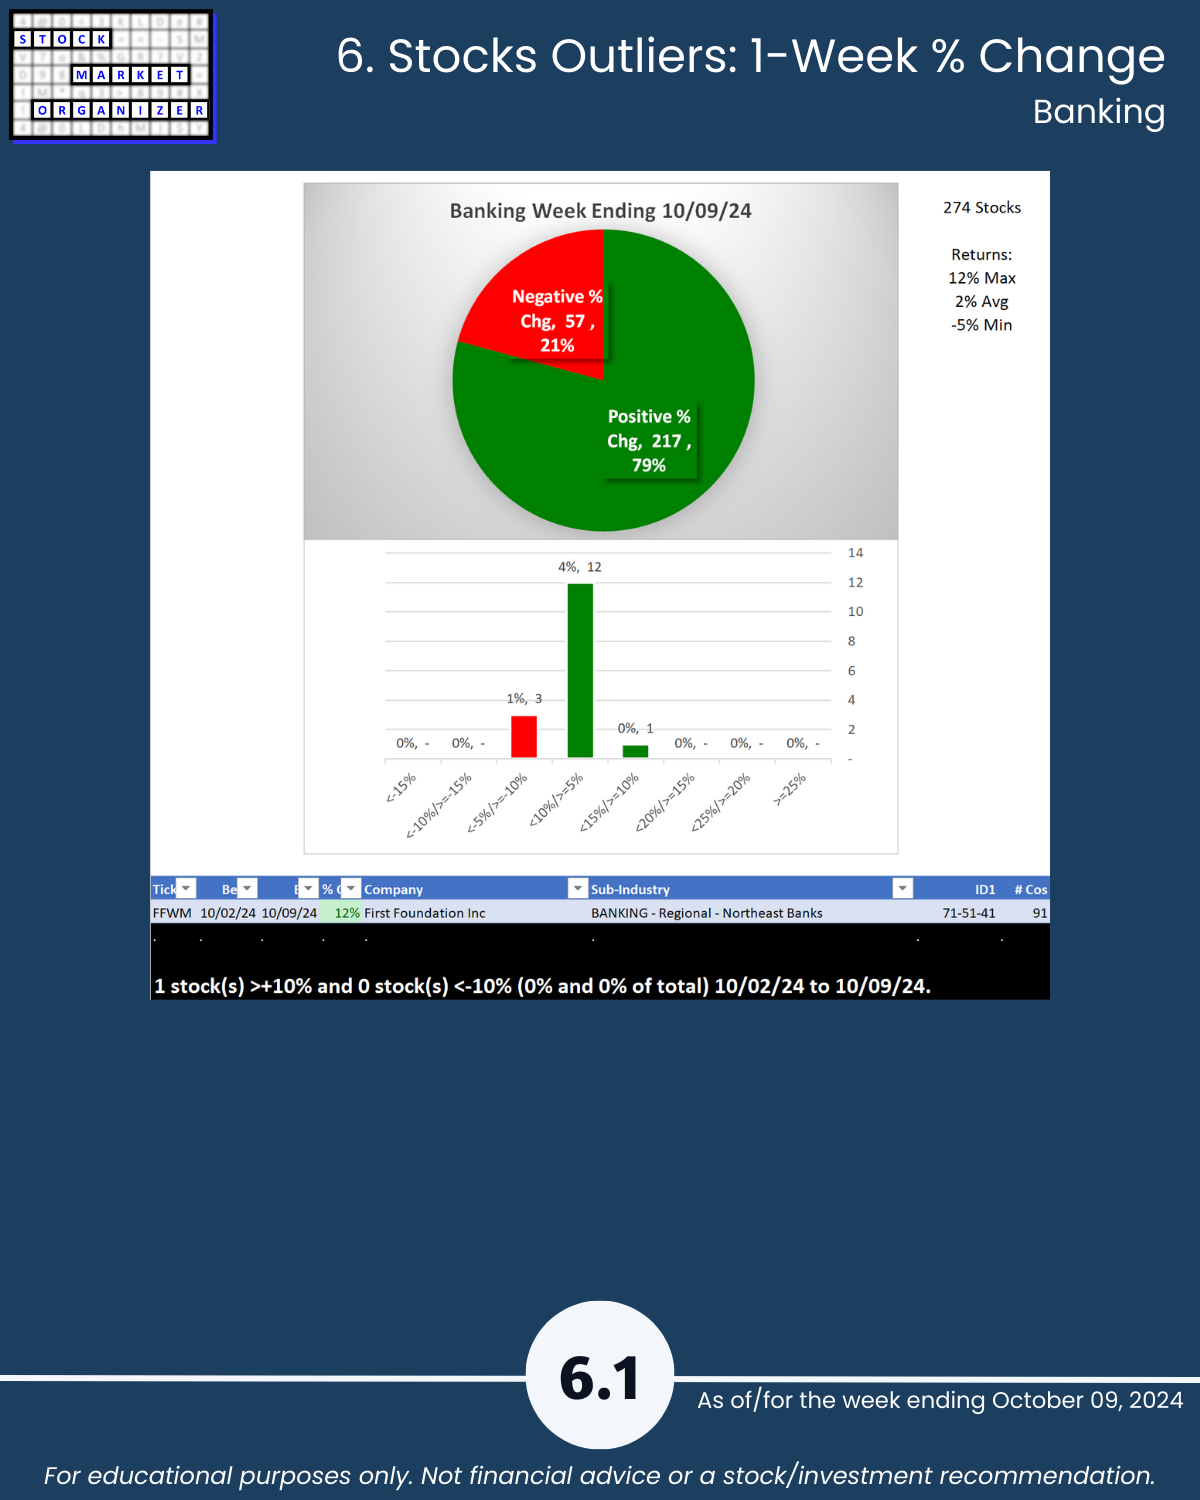
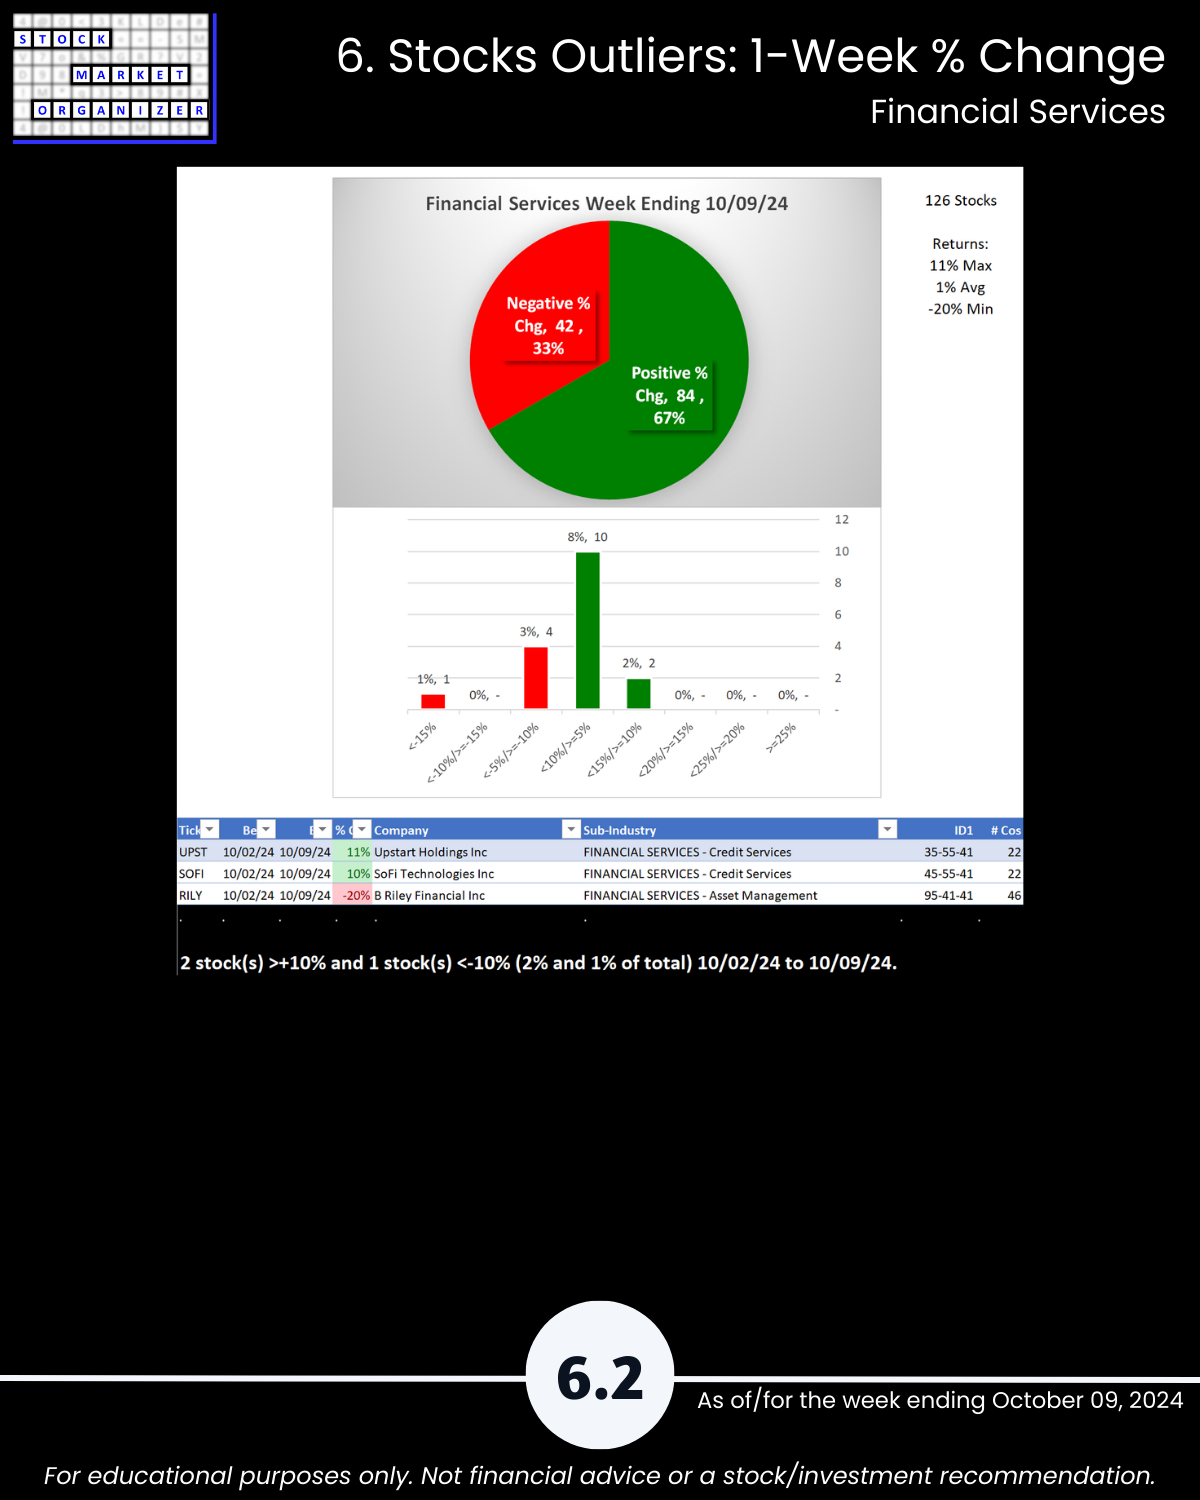
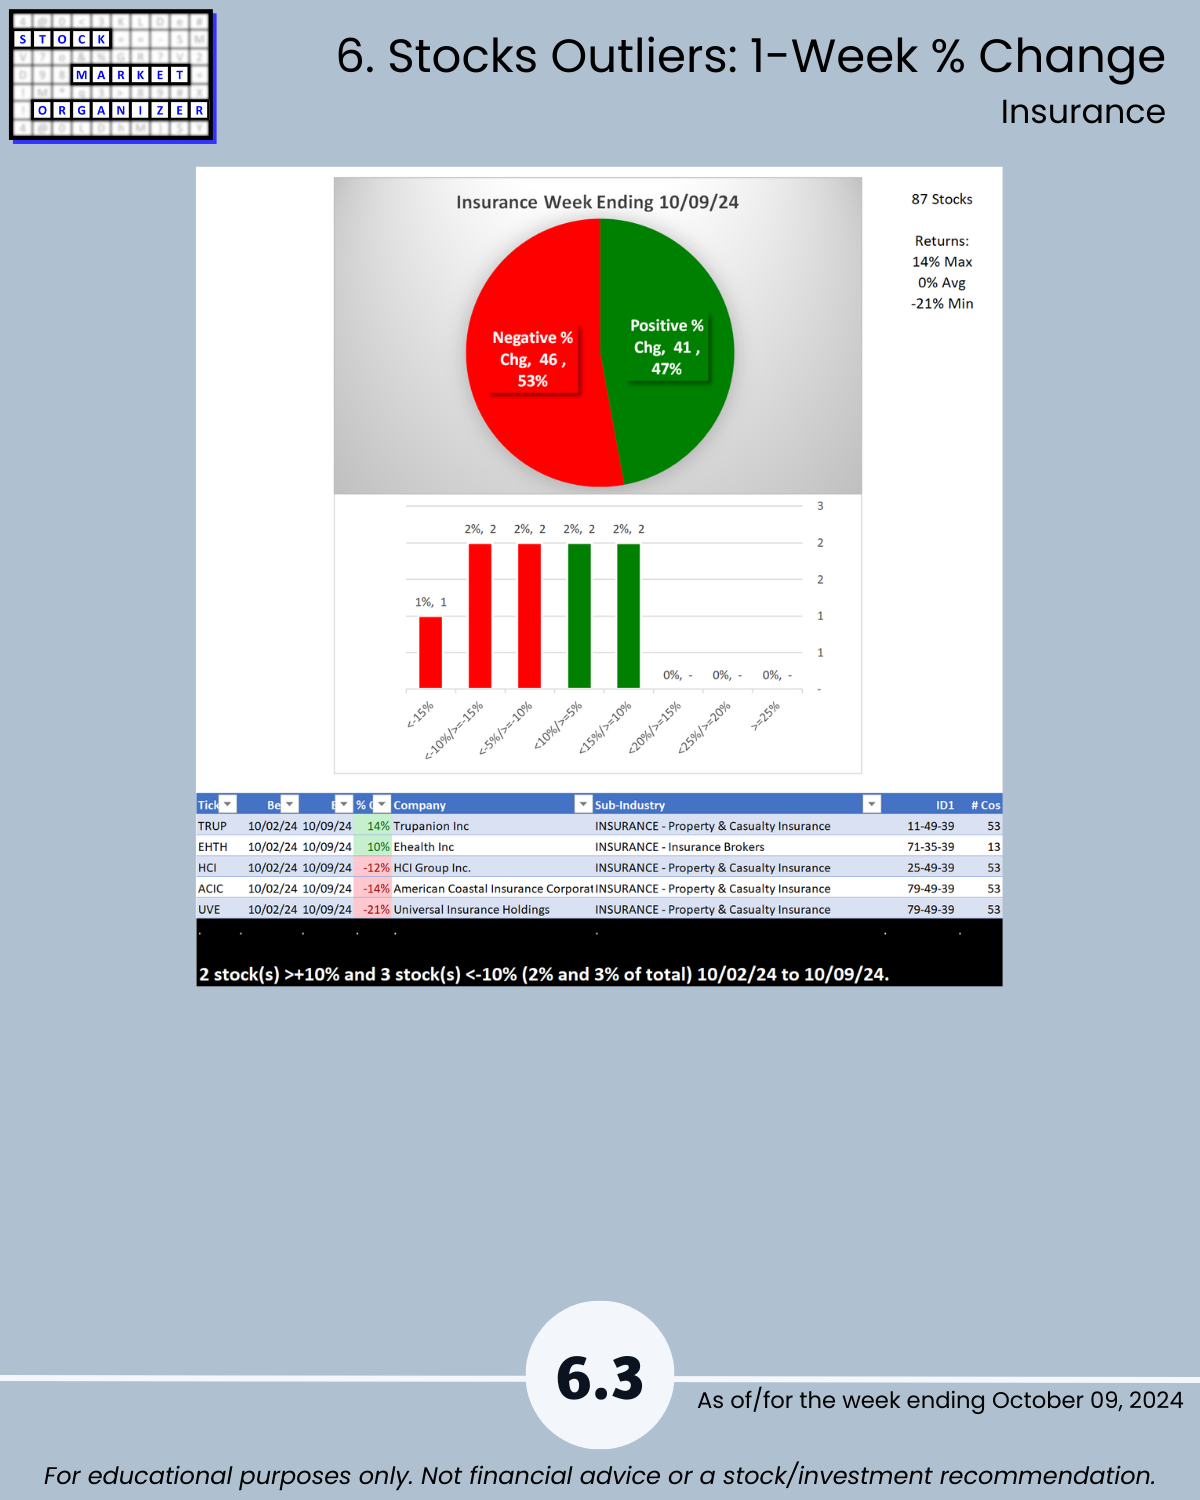
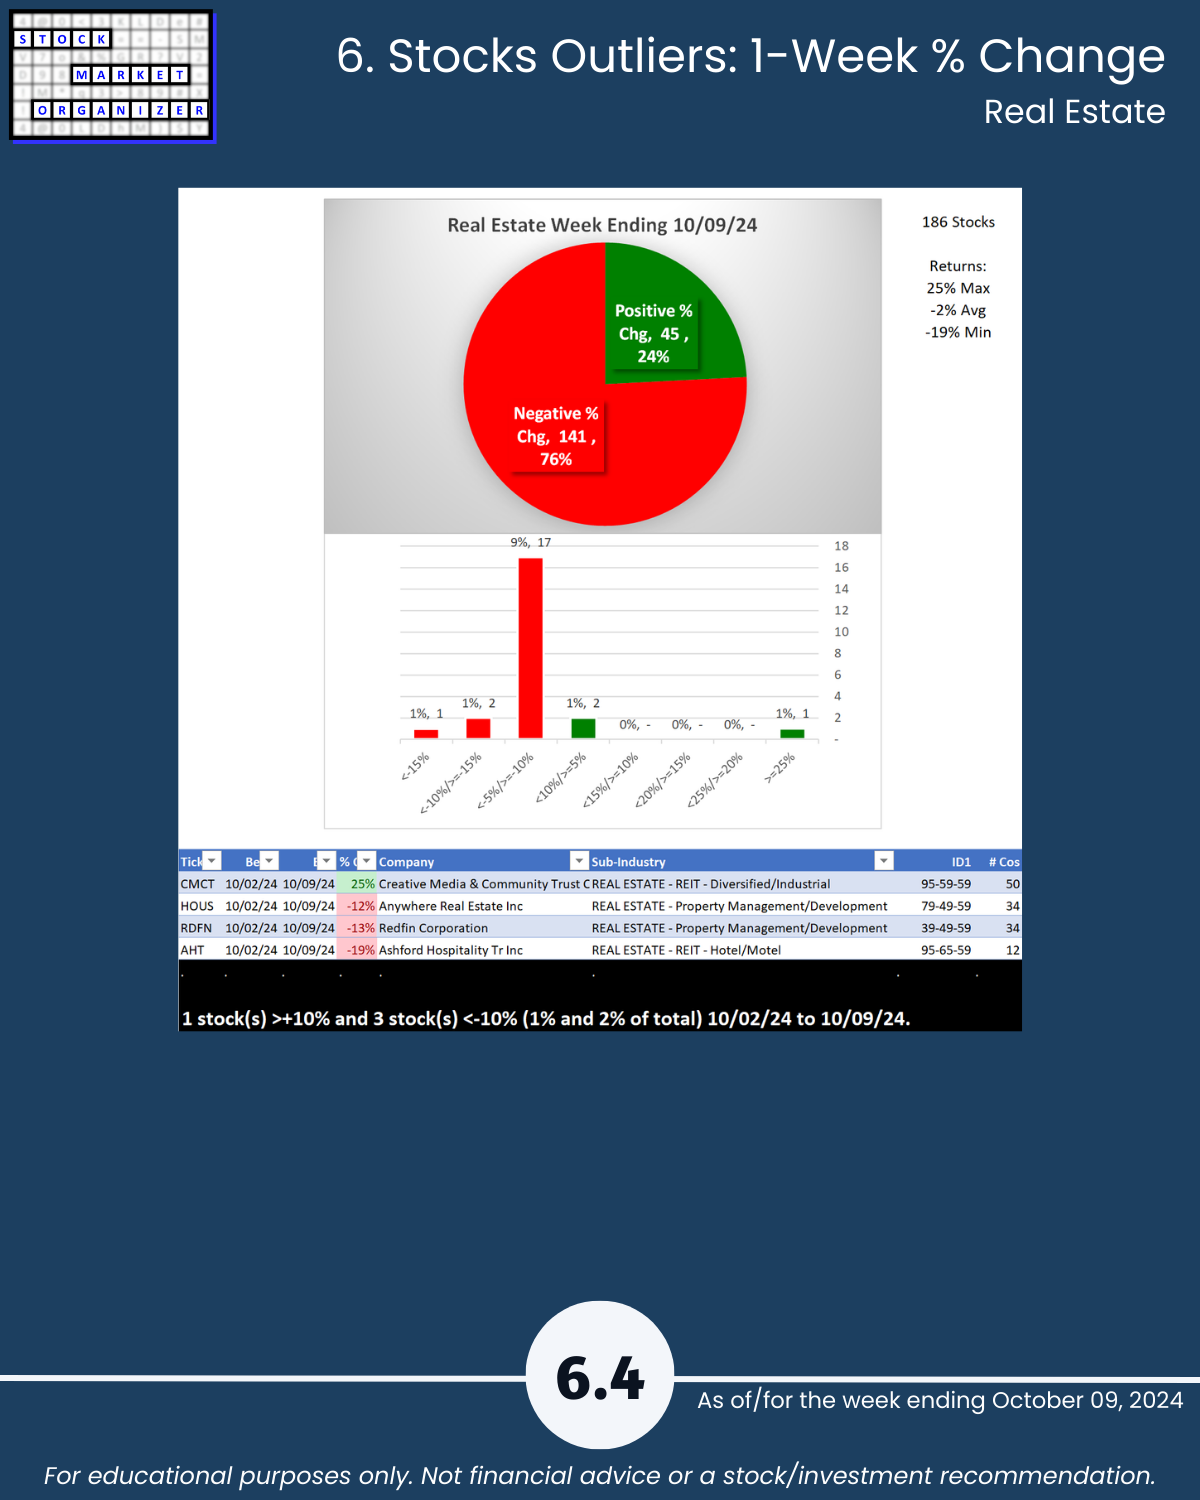
6. Stocks Outliers: 1-Week % Change
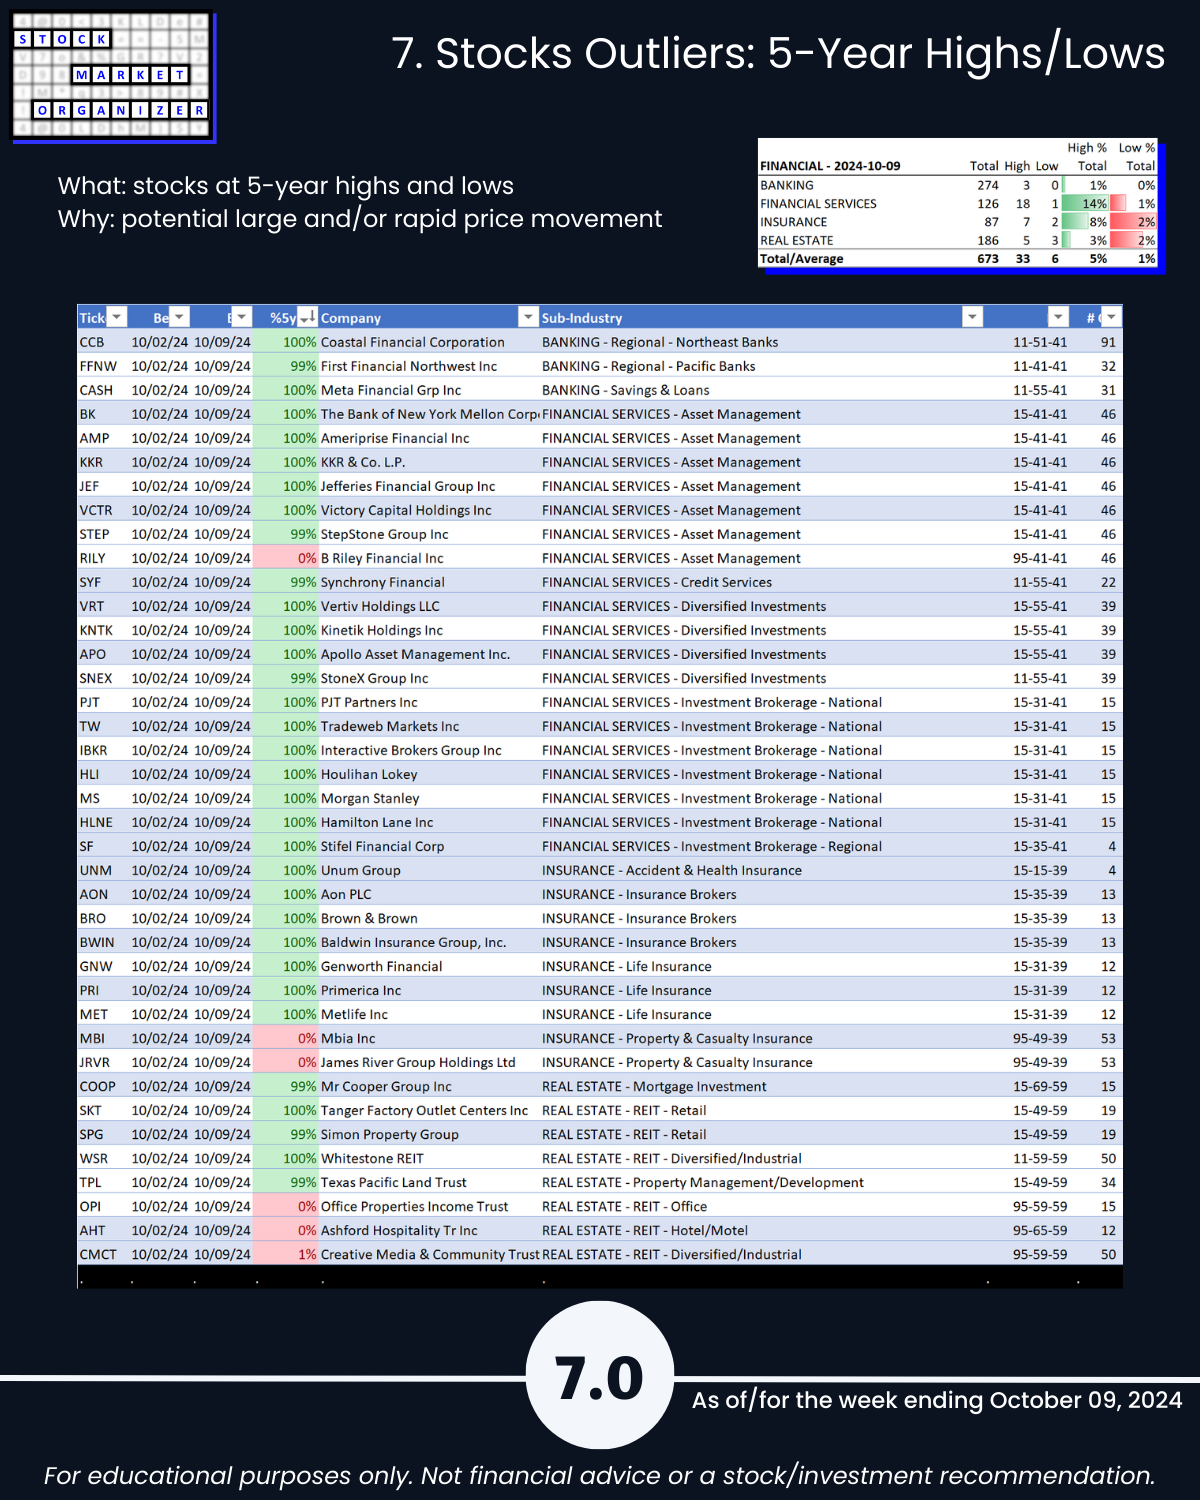
7. Stocks Outliers: 5-Year Highs/Lows