SMO Exclusive: Strength Report Financial Sector 2024-03-27

ICYMI Financials (Banking, Financial Services, Insurance, Real Estate) STRENGTHENED broadly for the week ending 3/27/24. I don’t predict so IDK if this will continue but you can’t have a multi-week rally without the first up week. And you can’t get 100% returns without first getting 10% returns. The market doesn’t have to be so complicated. Forget clues and hints and interpretations. Especially forget your feelings. If you want to know what’s happening in the market, ask the market. However you can. I do so by measuring strength, stock by stock. Follow me if you want regular updates on what IS. I do this in a way others don’t – this is clear from my reports. And if you find someone who can tell you regularly and objectively what WILL BE, then you’ve found the secret to untold riches. Maybe it’s you. Probably not because you wouldn’t be reading this if so.
Unique stats demonstrating Sector strength this week:
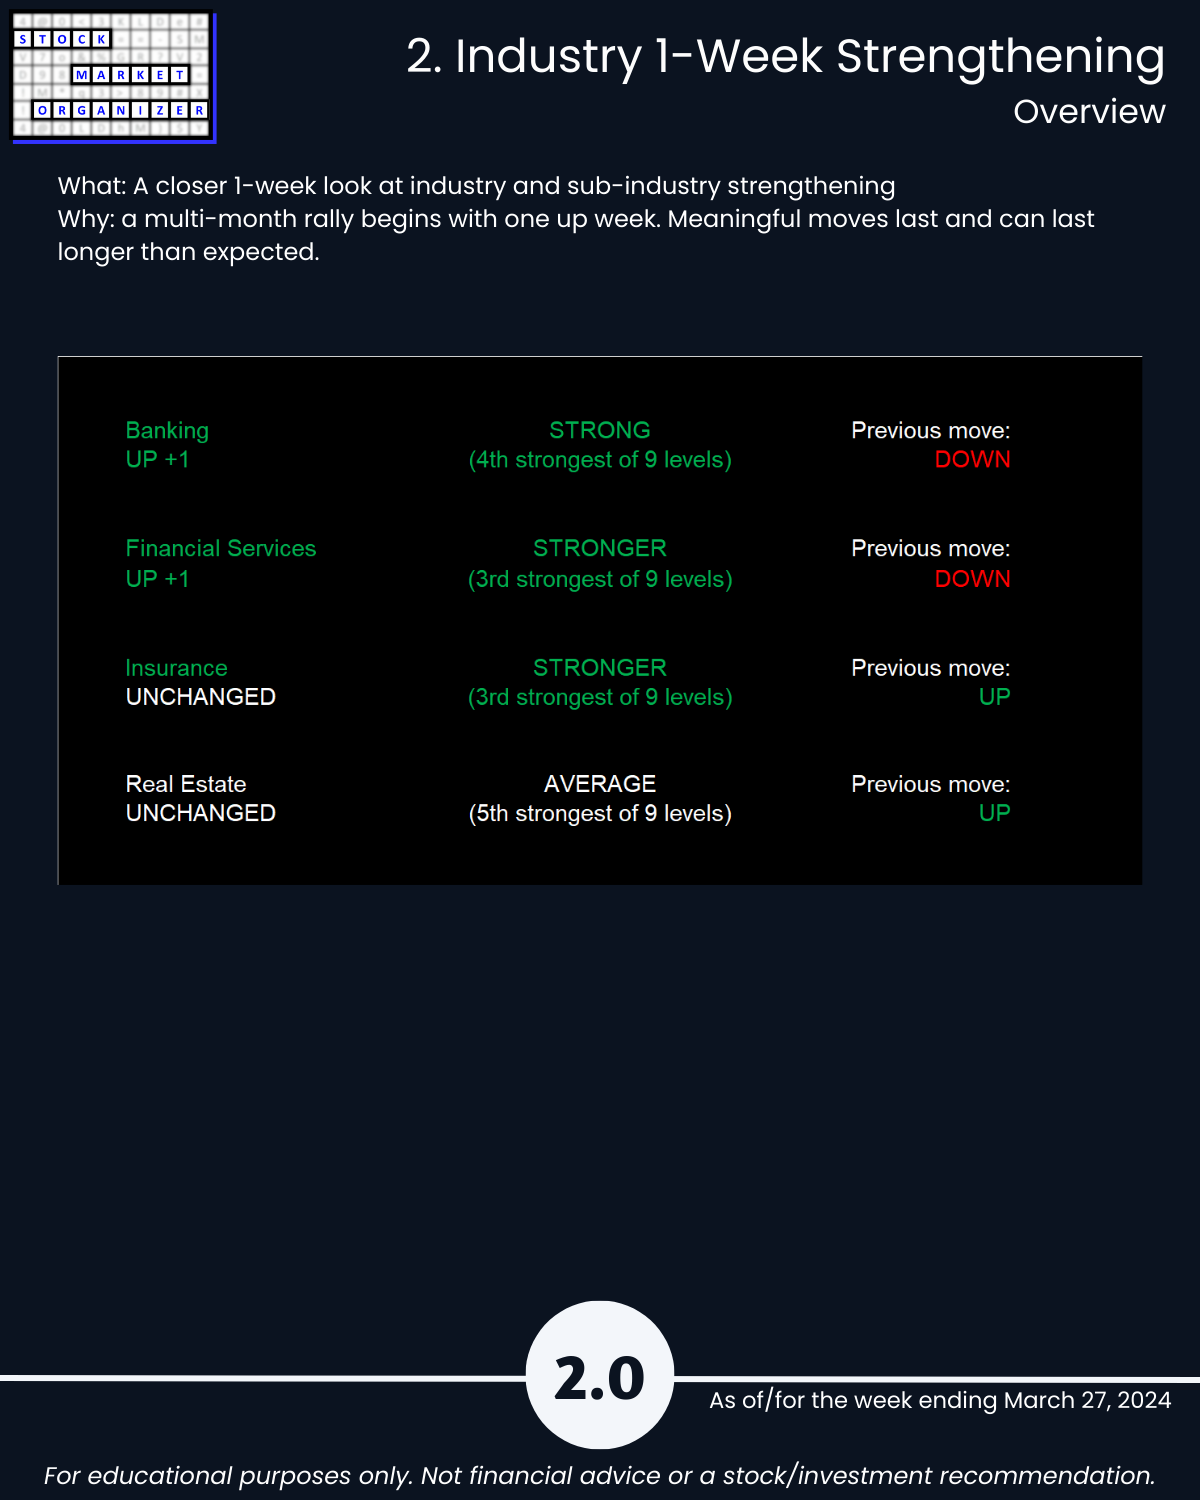
🔹 2 of 4 industries strengthened (Banking and Financial Services)
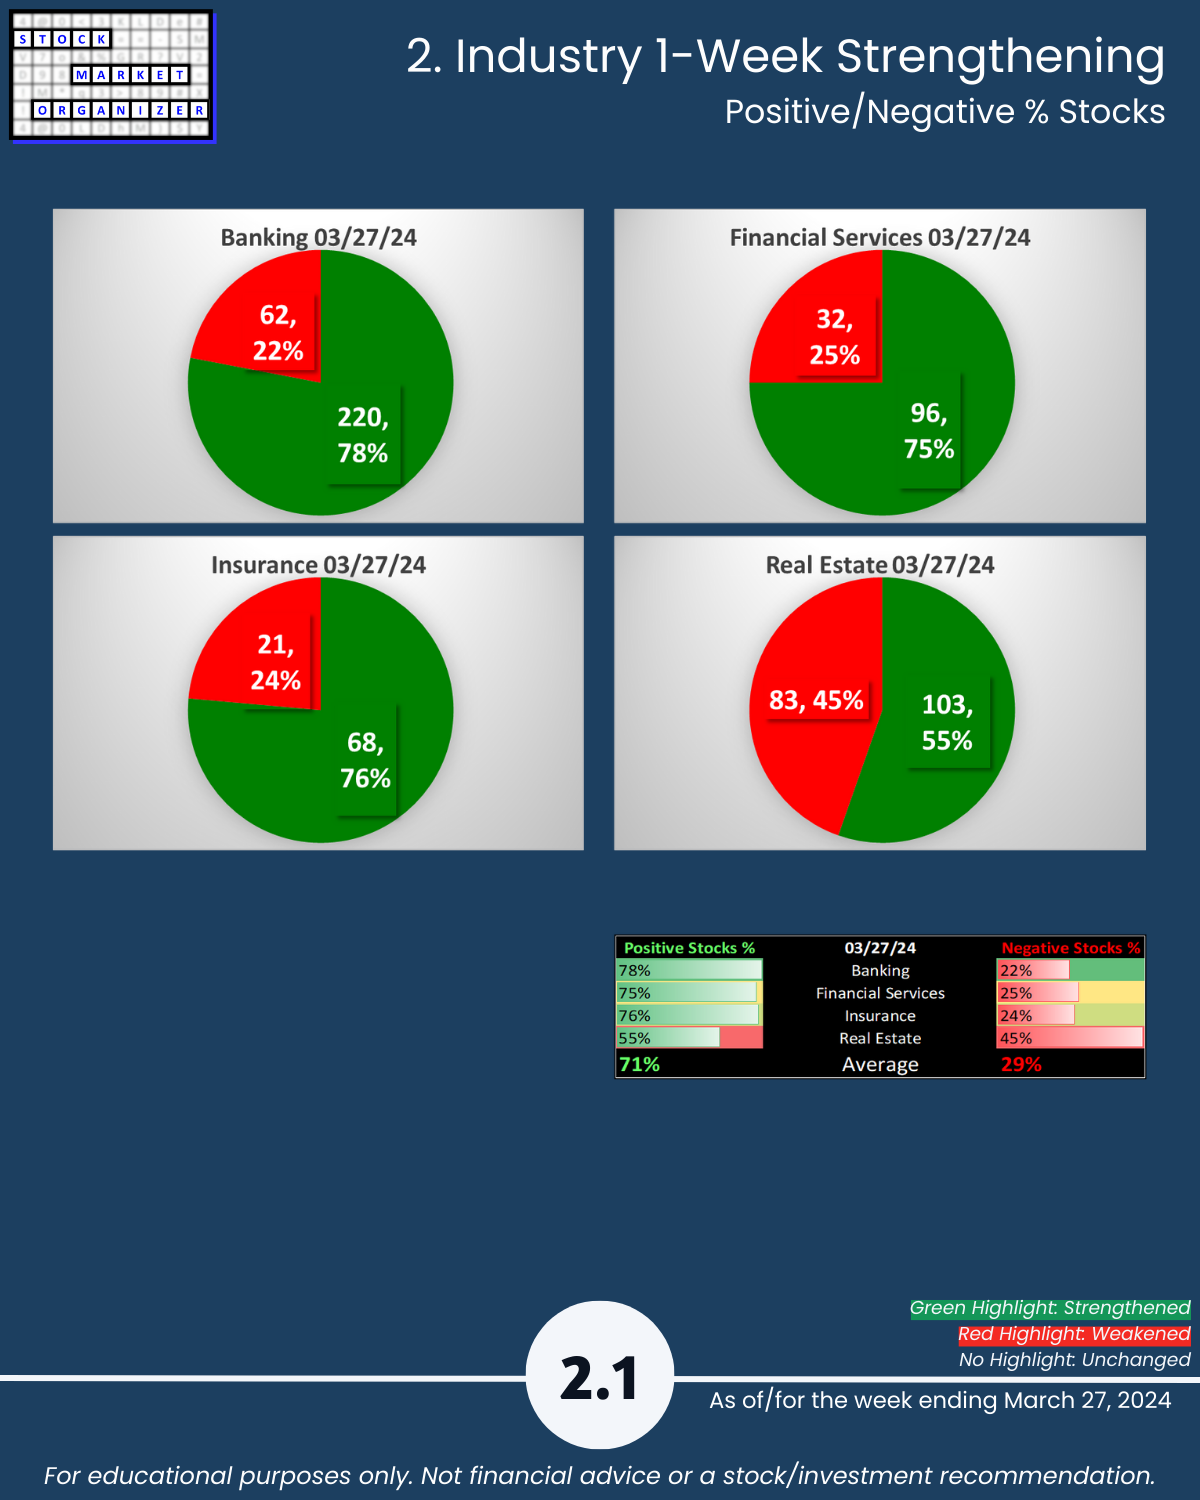
🔹 71% industry average positive stocks (Banking 78%, Insurance 76% positive)
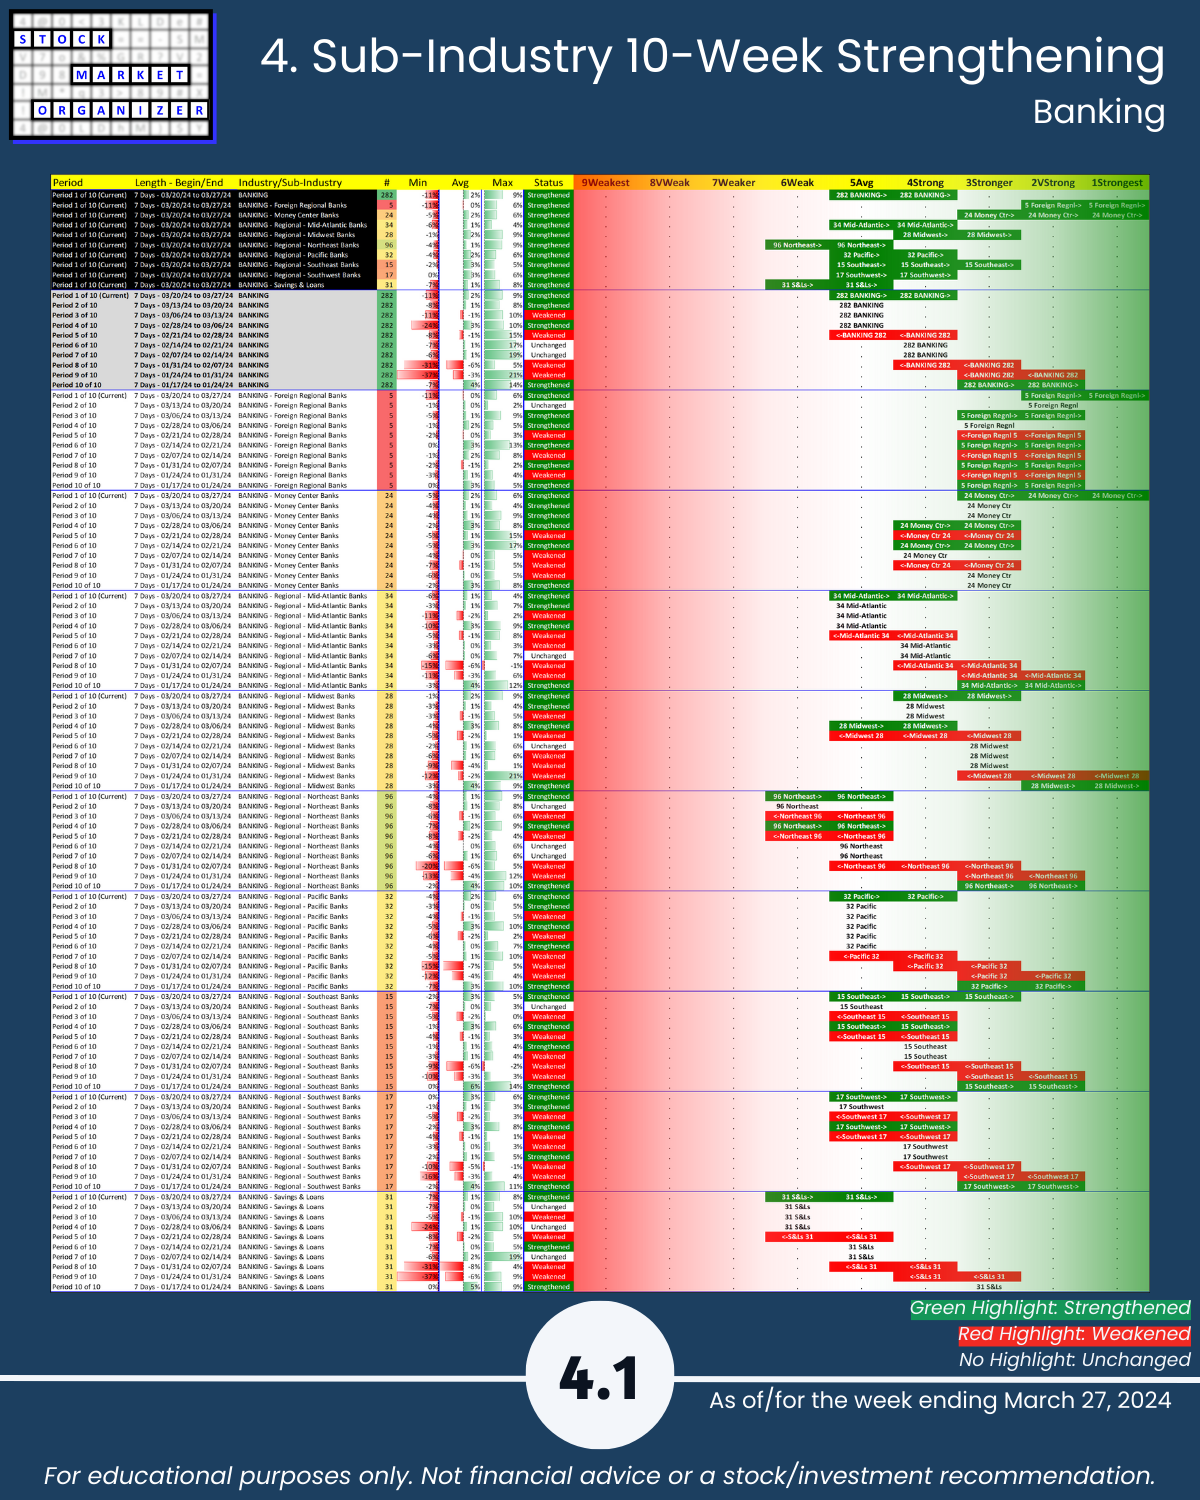
🔹 9 of 9 Banking sub-industries strengthened
🔹 48% of 27 sub-industries strengthened
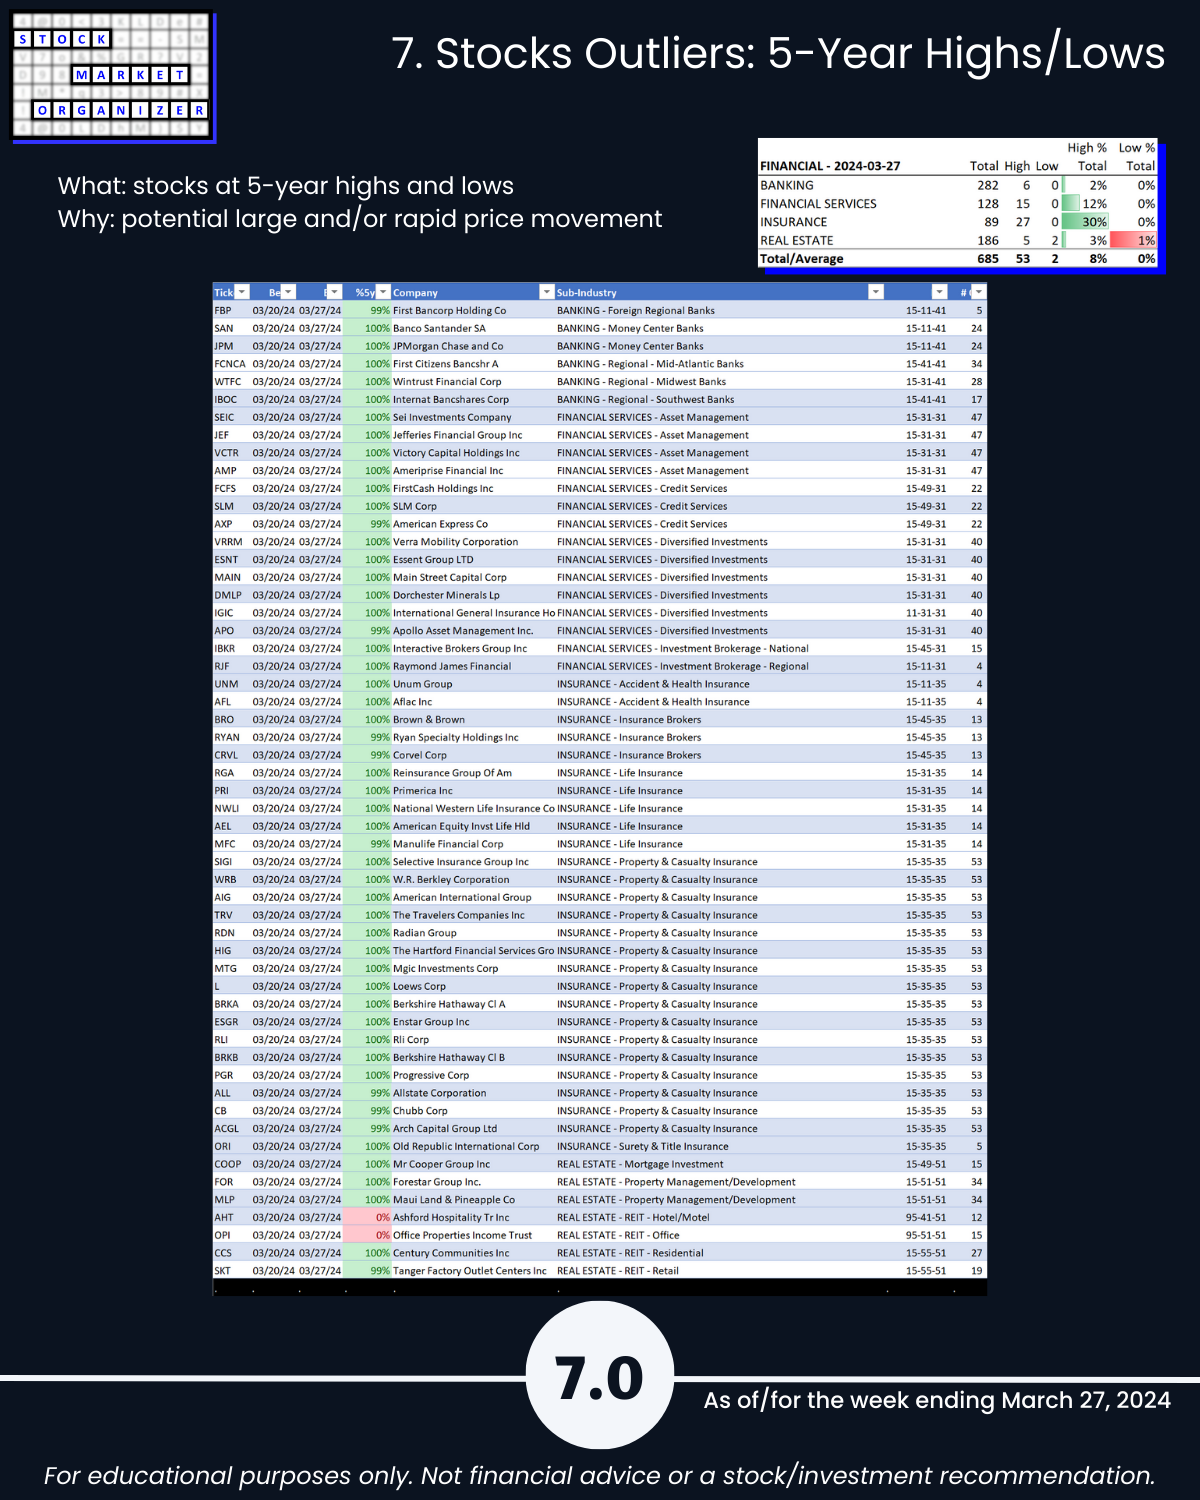
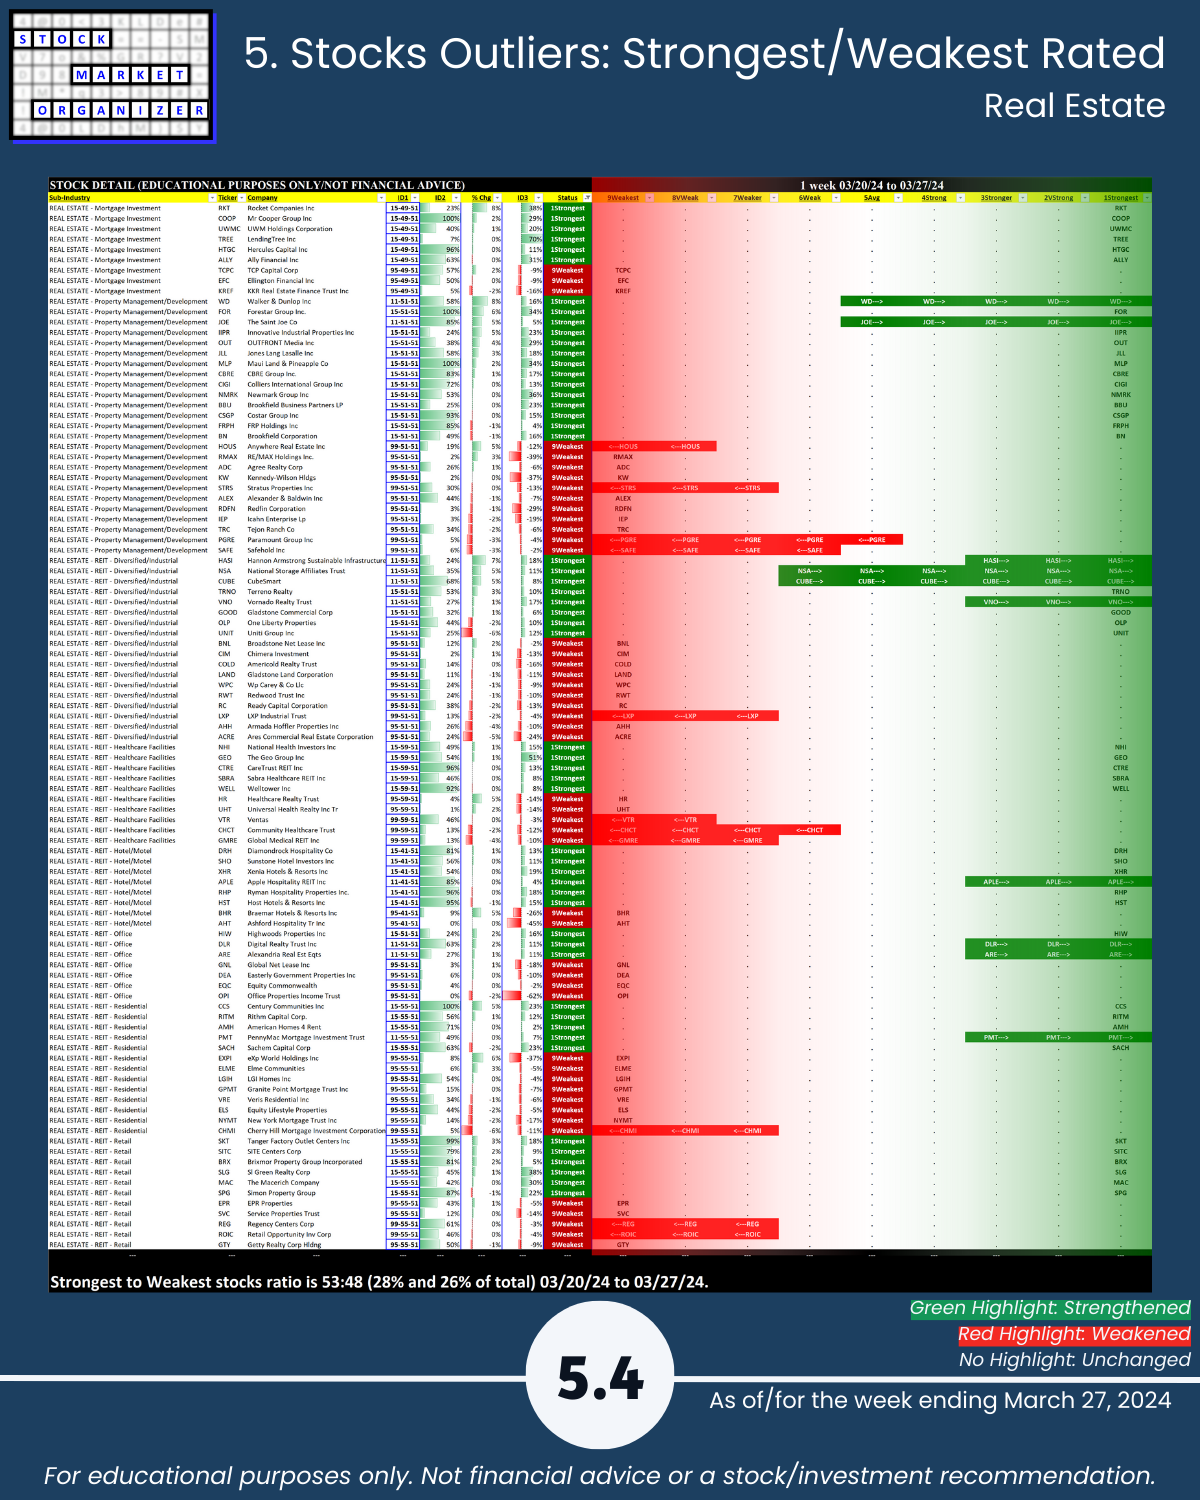
🔹 53 stocks at 5+ year highs, 2 at 5+ year lows (mean reverters check out AHT and OPI)
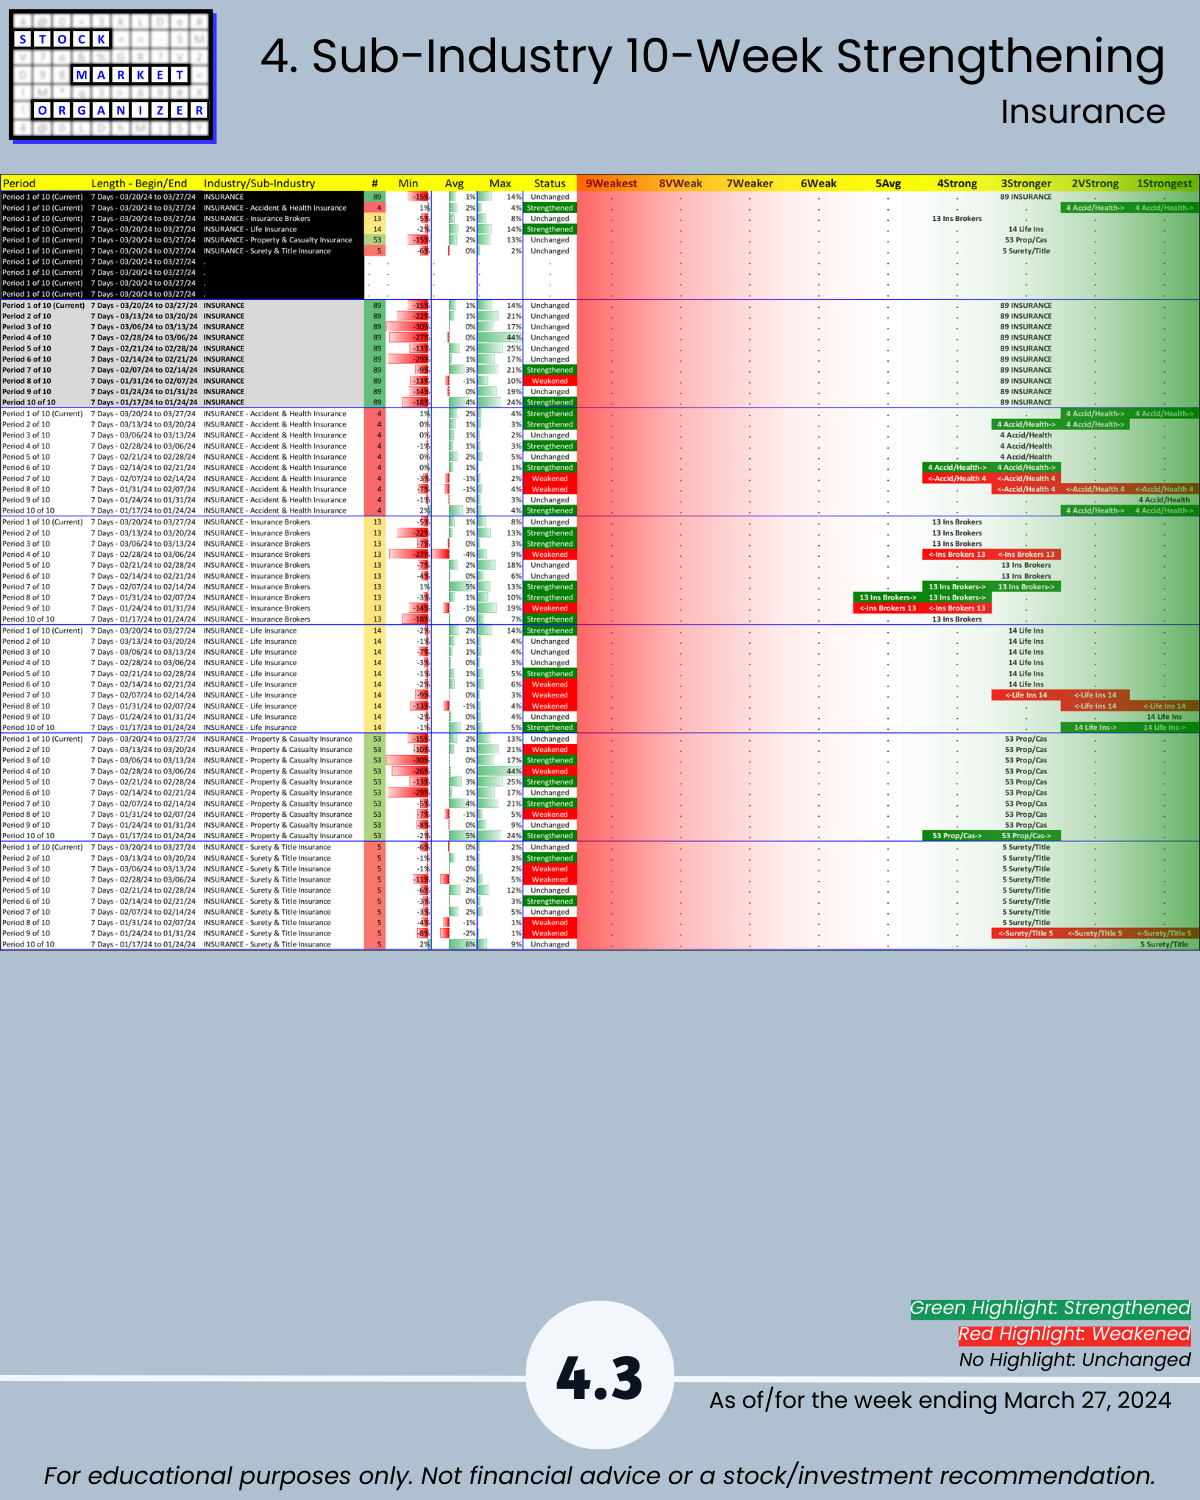
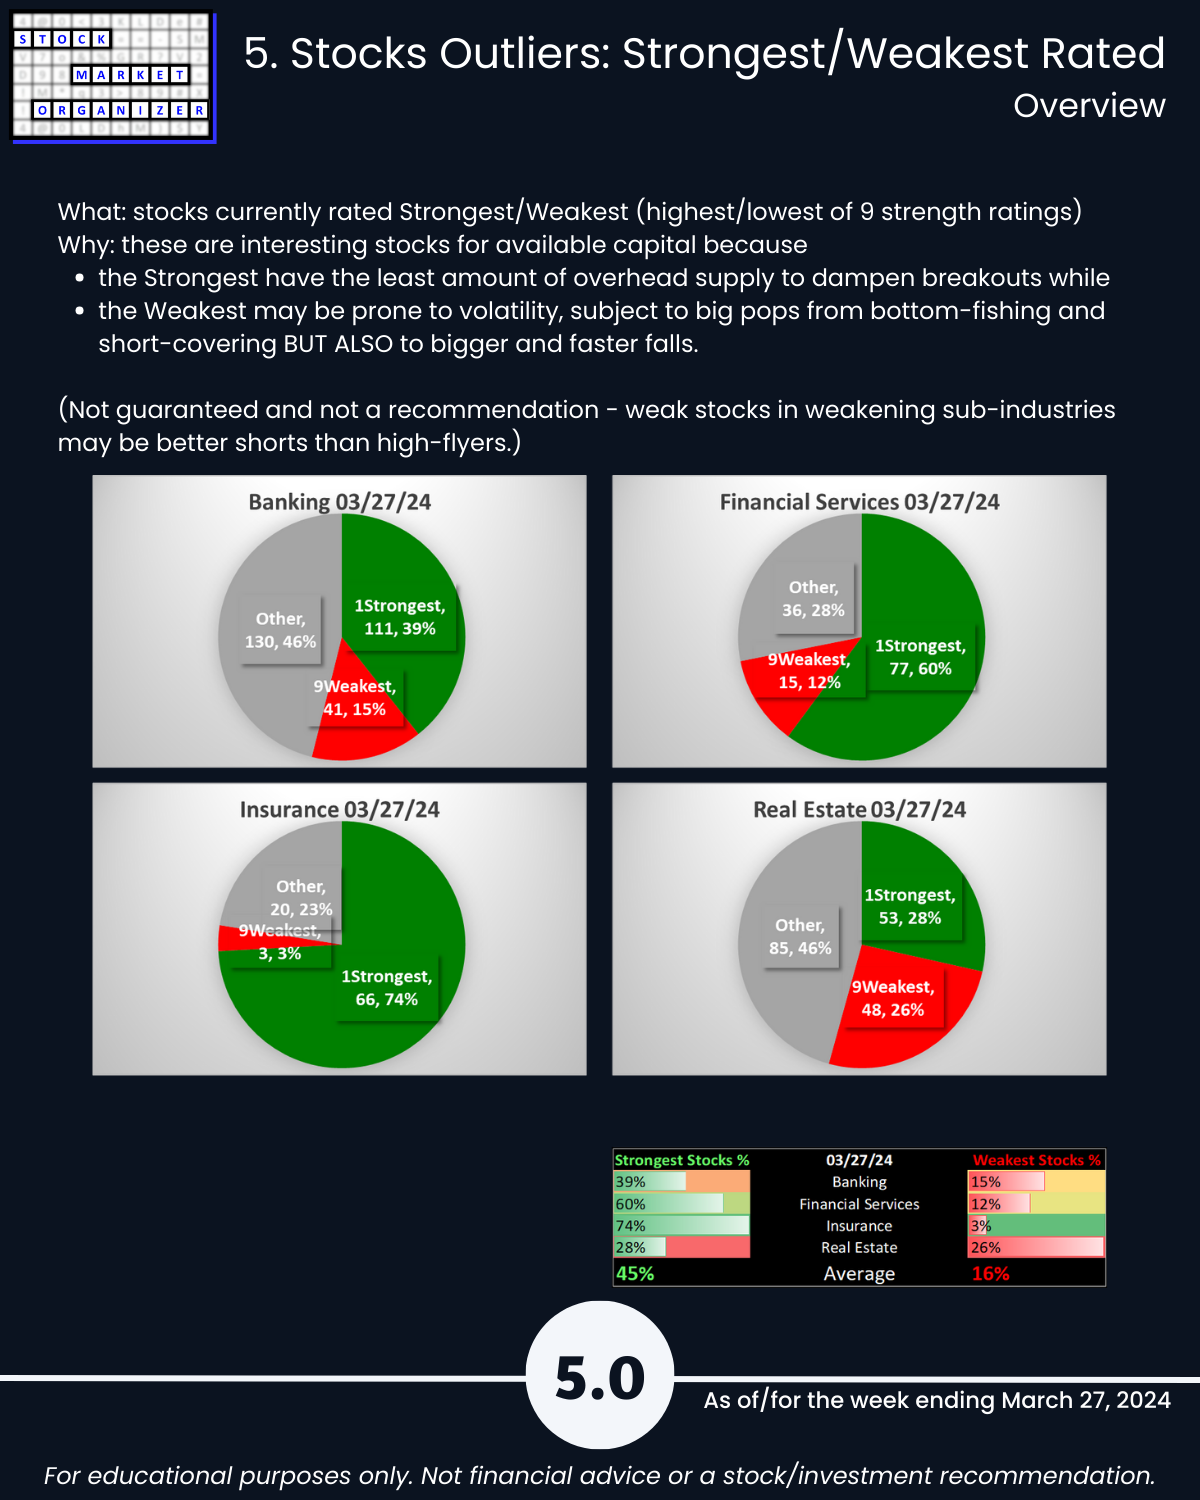
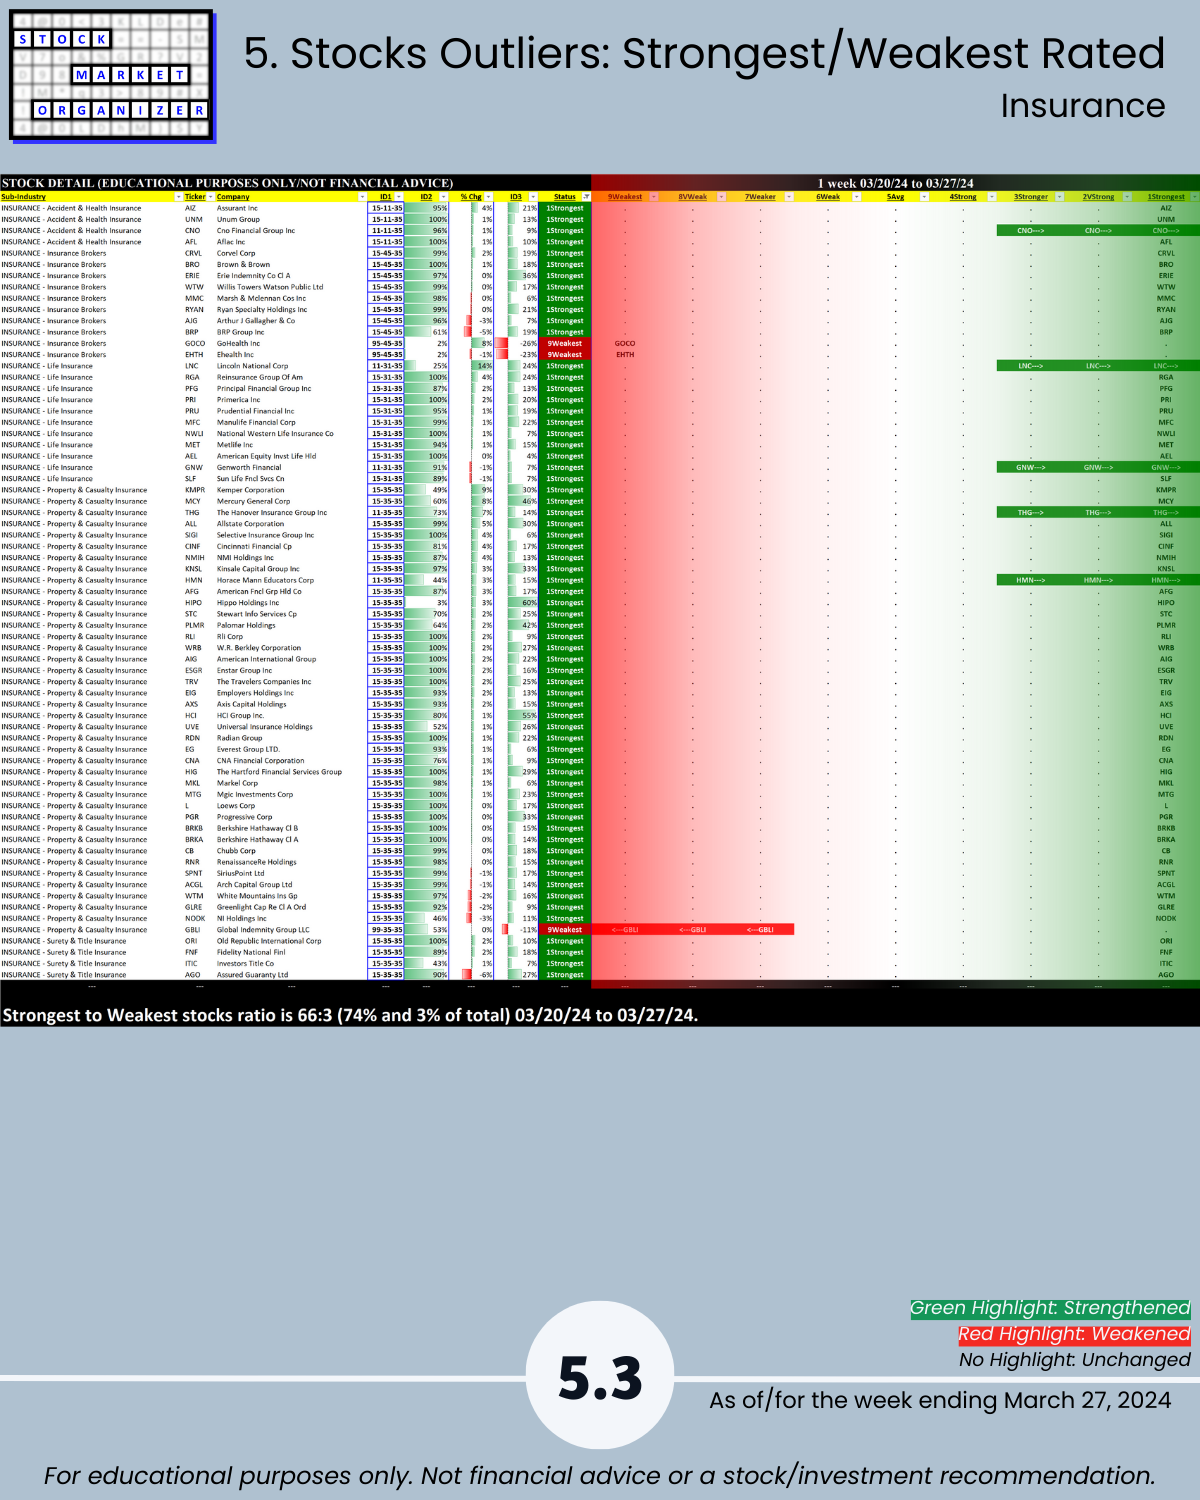
🔹 Insurance: 30% of stocks are at 5+ year highs, and it has a 74%:3% ratio of Strongest to Weakest-rated stocks.
Insurance closeup: it strengthened to Stronger (3rd strongest of 9 levels) after the week ending 1/3/24. Since then, in 12 weeks:
🔹 Average return 11.8%
🔹 Range -27% to +110%
🔹 82% positive stocks
🔹 20% stocks >20% return
BOTTOM LINE
Anyone can eyeball a chart and say whether it is strengthening or weakening. What the average observer cannot do is tell you whether what’s happening at the sub-industry, industry, and market levels helps or hinders the stock’s action.
This system can.
HIGHLIGHTS
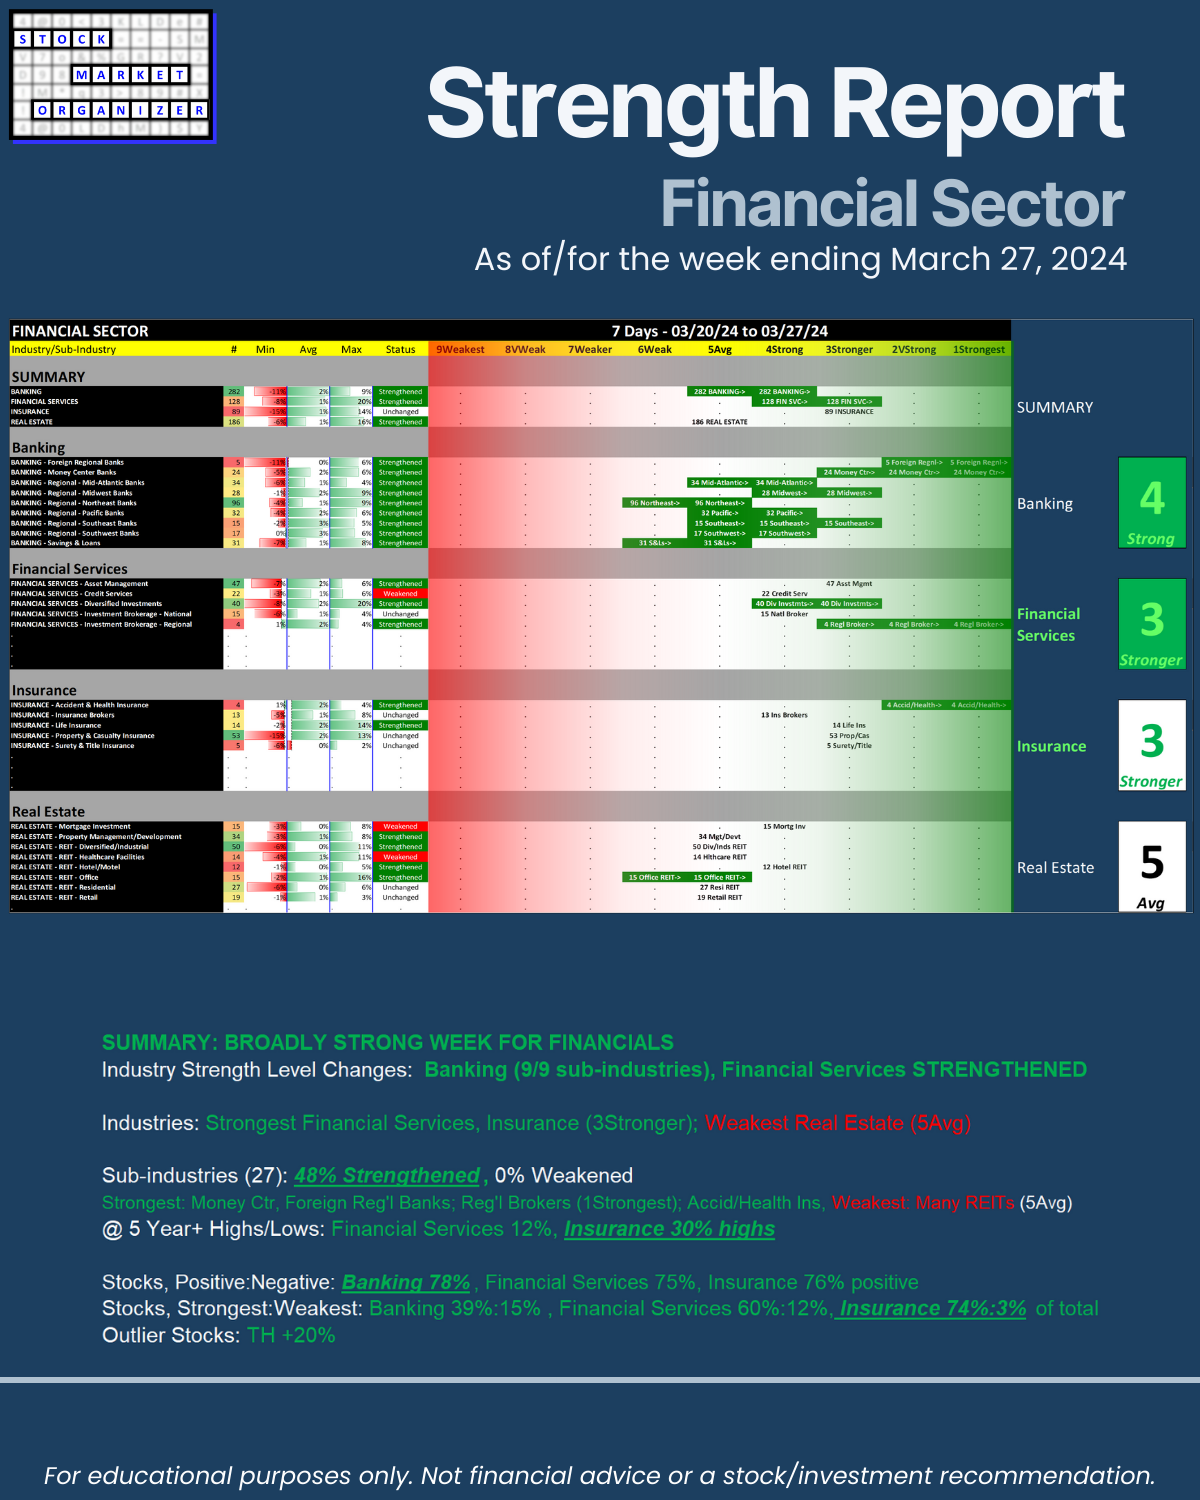
🔹 SUMMARY: BROADLY STRONG WEEK FOR FINANCIALS
🔹 Industry Strength Level Changes: Banking (9/9 sub-industries), Financial Services STRENGTHENED
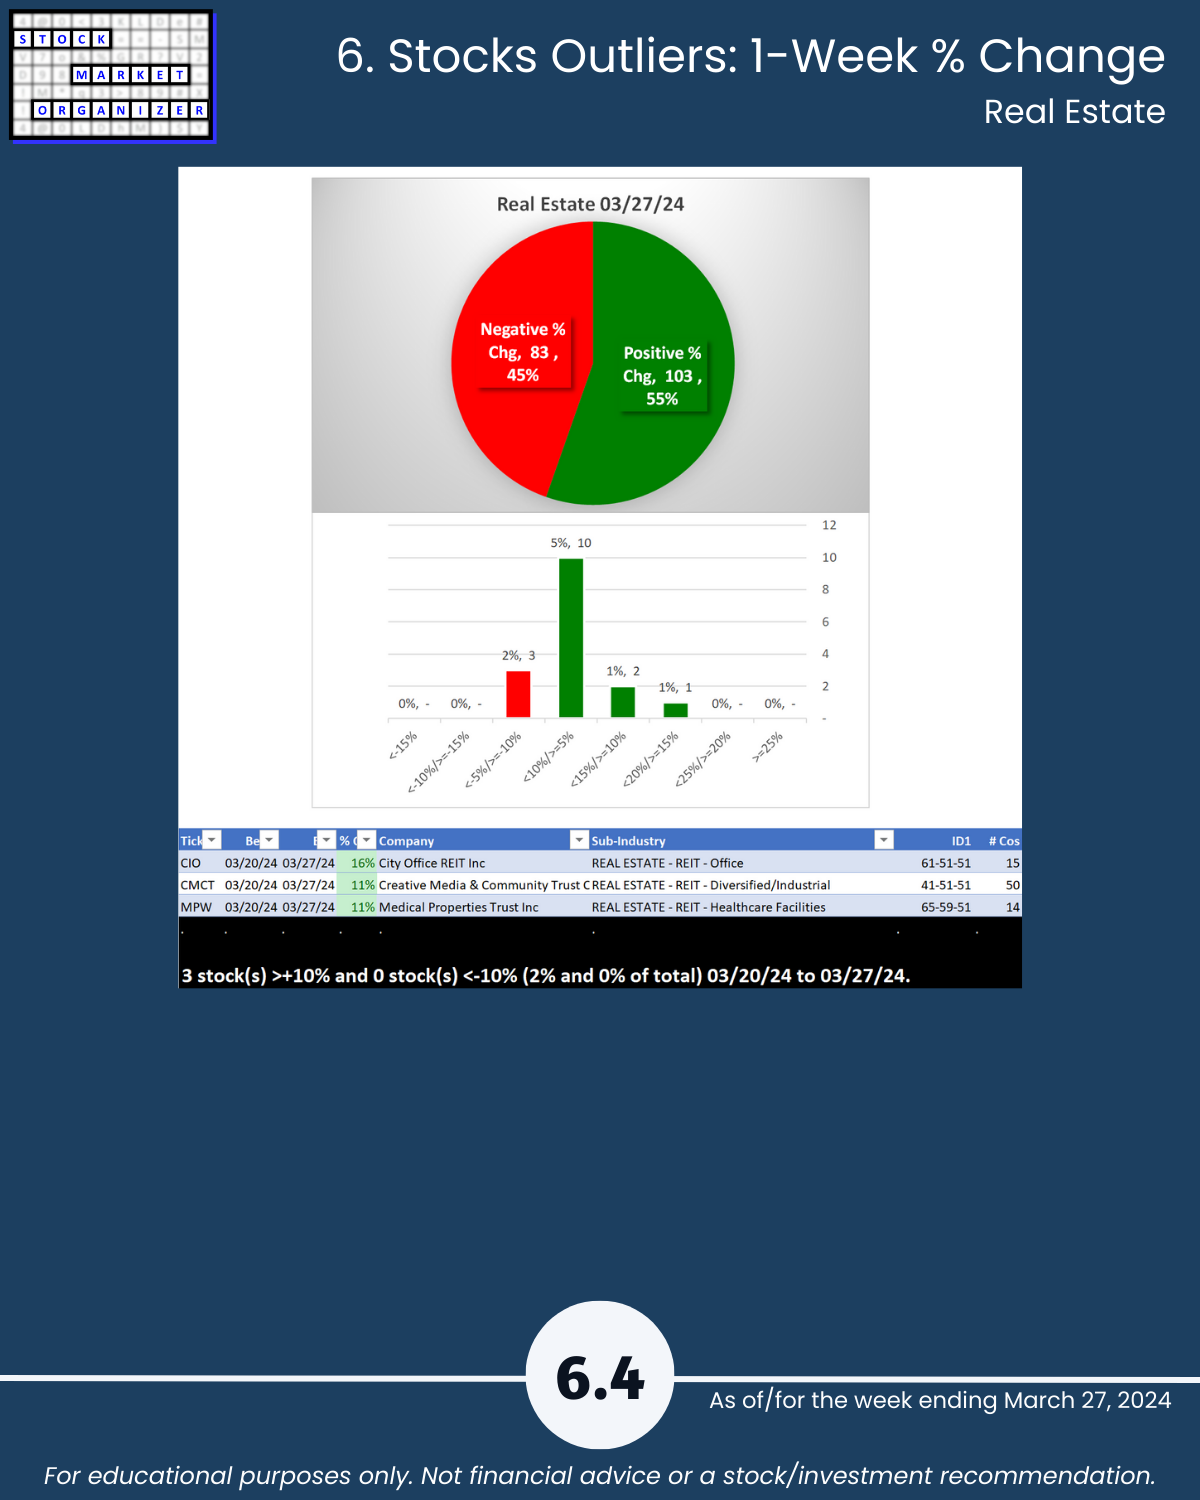
🔹 Industries: Strongest = Financial Services, Insurance (3Stronger); Weakest = Real Estate (5Avg)
🔹 Sub-industries (27): 48% Strengthened, 0% Weakened
Strongest: Money Ctr, Foreign Reg'l Banks; Reg'l Brokers (1Strongest); Accid/Health Ins, Weakest: Many REITs (5Avg)
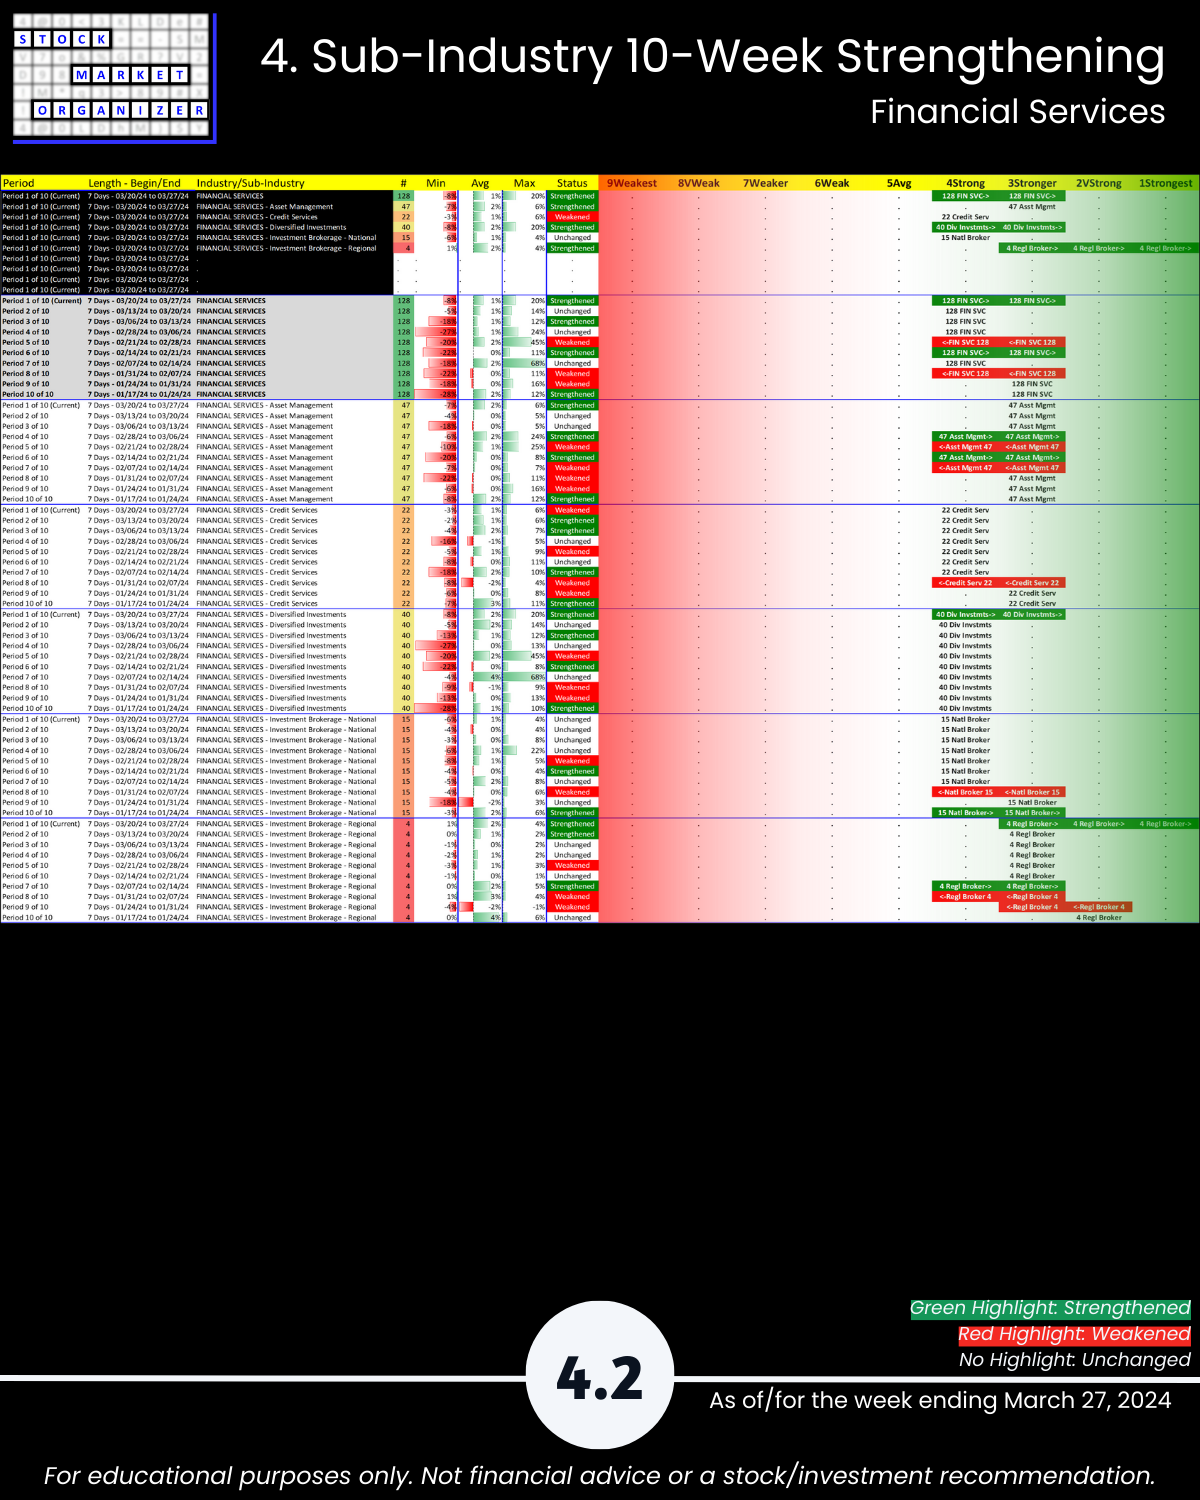
🔹 @ 5 Year+ Highs/Lows: Financial Services 12%, Insurance 30% highs
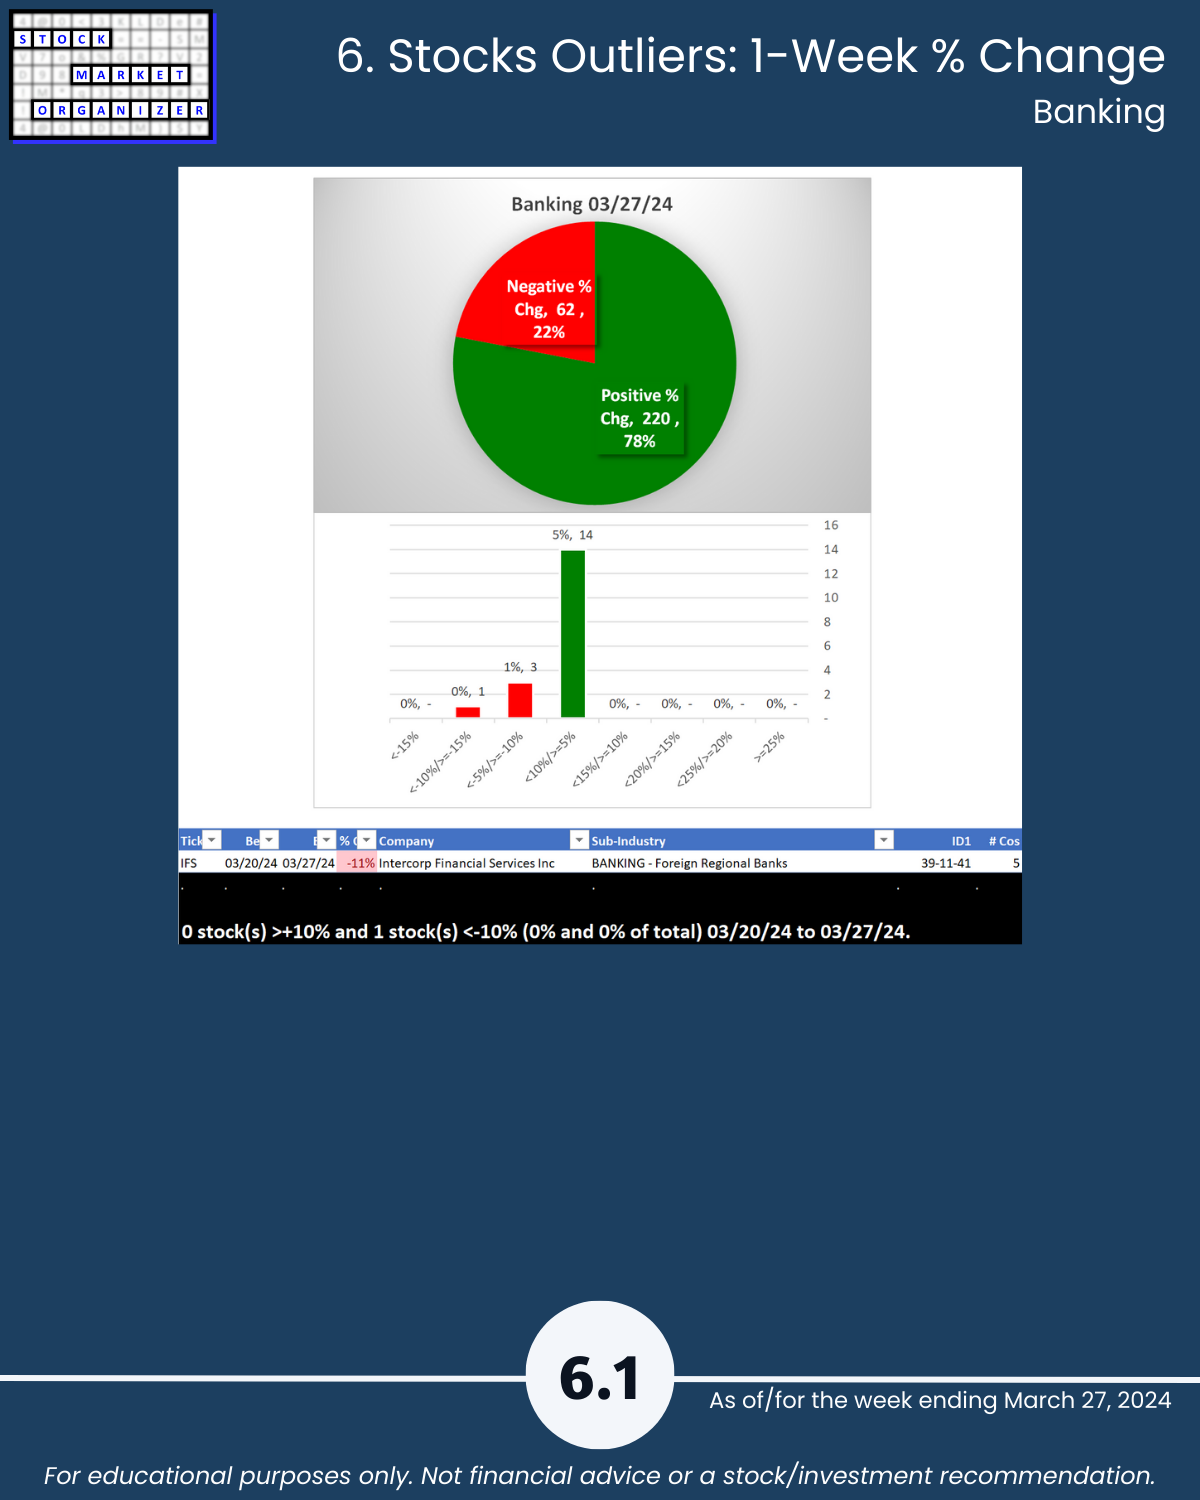
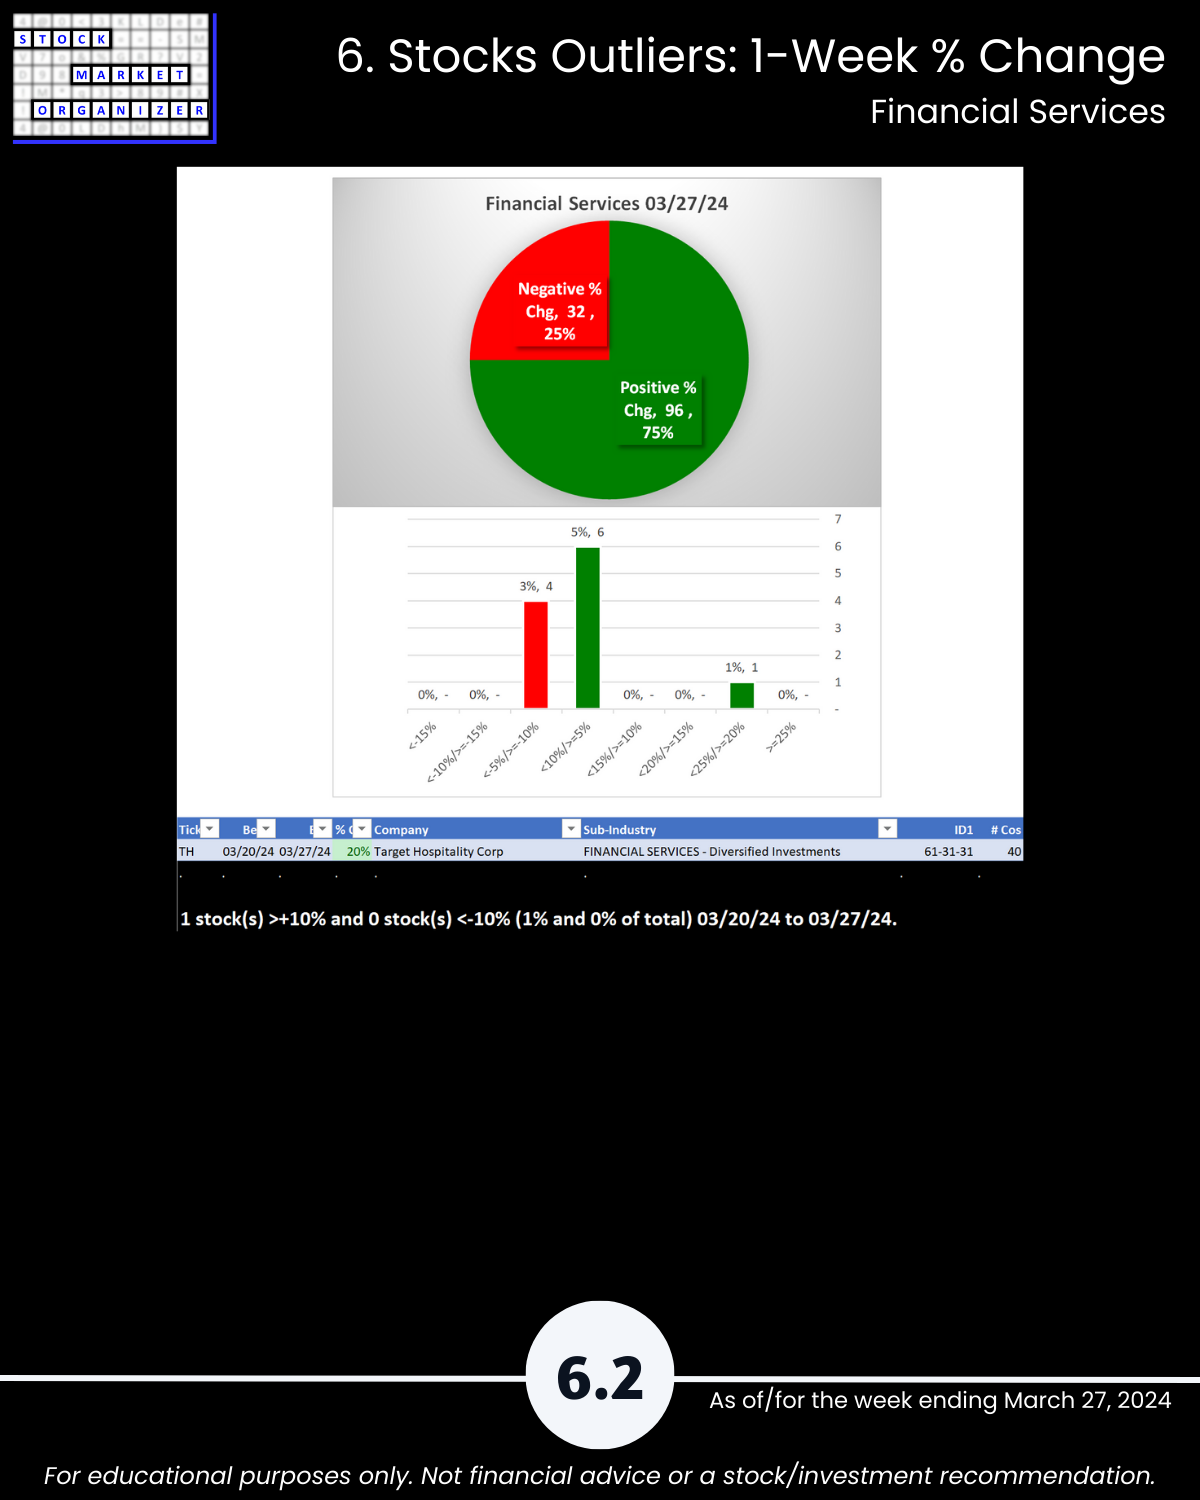
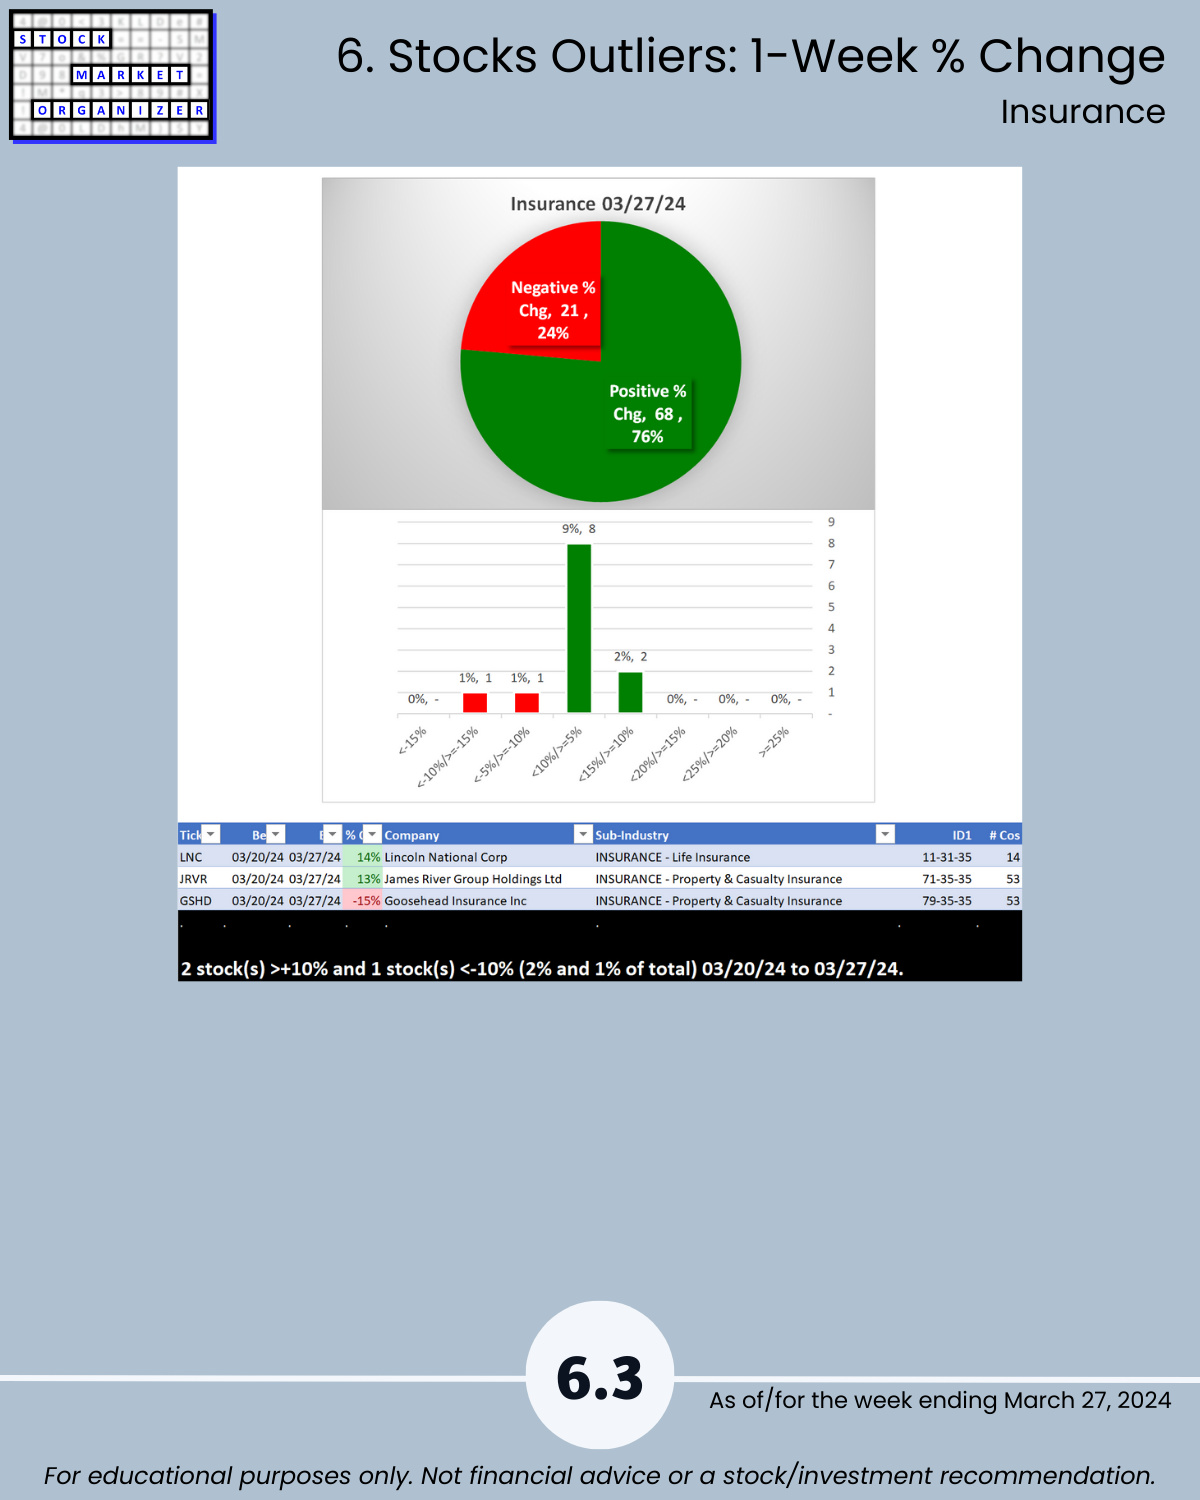
🔹 Stocks, Positive:Negative: Banking 78%, Financial Services 75%, Insurance 76% positive
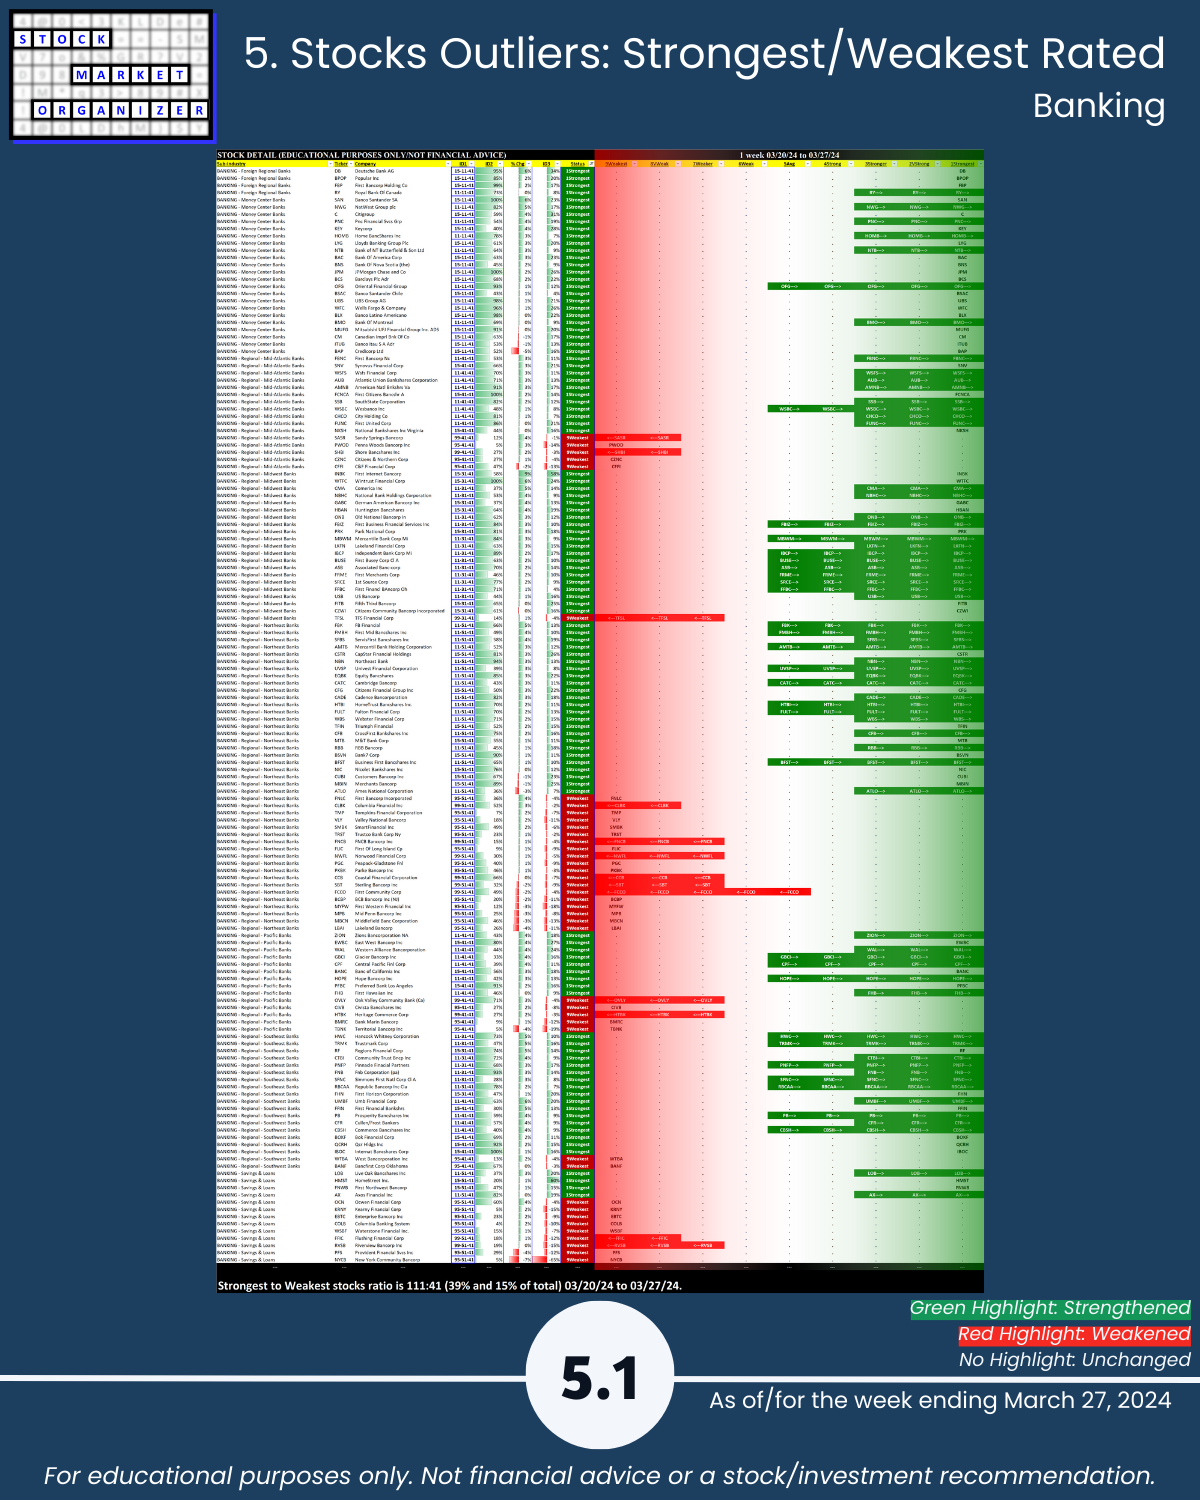
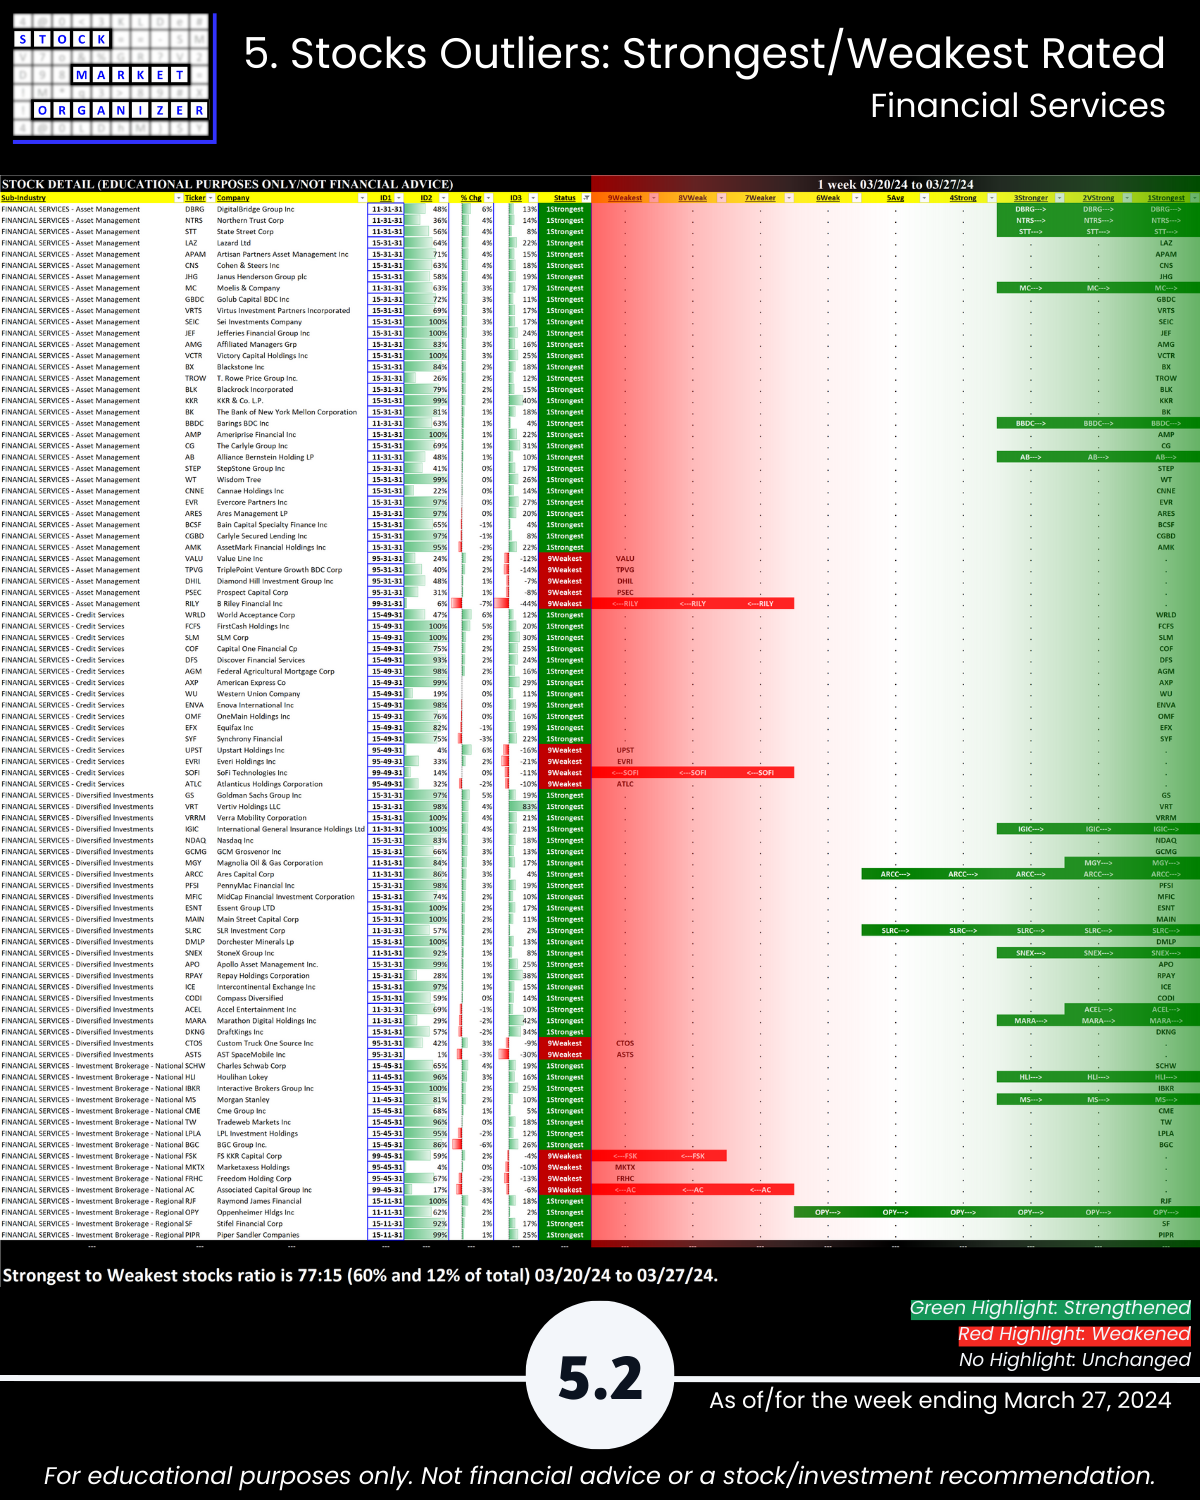
🔹 Stocks, Strongest:Weakest: Banking 39%:15% , Financial Services 60%:12%, Insurance 74%:3% of total
🔹 Outlier Stocks: TH +20%
This report may particularly be of interest if the following 5 concepts resonate with you:
- The stronger your stocks, the greener your P&L.
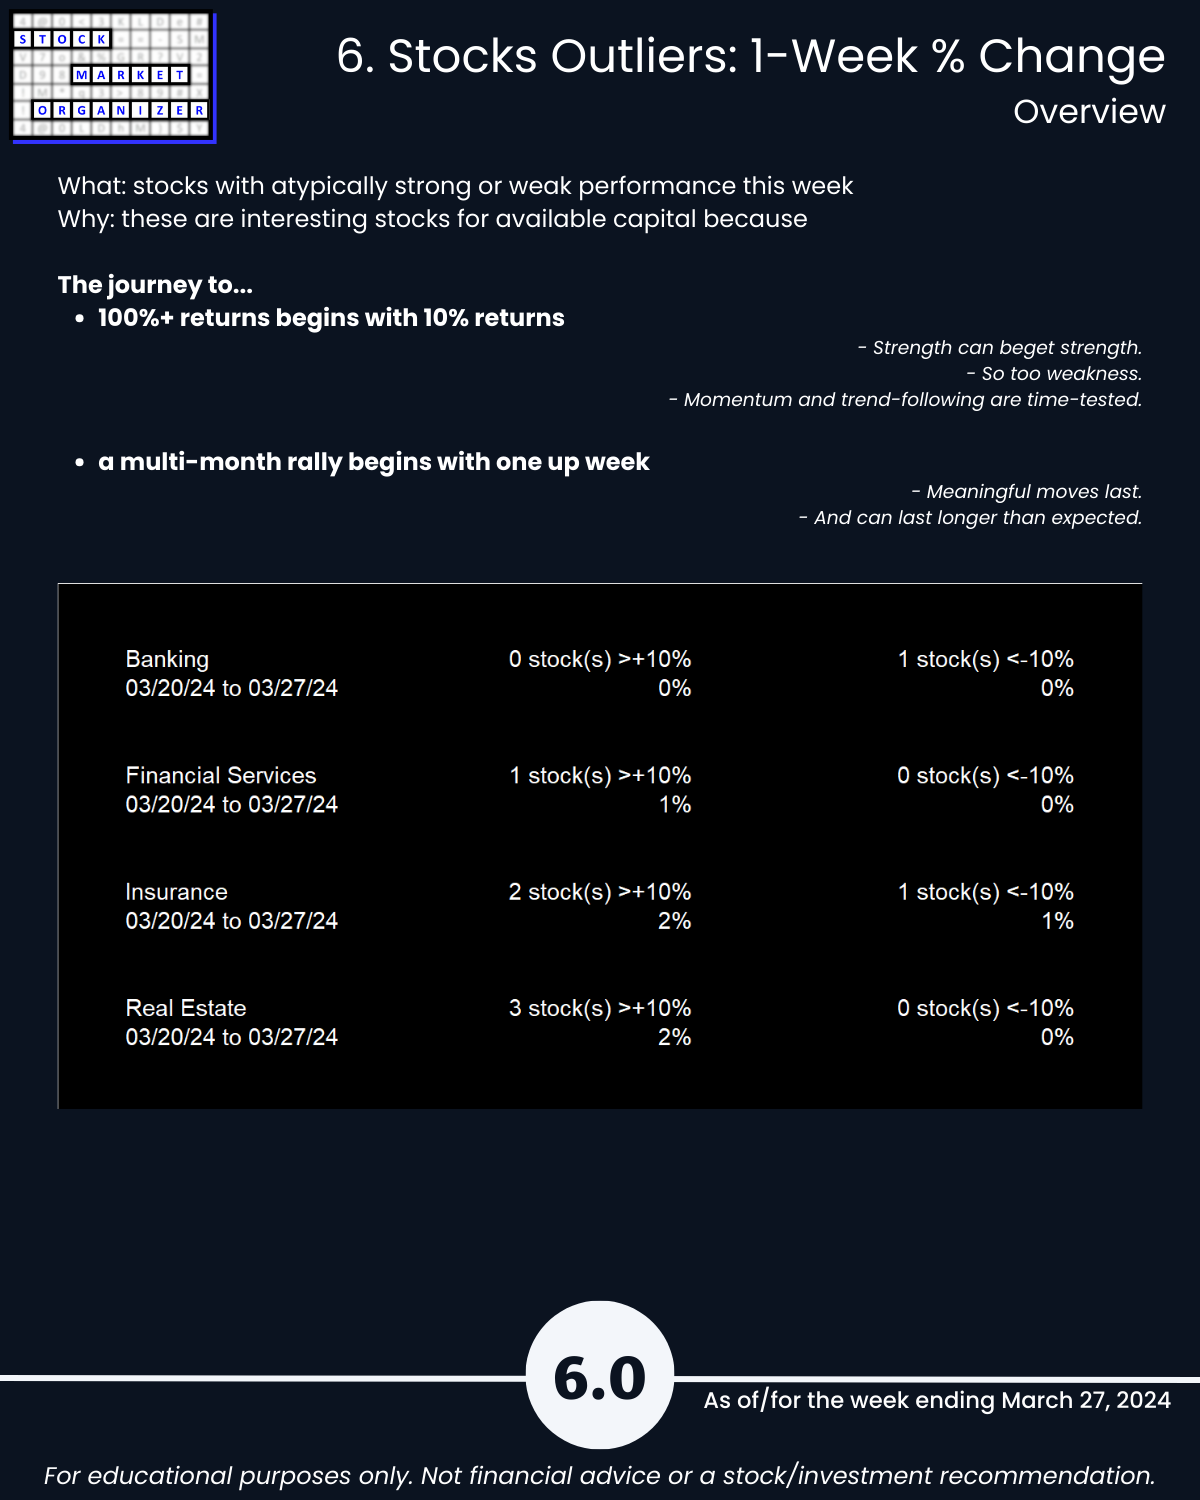
- The journey to 100%+ returns begins with 10% returns.
- The journey to a multi-month rally begins with one up week.
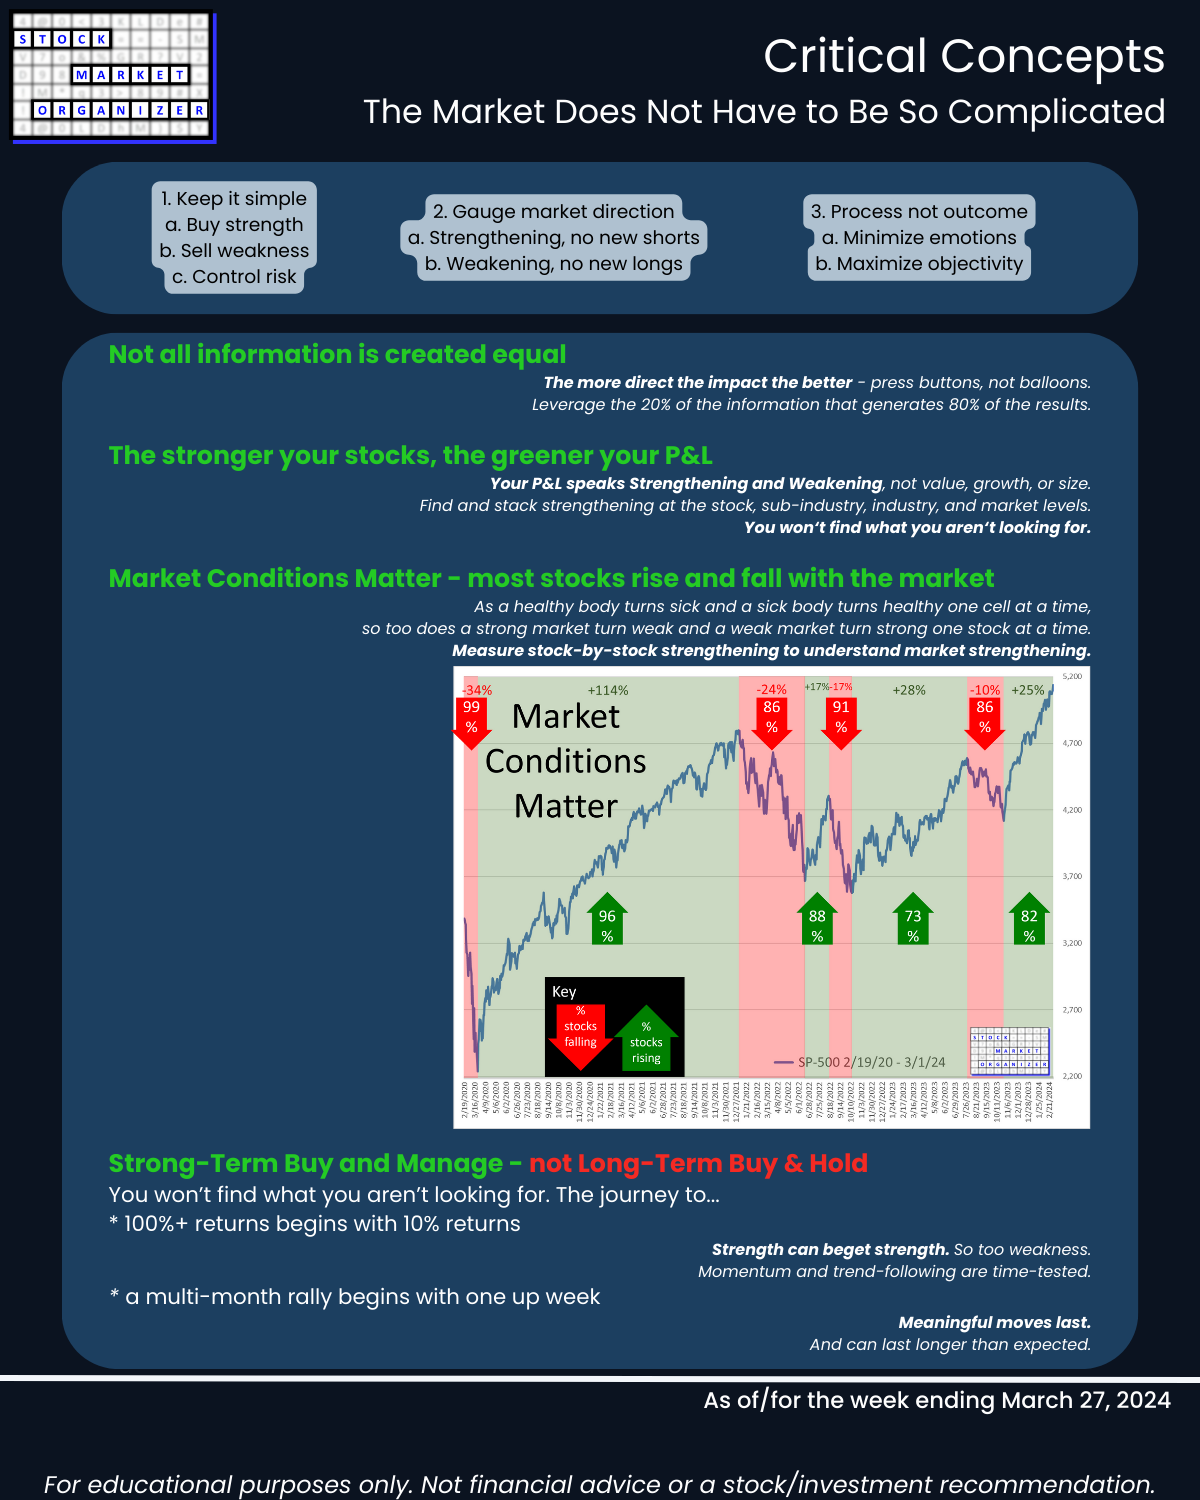
- Most stocks do what the market does. (While the market can only do what its underlying stocks, sub-industries, and industries do.)
- 80/20: not all information is created equal. (Press buttons, not balloons.)
Following are galleries with page-by-page views of this report.
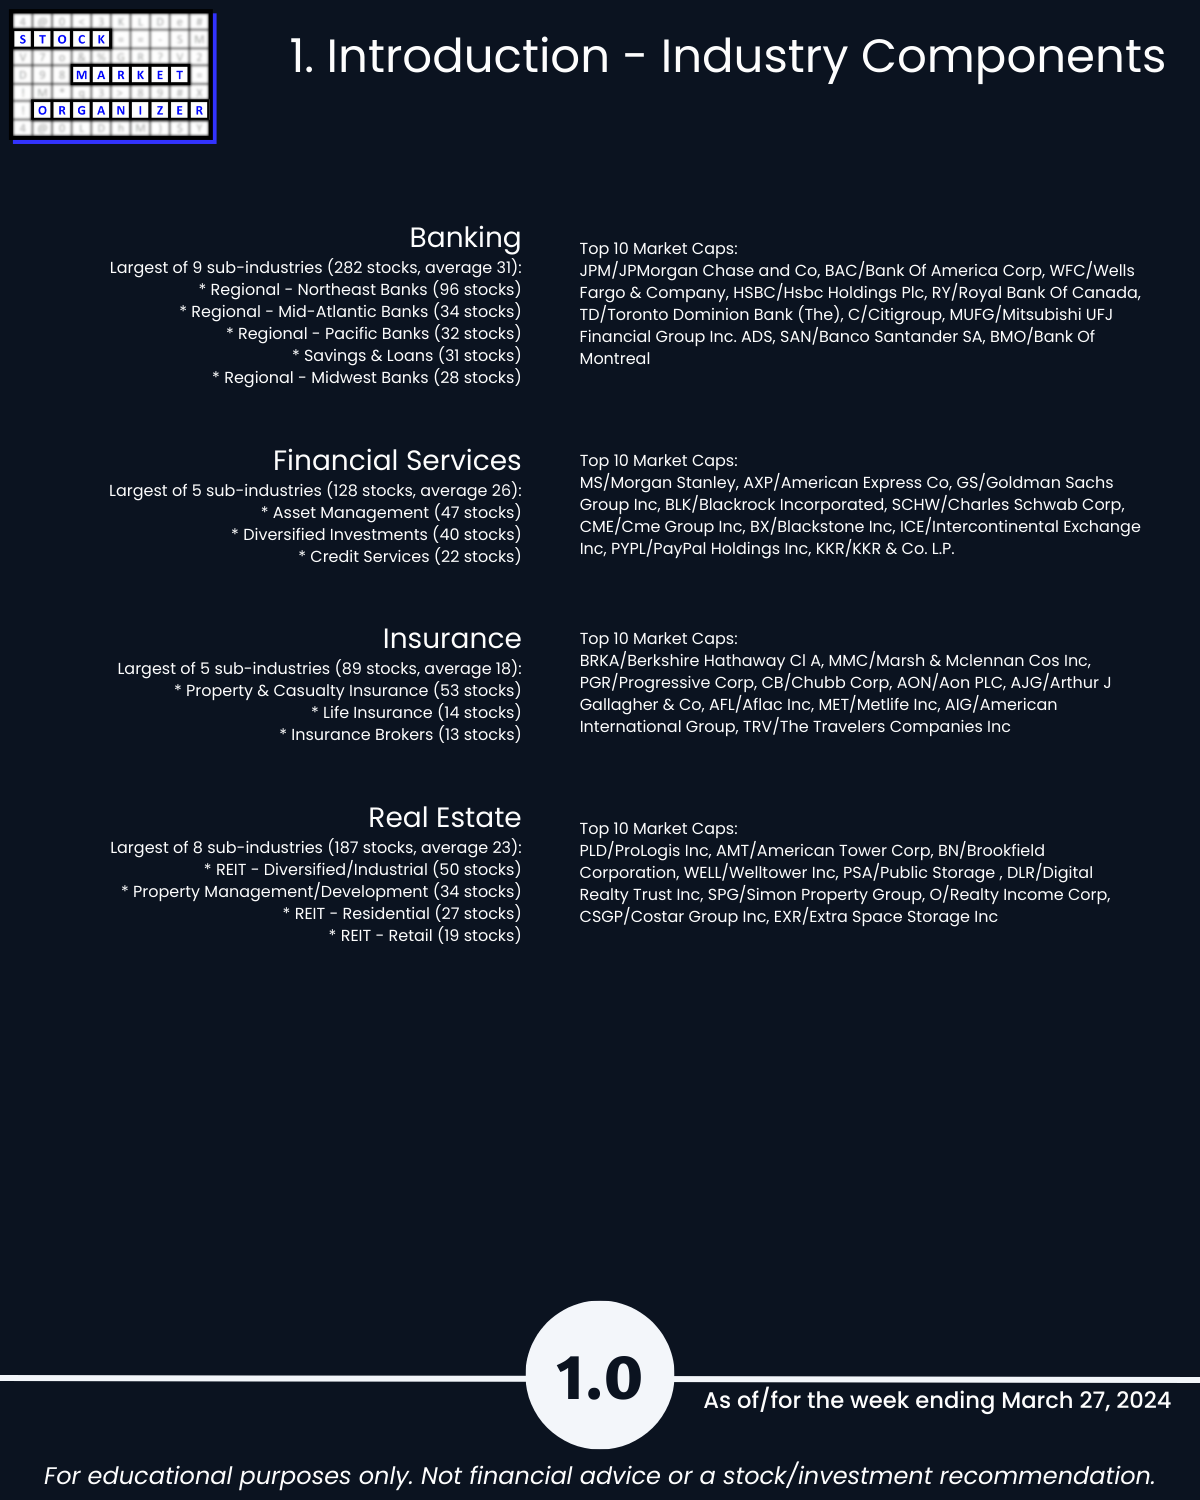
1. Introduction - Industry Components
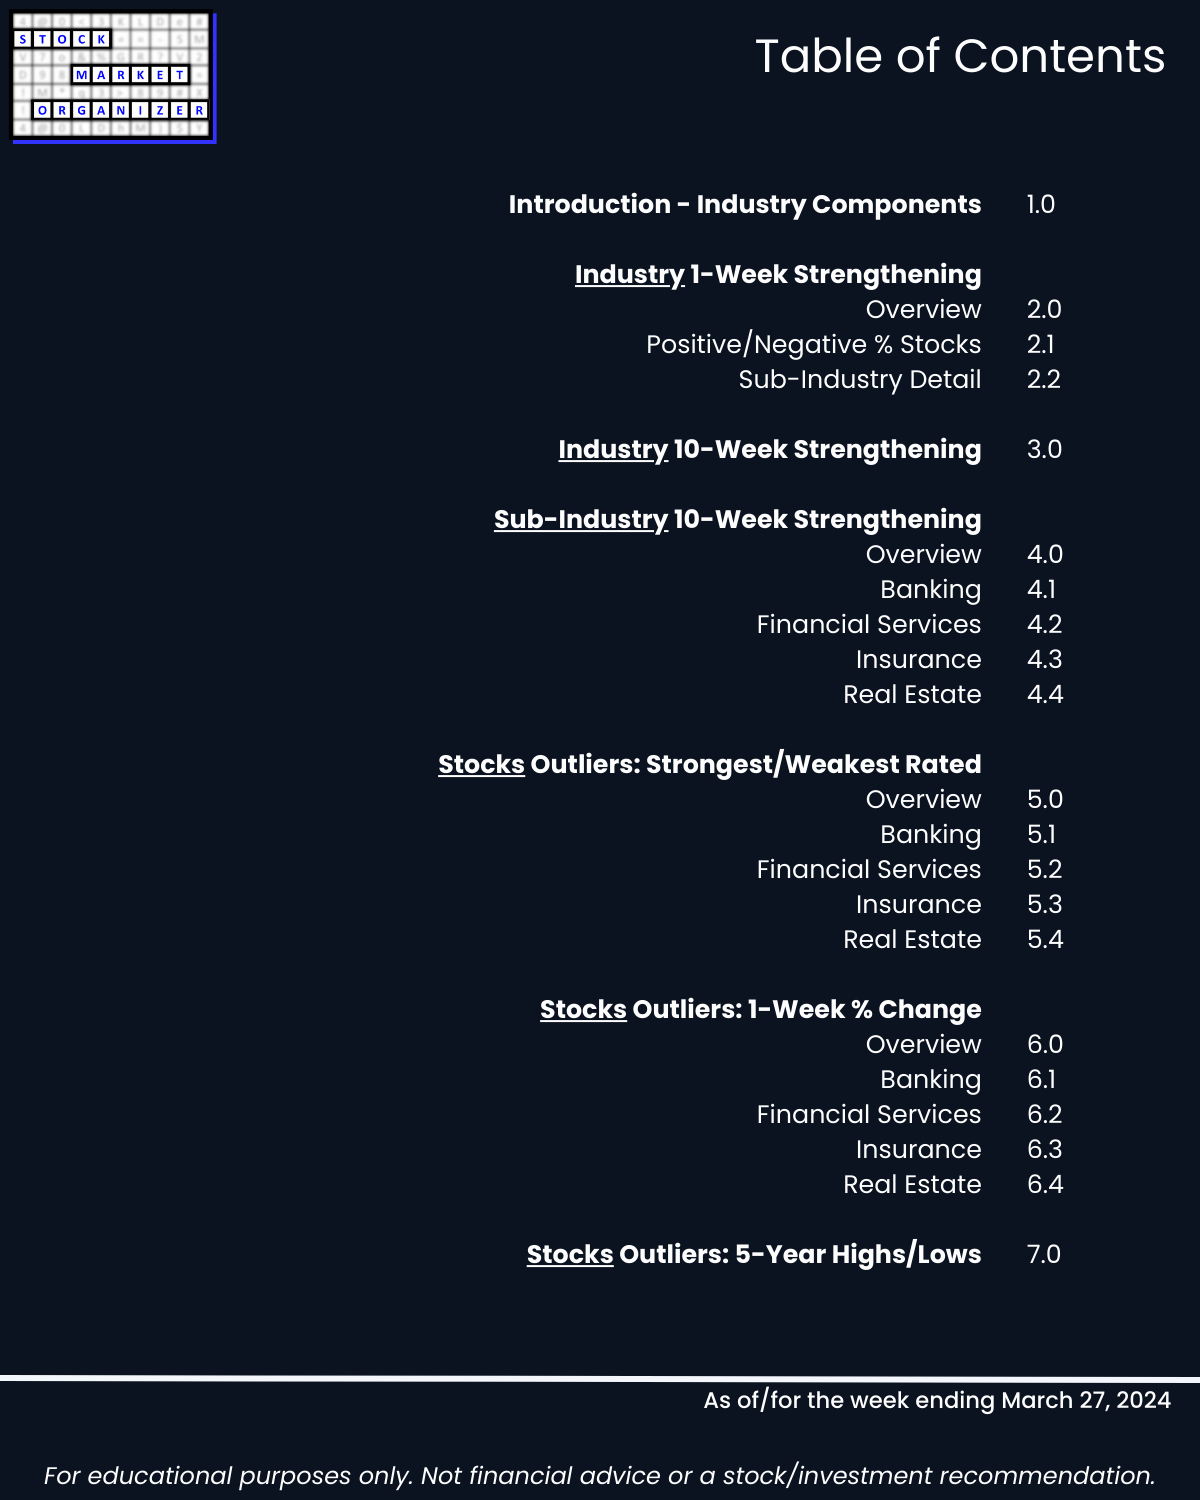
2. Industry 1-Week Strengthening
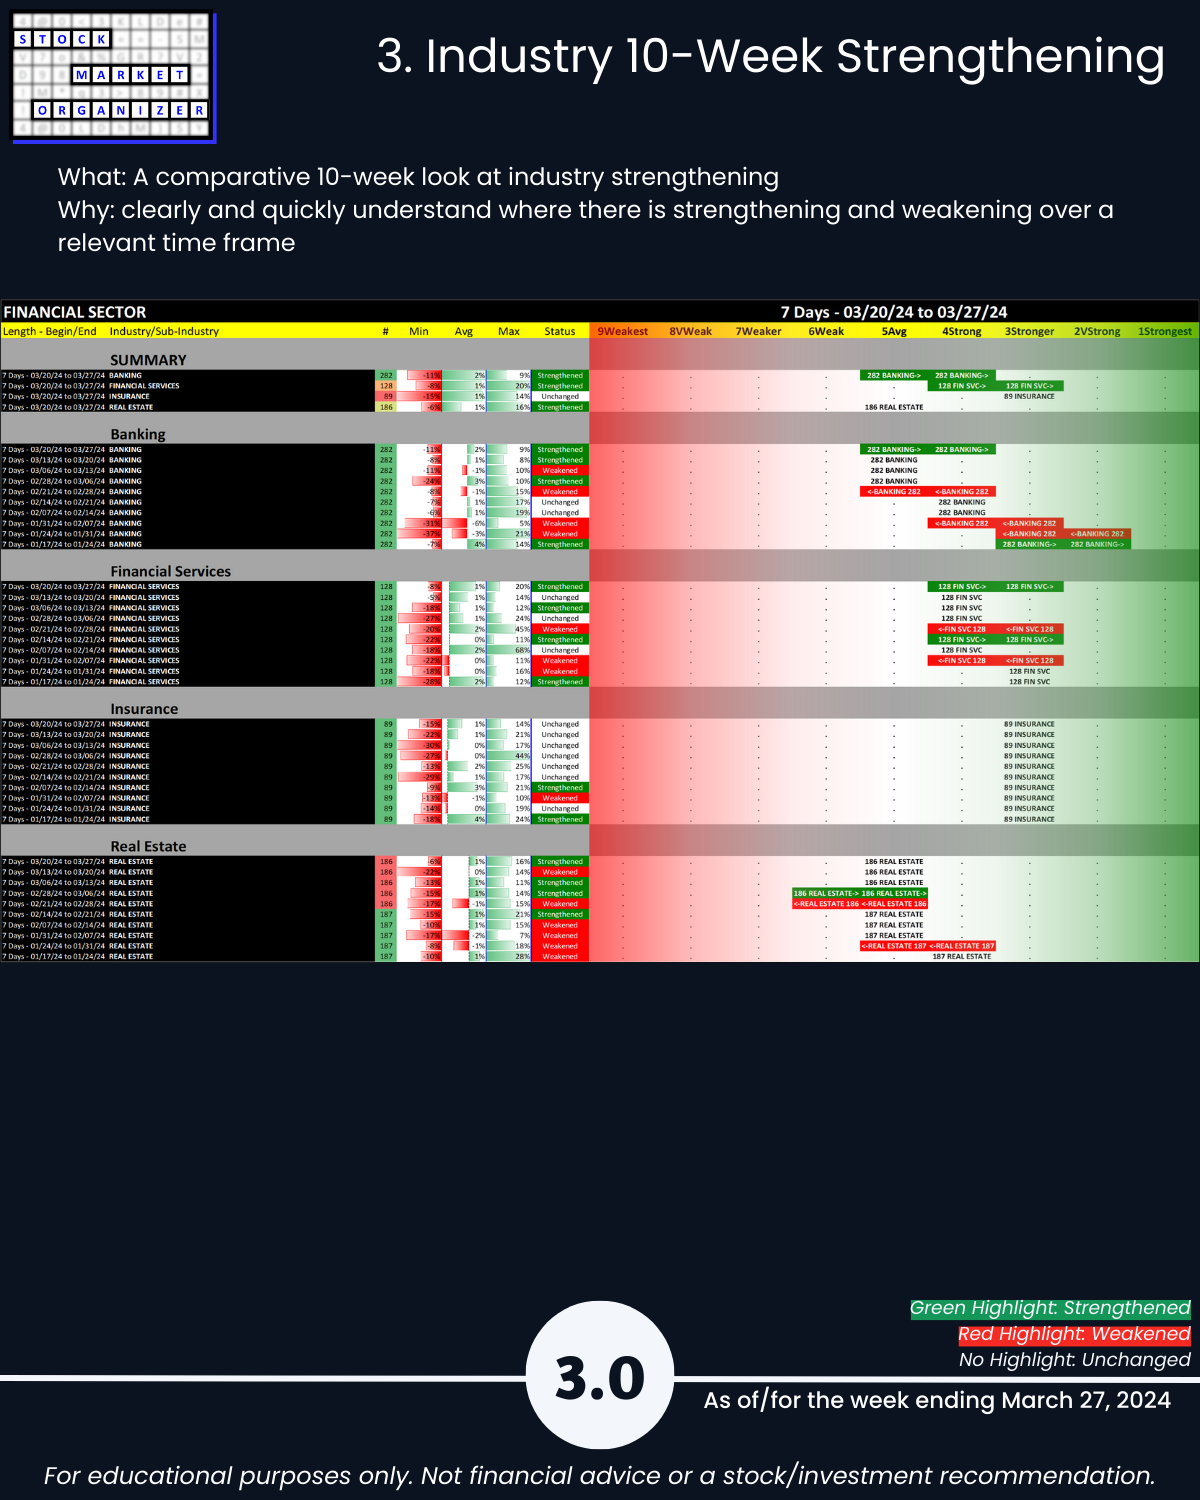
3. Industry 10-Week Strengthening
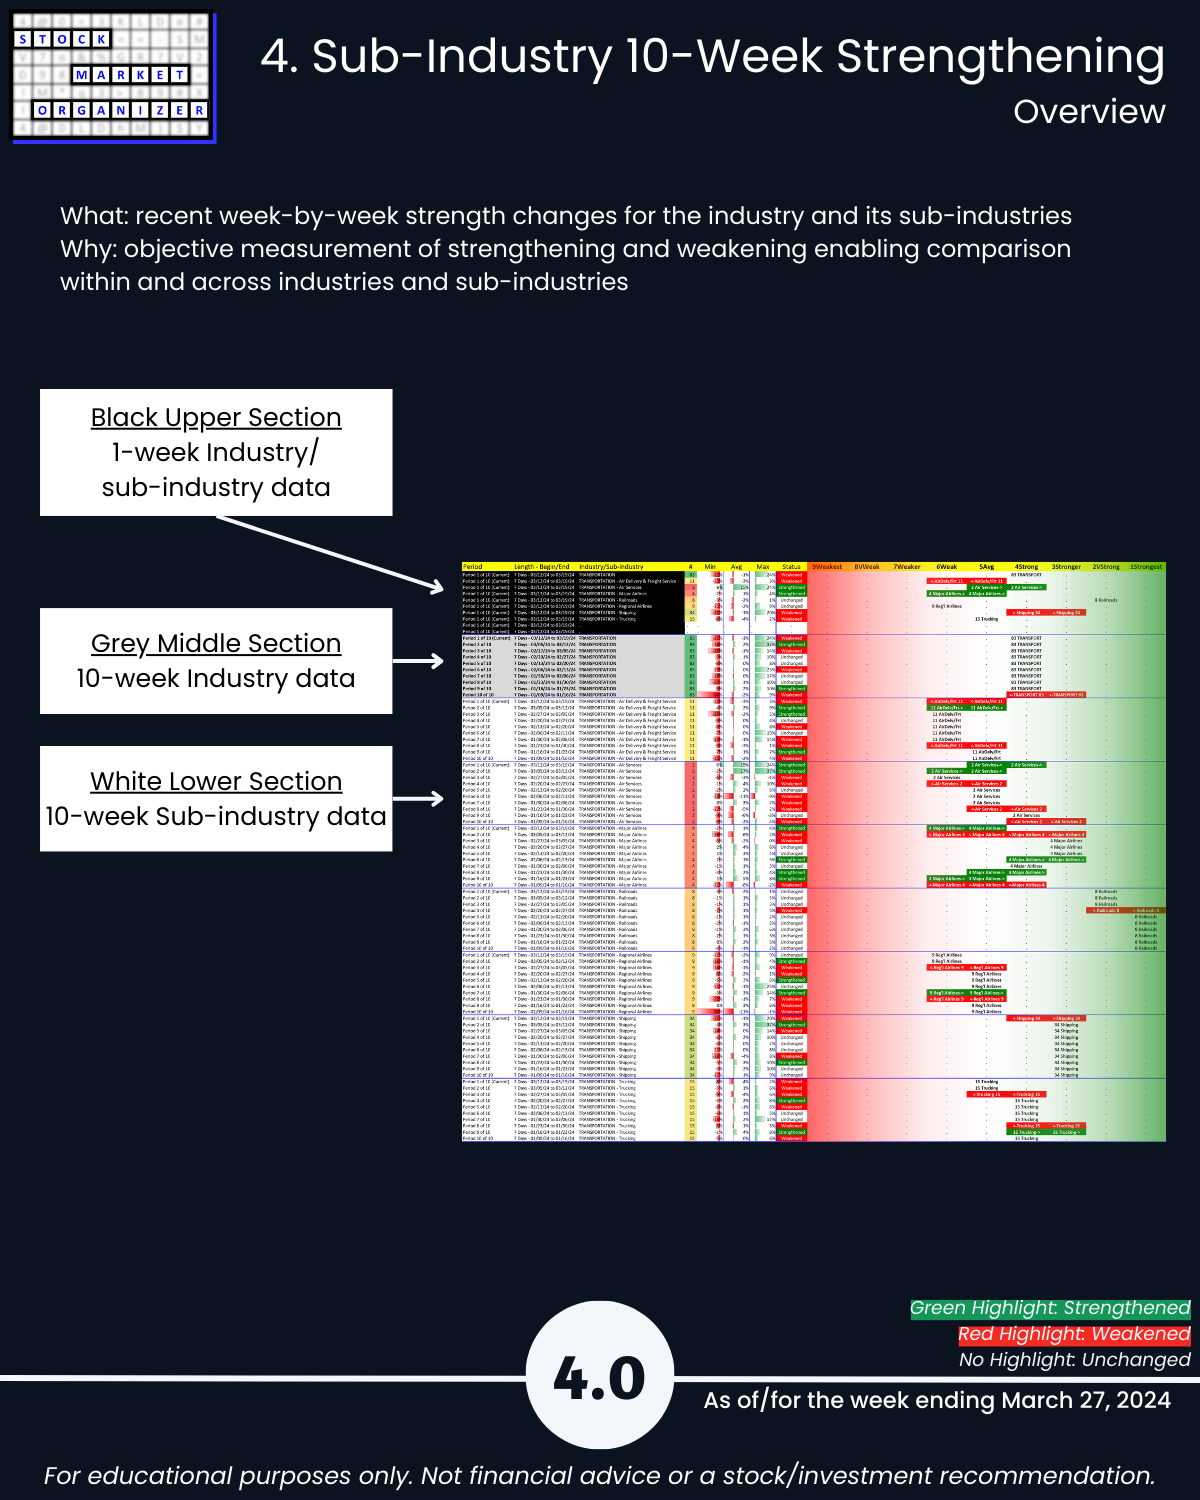
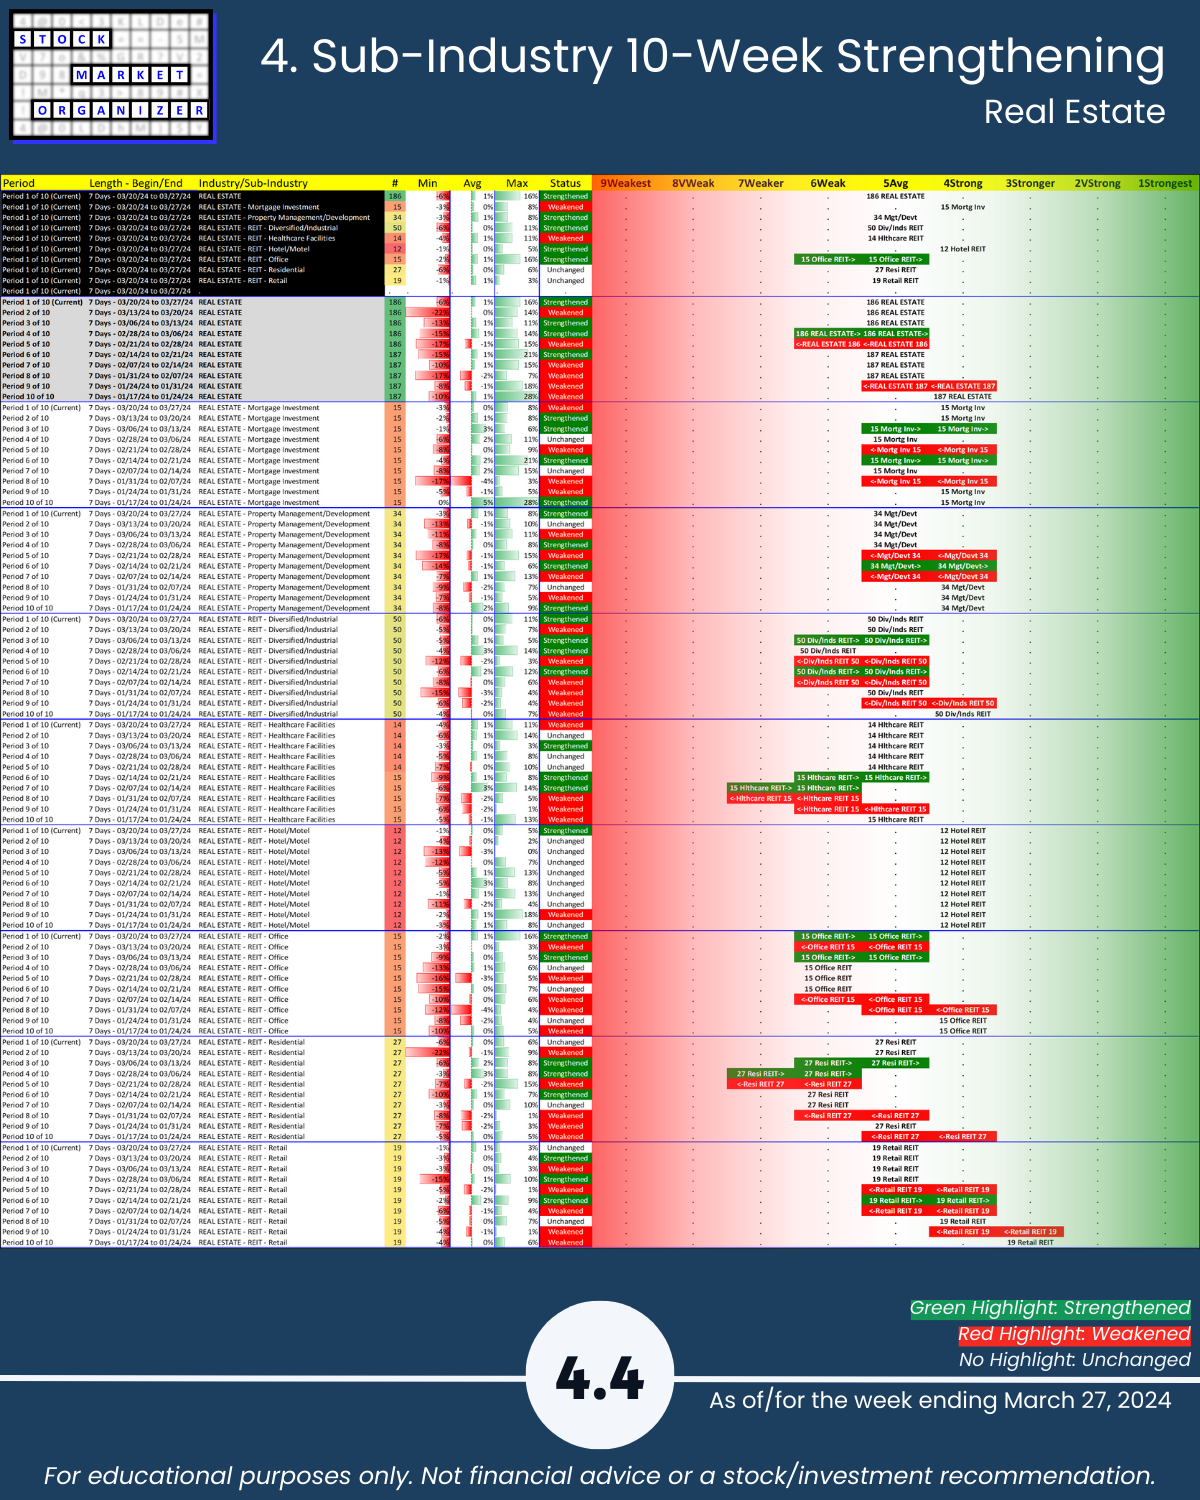
4. Sub-Industry 10-Week Strengthening
5. Stocks Outliers: Strongest/Weakest Rated
6. Stocks Outliers: 1-Week % Change
7. Stocks Outliers: 5-Year Highs/Lows