SMO Exclusive: Strength Report Financial Sector 2024-03-06

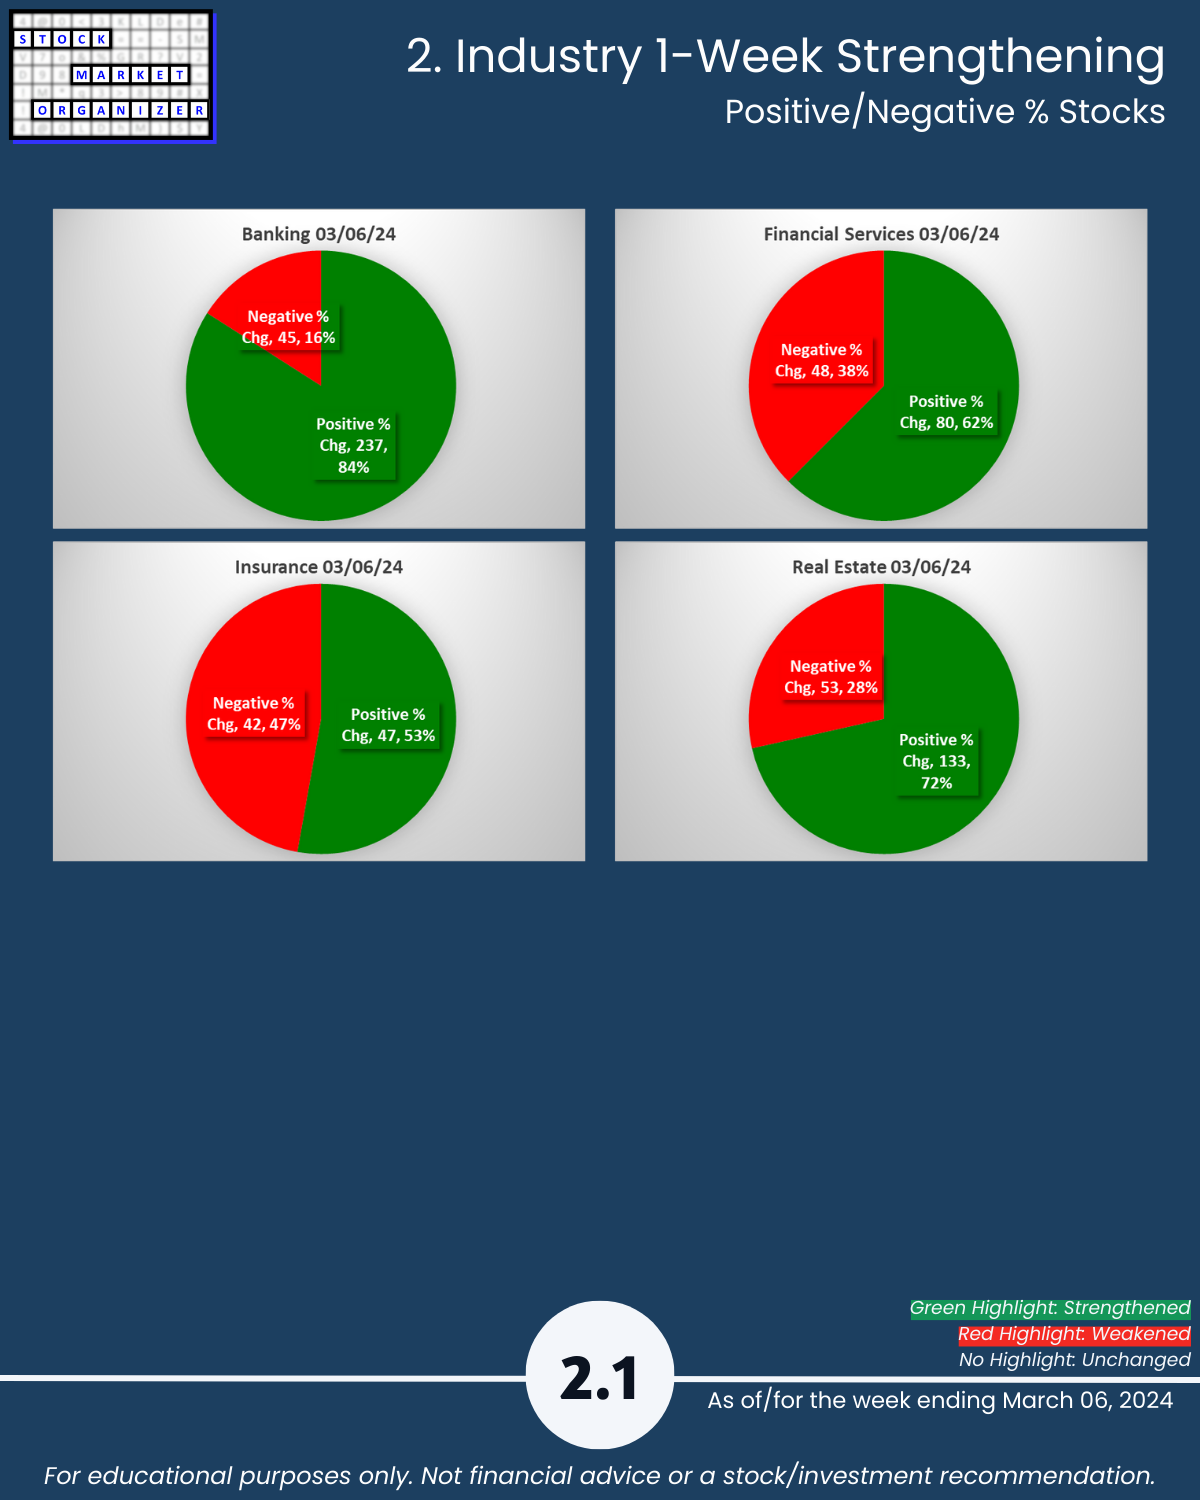
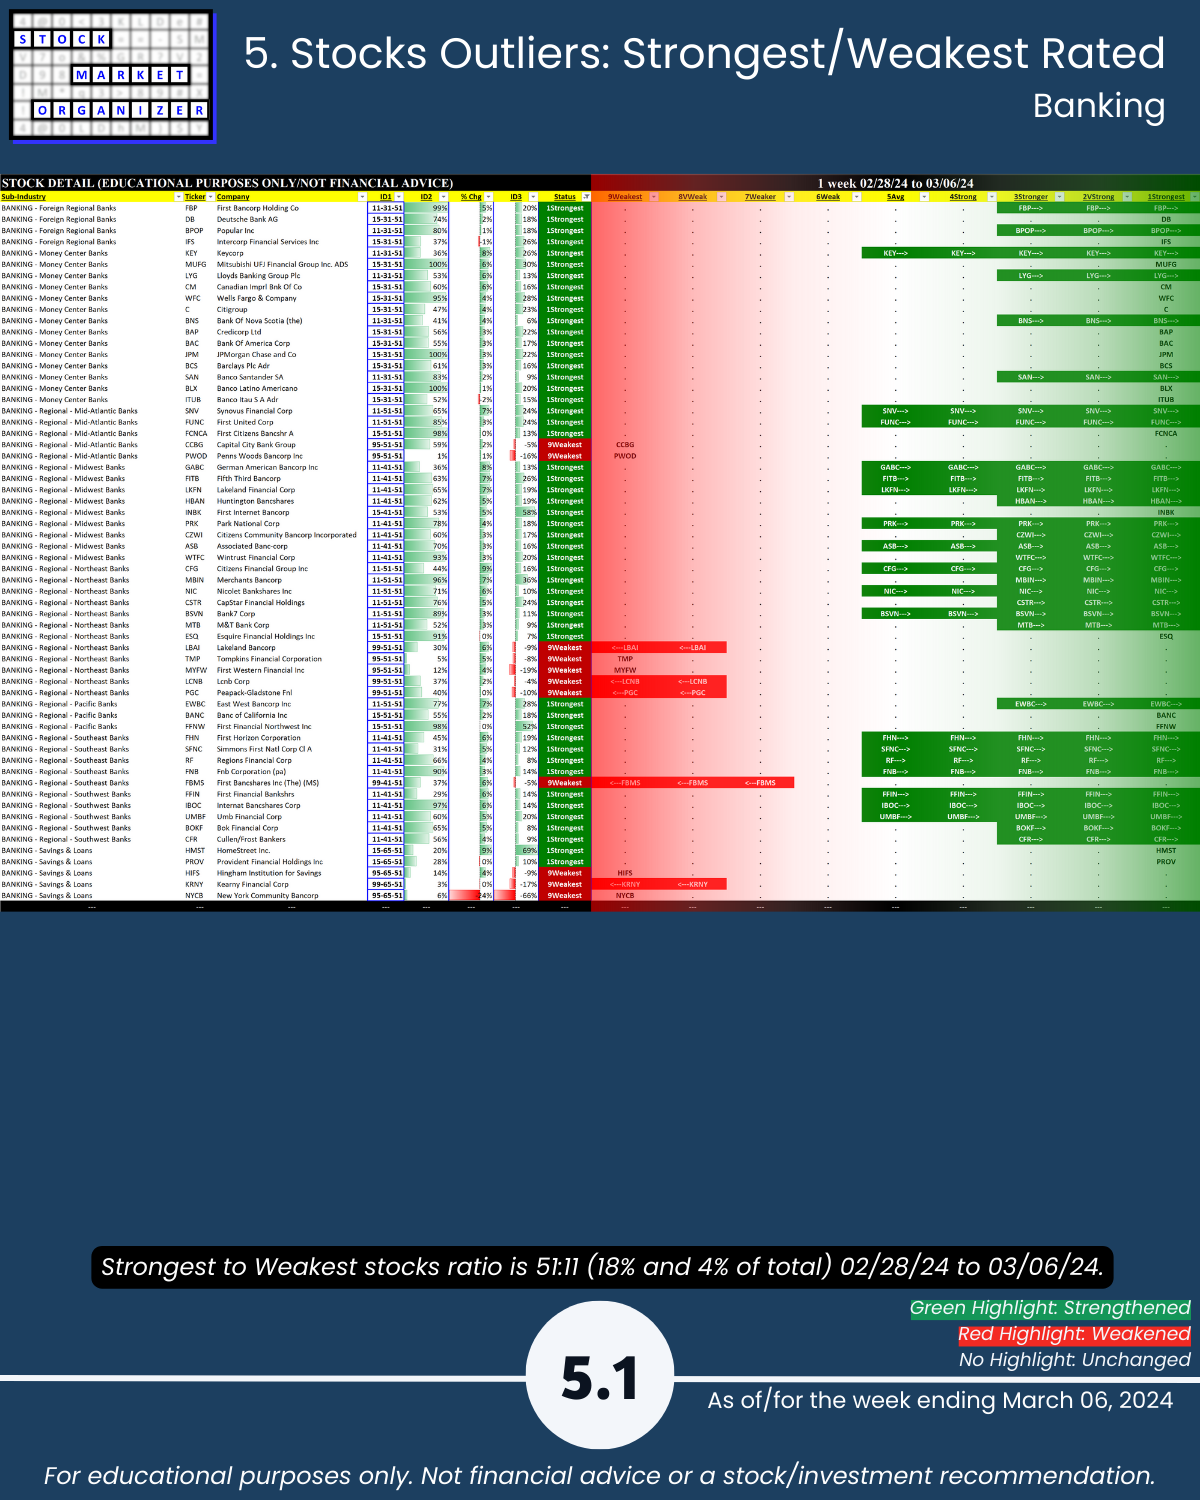
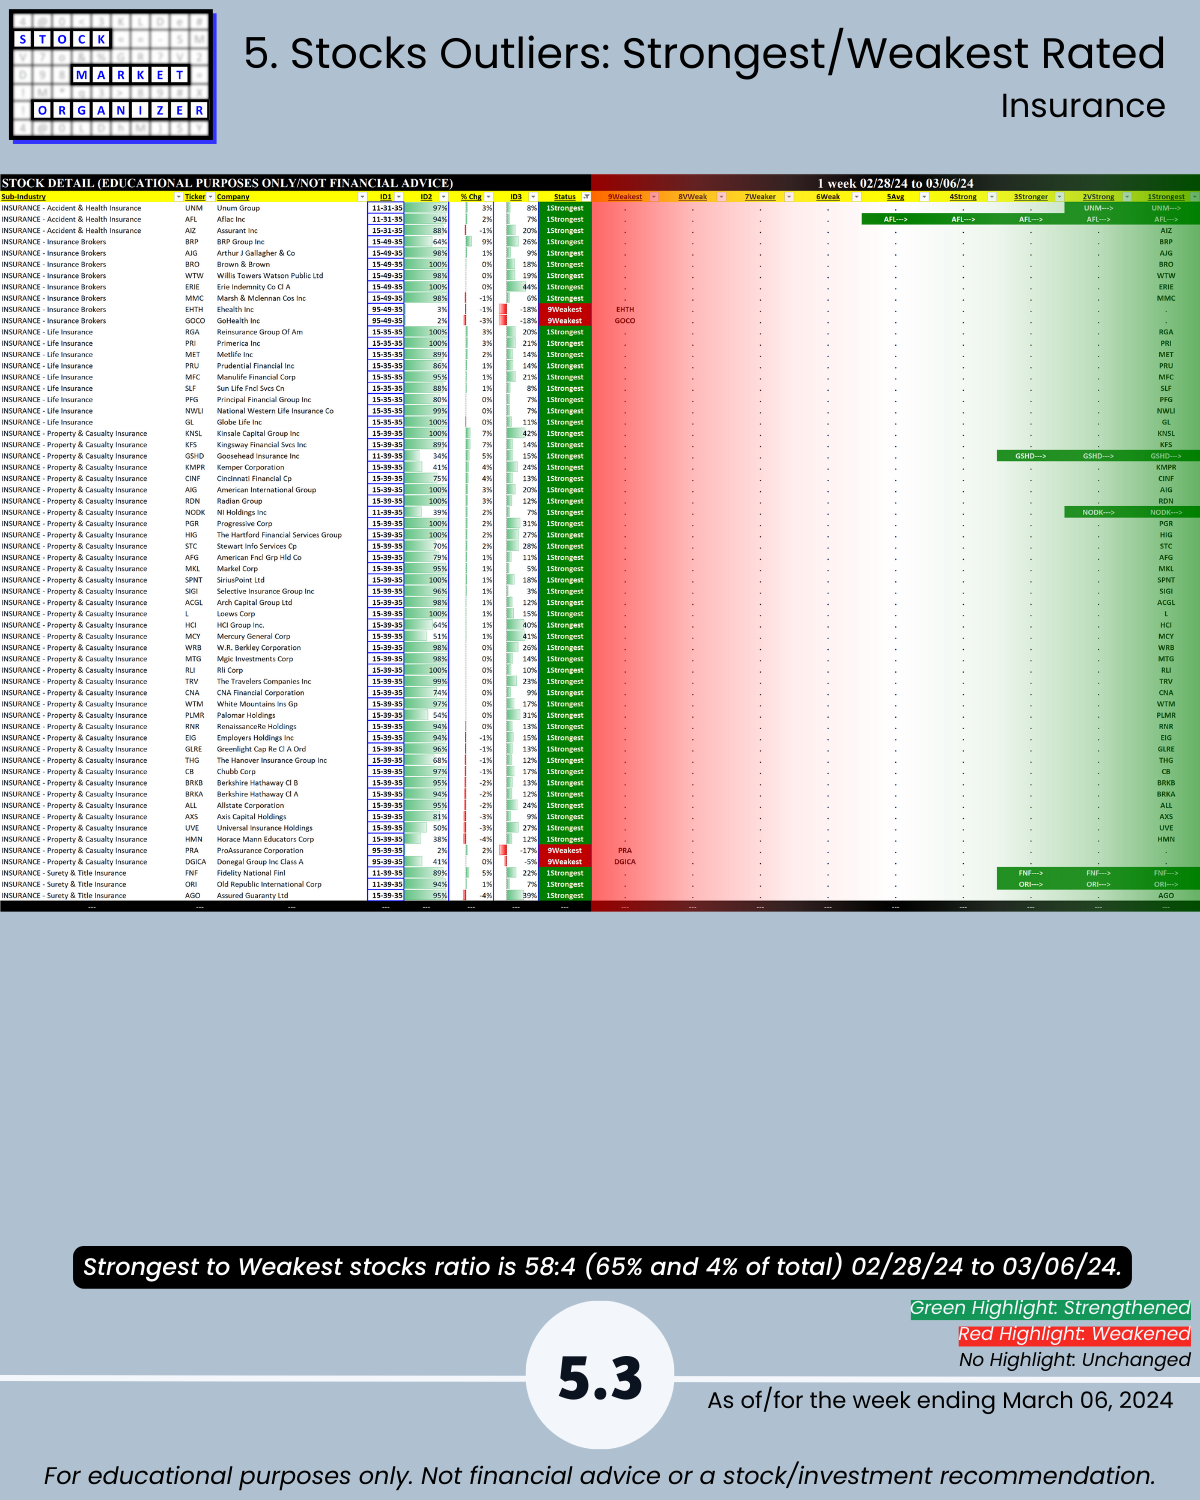
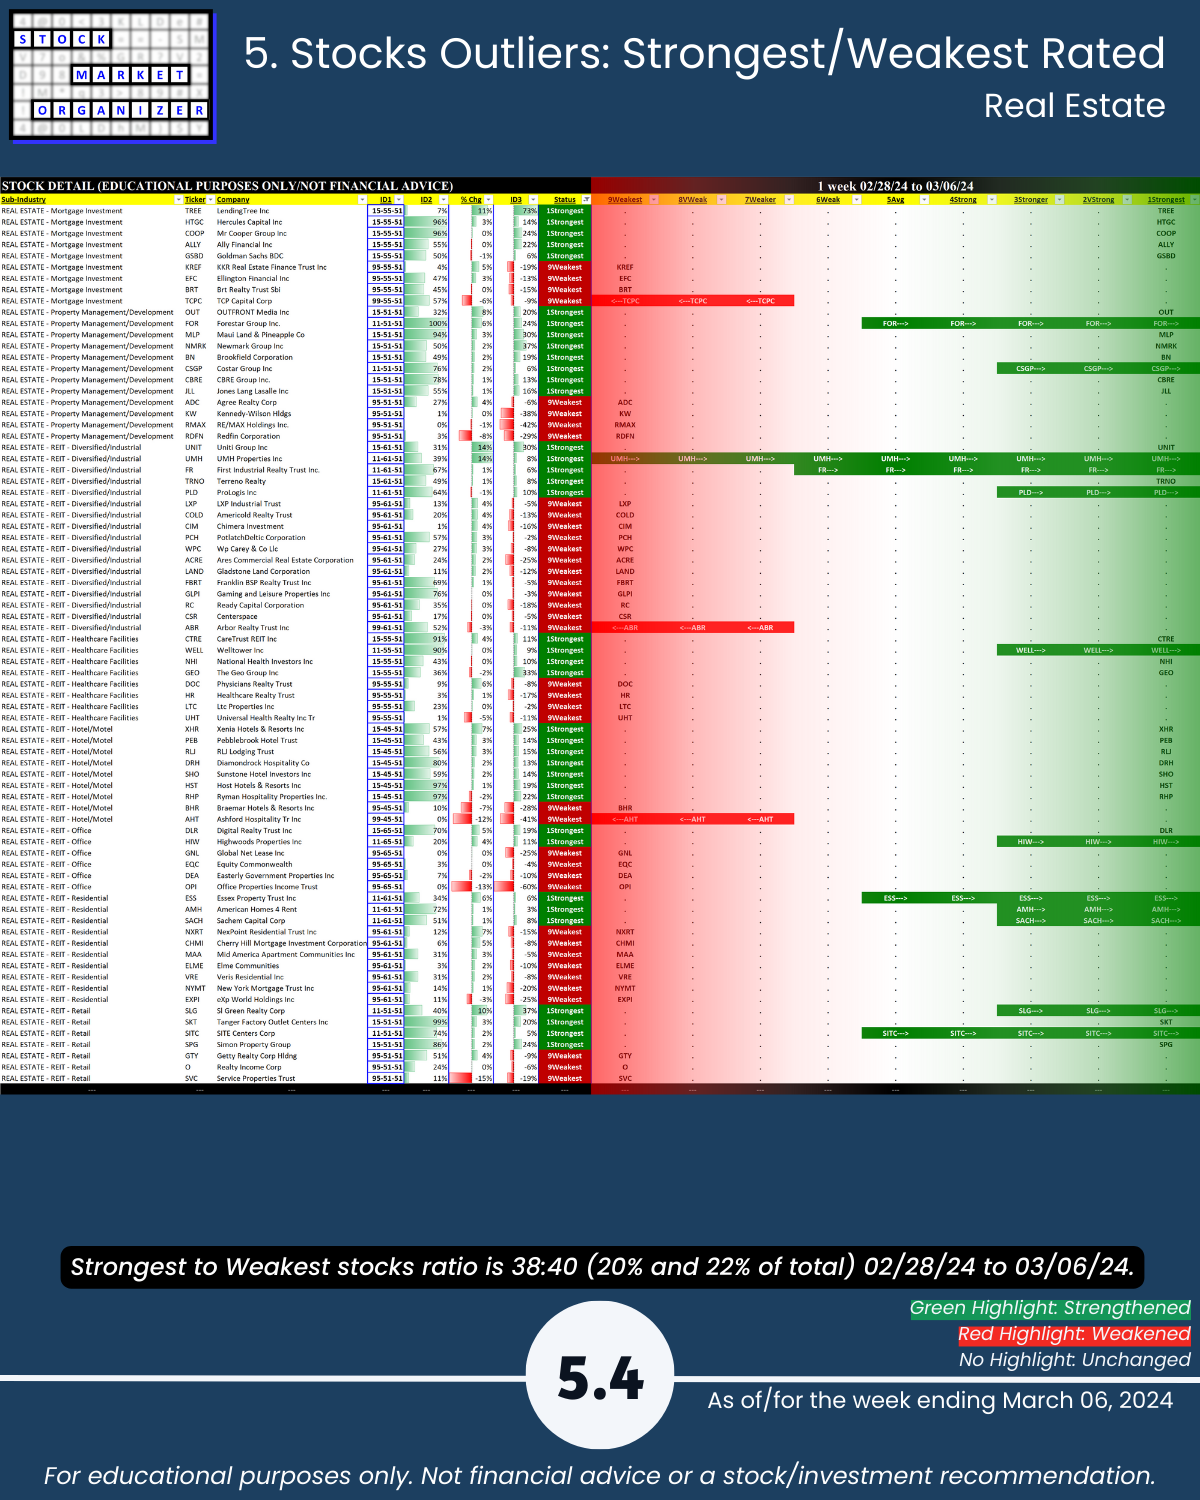
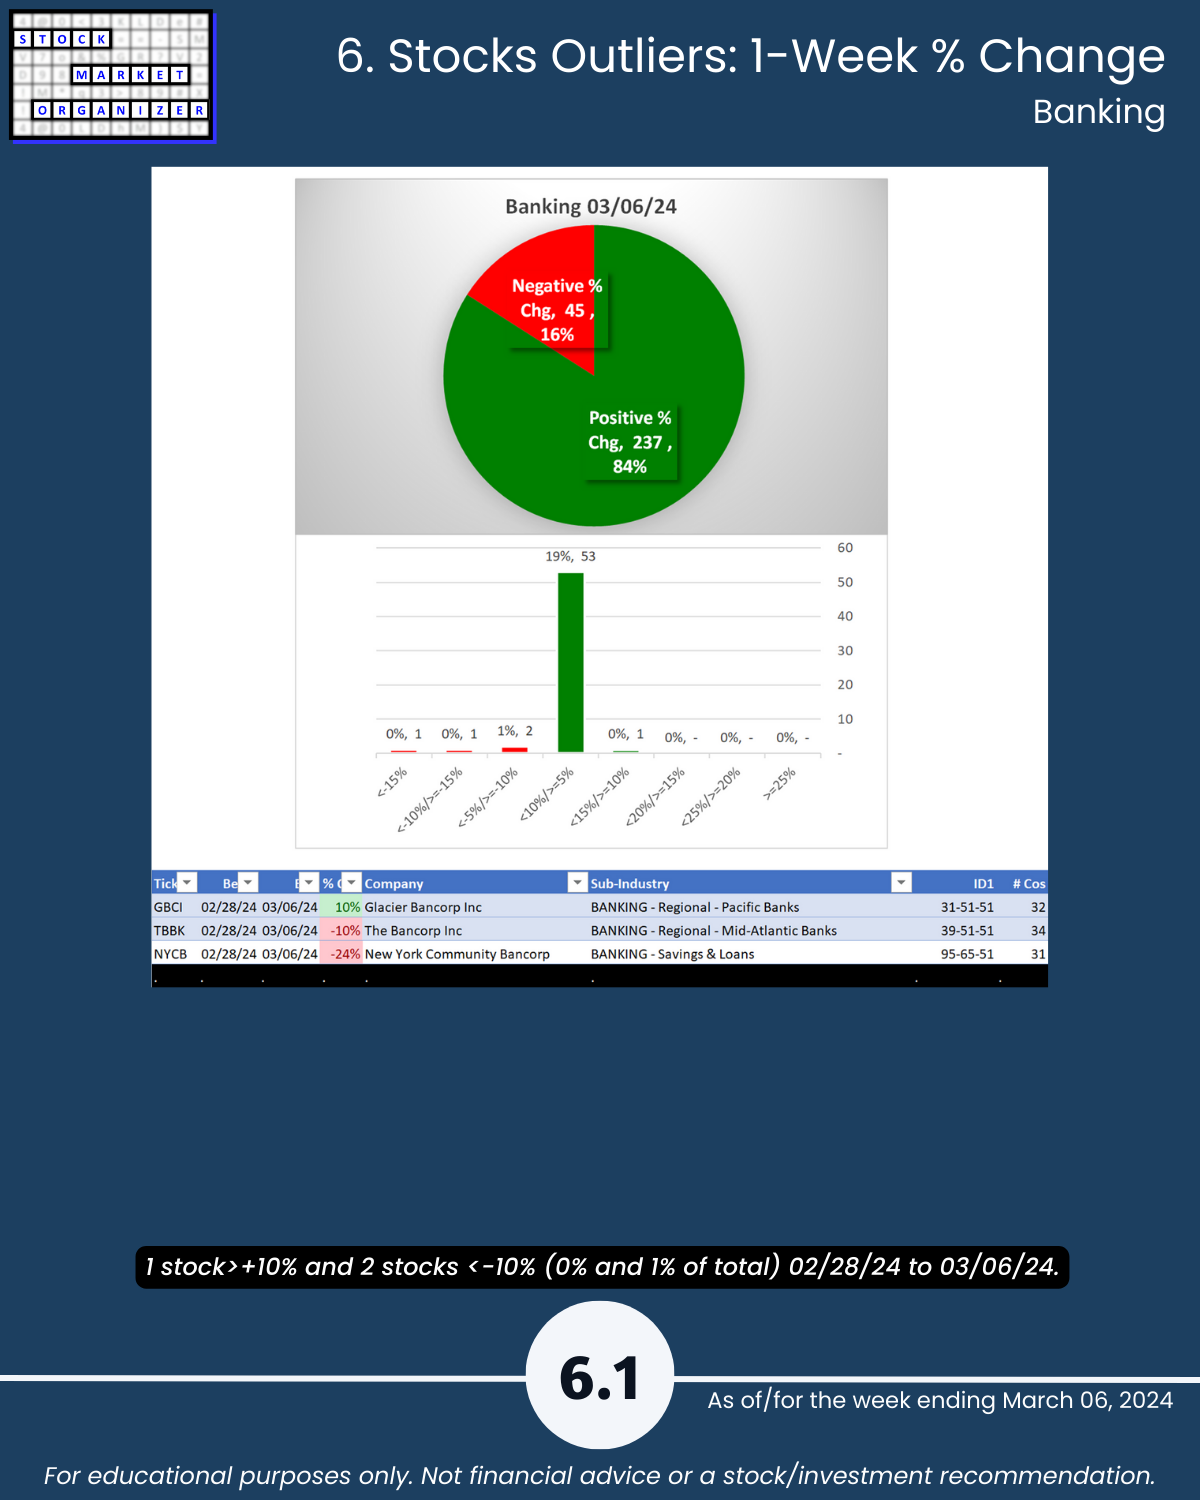
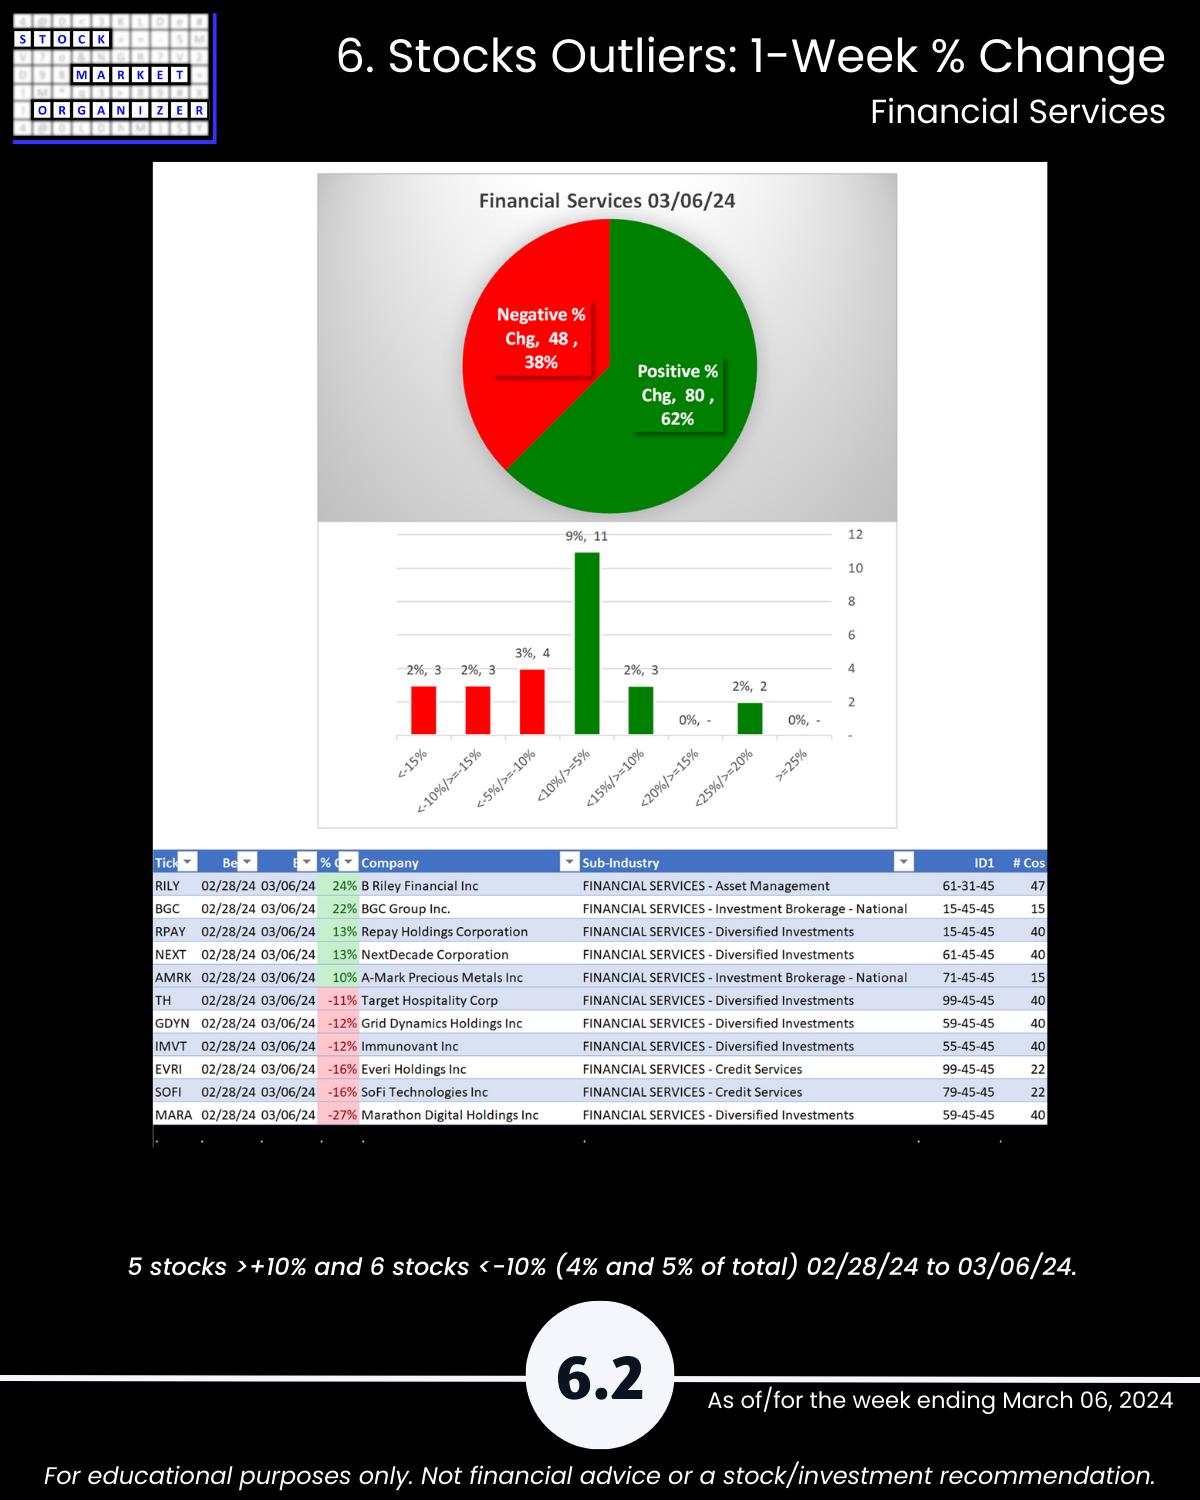
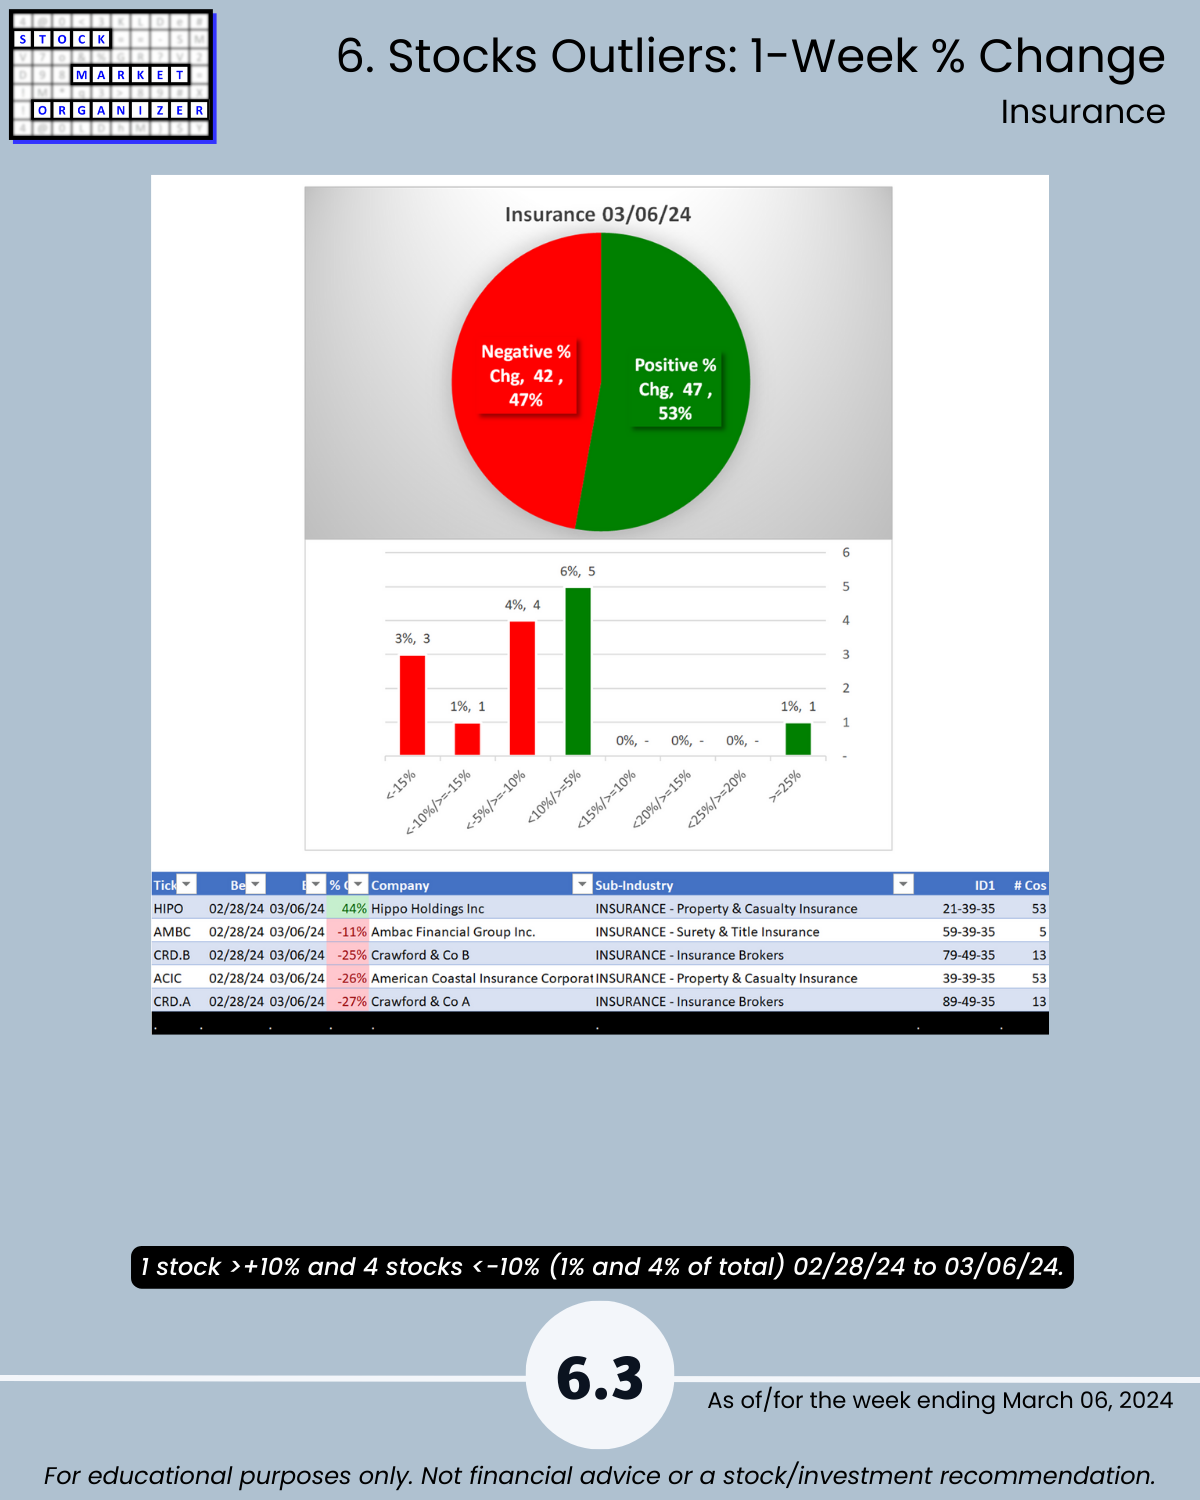
Tomorrow, Tech: today, HIPO (+44% 1 week) doesn’t care that NYCB (-24%) situation not improving, previous week 3 of 4 Financial sector industries WEAKENED, week ending 3/6/24 where are we? Some recovery as Banking 84% positive stocks (page 5.1 = graphic proof of this industry’s improvement), Real Estate 72%. Insurance still firm at 18% of its stocks at 5+ year highs and 65% stocks rated Strongest (highest of 9 strength levels, page 5.3). This despite former star pupil ACIC -26% this week after being +104% in 3.5 months from 11/13/23 to 2/28/24.
If you aren’t explicitly looking everywhere for strength, how will you know where and when the next pockets of strength and weakness are emerging?
Below/attached: Financial sector detail including Strongest- and Weakest-rated stocks and objective strengthening/weakening measurements.
DEEP DOWN YOU PROBABLY KNOW
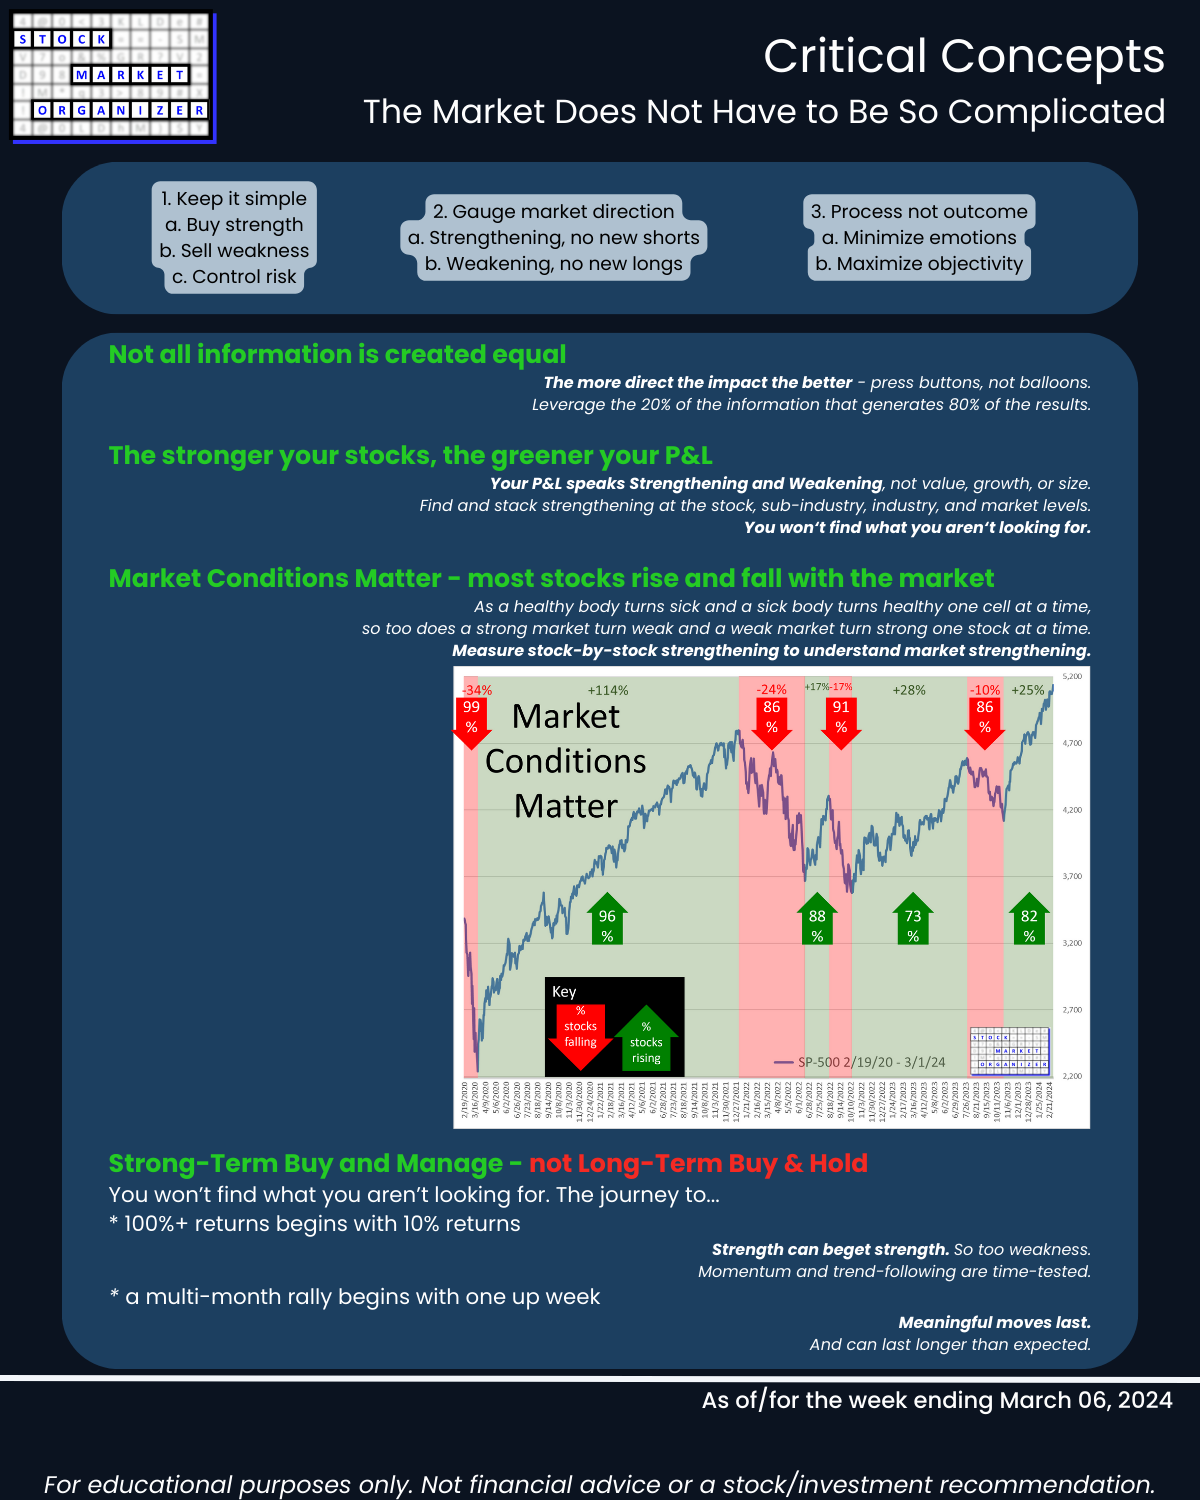
The market doesn’t have to be so complicated.
I look for strength in every corner and every level of the U.S. stock market because the stronger your stocks the greener your P&L.
🔹 Individual stock strength is great.
🔹 It’s even better when stacked with sub-industry, industry, and market strength.
HIGHLIGHTS
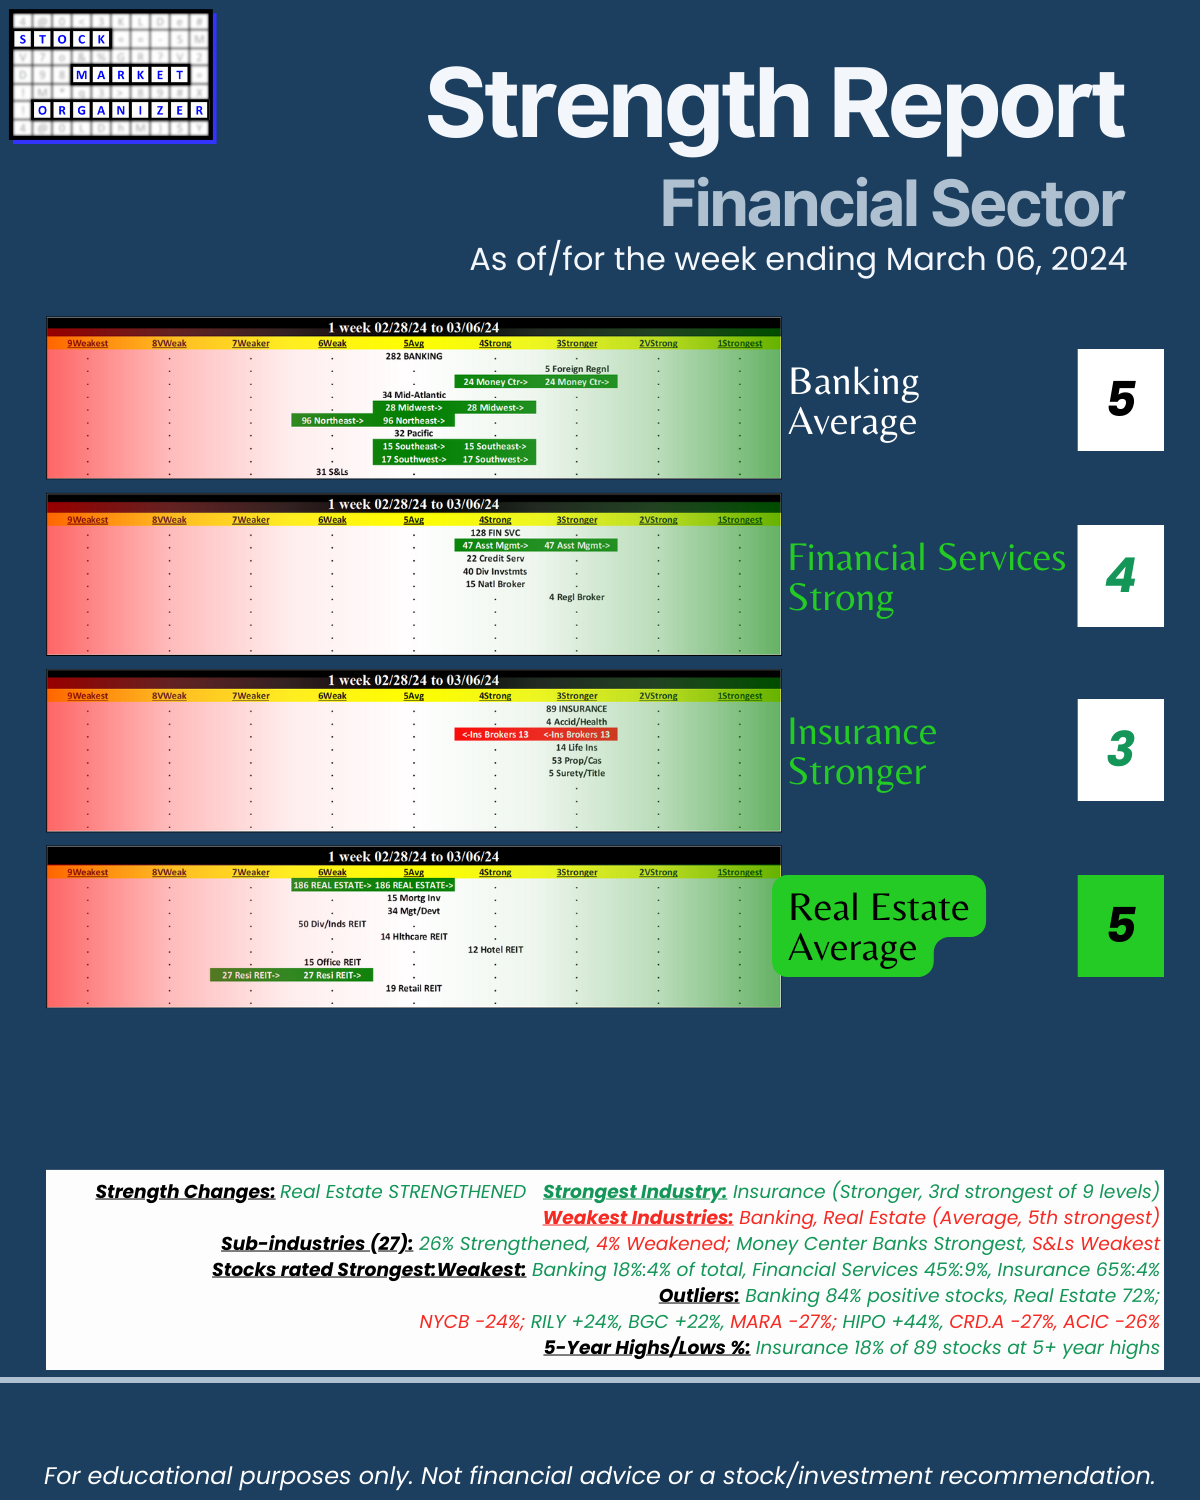
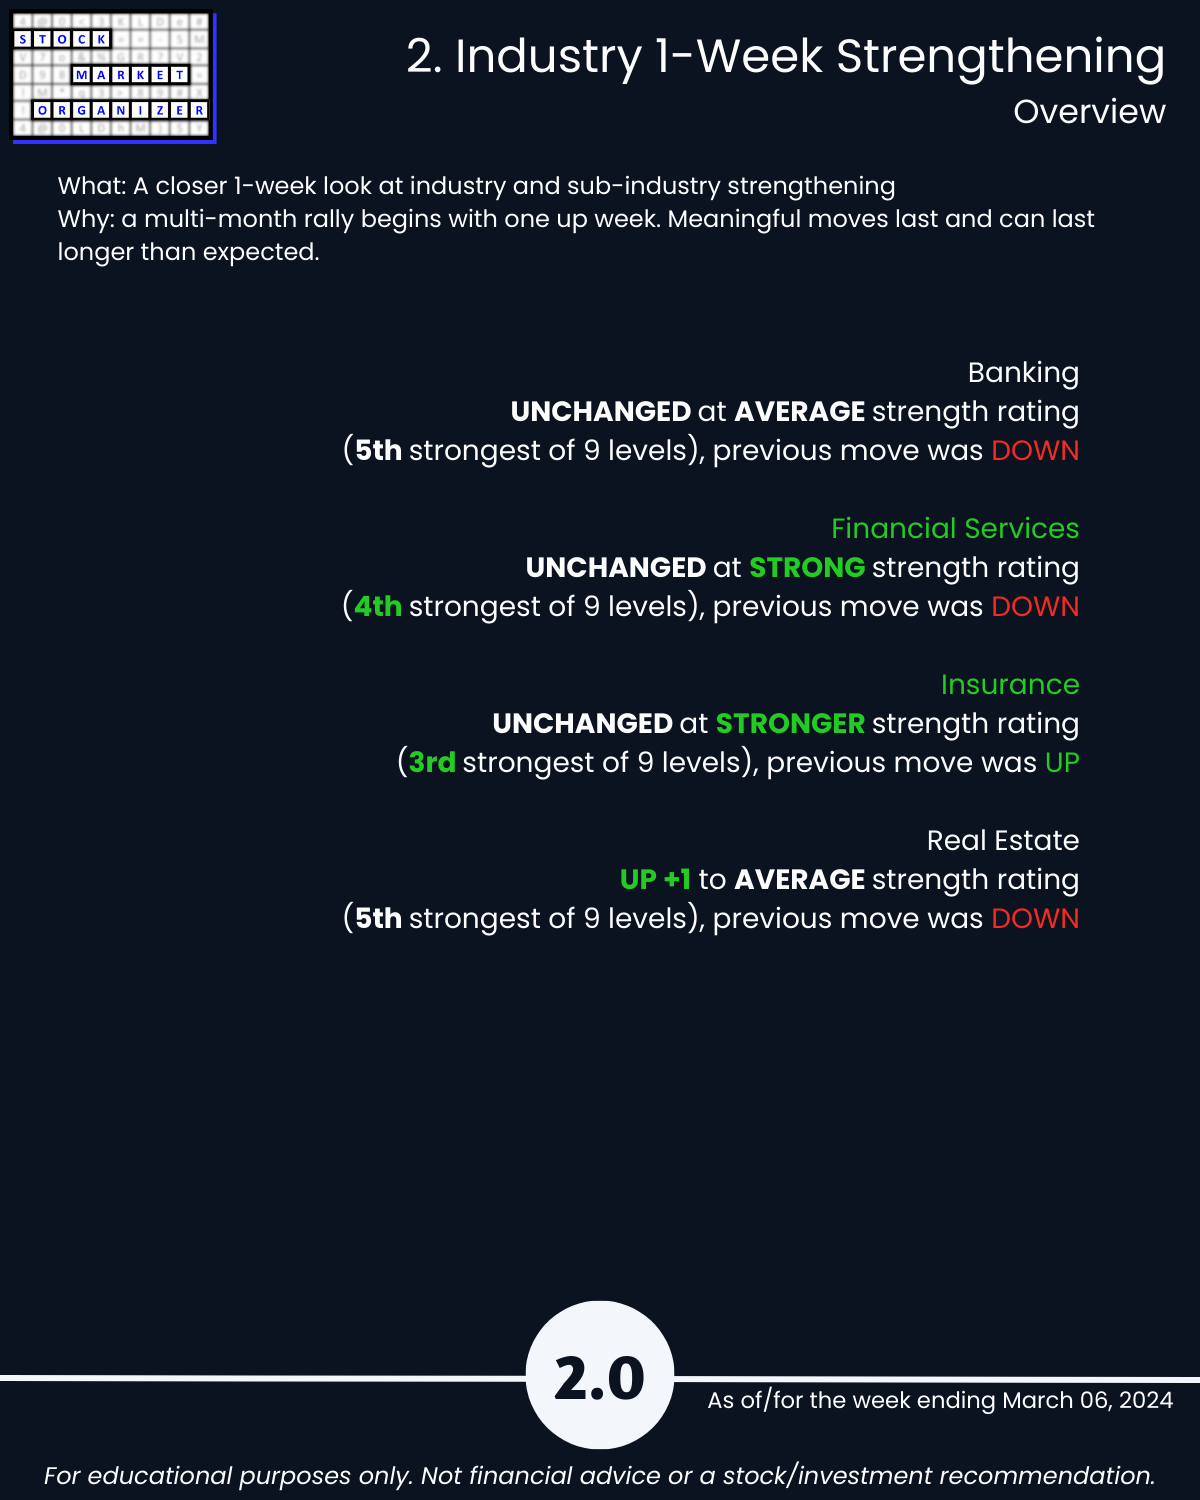
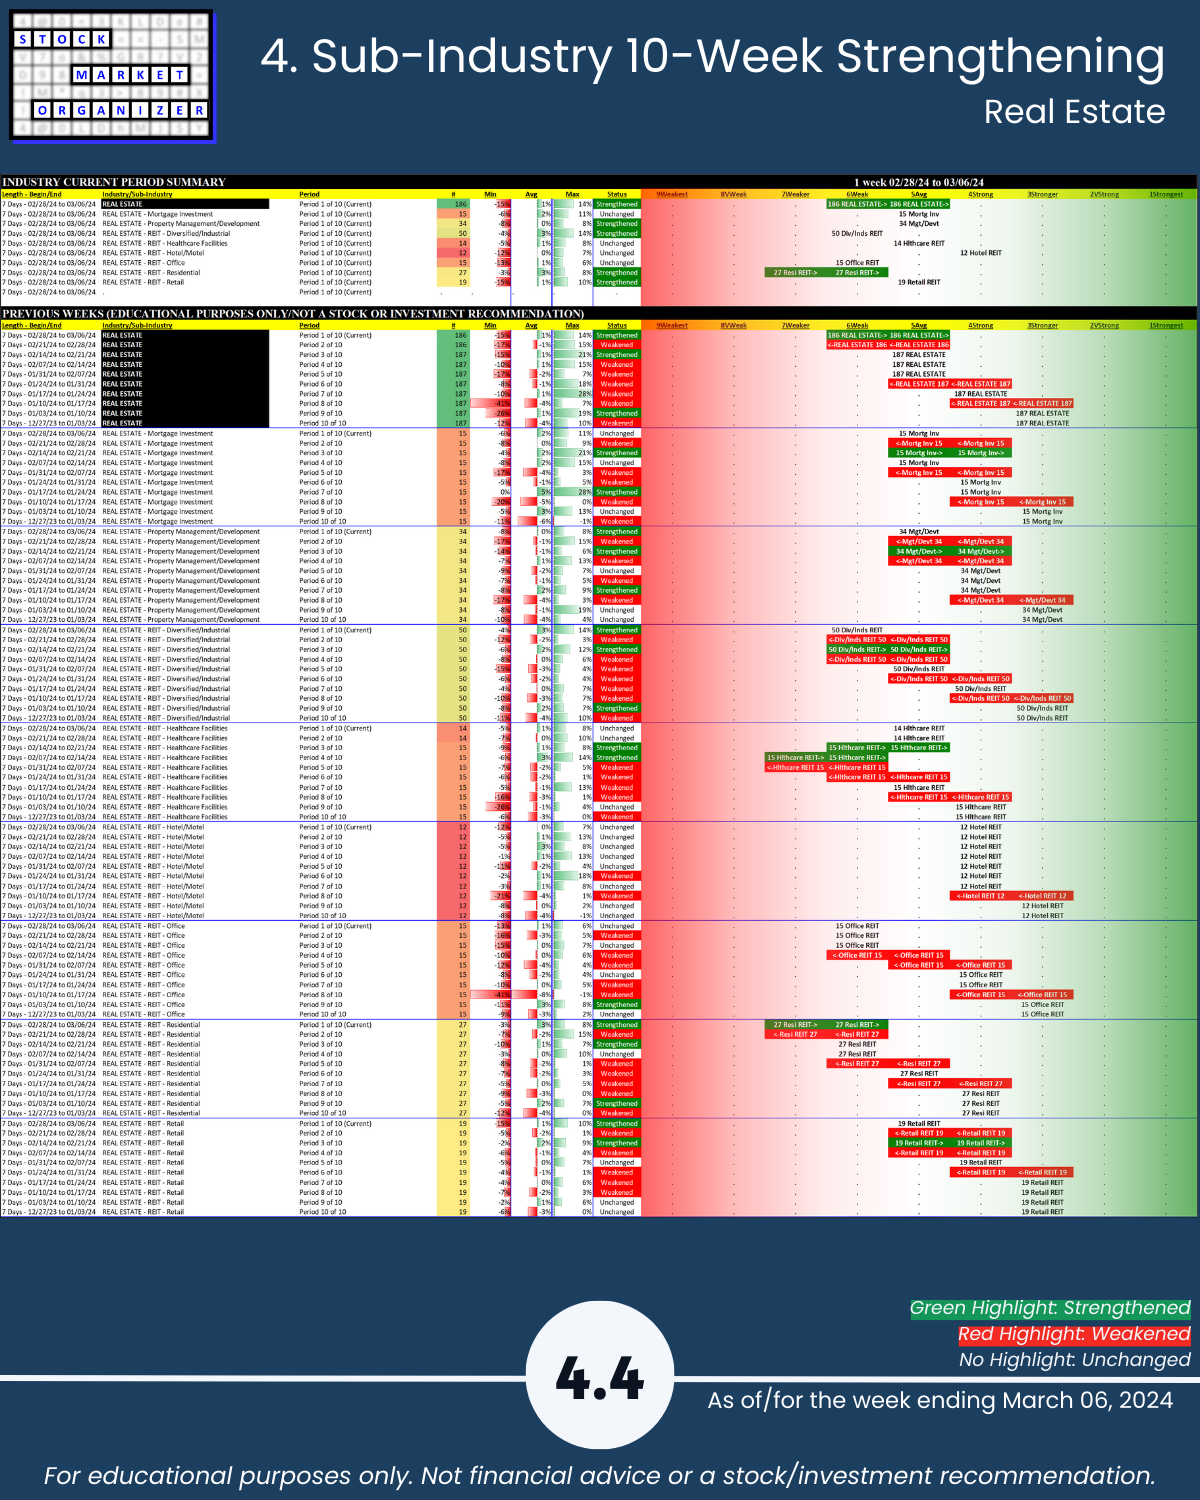
🔹 Strength Changes: Real Estate STRENGTHENED
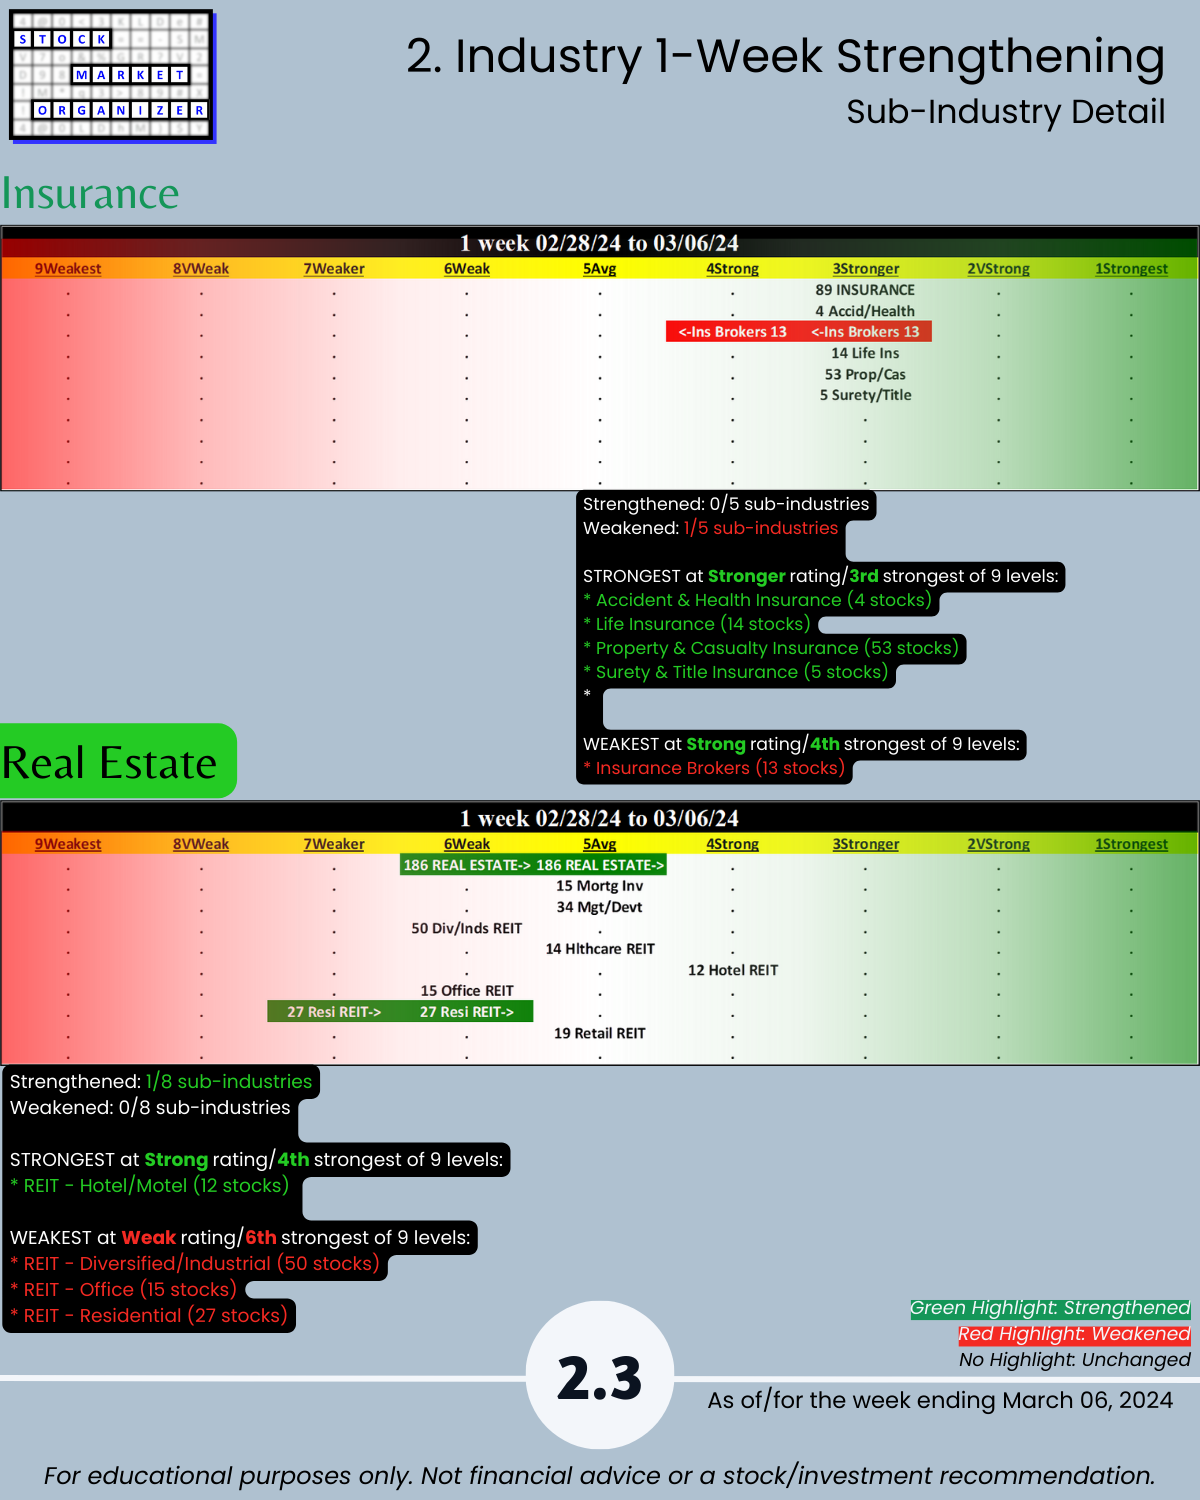
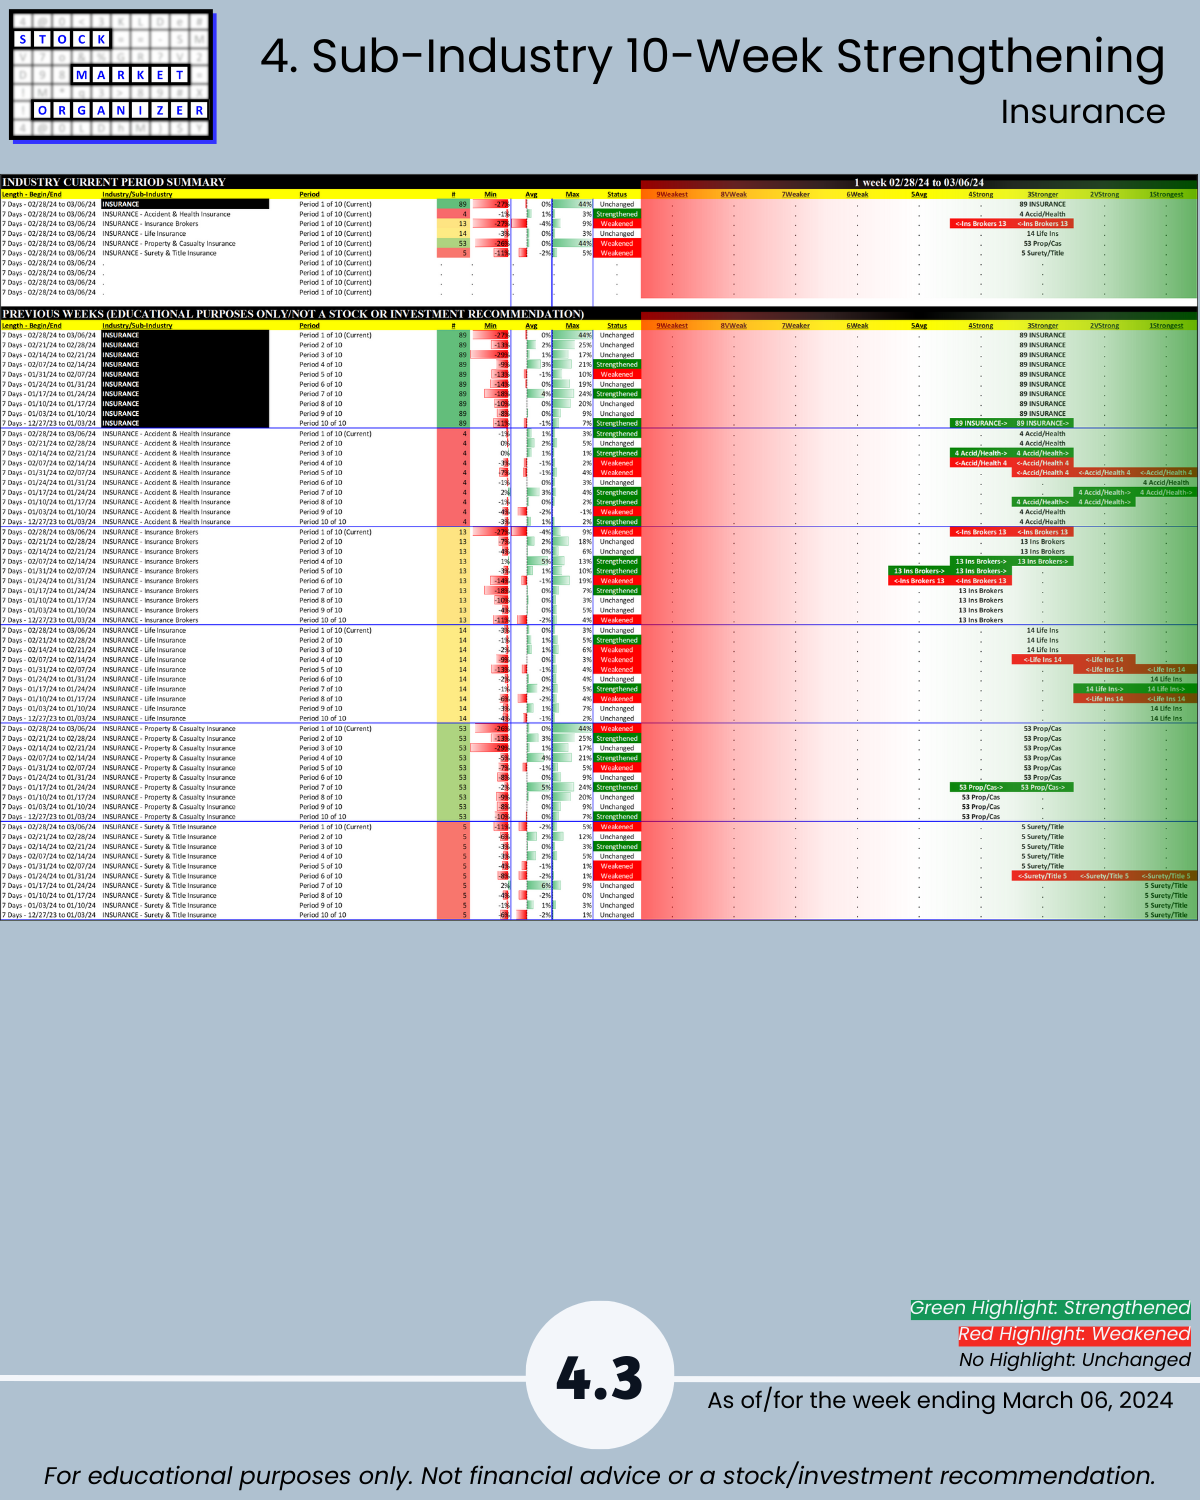
🔹 Strongest Industry: Insurance (Stronger, 3rd strongest of 9 levels)
🔹 Weakest Industries: Banking, Real Estate (Average, 5th strongest)
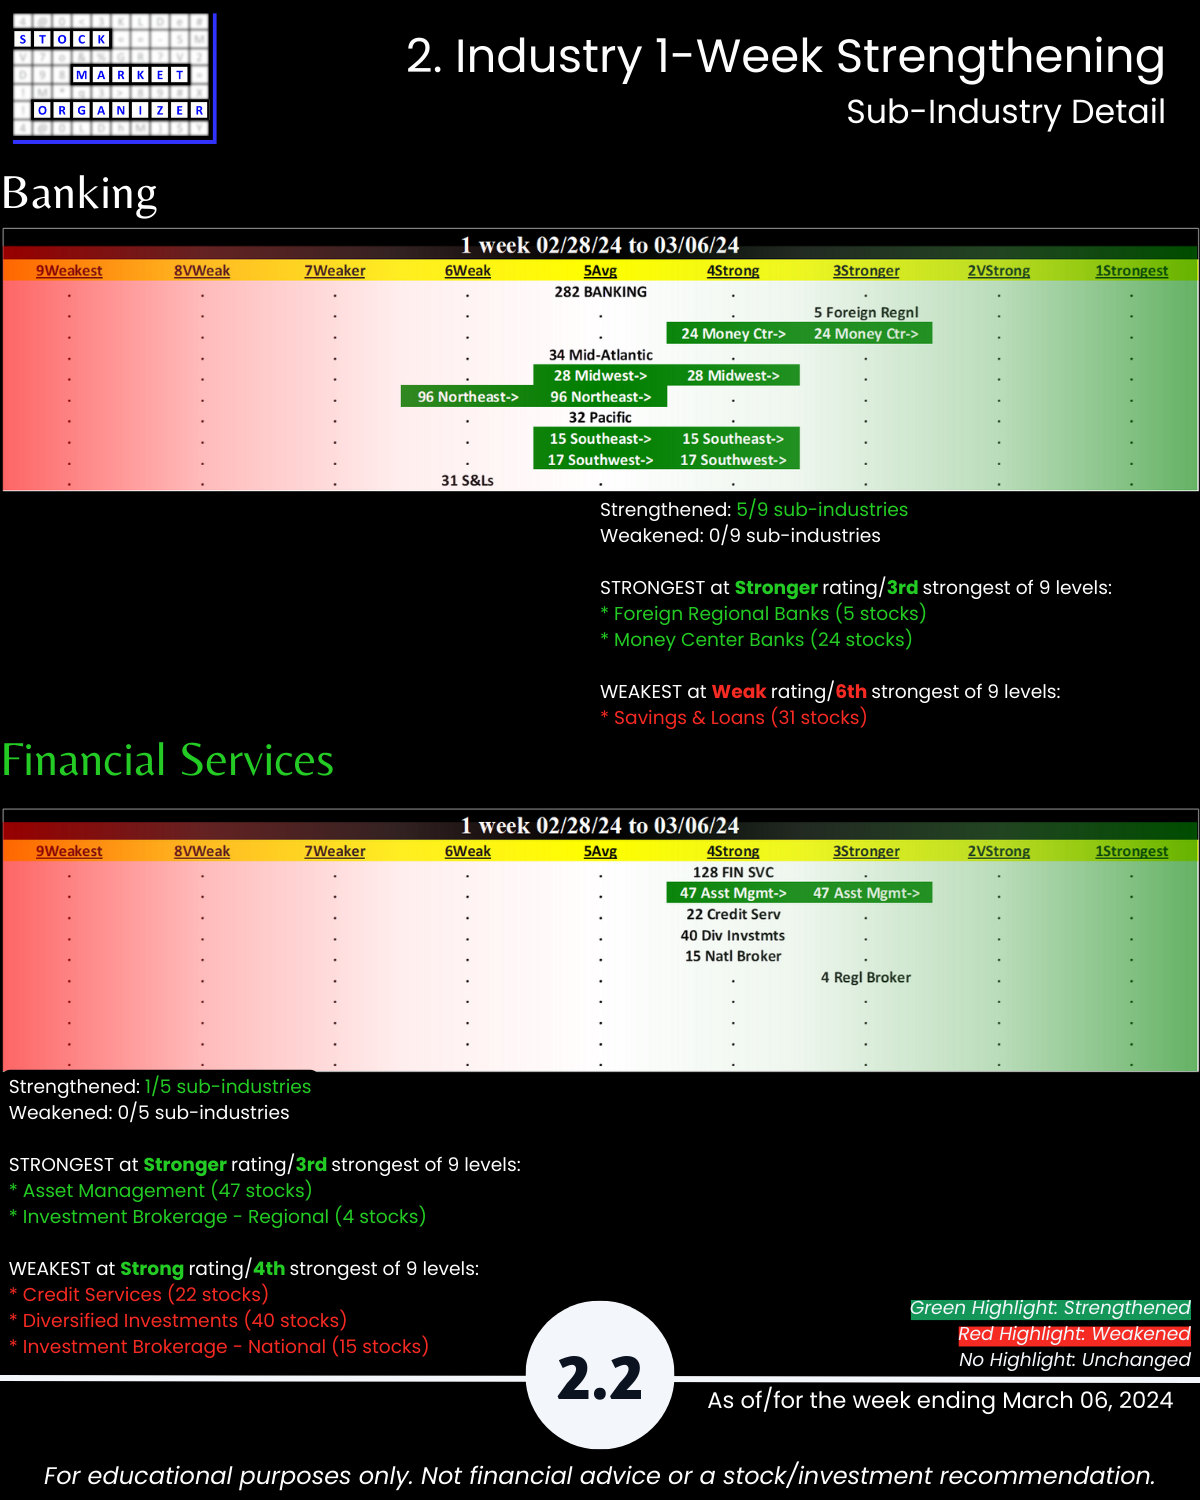
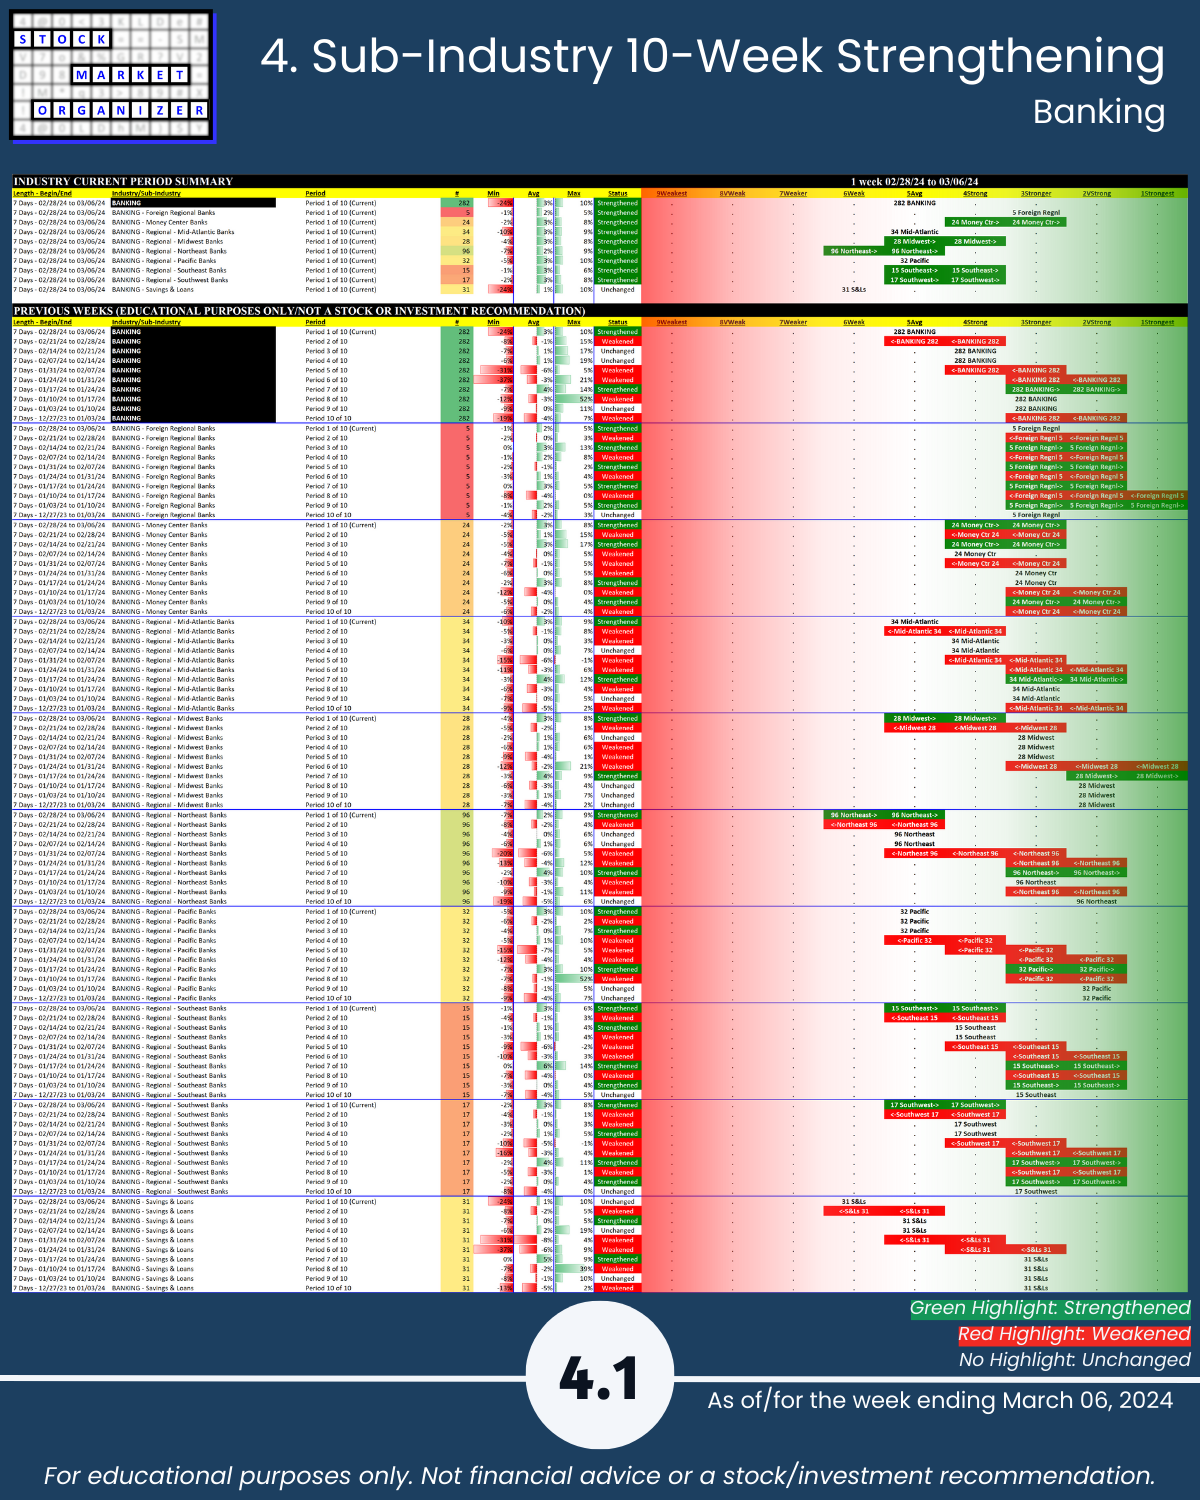
🔹 Sub-industries (27): 26% Strengthened, 4% Weakened; Money Center Banks Strongest, S&Ls Weakest
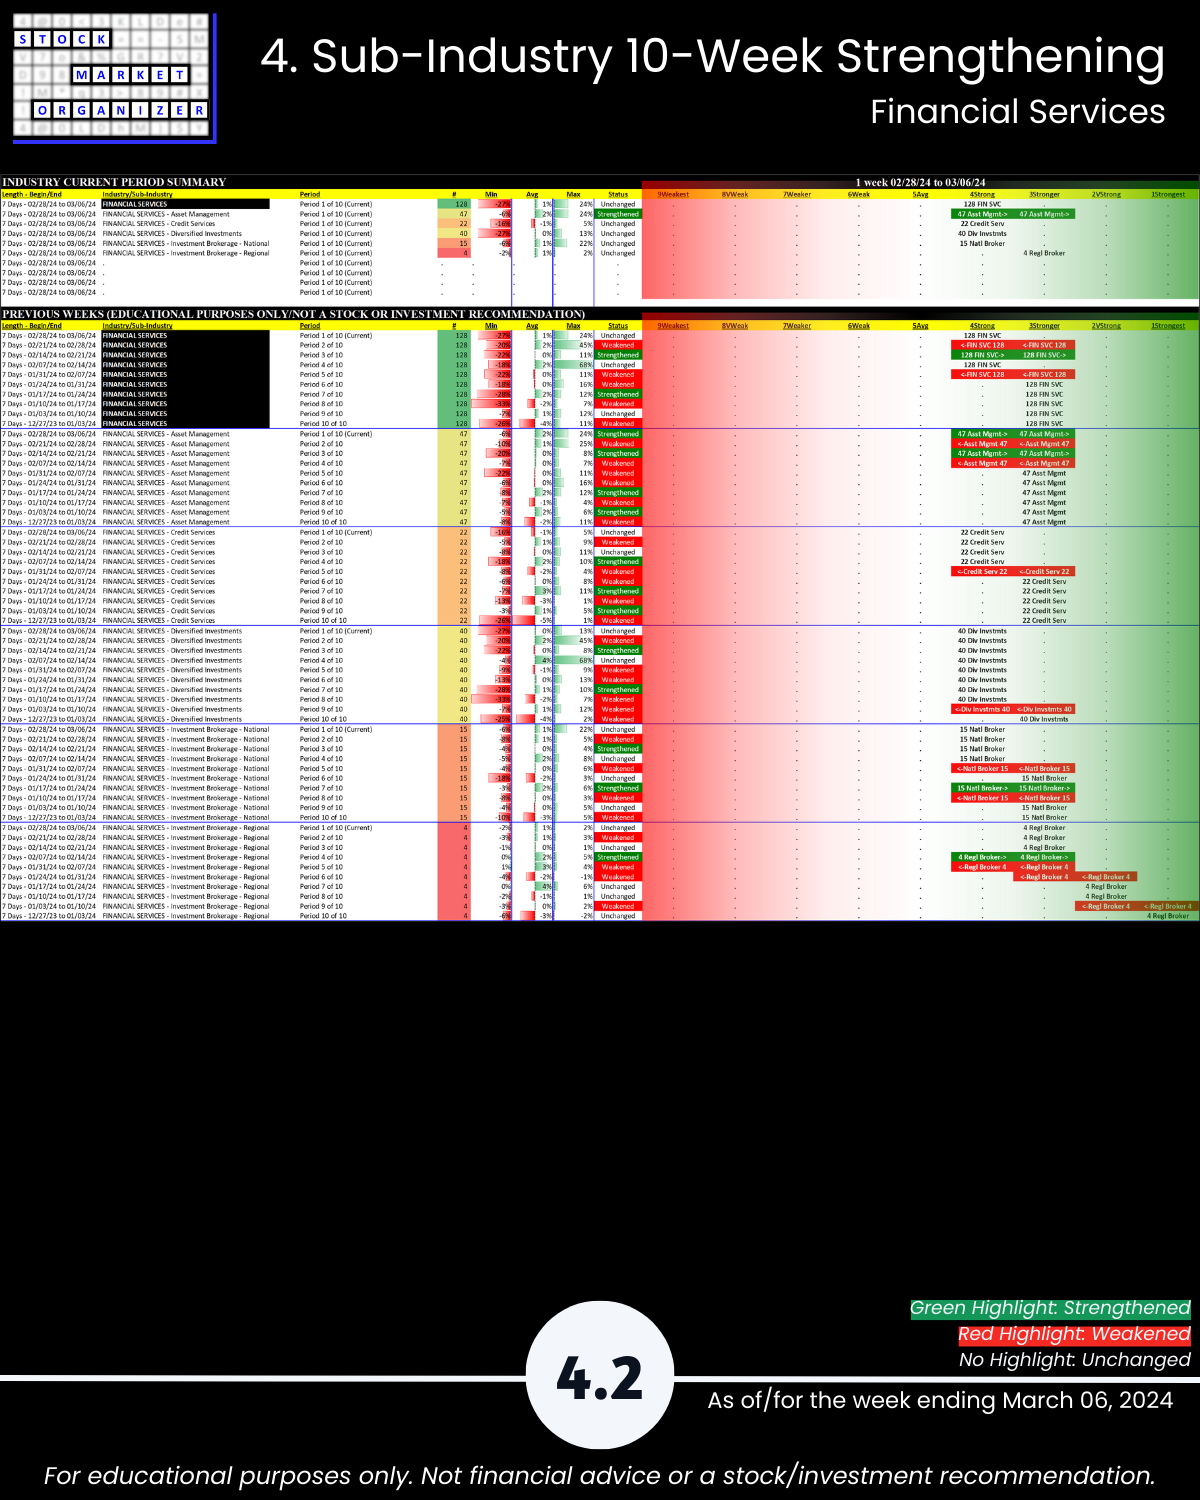
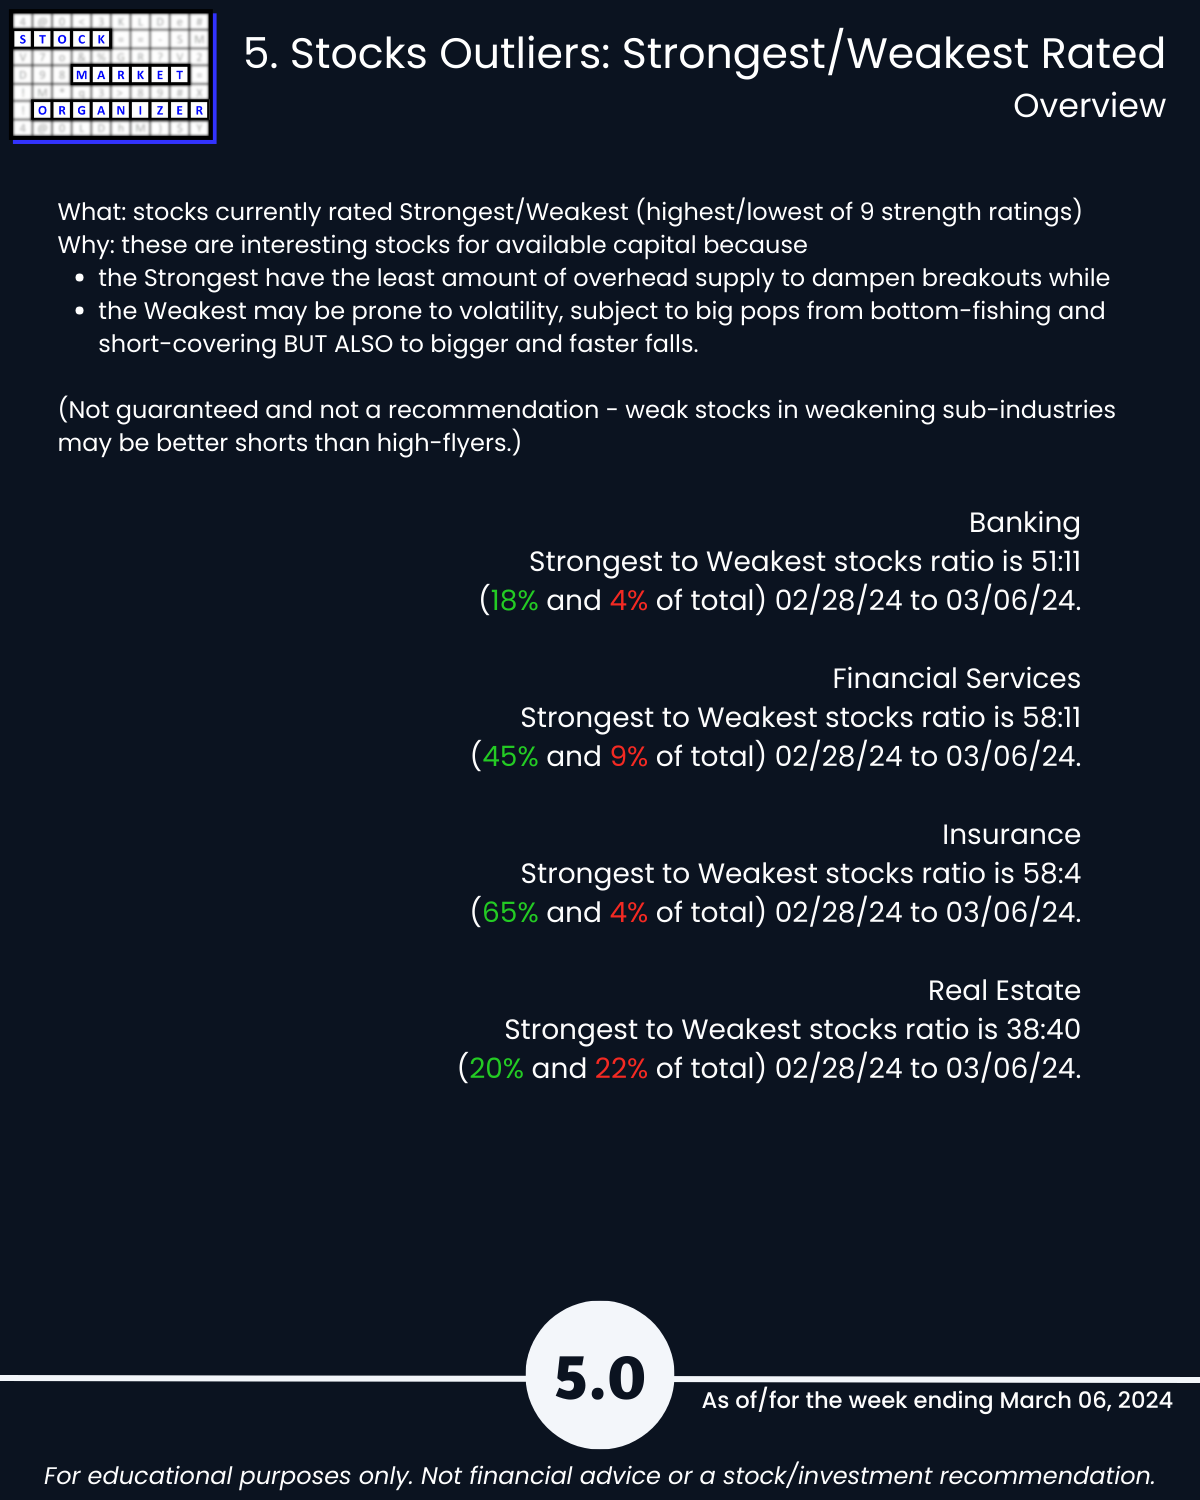
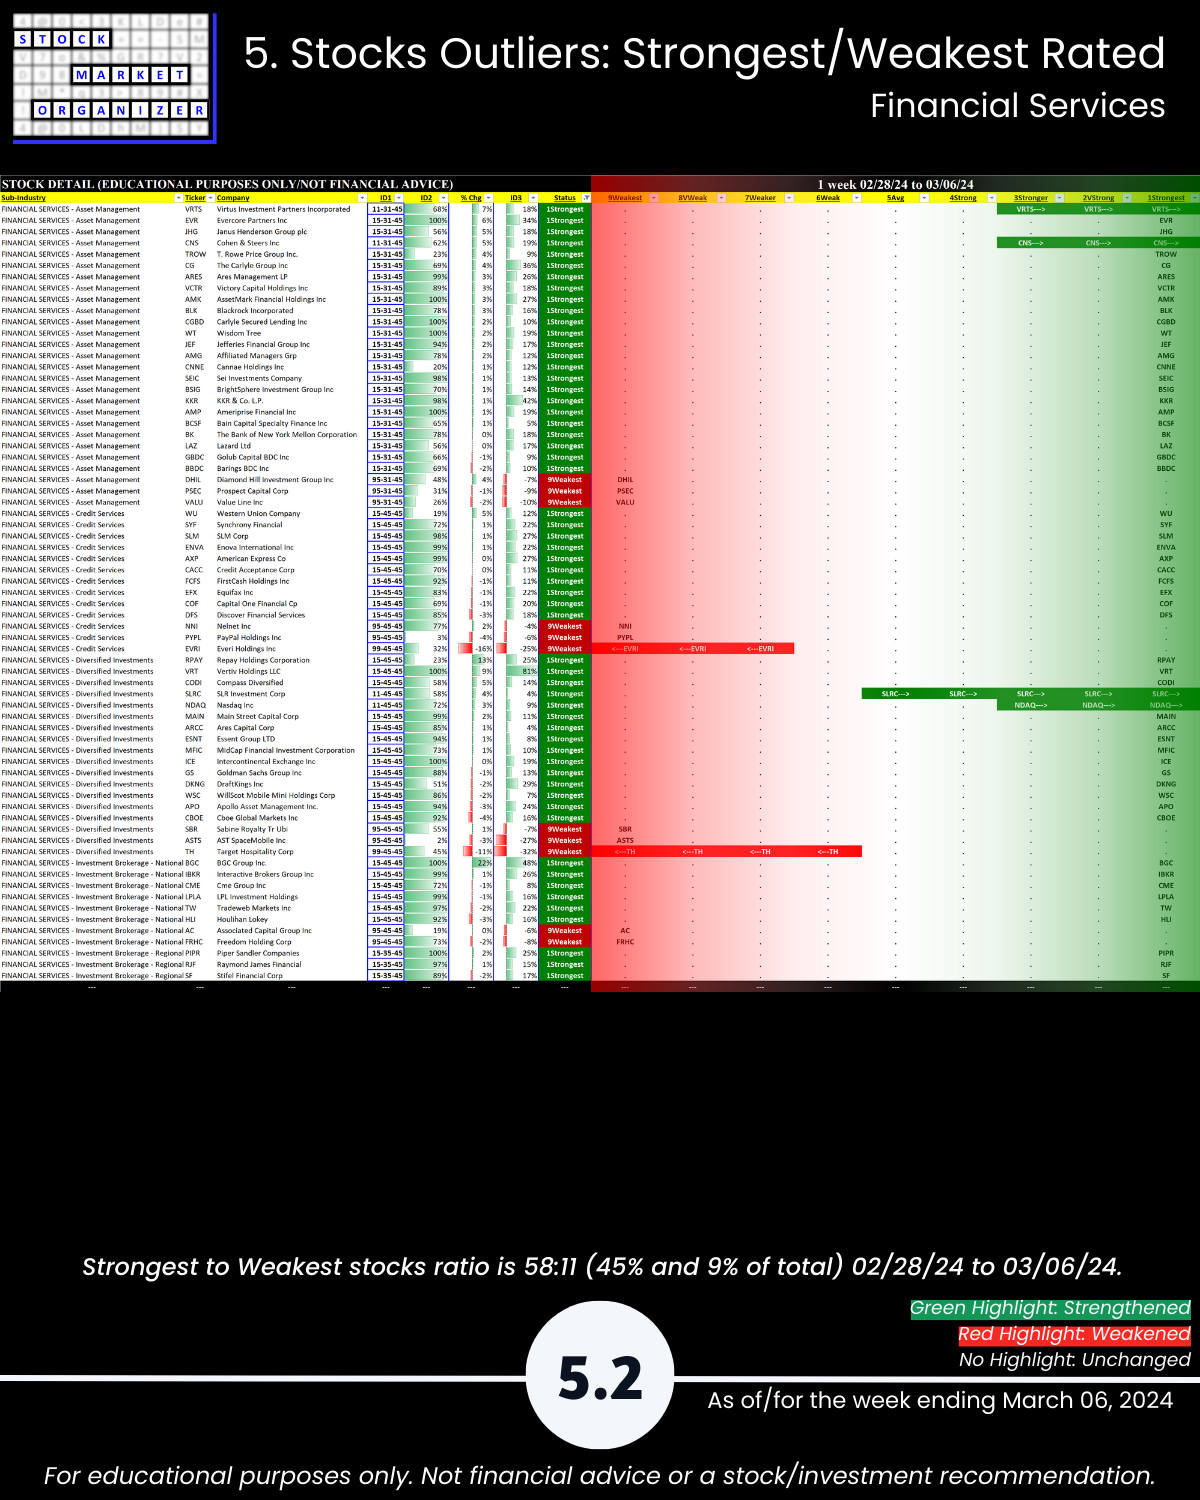
🔹 Stocks rated Strongest:Weakest: Banking 18%:4% of total, Financial Services 45%:9%, Insurance 65%:4%
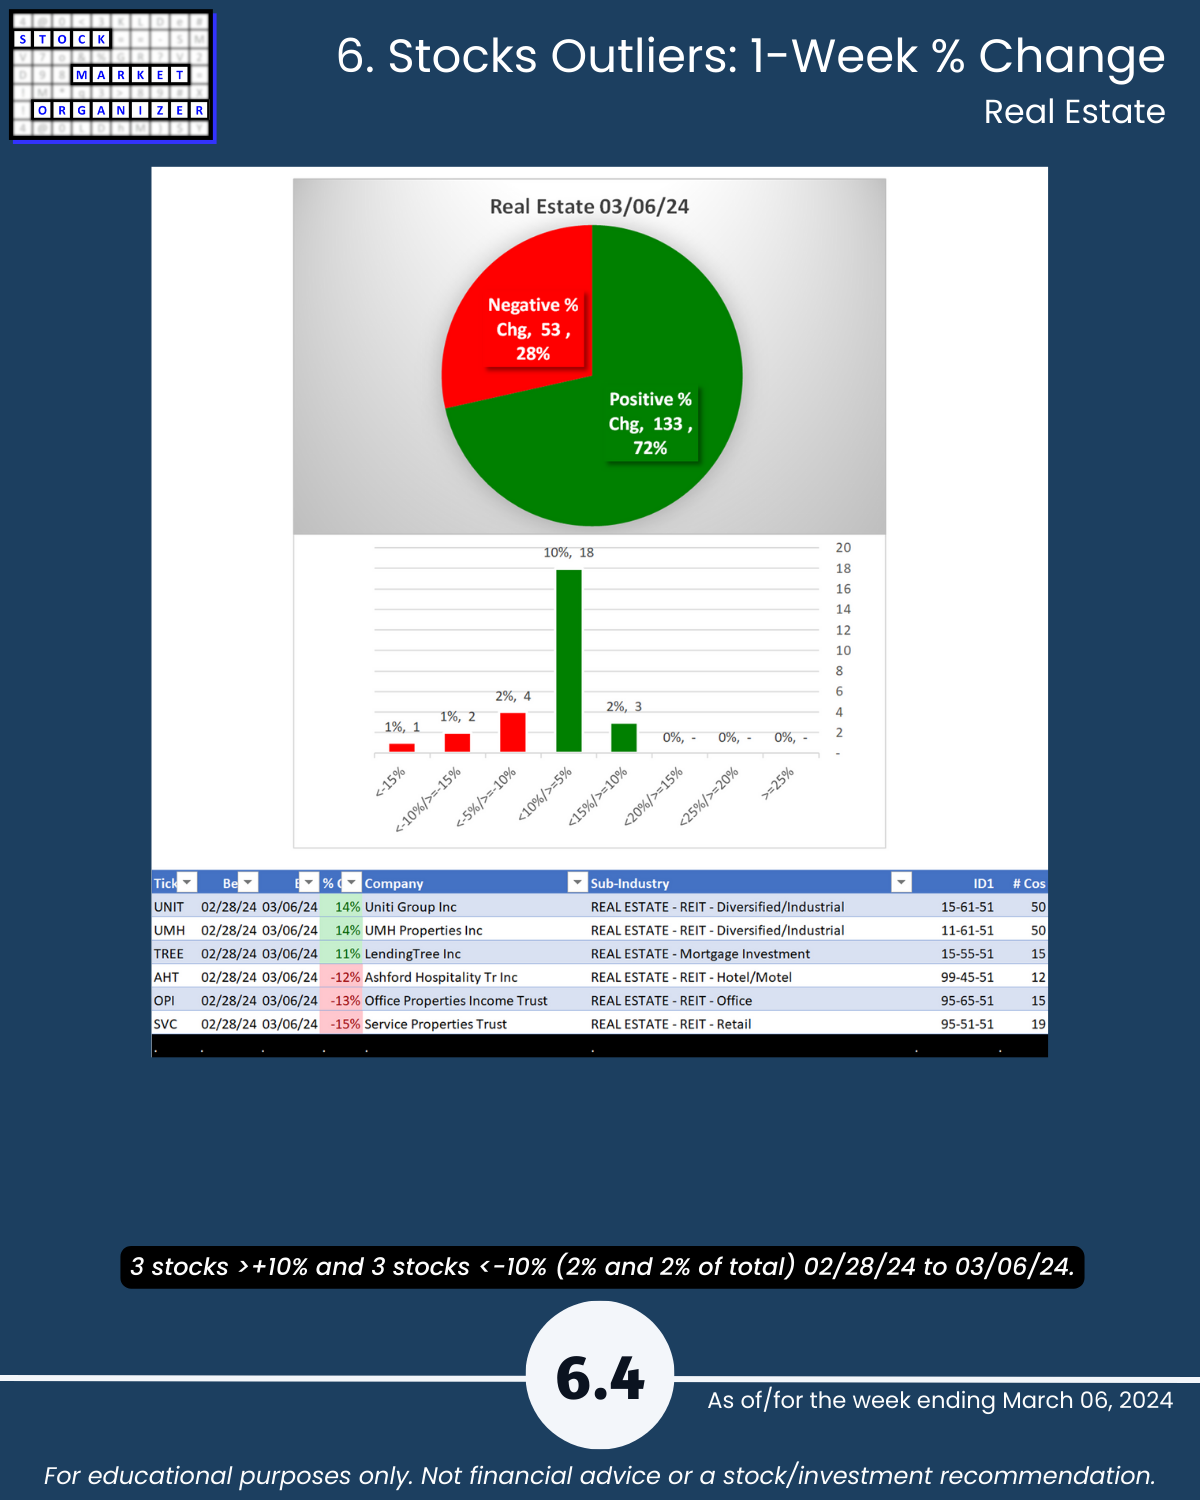
🔹 Outliers: Banking 84% positive stocks, Real Estate 72%; NYCB -24%; RILY +24%, BGC +22%, MARA -27%; HIPO +44%, CRD.A -27%, ACIC -26%
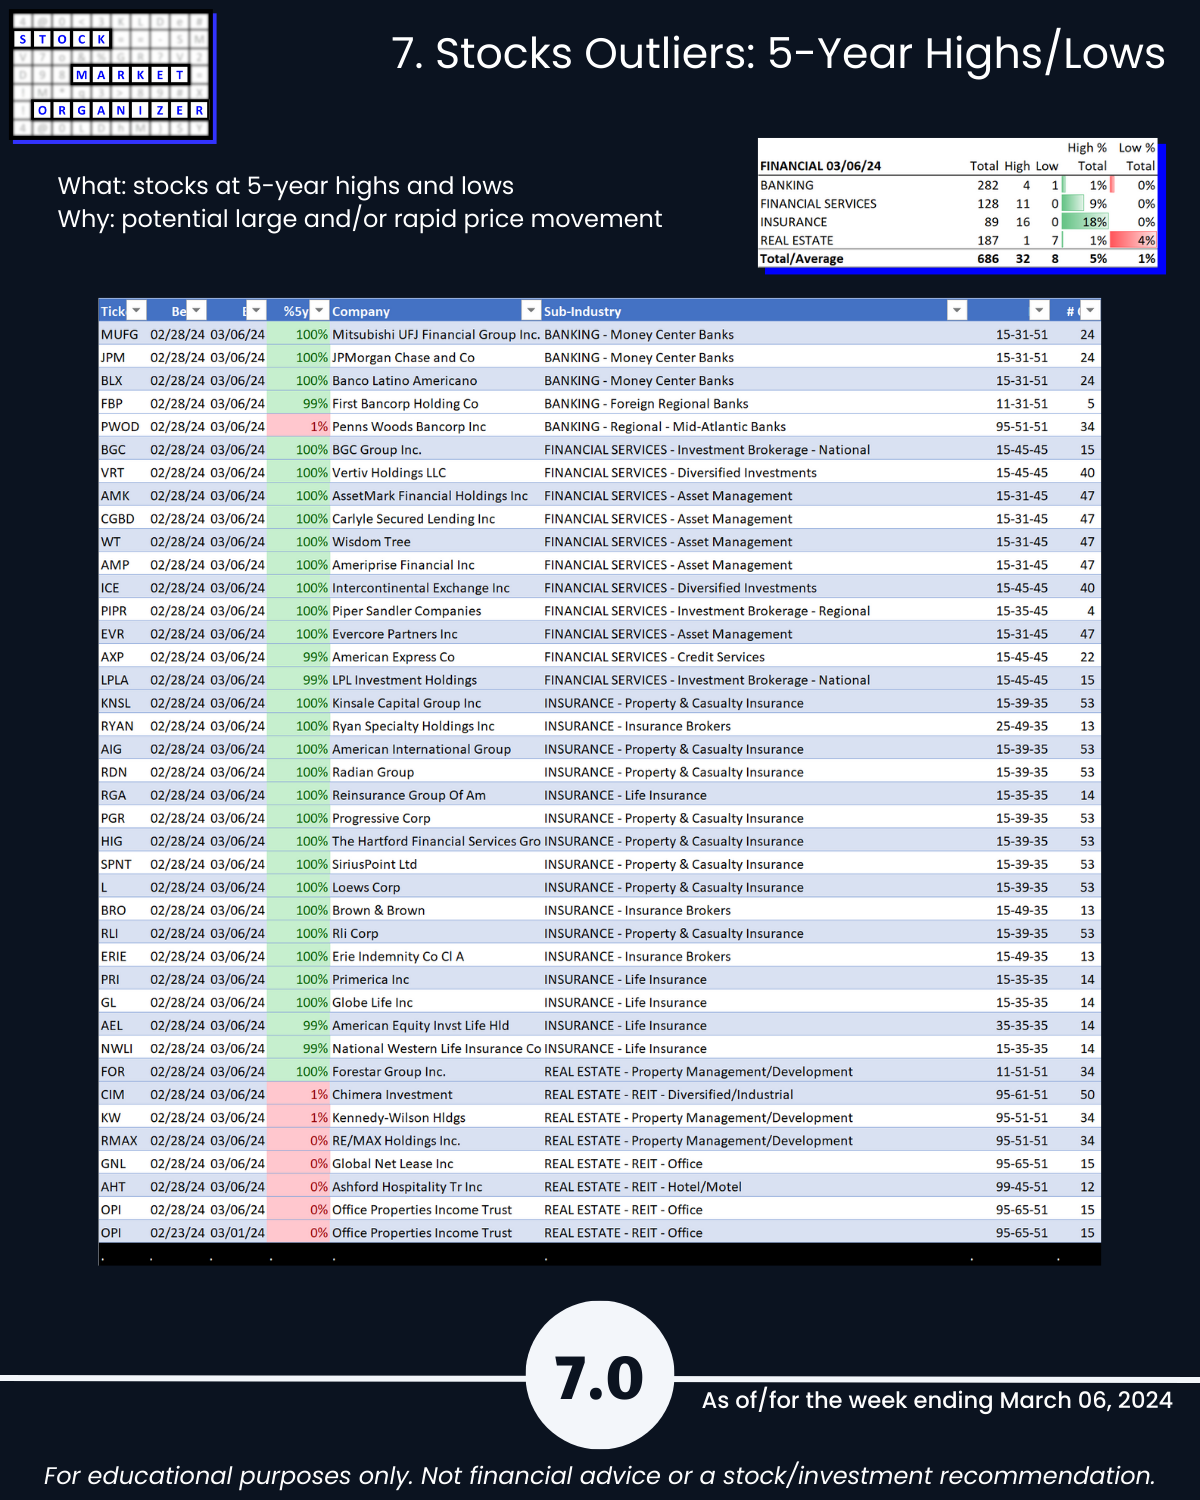
🔹 5-Year Highs/Lows %: Insurance 18% of 89 stocks at 5+ year highs
WHAT’S GOING ON HERE?
I’m finding strong stocks in strengthening sub-industries and strengthening industries by tracking strengthening/weakening from the individual stock through overall market levels.
From this you know:
🔹 The strongest stocks in each industry. Helpful for “the stronger your stocks, the greener your P&L” believers. Ditch portfolio dogs until they begin strengthening.
🔹 Whether sub-industries and industries are currently strengthening. “The trend is your friend” applies to sub-industries and industries too.
This report may particularly be of interest if the following 5 concepts resonate with you:
- The stronger your stocks, the greener your P&L.
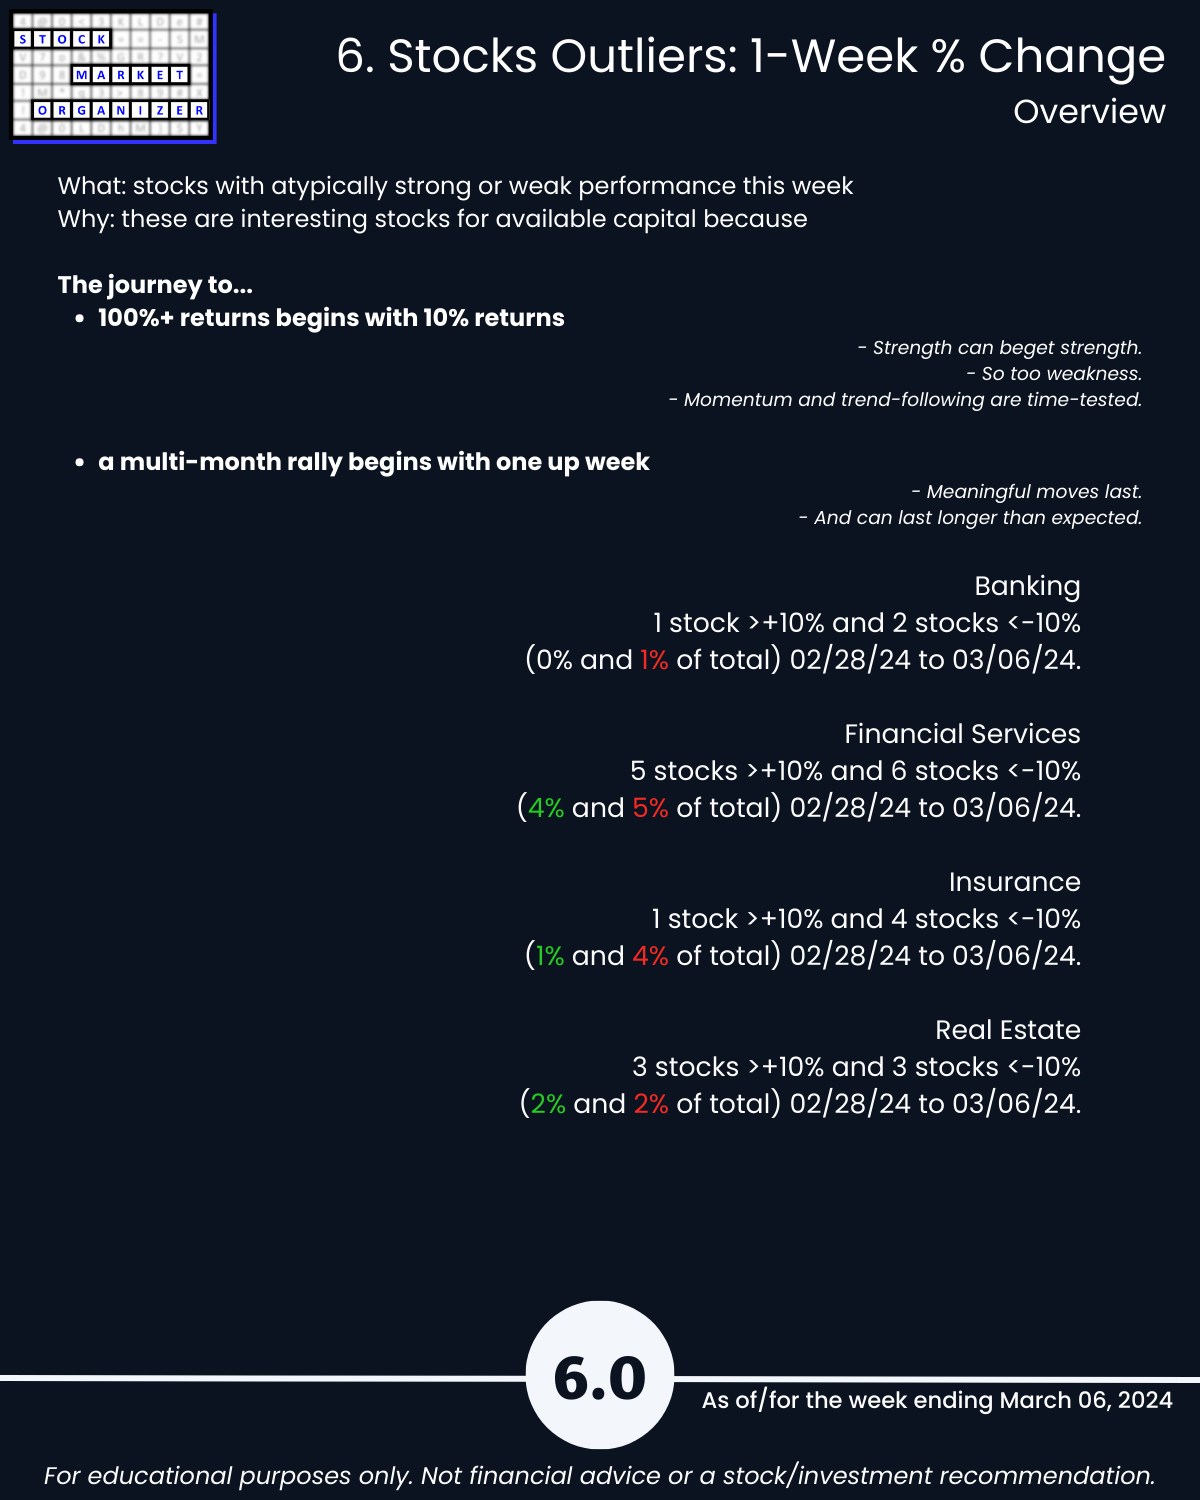
- The journey to 100%+ returns begins with 10% returns.
- The journey to a multi-month rally begins with one up week.
- Most stocks do what the market does. (While the market can only do what its underlying stocks, sub-industries, and industries do.)
- 80/20: not all information is created equal. (Press buttons, not balloons.)
Following are galleries with page-by-page views of this report.
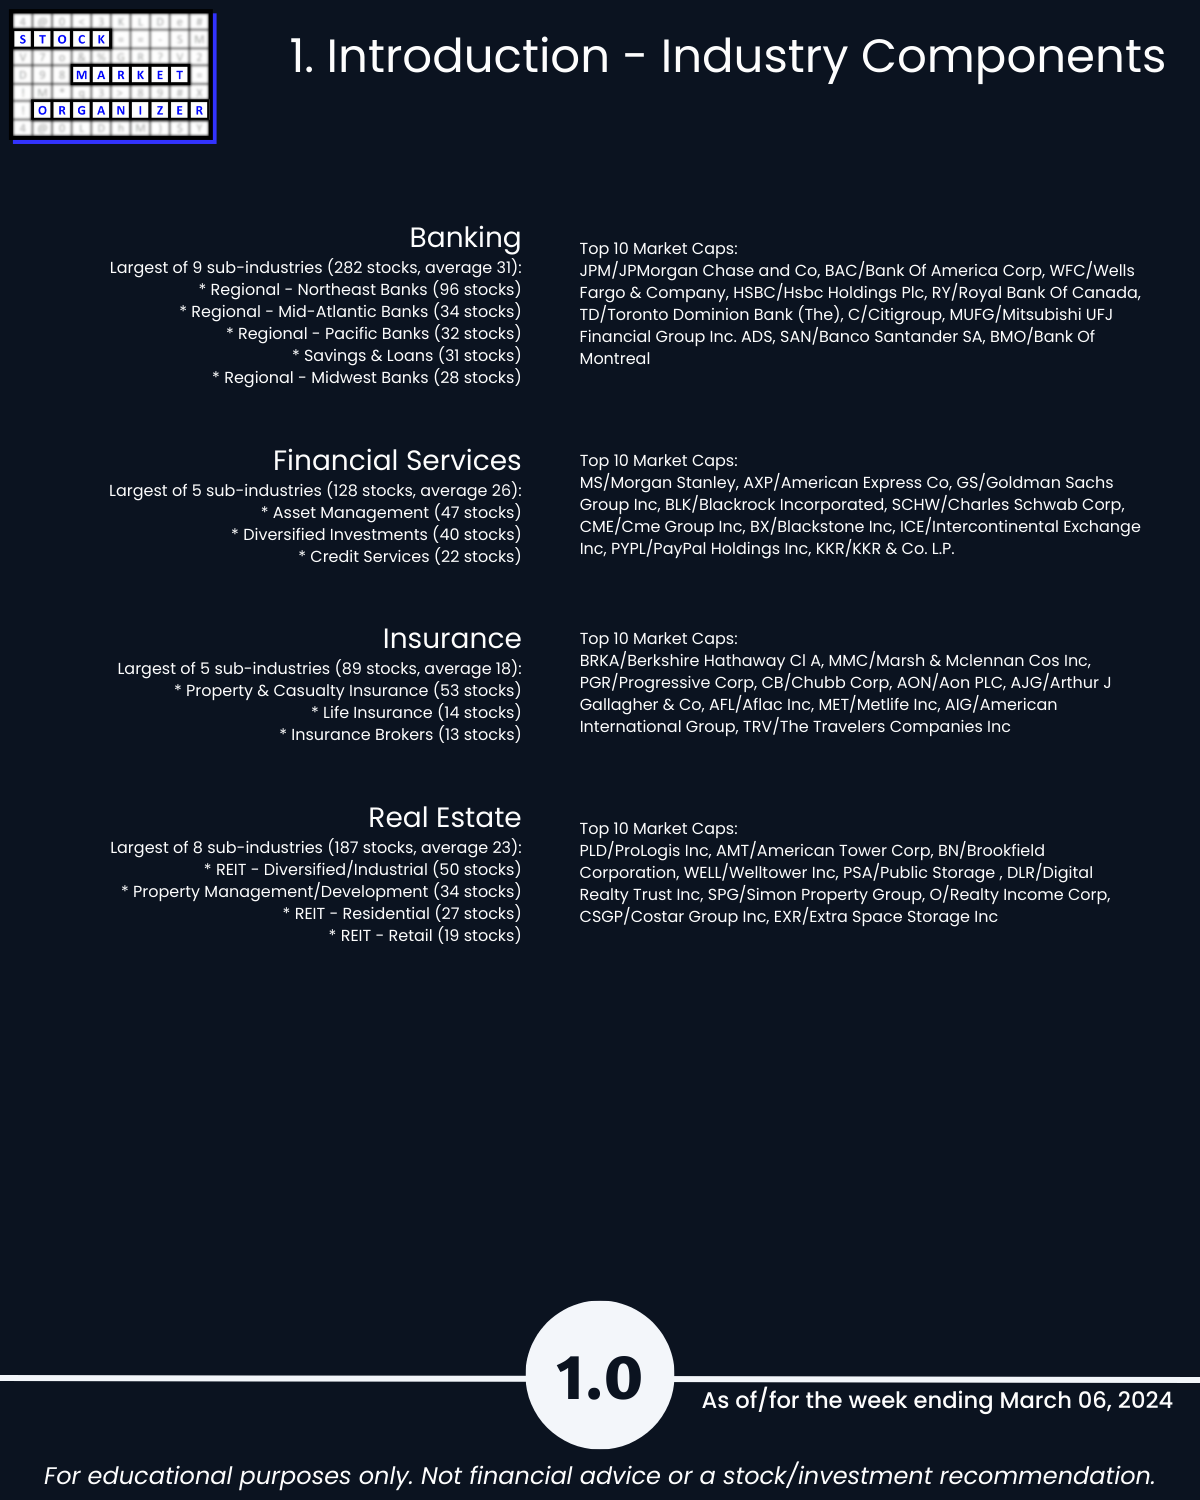
1. Introduction - Industry Components
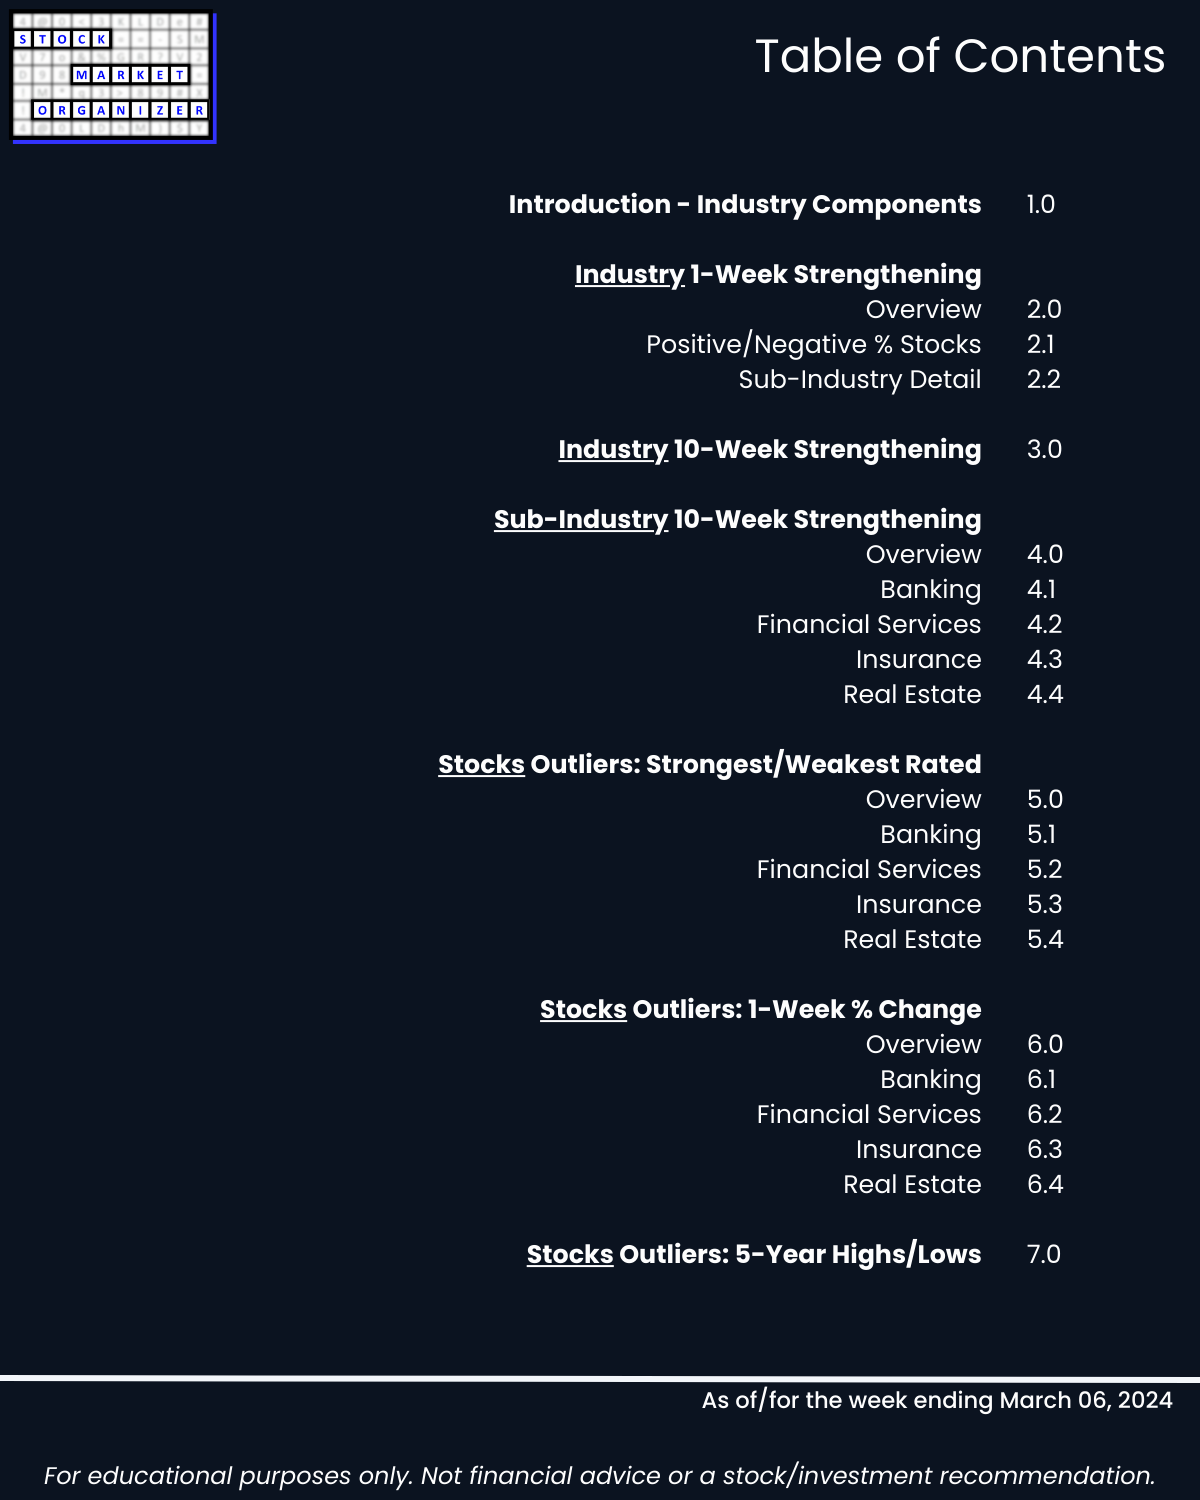
2. Industry 1-Week Strengthening
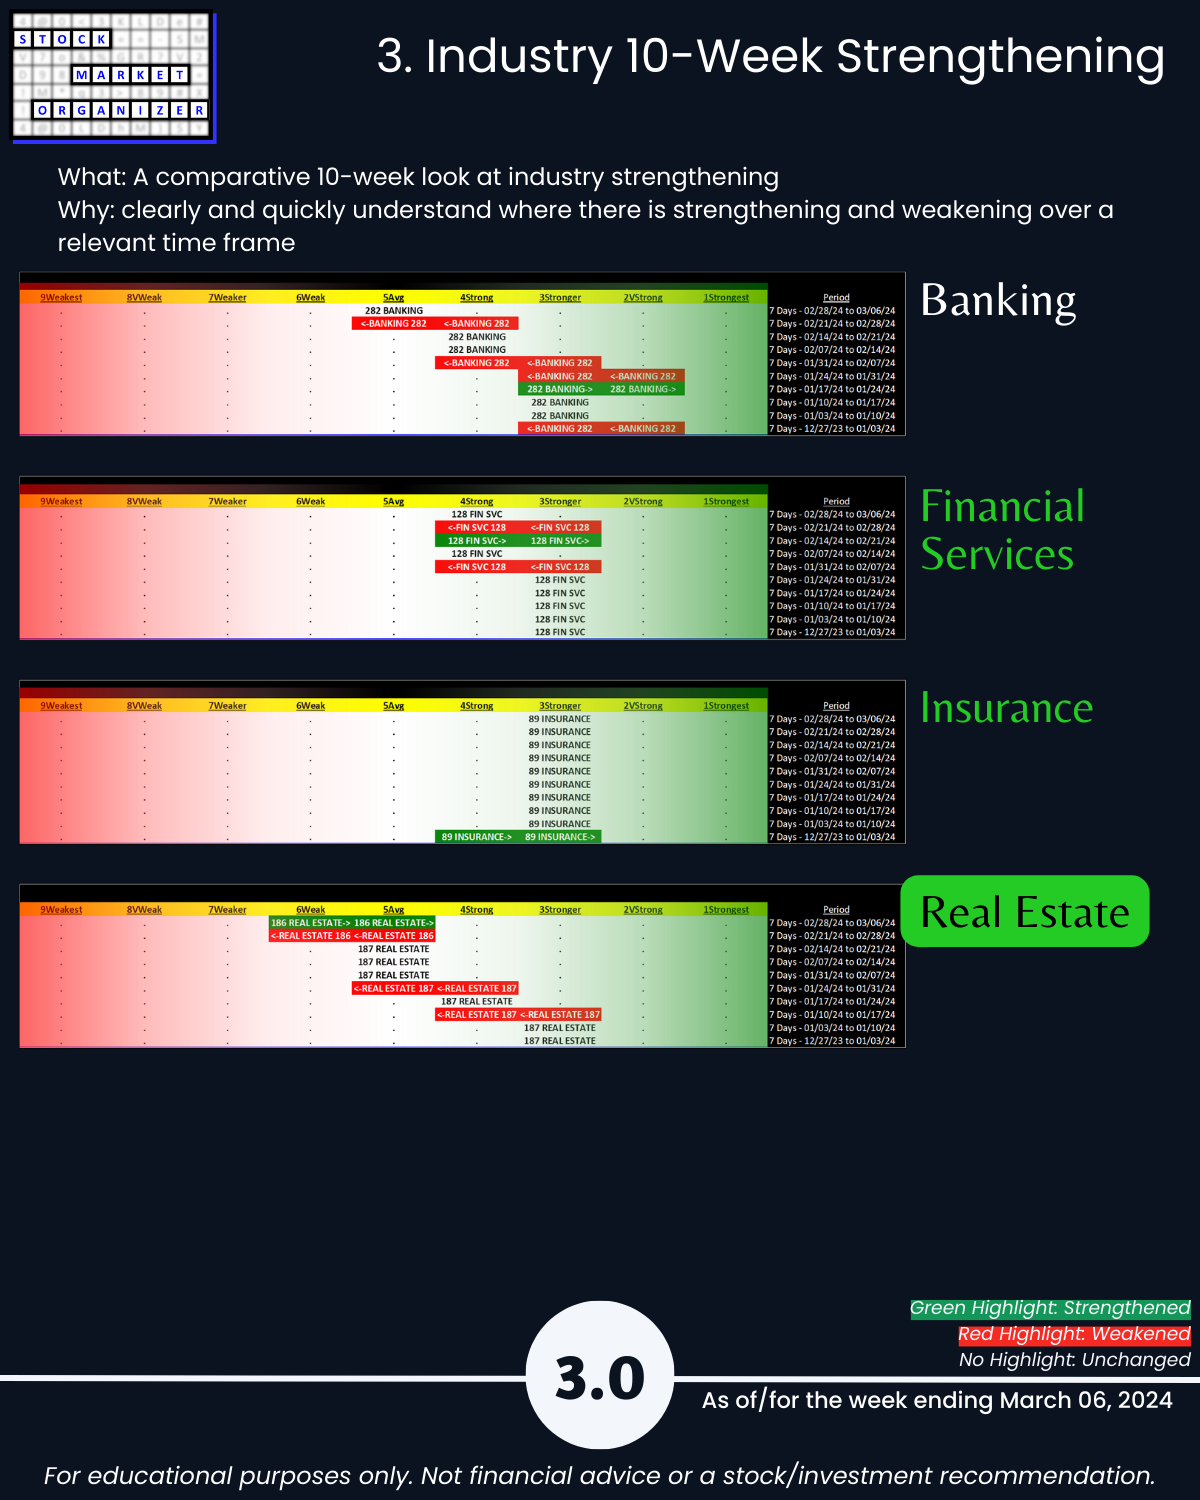
3. Industry 10-Week Strengthening

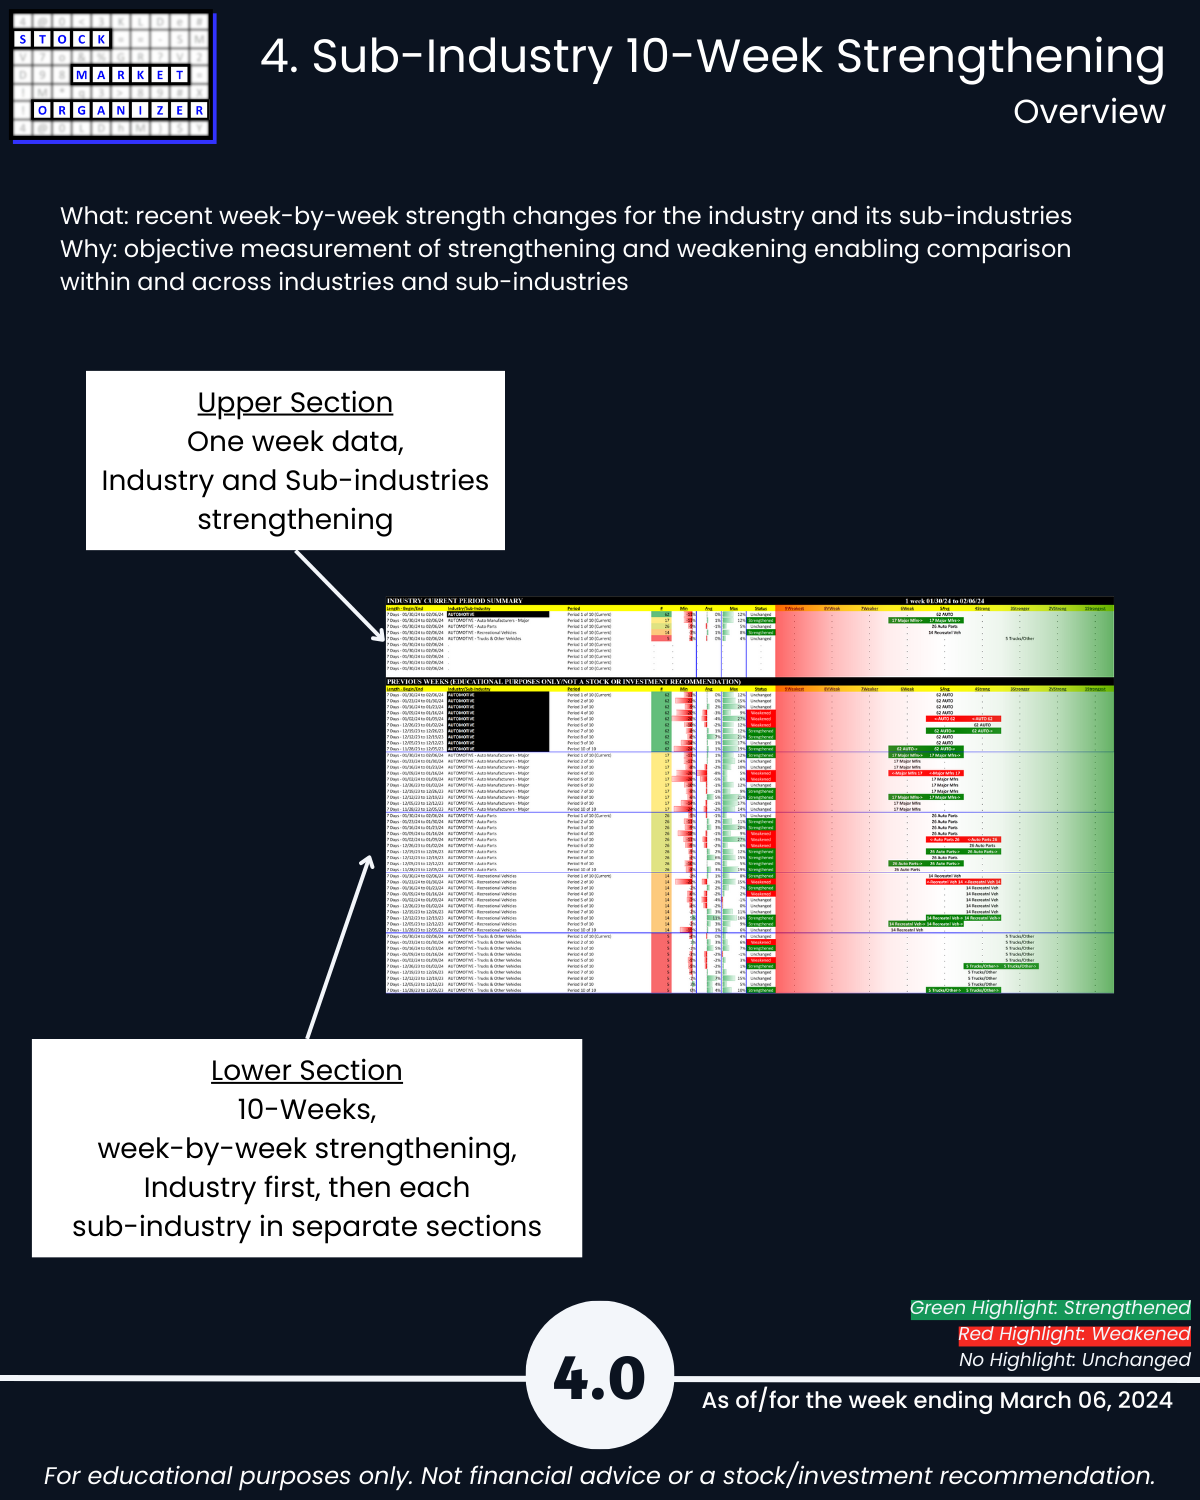
4. Sub-Industry 10-Week Strengthening
5. Stocks Outliers: Strongest/Weakest Rated
6. Stocks Outliers: 1-Week % Change
7. Stocks Outliers: 5-Year Highs/Lows