SMO Exclusive: Strength Report Financial Sector 2024-02-28

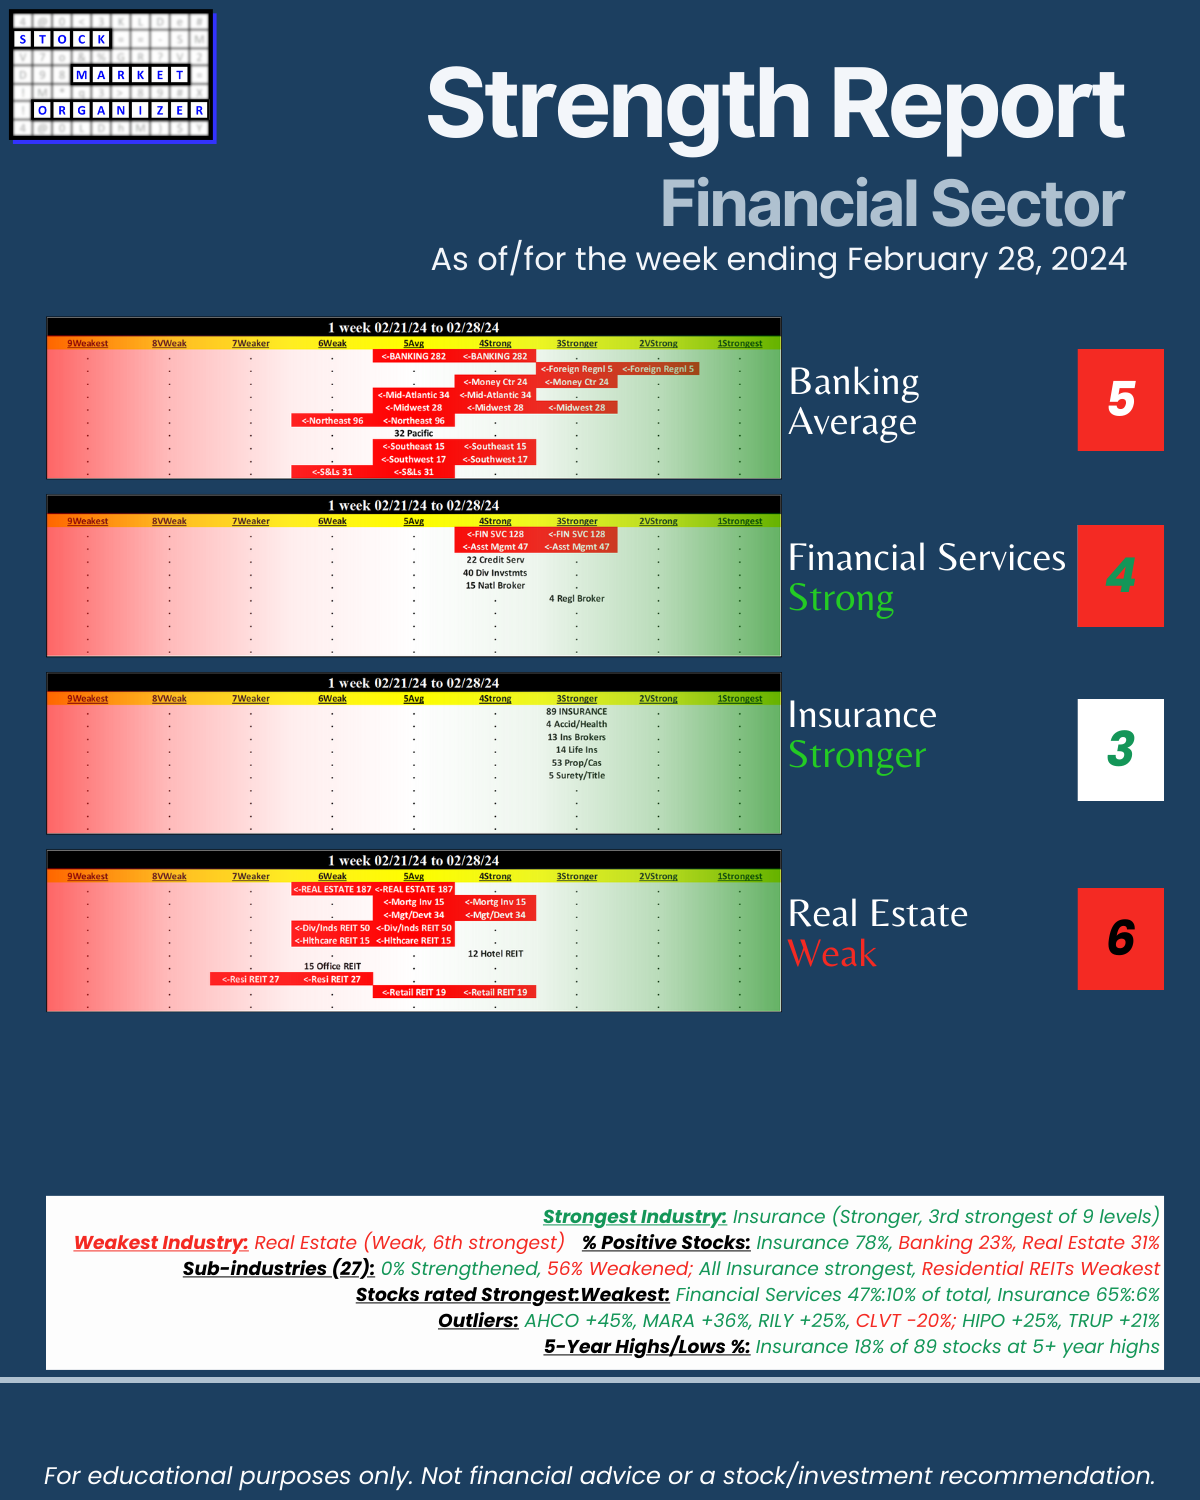
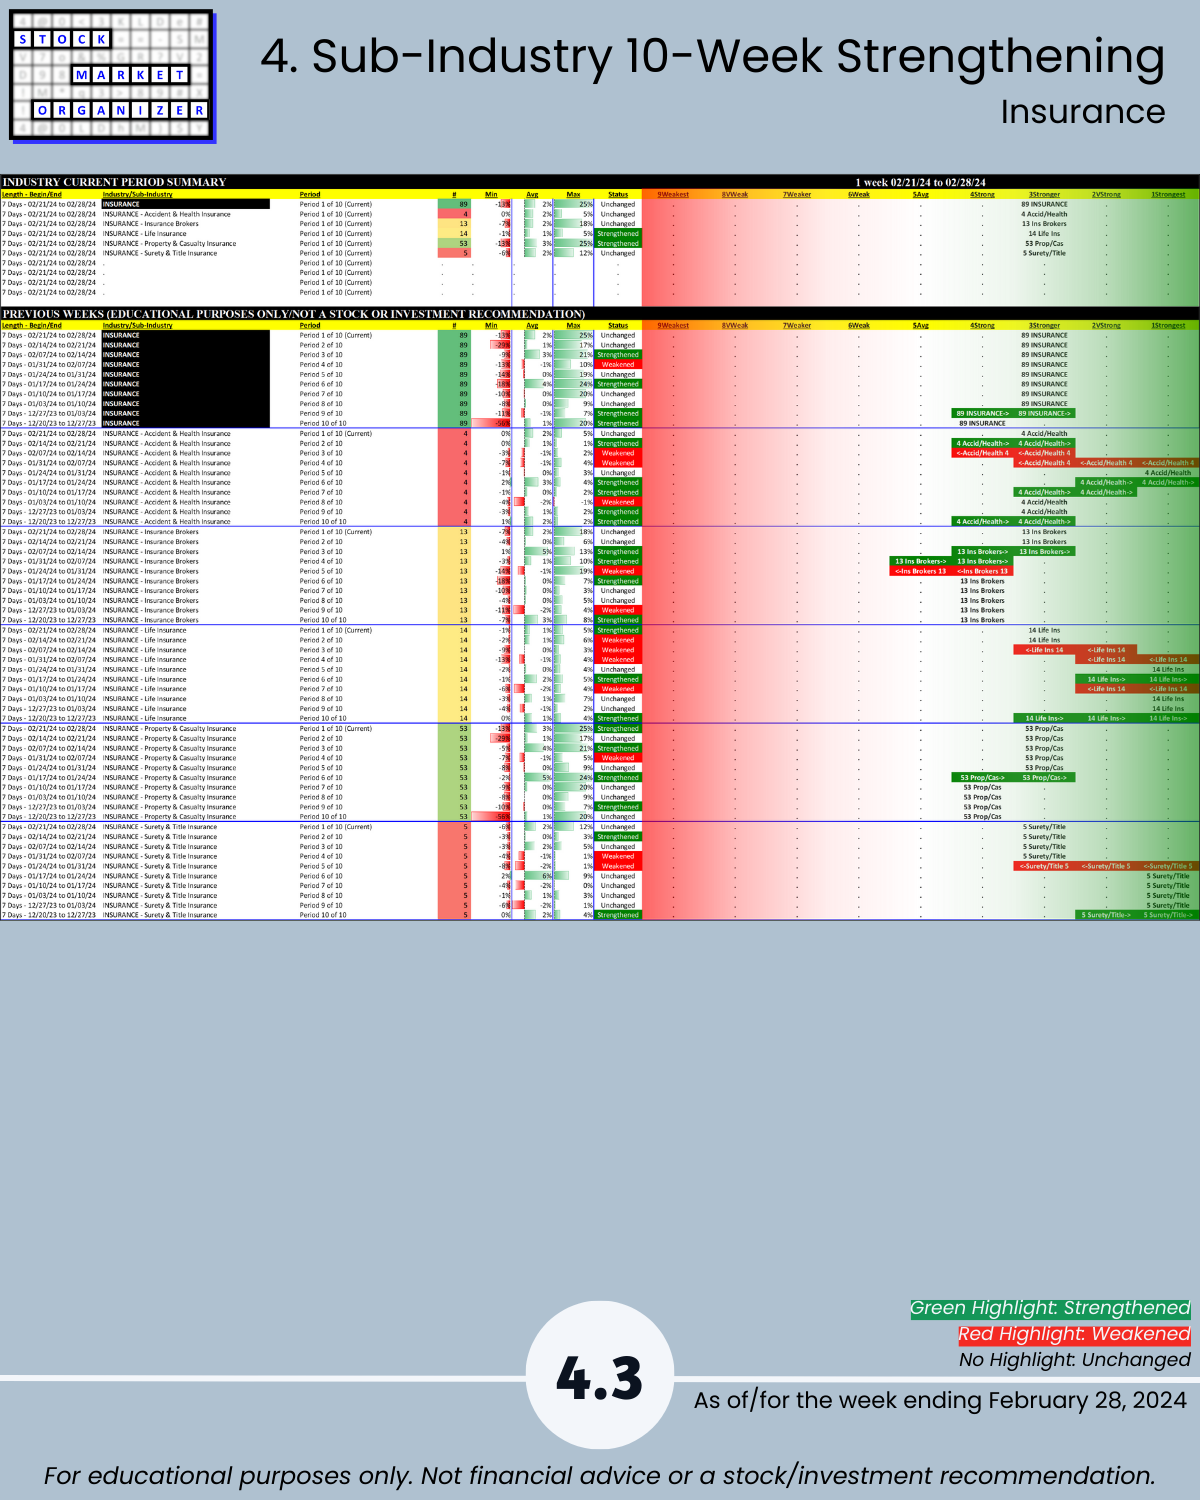
Financial sector update 2/28/24, 3 of 4 industries WEAKENED (Banking, Financial Services, Real Estate, with >80% of Banking/RE sub-industries weakening) as the fourth Beatle Insurance stands tall with 18% of its stocks at 5+ year highs, 78% positive stocks for the week, and 65% stocks rated Strongest (highest of 9 strength levels, page 5.3). If you aren’t explicitly looking everywhere for strength, how will you know where and when the next pockets of strength and weakness are emerging?
Notable weakness for the week:
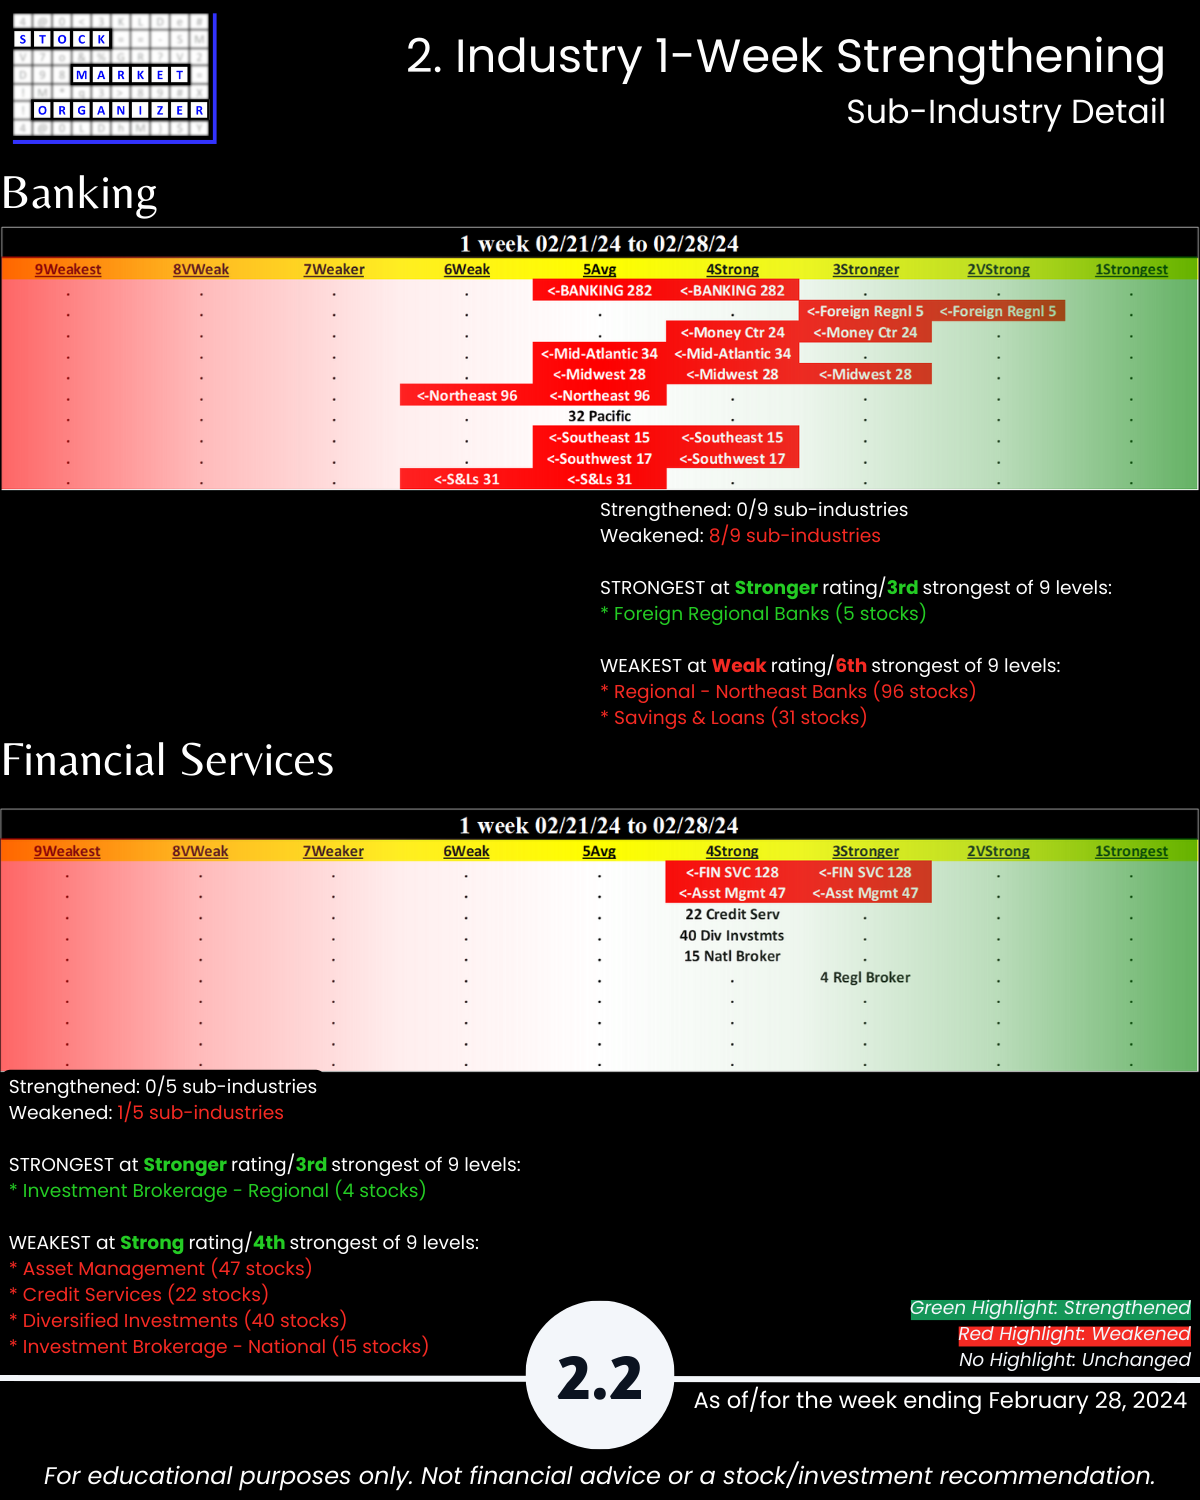
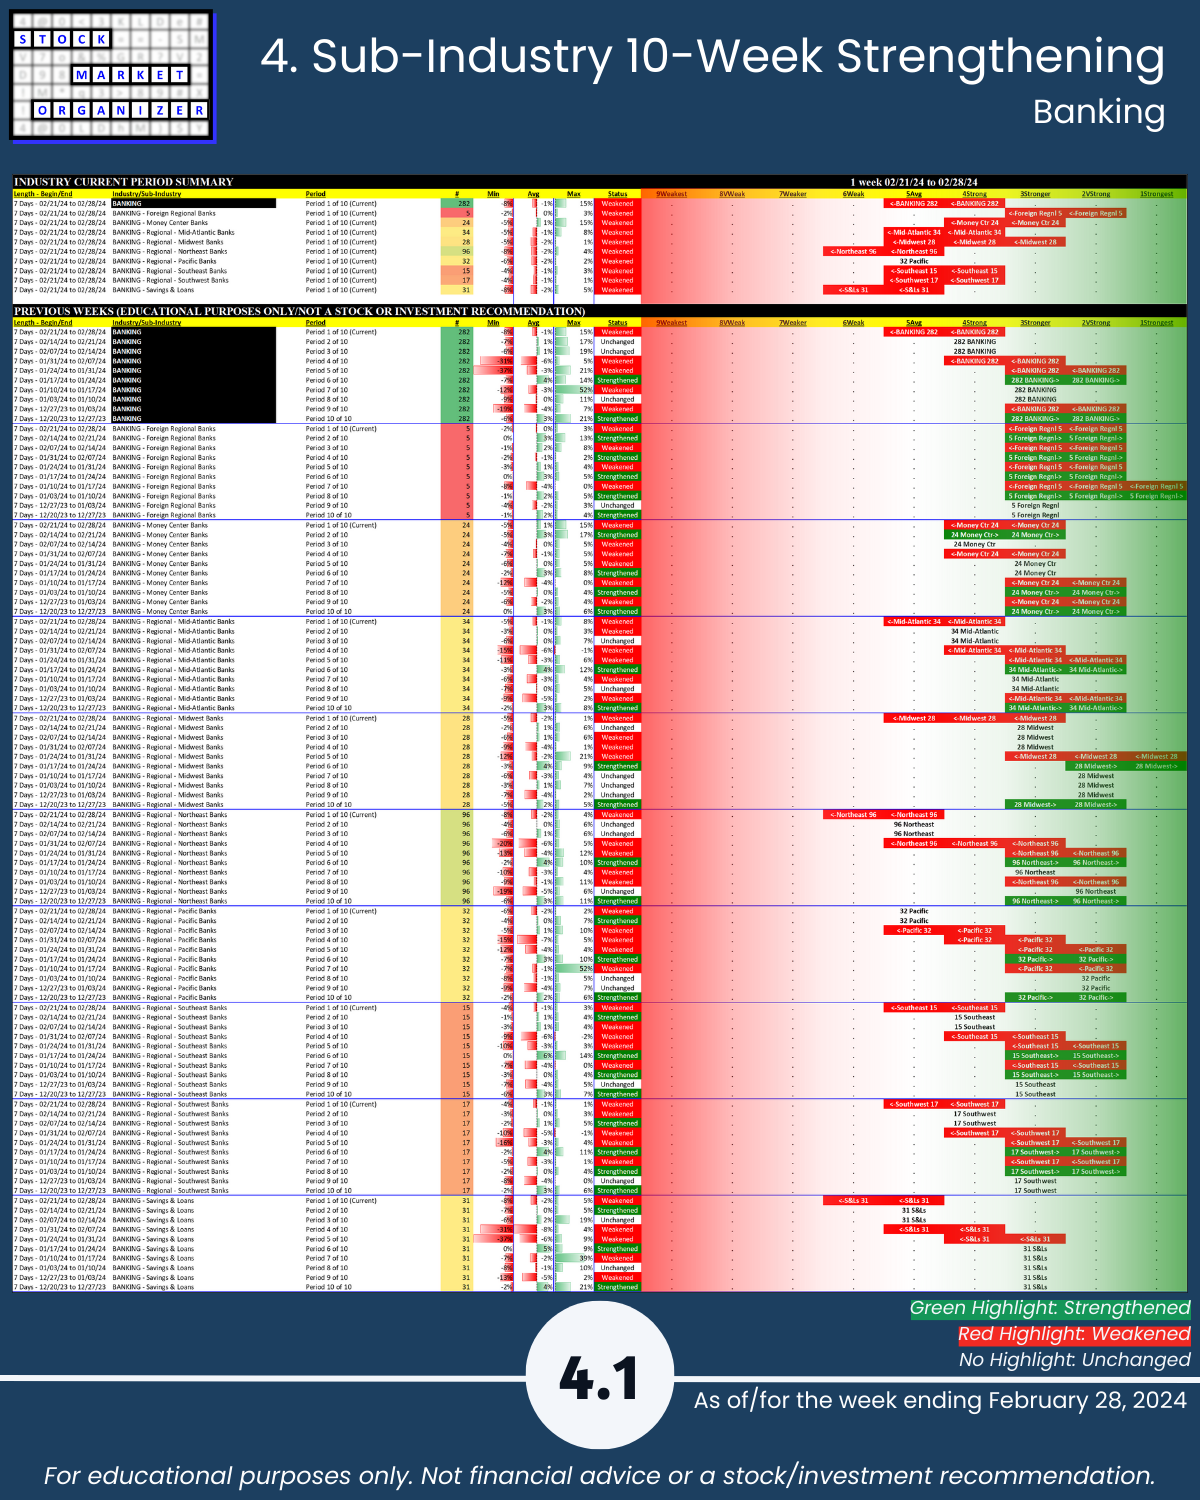
Banking 8/9 sub-industries weakened, 77% stocks negative
- has fallen 3 strength levels in 5 weeks
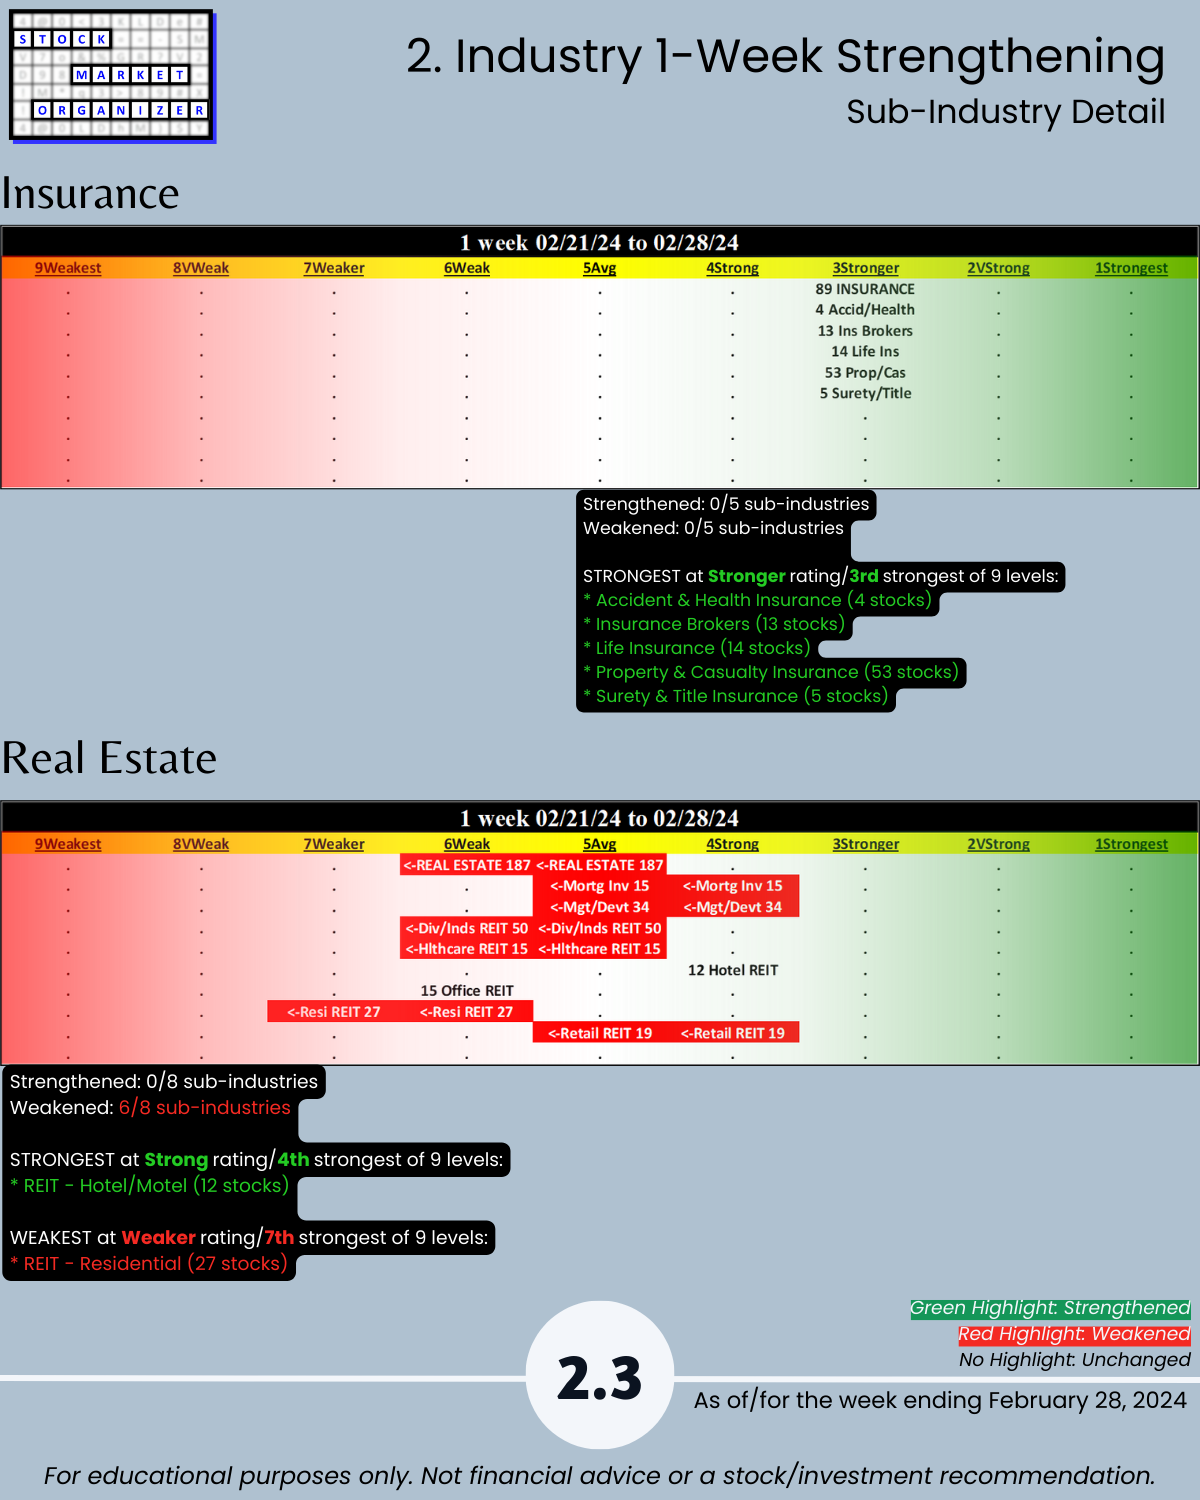
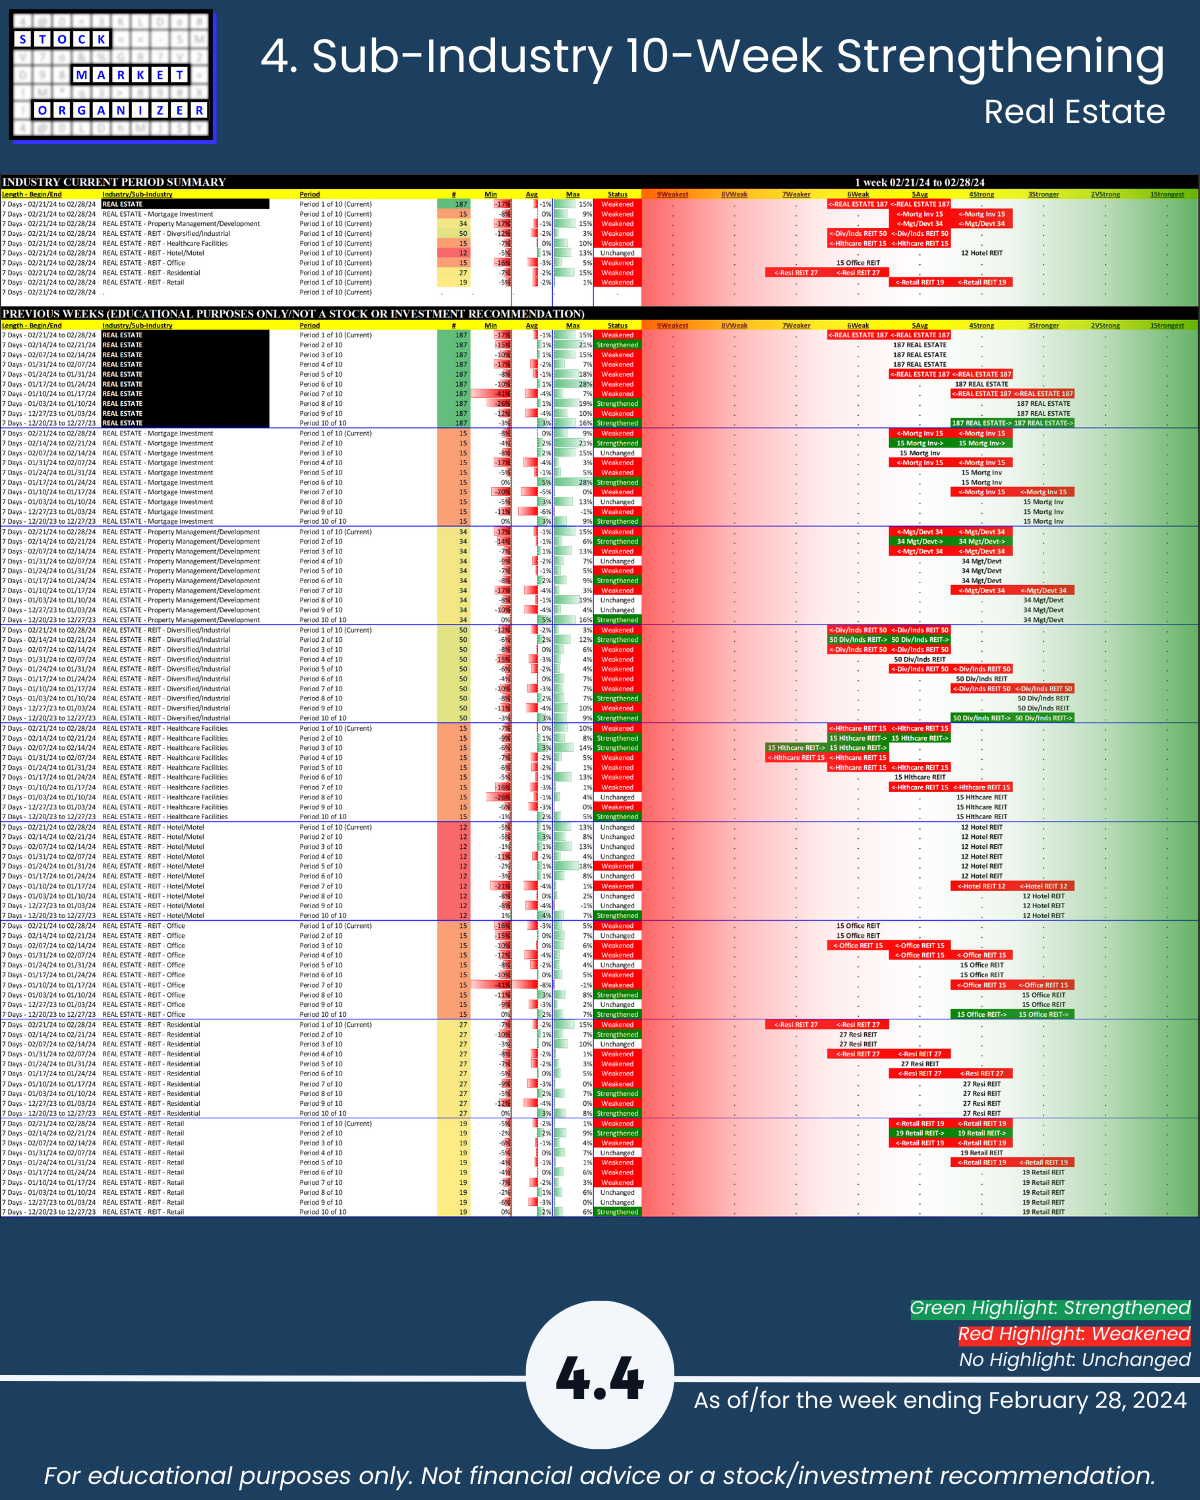
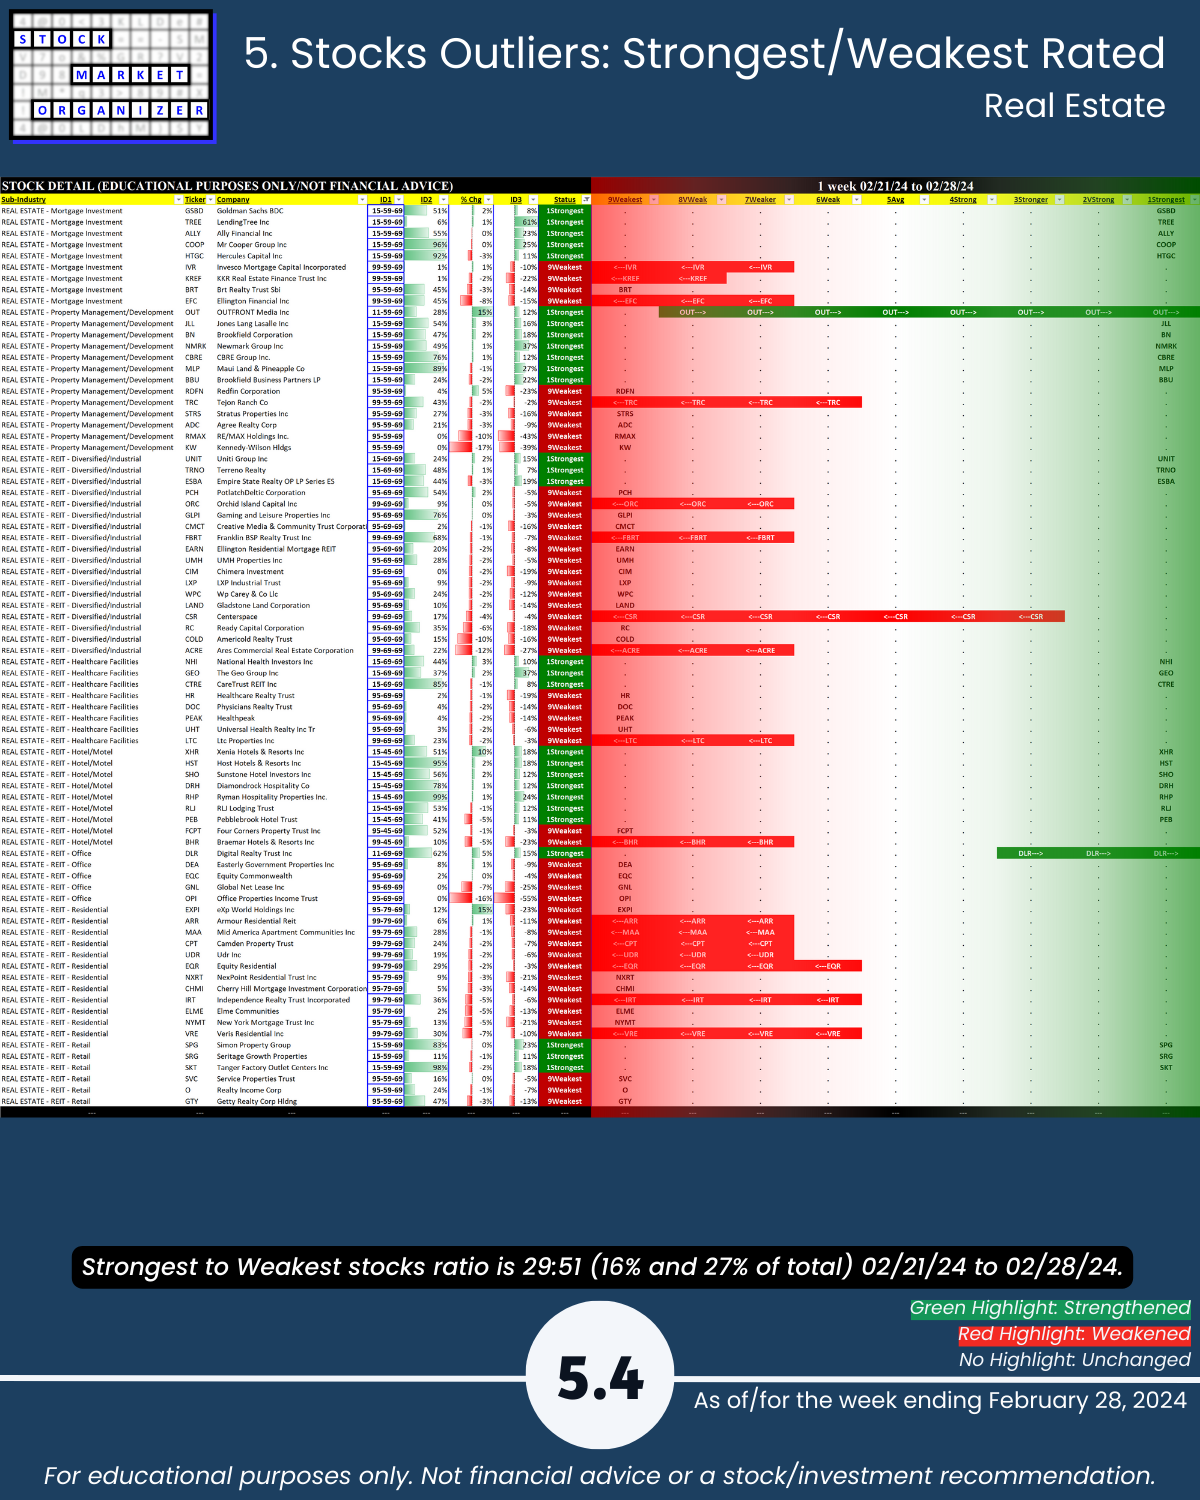
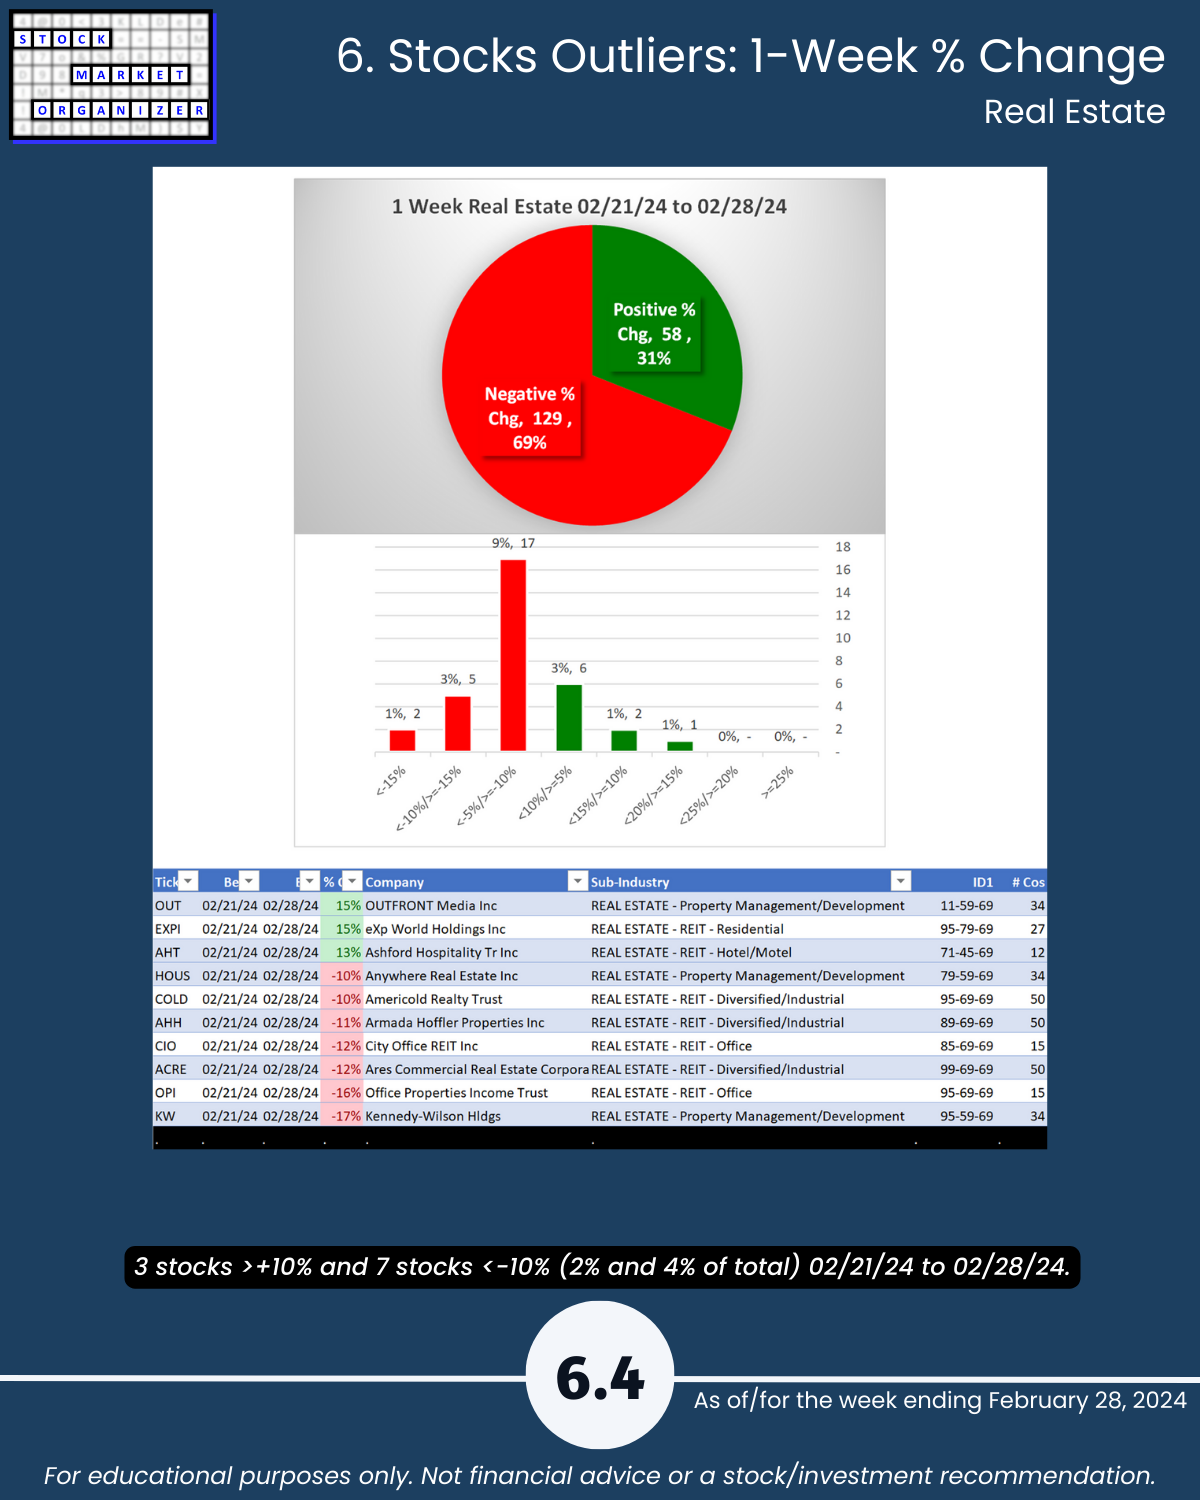
Real Estate 6/8 sub-industries weakened, 69% stocks negative - has fallen 3 strength levels in 7 weeks
Below/attached: detail including Strongest- and Weakest-rated stocks and objective strengthening/weakening measurements.
HIGHLIGHTS
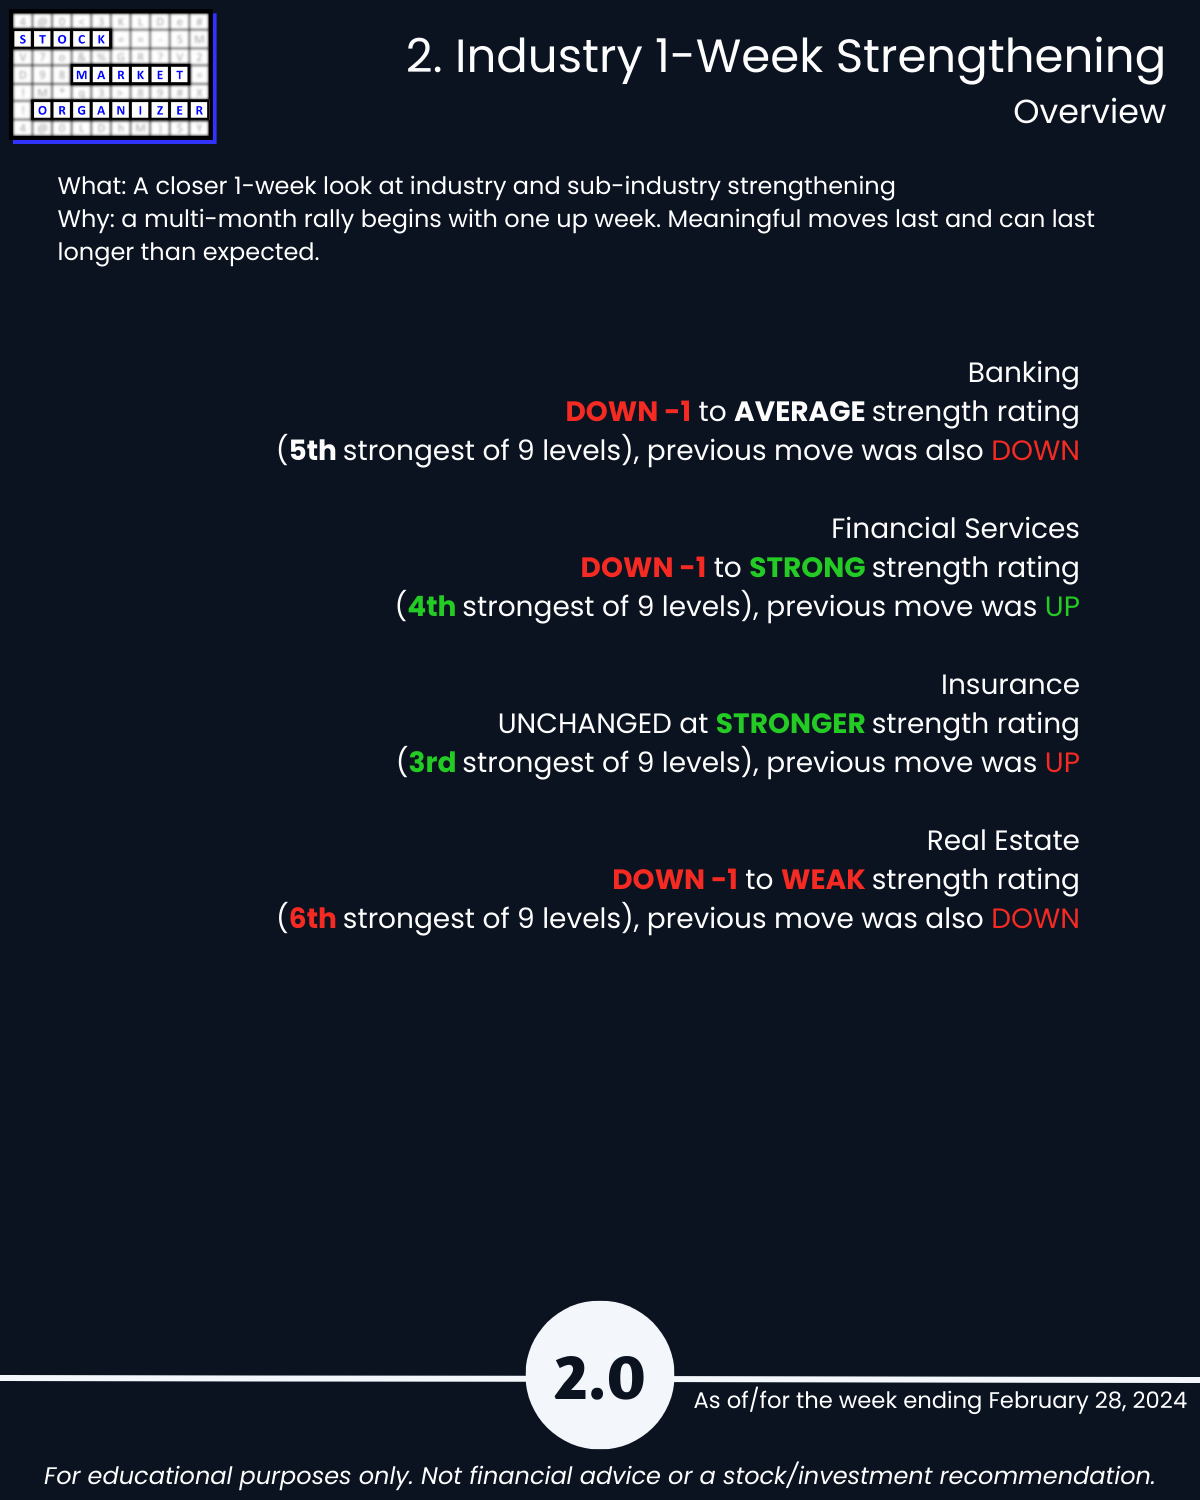
🔹 Strongest Industry: Insurance (Stronger, 3rd strongest of 9 levels)
🔹 Weakest Industry: Real Estate (Weak, 6th strongest)
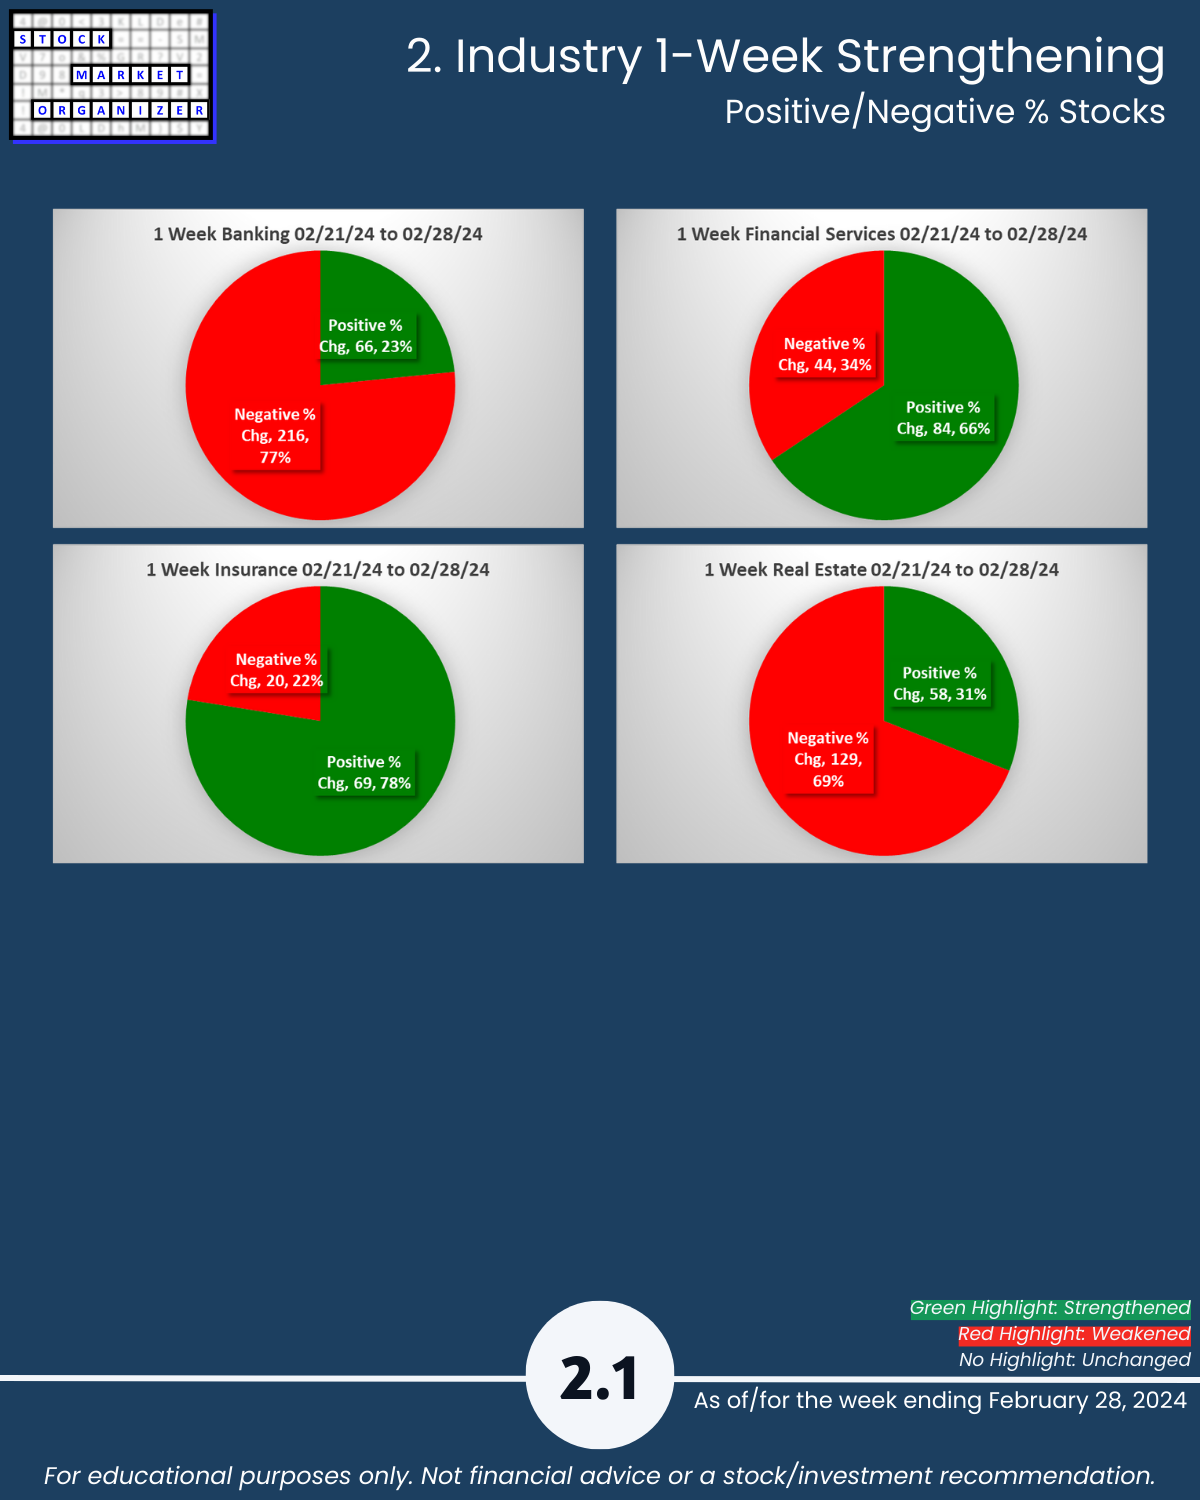
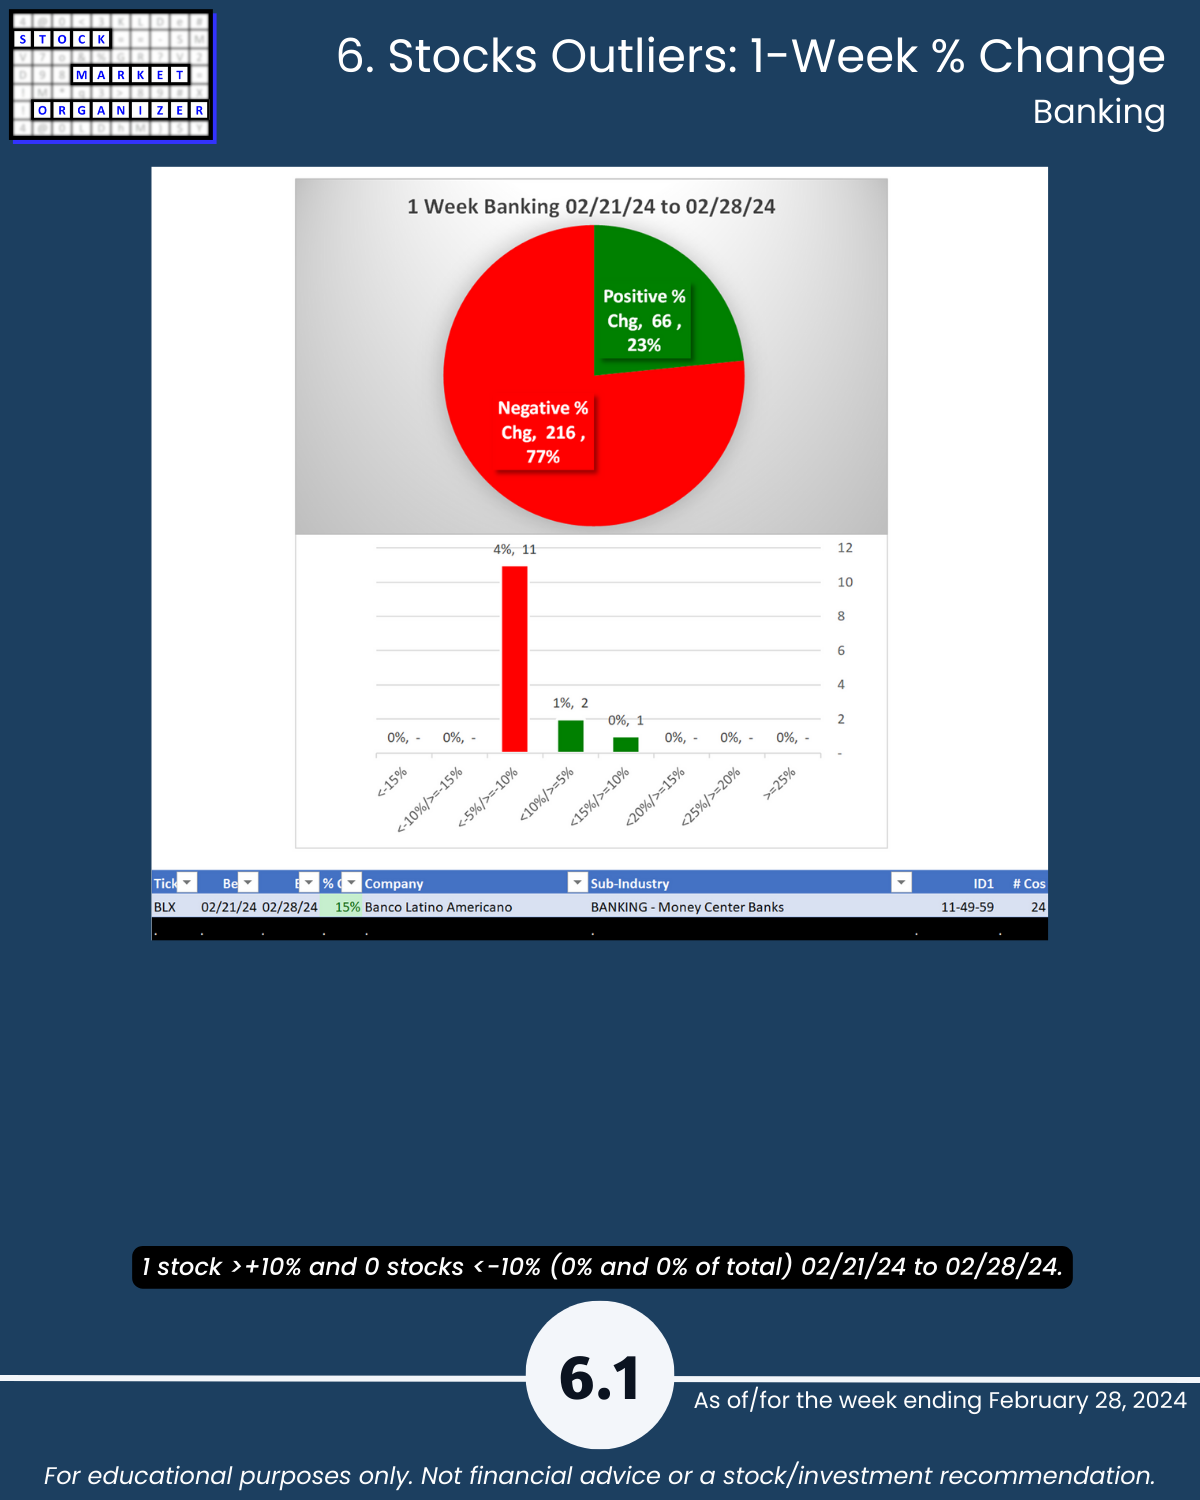
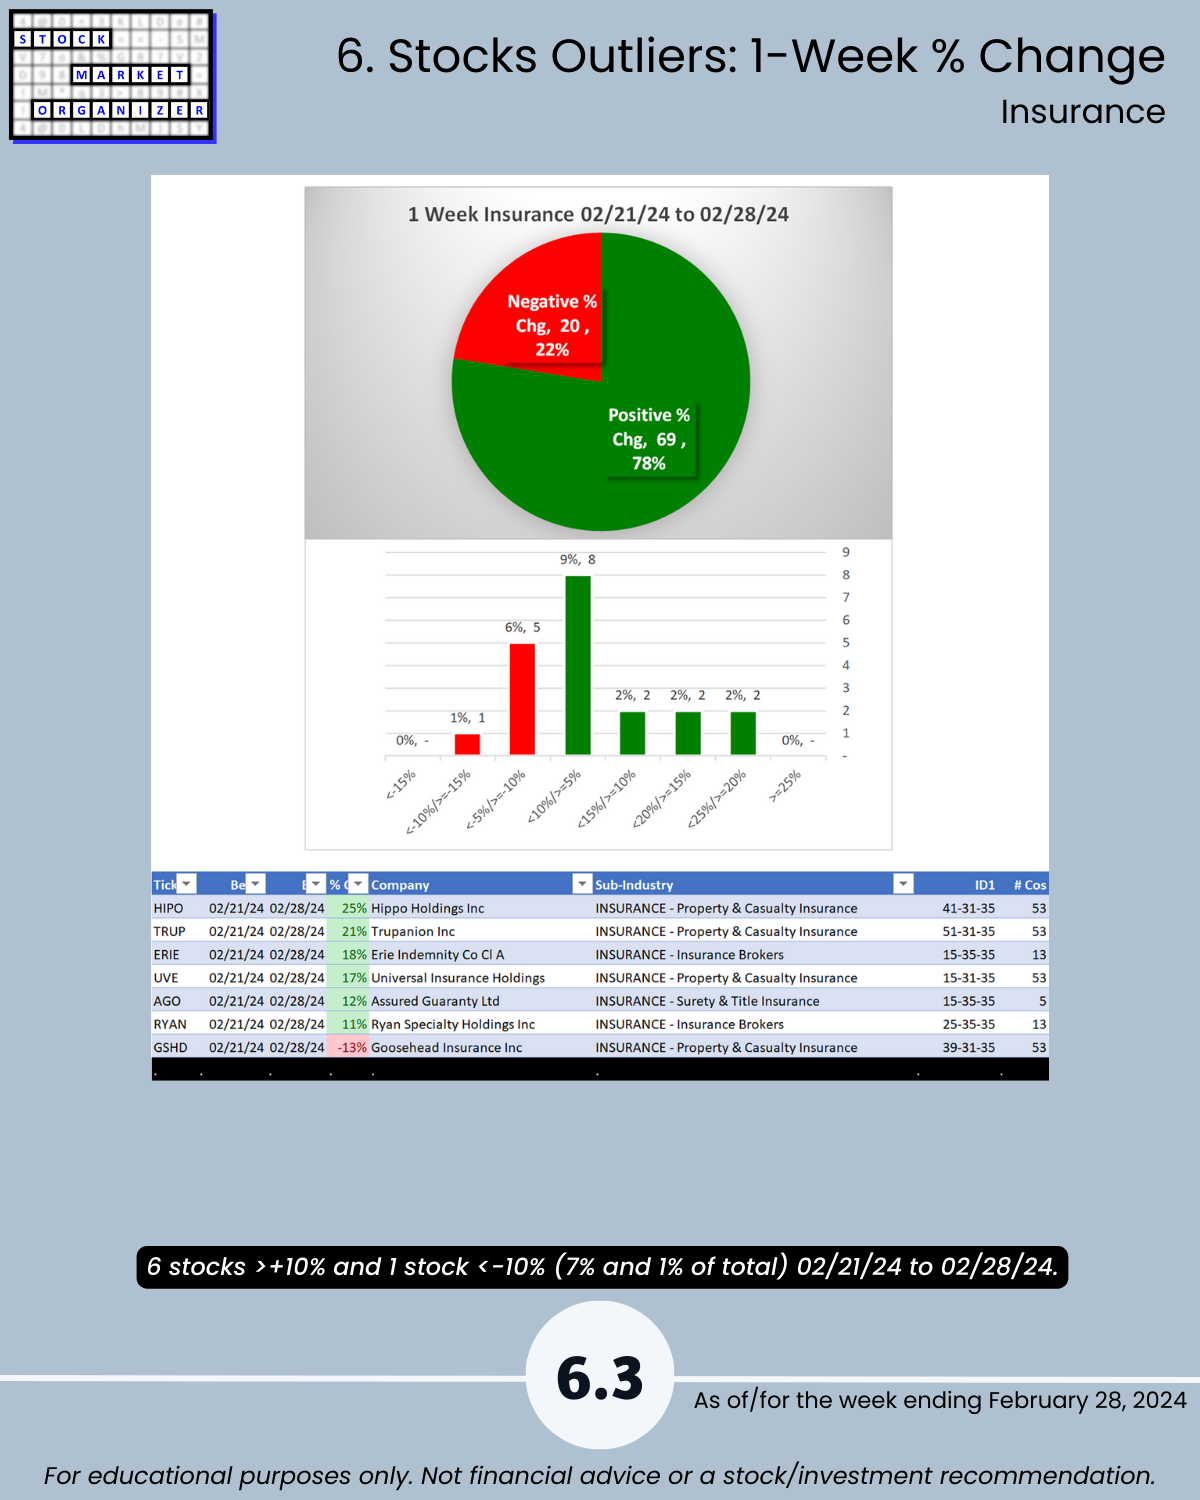
🔹 % Positive Stocks: Insurance 78%, Banking 23%, Real Estate 31%
🔹 Sub-industries (27): 0% Strengthened, 56% Weakened; All Insurance strongest, Residential REITs Weakest
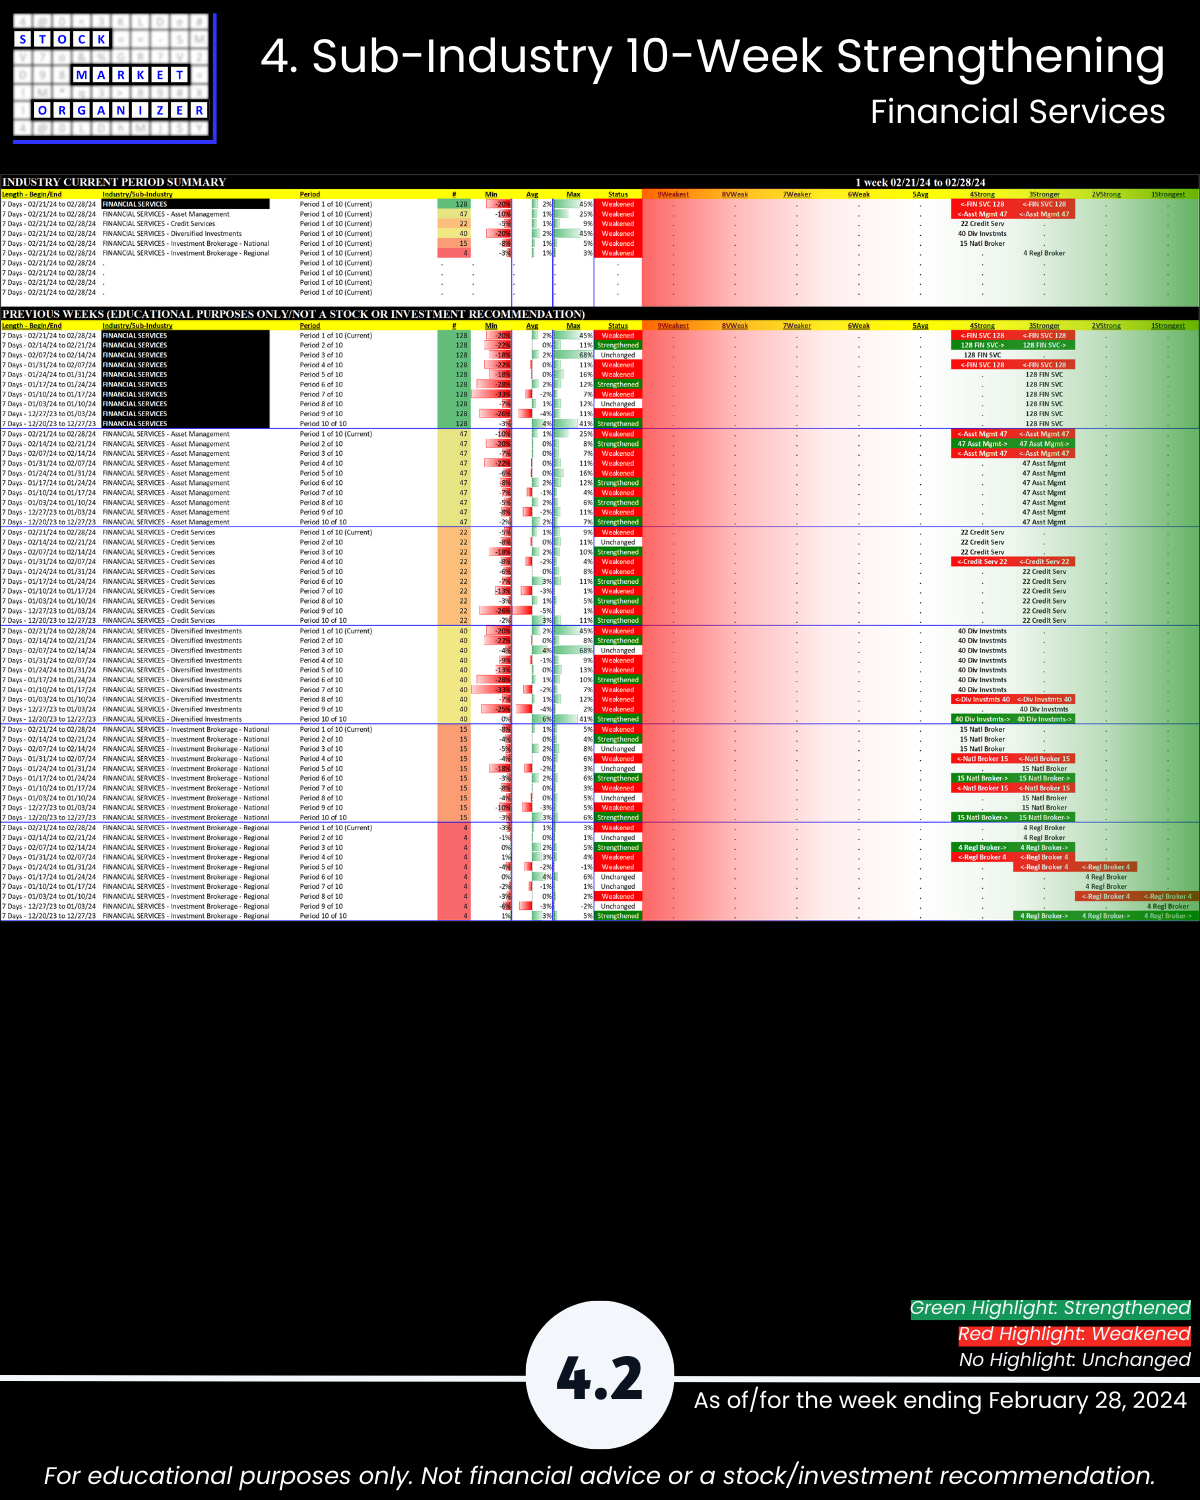
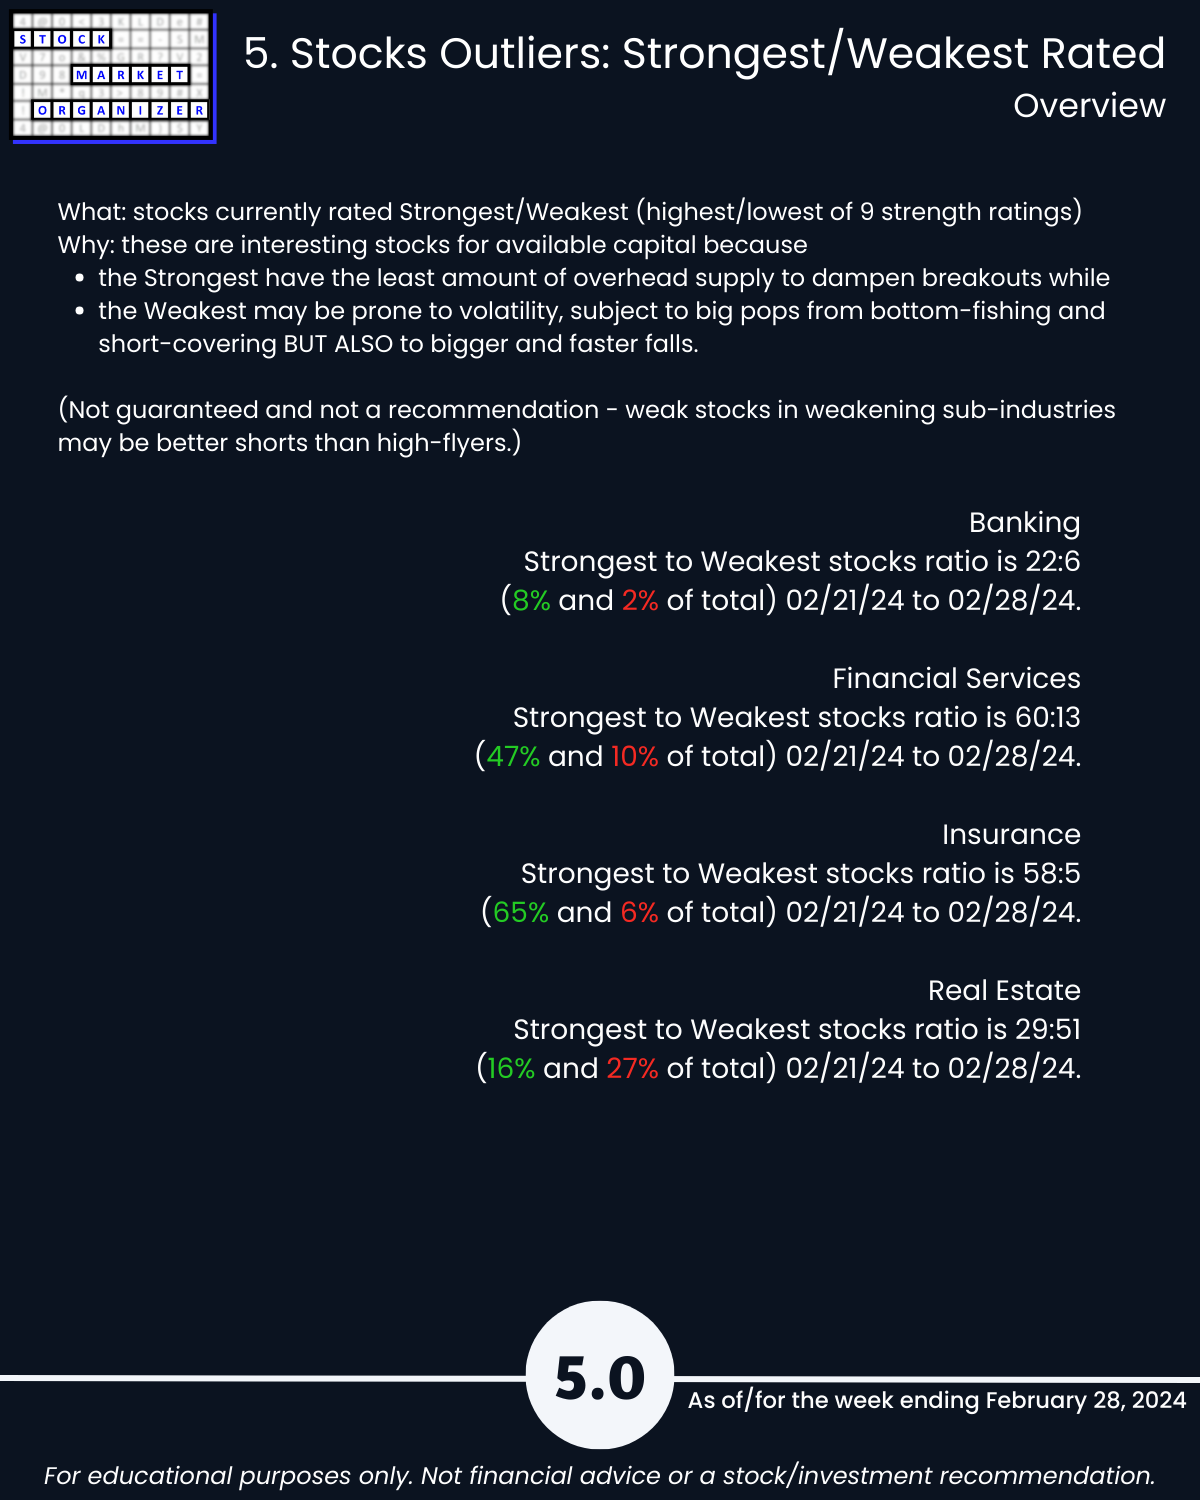
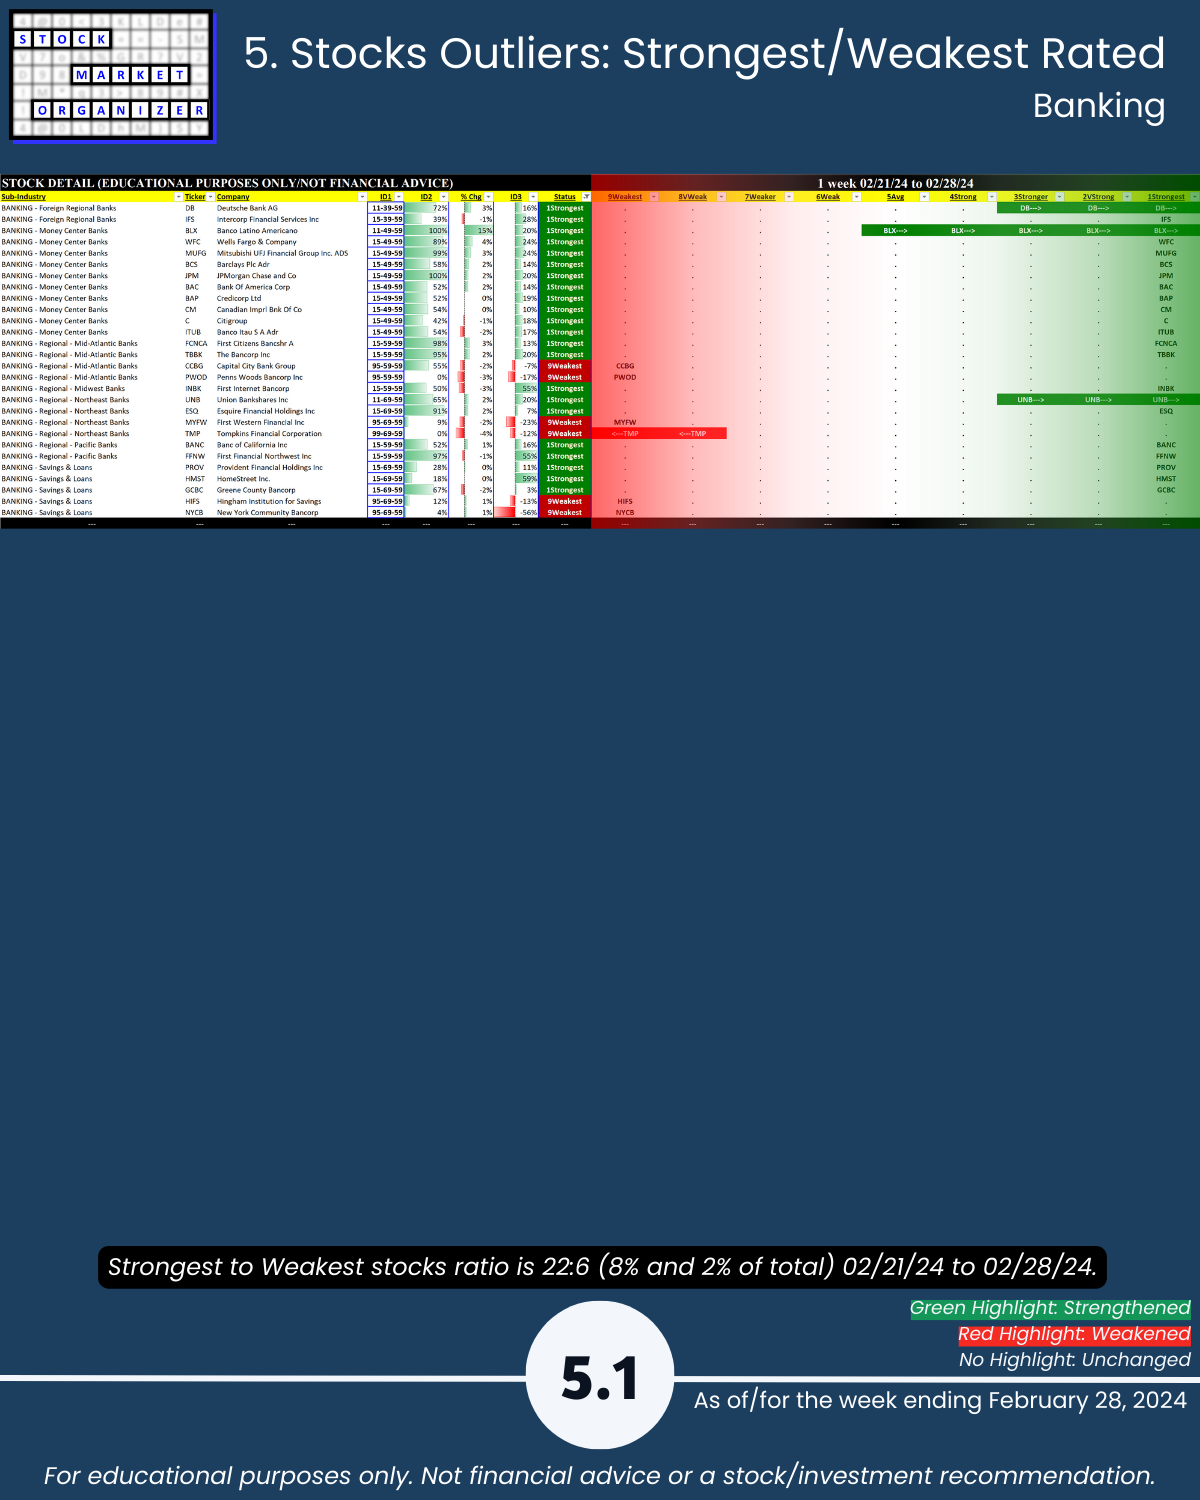
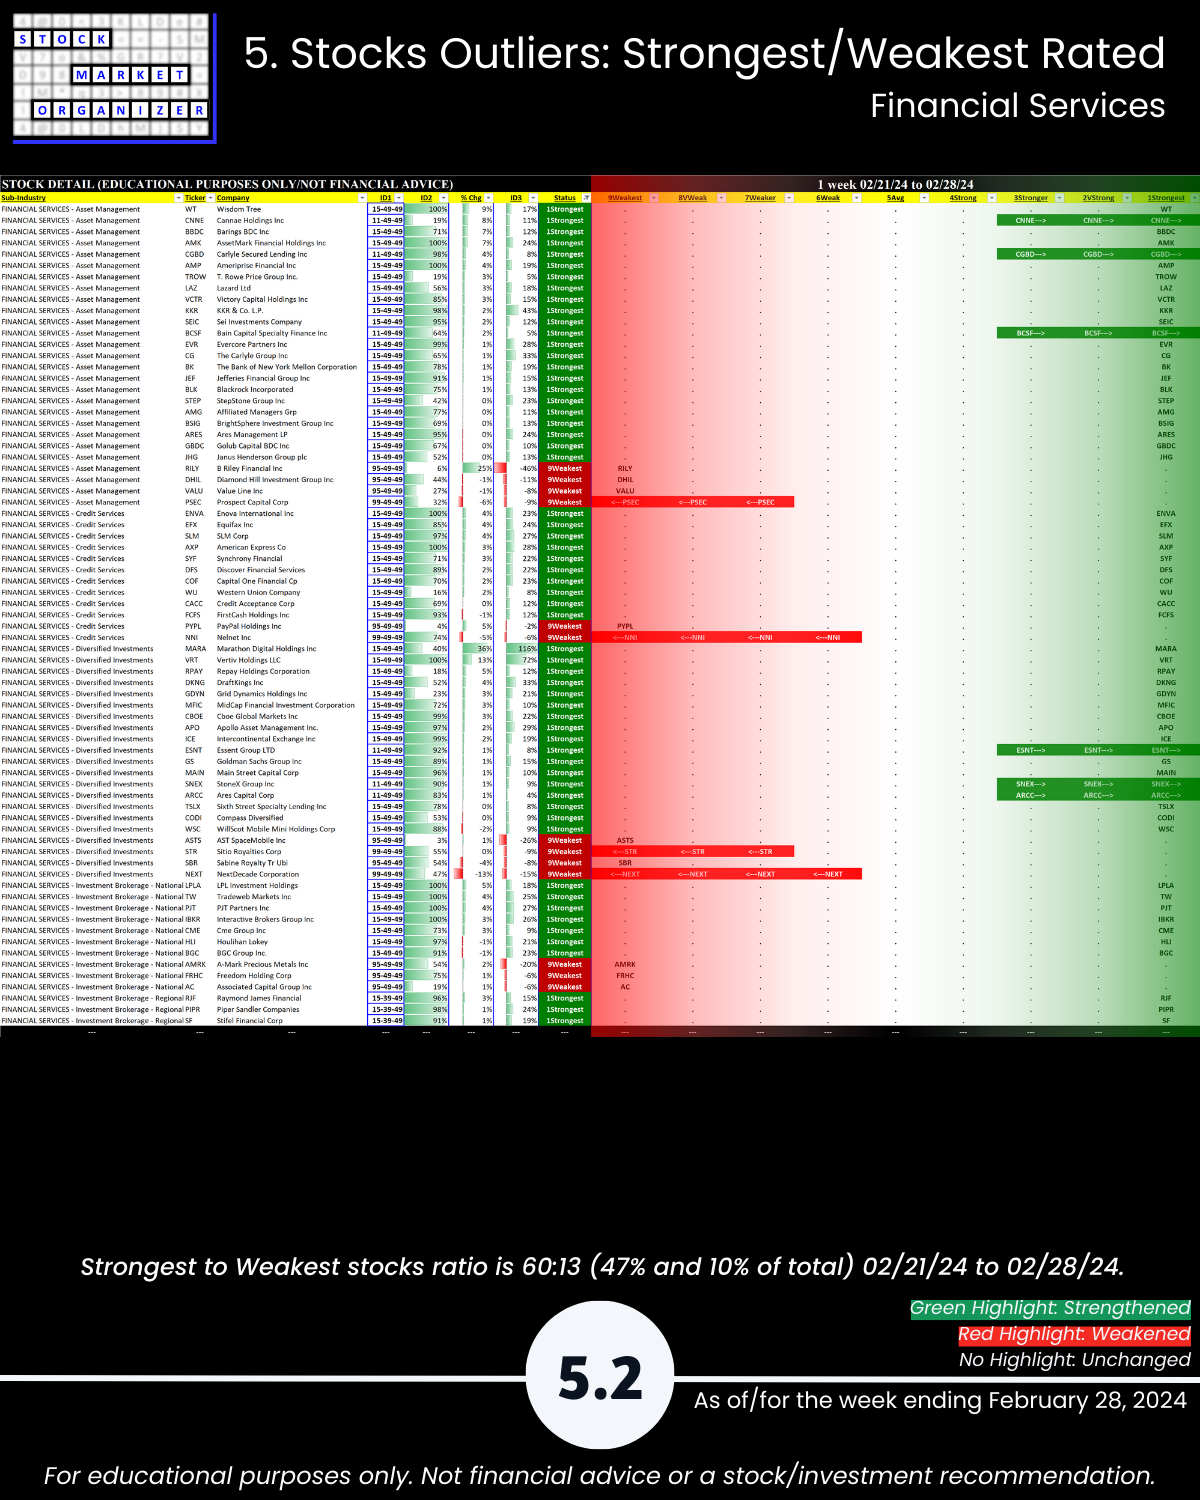
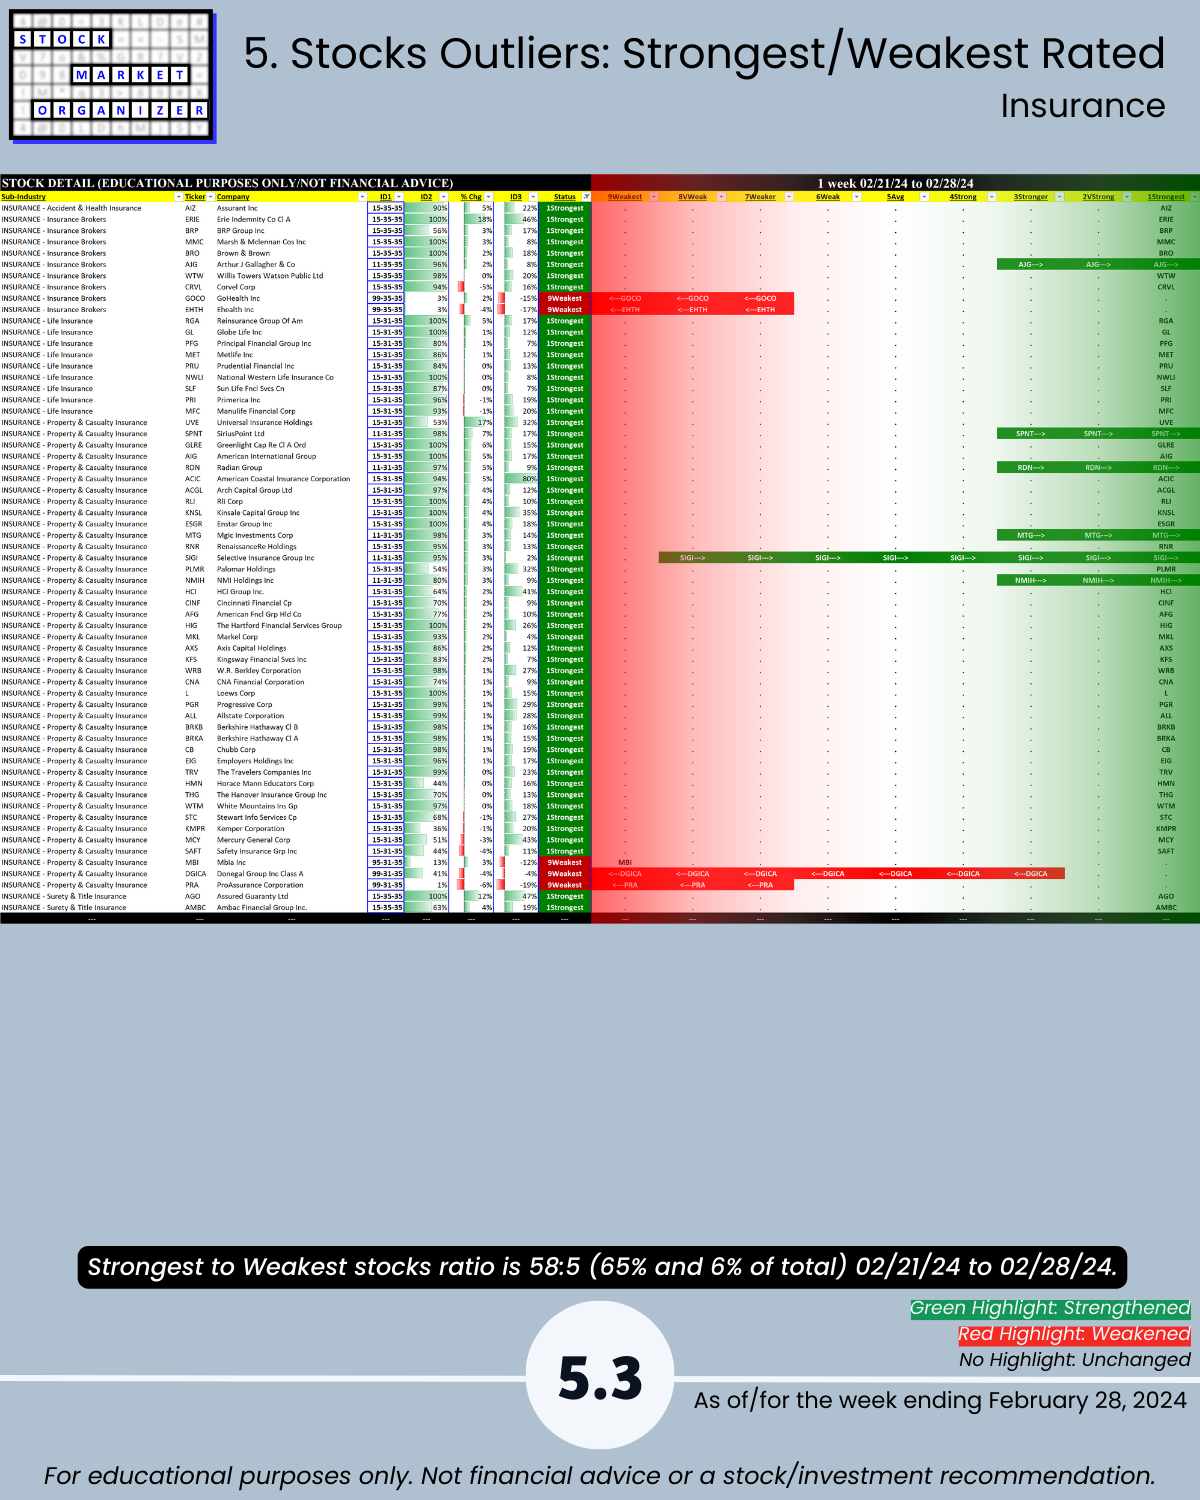
🔹 Stocks rated Strongest:Weakest: Financial Services 47%:10% of total, Insurance 65%:6%
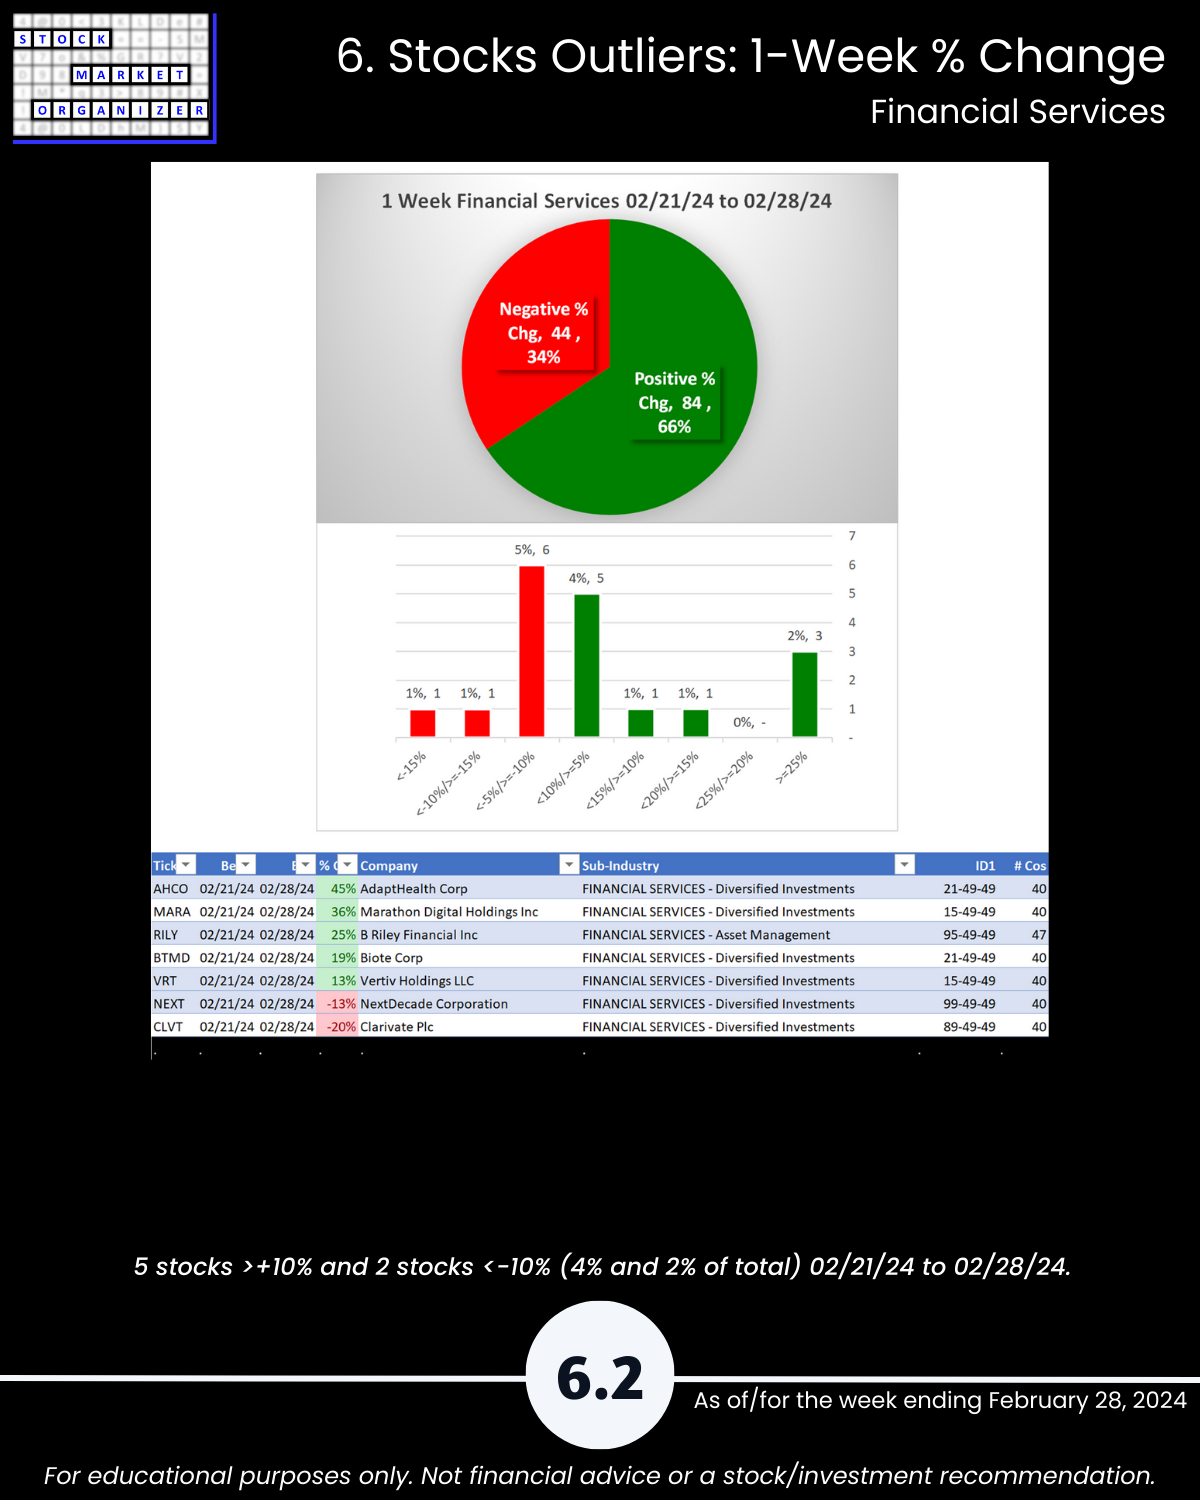
🔹 Outliers: AHCO +45%, MARA +36%, RILY +25%, CLVT -20%; HIPO +25%, TRUP +21%
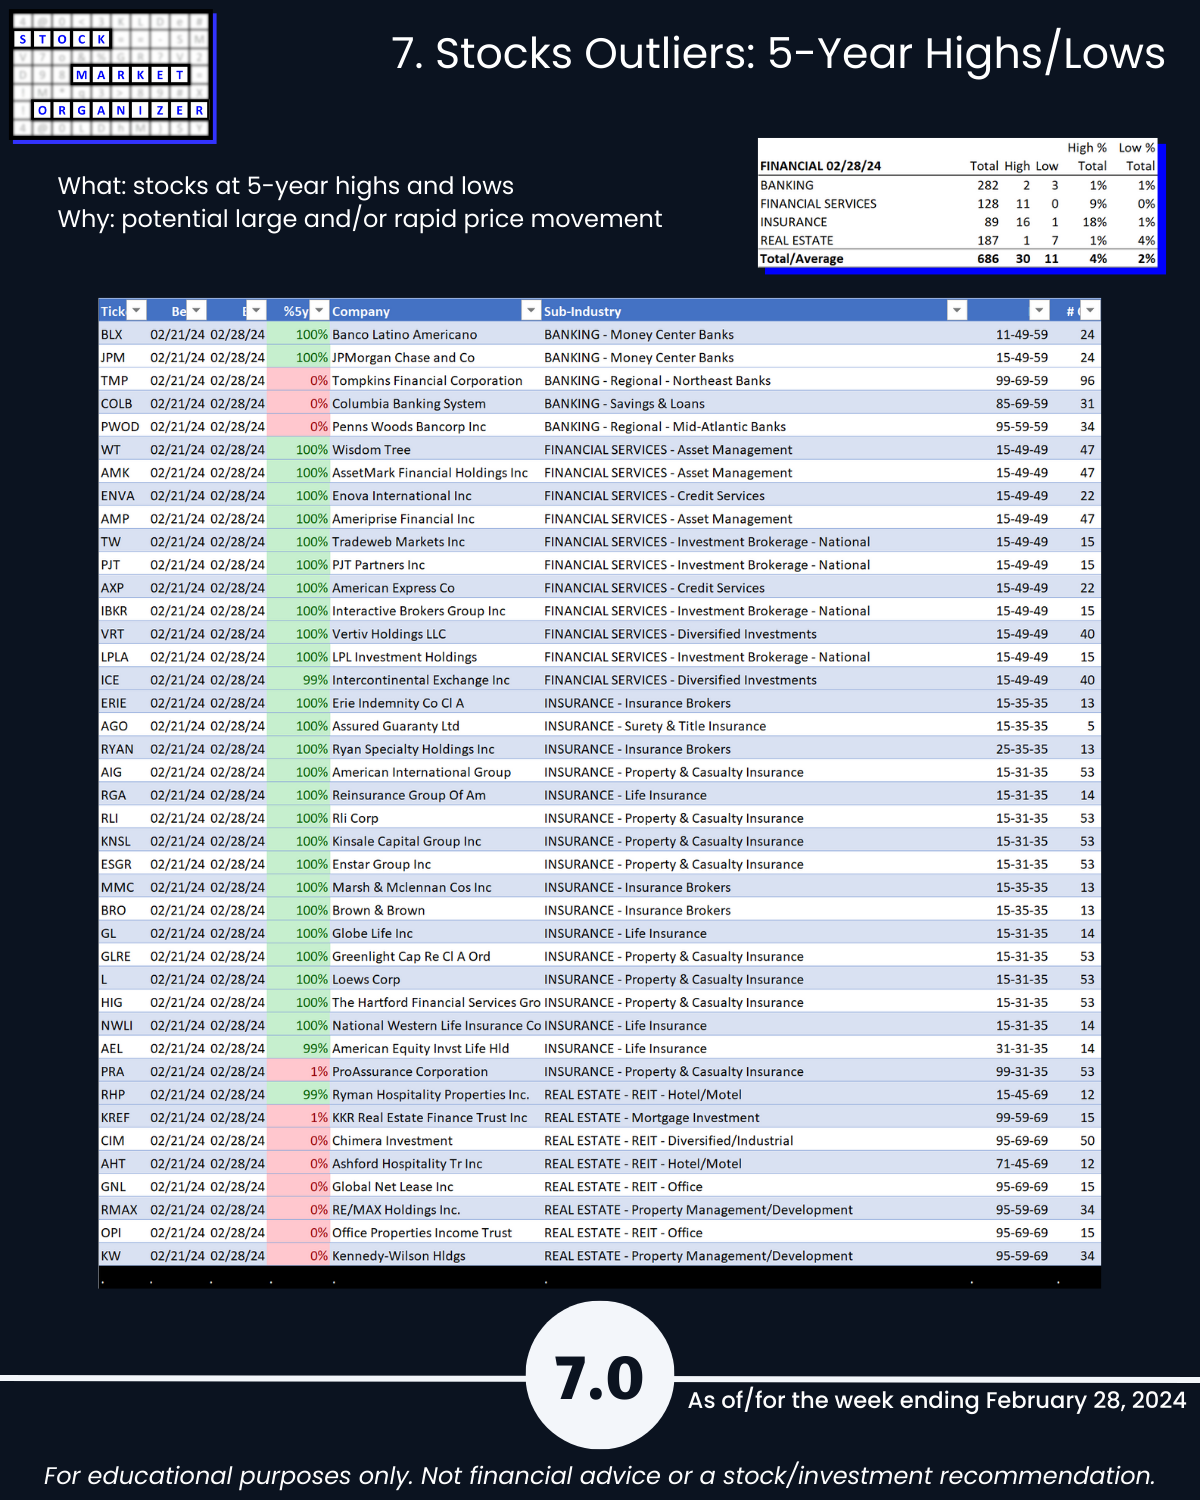
🔹 5-Year Highs/Lows %: Insurance 18% of 89 stocks at 5+ year highs
WHAT’S GOING ON?
I’m finding strong stocks in strengthening sub-industries and strengthening industries by tracking strengthening/weakening from the individual stock through overall market levels.
From this you know:
🔹 The strongest stocks in each industry. Helpful for “the stronger your stocks, the greener your P&L” believers. Ditch portfolio dogs until they begin strengthening.
🔹 How all stocks in each sub-industry/industry compare in current strengthening and weakening. No guarantee the relationships will continue but it’s hard to game plan where they could go if you don’t know where they are now.
🔹 Whether sub-industries and industries are currently strengthening. “The trend is your friend” applies to sub-industries and industries too.
THE BOTTOM LINE
Bottom-ticking isn’t part of the program.
Measuring strength week-by-week is.
Because
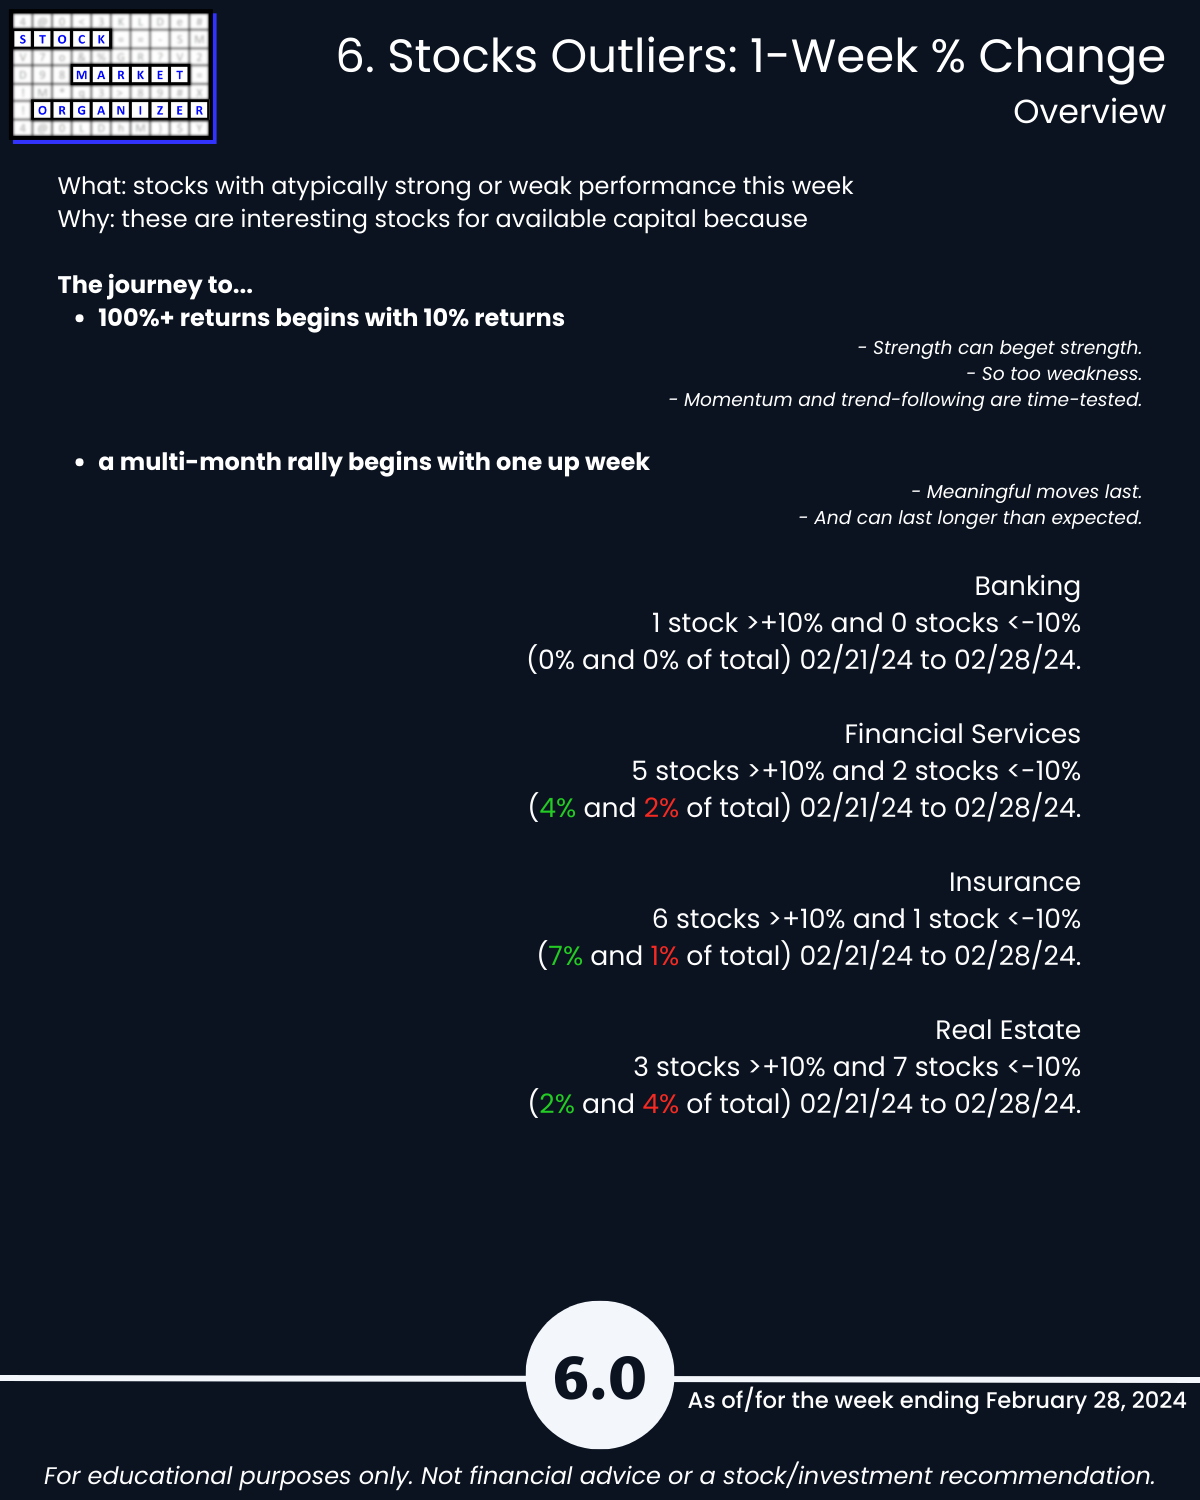
🔹 the rally of multiple months+ begins with one up week, and
🔹 the journey to 100%+ returns begins with 10% returns.
It really doesn’t have to be so complicated.
This report may particularly be of interest if the following 5 concepts resonate with you:
- The stronger your stocks, the greener your P&L.
- The journey to 100%+ returns begins with 10% returns.
- The journey to a multi-month rally begins with one up week.
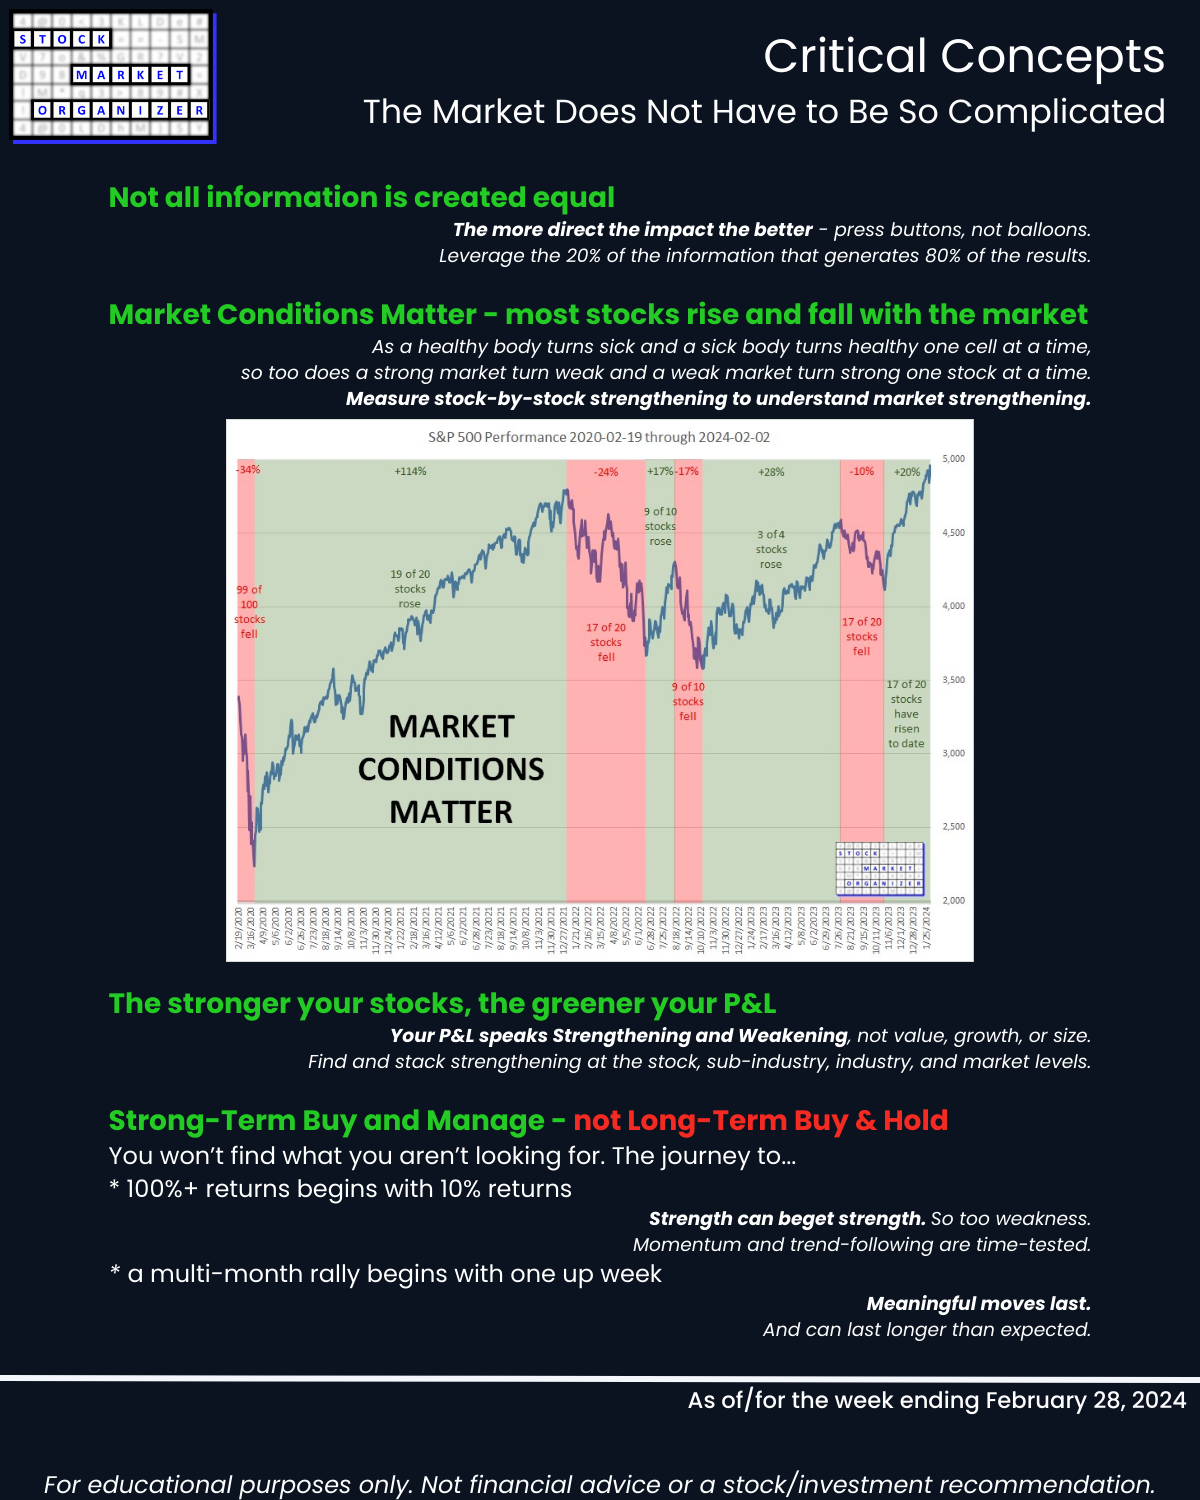
- Most stocks do what the market does. (While the market can only do what its underlying stocks, sub-industries, and industries do.)
- 80/20: not all information is created equal. (Press buttons, not balloons.)
Following are galleries with page-by-page views of this report.
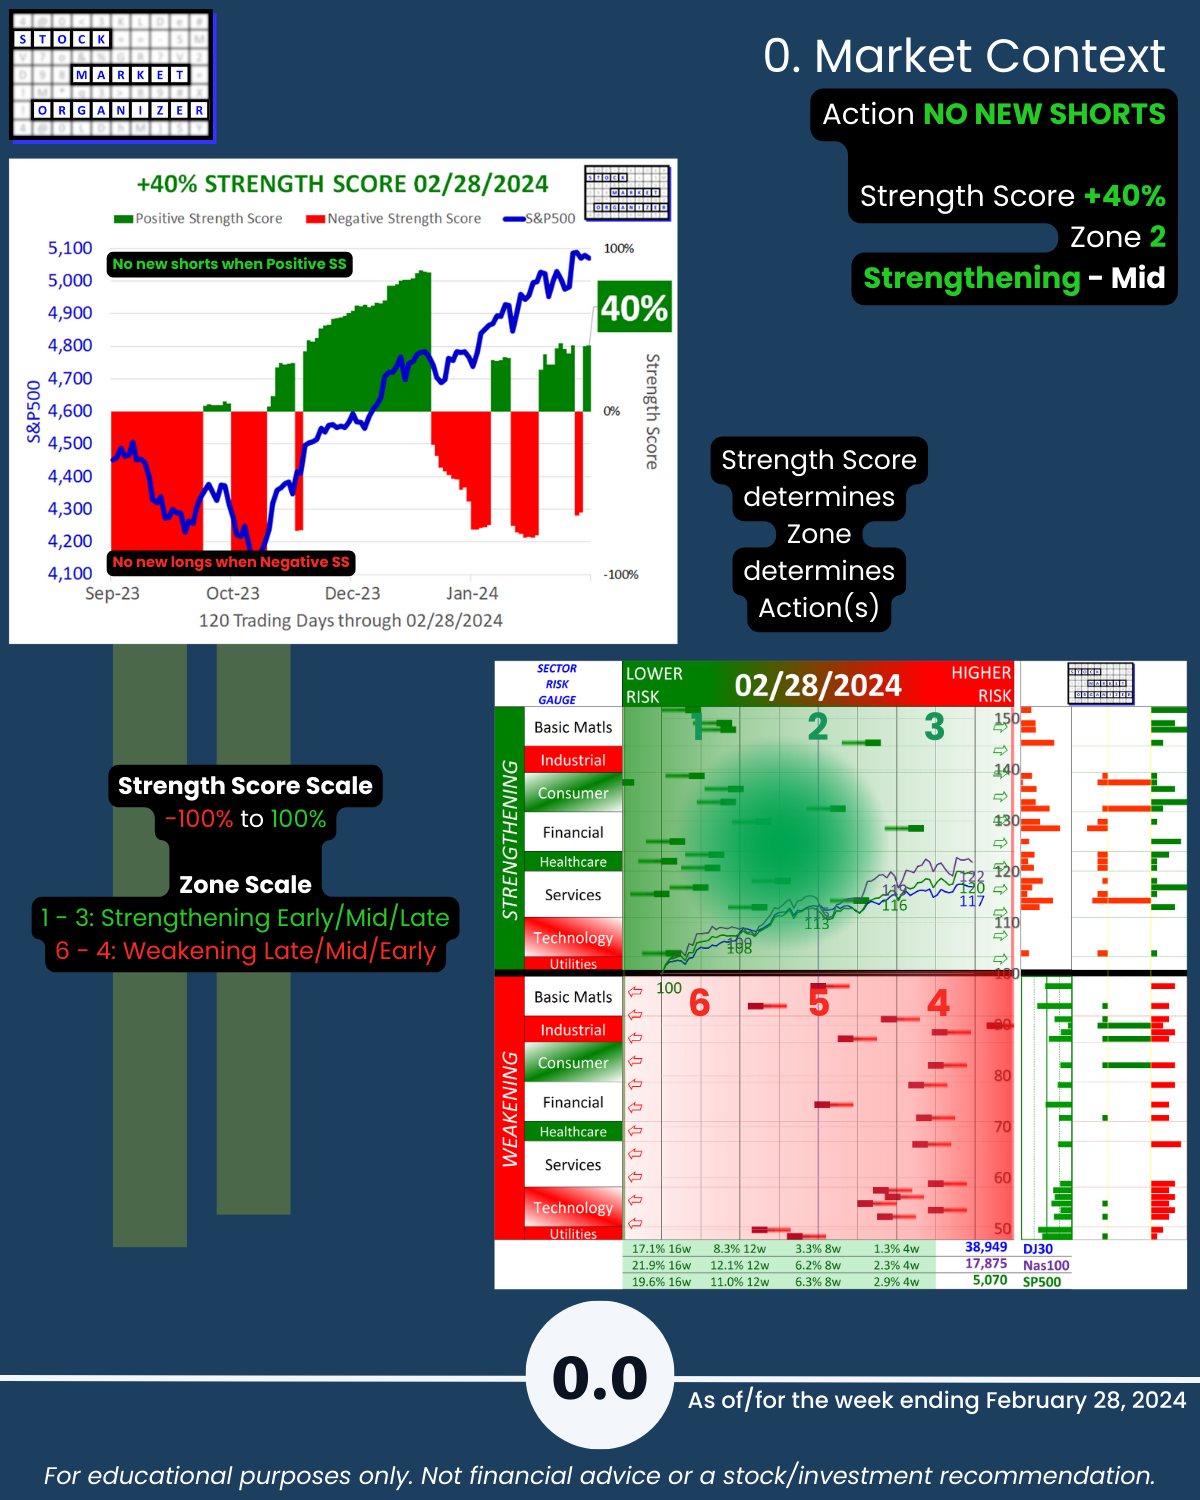
0. Market Context
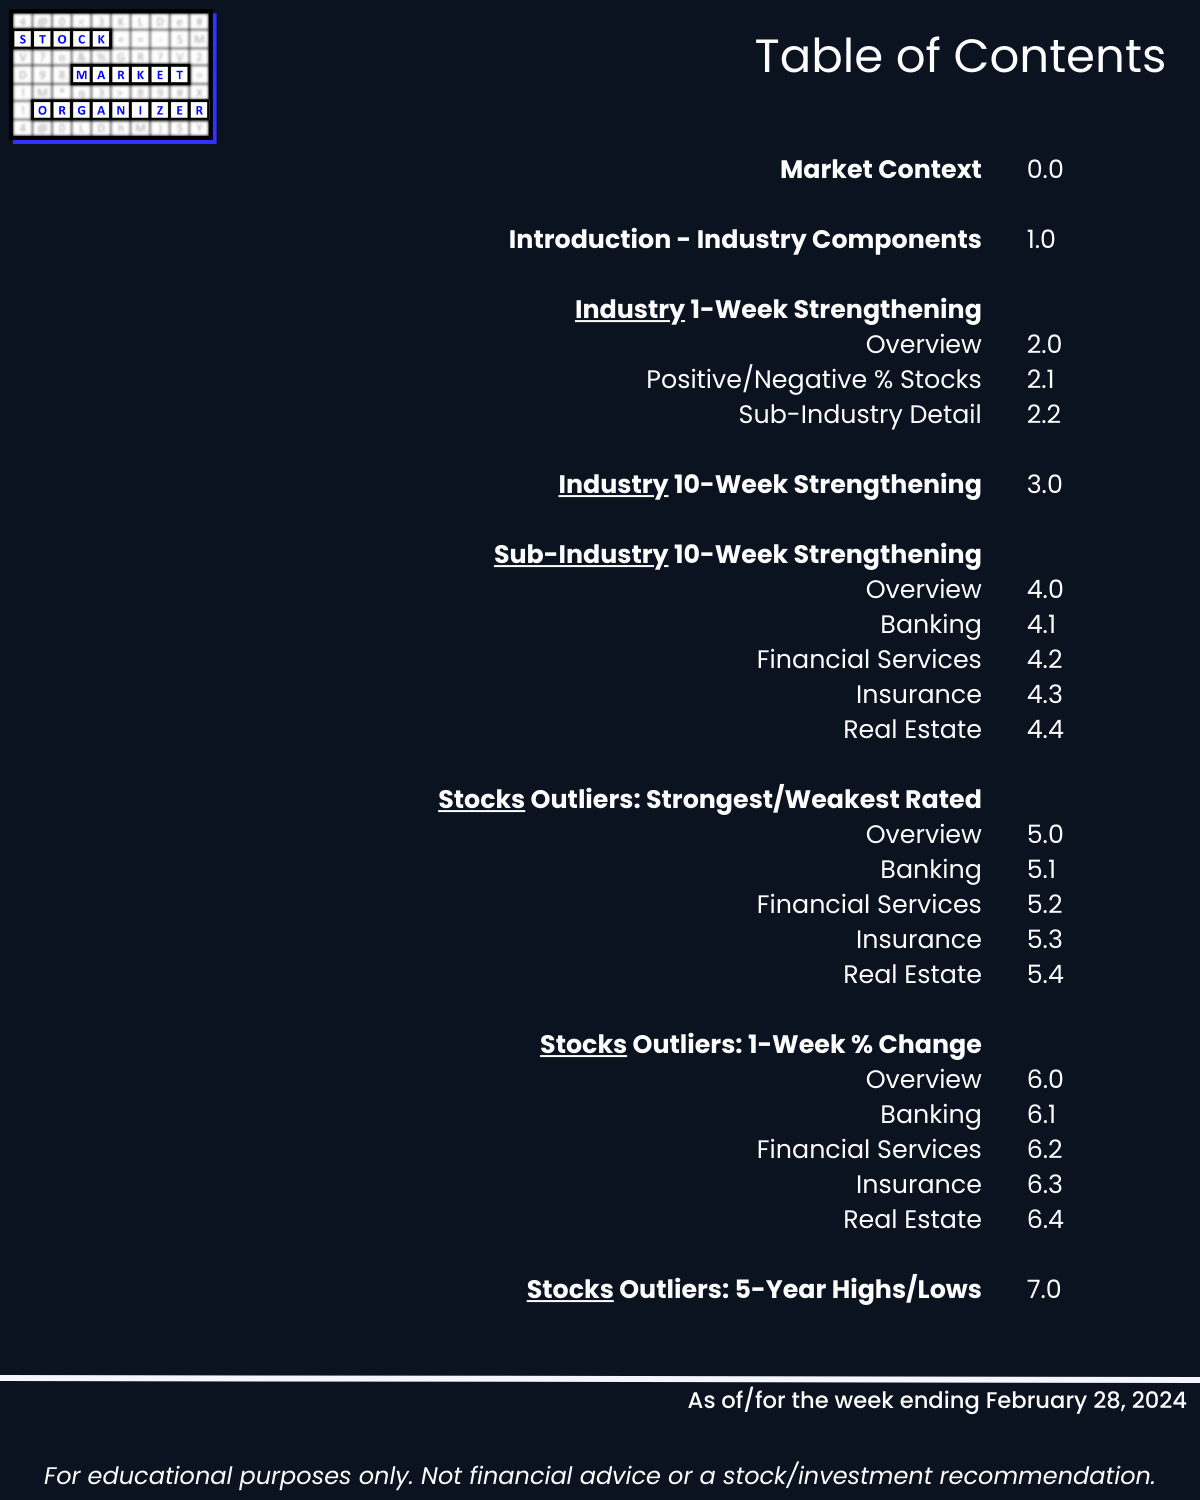
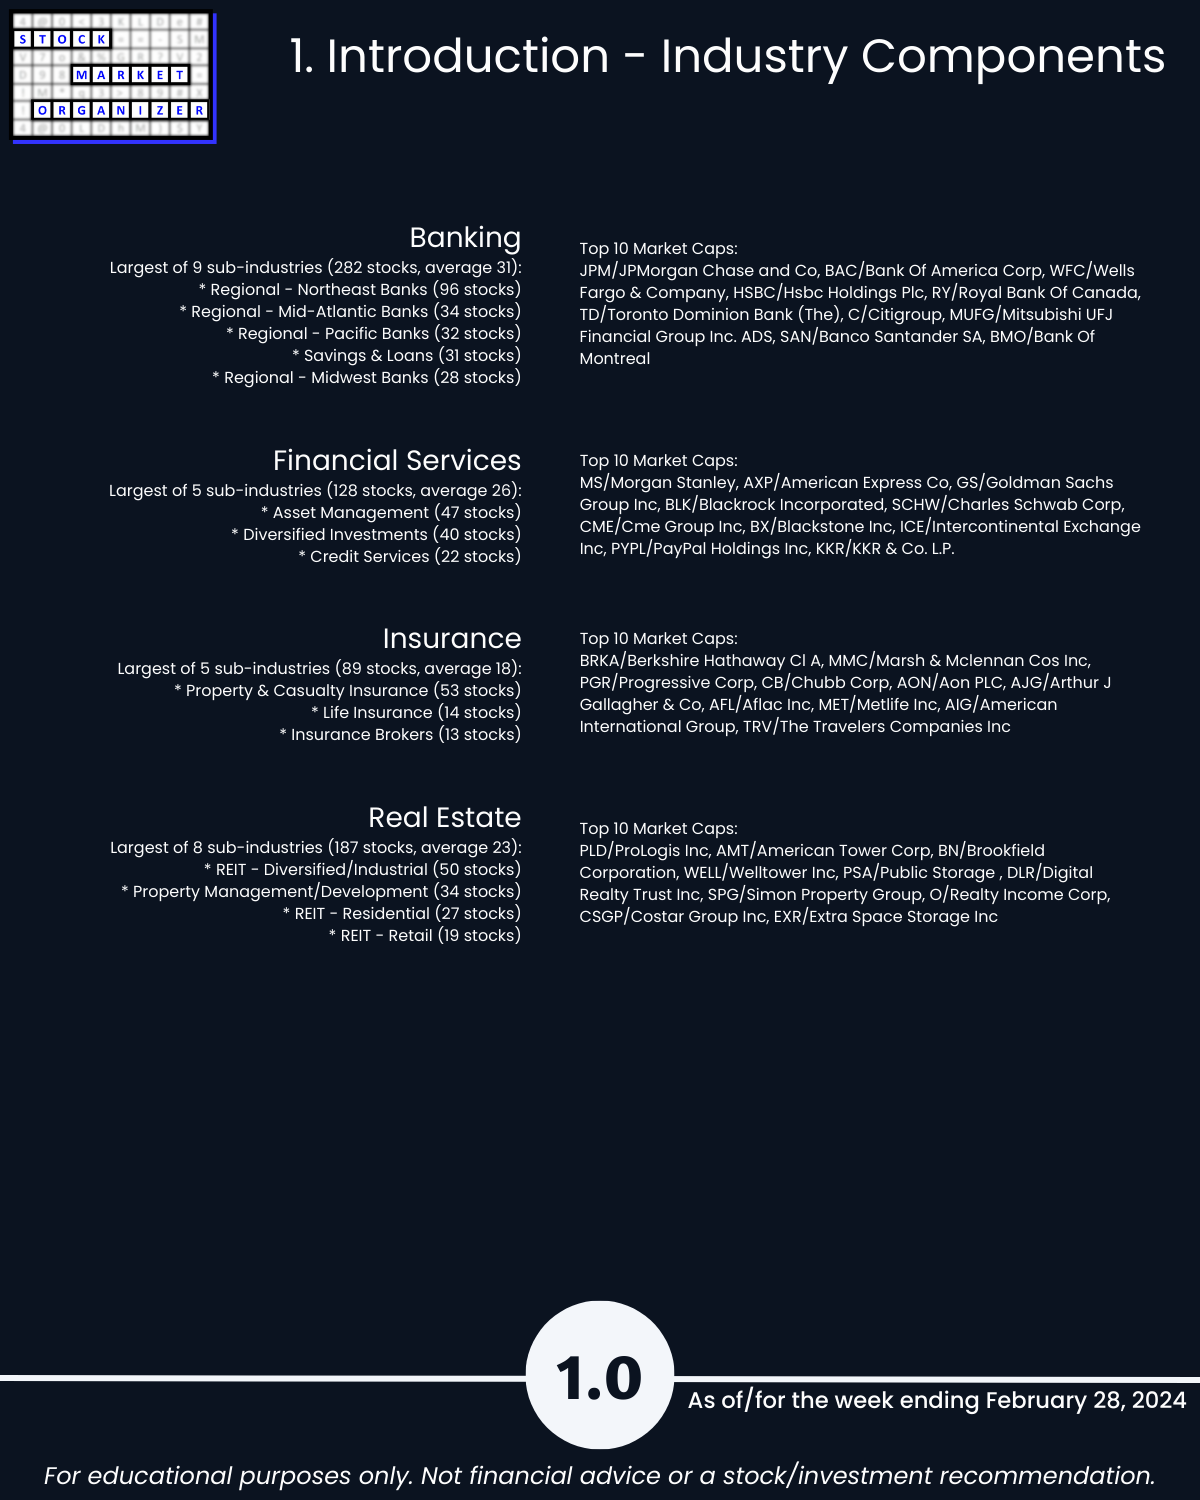
1. Introduction - Industry Components
2. Industry 1-Week Strengthening
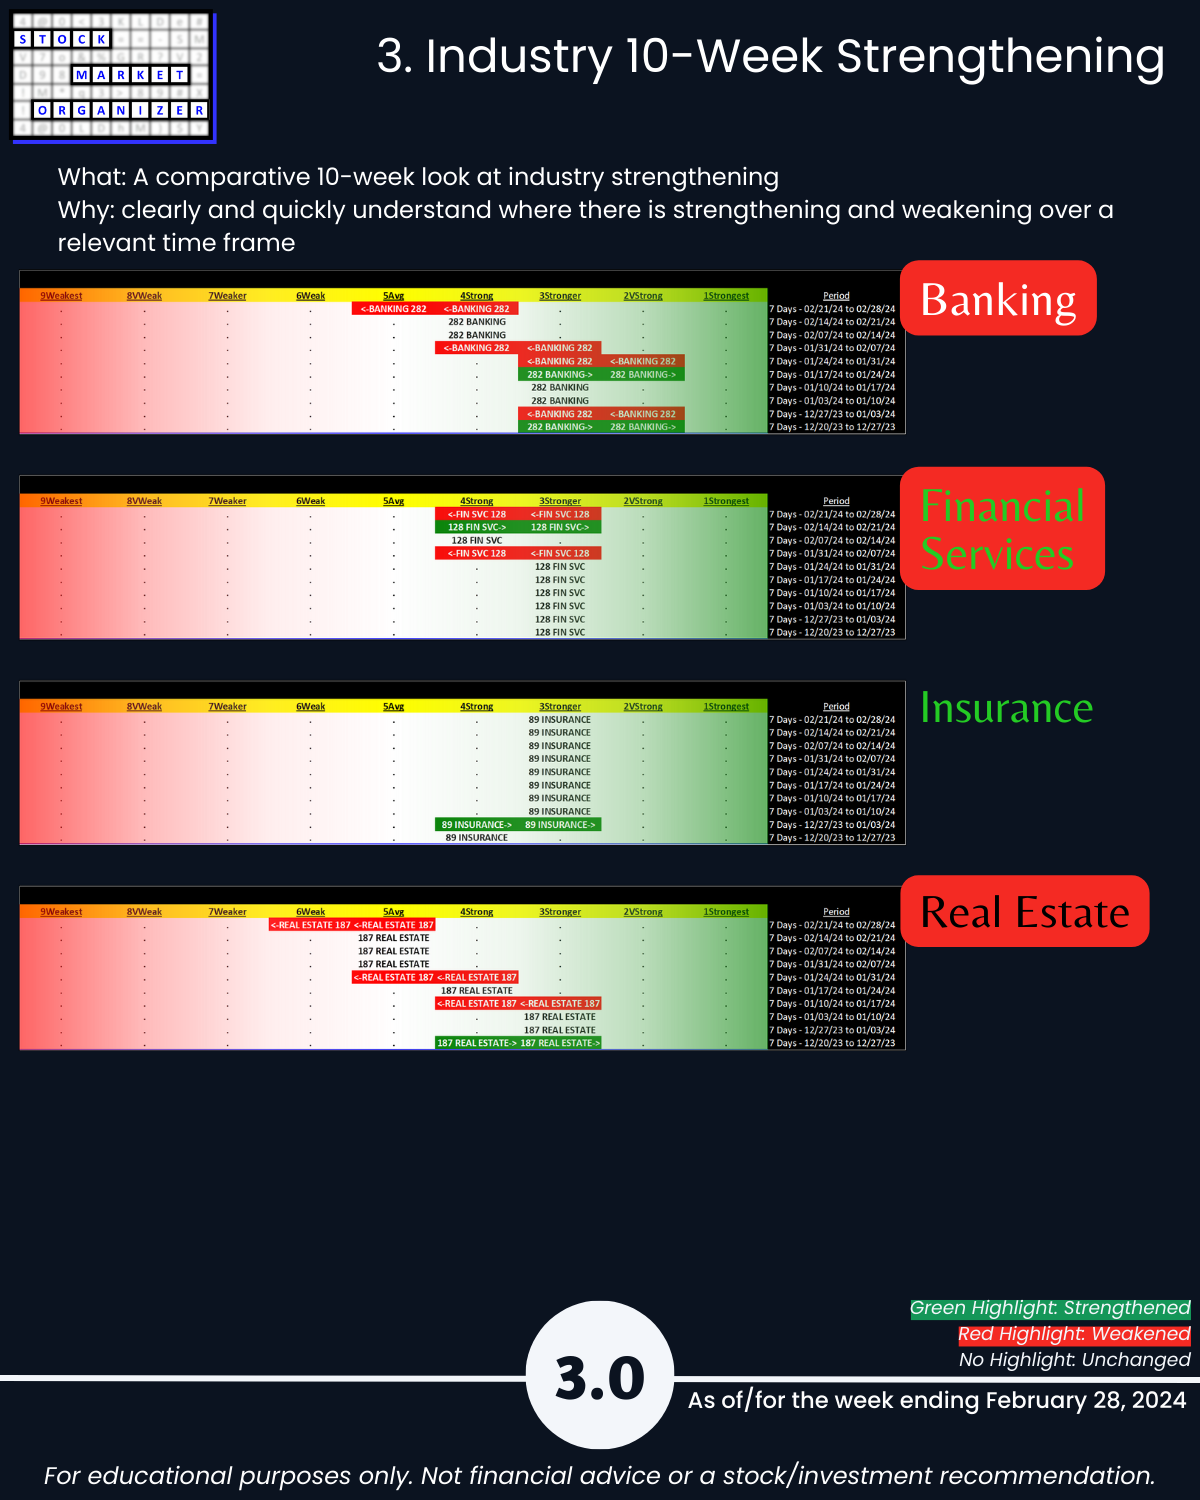
3. Industry 10-Week Strengthening
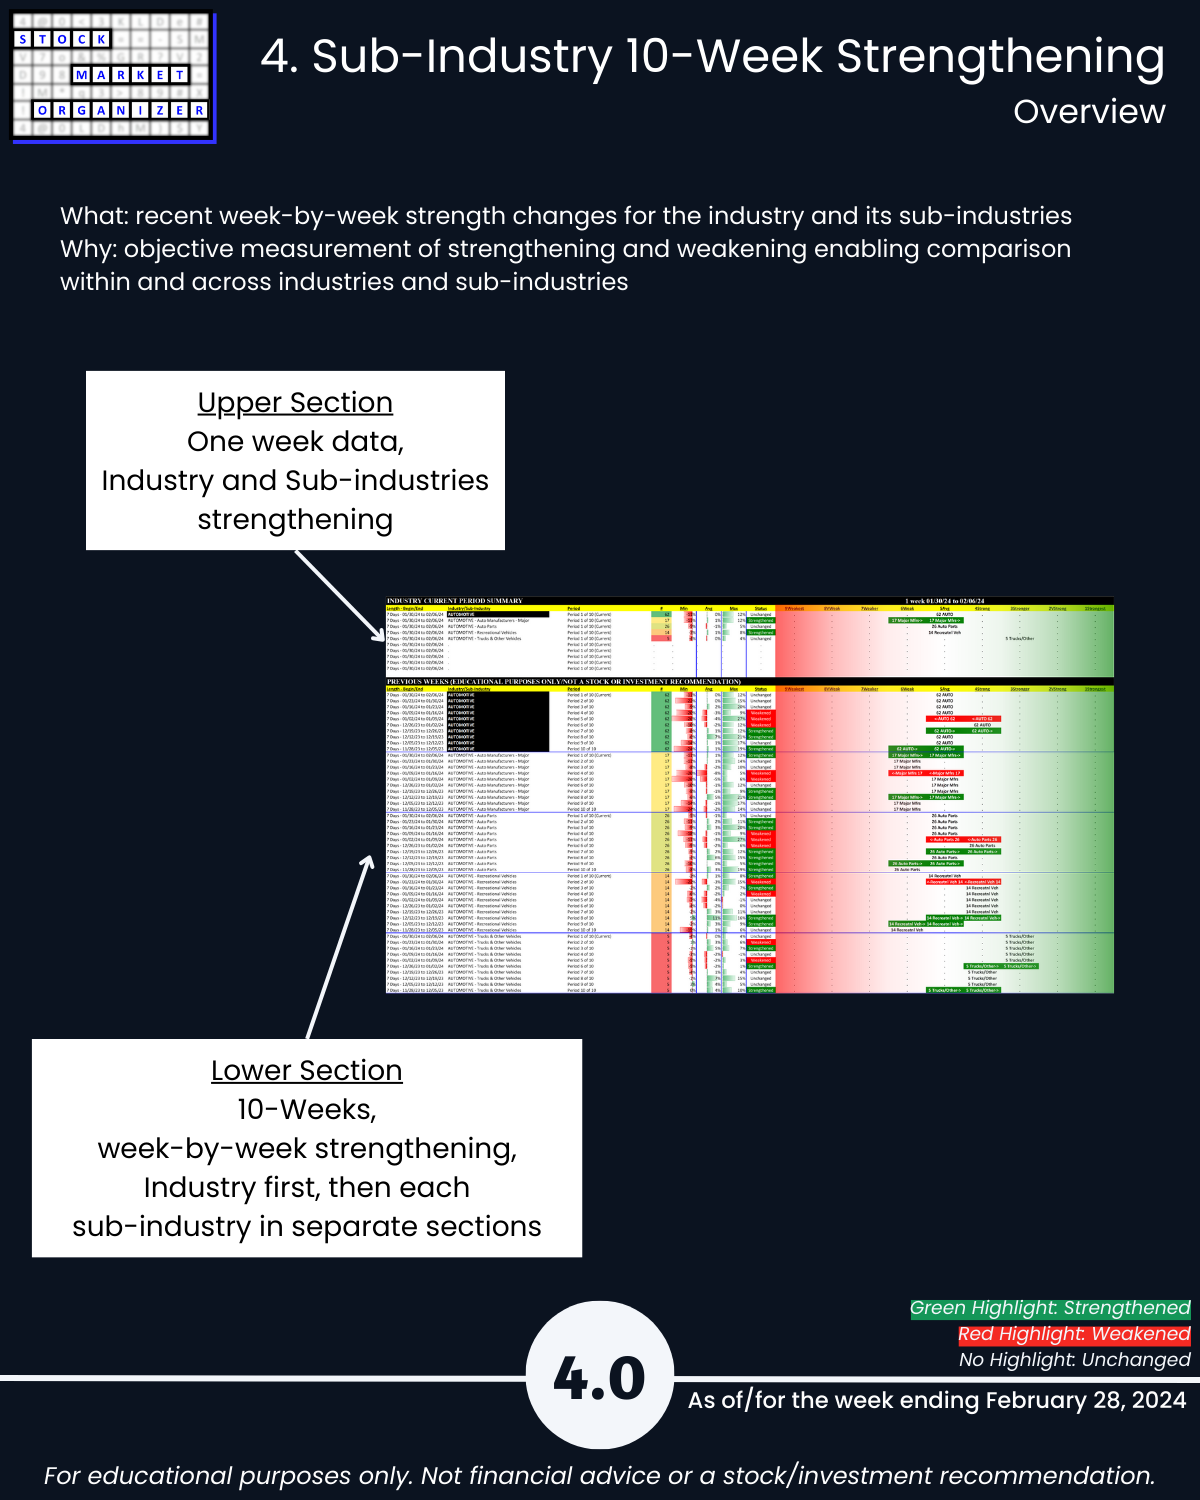
4. Sub-Industry 10-Week Strengthening
5. Stocks Outliers: Strongest/Weakest Rated
6. Stocks Outliers: 1-Week % Change
7. Stocks Outliers: 5-Year Highs/Lows