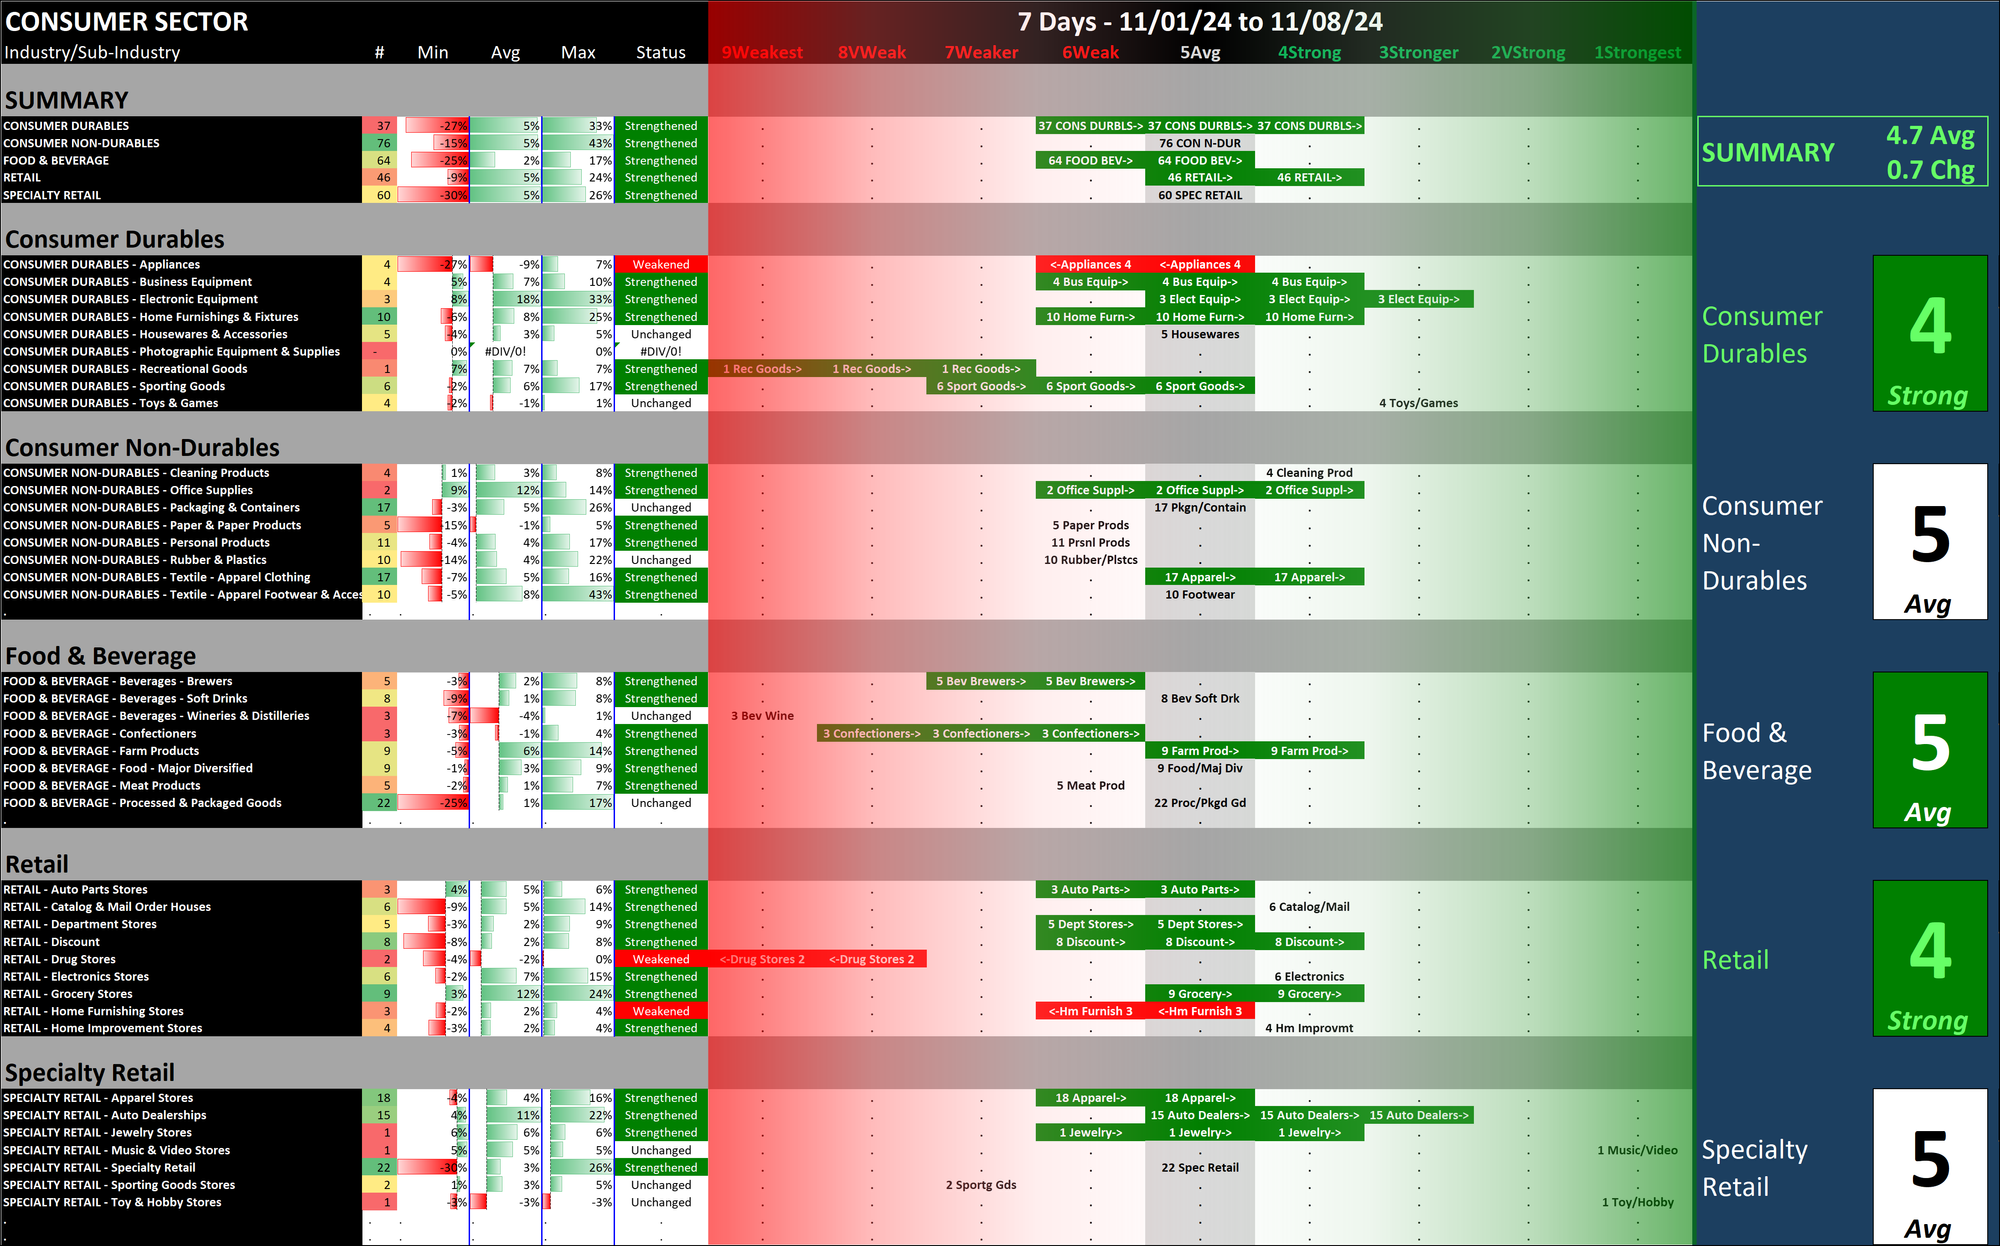
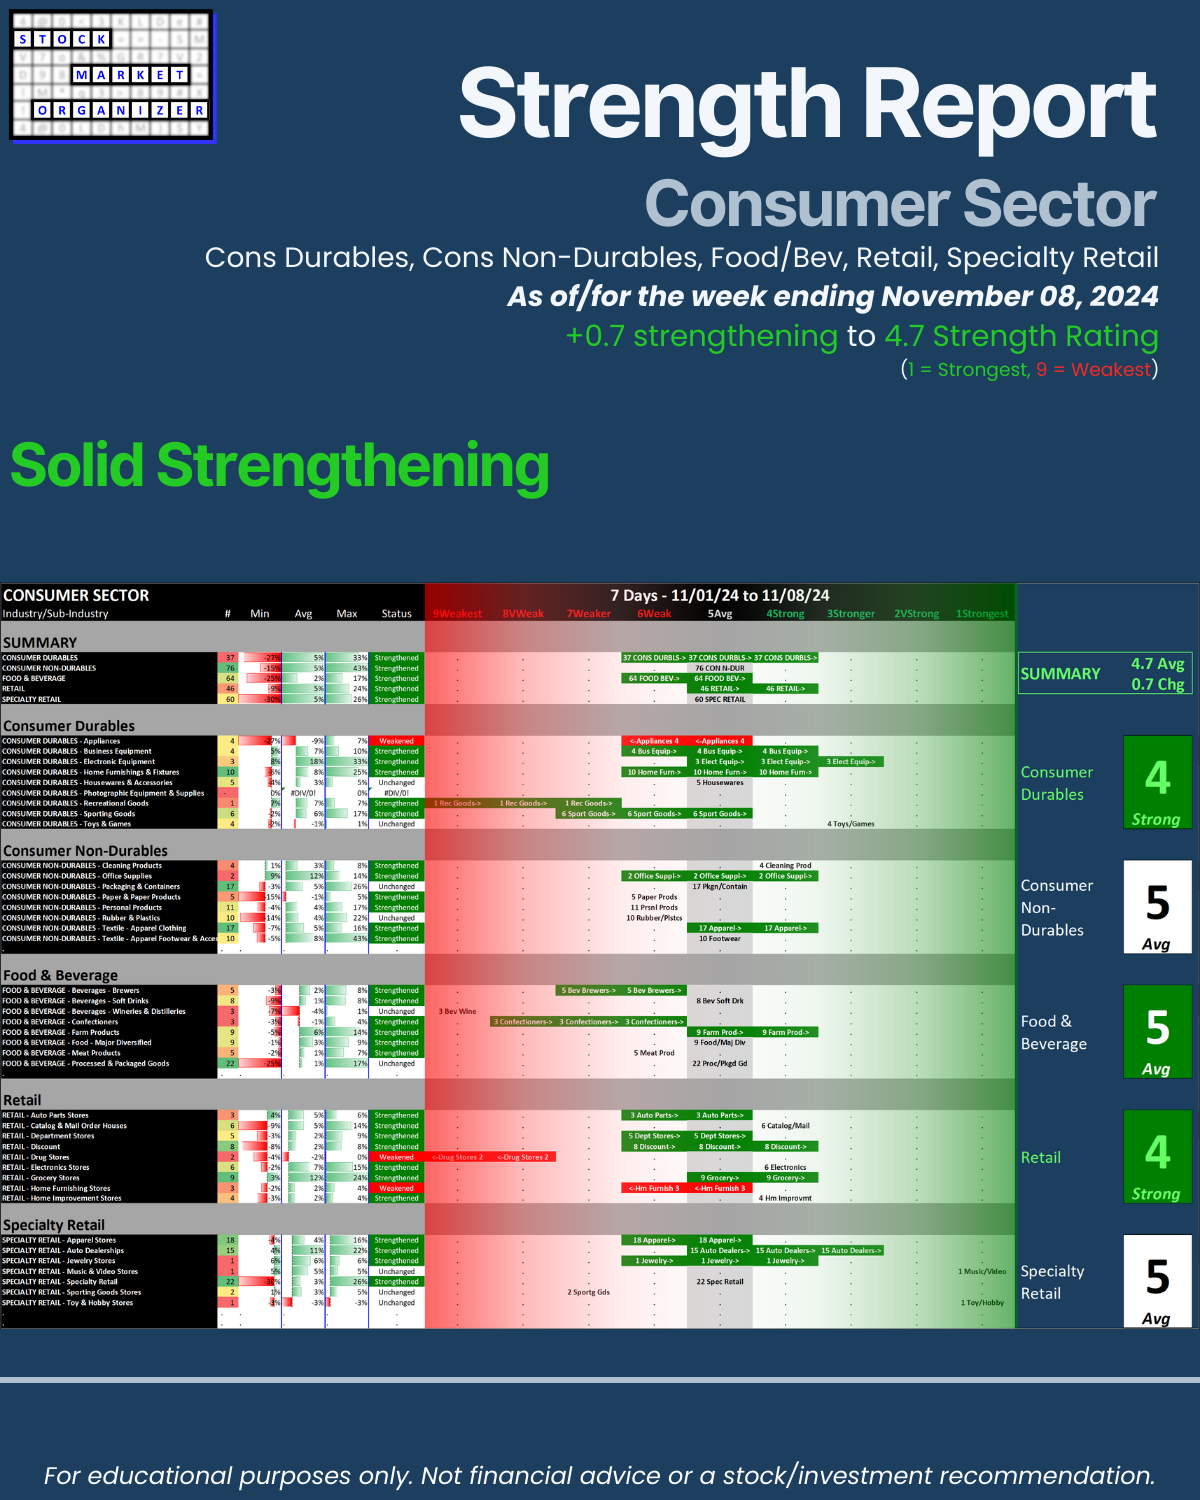
SMO Exclusive: Strength Report Consumer Sector 2024-11-08 Strengthened +0.7 to 4.7 Strength Score
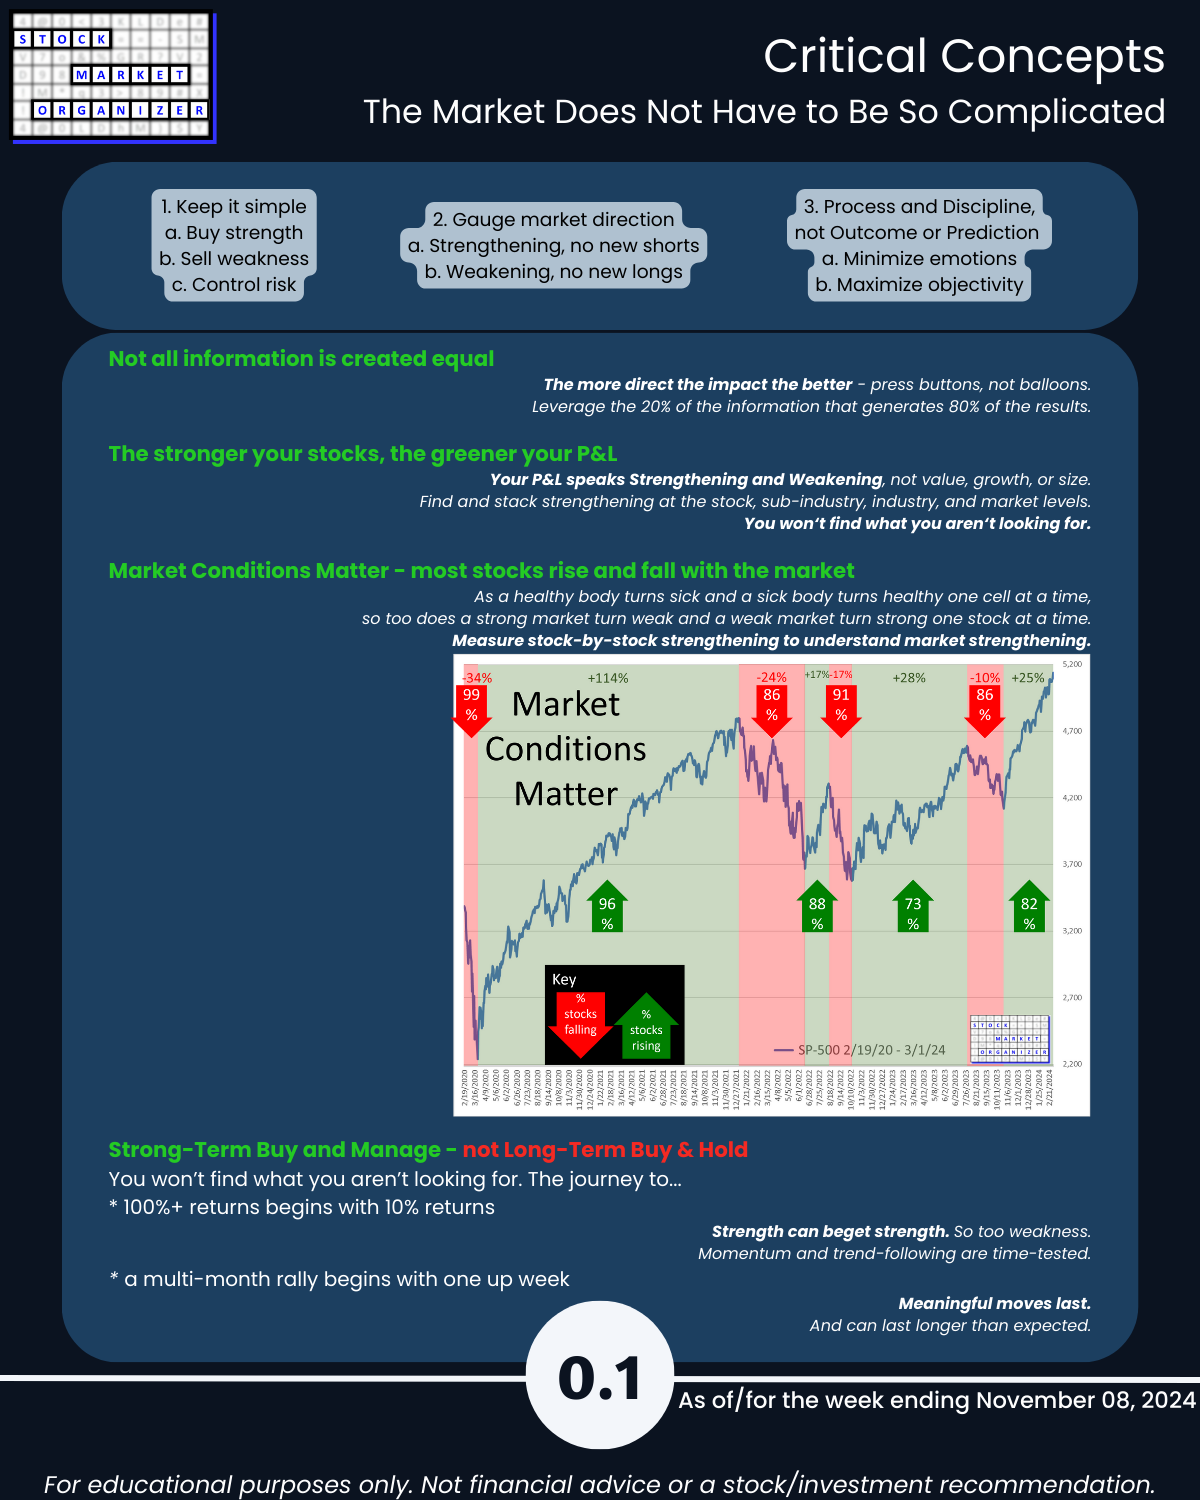
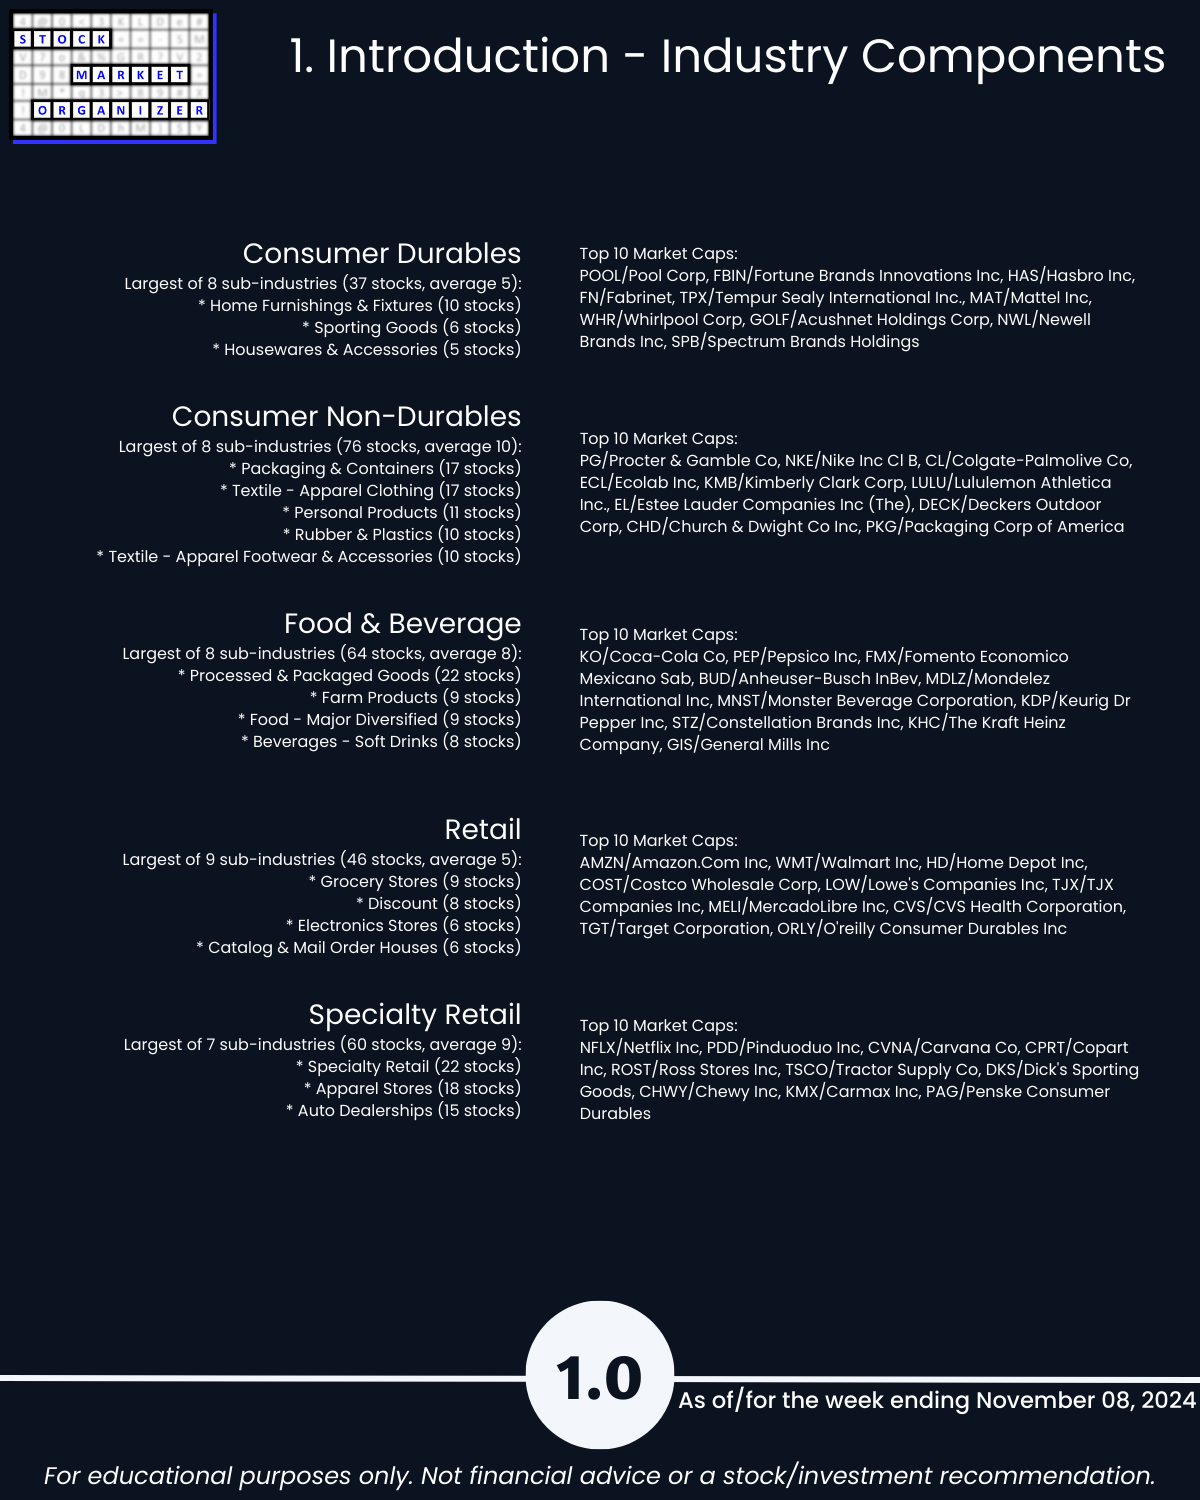
Reminder that the stock market does not have to be so complicated. The attached report clearly reflects where there is strength and weakness in the Consumer Sector, which consists of the following industries:
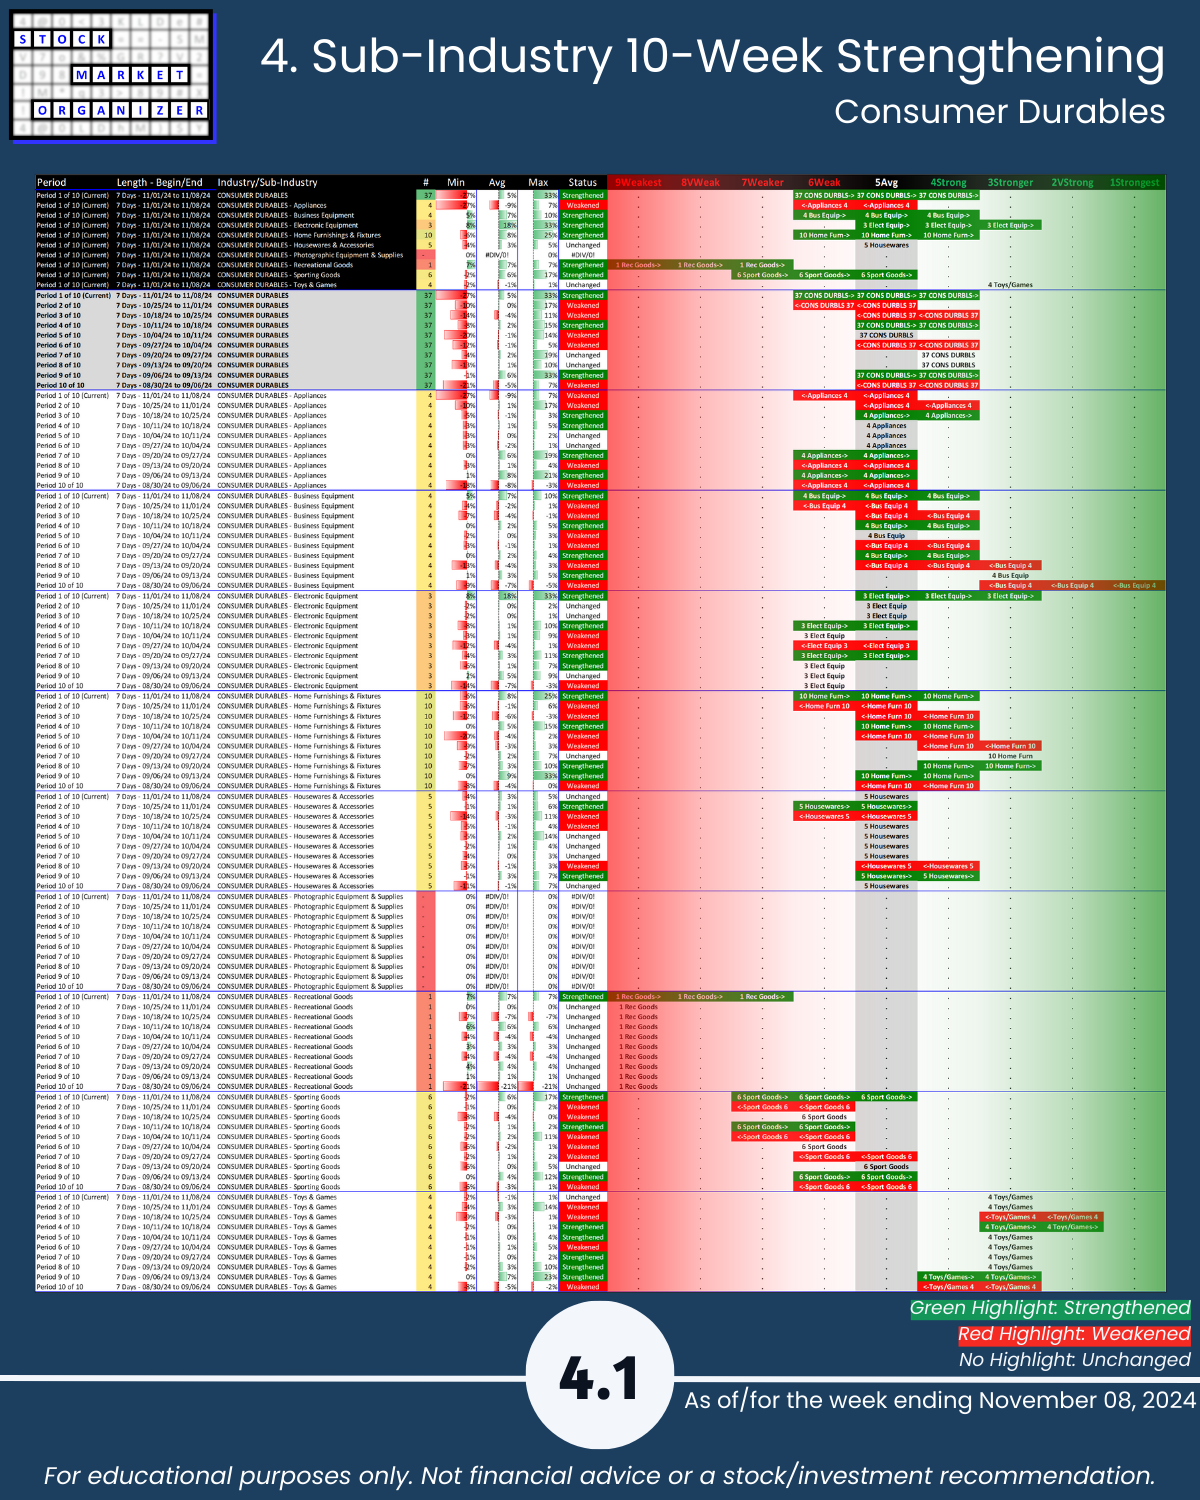
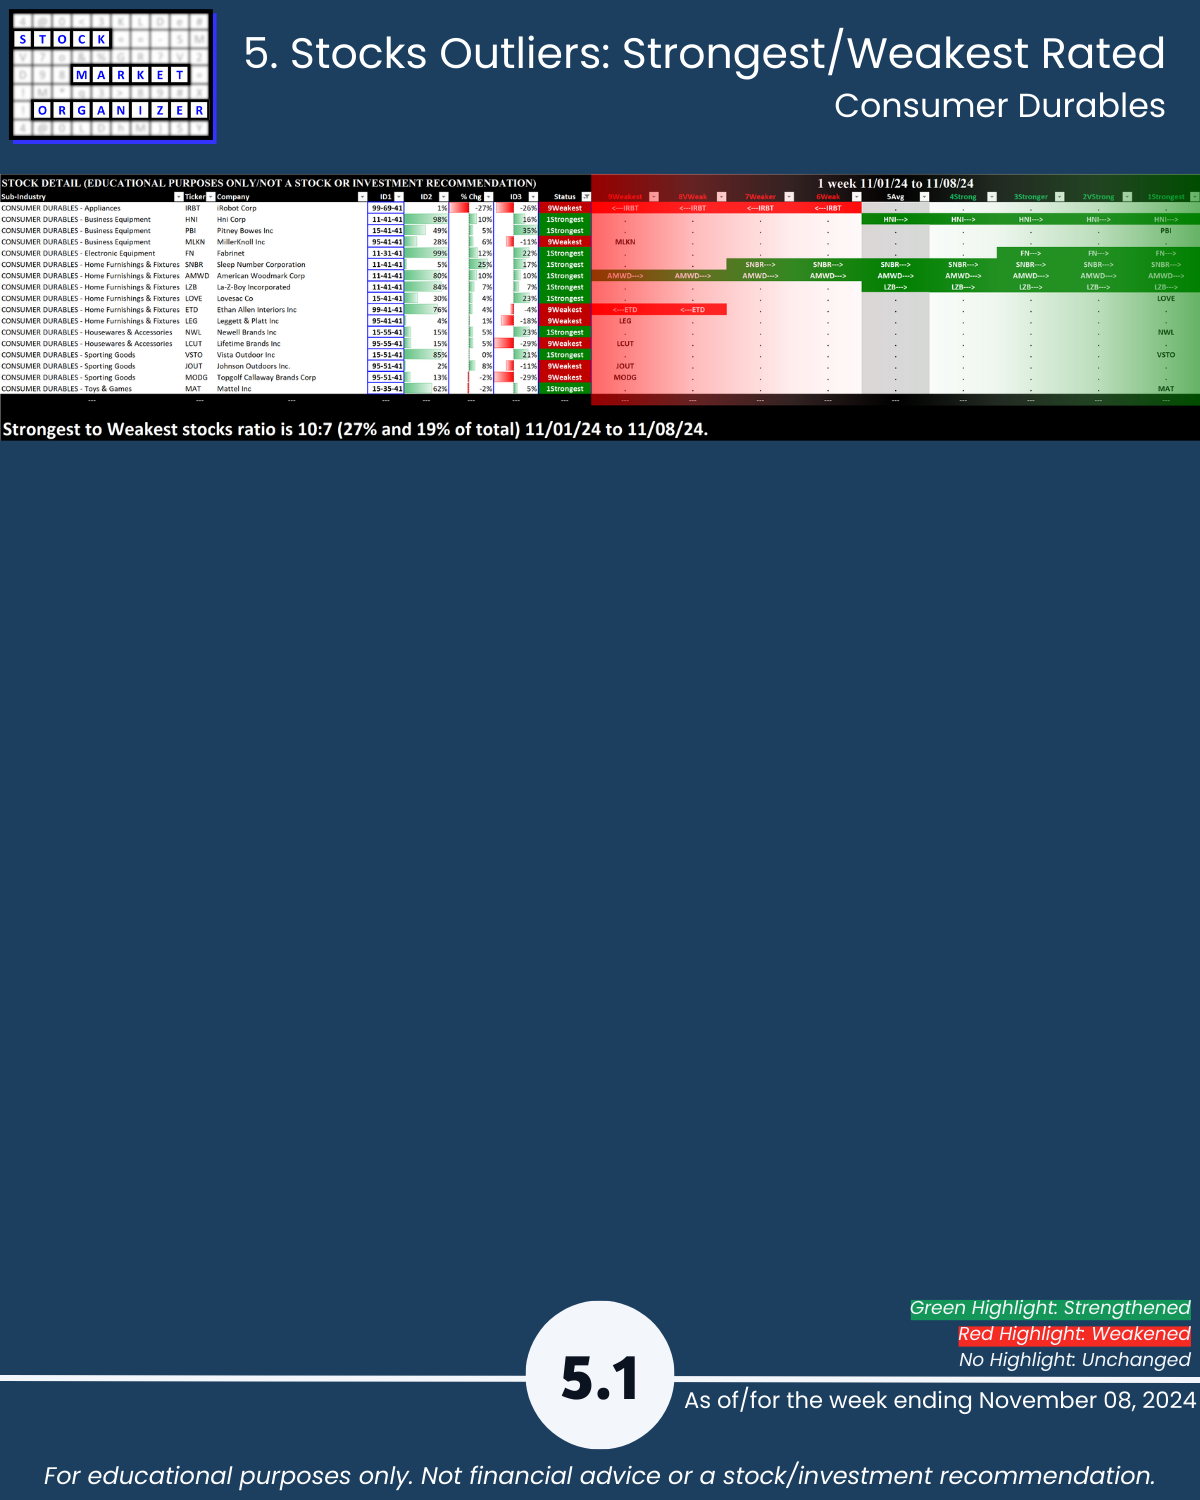
- Consumer Durables
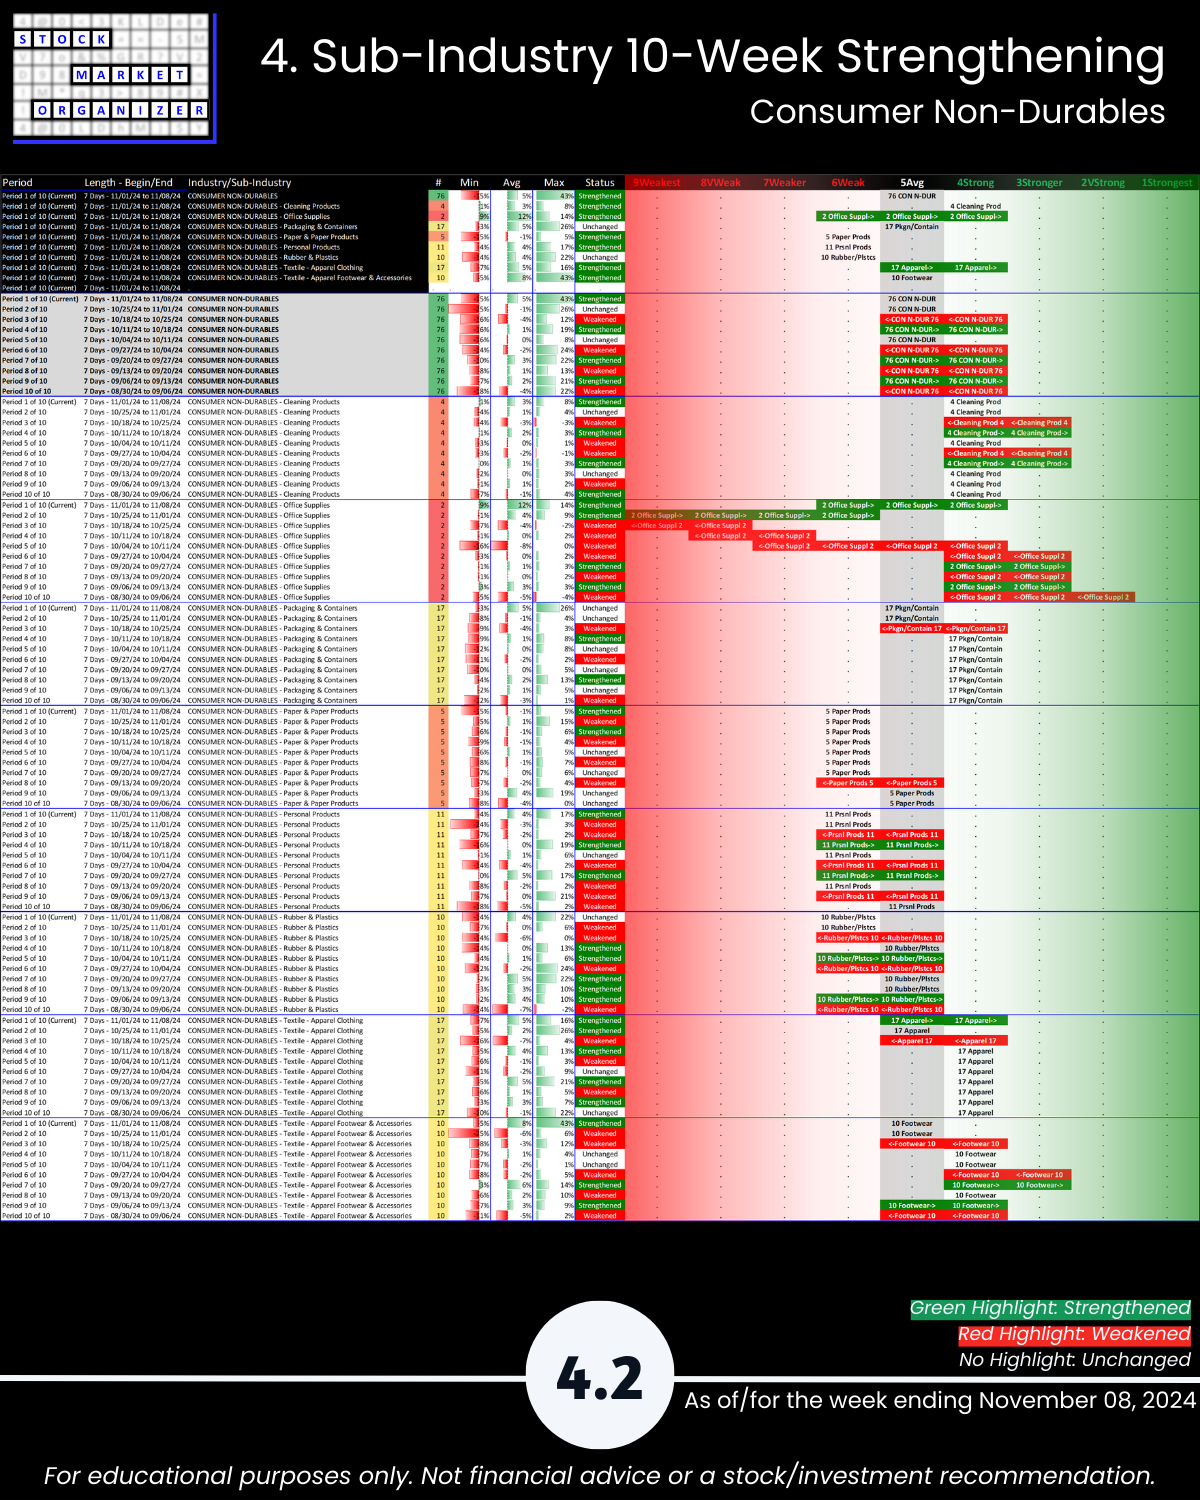
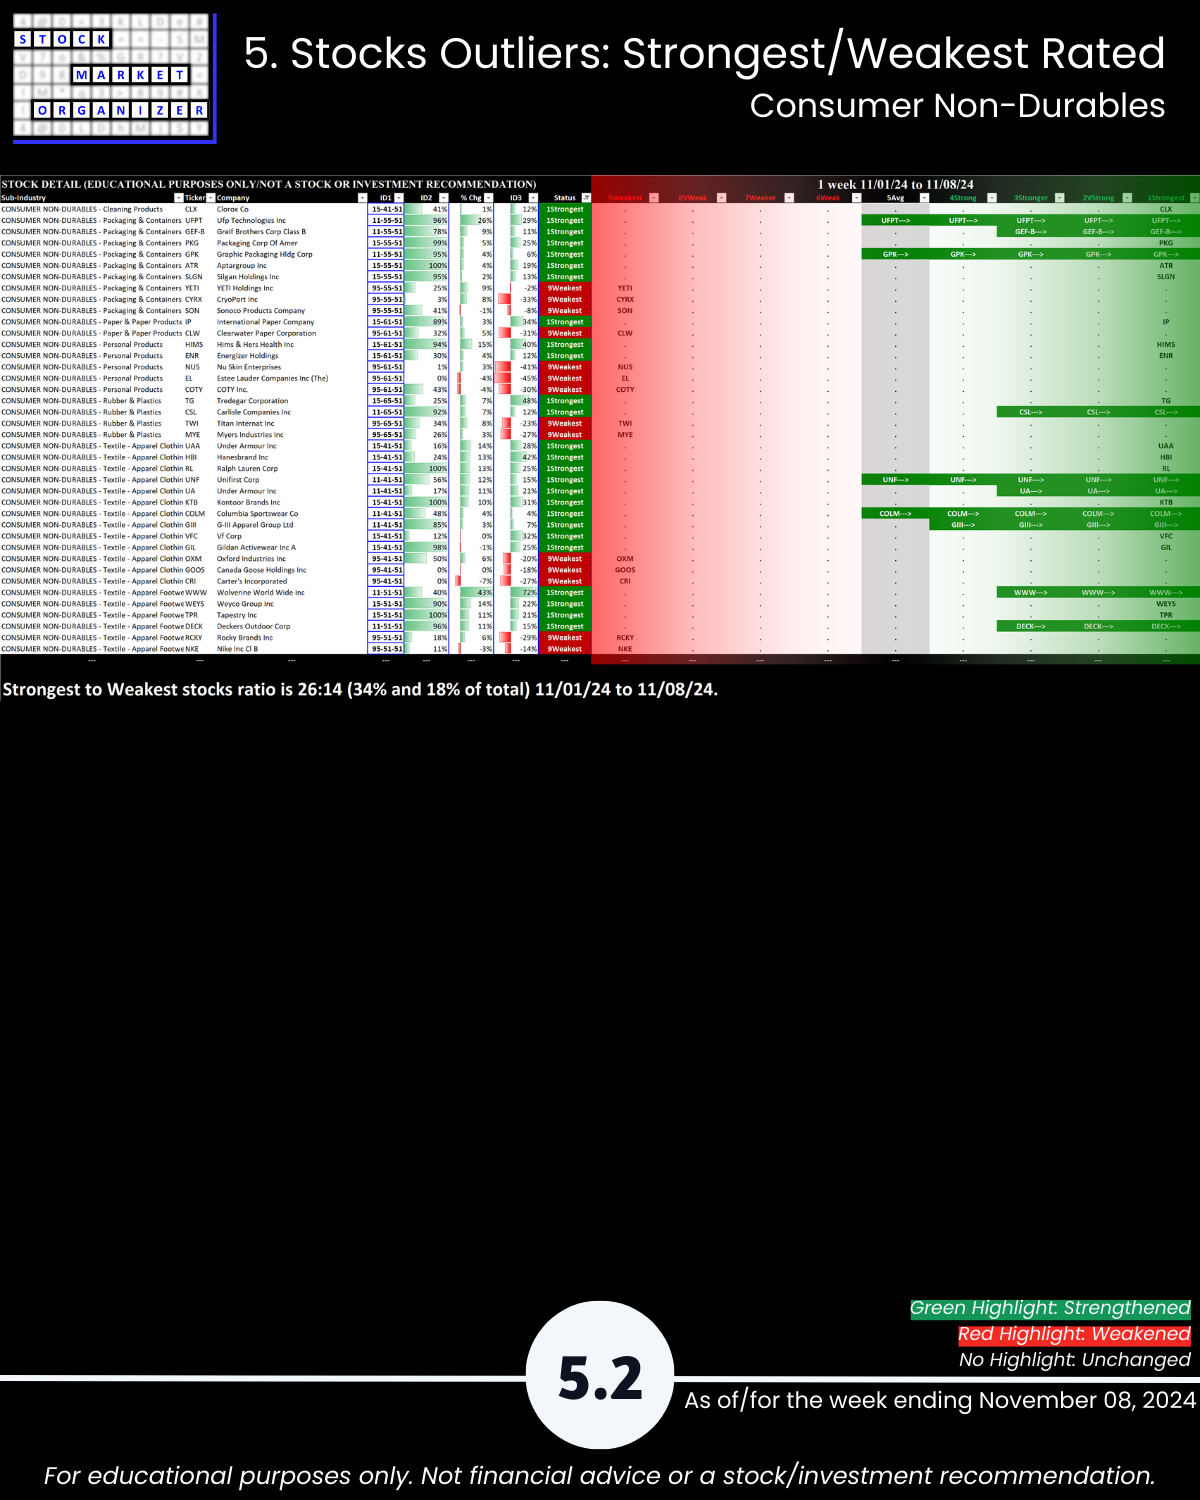
- Consumer Non-Durables
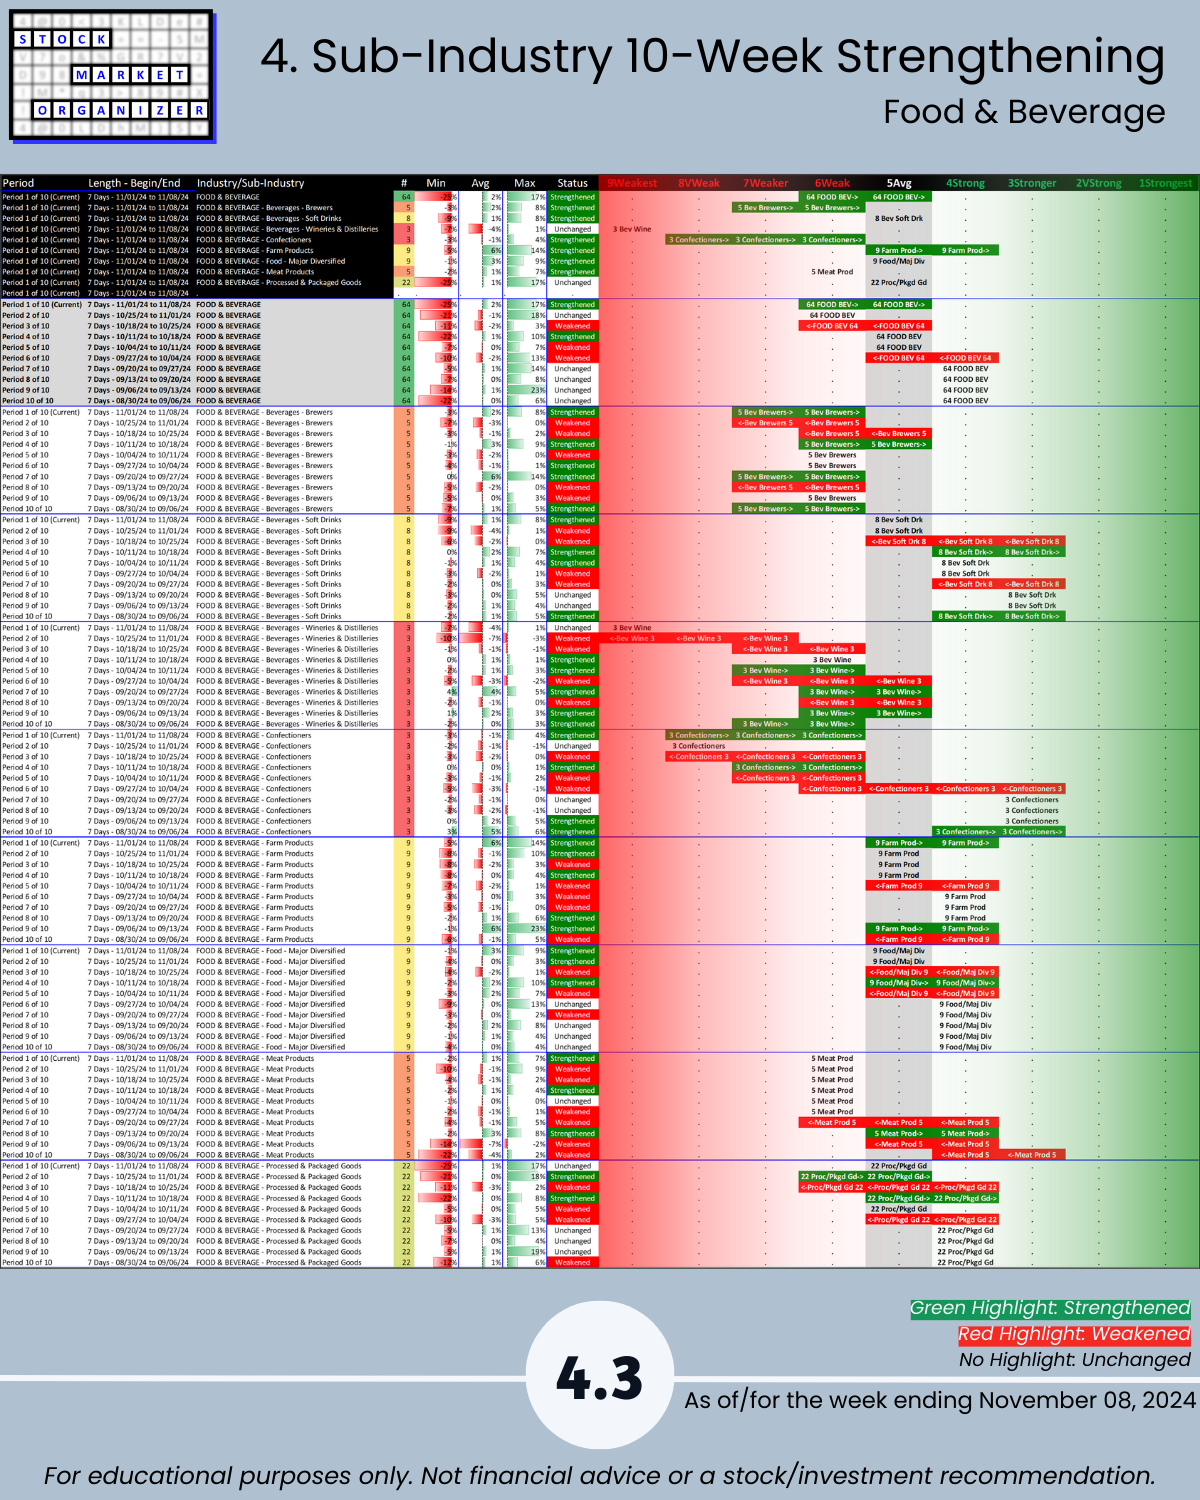
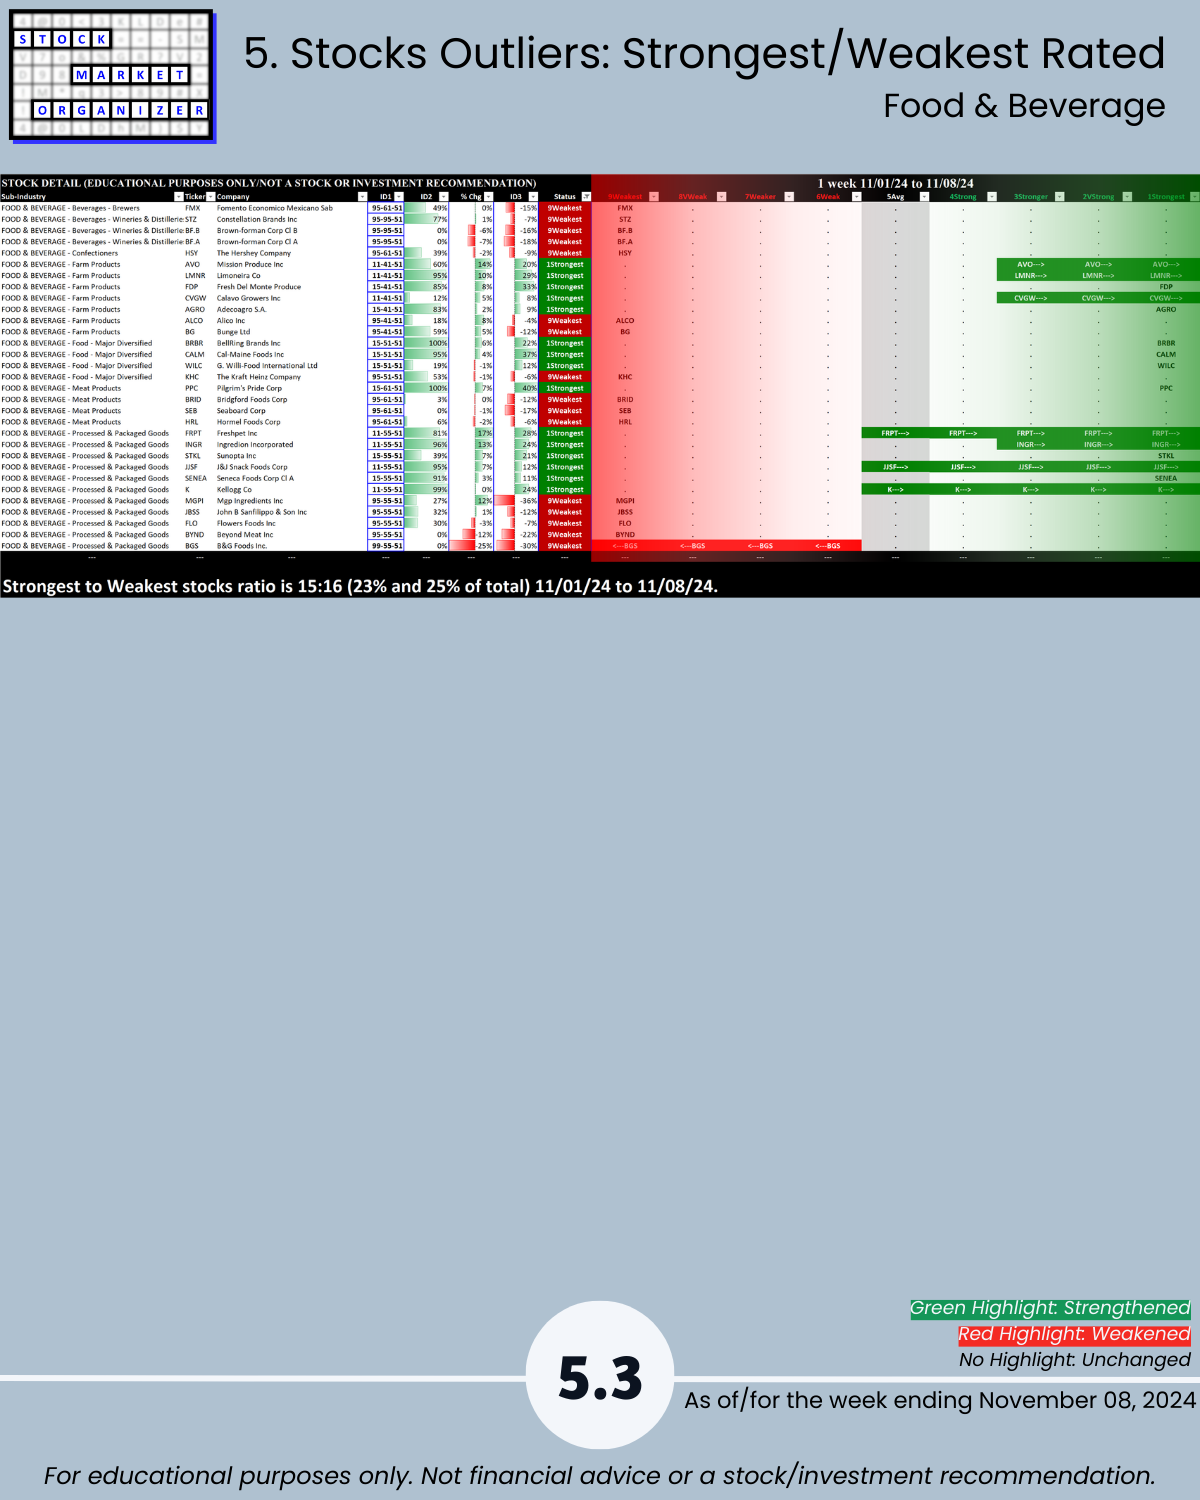
- Food & Beverage
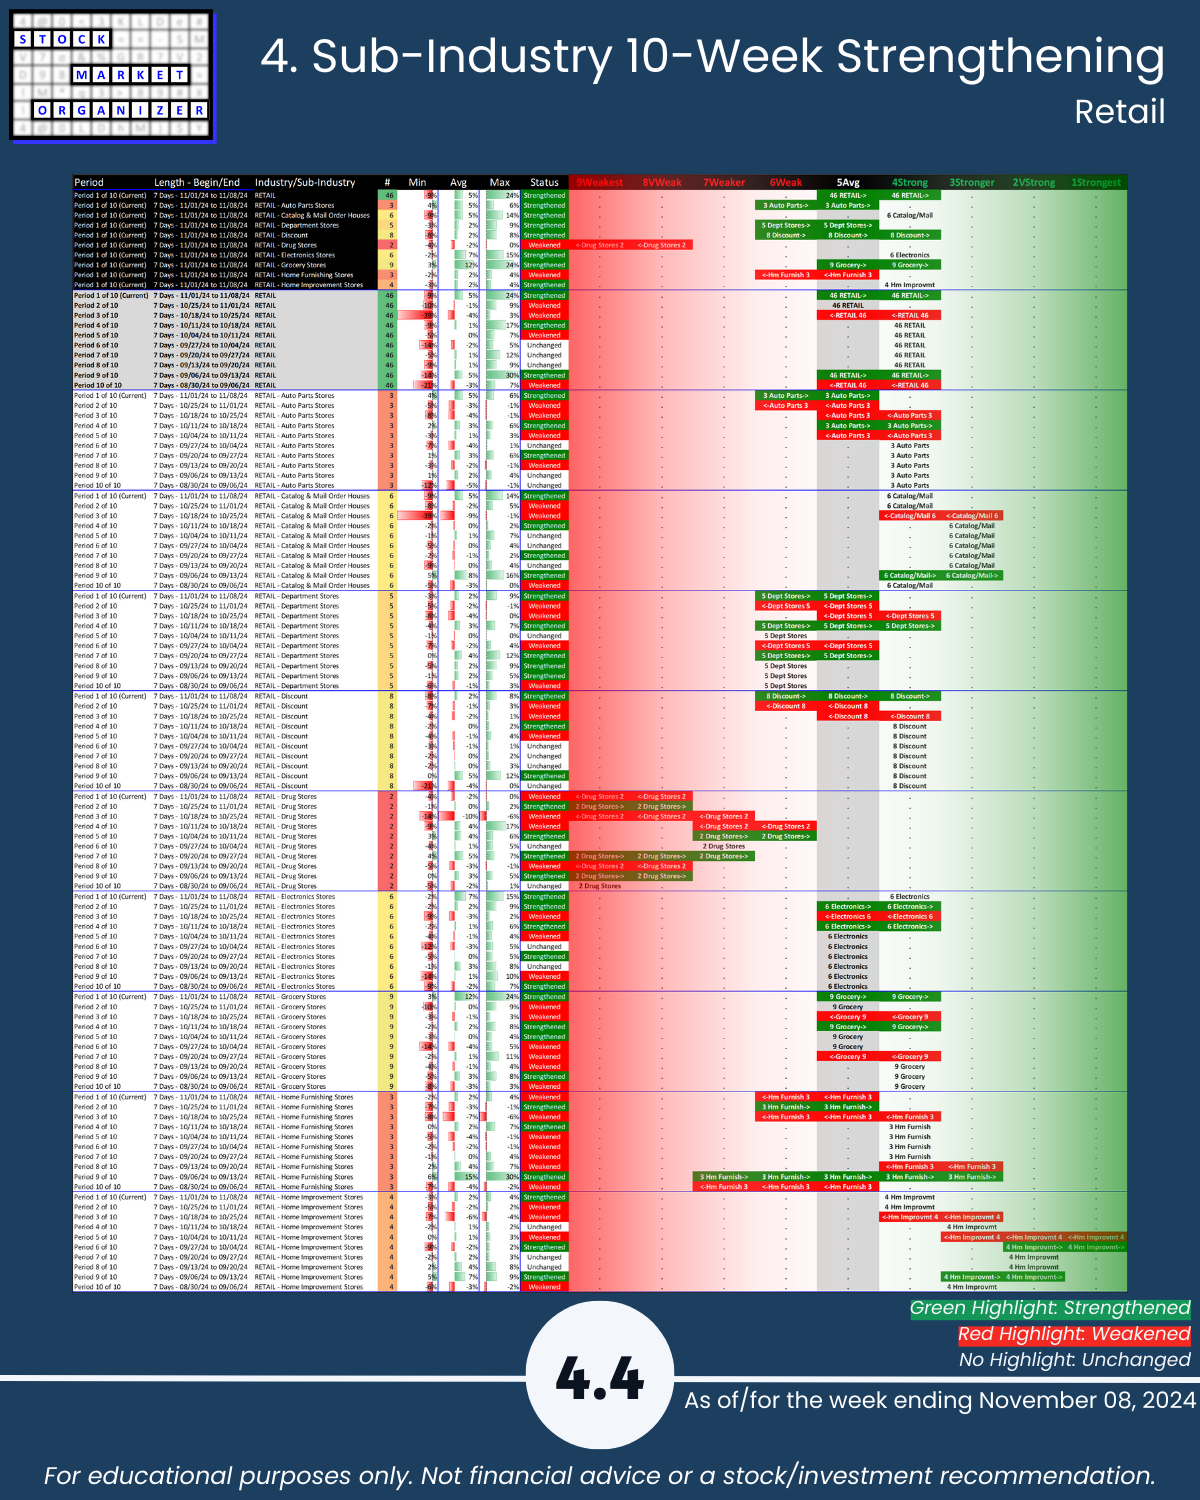
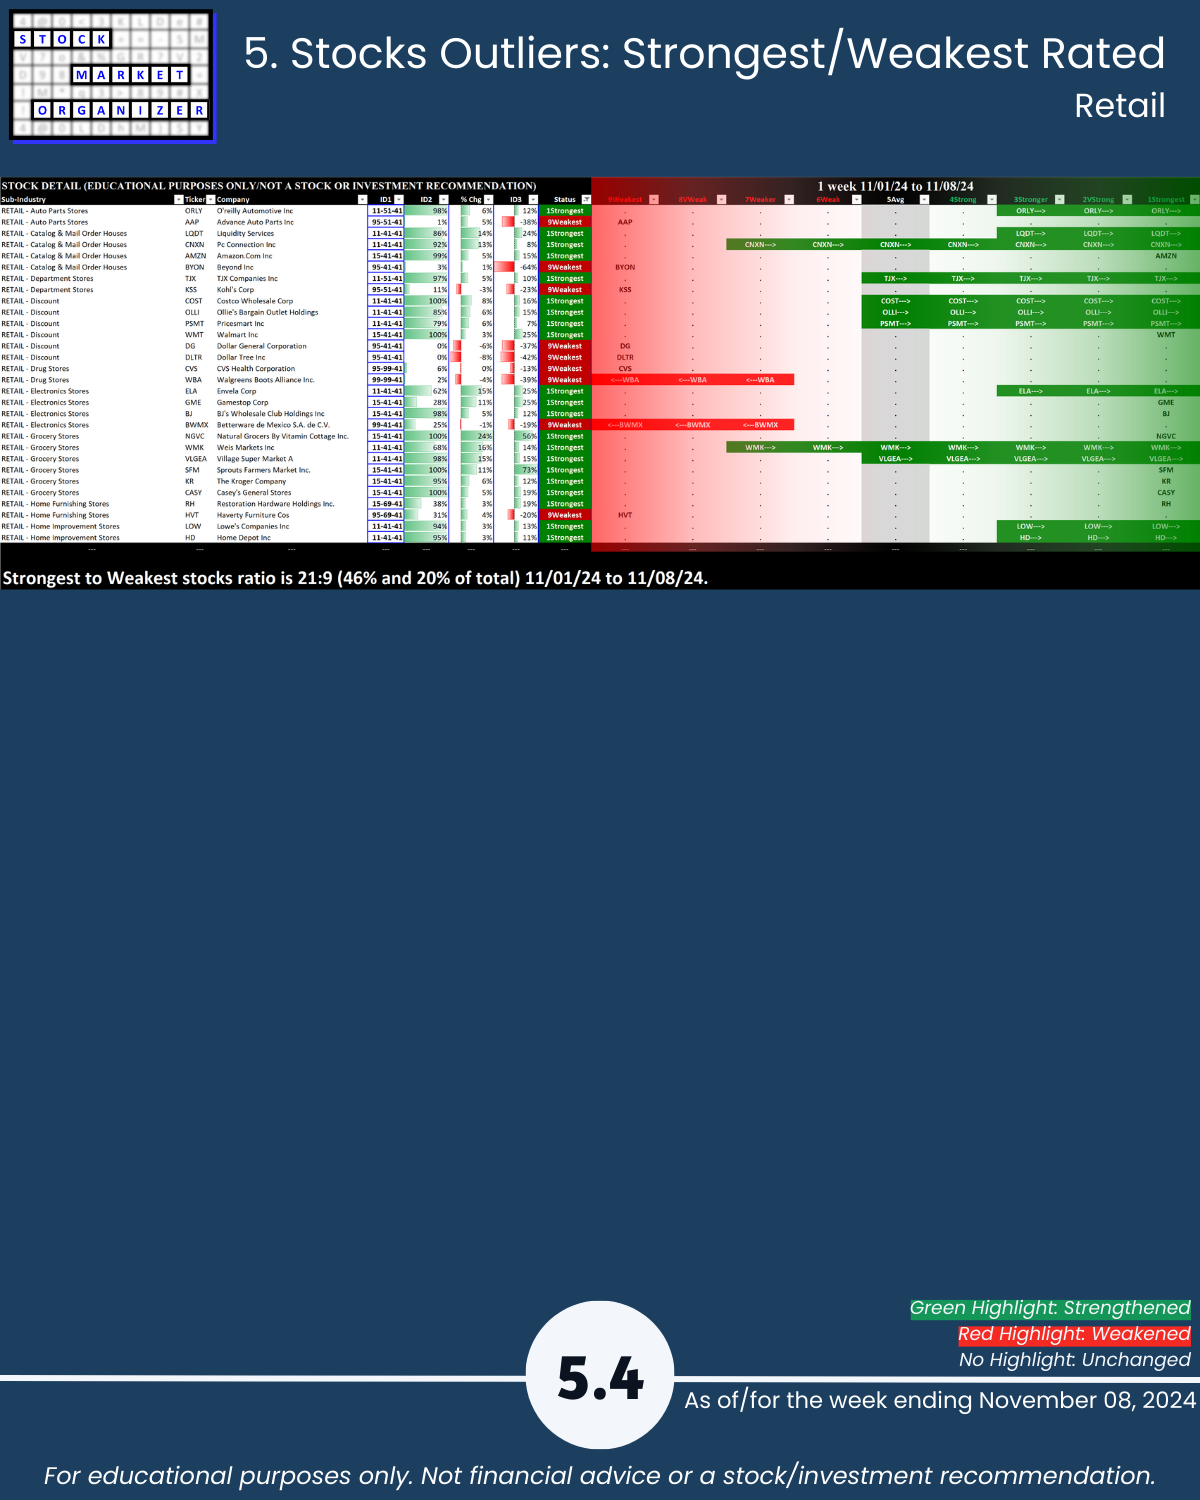
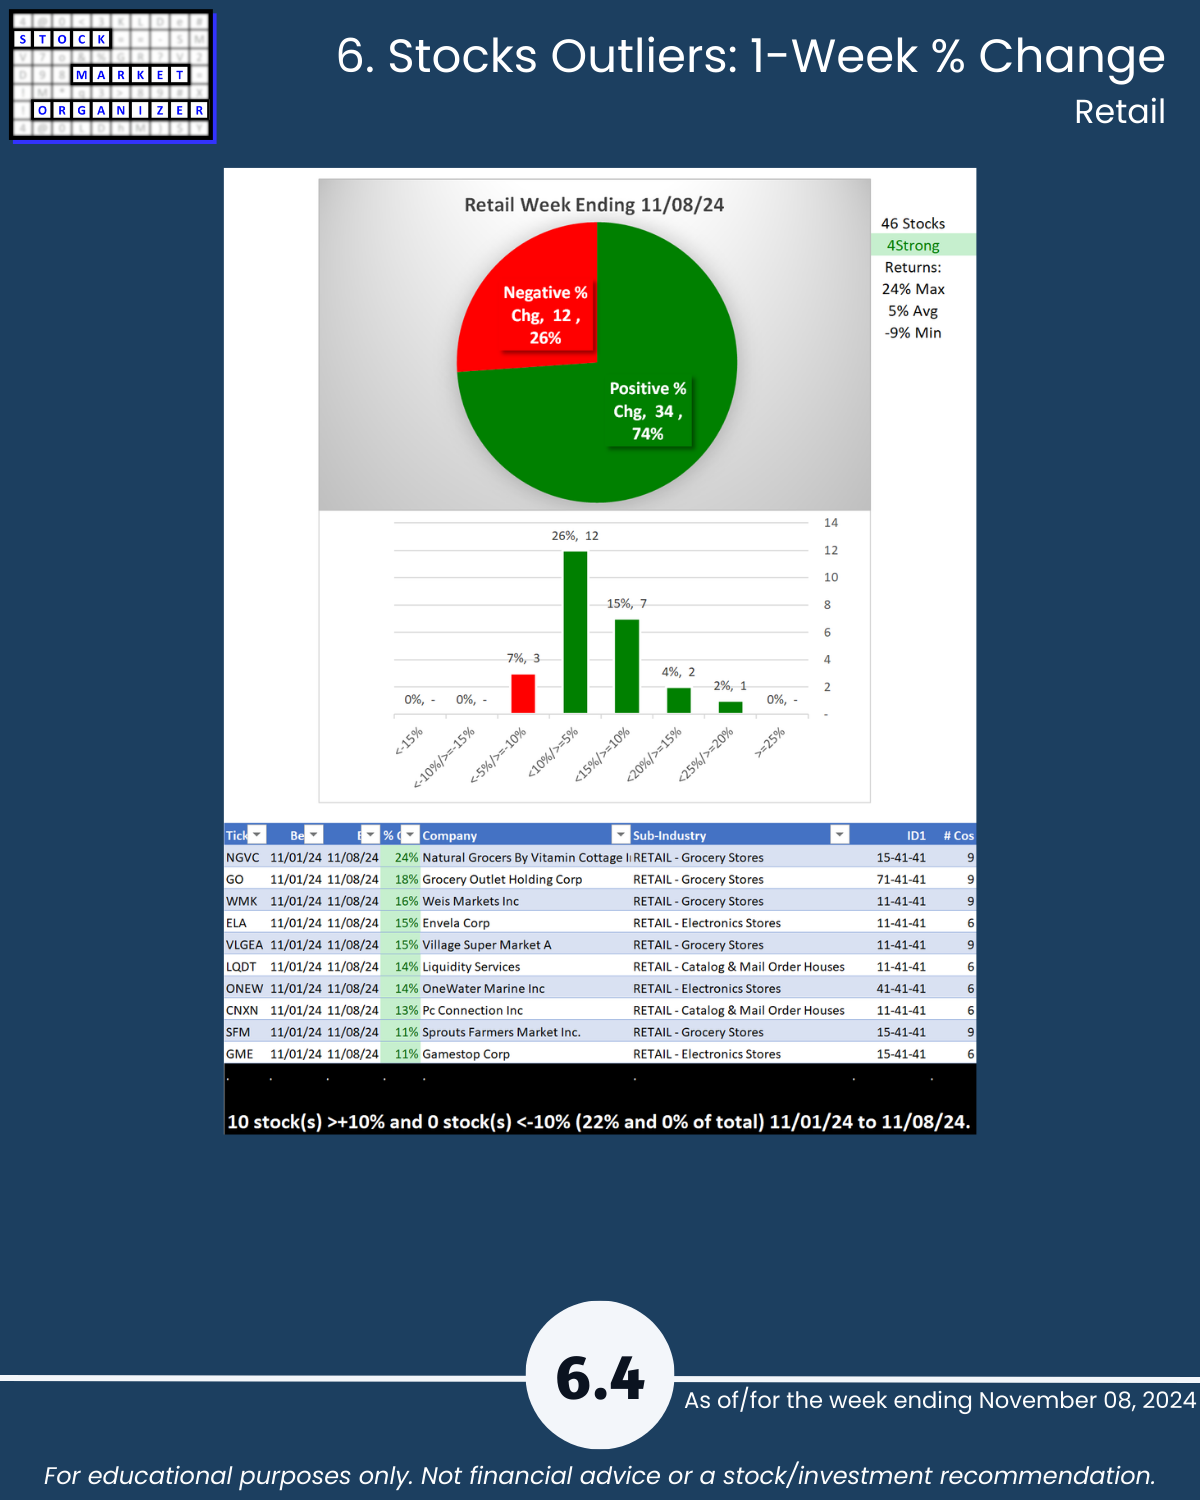
- Retail
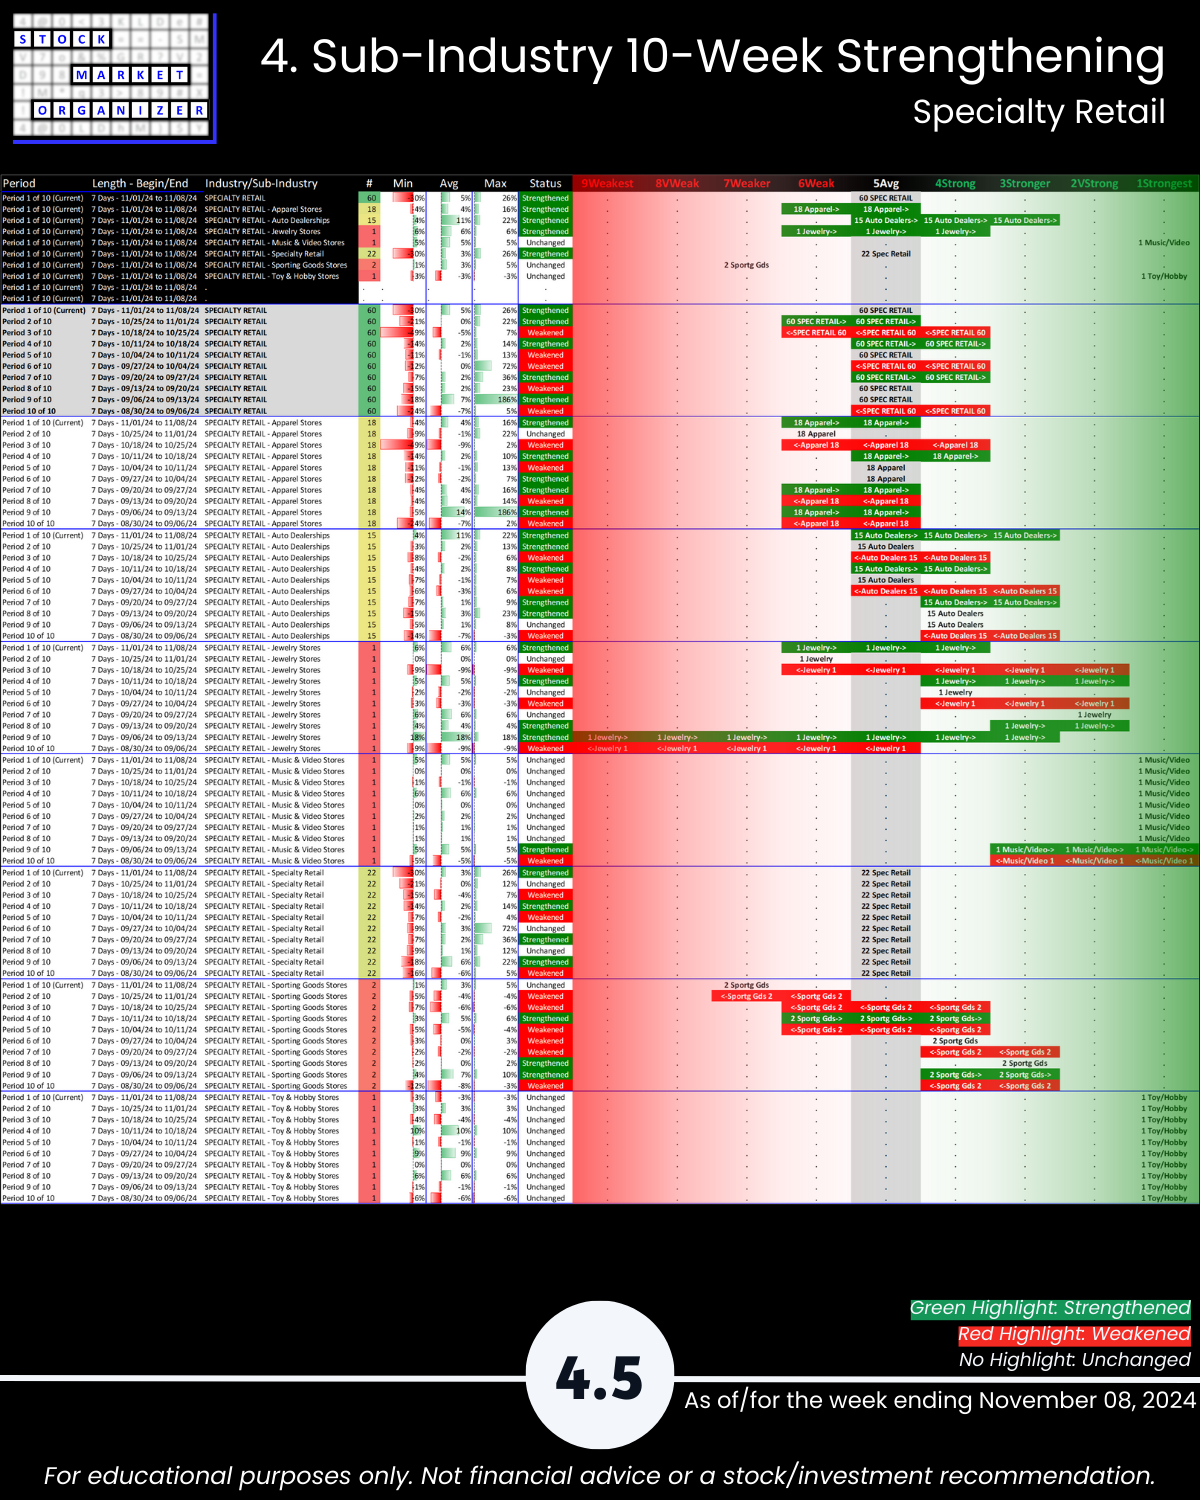
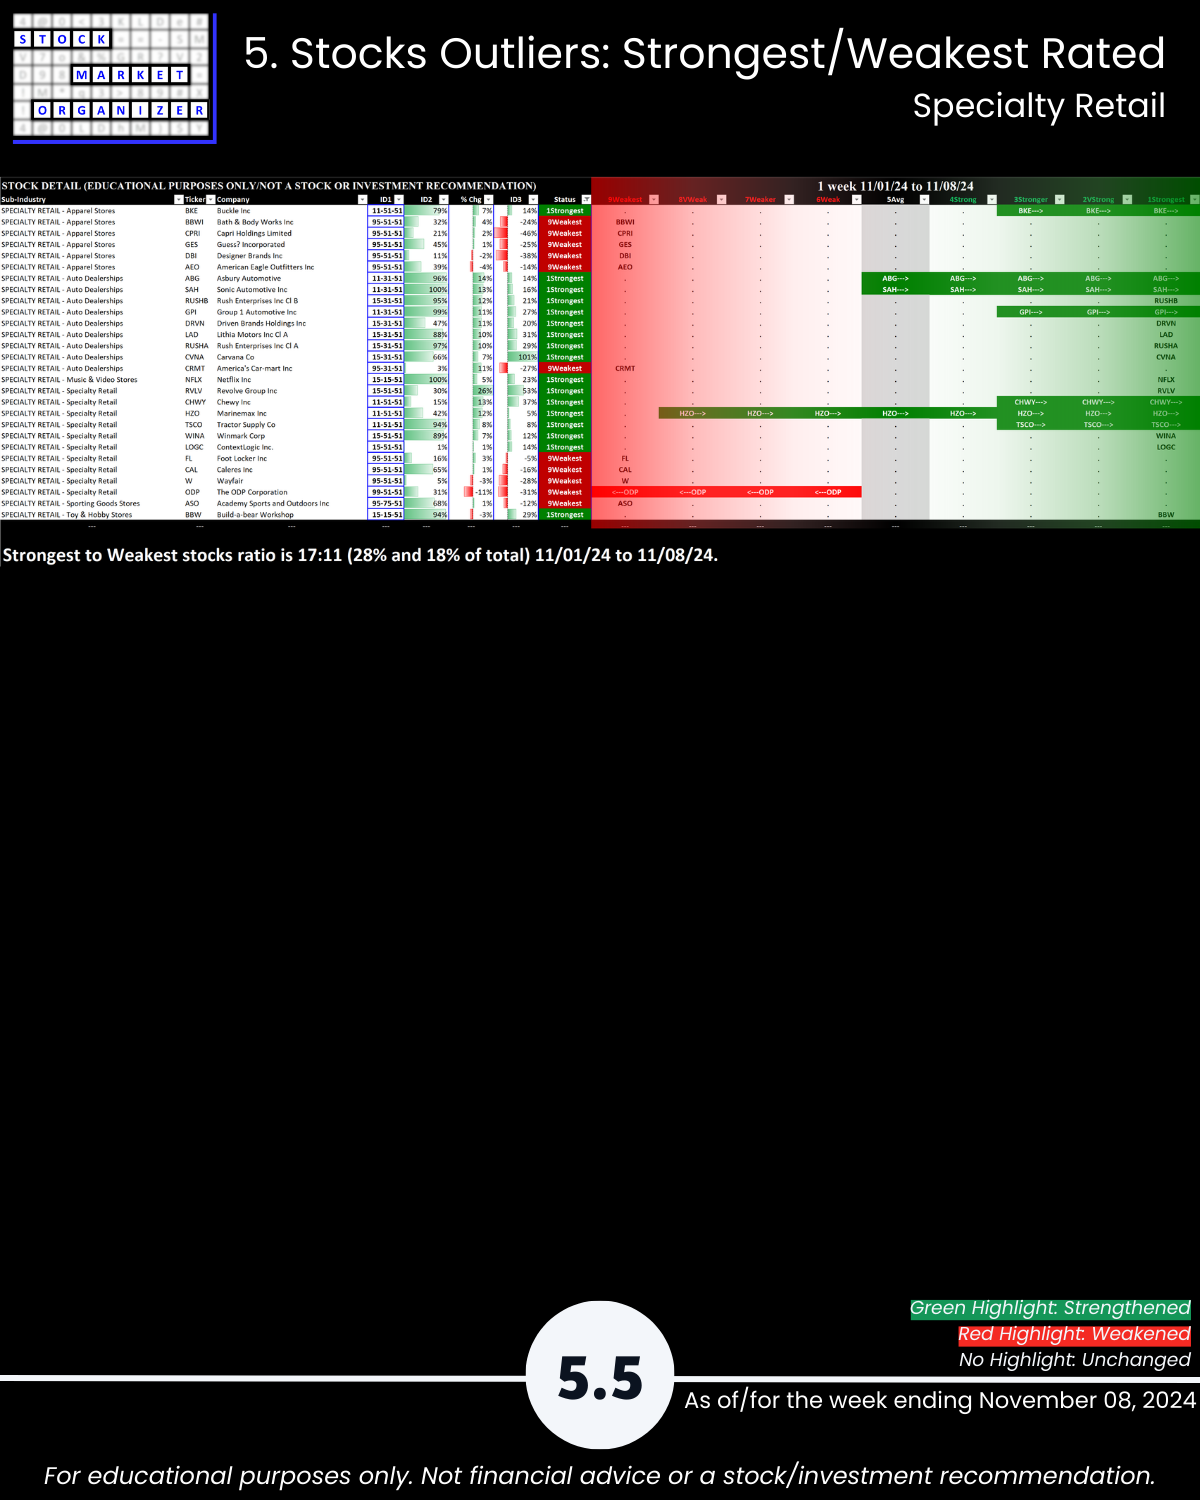
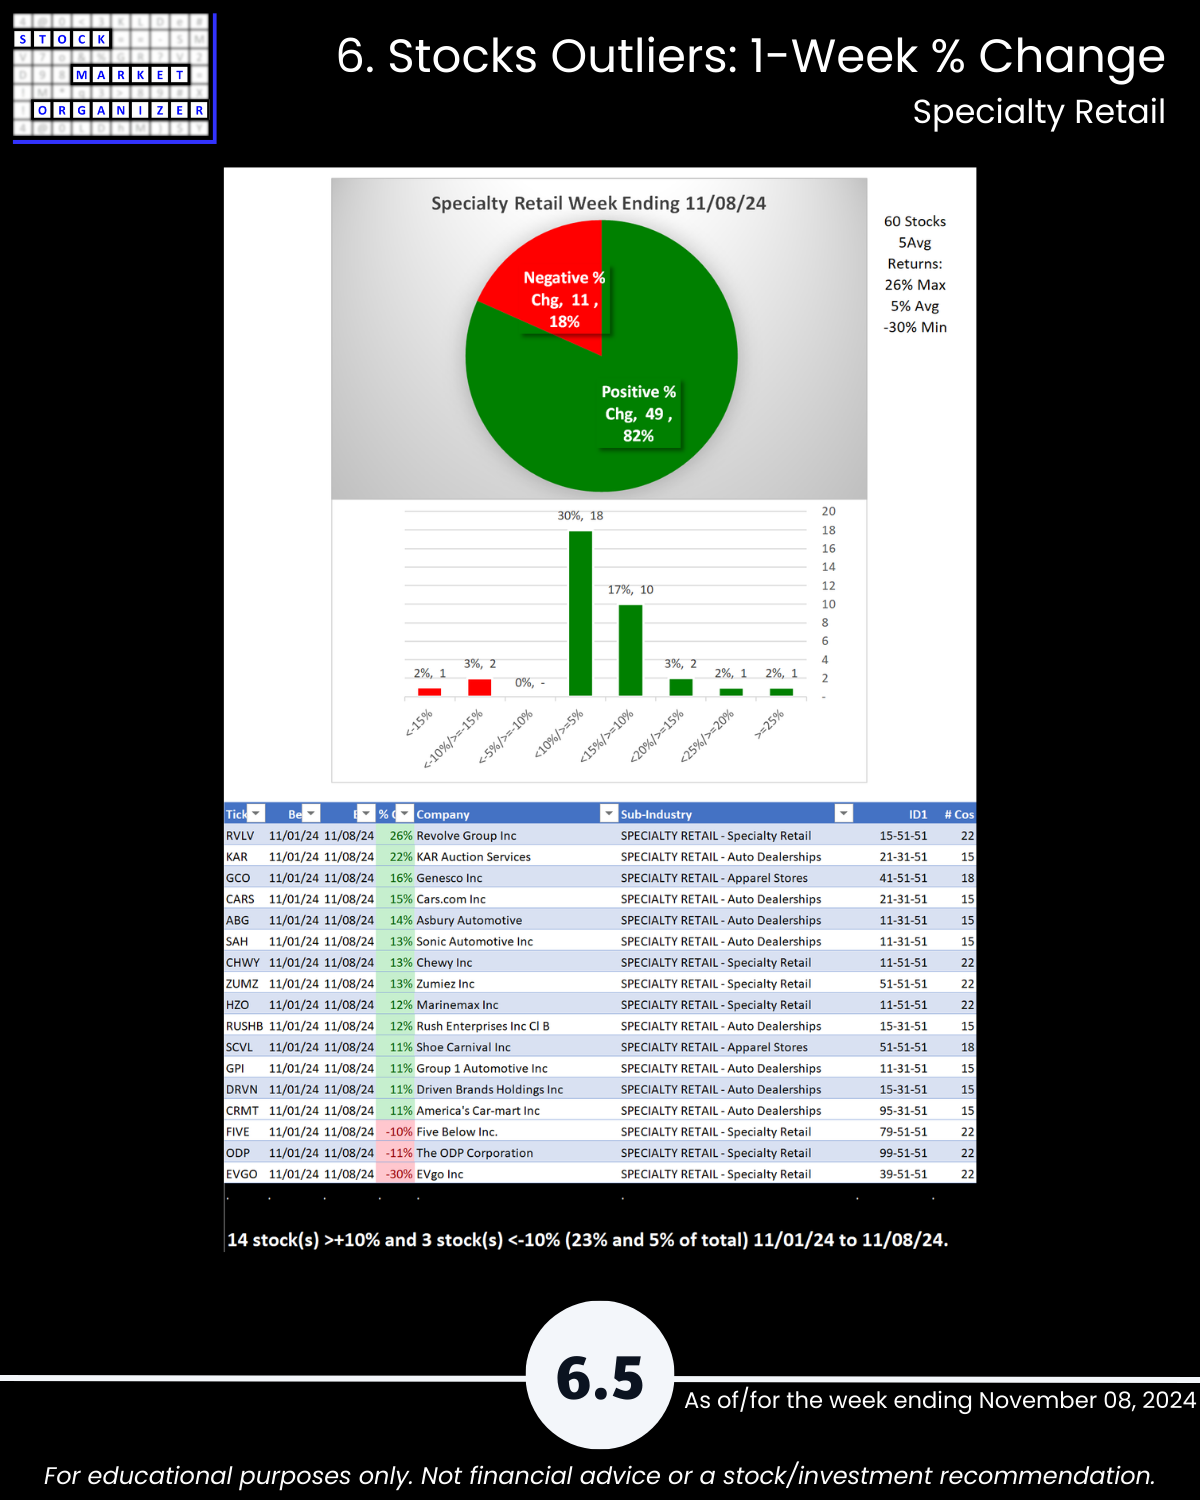
- Specialty Retail
Status
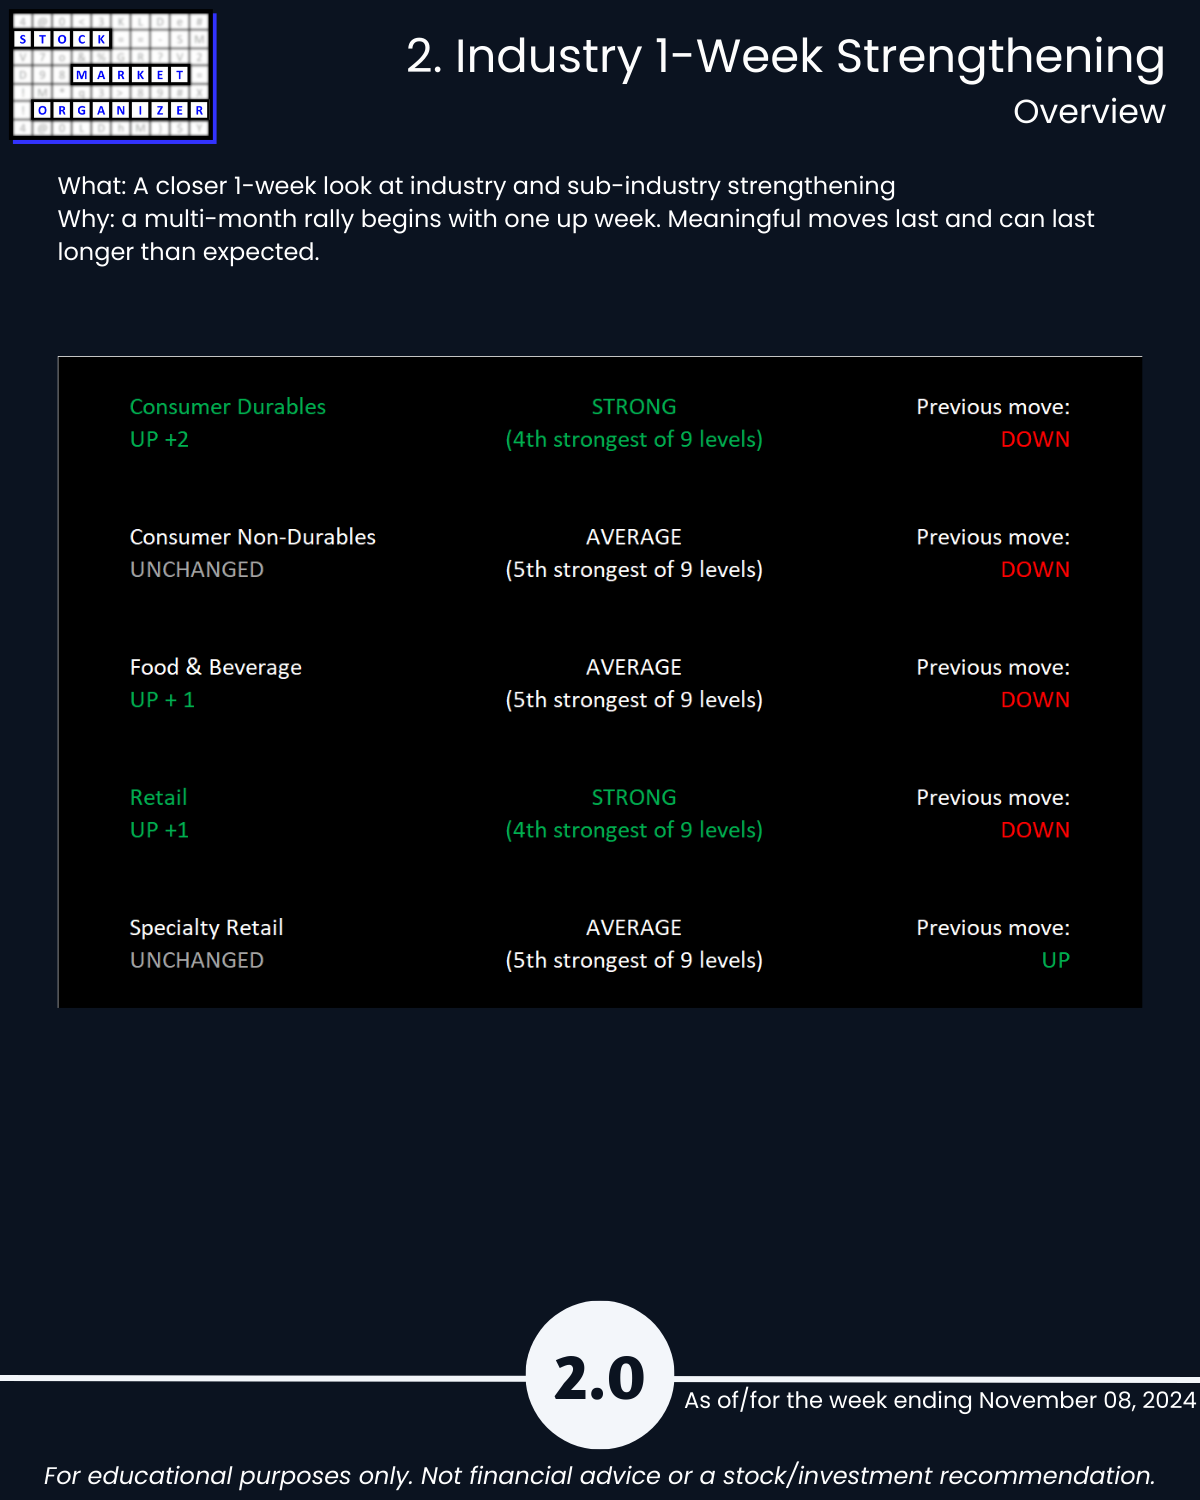
The Consumer Sector:
- Solidly strengthened this week by 0.7 points to a 4.7 composite strength score. This strength score is stronger than the 5Average.
- Consumer Durables strengthened two levels, one week after weakening one level, and is tied with Retail as strongest at 4Strong.
- Food & Beverage and Retail both strengthened one level.
Difference This vs. ETFs Analysis
Note this analysis is the same as that used for the SPDR ETFs (here's today's report Friday, November 8) but the two main differences are
1. Universe of stocks. The ETFs are the largest capitalization stocks, 500 of them in the 11 sector ETFs. In this analysis, there are approximately 2,700 stocks.
2. Sub-categorization below the market level. The ETF analysis with 500 stocks is limited to sector strengthening and weakening. This analysis with +/-2,700 stocks can be and is segregated into 29 industry groups and in turn 189 sub-industry groups.
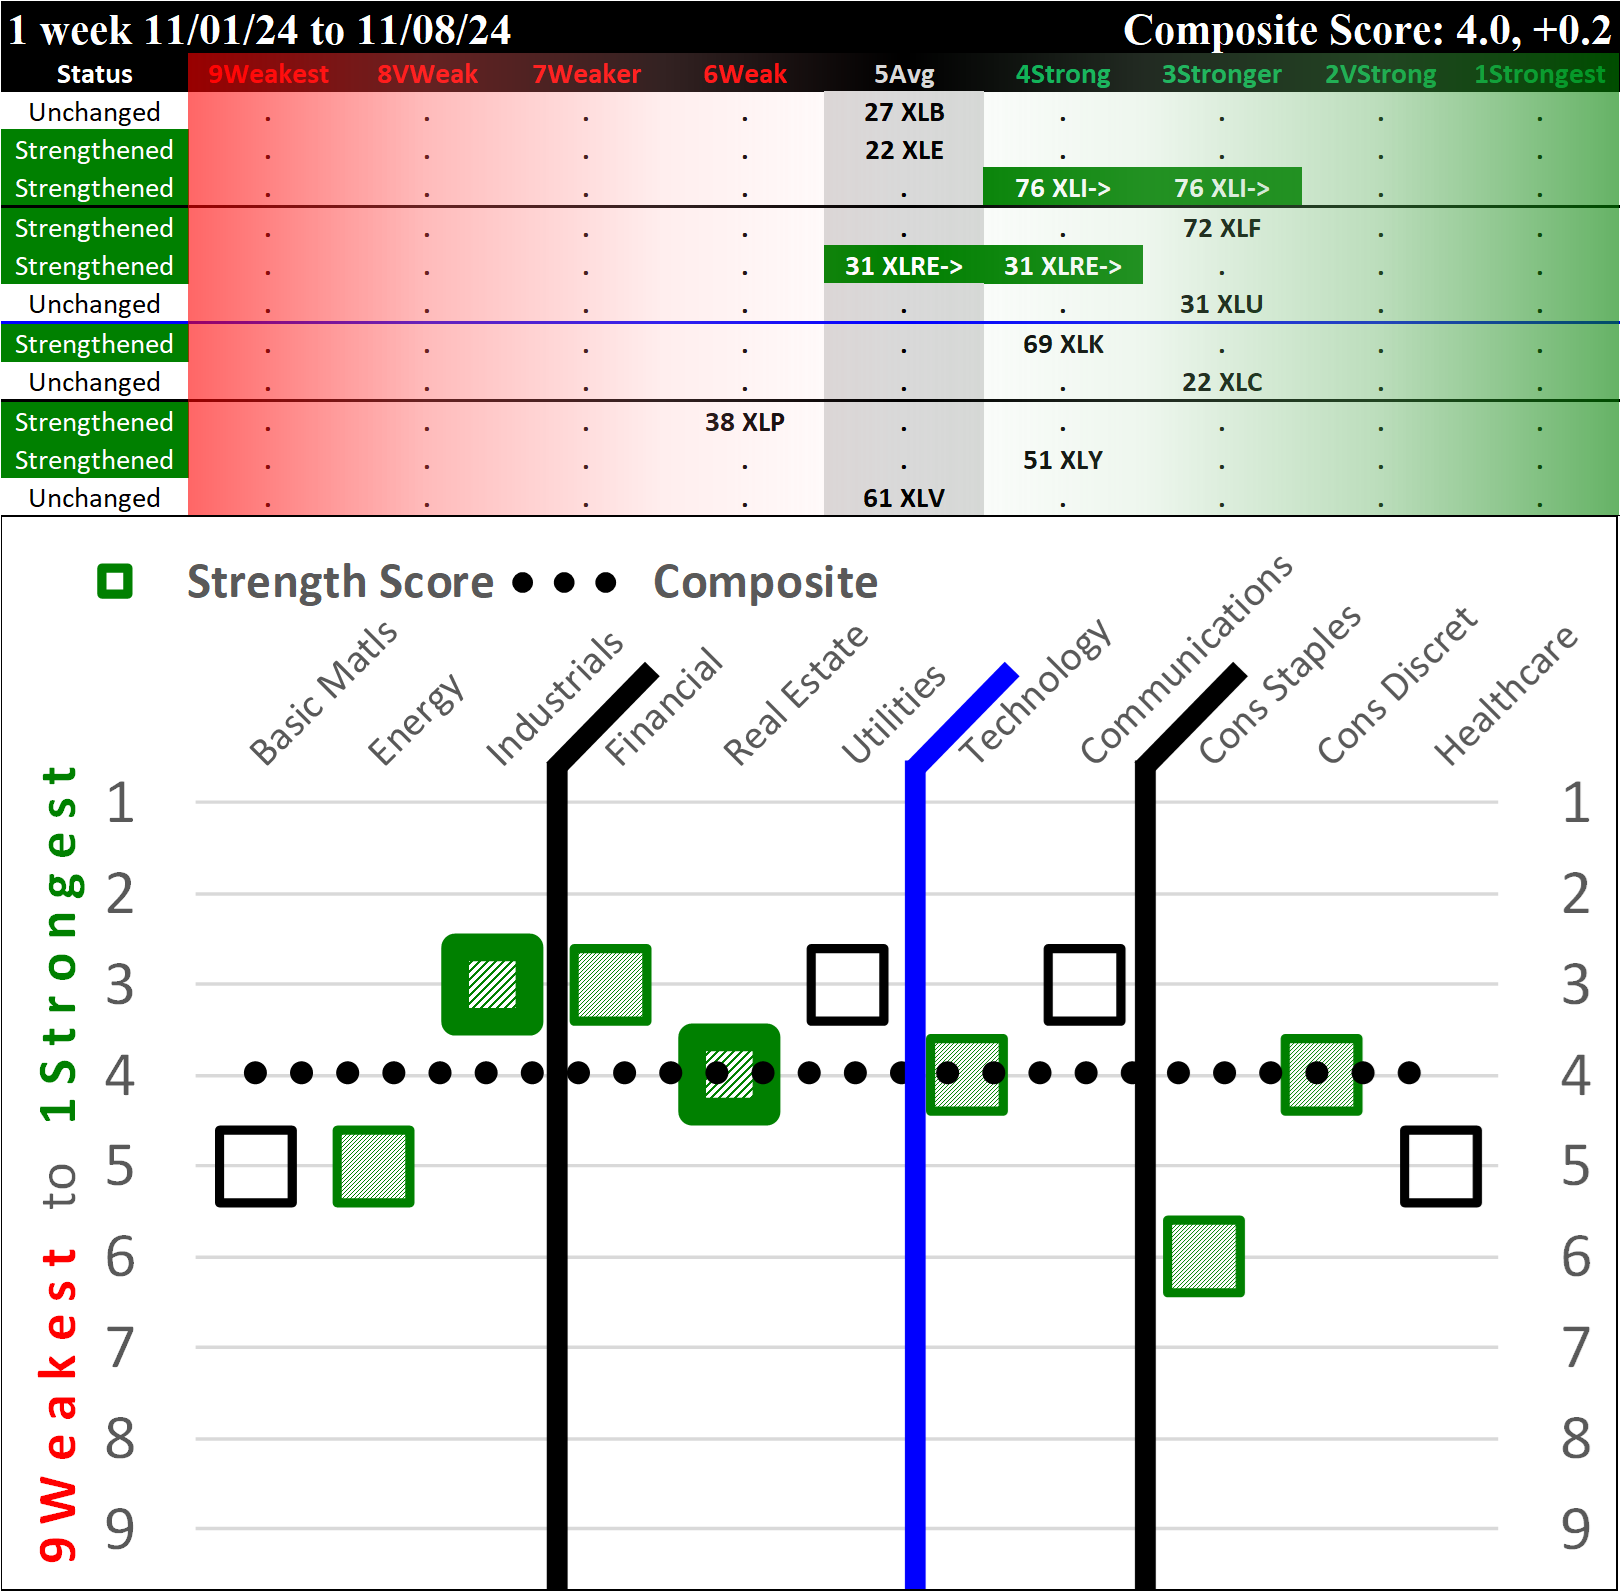
There are two Consumer ETFs - XLP/Consumer Staples and XLY/Consumer Discretionary. See below for their current standing relative to the 9 other ETFs:
How would I use this information?
The Market Strength Score is now positive and the two relevant sector ETFs (XLP/Consumer Staples and XLY/Consumer Discretionary) strengthened for the week ending yesterday.
Between the two, XLP/Consumer Staples at 6Weak is weaker than XLY/Consumer Discretionary at its 4Strong rating.
Based on this analysis of the larger stock universe, the Consumer Sector strengthened over the past week. This more broad analysis concurs with the strengthening reflected in the Consumer ETF analysis.
Both ETFs offer new long opportunities for available capital given their strengthening and the overall positive Market Strength Score environment. Others may differ, but I prefer to stack strength so in this environment I'd be focused on 1Strongest stocks. Below is the current detail from the two Consumer Sector ETFs, including a listing of all component stocks showing their ratings from 1Strongest to 9Weakest:
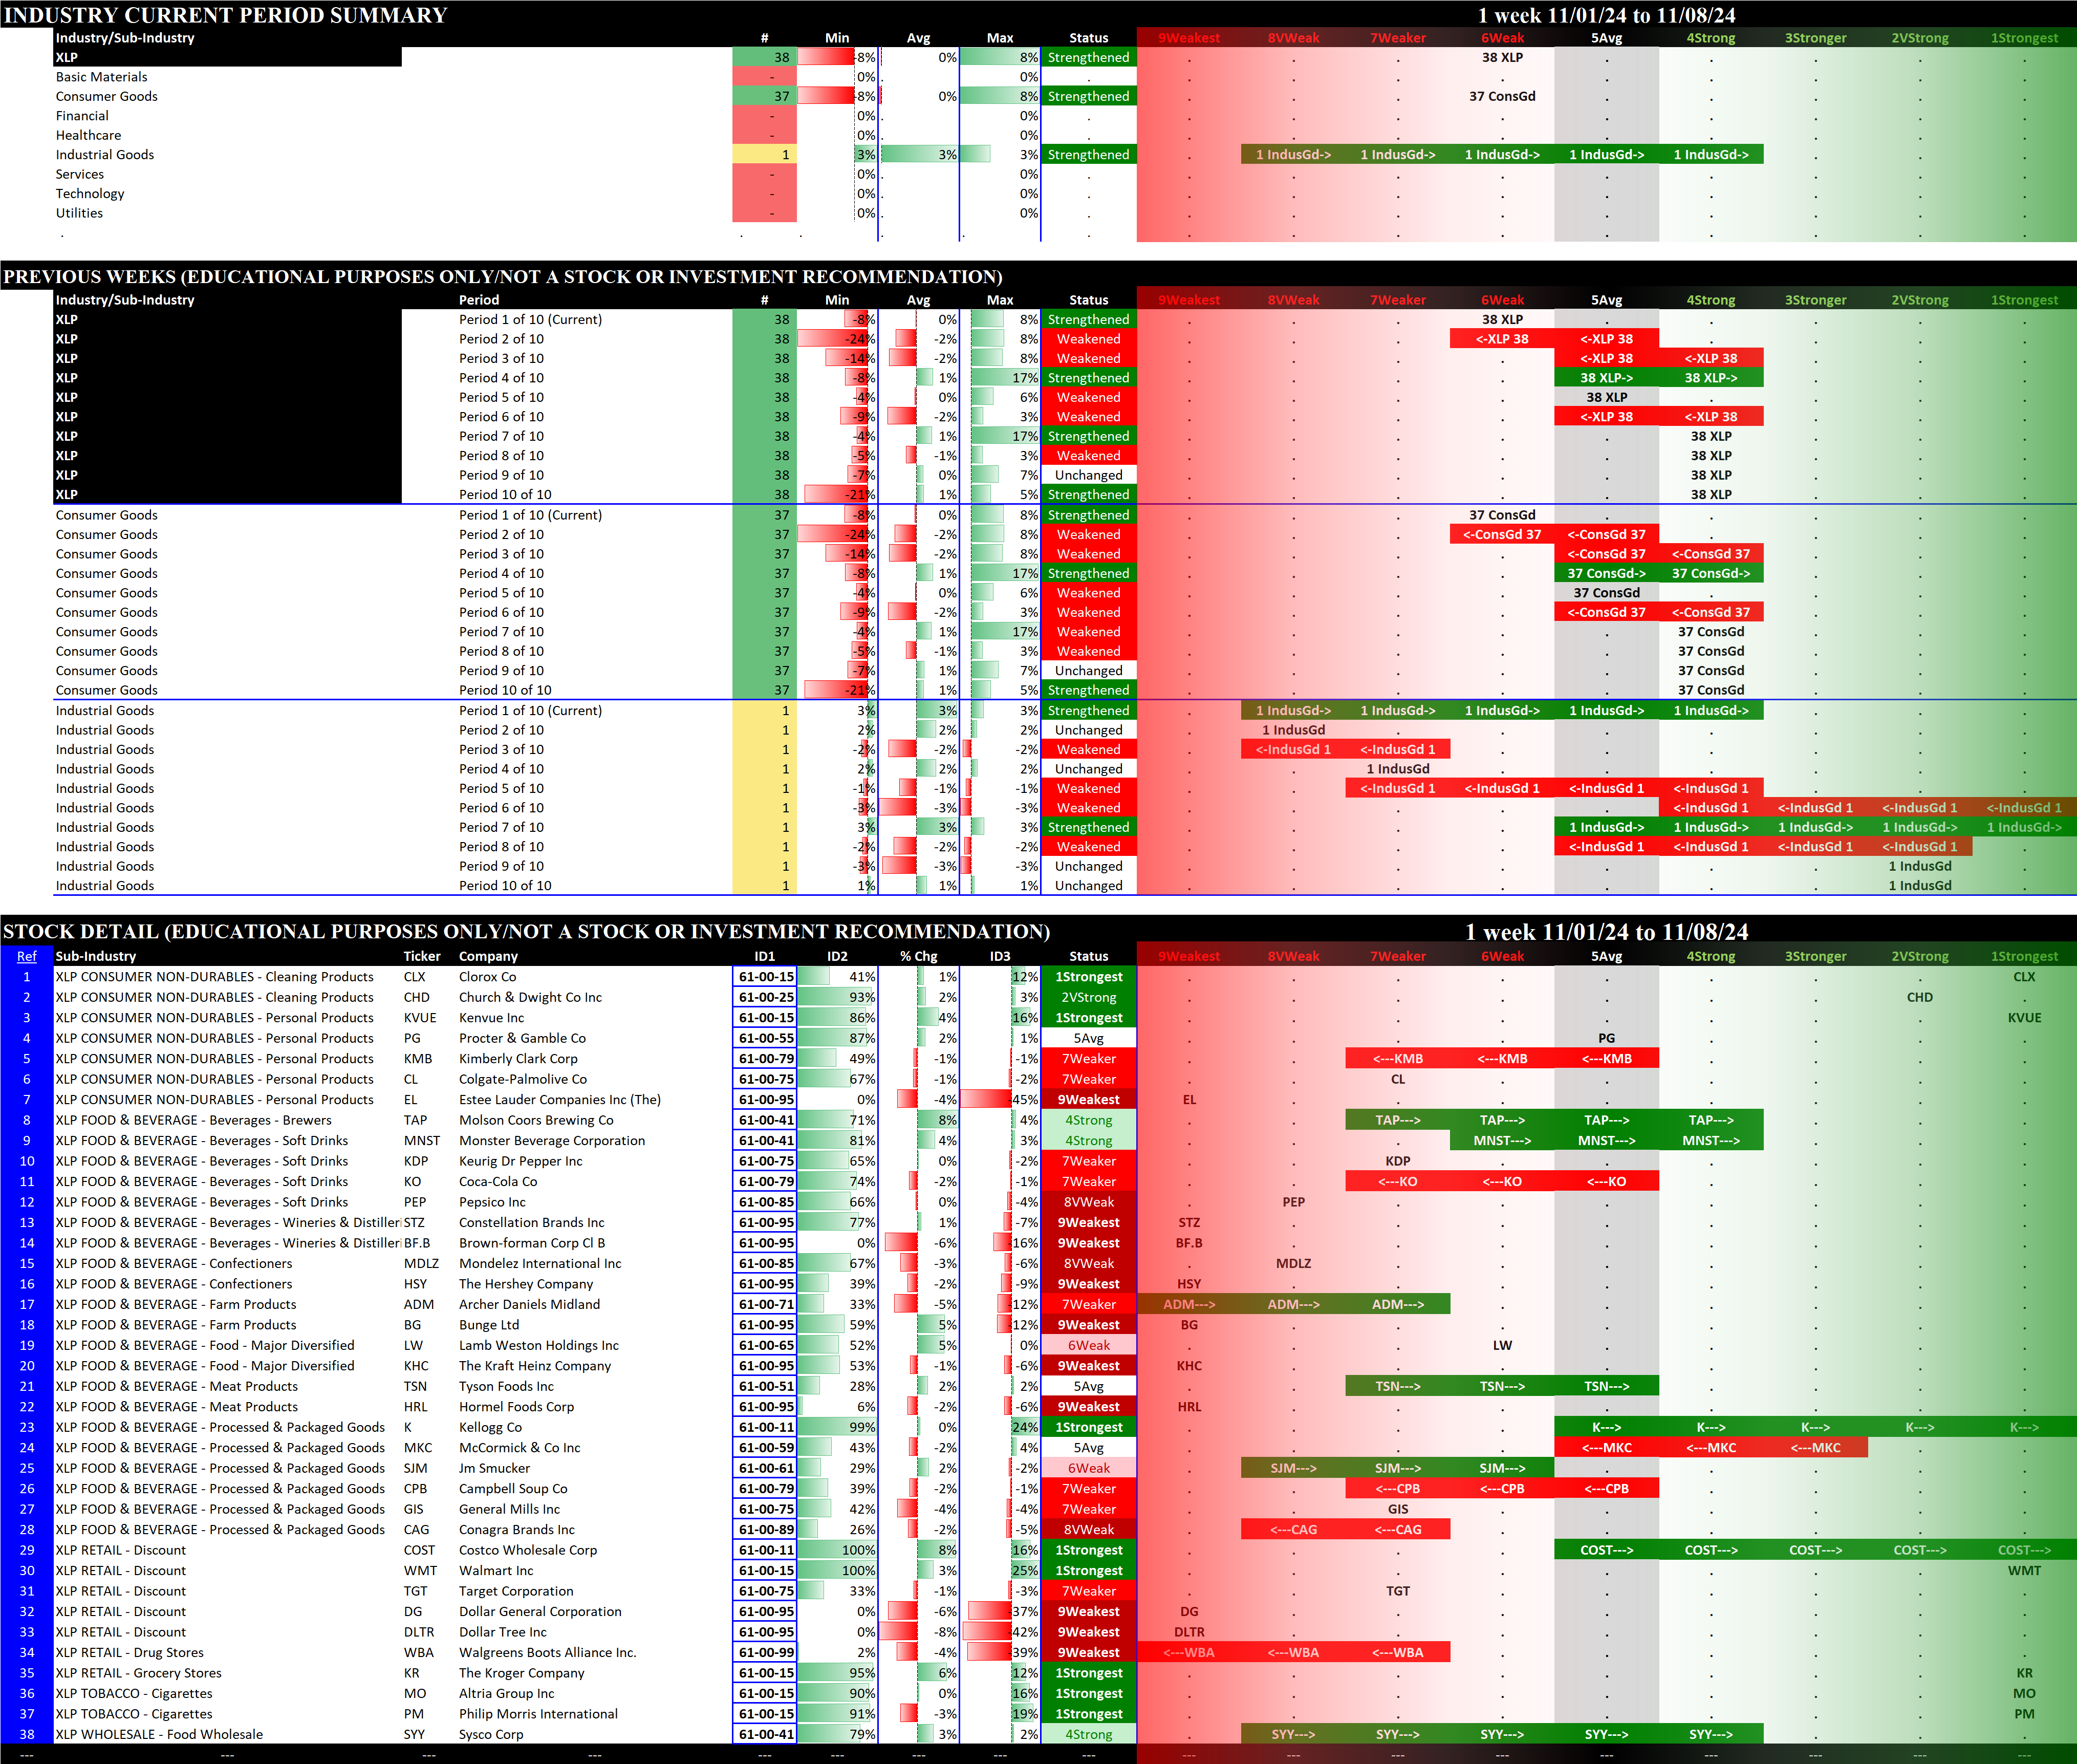
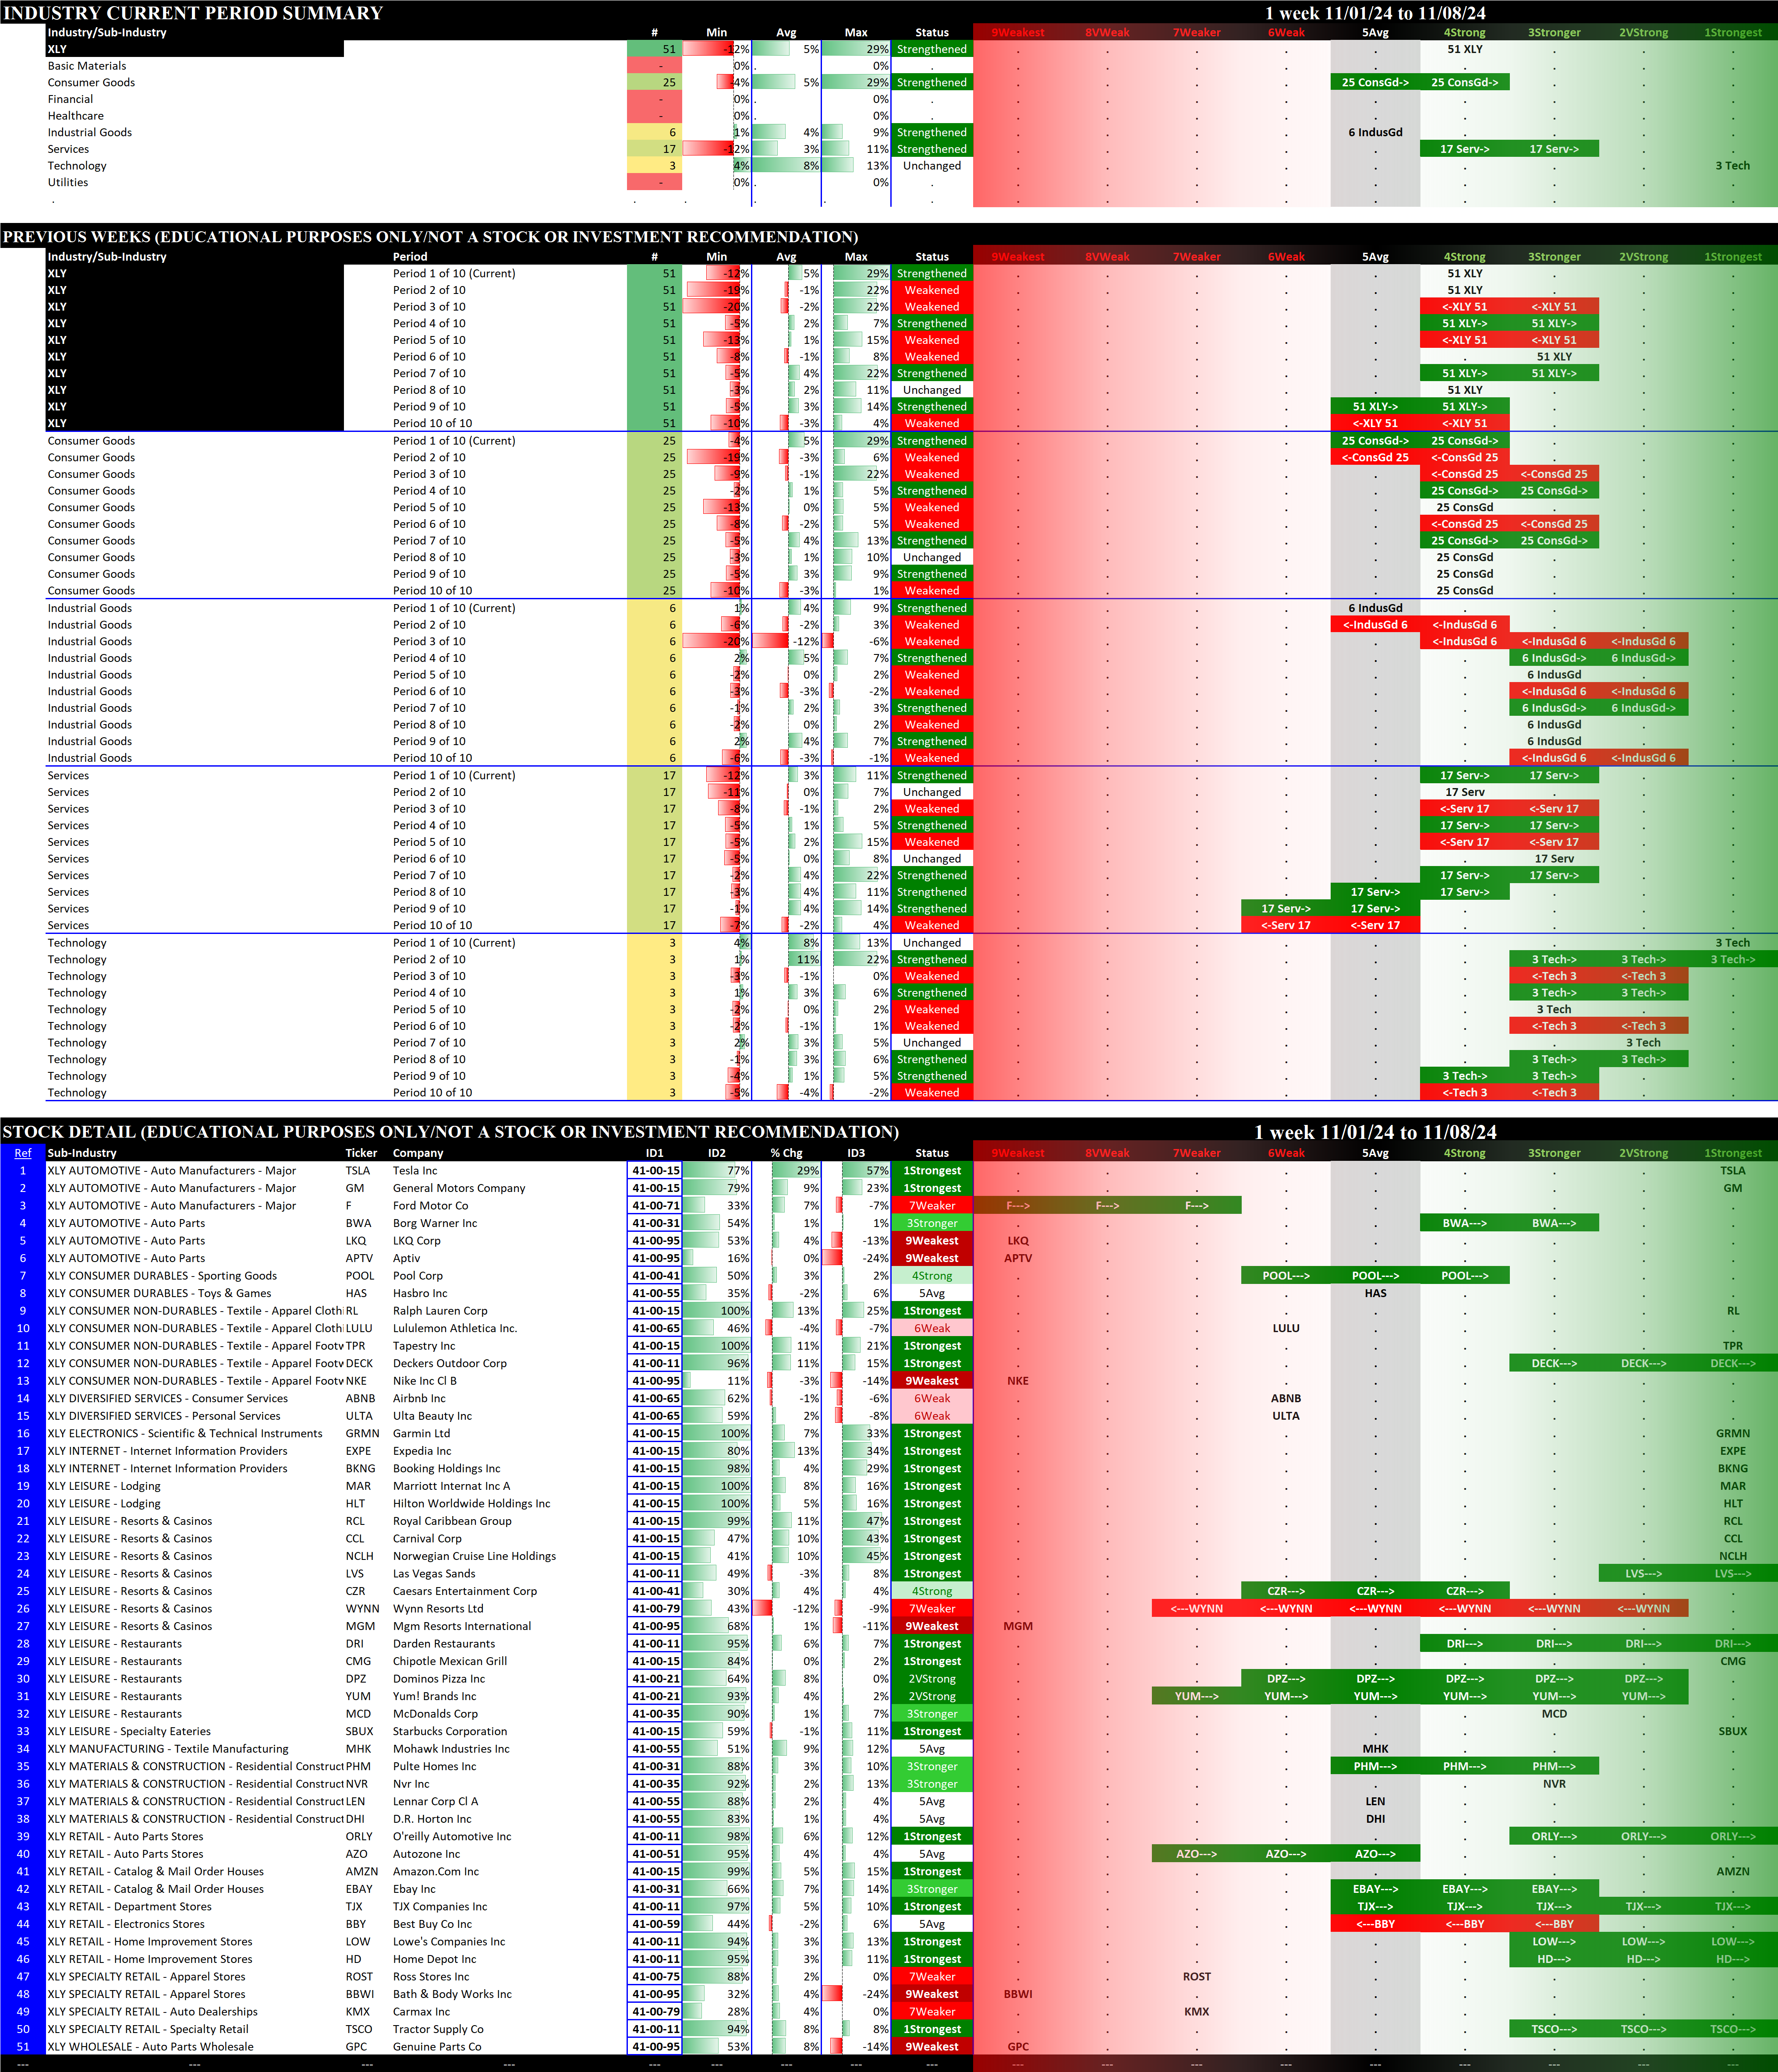
The XLP/Consumer Staples detail shows a mix of strengthening (6) and weakening stocks (6). Meanwhile, XLY/Consumer Discretionary shows a much higher proportion of strengthening vs. weakening stocks at 17:2. While both ETFs strengthened this week, this "under the hood" look reveals a broader level of strengthening in XLY, which likely contributes to its stronger overall rating at 4Strong vs. 6Weak for XLP.
There is absolutely no way of determining how long this environment will last. All one can do is find an objective way of measuring whether any given environment offers headwinds or tailwinds and then act accordingly based on these measurements.
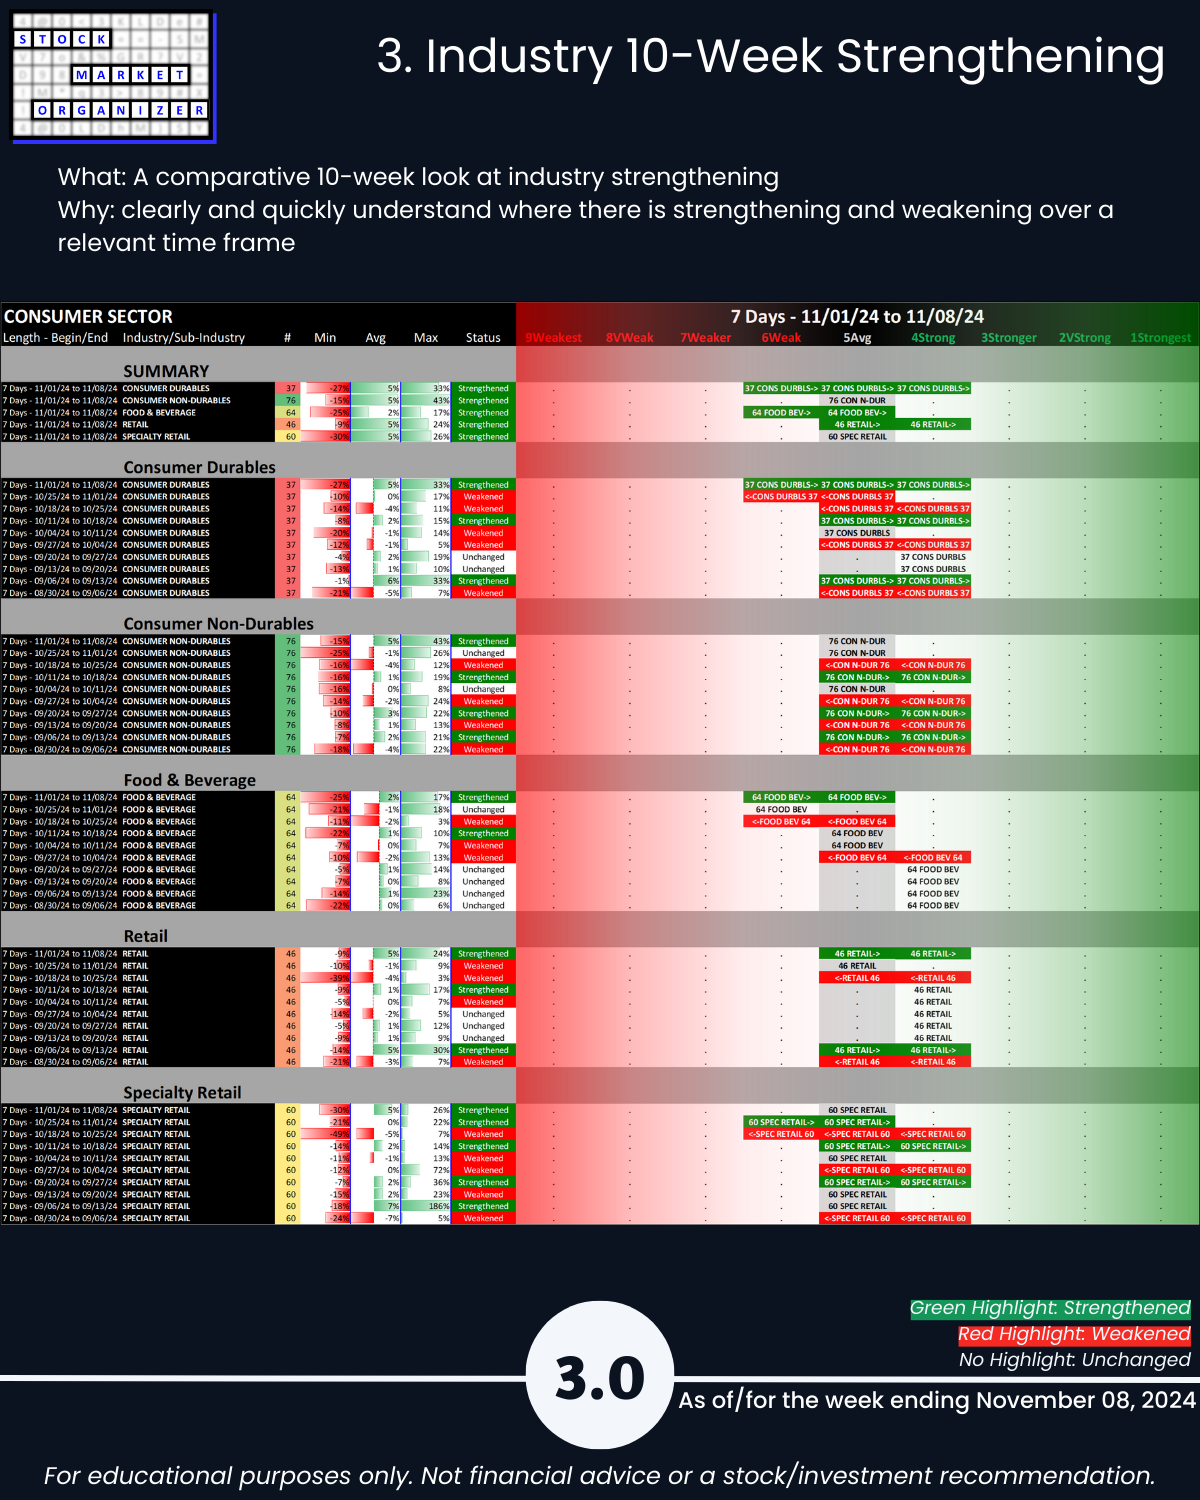
Details are below shown in a manner not available elsewhere because I created it from scratch to continually answer this question: “Where is there strengthening and weakening in the market at the stock, sub-industry, industry, and sector levels?” Combine this with the top-down Market Strength Score and Sector Risk Gauge to get a key competitive advantage of understanding strength at every level.
1. Introduction
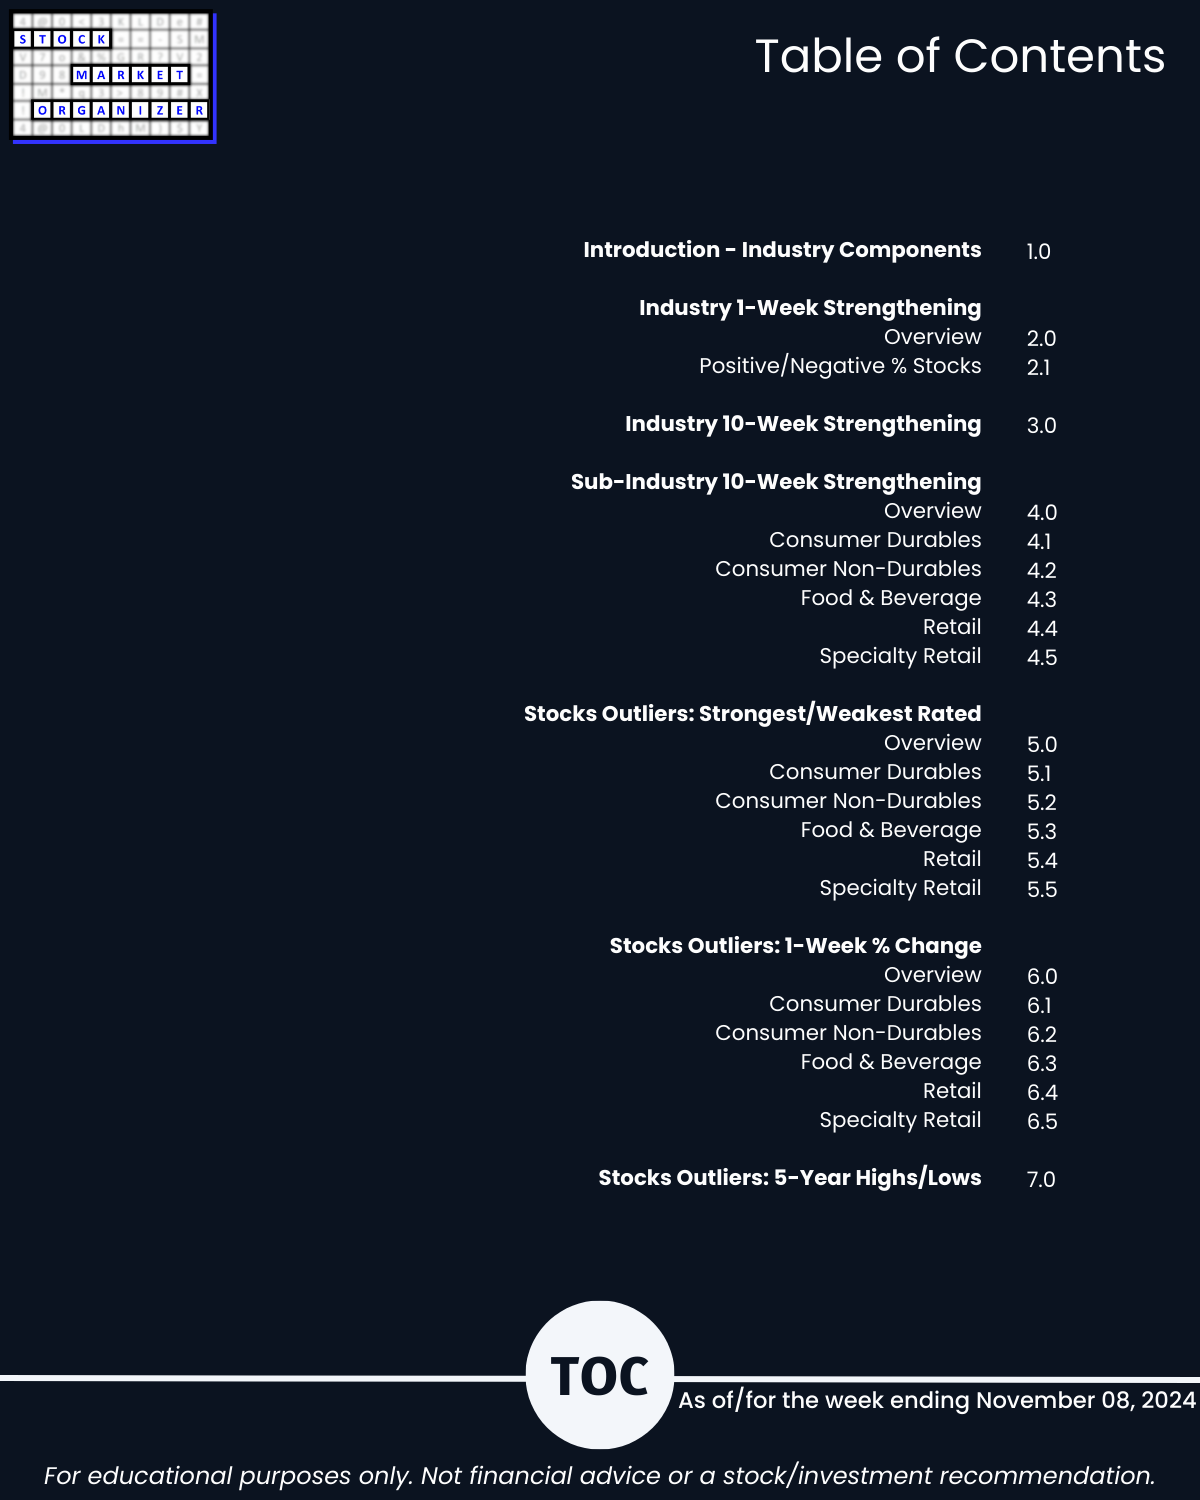
2. Industry 1-Week Strengthening
3. Industry 10-Week Strengthening
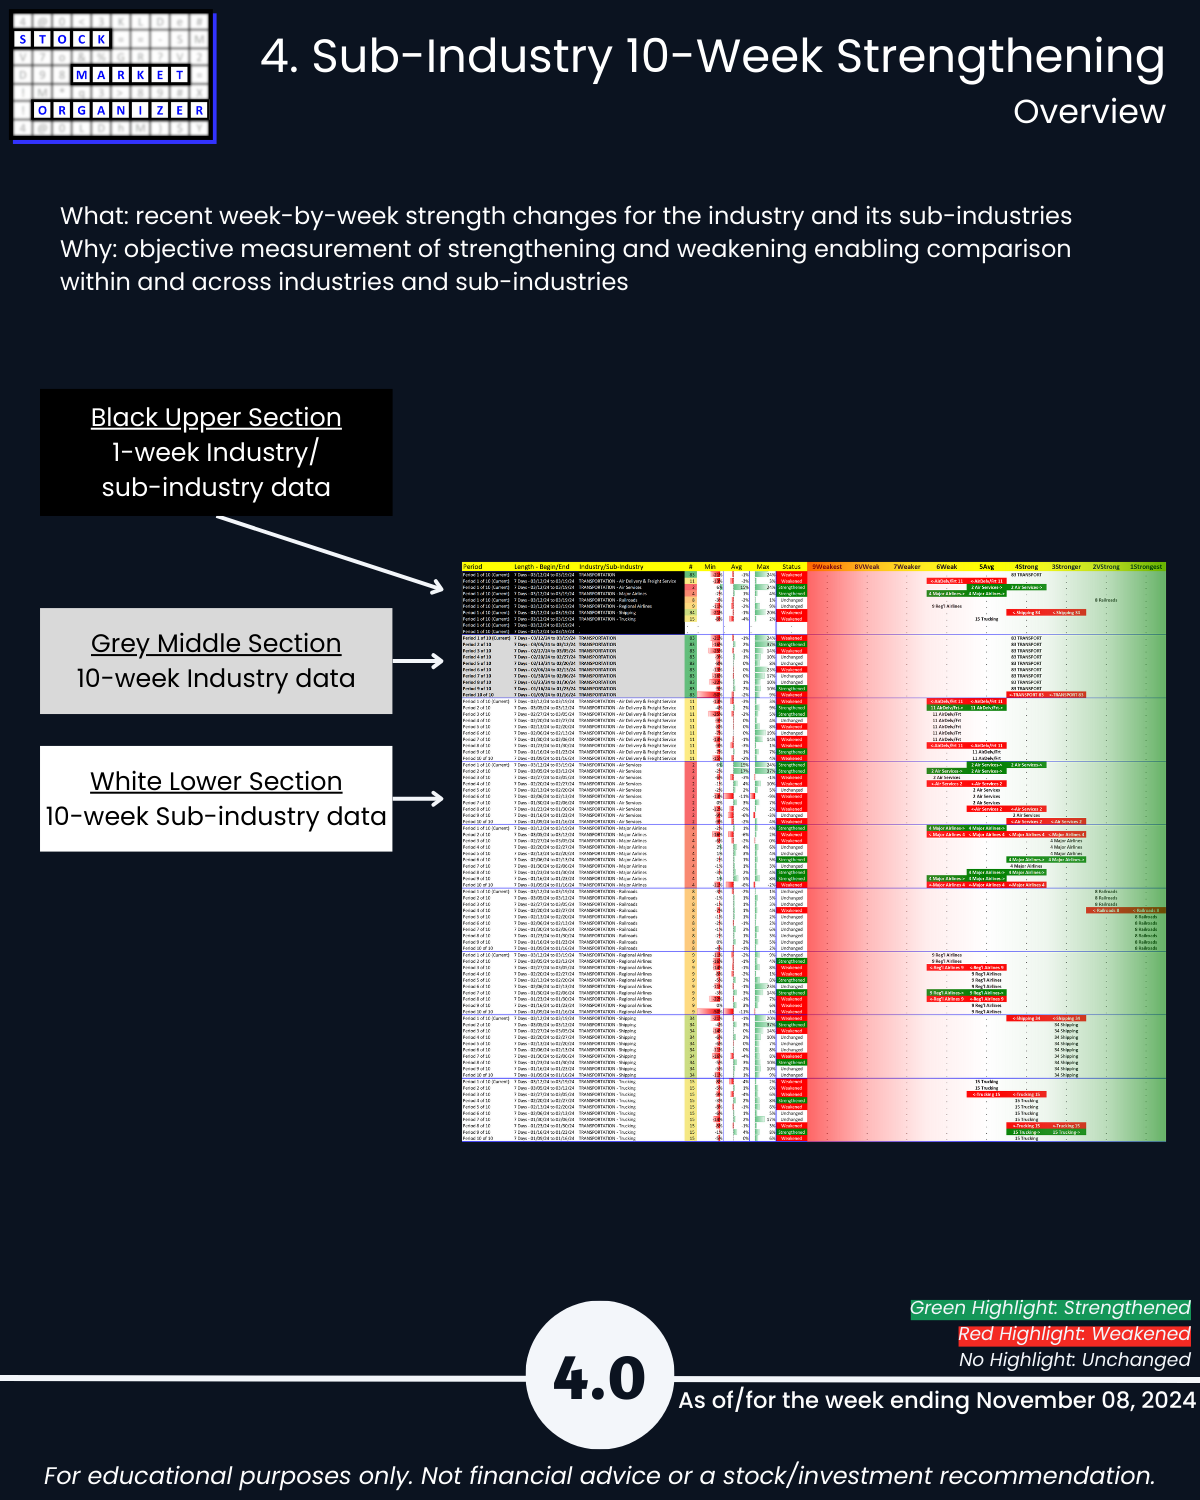
4. Sub-Industry 10-Week Strengthening
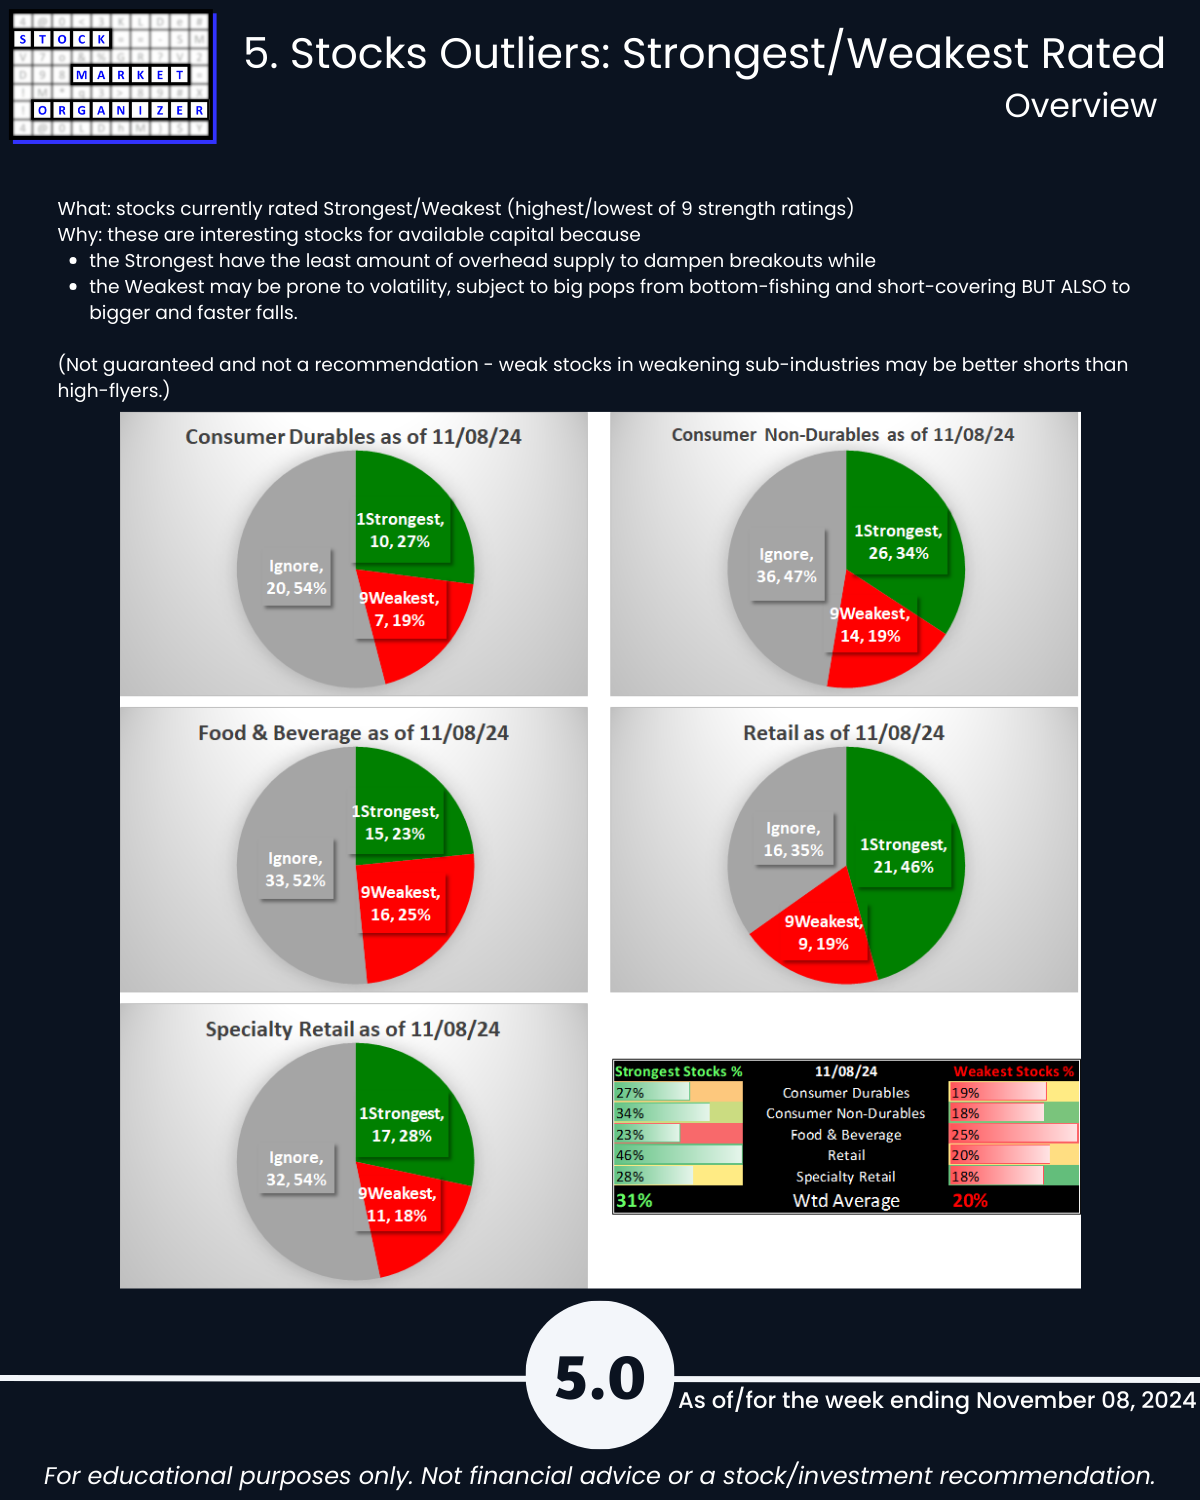
5. Stocks Outliers: Strongest/Weakest Rated
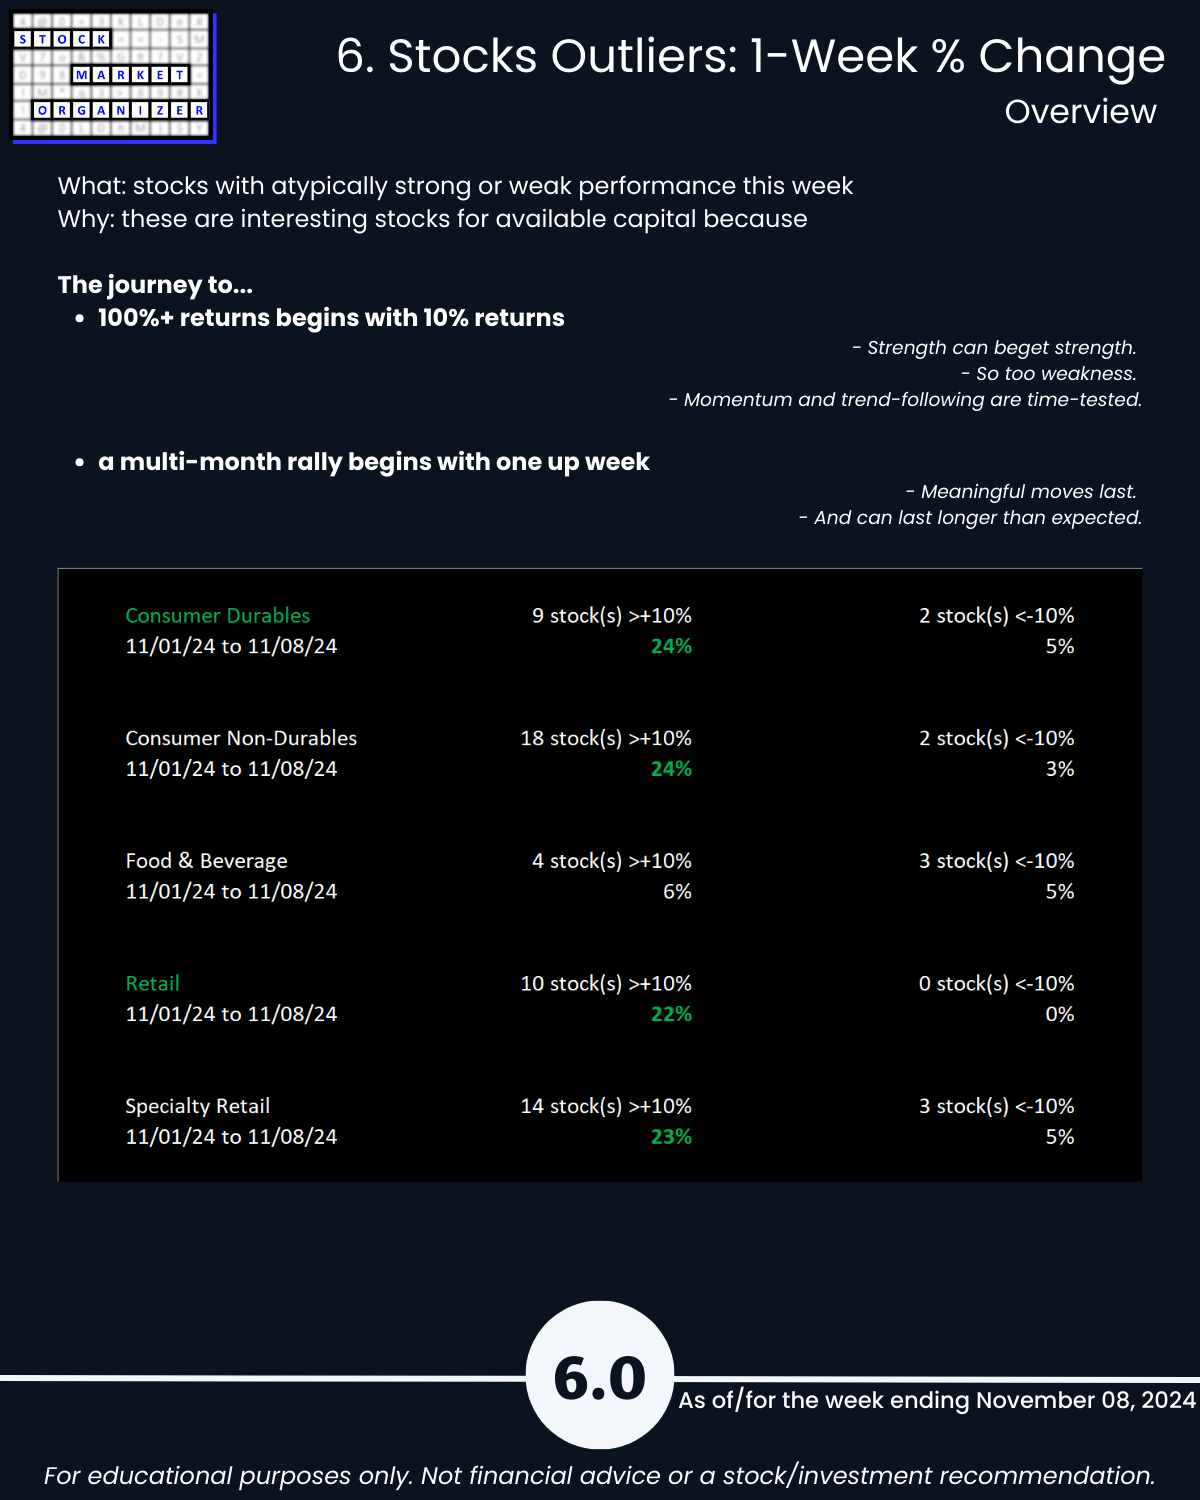
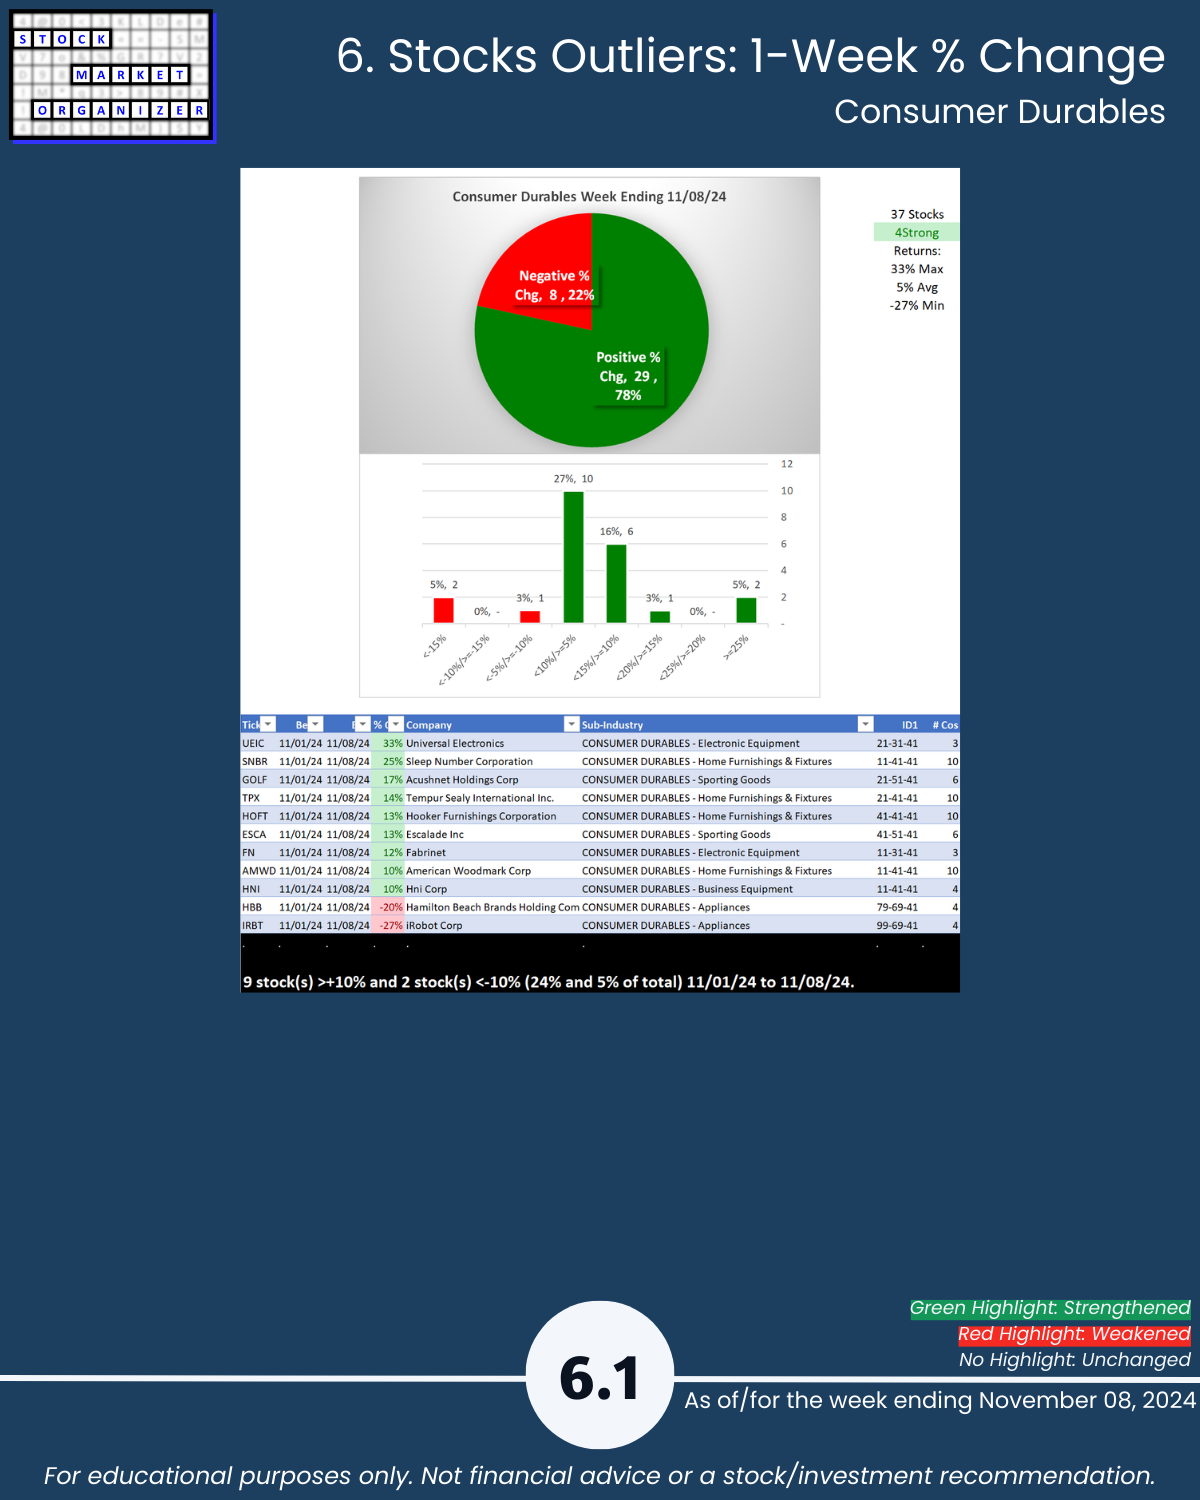
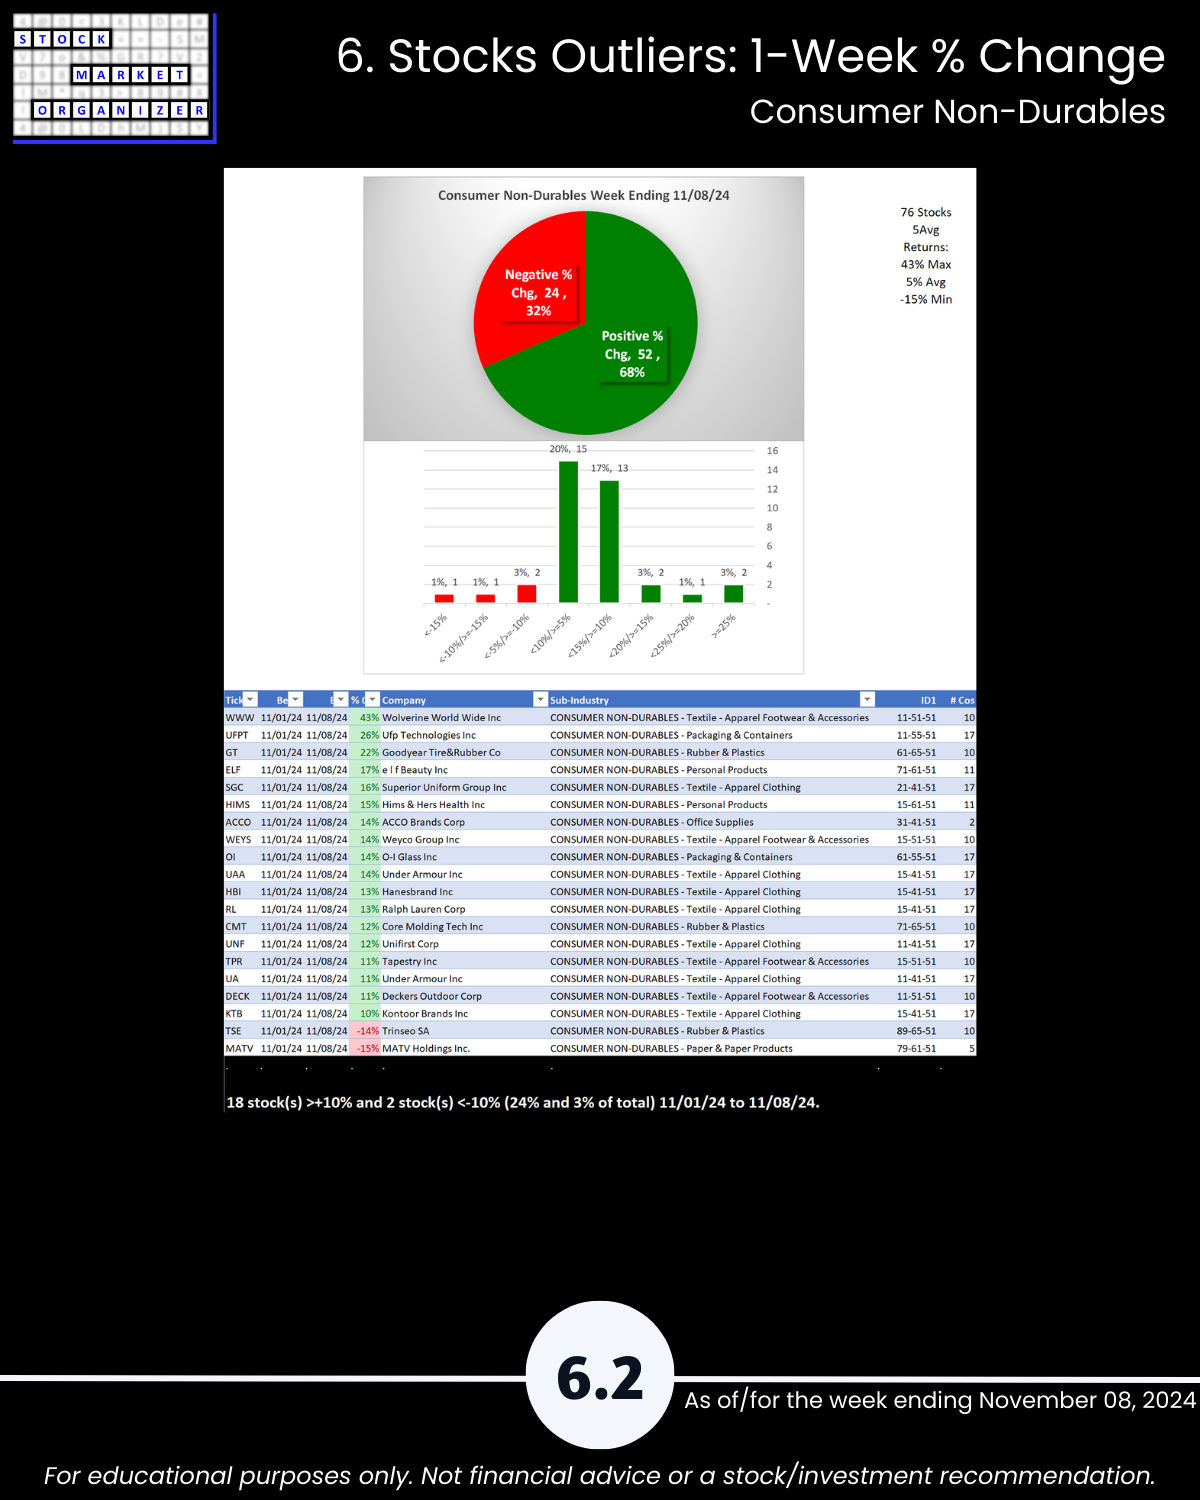
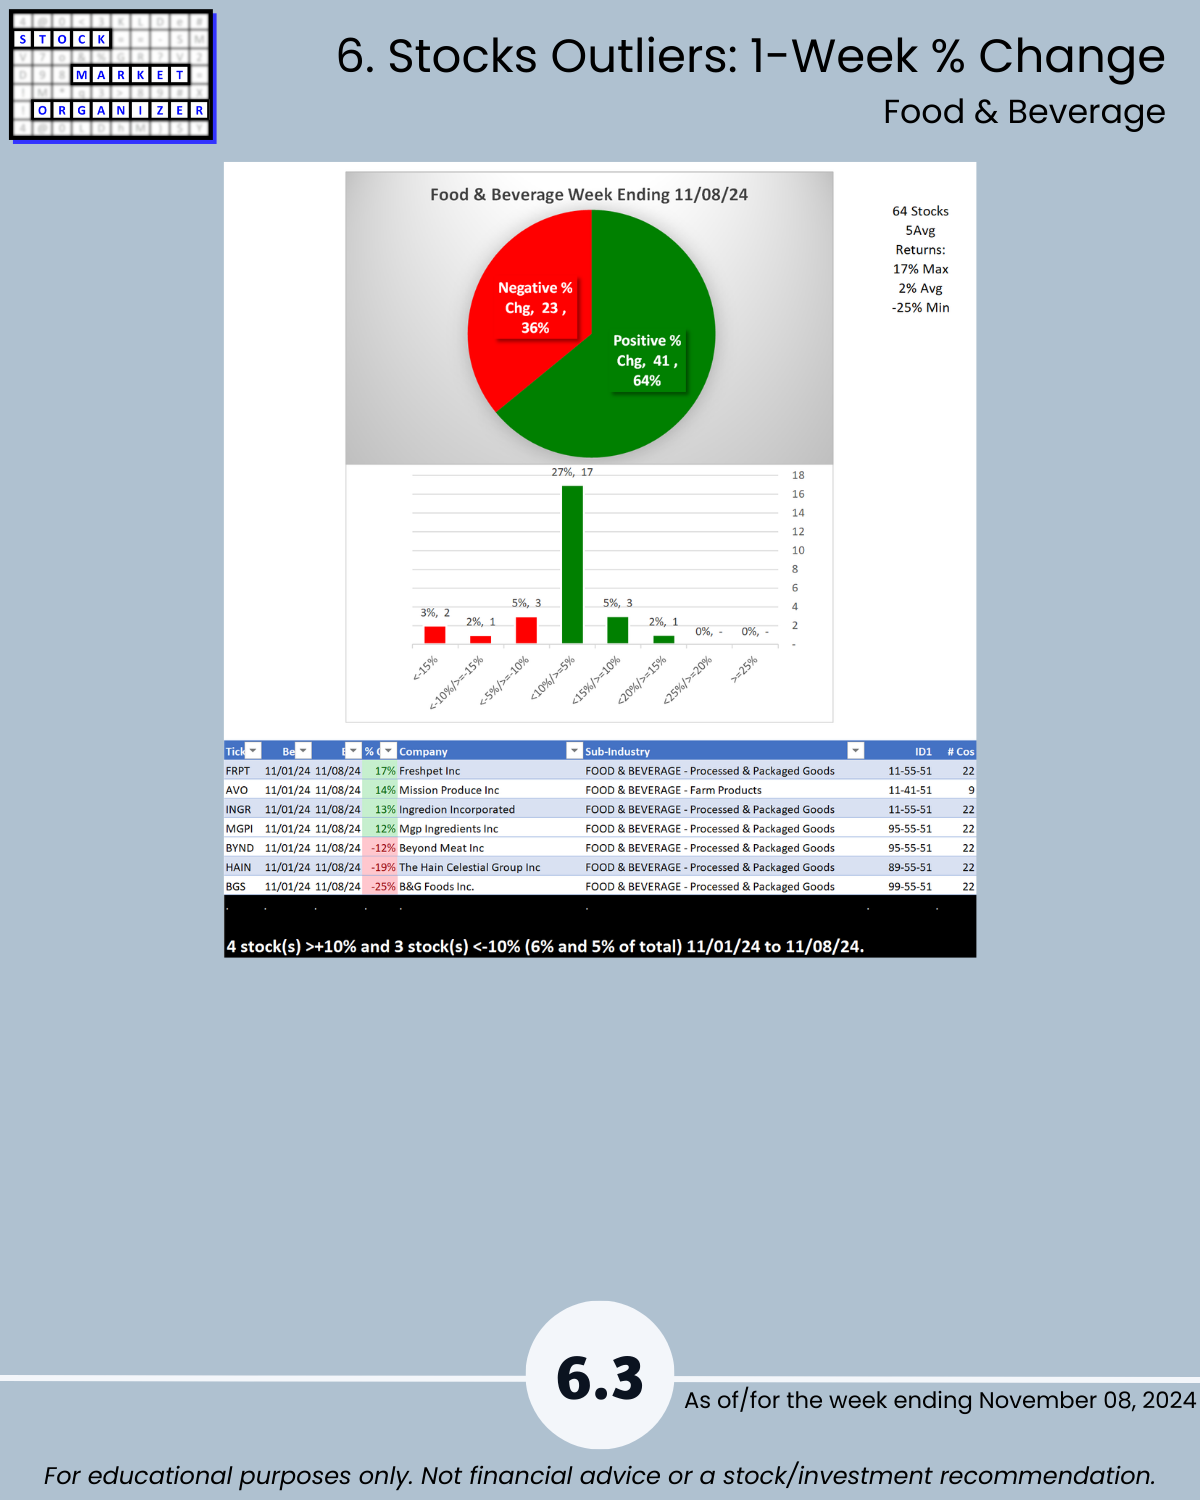
6. Stocks Outliers: 1-Week % Change
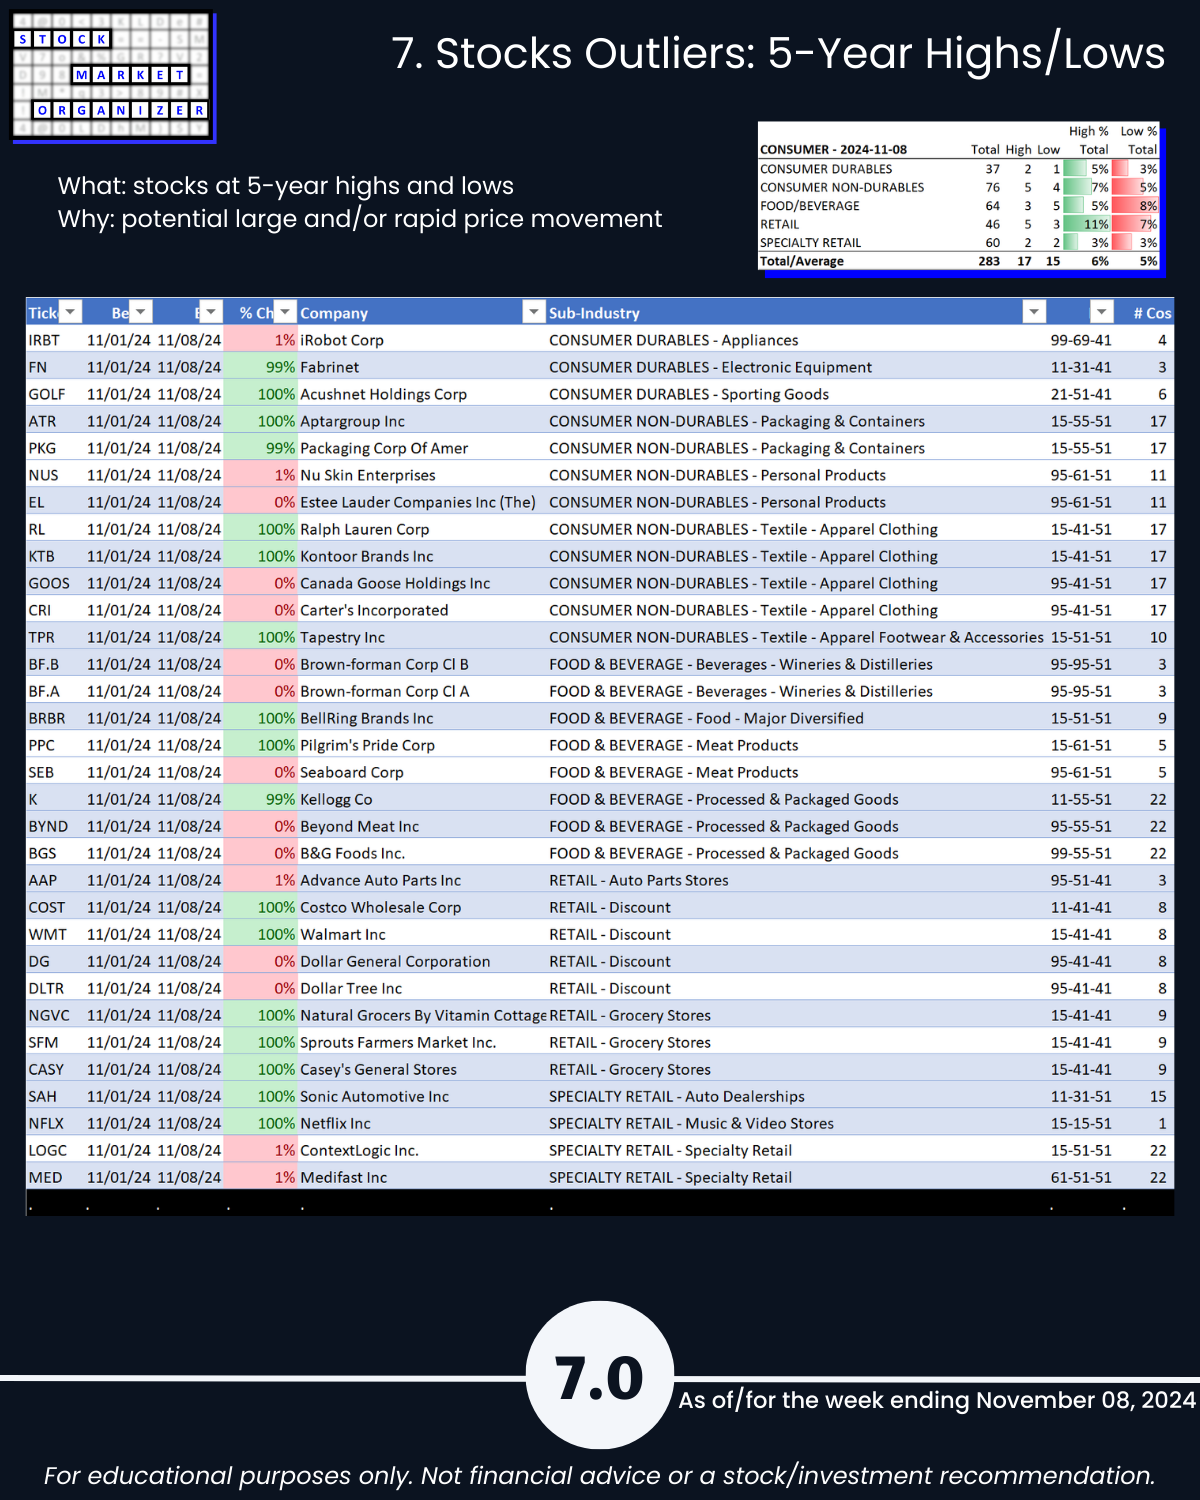
7. Stocks Outliers: 5-Year Highs/Lows