SMO Exclusive: Strength Report Consumer Sector 2024-11-01
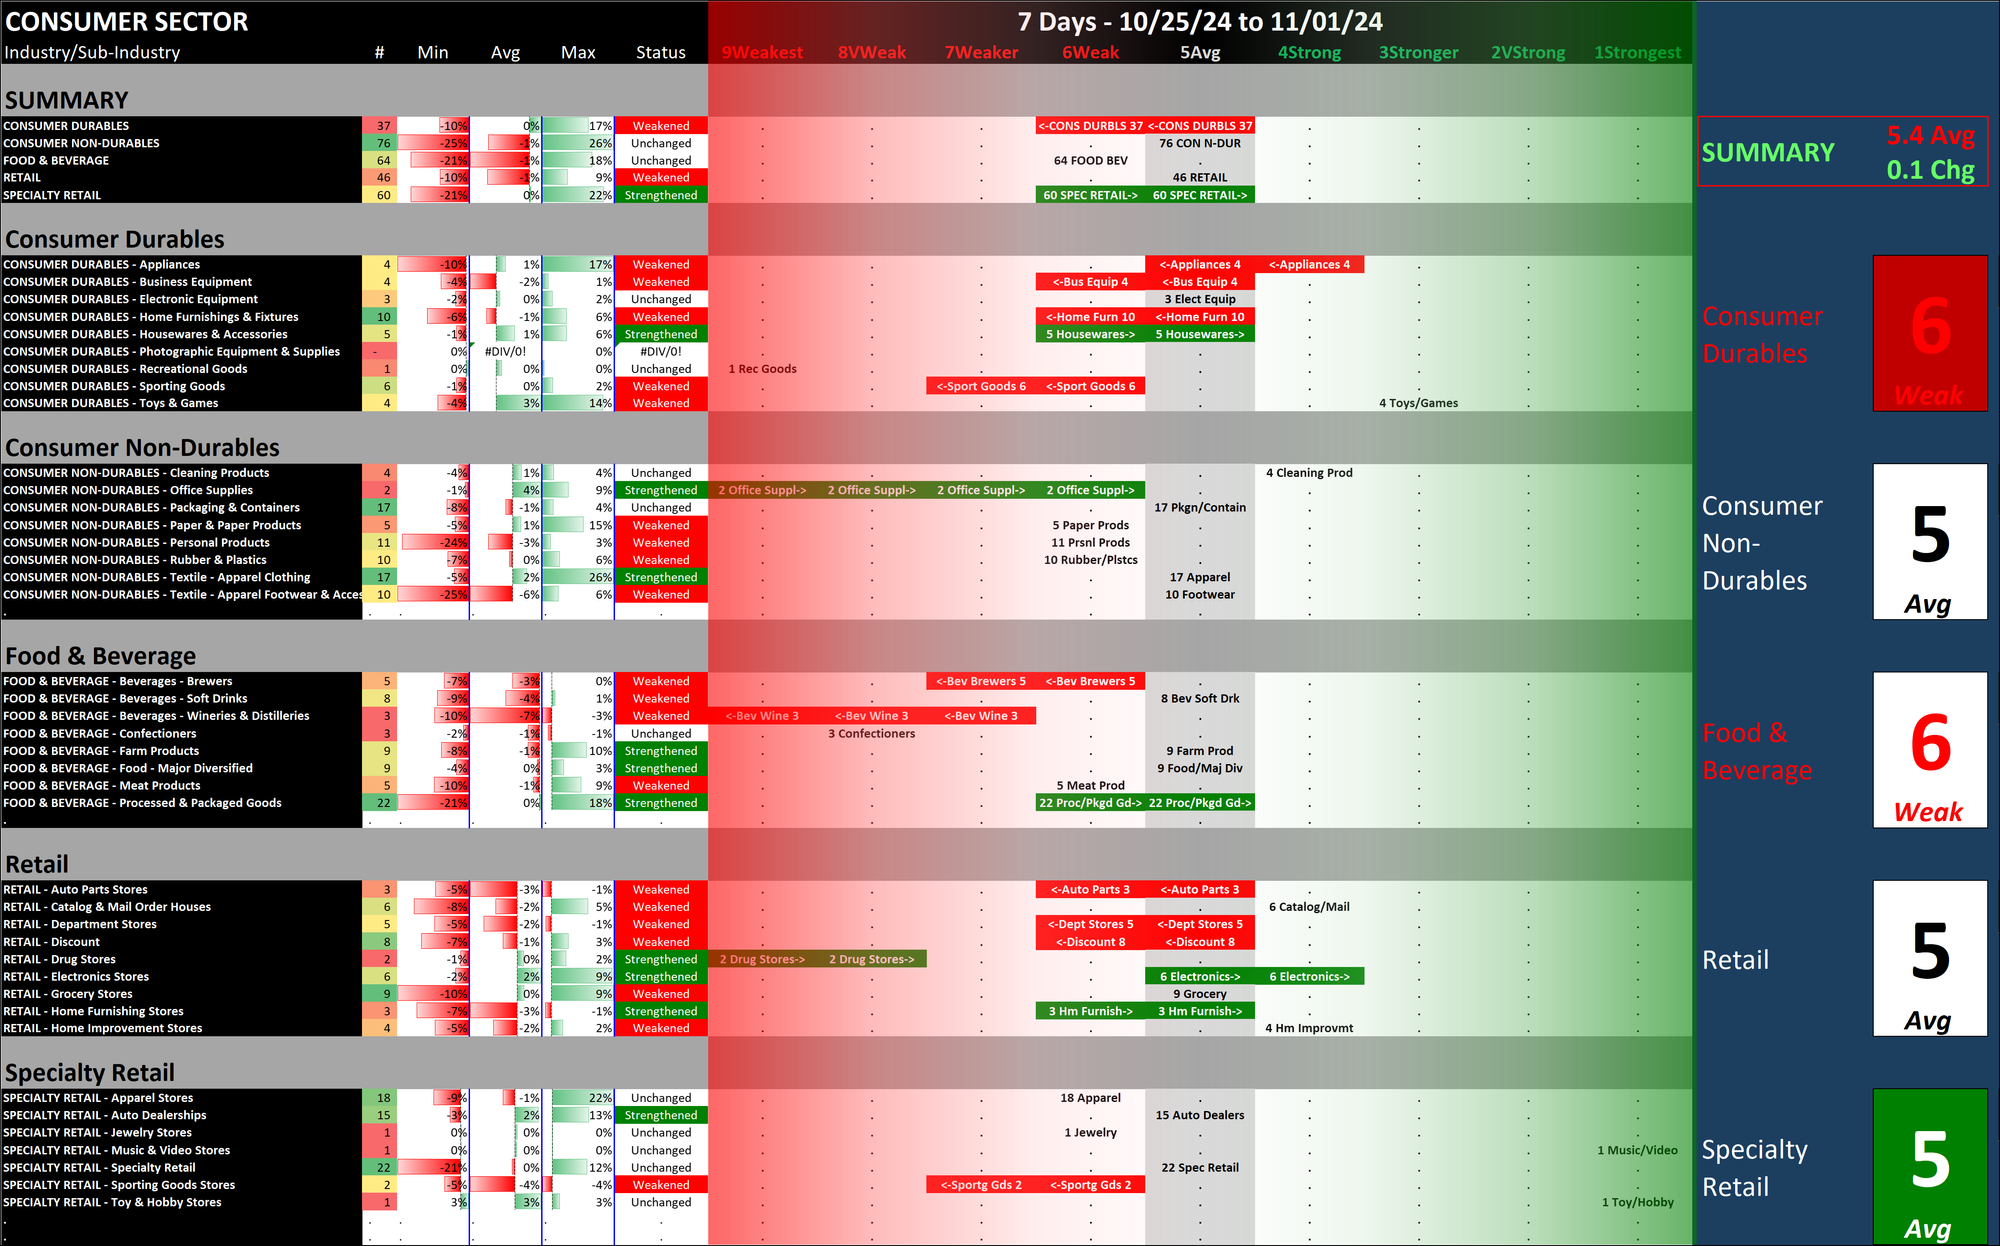
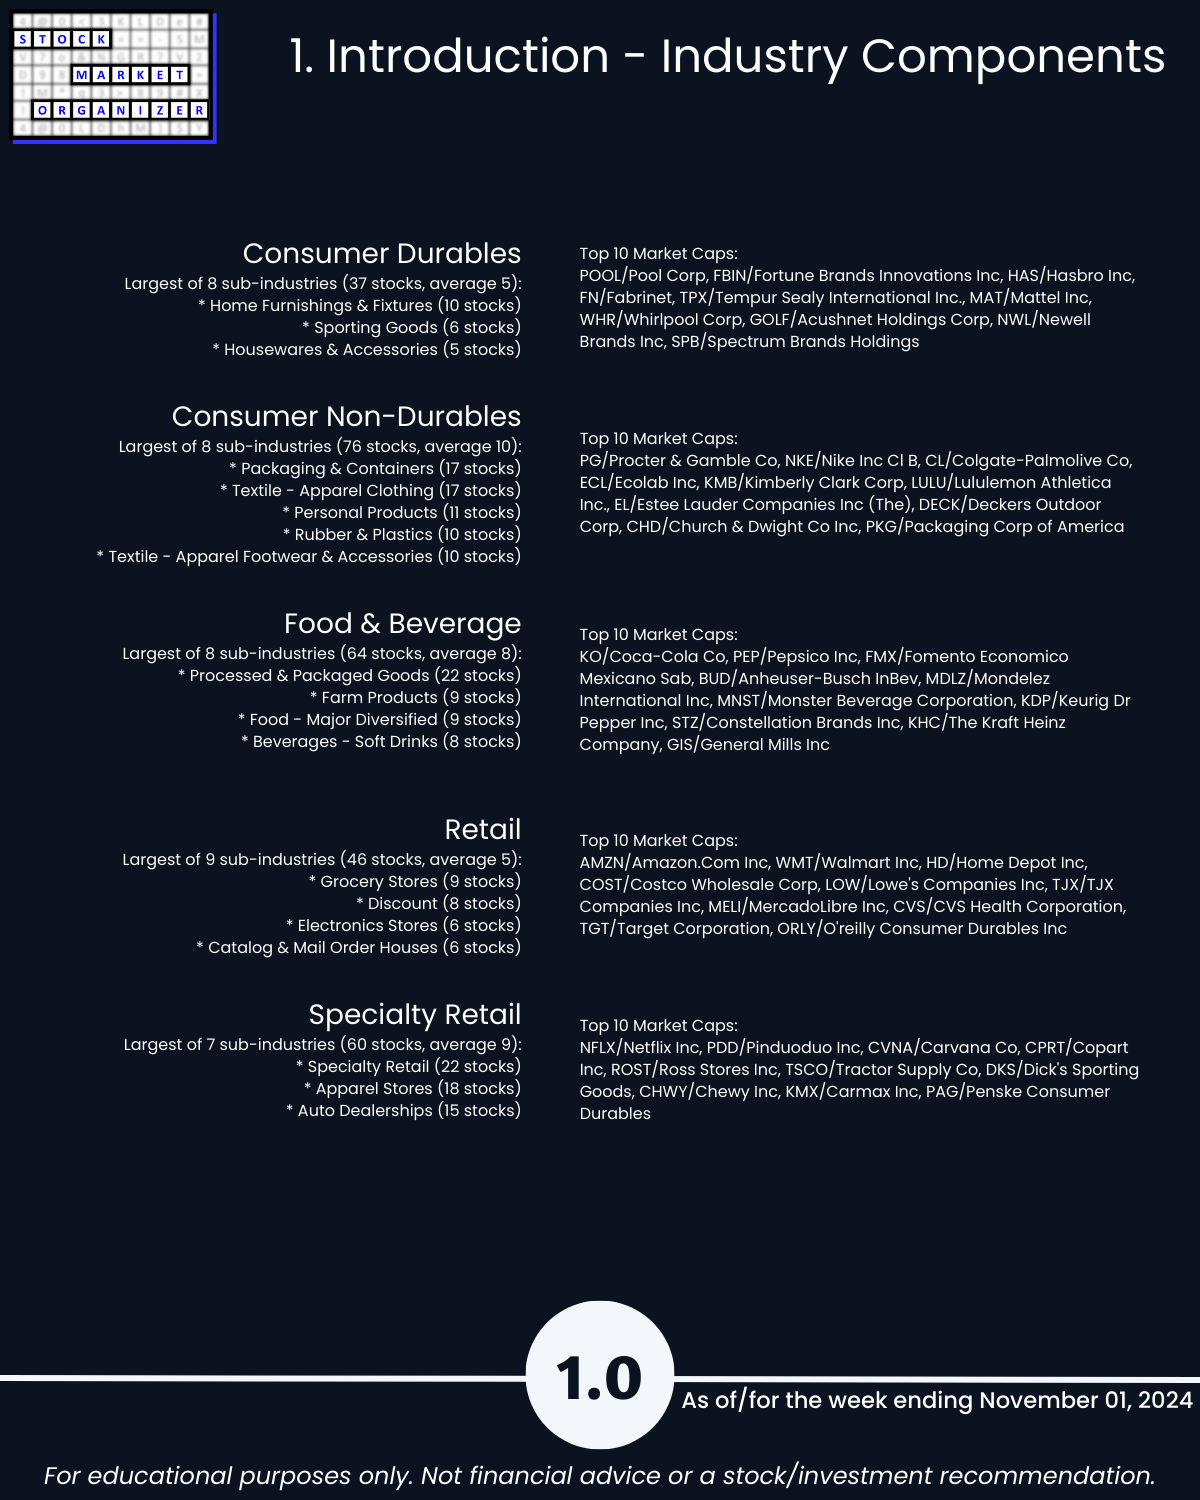
Reminder that the stock market does not have to be so complicated. The attached report clearly reflects where there is strength and weakness in the Consumer Sector, which consists of the following industries:
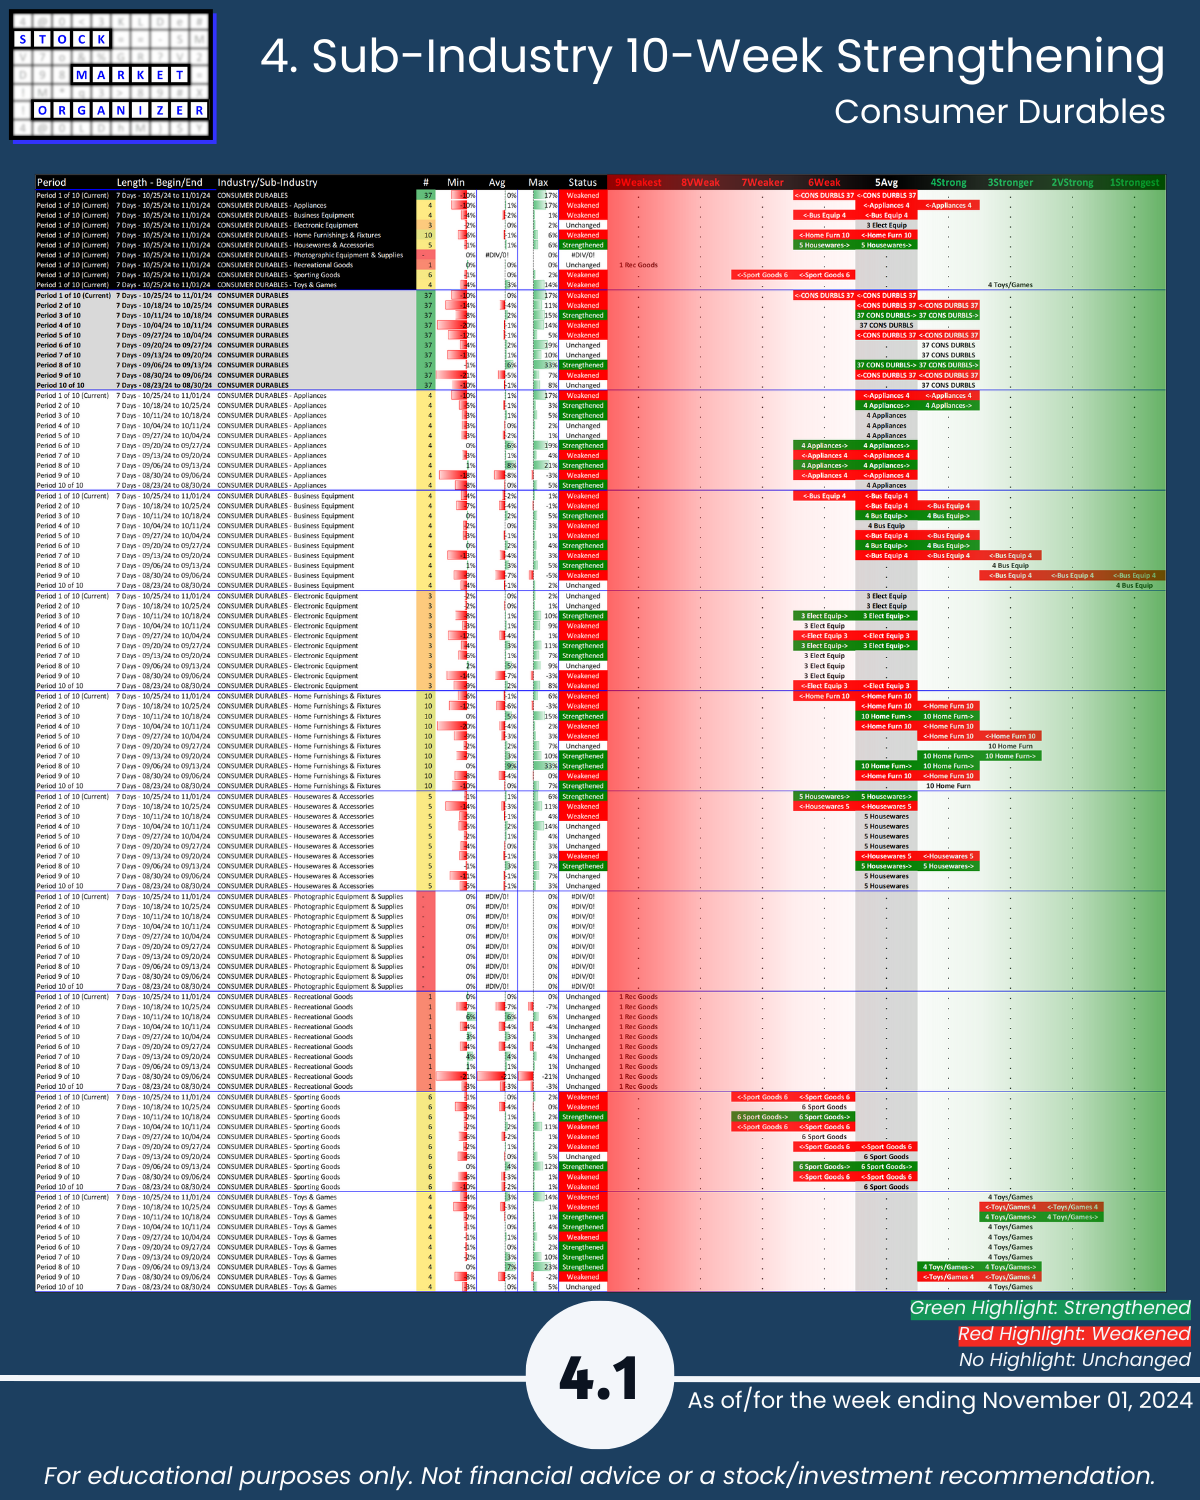
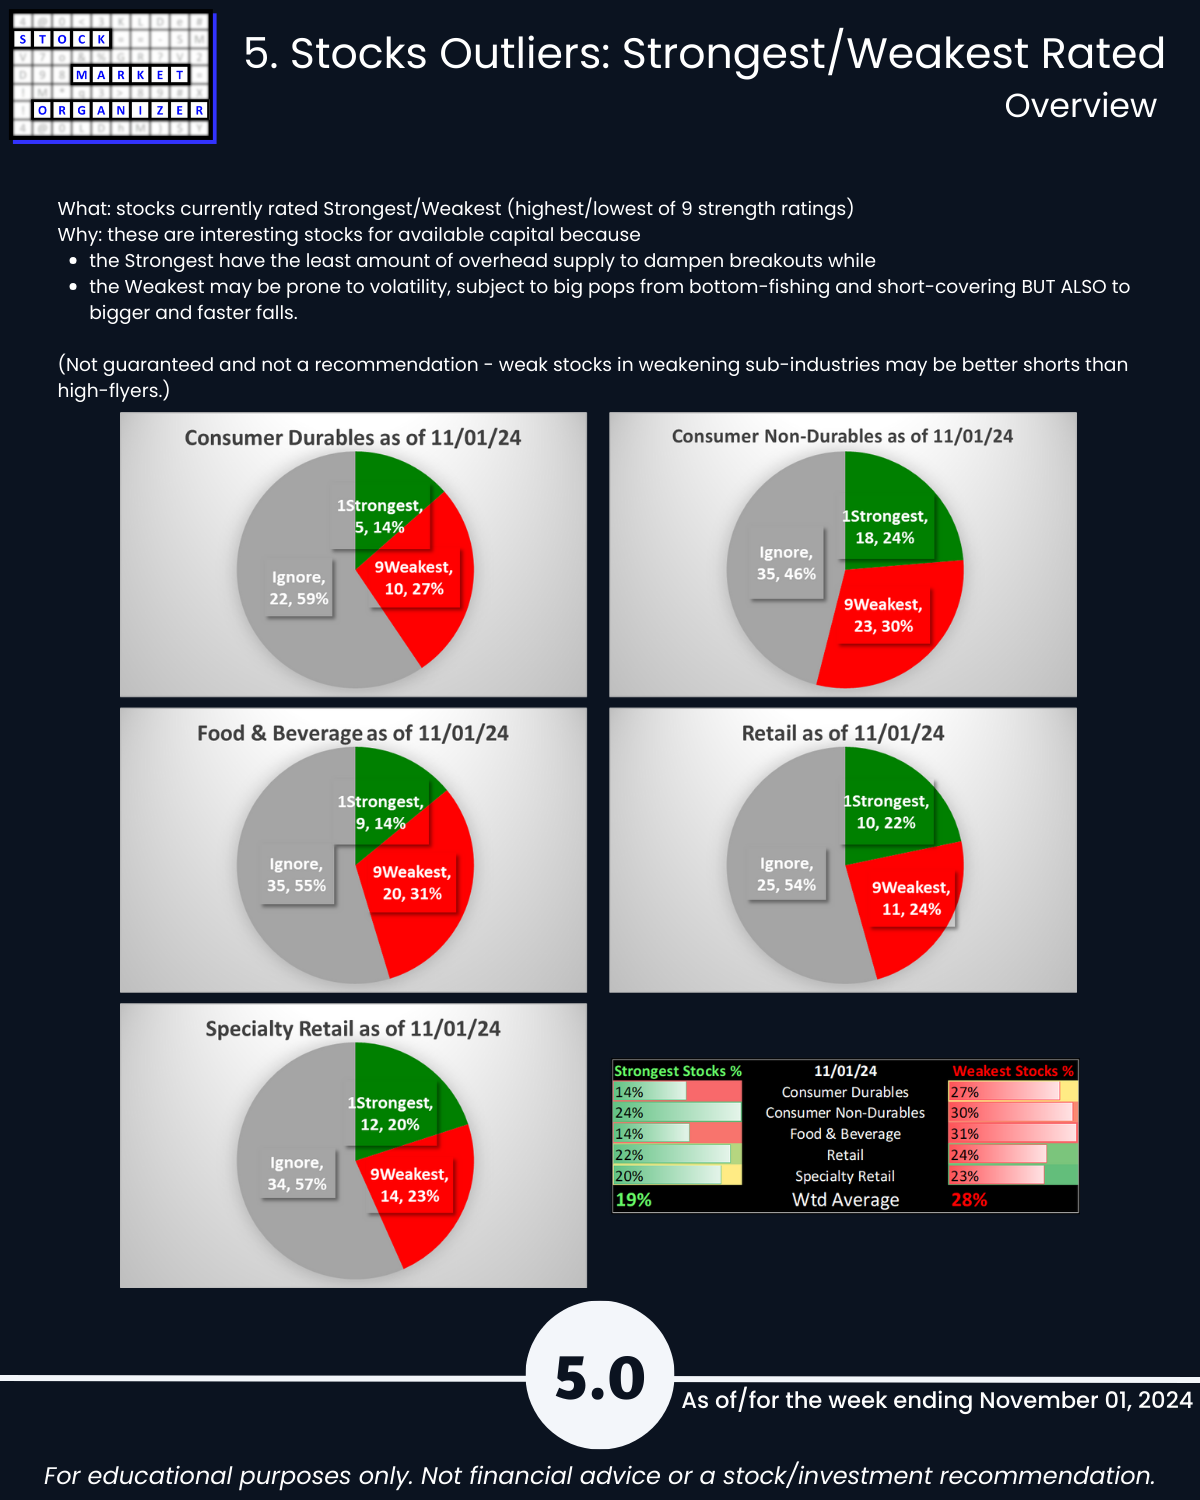
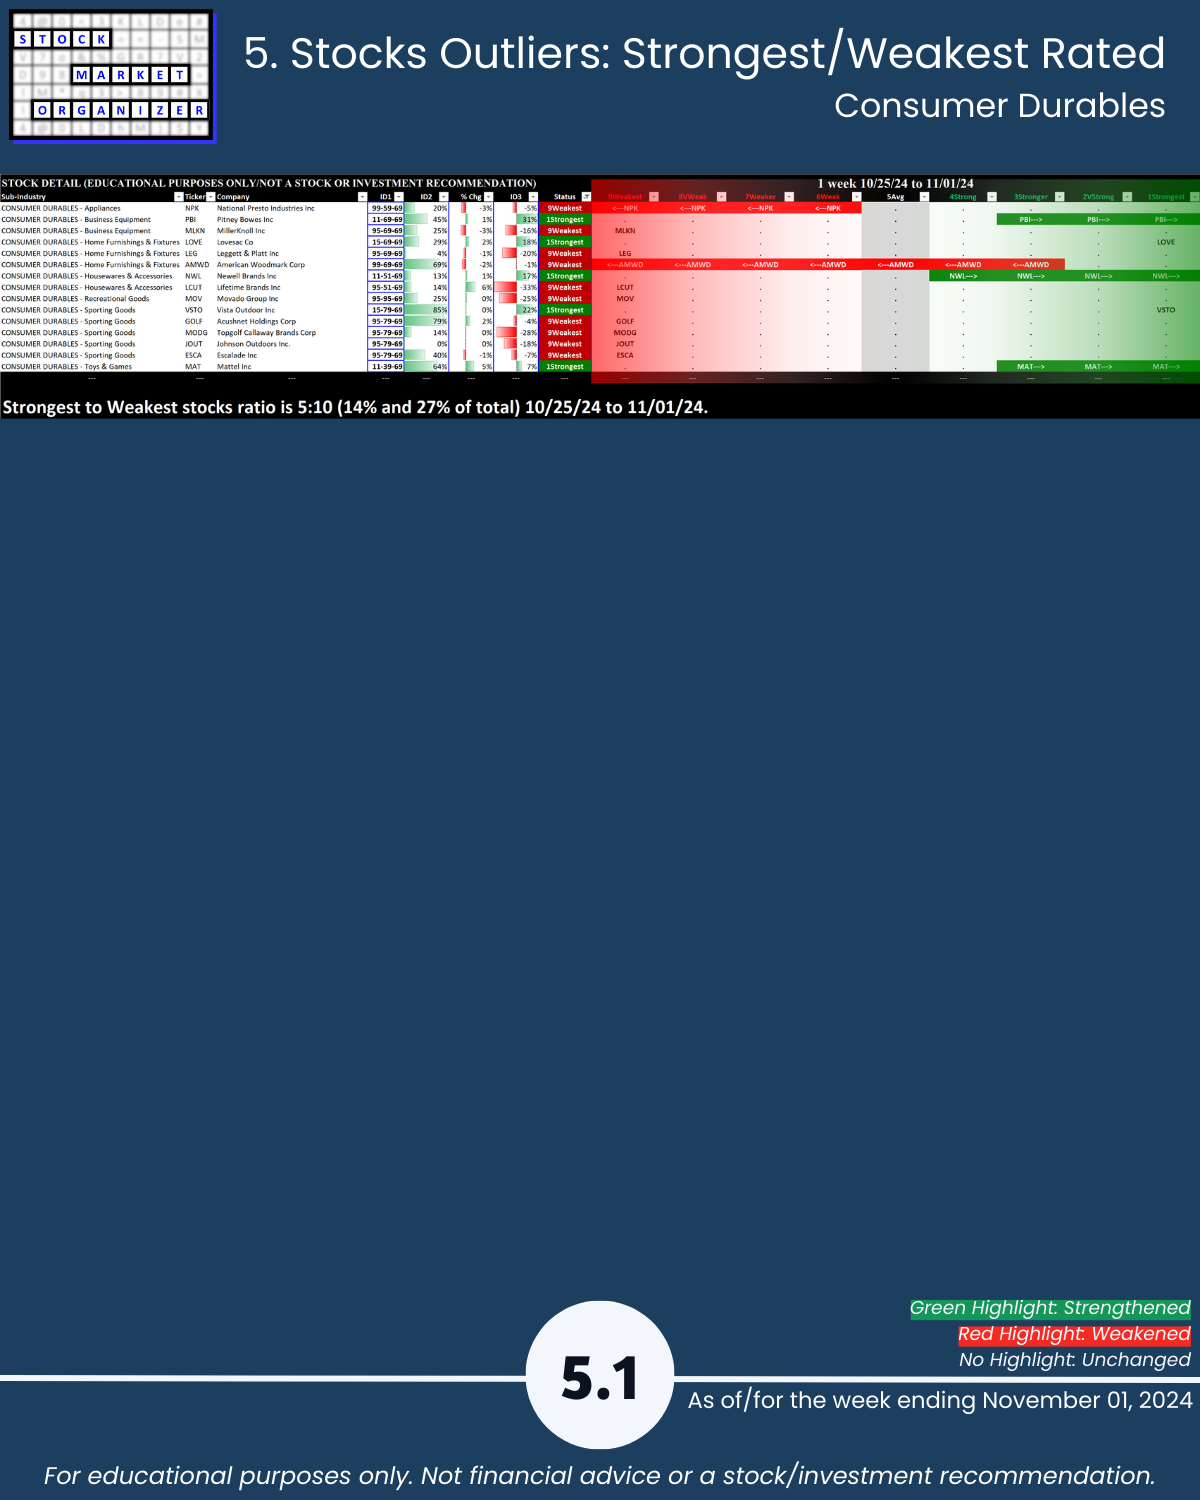
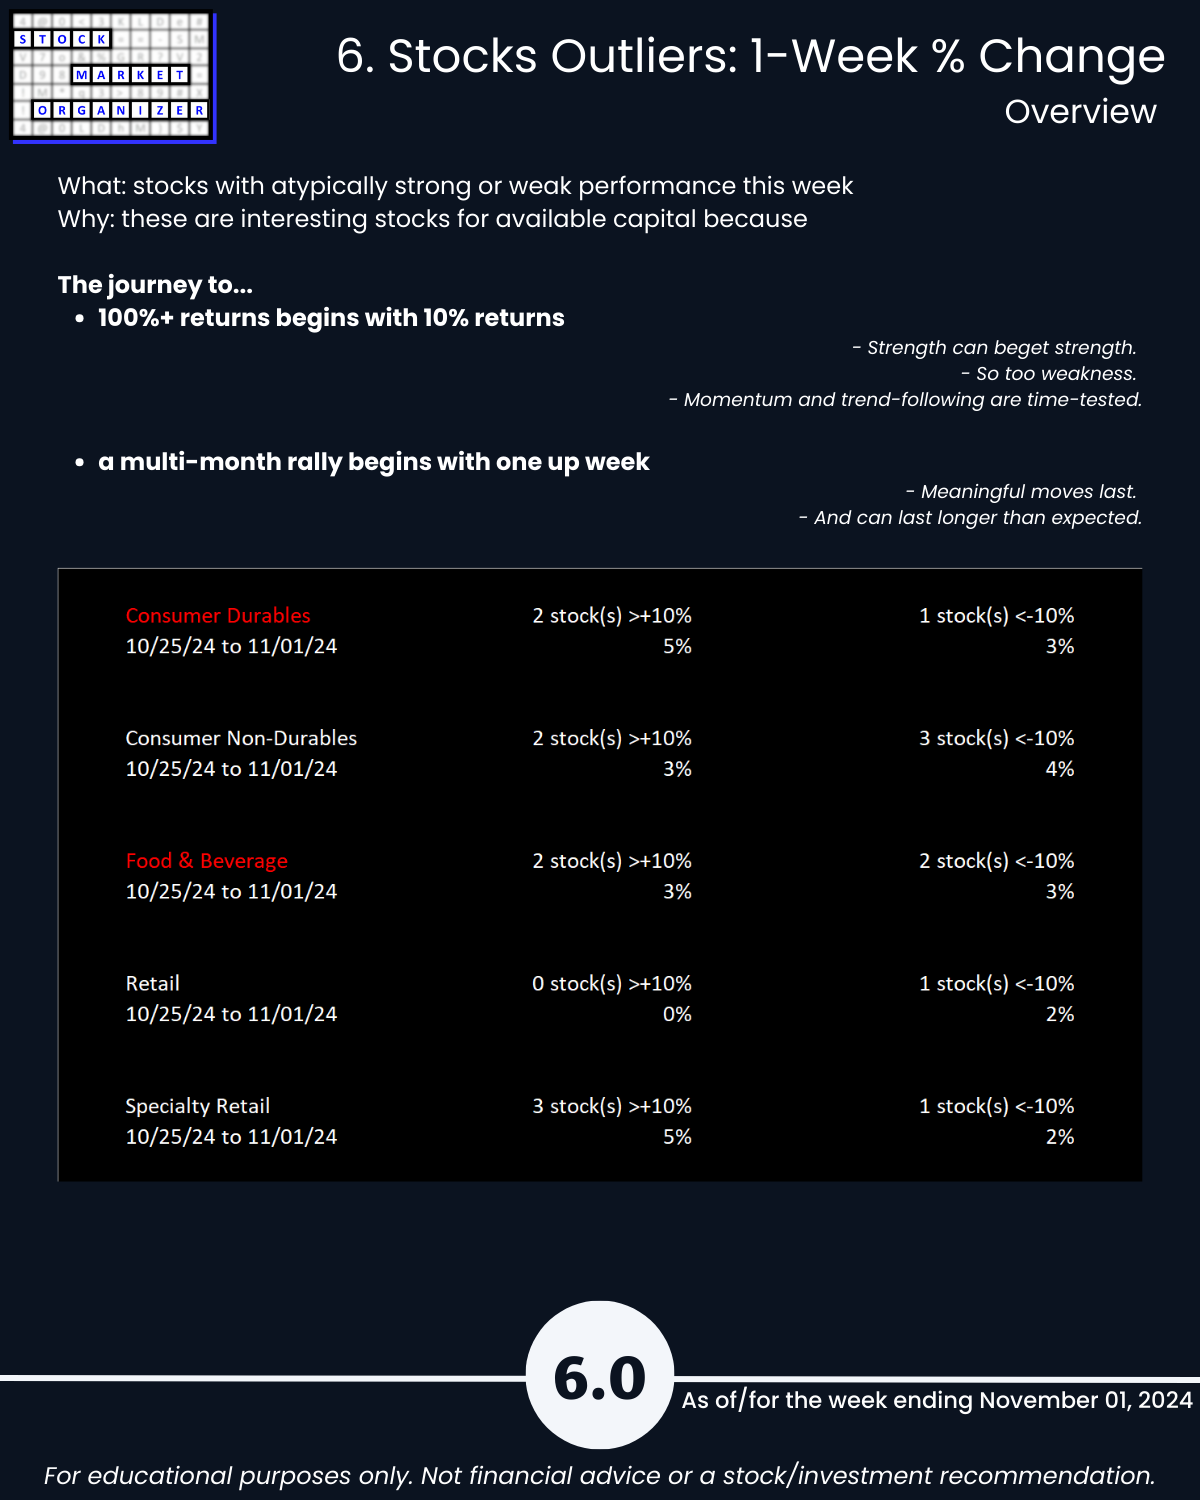
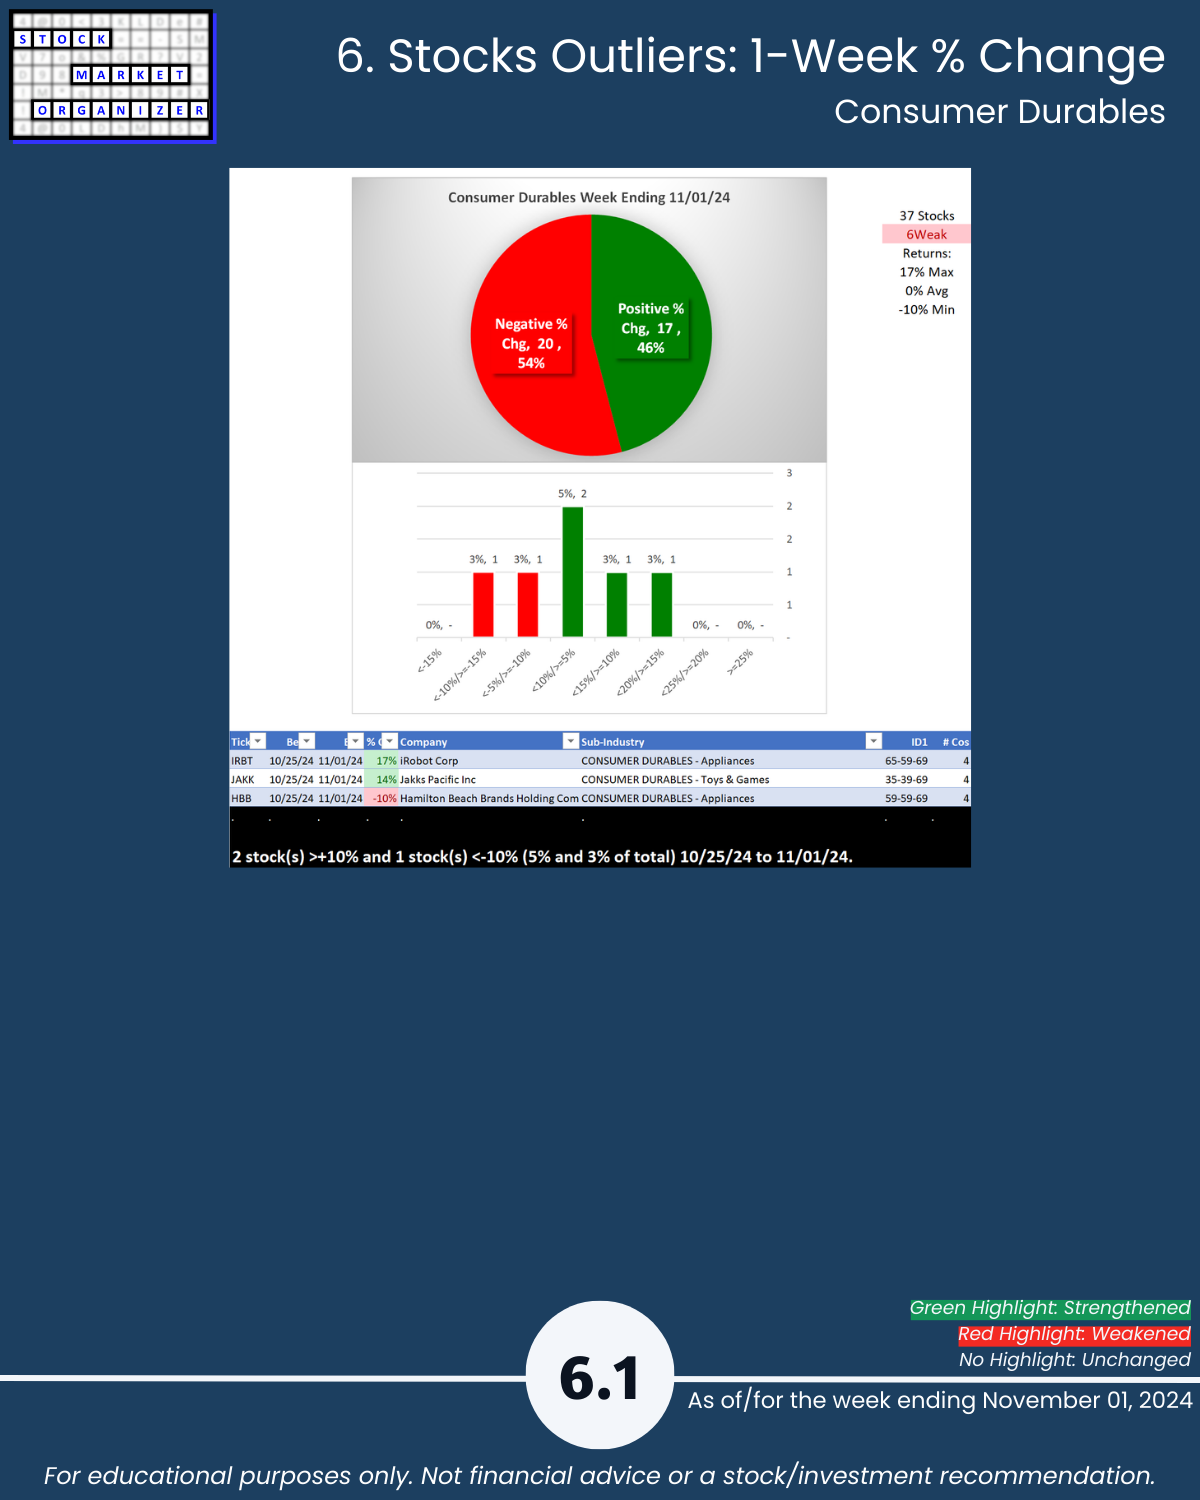
- Consumer Durables
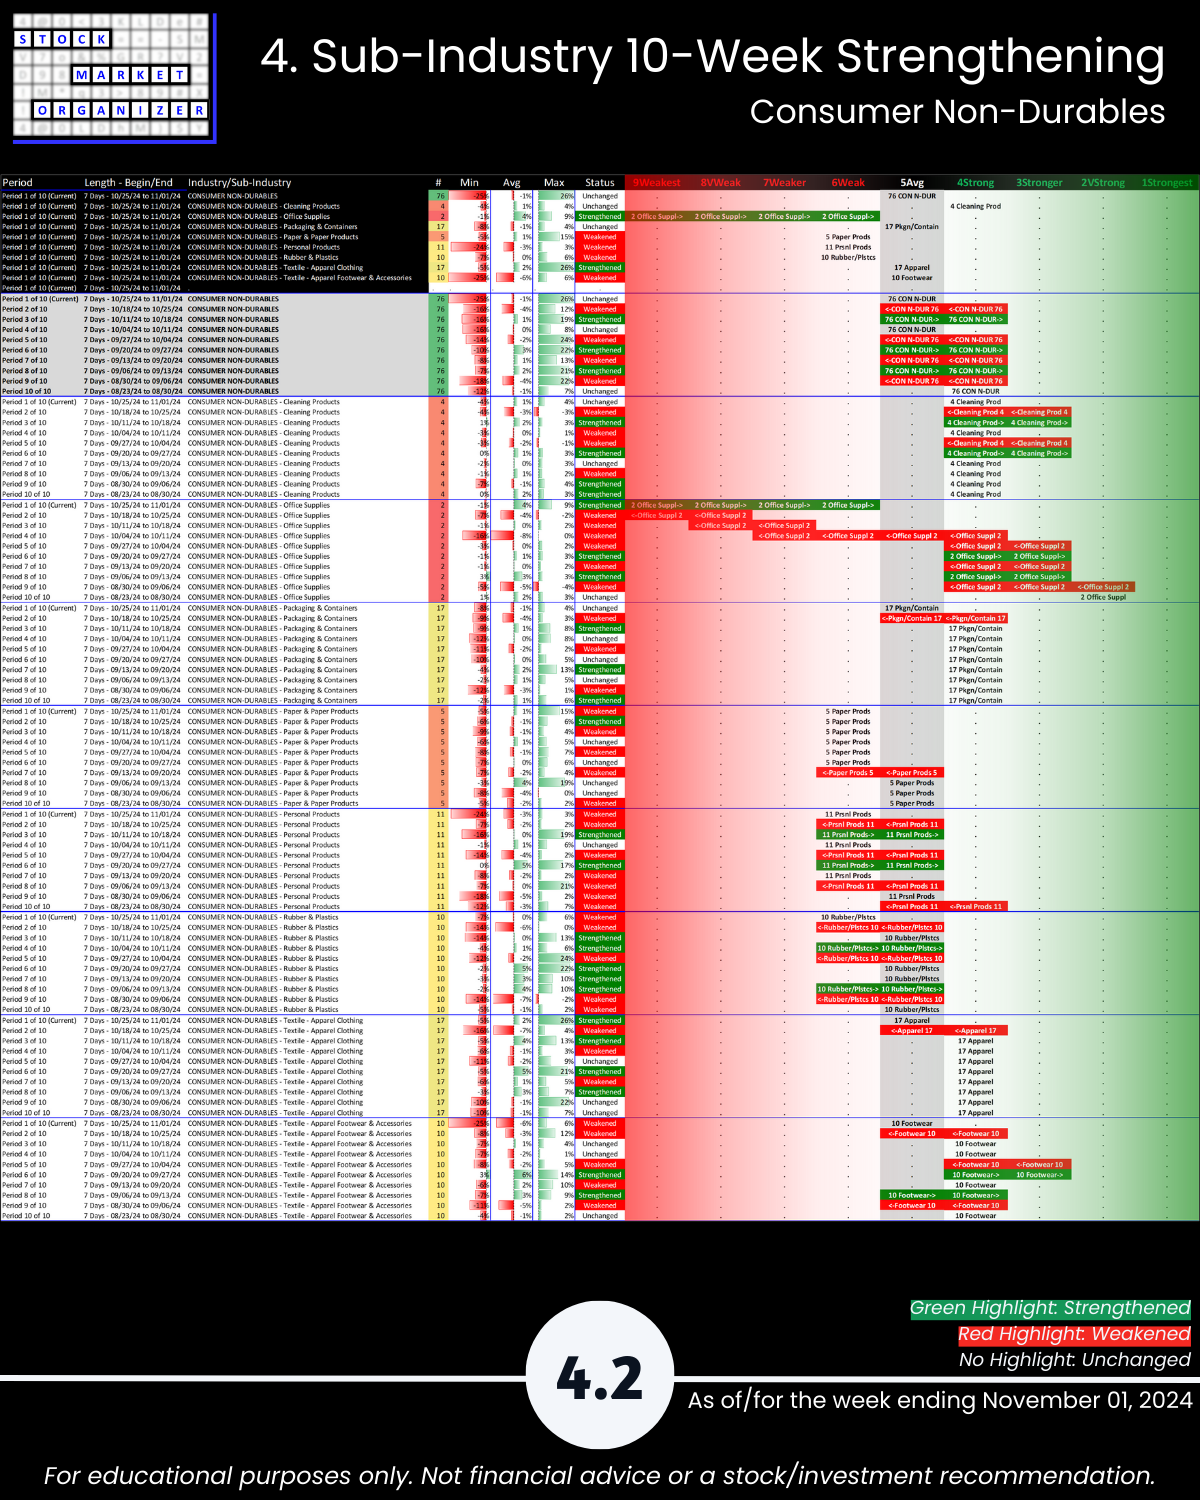
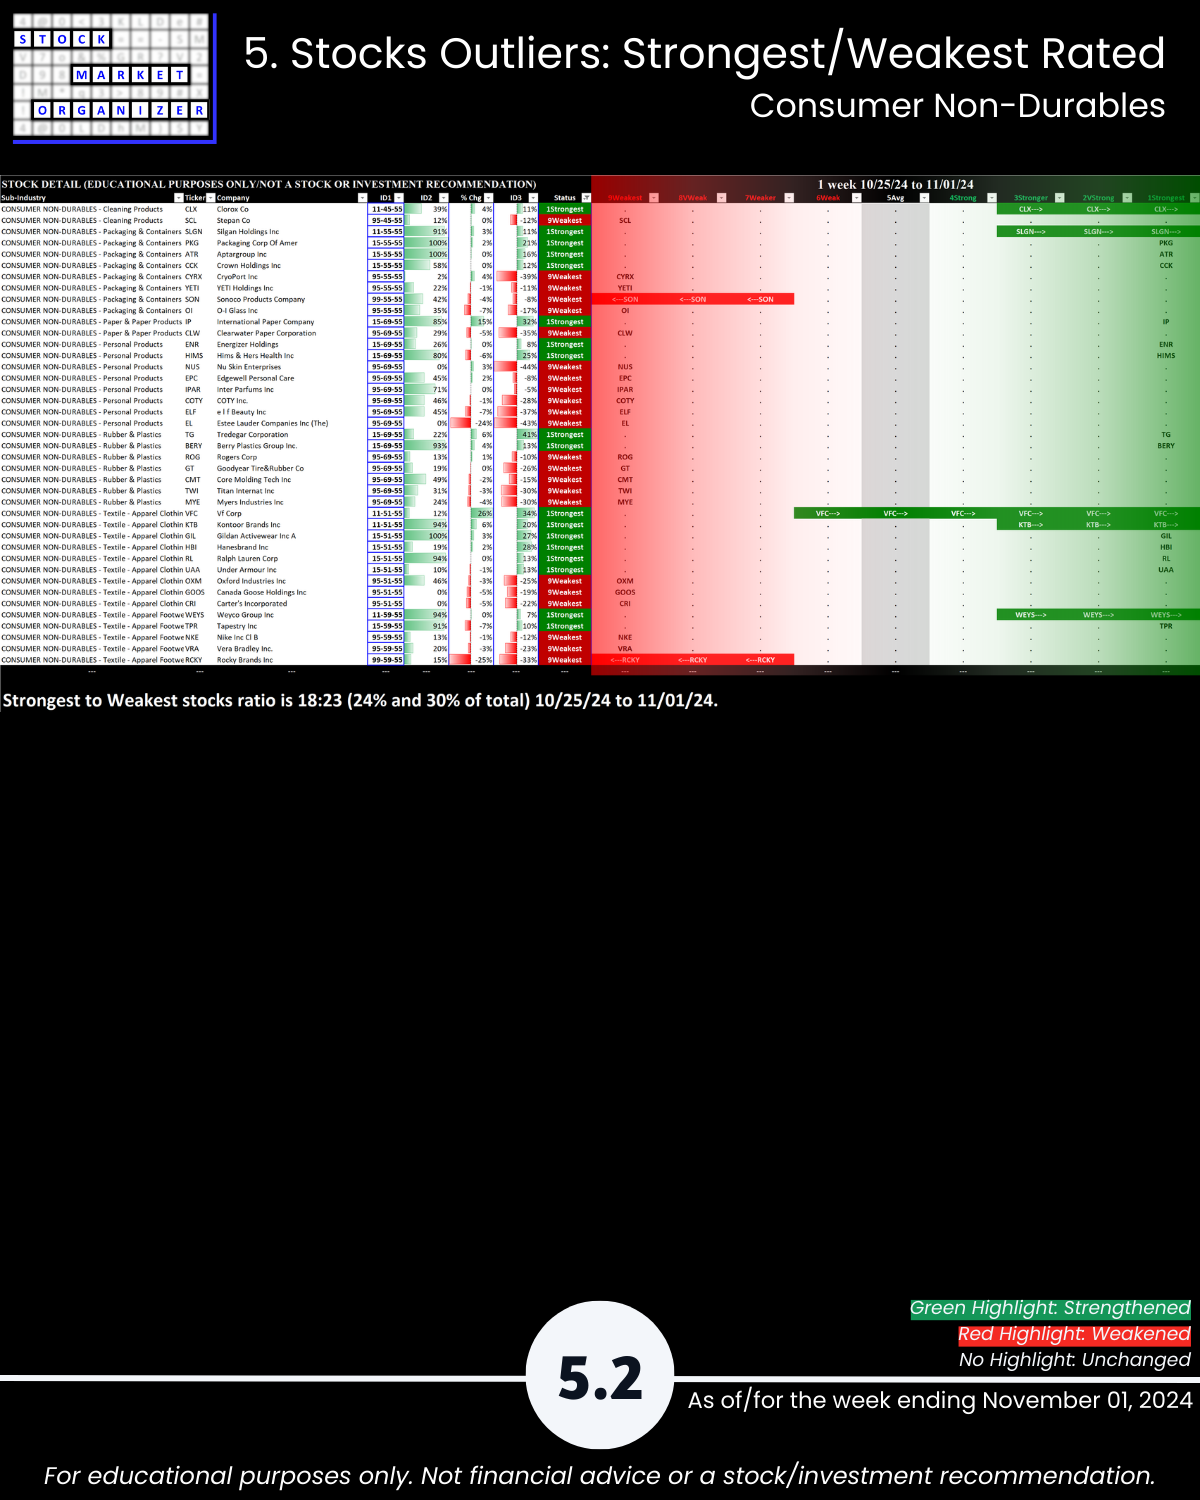
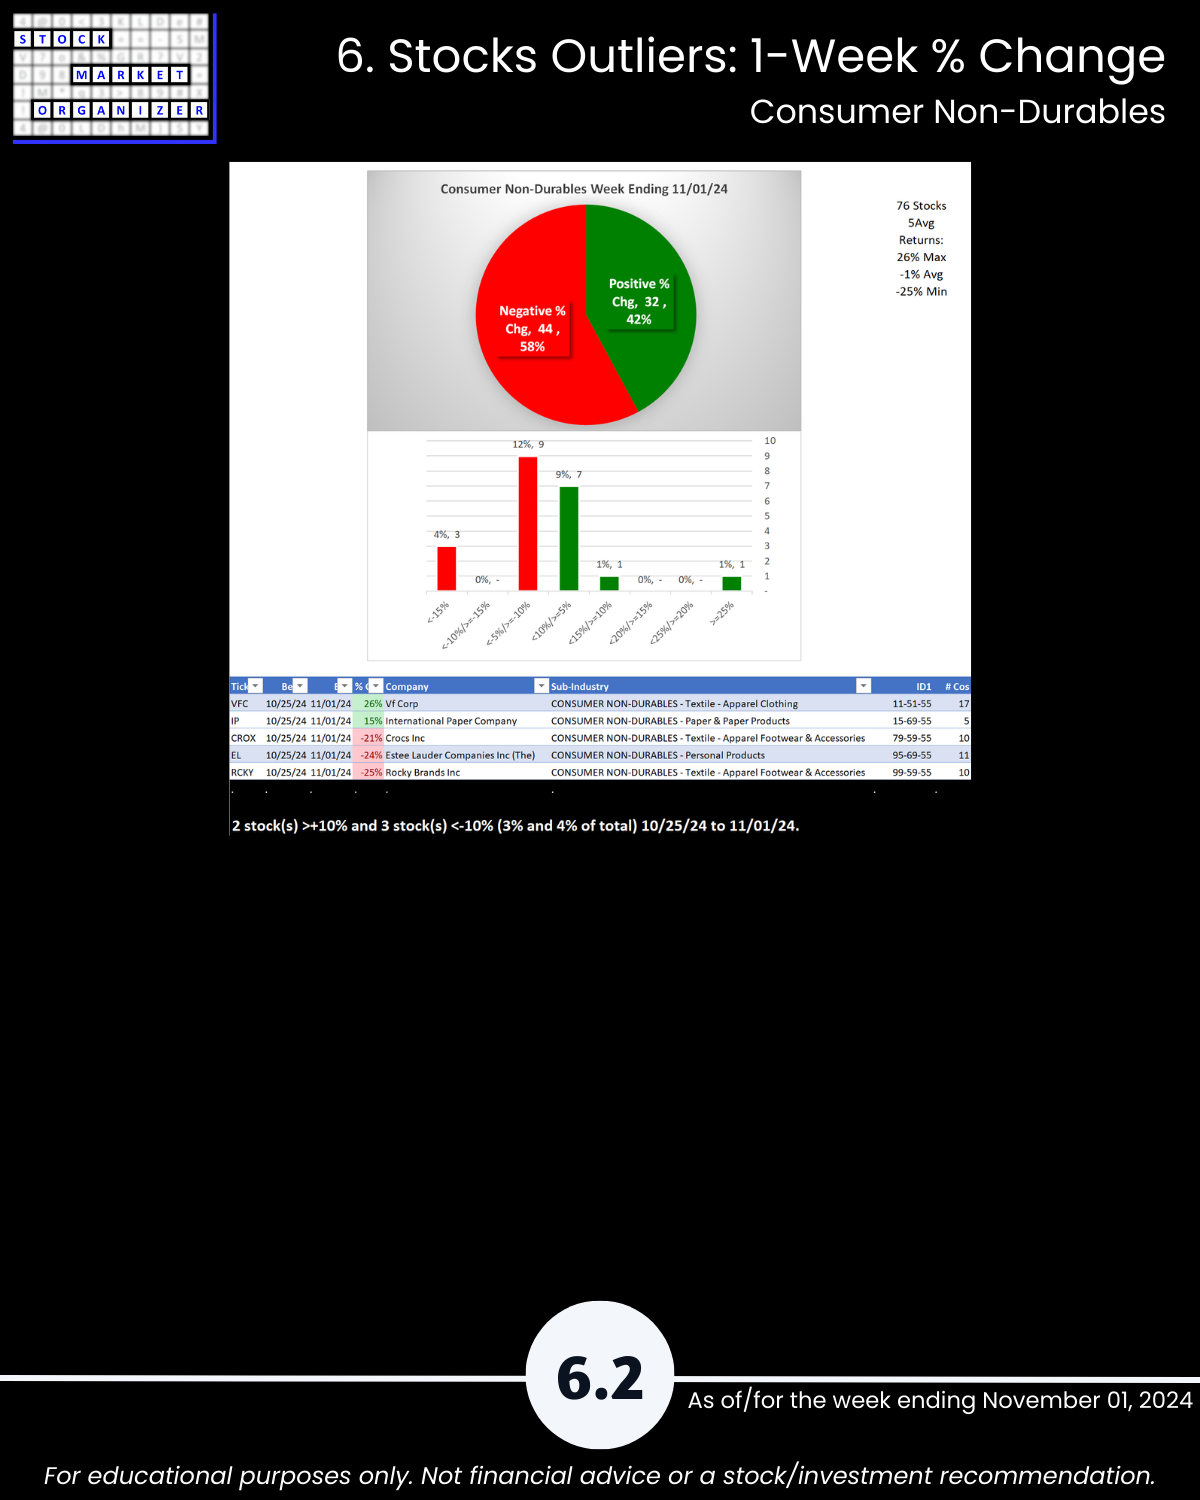
- Consumer Non-Durables
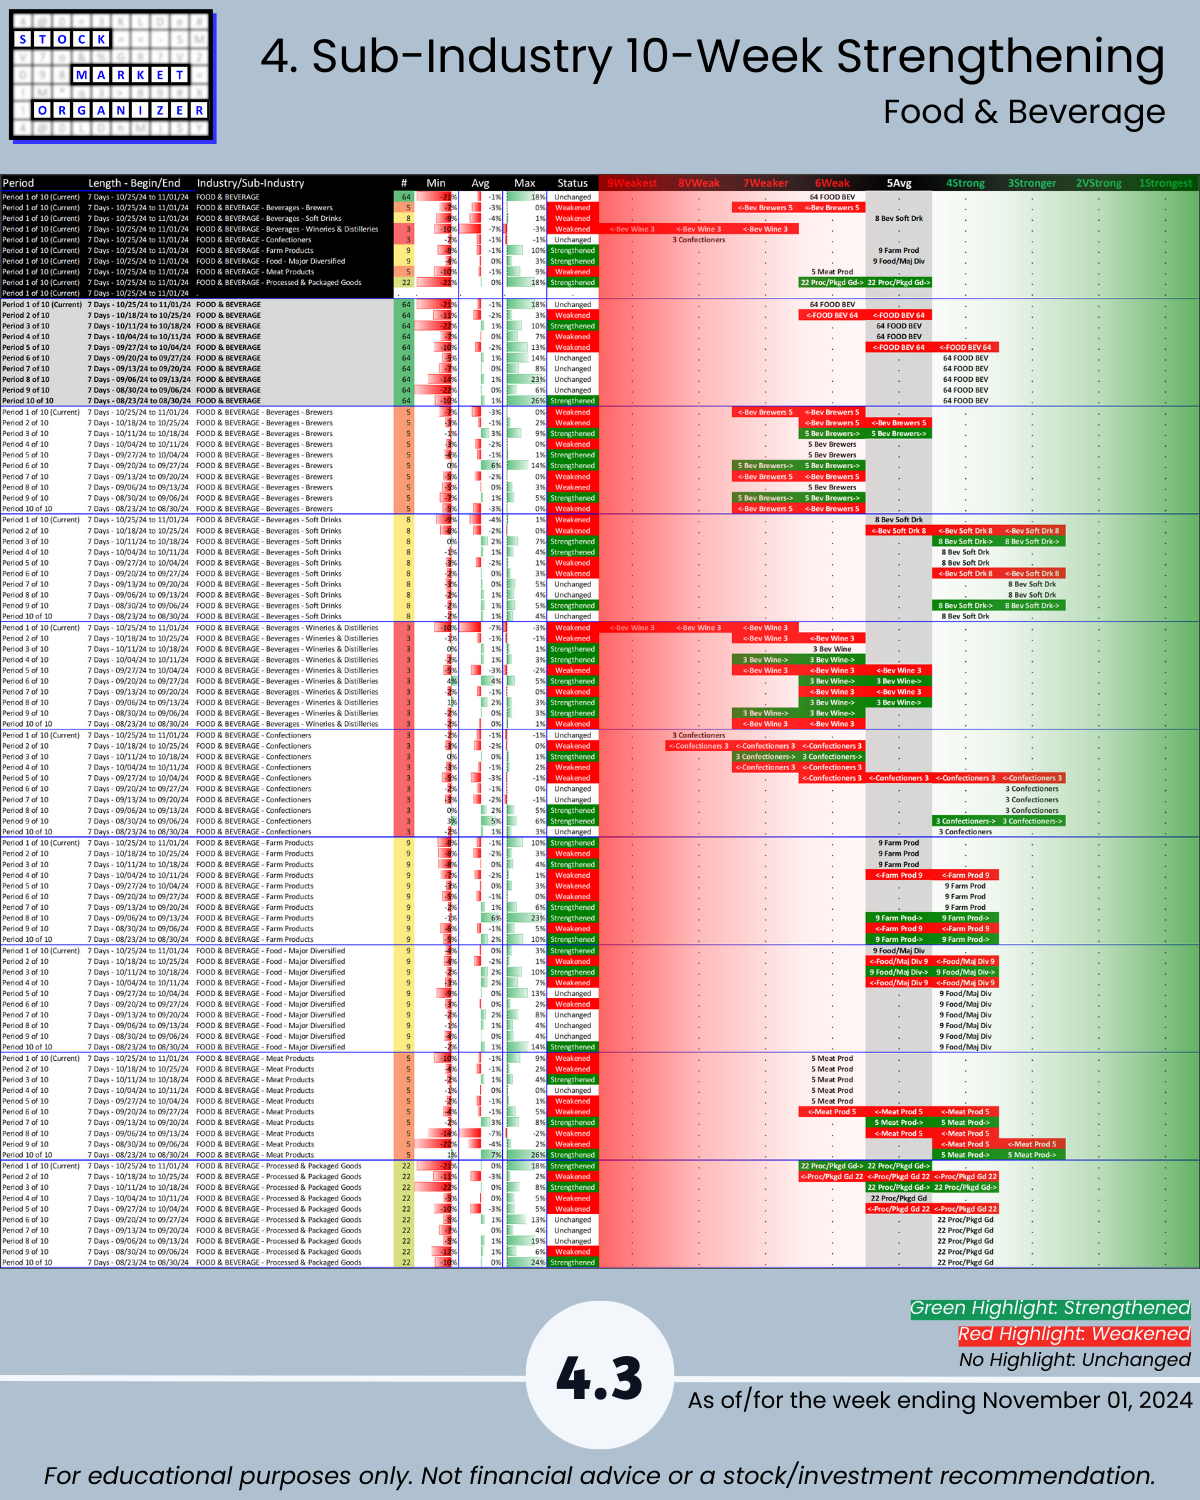
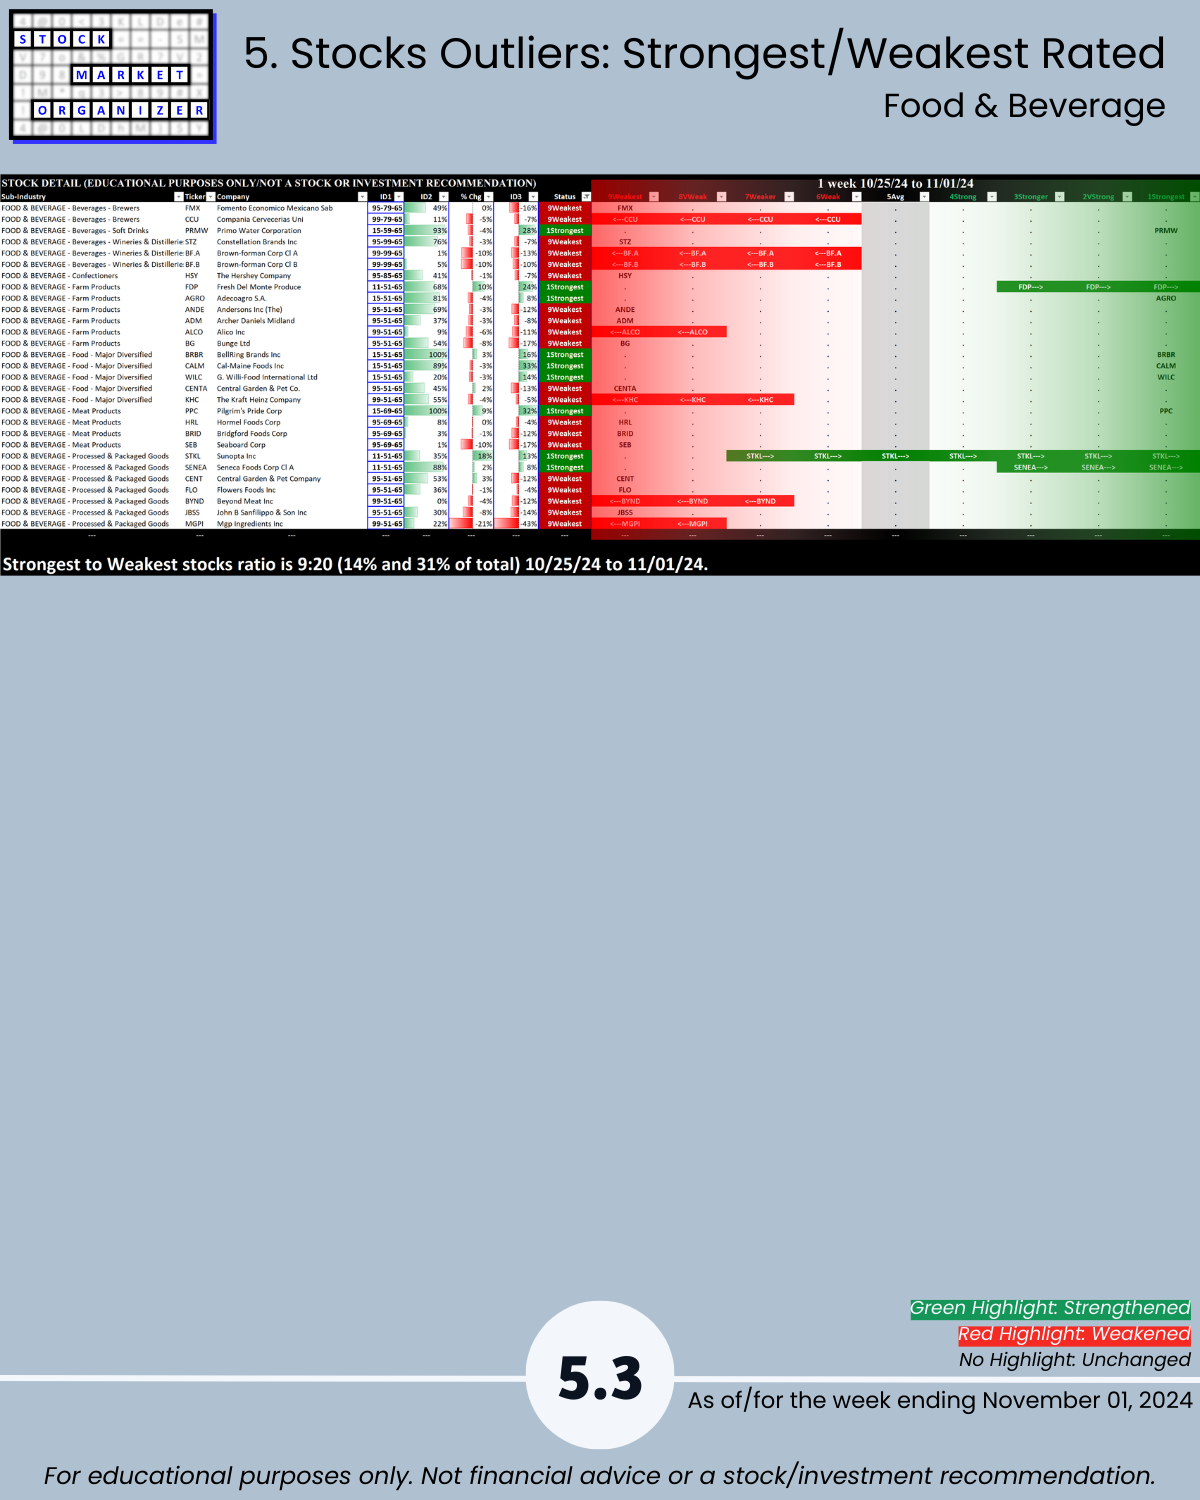
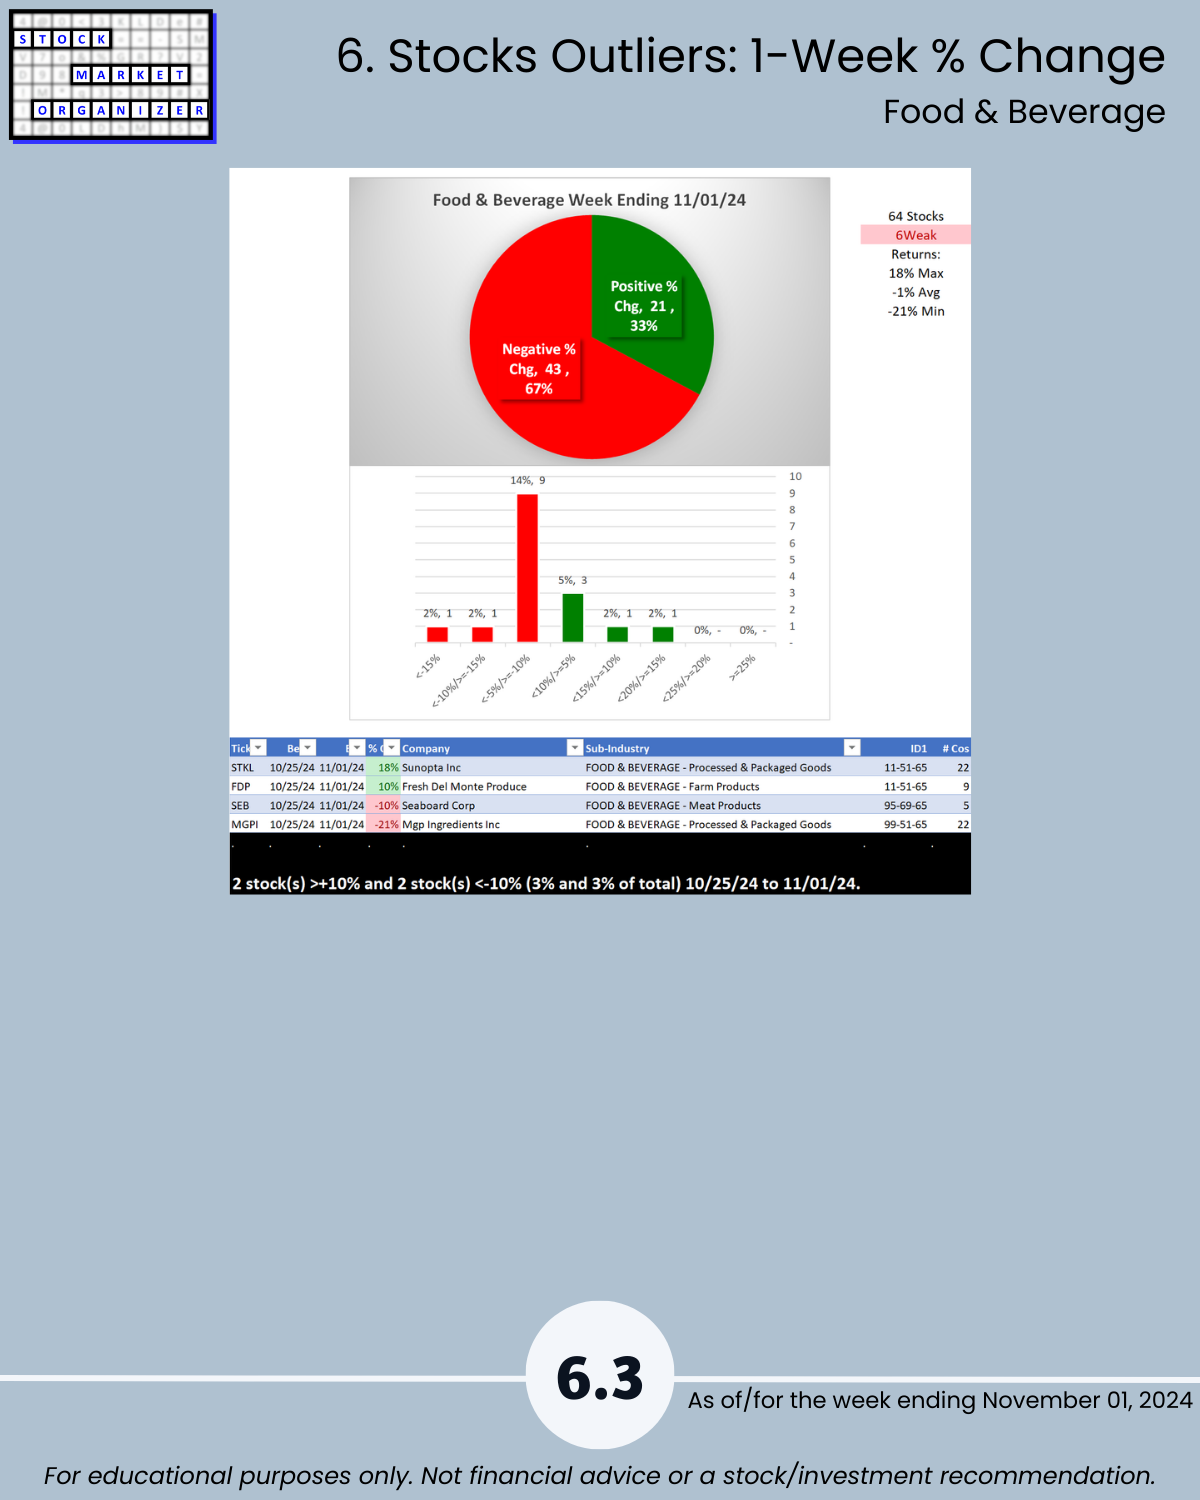
- Food & Beverage
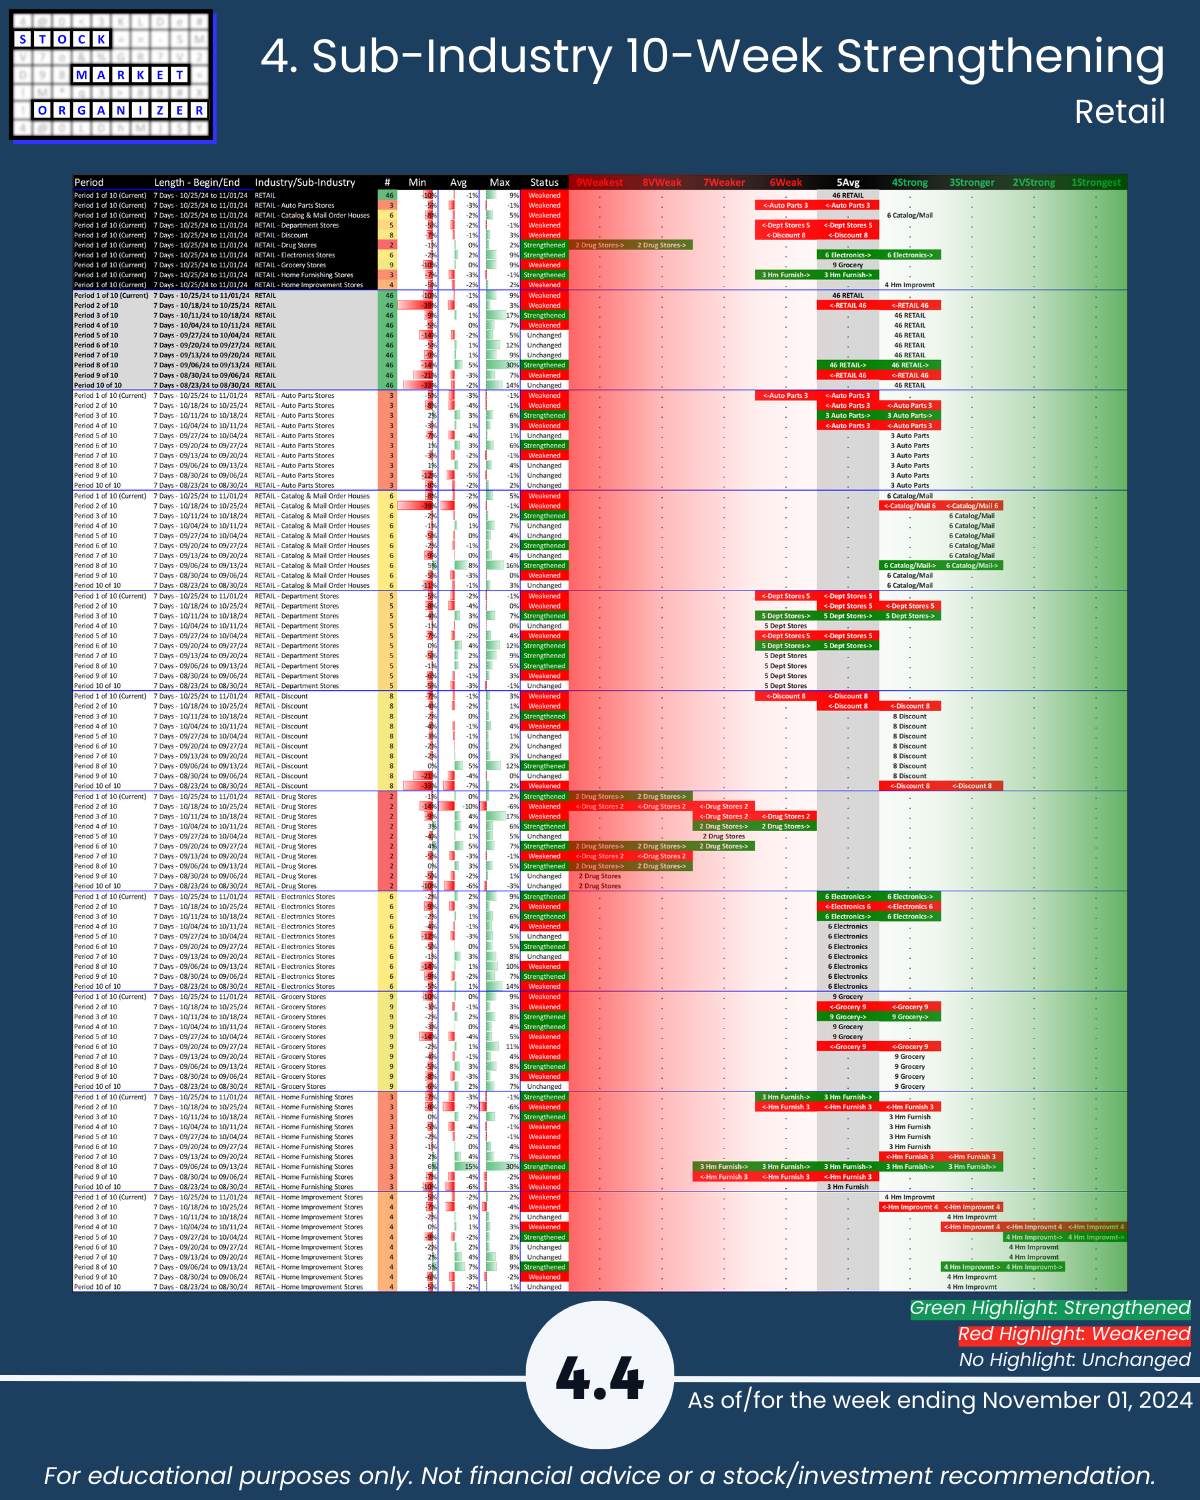
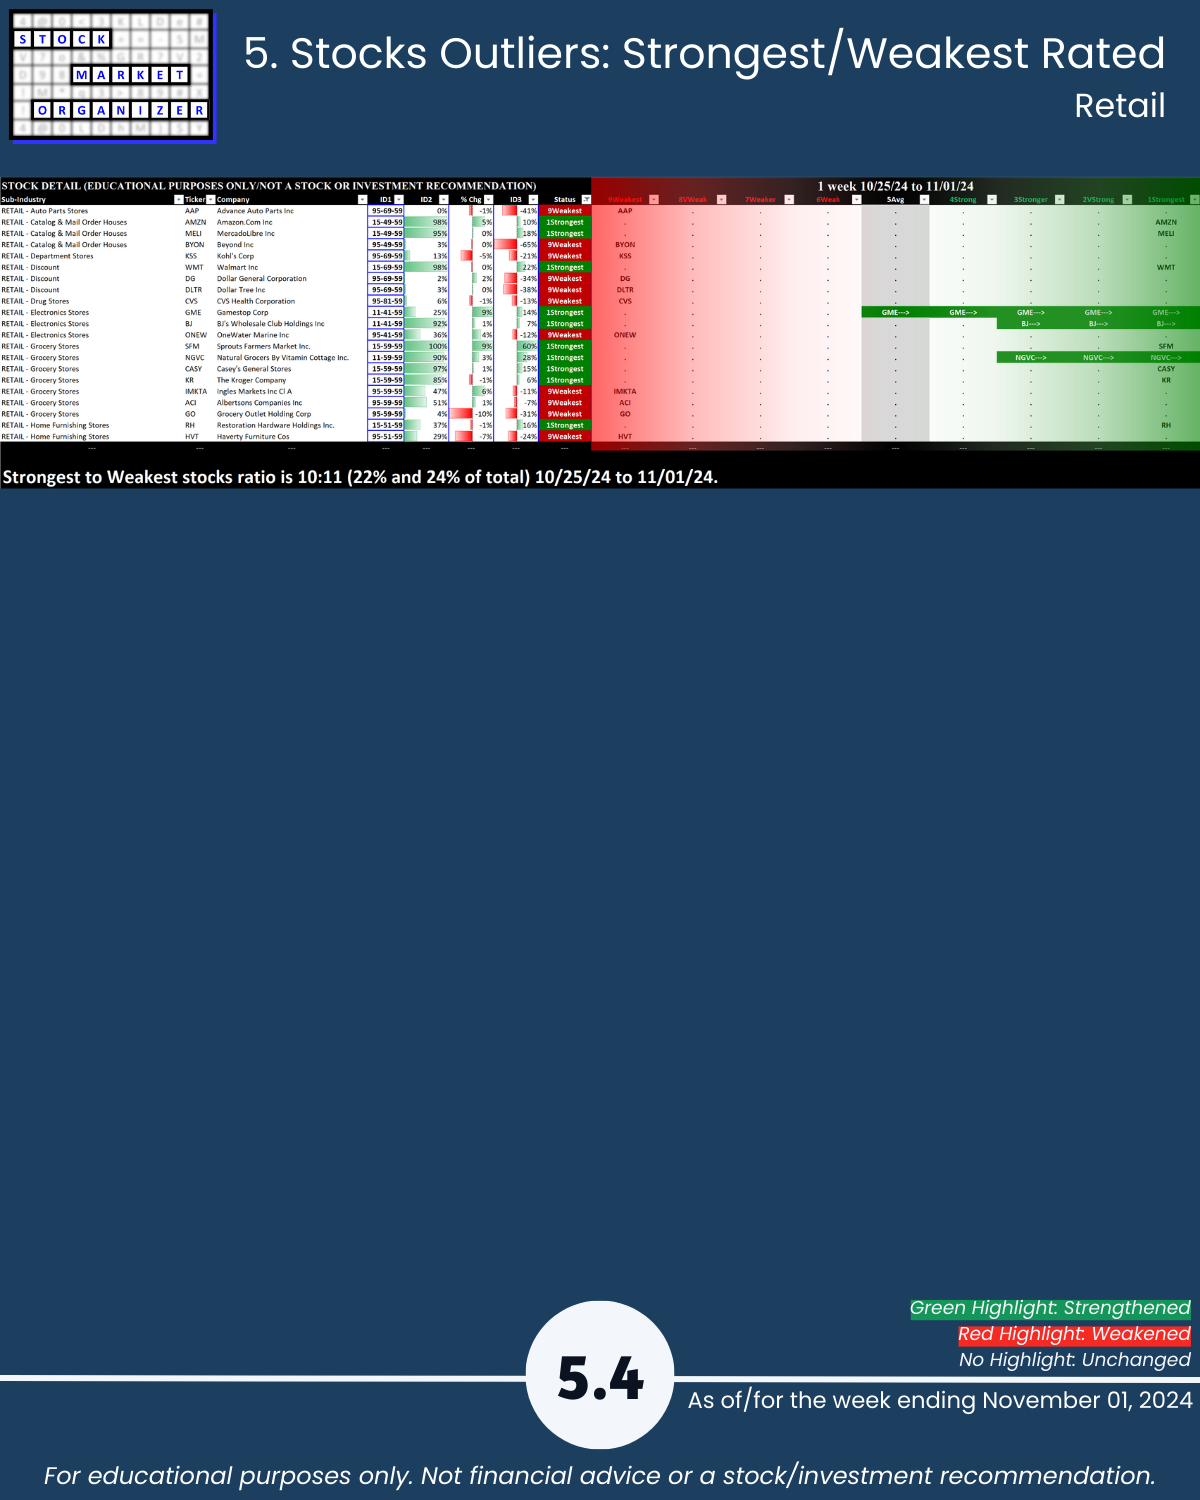
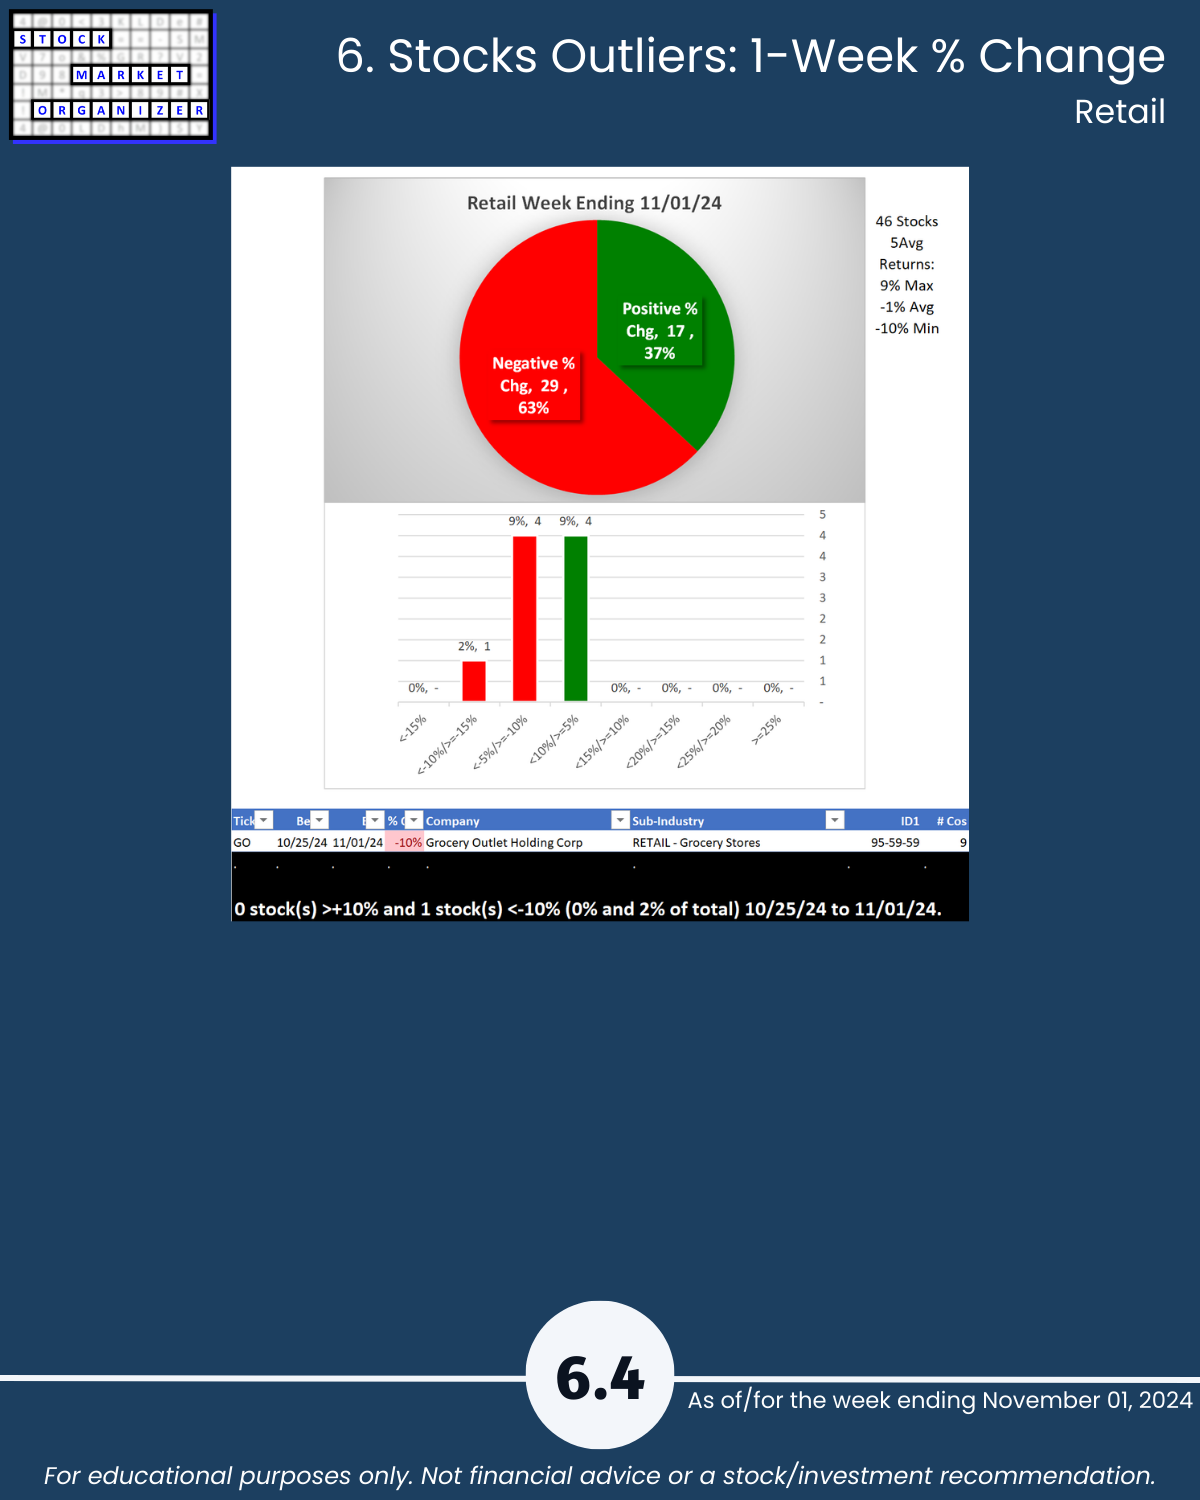
- Retail
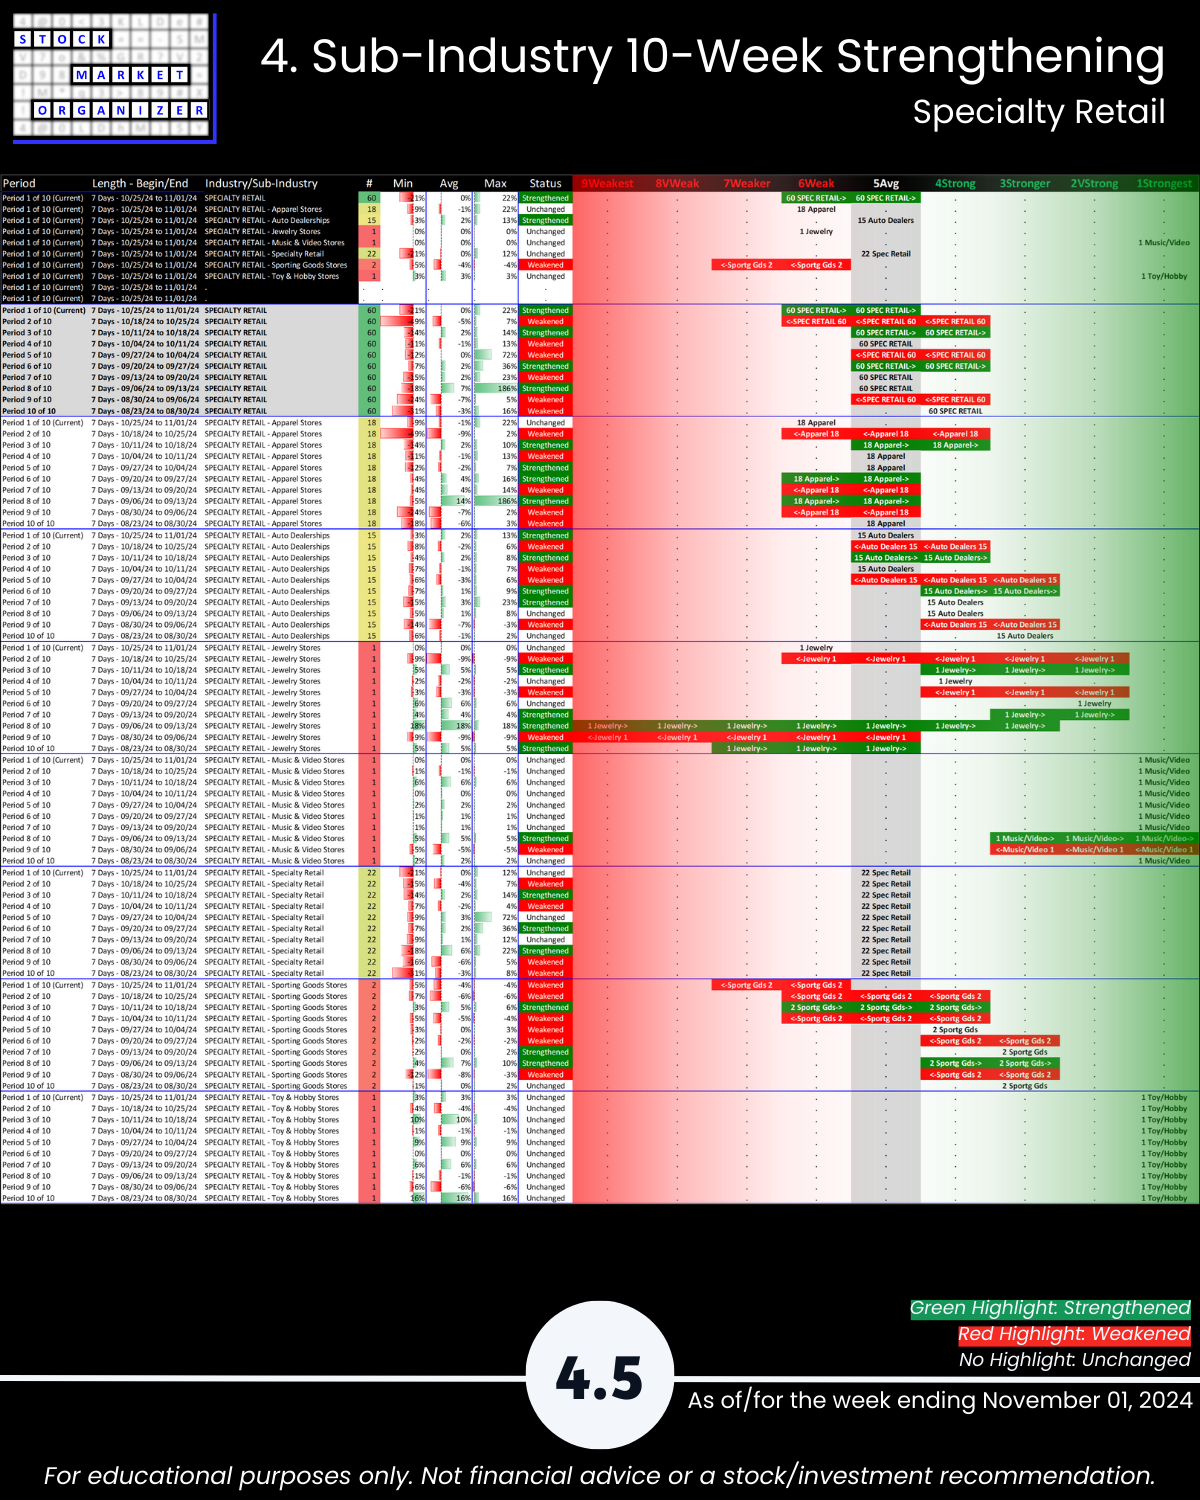
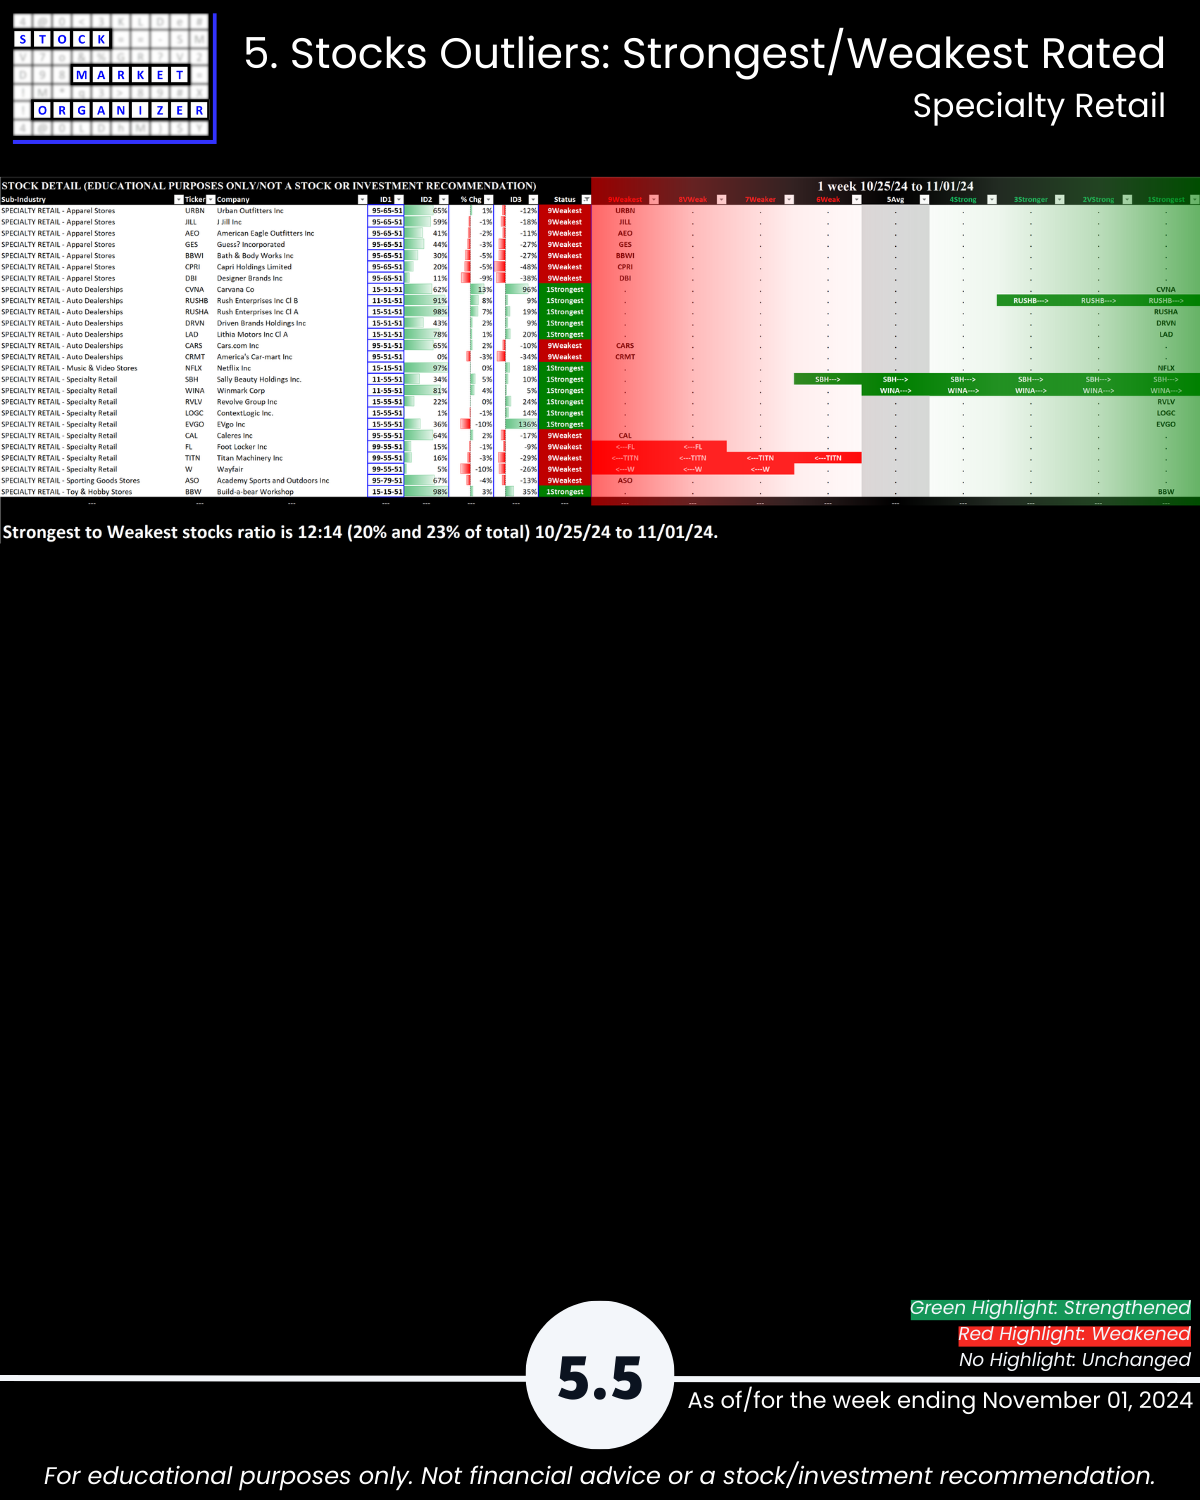
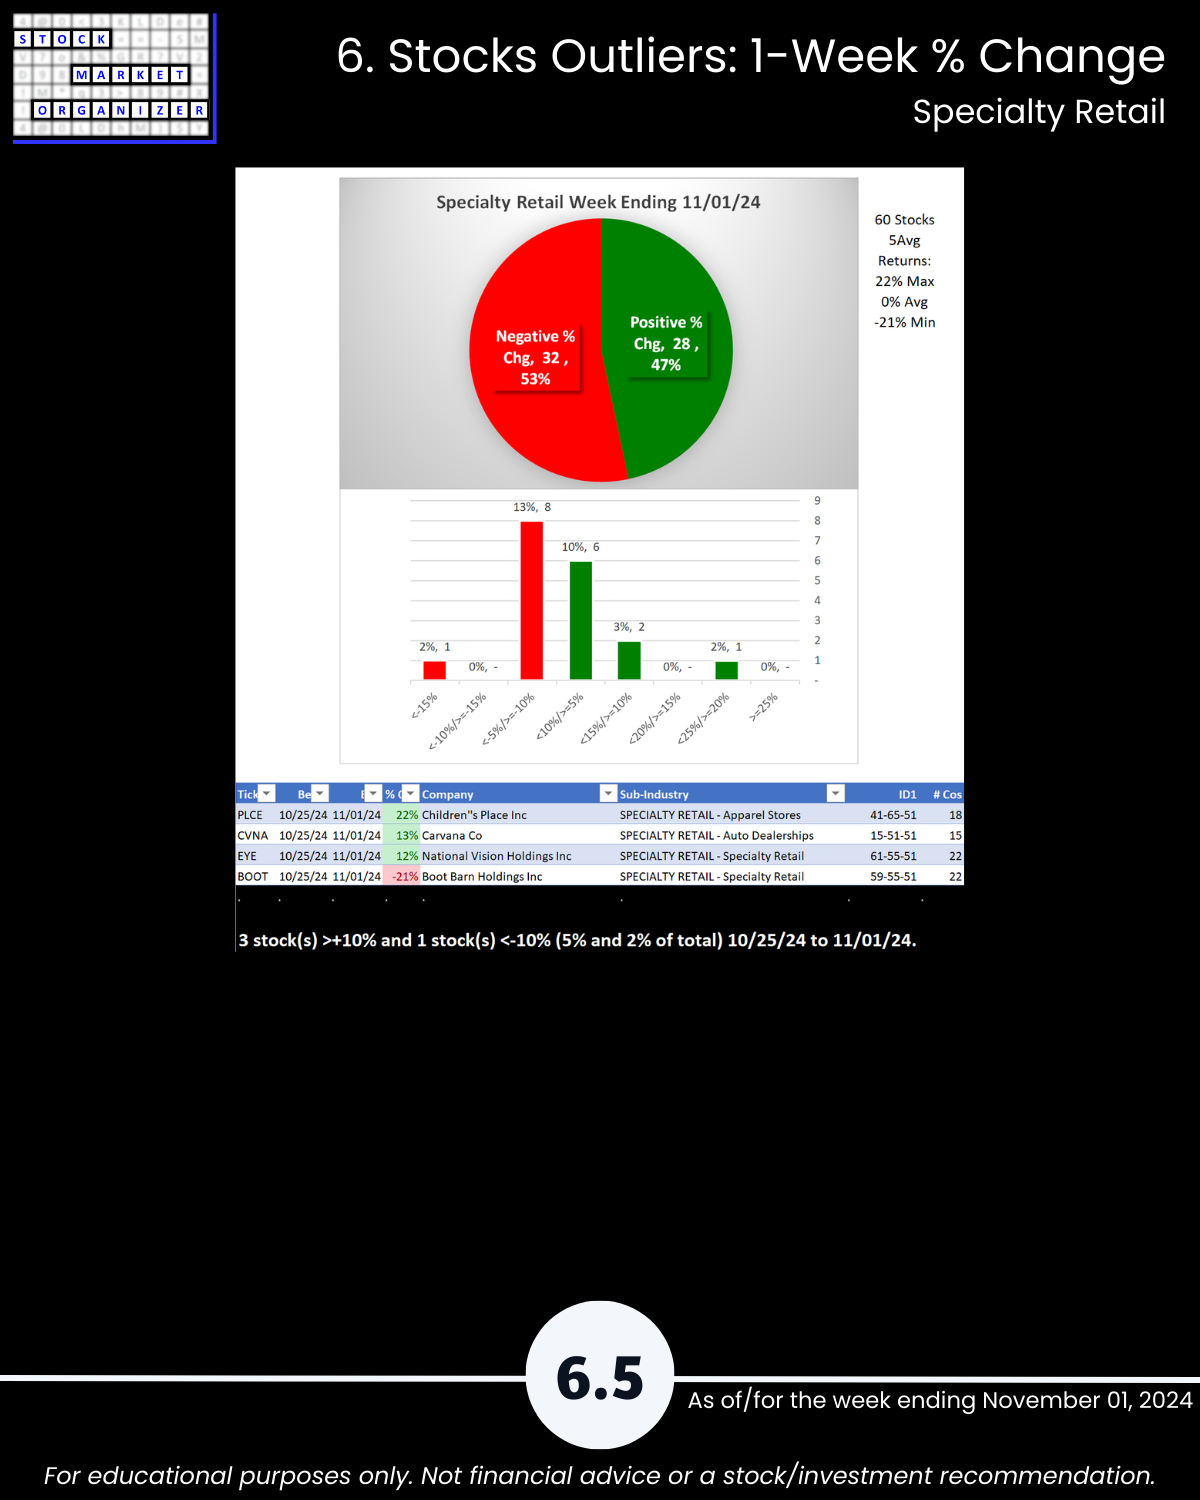
- Specialty Retail
Status
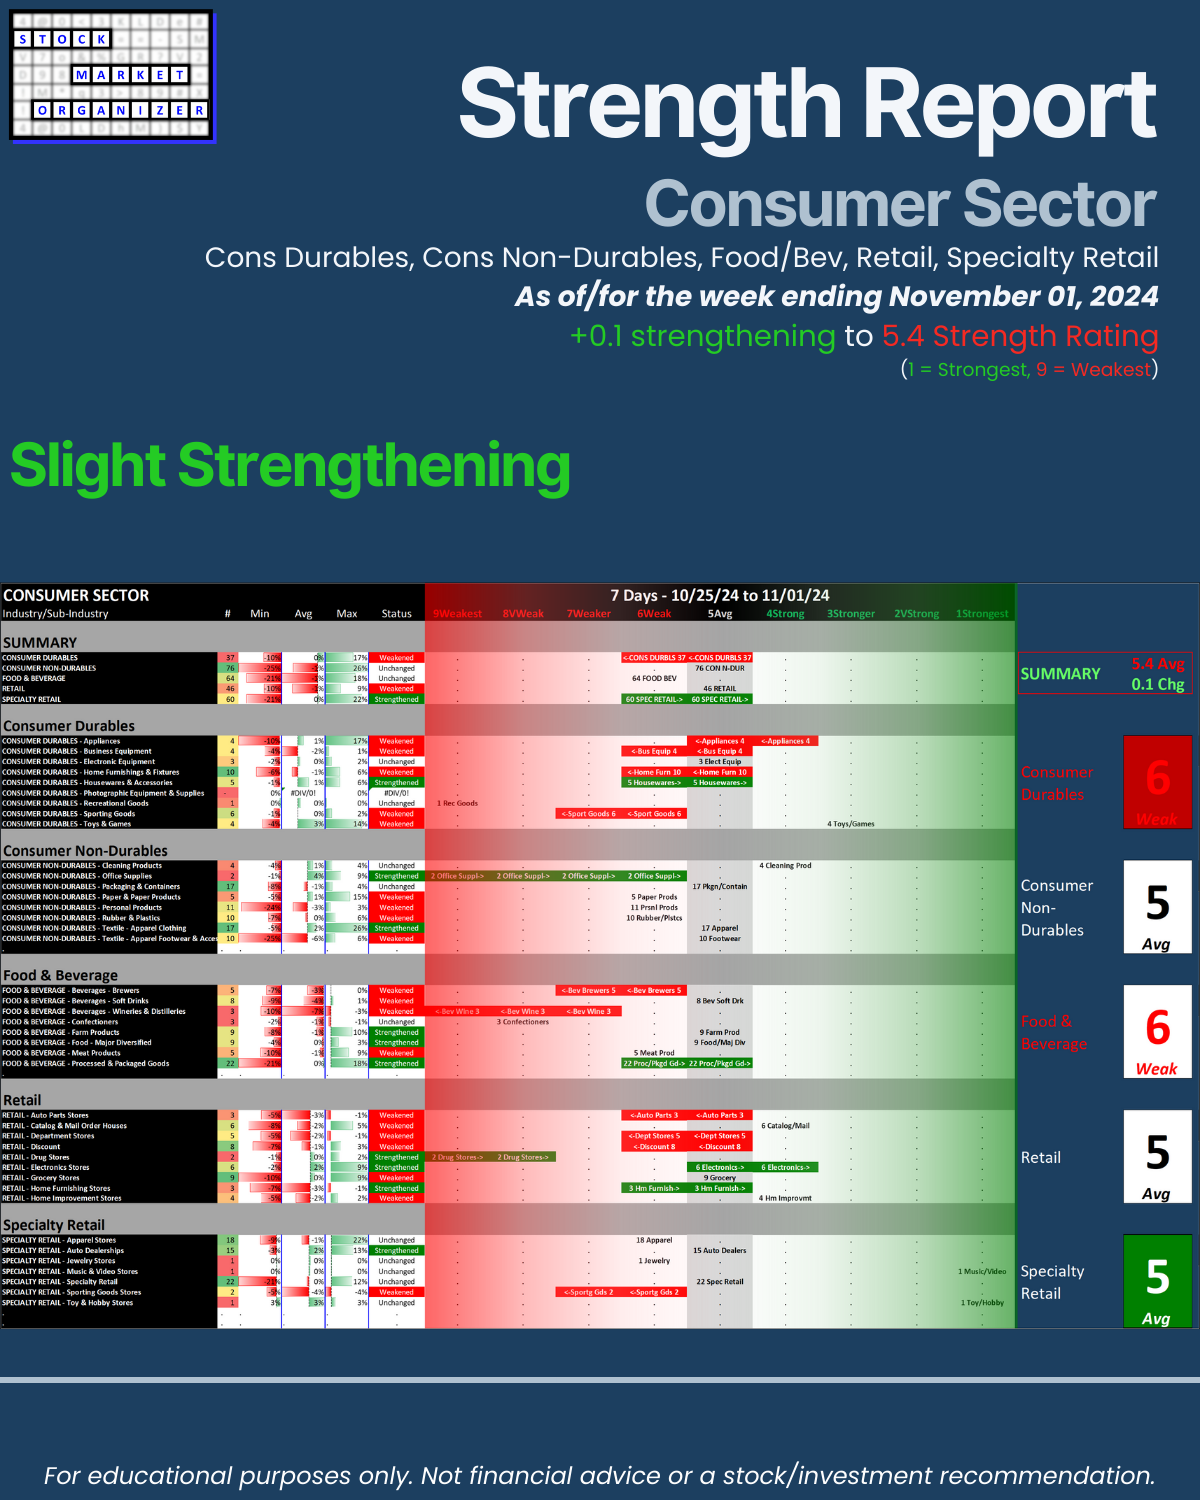
The Consumer Sector:
- Slightly strengthened this week by 0.1 points from a 5.5 to a 5.4 composite strength score. This is below average.
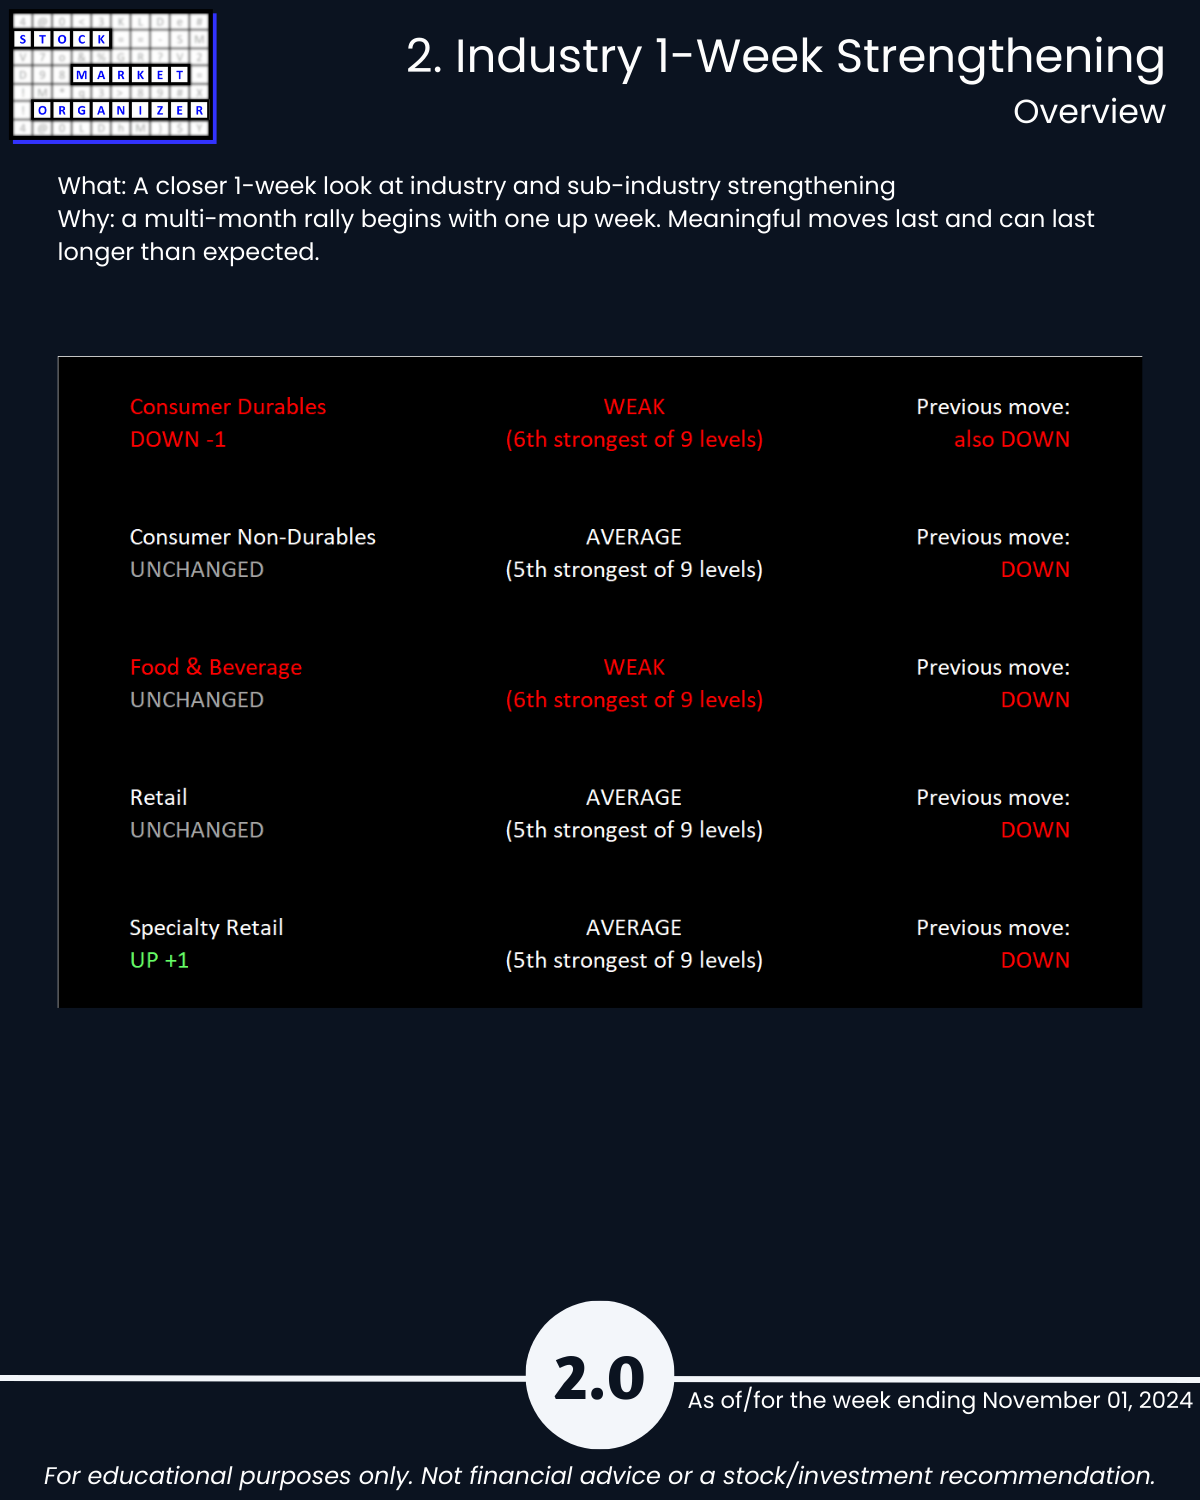
- Consumer Durables weakened one level and is tied with Food & Beverage at weakest of these industries at 6Weak, while the other three industries are at 5Average.
- Specialty Retail strengthened one level.
Difference This vs. ETFs Analysis
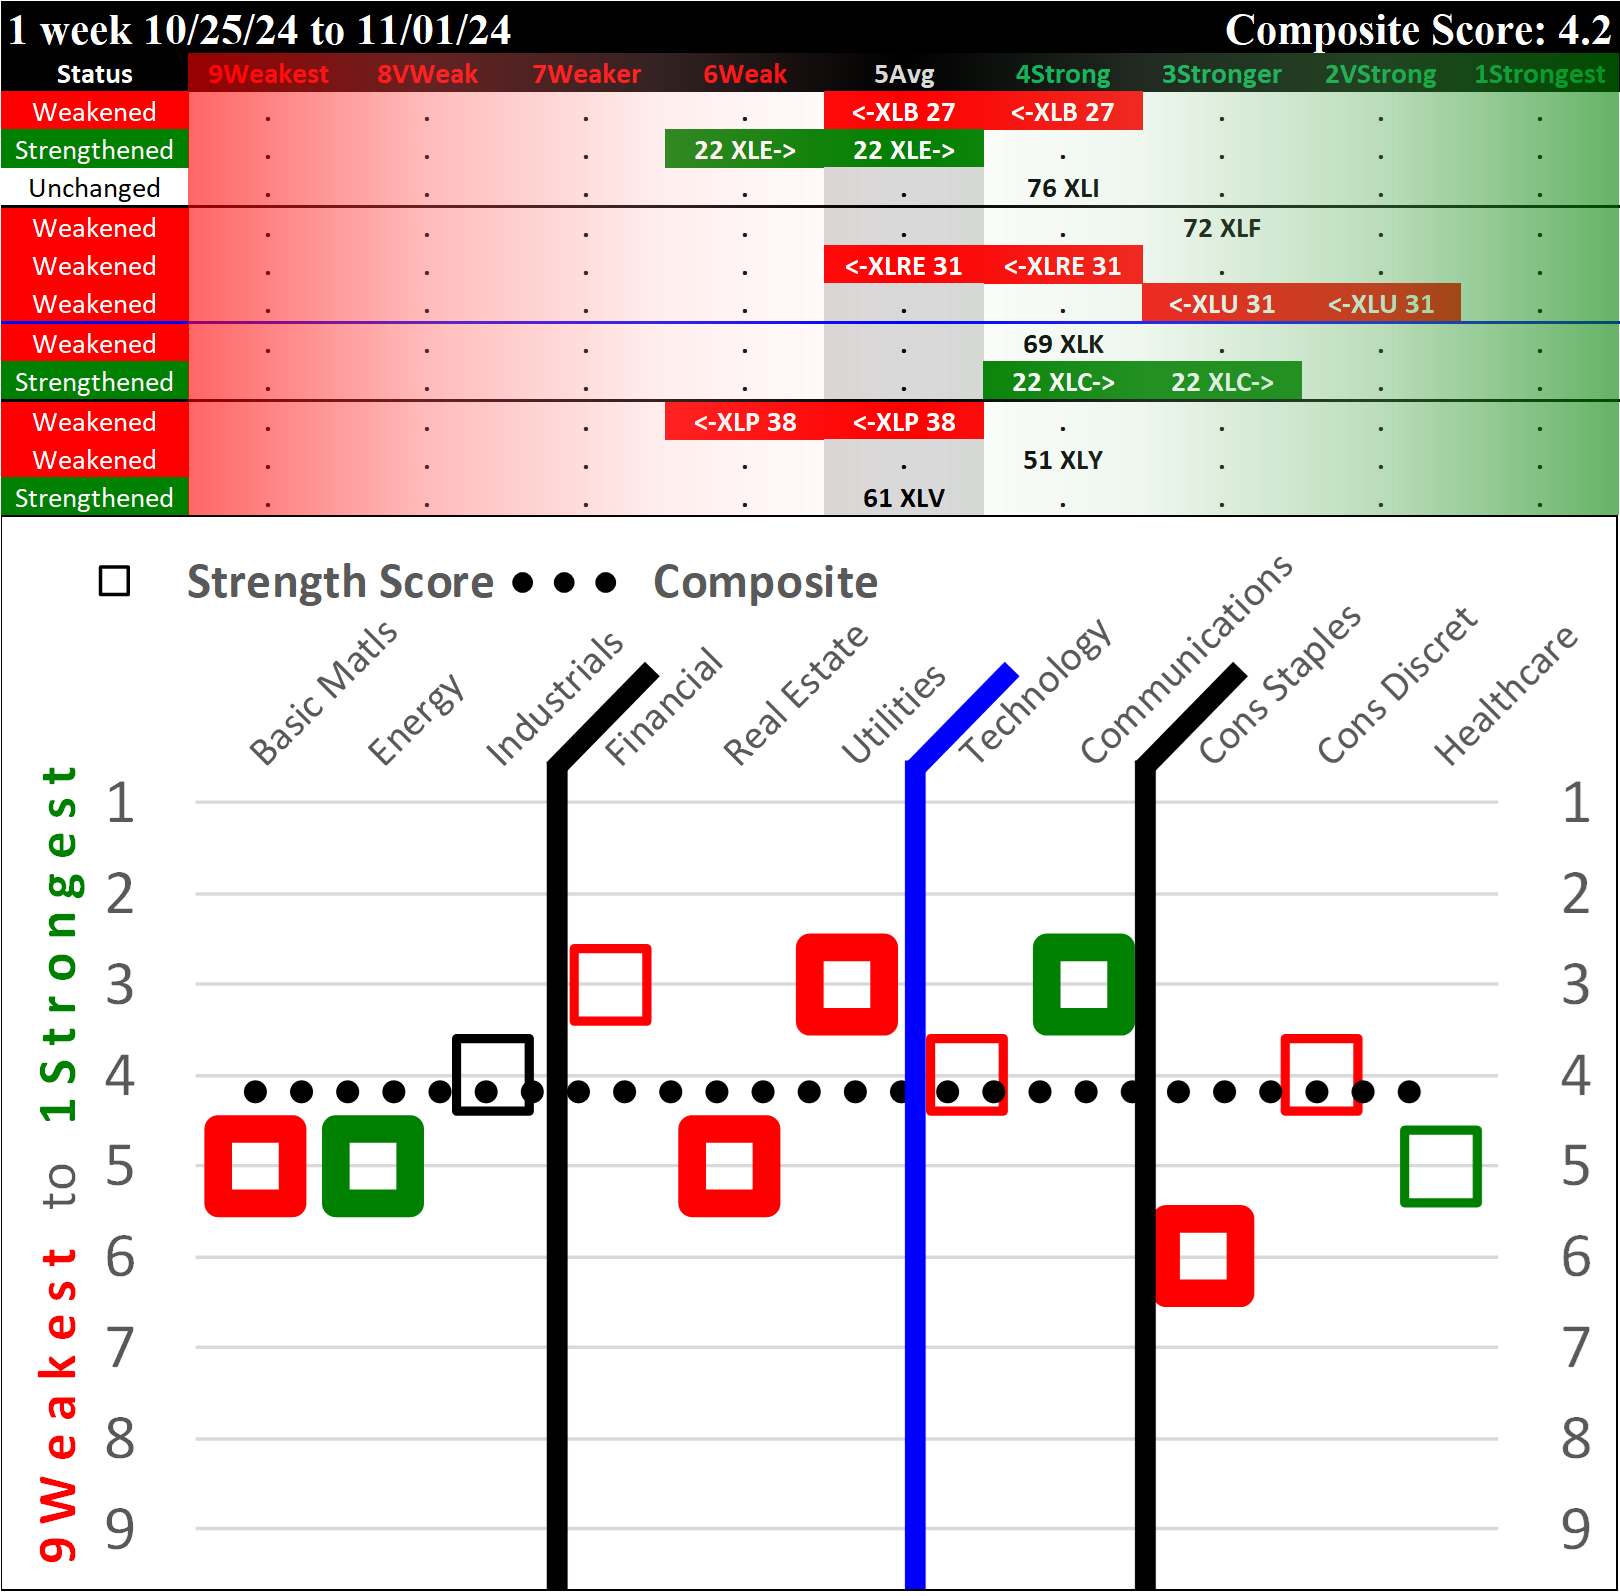
Note this analysis is the same as that used for the SPDR ETFs (here's the most recent example from Friday, November 1) but the two main differences are
1. Universe of stocks. The ETFs are the largest capitalization stocks, 500 of them in the 11 sector ETFs. In this analysis, there are approximately 2,700 stocks.
2. Sub-categorization below the market level. The ETF analysis with 500 stocks is limited to sector strengthening and weakening. This analysis with +/-2,700 stocks can be and is segregated into 29 industry groups and in turn 189 sub-industry groups.
There are two Consumer ETFs - XLP/Consumer Staples and XLY/Consumer Discretionary. See below for their standing relative to the 9 other ETFs:
How would I use this information?
The Market Strength Score is now negative and the two relevant sector ETFs (XLP/Consumer Staples and XLY/Consumer Discretionary) weakened for the week ending yesterday. Between the two, the weakening in actual rating of XLP/Consumer Staples to 6Weak indicates it is comparatively weaker than XLY/Consumer Discretionary, which weakened but remained at a 4Strong rating.
Based on this analysis of the larger stock universe, the Consumer Sector is essentially flat over the past week. There is nothing in this more broad analysis that would lead me to a different conclusion than those reflected in the Consumer ETF analysis.
Therefore, XLP/Consumer Staples offers better new short opportunities for available capital. I would not recommend opening new longs in stocks from either ETF, given their weakening and the overall market weakness per the Market Strength Score. Below is the current detail from the two Consumer Sector ETFs, including a listing of all component stocks:
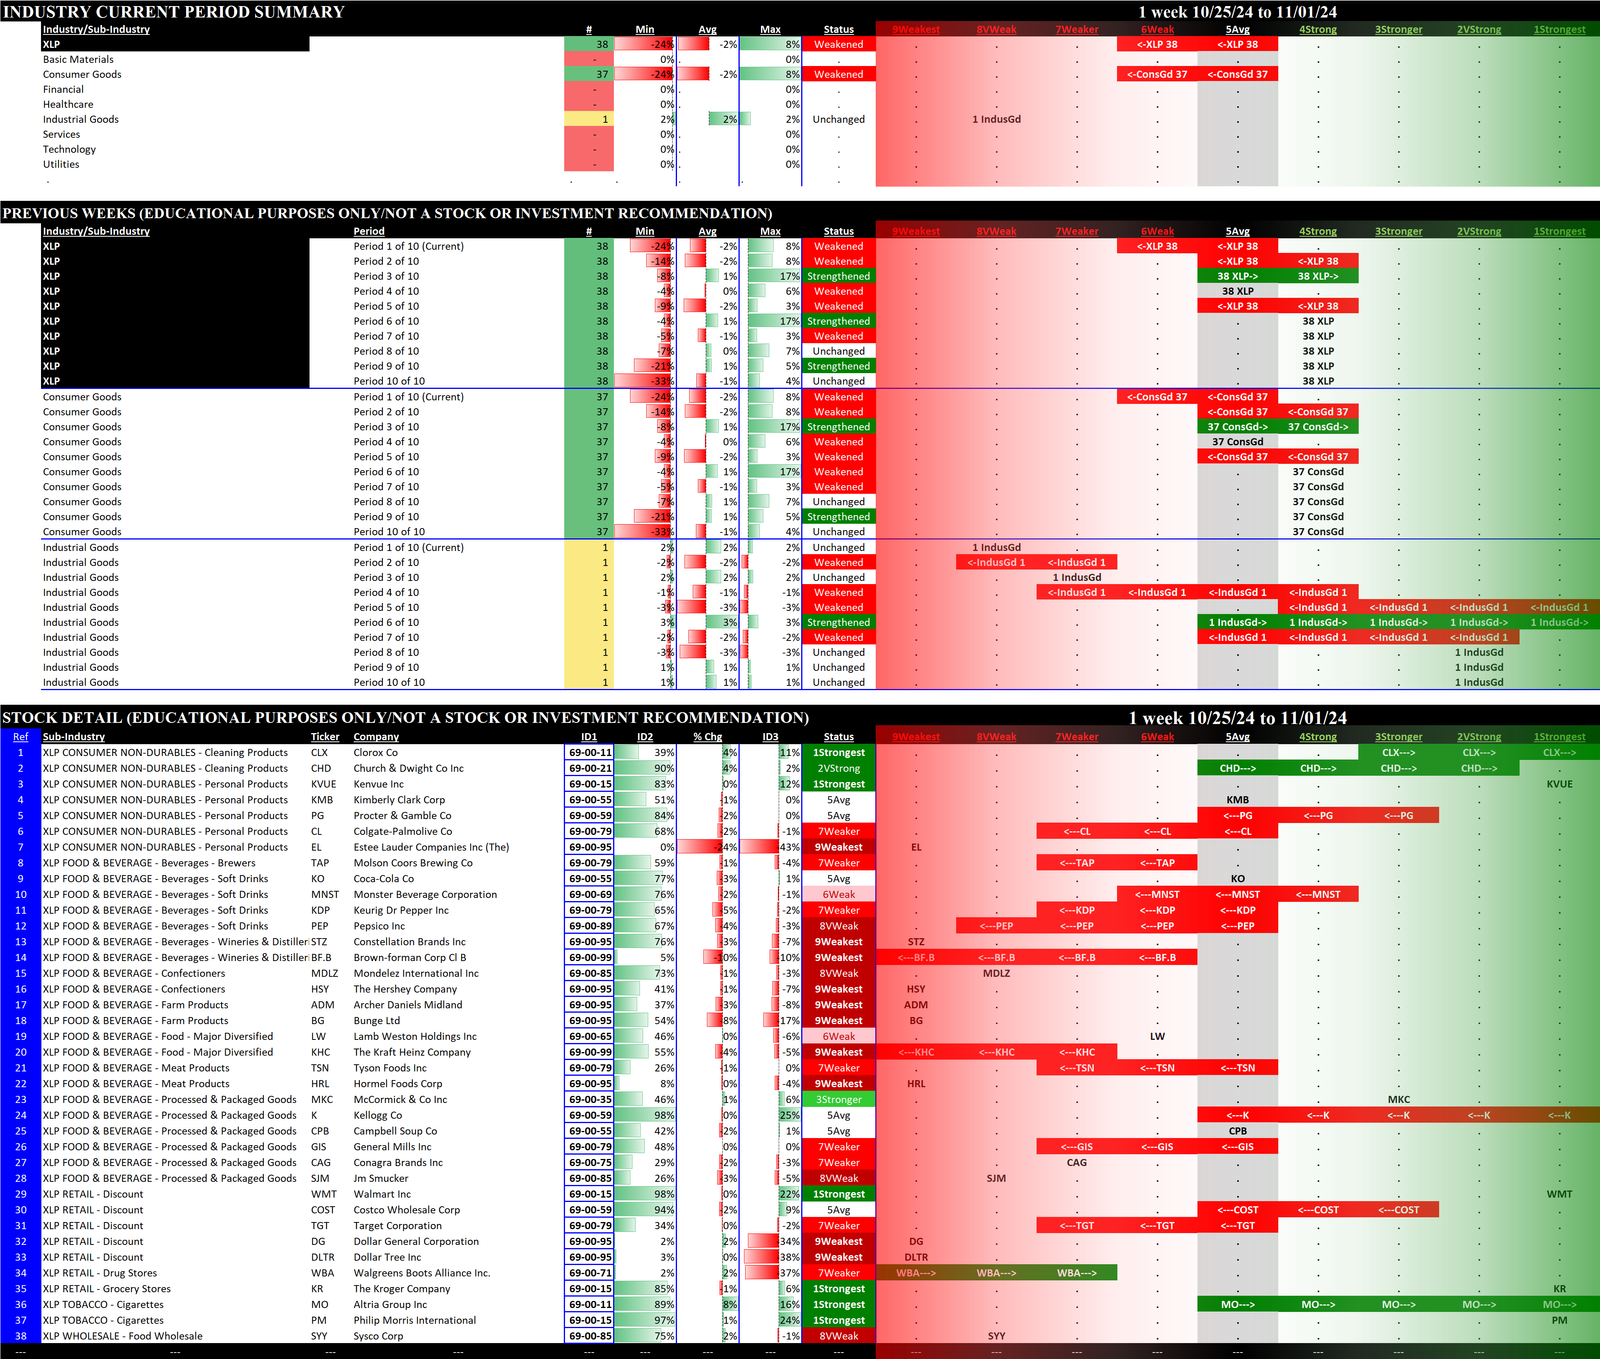
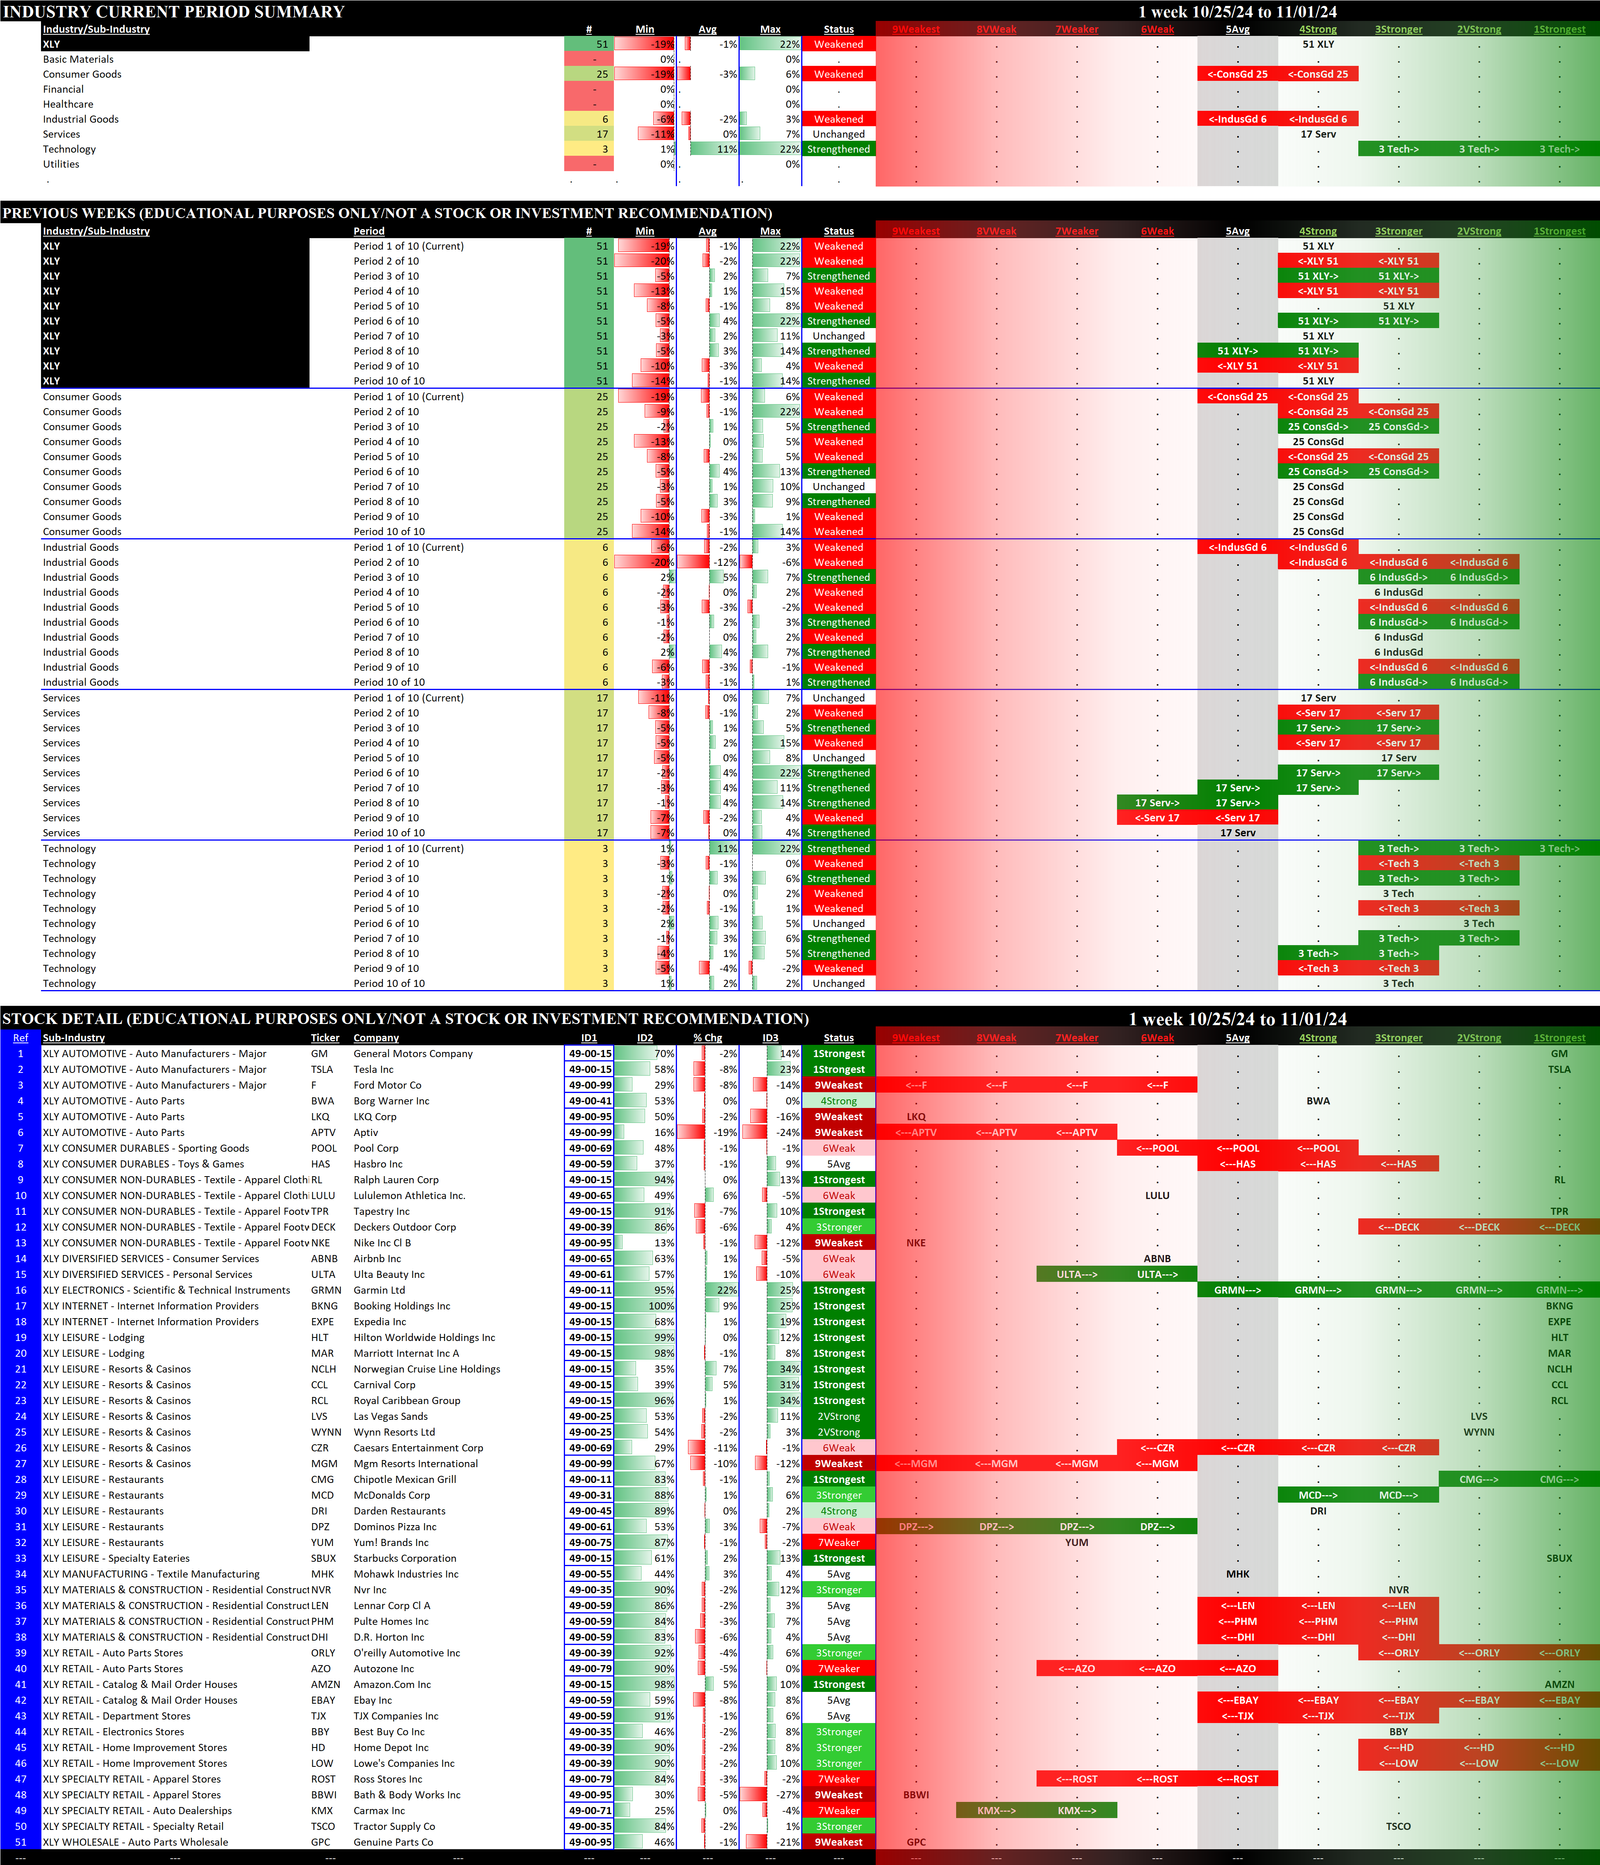
The detail for XLP/Consumer Staples (which has 38 stocks) shows 7 stocks from the Consumer Non-Durables industry and 21 stocks from the Retail industry. Meanwhile, XLY/Consumer Discretionary (which has 51 stocks) includes stocks from a broader array of industries, and includes 25 stocks from the Consumer Sector and 17 stocks from the Services sector (based on the Stock Market Organizer-defined 8 sectors).
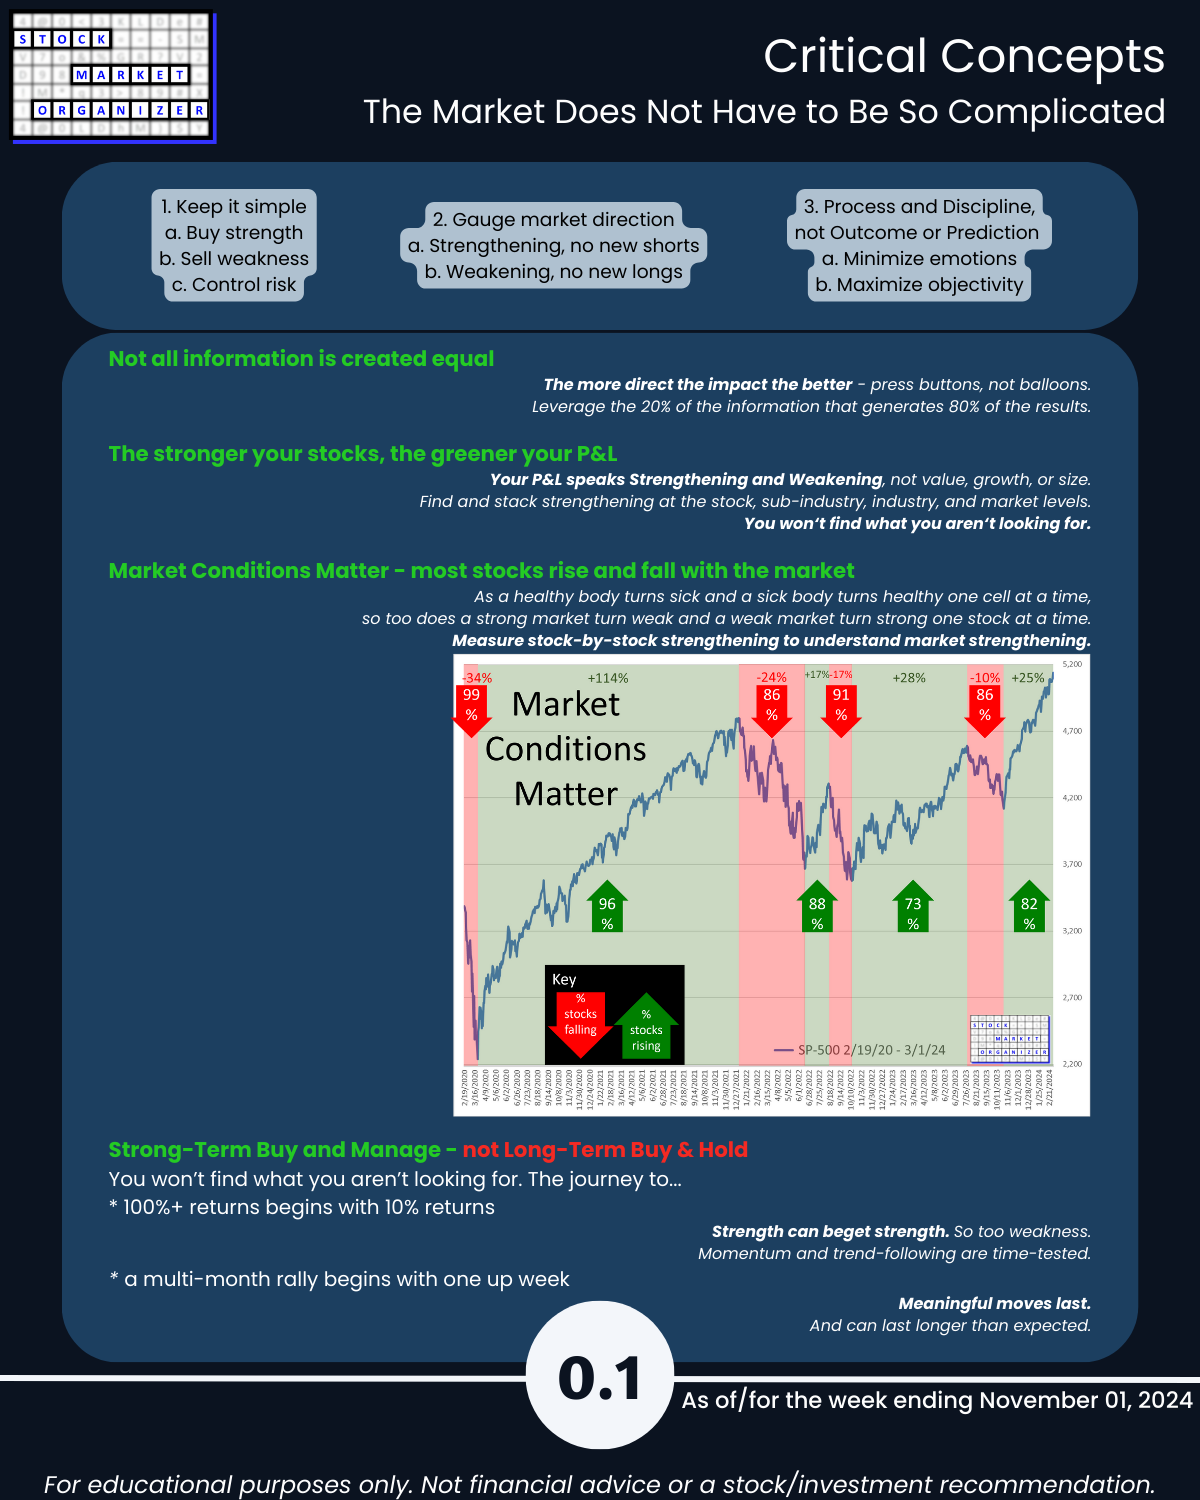
There is absolutely no way of determining how long this environment will last. All one can do is find an objective way of measuring whether any given environment offers headwinds or tailwinds and then act accordingly based on these measurements.
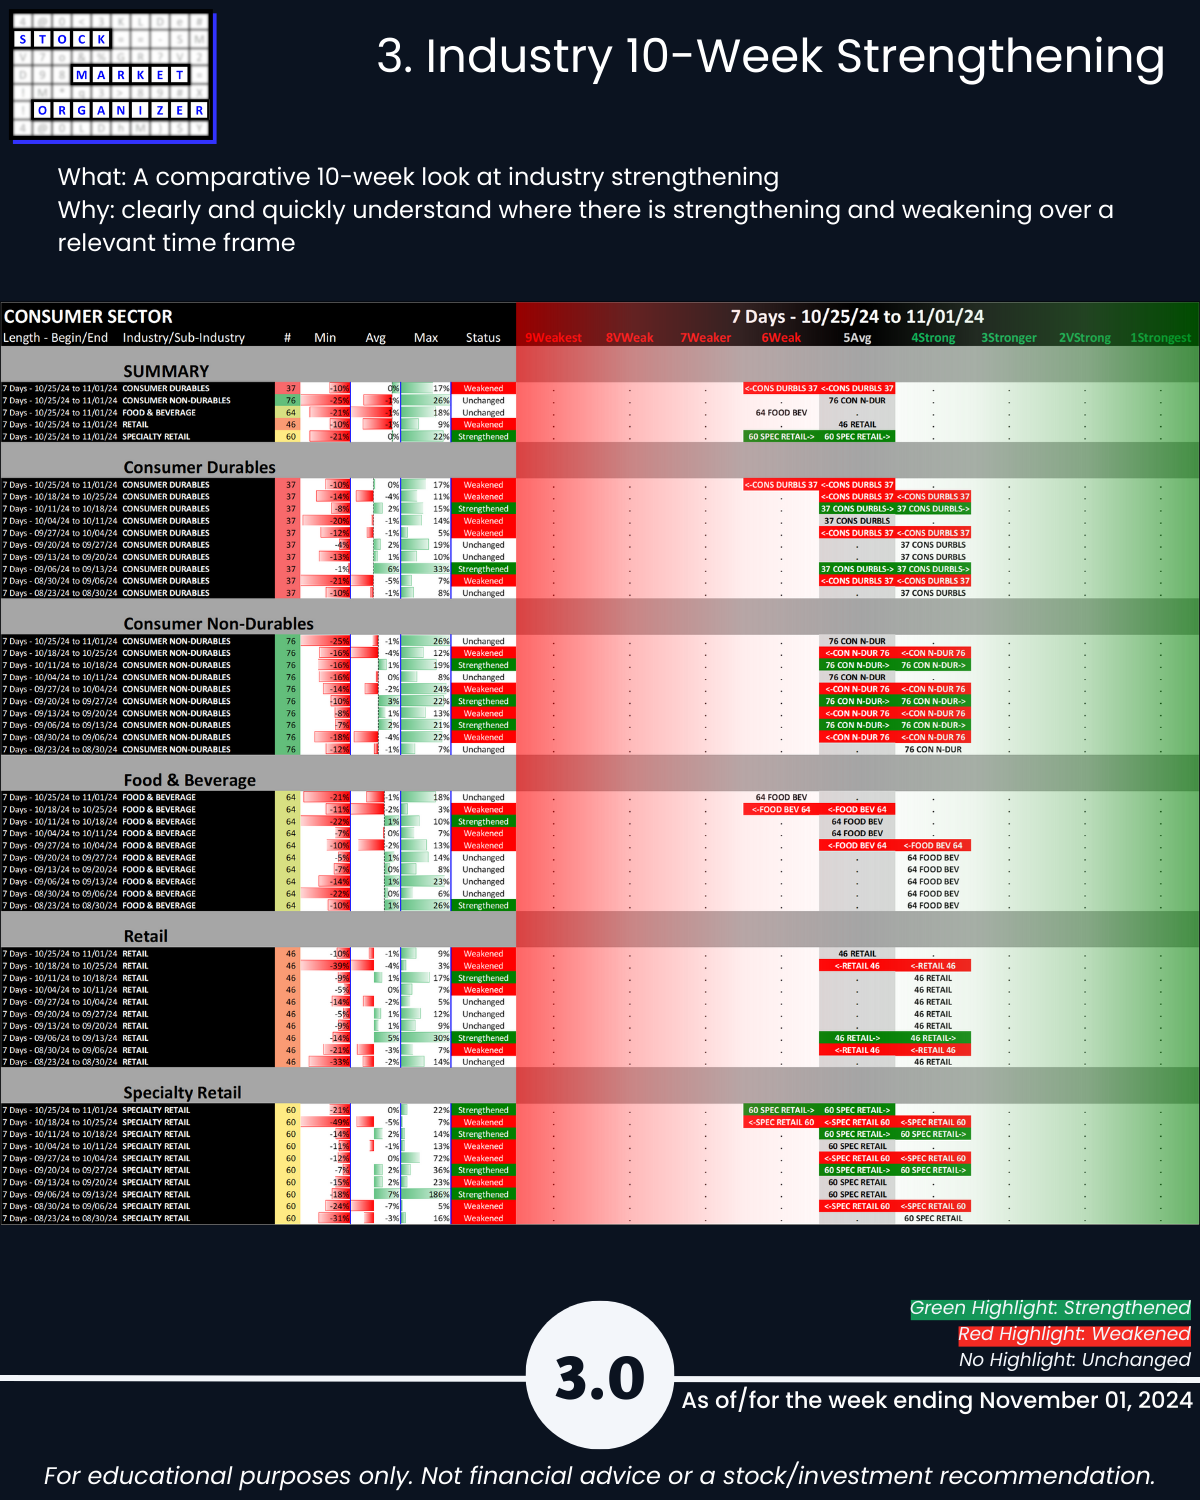
Details are below shown in a manner not available elsewhere because I created it from scratch to continually answer this question: “Where is there strengthening and weakening in the market at the stock, sub-industry, industry, and sector levels?” Combine this with the top-down Market Strength Score and Sector Risk Gauge to get a key competitive advantage of understanding strength at every level.
1. Introduction
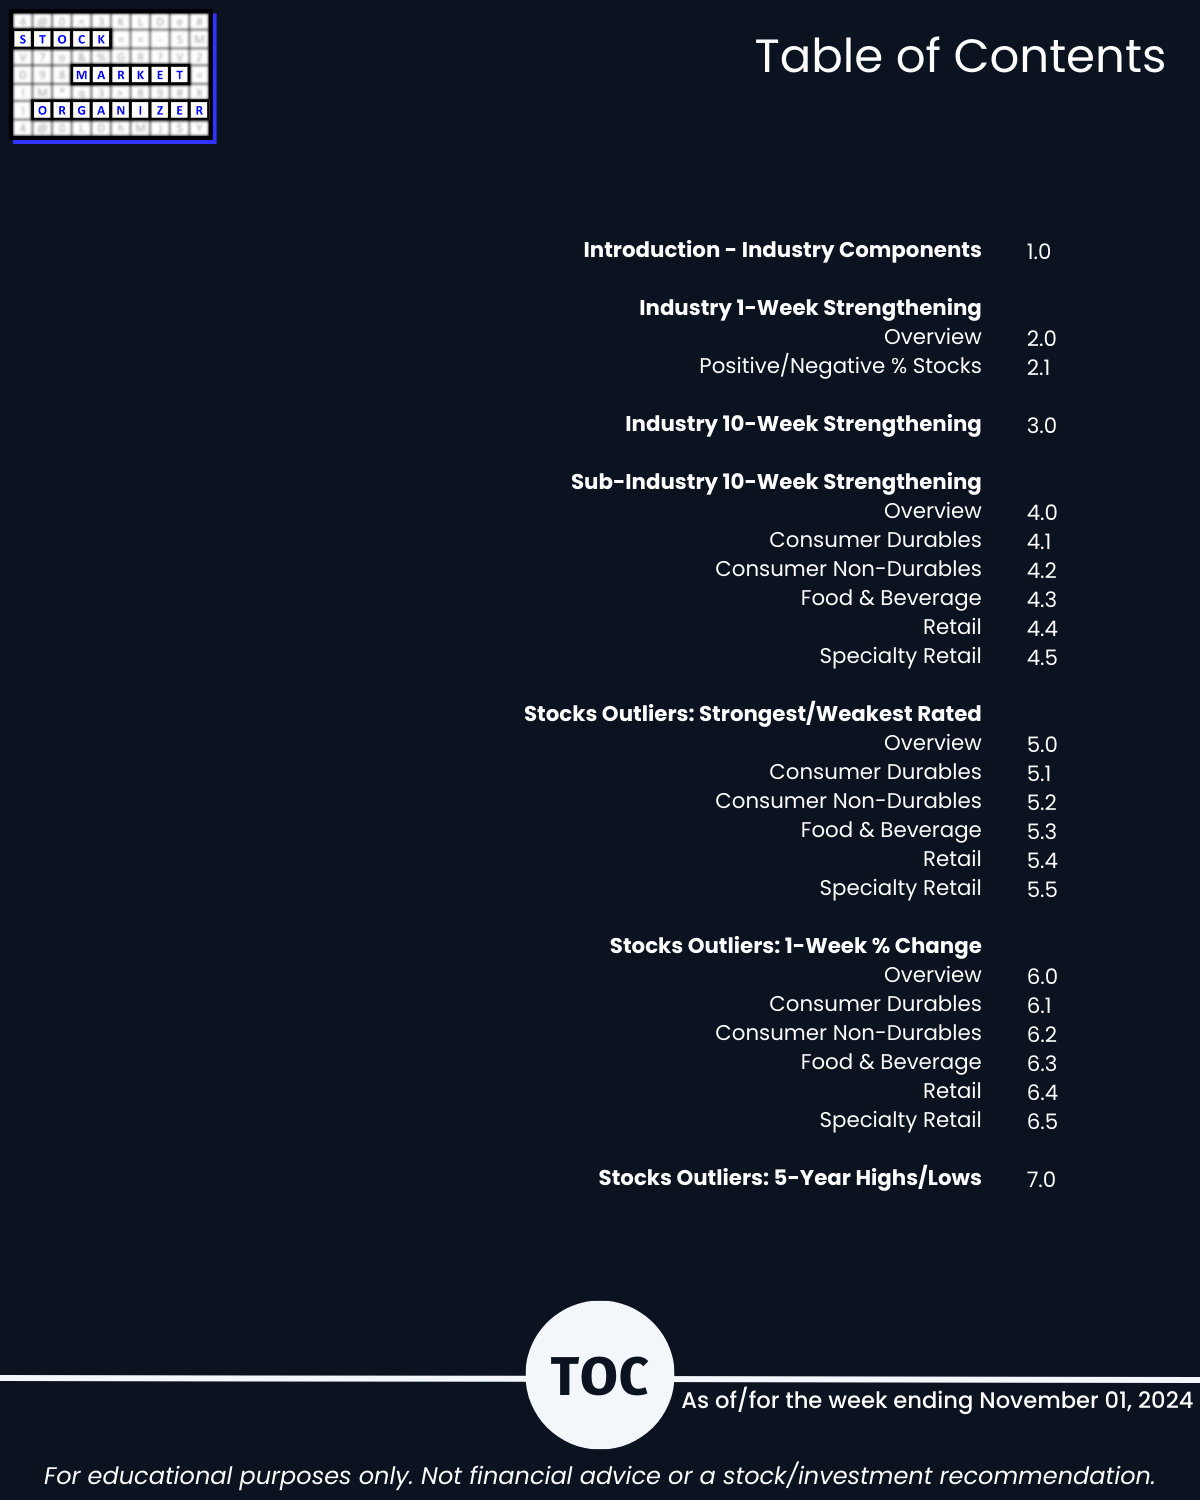
2. Industry 1-Week Strengthening
3. Industry 10-Week Strengthening
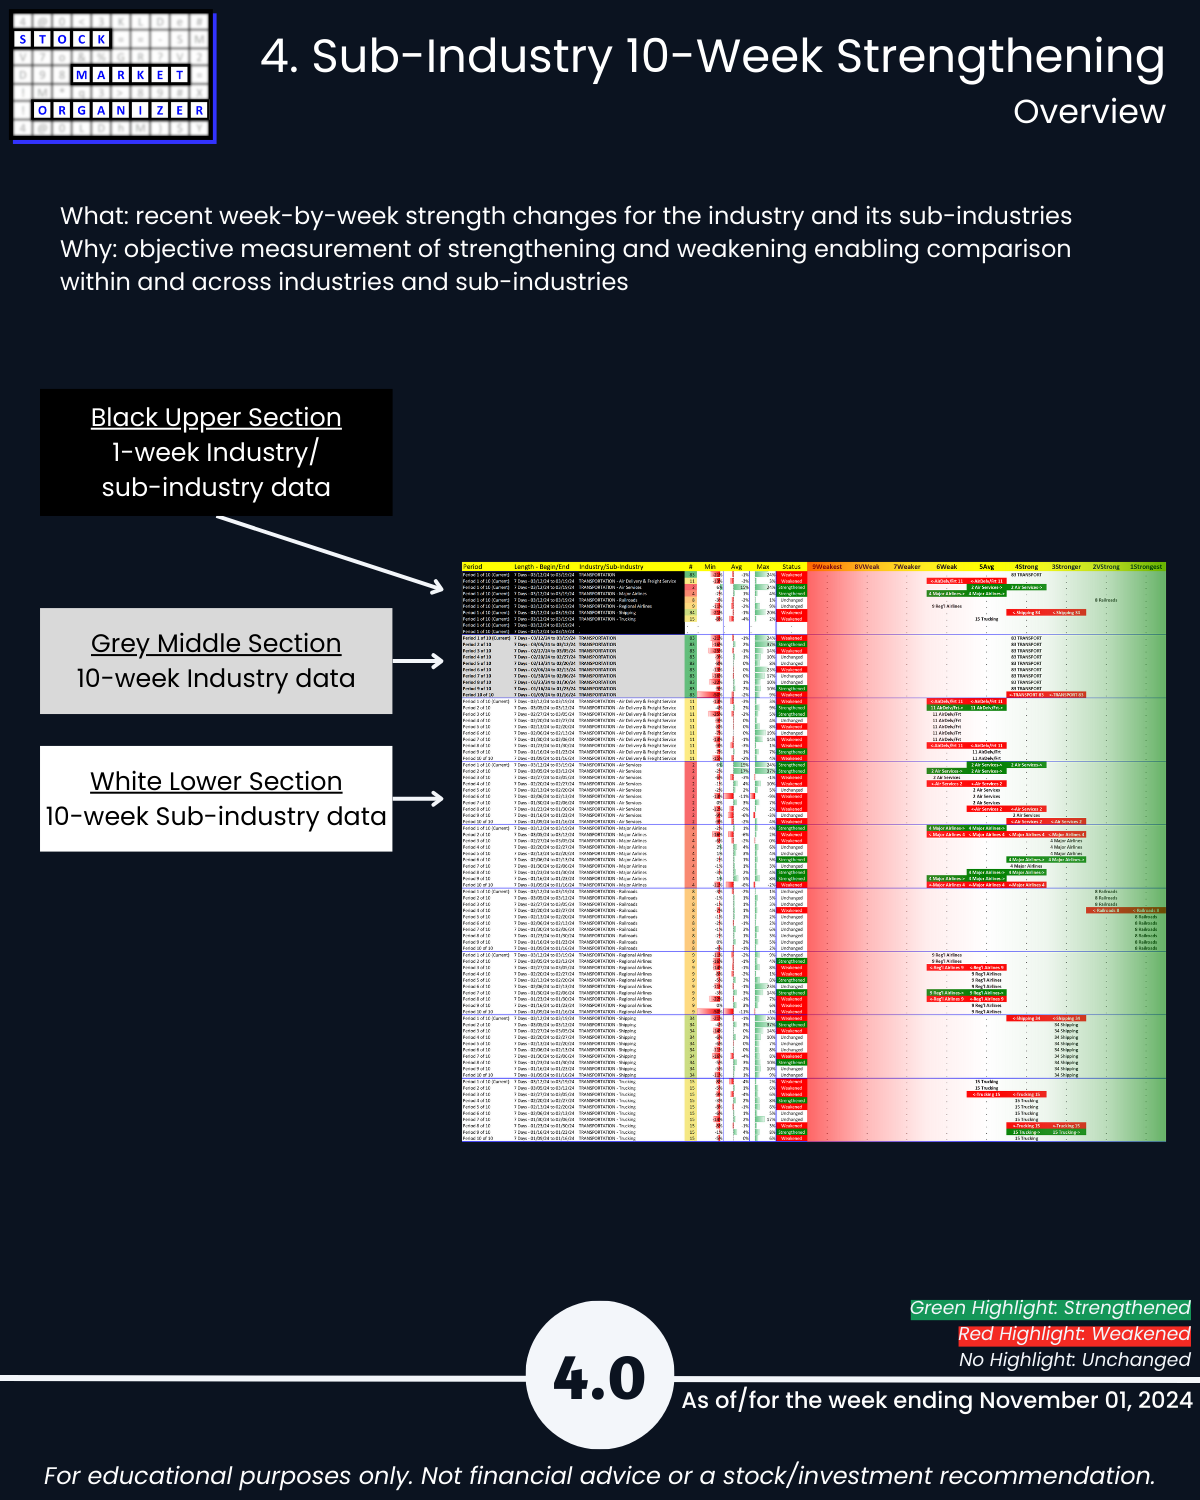
4. Sub-Industry 10-Week Strengthening
5. Stocks Outliers: Strongest/Weakest Rated
6. Stocks Outliers: 1-Week % Change
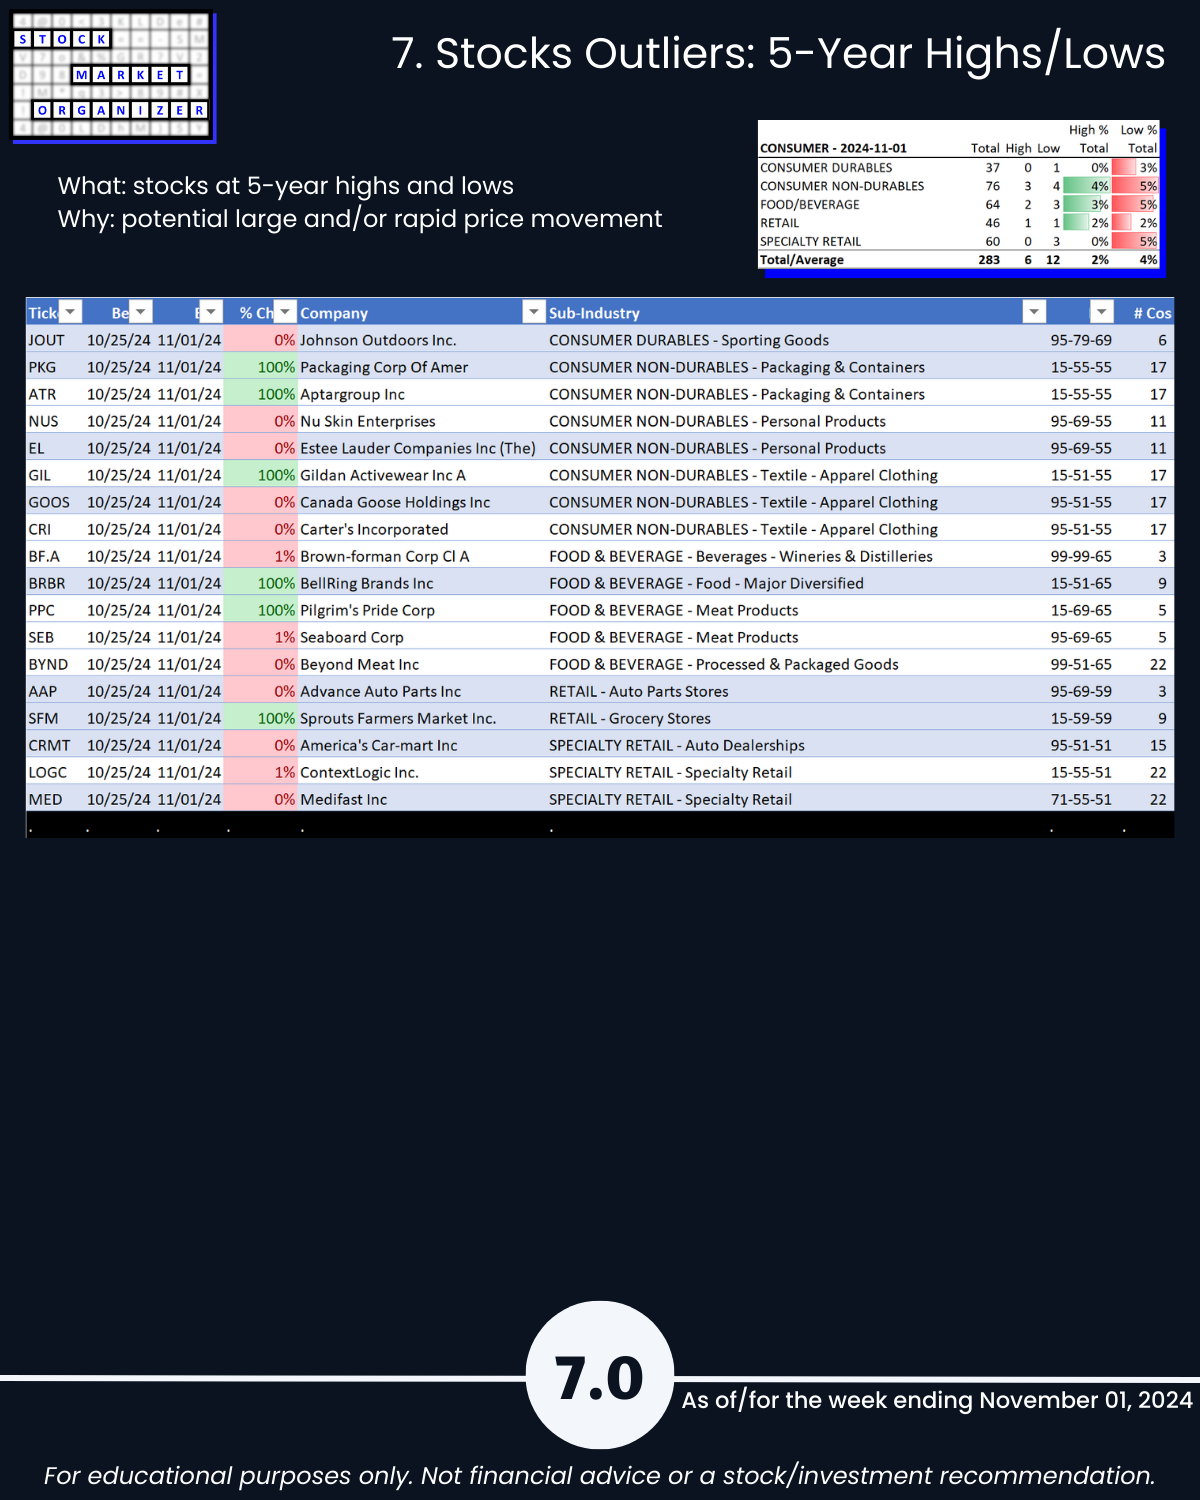
7. Stocks Outliers: 5-Year Highs/Lows