SMO Exclusive: Strength Report Consumer Sector 2024-04-12

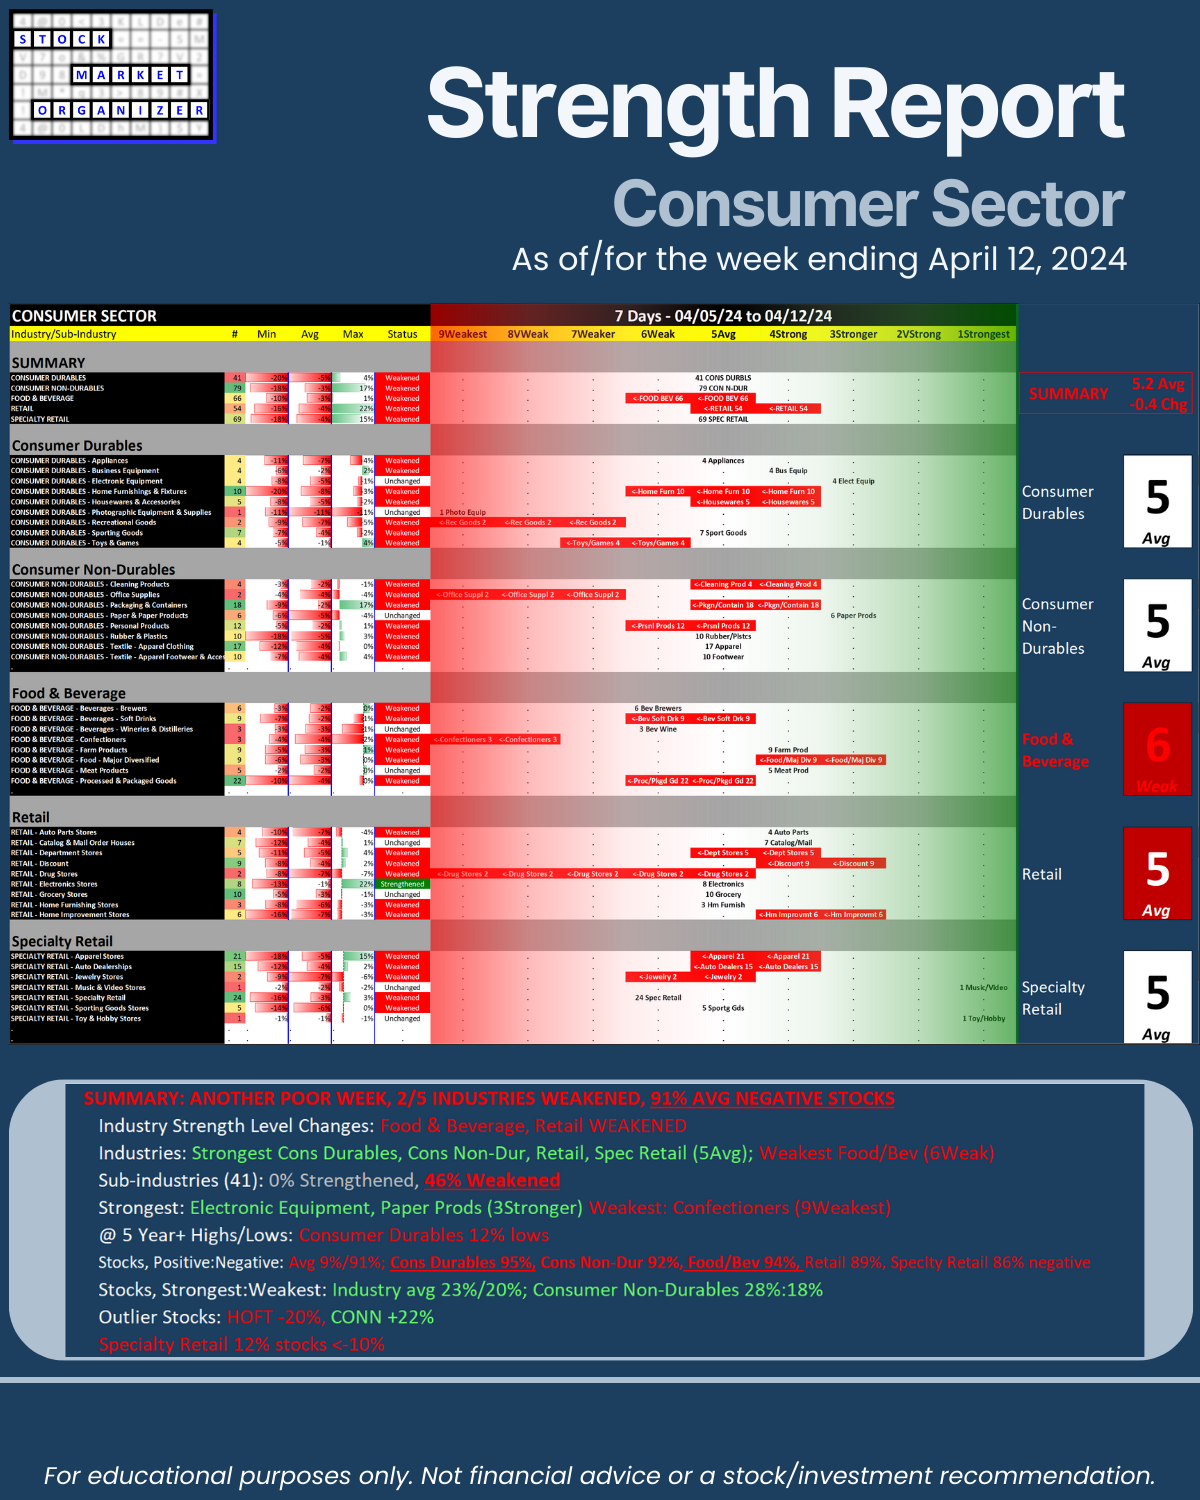
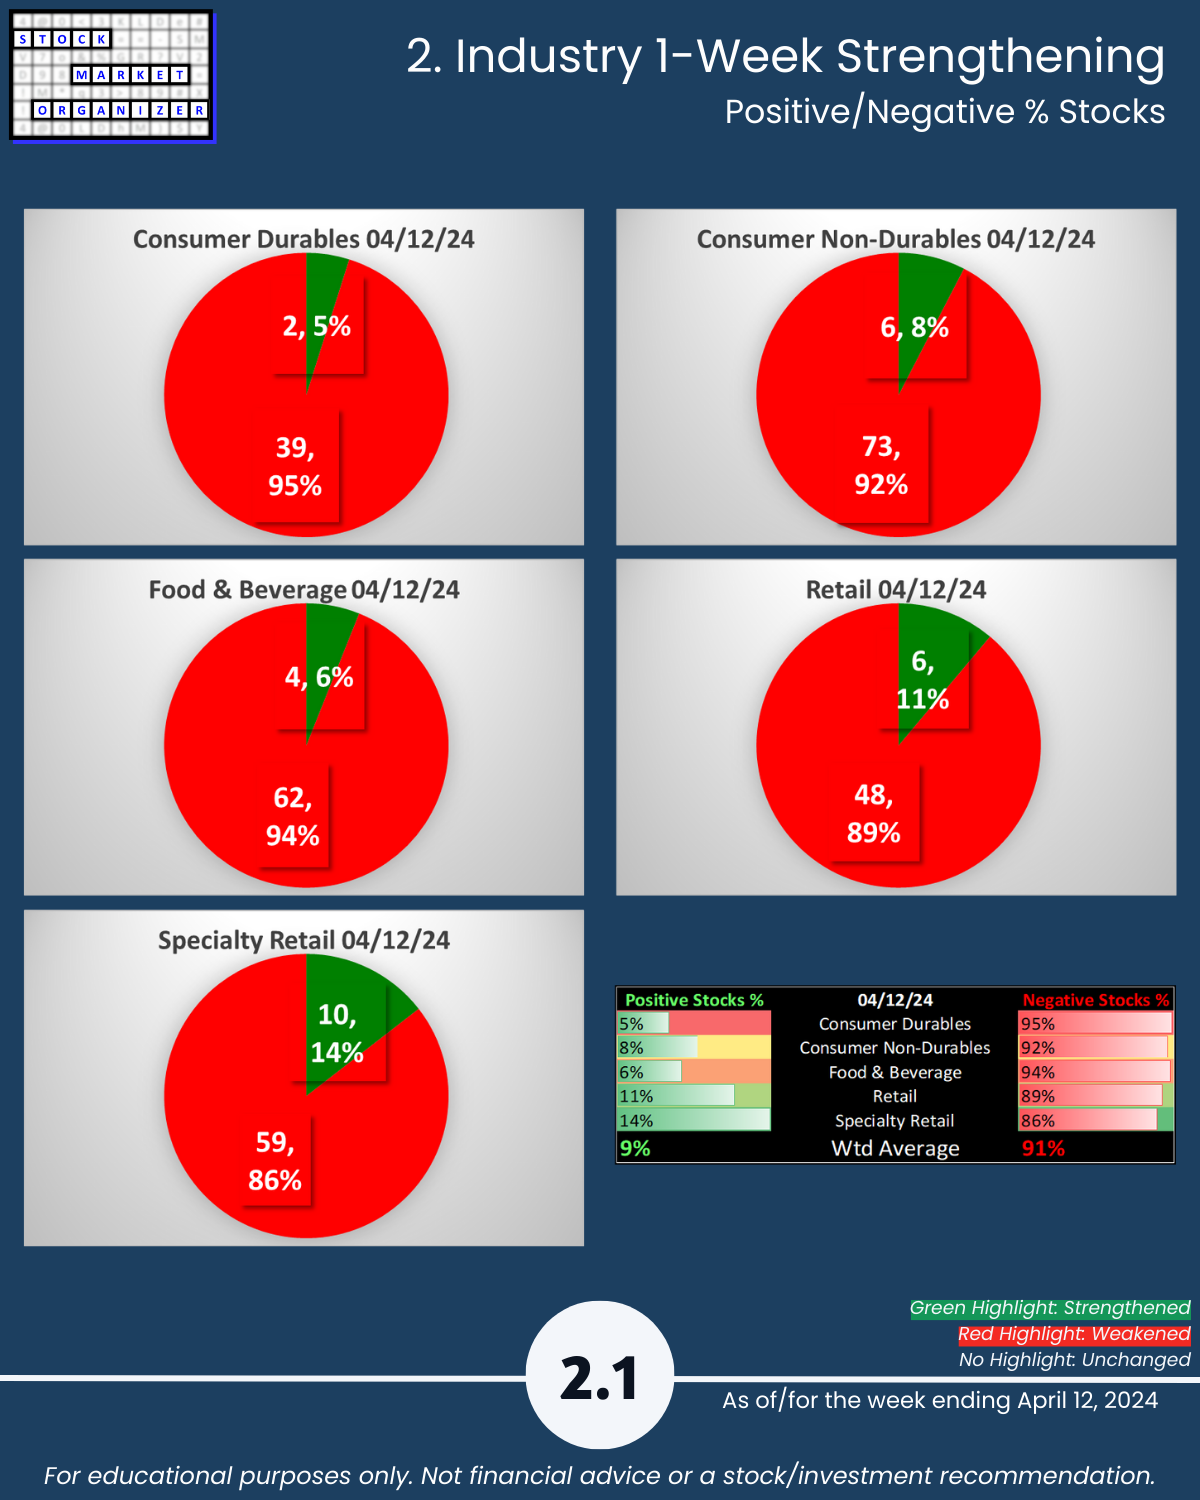
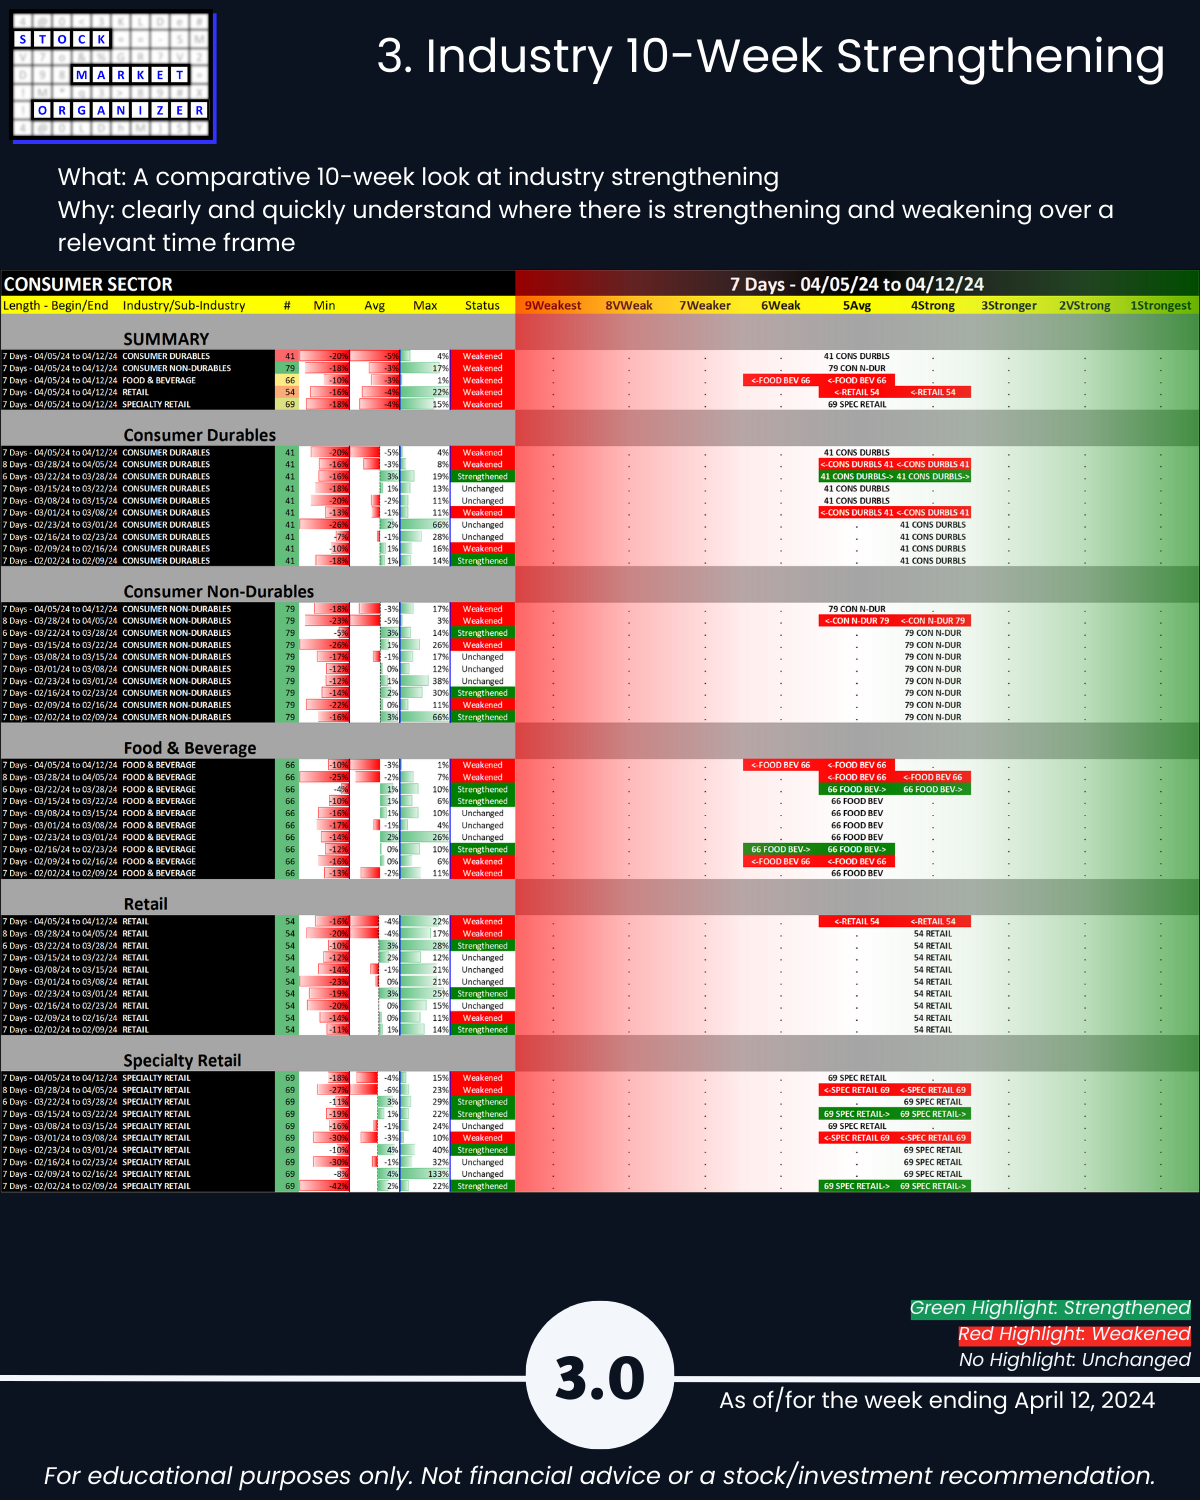
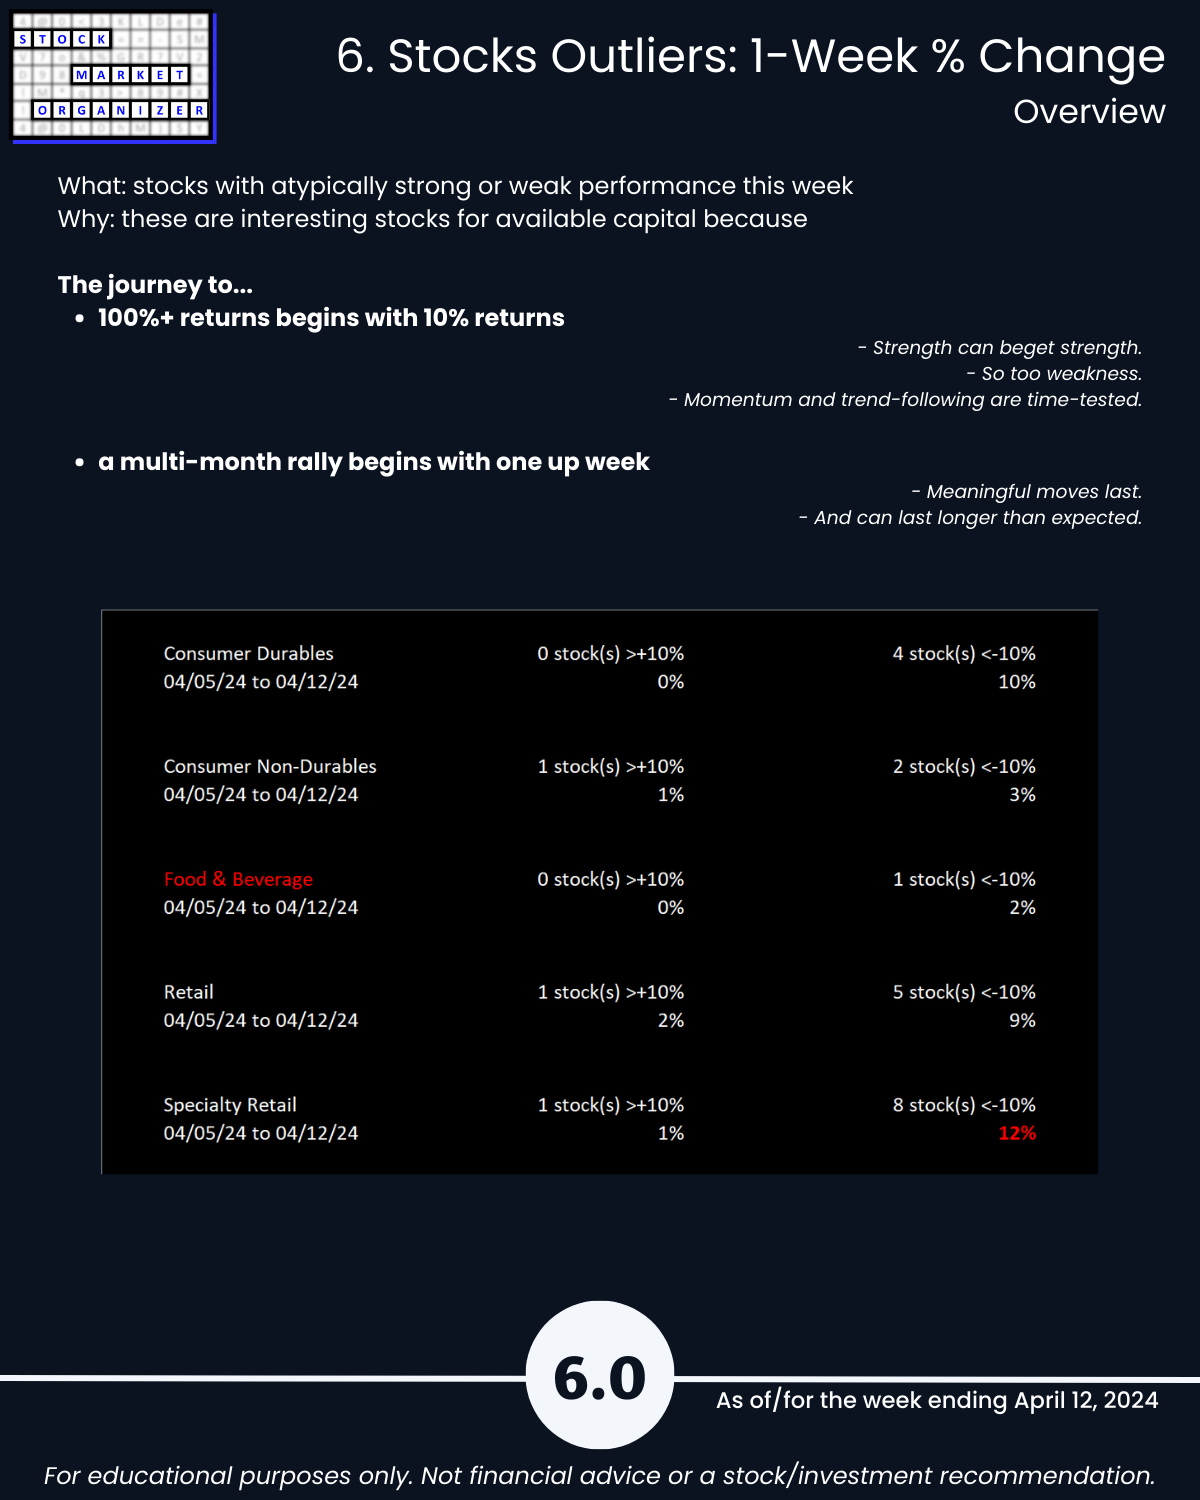
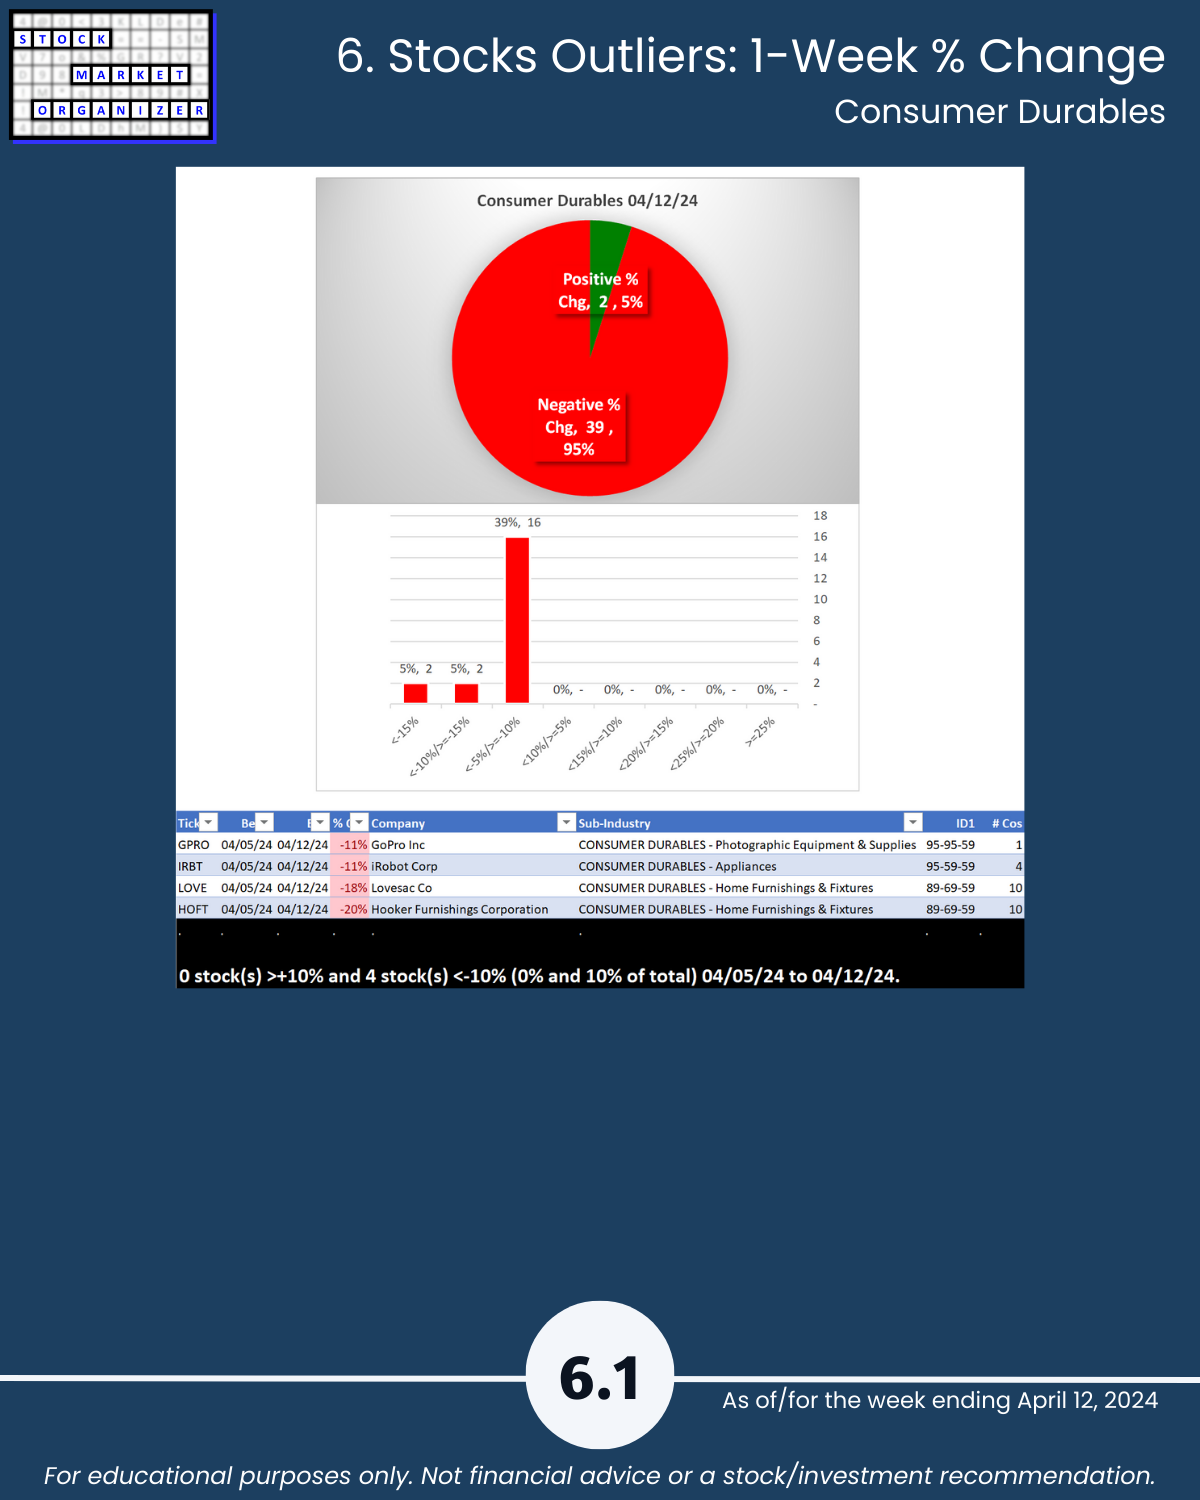
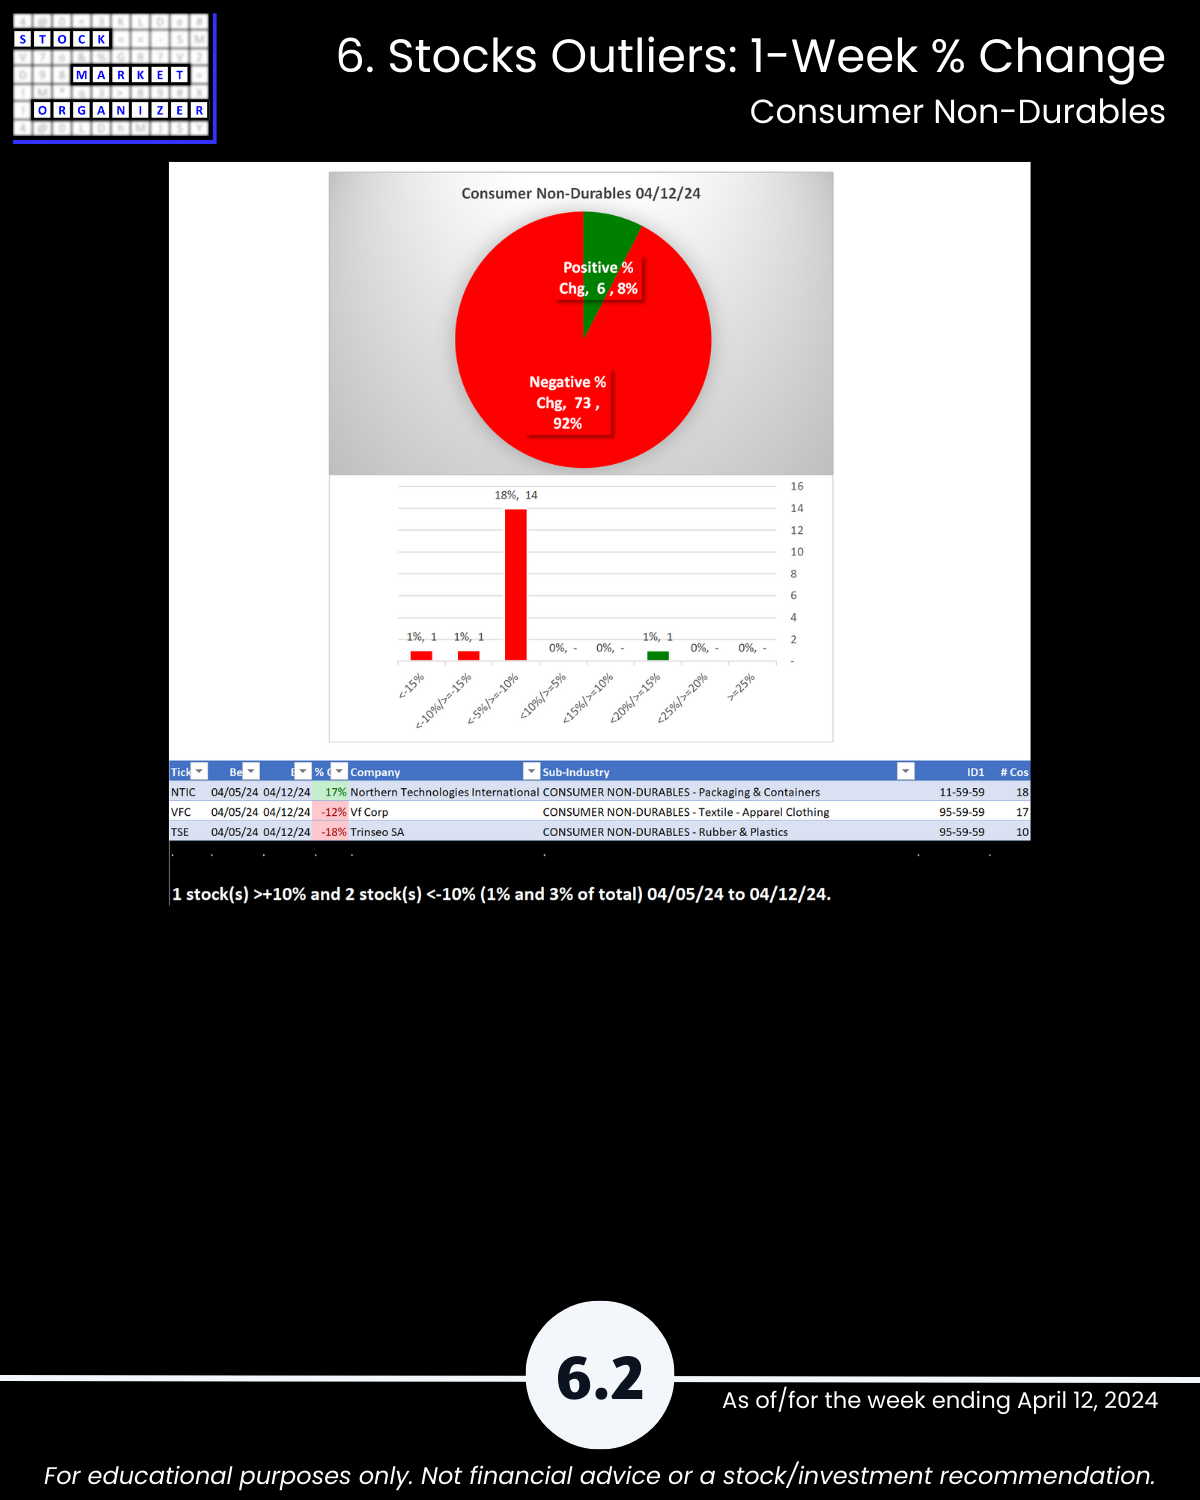
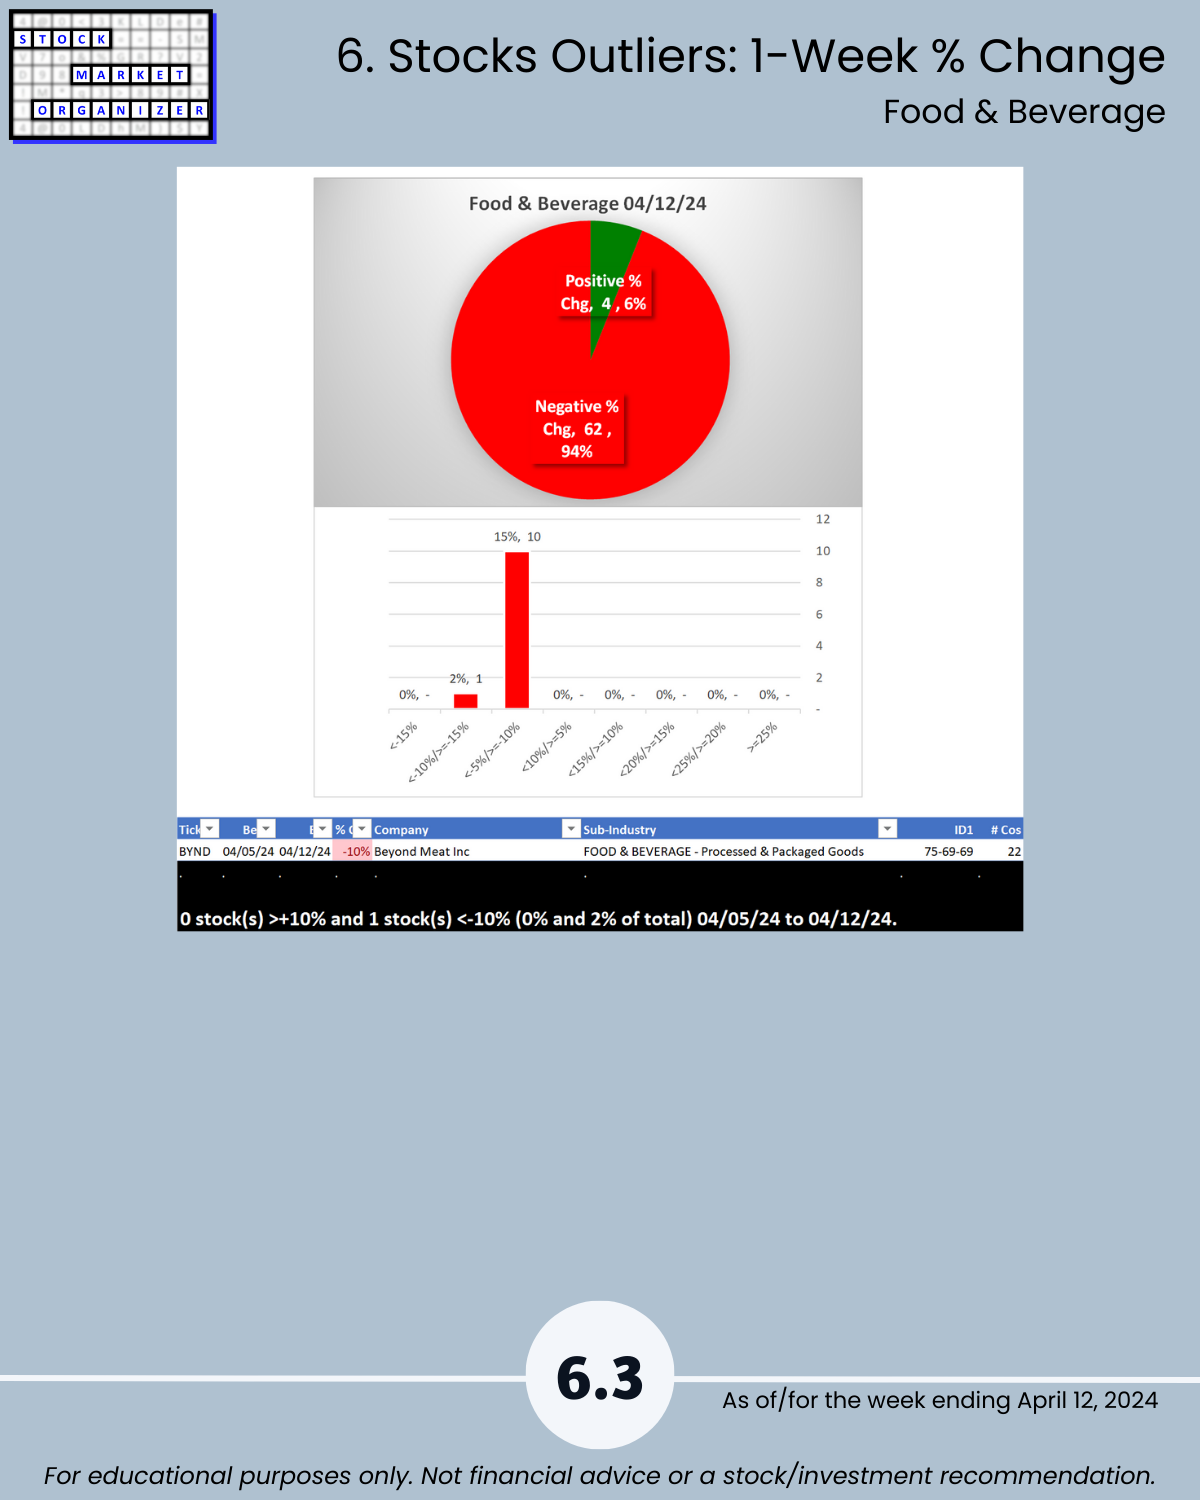
Consumer Sector stunk 4/5/24 and has another clunker 4/12/24. Unique U.S. Stock Market strength-based insights: 🔹 2 of 5 industries weakened as the weighted average strength score falls -0.4 to below Average at 5.2, 🔹 a whopping 91% negative stocks with Consumer Durables at 95%, Food & Beverage 94%, and Consumer Non-Durables 92%, 🔹 Specialty Retail 12% of stocks falling more than -10% 🔹 46% of 41 sub-industries weakened with none strengthening.
WHAT’S HAPPENING HERE?
I am…
Finding U.S. Stock Market strength from the
top down,
inside out,
and bottom up, because
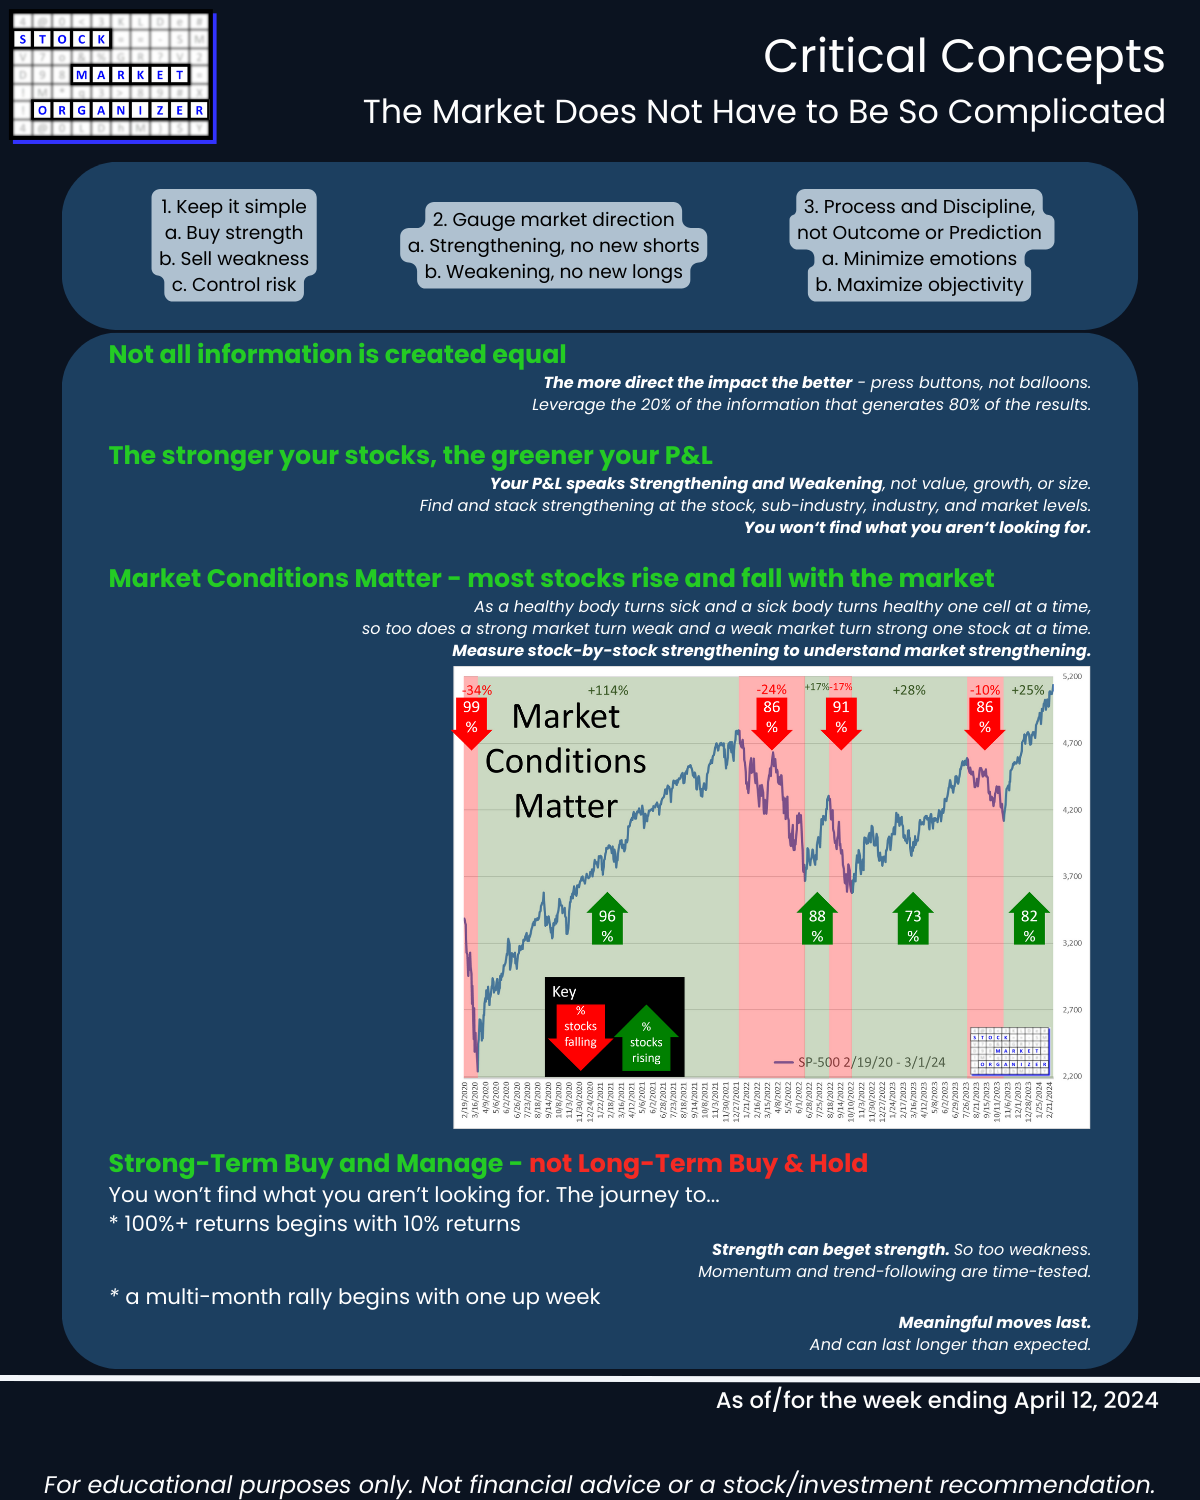
the stronger your stocks, the greener your P&L.
LOWLIGHTS YOU PROBABLY DON’T KNOW
SUMMARY: ANOTHER POOR WEEK, 2/5 INDUSTRIES WEAKENED, 91% AVG NEGATIVE STOCKS
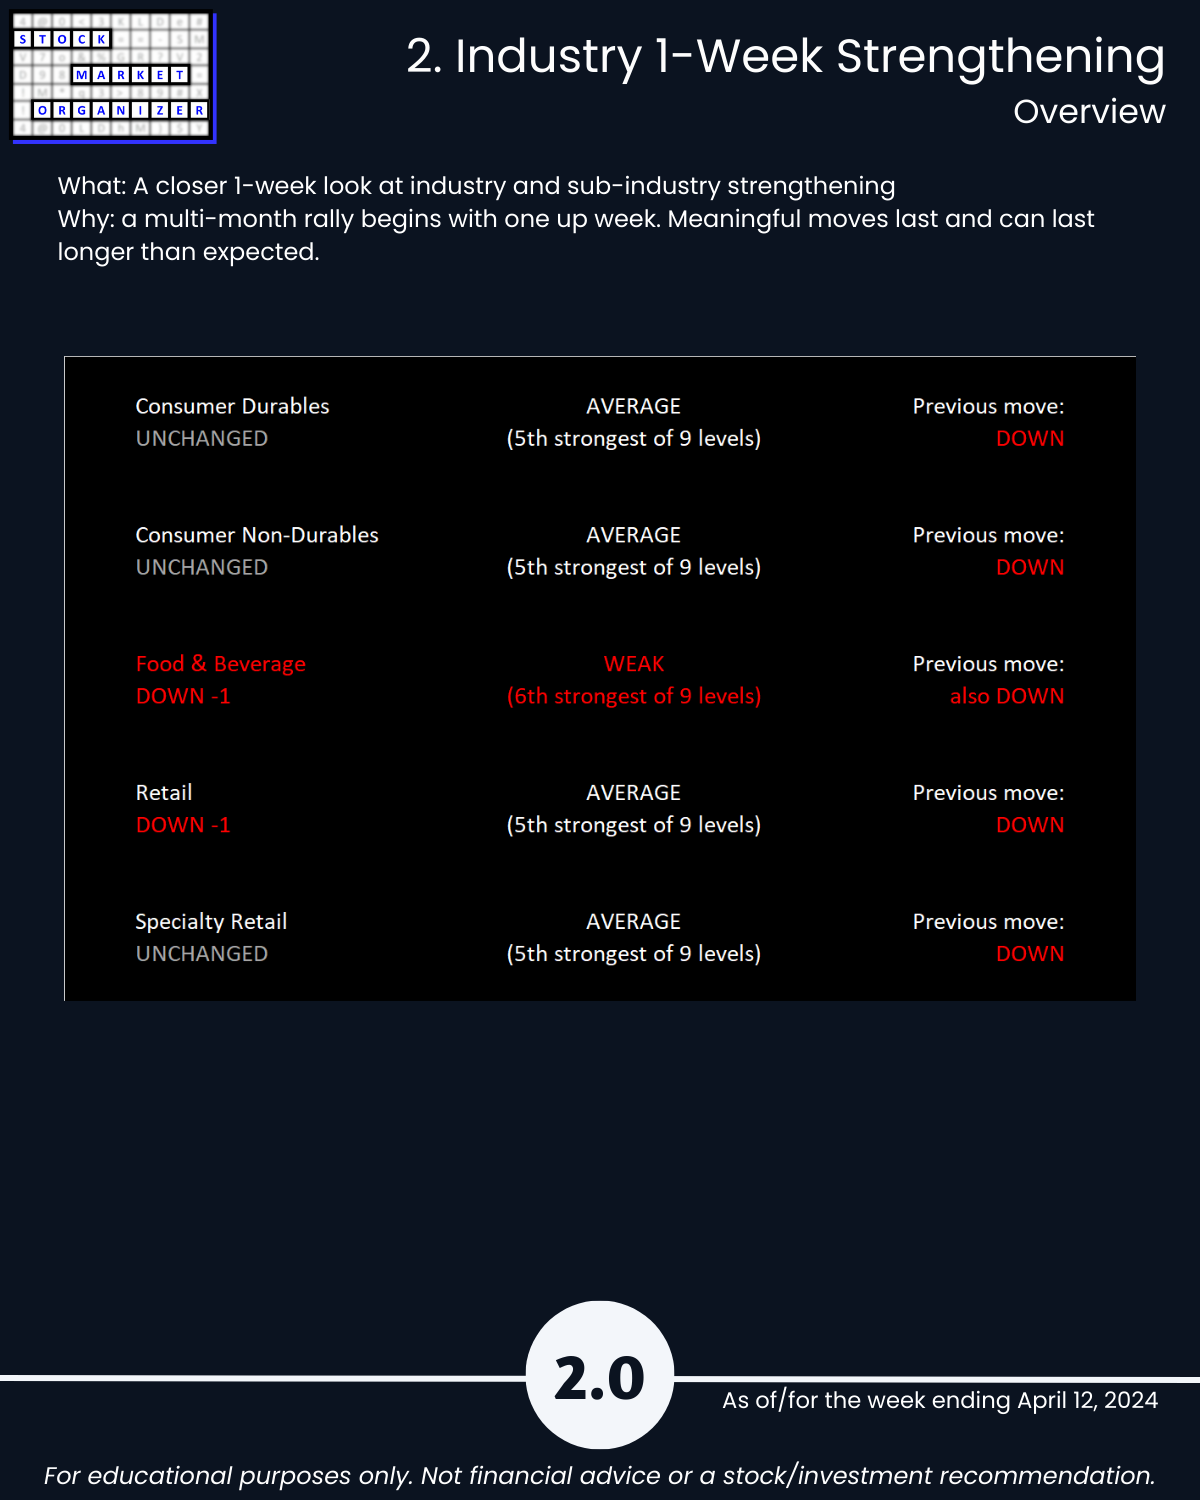
🔹 Industry Strength Level Changes: Food & Beverage, Retail WEAKENED
🔹 Industries
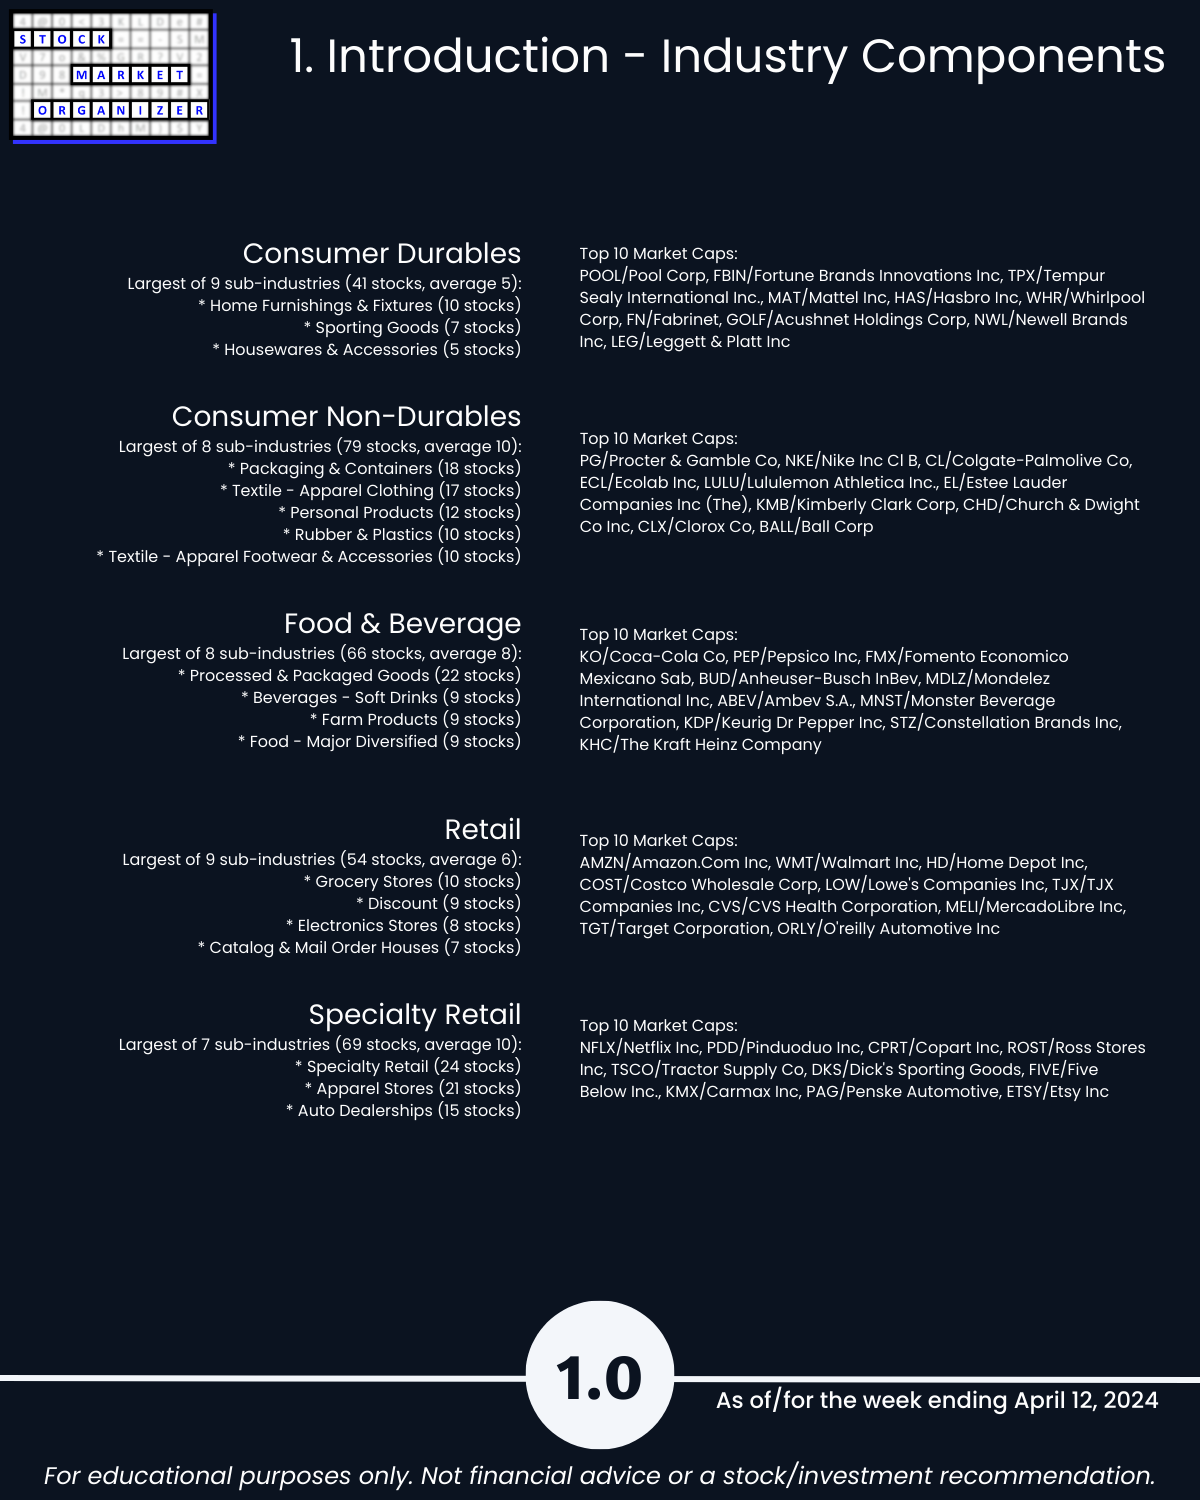
- Strongest Consumer Durables, Consumer Non-Durables, Retail, Specialty Retail (5Avg)
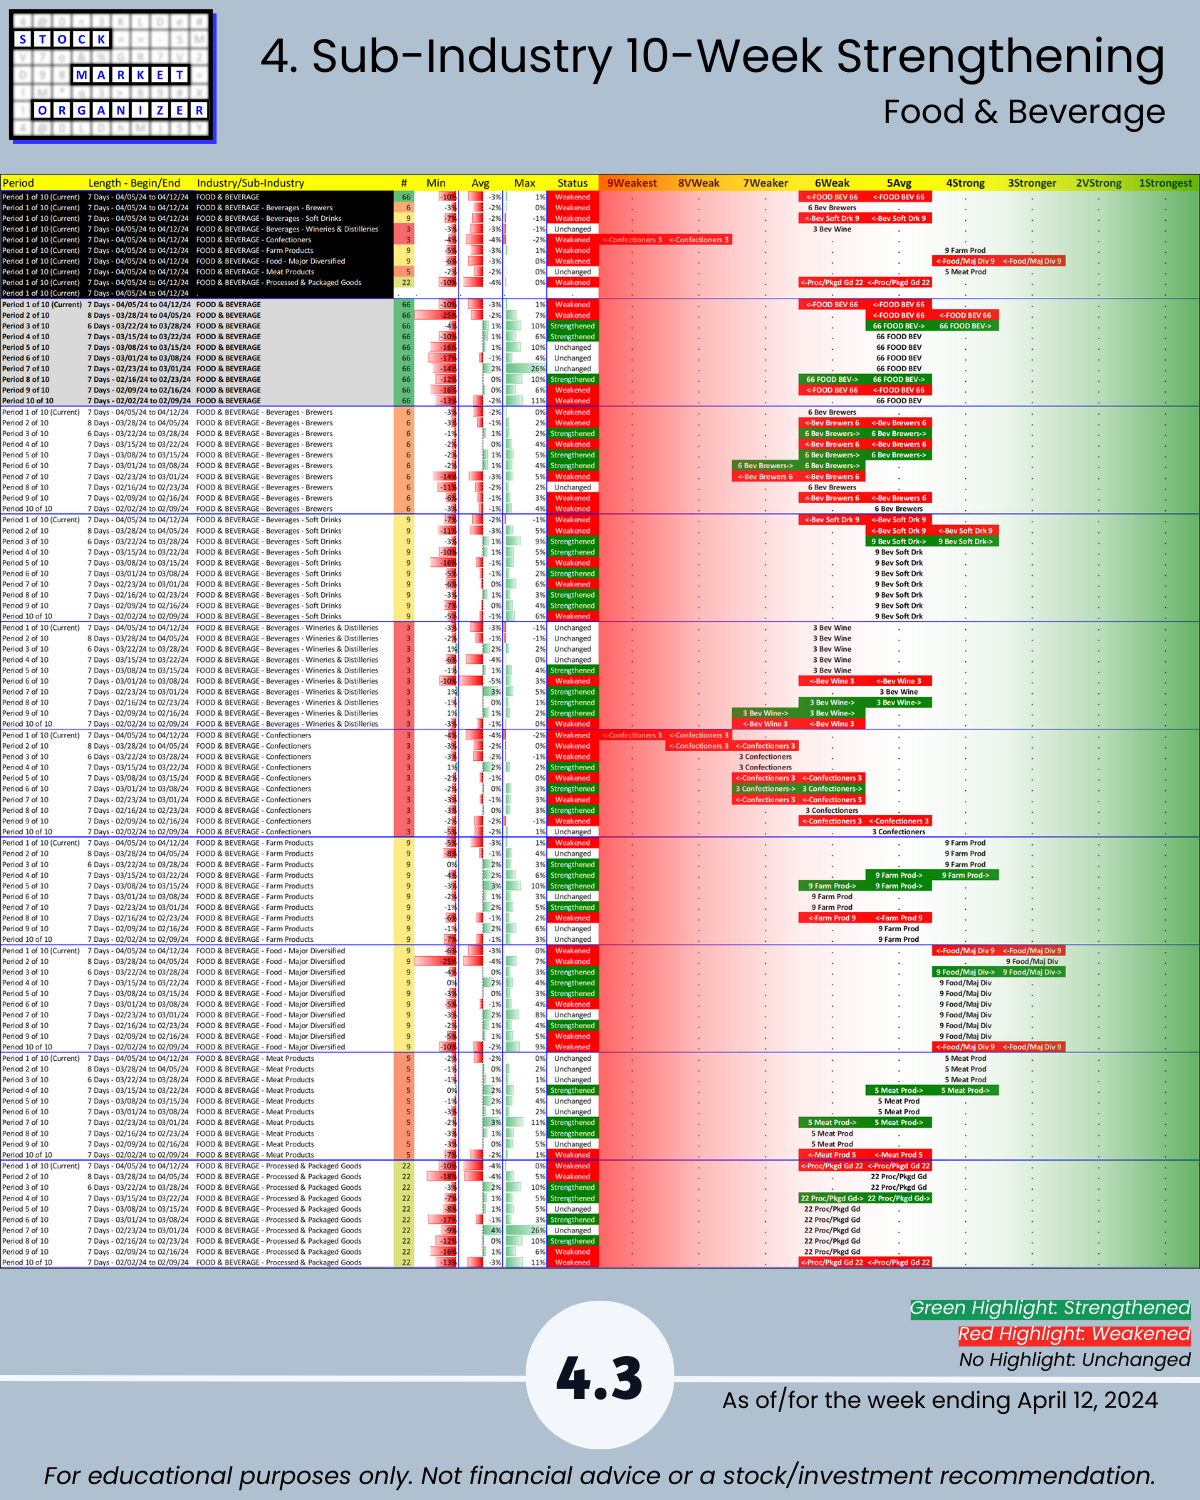
- Weakest Food & Beverage (6Weak)
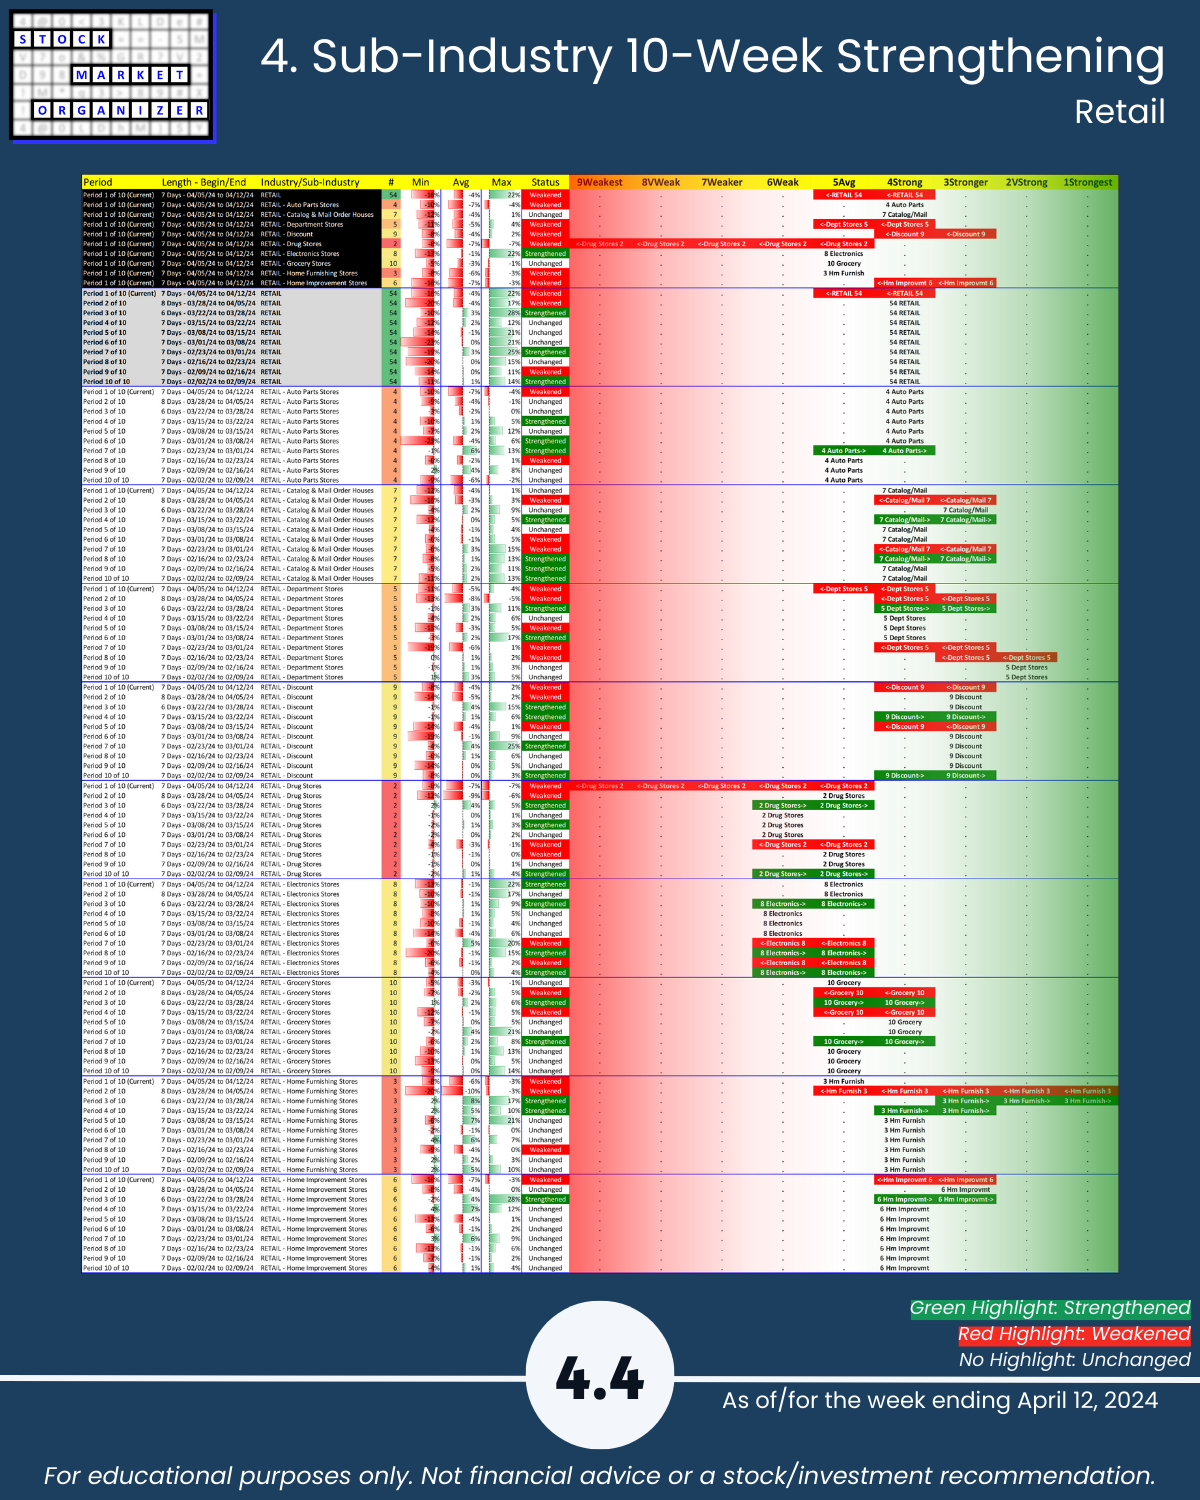
🔹 Sub-industries (41)
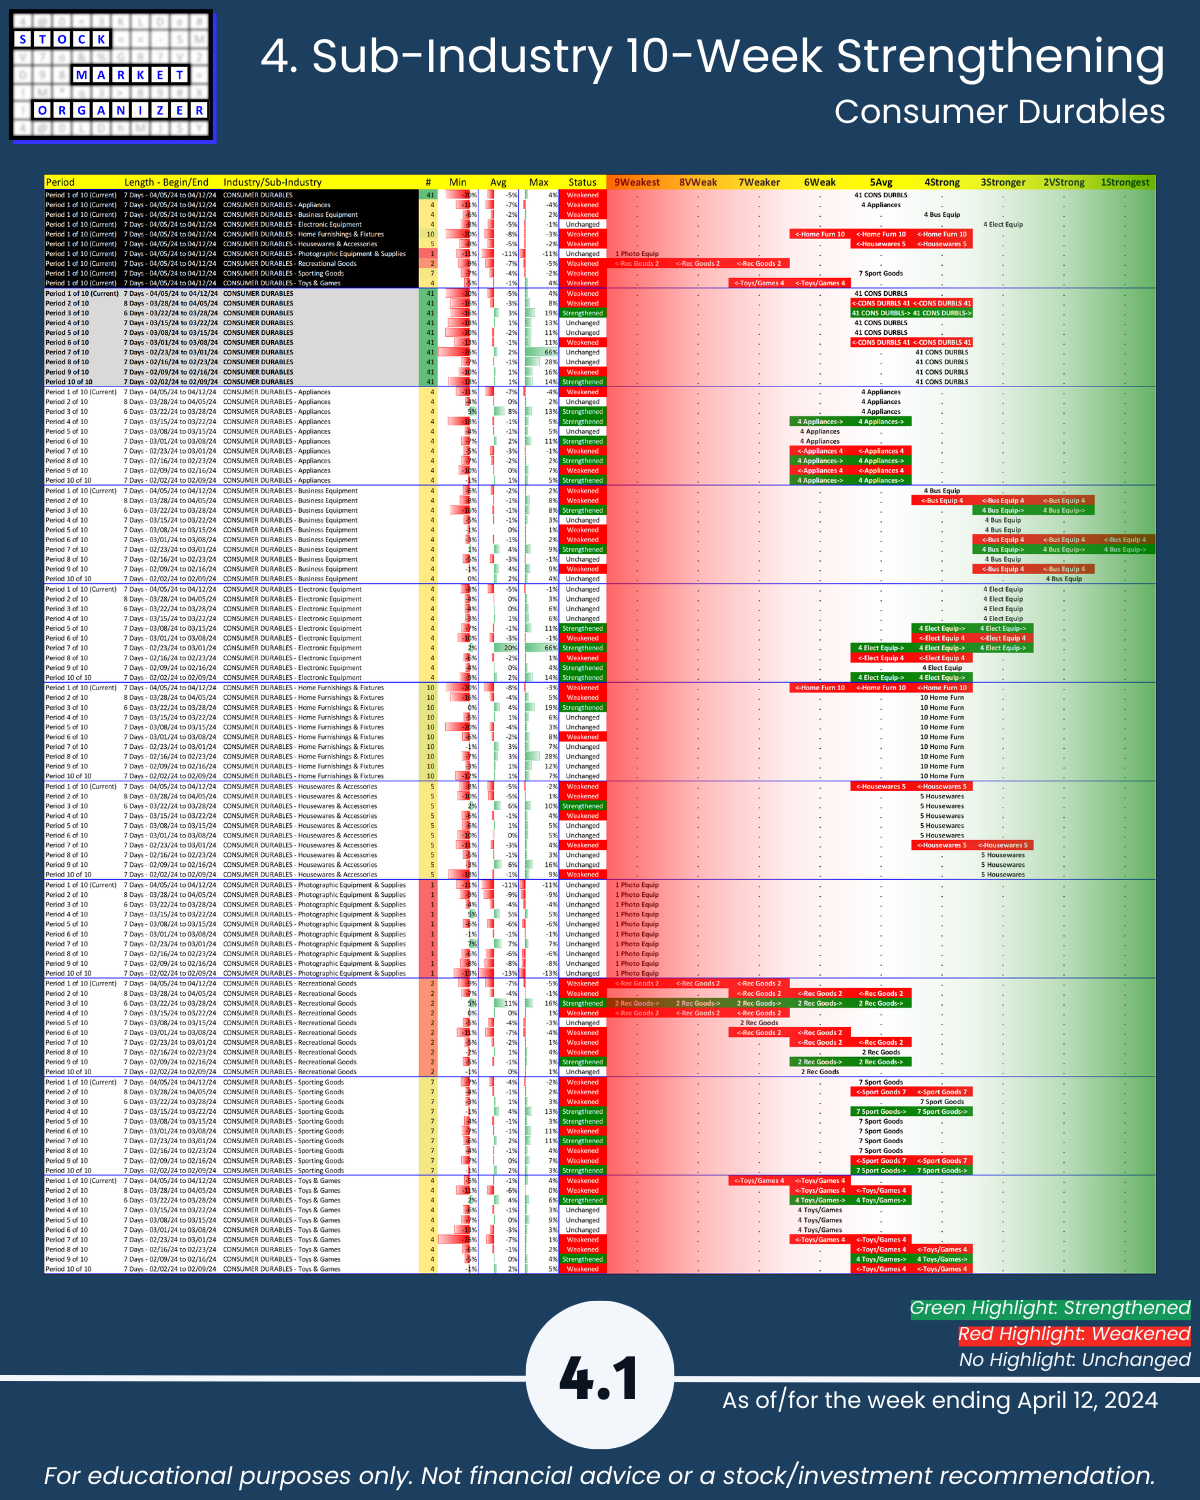
- 0% Strengthened, 46% Weakened
- Strongest: Electronic Equipment, Paper Products (3Stronger) Weakest: Confectioners (9Weakest)
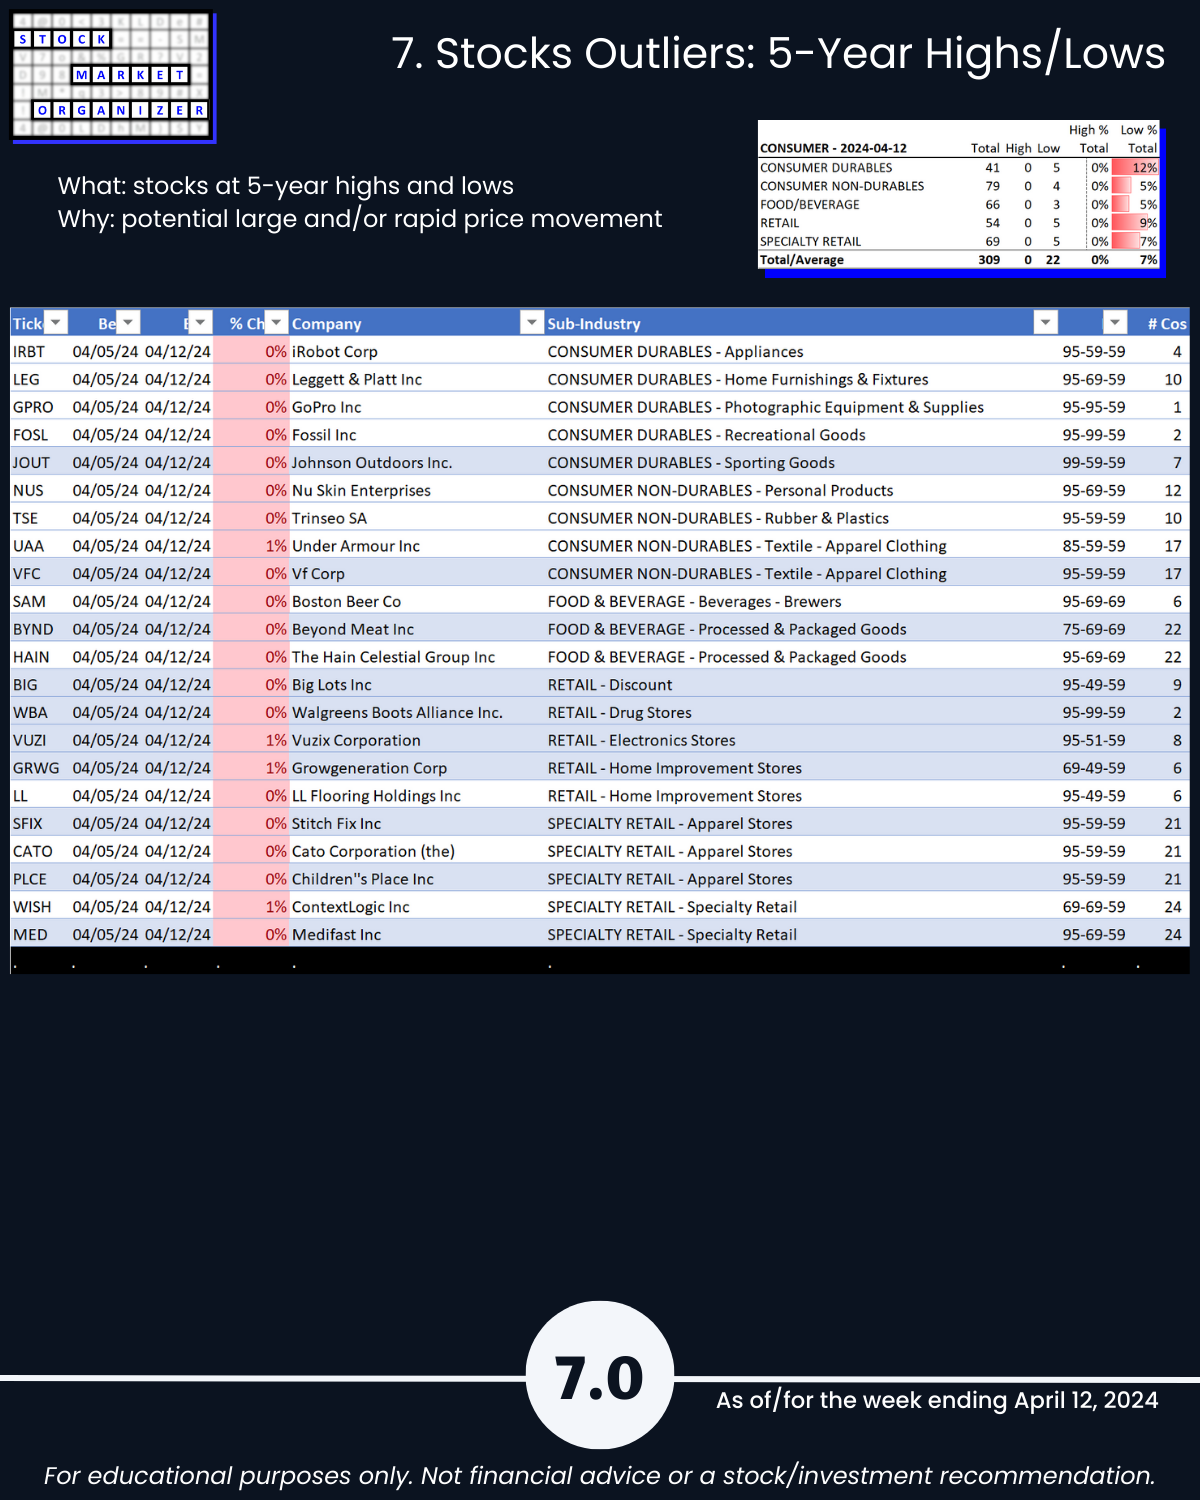
- @ 5 Year+ Highs/Lows: Consumer Durables 12% lows
🔹 Stocks
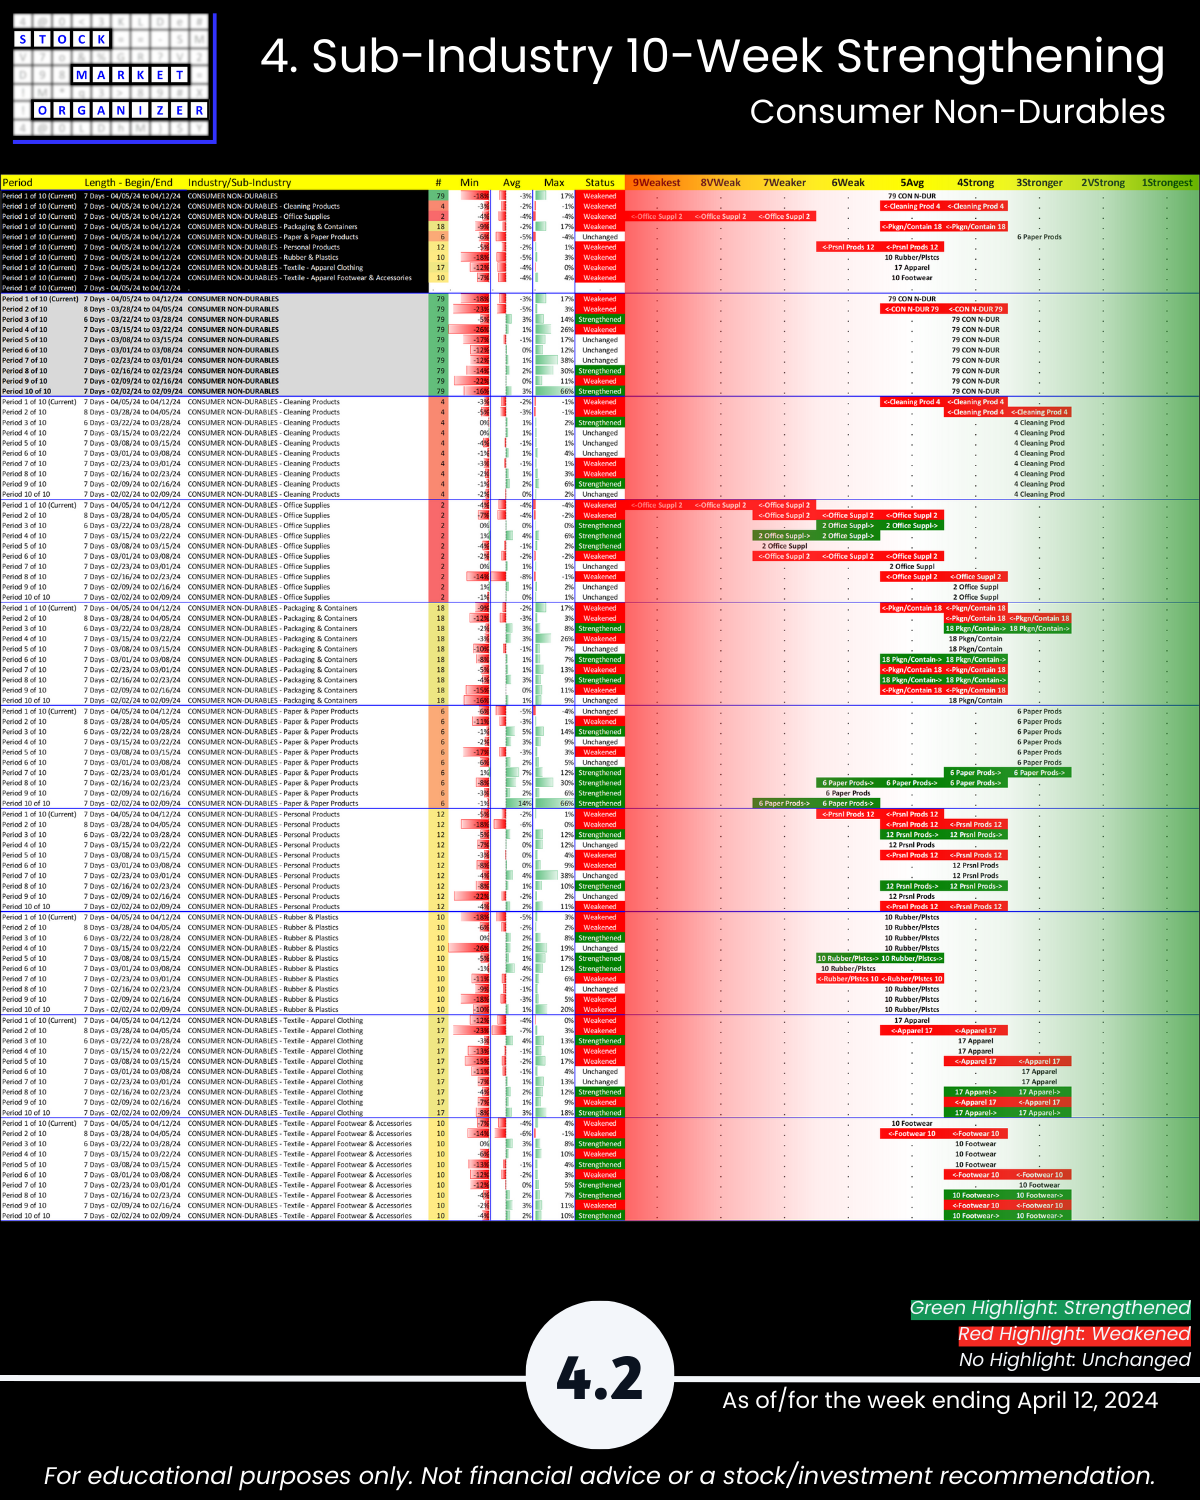
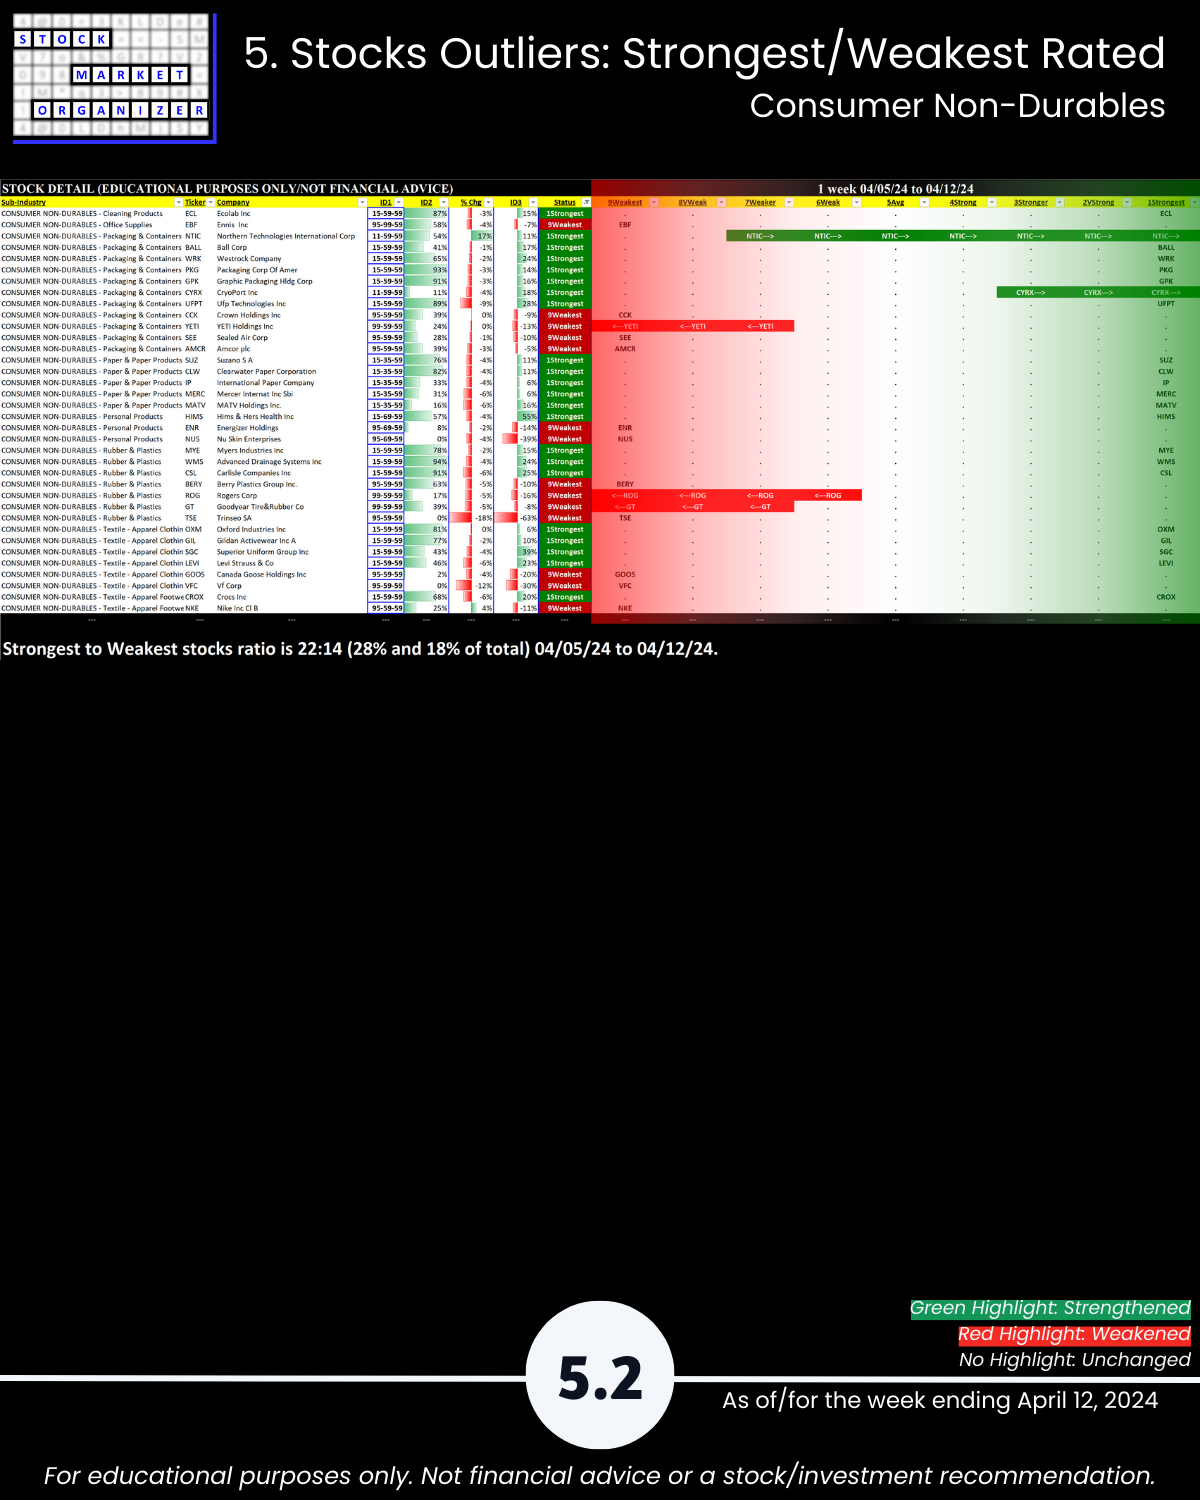
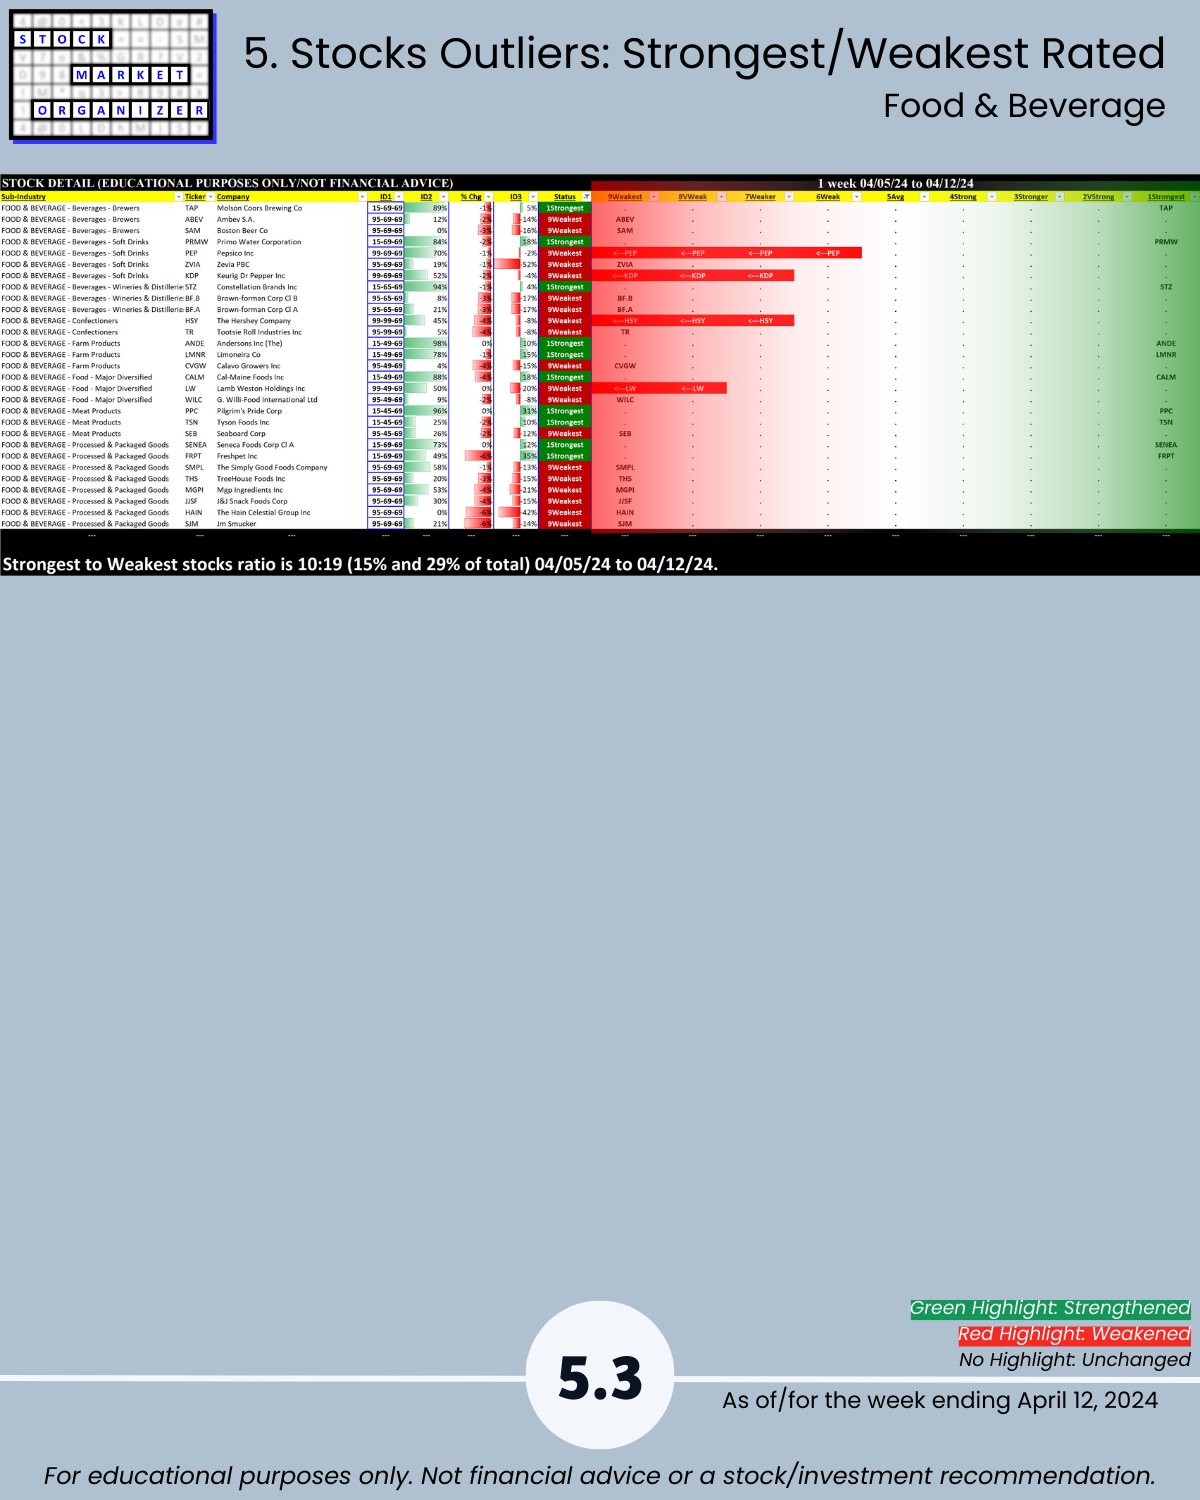
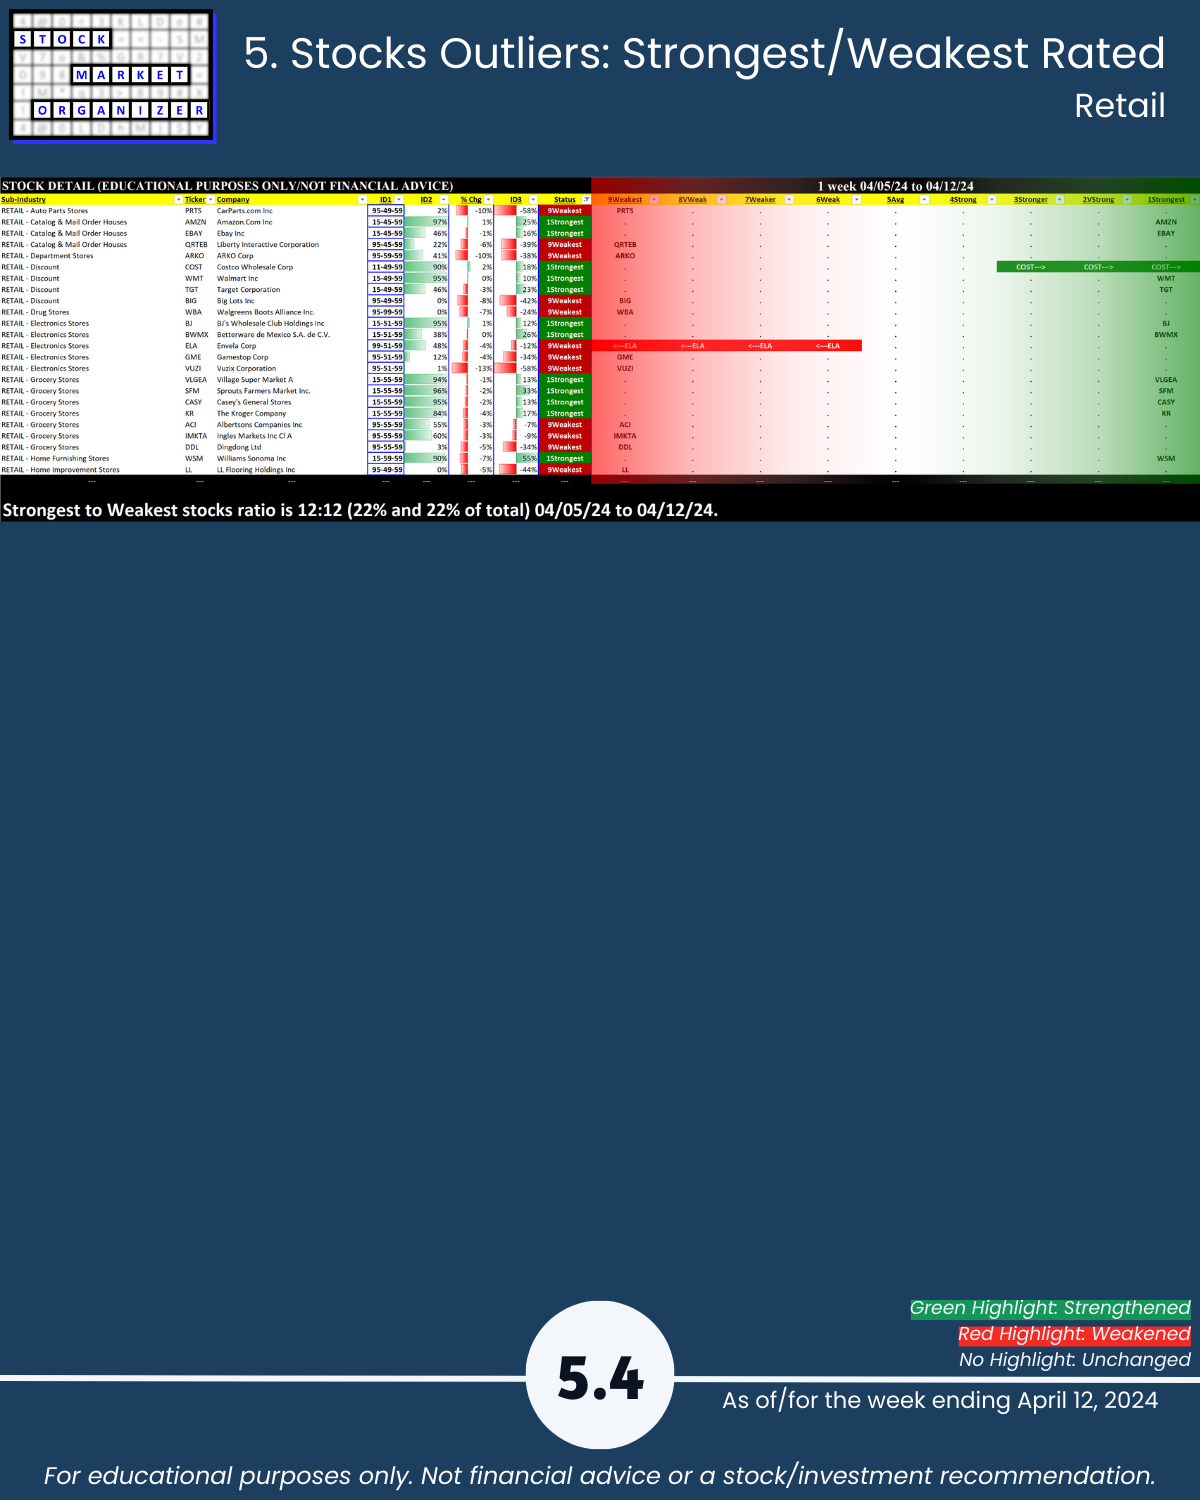
- Positive:Negative: Industry average 9%/91%; Consumer Durables 95%, Consumer Non-Durables 92%, Food & Beverage 94%, Retail 89%, Specialty Retail 86% negative
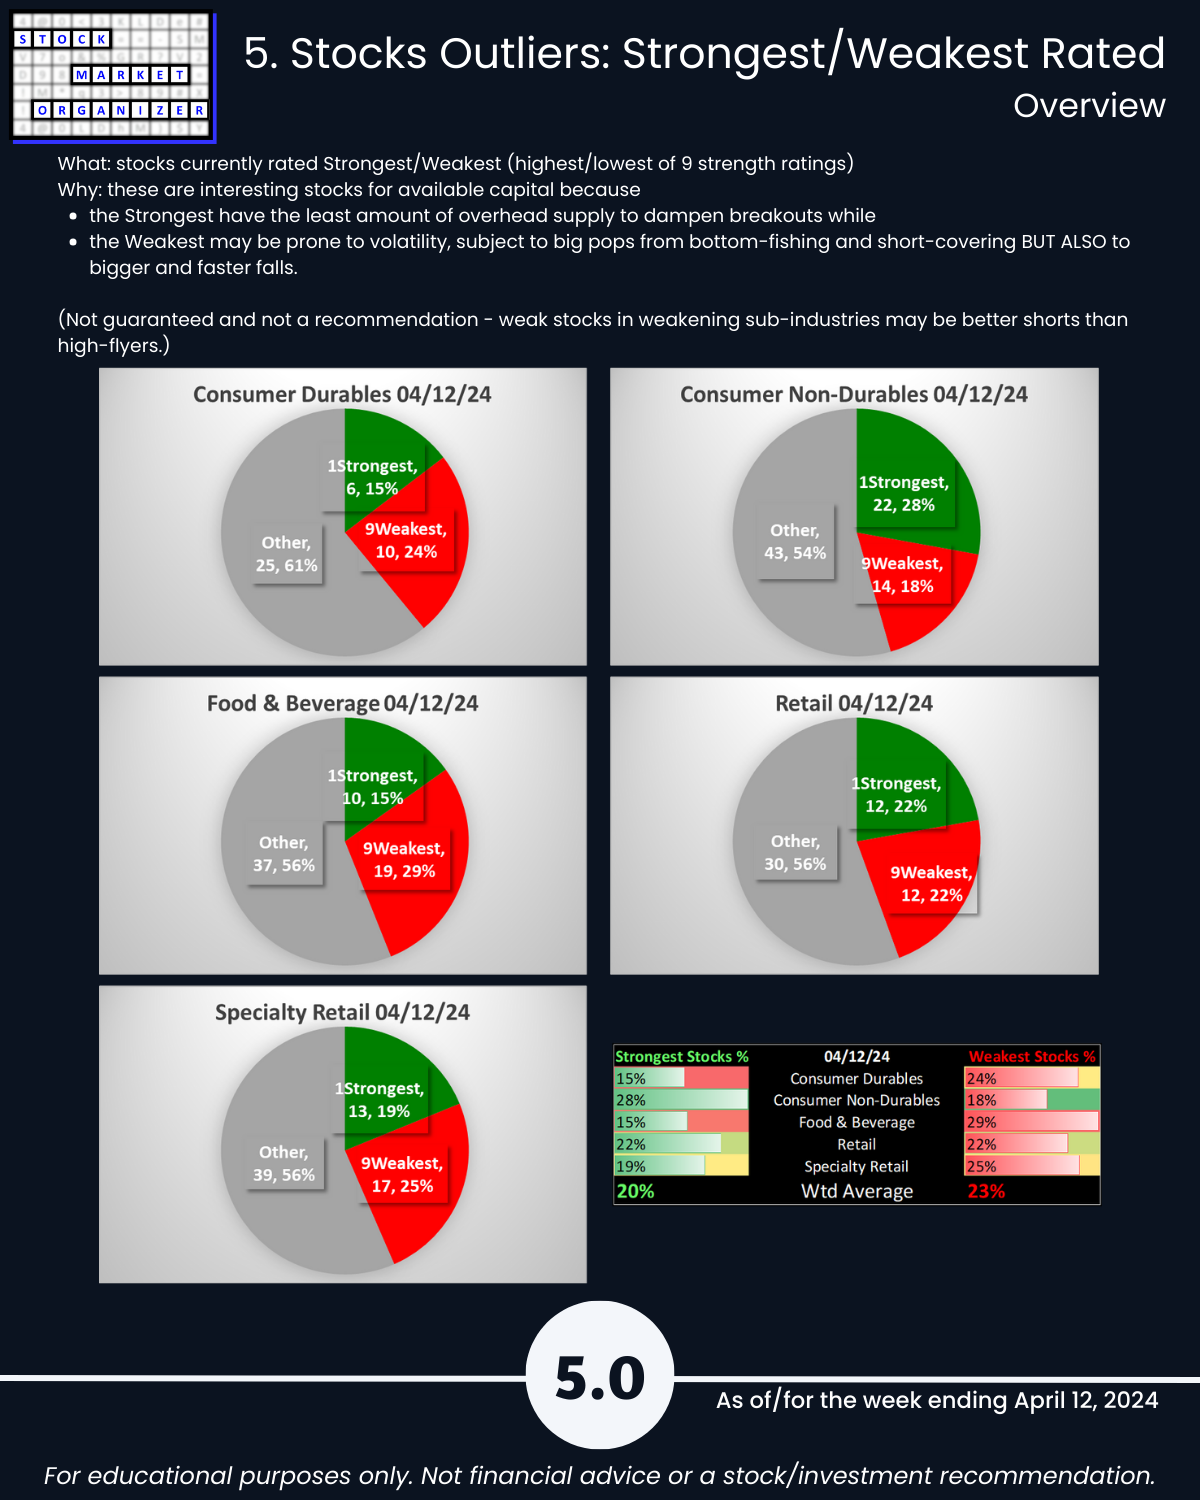
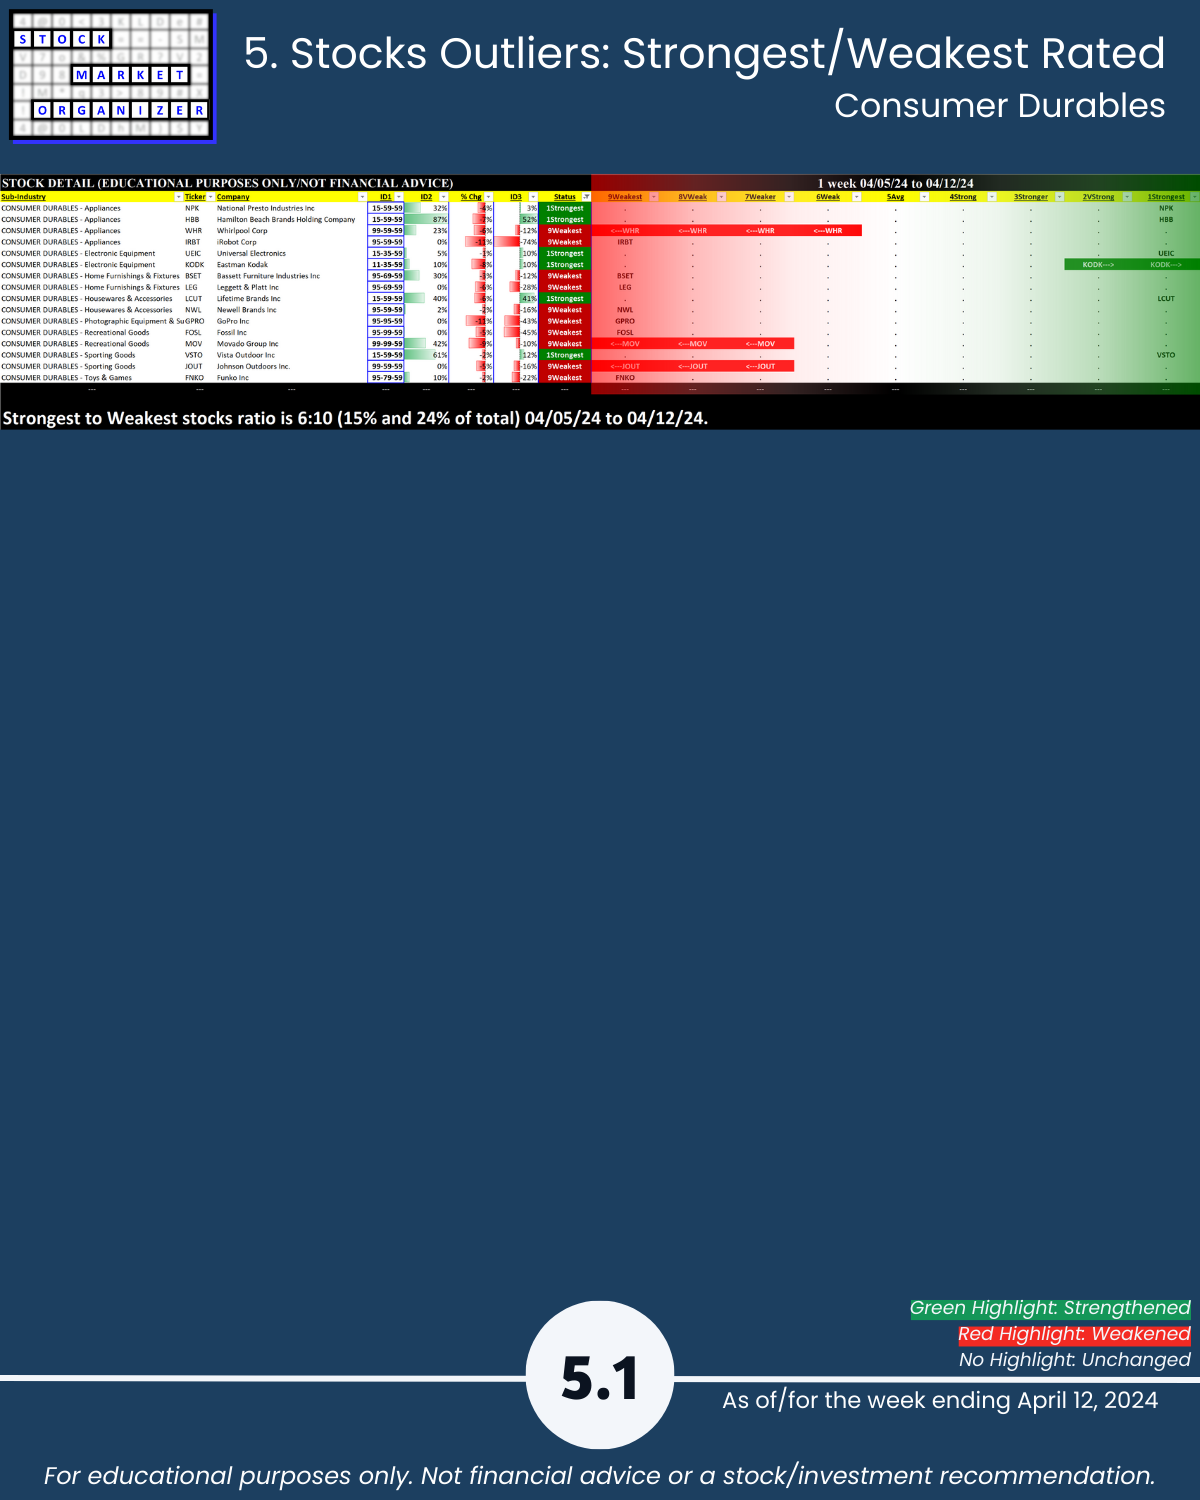
- Strongest:Weakest: Industry average 23%/20%; Consumer Non-Durables 28%:18%
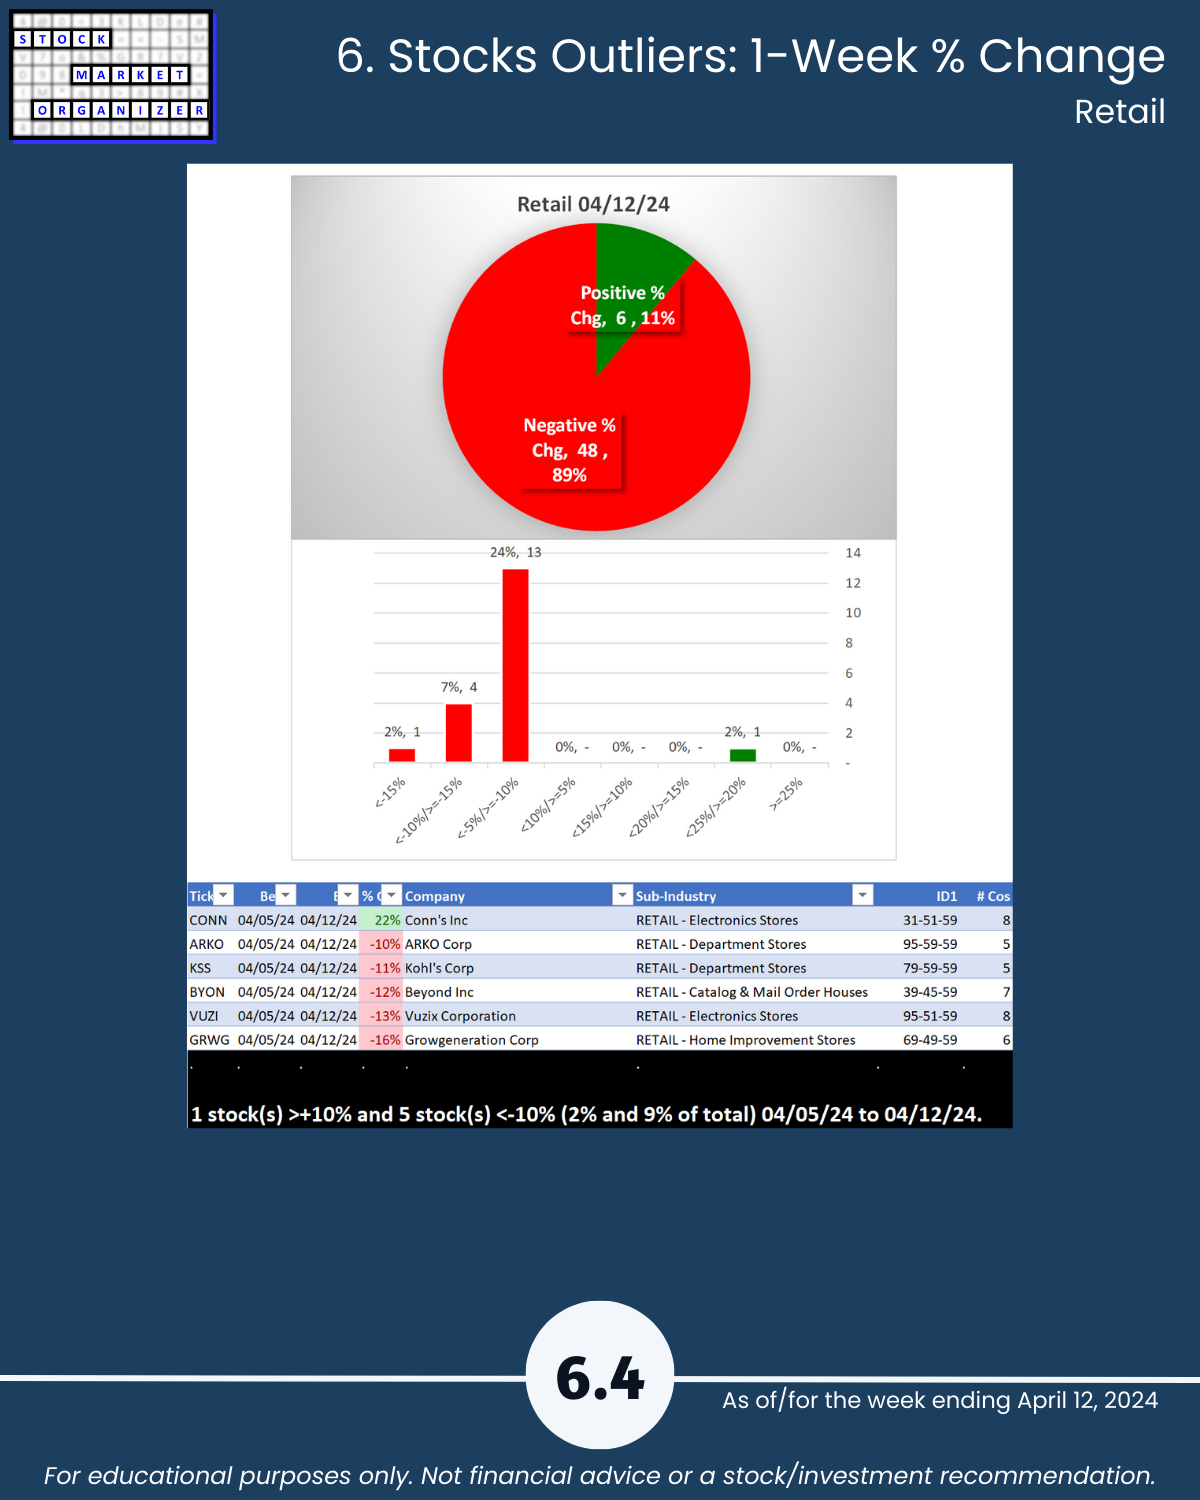
- Outlier Stocks: HOFT -20%, CONN +22%
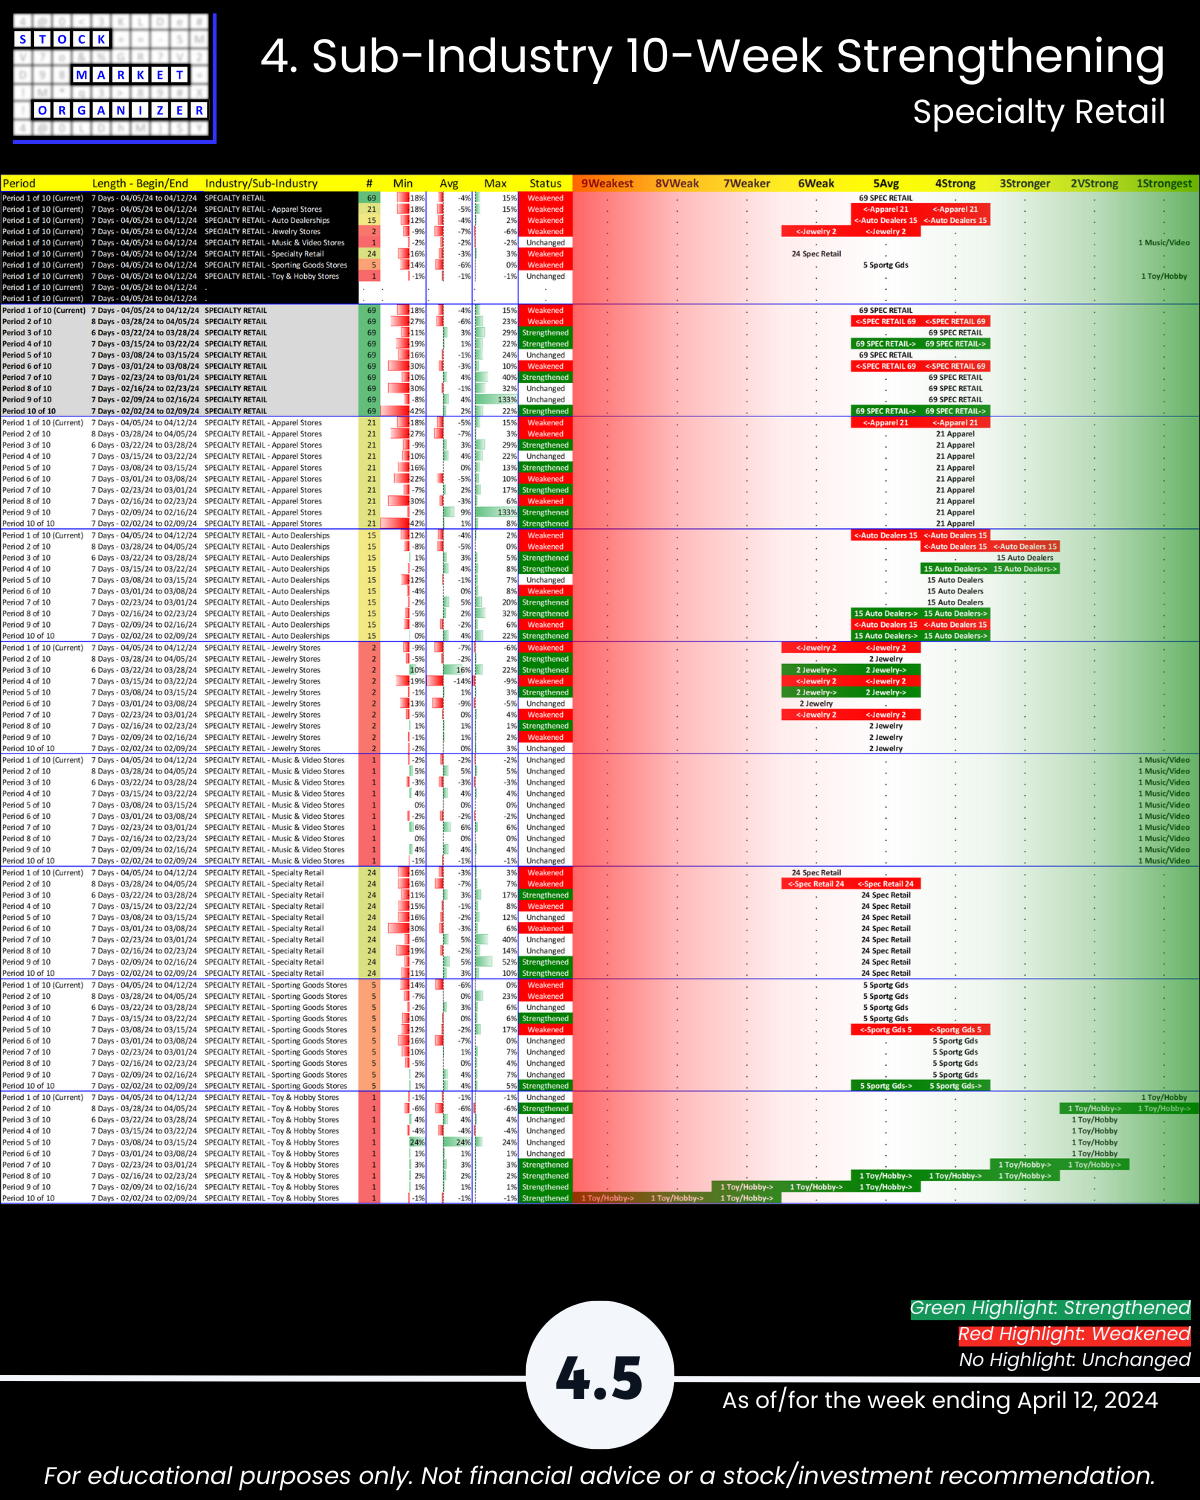
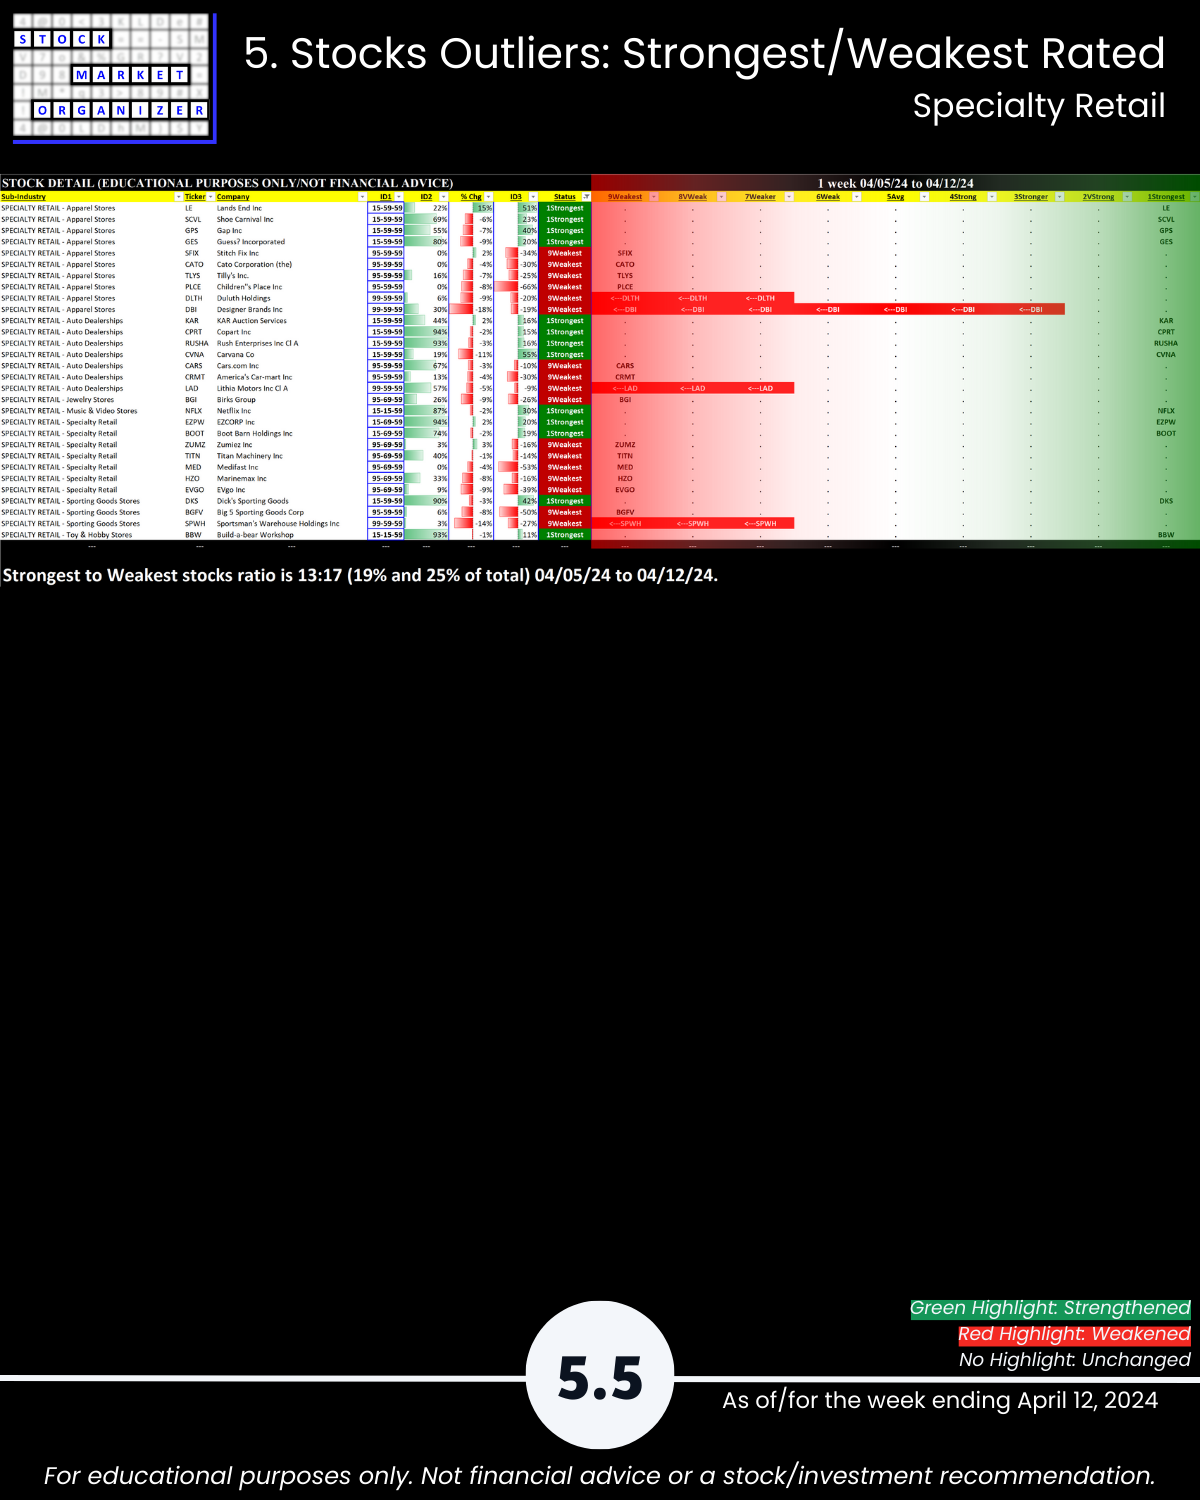
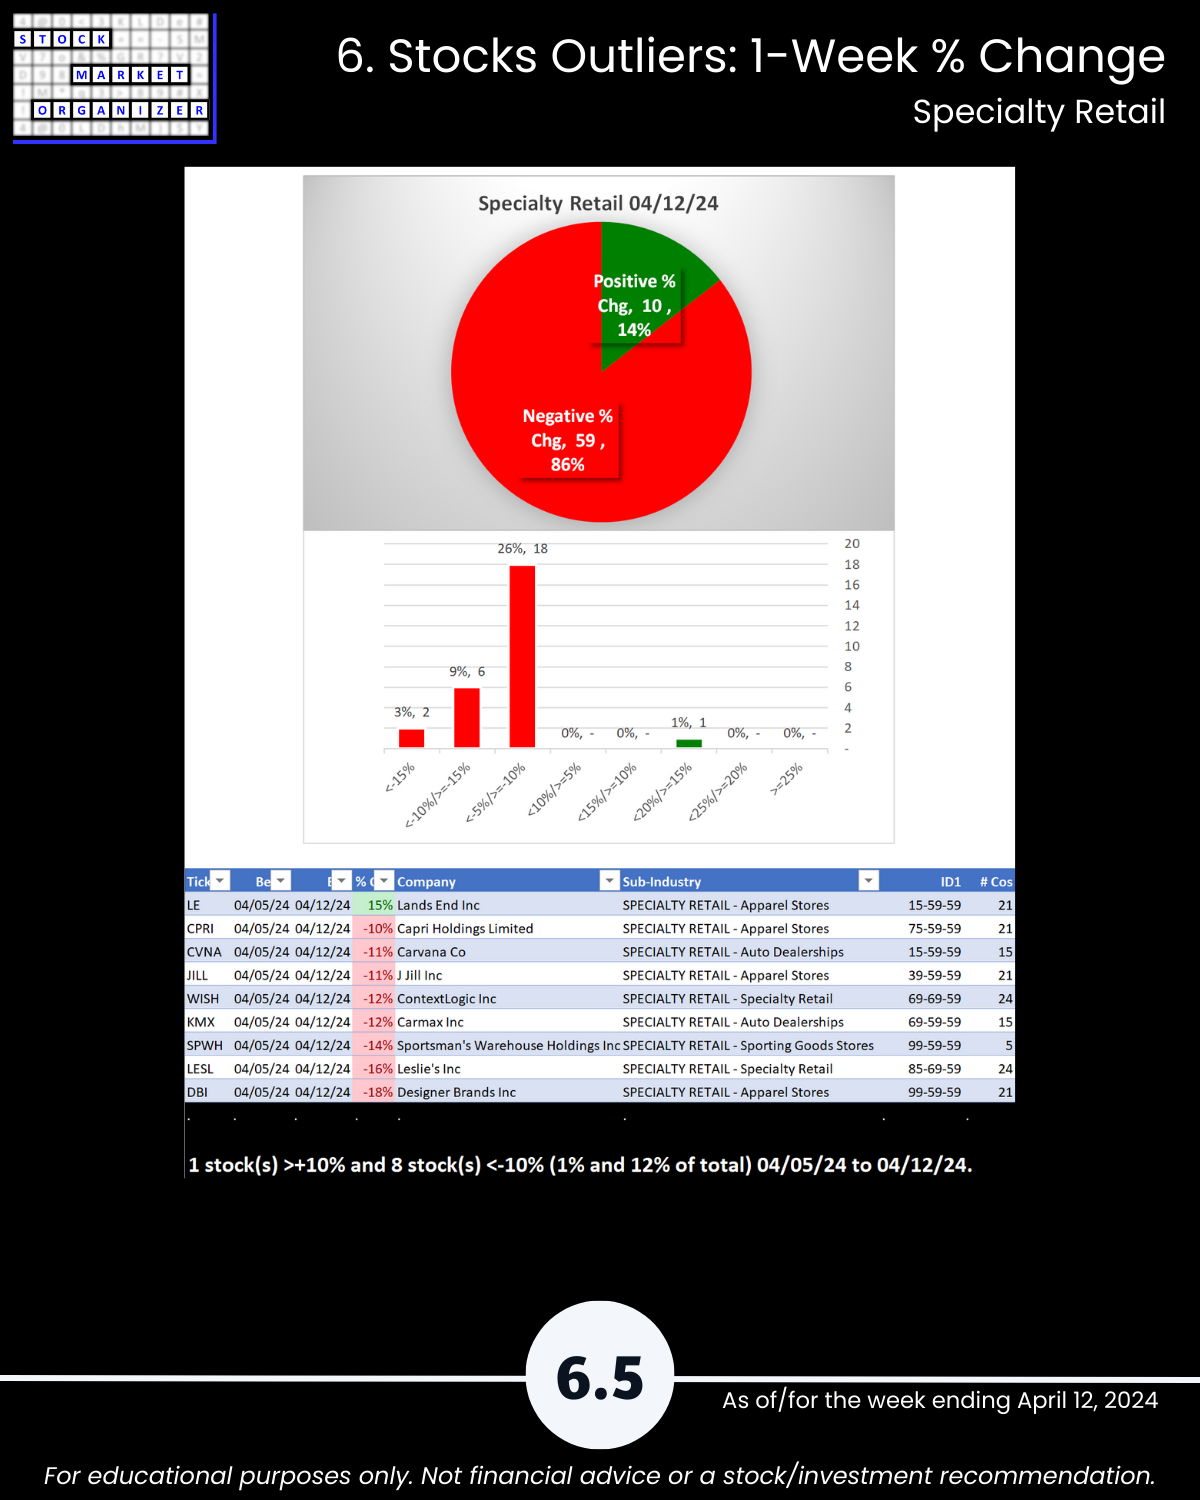
- Specialty Retail 12% stocks <-10%
Following are galleries with page-by-page views of this report.
1. Introduction
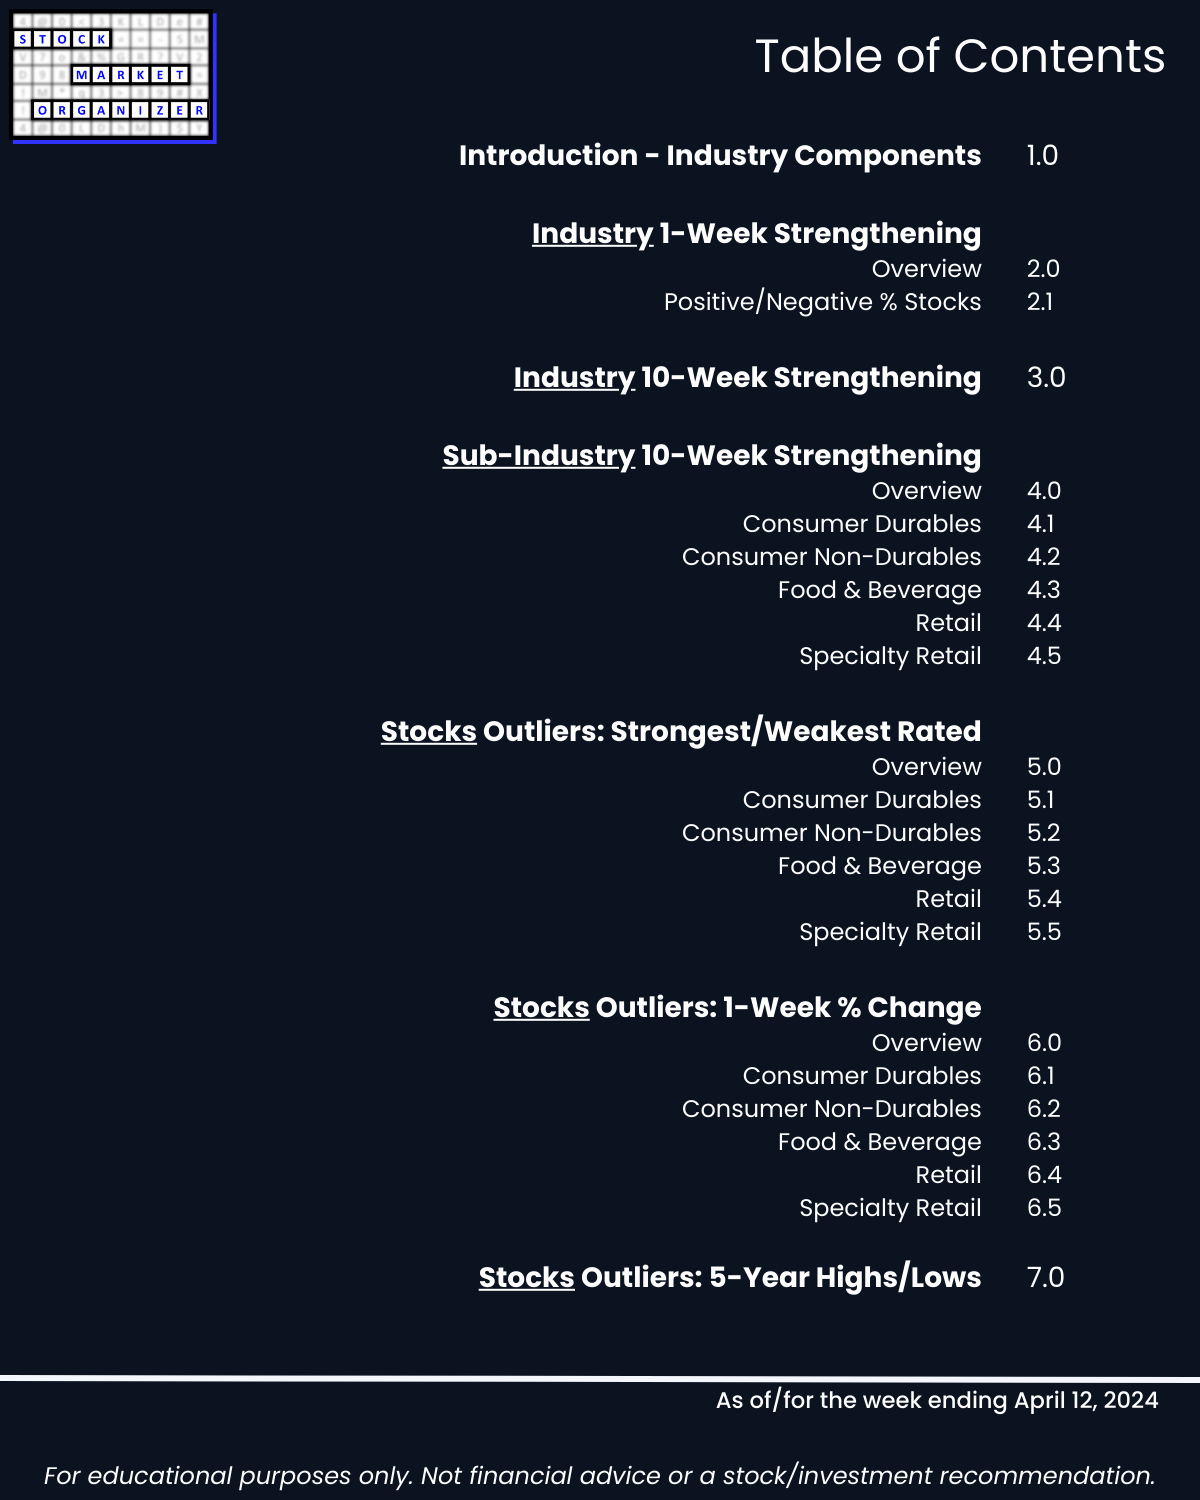
2. Industry 1-Week Strengthening
3. Industry 10-Week Strengthening
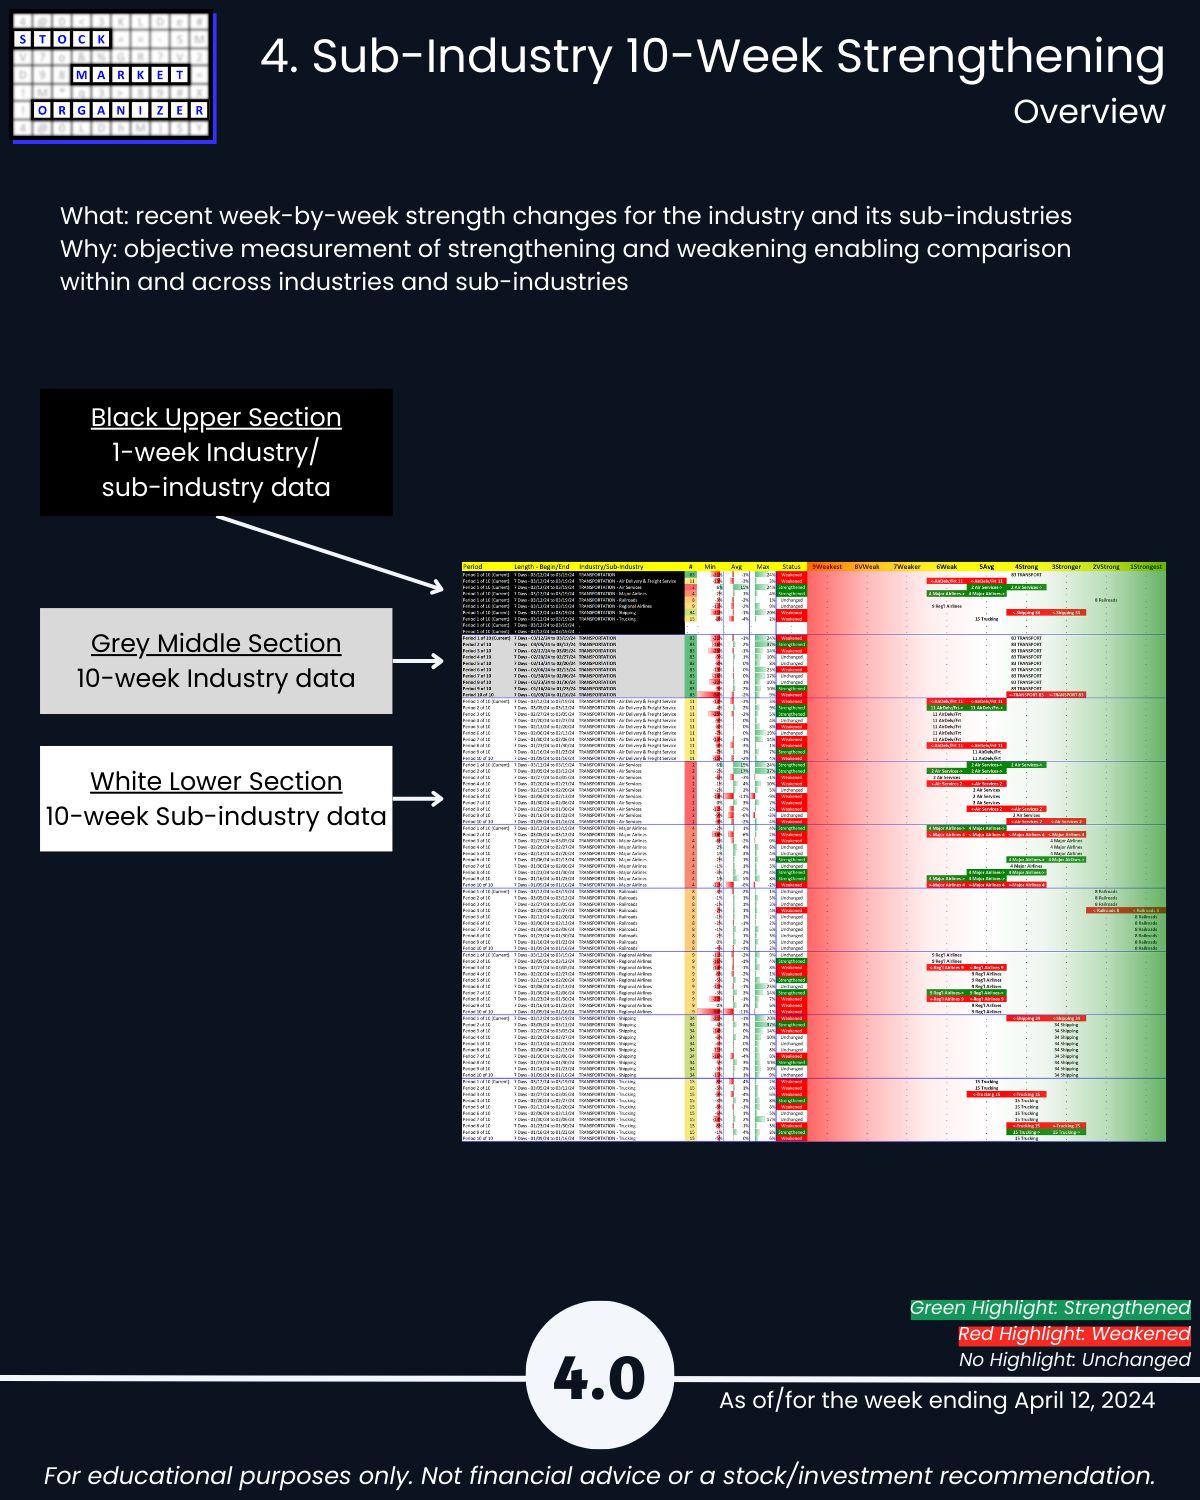
4. Sub-Industry 10-Week Strengthening
5. Stocks Outliers: Strongest/Weakest Rated
6. Stocks Outliers: 1-Week % Change
7. Stocks Outliers: 5-Year Highs/Lows